Identification of bacteria in enrichment cultures of sulfate ...
Upload
khangminh22Category
view
1download
0
International Journal of Food Studies IJFS February 2021 Volume 10 pages SI14–SI25
Effect of Taro (Colocasia esculenta) Enrichment onPhysicochemical and Textural Properties of Cake
Anuj Saklania, Ravinder Kaushikad*, Prince Chawlab, Naveen Kumarc, andMukul Kumarb
a School of Bioengineering and Food Technology, Shoolini University, Solan, India, 125001b Department of Food Technology, Lovely Professional University, Phagwada, Punjab, India
c Amity University, Jaipur, Rajasthan, Indiad University of Petroleum and Energy Studies, Dehradun, Uttrakhand, India-248007
*Corresponding authorravinder [email protected]
Tel: +91-9416962729
Received: 3 July 2018; Published online: 24 February 2021
Abstract
Taro is a plant widely produced in tropical areas for its underground corms and it is used mainly asa vegetable. Its physicochemical, sensory properties and health benefits led to its use in value-addedproducts. The cake is a high value-added bakery product and it needs a lower amount of gluten protein,therefore, taro flour (TF) was supplemented in wheat flour (WF) at different levels (10, 20, 30 and40%). In connection with this, the incorporation of taro flour into wheat-based products has beenreported to increase their nutritional and textural quality. The taro-supplemented cake showed highermineral and fiber content, however, reduced caloric value. It was observed that taro supplementationreduced gluten and protein content and had higher oil and water binding capacity, therefore suitablefor cake preparation. Taro cake had improved texture and sensory characteristics in comparison towheat cake. It can be concluded that addition of taro for cake preparation improves nutrition andquality characteristics, therefore, it can be recommended to use taro for cake preparation.
Keywords: Cake; Taro; Textural properties; Sensory properties; Flour enrichment; Composite flour
1 Introduction
When a crop is being considered for food, nu-tritional value and consumer acceptance are thekey factors for selection or rejection. The nu-tritional value of food depends upon its nutri-tional contents. As far as consumer acceptance isconcerned, tubers of (Colocasia esculenta, com-monly known as taro or cocoyam, are an import-ant food of several developing countries in Africa,West Indies, Pacific region and Asia (Nip, Whi-taker & Vargo, 1994). Large servings of tarocorms can become a significant source of diet-ary protein, especially if taken more than once a
day. Taro is also a good source of thiamin, ri-boflavin, iron, phosphorus and zinc and a verygood source of vitamin B6, vitamin C, niacin,potassium, copper, and manganese. Taro alsocontains greater amounts of vitamin B-complexthan whole milk (Soudy, Delatour & Grancher,2010). In addition, taro is especially useful topersons allergic to cereals and can be consumedby children who are sensitive to milk. For sup-plying nutrients, the taro tubers are considereda good source of carbohydrates and potassium.Taro is also a tuber that is very rich in carbo-hydrates, ranging between 73 to 80% which ismainly starch, 77.9%, and 1.4% crude fiber, dry
Copyright ©2021 ISEKI-Food Association (IFA) 10.7455/ijfs/10.SI.2021.a2
Cake prepared from taro (Colocasia esculenta) SI15
matter basis. Because of its high carbohydratecontent, this tuber represents one of the mainsources of energy in many parts of the tropicsand sub-tropics providing about a third of thefood intake of more than 400 million people inthese areas (Huang, Chen & Wang, 2007).Nowadays, zinc deficiency is widespread and af-fects the health and well-being of populationsworldwide; since taro is one of the few non-animal sources of zinc, its utilization should,therefore, be pursued to help in the alleviationof zinc deficiency which is associated with stunt-ing (Rana et al., 2018). However, despite thewide application and great potential of taro asa chief dietary source of carbohydrate and otheressential nutrients, its usage is often limited byits anti-nutrient contents which are either po-tentially toxic or may limit the bioavailability ofnutrients (Hambidge, 2000). Processing of foodlike noodles and cookies from taro helps in re-ducing its anti-nutrient content which can helpimprove its production and utilization potential(SPC, 2006).The market of novel plant-based foods Is gain-ing popularity, such as spices and herbs (Sharma,Kaushik, Sharma, Sharma et al., 2016; Sharma,Kaushik, Sharma, Chouhan & Kumar, 2016)and also serve as source of vitamins (Kaushik,Chawla, Kumar & Kumar, 2017; Kaushik,Sachdeva, Arora & Gupta, 2015; Sachdeva,Kaushik, Arora & Palaniswamy, 2015) and min-erals (Kaushik, Sachdeva & Arora, 2015; Sach-deva, Kaushik, Arora & Kapila, 2015). Cer-eals are the main economic crops from plantsand several bakery products are prepared fromthem like snacks (Sharma, Khatkar, Kaushik,Sharma, Sharma et al., 2017), noodles (Kaushik,Chawla, Kumar, Janghu & Lohan, 2018) rusk(Lohan, Kaushik, Bansal & Gandhi, 2020), cook-ies (Kumar, Khatkar & Kaushik, 2014) and soon. Bakery products are widely consumed andare becoming a major component of the globalfood market (Kaushik et al., 2018). Kumar etal. (2014) utilize taro as a potential substitutefor wheat flour in cake. Cake is one of the mostcommon bakery products consumed by nearly alllevels of society. This is mainly due to its ready-to-eat nature, availability in different varietiesand affordable cost. The development of bakeryfoods enriched with fiber is an important con-
tribution to a broader supply of food productswith beneficial health effects. In addition, cakeshave a relatively constant place in our diet fora long time and their continuous popularity hasencouraged the development of newer and moreattractive products that are available on the mar-ket today. It is often a dessert of choice for mealsat ceremonial occasions, particularly wedding an-niversaries and birthdays (Srivastava, Sanjeev &Kumar, 2002). Taro has wide medicinal proper-ties, significant amounts of vitamin A, vitaminC, and other phenolic cell reinforcements. Thepresent study was undertaken to develop andevaluate cake enriched with taro in different pro-portionate mixtures with wheat (10, 20, 30 and40 %). The physical characterization and sens-ory qualities of taro flour and wheat flour cakeare reported in this work.
2 Materials and Methods
The taro was obtained from the local market ofSolan, Himachal Pradesh, India. A fine part ofthe taro was scraped, washed, shredded into 1cm3 cubes and dried in a mini tray drying oven(Maro Scientific Works Pvt. Ltd., New Delhi, In-dia) for 48 h at 50 oC. Dried cubes were milled us-ing a roller-mill (Chopin Laboratory CD-1 mill,France) as per the method described by Kaushiket al. (2017). To obtain uniform particle size,taro flour was sieved through a 60 mm meshsieve. The taro flour was then packed in an air-tight plastic container for future use. All chem-icals used were AR grade.
2.1 Chemical composition of TFand WF and theirproportionate mixture
Standard methods of AOAC (2005) were usedto determine Moisture (AOAC - 925.10), fat(AOAC - 2003.05) by soxhlet extraction andash (AOAC - 923.03) by combustion. Protein(AOAC - 960.52) was determined by the microKjeldahl method. Petroleum ether, sodium hy-droxide, sodium hydroxide, and ammonium bor-ate chemicals were used in the preparation of TF.All chemicals were from Loba Chemical Com-pany.
IJFS February 2021 Volume 10 pages SI14–SI25
SI16 Saklani et al.
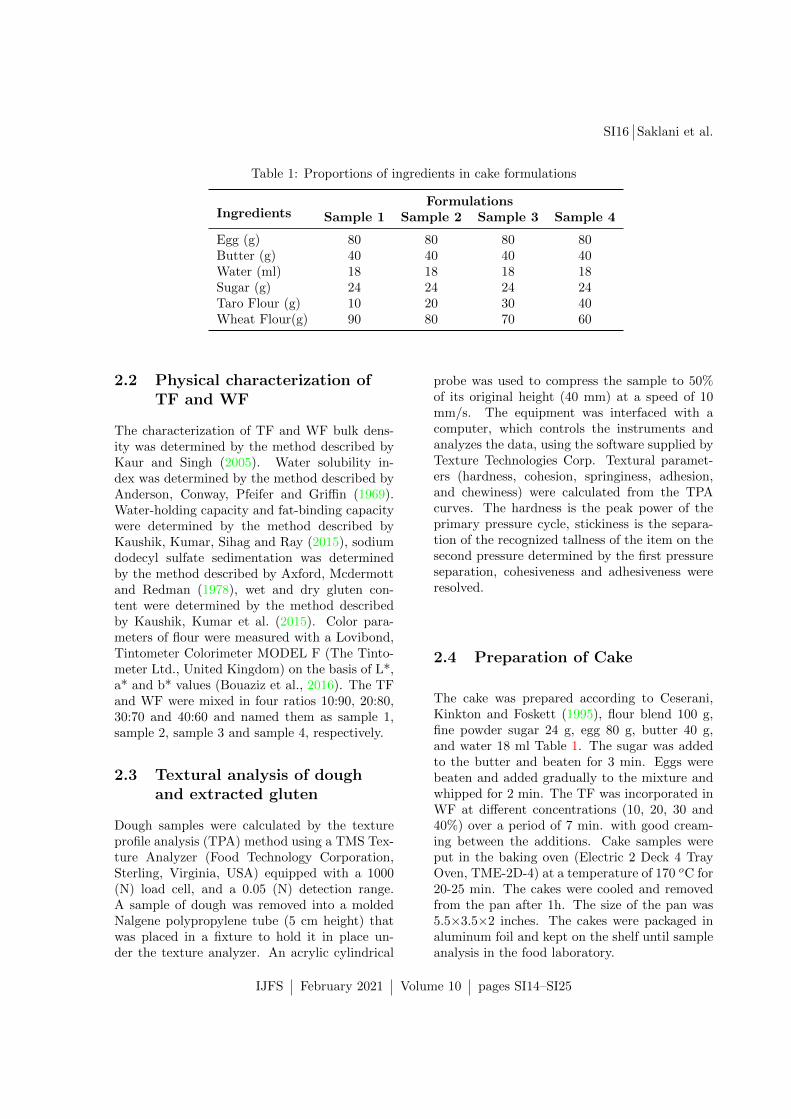
Table 1: Proportions of ingredients in cake formulations
IngredientsFormulations
Sample 1 Sample 2 Sample 3 Sample 4
Egg (g) 80 80 80 80Butter (g) 40 40 40 40Water (ml) 18 18 18 18Sugar (g) 24 24 24 24Taro Flour (g) 10 20 30 40Wheat Flour(g) 90 80 70 60
2.2 Physical characterization ofTF and WF
The characterization of TF and WF bulk dens-ity was determined by the method described byKaur and Singh (2005). Water solubility in-dex was determined by the method described byAnderson, Conway, Pfeifer and Griffin (1969).Water-holding capacity and fat-binding capacitywere determined by the method described byKaushik, Kumar, Sihag and Ray (2015), sodiumdodecyl sulfate sedimentation was determinedby the method described by Axford, Mcdermottand Redman (1978), wet and dry gluten con-tent were determined by the method describedby Kaushik, Kumar et al. (2015). Color para-meters of flour were measured with a Lovibond,Tintometer Colorimeter MODEL F (The Tinto-meter Ltd., United Kingdom) on the basis of L*,a* and b* values (Bouaziz et al., 2016). The TFand WF were mixed in four ratios 10:90, 20:80,30:70 and 40:60 and named them as sample 1,sample 2, sample 3 and sample 4, respectively.
2.3 Textural analysis of doughand extracted gluten
Dough samples were calculated by the textureprofile analysis (TPA) method using a TMS Tex-ture Analyzer (Food Technology Corporation,Sterling, Virginia, USA) equipped with a 1000(N) load cell, and a 0.05 (N) detection range.A sample of dough was removed into a moldedNalgene polypropylene tube (5 cm height) thatwas placed in a fixture to hold it in place un-der the texture analyzer. An acrylic cylindrical
probe was used to compress the sample to 50%of its original height (40 mm) at a speed of 10mm/s. The equipment was interfaced with acomputer, which controls the instruments andanalyzes the data, using the software supplied byTexture Technologies Corp. Textural paramet-ers (hardness, cohesion, springiness, adhesion,and chewiness) were calculated from the TPAcurves. The hardness is the peak power of theprimary pressure cycle, stickiness is the separa-tion of the recognized tallness of the item on thesecond pressure determined by the first pressureseparation, cohesiveness and adhesiveness wereresolved.
2.4 Preparation of Cake
The cake was prepared according to Ceserani,Kinkton and Foskett (1995), flour blend 100 g,fine powder sugar 24 g, egg 80 g, butter 40 g,and water 18 ml Table 1. The sugar was addedto the butter and beaten for 3 min. Eggs werebeaten and added gradually to the mixture andwhipped for 2 min. The TF was incorporated inWF at different concentrations (10, 20, 30 and40%) over a period of 7 min. with good cream-ing between the additions. Cake samples wereput in the baking oven (Electric 2 Deck 4 TrayOven, TME-2D-4) at a temperature of 170 oC for20-25 min. The cakes were cooled and removedfrom the pan after 1h. The size of the pan was5.5×3.5×2 inches. The cakes were packaged inaluminum foil and kept on the shelf until sampleanalysis in the food laboratory.
IJFS February 2021 Volume 10 pages SI14–SI25
Cake prepared from taro (Colocasia esculenta) SI17
2.5 Physical characteristics ofcakes
The volume of cakes was measured using theraised displacement method (Rosell, Rojas & deBarber, 2001). Weight, length, width, and heightof the cakes were estimated. The textural prop-erties of cakes were estimated by a Texture Ana-lyzer. Cake slices (2.5 cm thick) were placed onthe Texture analyzer platform. An acrylic cyl-indrical probe was used to compress the cakesample up to 50% of its original height at aspeed of 10 mm/s. Colors of crust and crumbwere measured using the Portable Colorimeter(Lovibond, Colorimeter MODEL F).
2.6 FTIR interpretation
The microstructural changes were verified withthe FTIR spectrometer (CARY 630 AgilentTechnologies, Santa Clara, California, USA). Mi-crolab Software (Bozeman, Montana, USA) wasused to generate data with a resolution of 8 cm-1.The graphs obtained using the FTIR were ana-lyzed using a method described by Lampman,Kriz and Vyvyan (2001).
2.7 Sensory evaluation
The sensory analysis was performed at the Foodand Nutrition Laboratory by 35 students andteachers of Shoolini University, from 19 to 37years old. Judges evaluated the attributes: color,odor, flavor, taste, texture and overall acceptab-ility using a nine-point hedonic scale (where 1 =liked extremely and 9 = disliked extremely). Thesensory analysis was conducted at room temper-ature, and each judge received the samples inwhite plastic dishes, numbered with random di-gits (Lohan et al., 2020). Cake samples were leftto cool for 4h after baking then samples were cutand subjected to taste panel.
2.8 Statistical analysis
Means (n=3), standard error mean (SEM), linearregression analysis and 95% confidence intervalswere calculated using Microsoft Excel 2007 (Mi-crosoft Corp., Redmond, WA) as per Kaushik
et al. (2017), Sachdeva, Kaushik, Arora and Pa-laniswamy (2015) and Sachdeva, Kaushik, Aroraand Kapila (2015). Data were subjected to aone-way analysis of variance (ANOVA).
3 Results and Discussion
3.1 Physical and chemicalcharacterization of TF andWF
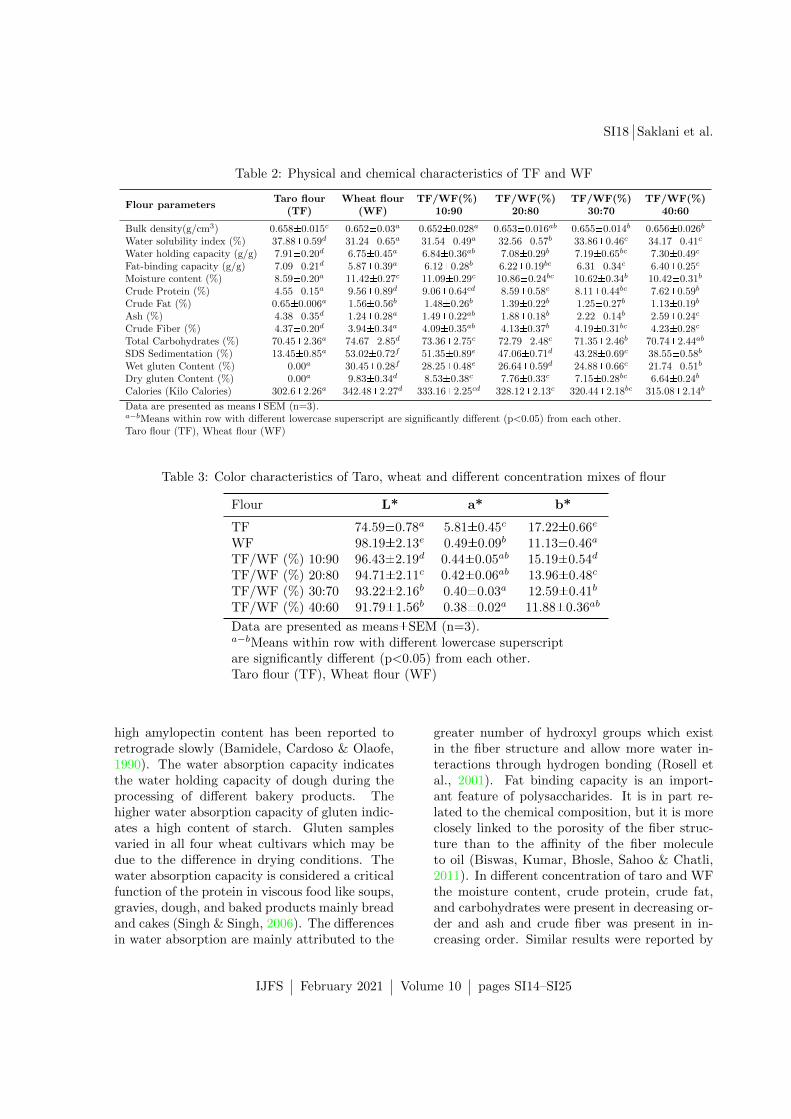
Physical properties of granular solids play an im-portant role in manufacturing as they determ-ine the application and use of food materials forseveral food products. Physical properties areimportant in choosing the flow behavior of theirproper handling during the several phases of pro-cessing, conveying and storage (Ganesan, Rosen-trater & Muthukurnarappan, 2008). The phys-ical properties of the TF and WF are summar-ized in Table 2. Bulk density is an indication ofthe porosity of a product and a function of flourwettability without the influence of any compres-sion. It is also a reflection of what the samplecan carry if rested directly on another. Thebulk density of TF and WF was 0.658 and 0.652(g/cm3), respectively. As the concentration ofTF increased in mixed flour the bulk density alsoincreased. Njintang et al. (2007) determined asimilar bulk density of taro flour (0.645 g/cm3),however, somewhat higher bulk density (0.745g/cm3) was reported by Tagodoe and Nip (1994).Water solubility index was 37.88 and 31.24% forTF and WF, respectively and the results revealedthat with the increase in taro concentration, wa-ter solubility index also increased. Flours withhigh water solubility index have been reportedto be good constituents in bakery applications asthey improve solubility characteristics and leadto the improved freshness of baked products (Maet al., 2011). Water holding capacity of TF andWF was 7.91 and 6.75% and fat binding capa-city of TF and WF was 7.09 and 5.87%, respect-ively and the different concentrations of TF andWF water holding capacity and fat binding ca-pacity showed increasing order. The high syner-gic value observed for wheat flour compared totaro flour may be attributed to the differences inamylose content, given the fact that starch with
IJFS February 2021 Volume 10 pages SI14–SI25
SI18 Saklani et al.
Table 2: Physical and chemical characteristics of TF and WF
Flour parametersTaro flour Wheat flour TF/WF(%) TF/WF(%) TF/WF(%) TF/WF(%)
(TF) (WF) 10:90 20:80 30:70 40:60
Bulk density(g/cm3) 0.658±0.015c 0.652±0.03a 0.652±0.028a 0.653±0.016ab 0.655±0.014b 0.656±0.026b
Water solubility index (%) 37.88±0.59d 31.24±0.65a 31.54±0.49a 32.56±0.57b 33.86±0.46c 34.17±0.41c
Water holding capacity (g/g) 7.91±0.20d 6.75±0.45a 6.84±0.36ab 7.08±0.29b 7.19±0.65bc 7.30±0.49c
Fat-binding capacity (g/g) 7.09±0.21d 5.87±0.39a 6.12±0.28b 6.22±0.19bc 6.31±0.34c 6.40±0.25c
Moisture content (%) 8.59±0.20a 11.42±0.27c 11.09±0.29c 10.86±0.24bc 10.62±0.34b 10.42±0.31b
Crude Protein (%) 4.55±0.15a 9.56±0.89d 9.06±0.64cd 8.59±0.58c 8.11±0.44bc 7.62±0.59b
Crude Fat (%) 0.65±0.006a 1.56±0.56b 1.48±0.26b 1.39±0.22b 1.25±0.27b 1.13±0.19b
Ash (%) 4.38±0.35d 1.24±0.28a 1.49±0.22ab 1.88±0.18b 2.22±0.14b 2.59±0.24c
Crude Fiber (%) 4.37±0.20d 3.94±0.34a 4.09±0.35ab 4.13±0.37b 4.19±0.31bc 4.23±0.28c
Total Carbohydrates (%) 70.45±2.36a 74.67±2.85d 73.36±2.75c 72.79±2.48c 71.35±2.46b 70.74±2.44ab
SDS Sedimentation (%) 13.45±0.85a 53.02±0.72f 51.35±0.89e 47.06±0.71d 43.28±0.69c 38.55±0.58b
Wet gluten Content (%) 0.00a 30.45±0.28f 28.25±0.48e 26.64±0.59d 24.88±0.66c 21.74±0.51b
Dry gluten Content (%) 0.00a 9.83±0.34d 8.53±0.38c 7.76±0.33c 7.15±0.28bc 6.64±0.24b
Calories (Kilo Calories) 302.6±2.26a 342.48±2.27d 333.16±2.25cd 328.12±2.13c 320.44±2.18bc 315.08±2.14b
Data are presented as means±SEM (n=3).a−bMeans within row with different lowercase superscript are significantly different (p<0.05) from each other.Taro flour (TF), Wheat flour (WF)
Table 3: Color characteristics of Taro, wheat and different concentration mixes of flour
Flour L* a* b*
TF 74.59±0.78a 5.81±0.45c 17.22±0.66e
WF 98.19±2.13e 0.49±0.09b 11.13±0.46a
TF/WF (%) 10:90 96.43±2.19d 0.44±0.05ab 15.19±0.54d
TF/WF (%) 20:80 94.71±2.11c 0.42±0.06ab 13.96±0.48c
TF/WF (%) 30:70 93.22±2.16b 0.40±0.03a 12.59±0.41b
TF/WF (%) 40:60 91.79±1.56b 0.38±0.02a 11.88±0.36ab
Data are presented as means±SEM (n=3).a−bMeans within row with different lowercase superscriptare significantly different (p<0.05) from each other.Taro flour (TF), Wheat flour (WF)
high amylopectin content has been reported toretrograde slowly (Bamidele, Cardoso & Olaofe,1990). The water absorption capacity indicatesthe water holding capacity of dough during theprocessing of different bakery products. Thehigher water absorption capacity of gluten indic-ates a high content of starch. Gluten samplesvaried in all four wheat cultivars which may bedue to the difference in drying conditions. Thewater absorption capacity is considered a criticalfunction of the protein in viscous food like soups,gravies, dough, and baked products mainly breadand cakes (Singh & Singh, 2006). The differencesin water absorption are mainly attributed to the
greater number of hydroxyl groups which existin the fiber structure and allow more water in-teractions through hydrogen bonding (Rosell etal., 2001). Fat binding capacity is an import-ant feature of polysaccharides. It is in part re-lated to the chemical composition, but it is moreclosely linked to the porosity of the fiber struc-ture than to the affinity of the fiber moleculeto oil (Biswas, Kumar, Bhosle, Sahoo & Chatli,2011). In different concentration of taro and WFthe moisture content, crude protein, crude fat,and carbohydrates were present in decreasing or-der and ash and crude fiber was present in in-creasing order. Similar results were reported by
IJFS February 2021 Volume 10 pages SI14–SI25
Cake prepared from taro (Colocasia esculenta) SI19
Eke, Sanni and Owuno (2009) in banana cake,and See, Noor Aziah and Wan Nadiah (2007) inbread cakes. SDS sedimentation varied between3.45 to 33.02% respectively, and as the concentra-tion of TF increased, SDS value decreased. TheSDS sedimentation volume is a good indicatorof wheat flour quality. Present SDS values arein agreement with the values determined by Su-pekar, Patil and Munjal (2005). The SDS sedi-mentation value of wheat flours is based on thefact that gluten protein absorbs water and swellsconsiderably when treated with lactic acid. Thewet gluten content and the dry gluten contentwere present in WF 30.45 and 9.83%, respect-ively and absent in TF. Gluten is an importantconstituent of wheat because it provides strengthto dough and texture to baked wheat products.Higher gluten content in WF is recommended forbread and lower gluten content is found betterfor biscuits and cookies (Autran, Hamer, Plijter& Pogna, 1997). In a response surface studyon gluten extraction from low-grade flour anddurum flour, it was found that the protein con-centration in protein fractions increased as thewater content in the dough increased from 400to 710 g/Kg (Dik, Yondem-Makascioglu, Aytac& Kincal, 2002). This provides the dry matter ofgluten protein present in flour and water absorp-tion capacity of gluten present in flour. However,results determined by Singh and Singh (2006)ranged between 5.9 and 10.1 % of dry glutenyield. Supekar et al. (2005) determined the drygluten content in the range of 9.4 to 12.7 %. Sim-ilar results were reported by Pharande, Dhotreand Adsule (1988).Color is a significant parameter which in-cludes the physical appearance of the product(Bhandari, Patel & Dong Chen, 2008). Table 3shows the color values (L*, a* and b*) of TFwas ranged between L* 74.59, a* 5.81, b* 17.22and WF L* 98.19, a* 0.49, b* 11.13 and in dif-ferent concentrations of TF and WF color valuesranged between L* 96.43, a* 0.44, b* 15.19 inTF/WF 10:90%, L* 94.71, a* 0.42, b* 13.96 inTF/WF 20:80%, L* 93.22, a* 0.44, b* 12.41 inTF/WF 30:70% and L* 91.79, a* 0.38, b* 11.88in TF/WF 40:60%. Kumar et al. (2014) repor-ted similar results for taro cake. They also repor-ted that with substitution of taro carbohydrate,fiber, water absorption index and water solubility
index were increased.
3.2 Dough properties
Textural properties of dough, glutenextracted and cake
Textural properties (hardness, cohesiveness,stickiness, and adhesion) were analyzed to assessthe effect of the addition of TF to WF on doughquality shown in Table 4. As reported by Carsonand Sun (2001), texture analysis is an object-ive physical examination of baked products andgives direct information on the product quality,while dough rheology tests provide informationon the baking suitability of the flour as raw ma-terial. Similar results showing increased hardnesswere found in bread prepared with 10%, 20%,and 30% buckwheat flour (Torbica, Hadnadev &Dapcevic, 2010). Gluten has a significant effecton the consistency of dough, and also affects thestructure of molecules in the flour. According toChang and Liu (1991), the level and structure ofprotein and starch have an effect on the hydra-tion pattern of flour and modify the consistencyof dough. In gluten-free muffins prepared withteff, flour similar results were reported by Tess,Bhaduri, Ghatak and Navder (2015).
Physical characteristics of the cake
The effect of TF incorporation on the physicalproperties of the cake is summarized in Table 5.Increase in the width and height of the taro cakeand dough were affected by the addition of TFin WF. The weight and the volume of the cakewere also affected by the addition of TF duringformulation. In fact, the weight of the cake aftercooking was increased with the addition of TF.The highest weight was exhibited with TF ad-dition at a level of 40%. The volume of cakeincreased with the addition of TF.
3.3 FTIR interpretation
FTIR is a cheap, fast, reliable, correct and non-destructive method, to find the functional groupspresent in a sample (Schwanninger, Rodrigues,
IJFS February 2021 Volume 10 pages SI14–SI25

SI20 Saklani et al.
Table 4: The textural properties of different types of dough, gluten extract and cake
Cohesiveness (mm) Adhesion (N) Stickiness (N) Hardness (N)
Textural properties of DoughTF (100%) 0.44±0.028a 0.26±0.027a 1.13±0.031a 0.89±0.027a
WF (100%) 0.46±0.033a 0.20±0.026a 0.98±0.034a 0.63±0.029a
TF/WF (%) 10:90 0.46±0.023a 0.22±0.035a 1.00±0.038a 0.67±0.036a
TF/WF (%) 20:80 0.45±0.031a 0.24±0.031b 1.04±0.056a 0.71±0.044a
TF/WF (%) 30:70 0.45±0.025a 0.25±0.029a 1.07±0.064a 0.76±0.042b
TF/WF (%) 40:60 0.44±0.029a 0.26±0.025b 1.09±0.054a 0.81±0.033b
Textural properties of glutenTF (100%) -NA- -NA- -NA- -NA-WF (100%) 0.18±0.019a 0.12±0.027a 0.41±0.31a 0.39±0.31a
TF/WF (%) 10:90 0.17±0.022a 0.11±0.025 a 0.39±0.28b 0.37±0.29a
TF/WF (%) 20:80 0.16±0.021a 0.10±0.021b 0.37±0.24a 0.36±0.27a
TF/WF (%) 30:70 0.15±0.018a 0.09±0.023a 0.36±0.27a 0.35±0.28a
TF/WF (%) 40:60 0.14±0.020a 0.08±0.022a 0.34±0.25b 0.33±0.26b
Textural properties of cakeTF (100%) 2.15±0.19b 1.19±0.21b 1.65±0.36b 1.13±0.36b
WF (100%) 2.11±0.16a 1.11±0.19a 1.44±0.34a 0.98±0.27a
TF/WF (%) 10:90 Cake 2.14±0.15a 1.12±0.24a 1.57±0.41a 1.03±0.28a
TF/WF (%) 20:80 Cake 2.13±0.24a 1.14±0.17a 1.59±0.35b 1.05±0.45ab
TF/WF (%) 30:70 Cake 2.12±0.25ab 1.17±0.11b 1.60±0.28a 1.09±0.33a
TF/WF (%) 40:60 Cake 2.11±0.31b 1.18±0.25b 1.63±0.19ab 1.12±0.27b
Data are presented as means±SEM (n=3).a−bMeans within columns with different lowercase superscript are significantly different (p<0.05)from each other. Taro flour (TF), Wheat flour (WF)
Table 5: Physical characteristics of cakes
Length Width Height Weight before Weight after Volume(cm) (cm) (cm) cooking (g) cooking (g) (cm3)
TF (100%) 13.6±0.37a 8.5±0.44a 7.0±0.22a 150±0.98a 142±0.89a 809±1.13b
WF (100%) 13.4±0.33a 8.5±0.41a 7.1±0.21a 150±0.92a 144±0.92b 808±1.11a
TF/WF 10%/90% 13.4±0.36a 8.5±0.45a 7.0±0.20a 150±0.95a 143±0.94a 797±1.13a
TF/WF 20%/80% 13.5±0.38a 8.5±0.51a 7.0±0.25a 150±0.87b 142±0.90b 803±1.21a
TF/WF 30%/70% 13.4±0.39a 8.5±0.35a 7.0±0.27a 150±0.75b 141±0.80a 809±1.19b
TF/WF 40%/60% 13.5±0.37a 8.5±0.47a 7.1±0.29b 150±0.90a 144±0.95a 814±1.15b
Data are presented as means±SEM (n=3).a−bMeans within row with different lowercase superscript are significantly different (p<0.05) from eachother.Taro flour (TF), Wheat flour (WF)
IJFS February 2021 Volume 10 pages SI14–SI25
Cake prepared from taro (Colocasia esculenta) SI21
Figure 1: Spectra representation of FTIR analysis of TF, WF and different concentrations of TF andWF
Table 6: Liking scores of cakes prepared with TF
Characteristics Maximum TF WF TF/WF TF/WF TF/WF TF/WFscore (100%) (100%) 10%/90% 20%/80% 30%/70% 40%/60%
Color 10 7.5±0.24a 7.5±0.22a 8.5±0.35c 8.0±0.23b 8.0±0.33b 8.0±0.25b
Texture 10 8.0±0.28a 8.0±0.24a 8.0±0.24a 8.0±0.30a 8.0±0.25a 8.0±0.18a
Taste 10 7.5±0.23a 8.0±0.26b 8.5±0.28c 8.5±0.28c 8.0±0.29b 8.0±0.27b
Odor 10 8.0±0.19b 7.5±0.27a 8.5±0.27c 8.5±0.26c 8.0±0.24b 8.5±0.25c
Overall 10 8.0±0.22a 8.0±0.23a 8.5±0.21b 8.5±0.25b 8.0±0.31a 8.0±0.22a
Acceptability
Data are presented as means±SEM (n=3).a−bMeans within row with different lowercase superscript are significantly different (p<0.05) from eachother.Taro flour (TF), Wheat flour (WF)
IJFS February 2021 Volume 10 pages SI14–SI25
SI22 Saklani et al.
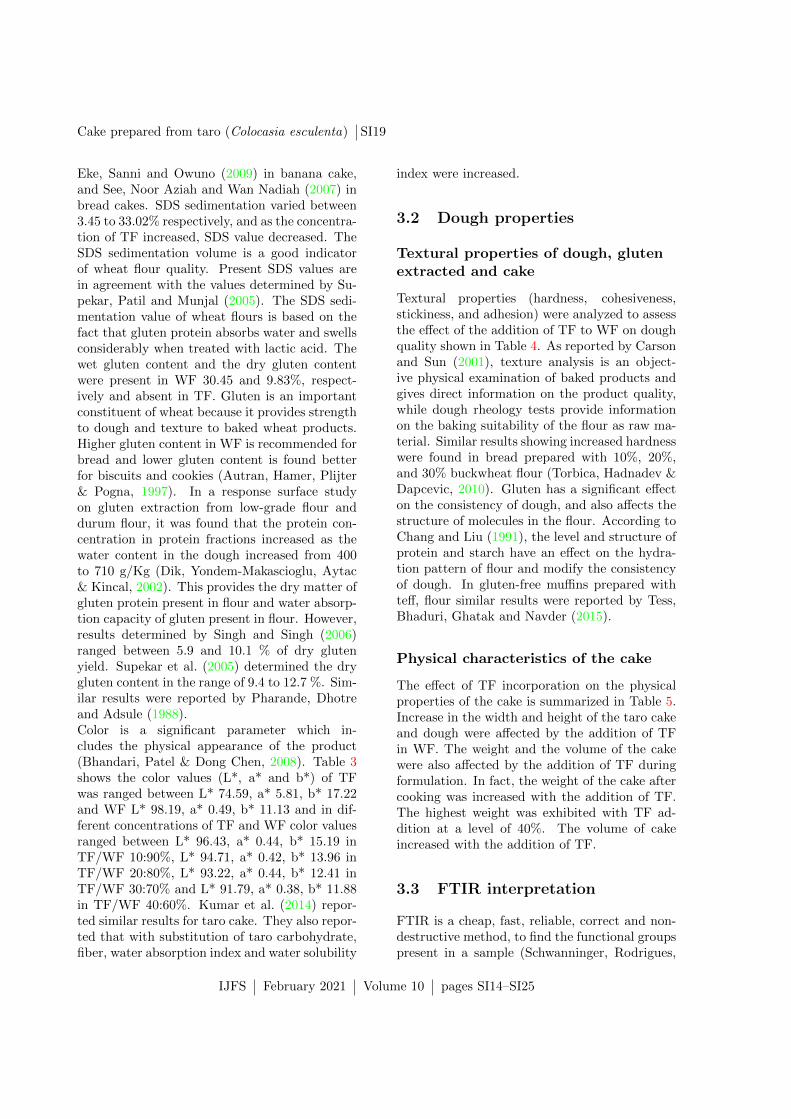
Pereira & Hinterstoisser, 2004). To have inform-ation about the chemical structure of taro flourand wheat flour, the FTIR spectrum is given inFigure 1. The FTIR spectrum was recorded inthe transmission mode between 4000 cm-1 and500 cm-1 for taro and wheat. The spectrum ofbiopolyols had characteristic bands of celluloseat 3420, 1163, 1060, and 1033 cm-1. Addition-ally, the peaks observed at 1714, 1660, 1117, and1013 cm-1 were related to the functional groupsof lignin. The broad band at about 3600-3000cm1 was related to the characteristic stretchingvibration of -OH. The various functional groupspresent in both TF and WF were (-C=C-O-C)(Ether), (-C-OH) (Phenol) and (-C-OH) (1o and2o Alcohol) and (-C-H) (Alkyl). The presence ofthese functional groups represents the molecularcomposition of both TF and WF which furthersupports the conclusion of no interaction in char-acteristic functional groups of flour with the in-gredients of TF.
3.4 Sensory Evaluation
Table 6 shows effects of adding different con-centrations of taro on sensory evaluation of pre-pared cake. The current study applied the sens-ory profiling method involving a panel and had adifferential rank ordered perception for the fourmanufactured cake samples. In taste and odorthere were significant differences in control andother concentrations. Karaoglu and Kotancilar(2009) reported no significant difference amongsamples with and without cake preparation us-ing tapioca starch for liking scores of appear-ance, color and odor. Samples 10 and 20% TF-added showed the highest taste scores. In or-der, WF cake showed the lowest scores whereas,10 and 20% TF-added cake showed highest tastescores. The overall sensory acceptability of TFcake was lowest, whereas, 10% and 20% TF ad-ded cake showed the highest scores. According tothese results, 10 and 20% TF-added cakes showedhigher sensory scores, however, 10% TF-addedcake was utilised for further studies.
4 Conclusions
The health benefits of taro are numerous andreported by several papers. Therefore, taro-enriched cake was developed. Most of the physic-chemical properties of taro were different fromWF. Enrichment with taro significantly affectstextural properties as taro lacks gluten. Thecomposite taro flour at the 40% replacement levelshowed physical properties similar to wheat cakesamples, especially for products from taro-wheatcomposite flour. The taro-wheat composite flourhad the lowest setback and processing stability,which indicated low staling or aging of doughfor cake replaced with taro flour. The compositecake would serve as a functional food because ofthe high trace element content. It can be sugges-ted that other non-cereal products like elephantfoot yam and water caltrop will also be tried forcake preparation. For the future, taro will betried for production of noodles, cookies, bread,buns, pizza base and pan bread.
Acknowledgements
This work was conducted in the School of Bioen-gineering and Food Technology, Shoolini Univer-sity, Solan, Himachal Pradesh. All chemicals,glass wares and Instruments were provided bythe School of Bioengineering and Food Techno-logy, Shoolini University, Solan, Himachal Pra-desh.
References
Anderson, R. A., Conway, H. F., Pfeifer, V. F. &Griffin, E. L. (1969). Gelatinization of corngrits by roll- and extrusion-cooking. CerealScience Today, 14 (1), 4–7.
AOAC. (2005). Official methods of analysis. TheAssociation of Official Analytical Chem-ists (18th ed.). 481. North Fredrick AvenueGaithersburg, Maryland, USA.
Autran, J. C., Hamer, R. J., Plijter, J. J. &Pogna, N. E. (1997). Exploring and im-proving the industrial use of wheats. CerealFoods World, 42 (4), 216–227.
IJFS February 2021 Volume 10 pages SI14–SI25
Cake prepared from taro (Colocasia esculenta) SI23
Axford, D. W. E., Mcdermott, E. E. & Redman,D. G. (1978). Small-scale tests for bread-making quality of wheat. Cereal FoodsWorld, 23 (8), 477–478.
Bamidele, E. A., Cardoso, A. O. & Olaofe, O.(1990). Rheology and baking potential ofwheat/plantain composite flour. Journal ofthe Science of Food and Agriculture, 51 (3),421–424. doi:10.1002/jsfa.2740510315
Bhandari, B., Patel, K. & Dong Chen, X. (2008).Spray drying of food materials - processand product characteristics. Drying Tech-nologies in Food Processing.
Biswas, A., Kumar, V., Bhosle, S., Sahoo, J.& Chatli, M. K. (2011). Dietary fibersas functional ingredients in meat productsand their role in human health. Interna-tional Journal of Livestock Production, 2,45–54.
Bouaziz, F., Koubaa, M., Neifar, M., Zouari-Ellouzi, S., Besbes, S., Chaari, F., . . .Ghorbel, R. E. (2016). Feasibility of usingalmond gum as coating agent to improvethe quality of fried potato chips: Evaluationof sensorial properties. LWT - Food Scienceand Technology, 65, 800–807. doi:10.1016/j.lwt.2015.09.009
Carson, L. & Sun, X. Z. S. (2001). Creep-recovery of bread and correlation to sens-ory measurements of textural attributes.Cereal Chemistry, 78 (1), 101–104. doi:10.1094/CCHEM.2001.78.1.101
Ceserani, V., Kinkton, R. & Foskett, D. (1995).Practical cooking. London: Holder andStronghton.
Chang, S.-m. & Liu, L.-c. (1991). Retrograda-tion of rice starches studied by differentialscanning calorimetry and influence of sug-ars, nacl and lipids. Journal of Food Sci-ence, 56 (2), 564–566. doi:10.1111/j.1365-2621.1991.tb05325.x
Dik, T., Yondem-Makascioglu, F., Aytac, C. H.& Kincal, N. S. (2002). Wet separation ofwheat flours into starch and gluten frac-tions: The combined effects of water toflour ratio-dough maturation time and theeffects of flour aging and ascorbic acid ad-dition. Journal of the Science of Food andAgriculture, 82 (4), 405–413. doi:10.1002/jsfa.1061
Eke, J., Sanni, S. A. & Owuno, F. (2009). Prox-imate and sensory properties of bananacakes. Nigerian Food Journal, 27. doi:10 .4314/nifoj.v27i2.47479
Ganesan, V., Rosentrater, K. A. & Muthukurn-arappan, K. (2008). Flowability and hand-ling characteristics of bulk solids andpowders - a review with implicationsfor ddgs. Biosystems Engineering, 101 (4),425–435. doi:10 . 1016 / j . biosystemseng .2008.09.008
Hambidge, M. (2000). Human zinc deficiency.The Journal of Nutrition, 130 (5), 1344S–1349S. doi:10.1093/jn/130.5.1344S
Huang, C.-C., Chen, W.-C. & Wang, C.-C. R.(2007). Comparison of taiwan paddy- andupland-cultivated taro (colocasia esculental.) cultivars for nutritive values. FoodChemistry, 102 (1), 250–256. doi:10.1016/j.foodchem.2006.04.044
Karaoglu, M. M. & Kotancilar, H. G. (2009).Quality and textural behaviour of par-baked and rebaked cake during prolongedstorage. International Journal of Food Sci-ence & Technology, 44 (1), 93–99. doi:10 .1111/j.1365-2621.2007.01650.x
Kaur, M. & Singh, N. (2005). Studies on func-tional, thermal and pasting properties offlours from different chickpea (cicer ariet-inum l.) cultivars. Food Chemistry, 91 (3),403–411. doi:10.1016/j.foodchem.2004.06.015
Kaushik, R., Chawla, P., Kumar, N., Janghu, S.& Lohan, A. (2018). Effect of premillingtreatments on wheat gluten extraction andnoodle quality. Food Science and Techno-logy International, 24, 108201321878236.doi:10.1177/1082013218782368
Kaushik, R., Chawla, P., Kumar, N. & Kumar,M. (2017). Effect of pre-milling treatmentson wheat flour quality. Annals of the Uni-versity Dunarea De Jos of Galati, FascicleVi-food Technology, 41 (2), 141–152.
Kaushik, R., Kumar, N., Sihag, M. K. & Ray,A. (2015). Isolation, characterization ofwheat gluten and its regeneration proper-ties. Journal of Food Science and Techno-logy - MYSORE, 52 (9), 5930–5937. doi:10.1007/s13197-014-1690-2
IJFS February 2021 Volume 10 pages SI14–SI25

SI24 Saklani et al.
Kaushik, R., Sachdeva, B. & Arora, S. (2015).Heat stability and thermal properties ofcalcium fortified milk. CYTA - Journalof Food, 13 (2), 305–311. doi:10 . 1080 /19476337.2014.971346
Kaushik, R., Sachdeva, B., Arora, S. & Gupta,C. (2015). Effect of fat content on sens-ory and physico-chemical properties oflaboratory-pasteurised calcium- and vit-amin d-fortified mixture of cow and buffalomilk. International Journal of Dairy Tech-nology, 68 (1), 135–143. doi:10.1111/1471-0307.12166
Kumar, N., Khatkar, B. & Kaushik, R. (2014).Effect of reducing agents on wheat glu-ten and quality characteristion of flour andcookies. Journal of Food Science and Tech-nology. doi:10.1007/s13197-013-1224-3
Lampman, G. M., Kriz, G. S. & Vyvyan,J. R. (2001). Introduction to spectroscopy:A guide for students of organic chemistry.Harcourt College Publishers.
Lohan, A., Kaushik, R., Bansal, V. & Gandhi,K. (2020). Flax seeds and finger mil-let enriched functional rusk. InternationalJournal of Food Studies, 9 (1), 213–224.doi:10.7455/ijfs/9.1.2020.a7
Ma, Z., Boye, J. I., Simpson, B. K., Prasher,S. O., Monpetit, D. & Malcolmson, L.(2011). Thermal processing effects on thefunctional properties and microstructureof lentil, chickpea, and pea flours. FoodResearch International, 44 (8, SI), 2534–2544. CIFST/AAFC Meeting, Winnipeg,CANADA, MAY 30-JUN 01, 2010. doi:10.1016/j.foodres.2010.12.017
Nip, W. K., Whitaker, C. S. & Vargo, D. (1994).Application of taro flour in cookie formu-lations. International Journal of Food Sci-ence & Technology, 29 (4), 463–468.
Njintang, Y. N., Mbofung, C. M. F., Moates,G. K., Parker, M. L., Craig, F., Smith,A. C. & Waldron, W. K. (2007). Functionalproperties of five varieties of taro flour, andrelationship to creep recovery and sensorycharacteristics of achu (taro based paste).Journal of Food Engineering, 82 (2), 114–120. doi:10.1016/j.jfoodeng.2006.12.023
Pharande, A. L., Dhotre, V. A. & Adsule, R. N.(1988). Quality characteristics of recently
released wheat variety. J Maha Agric Univ,13, 234–235.
Rana, B., Kaushik, R., Kaushal, K., Arora, S.,Kaushal, A., Gupta, S., . . . Kaushik, P.(2018). Physicochemical and electrochem-ical properties of zinc fortified milk. FoodBioscience, 21, 117–124. doi:10.1016/j.fbio.2017.12.008
Rosell, C. M., Rojas, J. A. & de Barber, C. B.(2001). Influence of hydrocolloids on doughrheology and bread quality. Food Hydrocol-loids, 15 (1), 75–81. doi:10 . 1016 / S0268 -005X(00)00054-0
Sachdeva, B., Kaushik, R., Arora, S. & Kapila,S. (2015). Bioavailability of iron in multiplefortified milk. Journal of Food Science andTechnology - MYSORE, 52 (9), 6017–6023.doi:10.1007/s13197-015-1711-9
Sachdeva, B., Kaushik, R., Arora, S. & Pa-laniswamy, I. (2015). Impact of fortifica-tion with iron salts and vitamin a on thephysicochemical properties of laboratory-pasteurised toned milk and bioaccessibil-ity of the added nutrients. InternationalJournal of Dairy Technology, 68. doi:10 .1111/1471-0307.12185
Schwanninger, M., Rodrigues, J. C., Pereira,H. & Hinterstoisser, B. (2004). Effects ofshort-time vibratory ball milling on theshape of ft-ir spectra of wood and cellu-lose. Vibrational Spectroscopy, 36 (1), 23–40. doi:10.1016/j.vibspec.2004.02.003
See, E. F., Noor Aziah, A. A. & Wan Na-diah, W. A. (2007). Physico-chemical andsensory evaluation of breads supplementedwith pumpkin flour. ASEAN Food Journal,14 (2), 123. Retrieved from http://www.ifrj.upm.edu
Sharma, N., Khatkar, B. S., Kaushik, R.,Sharma, P., Sharma, R. et al. (2017). Isol-ation and development of wheat based glu-ten edible film and its physicochemicalproperties. International Food ResearchJournal, 24 (1), 94–101.
Sharma, S., Kaushik, R., Sharma, P., Sharma,R., Thapa, A. & Kp, I. (2016). Antimicro-bial activity of herbs against yersinia en-terocolitica and mixed microflora. Annalsof the University Dunarea De Jos of Galati,
IJFS February 2021 Volume 10 pages SI14–SI25

Cake prepared from taro (Colocasia esculenta) SI25
Fascicle Vi-food Technology, 40 (2), 119–134.
Sharma, S., Kaushik, R., Sharma, S., Chouhan,P. & Kumar, N. (2016). Effect of herb ex-tracts on growth of probiotic cultures. In-dian Journal of Dairy Science, 69 (3), 328–335.
Singh, B. & Singh, N. (2006). Physico-chemical,water and oil absorption and thermal prop-erties of gluten isolated from different in-dian wheat cultivars. Journal of Food Sci-ence and Technology, 43, 251–255.
Soudy, I. D., Delatour, P. & Grancher, D. (2010).Effects of traditional soaking on the nutri-tional profile of taro flour (colocasia escu-lenta l. schott) produced in chad. Revue DeMedecine Veterinaire, 161 (1), 37–42.
SPC. (2006). Secretariat of the pacific com-munity. Taro Pacific Food Leaflet. HealthyPacific Lifestyle Section- Secretariat of thePacific Community New Caledonia. ISSN1018-0966. Retrieved from https://www.spc . int / DigitalLibrary / Doc / PHD /Unsorted / Healthy Lifestyle / Nutrition /Food leaflet compilation.pdf
Srivastava, R. P., Sanjeev, K. & Kumar, S.(2002). Fruit and vegetable preservation.Global Media.
Supekar, D. T., Patil, S. R. & Munjal, S. (2005).Comparative study of some important aes-tivum, durum and dicoccum wheat cul-tivars for grain, flour quality and suit-ability for chapati making characteristics.Journal of Food Science and Technology -MYSORE, 42, 488–492.
Tagodoe, A. & Nip, W.-k. (1994). Func-tional properties of raw and precookedtaro (calacasia esculenta). InternationalJournal of Food Science & Technology, 29,457–462. doi:10 . 1111/ j . 1365 - 2621 .1994 .tb02087.x
Tess, M., Bhaduri, S., Ghatak, R. & Navder,K. P. (2015). Physical, textural and sensorycharacteristics of gluten free muffins pre-pared with teff flour (eragrostistef (zucc)trotter). Journal of Food Processing &Technology, 06. doi:10 . 4172 / 2157 - 7110 .1000490
Torbica, A., Hadnadev, M. & Dapcevic, T.(2010). Rheological, textural and sens-
ory properties of gluten-free bread for-mulations based on rice and buckwheatflour. Food Hydrocolloids, 24 (6-7), 626–632. doi:10.1016/j.foodhyd.2010.03.004
IJFS February 2021 Volume 10 pages SI14–SI25
Copyright © 2022 FDOKUMEN