Response of fruit growth and ripening to crop level in dry-farmed Cabernet Sauvignon on four...
11
Am. J. Enol. Vitic. 57:3 (2006) 314 There is much discussion on the proper balance of vegetative and reproductive growth in viticulture. To opti- mize reproductive growth and ultimately yield, it is essen- tial to have an estimate of cropping potential, that is, the amount of fruit that can ripen. In grapevine, as in other perennial plants, vegetative and reproductive growth oc- curs simultaneously. Competition between the two pro- cesses begins when resources are not sufficient to sup- port growth at potential rates. Such competition is generally agreed to be the basis for the partitioning of re- sources to reproductive and vegetative organs (Wardlaw 1990). The indeterminate growth habit allows vegetative growth to compete for resources well beyond flowering, in contrast to determinate crops such as corn or sunflower. Several cultural factors contribute to the partitioning be- tween vegetative and reproductive growth, including di- rect manipulation of sinks, water and nutrient status, and grafting via rootstock-scion combinations. In a vineyard, common methods to regulate partitioning into vegetative and reproductive growth are winter prun- ing to manipulate the number of buds per vine, cluster thinning, or a combination (Winkler et al. 1974). Since most buds in cultivated grape are mixed buds, pruning necessarily affects both vegetative and reproductive growth. Reproductive growth (measured as yield) is more responsive than vegetative growth (usually measured as pruning weight) to pruning (buds/vine) (Lider et al. 1973, Freeman et al. 1979, Williams 1996). Consequently, vines can be “overcropped” (bear more reproductive sinks than the vegetative growth can mature) by pruning to high numbers of buds per vine (Winkler 1954). Overcropping can be avoided after pruning by removal of some repro- ductive sinks by cluster thinning that directly reduces re- productive growth. Some compensatory shoot and fruit growth can occur, but only when thinning is done early in the season (Winkler 1931). When clusters are thinned at veraison or later, there is a slight or no effect on leaf area per shoot or per cluster, higher concentrations of carbo- hydrate reserves accumulate (Duchene et al. 2003), yield is reduced, and grapes ripen earlier (Bertamini et al. 1991). The impact of overcropping and cluster thinning on sen- sory attributes of wines was recently studied (Chapman et al. 2004). Cropping potential and growth partitioning can also be affected by manipulating vine water status, but the role of water status is complex. First, irrigation to increase vine water status is widely used to increase crop production. Yet, irrigation, similar to pruning, affects both vegetative and reproductive growth. Contrary to pruning, the avail- able evidence indicates that vegetative growth is more sensitive to vine water status. One study showed that when any fraction of applied water was reduced, in irri- Response of Fruit Growth and Ripening to Crop Level in Dry-Farmed Cabernet Sauvignon on Four Rootstocks Vitale Nuzzo 1 * and Mark A. Matthews 2 1 Assistant professor, Universita’ degli Studi della Basilicata, Dipartimento di Scienze dei Sistemi Colturali, Forestali e dell’Ambiente, V. le Dell’Ateneo Lucano, 10, 85100 Potenza, Italy; 2 Professor, Department of Viticulture and Enology, University of California, Davis, CA 95616. *Corresponding author [fax: 39 (0) 971 20 5378; email: [email protected]] Acknowledgments: The authors thank the Fullbright Commission for sup- porting Vitale Nuzzo’s stay in the laboratory of M.A. Matthews and thank Erick Schultz and Miwako Sugihara for technical assistance. Manuscript submitted June 2005; revised March 2006 Copyright © 2006 by the American Society for Enology and Viticulture. All rights reserved. Abstract: An estimate of the amount of clusters that a vine can reasonably bring to maturity is essential for op- timizing crop level. This work was conducted to determine whether the timing of maturity in a high-yielding, dry- farmed Vitis vinifera L. Cabernet Sauvignon vineyard could be manipulated through rootstocks and crop level. Cabernet Sauvignon, grafted on 5C Teleki (V. berlandieri Planch. x V. riparia Michx), 1103 Paulsen, 140 Ruggeri, and 110 Richter (V. berlandieri Planch. x V. rupestris Scheele), was used in a trial carried out in 1997 and 1998 in an 8- year-old vineyard near Oakville, California. Four levels of crop were imposed by winter pruning all vines to four- bud spurs and cluster thinning at veraison: treatment 1 (100%), or double crop, no thinned vines with ~26 shoots and 40 clusters per vine; treatment 2 (75%), in which 25% of clusters were thinned; treatment 3 (50%), the stan- dard crop level in the study area or control, in which 50% of clusters were thinned and one cluster per shoot was retained; and treatment 4 (25%), in which 75% of clusters were thinned and one cluster every two shoots was retained. The time required to reach 23.5, 24.0, and 25.0 Brix was linearly dependent on crop level with a rate of about one day per each ton of grapes. Rootstocks and crop levels had no or little impact on fruitfulness, cluster and berry size, and final Brix. The reduction in sugar accumulation seems to be a sensitive measure for crop level and does not appear to be influenced by rootstock or environmental conditions. Key words: berry growth, berry composition, yield, 1103 Paulsen, 140 Ruggeri, 110 Richter, 5C Teleki
Transcript of Response of fruit growth and ripening to crop level in dry-farmed Cabernet Sauvignon on four...

314 – Nuzzo and Matthews
Am. J. Enol. Vitic. 57:3 (2006)
314
There is much discussion on the proper balance ofvegetative and reproductive growth in viticulture. To opti-mize reproductive growth and ultimately yield, it is essen-tial to have an estimate of cropping potential, that is, theamount of fruit that can ripen. In grapevine, as in otherperennial plants, vegetative and reproductive growth oc-curs simultaneously. Competition between the two pro-cesses begins when resources are not sufficient to sup-port growth at potential rates. Such competition isgenerally agreed to be the basis for the partitioning of re-sources to reproductive and vegetative organs (Wardlaw1990). The indeterminate growth habit allows vegetativegrowth to compete for resources well beyond flowering, incontrast to determinate crops such as corn or sunflower.Several cultural factors contribute to the partitioning be-tween vegetative and reproductive growth, including di-rect manipulation of sinks, water and nutrient status, andgrafting via rootstock-scion combinations.
In a vineyard, common methods to regulate partitioninginto vegetative and reproductive growth are winter prun-
ing to manipulate the number of buds per vine, clusterthinning, or a combination (Winkler et al. 1974). Sincemost buds in cultivated grape are mixed buds, pruningnecessarily affects both vegetative and reproductivegrowth. Reproductive growth (measured as yield) is moreresponsive than vegetative growth (usually measured aspruning weight) to pruning (buds/vine) (Lider et al. 1973,Freeman et al. 1979, Williams 1996). Consequently, vinescan be “overcropped” (bear more reproductive sinks thanthe vegetative growth can mature) by pruning to highnumbers of buds per vine (Winkler 1954). Overcroppingcan be avoided after pruning by removal of some repro-ductive sinks by cluster thinning that directly reduces re-productive growth. Some compensatory shoot and fruitgrowth can occur, but only when thinning is done early inthe season (Winkler 1931). When clusters are thinned atveraison or later, there is a slight or no effect on leaf areaper shoot or per cluster, higher concentrations of carbo-hydrate reserves accumulate (Duchene et al. 2003), yieldis reduced, and grapes ripen earlier (Bertamini et al. 1991).The impact of overcropping and cluster thinning on sen-sory attributes of wines was recently studied (Chapman etal. 2004).
Cropping potential and growth partitioning can also beaffected by manipulating vine water status, but the role ofwater status is complex. First, irrigation to increase vinewater status is widely used to increase crop production.Yet, irrigation, similar to pruning, affects both vegetativeand reproductive growth. Contrary to pruning, the avail-able evidence indicates that vegetative growth is moresensitive to vine water status. One study showed thatwhen any fraction of applied water was reduced, in irri-
Response of Fruit Growth and Ripening to Crop Level inDry-Farmed Cabernet Sauvignon on Four Rootstocks
Vitale Nuzzo1* and Mark A. Matthews2
1Assistant professor, Universita’ degli Studi della Basilicata, Dipartimentodi Scienze dei Sistemi Colturali, Forestali e dell’Ambiente, V. le Dell’AteneoLucano, 10, 85100 Potenza, Italy; 2Professor, Department of Viticultureand Enology, University of California, Davis, CA 95616.
*Corresponding author [fax: 39 (0) 971 20 5378; email: [email protected]]
Acknowledgments: The authors thank the Fullbright Commission for sup-porting Vitale Nuzzo’s stay in the laboratory of M.A. Matthews and thankErick Schultz and Miwako Sugihara for technical assistance.
Manuscript submitted June 2005; revised March 2006
Copyright © 2006 by the American Society for Enology and Viticulture.All rights reserved.
Abstract: An estimate of the amount of clusters that a vine can reasonably bring to maturity is essential for op-timizing crop level. This work was conducted to determine whether the timing of maturity in a high-yielding, dry-farmed Vitis vinifera L. Cabernet Sauvignon vineyard could be manipulated through rootstocks and crop level. CabernetSauvignon, grafted on 5C Teleki (V. berlandieri Planch. x V. riparia Michx), 1103 Paulsen, 140 Ruggeri, and 110Richter (V. berlandieri Planch. x V. rupestris Scheele), was used in a trial carried out in 1997 and 1998 in an 8-year-old vineyard near Oakville, California. Four levels of crop were imposed by winter pruning all vines to four-bud spurs and cluster thinning at veraison: treatment 1 (100%), or double crop, no thinned vines with ~26 shootsand 40 clusters per vine; treatment 2 (75%), in which 25% of clusters were thinned; treatment 3 (50%), the stan-dard crop level in the study area or control, in which 50% of clusters were thinned and one cluster per shoot wasretained; and treatment 4 (25%), in which 75% of clusters were thinned and one cluster every two shoots wasretained. The time required to reach 23.5, 24.0, and 25.0 Brix was linearly dependent on crop level with a rate ofabout one day per each ton of grapes. Rootstocks and crop levels had no or little impact on fruitfulness, clusterand berry size, and final Brix. The reduction in sugar accumulation seems to be a sensitive measure for crop leveland does not appear to be influenced by rootstock or environmental conditions.
Key words: berry growth, berry composition, yield, 1103 Paulsen, 140 Ruggeri, 110 Richter, 5C Teleki

Response of Fruit Growth and Ripening to Crop Level – 315
Am. J. Enol. Vitic. 57:3 (2006)
gated viticulture, vegetative growth decreased; but ap-plied water could be reduced as much as 50% before yielddecreased (Williams 1996). Another study showed thatwhen furrow irrigation produced slightly lower midday leafwater potentials than drip irrigation, shoot length was re-duced by 17%, but fruit weight was reduced only by 6%(Araujo et al. 1995). It was recently shown that fruitgrowth was not inhibited until midday leaf water potentialdecreased to -1.25 MPa (Roby et al. 2004), but shootgrowth is completely inhibited at about -1.2 MPa (Mat-thews et al. 1987, Schultz and Matthews 1988).
Second, water deficits are reported to accelerate fruitripening (van Leeuwen et al. 2003), but it is clear that wa-ter deficits inhibit the photosynthesis and translocationprocesses required for ripening (Chaves and Oliveira2004). Moderate water deficits may result in sugar accumu-lation in fruit by decreasing partitioning to alternate veg-etative sinks (Roby et al. 2004), but severe water deficitslimit the crop that can be ripened by reducing photosyn-thate production via inhibiting the rate of photosynthesis,inhibiting the development of photosynthetic leaf area,and accelerating leaf senescence while having less impacton reproductive sinks.
The role of rootstocks in partitioning and reproductivegrowth is less clear, particularly with respect to dry condi-tions. Although differences are often reported, for example,more vegetative growth compared to yield on Rupestris St.George (Vitis rupestris) (Ough et al. 1968), and converselya consistently greater partitioning to fruit on Riparia Gloire(Ollat et al. 2003), the many comparisons of relative veg-etative and reproductive growth of scions have producedfew consistently significant differences among rootstocks.This lack of consistency may indicate that the potentialfor rootstocks to impact scion growth can be obscured bythe various environments (irrigation and fertilization) inwhich the trials have been conducted. Thus, despite refer-ences to drought tolerance (Galet 1988, Pongracz 1983),there are few data directly addressing drought tolerancein the literature to indicate significant differences amongrootstocks. However, Ezzahouani and Williams (1995)showed clear effects of rootstocks on vegetative and re-productive growth of table-grape scions when grown underdry-farmed conditions.
The primary objective of this study was to determinehow much crop could be ripened when irrigation waterwas not available or used. This trial determined the croppotential and fruit ripening of Cabernet Sauvignon graftedonto four rootstocks and grown under dry-farmed condi-tions in an irrigated viticulture region (Napa Valley, CA).The rootstock cultivars with distinct growth habits—5CTeleki (V. berlandieri Planch. x V. riparia Michx) and 1103Paulsen (1103 P), 140 Ruggeri (140 Ru), and 110 Richter(110 R) (V. berlandieri Planch. x V. rupestris Scheele)—areestablished as commercially viable, phylloxera-resistantrootstocks with some reputation for differences indrought tolerance (110 R and 140 Ru tolerant, 5C sensitive)(Galet 1988, Pongracz 1983). However, there is little data
directly addressing drought tolerance in the literature toindicate significant differences among rootstocks.
Materials and Methods
Plant material and experimental design. Vitis viniferaL. cv. Cabernet Sauvignon scions grafted onto V. berlan-dieri Planch. x V. riparia Michx (5C Teleki) and V. berlan-dieri Planch. x V. rupestris Scheele (1103 P, 140 Ru, and110 R) rootstocks were planted at 1.0 x 2.44 m (vine x row)spacing and a 4,000 vines/ha vine density at the OakvilleExperimental vineyard (Napa Valley), operated by the De-partment of Viticulture and Enology, University of Califor-nia, Davis (lat: 38.43°; long: 122.41°). Vines were trained tounilateral cordons with a trunk height of 0.9 m, spur-pruned with six 2-bud spurs per meter of cordon, and trel-lised for vertical shoot-positioning. Summer pruning asshoot thinning, shoot topping (removal of shoot apex), orhedging was not performed. The vineyard was not irri-gated. Pest control and soil management practices wereperformed according to local recommendations. The cli-mate is low region III with an average of 1720 growingdegree days (base 10°C) (Winkler et al. 1974). The soil is agravelly, Bale clay loam (Lambert and Kashiwagi 1978),characterized as being part of alluvial fans with depths of183 cm or greater. Soil water-holding capacity is consid-ered moderate to high, at 0.08 cm of water per cm of soil.It is common for this soil type to have a water table dur-ing the winter and spring at ~120 cm depth.
Yield treatments were imposed in 1997 and 1998 bypruning to 4-bud spurs (24 to 28 buds/vine) and clusterthinning. The 4-bud spurs resulted in 100% more budsthan the 2-bud spurs in standard practice. Initial crop levelwas determined by counting the clusters and shoots ofeach vine at flowering. Four treatments were then im-posed: 100%, 2x standard crop (all clusters retained); 75%,1.5x standard crop (75% of clusters retained); 50%, stan-dard crop (50% of clusters retained, leaving one clusterper shoot); 25%, half standard crop (25% of clusters re-tained, leaving one cluster every two shoots). Cluster thin-ning was imposed at the onset of veraison and startedwith the apical cluster. Onset of veraison was determinedfrom a visual assessment of 5 to 10% of the berries hav-ing black color. Clusters were thinned on 8 July 1997 and3 Aug 1998. Harvest started as each treatment exceeded23.5 Brix.
At harvest, the number of clusters, the number ofshoots, and yield were determined for each vine. In 1998,four representative primary shoots per treatment (16shoots per rootstock) were collected; leaf area per shootwas measured with a video-based area meter calibratedwith opaque triangles of known area (Delta-T Device, Cam-bridge, UK). Mean shoot leaf area was multiplied by pri-mary shoot number per vine to calculate leaf area per vine.
In 1997, the weight of pruning material was determinedduring pruning the following winter when vines were dor-mant. In 1998, after harvest, 16 randomly selected primary

316 – Nuzzo and Matthews
Am. J. Enol. Vitic. 57:3 (2006)
shoots were collected and weighed in each rootstock.Mean shoot weight was multiplied by primary shoot num-ber per vine to calculate kg pruning weight per vine. Cropload was expressed on vine basis as yield to pruningweight ratio and as leaf area to yield ratio.
Treatments were arranged as a split-plot design withfour replications. Rootstocks were the whole plots, andcrop load was the split plot. Whole plots were 4 rows x 12vines; split plots were three vines within each row. Root-stock plots were randomly distributed down the rows, andcluster-thinning treatments were randomly distributedwithin rootstock plots. Only the center two rows wereused for data collection; each of the three vines in a splitplot was subsampled for a total of 192 vines (4 rootstocksx 4 yield treatments x 4 replications x 3 subsamples).
Meteorological variables were measured by a standardweather station of the California Irrigation ManagementInformation System (CIMIS) placed close to the experi-mental field. Growing degree days (GDD) were calculatedby subtracting 10°C (the minimum temperature threshold)from average temperature reported by the CIMIS daily re-port. Daily values were added from 1 Apr to 31 Oct.
Fruit samples and juice analysis. Samples of 50 to 100berries were collected at 10-day intervals beginning ap-proximately two weeks after fruit set and concluding atharvest. Berries were randomly picked from the clusters ofthe vines of each split plot. The berries sampled were im-mediately enclosed in a plastic bag, stored in a portablerefrigerator, and transported to the laboratory where freshweight (the rachis stem was removed) was recorded. Afterveraison, sampled berries were counted, weighed, macer-ated in a mortar, and then squeezed through two layers ofcheesecloth. Aliquots of the expressed juice were immedi-ately analyzed for total soluble solids (Brix) with a handrefractometer. In 1998, titratable acidity (TA) by titration toa pH end point of 8.4 with 0.1 N NaOH using phenolphtha-lein as indicator (expressed as g tartaric acid equiv. per Lof juice). The pH of the juice was measured with a pHmeter, using a glass electrode (HI1048; Hanna Instruments,Woonsocket, RI). At harvest, a further sample of 100 ber-ries randomly selected from vines of each split plot wascollected. Disks of dermal tissue (0.20 cm2) were removedwith a cork borer. Anthocyanins were extracted with acidi-fied methanol and the concentration estimated from theA535 according to (Amerine and Ough 1988).
Leaf water potential. Vine water status was determinedas midday leaf water potential (LWP) measured with thepressure chamber technique as described by Matthews etal. (1987). Briefly, healthy, fully expanded, and well-ex-posed leaves positioned between the 10th and the 15thnodes of the primary shoots were enclosed in a polyethyl-ene bag, excised, and immediately placed into a humidifiedpressure chamber for measurement. Measurements of LWPwere performed each month from 10 July to 5 Oct.
Data analysis. Data were analyzed by the analysis ofvariance using SigmaStat 3.0.1 software (SSPS, Inc. Chi-cago, IL). When warranted, the Student-Newman-Keuls
test was used to compare the means or a linear and sec-ond-degree polynomial regression analysis was performed.
ResultsThis trial included the hottest (1997) and the coolest
(1998) years of the preceding decade, 1989 to 1998 (Figure1). The difference between the two years was soon evi-dent in the growing season. Accumulation of growing de-gree days (GDDs) began almost one month earlier in 1997than in 1998. In 1997 fruit set was completed on 8 Junewhen 589 GDD were accumulated, while in 1998 fruit setcompleted on 29 June when only 427 GDD were accumu-lated. Veraison was on 8 July in 1997 (888 GDD) and on 2Aug in 1998 (763 GDD). The year 1998 was also unusu-ally rainy (1430 mm) as compared to the average of the1989 to 1998 period (930 mm). Nevertheless, in the 1998growing season there were five months (from the end ofMay to the end of October) without any rainfall.
Despite no irrigation, midday leaf water potentials(LWP) did not reach very low values in either season. In1997, midday LWP ranged from -1.10 MPa at the begin-ning of veraison to -1.37 MPa at harvest. There were nodifferences among rootstocks. In 1998, midday LWP de-creased from -0.92 MPa during stage I of berry develop-ment to -1.36 MPa at harvest (Table 1). Generally, in thefirst part of the growing season (from fruit set to veraison),vines on 5C showed a significantly lower midday LWPthan the other rootstocks and particularly 110 R and 140Ru. At veraison (36 days after fruit set), midday LWP wassimilar among rootstocks and ranged from -1.25 to -1.29MPa. In the second part of the growing season, fromveraison to harvest, vines grafted on 5C had a higher mid-day LWP than did vines on other rootstocks.
At fruit set, rootstocks did not differ significantly infruitfulness (clusters/shoot) or in crop level (clusters/vine)with 4-bud spurs (Table 2). In 1997, crop level varied from
Figure 1 Accumulation of growing degree days from 15 Mar to 31 Octduring 1997 and 1998 and the average of 10 years of growing seasons(1989 to 1998). Data were collected by the automatic weather station atOakville.
Response of Fruit Growth and Ripening to Crop Level – 317
Am. J. Enol. Vitic. 57:3 (2006)
~20 to 49 clusters/vine. In 1998, the crop level was statis-tically well separated among the cluster-thinning treat-ments, varying from 16.9 ± 4.6 to 42.3 ± 6.6. The cluster-thinning treatments created crop levels that were ~150%greater on unthinned vines than on heavily thinned vines.The crop level on the vines nominally thinned to 50% ofthe clusters present at veraison was similar to the stan-dard crop level for similarly trained vines.
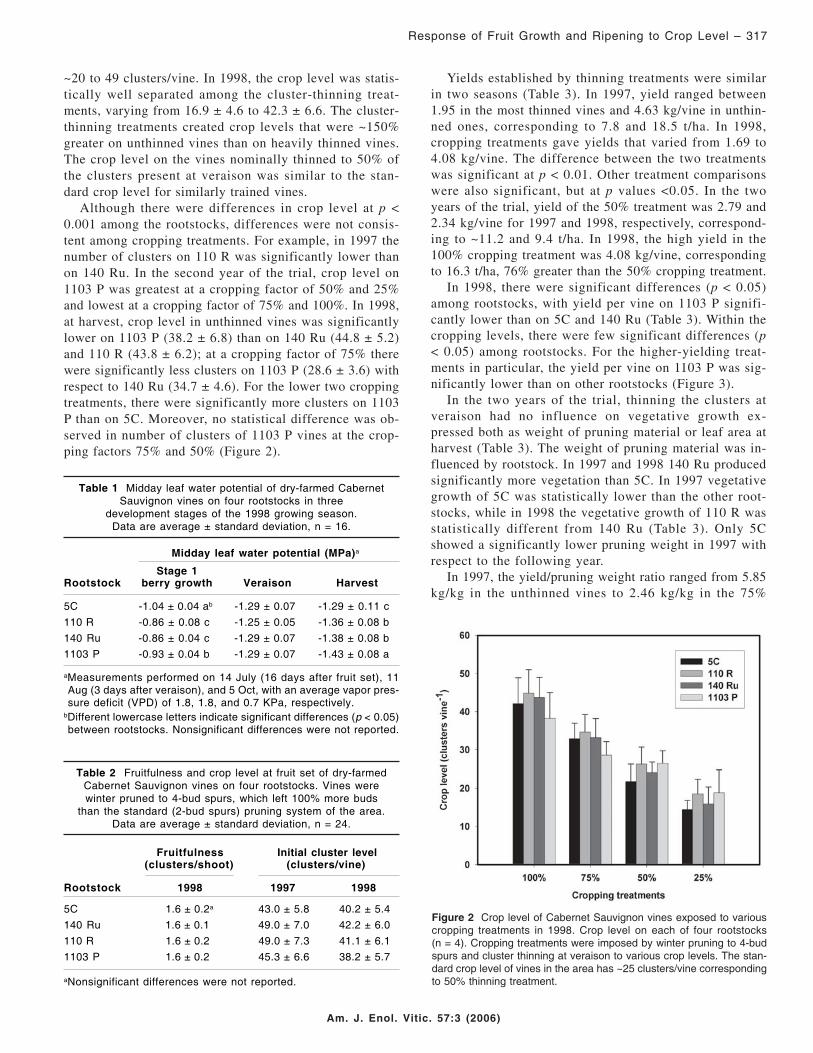
Although there were differences in crop level at p <0.001 among the rootstocks, differences were not consis-tent among cropping treatments. For example, in 1997 thenumber of clusters on 110 R was significantly lower thanon 140 Ru. In the second year of the trial, crop level on1103 P was greatest at a cropping factor of 50% and 25%and lowest at a cropping factor of 75% and 100%. In 1998,at harvest, crop level in unthinned vines was significantlylower on 1103 P (38.2 ± 6.8) than on 140 Ru (44.8 ± 5.2)and 110 R (43.8 ± 6.2); at a cropping factor of 75% therewere significantly less clusters on 1103 P (28.6 ± 3.6) withrespect to 140 Ru (34.7 ± 4.6). For the lower two croppingtreatments, there were significantly more clusters on 1103P than on 5C. Moreover, no statistical difference was ob-served in number of clusters of 1103 P vines at the crop-ping factors 75% and 50% (Figure 2).
Yields established by thinning treatments were similarin two seasons (Table 3). In 1997, yield ranged between1.95 in the most thinned vines and 4.63 kg/vine in unthin-ned ones, corresponding to 7.8 and 18.5 t/ha. In 1998,cropping treatments gave yields that varied from 1.69 to4.08 kg/vine. The difference between the two treatmentswas significant at p < 0.01. Other treatment comparisonswere also significant, but at p values <0.05. In the twoyears of the trial, yield of the 50% treatment was 2.79 and2.34 kg/vine for 1997 and 1998, respectively, correspond-ing to ~11.2 and 9.4 t/ha. In 1998, the high yield in the100% cropping treatment was 4.08 kg/vine, correspondingto 16.3 t/ha, 76% greater than the 50% cropping treatment.
In 1998, there were significant differences (p < 0.05)among rootstocks, with yield per vine on 1103 P signifi-cantly lower than on 5C and 140 Ru (Table 3). Within thecropping levels, there were few significant differences (p< 0.05) among rootstocks. For the higher-yielding treat-ments in particular, the yield per vine on 1103 P was sig-nificantly lower than on other rootstocks (Figure 3).
In the two years of the trial, thinning the clusters atveraison had no influence on vegetative growth ex-pressed both as weight of pruning material or leaf area atharvest (Table 3). The weight of pruning material was in-fluenced by rootstock. In 1997 and 1998 140 Ru producedsignificantly more vegetation than 5C. In 1997 vegetativegrowth of 5C was statistically lower than the other root-stocks, while in 1998 the vegetative growth of 110 R wasstatistically different from 140 Ru (Table 3). Only 5Cshowed a significantly lower pruning weight in 1997 withrespect to the following year.
In 1997, the yield/pruning weight ratio ranged from 5.85kg/kg in the unthinned vines to 2.46 kg/kg in the 75%
Table 1 Midday leaf water potential of dry-farmed CabernetSauvignon vines on four rootstocks in three
development stages of the 1998 growing season.Data are average ± standard deviation, n = 16.
Midday leaf water potential (MPa)a
Stage 1Rootstock berry growth Veraison Harvest
5C -1.04 ± 0.04 ab -1.29 ± 0.07 -1.29 ± 0.11 c
110 R -0.86 ± 0.08 c -1.25 ± 0.05 -1.36 ± 0.08 b
140 Ru -0.86 ± 0.04 c -1.29 ± 0.07 -1.38 ± 0.08 b
1103 P -0.93 ± 0.04 b -1.29 ± 0.07 -1.43 ± 0.08 a
aMeasurements performed on 14 July (16 days after fruit set), 11Aug (3 days after veraison), and 5 Oct, with an average vapor pres-sure deficit (VPD) of 1.8, 1.8, and 0.7 KPa, respectively.
bDifferent lowercase letters indicate significant differences (p < 0.05)between rootstocks. Nonsignificant differences were not reported.
Table 2 Fruitfulness and crop level at fruit set of dry-farmedCabernet Sauvignon vines on four rootstocks. Vines werewinter pruned to 4-bud spurs, which left 100% more buds
than the standard (2-bud spurs) pruning system of the area.Data are average ± standard deviation, n = 24.
Fruitfulness Initial cluster level(clusters/shoot) (clusters/vine)
Rootstock 1998 1997 1998
5C 1.6 ± 0.2a 43.0 ± 5.8 40.2 ± 5.4
140 Ru 1.6 ± 0.1 49.0 ± 7.0 42.2 ± 6.0
110 R 1.6 ± 0.2 49.0 ± 7.3 41.1 ± 6.1
1103 P 1.6 ± 0.2 45.3 ± 6.6 38.2 ± 5.7
aNonsignificant differences were not reported.
Figure 2 Crop level of Cabernet Sauvignon vines exposed to variouscropping treatments in 1998. Crop level on each of four rootstocks(n = 4). Cropping treatments were imposed by winter pruning to 4-budspurs and cluster thinning at veraison to various crop levels. The stan-dard crop level of vines in the area has ~25 clusters/vine correspondingto 50% thinning treatment.

318 – Nuzzo and Matthews
Am. J. Enol. Vitic. 57:3 (2006)
thinned vines. In 1998, the thinning treatments gave ayield to pruning weight ratio varying from 4.37 to 1.36 kg/kg (Table 3). The difference between the two treatmentswas significant at p < 0.001. Other comparisons betweentreatments were not always significant. For example, in1997 similar values of the yield/pruning weight ratio werecalculated at cropping factors of the 100% and 75%, whilethe comparisons were significantly different between thesetwo treatments and 3.63 and 2.46 kg/kg, calculated respec-tively for the cropping factor of 50% and 25%. The yield/pruning weight ratio values of the 50% and 25% treat-ments were significantly different. In 1998, the effect ofthinning on the yield to pruning weight ratio was wellseparated from the unthinned treatment. Within thethinned treatments, the values were significantly differentwith the 75% and 25% treatments (Table 3).
Yield to pruning ratio was also influenced by rootstock:5C has generally shown the highest values and 1103 P thelowest. In 1997, the value of yield to pruning weight ratiocalculated in vines grafted on 5C was statistically differentfrom the other rootstocks, but in 1998, 5C, 110 R, and 140Ru showed similar crop load values (Table 3). In 1998,rootstocks had no influence on the leaf area/yield ratiothat was 1.71 and 2.54 m2/kg, respectively, for 140 Ru and110 R. Leaf area per kilogram of fresh fruits was lower in100% and 75% treatments than in the remaining two treat-ments (Table 3). In the two years of the trial, there wereno interactions between years for rootstock and for croplevel factors in yield, pruning weight, and crop load.
Cluster weight was largely unaffected by the treatments.In 1997, the cluster weight ranged from 94.2 to 103.6 g/cluster, with no significant differences. Similarly, in 1998the average cluster weight varied from 92.0 to 101.2 gramsin the 75% and 25% cropping treatments, respectively(Figure 4); again with no significant difference. However,there were significant differences among rootstocks, withcluster weight significantly higher on 5C (p < 0.01) (Figure4). The 25% cropping level on 5C also produced clustersthat weighed 21% more than clusters from the 100% crop-ping level (p < 0.05). Rootstocks 140 Ru and 110 R showedthe same trend, but the gain in cluster weight from 100%to 25% cropping levels was only 6% and 7%, respectively.
In the two years of the trials, there were no differencesamong rootstocks in maximum berry size and in berry sizeat harvest (Table 4). On all rootstocks, berry size reacheda peak 7 to 15 days before harvest. Thereafter berriesshrank from 8.0 to 11.6%, in 1997, and from 3.0 to 6.0%, in1998, between reaching maximum size and harvest. The dif-ferences between the two years were due to a significantlylower berry weight at harvest measured in 1997 comparedwith 1998.
When considering seasonal patterns of berry growth,there were statistical differences in berry size among
Table 3 Yield and vegetative growth of dry-farmed Cabernet Sauvignon grafted on four rootstocks with four crop levels.Data were collected at harvest of 1997 and 1998. Data are average ± standard deviation, n = 16.
Yield Pruning wt Yield:Pruning wt Leaf area Leaf area:Yield(kg vine-1) (kg vine-1) (kg kg-1) (m2 vine-1) (m2 kg-1)
1997 1998 1997 1998 1997 1998 1998 1998
Crop level
100% 4.63±0.95aa 4.08±0.78a 0.84±0.30 1.06±0.37 5.85±1.33a 4.37±1.85a 5.33±2.10 1.35±0.65a
75% 3.78±0.26ab 3.00±0.58b 0.78±0.18 1.09±0.38 5.15±1.69a 3.13±1.30b 4.18±2.26 1.41±0.80a
50% 2.79±0.64bc 2.34±0.41c 0.83±0.27 1.33±0.53 3.63±1.32b 2.20±1.48bc 5.68±2.74 2.49±1.23b
25% 1.95±0.43c 1.69±0.44d 0.85±0.30 1.39±0.45 2.46±0.73c 1.36±0.62c 4.96±2.29 3.04±1.46b
Rootstock
5C 2.78±1.08 3.15±1.2a 0.46±0.05c 1.06±0.33bc 5.93±1.88a 3.44±2.08a 5.03±1.82 1.87±1.20
110 R 3.66±1.44 2.71±1.08ab 0.84±0.08b 0.97±0.31c 4.40±1.88b 3.25±1.89ab 4.12±2.65 2.54±1.20
140 Ru 3.47±1.33 2.90±0.97a 0.94±0.10ab 1.46±0.51a 3.70±1.37bc 2.44±1.54abc 6.24±2.16 1.71±1.43
1103 P 3.24±1.19 2.34±0.7 b 1.05±0.06a 1.38±0.45ab 3.07±1.06c 1.93±1.11c 4.80±2.46 2.17±1.25
aDifferent lowercase letters indicate significant differences (p < 0.05) between rows (crop level or rootstock). Nonsignificant differenceswere not reported.
Figure 3 Crop yield of Cabernet Sauvignon vines exposed to variouscropping treatments in 1998. Yield for vines on each four rootstocks(n = 4). Cropping treatments were imposed by winter pruning to 4-budspurs and cluster thinning at veraison to various crop levels.

Response of Fruit Growth and Ripening to Crop Level – 319
Am. J. Enol. Vitic. 57:3 (2006)
rootstocks and crop levels. For example, in 1998 vinesgrafted on 1103 P reached the maximum weight of 1.05 g/berry 87 days after fruit set, while vines grafted on theother rootstocks reached peak berry weight one weeklater. At this stage, 1103 P berries were significantlysmaller with respect to the other rootstocks (Figure 5A).Moreover, during the growing season, 1103 P generallyshows smaller berry size than other rootstocks; on thecontrary, 5C and 140 Ru generally show the highest value,but the differences were not always statistically signifi-cant. The effect of cropping level was generally insignifi-cant. In particular, only 51 days after fruit set, berries ofthe 100% cropping treatment were significantly smallerthan berries of 50% thinned vines. This difference was stillpresent 71 days after fruit set (Figure 5B). The greatest dif-ferences between the highest and the lowest croppinglevels were on 5C. Values were statistically different duringmost of the growing season (Figure 5C).
In 1998, sugar accumulation was more rapid in the low-est cropping treatment and slower in the highest croppingtreatment. Moreover, from veraison to harvest the sugar
content was statistically different among the highest crop-ping level and the other treatments (Figure 6A). Therewere significant differences in sugar content amongrootstocks from veraison to about 20 days before harvest,with sugar accumulation significantly lower on 5C (Figure6D). In all cropping treatments, the rate of sugar accumu-lation was initially very high (~0.7 Brix per day); it rapidlydecreased for the first 30 days after veraison and thensustained a fairly constant value of about 0.2 Brix/dayuntil harvest (Figure 6B,E). The accumulation of sugar wasdramatically different among cropping treatments (Figure6C). The differences between treatments were establishedprimarily in the first 30 days after veraison. The final yieldof sugar was ~120% greater in the 100% cropping treat-ment than in the 25% treatment. Sugar yielded from vinesgrafted on 1103 P was significantly lower than the otherrootstocks; at the end of the growing season, vines on1103 P yielded ~38% less sugar than 5C (Figure 6F).
The time required to reach a target Brix was a linearfunction of yield carried on the vines (Figure 7). The slopeof the relationship was ~1.2 days/(t ha) in 1997 and 1.1days/(t ha), and was similar regardless of the year andwhether the target was 23.5, 24.0, or 25.0 Brix. Among root-stocks, at the highest cropping levels (100 and 75%),vines on 5C needed an additional 3 to ~8 days to reach atarget value of Brix, while at the lowest cropping levels (50and 25%) 5C needed an additional ~3 days (Table 5).
In general, the 50% and 75% thinned vines had higherTA and pH and a lighter color (sometimes significantly)than vines with higher cropping factors. Particularly, therewere significant differences in TA, juice pH, and berryskin color between crop level and rootstock. Generally, TAon 5C was lower than the other rootstocks, even if thisdifference was significant only at lower crop levels. ThepH values were significantly higher in vines grafted on1103 P at crop levels 50%, 75%, and 100%. The compari-son for crop levels within rootstocks indicated that thepH of the highest cropping level was lower in allrootstocks, but the differences were significant onlywithin 5C, 110 R, and 140 Ru. The skin color was statisti-cally different only on 110 R and at the highest croppinglevels (Table 6).
Table 4 Berry size and shrinkage of dry-farmed Cabernet Sauvignon vines on four rootstocks. Data were collected when berries attained maximum fresh weight and at harvest. Shrinkage indicates loss of fresh weight between
the two sample dates. Data are average ± standard deviation, n = 16.
Berry (g) 1997 Berry (g) 1998
Shrinkage ShrinkageRootstock Maximum Harvest (% of max) Maximum Harvest (% of max)
5C 1.07 ± 0.06a 0.98 ± 0.08 8.0 1.11 ± 0.12 1.08 ± 0.10 3.0
110 R 1.08 ± 0.06 0.96 ± 0.08 11.6 1.12 ± 0.06 1.06 ± 0.07 6.0
140 Ru 1.14 ± 0.06 1.01 ± 0.05 11.6 1.11 ± 0.08 1.05 ± 0.07 5.5
1103 P 1.07 ± 0.07 0.96 ± 0.05 10.3 1.05 ± 0.07 1.02 ± 0.05 3.0
aNonsignificant differences were not reported.
Figure 4 Cluster weight at harvest of Cabernet Sauvignon vines ex-posed to various cropping treatments in 1998. Cluster weight for vineson each of four rootstocks (n = 4). Cropping treatments were imposedby winter pruning to 4-bud spurs and cluster thinning at veraison tovarious crop levels.

320 – Nuzzo and Matthews
Am. J. Enol. Vitic. 57:3 (2006)
DiscussionThis study showed that it is possible to obtain high
yields and to bring fruit to 25 Brix on dry-farmed soil inNapa Valley. Doubling the number of buds retained atpruning compared to standard practice increased yield byover 50% in each of two consecutive seasons, reaching20.92 t/ha in 1997 in two treatments. The yield differences
were closely associated with differences in clusters pervine, and there was little response of berry size to therange of crop levels imposed. The crop level treatmentsalso had no effect on vegetative growth, but significantlyaffected the rate of increase in sugar concentration (Brix)in berries after veraison. The time required to reach a Brixmaturity index was a linear function of the crop level.However, the slope of that relation, indicating days ofmaturity delay/ton of crop, was approximately 1.1 to 1.2days/(t ha). The various rootstocks used had no signifi-cant impact on these observations.
Most Napa Valley vineyards are irrigated, presumablyto avoid severe water deficits or increase yield. In our ex-perimental conditions, high yields were obtained withoutsevere water deficits or irrigation, although there was nosignificant rainfall between flowering and harvest and noirrigation water applied. There were no visible signs of se-vere water deficits, such as basal leaf abscission or accel-erated leaf senescence, even in 1103 P where a middayLWP of -1.43 MPa was measured at harvest. Although thestored soil water was probably considerably less than theevaporative demand indicated by the cumulative ETo of1000 and 720 mm for April through September of the 1997and 1998 growing seasons, respectively, closer attentionshould be paid to the use of irrigation in these soils.
The high ETo of 1997 was driven by high temperatures.For the cultivar Cabernet Sauvignon, suitable climate re-gions are reportedly where accumulated GDD is normallyfrom 1164 to 1421 (Jackson and Cherry 1988). That is con-siderably cooler than the Napa Valley in general (Winkleret al. 1974). From 1989 to 1998, the GDD accumulated atthe Oakville site used in this study was always higherthan the upper limit found in Jackson and Cherry’s re-search, and ranged from 1447 in 1998 to 1888 in 1997. Al-though indicating wine quality was a factor in the climatedesignations, Jackson and Cherry’s analysis included nodata on ripening. The grouping of varieties into climatesegments occurred before the index was developed, not asa result of analysis with the proposed index. In this study,fruit growth and development was similar despite havingthe hottest and coolest years in a decade, although har-vest dates were accordingly displaced. Thus, our resultsshow that environmental conditions—temperature and soilwater content—are not limiting to the ripening of CabernetSauvignon at Oakville.
The standard crop level, regulated by winter pruning, isabout 14 to 15 buds/m of cordon (Wolpert et al. 1996), andrepresentative yields for Cabernet Sauvignon that is tradi-tionally trained, pruned, and irrigated ranges from 9 to 12t/ha in Napa County (Chapman et al. 2004, Wolpert et al.1996, Kasimatis et al. 1985, Winkler 1969). In our experi-ment, we winter pruned to ~26 buds/m of cordon or pervine, or approximately double the standard. The meanyield of these vines (unthinned) was 4.4 kg/vine or 17.6 t/ha, while yield of vines thinned at the control level (50%)was ~10.3 t/ha (Table 3). Jackson and colleagues con-ducted pruning experiments in which the number of buds
Figure 5 Berry fresh weight at different days after fruit set of CabernetSauvignon vines exposed to various cropping treatments in 1998. (A)mean berry weight across four rootstocks (n = 4); (B) berry weightacross four cropping factors (n = 4); (C) berry weight for vines on 5Crootstock with two cropping treatments (n = 4). Cropping treatmentswere imposed by winter pruning to 4-bud spurs and cluster thinning atveraison to various crop levels. Standard crop level of vines in the areahas ~25 clusters/vine corresponding to 50% thinning treatment.

Response of Fruit Growth and Ripening to Crop Level – 321
Am. J. Enol. Vitic. 57:3 (2006)
was increased to more than double our high number (overfour times the standard practice), and reported no furtherincrease in yield, that is, yield per vine in CabernetSauvignon was stable at four to five kg/vine even withfurther increases above 26 buds/m of row (Jackson et al.1984). In a recent study where we imposed similar highbud numbers on Cabernet Sauvignon in a nearby vine-yard, yields of over 20 t/ha were obtained one year, butyields did not exceed 17 t/ha the following season. Thus,the high yields that were obtained here may approach thehighest that are sustainable without a divided canopy.There were slightly fewer clusters per vine in 1998 withrespect to the previous year, but the effect was similar
across treatments, suggesting that the decrease was notan effect of overcropping, as was observed on AlicanteBouschet (Winkler 1931).
In our experiment, the value of crop load was calcu-lated, on vine basis, by the yield to pruning weight ratio(kg/kg) and, in 1998, by the leaf area to yield ratio (m2/kg).Thinning whole clusters at the beginning of veraisoncaused a reduction in yield and in the yield/pruningweight ratio, and an increase in the leaf area/yield ratiothat was proportional to the number of clusters thinned.For example, the 50% treatment retained about 58% of theclusters of the 100% treatment and produced a yield thatwas 56% of the yield at 100%, with no change on both as
Figure 6 Sugar accumulation in fruit of Cabernet Sauvignon vines exposed to various cropping treatments (A, B, C) and rootstocks (D, E, F) duringthe 1998 season. (A, D) soluble solids determined by refractometry on aliquots from 50-berry samples; (B, E) rate of change of soluble solidsdetermined as slopes of curves in A and D, respectively; (C, F) yield of hexose sugar in t ha-1 calculated from product of data in Fig. 5B and Fig. 6A,D. Data are means of four replications. Cropping treatments were imposed by winter pruning to 4-bud spurs and cluster thinning at veraison to variouscrop levels. The standard crop level of vines in the area has ~25 clusters/vine corresponding to 50% thinning treatment.

322 – Nuzzo and Matthews
Am. J. Enol. Vitic. 57:3 (2006)
well as on leaf area per vine and weight of pruning mate-rial. The proportionally reduced yield, as first reported byWinkler (1931), indicates that most of the effects ofovercropping on source-sink relationships occur early insummer when shoot growth, fruit bud differentiation, andstage I of berry growth occur.
In this study, crop load calculated as yield per pruningweight ratio for the 50% treatment gave an average valueof 2.92 kg/kg over the two years of the trial. This value islower than the ideal of 4 to 7 (Smart and Robinson 1991),but it was in the range of the values found for CabernetSauvignon with comparable yield per hectare (Wolpert etal. 1995, 1996). Unthinned vines have shown a yield topruning weight ratio ~75% greater than the standard croplevel of Napa Valley area (50% treatments), but it was inthe range of 4 to 7 and was similar to the value found in afive-year trial for unthinned and irrigated Cabernet Sau-vignon vines (Bravdo et al. 1985). Our values of the yield/pruning weight ratio, compared with “ideal” values sug-gested by the literature, could be referred to standardcropped vines (100% and 75% treatments) and to under-cropped vines (50% and 25% treatments). The situation is
Figure 7 Harvest date (relative to veraison) for Cabernet Sauvignonvines exposed to cropping treatments that resulted in various cropyields in the two years of the trial. Cropping treatments were imposedby winter pruning to 4-bud spurs and cluster thinning at veraison. Eachpoint is the average of four single values. Data are shown for harvest atthree maturity criteria: 23.5, 24.0, 25.0 Brix. Curves represent linearregressions for each maturity criteria.
Table 5 Yield and number of days to 24.0 Brix of dry-farmed Cabernet Sauvignon vines on four rootstocks withfour crop levels. Data are average ± standard deviation n = 12.
5C 110 R 140 Ru 1103 P
Yield Days to Yield Days to Yield Days to Yield Days toCrop level (t ha-1) 24 Brix (t ha-1) 24 Brix (t ha-1) 24 Brix (t ha-1) 24 Brix
1997
100% 12.93±3.49 b,Ba 65 20.92±2.47 a,A 62 20.92±1.74 a,A 62 19.32±3.20 a,A 62
75% 15.98±6.83 A 55 15.69±1.16 B 52 15.11±6.97 B 52 13.66±2.03 B 52
50% 9.59±2.18 C 50 14.96±8.72 C 45 9.59±2.03 C 45 10.46±0.87 B 50
25% 5.96±3.49 C 46 6.97±6.68 D 42 9.89±1.16 C 42 8.43±2.06 C 44
1998
100% 18.46±5.05 a,A 72 16.85±3.50 a,A 65 16.21±3.32 a,A 65 13.48±3.28 b,A 64
75% 14.18±2.95 a,B 69 11.51±2.62 a,B 59 13.07±2.16 a,B 65 9.15±1.48 b,B 60
50% 9.67±2.67 C 61 8.60±1.28 C 58 9.61±2.77 C 57 9.00±2.46 B 57
25% 7.66±2.20 C 59 6.48±2.30 C 55 7.06±1.80 D 57 5.75±2.29 C 57
aDifferent lowercase letter indicate significant differences (p < 0.05) between columns (or rootstocks); different uppercase letters indicatesignificant differences (p < 0.05) between rows (or crop levels). Nonsignificant differences were not reported.
Table 6 Titratable acidity (TA), pH, and berry skin color of dry-farmed Cabernet Sauvignon grafted on four rootstocks withfour crop levels. Data were collected on 12 Oct 1998 when vines subjected to 1.0 and 0.5 crop levels were harvested.
Each value is an average of four single measurements.
5C 110 R 140 Ru 1103 P
Crop TA TA TA TAlevel (g L-1) pH Color (g L-1) pH Color (g L-1) pH Color (g L-1) pH Color
100% 2.56 3.48 ab,Ba 0.73 ab 2.91 3.34 b,C 1.06 a,A 2.78 3.37 b,B 0.61 b 2.76 BC 3.64 a 0.57 b
75% 2.43 3.45 ab,B 0.80 2.67 3.44 ab,BC 0.87 AB 2.82 3.39 b,B 0.69 2.67 C 3.62 a 0.70
50% 2.58 b 3.54 b,AB 0.64 2.90 ab 3.59 ab,AB 0.60 B 3.00 ab 3.62 ab,A 0.69 3.12 a,AB 3.74 a 0.53
25% 2.42 b 3.67 A 0.69 3.03 a 3.66 A 0.66 B 3.12 a 3.70 A 0.63 3.34 a,A 3.78 0.48
aDifferent lowercase letter indicate significant differences (p < 0.05) between columns (or rootstock); different uppercase letters indicatesignificant differences (p < 0.05) between rows (or crop levels). Nonsignificant differences were not reported.

Response of Fruit Growth and Ripening to Crop Level – 323
Am. J. Enol. Vitic. 57:3 (2006)
different when our values are compared with the valuesfound for Cabernet Sauvignon in a similar site (Wolpert etal. 1995, 1996). In this case, our treatments showed anundercropped situation for 25% treatments, and over-cropped vines for 75% and 100% treatments.
The usefulness of the leaf area/yield ratio as a measureof crop load has recently been reviewed, and the authorsproposed that ~0.8 to 1.2 m2/kg was required to fully ripenwinegrapes on single-canopy type trellis systems (Kliewerand Dokoozlian 2005). Those values are lower than datapresented here and suggest that even the unthinnedvines could be undercropped. However, as crop load (leafarea/yield ratio) increases, the number of days from verai-son to a target value of sugar concentration in the berrydecreases from ~65 in the unthinned vines to 50 in themost thinned ones. A delay of about 15 days in fruit matu-rity should be an indication that there was a too high fruitload per leaf area in the unthinned vines compared withthe most thinned vines. Moreover, we harvested the 75%and 100% treatments 20 to 30 days later (22 Oct 1998)than the standard harvest period of the area and almost atthe end of the growing season. At that time leaves startsenesce and drop, and accumulation of GDD reaches itspeak. Unfortunately, our experiment provided no results onother physiological parameters linked to source-sink rela-tionship (such as storage reserves and vine decline) thatcould be used to assess “cropping status” of vines.
In our conditions that varied sink size at veraison,berry size and composition were only slightly influenced.No compensation growth of the cluster was measured inany scion-rootstock combinations except for the mostthinned vines grafted on 5C. The compensation growthmeasured in 25% crop level on 5C may have been due toincomplete veraison at the time of thinning in 1998. How-ever, our cluster weight was comparable with that found inother research on Cabernet Sauvignon (Wolpert et al.1995, 1996, Kasimatis et al. 1985, Bravdo et al. 1985, Wink-ler 1969).
High yield of sugar per hectare was principally ob-tained by producing a high number of berries per hectare.At harvest there were no statistically significant differ-ences in sugar concentration among cropping factors andamong rootstocks, while yield per hectare was signifi-cantly different among cropping factors. Sugar accumula-tion is delayed by heavier crop loads. In our range ofyield values, 15 days was the average delay between thefirst and the last vines to achieve ripeness. In fact, theslope of the regression line was almost equal to one dayof delay for each ton of yield to reach the target Brix level.The slope of the regression line did not change with in-creasing the target in Brix level to 25.0 Brix.
In all treatments, the rate of increase in Brix decreasedrapidly during the first 30 days after veraison. Maximumberry size is attained during this same 30 days (Dokoo-zlian and Kliewer 1996, Poni et al. 1994). Thus, the rate ofsugar import/berry may have been constant, indicated bya 2.3 Brix increase with each 0.1 gram increase of berry
fresh weight during this period. After berry growth ceasedand Brix reached 16 to 18 degrees, the rate of sugar accu-mulation per berry decreased. This rapid phase of sugartransport is when differences in sugar accumulation be-tween cropping factors were established; the differenceswere then maintained until harvest. At the end of thegrowing season there was some shrinkage; at this stage, afurther increase of sugar accumulation occurred at a rateof ~0.55 Brix for each 0.01 gram of decrease in berry freshweight. This apparent accumulation may be the result ofwater loss and not sugar uptake.
In general, a minimum of 23.0 Brix, TA of ~5 to 7 g/L,and pH below 3.6 are required by the Napa Valley winer-ies for Cabernet Sauvignon grapes. Data from this experi-ment indicate that values occur weeks before the maximumof 25.0 Brix. Our values for TA and pH may describe fruitthat will not evoke maximum sensory impact in the wine.In a trial where different crop yield levels were obtainedfrom cluster thinning at veraison and from different budnumbers at winter pruning (Chapman et al. 2004), the au-thors found that veggie attributes decreased in intensityand fruity attributes increased in intensity as bud numberand yield increased. In contrast, there were few sensorydifferences detected in wines made from the various clus-ter-thinning treatments, although the yield range wasgreater in that experiment than in the pruning experiment.They concluded that Cabernet Sauvignon aromas and fla-vors respond to yield manipulation, but do so signifi-cantly only when yield is altered early in fruit develop-ment.
The rootstocks produced few consistent differences inthe growth and sugar accumulation parameters evaluatedin this study. As also reported elsewhere, the most vigor-ous (1103 P and 140 Ru) tended to produce clusters withless color and higher pH and TA (Lider 1957), but the dif-ferences were not always statistically significant with re-spect to the less vigorous 5C and 110 R.
Conclusions
Results showed that timing of ripening in a high-yield,dry-farmed Cabernet Sauvignon vineyard can be manipu-lated through crop level, while the rootstocks tested hadno effect on ripening. The delay in sugar accumulationseems to be a sensitive measure for crop level and doesnot appear to be influenced by rootstock or by environ-mental conditions. In both years, thinning clusters atveraison considerably reduced yield of grapes, sugar pervine, and sugar per unit of surface. The reduction in yieldwas only compensated by early ripening of the grapesand not by higher quality of the berries based upon stan-dard assays of fruit composition. Since quality was notchanged, production costs increased, and thus cluster re-moval of Cabernet Sauvignon at veraison should be care-fully evaluated in the environmental conditions of NapaValley, even in nonirrigated vineyards. We suggest thatthe thinning of clusters at or after veraison be considered

324 – Nuzzo and Matthews
Am. J. Enol. Vitic. 57:3 (2006)
only as a tool to control the time of picking, and we con-sider it to be economically profitable only when vines aresubstantially overcropped or noticeably stressed or whenenvironmental conditions do not allow a growing seasonas long as needed to ripen the grapes.
Literature Cited
Amerine, M.A., and C.S. Ough. 1988. Methods for Analysis ofMusts and Wines. Wiley & Sons, New York.
Araujo, F., L.E. Williams, D.W. Grimes, and M.A. Matthews. 1995.A comparative study of ‘Thompson Seedless’ grapevines underdrip and furrow irrigation. II. Growth, water use and nitrogen par-titioning. Sci. Hortic. 60:251-295.
Bertamini, M., F. Iacono, and A. Scienza. 1991. Manipolazione deirapporti sink-source mediante il diradamento dei grappoli e riflessisulla qualità (cv. Cabernet S.). Vignevini 7-8:41-47.
Bravdo, B., Y. Hepner, C. Loinger, S. Cohen, and H. Tabacman.1985. Effect of crop level and crop load on growth, yield, mustand wine composition and quality of Cabernet Sauvignon. Am. J.Enol. Vitic. 36:125-131.
Chapman, D.M., M.A. Matthews, and J.X. Guinard. 2004. Sensoryattributes of Cabernet Sauvignon wines made from vines with dif-ferent crop yields. Am. J. Enol. Vitic. 55:325-334.
Chaves, M.M., and M.M. Oliveira. 2004. Mechanisms underlyingplant resilience to water deficits: Prospects for water-saving ag-riculture. J. Exp. Bot. 55:2365-2384.
Dokoozlian, N.K., and W.M. Kliewer. 1996. Influence of light ongrape berry growth and composition varies during fruit develop-ment. J. Am. Soc. Hortic. Sci. 121:869-874.
Duchene, E., N. Jaegli, R. Salber, and J.P. Gaudillère. 2003. Ef-fects of ripening conditions on the following season’s growth andyield components for Pinot noir and Gewurztraminer grapevines(Vitis vinifera L.) in a controlled environment. J. Int. Sci. VigneVin 37:39-49.
Ezzahouani, A., and L.E. Williams. 1995. The influence of rootstockson leaf water potential, yield, and berry composition of Ruby seed-less grapevines. Am. J. Enol. Vitic. 46:559-563.
Freeman, B.M., T.H. Lee, and C.R. Turkington. 1979. Interactionof irrigation and pruning level on growth and yield of Shiraz vines.Am. J. Enol. Vitic. 30:218-223.
Galet, P. 1988. Cultivars and Vineyards in France. Vol. 1. The AmericanVitis Species and Their Cultivars. 2d ed. ENSA, Montpellier, France.
Jackson, D.I., and N.J. Cherry. 1988. Prediction of a district’s grape-ripening capacity using a latitude-temperature index (LTI). Am.J. Enol. Vitic. 39:19-28.
Jackson, D.I., G.F. Steans, and P.C. Hemmings. 1984. Vine responseto increased node numbers. Am. J. Enol. Vitic. 35:161-163.
Kasimatis, A.N., K.W. Bowers, and E.P. Vilas. 1985. Conversionof cane-pruned Cabernet Sauvignon vine to bilateral cordon trainingand a comparison of cane and spur pruning. Am. J. Enol. Vitic.36:240-244.
Kliewer, W.M., and N.K. Dokoozlian. 2005. Leaf area/crop weightratios of grapevines: Influence on fruit composition and wine qual-ity. Am. J. Enol. Vitic. 56:170-181.
Lambert, G., and J.H. Kashiwagi. 1978. Soil Survey of Napa County,California. Soil Conservation Service, U.S. Department of Agriculture.
Lider, L.A. 1957. A grape rootstock trial in Napa Valley: A nine-year progress report of three stocks on Bale loam soil. Am. J. Enol.Vitic. 18:121-125.
Lider, L.A., A.N. Kasimatis, and W.M. Kliewer. 1973. Effect ofpruning severity and rootstock on growth and yield of twografted, cane-pruned wine grape varieties. J. Am. Soc. Hortic. Sci.98:8-12.
Matthews, M.A., M.M. Anderson, and H.R. Schultz. 1987. Phe-nological and growth responses to early and late season waterdeficits in ‘Cabernet Franc.’ Vitis 26:147-160.
Ollat, N., J.P. Tandonnet, M. Lafontaine, and H.R. Schultz. 2003.Short and long term effects of three rootstocks on CabernetSauvignon vine behaviour and wine quality. Acta Hortic. 617:95-99.
Ough, C.S., J.A. Cook, and L.A. Lider. 1968. Rootstock-scion in-teractions concerning wine making. II. Wine compositional andsensory changes attributed to rootstock and fertilizer level differ-ences. Am. J. Enol. Vitic. 19:254-265.
Pongracz, D.P. 1983. Rootstocks for Grapevine. David Philip,Capetown.
Poni, S., A.N. Lakso, J.R. Turner, and R.E. Melious. 1994. Inter-actions of crop level and late season water stress on growth andphysiology of field-grown Concord grapevines. Am. J. Enol. Vitic.45:252-258.
Roby, G., J.F. Harbertson, D.O. Adams, and M.A. Matthews. 2004.Berry size and vine water deficits as factors in winegrape com-position: Anthocyanins and tannins. Aust. J. Grape Wine Res. 10:100-107.
Schultz, H.R., and M.A. Matthews. 1988. Vegetative growth dis-tribution during water deficits in Vitis vinifera L. Aust. J. PlantPhysiol. 15:641-656.
Smart, R., and M. Robinson. 1991. Sunlight into Wine. Winetitles,Adelaide.
van Leeuwen, C., O. Tregoat, X. Chone, M.E. Jaeck, S. Rabusseau,and J.P. Gaudillère. 2003. Le suivi du régime hydrique de la vigneet son incidence sur la maturation du raisin. Bull. OIV 76 (867-868):367-378.
Wardlaw, I.F. 1990. The control of carbon partitioning in plants.Transley Review 27. New Phytologist 116:341-381.
Williams. L.E. 1996. Grape. In Photoassimilate Distribution in Plantsand Crops. E. Zamski and A. Schaffer (Eds.), pp. 851-881. MarcelDekker, New York.
Winkler, A.J. 1931. Pruning and Thinning Experiments with Grapes.Bulletin 519. California Agricultural Experiment Station, UC Print-ing Office, Berkeley.
Winkler, A.J. 1954. Effects of overcropping. Am. J. Enol. 5:4-12.
Winkler, A.J. 1969. Effect of vine spacing in an unirrigated vine-yard on vine physiology, production and wine quality. Am. J. Enol.Vitic. 20:7-15.
Winkler, A.J., J.A. Cook, W.M. Kliewer, and L.A. Lider. 1974.General Viticulture. University of California Press, Berkeley.
Wolpert, J.A., A.N. Kasimatis, and P.S. Verdegaal. 1995. Viticulturalperformances of seven Cabernet Sauvignon clones in the north-ern San Joaquin Valley, California. Am. J. Enol. Vitic. 46:437-441.
Wolpert, J.A., J.A. Szychowski, and J.S. Semancik. 1996. Effectsof viroids on growth, yield, and maturity indices of CabernetSauvignon grapevines. Am. J. Enol. Vitic. 47:21-24.