Seasonal variation of ectosymbiotic ciliates on farmed and wild shrimps from coastal Yucatan, Mexico
Upload
khangminh22Category
view
1download
0
SUSTAINABLE DEVELOPMENT OF EXPORT-
ORIENTATED FARMED SEAFOOD IN THAILAND
A thesis submitted for the degree of Doctor of Philosophy
By
Arlene Nietes-Satapornvanit
Sustainable Aquaculture Research Group
Institute of Aquaculture, School of Natural Sciences, University of Stirling
Scotland, United Kingdom
April 2014
i
D E C L A R A T I O N
This thesis has been composed in its entirety by the candidate, except where specifically
acknowledged. The work described in this thesis has been conducted independently and
has not been submitted for any other degree.
Signature: ______________________________________________________
Date: __________________________________________________________
ii
ABSTRACT
Sustainable development of export-orientated farmed seafood in Thailand is a major
issue which can impact local stakeholders as well as global food security. The major
species taken into consideration in this research were initially the Pacific white shrimp
(Litopenaeus vannamei), Nile tilapia (Oreochromis niloticus), giant freshwater prawn
(Macrobrachium rosenbergii), and striped catfish (Pangasianodon hypophthalmus). After
which more focus was placed on Pacific white shrimp, which is Thailand’s major cultured
seafood being traded for export, and tilapia, which has potential for export but also
enjoying a good domestic market demand.
Actors or stakeholders directly and indirectly involved in aquaculture value chains may
have their own perceptions about sustainability affecting their operations, as various
factors within and outside their own systems could affect these perceptions. This could
lead to different efforts in responding to these factors to make their operations
sustainable.
Three major areas were covered in this study, namely a) describing the strengths and
weaknesses of shrimp and tilapia production in Thailand in relation to their export
potential, b) evaluating the status of compliance to global aquaculture standards of
shrimp and tilapia farming (covering technical and labour aspects), and c) determining
perceptions of sustainability across the shrimp and tilapia value chains in Thailand, with a
focus on the production sector.
iii
A mixed-methods approach was employed to obtain information in the study sites in
Thailand. Basic field interviews were conducted among 206 shrimp producers in 6
provinces in the east and south, and 199 tilapia producers in 4 provinces in the west and
east, in terms of farm operations and perceptions of factors which will affect the
sustainability of their operations, including generational aspects on future shrimp and
tilapia farming.
Key informant interviews were also conducted among other value chain actors (>30) such
as hatchery/nursery operators, input/service providers, processors/exporters and
technical/ institutional members to determine whether there are differences in their
sustainability perceptions.
In addition, face to face interviews with 18 shrimp farm male and female workers were
conducted (Thai and migrant workers), as well as with 14 key informants involved in
shrimp farm labour issues in Thailand, specifically for well-being and working conditions.
Stakeholders cited environmental (technical), economic, social and institutional (equity)
aspects of their operations as factors which will affect the sustainability of their
operations. Disease, product price and water quality were the three most important
sustainability factors among shrimp farmers, whereas water quality, disease and extreme
weather conditions were for tilapia farmers. Product price was the most cited by input
service providers, hatchery operators, shrimp and tilapia producers, and processors.
iv
Both Thai and migrant shrimp farm workers perceived a better or much better-off quality
of life working in shrimp farms in Thailand than in their previous occupations or status.
Almost all shrimp farms meet more than what are required under the Thai labour law or
the global aquaculture standards for human resources. With the importance of migrant
labour in Thailand, much still needs to be done in terms of assessing the impact of their
working in Thailand on their families left behind in their own countries, as well as on their
communities, including status of social protection to avoid exploitation.
Each stakeholder group strives to achieve sustainability so they can remain in operation in
the next few years, to survive on the business individually and corporately, and to be the
best provider of sustainably and ethically produced seafood for the world. The
compliance to aquaculture global standards and certifications may be considered to
contribute to the sustainability of operations by improving farm practices thereby
reducing detrimental impacts on farm and external environments, as well as
strengthening human relations with in the farm and in the community. However there are
some aspects of these standards which could eliminate the small players. In this study,
the large scale farms were more likely to comply with all the standards, followed by
medium scale, and lastly the small scale farms.
The differences in perceptions which exist among these stakeholders should be
understood by every sector and efforts should be made to address them so that there is
cohesiveness in giving support to achieve sustainable seafood production and trade.
v
ACKNOWLEDGEMENTS
My heartfelt gratitude to the following who have been part of my PhD journey, and without
whom this piece of work would not have been completed:
The research participants (shrimp and tilapia farmers, other value chain actors, farm workers and
key informants from various government and non-government organisations) in Thailand who
willingly provided valuable information and knowledge on their operations/ work, and shared
their ideas and perceptions, during field interviews, workshops and meetings - I hope your voice
could be heard through this manuscript;
Prof. David C. Little and Dr. Francis J. Murray for their supervision, guidance, support and
encouragement to keep thinking, discovering and learning from the ground without forgetting the
bigger picture; and for the various opportunities to learn from their expertise and experiences, to
expand and apply ideas to the real world;
The EU FP7 Sustaining Ethical Aquaculture Trade (SEAT) Project (No. 222889) for funding the
research; and for additional support from the UoStirling Student Fund and the Churches
International Student Network-UK;
The SEAT-Kasetsart University team, led by Dr. Kriengkrai Satapornvanit, and support from Asst.
Prof. Suriyan Tunkijjanukij, Dr. Prapansak Srisapoome, Dr. Pongtep Wilaipun, Dr. Kulapa
Supongpan, Dr. Tanaradee Khumya, and the research assistants, esp. Wanwichanee Sritha,
Kwanklao Srisopha, Laksiri Chomcheun, Jidapa Khatikarn, for their untiring support, guidance in
local knowledge and wisdom, and perseverance; to SEAT-UoS, esp. to Will Leschen, Lam Phan
Thanh and Wenbo Zhang, for the fruitful exchanges of ideas, and for sharing references and
computer skills including helping with formatting this manuscript;
Prof. Peter Edwards and Prof. Chang Kwei Lin, for the recommendations and wise counsel;
The Global Café team (Carol, Christine, Geoff, Hamish, Ken & Joan) for the encouragement and
the coffees; the hospitality of Dely & Raymond Elliot, Ruth & Islwyn Williams, Jacqueline Primrose
& family, Dave & Dorrit Little; IoAquaculture friends esp. Nattakarn, Winarti, Thao, Cai, Nancy,
Phuoc, Wanna, Yu-Ching, Udin, Stuart, Mamun for the friendship, & sharing of ideas, coffee, food
& laughter;
vi
Sa mga imaw ko sa Dungug Kinaray-a kag Balay Sugidanun, sa pagtugro nyo kanakun kang
kahigayunan nga makapa-utwas kang akun paminsarun kag baratyagun paagi sa pagsulat sa atun
pinalangga nga hambal;
My dearest Mom, sisters, and brother, for their love, patience & encouragement; and the
memory of my Dad, who continues to inspire, encourage and strengthen me;
My dear husband Key for the greatest support, encouragement and love, so I could continue with
this endeavour, always reminding me to be strong, and to remain focused to achieve the goal of
completing this research;
And to my Lord God, from Whom all blessings flow, for His guidance, protection, healing, and
enduring love. (Isaiah 41:10).
… ๆ ...
vii
TABLE OF CONTENTS
D E C L A R A T I O N .................................................................................................................... i ABSTRACT ............................................................................................................................... ii ACKNOWLEDGEMENTS .......................................................................................................... v TABLE OF CONTENTS ........................................................................................................... vii
LIST OF FIGURES ............................................................................................................. x LIST OF TABLES ............................................................................................................ xiii LIST OF ACRONYMS ...................................................................................................... xv
1. CHAPTER 1 Introduction ................................................................................................ 1 1.1. Rationale / Problem statement ........................................................................... 1 1.2. Labour issues ....................................................................................................... 4 1.3. Gender issues ...................................................................................................... 7 1.4. Brief information about the SEAT project............................................................ 9 1.5. Research objectives ........................................................................................... 10 1.6. Key concepts/theoretical framework ................................................................ 11 1.7. Structure of thesis ............................................................................................. 13
2. CHAPTER 2 General Methodology ............................................................................... 16 2.1. Research activities ............................................................................................. 16 2.2. Sample frame ..................................................................................................... 19 2.3. Definition of farm scale criteria ......................................................................... 21 2.4. Selection of study areas ..................................................................................... 23 2.5. Farmer sampling ................................................................................................ 25 2.6. Integrated farm surveys (IFS) ............................................................................. 27 2.7. Survey instruments ............................................................................................ 28 2.8. Data analysis ...................................................................................................... 31
3. CHAPTER 3 A systems overview of four commercially important farmed seafood species with an export focus in Thailand ............................................................................. 34
3.1. Introduction ....................................................................................................... 34 3.2. Trends/historical data ........................................................................................ 42
3.2.1. Freshwater prawn ................................................................................... 48 3.2.2. Striped catfish ......................................................................................... 53 3.2.3. Tilapia ..................................................................................................... 55 3.2.4. Penaeid shrimp ....................................................................................... 57
3.3. Importance of seed and hatchery development ............................................... 61 3.4. Emergence of feed industry .............................................................................. 68 3.5. Importance of seafood processing capacity ..................................................... 74
3.5.1. Shrimp ..................................................................................................... 80 3.5.2. Tilapia ..................................................................................................... 82 3.5.3. Pangasius ................................................................................................ 83 3.5.4. Cold storage ............................................................................................ 85
3.6. Inter-sectoral learning ....................................................................................... 86 3.7. Seafood intrinsic qualities and issues for domestic and export ........................ 90 3.8. Stakeholder analysis and roles of intermediaries .............................................. 98 3.9. Conclusions ...................................................................................................... 105
viii
4. CHAPTER 4 Shrimp and tilapia farming in Thailand: fulfilling domestic and global market needs ..................................................................................................................... 109
4.1. Introduction ..................................................................................................... 109 4.2. Research hypothesis/questions ....................................................................... 110 4.3. Scope ............................................................................................................... 112 4.4. Materials and Methods ................................................................................... 112
4.4.1. Integrated Farm Survey (2010-2011) .................................................... 112 4.4.2. Transition survey (2013) ....................................................................... 114 4.4.3. Data analysis ......................................................................................... 116
4.5. Results.............................................................................................................. 118 4.5.1. Existing aquaculture certification and standards ................................. 118 4.5.2. Study sites ............................................................................................. 122 4.5.3. Farming systems ................................................................................... 124 4.5.4. Seed source........................................................................................... 130 4.5.5. Stocking size .......................................................................................... 131 4.5.6. Containment systems ........................................................................... 132 4.5.7. Status of farm operations according to selected standards and certifications criteria ........................................................................................... 136 4.5.8. Trends and transition survey: changes occurring among farms ........... 168
4.6. Discussion ........................................................................................................ 179 4.6.1. Certification, standards and farming systems ...................................... 179 4.6.2. Legal aspects ......................................................................................... 182 4.6.3. Environmental Management: Effluents ................................................ 184 4.6.4. Environmental management: Water quality monitoring ..................... 187 4.6.5. Environmental management: Pond sludge .......................................... 188 4.6.6. Farm management: Feed management ............................................... 191 4.6.7. Energy Use ............................................................................................ 194 4.6.8. Fish welfare issues ................................................................................ 195 4.6.9. Trends and changes .............................................................................. 197
4.7. Conclusion ....................................................................................................... 198 5. CHAPTER 5 Assessment of the quality of life of shrimp farm workers in Thailand ... 201
5.1. Introduction ..................................................................................................... 201 5.2. Methodology ................................................................................................... 208
5.2.1. Survey respondents .............................................................................. 209 5.2.2. Face to face interviews ......................................................................... 213 5.2.3. Key informants ...................................................................................... 218 5.2.4. Survey instruments ............................................................................... 219 5.2.5. Analysis ................................................................................................. 220
5.3. Results.............................................................................................................. 220 5.3.1. Background of workers ......................................................................... 220 5.3.2. Quality of life of workers in shrimp farms ............................................ 221 5.3.3. Status of compliance to labour standards ............................................ 228 5.3.4. Treatment of workers , especially migrant workers in shrimp farms ... 253 5.3.5. Importance of migrant labour in shrimp farms in Thailand ................. 260 5.3.6. Gender aspects of shrimp farm labour................................................. 265
5.4. Discussion ........................................................................................................ 267 5.4.1. Quality of Life of shrimp farm workers ................................................. 267

ix
5.4.2. On compliance to global standards and certifications ......................... 270 5.4.3. On treatment of migrant workers by employers .................................. 273 5.4.4. On importance of migrant labour in shrimp farms in Thailand ............ 276 5.4.5. Gender issues ....................................................................................... 277
5.5. Conclusion ....................................................................................................... 279 6. CHAPTER 6 Shrimp and tilapia value chain actors in Thailand: their perceptions on sustainability ...................................................................................................................... 282
6.1. Introduction ..................................................................................................... 282 6.1.1. Sustainability definitions/theories ....................................................... 284 6.1.2. Global value chains ............................................................................... 285 6.1.3. Research questions ............................................................................... 287
6.2. Methodology ................................................................................................... 287 6.2.1. Activity 1. Scoping/exploratory research ............................................. 289 6.2.2. Activity 2. Integrated Farm Survey (IFS) ............................................... 291 6.2.3. Activity 3. State of the System Workshop ........................................... 292 6.2.4. Analysis ................................................................................................. 292
6.3. Results.............................................................................................................. 294 6.3.1. Generational information ..................................................................... 294 6.3.2. Stakeholders perceptions on sustainability of their operations in the next 1-2 years ...................................................................................................... 298
6.4. Discussion ........................................................................................................ 306 6.4.1. Generational information ..................................................................... 306 6.4.2. Sustainability perceptions .................................................................... 312
6.5. Conclusion ....................................................................................................... 317 7. CHAPTER 7 Overall Discussion and Conclusion ......................................................... 319
7.1. Overall Discussion ............................................................................................ 319 7.2. Reflections on sustainability perceptions of shrimp and tilapia VC actors ..... 330 7.3. Future perspectives and policy implications ................................................... 334 7.4. Critique of the methodology ........................................................................... 336 7.5. Recommendations for future study ................................................................ 338 7.6. Conclusion ....................................................................................................... 340
8. BIBLIOGRAPHY ............................................................................................................ 343 9. APPENDICES ................................................................................................................ 360
Appendix 1. Contributions to research design, data collection, data analysis and writing ......................................................................................................................... 360 Appendix 2. Checklist on Scoping and Overview of Production Systems .................. 361 Appendix 3. Details on key informant interviews for sample framing ...................... 364 Appendix 4. Questionnaire for Integrated Farm Survey ............................................ 391 Appendix 5. Questionnaire for Shrimp Transition Survey ......................................... 405 Appendix 6. Questionnaire for Face to Face Survey .................................................. 412 Appendix 7. Checklist for Key Informant Interview on Migrant Labour in Shrimp Farms .......................................................................................................................... 416
x
LIST OF FIGURES
Figure 1.1 The general research framework ................................................................ 13
Figure 2.1 Major research activities and timeline undertaken to collect field data .... 17 Figure 2.2 Provinces where the surveys were conducted ........................................... 24
Figure 3.1 Production of freshwater species from culture systems ............................ 39 Figure 3.2 Volume of exports of freshwater aquaculture species, 2009 to 2013 ........ 41 Figure 3.3 Production and export of tilapia, 2002 to 2013 .......................................... 42 Figure 3.4 Annual production of important aquaculture species ............................... 47 Figure 3.5 Production and growth rate of freshwater prawn in Thailand
(1989-2009) ........................................................................................................... 51 Figure 3.6 Production and export data of giant freshwater prawn from 2002
to 2013 .................................................................................................................. 52 Figure 3.7 Production of striped catfish in Thailand and Vietnam .............................. 54 Figure 3.8 Tilapia production and volume of exports for Nile and red tilapia ............. 57 Figure 3.9 Black tiger and white shrimp production in Thailand, 1987 to 2013 .......... 58 Figure 3.10 Food safety incidence reports on Thai shrimp exports to Europe ............ 59 Figure 3.11 Location of feed mills and production areas by species ........................... 70 Figure 3.12 Data map showing the number of seafood processing plants .................. 75 Figure 3.13 Establishment of processing plants and GDP % growth in Thailand ......... 76 Figure 3.14 Quantity and value of shrimp exported, 2008 to 2013 ............................. 81 Figure 3.15 Proportion of shrimp production for domestic and export markets,
2008 to 2013 ......................................................................................................... 82 Figure 3.16 Roles of independent cold storage companies ......................................... 85 Figure 3.17 Freshwater prawn exported to several countries and value .................... 94 Figure 4.1 Reasons for not responding to shrimp phone transition survey .............. 115 Figure 4.2 Location, scale and number of shrimp farms surveyed, 2010-2011 ......... 122 Figure 4.3 Location, scale and number of tilapia farms surveyed, 2010-2011 .......... 123 Figure 4.4 Tilapia farming systems according to farm scale ...................................... 126 Figure 4.5 Source of shrimp seed by farm scale ......................................................... 130 Figure 4.6 Source of tilapia seed by farm scale .......................................................... 131 Figure 4.7 The number of shrimp ponds according to farm scales ............................ 133 Figure 4.8 Number of ponds and cages in tilapia farms surveyed ............................. 134 Figure 4.9 Uses of ponds and cages in shrimp and tilapia farms by farm scale ......... 135 Figure 4.10 Status of surveyed farms regarding registration with DoF according
to species and farm scale .................................................................................... 137 Figure 4.11 Ways to treat the effluents from shrimp farms ...................................... 139 Figure 4.12 Status of effluent treatment among tilapia pond farms ......................... 140 Figure 4.13 Methods and routes of discharge of effluents from shrimp and
tilapia ponds by farm scale ................................................................................. 142 Figure 4.14 Water quality monitoring in shrimp and tilapia farms by farm scale ..... 144 Figure 4.15 Fate of sediments from shrimp and tilapia pond farms .......................... 145 Figure 4.16 Frequency of sediment removal in shrimp and tilapia pond farms
according to farm scale ....................................................................................... 146
xi
Figure 4.17 Detailed frequency of removing sediments for more than one culture cycle ........................................................................................................ 147
Figure 4.18 Types of feeds used in shrimp and tilapia culture by farm scales........... 148 Figure 4.19 Shrimp feed manufacturer preference .................................................. 149 Figure 4.20 Tilapia feed manufacturer preference .................................................... 150 Figure 4.21 Record keeping by species and farm scales ............................................ 153 Figure 4.22 Sources of energy in shrimp and tilapia farms by farm scale ................. 154 Figure 4.23 Uses of energy in shrimp and tilapia farms according to farm scales .... 155 Figure 4.24 Precautions taken by farms against predation and poaching by
farm scale ............................................................................................................ 156 Figure 4.25 Shrimp farms checking PLs by PCR method ........................................... 158 Figure 4.26 Services available to shrimp and tilapia farmers for diagnosing
disease problems ................................................................................................ 160 Figure 4.27 Pond lining in shrimp farms used for grow-out production
according to farm scales ..................................................................................... 161 Figure 4.28 A large scale shrimp farm with biosecurity features ............................... 162 Figure 4.29 Fate of stock lost during culture period .................................................. 163 Figure 4.30 Livelihood activities of tilapia farmers .................................................... 164 Figure 4.31 Livelihood activities of shrimp farmers ................................................... 165 Figure 4.32 Changes in shrimp farms during 2005 to 2010 ....................................... 168 Figure 4.33 Changes in shrimp farms in various categories during 2005 to 2010 ..... 170 Figure 4.34 Changes in tilapia farms 2005 to 2010 .................................................... 171 Figure 4.35 Changes in tilapia cage and pond farms during 2005 to 2010 ................ 172 Figure 4.36 General status of shrimp farms two years after IFS ............................... 173 Figure 4.37 General status of tilapia farms two years after integrated farm
survey .................................................................................................................. 174 Figure 4.38 Changes that occurred in shrimp farms by farm scales ......................... 177 Figure 4.39 Changes in the marketing aspects of shrimp farming ............................. 178
Figure 5.1 The shrimp value chain in Thailand ........................................................... 202 Figure 5.2 Country of origin and gender of shrimp farm workers surveyed.............. 221 Figure 5.3 Previous occupation of shrimp farm workers .......................................... 222 Figure 5.4 Country and gender distribution of workers’ occupation prior to
shrimp farm work ................................................................................................ 223 Figure 5.5 The ages of workers in shrimp farms interviewed for the survey. ........... 233 Figure 5.6 Basic steps for registering migrant workers ............................................. 240 Figure 5.7 Recruitment pathways for migrant workers ............................................ 247 Figure 5.8 Main areas of communication and interaction by farm scales ................ 259 Figure 5.9 Main areas of communication and interaction by origin ......................... 260
Figure 6.1 The main elements in sustainable seafood production and trade ........... 285 Figure 6.2 Responses of farmers according to their educational level on
the future involvement of their children ............................................................ 296 Figure 6.3 Previous occupations of survey respondents ............................................ 298 Figure 6.4 Sustainability factors ranked no. 1 by shrimp producers .......................... 299 Figure 6.5 Sustainability factors ranked no. 1 by tilapia producers ........................... 300
xii
Figure 6.6 Sustainability factors cited most frequently by other stakeholder groups .................................................................................................................. 303
xiii
LIST OF TABLES
Table 2. 1 Shrimp production/farm scales ................................................................... 20 Table 2. 2 Tilapia pond production/farm scales ........................................................... 21 Table 2.3 Topics covered in the IFS questionnaires .................................................... 29
Table 3.1 A summary of milestones in the aquaculture industry in Thailand relevant to the four target species ....................................................................... 43
Table 3. 2 Number of aquatic feed mills and their original activities .......................... 71 Table 3. 3 Constraints faced by processing plants in exporting their products ........... 78 Table 3. 4 Classification of forms of exports by species ............................................... 79 Table 3. 5 The number of plants processing various species for export ...................... 80 Table 3. 6 Number of cold storage facilities and scope of activities ............................ 86 Table 3. 7 Definition of shrimp farming systems ......................................................... 95 Table 3. 8 Strengths and weaknesses of Thailand tilapia for export ........................... 98 Table 3. 9 Stakeholder analysis matrix (aquaculture global value chain in Thailand) . 99
Table 4. 1 Study sites with corresponding number of farms by scale ....................... 113 Table 4. 2 Transition survey sample design ................................................................ 115 Table 4.3 General information on the global aquaculture standards used
in this study ......................................................................................................... 118 Table 4. 4 Summary of standards for shrimp and tilapia farms based on global
certifiers for aquaculture that have relevance to this study. ............................. 120 Table 4. 5 Aquaculture standards by DoF, Thailand ................................................... 121 Table 4. 6 Certified status of shrimp farms surveyed ................................................ 122 Table 4. 7 Production characteristics of shrimp farms by farm scale ........................ 124 Table 4. 8 Production characteristics of tilapia pond and cage farms surveyed ....... 128 Table 4. 9 Production characteristics of tilapia pond polyculture with ≥ 3 species ... 129 Table 4. 10 Whether there was agreement or not regarding discharge of
effluent with neighbours ..................................................................................... 143 Table 4. 11 Number of precautionary measures used by farms to avoid predation and
poaching .............................................................................................................. 157 Table 4. 12 Summary of outcomes in relation to compliance criteria of certification
standards ............................................................................................................. 167 Table 4. 13 Reasons for stopping tilapia farming temporarily ................................... 175
Table 5.1 Responses in relation to labour changes in the shrimp farms ................... 211 Table 5.2 Information on farm owners and managers interviewed ......................... 214 Table 5.3 Information on shrimp farm workers who were interviewed ................... 215 Table 5.4 Key informants interviewed for worker issues, at their place of work ..... 219 Table 5.5 Perceptions of shrimp farm workers on their quality of life ..................... 224 Table 5.6 Reasons for workers’ perceptions of a better quality of life ..................... 225 Table 5. 7 Salaries and bonuses of shrimp farm workers according to farm scale .... 229 Table 5. 8 Benefits provided to shrimp farm workers ............................................... 231 Table 5. 9 Types of migrant workers hired in shrimp farms...................................... 239 Table 5. 10 Costs in the recruitment and registration of migrant workers............... 241 Table 5. 11 Opinions on keeping the original documents by employers .................. 242

xiv
Table 5. 12 Types of contract agreements with workers .......................................... 245 Table 5. 13 Various ways to recruit shrimp farm workers ........................................ 246 Table 5. 14 Status of compliance to labour standards in shrimp farms .................... 252 Table 5. 15 Shrimp farm employers’ opinions on working with different
nationalities ......................................................................................................... 255 Table 5. 16 Future plans of migrant workers after working in shrimp farms in
Thailand ............................................................................................................... 263
Table 6. 1 Number of value chain actors interviewed/visited/met during
the scoping research .......................................................................................... 290 Table 6. 2 Important sustainability factors according to ranking by shrimp
farmers ................................................................................................................ 299 Table 6. 3 Important sustainability factors according to ranking by tilapia
farmers ................................................................................................................ 301 Table 6. 4 Sustainability factors most cited by respondents from different
stakeholder groups ............................................................................................. 305
Table 7.1 Summary of sustainability issues for shrimp and tilapia ............................ 331

xv
LIST OF ACRONYMS
ACFS Agricultural Commodity and Food Standards
AEC ASEAN Economic Community
AHPND Acute Hepatopancreatic Necrosis Disease AIT Asian Institute of Technology
ASC Aquaculture Stewardship Council
ASEAN Association of Southeast Asian Nations
BAAC Bank of Agriculture and Agricultural Cooperatives
BAP Best Aquaculture Practices
CoC Code of Conduct CP(F) Charoen Pokphand (Foods)
CSR Corporate Social Responsibility
DO Dissolved Oxygen
DoE Department of Employment
DoF Department of Fisheries DLPW Department of Labour Protection and Welfare
EEZ Exclusive Economic Zone
EM Effective Microorganism
EMS Early Mortality Syndrome
EU European Union FAO Food and Agricultural Organisation of the United Nations
FCR Feed Conversion Ratio
FMD Fisheries Movement Document
FW Freshwater
GAA Global Aquaculture Alliance GAP Good Aquaculture Practices
GVC Global Value Chain
HS Harmonized System (Harmonized Commodity Description and Coding System) for traded products
IFS Integrated Farm Survey ILO International Labour Organisation
IPEC International Programme on the Elimination of Child Labour
KI Key informant
LPG Liquefied Petroleum Gas
MOL Ministry of Labour MOU Memorandum of Understanding
NACA Network of Aquaculture Centers in Asia and the Pacific
NET Northeast Thailand
OECD Organisation for Economic Co-operation and Development
PCR Polymerase Chain Reaction
PE Polyethylene PFO Provincial Fisheries Office
PLs Postlarvae
ppt Parts per thousand
QOL Quality of Life
RASFF Rapid Alerts System for Food and Feed SEAT Sustaining Ethical Aquaculture Trade
SPF Specific Pathogen Free
SPR Specific Pathogen Resistant
SSP Sustainable Shrimp Programme
TAO Tambon (sub-district) Administrative Organisation TFFA Thai Frozen Foods Association
WSSV White spot syndrome virus
YHV Yellow head virus
1
1. CHAPTER 1 Introduction
1.1. Rationale / Problem statement
Aquaculture is becoming more important in supplying the world’s demand for seafood
(FAO, 2012) and Thailand has become a major player in seafood production, processing
and international trade. Strategies for aquaculture production and trade have been
created through government and private sector efforts to ensure sustainable production
and trade for food security. On the other hand, markets and consumers have set
standards and certifications to ensure good quality seafood grown in a sustainable
manner, with the aim to guide producers and make consumers confident in their choices
(Bostock et al., 2010). Bush et al. (2013) have argued though that aquaculture
certification is just one of the many approaches to achieve sustainable production and
that it could lead to a divide between larger scale and smaller scale farms in terms of
ability to comply. Similar concerns have been voiced previously for example by Belton et
al. (2011) regarding Pangasius aquaculture in Bangladesh and Vietnam. In fact, third-party
certification could be more of a power and politically-driven process (Konefal and
Hatanaka, 2011) which could affect compliance because not all farms are homogeneous.
This brings us to the issue of sustainability, and how it is defined. Bell & Morse (2008) had
pointed out that even though sustainability is a popular concept there is no specific
definition of the word. They further added that since people do not live in similar
conditions vis-à-vis environmental, social, and economic, it would not be right to just have
one definition of sustainability. The word could mean differently to various people,
depending on their own value systems (Bremer et al., 2013). On the other hand, a general
overview of the term was provided by Robertson (2014), saying that “sustainability refers
2
to systems and processes that are able to operate and persist on their own over long
periods of time.” Thus it is necessary that the perceptions of sustainability of various
stakeholders is known and understood among themselves and between producers and
consumers, and the intermediaries of the value chains that connect them.
Sustainable development of export-orientated farmed seafood in Thailand is an issue that
covers various aspects. It is not just the environmental or technical aspects or impacts of
the aquaculture farms that should be factored in, but also the economic and social
aspects, and the impacts and interactions, including the costs and benefits of all these
aspects (L. Lebel et al., 2009; Lebel et al., 2002; Whitmarsh and Palmieri, 2009). As an
example, Lebel et al. (2002) suggested that Thailand’s highly intensive (black tiger) shrimp
production systems as well as “complex organizational structure” could not really be
considered sustainable, and called for changes in modes of production, distribution,
processing and governance (Lebel et al., 2002). Furthermore, it has to be noted that the
concept of needs for, and limitations of, resources are core aspects for defining
sustainability (WCED, 1987). There is a question of whose responsibility it is to achieve
sustainable development in aquaculture. Actors directly and indirectly involved in
aquaculture value-chains may lack a broader understanding of sustainability beyond their
own concerns or business interests. Individual stakeholders do not necessarily share the
same perspectives, even those coming from the same value chain node. There could be
many factors within and outside their own systems which could affect their perceptions
leading to different efforts in responding to these factors to make their operations
sustainable. Therefore an improved or shared understanding of sustainability would
enhance and/or accelerate a drive to more sustainable practices.

3
In order to focus efforts to achieve sustainable seafood production and trade to benefit
both producers and consumers in Thailand and abroad, it is important to determine who
the key stakeholders are, what they think about the sustainability of their operations,
how different or similar are these perceptions are with each other, and what they are
doing to improve sustainability. Looking at sustainability with its many facets requires a
transdisciplinary approach, wherein various disciplines merge together to come up with a
workable solution for the society, with a combination of qualitative and quantitative
methods (Brandt et al., 2013).
This study was more focused on farms, therefore it was necessary to classify farms in
order to differentiate them. The main classification, aside from primary species cultured,
was farm scale. During key informant interviews to determine the number of farms
according to farm scales in the area, the respondents based their classification of ‘farm-
scale’ by simply responding according to the size or area of farm. Farm scale is usually
based on size or area of the farm while other factors that indicate scale of farm
operations are not considered, such as labour, farm ownership and management (Murray
et al., 2011). Thus for the purpose of this research, the SEAT project developed its own
criteria for farm scaling to cover these factors. The details on farm scales used in this
research are explained in Chapter 2.
Due to the growing importance of and interest in certification and standards especially in
global trade (Steering Committee of the State-of-Knowledge Assessment of Standards and
Certification, 2012; Washington and Ababouch, 2011), the level of compliance of farms
4
could affect their participation in trade. Compliance to standards may be affected by the
scale of operation of the farms, in that larger scale farms may be more likely to comply
than smaller scale farms. The direct impact of compliance to standards is improvement in
the production practices of the certified entity, which could also impact positively its
external environment including other stakeholders (Steering Committee of the State-of-
Knowledge Assessment of Standards and Certification, 2012). In the case of coffee,
compliance to standards resulted in an “overall income impact” as well as “spill-over
effects on adjacent communities”, although at the same time there were also weaknesses
such as hidden costs and hindrances to trade (Giovannucci and Ponte, 2005).
1.2. Labour issues
Aquaculture production and trade in Thailand is providing employment, and thus
contributing to food security both domestically and globally. With sustainability being
linked with human dignity and the quality of life (van Egmond & de Vries, 2011), it is also
a main issue to focus on the lives involved in aquaculture operations. Recently there has
been a lot of attention to labour issues in shrimp aquaculture, and the quality of life or
well-being of those employed in the sector. A number of case studies and reports have
been presented regarding the situation outside the fish/shrimp farming sector i.e.
upstream with the capture fisheries and downstream with the pre-processing and
processing sectors, with the labour abuses and exploitation, child labour, and human
trafficking issues, especially with migrant workers from neighbouring countries of
Cambodia, Lao PDR and Myanmar (Derks, 2013, 2010; EJF, 2013a, 2013b; ILO, 2013a;
ILRF/WWU, 2013; Sakaew and Tangpratchakoon, 2009; US Department of State, 2013;
Vartiala et al., 2013). In most of the cases mentioned above, writers referred to the
5
“shrimp farming industry” as a whole. However, there is not much information being
reported on the labour situation at the farm level except recently by Resurreccion & Sajor
(2010 and 2011) which was specific on gender aspects. Even ILO in Thailand had
mentioned that the risk of labour abuse at the farm level may be lower than that in the
factories and processing plants (Toumo Poutiainen, personal communication, 2013), and
acknowledged that this conclusion was based more on anecdotal evidence rather than
data. A report on child labour i.e. children involved in economic activities, in selected
areas in Thailand related to aquaculture was published recently by ILO/IPEC project and
confirmed the existence of child labour in those specific areas, in fisheries and
aquaculture (ILO, 2013a).
A total of 11.71 M workers as of early 2014 were reported in Agriculture, Forestry and
Fishery sectors (MOL, 2014). In addition, the Ministry of Labour reported that there were
1,211,104 legal migrant workers, and 23,391 illegal migrant workers. The migrant to
employed workers ratio was 2.93% in 2013 (MOL, 2014). This records the documented
workers and does not specify how many are working in the aquaculture sector, more so in
farms. Kruijssen et al. (2013) estimated less than 1% of the total workforce (Thai and
migrants) are involved in the fishing, farming and processing sectors, and does not
include the workforce in fish markets.
It has been estimated that there are about 1 million people involved in the shrimp
industry sector (Songsangjinda and Smithrithee, 2008; Tanticharoen et al., 2008),
however, there are no specific numbers of people employed in aquaculture farms. In the
Department of Employment, the number of registered migrant workers in aquaculture is

6
recorded under the agriculture and livestock category. There is a separate category for
fisheries sector but this refers to work on capture fishing vessels. Thus there are no
reliable figures to estimate the total number of workers in the shrimp and fish farming
sector.
Species-specific global standards and certification for aquaculture farms also include the
community and human resources aspects, focussing on working conditions of the workers
such as worker safety, employee relations, corporate social responsibility and responsible
social practices (ASC, 2014, 2012; GAA-BAP, 2013; GlobalGAP, 2012, 2011). It does not
take into consideration other aspects which are not directly related to the work, such as
informal work contribution by a family member or employment of couples, which are
important considerations for workers living on-farm. Issues regarding the quality of life of
workers and families, and relationships, therefore gender issues, and their living and
working conditions in the farms need to be considered. The OECD’s Better Life Initiative
(OECD, 2013) may be useful if it is applicable to sectoral or value chain node evaluation of
well-being. Another useful approach is that of Costanza et al. (2007) and Petrosillo et al.
(2013) which suggested to incorporate aspects of opportunities, human needs and one’s
perceptions of well-being.
The issue on the importance of migrant labour in the shrimp sector leads us to the
question of why there is such a degree of dependence and the issue of the relative
absence of Thai workers (ARCM/IAS/CU, 2013; Human Rights Watch, 2010; ILO, 2013a;
Resurreccion and Sajor, 2010). Whereas in the past, there was local migration mainly
from northeastern provinces to work in shrimp farms in the east and south, the situation

7
appears to have changed considerably (Resurreccion and Sajor, 2011). Local migration
was common among northeastern Thais in search of better incomes to survive the
poverty in their region (Ekachai, 1990) and this was the reason to drive them to work in
many available occupations in other regions in Thailand. Rigg & Nattapoolwat (2001)
reported the loss of labour from rice farming to more lucrative jobs in orchards and
factories.
1.3. Gender issues
Value chain actors are in constant interaction with each other, to transact business, for
business networking, and for family and social activities. In analysing these interactions, a
gender perspective is necessary in order to guide the framework of evaluation of the
impacts of international trade on gender relations among value chain actors in selected
countries in Asia. Gender refers to the social differences between men and women, boys
and girls, which are determined by society and may be learned and changed, and could
vary between and within cultures (FAO, 2001; GGCA, 2009). As noted by Laven et al.
(2009), most tools and interventions lean toward non-gender sensitiveness in working
with value chains and rural livelihoods, thus they have attempted to create a trajectory
on gender in value chains by combining gender and women empowerment with value
chain/pro-poor development.
The export of seafood from producing countries has increased considerably over the last
two decades, for selected species such as shrimp in Thailand. Despite the high value
earnings from foreign trade, there remains a vibrant domestic market demand for other
species namely tilapia and freshwater giant prawn. The intensity of labour use along the

8
value chains varies between countries and among species, and although both men and
women may be present in each value chain node, there are roles which have been
specific to each gender based on their ability, culture and skills, and benefits could be
different between genders (UNRISD, 2012). Moreover, UNRISD also reported about
disparities in benefits between men and women along the value chains, not only in
aquaculture but in general employment. The same trend could be seen in non-timber
forest products in Africa wherein women face many obstacles to participate in economic
activities (Shackleton et al., 2011). In addition, Laven and Verhart (2011) also pointed out
that women worked in parts of the value chain which have lower values, thereby getting
lower benefits compared to men.
In Thailand shrimp processing plants for example, women are usually involved in work
needing skills and detail such as filleting and deveining, while men were delegated to
heavy lifting tasks, driving and machinery work. In Bangladesh, >40% of fry catchers were
women and girls and > 60% of workers in the processing plants were women (USAID,
2006). In Vietnam and Nigeria, women are more visible in growout/farming, processing
and marketing, rather than in hatcheries (Veliu et al., 2009).
The gender aspect is a cross-cutting theme in this research, as this study deals with not
only the physical aspects of aquaculture but also assesses the human aspects through
their roles and interactions as stakeholders, value chain actors and workers.
Understanding gender is also important in well-being studies (OECD, 2013). The
promotion and implementation of gender equality in aquaculture are critical for any
contribution of the sector to the Millennium Development Goals (MDGs) (Arenas and
9
Lentisco, 2011). Although implementing a comprehensive gender analysis is problematic
in most research contexts, integrating gender aspects into a broader social and economic
analysis can contribute to an understanding of how male and female actors’ needs could
be addressed and met, for e.g. finances, decision making, information, and actual tasks
(Lebel et al., 2009). In this way, each actor will not lose opportunities for advancement
and their access to resources to develop themselves and improve their quality of life
(Pryck, 2013).
1.4. Brief information about the SEAT project
The Sustaining Ethical Aquaculture Trade (SEAT) Project was implemented under the
Framework Program 7 of the European Commission, under a research consortium of 13
institutional partners from Europe and Asia. The SEAT project was conceptualised during
the period of rising global consumption of seafood and associated trade volumes due to
an increasing population, increased wealth and changes in the eating habits of
consumers. With more than half of the seafood traded internationally, from developing
to developed countries, there has been a growing concern by markets and consumers
regarding how the processes along the global value chains for seafood meet standards for
sustainable food production and trading. The SEAT Project looked at the four key species
groups namely the river catfish (Pangasiidae), freshwater river prawns, marine shrimp,
and tilapias in Asian countries namely Bangladesh, China, Thailand and Vietnam. The
development and intensification of farming systems of these species have raised serious
concerns regarding the sustainability of the practices involved and the overall trade. The
project aimed to establish an evidence-based framework to support current and future
stakeholder dialogues organised by third party certifiers, which could contribute towards
10
harmonized standards, helping consumers to make fully informed choices with regards to
the sustainability and safety of their seafood. The project ran from 2009 to 2013, taking a
highly interdisciplinary approach to address sustainability questions. Topics addressed
included environmental impacts, impacts of trade on local livelihoods and public health,
food safety including contaminants and traceability concerns, barriers to trade, and
ethics. Life cycle analysis was used to explore energy and material costs embedded in the
global value-chains, while food ethicists examined the value-laden nature of sustainability
decisions i.e. who decides which qualities are significant in relation to sustainability. This
thesis is concerned with the Thailand aspect of the project. The information in this section
on SEAT Project was summarised from project documents (SEAT, 2009).
1.5. Research objectives
The main objective of the study was to assess the sustainability issues faced by various
value chain actors, specifically shrimp and tilapia producers, based on their own
perceptions.
Specifically, the study aimed to:
1. Describe the historical development of aquaculture and the status of the four
commercially important seafood species (marine shrimp, tilapia, freshwater
prawn, striped catfish) in Thailand and assessing the factors contributing to their
importance in international and domestic markets (Chapter 3)
2. Analyse shrimp and tilapia farming systems according to the farm-level criteria of
global standards and certification to determine status of compliance between
farming enterprises of various farm scales (Chapter 4)
11
3. Assess the quality of life of shrimp farm workers according to their perceptions
and investigate the status of compliance to global standards for human resources
in aquaculture (Chapter 5)
4. Show the differences in perceptions on sustainability of various value chain actors,
and specifically, among producers according to farm scale and other relevant
variables (Chapter 6)
1.6. Key concepts/theoretical framework
The transdisciplinary nature of sustainability studies ensures that they are both complex
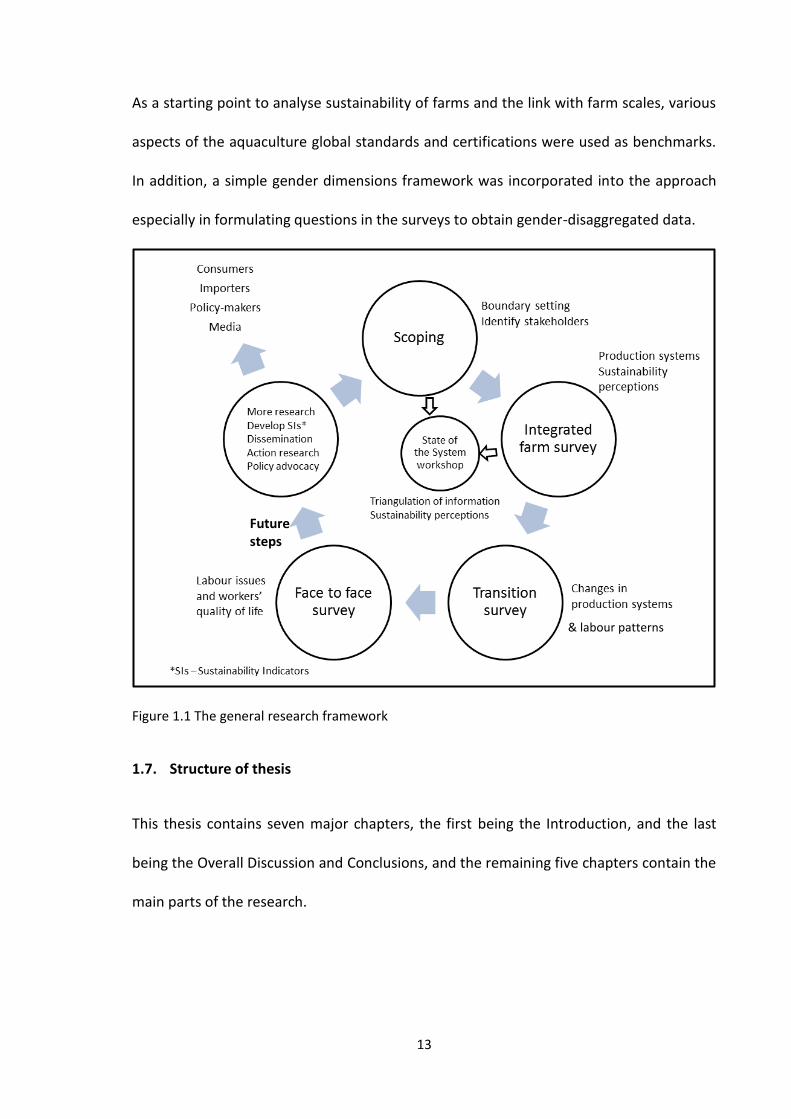
and varied in terms of approach. Figure 1.1 shows the general framework followed by this
research, namely:
Scoping and exploratory approach to obtain an overview of the historical
development and existing systems related to the four major species in this
research, i.e. marine shrimp, tilapia, freshwater prawn and striped catfish in
relation to the various stakeholders involved. This led to focus species that are
important to and have potential for export and trade, namely marine shrimp and
tilapia, respectively. This also led to identify system boundaries and stakeholders
who would participate in the more detailed research;
Integrated farm survey approach was conducted to obtain more detailed
information on production systems (farm level) of the focus species, i.e. marine
shrimp and tilapia, covering technical, economic, social and ethical issues. Also
includes determining producers’ perceptions on sustainability of their operations
to contribute to the development process for sustainability indicators for the
overall SEAT Project. In addition, several aspects of farm operations were
12
compared with the global certification standards to determine compliance
according to farm scales;
State of the system workshop approach to present preliminary findings for
triangulation with a group of integrated farmer survey respondents and
representatives from other relevant stakeholders (input service providers,
hatchery operators, processors, institutions, local government and academe),
including to obtain their perceptions on sustainability, which will also contribute
to the development process for sustainability indicators for the overall SEAT
Project;
Transition survey approach to determine changes in the farm operations of a
sample of respondents from the integrated farm surveys, and also to determine
samples for labour face to face survey;
Face to face surveys related to detailed issues on shrimp farm labour and
workers’ welfare, with particular interest on migrant labour in shrimp farms; and
to measure the existing farm conditions with the labour standards as well as
workers’ own perceptions of their quality of life;
Future steps stemming from this research: more information gathering on data
gaps, development of the sustainability indicators, dissemination of relevant
information, action research and policy advocacy, among others.
A multi-stage livelihoods approach was employed, keeping in mind the three main facets
of sustainability, i.e. environmental, economic and social or institutional. In the
sustainability and quality of life aspects of this research, information relied mainly on the
perceptions of various stakeholders.
13
As a starting point to analyse sustainability of farms and the link with farm scales, various
aspects of the aquaculture global standards and certifications were used as benchmarks.
In addition, a simple gender dimensions framework was incorporated into the approach
especially in formulating questions in the surveys to obtain gender-disaggregated data.
Figure 1.1 The general research framework
1.7. Structure of thesis
This thesis contains seven major chapters, the first being the Introduction, and the last
being the Overall Discussion and Conclusions, and the remaining five chapters contain the
main parts of the research.
Future steps
& labour patterns

14
Chapter 2 describes the general methodology followed in this research, especially
regarding the sample frame and design to determine study sites and survey respondents.
Subsets of these survey respondents were selected to provide information and
interaction in the other chapters.
Chapter 3 provides a systems overview of the four commercially important farmed
seafood species (marine shrimp, tilapia, freshwater prawn and striped catfish) in Thailand,
assessing the factors that contribute to their emergence as internationally traded
products or their restriction to domestic markets. This chapter provides the rationale for
focussing on shrimp and tilapia in this research.
Chapter 4 provides a detailed analysis of shrimp and tilapia production practices in
Thailand as well as the changes and trends. The chapter focusses on how the production
sector operates in order to fulfil both local and global demand for Thai seafood, including
the changes the sector has to face to achieve this. Current practices are presented using
the technical and legal aspects of international standards and certifications as a
framework. Changes and trends in the sector are assessed to understand likely threats to
sustainability of farming and the sector as a whole.
Chapter 5 focusses on the human resources and gender aspects of shrimp farming in
Thailand. The analysis focusses on how shrimp farms comply with the human resource
aspect of the global aquaculture standards and certifications, to determine whether these
standards are suitable in assessing the quality of life of shrimp farm workers, and to
compare them with the workers’ own perceptions of their quality of life.
15
Chapter 6 is about the sustainability perceptions of shrimp and tilapia stakeholders,
particularly the producers, analysing how different their perceptions are according to
farm scales and other variables, and how these producers are managing or changing their
operations to make the most of the situation. Having said that, there could be differences
in sustainability perceptions by the various stakeholders, or even by different types of
farmers, this may also mean that the definition of sustainability may be different from
one person to another, depending on the context and situation.

16
2. CHAPTER 2 General Methodology
This research involved connecting and interacting with actors/stakeholders across the
value chains of shrimp and tilapia production, processing and trade. The majority of the
data obtained were from the production node, i.e. the producers or farmers. Various
sources of information were used to build the general sample frame, on which selection
of survey respondents were based for subsequent field work. The general sample frame
of the whole study was based on census data obtained from local fisheries offices,
subdistrict administration offices, village chiefs, shrimp club offices and informal data
from key informants within individual communities, and additional secondary literature
from national government statistics, associations and company information.
This research was part of a bigger collaborative project called Sustaining Ethical
Aquaculture Trade (SEAT) funded by the European Commission under its FP7 Programme.
I have been actively involved in the design, planning and implementation of the various
phases of the research mentioned below which concerned the data collected for this
doctoral dissertation.
2.1. Research activities
This study involved four major research activities in connecting and interacting with
stakeholders from 2010 to 2013, which provide the data and information for the various
chapters of this thesis (Figure 2.1). This chapter presents the main sample frame, study
site selection and farmer selection which formed the basis for all the other subsequent
research activities involving the same sets of respondents. The various chapters in this
thesis will detail relevant methods to obtain data for that specific chapter.
17
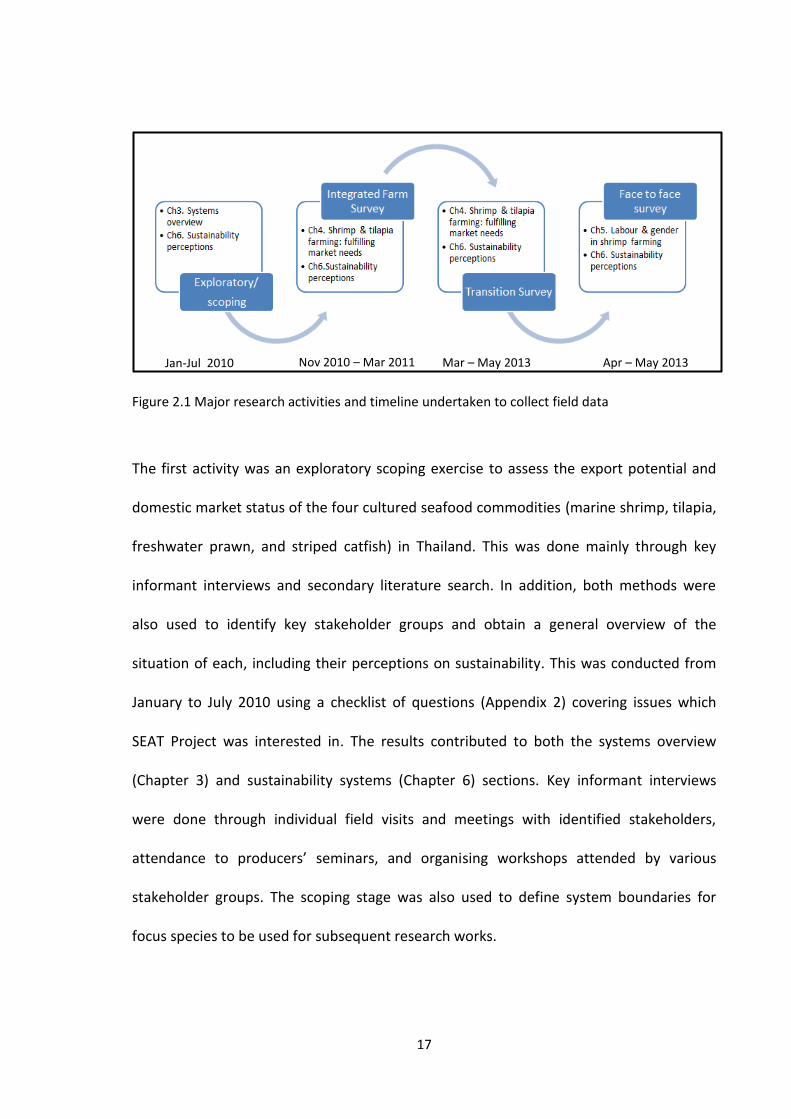
Figure 2.1 Major research activities and timeline undertaken to collect field data
The first activity was an exploratory scoping exercise to assess the export potential and
domestic market status of the four cultured seafood commodities (marine shrimp, tilapia,
freshwater prawn, and striped catfish) in Thailand. This was done mainly through key
informant interviews and secondary literature search. In addition, both methods were
also used to identify key stakeholder groups and obtain a general overview of the
situation of each, including their perceptions on sustainability. This was conducted from
January to July 2010 using a checklist of questions (Appendix 2) covering issues which
SEAT Project was interested in. The results contributed to both the systems overview
(Chapter 3) and sustainability systems (Chapter 6) sections. Key informant interviews
were done through individual field visits and meetings with identified stakeholders,
attendance to producers’ seminars, and organising workshops attended by various
stakeholder groups. The scoping stage was also used to define system boundaries for
focus species to be used for subsequent research works.
Jan-Jul 2010 Nov 2010 – Mar 2011 Mar – May 2013 Apr – May 2013
18
The second activity was an integrated farm survey (IFS) focusing on producers of shrimp
and tilapia from major production areas in Thailand, with more detailed questions on
operations and practices, sustainability, generational factors, including socio-economic
information related not only to their aquaculture operations but also to their household
circumstances (Appendix 4). This provided information to all the work packages of the
SEAT project. The survey itself was conducted from November 2010 to March 2011, with
the sample design and selection of sites guided by the results of the scoping stage to set
system boundaries. A multi-stage sampling process was followed, starting from larger
(province) then progressing to smaller (district, sub-district, village) administrative units
(Murray et al., 2011). Furthermore, various datasets on farm locations, farmer names,
farm scales and farming systems, from key informant interviews and secondary literature
research during the scoping period were used to derive the location for study sites and
farms (see Section 2.2 for detailed description). Preparation for the survey started in July
2010 until November 2010. The methodology on selection of sites and respondents is
explained in this chapter (Chapter 2). More detailed descriptions relevant to the chapters
utilising data from the integrated survey are described in specific chapters i.e. current
practices and trends in Chapter 4, respondents’ background in Chapter 5, and
sustainability perceptions in Chapter 6.
A state of the system workshop was conducted as a continuation of the IFS, expanding to
include a sample of other value chain actors. The information from this activity also
contributed to the sustainability perception in Chapter 6. Details of the SOS workshop are
reported in Satapornvanit et al. (2011).

19
The third activity was a transition survey (Appendix 5) conducted by phone in March 2013
for shrimp farmers, and in April to May 2013 for tilapia farmers, i.e. 2-3 years after the
baseline integrated farm survey was conducted. The purpose was to assess key changes
that had occurred in farming operations and in the general situation of the farm business
operations and personal status of the integrated survey respondents. A detailed
methodology is presented in Chapters 4 and 5.
The fourth activity was a face to face survey of shrimp farmers, workers and key
informants on labour patterns from April to May 2013 based on the results of the
transition phone survey among shrimp farmers (third activity) (Appendix 6, Appendix 7).
A detailed methodology is explained in Chapter 5.
2.2. Sample frame
Definitions of farm scales were developed together with the other members of the SEAT
project team and formed part of a regional four country exercise. My involvement was to
provide inputs and information based on local conditions that were relevant to country-
specific criteria. The information came from previous scoping research and general
industry information. The definitions of the criteria used are explained below.
Shrimp farm samples were based on production scales, i.e. small, medium and large
(Table 2.1).

20
For tilapia, sampling was based on containment system (cages in river, ponds) at the first
instance, and under each system, tilapia ponds were divided into production scales, i.e.
small, medium and large (Table 2.2). The production scale for tilapia in cages was difficult
to determine as the scoping study indicated that a single farming household, or individual
within it, can manage the whole operation by themselves over a very large range of
production containment systems (from 1 to 100 units). The farmer interviewed during
scoping phase who had the most number of cages (100 units @ 9 m2 x 1.5 m/unit) was
producing around 600 T/year, hiring labour only for harvesting the fish. Whereas the
farmer with only one cage (25 m2 x 2.5 m) was producing 3.8 T/year. During this research
all farms with cages were not subjected to scaling. The criterion for large farms i.e.
registered company with vertical integration was still applied, and there was only one
tilapia farm (ponds) in the study area which fit this criterion, and none for cages.
Farm scaling for cages needs a different set of criteria which was not covered in this
research, maybe based on production intensity/levels per unit area.
Table 2. 1 Shrimp production/farm scales
Criteria Small Medium Large
No. of ponds Up to 2 3 and above N.A.
Business ownership Household/extended
family
Household/extended
family/external owner
Company/corporate
Farm management Household/extended
family
Household/extended
family/external owner
/hired manager
Hired manager
Labour relations Up to 2 hired full-time
labour
3 and above hired full-
time labour
Hired employees/
full-time labour
Source: Murray et al. (2011)
21
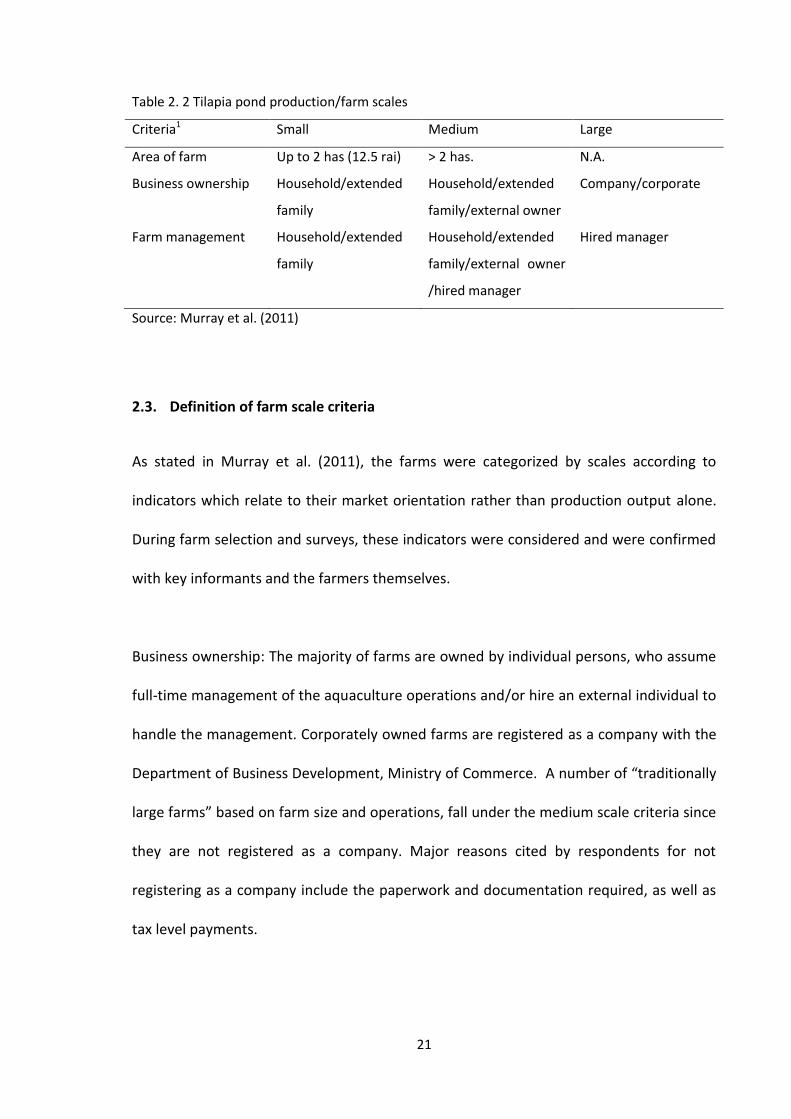
Table 2. 2 Tilapia pond production/farm scales
Criteria1 Small Medium Large
Area of farm Up to 2 has (12.5 rai) > 2 has. N.A.
Business ownership Household/extended
family
Household/extended
family/external owner
Company/corporate
Farm management Household/extended
family
Household/extended
family/external owner
/hired manager
Hired manager
Source: Murray et al. (2011)
2.3. Definition of farm scale criteria
As stated in Murray et al. (2011), the farms were categorized by scales according to
indicators which relate to their market orientation rather than production output alone.
During farm selection and surveys, these indicators were considered and were confirmed
with key informants and the farmers themselves.
Business ownership: The majority of farms are owned by individual persons, who assume
full-time management of the aquaculture operations and/or hire an external individual to
handle the management. Corporately owned farms are registered as a company with the
Department of Business Development, Ministry of Commerce. A number of “traditionally
large farms” based on farm size and operations, fall under the medium scale criteria since
they are not registered as a company. Major reasons cited by respondents for not
registering as a company include the paperwork and documentation required, as well as
tax level payments.
22
Farm management: Depending on scale, farms are managed by the owner herself/himself
or household member, i.e. partnership with the married couple owners or with the adult
children, or by external person hired as a manager.
Full-time waged labour: Even those considered small farms may also hire full-time labour,
especially if the owner is considered an absentee owner, or have other livelihood
activities or business interests. Workers are usually assigned responsibility for one pond,
workers employed as a couple typically manage two ponds. Nowadays, due to
mechanisation i.e. paddlewheel aerators and autofeeders, a worker may be able to
handle two ponds on his own, especially if experienced.
In tilapia farms, labour requirements are lower. For cage farms, a single person can
handle up to 100 cages (usually 9 m2 in area) and would just hire part-time workers to
help in harvesting.
Registered trading name: In Thailand, any aquaculture farm can register with the
Department of Fisheries. Registration is prerequisite for the traceability system involving
the Fisheries Movement Document (FMD) which is needed for exporting product. Other
types of aquaculture farms are also registered for the Thai Good Aquaculture Practices
(ThaiGAP) certification, as well as for annual fisheries statistics and disaster or welfare
benefits. Thus when disaster such as flooding occurs, farms registered with DoF can seek
government financial support. In addition, farms may register with the Department of
Business Development to be recognised as a corporate entity.
23
Vertical and horizontal integration: Vertical integration occurs when the different
stages/processes (i.e. from production to delivery) in the value chain is
coordinated/controlled/owned by one lead company or entity, which results in increased
efficiency and market power for that company. This could also be achieved through
agreements and written contracts with various actors/owners of processes, or being
involved in several activities in the value chain (GTZ, 2007; Laven et al., 2009). Larger
farms tend to have more integration of the production chain in order to minimise cost
and improve quality of production. This improves traceability of processes and inputs into
the production. Whereas horizontal integration in the farming sense occurs when one is
involved in the management issues including decision making in the chain (Laven et al.,
2009).
2.4. Selection of study areas
There were two major steps in the selection process for the study areas, namely the
selection of provinces and then the sub-districts (tambon). This process utilized secondary
data from the Department of Fisheries (DoF) and the Provincial Fisheries Offices (PFO).
The provinces were selected based on the number and area of registered farms including
accessibility from the Bangkok research base and the availability of support from local
Government offices, farmer groups and individual key informants.
Information from the DOF national fisheries statistics showing major areas of production
was also used as reference. Due to limitations in resources, time and accessibility, only
tilapia production areas in the central region were considered. Based on the DoF
statistics, the most productive provinces were Nakhon Pathom, Chachoengsao and
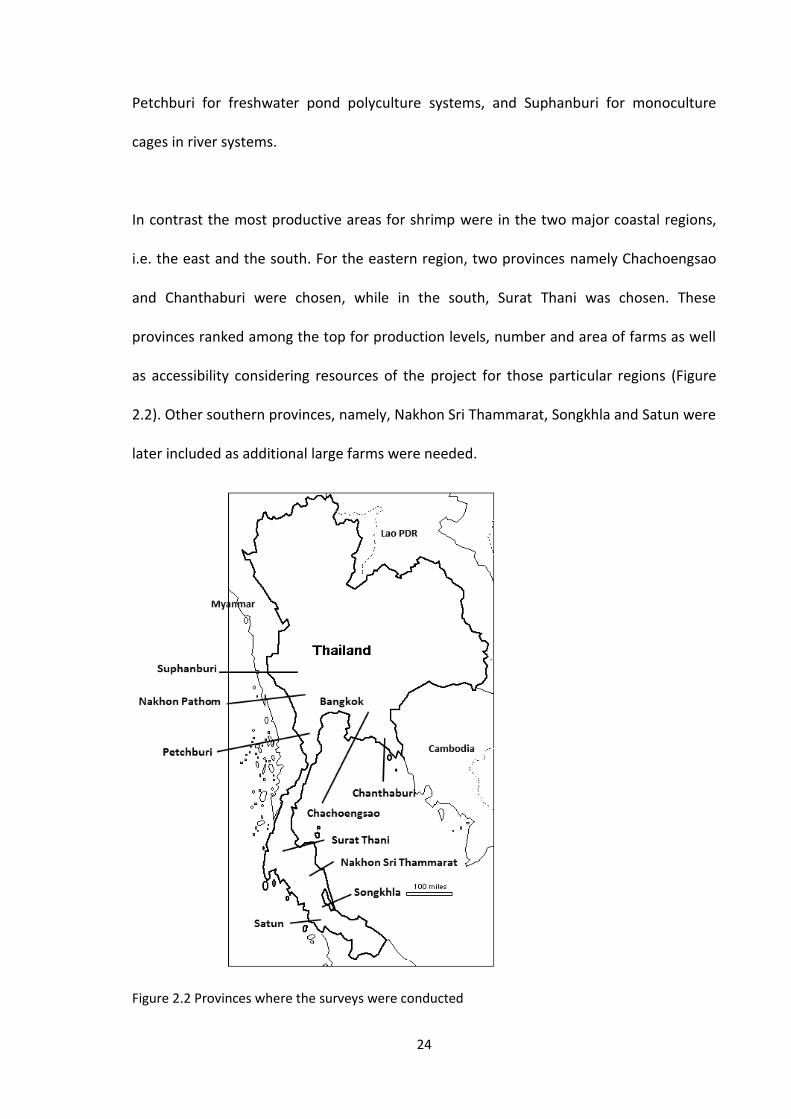
24
Petchburi for freshwater pond polyculture systems, and Suphanburi for monoculture
cages in river systems.
In contrast the most productive areas for shrimp were in the two major coastal regions,
i.e. the east and the south. For the eastern region, two provinces namely Chachoengsao
and Chanthaburi were chosen, while in the south, Surat Thani was chosen. These
provinces ranked among the top for production levels, number and area of farms as well
as accessibility considering resources of the project for those particular regions (Figure
2.2). Other southern provinces, namely, Nakhon Sri Thammarat, Songkhla and Satun were
later included as additional large farms were needed.
Figure 2.2 Provinces where the surveys were conducted

25
After selecting the provinces, the number of farms in the sub-districts (based on
information obtained from local Department of Fisheries) was sorted from highest to
lowest, and only those with more than 50 farms were subjected to a randomisation
process (Gentle, 2003) using the equation in MS Excel: = RAND( ) * (MAX(cell1:celln)-1) + 1,
where, cell1 is the first value in the column and celln is the last value in the same column
(Murray et al., 2011). The values are the cumulative number of farms in each sub-district
(after ranking from highest to lowest).
2.5. Farmer sampling
Obtaining a complete list of producer households/farm owners was not possible as this
information was subject to the Official Information Act, B.E. 2540 (1997) of Thailand (Thai
Royal Gazette, 1997), whereby any personal information requested required a written
request and written permission of all farm owners/operators whose information was
accessed.
An initial list was obtained from published farmers’ lists from DoF websites, local fisheries
offices and key informants from the areas sampled randomly (see Section 2.4). An initial
categorisation was based on these lists, after which farms were categorised according to
scale to ensure adequate numbers of small and medium farms, based on the available
information. However information especially on labour, was not enough to completely
categorise them using the classification given above (Tables 2.1 and 2.2).
The second categorisation was based on key informant interviews (KIIs) in the field. Key
informant interviews were conducted to obtain a more detailed overview of the situation

26
of shrimp and tilapia farms in specific areas (Appendix 3). The initial categorised farmer
lists were validated by going to at least three key informants (sub-district administrative
organization (TAO) offices, the local farmer club and the village heads) in each selected
sub-district. Missing farmers’ names were identified and added to the list, while farmer
names from the secondary data were removed if they were no longer farming shrimp or
tilapia. However, if the farm itself still existed but had a different business owner, it was
still included in the list. Contact information of each identified farm was also obtained
from the KIs. In cases where the contact information could not be given by the KIs due to
confidentiality, the KIs were requested to contact the farms if ever they were randomly
selected. In most cases the KIs could not provide information on hired labour status of the
farms (which was one of the criteria to determine farm scales).
From the KIIs, new lists were drawn up and clusters were identified based on sub-districts
to ensure enough numbers of farms for selection. A randomised sample of households
was then applied with the scale independent variable strata to achieve the sample design
numbers. Randomisation using the Excel RAND formula was run on enterprise data after
farms were categorised into their production/farm scales. The randomisation programme
from MS Excel (= RAND( ) * (C1 - B1) + B1, where B1 is 1, and C1 is the highest number of
farms) was run to determine the farmers to be interviewed (Murray et al., 2011).
Initially, 200 shrimp and 200 tilapia farmers were sampled. However, due to reasons such
as availability and willingness to participate, the final number of respondents for shrimp
was 206 and for tilapia, 199.

27
2.6. Integrated farm surveys (IFS)
Farmers who were randomly selected from the above processes were contacted by either
field staff or KIs, depending on the availability of information and on the situation in each
site. In most cases, it was the key informant or KI (such as the village headman, subdistrict
head or his technical staff, or the local shrimp club head or his representative) who
assisted in contacting the respondents. The KI would arrange for the respondents to come
to a central place for the interviews to be conducted. Typically a local venue where
farmers already met informally was chosen for such interviews. After the interviews, the
farms were visited, and after permission was sought and given, GPS coordinates and
photographs were taken to characterise location and key characteristics. A few interviews
especially those organised directly by field research staff, were conducted in the farms
depending on the respondents’ preferences.
There were cases when some of the farms, especially large farms, requested an official
letter from the Faculty of Fisheries, Kasetsart University. This has become standard
protocol in Thailand and the SEAT project management assisted in preparing and
procuring these letters to be sent to the farms/companies in the time period required by
the respondents.
Whereas the main target to interview were the farmers or farm owners, there were
instances when only the farm managers of shrimp farms were available to be
interviewed, especially in the case of some medium-scale farms and in all cases for the
large (corporate) farms.
28
The interviews were conducted by a team of Thai field research assistants who were
recruited and trained for several weeks prior to the scheduled interviews to familiarise
themselves with the questions, aquaculture terminology, and coding of responses, as well
as to have a basic understanding of shrimp and tilapia farming. Not all of the enumerators
had fisheries or aquaculture backgrounds but they all had field survey experience with
other non-aquaculture projects. Training sessions were conducted for either the whole
day, or half-day (morning or afternoon) depending on other work load of the staff. Prior
to the training, meetings related to questionnaire development were conducted, wherein
the enumerator team was also present to observe and/or participate in the discussions
(see Section 2.7). The final version of the translated (from English to Thai) questionnaires
was used for the training, which was conducted in the Thai language. In addition, the
accompanying notes developed by the SEAT project team (Murray et al., 2011) were also
used as reference to explain the questions and choices of responses. The Thai training
facilitator would clarify aquaculture specific topics or terms with me during and outside
the training sessions. The team would go through each question and the meaning was
explained, including the choices for responses, if any. In addition, the way to ask and
record the responses was also explained and practiced. The team also did role plays as
interviewers and respondents, and practiced recording responses into the questionnaires.
2.7. Survey instruments
A set of questions was developed by the SEAT project interdisciplinary team to gain a
holistic view of farm operations and farmer perceptions on various topics related to their
operations (Murray et al., 2011). Table 2.3 shows the various topics covered in the
questionnaires (Appendix 4).
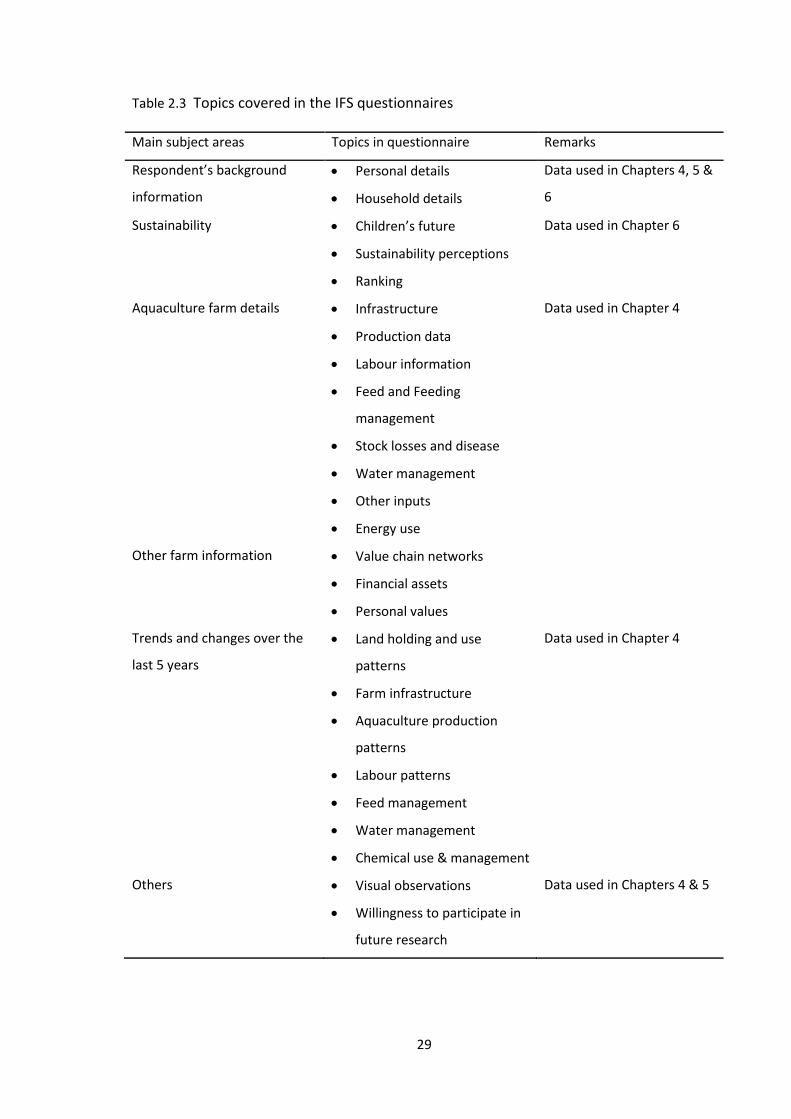
29
Table 2.3 Topics covered in the IFS questionnaires
Main subject areas Topics in questionnaire Remarks
Respondent’s background
information
Personal details
Household details
Data used in Chapters 4, 5 &
6
Sustainability Children’s future
Sustainability perceptions
Ranking
Data used in Chapter 6
Aquaculture farm details Infrastructure
Production data
Labour information
Feed and Feeding
management
Stock losses and disease
Water management
Other inputs
Energy use
Data used in Chapter 4
Other farm information Value chain networks
Financial assets
Personal values
Trends and changes over the
last 5 years
Land holding and use
patterns
Farm infrastructure
Aquaculture production
patterns
Labour patterns
Feed management
Water management
Chemical use & management
Data used in Chapter 4
Others Visual observations
Willingness to participate in
future research
Data used in Chapters 4 & 5
30
The questionnaire was designed to be as gender-sensitive as possible in order to obtain
gender disaggregated data although it was not possible to ensure a sample frame with
equal numbers of male and female respondents, as the sample frame was based on farms
and not by gender. Being gender-sensitive in this case meant that when asking questions
related to people, questions should lead to responses which would provide information
on men, women, boys and girls, so we could obtain gender disaggregated data. For
example, background data about the respondents, their children, members of household
and their responsibilities in relation to farm operations, labour force, and their tasks.
However a comprehensive gender analysis of farming was outside the scope of the
research.
At the end of the survey, the farmers were asked if they were willing to participate in
future research activities, especially for subsequent surveys. Farmers’ responses to this
question were considered when selecting respondents for future surveys and meetings.
Pilot testing of questionnaires was conducted among shrimp and tilapia farmers a few
weeks prior to actual surveys to further refine the sequence as well as the framing of the
questions. After the pilot testing, it was attempted to reduce the questions but
compromise had to be made to balance representations of the different aspects of the
SEAT project. The resulting questionnaire was still lengthy, taking around 1.5 to 2 hours to
complete. The original version of the questionnaire was in English and it was translated
into Thai, and then translated back into English to ensure that the meaning was captured
in the translation. Detailed accompanying survey notes were also developed to give
31
guidance to the whole survey activity including subsequent data entry (Murray et al.,
2011).
2.8. Data analysis
Data collected from the integrated farm survey were entered in an ACCESS database
(Murray et al., 2011). The database was designed to allow entry of data from the four
project countries to enable comparative analysis later at the project level. Prior to data
entry into ACCESS, every enumerator had to review the responses at the end of each day
of the survey, and complete other data which were already known, but were not noted
before the interview, for example details such as village, sub-district, province, and GPS
coordinates. The data noted on the questionnaire were also checked or cleaned. For
example, notes written illegibly, and in Thai, were re-written next to them in a clearer
handwriting, and translated into English when necessary. As the team returned to the
project base, the questionnaires were collected and were assigned survey codes to
identify each respondent.
A team of researchers entered data into the MS ACCESS database, using an assembly line
approach. Thus one questionnaire would pass through 3 to 4 persons to enter data on
specific sections of the database. Main data entry took about 3 months to complete. Then
database checking and cleaning went on for a few more weeks initially. Months later,
more cleaning and checking had to be done as the database was circulated to other
research project partners, and questions and issues which needed clarification were
raised to understand the data.
32
Descriptive statistics were used to determine trends, and statistical analysis of non-
parametric data was used to analyse significant differences and correlations among
variables when necessary. Statistical analyses to determine significant differences of
relevant data were conducted using SPSS ver. 19-21, MS Excel 2010 and Minitab, when
necessary. Independent variables used were primary species cultured i.e. shrimp or
tilapia, farm scale, gender of respondents and children, geographical location of farms
and stakeholder groups. Whereas the dependent variables considered in this study were
the various aspects of farm operations such as farm, feed, water and environmental
management, infrastructure and production data, labour data, respondents’ preference
for their children’s future occupation, sustainability factors, and importance of
sustainability factors according to ranking.
As part of the analysis of farm data collected, they were benchmarked against the
standards of the most common aquaculture certification schemes, to assess the level of
compliance of farms according to farm scales. The analysis is expounded in more detail in
Chapter 4. However, it is understood that certification is not a requirement for
sustainability, as there are many other aspects of sustainability such as economic
efficiency and social equity which are not covered by certification standards. Measures
such as life cycle costing and sustainable livelihoods index are not fully integrated in the
standards. The certification schemes used in this research focus mainly on environmental
aspects and some social aspects such as community interactions and labour relations. In
addition, the standards also do not cover other environmental dimensions such as those
measured through life cycle assessments, and carbon and water foot printing. Thus,
compliance to standards may not be equated to the sustainability status of a system or
33
operation, but could contribute to assessing the areas in the farm which need to be
improved for better farm management.

34
3. CHAPTER 3 A systems overview of four commercially important farmed seafood
species with an export focus in Thailand
3.1. Introduction
Since the recent expansion in aquaculture globally beginning in the early 1980s, Thailand
has quickly established and maintained a high profile on the strength of both domestic
demand and developing export market.
Thailand has become a major player in terms of seafood production and processing in the
global seafood trade, making her one of the main suppliers of aquatic foods in various
forms. Innovation in the agricultural sector is well known and has been demonstrated in
fruit, rice and orchid farming as well as aquaculture (Falvey, 2000; Kongkeo and Davy,
2010). Furthermore, long experience particularly in freshwater and extensive marine
shrimp farming, gave a firm basis for rapid development in the last three decades,
reaching a 2.6% share of global production by 2008 (FAO, 2008).
Thailand has been practicing aquaculture since the introduction of carp farming by
Chinese immigrants in the early 1900s (Edwards et al., 1983). Resilience and adaptability
of Thai producers and entrepreneurs, together with institutional support and
collaboration, have played a major role in bringing Thailand to its current status even as
producers and entrepreneurs strive for sustainability (Kongkeo & Davy 2010).
Several factors have been critical to Thailand’s strategy to achieve a balanced and
sustainable aquaculture to meet domestic and global demands for its aquaculture food
35
products (Yamprayoon and Sukhumparnich, 2010). Furthermore, specific strategies for
aquaculture production and trade, initially with shrimp and tilapia, and expanding to
other species, have been created in line with these considerations. This shows that the
Thai Government has developed an open and holistic view, to adapt and to work in
coordination with other sectors as aquaculture grows rapidly in Thailand. This reflects on
Thailand’s historic openness to trade, geographical location, and contact with other
cultures to expand its reach through building trust and delivery of quality products
(Belton and Little, 2008; Falvey, 2000; Kagawa and Bailey, 2006; Rigg, 2012).
Aquaculture in Thailand is much diversified, with production systems in both freshwater
and brackishwater/coastal areas, farming both domestic and exotic species. One example
is the farming of Pacific white leg shrimp, a non-native marine species, which is also
farmed in inland freshwater areas (Briggs et al., 2005; Kongkeo and Davy, 2010). Another
is tilapia, an exotic freshwater species, but also commonly raised in brackishwater ponds
(Pongthana et al., 2010; Stickney, 1986).
The role of agribusiness in Thai aquaculture development story has been central, going
even beyond Thailand through trade and investment expansion (Goss et al., 2000; Lebel
et al., 2010, 2002; Tanticharoen, 2000). As one company considers to make themselves
and Thailand as “the kitchen of the world”, another grooms themselves to be “the chef of
the world” (CPF, 2012; Thai Union Group, 2014, 2012). This shows the progressive outlook
of Thai producers/entrepreneurs, who always look out for opportunities within and
beyond their own backyards, innovating and aligning themselves with market trends to
36
be able to meet requirements and supply demand (Kongkeo and Davy, 2010; Lebel et al.,
2002).
As Thailand continues to play a major role in the global arena of seafood trade, the
stakeholders have become more aware of what are required, and are attempting to
streamline corporate activities and efforts, to reduce costs as well as to ensure quality of
inputs which go into the production system. For example, companies which have major
stakes in processing and export have tended to vertically integrate their operations to
maximise resources, have more control in the quality of inputs and production, and
ensure good traceability, aiming to achieve sustainability (CPF, 2012; Mariojouls et al.,
2004; Thai Union Group, 2014).
Thailand’s early adoption of farming has not always resulted in any continued dominance
as demonstrated by the shrimp industry. Thailand pioneered the culture of tilapia,
freshwater prawn and striped catfish in the region and, while production levels have
typically been maintained or increased to meet domestic growth, they have long been
eclipsed by production in neighbouring countries i.e. tilapia in China, striped catfish in
Bangladesh and Vietnam, and freshwater prawn in Bangladesh (Ahmed et al., 2010;
Edwards and Hossain, 2010; Phan, 2014; Zhang, 2014).
In focusing on these four aquaculture species in aquaculture, namely penaeid shrimp
(Litopenaeus vannamei), Nile tilapia (Oreochromis niloticus), freshwater prawn
(Macrobrachium rosenbergii) and striped catfish (Pangasianodon and Pangasius spp.),
several research questions were identified:

37
What are the differences among the four species in terms of their development
along the supply chains, their successes in domestic and export markets, and
potential for export?
Why do these differences exist and were these differences considered
opportunities or constraints?
Who are the stakeholders in the Thai seafood industry and what are their roles in
establishing and sustaining the industry?
The use of the terms shrimp, tilapia, prawn and striped catfish is defined as follows:
Shrimp – may refer to black tiger shrimp (Penaeus monodon) and/or white shrimp
(Litopenaeus vannamei), depending on the specified time frame. Historically, shrimp
production before 2000 was mainly P. monodon, while after 2000 production declined
rapidly and substituted with mainly L. vannamei (Briggs et al., 2005; Kongkeo and Davy,
2010). Where possible, reference to either species will be specified. At the same time,
shrimp production refers to production coming from both coastal and inland (as low
salinity areas) unless otherwise specified.
Tilapia – is a collective term referring to both Oreochromis niloticus and its hybrid, ruby or
red or tabtim tilapia, unless otherwise specified. FAO and DOF records do not specify the
sources whether from freshwater or brackishwater areas, although there are separate
records from ponds, ditches and paddy fields, and cages.

38
Prawn – refers to the giant freshwater river prawn, Macrobrachium rosenbergii. However
in other literature elsewhere, it is common to use the term prawn to refer also to shrimp.
Striped catfish – refers to the local species of Pangasianodon hypophthalmus formerly
known as Pangasius sutchii in older literature. DOF data provides production information
from ponds, ditches and paddy fields, and cages. FAO reports only production data of
striped catfish but no export data. However FAO reports on catfish export data from
Thailand (FAO, 2014).
In Thailand, shrimp is by far the most important aquaculture species in relation to trade
and foreign earnings, according to volume produced and exported, and the revenues
gained. In 2005, shrimp production and value were higher by more than 50% than the
combined production of tilapia, freshwater prawn and striped catfish, respectively. By
2008, shrimp production was nearly double that of the other three species combined
(FAO, 2014). Export volumes followed the same trend.
Among the top freshwater species, records of the Thai DOF and FAO have shown that
since the 1980s, freshwater fish production has gradually become dominated by Nile
tilapia (DOF, 2013a; FAO, 2014). Production of native freshwater species such as walking
catfish (Clarias spp.), Thai silver barb (Barbonymus gonionotus), snakeskin gourami
(Trichopodus or Trichogaster pectoralis), striped catfish (Pangasius spp.), snakehead
(Channa striata), giant gourami (Osphronemus goramy) and common carp (Cyprinus
carpio) were much lower despite their popularity among Thai consumers (Figure 3.1). This
could imply the comparative suitability for cost effective culture of tilapia compared to
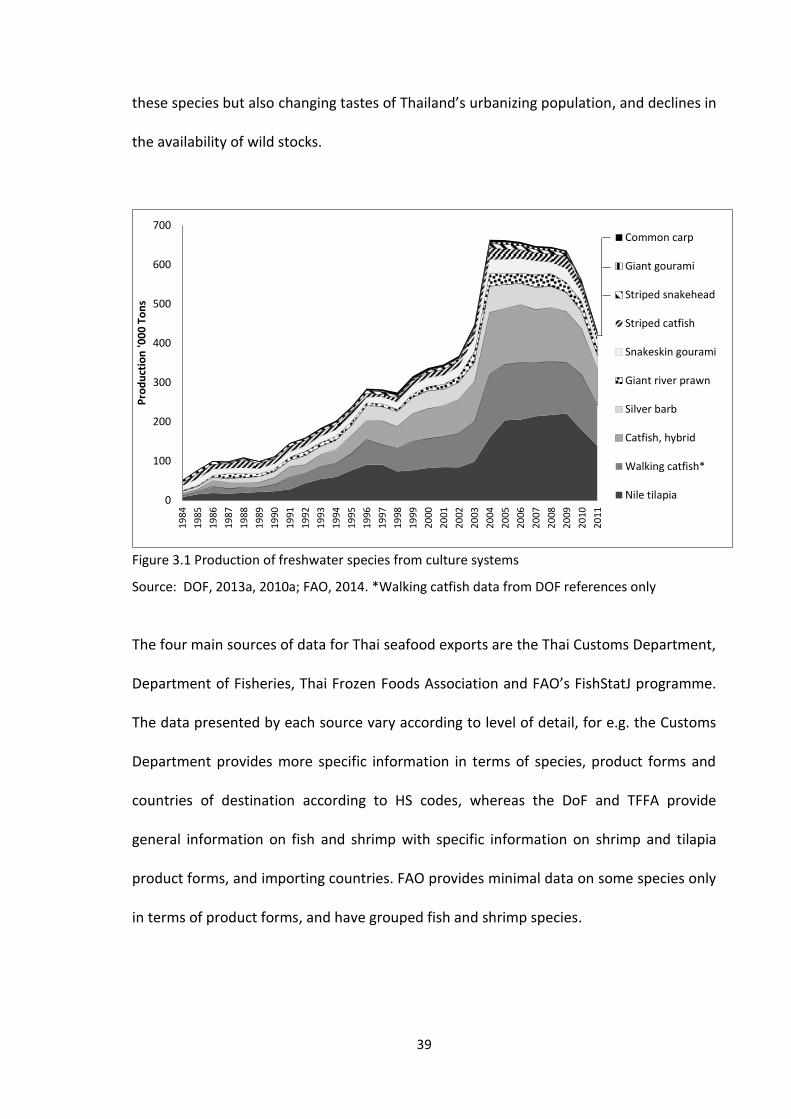
39
these species but also changing tastes of Thailand’s urbanizing population, and declines in
the availability of wild stocks.
Figure 3.1 Production of freshwater species from culture systems
Source: DOF, 2013a, 2010a; FAO, 2014. *Walking catfish data from DOF references only
The four main sources of data for Thai seafood exports are the Thai Customs Department,
Department of Fisheries, Thai Frozen Foods Association and FAO’s FishStatJ programme.
The data presented by each source vary according to level of detail, for e.g. the Customs
Department provides more specific information in terms of species, product forms and
countries of destination according to HS codes, whereas the DoF and TFFA provide
general information on fish and shrimp with specific information on shrimp and tilapia
product forms, and importing countries. FAO provides minimal data on some species only
in terms of product forms, and have grouped fish and shrimp species.
0
100
200
300
400
500
600
700
19
84
19
85
19
86
19
87
19
88
19
89
19
90
19
91
19
92
19
93
19
94
19
95
19
96
19
97
19
98
19
99
20
00
20
01
20
02
20
03
20
04
20
05
20
06
20
07
20
08
20
09
20
10
20
11
Pro
du
ctio
n '0
00
To
ns
Common carp
Giant gourami
Striped snakehead
Striped catfish
Snakeskin gourami
Giant river prawn
Silver barb
Catfish, hybrid
Walking catfish*
Nile tilapia
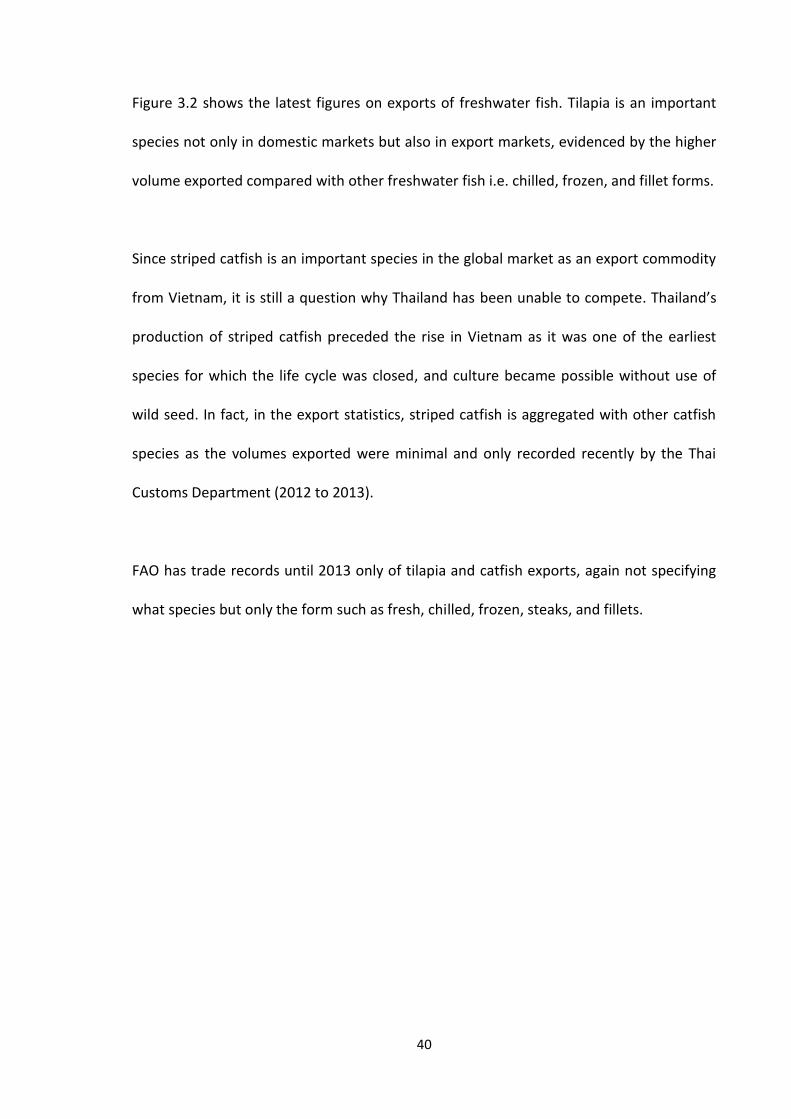
40
Figure 3.2 shows the latest figures on exports of freshwater fish. Tilapia is an important
species not only in domestic markets but also in export markets, evidenced by the higher
volume exported compared with other freshwater fish i.e. chilled, frozen, and fillet forms.
Since striped catfish is an important species in the global market as an export commodity
from Vietnam, it is still a question why Thailand has been unable to compete. Thailand’s
production of striped catfish preceded the rise in Vietnam as it was one of the earliest
species for which the life cycle was closed, and culture became possible without use of
wild seed. In fact, in the export statistics, striped catfish is aggregated with other catfish
species as the volumes exported were minimal and only recorded recently by the Thai
Customs Department (2012 to 2013).
FAO has trade records until 2013 only of tilapia and catfish exports, again not specifying
what species but only the form such as fresh, chilled, frozen, steaks, and fillets.
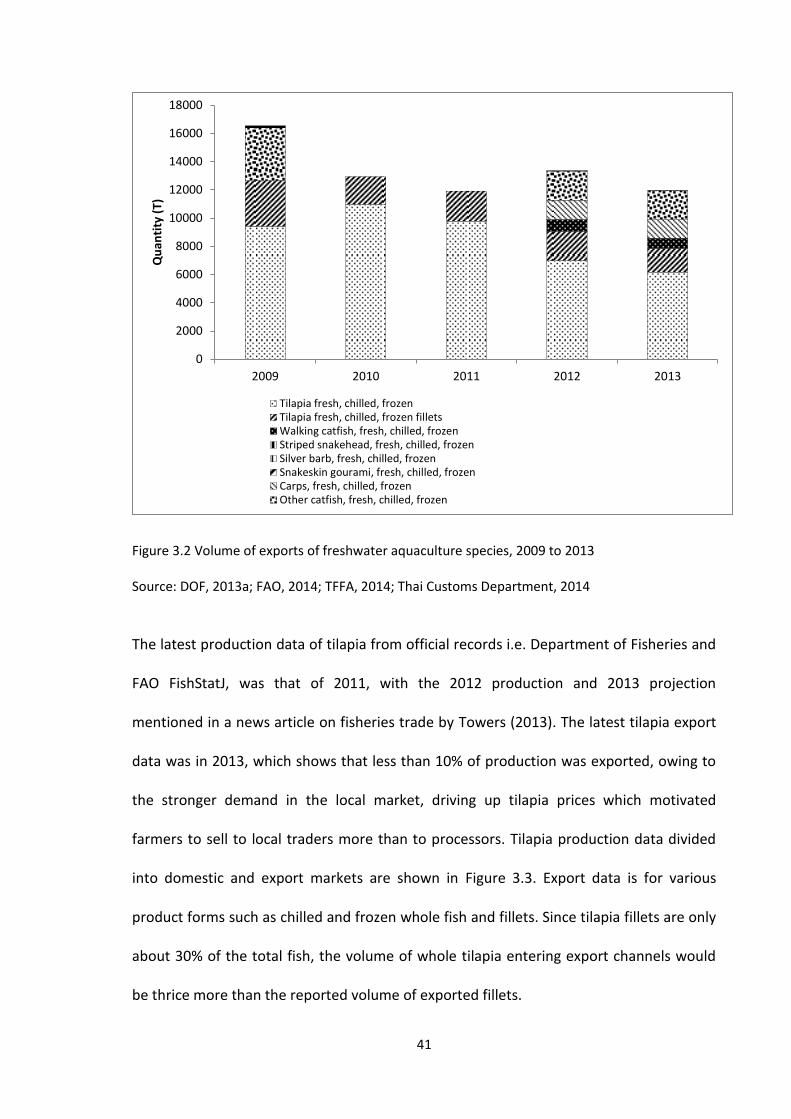
41
Figure 3.2 Volume of exports of freshwater aquaculture species, 2009 to 2013
Source: DOF, 2013a; FAO, 2014; TFFA, 2014; Thai Customs Department, 2014
The latest production data of tilapia from official records i.e. Department of Fisheries and
FAO FishStatJ, was that of 2011, with the 2012 production and 2013 projection
mentioned in a news article on fisheries trade by Towers (2013). The latest tilapia export
data was in 2013, which shows that less than 10% of production was exported, owing to
the stronger demand in the local market, driving up tilapia prices which motivated
farmers to sell to local traders more than to processors. Tilapia production data divided
into domestic and export markets are shown in Figure 3.3. Export data is for various
product forms such as chilled and frozen whole fish and fillets. Since tilapia fillets are only
about 30% of the total fish, the volume of whole tilapia entering export channels would
be thrice more than the reported volume of exported fillets.
0
2000
4000
6000
8000
10000
12000
14000
16000
18000
2009 2010 2011 2012 2013
Qu
anti
ty (
T)
Tilapia fresh, chilled, frozenTilapia fresh, chilled, frozen filletsWalking catfish, fresh, chilled, frozenStriped snakehead, fresh, chilled, frozenSilver barb, fresh, chilled, frozenSnakeskin gourami, fresh, chilled, frozenCarps, fresh, chilled, frozenOther catfish, fresh, chilled, frozen
42
Figure 3.3 Production and export of tilapia, 2002 to 2013
Source: DOF, 2013a; FAO, 2014; Towers, 2013
3.2. Trends/historical data
Aquaculture in Thailand has a long history, and has significantly developed since before
the 1950s, firstly with freshwater aquaculture particularly with snakeskin gourami and
carps, and much later with brackishwater aquaculture (Edwards, 2011; Falvey, 2000; FAO,
2009). Table 3.1 presents major milestones in the aquaculture industry related to the four
species in this chapter.
0%
10%
20%
30%
40%
50%
60%
70%
80%
90%
100%
2002 2003 2004 2005 2006 2007 2008 2009 2010 2011 2012 2013
Tila
pia
pro
du
ctio
n s
old
in d
om
est
ic &
exp
ort
mar
kets
(%
)
Domestic Export
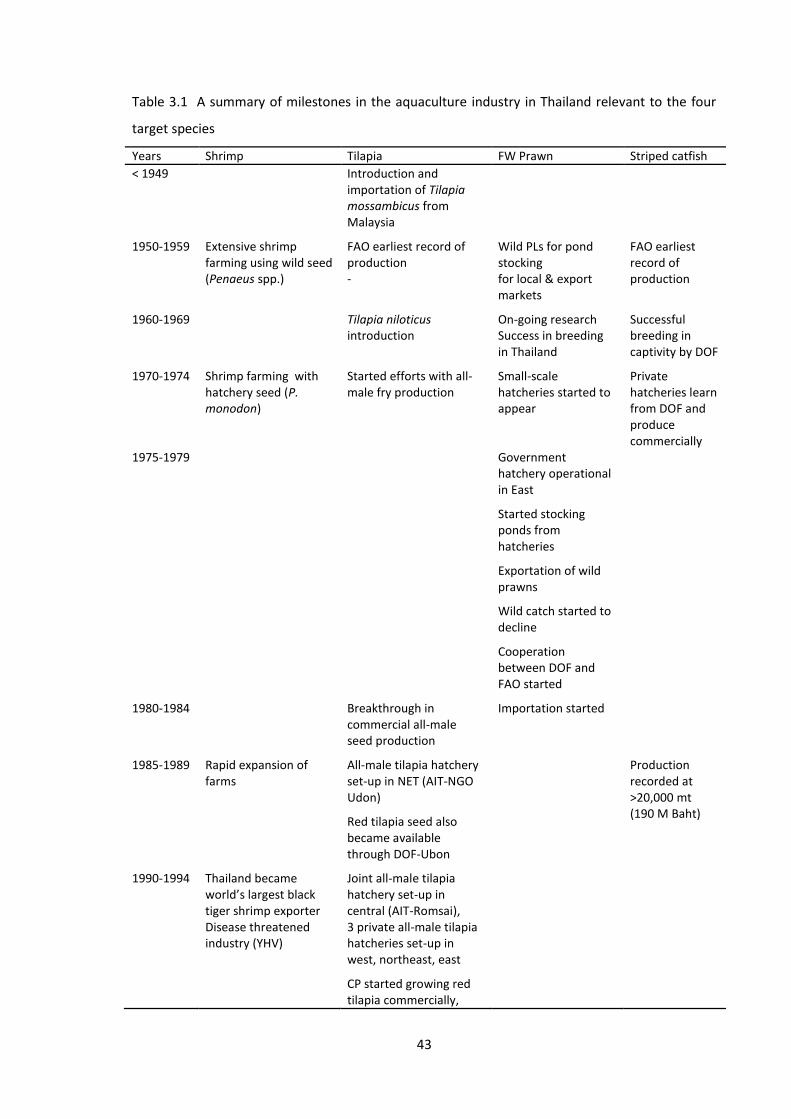
43
Table 3.1 A summary of milestones in the aquaculture industry in Thailand relevant to the four
target species
Years Shrimp Tilapia FW Prawn Striped catfish
< 1949 Introduction and importation of Tilapia mossambicus from Malaysia
1950-1959 Extensive shrimp farming using wild seed (Penaeus spp.)
FAO earliest record of production -
Wild PLs for pond stocking for local & export markets
FAO earliest record of production
1960-1969 Tilapia niloticus introduction
On-going research Success in breeding in Thailand
Successful breeding in captivity by DOF
1970-1974 Shrimp farming with hatchery seed (P. monodon)
Started efforts with all-male fry production
Small-scale hatcheries started to appear
Private hatcheries learn from DOF and produce commercially
1975-1979 Government hatchery operational in East
Started stocking ponds from hatcheries
Exportation of wild prawns
Wild catch started to decline
Cooperation between DOF and FAO started
1980-1984 Breakthrough in commercial all-male seed production
Importation started
1985-1989 Rapid expansion of farms
All-male tilapia hatchery set-up in NET (AIT-NGO Udon)
Red tilapia seed also became available through DOF-Ubon
Production recorded at >20,000 mt (190 M Baht)
1990-1994 Thailand became world’s largest black tiger shrimp exporter Disease threatened industry (YHV)
Joint all-male tilapia hatchery set-up in central (AIT-Romsai), 3 private all-male tilapia hatcheries set-up in west, northeast, east
CP started growing red tilapia commercially,

44
Years Shrimp Tilapia FW Prawn Striped catfish
initiating contract farming for tilapia
1995-1999 Disease threatened industry (WSSV)
Government ban on inland shrimp farming
SPF L. vannamei broodstock imported from Taiwan
Industry self-imposed standards on shrimp production
CP started commercial seed production after years of experimentation CP promoted cage farming
Production recorded at <7,700 mt (138 M Baht)
2000-2004 P. monodon slow growth syndrome began
White shrimp became popular species
Limited SPF broodstock imports tested
Lobbied for more SPF broodstock imports
DOF bans antibiotic use in shrimp
EU zero tolerance of antibiotics
Massive rejection of shrimp exports to Europe
SPF white shrimp locally produced (F1)
Domestic shrimp consumption promoted
Taura virus syndrome
Grobest Frozen Foods Co. set-up tilapia processing plant in Nakhon Phanom
2005-2009 White shrimp widely cultured (98% of production)
Tilapia pond production reached > 200,000 t
Export of tilapia fillet began
Around 20 all-male hatcheries operating
Wild capture <700 t
Government efforts to export
Pilot project by govt & private company for production & export (NET)
Exported 11 t fillet to US from pilot project, although not sustained due to supply issues
2010 Blue shrimp introduced by Sarasin hatchery
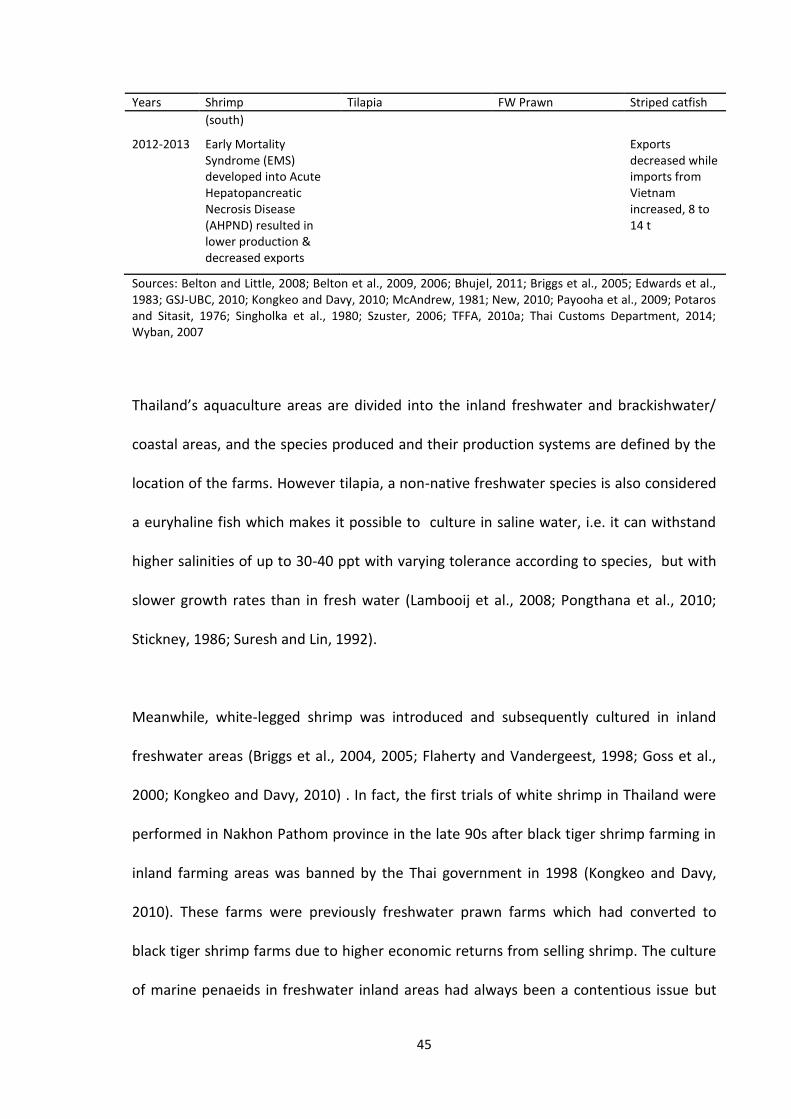
45
Years Shrimp Tilapia FW Prawn Striped catfish
(south)
2012-2013 Early Mortality Syndrome (EMS) developed into Acute Hepatopancreatic Necrosis Disease (AHPND) resulted in lower production & decreased exports
Exports decreased while imports from Vietnam increased, 8 to 14 t
Sources: Belton and Little, 2008; Belton et al., 2009, 2006; Bhujel, 2011; Briggs et al., 2005; Edwards et al., 1983; GSJ-UBC, 2010; Kongkeo and Davy, 2010; McAndrew, 1981; New, 2010; Payooha et al., 2009; Potaros and Sitasit, 1976; Singholka et al., 1980; Szuster, 2006; TFFA, 2010a; Thai Customs Department, 2014; Wyban, 2007
Thailand’s aquaculture areas are divided into the inland freshwater and brackishwater/
coastal areas, and the species produced and their production systems are defined by the
location of the farms. However tilapia, a non-native freshwater species is also considered
a euryhaline fish which makes it possible to culture in saline water, i.e. it can withstand
higher salinities of up to 30-40 ppt with varying tolerance according to species, but with
slower growth rates than in fresh water (Lambooij et al., 2008; Pongthana et al., 2010;
Stickney, 1986; Suresh and Lin, 1992).
Meanwhile, white-legged shrimp was introduced and subsequently cultured in inland
freshwater areas (Briggs et al., 2004, 2005; Flaherty and Vandergeest, 1998; Goss et al.,
2000; Kongkeo and Davy, 2010) . In fact, the first trials of white shrimp in Thailand were
performed in Nakhon Pathom province in the late 90s after black tiger shrimp farming in
inland farming areas was banned by the Thai government in 1998 (Kongkeo and Davy,
2010). These farms were previously freshwater prawn farms which had converted to
black tiger shrimp farms due to higher economic returns from selling shrimp. The culture
of marine penaeids in freshwater inland areas had always been a contentious issue but

46
the introduction of white-legged shrimp led a to a rapid increase in area cultured, from
70,400 ha in 2002 to 75,736 in 2003 (Tookwinas et al., 2005). DoF started to record
production of white shrimp in 2002, which was 11% of total shrimp production, then in
2003, production was recorded at 52% of total shrimp production (Tookwinas et al.,
2005). More recently the government has ceded responsibility to the provincial governors
of affected inland provinces to decide on banning the culture of L. vannamei in their areas
as they see fit (Sukpanich, 2011), which gave rise to a very complex situation.
Between the years 1950 and 1970, only production from tilapia and striped catfish was
reported by FAO statistics for freshwater fish species, which ranged from 130 t in 1950 to
almost 1,650 t in 1970 for tilapia, and 2,800 to 6,600 t for striped catfish for the same
period (FAO, 2014). For freshwater prawn and black tiger shrimp, the earliest production
statistics appeared in 1984, at 14,542 t and 1,189 t, respectively (FAO, 2014).
Oreochromis (=Tilapia) mossambicus was first introduced to Thailand for aquaculture
purposes in 1949 from Malaysia (De Silva et al., 2004) whereas Oreochromis (=
Sarotherodon) niloticus was introduced in the mid-1960s (McAndrew 1981; De Silva et al.
2004; Bhujel 2011). In early 1950s, FAO provided assistance to Thailand to construct
ponds around 15,000 ponds for tilapia production, aiding the change in the Thai palate
from carps to tilapia (Falvey, 2000).
Freshwater prawn farming started in the mid 1970s, stimulated by the growing demand in
both domestic and export markets and after a breakthrough in hatchery and nursery
technology by government researchers (Singholka et al. 1980; New & Kutty 2010).
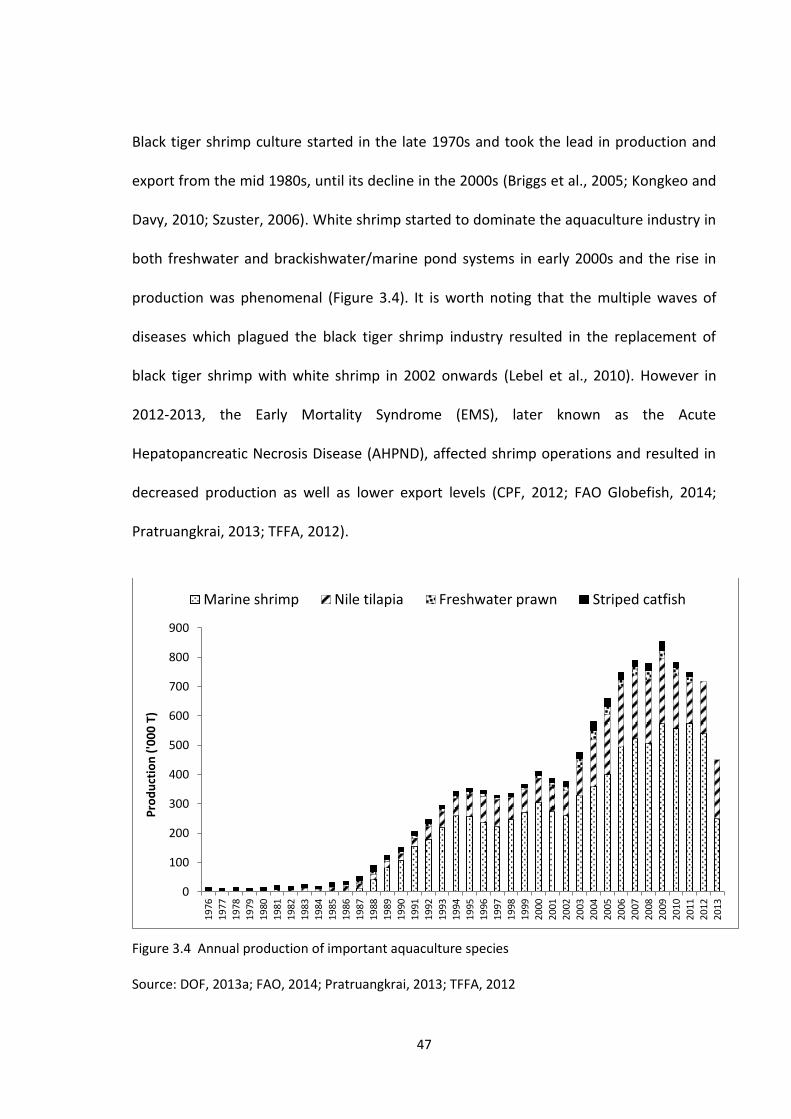
47
Black tiger shrimp culture started in the late 1970s and took the lead in production and
export from the mid 1980s, until its decline in the 2000s (Briggs et al., 2005; Kongkeo and
Davy, 2010; Szuster, 2006). White shrimp started to dominate the aquaculture industry in
both freshwater and brackishwater/marine pond systems in early 2000s and the rise in
production was phenomenal (Figure 3.4). It is worth noting that the multiple waves of
diseases which plagued the black tiger shrimp industry resulted in the replacement of
black tiger shrimp with white shrimp in 2002 onwards (Lebel et al., 2010). However in
2012-2013, the Early Mortality Syndrome (EMS), later known as the Acute
Hepatopancreatic Necrosis Disease (AHPND), affected shrimp operations and resulted in
decreased production as well as lower export levels (CPF, 2012; FAO Globefish, 2014;
Pratruangkrai, 2013; TFFA, 2012).
Figure 3.4 Annual production of important aquaculture species
Source: DOF, 2013a; FAO, 2014; Pratruangkrai, 2013; TFFA, 2012
0
100
200
300
400
500
600
700
800
900
19
76
19
77
19
78
19
79
19
80
19
81
19
82
19
83
19
84
19
85
19
86
19
87
19
88
19
89
19
90
19
91
19
92
19
93
19
94
19
95
19
96
19
97
19
98
19
99
20
00
20
01
20
02
20
03
20
04
20
05
20
06
20
07
20
08
20
09
20
10
20
11
20
12
20
13
Pro
du
ctio
n (
'00
0 T
)
Marine shrimp Nile tilapia Freshwater prawn Striped catfish
48
3.2.1. Freshwater prawn
Farming of the giant freshwater prawn, Macrobrachium rosenbergii became symbolic of
the rise and technical capacity of Thai aquaculture as it has been in existence for nearly
half a century (Singholka et al. 1980; Chareontawee et al. 2007; Karaket et al. 2011), pre-
dating that of other countries in the Region by several decades. Kongkeo and Davy (2010),
New et al. (2010) and Singholka et al. (1980) gave detailed accounts on the history and
development of freshwater prawn farming and its status as well as production levels,
summarised in the following sentences.
Thai researchers had already been experimenting with larval rearing of the prawn in the
1950s, which were followed through by Malaysian researchers who then achieved
success in hatchery rearing (Singholka et al., 1980). Furthermore, in the 1960s, supplies of
freshwater prawn for both local and export markets came mainly from capture fisheries
in the central region of Thailand. A decline in catches from the wild led to the importation
from Burma to satisfy both local and export demand. Freshwater prawn farming in
Thailand developed mainly to augment the lack of supply from the capture sector. It was
the development of small private hatcheries in the Eastern region in the early 1970s
through the prawn extension project of DoF and FAO, based on project demonstrations
that laid the groundwork for the Macrobrachium industry and other species including
black tiger shrimp that followed (Kongkeo and Davy, 2010; New et al., 2010; Singholka et
al., 1980).
49
Production was less than 0.5 t in 1975 (New 2010), while FAO records on freshwater
prawn production began in 1978, recording production at 100 t which peaked in 1987 at
almost 12000 t, and 2004 at around 32500 t (FAO-FishStatJ, 2011). A government prawn
hatchery in Chachoengsao province became fully operational in the late 1970s (Singholka
et al., 1980), which operated later than the small private hatcheries set-up in the early
1970s. Production was small at the beginning but during 1979 to 1981 the cooperation
between Thai DOF and FAO resulted in expansion of prawn farming, not only in Thailand
but also in other countries through sharing of knowledge and expertise (New 2010). In
addition, government personnel also set-up their own private operations, and this
technical knowhow was then transferred to neighbours and farmers (Kongkeo and Davy,
2010).
Between 1992 and 2001, average global production of M. rosenbergii expanded rapidly
due to increased production mainly in India and a resurgence in production in Thailand,
with China still leading the production (New 2005). The growth during this period was
also attributed to a certain extent to the failure of the black tiger shrimp industry
(Chareontawee and Poompuang, 2007). However, as of 2005, the global production of
freshwater prawn was still considered small compared to overall marine shrimp
production (New 2005), which was a similar trend in Thailand, with marine shrimp
production dominated by white shrimp (Figure 3.4). Even though it was predicted by New
(2005) that the output of freshwater prawn in Thailand would expand significantly as the
country realised the global demand for prawn and its more environmentally friendly
culture system, it was only in 2007 that production grew to nearly 27% of the 2006 prawn
production, then it dropped to 3% in 2008, and had negative growth in 2009 (Figure 3.5).

50
The perception was that the low levels and inconsistency in production were due to slow
growth rate, size variation, poor pond environment and genetic deterioration of local
broodstock (Chareontawee & Poompuang 2007). These reasons may not only apply to
freshwater prawn but also to other cultured species. Another perspective on the reasons
for inconsistency in prawn production referred to factors such as marketing, expansion of
marine shrimp farming, inland culture of white shrimp and the effect of diseases on the
income of marine shrimp farming (New & Kutty 2010). In 2001 Thailand was just fourth
among the top fifteen producers of freshwater prawn, despite being considered as one of
the pioneers along with Taiwan, when production was reported to be rising in Thailand
then (New 2005). A decade later, it was reported that Thailand was the third largest
producer of farmed freshwater prawn (following China and India), with the fisheries catch
much lower than before (New 2010). The rate of growth in production could be seen in
Figure 3.5, where during mid-1990s the negative growth was due to the farmers switching
to culture black tiger shrimp in freshwater prawn ponds in inland areas, as well as
problems with marketing and economic factors (New and Kutty, 2010). The renewed
increase in production starting in the late 1990s has been related to increasing local
demand for a traditional food item, the ban in inland shrimp farming, and government
efforts to promote exports (New & Kutty 2010).

51
Figure 3.5 Production and growth rate of freshwater prawn in Thailand (1989-2009)
Source: FAO, 2014 (production data only)
Export data against production of freshwater prawn from 2002 to 2009 are shown in
Figure 3.6. There has really been no development in terms of export activities during the
last 10 years, and since 2007 the exports have not reached 10% of production. According
to Na-Nakorn and Jintasataporn (2012) a limited export market and low yield are
hindering the development of giant freshwater prawn business, and suggested the
development of better genetic strains, and improved culture techniques including culture
of all-male prawns.
-100
-50
0
50
100
150
0.0
5.0
10.0
15.0
20.0
25.0
30.0
35.0
19
89
19
90
19
91
19
92
19
93
19
94
19
95
19
96
19
97
19
98
19
99
20
00
20
01
20
02
20
03
20
04
20
05
20
06
20
07
20
08
20
09
Gro
wth
rat
e (
%)
Pro
du
ctio
n (
'00
0M
T)
Production ('000 MT) Growth rate (%)
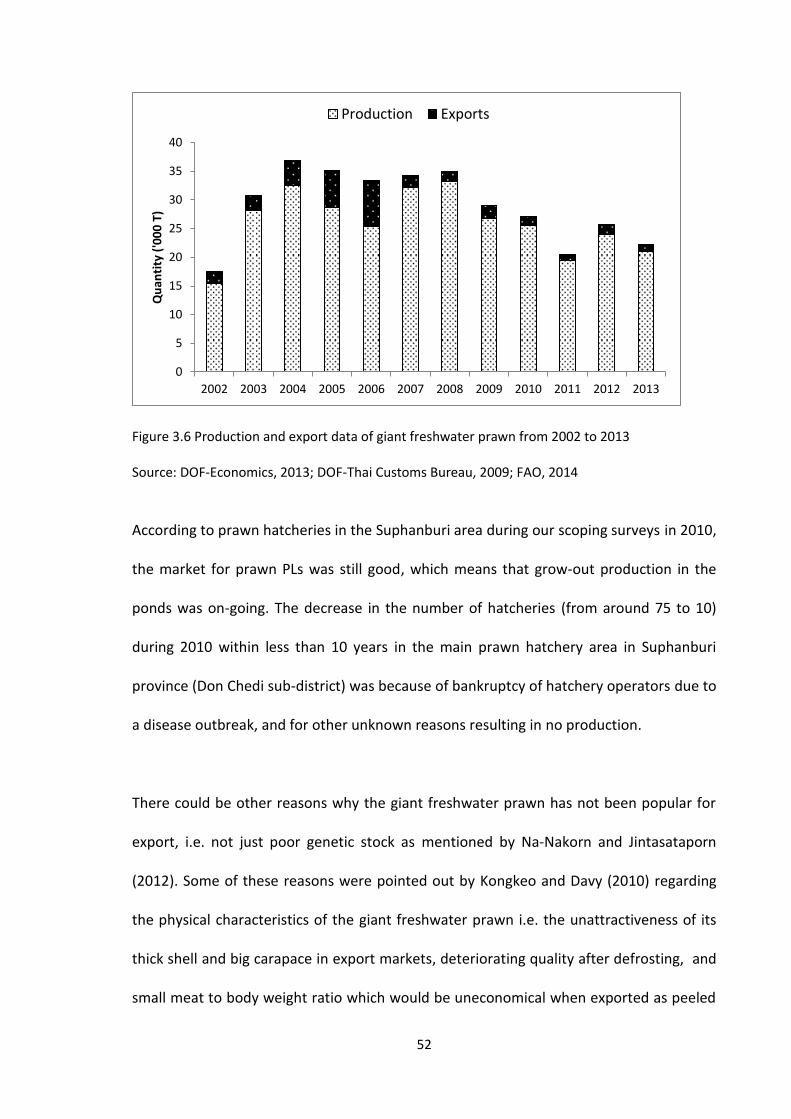
52
Figure 3.6 Production and export data of giant freshwater prawn from 2002 to 2013
Source: DOF-Economics, 2013; DOF-Thai Customs Bureau, 2009; FAO, 2014
According to prawn hatcheries in the Suphanburi area during our scoping surveys in 2010,
the market for prawn PLs was still good, which means that grow-out production in the
ponds was on-going. The decrease in the number of hatcheries (from around 75 to 10)
during 2010 within less than 10 years in the main prawn hatchery area in Suphanburi
province (Don Chedi sub-district) was because of bankruptcy of hatchery operators due to
a disease outbreak, and for other unknown reasons resulting in no production.
There could be other reasons why the giant freshwater prawn has not been popular for
export, i.e. not just poor genetic stock as mentioned by Na-Nakorn and Jintasataporn
(2012). Some of these reasons were pointed out by Kongkeo and Davy (2010) regarding
the physical characteristics of the giant freshwater prawn i.e. the unattractiveness of its
thick shell and big carapace in export markets, deteriorating quality after defrosting, and
small meat to body weight ratio which would be uneconomical when exported as peeled
0
5
10
15
20
25
30
35
40
2002 2003 2004 2005 2006 2007 2008 2009 2010 2011 2012 2013
Qu
anti
ty (
'00
0 T
)
Production Exports
53
and frozen. In addition, the domestic market for freshwater prawn is stable i.e. good price
and higher demand as it is a favoured food item in Thai cuisine (New, 2010; Schwantes et
al., 2009).
In 2012, the problems faced by the freshwater prawn culture included the high cost of
inputs such as feed and labour, fuel shortage, and seed quality, and lower market
demand affecting the price of prawns (DOF-Economics, 2012).
3.2.2. Striped catfish
Thailand has been culturing striped catfish (Pangasius sp.), a native fish species, since the
19th century using wild seed and raised in ponds, and cages in rivers (Edwards et al.,
1983), and traditionally it was considered an important fish for local consumption
(Edwards et al., 1983; Payooha, 2002). A number of species such as Pangasionodon
hypophthalmus (a.k.a Pangasius sutchii), P. lanaurdi, and P. bocourti were cultured
mainly in wooden cages along river canal systems, with the Mekong River and its
tributaries considered the most suitable. P. bocourti has been considered an important
species in the Mekong basin for cage culture in both Thailand and Vietnam (Jiwyam,
2010). Earliest production records by FAO started in the 1950s indicating that at that time
it dominated freshwater fish production among the four species being reviewed until the
1980s (20,353 t worth 190.2 M Baht in 1988). It appears that a decline in production
(13,000 to 6,800 t from 1989 to 1997) occurred as tilapia was introduced and became
established (Figure 3.4) (DOF, 2013a; FAO, 2014; Payooha, 2002). Pangasius production
from the late 1990s gradually increased again (from 11,339 t in 1999 to 30,922 t in 2009)
reaching about 14% of tilapia production by 2009 in Thailand (DOF, 2010a; FAO-FishStatJ,

54
2011), and a mere 3.1% of the 993,000 t production in Vietnam in 2009 (Phan et al.,
2011) (Figure 3.7). Latest data show that Pangasius production in Thailand in 2011
dropped to 15,252 t , equivalent to only 11% of tilapia production in Thailand and 1.3% of
Vietnam production, in the same year (FAO, 2014; Vietnamese Fisheries Directorate,
2011). Figure 3.7 shows that Thai striped catfish production and industry are
incomparable with Vietnam and continue to lose ground. While Vietnam’s export
orientated industry has rapidly innovated, in Thailand the basic culture systems continue
to be used and the fish produced are not of export quality.
Figure 3.7 Production of striped catfish in Thailand and Vietnam
Source: FAO, 2014; Vietnamese Fisheries Directorate, 2013
Most striped catfish in Thailand (especially in the central region) have been grown in
ponds on poor quality feeds, especially waste cafeteria feeds resulting in poor quality, off-
flavoured fish with low value. Cages in rivers have been traditionally used for growing
striped catfish (Edwards et al., 1983; Payooha et al., 2009; Phillips, 2002), but in the
0.0
5.0
10.0
15.0
20.0
25.0
30.0
35.0
0
200
400
600
800
1000
1200
1400
2001 2002 2003 2004 2005 2006 2007 2008 2009 2010 2011 2012 2013%
of
Vie
tnam
pro
du
ctio
n
Pro
du
ctio
n (
'00
0T)
Thailand production Vietnam production % of Vietnam production
55
northeast region, previous catfish cage farmers have shifted to growing tilapia due to the
latter’s shorter culture period to reach marketable size (Payooha et al., 2009). The shift
allowed for more income to be received by the farmers (at least 2-3x per year) compared
with striped catfish which takes nearly a year or more to be harvested and sold (from
scoping survey among cage farmers in Ubon Ratchathani province).
3.2.3. Tilapia
In the mid 1990s, CP company started to contract farmers in the central and the
northeast regions to grow ruby (tabtim) or red tilapia in ponds and cages, offering seed
and feed so they would have a supply for their processing plants for both local and
domestic markets (Belton et al. 2006). Furthermore, ruby or tabtim tilapia became a
cheaper and fresher substitute i.e. higher quality alternative, to marine fish which
required long hours of transport especially to upcountry inland areas. The development
of cage-based tilapia systems has been attributed mainly to CP company (Belton et al.
2006; 2009) resulting from its research, development and marketing activities, for both
local and export markets. Through its innovative marketing strategies in which food
services were targeted before retail markets, the production and consumption of cage-
produced red tilapia has become popular in many areas of the country. Recently, other
companies (for e.g. Grobest) with seed, feed, inputs and processing capacities have also
contracted cage farmers to produce tilapia (both Nile and red), for both local and export
markets. Although the supply is mainly for northeast provinces, they are sold into a
premium live domestic market, where producers and traders could obtain higher prices,
making it more expensive for the processors to offer to buy them. Most (81%) of tilapia
produced still came from pond systems with 19% from cages in rivers (DOF, 2013a).
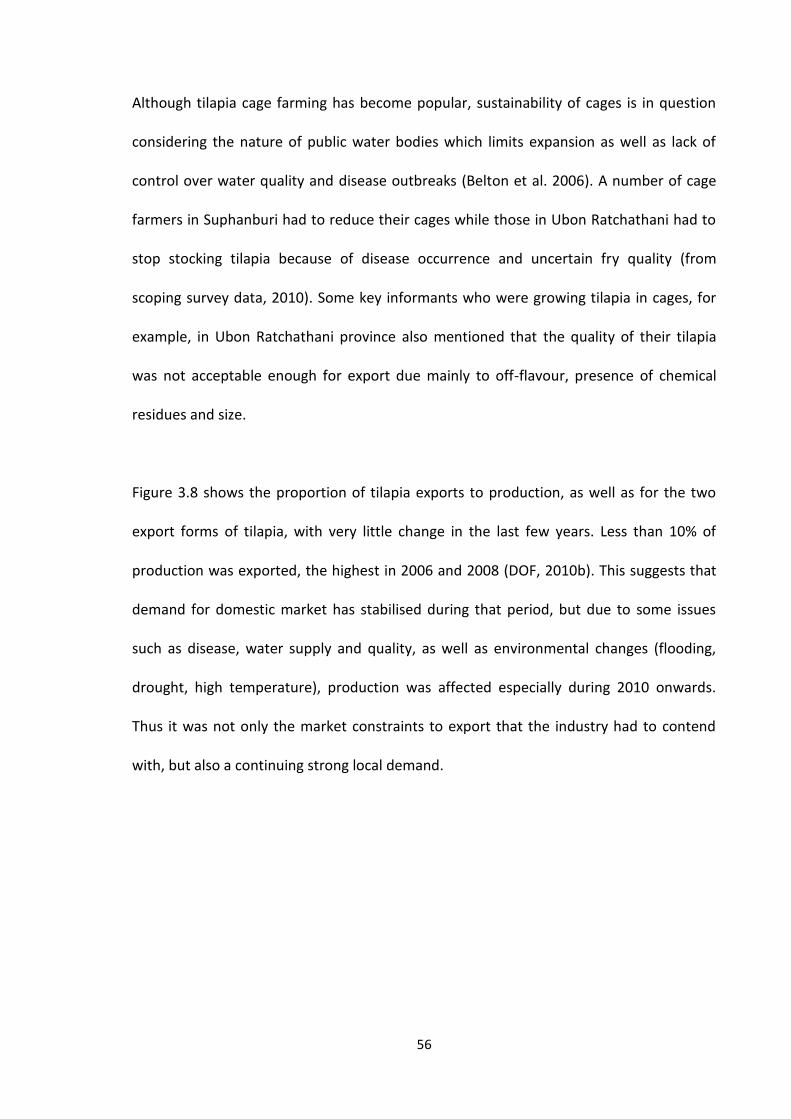
56
Although tilapia cage farming has become popular, sustainability of cages is in question
considering the nature of public water bodies which limits expansion as well as lack of
control over water quality and disease outbreaks (Belton et al. 2006). A number of cage
farmers in Suphanburi had to reduce their cages while those in Ubon Ratchathani had to
stop stocking tilapia because of disease occurrence and uncertain fry quality (from
scoping survey data, 2010). Some key informants who were growing tilapia in cages, for
example, in Ubon Ratchathani province also mentioned that the quality of their tilapia
was not acceptable enough for export due mainly to off-flavour, presence of chemical
residues and size.
Figure 3.8 shows the proportion of tilapia exports to production, as well as for the two
export forms of tilapia, with very little change in the last few years. Less than 10% of
production was exported, the highest in 2006 and 2008 (DOF, 2010b). This suggests that
demand for domestic market has stabilised during that period, but due to some issues
such as disease, water supply and quality, as well as environmental changes (flooding,
drought, high temperature), production was affected especially during 2010 onwards.
Thus it was not only the market constraints to export that the industry had to contend
with, but also a continuing strong local demand.

57
Figure 3.8 Tilapia production and volume of exports for Nile and red tilapia
Source: FAO, 2014; TFFA, 2014
3.2.4. Penaeid shrimp
Traditional penaeid shrimp farming had already been practiced in Thailand as early as the
1930s in extensive systems with Penaeus merguensis (banana shrimp) (Kongkeo, 2007),
however, Thailand’s black tiger shrimp industry started in the early 1970s following the
development of hatcheries in Thailand and with promotion from DoF (Kongkeo and Davy,
2010; Tookwinas et al., 2005), and took off in the mid-1970s following the shrimp
production crash in Taiwan and the high value of shrimp in international markets that was
an outcome of increasing demand (Briggs et al., 2005; Kongkeo and Davy, 2010). This
resulted in the proliferation of many small intensive farms in Thailand making it the
production leader in the early 1990s until the end of the millennium (2000) with black
tiger shrimp, and continued with white shrimp.
0
50
100
150
200
250
2002 2003 2004 2005 2006 2007 2008 2009 2010 2011 2012 2013
Pro
du
ctio
n (
'00
0 T
)
Production Export (chilled, frozen whole) Export (chilled, frozen fillets)
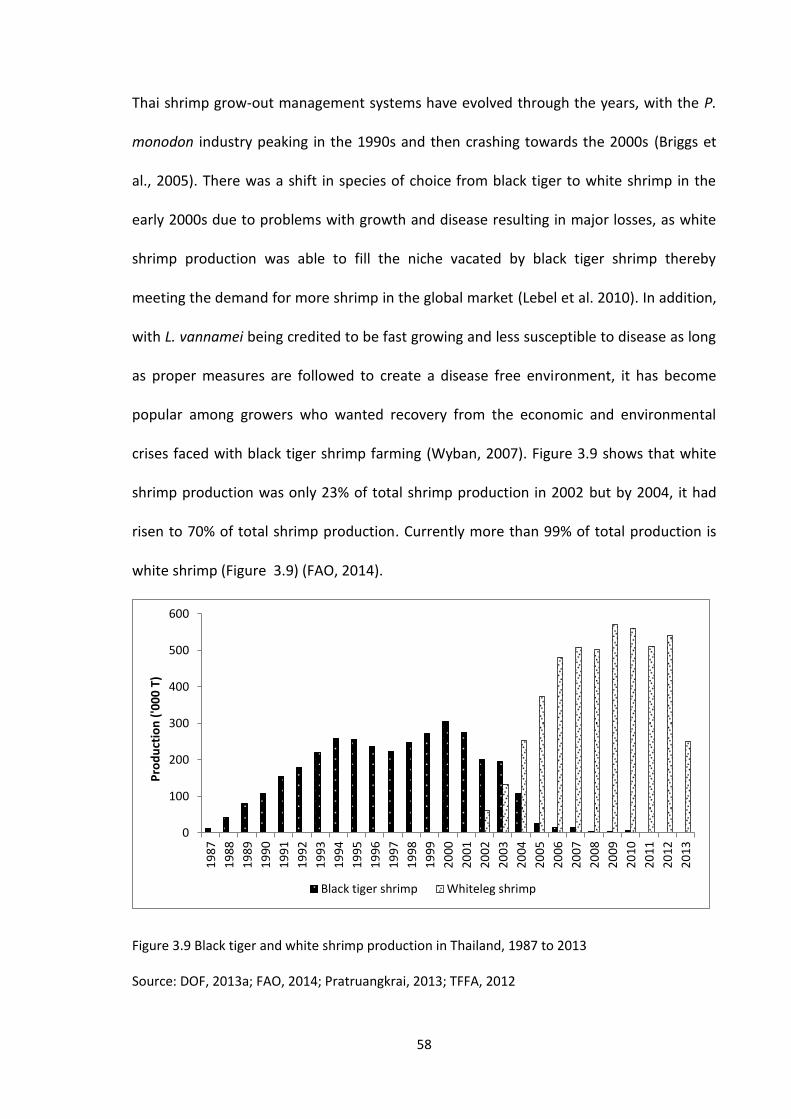
58
Thai shrimp grow-out management systems have evolved through the years, with the P.
monodon industry peaking in the 1990s and then crashing towards the 2000s (Briggs et
al., 2005). There was a shift in species of choice from black tiger to white shrimp in the
early 2000s due to problems with growth and disease resulting in major losses, as white
shrimp production was able to fill the niche vacated by black tiger shrimp thereby
meeting the demand for more shrimp in the global market (Lebel et al. 2010). In addition,
with L. vannamei being credited to be fast growing and less susceptible to disease as long
as proper measures are followed to create a disease free environment, it has become
popular among growers who wanted recovery from the economic and environmental
crises faced with black tiger shrimp farming (Wyban, 2007). Figure 3.9 shows that white
shrimp production was only 23% of total shrimp production in 2002 but by 2004, it had
risen to 70% of total shrimp production. Currently more than 99% of total production is
white shrimp (Figure 3.9) (FAO, 2014).
Figure 3.9 Black tiger and white shrimp production in Thailand, 1987 to 2013
Source: DOF, 2013a; FAO, 2014; Pratruangkrai, 2013; TFFA, 2012
0
100
200
300
400
500
600
19
87
19
88
19
89
19
90
19
91
19
92
19
93
19
94
19
95
19
96
19
97
19
98
19
99
20
00
20
01
20
02
20
03
20
04
20
05
20
06
20
07
20
08
20
09
20
10
20
11
20
12
20
13
Pro
du
ctio
n (
'00
0 T
)
Black tiger shrimp Whiteleg shrimp
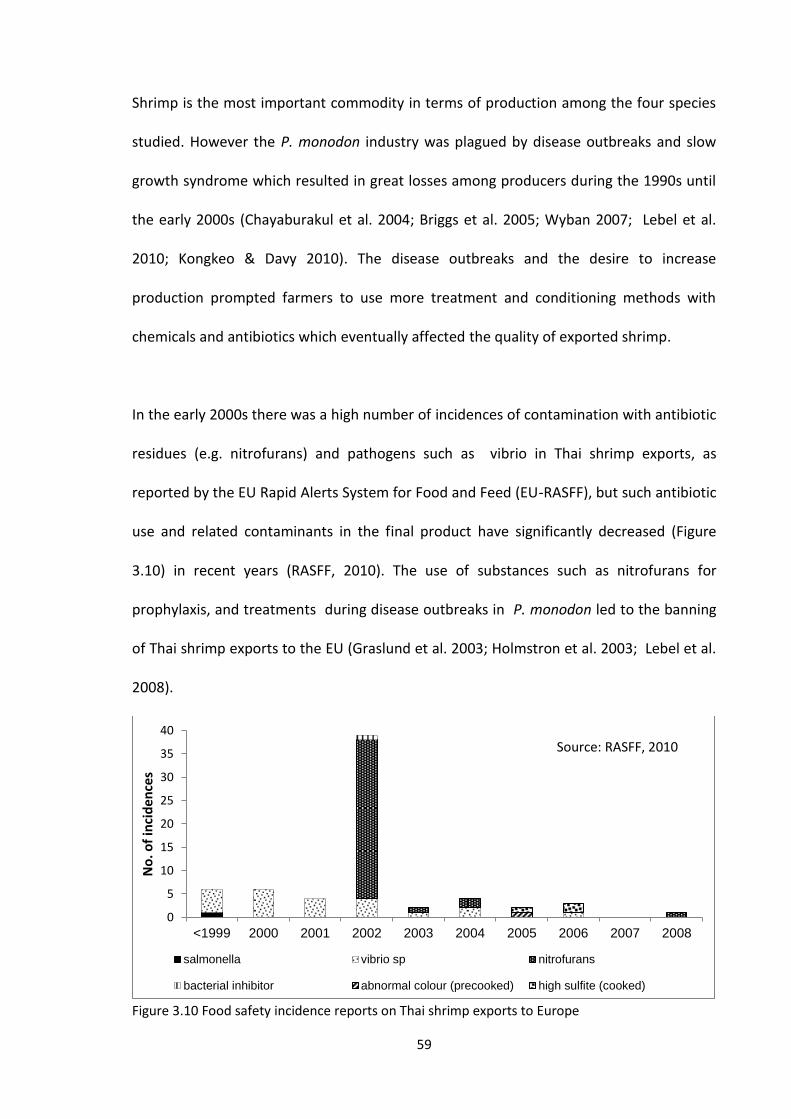
59
Shrimp is the most important commodity in terms of production among the four species
studied. However the P. monodon industry was plagued by disease outbreaks and slow
growth syndrome which resulted in great losses among producers during the 1990s until
the early 2000s (Chayaburakul et al. 2004; Briggs et al. 2005; Wyban 2007; Lebel et al.
2010; Kongkeo & Davy 2010). The disease outbreaks and the desire to increase
production prompted farmers to use more treatment and conditioning methods with
chemicals and antibiotics which eventually affected the quality of exported shrimp.
In the early 2000s there was a high number of incidences of contamination with antibiotic
residues (e.g. nitrofurans) and pathogens such as vibrio in Thai shrimp exports, as
reported by the EU Rapid Alerts System for Food and Feed (EU-RASFF), but such antibiotic
use and related contaminants in the final product have significantly decreased (Figure
3.10) in recent years (RASFF, 2010). The use of substances such as nitrofurans for
prophylaxis, and treatments during disease outbreaks in P. monodon led to the banning
of Thai shrimp exports to the EU (Graslund et al. 2003; Holmstron et al. 2003; Lebel et al.
2008).
Figure 3.10 Food safety incidence reports on Thai shrimp exports to Europe
0
5
10
15
20
25
30
35
40
<1999 2000 2001 2002 2003 2004 2005 2006 2007 2008
No
. of
inci
den
ces
salmonella vibrio sp nitrofurans
bacterial inhibitor abnormal colour (precooked) high sulfite (cooked)
Source: RASFF, 2010

60
In the late 1990s to early 2000s, the private sector first introduced specific-pathogen free
(SPF) L. vannamei from Hawaii for experimentation mainly in the freshwater areas of
Thailand i.e. Nakhon Pathom province, where P. monodon farming was banned following
a government regulation due to concerns for salt water intrusion into freshwater supply
(Kongkeo and Davy, 2010; Wyban, 2007). White shrimp production then spread to other
parts of the freshwater inland areas. In early 2000, white shrimp farming expanded to
the coastal areas, resulting in a sharp increase in production (Kongkeo and Davy, 2010).
White shrimp production data began to appear in the FAO database in 2002. The shift in
species was mainly driven by the problems of disease and slow growth faced by black
tiger shrimp producers, and the opportunities provided by white shrimp culture in terms
of faster growth, lower production costs, and better environmental and disease
management (Lebel et al. 2010).
The shift to L. vannamei and the subsequent regulatory frameworks, advances in
biosecure and green techniques and the cooperation among different stakeholders
through farmers’ clubs/groups have helped the industry to recover (Lebel et al., 2009 &
2010; McIntosh, 2008a; Wyban, 2007; Yamprayoon and Sukhumparnich, 2010). These
efforts, including the government’s regulation banning the use of antibiotics and other
hazardous chemicals, have resulted in drastic reduction in the use of antibiotics and other
hazardous chemicals in aquaculture initially with shrimp culture and recently expanding
to other aquaculture systems (Lebel et al. 2008; Rico et al., 2012).

61
3.3. Importance of seed and hatchery development
It has been established that for aquaculture to fully develop, a reliable supply of quality
seed is important (AIT Outreach 2000; Little et al. 2002). In the past when fish farming
was still extensive and demand for farmed products was modest, reliance on wild seed
was sufficient. However, due to the development of aquaculture to respond to increasing
demand for food fish not only locally but also globally, a hatchery sector producing
consistent quality juveniles has been critical.
Artificial fish seed propagation in Thailand developed at different periods of time
depending on species and location (Belton, 2012; Belton et al., 2009). As aquaculture
systems intensified, good quality seed, i.e. less size variation, sufficient quantities at the
time required and stress-resistant, were required, and reliance on hatchery seed also
increased (AIT Outreach 2000; Little et al. 2002; Kongkeo & Davy 2010). In Thailand,
efforts of the Government, researchers and a network of private
entrepreneurs/operators and traders contributed to a strong seed production industry
making fish seed available which promoted aquaculture development in the country,
especially among the species studied (Little & MacNiven 2001; Little et al. 2002; Belton
&Little 2008; Kongkeo & Davy 2010; New & Kutty 2010).
Tilapia production in Thailand topped freshwater fish production after tilapia hatchery
technology through mass seed production was developed by AIT and became established
through private-public partnerships and training (Belton, 2012; Belton et al., 2009; Bhujel,
2011). One of the major reasons for the rise of tilapia as an important aquatic food
62
commodity was the success in seed production technology, specifically the application of
artificial egg incubation and all-male fry production (Bhujel 2009). The use of monosex
fish is particularly critical for population control and final size management in the semi-
intensive systems that still dominate in Thailand. More importantly are the informal
interactions among enterprising individuals which were efficient in extending hatchery
technical know-how from research institutions to the private sector (Belton, 2012).
The history and development of tilapia hatcheries in Thailand, especially for monosex
tilapia fry production was described by Belton et al. (2009) and Bhujel (2011), attributing
tilapia hatchery development to the close collaboration among academic research
institutes such as the Asian Institute of Technology, the DoF and the private sector,
including banks such as the Asian Development Bank and the Bank of Agriculture and
Agricultural Cooperatives (BAAC). DoF was credited for its contribution to provision of
high quality broodstock, in addition to its many other roles of fry production and
extending seed production technology to the provinces. BAAC provides credit for
agricultural activities to individual farmers, agricultural cooperatives, farmers’
associations as well as government-secured loan projects (BAAC, 2009).
Hatchery development has been instrumental in the development of tilapia aquaculture
which resulted in higher production and consumer acceptance. Disease occurrence in
tilapia fry and fingerlings may be the major constraint of the industry and research on
how to prevent disease infestation is on-going. Specific pathogen resistant (SPR)
broodstock may be critical in the future (Warren Turner, personal communication, 2010),
considering that a growing number of serious tilapia diseases reduce performance and
63
growth. For example, in tilapia cages, there is a need to use chemical inputs, both as
prophylactic for disease prevention, as well as for treatment when disease occurs (Rico et
al., 2013).
The establishment of first, freshwater prawn and then, black tiger shrimp backyard
hatcheries was a major factor in seed production and hatchery development in Thailand
(Kongkeo and Davy, 2010). Furthermore, the success in shrimp was initially linked to the
fact that the hatchery techniques based on prawn were already well established. These
household owned and operated backyard hatcheries favoured their technical success
over Government employee-based hatcheries as extended family members could provide
round the clock labour and management, and it was useful to have the operations within
distance from the owner’s house.
The Thai DOF as well as local educational institutions (Department of Vocational
Education’s agricultural colleges, universities) played a major role in research, training
and development of skilled labour, and most of the time DOF technical staff and workers
themselves or their families were the entrepreneurs establishing backyard hatcheries
(Belton et al., 2009; Little et al., 1987). This informal extension of knowledge and skills
gained from formal employment into private enterprise is a characteristic of the Thai
aquaculture hatchery sector in general and has also been described for Vietnam and
elsewhere in Asia (Belton, 2012; Little et al., 2002).
The loan from the Asian Development Bank to Thailand during the mid 1980s until 1993
to promote black tiger shrimp aquaculture enabled the establishment and improvement
64
of a number of government shrimp hatcheries, which resulted in increased production of
up to 60 million PLs, the majority (70%) of which were used to restock the wild and for
research at DOF, and the remaining 30% sold to farms (ADB, 1996). Based on the
production levels of shrimp during ADB project implementation, i.e. 118,000 to 250,000 t
from 1990 to 1994 (ADB, 1996), at a conservative 50% survival rate (from PL to
marketable size of 30 shrimp/kg), around 7 to 15 Billion PLs were required for stocking.
Private sector seed production thus quickly became the main source of supply to shrimp
farmers.
In the late 1990s when the industry shifted from culturing black tiger shrimp to white
shrimp, broodstock of Litopenaeus vannamei had to be imported as it was “an introduced
species in Asia and the Pacific” (Briggs et al., 2005). Subsequently, the tiger shrimp
hatcheries either stopped operation or shifted to producing white shrimp PLs. Hatcheries
importing white shrimp broodstock had to register with the DoF, which was part of the
regulatory and control measures especially related to disease prevention, with the
broodstock required to be certified as specific pathogen free (SPF). However, non-SPF
broodstock continued to be imported without permit from DOF into the late 1990s and
early 2000s (Briggs et al., 2005; Tookwinas et al., 2005). Regulating imports of broodstock
starting in early 2002 (Tookwinas et al., 2005) helped in achieving success in white shrimp
production, as the control ensured that only SPF broodstock were used, with the
suppliers (from Hawaii, USA) required to become certified SPF producers and obliged to
meet DOF criteria (Tookwinas et al., 2005; Wyban, 2007).
65
Home-grown F1 broodstock soon became available but the quality of postlarvae was
lower (slower growth, more variable sizes and more vulnerable to diseases) than those
coming directly from imported SPF broodstock (Wyban, 2007). Mcintosh (2010) pointed
out, though, that domesticated, disease-free shrimp was one of the key drivers in reviving
the shrimp industry in Thailand, mentioning about selective breeding programmes of
which the CP breeding programme in Thailand is the largest, supplying PLs to their farms
and clients. The good quality broodstock and PLs mentioned by Mcintosh (2010) above
obviously referred to subsequent generations and not specifically the F1 generation
mentioned by Wyban (2007). These importing hatcheries would sell nauplii to the smaller
scale hatcheries located in the eastern provinces of Chachoengsao and Chonburi, and
Phuket province in the south, as well as sell PLs directly to growers and use in their own
growout farms (Kongkeo and Davy, 2010). These hatcheries also had to develop their own
selective breeding programmes so they would not be dependent on imported broodstock
in the long run. With CP’s purchase of the broodstock production facility in Hawaii,
broodstock imports have been limited to their (CP) own hatcheries (source from a key
informant during surveys).
Thus private sector development with all its informal relationships and networks has also
been central to the expansion of seed production technology in Thailand (Belton, 2012).
An example of private sector effort in development of seed production technologies is
that by Charoen Pokphand Foods company, a large vertically integrated company which
has been an industry leader in shrimp seed production through its development of
efficient, biosecure techniques including selective breeding to ensure healthy broodstock
and good quality PLs for their own operations as well as for their leased and contract

66
farms (McIntosh, 2008b). The company believes that in order for a vertically integrated
operation to survive they need to have a strong foundation in the production of reliable,
high quality and healthy PLs. Currently they have 10 corporate hatcheries catering to their
farms (owned and leased) and have the capacity of producing 80 to 900 million
PLs/month.
Pangasius is one of the earliest species spawned in Thailand, at Nakhon Sawan Fisheries
Station in 1958 (Boonbrahm, 1959). The Department of Fisheries still has the capacity to
breed them, although commercial supply of juveniles has long been dominated by private
sector hatcheries. Traditionally farmers would collect fingerlings from rivers and stock
them in cages (Payooha et al., 2009). In Vietnam, they also used to collect fingerlings from
the wild but would stock them in their “latrine” backyard farms (De Silva and Phuong,
2011).
In Nakhon Phanom, northeast Thailand, along the Mekong River, the government’s
initiative in one of its pilot projects to promote striped catfish culture for export in 2005
resulted in a temporary high demand for fingerlings of Pangasius bocourti to be stocked
in growout ponds and cages (Payooha et al., 2009). The Thai interest in this species was
probably motivated by the success of the Vietnamese industry as well as a long period of
decline in the domestic market of the pure striped catfish species (P. hypophthalmus),
thus there was an attempt to re-launch it as an export item or boost its exportation
(BAAC, 2009). However quality issues related to flesh and flavour might have constrained
the success of the initiative (DOF-Economics, 2009).
67
To ensure enough seed supply, researchers at the Nakhon Phanom Department of
Fisheries Station successfully cross-bred the female of Pangasianodon hypophthalmus
and male P. bocourti which is more fecund and has a higher survival during nursing
(Payooha et al., 2009). The flesh texture is similar to that of P. bocourti. This is marketed
as Thai Panga and the local name is Sawai Mong (Payooha et al., 2009). There are major
concerns on this in relation to biodiversity issues and certification as cross-breeding
species is not supported by major certifiers. Even though Thailand has developed the
technology of seed production and culture a long time ago, there is lack of comparative
advantage in producing good quality Pangasius for export. For example, the Vietnamese
can achieve good quality product through intensive water management (Phan et al.,
2011), whereas Thailand has opted for technical short cuts such as hybridisation or
genetic manipulation of the native species to solve the yellow flesh problem, for e.g.
genetic techniques (Na-Nakorn and Moeikum, 2009).
Seed quality continues to be an issue especially with white shrimp and tilapia, in terms of
achieving strains which are of good quality and resistant to diseases which ail the
industry. When juvenile shrimp started dying en masse 30-45 days after stocking
(symptoms of the Early Mortality Syndrome) during 2012-2013, the quality of post-larvae
was thought to be the likely cause, resulting in majority of farmers changing their seed
sources. The DOF and private sector also collaborated in having a consensus for
guidelines which hatcheries should follow to produce better quality PLs (DOF, 2013b;
TFFA, 2012).

68
For tilapia, despite being well-known as a species that is easy to breed and culture (Belton
et al., 2009), and widely produced (Norman-López and Bjørndal, 2009), disease
prevention is still one of the major concerns in order to strengthen tilapia industry
(Towers, 2013). In addition to quality concerns for tilapia seed, Bhujel (2011) also
emphasized the importance of producing enough quality seed. Over the last few decades
considerable resources have been invested in training fish geneticists in the Thai DOF and
Universities and ‘improved strains’ have been identified as a key requirement for
increasing performance for all cultured species. Participation of Thailand in the regional
GIFT project (Genetically Improved Farmed Tilapia) has been a major success with a high
proportion of commercial Nile tilapia strains now being GIFT or GIFT hybrids (75% of
fingerlings cultured by farmers) (Ponzoni et al., 2010). Trials across the region in the early
2000s showed that adoption of GIFT strains would increase production thereby lowering
price and making tilapia more accessible to a large population (Ponzoni, 2008).
The relative importance of disease control, genetics and other factors in seed production
remains contested however, such as what Na-Nakorn and Jintasataporn (2012) claimed
that genetically improved strains of freshwater prawns would help expand the business.
On the other hand, it is notable that Vietnam has built its huge Pangasius industry
essentially based on wild, unimproved genetic stock.
3.4. Emergence of feed industry
Thongrod (2007) reported that there were about 60 feed mills in Thailand, with 32
producing shrimp feeds, 12 producing tilapia with the remaining produce both shrimp
and fish, as well as specific ingredients such as additives and premixes. An analysis of
69
advertisements in professional magazines in 2011 identified more than 20 aquaculture
feed companies, producing feeds for shrimp (white and black tiger), prawn, tilapia and
other fish and aquatic animals such as for catfish, sea bass, carp and other herbivorous
fish, crab, lobster, soft-shelled terrapin turtle and frog. In addition there are more than 60
brands and or feed types/grade, with some companies producing as many as nine
different feeds for various species and ages/sizes. Figure 3.11 shows the location of the
feed mills by density (average number/ production area), according to species. Feed mills
are strategically located based on the aquatic species which are commonly raised in that
particularly area, with a concentration in the ‘fish belt’ around Bangkok where freshwater
fish culture dominates. The feed mills are producing feeds for tilapia, catfish and other
herbivorous fish species.
Feed mills have their own sales offices and shops with sales agents in strategic provinces
close to concentrations of farms. In addition, agricultural and feed shops also exist in the
provinces, sub-districts and villages to cater to medium and small scale farmers. These
shops could either be direct distributors of feed companies or independent retailers.
Farms which have a high number of ponds in operation requiring a large volume of feeds
per time (i.e. medium and large scale farms based on SEAT project classification) typically
buy directly from feed companies as they can purchase in bulk and have enough storage
area to keep the feed. Cooperatives and farmer clubs/associations also helped to
negotiate with feed companies directly for a cheaper price than buying from retail feed
shops/dealers (Lebel et al., 2009).

70
Figure 3.11 Location of feed mills and production areas by species
Table 3.2 shows that most of the feed mills did not start with fish and shrimp feed
production but rather with livestock (chicken or swine) feed or production. The oldest
feed mill company (Betagro) was established in 1967 as an animal feed manufacturer,
0
1
2-5
6-9
>10
Saraburi
Lopburi
Chonburi
Ubon
Ratchatha
Yasotho
Nakhon Ratchasima
Phitsanulok
Suphanburi
Ayutthaya
Nakhom Pathom
Pathumthani
Bangkok ChachoengsaoSamut
Prakan
Samut
Sakhon
Samut Songkham
Petchburi
Songkhla
Number of feed mills:
shrimp
tilapia
prawn striped catfish

71
which later established a fully vertical integrated system for poultry and swine. Their
aquaculture feed business came much later, in the mid- 2000, producing mainly feeds for
Nile and red tilapia (The Nation, 2007). In fact nearly all the feed mills started their feed
manufacturing business as animal feed producers then evolved into vertically integrated
operations for livestock production such as for poultry and swine before diversification
into aquatic animal feeds. When they entered the aquaculture business, they followed
this same pattern of vertical integration (from feed, seed, production, processing and
marketing).
Table 3. 2 Number of aquatic feed mills and their original activities
Years
established
Years started
as animal feed
producer
Years
started with
aquafeed
Started
aquafeed
production
Current products
>20 years 6 4 1988 - 2006 Livestock feed, fish and
shrimp feed, livestock
production, aquaculture,
food processing, exports
<20 years 2 2 1999 - 2000 Shrimp and fish feed,
livestock feed, processing,
additives, equipment,
exports
Source: Scoping survey, 2010
The decade following the establishment of Betagro company saw the establishment of
other companies, such as Cargill Siam, Centaco, Grobest and Laemthong. As with Betagro,
these companies did not start as aquatic feed manufacturers outright (except for
Grobest), but as animal feed manufacturers, livestock producers, and agricultural food
processors. In 1978, Charoen Pokphand company was established, manufacturing and
72
distributing animal feeds initially in the south of Thailand. It later on expanded into agro-
industry and the food production business, mainly in livestock and aquaculture, as fully
integrated operations, from feed raw material procurement, feed manufacture and
distribution, animal breeding, animal farming, meat processing, and manufacturing of
food products from meat (CPF, 2008).
As part of general agricultural development and the intensification of livestock systems
especially poultry, more feed mill companies were established in the 1980s through the
1990s until 2000, the last year reported for a feed mill becoming established, although
some established companies continue to set-up new plants even in 2006-2007. Through
the years these companies expanded into aquaculture feed manufacturing as
opportunities and species diversity of the aquaculture sector grew , increasing availability
and competitiveness of the sector with different brands competing on price and service,
and contributing to the continued ‘immanent’ development of Thai aquaculture (Belton &
Little 2011). In addition, the intensification of aquaculture systems further fuelled
demand for commercial formulated feeds.
Feed mill operations could be a starting point of upgrading activities of companies which
move up the value chain, or a result of upgrading from other agricultural and fishery
operations. This is one example of upgrading where operations upgrade with the aim of
obtaining more returns by producing items with added value or changing to more
profitable activities (Bolwig et al., 2010). One of the feed mill companies belonging to the
Apitoon Group of seafood companies (established in 1975), primarily producing and
processing surimi and other marine food products from their fisheries operations, went
73
into fish meal processing to utilise processing fish by-products and wastes (Apitoon
Group, 2002). Being a producer of premium grade fish meal, they considered it natural
to branch out into fish and shrimp feed manufacturing, including other livestock feeds,
and shrimp and finfish aquaculture to ensure stable supply for their processing business
(Apitoon Group, 2002). Similarly upgrading and more diversified operations occurred with
the Thai Union Group, with their first manufacturing company for tuna established in
1973, then frozen seafood processing and export started in 1988, and feed mill in 2000.
Thai Union Group is considered Thailand’s largest canned and frozen seafood producer,
with business interests in many parts of the world (Thai Union Group, 2012).
The development or evolution of animal feed manufacturers and livestock producers into
aquatic feed manufacturers and aquaculture producers, processors and even exporters
reflected the fact that the aquaculture industry was growing and becoming more
important (McIntosh 2008b). In addition, higher margins from these operations compared
to terrestrial livestock feeds were possible since aquafeeds tended to be of higher quality
and required higher processing costs, for example to achieve water stability. Companies
that ventured into this type of expansion also became vertically integrated to ensure full
management control of operations and supplies in all phases of operations.
A few of the aquatic feed mill companies established in the latter part of the expansion
era did not have a history of livestock feed production in Thailand but rather had
specialized in aquatic feed production in other countries in the region. Stand-alone feed
mill companies, i.e. those which did not have their own growout operations, would tend
74
to enter into contract agreements with growout farms, to sell their feeds and provide
after sales technical assistance.
The wide range of feeds in the market has led to intense competition with significant
choice for farmers although the rising cost of raw materials and, inevitably that for
formulated feeds are major constraints for the feed manufacturers and farmers,
respectively (Satapornvanit et al., 2011).
3.5. Importance of seafood processing capacity
Thailand has been supplying processed food to the global market for more than 20 years
and the success in the export of processed agricultural food products has been attributed
to the growing confidence international consumers have in Thailand to produce quality
food products, including frozen shrimp (Sukphisit, 2010).
Thailand has more than 200 seafood processing plants with about 160 of them exporting
the target seafood species of this research (TFFA, 2010b). The combined capital of at least
128 factories is nearly 30,000 M Thai Baht, ranging from 1 to 8,000 M Thai Baht (TFFA,
2010b) (US$ 1 = 30 Thai Baht in 2010). Most processing plants are located in Samut
Sakhon and Samut Prakarn provinces near Bangkok, and in Songkhla in the south (Figure
3.12). Songkhla province continues to be one of the main centres for capture fisheries,
with the greatest, and increasing, number of registered fishing boats (up to 21% of
national fleet in 2011) although in terms of tonnage in 2011, it only ranked 7th since most
(88%) of the boats were of smaller size (<14 m) (DOF, 2013a). Songkhla port is also one of
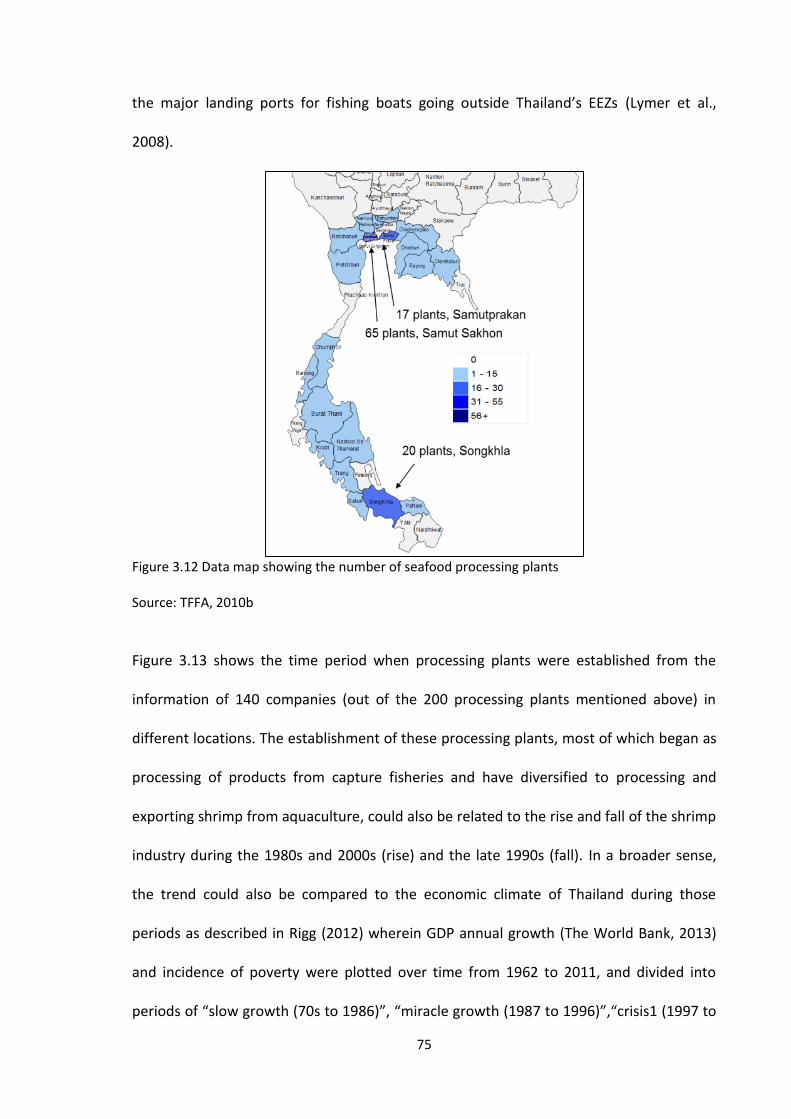
75
the major landing ports for fishing boats going outside Thailand’s EEZs (Lymer et al.,
2008).
Figure 3.12 Data map showing the number of seafood processing plants
Source: TFFA, 2010b
Figure 3.13 shows the time period when processing plants were established from the
information of 140 companies (out of the 200 processing plants mentioned above) in
different locations. The establishment of these processing plants, most of which began as
processing of products from capture fisheries and have diversified to processing and
exporting shrimp from aquaculture, could also be related to the rise and fall of the shrimp
industry during the 1980s and 2000s (rise) and the late 1990s (fall). In a broader sense,
the trend could also be compared to the economic climate of Thailand during those
periods as described in Rigg (2012) wherein GDP annual growth (The World Bank, 2013)
and incidence of poverty were plotted over time from 1962 to 2011, and divided into
periods of “slow growth (70s to 1986)”, “miracle growth (1987 to 1996)”,“crisis1 (1997 to

76
2002)” and “crisis2 (2008 to 2011)”. The 6 plants established in 1996 were processing not
only shrimp but also prawn and tilapia due to a rising demand for these species in the
export markets at that time.
Figure 3.13 Establishment of processing plants and GDP % growth in Thailand
Source: TFFA, 2010b; The World Bank, 2013 (processing plants n=140)
Of the three provinces, a great majority of processing plants and other fishery industrial
activities are located in the province of Samut Sakhon, at the mouth of the Tha Chin River,
which is a tributary of the Chao Phraya River, emptying into the Gulf of Thailand. Along its
coast are many fields being used for sea salt production, which played a role in the origins
of shrimp farming in the country, whereby people would allow or stock shrimp PLs into
the ponds (Hossain and Lin, 2001). The province’s former name was Tha Chin, which
means “Chinese port”, because it was a commercial trading port between the Thais and
the Chinese traders who came in their Chinese ships or junks; the port was established
commercially in 1548 (TAT, 2008). Its proximity to Bangkok (distance, 30 km) and the sea
-15
-10
-5
0
5
10
15
0
1
2
3
4
5
6
7
8
9
10
19
661
967
19
681
969
19
701
971
19
721
973
19
741
975
19
761
977
19
781
979
19
801
981
19
821
983
19
841
985
19
861
987
19
881
989
19
901
991
19
921
993
19
941
995
19
961
997
19
981
999
20
002
001
20
022
003
20
042
005
20
062
007
GD
P %
gro
wth
Nu
mb
er o
f p
roce
ssin
g p
lan
ts
Number of processing plants established GDP % growth
77
(distance, 2 km) makes it an ideal location for businesses and industries related to
fisheries and shipping. The urbanisation of Bangkok in the mid-1980s to early 1990s
spilled over to the neighbouring provinces including Samut Sakhon, one of the five
provinces around Bangkok considered as the Bangkok Metropolitan Region (BMR),
although their governance is still under the jurisdiction of their respective provincial and
local governments and not under the Bangkok Metropolitan Administration (BMA)
(Davivongs et al., 2012; Kritsanaphan and Sajor, 2011; Rigg, 2012; Trethanya and Perera,
2009). The other four provinces in the BMR are Nakhon Pathom, Nonthaburi,
Pathumthani and Samut Prakarn.
These conditions led to rapid urbanisation in this province which resulted in a good basic
infrastructure such as better roads, communication and irrigation canal systems. In the
past the canal river system was the main commercial transportation system connecting
people especially traders to many areas. Previously, the sources of livelihood of the
people there were salt making, charcoal production, fishery and boat making, and
agriculture (Parks, 2012). Many industrial and food companies and factories were
established in this province from the 1980s onwards due to its proximity to the seaport
and city centre. More than 1,000 ships dock in this province for trading, loading and
unloading of goods. This province is also the wholesale seafood center for landing,
auction/selling, processing and exporting, even for production of feeds and farming of
shrimp and fish. The Mahachai Talay Thai Market, an auction wholesale market for
seafood coming from the nearby fish landing port as well as for shrimp and other finfish
from many provinces in Thailand, is located here. It is considered one of the biggest
seafood markets in the region. The province continues to be an important location for the
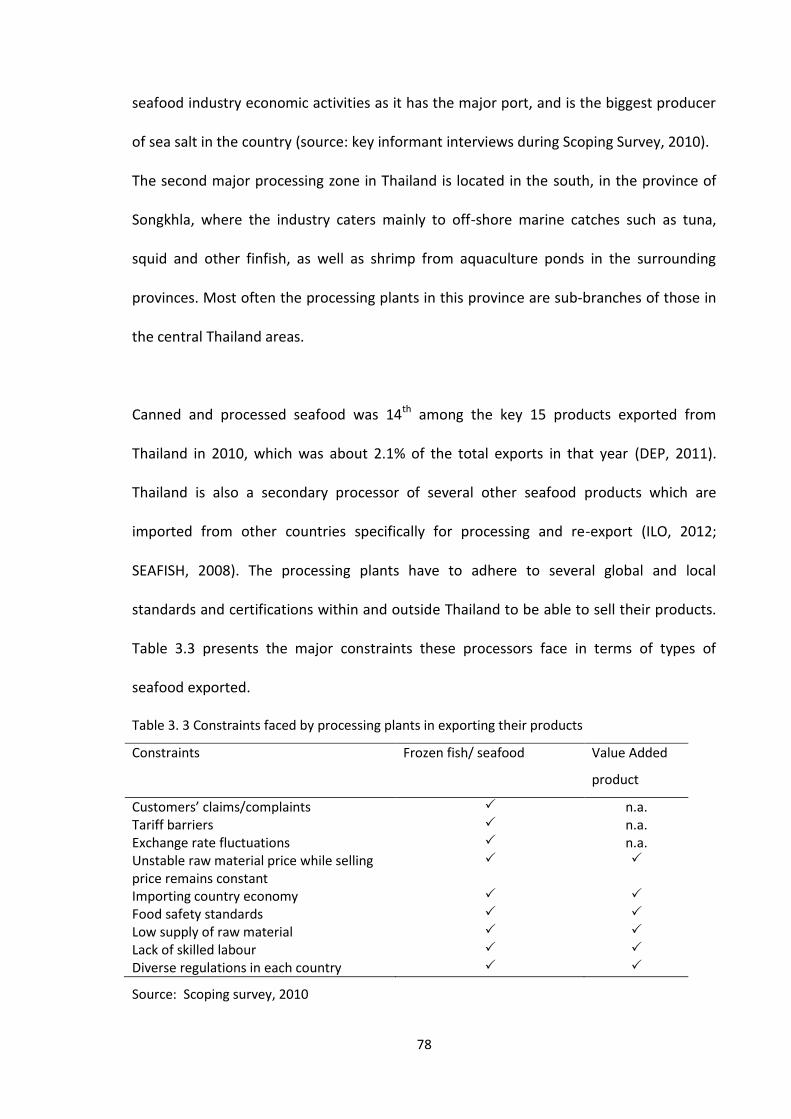
78
seafood industry economic activities as it has the major port, and is the biggest producer
of sea salt in the country (source: key informant interviews during Scoping Survey, 2010).
The second major processing zone in Thailand is located in the south, in the province of
Songkhla, where the industry caters mainly to off-shore marine catches such as tuna,
squid and other finfish, as well as shrimp from aquaculture ponds in the surrounding
provinces. Most often the processing plants in this province are sub-branches of those in
the central Thailand areas.
Canned and processed seafood was 14th among the key 15 products exported from
Thailand in 2010, which was about 2.1% of the total exports in that year (DEP, 2011).
Thailand is also a secondary processor of several other seafood products which are
imported from other countries specifically for processing and re-export (ILO, 2012;
SEAFISH, 2008). The processing plants have to adhere to several global and local
standards and certifications within and outside Thailand to be able to sell their products.
Table 3.3 presents the major constraints these processors face in terms of types of
seafood exported.
Table 3. 3 Constraints faced by processing plants in exporting their products
Constraints Frozen fish/ seafood Value Added
product
Customers’ claims/complaints n.a. Tariff barriers n.a. Exchange rate fluctuations n.a. Unstable raw material price while selling price remains constant
Importing country economy
Food safety standards
Low supply of raw material
Lack of skilled labour
Diverse regulations in each country
Source: Scoping survey, 2010

79
Processing plants have varying capacities to produce products for export as well as for the
domestic markets, depending on orders. Table 3.4 shows the standard classification of
exports according to species, used for tilapia, shrimp and prawn, and catfish (not
specified in terms of species of catfish) (FAO, 2014; TFFA, 2014; Thai Customs
Department, 2014). However product differentiation may be more specific according to
processors, classifying products as whole round, gutted (gilled)/head-on, gutted/shell-
on/head-off, fillet/shell-head-off, value added/cooked (Thai Union Group, 2014).
Table 3. 4 Classification of forms of exports by species
Forms exported Tilapia Shrimp &
prawn
Catfish
Fresh or chilled
Frozen
Fillets, fresh or chilled x
Fillets, frozen x
Steaks, frozen x x
Dried, salted or in brine x x
Live x x
Not frozen x x
Prepared or preserved, in airtight containers x x
Prepared or preserved, not in airtight containers x x
Source: FAO, 2014; TFFA, 2014; Thai Customs Department, 2014
The majority of processing plants deal with shrimp and prawn for export (Table 3.5),
whereas there are also some processing plants for both shrimp and tilapia, as well as a
combination of other species. There is some confusion in the literature especially because
the terms “shrimp” and “prawn” are used interchangeably, as in Table 3.5 from the list of
processing plants. Thus “prawn” could refer mostly to shrimp as used by the processing
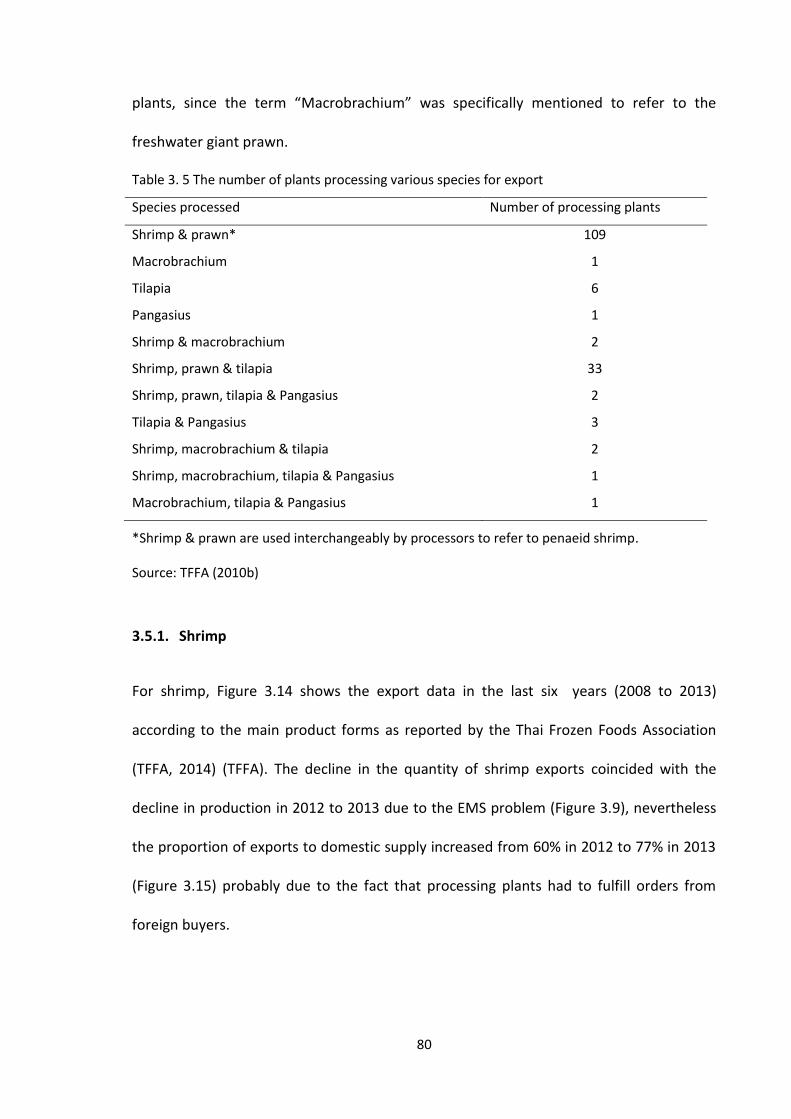
80
plants, since the term “Macrobrachium” was specifically mentioned to refer to the
freshwater giant prawn.
Table 3. 5 The number of plants processing various species for export
Species processed Number of processing plants
Shrimp & prawn* 109
Macrobrachium 1
Tilapia 6
Pangasius 1
Shrimp & macrobrachium 2
Shrimp, prawn & tilapia 33
Shrimp, prawn, tilapia & Pangasius 2
Tilapia & Pangasius 3
Shrimp, macrobrachium & tilapia 2
Shrimp, macrobrachium, tilapia & Pangasius 1
Macrobrachium, tilapia & Pangasius 1
*Shrimp & prawn are used interchangeably by processors to refer to penaeid shrimp.
Source: TFFA (2010b)
3.5.1. Shrimp
For shrimp, Figure 3.14 shows the export data in the last six years (2008 to 2013)
according to the main product forms as reported by the Thai Frozen Foods Association
(TFFA, 2014) (TFFA). The decline in the quantity of shrimp exports coincided with the
decline in production in 2012 to 2013 due to the EMS problem (Figure 3.9), nevertheless
the proportion of exports to domestic supply increased from 60% in 2012 to 77% in 2013
(Figure 3.15) probably due to the fact that processing plants had to fulfill orders from
foreign buyers.
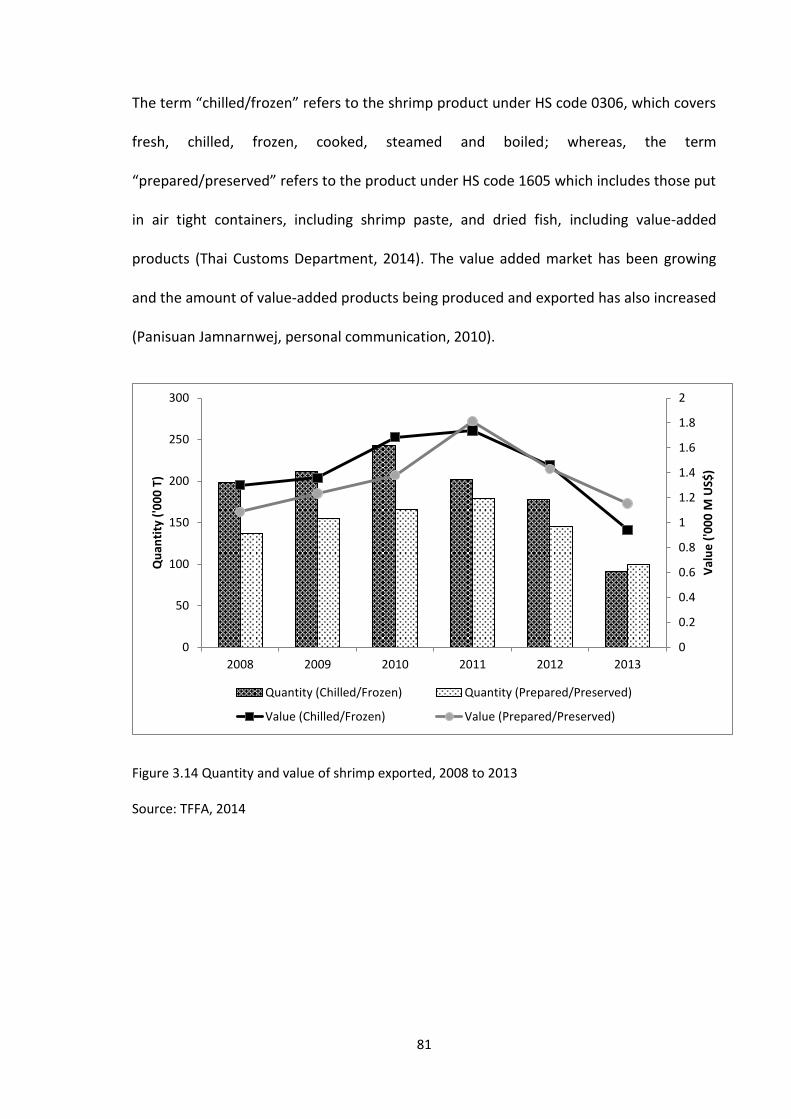
81
The term “chilled/frozen” refers to the shrimp product under HS code 0306, which covers
fresh, chilled, frozen, cooked, steamed and boiled; whereas, the term
“prepared/preserved” refers to the product under HS code 1605 which includes those put
in air tight containers, including shrimp paste, and dried fish, including value-added
products (Thai Customs Department, 2014). The value added market has been growing
and the amount of value-added products being produced and exported has also increased
(Panisuan Jamnarnwej, personal communication, 2010).
Figure 3.14 Quantity and value of shrimp exported, 2008 to 2013
Source: TFFA, 2014
0
0.2
0.4
0.6
0.8
1
1.2
1.4
1.6
1.8
2
0
50
100
150
200
250
300
2008 2009 2010 2011 2012 2013
Val
ue
('0
00
M U
S$)
Qu
anti
ty (
'00
0 T
)
Quantity (Chilled/Frozen) Quantity (Prepared/Preserved)
Value (Chilled/Frozen) Value (Prepared/Preserved)

82
Figure 3.15 Proportion of shrimp production for domestic and export markets, 2008 to 2013
Source: FAO (2014); TFFA (2014)
3.5.2. Tilapia
Tilapia is exported from Thailand as both whole frozen fish and fillet. The important
markets for tilapia fillets are USA, Europe and the Middle East; whereas for whole frozen
tilapia, Europe (esp. France, United Kingdom and the Netherlands) and the Middle East
are the main markets. The main competitor of Thailand in tilapia exports is China,
considered the top global producer (1x10⁶ tons in 2009) and exporter (2x10⁵ t) of tilapia
(Bamreurak, 2010), and recently exporting 21.5% of its 258,000 mt production (Towers,
2013). Thailand is also exporting tilapia to some Asian countries namely Japan, Taiwan
and the Philippines (both fillet and frozen whole). The major constraints facing processors
in relation to tilapia are the quality (muddy/off-flavour and chemical/antibiotic residues)
and quantity (enough supply of raw material of the right size as per orders) (Fegan and
Fitzsimmons, 2008; Yamprayoon and Noomhorn, 2003).
0%
10%
20%
30%
40%
50%
60%
70%
80%
90%
100%
2008 2009 2010 2011 2012 2013
exports domestic
83
3.5.3. Pangasius
With excellent processing facilities, it would have been easier to integrate processing of
striped catfish into frozen fillets if the processors could get enough raw material of a
certain quality i.e. white flesh which the global market requires. However, in Thailand, the
problem of yellow colouration of striped catfish flesh remains a constraint as this has a
significantly lower value in export markets, thus Vietnam which could produce a better
quality flesh has a comparative advantage (Belton et al., 2011). Striped catfish remains as
a cheap fish in the local markets, partly due to the way they are cultured in ponds
especially in terms of feeding management (Payooha, 2002).
CPF found that there is very low value of striped catfish produced in Thailand, thus they
could not sell it as a value-added fish fillet. CPF has already achieved the level of quality
the market so desires for striped catfish after intensive research, yet due to its low value
in Thailand, CPF plans to set-up a farm and processing plant in Vietnam for processing
to obtain a higher price for processed striped catfish (Wara Taparhaudee, personal
communication, 2011). This company already has a presence in Vietnam in feed
processing.
The result of this effort is that Pangasius fillet is now imported into Thailand and available
in the local supermarkets as well as in CPF food markets. According to Pangasius Vietnam
News (2013), Thailand exports of Pangasius fillets have been decreasing, pointing to the
increasing value of the Thai baht against the US dollar and the lack of orders as reasons
for Thai processors to reduce or stop production. On the other hand, imports of Pangasius
84
fillets from Vietnam into Thailand have been increasing, with Thailand ranking 2nd among
ASEAN importers of Vietnamese Pangasius (2.5% of Vietnamese exports) (Pangasius
Vietnam News, 2013)
In Thailand the price of striped catfish with white meat is not different from that of the
yellow meat striped catfish (Jesada Is-Haak, personal communication, 2011), i.e. it is not
differentiated. The case of Pangasius in Thailand is a clear example of an early adopter
‘losing out’ to late entrants who have developed export markets strategically and in
response to necessity, thus when the Vietnamese faced trade barriers in their main
export market, the USA, they rapidly developed alternative markets in the EU (Belton et
al., 2011).
A number of studies on Pangasius concentrated on genetic mapping and improvement for
better breeding performance (Na-Nakorn & Moeikum 2009; Kanlapapuk 2010); however,
research efforts should be made to increase competitiveness of Thai-produced striped
catfish in both domestic and foreign markets to increase the value of good quality meat,
encourage growers to invest more and for the industry to capitalize more on the growing
demand for it. Likewise the perception of Pangasius as a cheap, low quality fish has to be
changed to be able to demand a higher price in the market, and this will involve social
marketing in addition to better culture management skills and financial strategy. However
given the way Vietnam produces their Pangasius, and the volume being produced,
Thailand might not be able to compete still.
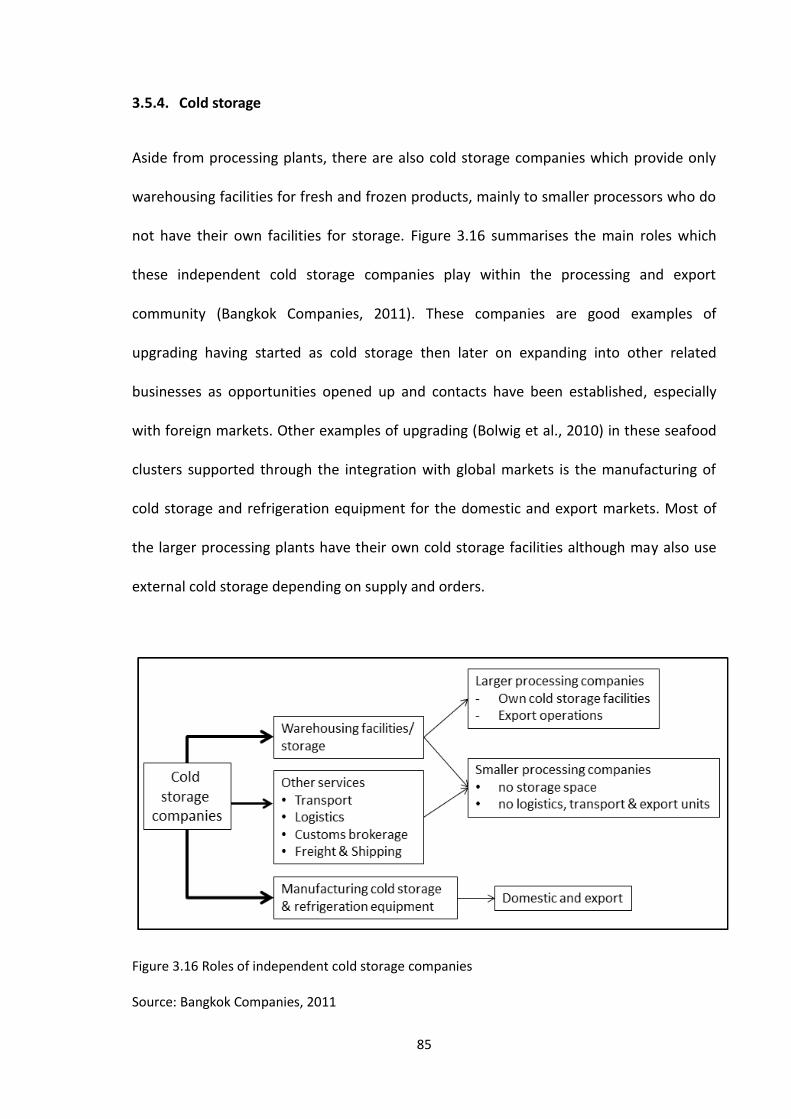
85
3.5.4. Cold storage
Aside from processing plants, there are also cold storage companies which provide only
warehousing facilities for fresh and frozen products, mainly to smaller processors who do
not have their own facilities for storage. Figure 3.16 summarises the main roles which
these independent cold storage companies play within the processing and export
community (Bangkok Companies, 2011). These companies are good examples of
upgrading having started as cold storage then later on expanding into other related
businesses as opportunities opened up and contacts have been established, especially
with foreign markets. Other examples of upgrading (Bolwig et al., 2010) in these seafood
clusters supported through the integration with global markets is the manufacturing of
cold storage and refrigeration equipment for the domestic and export markets. Most of
the larger processing plants have their own cold storage facilities although may also use
external cold storage depending on supply and orders.
Figure 3.16 Roles of independent cold storage companies
Source: Bangkok Companies, 2011

86
Samut Sakhon is the main location of cold storage warehouses, where the majority of fish
and other seafood products are landed, stored, processed, packaged and eventually
distributed. There are nearly 50 cold storage companies with a varying range of activities
as in Table 3.6.
Table 3. 6 Number of cold storage facilities and scope of activities
Type of activity Number Remarks
Cold storage (warehouse, storage) 23 One company has cold storage space of nearly 1200 m2 at -5 to +10°C, humidity 70-90%; refrigerated space is 774 m2 at -15 to -30°C
Cold storage, food processing 18 Food processed are shrimp, prawn, freshwater & marine fish & other aquatic species, agricultural products, semi-processed food
One company has capacity of 4,000 t frozen seafood and 1,000 t shrimp; another company has capacity of 18,096 t frozen seafood
Cold storage, customs brokers/agents, freight & shipping, transportation, material handling, logistics
2 Includes warehousing, customs clearance, inland transportation, through transportation by sea/land, temperature controlled transport, packaging
Manufacturing equipment, building materials, insulation, container services
4 Insulated roofing and panel systems, expandable polystyrene foam, refrigerator spare parts, 20 and 40-footer refrigerated marine containers (also rental), metal products
Source: Bangkok Companies (2011)
3.6. Inter-sectoral learning
Sustainability in aquaculture does not only mean knowledge about the technical aspects
of growing aquatic species and its impact to the environment, but also awareness of the
human side such as social networking and cultural relationships that go with it (Lebel et
al. 2009). The establishment of farmer associations and clubs by the producers

87
themselves in the late 1990s created a “seminar culture” among the stakeholders, as
regular events brought them together to share knowledge, give advice, promote
innovative technologies and exchange information, as well as establish a level of trust
among stakeholders (Lebel et al. 2009).
Other aquaculture associations such as for freshwater aquaculture or national level
associations have also been set-up by producers and relevant stakeholders, and efforts
have been made to bring stakeholders together in a similar format as that for shrimp. For
example, the Thai Aquaculture Association organises meetings with farmers to discuss the
potential for tilapia export, with cooperation from the government DOF, the Thai Frozen
Foods Association, and input providers, who would share information on latest trends
and other technical issues.
Costs of these meetings were borne by various sources, such as company sponsorships,
registration fees of participants, and club membership fees. Participants who attended
could be both members and non-members, and registration fees were charged to cover
expenses for venue, meals, and materials.
Thus the development of the aquaculture industry in Thailand is not a stand-alone effort.
Its development and intensification are linked with other developments in other sectors,
such as in the animal feed production and vertical integration of companies, the growth in
other sectors both in the community and national levels, as well as involvement in the
global trade of other products and industry (Belton & Little 2008). Due to globalization
Thai producers and entrepreneurs have become more aware of and exposed to what the
88
market wants, and have adjusted their operations accordingly. Some companies such as
Charoen Pokphand are industry leaders in technological innovation to improve efficiency
and sustainability (McIntosh, 2008a). This has involved investment in infrastructure to
improve biosecurity, and seed quality (through the introduction of SPF and PCR testing).
In addition, producers are now eager to understand what happens to their products after
reaching overseas markets, such as how their products are presented and marketed
(Satapornvanit et al. 2011).
Internally, the industry has learned from its experience with the boom and bust of the
black tiger prawn period that was linked to factors such as disease outbreaks,
indiscriminate use of chemicals especially antibiotics for treating disease rather than
prevention, and complete disregard of the environment and other issues for economic
gain especially foreign exchange earnings (Lebel et al., 2010; Lebel et al., 2009). Thus,
efforts within and outside Thailand for a better and more sustainable aquaculture
practice have prompted the industry (led by the DoF and the private sector) to a rethink
of the whole system for shrimp initially, and for other species eventually.
The Food Safety Year in 2004 declared by the Thai Government strengthened the food
safety control programmes for food and agricultural commodities (Yamprayoon and
Sukhumparnich, 2010). Furthermore, the policy for food safety and good traceability
system is linked with the “Kitchen of the World” initiative of Thailand supported by
government and private entities (CPF, 2012; Thai Union Group, 2014). The Thai
Government through the relevant ministries adopted this as a policy, recognising their
responsibility and mandate to take the lead in establishing and implementing regulatory

89
mechanisms for the industry to thrive under international pressure (Yamprayoon and
Sukhumparnich, 2010). As a result, for the shrimp industry initially, registrations,
movement documents and checking as part of the traceability systems have been put in
place, with the private sector cooperating and even going beyond regulatory
requirements by engaging with foreign buyers and consumers as well as 3rd party
certifiers (Yamprayoon and Sukhumparnich, 2010).
Even though it has been reported that local communities and local governments can be
effective regulators of aquaculture activities such as shrimp farming, and that external
certification mechanisms are detached due to its non-participatory approach in its
formulation (Vandergeest, 2007), there is still a lack of awareness and trust among buyers
and consumers in importing countries of local regulating mechanisms which are not
endorsed by global or 3rd party institutions and companies (Satapornvanit et al., 2011).
A key element of experience of the Thai aquaculture industry has been the success of
domesticated broodstock, in the case of L. vannamei, where disease management was
found to be easier (Lebel et al. 2010) than obtaining broodstock from the wild. So in the
case of M. rosenbergii broodstock, the industry is being cautious in bringing in broodstock
from other countries such as Bangladesh (Wara Taparhudee, personal communication,
2011). It is ironic that since in the early 1990s, Thailand had given a number of broodstock
to Bangladesh where freshwater prawn is also a native species there (New 2010).
The value of interactions among different stakeholders, through the benefits gained by
exchange of ideas and networking was confirmed in a stakeholder meeting held to
90
triangulate early research findings about the sector (Satapornvanit et al. 2011). Vertical
and horizontal business relations between the producers and different levels of sellers
and buyers of their products, i.e. input providers, processors, exporters and overseas
buyers are crucial for business negotiations and building trust (Lebel et al. 2009).
The Thai aquaculture industry led by actors within the shrimp industry has sought to
regain the trust of buyers in its product quality through the efforts of the Government,
producers, processors and other stakeholders in compliance of food safety regulations
and standards. However, many are still of the opinion that local food safety standards are
unknown to outside buyers and consumers, thus the producers have to comply with
global albeit more expensive certification standards. Small-scale producers could be at a
disadvantage in terms of compliance to these standards due to their insufficient
economic and technical capability (Wilkings, 2012). The Thai DoF has set-up a unit called
the Aquaculture Development and Certification Center (ADCC), which will provide
certification according to international standards ISO/IEC Guide 65 accreditation, giving
an alternative certification to farmers which is less complex (DOF, 2013c).
3.7. Seafood intrinsic qualities and issues for domestic and export
According to the Economics Division Report (Economics-DOF, 2011), the culture of striped
catfish in Thailand is big business but the whitish-yellow flesh is not acceptable for the
export market. In the domestic market, it is sold in both wet markets and supermarkets,
as whole fish or cut into steaks, as well as being processed into fish balls. Interestingly
there are frozen Pangasius fillets and steaks from Vietnam which are sold in the
supermarkets as well. The same Economics Division Report (Economics-DOF, 2011)
91
suggested that DOF should research more on how to achieve white flesh and come up
with a feed formulation to produce white fish flesh. Considering that it is already known
how to achieve white fish flesh through feeds and intensive water exchange (Vietnam)
(Phan et al., 2009), it may be more beneficial to conduct a research on how to achieve
white flesh under conditions of limited water exchange since this is more likely the issue
in Thailand or to enhance ways to add value through post-harvest processing to the
current quality of farmed catfish. From the same report (Economics-DOF, 2011) it was
stated that smoked Pangasius is an indigenous product in Thailand that has not been
promoted and that strategies to add value in this and other ways require development.
The key question about Pangasius in Thailand is why there is a lack of interest or progress
toward an export industry, given that historically it was considered a high value
commodity from the wild and produced in cages, then became a low value farmed
species in ponds. Pond culture of Pangasius in peri-urban areas utilised agro-industrial by
products and waste food from eating establishments, which led to lower quality flesh
which fetched lower prices than other fish species in the market (Payooha, 2002).
Reasons for its slow uptake for global market production include a limited area for
intensification due to cost as ponds have to be dug deeper, and more resources required
for feeding and water usage. In the Vietnamese experience, water is important in
Pangasius farming, in terms of the quantity and efficiency of use (Phan et al., 2011).
Thailand has a large number of water bodies but there are other competing activities to
utilise available water resources (Falvey, 2000), and factor in the changes in weather
patterns leading to droughts and floods, water has become a much more valuable
resource. So this will be a challenge especially for Pangasius production systems, as well
92
as for the whole aquaculture industry, to use water efficiently to produce better quality
seafood.
Creating a niche market such as organic Pangasius may have potential but alternative
strategies include further development of value-added products through Thailand’s
innovative and well developed seafood processing industry.
Macrobrachium rosenbergii was traditionally known as king prawn in Thailand, especially
because of their larger size (500 g) compared with other river prawns (Sukphisit 2011).
Freshwater prawns were considered superior to marine shrimp for many Thai dishes and
their popularity keeps local market demand strong. The head which has a high fat content
is sought after for its creamy taste when cooked in a soup. Thus the whole prawn is
eaten, and with the head nearly 50% of the whole body size it is not economically viable
as an export product where heads are usually removed prior to processing.
“The qualities that give river prawns their reputation as the best of the best
are their firm meat and delicate flavour with no fishy odour. The head is filled
with the orange prawn fat that is highly esteemed in Thai cuisine for its
delectable flavour. Its aroma is said to have a stimulating effect on the
appetite.” – Suthon Sukphisit, Simply Irresistible: Jumbo Prawns & Shrimps,
http://www.TATnews.org (Sukphisit, 2011).
The high overall product value domestically, compared to its processed value for export,
is a key reason for the lack of export development despite having been cultured in
93
Thailand for more than 30 years. Prices for prawn compared to shrimp remain highly
differentiated locally. In 2012, wholesale market price of live freshwater giant prawn
ranged from 235 Baht/kg (>20pcs/kg) to 418 Baht/kg (13-14 pcs/kg), whereas for chilled
product, the wholesale market price ranged from 135 Baht/kg (25-40 pcs/kg) to 304
Baht/kg (13-14 pcs/kg) (DOF-Economics, 2013). In terms of unit area, however the value
of shrimp is almost three times higher than prawn (US$ 4,407.20/rai versus
US$1,511.50/rai, 2008 data, 1 rai=1600 m2) reflecting the much higher intensity of
production in the former and explaining its popularity among farmers. These figures are
based on the total value of production of each species and the total production area
(DOF, 2010c).
With more than 80% of production of freshwater giant prawn sold in the domestic market
and the potential for exports, the production is not enough to meet the demand for both
domestic and export markets. The stagnation in growth could be due to the production
sector facing problems such as genetic deterioration leading to slow growth and disease,
as well as factors related to techniques and economics (Chareontawee and Poompuang,
2007; New, 2005; Schwantes et al., 2009; Whangchai et al., 2007). The cannibalistic
nature of prawns is certainly a limitation to intensification with a higher stocking density
so it will be more likely to be in lower density monoculture and/or polyculture systems.
There have been reports on freshwater prawn exports, such as those by Singholka et al.
(1980) and (FAO, 2014). Exports were increasing from 2002 (2,099 t valued at 514 M
Baht) to 2006 (8,087 t valued at 1,712 M baht) then it decreased in 2007 (2,099 t valued
at 486 M Baht) and 2008 (1,837 t valued at 392 M Baht) and increased slightly in 2009
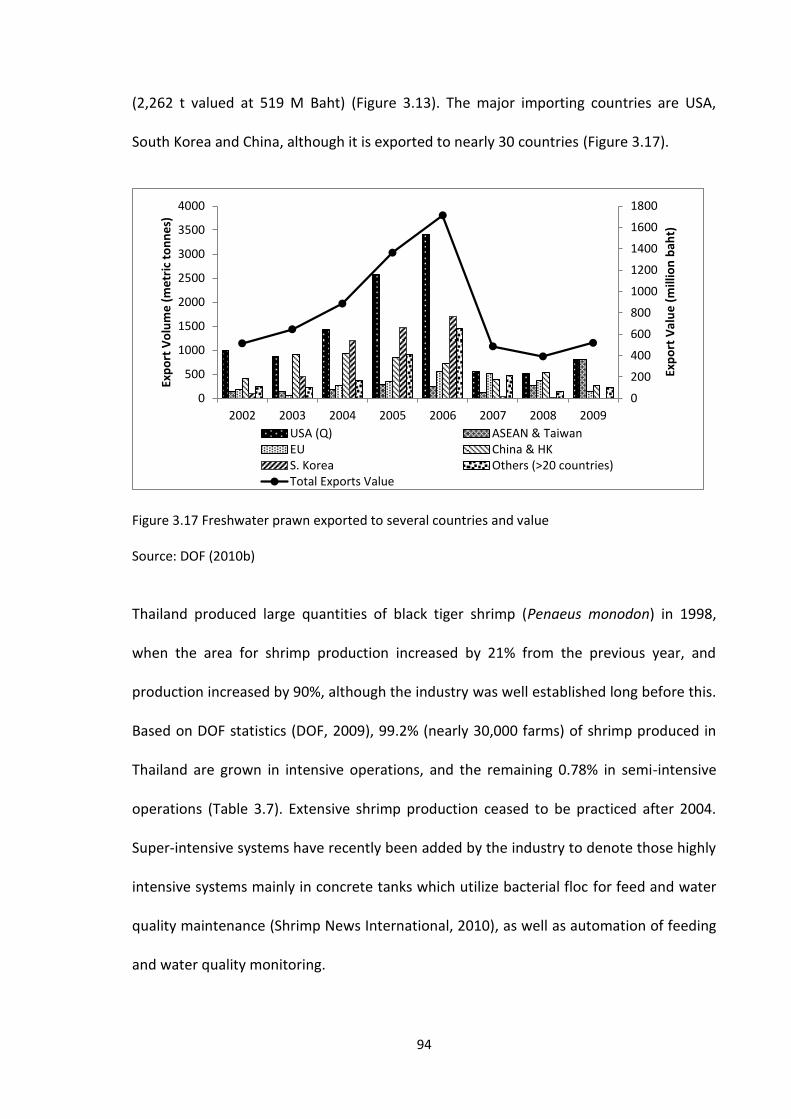
94
(2,262 t valued at 519 M Baht) (Figure 3.13). The major importing countries are USA,
South Korea and China, although it is exported to nearly 30 countries (Figure 3.17).
Figure 3.17 Freshwater prawn exported to several countries and value
Source: DOF (2010b)
Thailand produced large quantities of black tiger shrimp (Penaeus monodon) in 1998,
when the area for shrimp production increased by 21% from the previous year, and
production increased by 90%, although the industry was well established long before this.
Based on DOF statistics (DOF, 2009), 99.2% (nearly 30,000 farms) of shrimp produced in
Thailand are grown in intensive operations, and the remaining 0.78% in semi-intensive
operations (Table 3.7). Extensive shrimp production ceased to be practiced after 2004.
Super-intensive systems have recently been added by the industry to denote those highly
intensive systems mainly in concrete tanks which utilize bacterial floc for feed and water
quality maintenance (Shrimp News International, 2010), as well as automation of feeding
and water quality monitoring.
0
200
400
600
800
1000
1200
1400
1600
1800
0
500
1000
1500
2000
2500
3000
3500
4000
2002 2003 2004 2005 2006 2007 2008 2009
Exp
ort
Val
ue
(m
illio
n b
aht)
Exp
ort
Vo
lum
e (
me
tric
to
nn
es)
USA (Q) ASEAN & TaiwanEU China & HKS. Korea Others (>20 countries)Total Exports Value
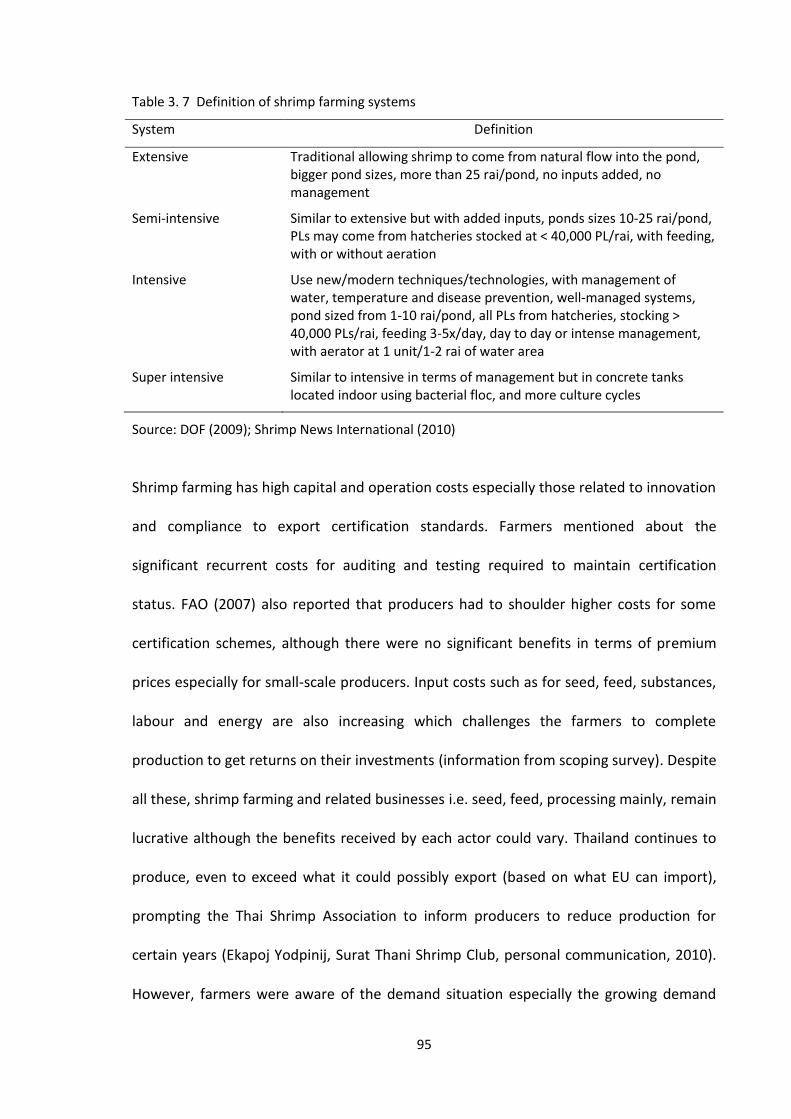
95
Table 3. 7 Definition of shrimp farming systems
System Definition
Extensive Traditional allowing shrimp to come from natural flow into the pond, bigger pond sizes, more than 25 rai/pond, no inputs added, no management
Semi-intensive Similar to extensive but with added inputs, ponds sizes 10-25 rai/pond, PLs may come from hatcheries stocked at < 40,000 PL/rai, with feeding, with or without aeration
Intensive Use new/modern techniques/technologies, with management of water, temperature and disease prevention, well-managed systems, pond sized from 1-10 rai/pond, all PLs from hatcheries, stocking > 40,000 PLs/rai, feeding 3-5x/day, day to day or intense management, with aerator at 1 unit/1-2 rai of water area
Super intensive Similar to intensive in terms of management but in concrete tanks located indoor using bacterial floc, and more culture cycles
Source: DOF (2009); Shrimp News International (2010)
Shrimp farming has high capital and operation costs especially those related to innovation
and compliance to export certification standards. Farmers mentioned about the
significant recurrent costs for auditing and testing required to maintain certification
status. FAO (2007) also reported that producers had to shoulder higher costs for some
certification schemes, although there were no significant benefits in terms of premium
prices especially for small-scale producers. Input costs such as for seed, feed, substances,
labour and energy are also increasing which challenges the farmers to complete
production to get returns on their investments (information from scoping survey). Despite
all these, shrimp farming and related businesses i.e. seed, feed, processing mainly, remain
lucrative although the benefits received by each actor could vary. Thailand continues to
produce, even to exceed what it could possibly export (based on what EU can import),
prompting the Thai Shrimp Association to inform producers to reduce production for
certain years (Ekapoj Yodpinij, Surat Thani Shrimp Club, personal communication, 2010).
However, farmers were aware of the demand situation especially the growing demand
96
from China for more shrimp, and farmers would continue to produce to meet the
requirements from the processing and export companies (Banjong Nissapavanich, Eastern
Thai Farmers’ Association, personal communication, 2010). Furthermore, the capacity of
Thailand to produce shrimp was 500,00 T which was already achieved, but farmers would
continue to produce despite this as they thought they could earn more. Thus it was
suggested that DoF should legislate a law regarding production ceilings and regulate the
implementation (B. Nissapavanich, personal communication, 2010).
Tilapia has been regarded as promising to become the second most important
aquaculture species in Thailand next to shrimp (Bhujel & Woollard 2011). Although it is
now the top producing freshwater species with nearly 300,000 t annual production, a
mere 10 % is exported (DOF, 2010a; FAO-FishStatJ, 2011). The expansion of tilapia culture
(in terms of area coverage and increased production) could be hindered by several issues
facing the producers. These issues include high production costs, low market price, off-
flavour, problems with communal water bodies, expensive formulated feeds, low quality
supplementary feeds, seed quality, genetic quality of broodstock, and production of drug
residue-free fish for export (Bhujel & Woollard 2011).
The Thai government together with other organisations has been promoting exports of
tilapia by giving information to farmers on market trends, demands, requirements and
what Thailand has to do to compete globally. The main markets for Thai tilapia depend on
the product form. For frozen fillet, the USA and Asia are the main markets, whereas for
frozen whole fish, the main markets are the EU and the Middle East (Bamreurak, 2010).
USA remains the most important export market for frozen fillet with 20% of tilapia
97
exports (50% of total exports value of tilapia) going there in 2009. In 2011, Grobest, the
biggest tilapia producer, processor and exporter, exported 1,400 MT tilapia fillet, which
was 65% of the total fillet exports (2,140.65 MT, TFFA, 2014) from Thailand. Even with
this amount, Grobest was not able to meet the orders from their customers, mainly from
the USA, as demand was higher than supply.
EU states (mainly France, Netherlands and UK) prefer whole frozen fish, with 40% of total
exports (31% of total value). The other important markets are the Middle East (Saudi
Arabia and UAE for whole frozen fish) and Asia (Japan, Taiwan and Philippines for frozen
fillet). In EU, the trend is to import more tilapia because it is popular with consumers. Due
to the global economic crisis, tilapia’s cheaper price can provide them with protein from a
white flesh fish and good taste, although growth was slow possibly because of the rapid
takeover of the same market by Pangasius.
Table 3.8 summarises the strengths and weaknesses of tilapia industry in Thailand which
could be considered as potential or hindrances, respectively, in promoting exportation,
based on the perspective of Bamreurak (2010), owner of a processing plant for tilapia,
freshwater prawns and fruit.

98
Table 3. 8 Strengths and weaknesses of Thailand tilapia for export
Strengths Weaknesses
Global recognition of good quality standards of Thai tilapia.
Broodstock has problems with health and quality.
Stock growth is slow, with disease outbreaks.
Research development is limited.
Government support for production (technical know-how) and export promotion (marketing).
Higher production costs esp. price of feed but low selling price
Global consumption and demand are increasing.
Most producers are small scale farmers, so they might not be commercially stable
Source: Bamreurak, 2010
Despite the weaknesses pointed out in Table 3.8 that are hindrances to exports, these are
the perceptions from the processing and exporter side. Farmers continue to produce
tilapia for the local markets, mainly due to market price, which they can sell higher than
selling to the processing plants. Disease, water quality, low price and high input costs are
the common problems faced by the producers which need to be addressed first.
3.8. Stakeholder analysis and roles of intermediaries
In order to understand the existing situation in the aquaculture industry and to know the
people or actors who are involved in every process, a stakeholder analysis is a critical
initial step. Stakeholder analysis aims to recognize people or groups who can have impact
on a certain issue or phenomenon (Reed et al., 2009) and be affected by whatever is done
on this, explain aspects of an issue coming out of an act or a resolution, and arranges the
order of influences of those involved on any decision made related to the issue (Reed et
al., 2009). This also includes the social networks among stakeholders (Prell et al., 2008),
which could influence perceptions and decision-making, especially relevant to
sustainability of their operations and interactions with other actors in the value chain.
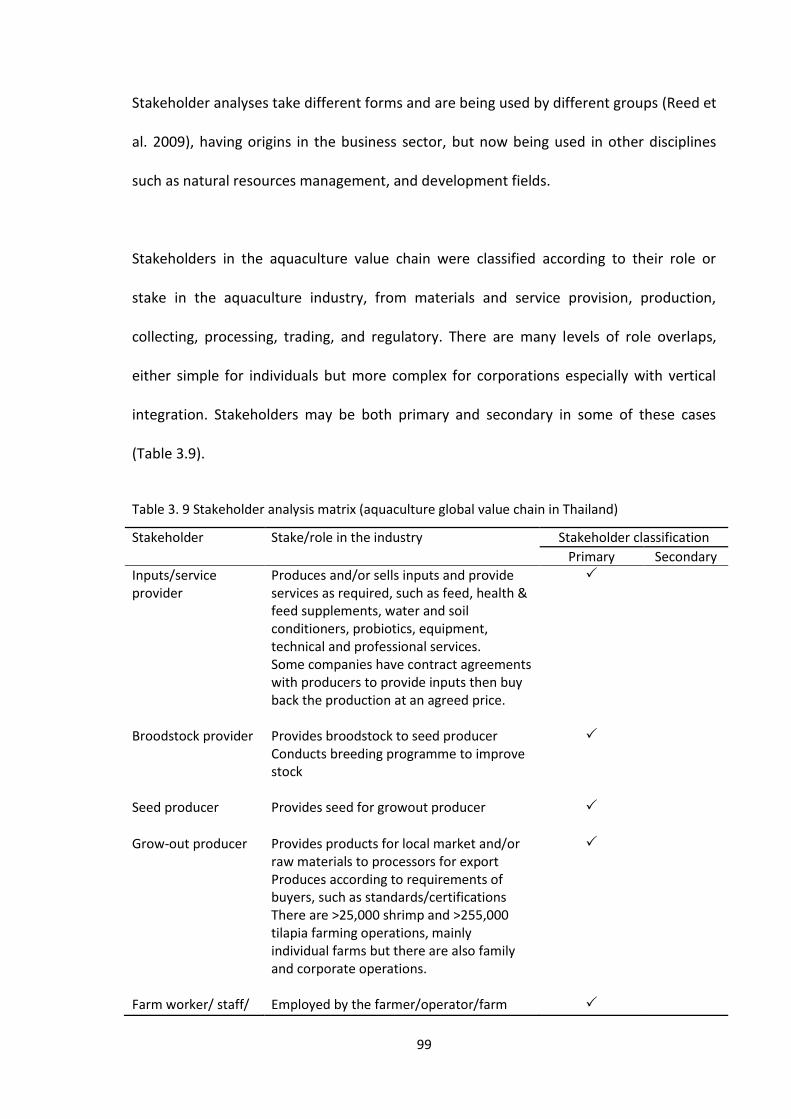
99
Stakeholder analyses take different forms and are being used by different groups (Reed et
al. 2009), having origins in the business sector, but now being used in other disciplines
such as natural resources management, and development fields.
Stakeholders in the aquaculture value chain were classified according to their role or
stake in the aquaculture industry, from materials and service provision, production,
collecting, processing, trading, and regulatory. There are many levels of role overlaps,
either simple for individuals but more complex for corporations especially with vertical
integration. Stakeholders may be both primary and secondary in some of these cases
(Table 3.9).
Table 3. 9 Stakeholder analysis matrix (aquaculture global value chain in Thailand)
Stakeholder Stake/role in the industry Stakeholder classification
Primary Secondary
Inputs/service provider
Produces and/or sells inputs and provide services as required, such as feed, health & feed supplements, water and soil conditioners, probiotics, equipment, technical and professional services. Some companies have contract agreements with producers to provide inputs then buy back the production at an agreed price.
Broodstock provider Provides broodstock to seed producer Conducts breeding programme to improve stock
Seed producer Provides seed for growout producer
Grow-out producer Provides products for local market and/or raw materials to processors for export Produces according to requirements of buyers, such as standards/certifications There are >25,000 shrimp and >255,000 tilapia farming operations, mainly individual farms but there are also family and corporate operations.
Farm worker/ staff/ Employed by the farmer/operator/farm

100
Stakeholder Stake/role in the industry Stakeholder classification
Primary Secondary
employee owner/company. Roles are according to the scale of operation of the farm, for e.g. large/medium-scale farms will hire managers who oversee the whole farm operations, technicians for laboratories/ heads of zones/machineries, administrative staff and pond workers per pond; small-scale farms will have a married couple as workers for the whole farm
Collector/harvester Specialised group of people who provide their services to the producers at harvest time, bringing their own harvesting equipment. Compensation depends on negotiation with farmers.
Trader/ middlemen/ women/local buyer/broker/ distributor
Buys directly from farmer at farm-gate Negotiates for the selling price of product Purchases products from producers Sells products to local wholesalers or retailers or processors Finds producers who can supply as per market demands
Trader/buyer/ seller Buys from a collector, trader, wholesaler or retailer, or an auctioneer in an auction market
Processor/ exporter
Purchases products directly from producers or from brokers/auction markets May have contract agreements with producers Processes products according to customer/ importer requirements Knows market information, demand, requirements and communicates information to producers and brokers Facilitates or funds 3rd party certifications for producers
Importer Provides information to processors/ exporters regarding consumer/market requirements and preferences
Provincial Fisheries Officer
Provides information on government policies and technical training of producers Conducts registration of farms Issues movement documents to seed and growout producers
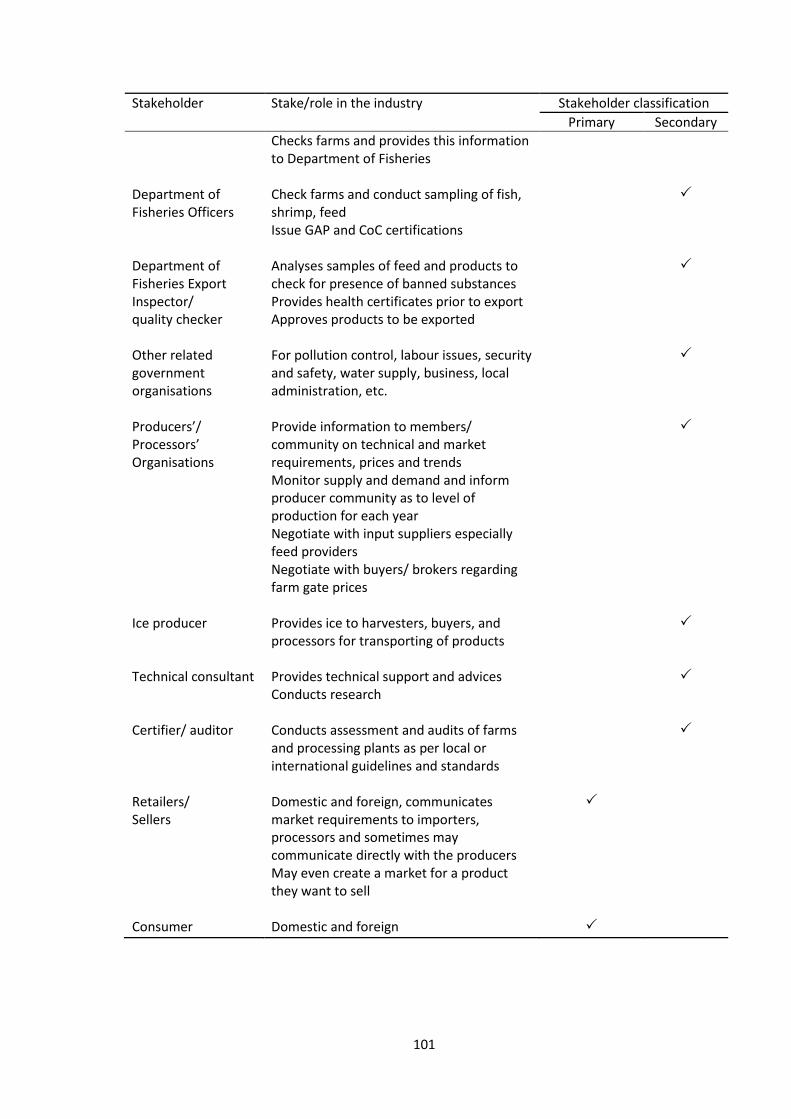
101
Stakeholder Stake/role in the industry Stakeholder classification
Primary Secondary
Checks farms and provides this information to Department of Fisheries
Department of Fisheries Officers
Check farms and conduct sampling of fish, shrimp, feed Issue GAP and CoC certifications
Department of Fisheries Export Inspector/ quality checker
Analyses samples of feed and products to check for presence of banned substances Provides health certificates prior to export Approves products to be exported
Other related government organisations
For pollution control, labour issues, security and safety, water supply, business, local administration, etc.
Producers’/ Processors’ Organisations
Provide information to members/ community on technical and market requirements, prices and trends Monitor supply and demand and inform producer community as to level of production for each year Negotiate with input suppliers especially feed providers Negotiate with buyers/ brokers regarding farm gate prices
Ice producer Provides ice to harvesters, buyers, and processors for transporting of products
Technical consultant Provides technical support and advices Conducts research
Certifier/ auditor Conducts assessment and audits of farms and processing plants as per local or international guidelines and standards
Retailers/ Sellers
Domestic and foreign, communicates market requirements to importers, processors and sometimes may communicate directly with the producers May even create a market for a product they want to sell
Consumer Domestic and foreign

102
Primary stakeholders are those directly involved in the production, processing and trade
(export) of seafood products. In an industry such as aquaculture in Thailand, there are
situations when a certain stakeholder has more than one role, such as in vertically
integrated operations, when the stakeholder (a company as the legal entity) operates a
hatchery to produce seed for their own farm, and also sells the seed to others, then
produces own feed, and markets the feed as well. Another instance will be a technical
person who is employed by a formal institution or has other business concerns, and then
also has a hatchery or a grow-out farm or a shop which sells aquaculture inputs. There are
many levels of role overlaps, either simple for individuals but more complex or complete
for corporations; stakeholders may be both primary or secondary in some of these cases.
The primary stakeholders in the production sector especially in the farming aspect include
not only the owners or operators but equally important are the farm staff/employees and
workers.
Traders or middlemen/women are important stakeholders as they link the producers with
the markets for the products. A review on agricultural middlemen in Thailand by Rigg
(1986) described the important role played by middlemen, especially Chinese traders
since the middle of the 17th century in Thailand, in marketing and providing opportunities
for farm producers to sell their products. To the present time, traders/middlemen/
women albeit in various forms continue to play an important role, as primary and
secondary stakeholders in the aquaculture business.
Retailers and consumers (domestic and foreign) are classified as primary stakeholders, as
their requirements drive market demand for the seafood products, which in turn inform
103
the other stakeholders on what and how much to produce at what level of quality. In this
case they are stakeholders who are important even though they are not directly involved
in the actions of production and processing and trading but their preferences on the type
of products are important information to both the primary and secondary producers.
Secondary stakeholders are those not directly involved in the production and processing
of aquatic products, but their involvement is more on providing services as well as
regulatory, advisory and monitoring, to ensure processes adhere to good, legal and safe
practices. Due to the need for transparent processes for the sustainability of international
trade in seafood to be possible, there are governance mechanisms put in place to achieve
these.
Whilst there are a number of institutional agents impacting the aquaculture trade
industry especially in seafood exports, the Thai Department of Fisheries obviously plays a
major role, and all seafood exports have to pass through their checking and certification
system. This was also mentioned by Belton & Little (2008) in that amidst all the
institutional interventions for aquaculture development, the prominence of DOF as one
of the main government executing agencies was obvious, as it spearheaded the
dissemination and adoption of several techniques to improve culture systems as well as in
capacity building. In addition, DOF also handled or spearheaded all the government
initiatives on national standards setting and negotiating with international standards fora.
Other institutions such as the Asian Development Bank (ADB, 1996) and the BAAC or Bank
of Agriculture and Agricultural Cooperatives (BAAC, 2009; Chaitrong, 2008;
Klungboonkrong, 1991) helped to promote aquaculture by providing funding and loans to
104
government fisheries institutions, farmers and cooperatives. The other point of relevance
was that the rapid expansion of shrimp although initially short-lived supported
development of an ‘infrastructure’ which supported other species to develop
subsequently (Belton & Little 2008).
With the responsibilities of DOF from policy formulation, enforcement, implementation
and actual involvement in the industry until exportation, stakeholders from farmers,
processors and exporters expect DOF to give more support to them in order for their
business to become more stable (information based on key informant interviews during
Scoping survey, 2010).
Subsidies by the government through the financial institutions such as BAAC have helped
in aquaculture development, by providing loans to farmers, who needed financial help
not only to their fish system but they could also have other farming systems such as rice
and other crops. However, more is required as farmers demand assistance with selling
price of their products and the increasing costs of inputs. The government also provides
financial packages to those affected by natural calamities such as flooding but farmers
have to register with the DOF to have the right to claim for damages. For e.g., after the
2011 flood, the government provided monetary compensation to farmers who lost their
crops, with fish farmers receiving 4,225 Baht/rai, and shrimp/crab farmers receiving
10,920 Baht/rai but they could claim up to 5 rai; while fish cage farmers could claim 315
Baht/m2 of cage up to 8 m2 (The World Bank, 2012).
105
In 2009, the Food and Agriculture Organization of the UN and the DOF organized a
Workshop on the Options for a Potential Insurance Scheme for Aquaculture in Thailand
(FAO, 2010). The consensus in the workshop was that the need for aquaculture insurance
was recognized and the stakeholders supported the setting up of a mutual fund for the
Thai shrimp farming industry, which should include small and medium-scale shrimp
farmers including local feed distributors and hatchery operators. The insurance will cover
the following risks: natural perils damaging the stock, diseases, other perils such as theft
and mechanical failure, and price fluctuations. However there was no legal framework yet
at the time (year 2009) and it was suggested that government assistance should be given
to address this matter.
A number of local, regional and international organisations and institutions have also
contributed to the development of aquaculture especially in providing venues for
information and knowledge exchange among stakeholders. Specifically the Network of
Aquaculture Centers in Asia and the Pacific (NACA) whose headquarters are in Bangkok
has been visible in this role, as well as in promoting sustainable aquaculture, and
providing academic, research and institutional support to various stakeholders not only in
Thailand but in the region and beyond.
3.9. Conclusions
Looking at the four farmed aquatic species, not all of them have export potential. The
main issue for the viability as an export product is the capacity to meet international
standards and consumer requirements. This will be a challenge for Pangasius as to the
way it is cultured in Thailand, whereas the physical characteristics of freshwater prawn
106
will be a constraint for frozen product forms. Both these species are meeting domestic
needs but might not be able to meet export requirements.
Penaeid shrimp culture has a comparative advantage over the other three species in
terms of export trade due to its high global demand, translating itself to a premium price
for producers. The recent developments in consumer requirements have changed the
way shrimp is grown in Thailand in recent years, and stakeholders (producers, processors,
traders, exporters) now have become more aware of sustainable and ethical principles in
their operations. Adherence to local and foreign standards and certification is now
considered a must for those who desire to continue meeting the demand for the export
market.
Thailand may not have a comparative advantage with Pangasius in terms of developing an
export trade as production cost will be high and there is no assurance that the product
can be sold at a premium price so there is wariness to invest in upgrading Pangasius
production systems. In addition, Thailand will not be able to compete with Vietnam, since
the Vietnamese Pangasius production systems require high quantities of water for water
exchange (Phan, 2014). However market creation can be initiated capitalising on the
historical significance of Pangasius to appeal to Thai consumers, for the domestic
markets, in order to compete with the growing Pangasius imports into Thailand.
Producing Pangasius for a niche market, such as organic Pangasius, may have potential for
export but only through a vertically integrated operation, and if sourcing out from other
producers, it should be through contract growing (seed, feed and processing by the
107
organic company) so there is close monitoring of production to ensure adherence to
organic standards.
As freshwater prawn is so much a part of the Thai cuisine, domestic demand will remain
high. Although, the potential for export remains high especially for live exports to
neighbouring countries but volume production of processed prawn seems to be limited
by vulnerability to diseases and cannibalism at higher densities and higher costs of
production than competitors.
Polyculture systems in freshwater areas, such as tilapia with finfish, tilapia with white
shrimp, or freshwater prawn with white shrimp, may be limited to smallholder systems.
Production from these systems may be acceptable for export if farms are registered into
the traceability system of the Government and be certified locally. Tilapia industry should
look more into developing high quality, SPF broodstock to strengthen the stock for grow-
out, that is fast growing and disease resistant. In addition, development of low cost, high
quality feed for improved feed efficiency is necessary resulting in increased production
per unit area.
With China facing constraints in terms of labour shortage in the processing sector, and its
strict control of migrant labour, China’s capacity to process and export tilapia at the
current rate would eventually be affected (Zhang, 2014). Thailand could then use this as
an opportunity for Thailand to expand quality tilapia production to meet export demands
but there is a need to enforce good labour practices along the value chain.
108
Producers and other value chain actors could benefit from training to develop their
entrepreneurial skills as fish farming or other related activities is a business enterprise, at
the same time strengthen campaigns for environmental stability and social responsibility,
which will eventually give an edge to production and marketing. This role could be taken
up by the producer clubs/associations as well as the media which are effective in
disseminating information to the public.
With the importance of shrimp in seafood export trade, and the strong potential to
increase exports of tilapia, it is then necessary to look into more detail at the production
practices of these two species. As global standards and certification schemes are
important entry points for products to be traded in the export markets, the following
chapters will focus on how shrimp and tilapia production systems operated to fulfill
market demands. The following chapters, 4 and 5, will focus on the technical and
environmental aspects of shrimp and tilapia production practices, and the human
resources aspects of shrimp production, respectively.
109
4. CHAPTER 4 Shrimp and tilapia farming in Thailand: fulfilling domestic and global
market needs
4.1. Introduction
Shrimp and tilapia were described as the two aquaculture species which have developed,
or have potential to develop, respectively, significant to global trade. The dynamism of
the shrimp and tilapia sectors are worth understanding in greater depth, in relation to
what types of farms are they being produced and the diverse production systems which
farmers are employing to be able to meet market demand, both locally and globally. This
chapter then focuses on the current practices and status of farming these species vis-à-vis
the criteria regarding farm management in the globally accepted certifications and
standards.
Certification and standards in global trade of food products, of which seafood is a major
commodity, has grown in importance, evidenced by the multiple certifications and
standards emerging, both location-specific and global (Washington and Ababouch, 2011).
Some examples of these standards and certification schemes which Thai seafood
producers and exporters have to follow if they wanted to export food products to various
countries include GlobalGAP (Europe), Naturland (Europe), ThaiGAP (Europe, USA), Global
Aquaculture Alliance/Best Aquaculture Practices (USA), Safe Quality Food (global), and
the British Retail Consortium (global) (Washington and Ababouch, 2011). Little is known
about the number of shrimp and tilapia farms in Thailand operating according to different
global standards and certifications, although some such as GAA/BAP regularly announces
the names of farms they certify.
110
The Thai DoF has the local registration and certification mechanisms for the traceability
system of products for export, such as mainly for shrimp, followed by tilapia, and planning
to implement with other species (Yamprayoon and Sukhumparnich, 2010). Globally, only
4.6% of aquaculture production is certified (Bush et al. 2013). The majority of shrimp
farms exporting their products operate to comply with these standards in order to
compete in the export market, but there are farms which operate to produce for any
market (local or global if certifications are not required). In addition, farms change their
mode of operation due to market demands and standards requirements, or there are
other reasons driving these changes.
The global standards and certifications covered in this chapter refer only to the ones
issues by the Global Aquaculture Alliance/Best Aquaculture Practices (GAA-BAP, 2013),
GlobalGAP for shrimp and tilapia (GlobalGAP, 2012), and the Aquaculture Stewardship
Council (ASC) for tilapia (ASC, 2012). Although these standards and certifications are
accepted by the industry and are being used as a way to achieve sustainability, they may
still have limitations in terms of measuring the impacts of the external environment on
the farms (Han and Immink, 2013).
4.2. Research hypothesis/questions
The research hypothesis is that the larger and more corporately managed farms are more
capable of operating according to global standards and certifications, enabling them to
participate more and compete in the export trade of seafood products. Conversely,
smaller scale farms are likely to be excluded from global trade activities leading to
111
discontinuance of their business because of an inability to comply with 3rd party
standards. If the small scale farmers can continue in operation, their production will be
geared towards competing only in domestic or international markets which do not
require strict standards. However, as mentioned earlier, certification and standards are
growing in importance as well as in geographical distribution which means that there is a
possibility that those countries not requiring certified products now will require them in
the future (Steering Committee of the State-of-Knowledge Assessment of Standards and
Certification, 2012).
Thailand currently exports seafood especially shrimp not only to countries that require 3rd
party certification (for e.g. USA, Europe, Canada, Australia and Japan), but also to other
countries such as those within Asia and the Middle East which do not really require 3rd
party certification. Likewise, some requirements for export products might be easier to
comply with than others, depending on the resource base, technical capacity of farmers,
and scale of the farm operations. In addition, changes occurring in farm operations in
recent years may be influenced by other factors that may be of local importance.
The research work presented in this chapter was guided by the following research
questions:
1. How do the farms measure against the major global standards and certifications
on environmental and farm management aspects to meet market needs?
2. How did the farms vary in the changes in their operations in recent years?
a. How different were the reasons for changes among farms of different
scales?
112
b. Which farm scale was most likely to change or stop farming?
4.3. Scope
The data presented here came from the responses of shrimp and tilapia farm
owners/operators and/or managers of the sampled farms during the Integrated Farm
Surveys (IFS) conducted in Thailand from December 2010 to March 2011. Farm owners
are individuals who have legal ownership of the farm, can be an individual or a company
(if registered as a Thai business), can be co-owners in the case of husband and wife, or
he/she can be the legal lessor of the farm in the case of the farm being leased from a legal
owner. These owners may or may not be the managers/operators of their farms,
especially for small and medium scale farms. Large/corporate farms will always have a
manager employed.
Farm managers are those who are hired or employed by an individual farm owner or a
corporate farm. He or she may or may not be a shareholder in the company.
Data on trends and changes came from both the IFS (based on respondents’ recall) and
the phone transition survey conducted in March to May 2013.
4.4. Materials and Methods
4.4.1. Integrated Farm Survey (2010-2011)
This study involved a survey of 206 shrimp and 199 tilapia farmers from the major
production areas in Thailand identified during a scoping stage (Table 4.1). The sampling
methods including selection of study areas and farmers are described in Chapter 2. The
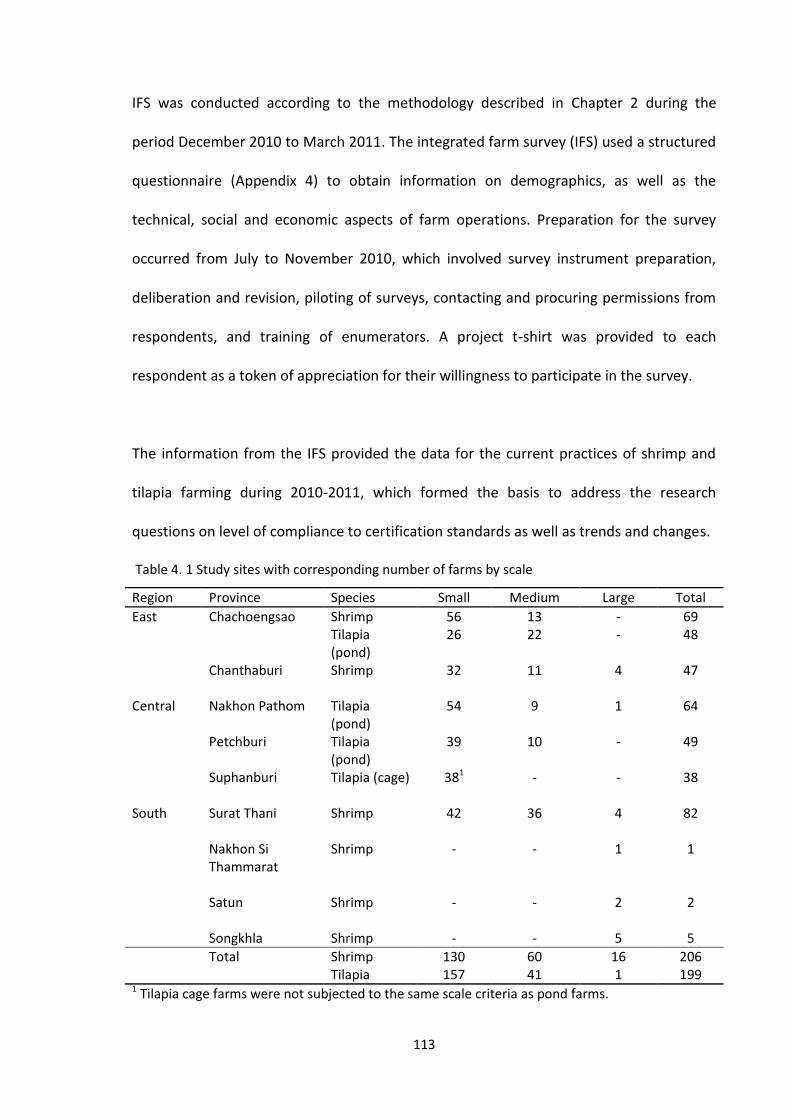
113
IFS was conducted according to the methodology described in Chapter 2 during the
period December 2010 to March 2011. The integrated farm survey (IFS) used a structured
questionnaire (Appendix 4) to obtain information on demographics, as well as the
technical, social and economic aspects of farm operations. Preparation for the survey
occurred from July to November 2010, which involved survey instrument preparation,
deliberation and revision, piloting of surveys, contacting and procuring permissions from
respondents, and training of enumerators. A project t-shirt was provided to each
respondent as a token of appreciation for their willingness to participate in the survey.
The information from the IFS provided the data for the current practices of shrimp and
tilapia farming during 2010-2011, which formed the basis to address the research
questions on level of compliance to certification standards as well as trends and changes.
Table 4. 1 Study sites with corresponding number of farms by scale
Region Province Species Small Medium Large Total
East Chachoengsao Shrimp 56 13 - 69 Tilapia
(pond) 26 22 - 48
Chanthaburi Shrimp 32 11 4 47
Central Nakhon Pathom Tilapia
(pond) 54 9 1 64
Petchburi Tilapia
(pond) 39 10 - 49
Suphanburi Tilapia (cage) 381 - - 38
South Surat Thani Shrimp 42 36 4 82
Nakhon Si
Thammarat Shrimp - - 1 1
Satun Shrimp - - 2 2
Songkhla Shrimp - - 5 5
Total Shrimp 130 60 16 206 Tilapia 157 41 1 199
1 Tilapia cage farms were not subjected to the same scale criteria as pond farms.

114
In the IFS questionnaire, a number of questions related to changes over the last 5 years
covering from 2005/2006 to 2010/2011 were also asked, which gave the opportunity for
the respondents to share by recall the trends they have experienced and observed on
certain topics/issues such as land holding and use patterns, farm infrastructure,
aquaculture production patterns, labour patterns, feed management, water management
and chemical and substance use and management.
The team of survey enumerators was composed of 9 females and 2 males, with 3 of the
females and 1 male involved since the start of the survey until it was completed
(Appendix 1). All the interviews were conducted in the Thai language.
4.4.2. Transition survey (2013)
Recent changes in shrimp farming operations and respondents’ situation were assessed
using a telephone survey between 7 and 15 March 2013. Respondents from the 2010-
2011 survey who signified their willingness to participate in further research activities
were contacted by phone in February 2013 to inform them of the transition survey, and
to explain the reasons for conducting such survey.
Out of the 206 shrimp farm respondents during IFS in 2010-2011, 160 (78%) indicated
that they were willing to participate in future research activities of the project (Table 4.2).
From this 160, only 158 could be contacted by phone. An additional 7 respondents were
contacted, composed of 6 who did not respond during IFS if they were willing or not to
participate in future research, and 1 who responded No but was contacted by mistake.
Thus a total of 165 persons were contacted for the telephone survey.

115
Table 4. 2 Transition survey sample design
Species Total IFS respondents (2010-2011)
Willing to participate in
further research
Contacted for transition survey
(2013)
Responded to phone survey
(2013)
Shrimp 206 160 165 117
Tilapia 199 166 131* 81*
*Burana-osod et al. (2013)
Out of these 165 potential respondents, only 117 (71%) responded to the phone survey.
Whereas 8% did not answer the phone, 5% had no telephone number recorded in the
database, and the remaining 16% had various reasons for not responding to the phone
survey (Figure 4.1).
Figure 4.1 Reasons for not responding to shrimp phone transition survey
The transition survey questionnaires (for both shrimp and tilapia) were piloted during
February 2013 with farmers in Surat Thani (10 shrimp) and Prachinburi (2 tilapia). I was
responsible for shrimp survey while another student was responsible to implement the
tilapia survey.
0 2 4 6 8 10 12 14
Did not answer the phone
No phone no. in database
Not free/not available
Could not be contacted, reason unknown
Wrong number
Telephone was turned off
Referred us to another farmer
Number out of service
No signal when contacted
No. of shrimp farm respondents (n=48)

116
The shrimp telephone survey took about 30 to 45 minutes per person, depending on how
long the respondent responded to the questions, as well as the clarification needed by
enumerators, if any. For most, the interviews took place during the 2nd or 3rd calls, since
the first call was to inform about the interview, and to make an appointment. There were
five female enumerators who conducted the interviews. These enumerators were trained
on the survey instruments prior to the interviews to explain and familiarize themselves
with the questions (Appendix 5).
For tilapia farming changes, some secondary data obtained from the transition survey
conducted by Burana-osod et al. (2013) is used for comparison purposes.
4.4.3. Data analysis
Data from the IFS were inputted into pre-designed database in MS Access (Murray et al.,
2011). The independent variables were species and farm scale. Dependent variables are
those that correspond to the three major certification standards, which have been
categorized for presentation in this chapter, were legal aspects, environmental
management and farm management. It has to be noted that the data from the IFS did not
respond to all the criteria in the standards thus this is not a comprehensive review of the
status of farms re: overall compliance but only looking at how farms comply with the
selected aspects mentioned above.
The human resources, worker safety and welfare aspects will be discussed in Chapter 5.
117
As the sample design was unbalanced (e.g. far fewer large than small or medium farms), it
was necessary to present proportions rather than ‘raw’ frequencies or percentages i.e.
using total numbers of respondents in any particular combination of independent factors
in cross-tabulation or pivot chart as the denominators Thus weighting of survey data was
applied when necessary in order to reduce misrepresentations and biases caused by
unbalanced sample sizes. Each farm scale sample size was assigned weights to be used as
denominators, using the following formula: 1/n x 100 or 100/n, where n is the number of
respondents for each scale, for a particular response. It has to be noted that n values
varied because not everybody in the sample responded to all the questions, i.e. there
were some questions wherein a number of respondents did not provide information,
either because it was not applicable, or they were not willing to disclose the information,
or the data was not collected.
In addition, as the survey was mainly focused on the farm system, no data outside the
farm was collected. Thus for standards relating to external environmental or social
impacts of farm activities, there were no external validation regarding conservation,
biodiversity, measurements of water quality and eutrophication of the outside water
body, and wildlife protection. However there were a few anecdotal references based on
individual comments of the respondents.
Data from the shrimp transition phone surveys were inputted into excel sheets. The key
independent variable was farm scale. Data analysis had both quantitative and qualitative
elements, the latter which were coded prior to entry to allow for descriptive statistics and
comparison.

118
Statistical analysis to determine differences among farm scales whenever necessary was
conducted using SPSS version 21 and Minitab.
4.5. Results
4.5.1. Existing aquaculture certification and standards
There are three major 3rd party certification standards which are being followed by the
aquaculture global trade market, summarised in Table 4.3.
Table 4.3 General information on the global aquaculture standards used in this study
Certification/standard Certifying body Species Remarks
Best Aquaculture
Practices Certification
(BAP)
Global Aquaculture
Alliance (GAA)
Shrimp, tilapia Shrimp started in 2002
Tilapia started in 2008
GLOBALG.A.P. (Good
Aquaculture Practices)
Global GAP Shrimp, tilapia Started in 2007
ASC Tilapia Standard Aquaculture
Stewardship Council
(ASC) 1
Tilapia Started in 2012
1The ASC released the Shrimp Standard in March 2014 so it was not included here.
The various standards have similarities and differences. For the purposes of this chapter
to present the data from field surveys, Table 4.4 presents the various criteria, under
which the dependent variables were based, to be compared against the independent
variables. The data in this chapter will be presented according to the points in Table 4.4
119
i.e. not all standards criteria were covered by this research as this was not to evaluate the
standards per se but to assess the performance of farms in relation to the standards.
In Thailand, the Department of Fisheries (DoF) has implemented a number of local
standards for farms to follow. Table 4.5 gives a brief description of these local standards.
Among the shrimp farms surveyed during IFS, only 1 large and 2 medium shrimp farms
had been certified by BAP/GAA (Table 4.6), i.e. as of 2011. A large majority (93%) of
shrimp farms surveyed were certified under ThaiGAP offered by the Thai Department of
Fisheries.
For tilapia farms surveyed, only 20% or 38 farms, comprising of 5 cage and 33 pond farms
had ThaiGAP certification.

120
Table 4. 4 Summary of standards for shrimp and tilapia farms based on global certifiers for aquaculture that have relevance to this study.
STANDARDS FOR REQUIRED COMPLIANCE GLOBAL STANDARDS/ CERTIFICATIONS SPECIES
GAA/BAP GlobalGAP ASC Shrimp Tilapia
Legal aspects:
Community: Property rights and regulatory compliance / / /
Site management: Legislative framework & documentation / / /
Obey the law & comply with all national & local regulations: Evidence of
legal compliance
/ x /
Environmental Management:
Effluent Management / / Ponds
Water usage and disposal / / /
Water quality control / Cages
Pond sludge management / / Ponds
Stocking sources, control of escapes / / /
Predator control / / /
Farm Management:
Feed management, records, storage / / /
Preference for better feed manufacturers / x /
Fish welfare, management and husbandry: treatments, records, mortality / / /
Fish health management / x /
Drug and chemical management, storage / / / / /
Biosecurity: Disease control / / /
Traceability: Record-keeping requirement / / / /
Use resources responsibly: Energy use / x /
Food safety: Harvest, packing and transport / / / x
Legend: / (covered); x (not covered). Source: ASC, 2012; GAA-BAP, 2013; GlobalGAP, 2012

121
Table 4. 5 Aquaculture standards by DoF, Thailand
Name Details Remarks
Safety level Farms under this scheme should be
registered and not use prohibited
substances, have less detection of residues
of antibiotic and hazardous substances, and
have fry and fish movement documents.
Legal requirement for
registered farms,
produce usually sold to
domestic markets only.
Also applies to
hatcheries.
Thailand Good
Aquaculture Practices
(ThaiGAP)
A more detailed guideline in addition to the
safety level standard, covering issues related
to location, management, inputs, fish health
management, farm hygiene, harvesting and
transportation, and data collection. Fishery
Movement Documents from hatchery and
growout are required for those exporting.
Required for all farms
producing for export
market. Certified for 2
years and renewable
after acceptable audits.
Also applies to
hatcheries.
Code of Conduct (CoC) Criteria to be followed includes: site
selection, general farm management,
stocking density, feed, shrimp health
management, therapeutic agents and
chemicals, effluent and sediments, harvest
and transportation, social responsibility,
farm grouping and training, data collection
Also specific guidelines for hatcheries,
nurseries, distributor, processors/ exporters.
Fishery Movement Documents from
hatchery and growout are required for those
exporting.
Shrimp hatchery,
growout, processing,
input providers,
marketing
GAP Plus This is a certification given to those
complying with the GAP plus additional
other practices that are beneficial to product
safety and quality such as the Sustainable
Shrimp Programme (SSP) or recently ASEAN
GAP.
Initially with shrimp
farms
Source: NACA et al., 2007
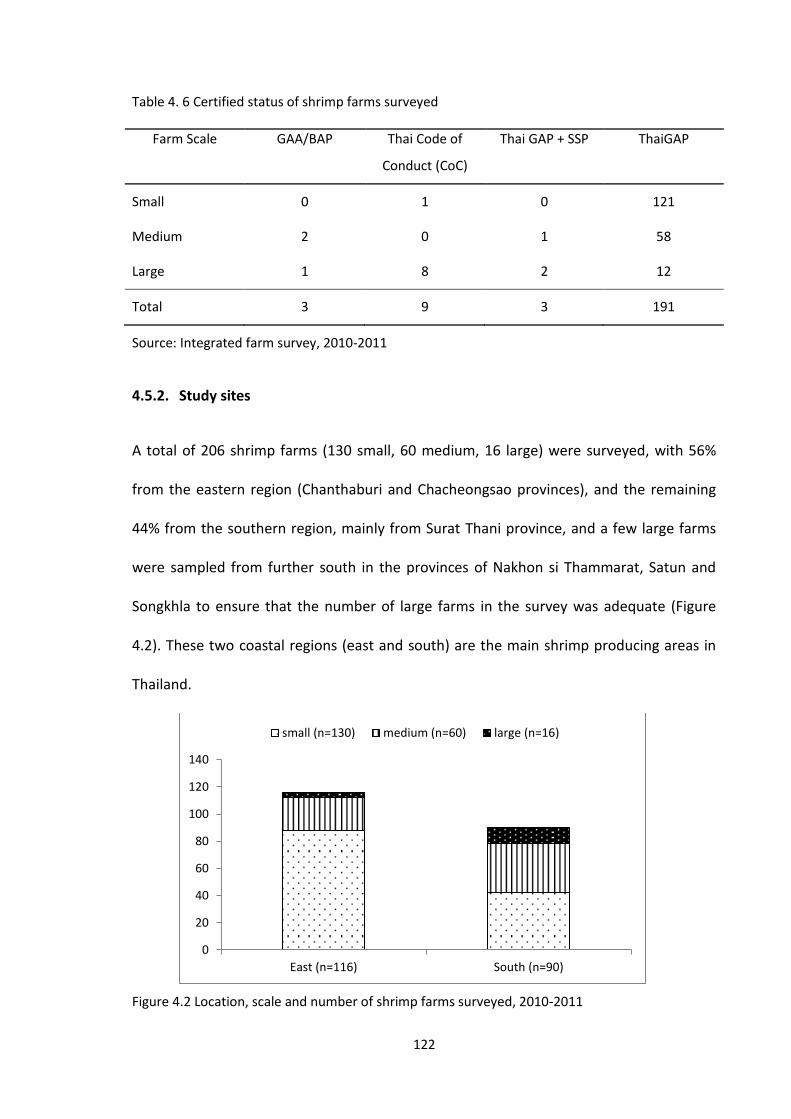
122
Table 4. 6 Certified status of shrimp farms surveyed
Farm Scale GAA/BAP Thai Code of
Conduct (CoC)
Thai GAP + SSP ThaiGAP
Small 0 1 0 121
Medium 2 0 1 58
Large 1 8 2 12
Total 3 9 3 191
Source: Integrated farm survey, 2010-2011
4.5.2. Study sites
A total of 206 shrimp farms (130 small, 60 medium, 16 large) were surveyed, with 56%
from the eastern region (Chanthaburi and Chacheongsao provinces), and the remaining
44% from the southern region, mainly from Surat Thani province, and a few large farms
were sampled from further south in the provinces of Nakhon si Thammarat, Satun and
Songkhla to ensure that the number of large farms in the survey was adequate (Figure
4.2). These two coastal regions (east and south) are the main shrimp producing areas in
Thailand.
Figure 4.2 Location, scale and number of shrimp farms surveyed, 2010-2011
0
20
40
60
80
100
120
140
East (n=116) South (n=90)
small (n=130) medium (n=60) large (n=16)
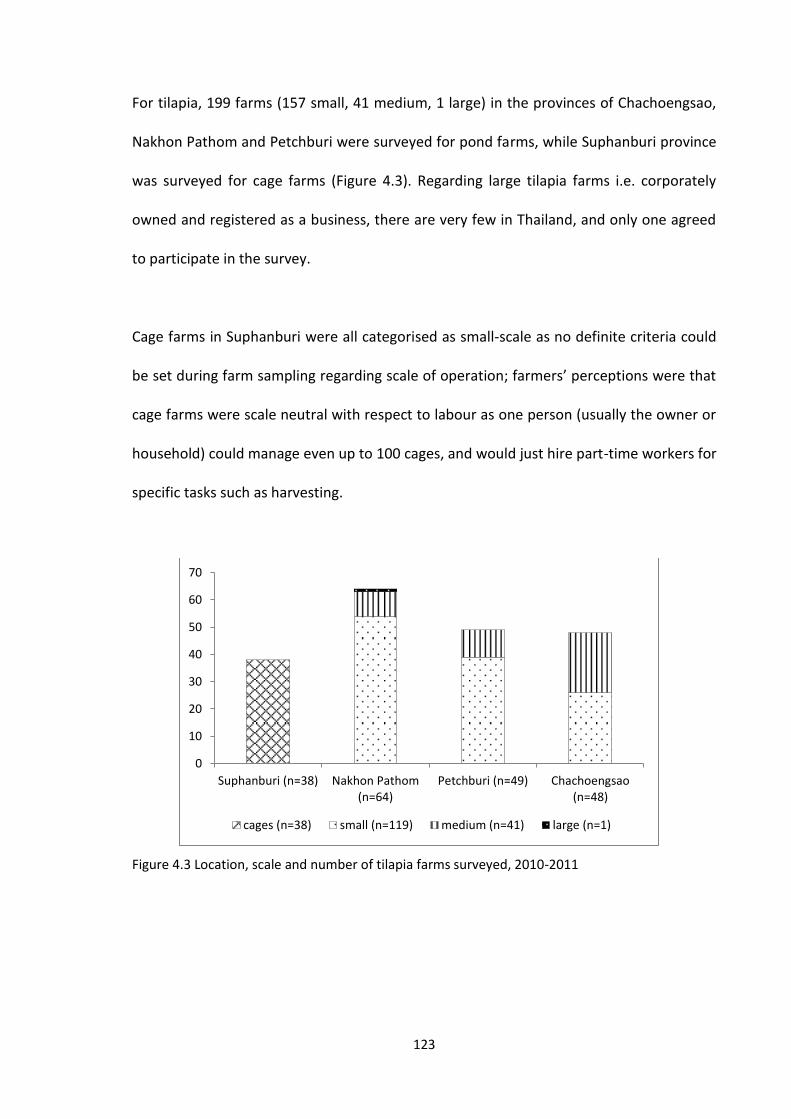
123
For tilapia, 199 farms (157 small, 41 medium, 1 large) in the provinces of Chachoengsao,
Nakhon Pathom and Petchburi were surveyed for pond farms, while Suphanburi province
was surveyed for cage farms (Figure 4.3). Regarding large tilapia farms i.e. corporately
owned and registered as a business, there are very few in Thailand, and only one agreed
to participate in the survey.
Cage farms in Suphanburi were all categorised as small-scale as no definite criteria could
be set during farm sampling regarding scale of operation; farmers’ perceptions were that
cage farms were scale neutral with respect to labour as one person (usually the owner or
household) could manage even up to 100 cages, and would just hire part-time workers for
specific tasks such as harvesting.
Figure 4.3 Location, scale and number of tilapia farms surveyed, 2010-2011
0
10
20
30
40
50
60
70
Suphanburi (n=38) Nakhon Pathom(n=64)
Petchburi (n=49) Chachoengsao(n=48)
cages (n=38) small (n=119) medium (n=41) large (n=1)
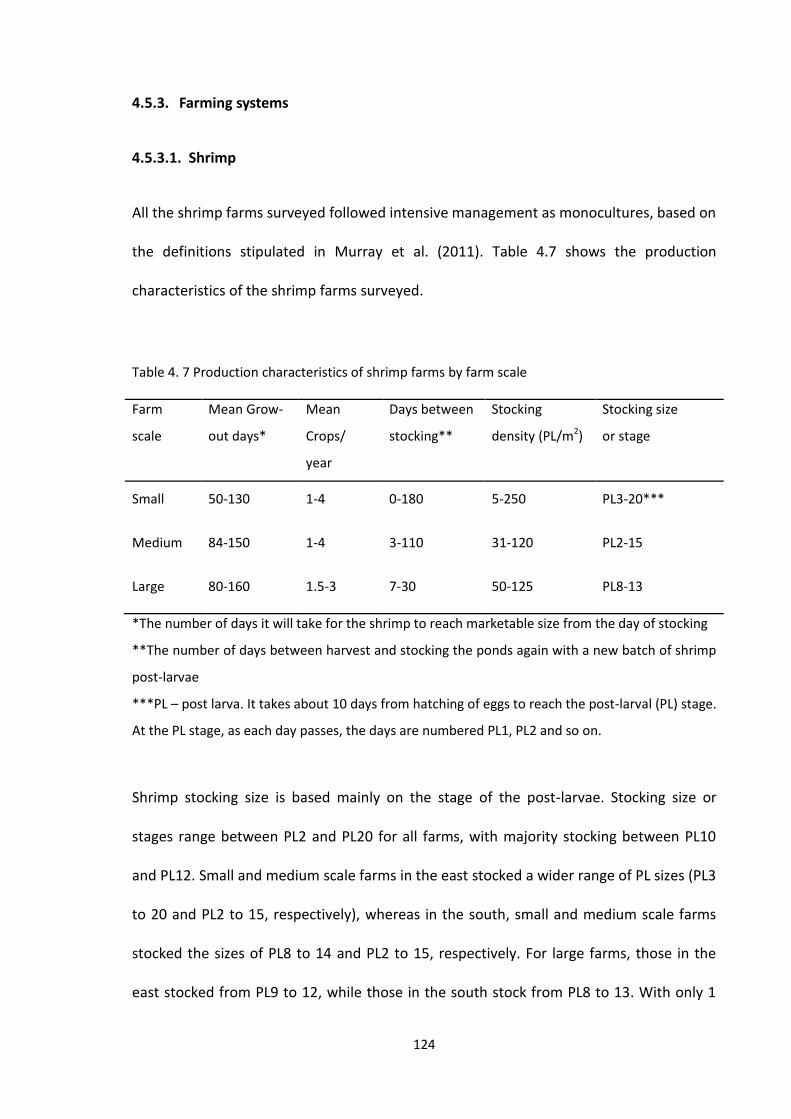
124
4.5.3. Farming systems
4.5.3.1. Shrimp
All the shrimp farms surveyed followed intensive management as monocultures, based on
the definitions stipulated in Murray et al. (2011). Table 4.7 shows the production
characteristics of the shrimp farms surveyed.
Table 4. 7 Production characteristics of shrimp farms by farm scale
Farm
scale
Mean Grow-
out days*
Mean
Crops/
year
Days between
stocking**
Stocking
density (PL/m2)
Stocking size
or stage
Small 50-130 1-4 0-180 5-250 PL3-20***
Medium 84-150 1-4 3-110 31-120 PL2-15
Large 80-160 1.5-3 7-30 50-125 PL8-13
*The number of days it will take for the shrimp to reach marketable size from the day of stocking
**The number of days between harvest and stocking the ponds again with a new batch of shrimp
post-larvae
***PL – post larva. It takes about 10 days from hatching of eggs to reach the post-larval (PL) stage.
At the PL stage, as each day passes, the days are numbered PL1, PL2 and so on.
Shrimp stocking size is based mainly on the stage of the post-larvae. Stocking size or
stages range between PL2 and PL20 for all farms, with majority stocking between PL10
and PL12. Small and medium scale farms in the east stocked a wider range of PL sizes (PL3
to 20 and PL2 to 15, respectively), whereas in the south, small and medium scale farms
stocked the sizes of PL8 to 14 and PL2 to 15, respectively. For large farms, those in the
east stocked from PL9 to 12, while those in the south stock from PL8 to 13. With only 1

125
large farm and 2 medium scale farms having dedicated nursery ponds (Figure 4.10), the
majority of farms stocked PLs directly into grow-out ponds.
Initial shrimp stocking densities were not significantly different between enterprise scale
and location (Eastern and Southern regions).
4.5.3.2. Tilapia
Tilapia culture systems can be categorized into two major types (1) monoculture (all
cages/ some ponds), and (2) polyculture1, deliberately stocked with one other species
only for e.g. white shrimp, or two or more other aquatic species of economic value
(finfish, shrimp, prawn and frogs). In addition, in both pond cage systems, non-stocked
species were also harvested. All polyculture systems are in ponds. In each case there are
various production characteristics.
Figure 4.4 shows the tilapia farming systems by farm scale followed by the respondents in
this survey (based on weighted data). The majority of farms surveyed for all scales were
polyculture systems, in ponds. Of the small scale intensive monoculture farms (24% based
on weighted data), all except 1 were cage farms.
Tilapia cage farming systems are considered intensive systems based on inputs used as
described in Murray et al. (2011). Regarding farm scaling for tilapia cages, since our
criteria for large scale is corporate ownership i.e. registered as a company, there are only
1 Non-stocked species also enter the ponds and cages and so nearly all systems are ‘polycultures’, similar to
the farmer managed aquatic systems described in Amilhat et al. (2009).

126
very few companies which operate tilapia cages, such as CP and Grobest. Even these
companies have contract agreements with farmers (small scale based on criteria of
ownership and labour) who grow tilapia on cages, buy seed and feed from these
companies, and after 3 to 4 months of grow-out, sell the fish back to these companies.
Tilapia produced from contract farms should still meet the quality standards set by these
companies i.e. size, flavour, no chemical residues.
Thus the cage farms in this research were considered small scale according to the SEAT
Project definition. Scaling for cages may need to be further explored considering other
factors that are different from pond systems, such as intensity of production per unit
area.
Figure 4.4 Tilapia farming systems according to farm scale
0%
10%
20%
30%
40%
50%
60%
70%
80%
90%
100%
Large (n=1) Medium (n=41) Small (n=157)
% o
f re
spo
nd
en
ts
Intensive monoculture Semi-intensive monoculture
Semi-Intensive polyculture Traditional extensive
127
One tilapia pond farm in Petchburi was classified as traditional extensive (Figure 4.4), the
main reason was that the farmer was not using any feed and fertiliser to grow tilapia
(Murray et al., 2011). The farm (1.6 ha) was formerly a snakehead farm and is now
stocked with mixed sex tilapia fry from a hatchery and only has one cropping period for
180 days.
The majority of the small and medium sized pond farms follow a semi-intensive
polyculture farming system, with tilapia as the primary species (Tables 4.8 and 4.9),
although there were farms that changed the primary species to other species depending
on the season and market prices. Other species stocked with tilapia included Chinese
carps (Hypophthalmichthys molitrix or silver carp and Aristichthys nobilis or bighead carp),
Indian major carps (Cirrhinus mrigala or Mrigal and Labeo rohita or rohu) and common
carp (Cyprinus carpio), Thai silver barb (Barbonymus gonionotus), white shrimp,
freshwater prawn, catfish (Clarias sp.), snakehead (Channa striata), climbing perch
(Anabas testudineus), snakeskin gourami (Trichopodus or Trichogaster pectoralis), pacu
(Colossoma macropomum) and frogs (Rana ranina) (Table 4.9). The only large pond farm
surveyed also followed the semi-intensive polyculture system, stocking with Chinese
carps, Indian carps and Pangasius.
Tables 4.8 and 4.9 show the details of these tilapia production systems mentioned above.
A distinction is made between tilapia in polyculture with just white shrimp, and tilapia in
polyculture with 2 or more other species (white shrimp and others) due to the much
higher stocking density of white shrimp (up to 125 PL/m2) in the first system, while in the
second system, density ranged 7.5 to 31.3 PL/m2. In addition, the number of crops per
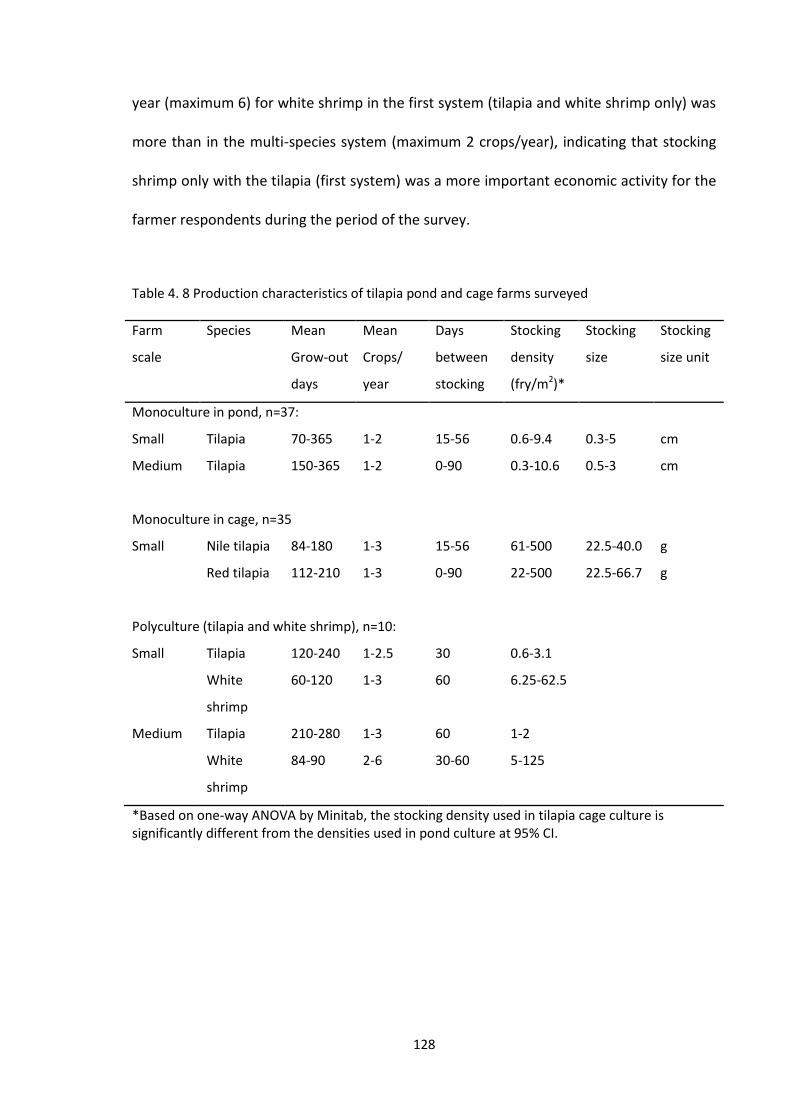
128
year (maximum 6) for white shrimp in the first system (tilapia and white shrimp only) was
more than in the multi-species system (maximum 2 crops/year), indicating that stocking
shrimp only with the tilapia (first system) was a more important economic activity for the
farmer respondents during the period of the survey.
Table 4. 8 Production characteristics of tilapia pond and cage farms surveyed
Farm
scale
Species Mean
Grow-out
days
Mean
Crops/
year
Days
between
stocking
Stocking
density
(fry/m2)*
Stocking
size
Stocking
size unit
Monoculture in pond, n=37:
Small Tilapia 70-365 1-2 15-56 0.6-9.4 0.3-5 cm
Medium Tilapia 150-365 1-2 0-90 0.3-10.6 0.5-3 cm
Monoculture in cage, n=35
Small Nile tilapia 84-180 1-3 15-56 61-500 22.5-40.0 g
Red tilapia 112-210 1-3 0-90 22-500 22.5-66.7 g
Polyculture (tilapia and white shrimp), n=10:
Small Tilapia 120-240 1-2.5 30 0.6-3.1
White
shrimp
60-120 1-3 60 6.25-62.5
Medium Tilapia 210-280 1-3 60 1-2
White
shrimp
84-90 2-6 30-60 5-125
*Based on one-way ANOVA by Minitab, the stocking density used in tilapia cage culture is significantly different from the densities used in pond culture at 95% CI.
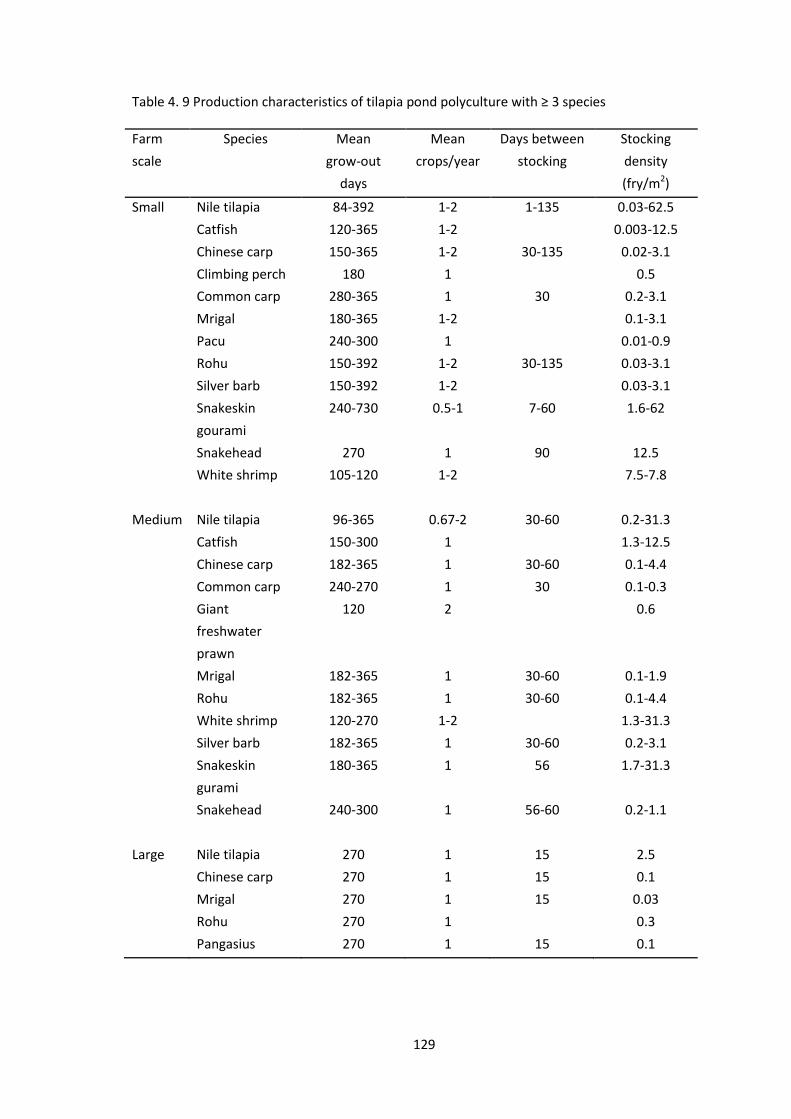
129
Table 4. 9 Production characteristics of tilapia pond polyculture with ≥ 3 species
Farm
scale
Species Mean
grow-out
days
Mean
crops/year
Days between
stocking
Stocking
density
(fry/m2)
Small Nile tilapia 84-392 1-2 1-135 0.03-62.5
Catfish 120-365 1-2 0.003-12.5
Chinese carp 150-365 1-2 30-135 0.02-3.1
Climbing perch 180 1 0.5
Common carp 280-365 1 30 0.2-3.1
Mrigal 180-365 1-2 0.1-3.1
Pacu 240-300 1 0.01-0.9
Rohu 150-392 1-2 30-135 0.03-3.1
Silver barb 150-392 1-2 0.03-3.1
Snakeskin
gourami
240-730 0.5-1 7-60 1.6-62
Snakehead 270 1 90 12.5
White shrimp 105-120 1-2 7.5-7.8
Medium Nile tilapia 96-365 0.67-2 30-60 0.2-31.3
Catfish 150-300 1 1.3-12.5
Chinese carp 182-365 1 30-60 0.1-4.4
Common carp 240-270 1 30 0.1-0.3
Giant
freshwater
prawn
120 2 0.6
Mrigal 182-365 1 30-60 0.1-1.9
Rohu 182-365 1 30-60 0.1-4.4
White shrimp 120-270 1-2 1.3-31.3
Silver barb 182-365 1 30-60 0.2-3.1
Snakeskin
gurami
180-365 1 56 1.7-31.3
Snakehead 240-300 1 56-60 0.2-1.1
Large Nile tilapia 270 1 15 2.5
Chinese carp 270 1 15 0.1
Mrigal 270 1 15 0.03
Rohu 270 1 0.3
Pangasius 270 1 15 0.1

130
4.5.4. Seed source
Shrimp seed come from various sources, but mainly from commercial hatcheries (Figure
4.5). The majority of the shrimp farmers, especially small and medium scale farms did not
know the source of the broodstock the hatcheries were using. It could be that they did
not request for this information from the hatcheries. Whereas the majority of the large
scale farms knew that the broodstock used by the hatcheries were domesticated. Only
one of the large farms surveyed knew the broodstock was domesticated because the
farm was using its own postlarvae as the hatchery is part of their vertically integrated
operations.
Figure 4.5 Source of shrimp seed by farm scale
N: large=16, medium=59, small=124
0%
10%
20%
30%
40%
50%
60%
70%
80%
90%
100%
Large Medium Small
% o
f re
spo
nd
en
ts
Own hatchery – domesticated broodstock
Commercial nursery – domesticated broodstock
Commercial hatchery – domesticated broodstock
Commercial hatchery – broodstock source unknown
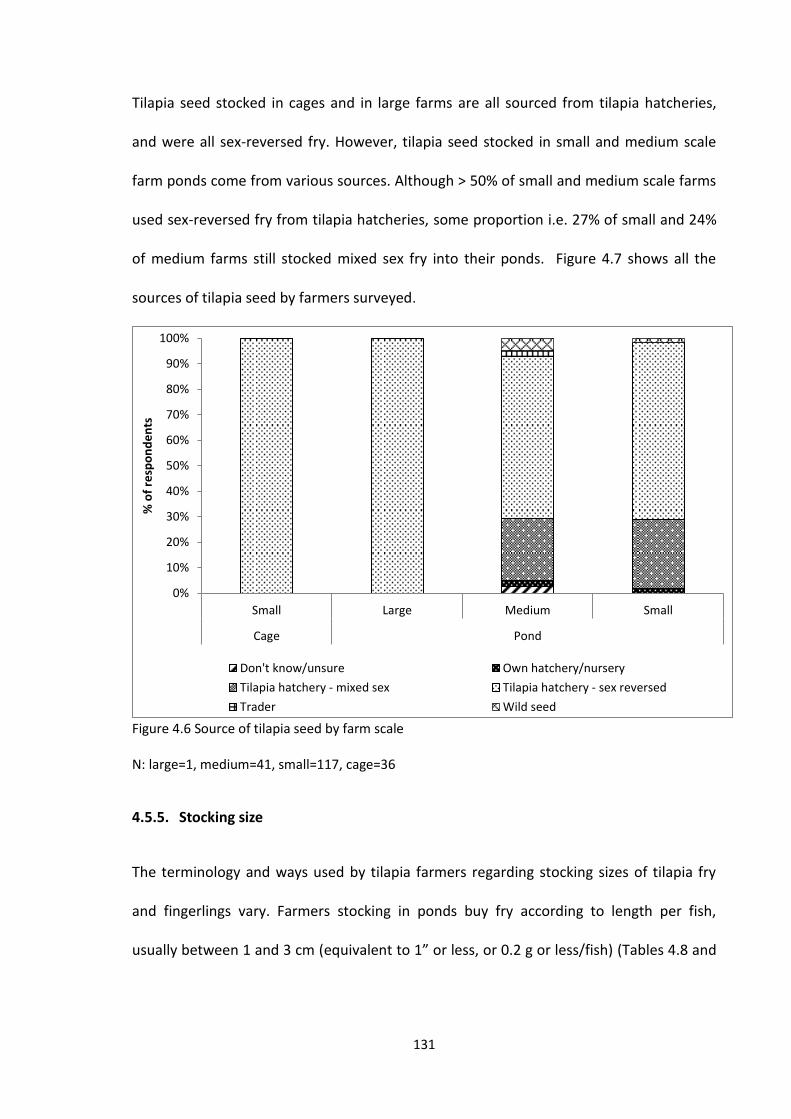
131
Tilapia seed stocked in cages and in large farms are all sourced from tilapia hatcheries,
and were all sex-reversed fry. However, tilapia seed stocked in small and medium scale
farm ponds come from various sources. Although > 50% of small and medium scale farms
used sex-reversed fry from tilapia hatcheries, some proportion i.e. 27% of small and 24%
of medium farms still stocked mixed sex fry into their ponds. Figure 4.7 shows all the
sources of tilapia seed by farmers surveyed.
Figure 4.6 Source of tilapia seed by farm scale
N: large=1, medium=41, small=117, cage=36
4.5.5. Stocking size
The terminology and ways used by tilapia farmers regarding stocking sizes of tilapia fry
and fingerlings vary. Farmers stocking in ponds buy fry according to length per fish,
usually between 1 and 3 cm (equivalent to 1” or less, or 0.2 g or less/fish) (Tables 4.8 and
0%
10%
20%
30%
40%
50%
60%
70%
80%
90%
100%
Small Large Medium Small
Cage Pond
% o
f re
spo
nd
en
ts
Don't know/unsure Own hatchery/nursery
Tilapia hatchery - mixed sex Tilapia hatchery - sex reversed
Trader Wild seed
132
4.9). Farmers would refer to this size as the leaf of the tamarind (bai makham). Cage
farmers mainly stock according to number of fish/kg, weight/fish, and length per fish.
There are at least three stocking sizes for tilapia, i.e. small (1-3 cm or 0.2 g), large (3.5” to
5” or 20-40 g or 25-30 fish/kg), and very large (>60 g). The majority of pond-stocked fry
are small fish, which are cheaper and easier to transport, whereas larger fish are stocked
in cages. Only a few farms (both cages and ponds) stock very large size (>60g/fish) as they
are more expensive and more difficult to transport live, although culture period will be
shorter.
4.5.6. Containment systems
4.5.6.1. Number of ponds and cages
There is a wide variation among the farm scales in terms of the number of containment
units, i.e. ponds and cages, per farm. For small-scale shrimp farms, the number of ponds
per farm ranged from 1 to 20, with an average of 4 ponds, and a mode (majority) of 2
ponds. Whereas for medium scale, there is a range of 1 to 34 ponds per farm with
average of 9 ponds, and a mode (majority) of 5 ponds. For large farms owned by
companies, the number of ponds range from 10 to 146 ponds, with average of 57, and a
mode (majority) of 88 ponds (Figure 4.7).
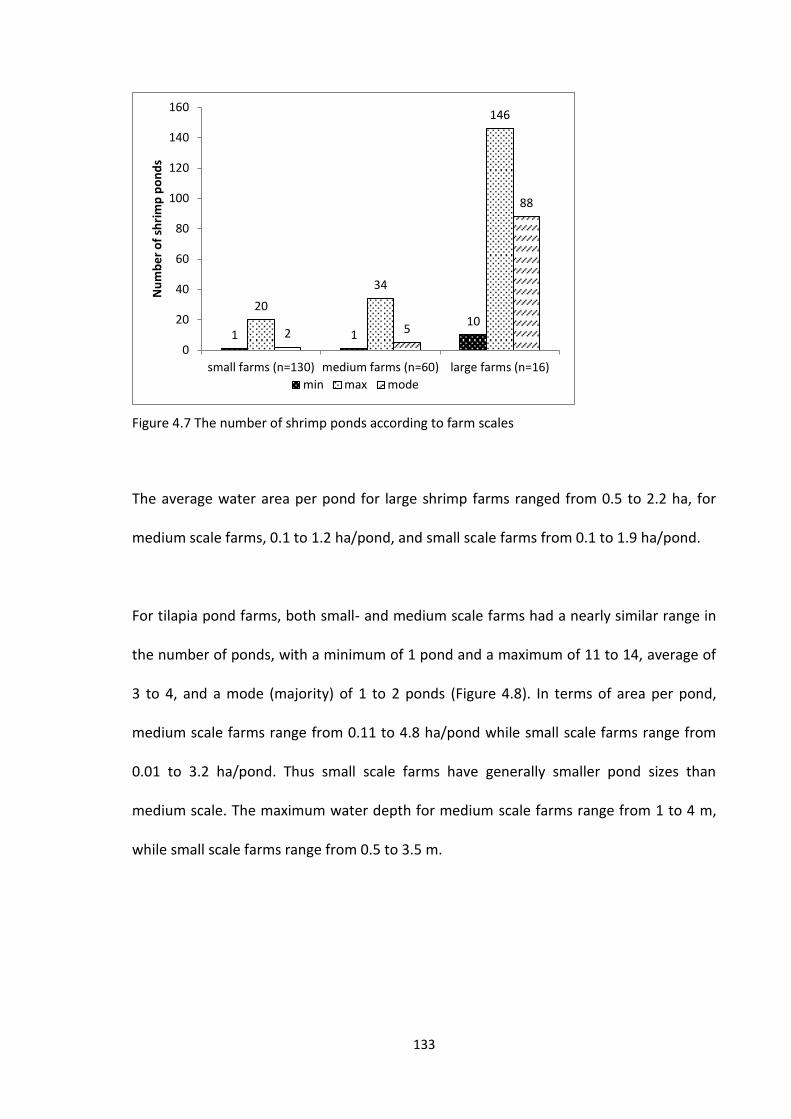
133
Figure 4.7 The number of shrimp ponds according to farm scales
The average water area per pond for large shrimp farms ranged from 0.5 to 2.2 ha, for
medium scale farms, 0.1 to 1.2 ha/pond, and small scale farms from 0.1 to 1.9 ha/pond.
For tilapia pond farms, both small- and medium scale farms had a nearly similar range in
the number of ponds, with a minimum of 1 pond and a maximum of 11 to 14, average of
3 to 4, and a mode (majority) of 1 to 2 ponds (Figure 4.8). In terms of area per pond,
medium scale farms range from 0.11 to 4.8 ha/pond while small scale farms range from
0.01 to 3.2 ha/pond. Thus small scale farms have generally smaller pond sizes than
medium scale. The maximum water depth for medium scale farms range from 1 to 4 m,
while small scale farms range from 0.5 to 3.5 m.
1 1 10
20
34
146
2 5
88
0
20
40
60
80
100
120
140
160
small farms (n=130) medium farms (n=60) large farms (n=16)
Nu
mb
er
of
shri
mp
po
nd
s
min max mode
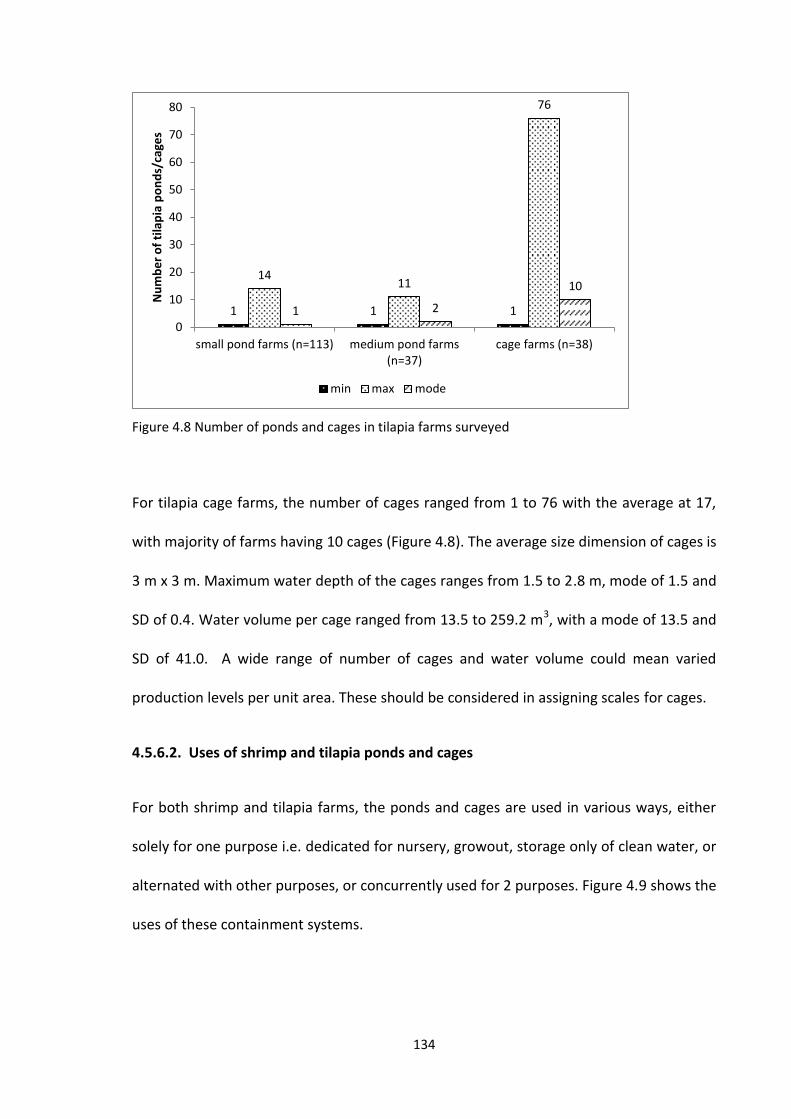
134
Figure 4.8 Number of ponds and cages in tilapia farms surveyed
For tilapia cage farms, the number of cages ranged from 1 to 76 with the average at 17,
with majority of farms having 10 cages (Figure 4.8). The average size dimension of cages is
3 m x 3 m. Maximum water depth of the cages ranges from 1.5 to 2.8 m, mode of 1.5 and
SD of 0.4. Water volume per cage ranged from 13.5 to 259.2 m3, with a mode of 13.5 and
SD of 41.0. A wide range of number of cages and water volume could mean varied
production levels per unit area. These should be considered in assigning scales for cages.
4.5.6.2. Uses of shrimp and tilapia ponds and cages
For both shrimp and tilapia farms, the ponds and cages are used in various ways, either
solely for one purpose i.e. dedicated for nursery, growout, storage only of clean water, or
alternated with other purposes, or concurrently used for 2 purposes. Figure 4.9 shows the
uses of these containment systems.
1 1 1
14 11
76
1 2
10
0
10
20
30
40
50
60
70
80
small pond farms (n=113) medium pond farms(n=37)
cage farms (n=38)
Nu
mb
er
of
tila
pia
po
nd
s/ca
ges
min max mode
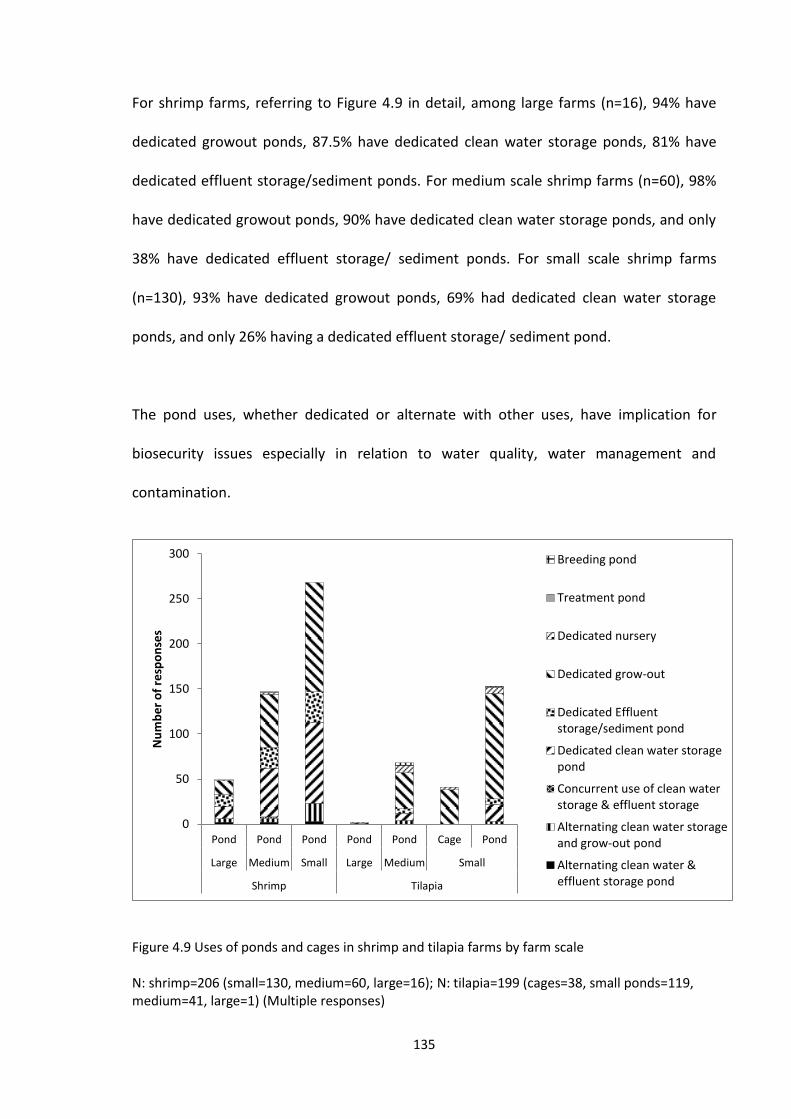
135
For shrimp farms, referring to Figure 4.9 in detail, among large farms (n=16), 94% have
dedicated growout ponds, 87.5% have dedicated clean water storage ponds, 81% have
dedicated effluent storage/sediment ponds. For medium scale shrimp farms (n=60), 98%
have dedicated growout ponds, 90% have dedicated clean water storage ponds, and only
38% have dedicated effluent storage/ sediment ponds. For small scale shrimp farms
(n=130), 93% have dedicated growout ponds, 69% had dedicated clean water storage
ponds, and only 26% having a dedicated effluent storage/ sediment pond.
The pond uses, whether dedicated or alternate with other uses, have implication for
biosecurity issues especially in relation to water quality, water management and
contamination.
Figure 4.9 Uses of ponds and cages in shrimp and tilapia farms by farm scale
N: shrimp=206 (small=130, medium=60, large=16); N: tilapia=199 (cages=38, small ponds=119, medium=41, large=1) (Multiple responses)
0
50
100
150
200
250
300
Pond Pond Pond Pond Pond Cage Pond
Large Medium Small Large Medium Small
Shrimp Tilapia
Nu
mb
er
of
resp
on
ses
Breeding pond
Treatment pond
Dedicated nursery
Dedicated grow-out
Dedicated Effluentstorage/sediment pond
Dedicated clean water storagepond
Concurrent use of clean waterstorage & effluent storage
Alternating clean water storageand grow-out pond
Alternating clean water &effluent storage pond
136
For all the tilapia pond farms, the majority of their ponds are dedicated for growout
production. Almost 20% of the medium (n=41) and 16% of the small scale (n=119) pond
farms attempt to have dedicated ponds for clean water storage, to ensure availability of
supply when needed. A few of the pond farms (10% medium and 2% small) use their
growout ponds as alternative units to store clean water. However the majority would
have no stored clean water which could be critical if pond water quality deteriorates and
these farms do not have clean water to exchange.
4.5.7. Status of farm operations according to selected standards and certifications
criteria
4.5.7.1. Legal aspects: Obey the law and comply with all national and local regulations.
Figure 4.10 shows the status of the shrimp and tilapia farms surveyed in terms of their
compliance with the Department of Fisheries regulation for registration of farms for
ThaiGAP (ACFS, 2009) as well as for the Fisheries Movement Document (FMD). These
documents are more important and relevant for shrimp farmers because these are
requirements for trading with processing plants for export of shrimp, as part of the
traceability system. Whereas for tilapia, as most of the production (about 90%) are for the
domestic market, such documents are less important, although the Department of
Fisheries does try to encourage farms to register for other purposes such as for data
collection and statistics. Access rights (mainly fisheries and aquaculture in public waters)
are governed under the Fisheries Act regulated by DoF, while ownership, development
and other land use are governed by other government agencies such as Land
Development, Ministry of Natural Resources and Environment, and Pollution Control
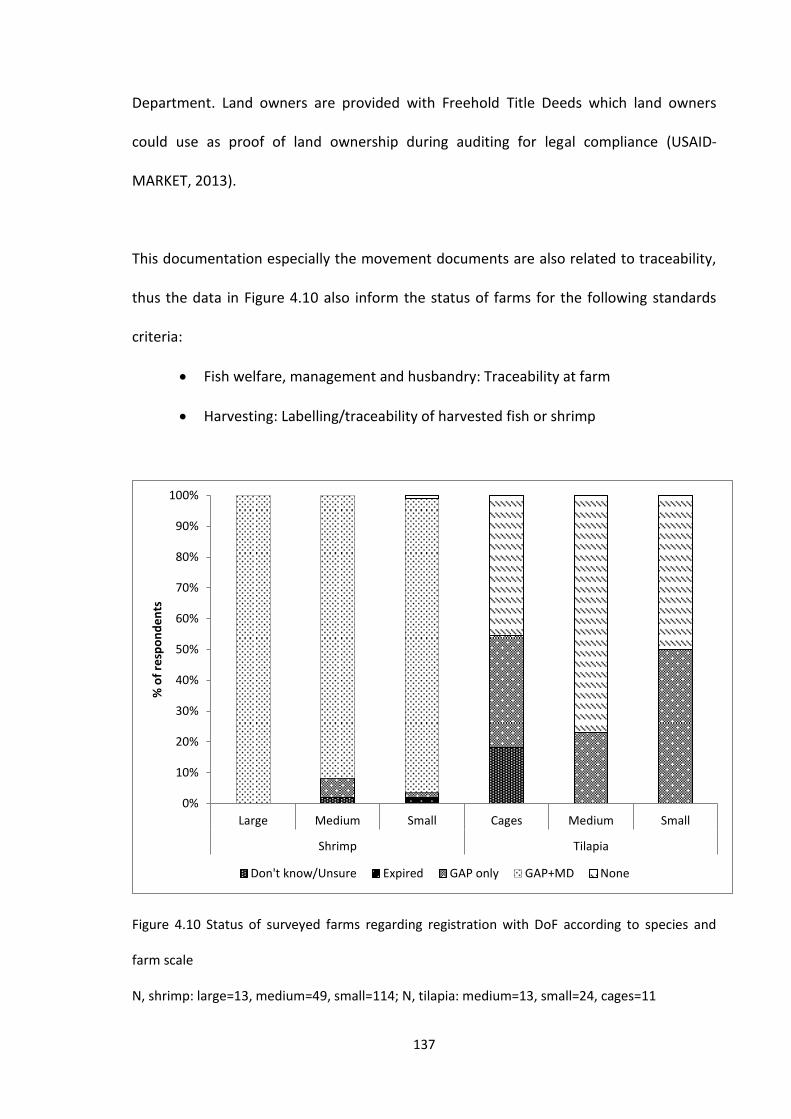
137
Department. Land owners are provided with Freehold Title Deeds which land owners
could use as proof of land ownership during auditing for legal compliance (USAID-
MARKET, 2013).
This documentation especially the movement documents are also related to traceability,
thus the data in Figure 4.10 also inform the status of farms for the following standards
criteria:
Fish welfare, management and husbandry: Traceability at farm
Harvesting: Labelling/traceability of harvested fish or shrimp
Figure 4.10 Status of surveyed farms regarding registration with DoF according to species and
farm scale
N, shrimp: large=13, medium=49, small=114; N, tilapia: medium=13, small=24, cages=11
0%
10%
20%
30%
40%
50%
60%
70%
80%
90%
100%
Large Medium Small Cages Medium Small
Shrimp Tilapia
% o
f re
spo
nd
en
ts
Don't know/Unsure Expired GAP only GAP+MD None
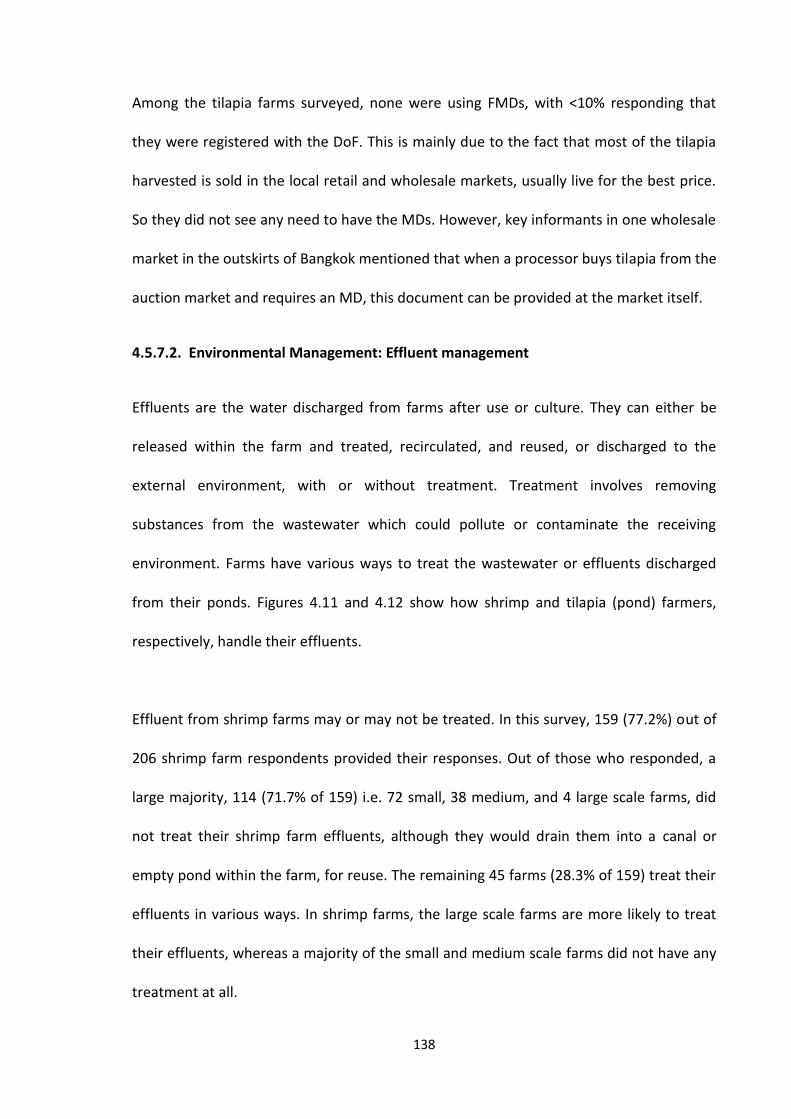
138
Among the tilapia farms surveyed, none were using FMDs, with <10% responding that
they were registered with the DoF. This is mainly due to the fact that most of the tilapia
harvested is sold in the local retail and wholesale markets, usually live for the best price.
So they did not see any need to have the MDs. However, key informants in one wholesale
market in the outskirts of Bangkok mentioned that when a processor buys tilapia from the
auction market and requires an MD, this document can be provided at the market itself.
4.5.7.2. Environmental Management: Effluent management
Effluents are the water discharged from farms after use or culture. They can either be
released within the farm and treated, recirculated, and reused, or discharged to the
external environment, with or without treatment. Treatment involves removing
substances from the wastewater which could pollute or contaminate the receiving
environment. Farms have various ways to treat the wastewater or effluents discharged
from their ponds. Figures 4.11 and 4.12 show how shrimp and tilapia (pond) farmers,
respectively, handle their effluents.
Effluent from shrimp farms may or may not be treated. In this survey, 159 (77.2%) out of
206 shrimp farm respondents provided their responses. Out of those who responded, a
large majority, 114 (71.7% of 159) i.e. 72 small, 38 medium, and 4 large scale farms, did
not treat their shrimp farm effluents, although they would drain them into a canal or
empty pond within the farm, for reuse. The remaining 45 farms (28.3% of 159) treat their
effluents in various ways. In shrimp farms, the large scale farms are more likely to treat
their effluents, whereas a majority of the small and medium scale farms did not have any
treatment at all.
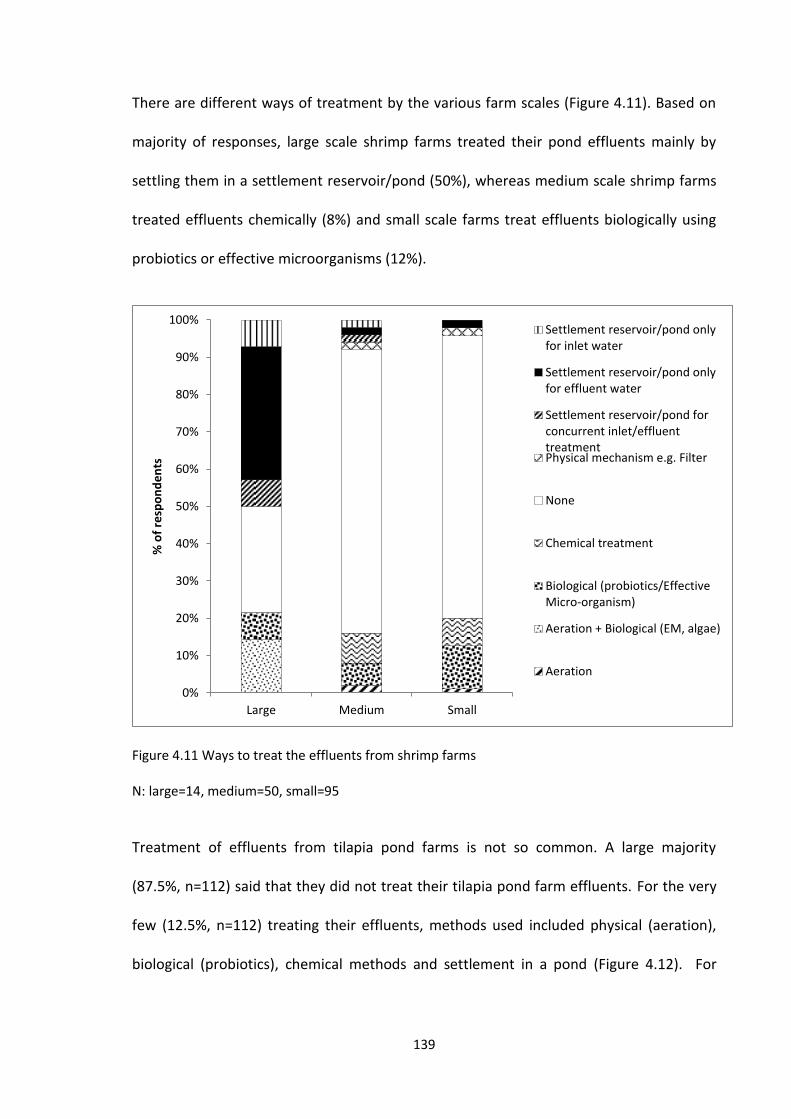
139
There are different ways of treatment by the various farm scales (Figure 4.11). Based on
majority of responses, large scale shrimp farms treated their pond effluents mainly by
settling them in a settlement reservoir/pond (50%), whereas medium scale shrimp farms
treated effluents chemically (8%) and small scale farms treat effluents biologically using
probiotics or effective microorganisms (12%).
Figure 4.11 Ways to treat the effluents from shrimp farms
N: large=14, medium=50, small=95
Treatment of effluents from tilapia pond farms is not so common. A large majority
(87.5%, n=112) said that they did not treat their tilapia pond farm effluents. For the very
few (12.5%, n=112) treating their effluents, methods used included physical (aeration),
biological (probiotics), chemical methods and settlement in a pond (Figure 4.12). For
0%
10%
20%
30%
40%
50%
60%
70%
80%
90%
100%
Large Medium Small
% o
f re
spo
nd
en
ts
Settlement reservoir/pond onlyfor inlet water
Settlement reservoir/pond onlyfor effluent water
Settlement reservoir/pond forconcurrent inlet/effluenttreatmentPhysical mechanism e.g. Filter
None
Chemical treatment
Biological (probiotics/EffectiveMicro-organism)
Aeration + Biological (EM, algae)
Aeration
140
both medium and small scale pond farms, biological treatment using probiotics and
effective microorganism (EM) was most common.
Figure 4.12 Status of effluent treatment among tilapia pond farms
N: medium=28; small=84
4.5.7.2.1. Discharge methods and routes
Farms discharge the waste water or effluent from their culture ponds into another
location inside the farm, mainly into the drainage canal which is part of their farm system.
The certification standards do not specify how farms should remove the wastewater from
the pond to another area but are more concerned on whether the effluents are released
into the external environment, and that they should be treated prior to discharge.
Figure 4.13 shows that the majority of the farms have their own drainage system within
the farm. Thus this would likely minimise impacts external to the farm. It has to be noted
that especially for shrimp farms, closed and recirculating systems are commonly used
which means that the water discharged from the culture ponds is not allowed to leave
0%
20%
40%
60%
80%
100%
Medium Small
% o
f re
spo
nd
en
ts
Settlement reservoir/pond only for effluent water None
Chemical treatment Biological (probiotics/Effective Micro-organisms)
Aeration

141
the farm but kept in another pond for the next culture period. This is likely to be similar
for tilapia farms as water is scarce. Tilapia pond farms pumping into its own drainage
system is the majority choice for both small (73%) and medium (50%) scale farms.
Gravity, by pumping and a combination of both were the modes of discharge used by
shrimp farms. For large scale farms, the majority (>50% of large scale farms, n=14) used
gravity draining, whereas pumping out was more common among almost half of the
medium (n=47) and small scale (n=96) farmers.
Section 4.4.10 on energy use describes the source of energy for pumping water was
affected by farm scale; a large majority of farms used diesel pumps, i.e. > 70% of small
and medium scale shrimp farmers, and > 80% of tilapia small and medium scale. Large
scale shrimp farms were more likely to use a combination of grid electricity (> 60%) and
diesel (50%). However the information was not specific whether the pumping was for
inlet or effluent discharge.
With nearly all the ponds having their own drainage system, this means that whether the
effluent is pumped out and/or allowed to flow out by gravity, effluents would remain
within drainage canals within the farm for settlement and reuse.
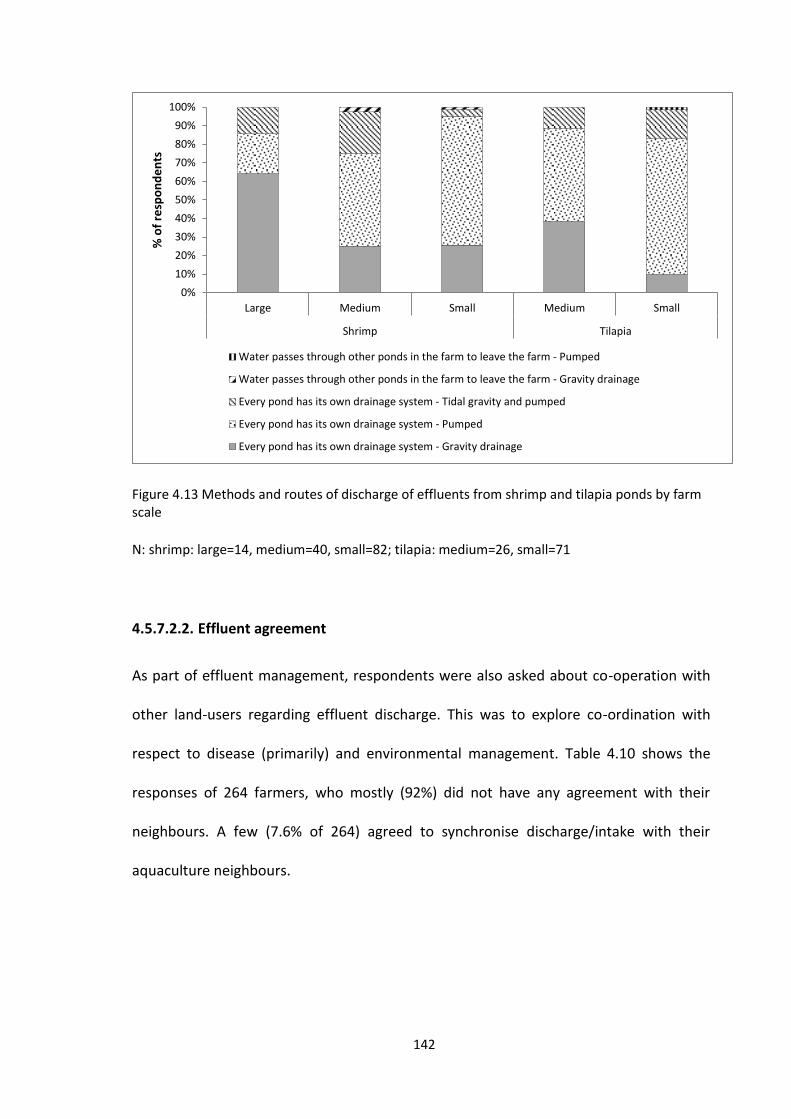
142
Figure 4.13 Methods and routes of discharge of effluents from shrimp and tilapia ponds by farm scale
N: shrimp: large=14, medium=40, small=82; tilapia: medium=26, small=71
4.5.7.2.2. Effluent agreement
As part of effluent management, respondents were also asked about co-operation with
other land-users regarding effluent discharge. This was to explore co-ordination with
respect to disease (primarily) and environmental management. Table 4.10 shows the
responses of 264 farmers, who mostly (92%) did not have any agreement with their
neighbours. A few (7.6% of 264) agreed to synchronise discharge/intake with their
aquaculture neighbours.
0%
10%
20%
30%
40%
50%
60%
70%
80%
90%
100%
Large Medium Small Medium Small
Shrimp Tilapia
% o
f re
spo
nd
en
ts
Water passes through other ponds in the farm to leave the farm - Pumped
Water passes through other ponds in the farm to leave the farm - Gravity drainage
Every pond has its own drainage system - Tidal gravity and pumped
Every pond has its own drainage system - Pumped
Every pond has its own drainage system - Gravity drainage
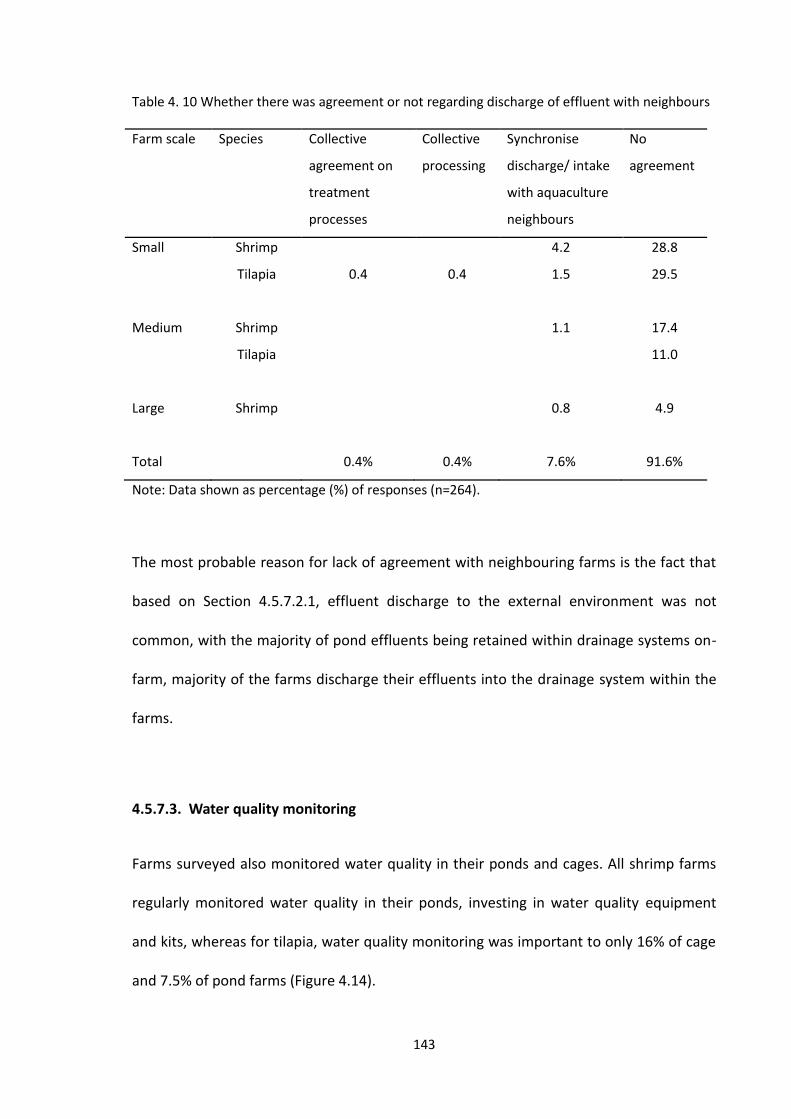
143
Table 4. 10 Whether there was agreement or not regarding discharge of effluent with neighbours
Farm scale Species Collective
agreement on
treatment
processes
Collective
processing
Synchronise
discharge/ intake
with aquaculture
neighbours
No
agreement
Small Shrimp 4.2 28.8
Tilapia 0.4 0.4 1.5 29.5
Medium Shrimp 1.1 17.4
Tilapia 11.0
Large Shrimp 0.8 4.9
Total 0.4% 0.4% 7.6% 91.6%
Note: Data shown as percentage (%) of responses (n=264).
The most probable reason for lack of agreement with neighbouring farms is the fact that
based on Section 4.5.7.2.1, effluent discharge to the external environment was not
common, with the majority of pond effluents being retained within drainage systems on-
farm, majority of the farms discharge their effluents into the drainage system within the
farms.
4.5.7.3. Water quality monitoring
Farms surveyed also monitored water quality in their ponds and cages. All shrimp farms
regularly monitored water quality in their ponds, investing in water quality equipment
and kits, whereas for tilapia, water quality monitoring was important to only 16% of cage
and 7.5% of pond farms (Figure 4.14).
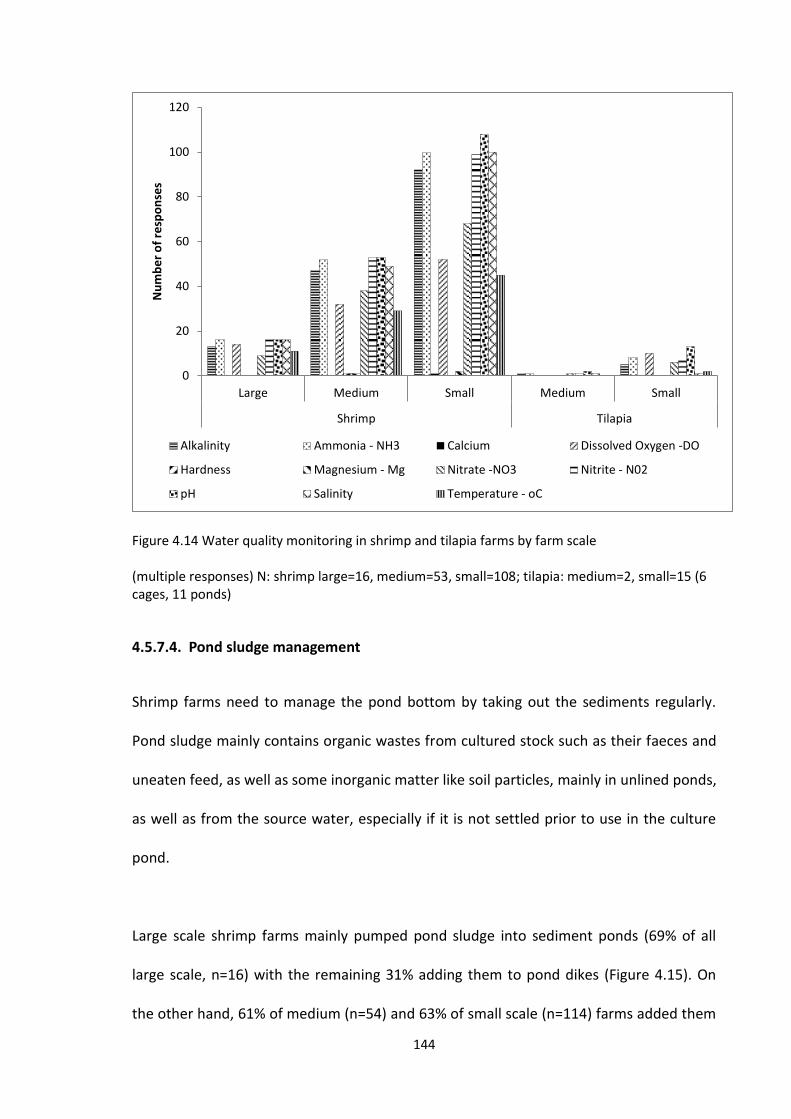
144
Figure 4.14 Water quality monitoring in shrimp and tilapia farms by farm scale
(multiple responses) N: shrimp large=16, medium=53, small=108; tilapia: medium=2, small=15 (6 cages, 11 ponds)
4.5.7.4. Pond sludge management
Shrimp farms need to manage the pond bottom by taking out the sediments regularly.
Pond sludge mainly contains organic wastes from cultured stock such as their faeces and
uneaten feed, as well as some inorganic matter like soil particles, mainly in unlined ponds,
as well as from the source water, especially if it is not settled prior to use in the culture
pond.
Large scale shrimp farms mainly pumped pond sludge into sediment ponds (69% of all
large scale, n=16) with the remaining 31% adding them to pond dikes (Figure 4.15). On
the other hand, 61% of medium (n=54) and 63% of small scale (n=114) farms added them
0
20
40
60
80
100
120
Large Medium Small Medium Small
Shrimp Tilapia
Nu
mb
er
of
resp
on
ses
Alkalinity Ammonia - NH3 Calcium Dissolved Oxygen -DO
Hardness Magnesium - Mg Nitrate -NO3 Nitrite - N02
pH Salinity Temperature - oC
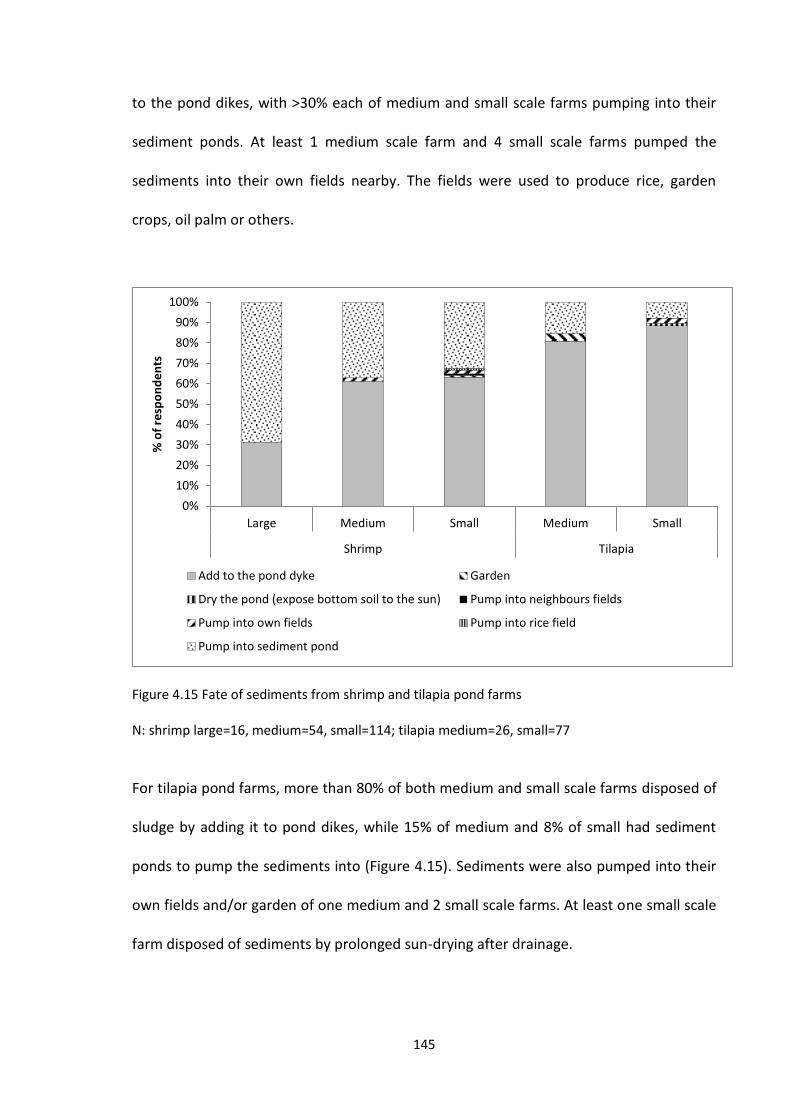
145
to the pond dikes, with >30% each of medium and small scale farms pumping into their
sediment ponds. At least 1 medium scale farm and 4 small scale farms pumped the
sediments into their own fields nearby. The fields were used to produce rice, garden
crops, oil palm or others.
Figure 4.15 Fate of sediments from shrimp and tilapia pond farms
N: shrimp large=16, medium=54, small=114; tilapia medium=26, small=77
For tilapia pond farms, more than 80% of both medium and small scale farms disposed of
sludge by adding it to pond dikes, while 15% of medium and 8% of small had sediment
ponds to pump the sediments into (Figure 4.15). Sediments were also pumped into their
own fields and/or garden of one medium and 2 small scale farms. At least one small scale
farm disposed of sediments by prolonged sun-drying after drainage.
0%
10%
20%
30%
40%
50%
60%
70%
80%
90%
100%
Large Medium Small Medium Small
Shrimp Tilapia
% o
f re
spo
nd
en
ts
Add to the pond dyke Garden
Dry the pond (expose bottom soil to the sun) Pump into neighbours fields
Pump into own fields Pump into rice field
Pump into sediment pond

146
The majority (73%) of shrimp farms (n=184) removed sediments after more than one
cycle (Figure 4.16). This trend is reflected by farm scale as follows: 69% of large scale
(n=16), 70% of medium scale (n=53) and 77% of small scale (n=115) farms. The culture
cycle for shrimp is from 1-4 cycles per year (Table 4.7). Large shrimp farms had a longer
interval between removing sediments, i.e. every 3-4 and up to 8 years (Figure 4.17). The
majority of medium and small scale shrimp farms removed sediments more frequently
(every 1-2 years). The sediment build-up in the pond is related to nutrient loading based
on feed, which in turn is related to stocking density. In addition, other farm management
features such as water exchange, aeration, pond design and lining status could play a role
in the build-up of sediments.
Figure 4.16 Frequency of sediment removal in shrimp and tilapia pond farms according to farm
scale N, shrimp: large=16, medium=53, small=115; N, tilapia: medium=26, small=74
0%
10%
20%
30%
40%
50%
60%
70%
80%
90%
100%
Large Medium Small Medium Small
Shrimp Tilapia
2 times during the culture cycle After every culture cycle
After more than one culture cycle Once during the culture cycle

147
Tilapia pond farms also followed similar trends i.e. 54% of medium (n=26) and 72% of
small scale (n=74) farms removed sediments after more than one cycle. The culture cycle
for tilapia in ponds is from 1-2 cycles per year (Tables 4.8 and 4.9), thus removal was from
every year up to every 5 years (Figure 4.17).
Figure 4.17 Detailed frequency of removing sediments for more than one culture cycle
N, shrimp: large=2, medium=17, small=28; N, tilapia: medium=1, small=12
4.5.7.5. Feed Management
4.5.7.5.1. Feed manufacturers
Figure 4.18 shows the various feed types used for shrimp and tilapia culture. The use of
commercial industrial sinking pellets among shrimp farms was universal in this survey.
0
5
10
15
20
25
30
Large Medium Small Medium Small
Shrimp Tilapia
Nu
mb
er
of
resp
on
ses
2 years 2-4 years every 10 years every 1-2 years every 2 crops
every 2 years every 2-3 crops every 2-3 years every 3 crops every 3 years
every 3-4 years every 5 years every 6 months every 8 years every year
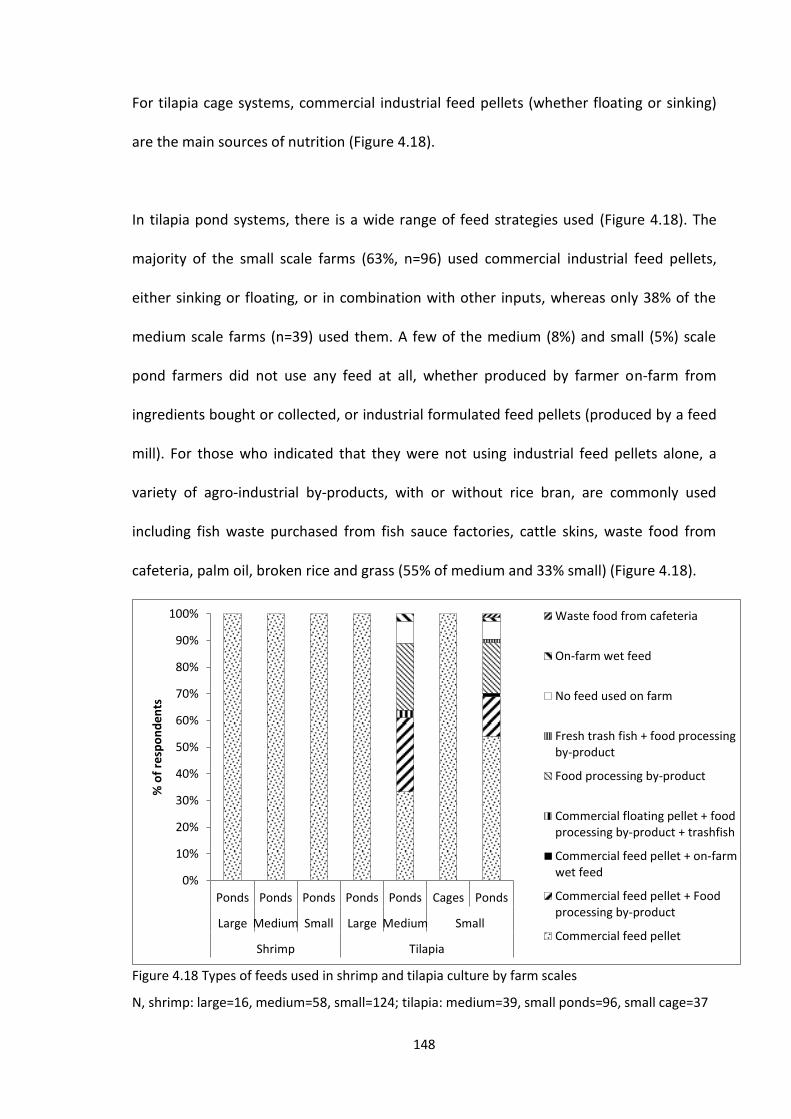
148
For tilapia cage systems, commercial industrial feed pellets (whether floating or sinking)
are the main sources of nutrition (Figure 4.18).
In tilapia pond systems, there is a wide range of feed strategies used (Figure 4.18). The
majority of the small scale farms (63%, n=96) used commercial industrial feed pellets,
either sinking or floating, or in combination with other inputs, whereas only 38% of the
medium scale farms (n=39) used them. A few of the medium (8%) and small (5%) scale
pond farmers did not use any feed at all, whether produced by farmer on-farm from
ingredients bought or collected, or industrial formulated feed pellets (produced by a feed
mill). For those who indicated that they were not using industrial feed pellets alone, a
variety of agro-industrial by-products, with or without rice bran, are commonly used
including fish waste purchased from fish sauce factories, cattle skins, waste food from
cafeteria, palm oil, broken rice and grass (55% of medium and 33% small) (Figure 4.18).
Figure 4.18 Types of feeds used in shrimp and tilapia culture by farm scales
N, shrimp: large=16, medium=58, small=124; tilapia: medium=39, small ponds=96, small cage=37
0%
10%
20%
30%
40%
50%
60%
70%
80%
90%
100%
Ponds Ponds Ponds Ponds Ponds Cages Ponds
Large Medium Small Large Medium Small
Shrimp Tilapia
% o
f re
spo
nd
en
ts
Waste food from cafeteria
On-farm wet feed
No feed used on farm
Fresh trash fish + food processingby-product
Food processing by-product
Commercial floating pellet + foodprocessing by-product + trashfish
Commercial feed pellet + on-farmwet feed
Commercial feed pellet + Foodprocessing by-product
Commercial feed pellet

149
Figure 4.19 shows that there are three shrimp feed manufacturers preferred by shrimp
farms. A major feed company (named here as Company A to protect identity) is preferred
by nearly 65% of the surveyed farms (75% large, 64% medium, 64% small). Small scale
farms tended to use a greater variety of feed manufacturers than the large and medium
scale farms.
Figure 4.19 Shrimp feed manufacturer preference
n, large=16, medium=56, small=118 (multiple responses)
The lone large tilapia farm had its own feed mill to produce feed pellets for use in the
farm. Medium and small scale tilapia farms sourced feed from a number of different
manufacturers. The same feed company (Company A) most preferred by shrimp farmers
was also preferred by 71% of the tilapia pond farms, but by only 18% of the cage farms
(Figure 4.20).
0
10
20
30
40
50
60
70
80
Large Medium Small
Nu
mb
er
of
resp
on
ses
Company A Company B Company C Company D Company E
Company F Company G Company H Others
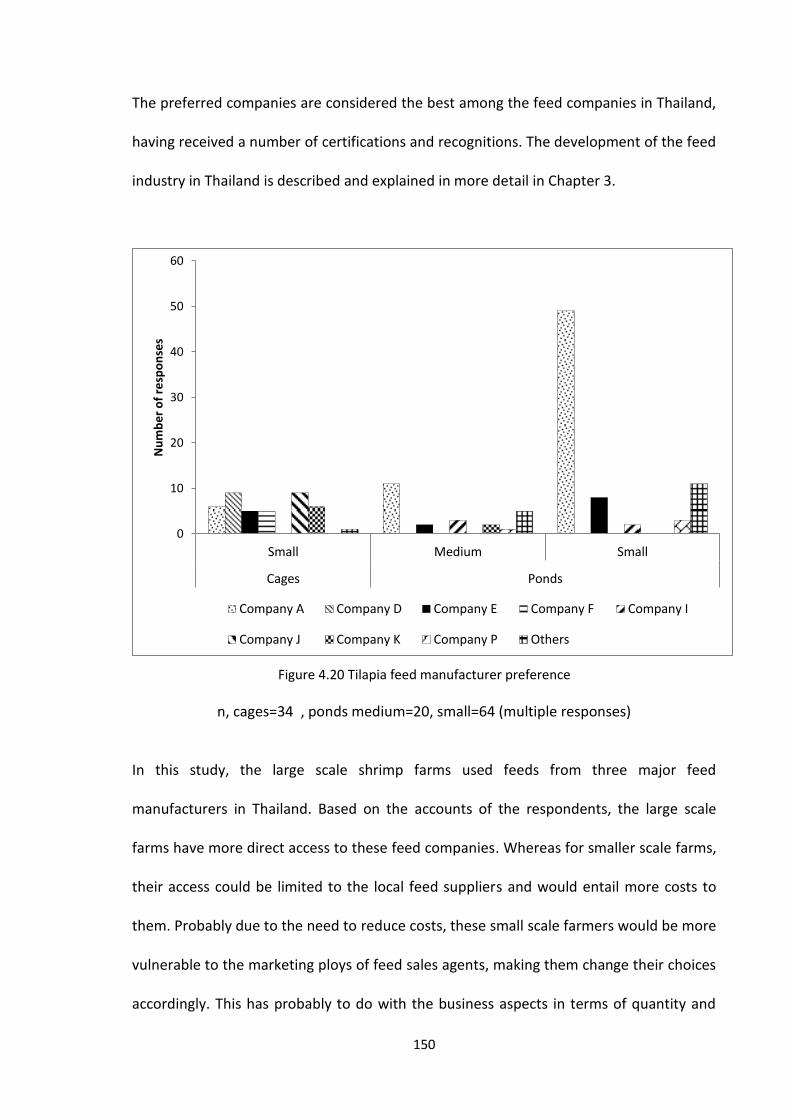
150
The preferred companies are considered the best among the feed companies in Thailand,
having received a number of certifications and recognitions. The development of the feed
industry in Thailand is described and explained in more detail in Chapter 3.
Figure 4.20 Tilapia feed manufacturer preference
n, cages=34 , ponds medium=20, small=64 (multiple responses)
In this study, the large scale shrimp farms used feeds from three major feed
manufacturers in Thailand. Based on the accounts of the respondents, the large scale
farms have more direct access to these feed companies. Whereas for smaller scale farms,
their access could be limited to the local feed suppliers and would entail more costs to
them. Probably due to the need to reduce costs, these small scale farmers would be more
vulnerable to the marketing ploys of feed sales agents, making them change their choices
accordingly. This has probably to do with the business aspects in terms of quantity and
0
10
20
30
40
50
60
Small Medium Small
Cages Ponds
Nu
mb
er
of
resp
on
ses
Company A Company D Company E Company F Company I
Company J Company K Company P Others

151
frequency of orders, agreements, accessibility, brand loyalty, delivery and technical
services, and negotiations between feed companies/sellers and shrimp companies and
farmers. However, farmers still needed to be vigilant in choosing which manufacturers
had feed certifications (issued by the DoF from random checking) to ensure that the feeds
used were not contaminated/ adulterated.
4.5.7.5.2. Feed records
Shrimp farms were more likely to keep records regarding feeds than tilapia producers, i.e.
large scale shrimp farms (100%), medium (95%) and small (73%) (Figure 4.21). For tilapia
farms, 66% of cage farms, 56% of small pond farms and 30% of medium pond farms kept
records about feed use. These percentages are based only on the total number of farms
keeping records. It has to be noted that among tilapia pond farms, more small scale farms
used commercial feed pellets than medium scale, which could probably be the reason
why more small scale farmers kept records. Feed companies usually provided free record
keeping books to farmers with ready to fill tables.
4.5.7.6. Traceability: Record keeping
Information on traceability from hatchery to processing is contained in the Fisheries
Movement Documents, especially for shrimp production destined for export. The
hatcheries provided the document called Fry MD to the growout producers every time
post-larvae were sold. Then when the harvest in growout ponds were ready, the
producers would report the information on pond area, production and harvest size, to the
local office of the Department of Fisheries, to obtain an MD of growout harvest or
production. Then the producers would give these documents to the buyers (brokers or
152
market wholesalers or processors), who in turn would pass them on to the exporters.
According to exporters interviewed, they would keep these documents, and could
provide them to foreign buyers/ exporters when requested.
Traceability of goods used and processes occurring (outside and within the farms) during
production could be achieved through regular record keeping. For those from outside the
farm, this would require issuing certain documents or certifications such as from
manufacturers of feed and other substances.
Within the farm, Figure 4.21 shows the farm data recorded by farm respondents
according to farm scale. Most of the data recorded were water quality parameters and
feed usage as these were asked in the survey. However other data such as financial
information are also recorded among others especially for medium and large scale farms.
For shrimp, large scale farms consider the parameters water quality, stocking, mortality,
growth, feed and chemical use (Figure 4.21) as equally important to record, whereas for
the medium and small scale farms, stocking, feed and water quality were the most
important.
For tilapia cages, stocking, feeding and chemical use were important to record. For
medium-scale tilapia pond farms, stocking information was the most recorded, while for
small scale pond farms, stocking and feeding were most recorded.

153
Figure 4.21 Record keeping by species and farm scales
N, shrimp: large=16, medium=60, small=130; N, tilapia: ponds-large=1, medium=27, small ponds=86, small cages=32 (multiple responses)
4.5.7.7. Energy use
The main sources of energy in shrimp farms were a combination of diesel and grid
electricity, whereas for tilapia farms, diesel was the main source for pond farms and grid
electricity for cage farms (Figure 4.22). In addition, shrimp farms also used other energy
sources such as propane or liquefied petroleum gas (LPG) and gasoline. Small and
medium scale farmers tried to reduce costs by combining energy sources rather than just
depending on grid electricity alone. The majority of shrimp farms of all scales (76% small,
86% medium and 62.5% large) used a combination of energy sources to power farm
activities.
0
20
40
60
80
100
120
Large Medium Small Small Large Medium Small
Ponds Cages Ponds
Shrimp Tilapia
Nu
mb
er
of
resp
on
ses
Chemical use Feed Financial Growth Mortality Stocking Water quality
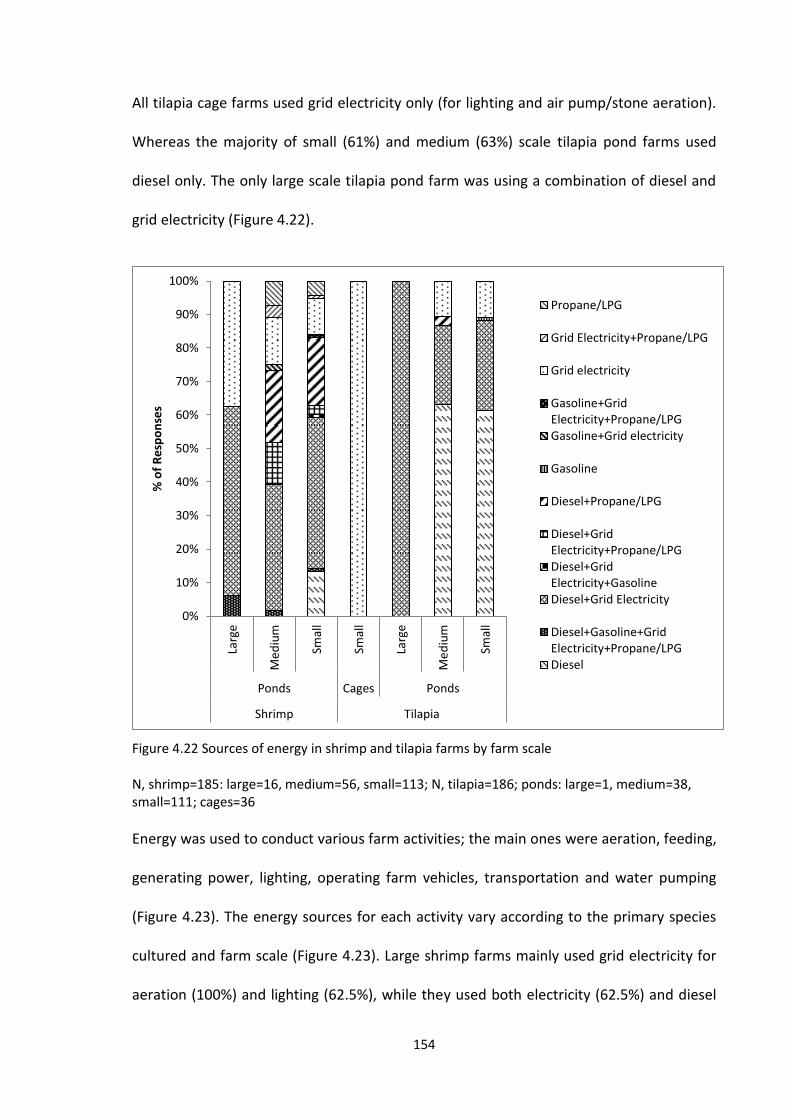
154
All tilapia cage farms used grid electricity only (for lighting and air pump/stone aeration).
Whereas the majority of small (61%) and medium (63%) scale tilapia pond farms used
diesel only. The only large scale tilapia pond farm was using a combination of diesel and
grid electricity (Figure 4.22).
Figure 4.22 Sources of energy in shrimp and tilapia farms by farm scale
N, shrimp=185: large=16, medium=56, small=113; N, tilapia=186; ponds: large=1, medium=38, small=111; cages=36
Energy was used to conduct various farm activities; the main ones were aeration, feeding,
generating power, lighting, operating farm vehicles, transportation and water pumping
(Figure 4.23). The energy sources for each activity vary according to the primary species
cultured and farm scale (Figure 4.23). Large shrimp farms mainly used grid electricity for
aeration (100%) and lighting (62.5%), while they used both electricity (62.5%) and diesel
0%
10%
20%
30%
40%
50%
60%
70%
80%
90%
100%
Larg
e
Me
diu
m
Smal
l
Smal
l
Larg
e
Me
diu
m
Smal
l
Ponds Cages Ponds
Shrimp Tilapia
% o
f R
esp
on
ses
Propane/LPG
Grid Electricity+Propane/LPG
Grid electricity
Gasoline+GridElectricity+Propane/LPGGasoline+Grid electricity
Gasoline
Diesel+Propane/LPG
Diesel+GridElectricity+Propane/LPGDiesel+GridElectricity+GasolineDiesel+Grid Electricity
Diesel+Gasoline+GridElectricity+Propane/LPGDiesel
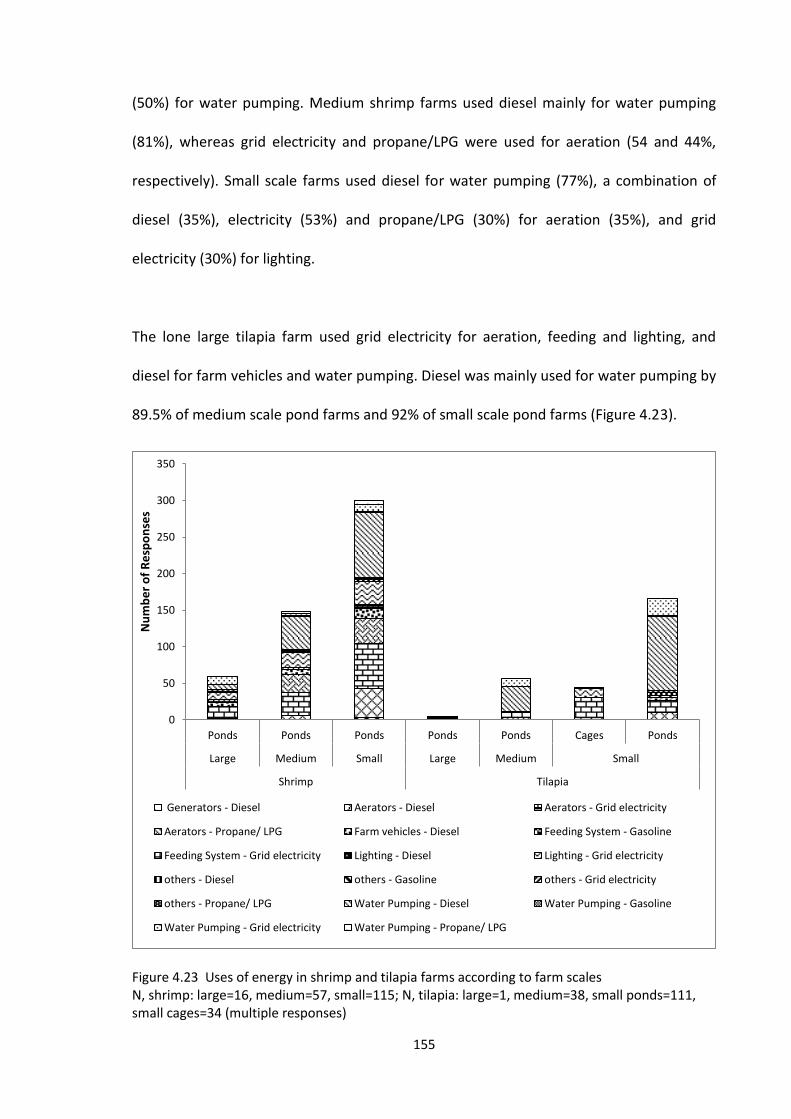
155
(50%) for water pumping. Medium shrimp farms used diesel mainly for water pumping
(81%), whereas grid electricity and propane/LPG were used for aeration (54 and 44%,
respectively). Small scale farms used diesel for water pumping (77%), a combination of
diesel (35%), electricity (53%) and propane/LPG (30%) for aeration (35%), and grid
electricity (30%) for lighting.
The lone large tilapia farm used grid electricity for aeration, feeding and lighting, and
diesel for farm vehicles and water pumping. Diesel was mainly used for water pumping by
89.5% of medium scale pond farms and 92% of small scale pond farms (Figure 4.23).
Figure 4.23 Uses of energy in shrimp and tilapia farms according to farm scales N, shrimp: large=16, medium=57, small=115; N, tilapia: large=1, medium=38, small ponds=111, small cages=34 (multiple responses)
0
50
100
150
200
250
300
350
Ponds Ponds Ponds Ponds Ponds Cages Ponds
Large Medium Small Large Medium Small
Shrimp Tilapia
Nu
mb
er
of
Re
spo
nse
s
Generators - Diesel Aerators - Diesel Aerators - Grid electricity
Aerators - Propane/ LPG Farm vehicles - Diesel Feeding System - Gasoline
Feeding System - Grid electricity Lighting - Diesel Lighting - Grid electricity
others - Diesel others - Gasoline others - Grid electricity
others - Propane/ LPG Water Pumping - Diesel Water Pumping - Gasoline
Water Pumping - Grid electricity Water Pumping - Propane/ LPG

156
4.5.7.8. Predator control
Farmers and operators had to employ various ways to guard or protect their farms
against animal predators and human poachers. These ways depend on species cultured
and farm scales (Figure 4.24). Table 4.11 shows the number of precautionary measures
employed according to farm scale. The measures taken by farms reflected the value of
the species being farmed and the intensity of operations, i.e. there are more measures
taken to protect shrimp farms and tilapia cages as there is more threat of theft and
poaching due to the higher value of their stock.
Figure 4.24 Precautions taken by farms against predation and poaching by farm scale N, shrimp: large=16, medium=60, small=130; N, tilapia: large=1, medium=41, small ponds=119, cages=38 (multiple responses, weighted data)
0
50
100
150
200
250
300
Ponds Ponds Ponds Ponds Ponds Cages Ponds
Large Medium Small Large Medium Small
Shrimp Tilapia
Nu
mb
er
of
resp
on
ses
Watchman
Strings over ponds
Screening of inlet around outletpipesPoison or traps
Plant lotus in the pond (to protectfish)Physically chasing away
PE lining
PE around individual pond
None
Netting over ponds
Net screening around the wholefarmNet screening around individualpondsLighting
Guard Dogs
Gate
Fence on one side/zone and canalon the other sideFence around the whole farm
canal around the farm
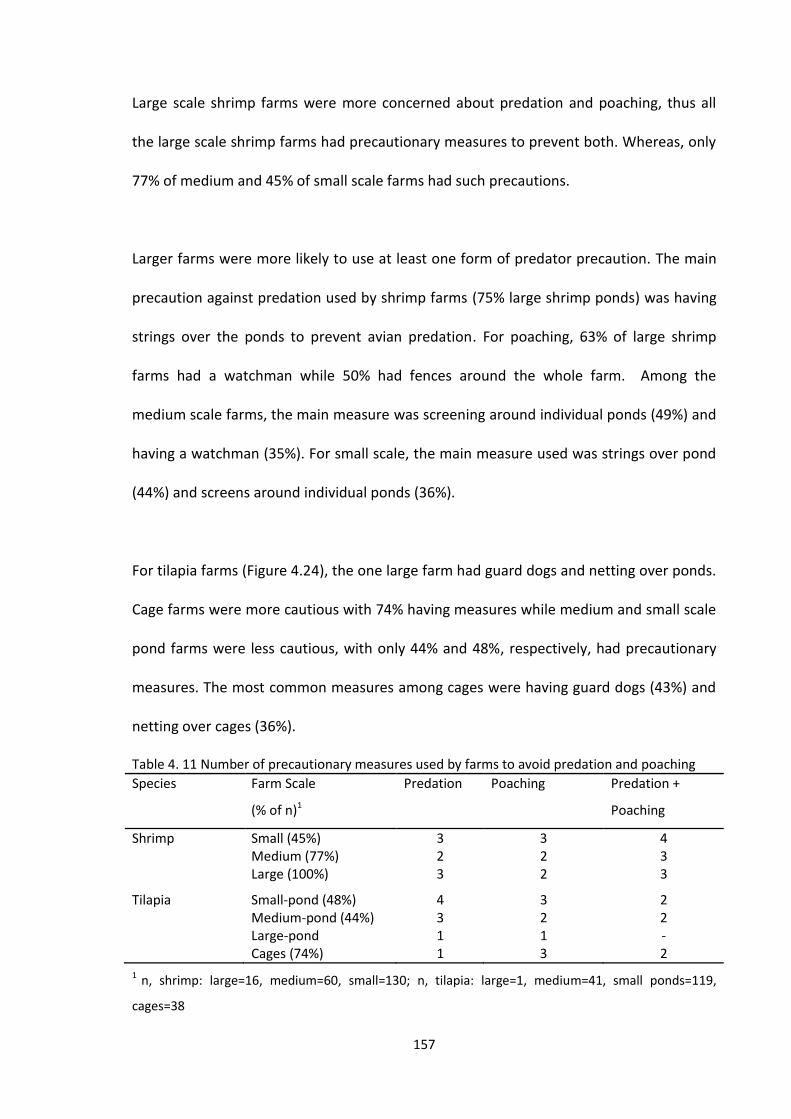
157
Large scale shrimp farms were more concerned about predation and poaching, thus all
the large scale shrimp farms had precautionary measures to prevent both. Whereas, only
77% of medium and 45% of small scale farms had such precautions.
Larger farms were more likely to use at least one form of predator precaution. The main
precaution against predation used by shrimp farms (75% large shrimp ponds) was having
strings over the ponds to prevent avian predation. For poaching, 63% of large shrimp
farms had a watchman while 50% had fences around the whole farm. Among the
medium scale farms, the main measure was screening around individual ponds (49%) and
having a watchman (35%). For small scale, the main measure used was strings over pond
(44%) and screens around individual ponds (36%).
For tilapia farms (Figure 4.24), the one large farm had guard dogs and netting over ponds.
Cage farms were more cautious with 74% having measures while medium and small scale
pond farms were less cautious, with only 44% and 48%, respectively, had precautionary
measures. The most common measures among cages were having guard dogs (43%) and
netting over cages (36%).
Table 4. 11 Number of precautionary measures used by farms to avoid predation and poaching
Species Farm Scale
(% of n)1
Predation Poaching Predation +
Poaching
Shrimp Small (45%) 3 3 4 Medium (77%) 2 2 3 Large (100%) 3 2 3
Tilapia Small-pond (48%) 4 3 2 Medium-pond (44%) 3 2 2 Large-pond 1 1 - Cages (74%) 1 3 2
1 n, shrimp: large=16, medium=60, small=130; n, tilapia: large=1, medium=41, small ponds=119,
cages=38
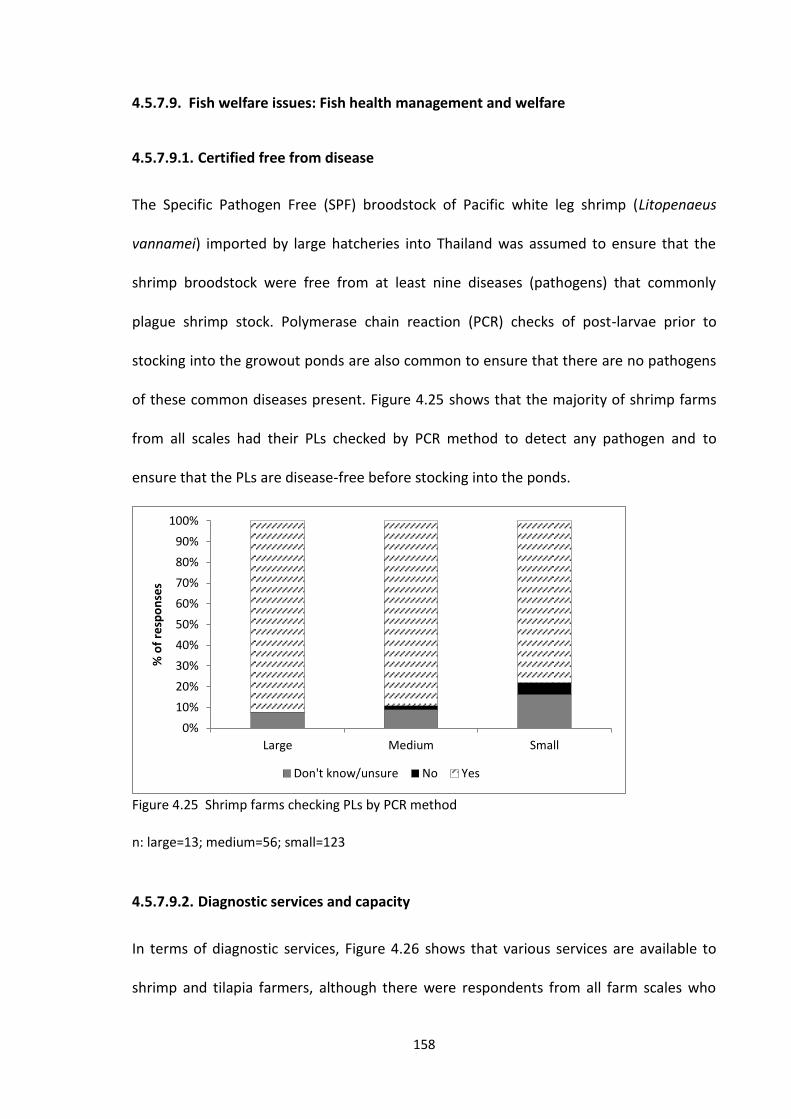
158
4.5.7.9. Fish welfare issues: Fish health management and welfare
4.5.7.9.1. Certified free from disease
The Specific Pathogen Free (SPF) broodstock of Pacific white leg shrimp (Litopenaeus
vannamei) imported by large hatcheries into Thailand was assumed to ensure that the
shrimp broodstock were free from at least nine diseases (pathogens) that commonly
plague shrimp stock. Polymerase chain reaction (PCR) checks of post-larvae prior to
stocking into the growout ponds are also common to ensure that there are no pathogens
of these common diseases present. Figure 4.25 shows that the majority of shrimp farms
from all scales had their PLs checked by PCR method to detect any pathogen and to
ensure that the PLs are disease-free before stocking into the ponds.
Figure 4.25 Shrimp farms checking PLs by PCR method
n: large=13; medium=56; small=123
4.5.7.9.2. Diagnostic services and capacity
In terms of diagnostic services, Figure 4.26 shows that various services are available to
shrimp and tilapia farmers, although there were respondents from all farm scales who
0%
10%
20%
30%
40%
50%
60%
70%
80%
90%
100%
Large Medium Small
% o
f re
spo
nse
s
Don't know/unsure No Yes
159
responded that using diagnostic services was not applicable to them, i.e. 42% from small,
35% from medium and 6% from large scale farms.
The most popular were those provided by professional services such as from companies,
universities and other research facilities. This is especially true for large shrimp farms
(62.5%). In addition, 25% of the large shrimp farms had their own trained health
specialists, and nearly 20% obtained services from feed companies. For small and medium
scale shrimp farms, diagnosis support from feed companies was the most common (38%
from each scale), followed by services from professionals and universities (23% medium
and 26% small).
For tilapia farms, obtaining services from professional organisations, universities and
other research facilities was the most common (47% cage farms, 26% small scale pond
farms and 22% medium scale farms). In addition, 49% of cage farms obtained diagnostic
services from feed companies.
The importance placed by the farms on professional diagnostic services from universities
and research institutes, especially among the shrimp farms, was observed. Whereas for
tilapia, a large majority of the small and medium scale farms might not be aware of either
doing proper diagnostics or where to obtain them.

160
Figure 4.26 Services available to shrimp and tilapia farmers for diagnosing disease problems
n, shrimp: large=16, medium=60, small=130; N, tilapia: large=1, medium=41, small ponds=119, small cages=38 (multiple responses)
4.5.7.10. Biosecurity
4.5.7.10.1. Pond lining in shrimp farms
Pond lining is one feature of intensification and improved biosecurity in shrimp farms, to
reduce exposure to disease pathogens especially coming from the soil. Among the
shrimp farms surveyed, a large number of small scale farms still did not use pond liners in
0
20
40
60
80
100
120
140
Ponds Ponds Ponds Ponds Ponds Cages Ponds
Large Medium Small Large Medium Small
Shrimp Tilapia
Nu
mb
er
of
Re
spo
nse
s
Professional diagnostic service, university, other research facility
Hatchery/seed source
Farm(s) employ trained health specialist(s)
Diagnosis support from feed company
Diagnosis support from chemical supplier
Diagnosis by ownself
Cold storage/processing company
Ask neighbouring farm
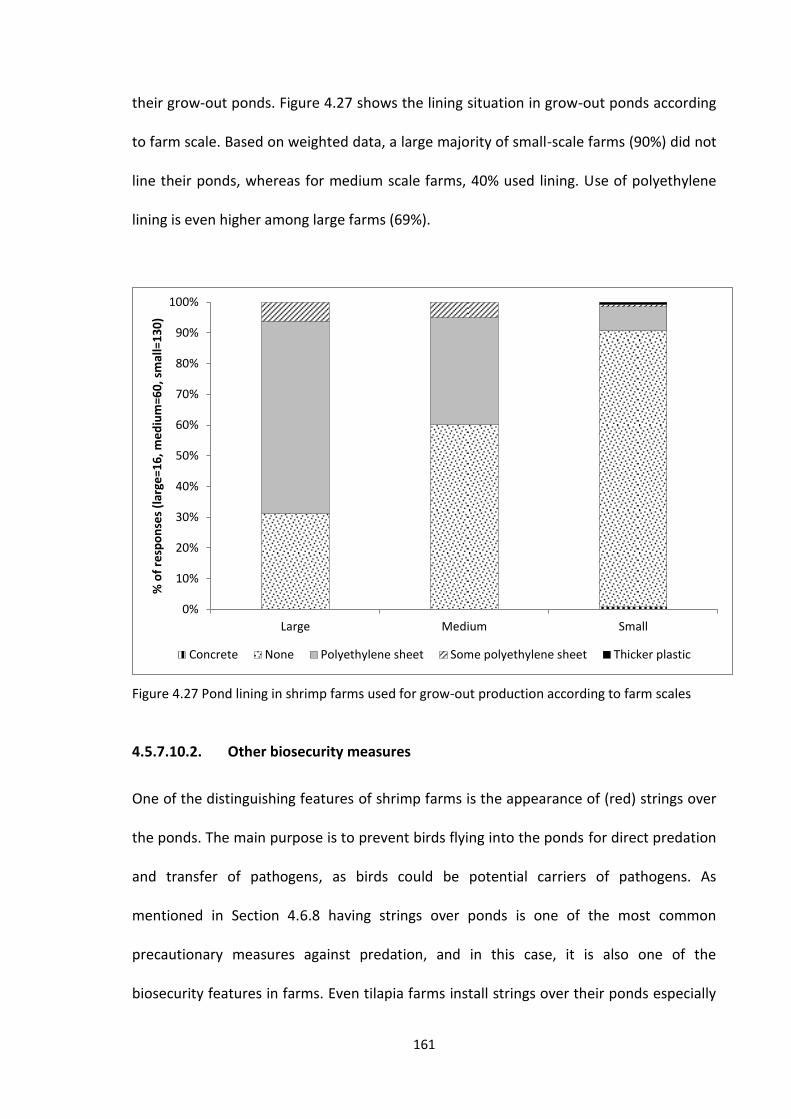
161
their grow-out ponds. Figure 4.27 shows the lining situation in grow-out ponds according
to farm scale. Based on weighted data, a large majority of small-scale farms (90%) did not
line their ponds, whereas for medium scale farms, 40% used lining. Use of polyethylene
lining is even higher among large farms (69%).
Figure 4.27 Pond lining in shrimp farms used for grow-out production according to farm scales
4.5.7.10.2. Other biosecurity measures
One of the distinguishing features of shrimp farms is the appearance of (red) strings over
the ponds. The main purpose is to prevent birds flying into the ponds for direct predation
and transfer of pathogens, as birds could be potential carriers of pathogens. As
mentioned in Section 4.6.8 having strings over ponds is one of the most common
precautionary measures against predation, and in this case, it is also one of the
biosecurity features in farms. Even tilapia farms install strings over their ponds especially
0%
10%
20%
30%
40%
50%
60%
70%
80%
90%
100%
Large Medium Small
% o
f re
spo
nse
s (l
arge
=16
, m
ed
ium
=60
, sm
all=
13
0)
Concrete None Polyethylene sheet Some polyethylene sheet Thicker plastic
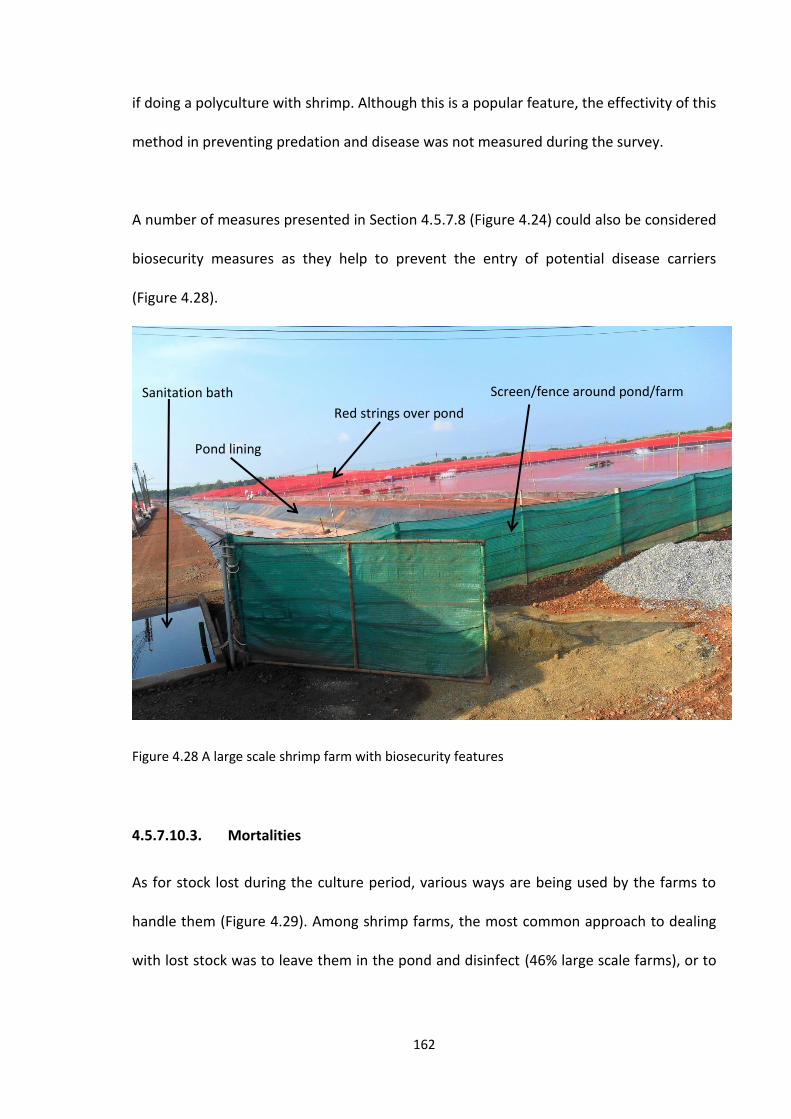
162
if doing a polyculture with shrimp. Although this is a popular feature, the effectivity of this
method in preventing predation and disease was not measured during the survey.
A number of measures presented in Section 4.5.7.8 (Figure 4.24) could also be considered
biosecurity measures as they help to prevent the entry of potential disease carriers
(Figure 4.28).
Figure 4.28 A large scale shrimp farm with biosecurity features
4.5.7.10.3. Mortalities
As for stock lost during the culture period, various ways are being used by the farms to
handle them (Figure 4.29). Among shrimp farms, the most common approach to dealing
with lost stock was to leave them in the pond and disinfect (46% large scale farms), or to
Red strings over pond
Pond lining
Screen/fence around pond/farm Sanitation bath
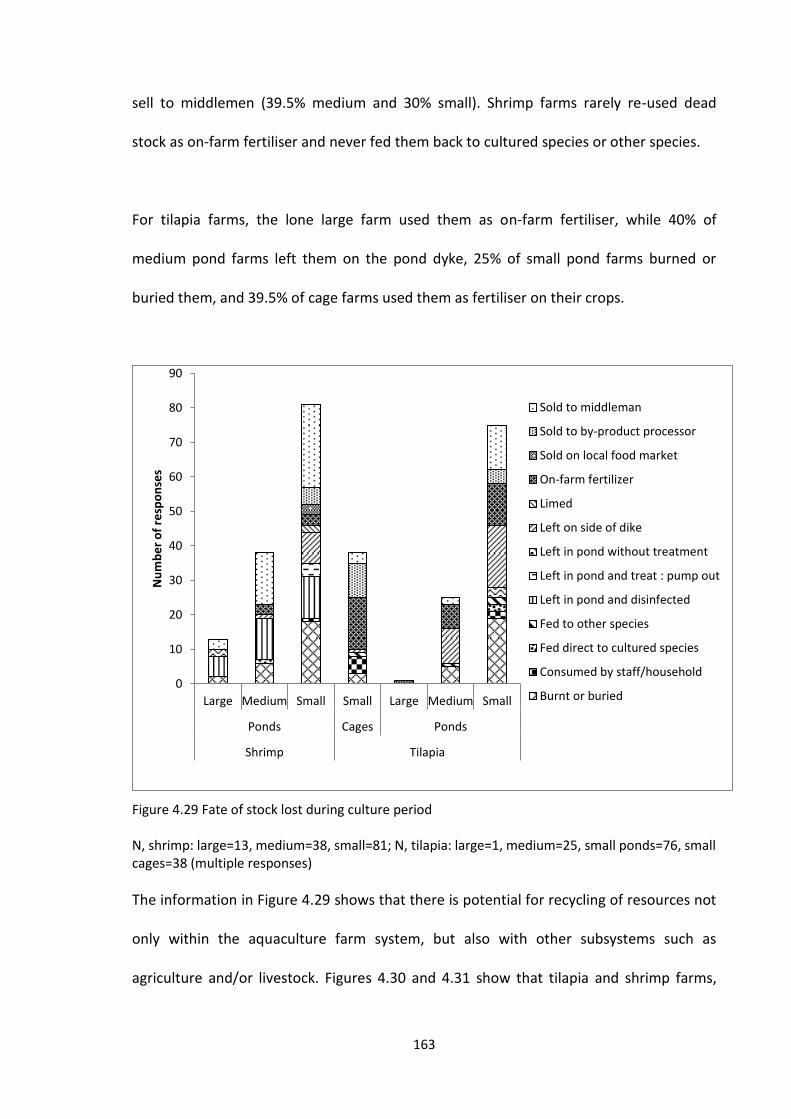
163
sell to middlemen (39.5% medium and 30% small). Shrimp farms rarely re-used dead
stock as on-farm fertiliser and never fed them back to cultured species or other species.
For tilapia farms, the lone large farm used them as on-farm fertiliser, while 40% of
medium pond farms left them on the pond dyke, 25% of small pond farms burned or
buried them, and 39.5% of cage farms used them as fertiliser on their crops.
Figure 4.29 Fate of stock lost during culture period
N, shrimp: large=13, medium=38, small=81; N, tilapia: large=1, medium=25, small ponds=76, small cages=38 (multiple responses)
The information in Figure 4.29 shows that there is potential for recycling of resources not
only within the aquaculture farm system, but also with other subsystems such as
agriculture and/or livestock. Figures 4.30 and 4.31 show that tilapia and shrimp farms,
0
10
20
30
40
50
60
70
80
90
Large Medium Small Small Large Medium Small
Ponds Cages Ponds
Shrimp Tilapia
Nu
mb
er
of
resp
on
ses
Sold to middleman
Sold to by-product processor
Sold on local food market
On-farm fertilizer
Limed
Left on side of dike
Left in pond without treatment
Left in pond and treat : pump out
Left in pond and disinfected
Fed to other species
Fed direct to cultured species
Consumed by staff/household
Burnt or buried
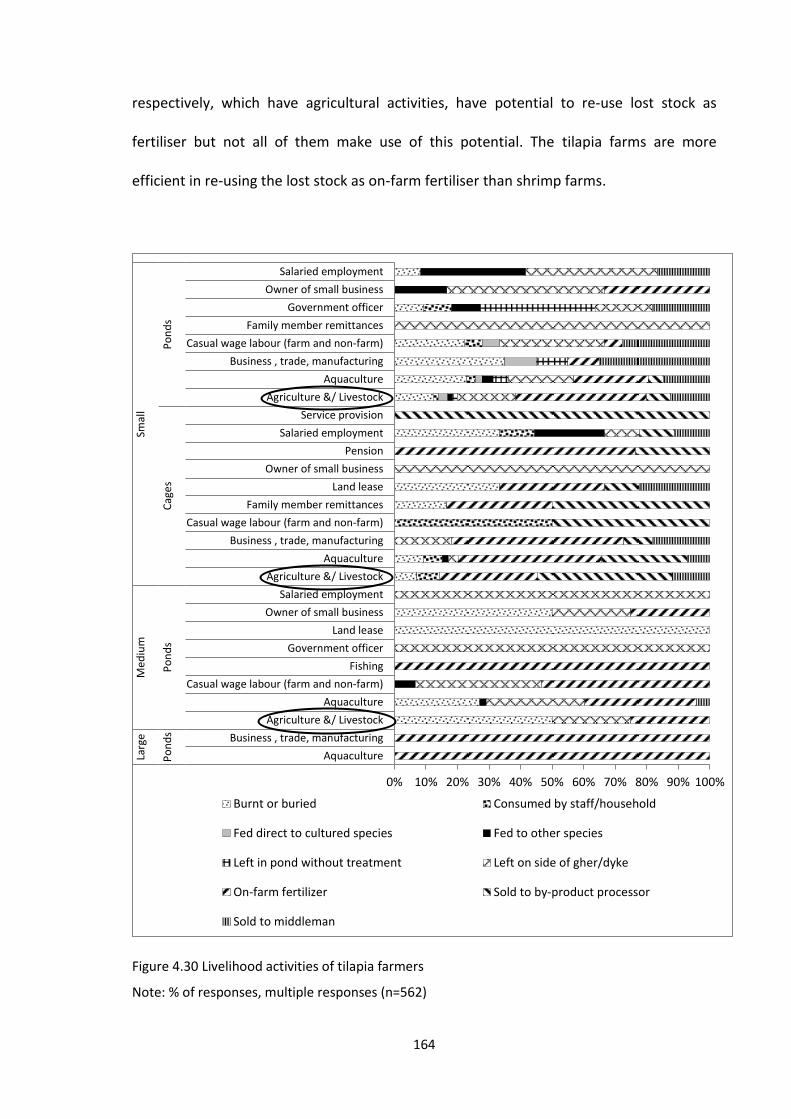
164
respectively, which have agricultural activities, have potential to re-use lost stock as
fertiliser but not all of them make use of this potential. The tilapia farms are more
efficient in re-using the lost stock as on-farm fertiliser than shrimp farms.
Figure 4.30 Livelihood activities of tilapia farmers
Note: % of responses, multiple responses (n=562)
0% 10% 20% 30% 40% 50% 60% 70% 80% 90% 100%
Aquaculture
Business , trade, manufacturing
Agriculture &/ Livestock
Aquaculture
Casual wage labour (farm and non-farm)
Fishing
Government officer
Land lease
Owner of small business
Salaried employment
Agriculture &/ Livestock
Aquaculture
Business , trade, manufacturing
Casual wage labour (farm and non-farm)
Family member remittances
Land lease
Owner of small business
Pension
Salaried employment
Service provision
Agriculture &/ Livestock
Aquaculture
Business , trade, manufacturing
Casual wage labour (farm and non-farm)
Family member remittances
Government officer
Owner of small business
Salaried employment
Po
nd
sP
on
ds
Cag
es
Po
nd
s
Larg
eM
ediu
mSm
all
Burnt or buried Consumed by staff/household
Fed direct to cultured species Fed to other species
Left in pond without treatment Left on side of gher/dyke
On-farm fertilizer Sold to by-product processor
Sold to middleman
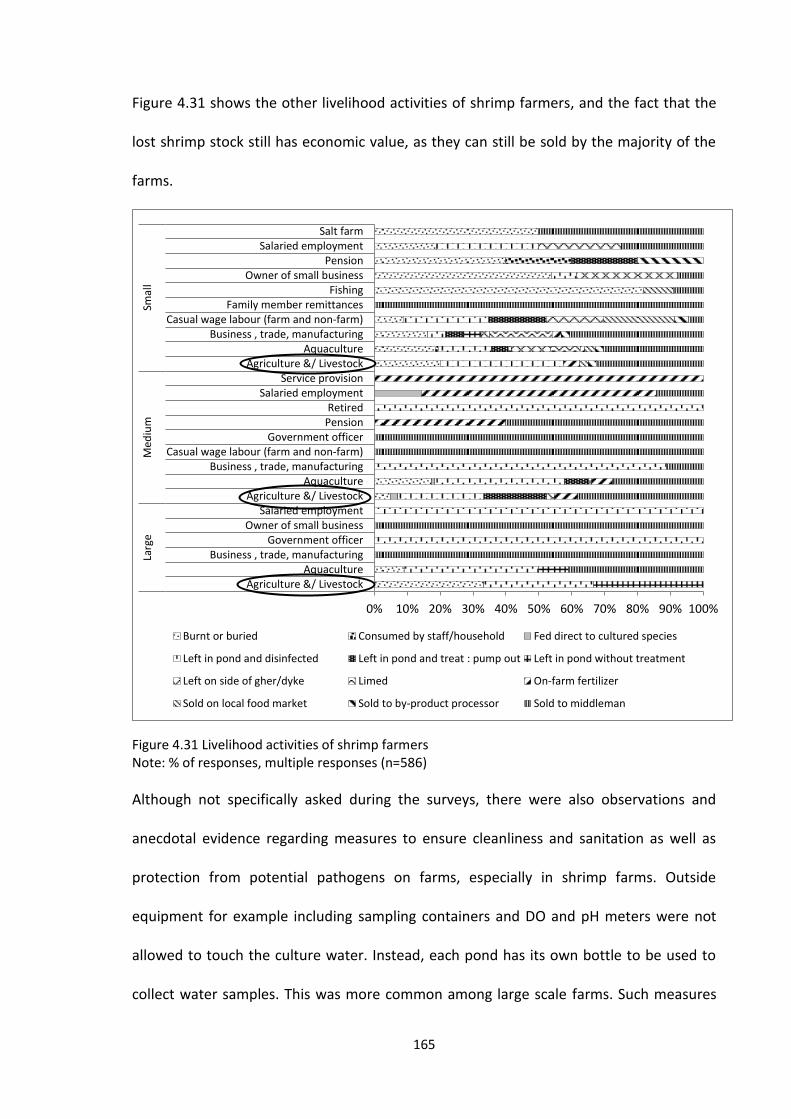
165
Figure 4.31 shows the other livelihood activities of shrimp farmers, and the fact that the
lost shrimp stock still has economic value, as they can still be sold by the majority of the
farms.
Figure 4.31 Livelihood activities of shrimp farmers Note: % of responses, multiple responses (n=586)
Although not specifically asked during the surveys, there were also observations and
anecdotal evidence regarding measures to ensure cleanliness and sanitation as well as
protection from potential pathogens on farms, especially in shrimp farms. Outside
equipment for example including sampling containers and DO and pH meters were not
allowed to touch the culture water. Instead, each pond has its own bottle to be used to
collect water samples. This was more common among large scale farms. Such measures
0% 10% 20% 30% 40% 50% 60% 70% 80% 90% 100%
Agriculture &/ LivestockAquaculture
Business , trade, manufacturingGovernment officer
Owner of small businessSalaried employment
Agriculture &/ LivestockAquaculture
Business , trade, manufacturingCasual wage labour (farm and non-farm)
Government officerPensionRetired
Salaried employmentService provision
Agriculture &/ LivestockAquaculture
Business , trade, manufacturingCasual wage labour (farm and non-farm)
Family member remittancesFishing
Owner of small businessPension
Salaried employmentSalt farm
Larg
eM
ediu
mSm
all
Burnt or buried Consumed by staff/household Fed direct to cultured species
Left in pond and disinfected Left in pond and treat : pump out Left in pond without treatment
Left on side of gher/dyke Limed On-farm fertilizer
Sold on local food market Sold to by-product processor Sold to middleman
166
were much less common on small and medium scale farms. Workers also revealed
restrictions on mobility within farms if infections occurred to reduce the likelihood of
cross-contamination of these areas. In larger farms, vehicle sanitation baths at farm entry
points were common.
4.5.7.11. Status of surveyed farms according to selected certification standards in
aquaculture
The summary of information on current farm practices presented in Section 4.5.7 is
shown in Table 4.12. The information shows how the various shrimp and tilapia farms
perform in terms of their compliance to some criteria in the global certification standards.
It also addresses the main research hypothesis in this chapter, i.e. that the large scale
farms are more likely to comply with global certification standards than the small scale
farms.
The main areas where all the shrimp farms have ease in compliance were: effluent
discharge within the farm only, water quality monitoring, and pond sludge management
within the farm only. The main areas where large scale shrimp farms have the advantage
over the medium and small scale farms, were in the legal aspects on registration and
traceability, effluent treatment, record keeping, predator control, fish welfare issues, and
biosecurity. For tilapia, the cage farms are more efficient in biosecurity regarding the
disposal of mortalities, and they are much better than pond farms in record keeping,
predator control, and availing of diagnostic services. However, biosecurity could not really
be ensured during production as ponds and cages are open systems (exposed to natural
elements). Areas that tilapia ponds are efficient include effluent discharge and pond
sludge management, which are done within the farm and not released outside.
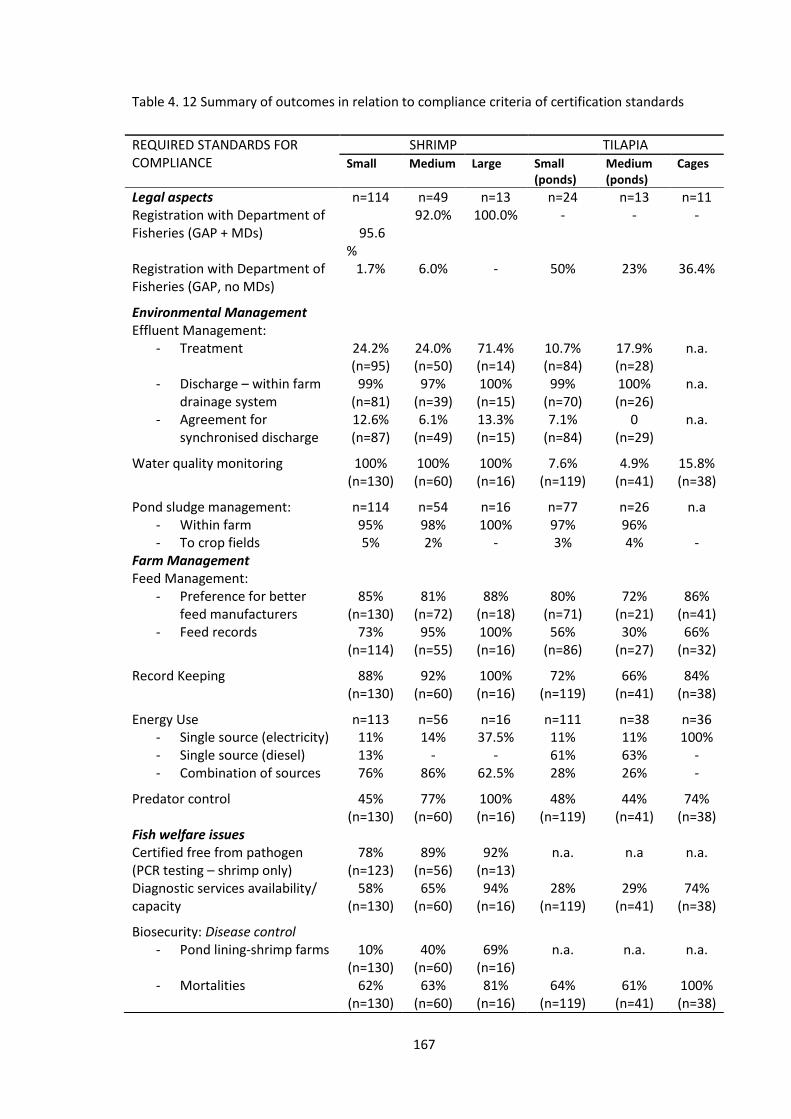
167
Table 4. 12 Summary of outcomes in relation to compliance criteria of certification standards
REQUIRED STANDARDS FOR COMPLIANCE
SHRIMP TILAPIA Small Medium Large Small
(ponds) Medium (ponds)
Cages
Legal aspects n=114 n=49 n=13 n=24 n=13 n=11 Registration with Department of Fisheries (GAP + MDs)
95.6%
92.0% 100.0% - - -
Registration with Department of Fisheries (GAP, no MDs)
1.7% 6.0% - 50% 23% 36.4%
Environmental Management Effluent Management:
- Treatment 24.2% (n=95)
24.0% (n=50)
71.4% (n=14)
10.7% (n=84)
17.9% (n=28)
n.a.
- Discharge – within farm drainage system
99% (n=81)
97% (n=39)
100% (n=15)
99% (n=70)
100% (n=26)
n.a.
- Agreement for synchronised discharge
12.6% (n=87)
6.1% (n=49)
13.3% (n=15)
7.1% (n=84)
0 (n=29)
n.a.
Water quality monitoring 100% (n=130)
100% (n=60)
100% (n=16)
7.6% (n=119)
4.9% (n=41)
15.8% (n=38)
Pond sludge management: n=114 n=54 n=16 n=77 n=26 n.a - Within farm 95% 98% 100% 97% 96% - To crop fields 5% 2% - 3% 4% -
Farm Management Feed Management:
- Preference for better feed manufacturers
85% (n=130)
81% (n=72)
88% (n=18)
80% (n=71)
72% (n=21)
86% (n=41)
- Feed records 73% (n=114)
95% (n=55)
100% (n=16)
56% (n=86)
30% (n=27)
66% (n=32)
Record Keeping 88% (n=130)
92% (n=60)
100% (n=16)
72% (n=119)
66% (n=41)
84% (n=38)
Energy Use n=113 n=56 n=16 n=111 n=38 n=36 - Single source (electricity) 11% 14% 37.5% 11% 11% 100% - Single source (diesel) 13% - - 61% 63% - - Combination of sources 76% 86% 62.5% 28% 26% -
Predator control 45% (n=130)
77% (n=60)
100% (n=16)
48% (n=119)
44% (n=41)
74% (n=38)
Fish welfare issues Certified free from pathogen (PCR testing – shrimp only)
78% (n=123)
89% (n=56)
92% (n=13)
n.a. n.a n.a.
Diagnostic services availability/ capacity
58% (n=130)
65% (n=60)
94% (n=16)
28% (n=119)
29% (n=41)
74% (n=38)
Biosecurity: Disease control - Pond lining-shrimp farms 10%
(n=130) 40%
(n=60) 69%
(n=16) n.a. n.a. n.a.
- Mortalities 62% (n=130)
63% (n=60)
81% (n=16)
64% (n=119)
61% (n=41)
100% (n=38)
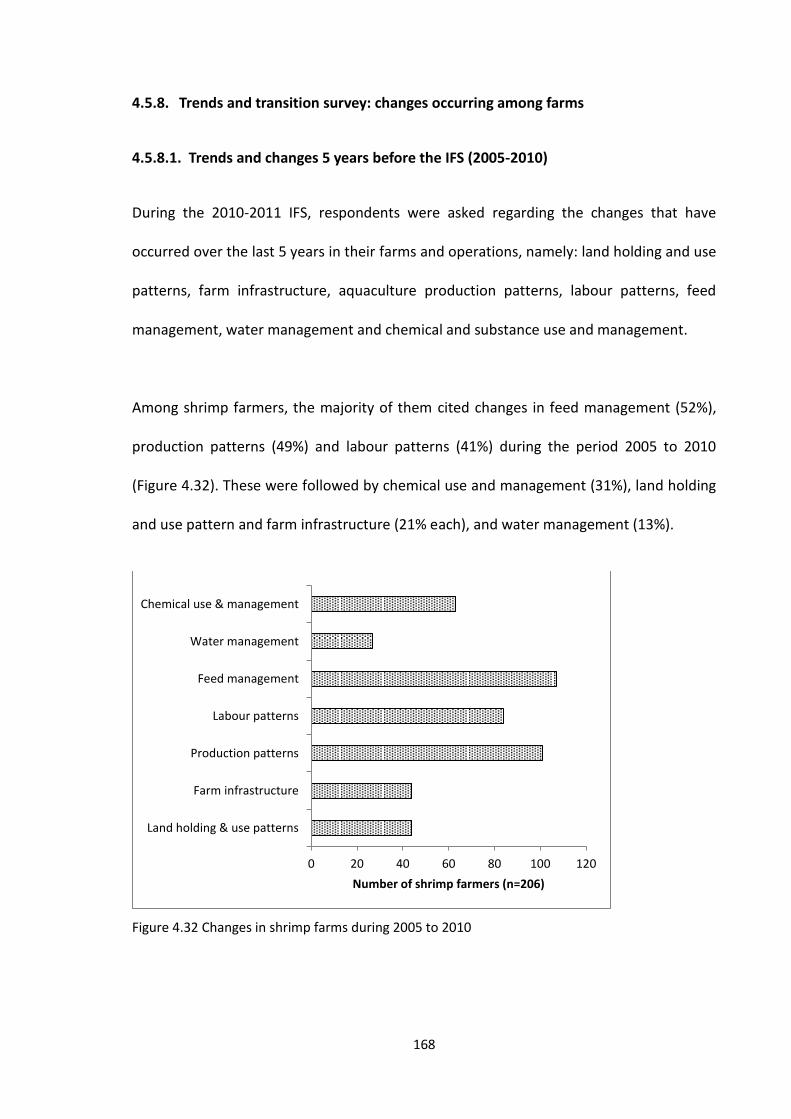
168
4.5.8. Trends and transition survey: changes occurring among farms
4.5.8.1. Trends and changes 5 years before the IFS (2005-2010)
During the 2010-2011 IFS, respondents were asked regarding the changes that have
occurred over the last 5 years in their farms and operations, namely: land holding and use
patterns, farm infrastructure, aquaculture production patterns, labour patterns, feed
management, water management and chemical and substance use and management.
Among shrimp farmers, the majority of them cited changes in feed management (52%),
production patterns (49%) and labour patterns (41%) during the period 2005 to 2010
(Figure 4.32). These were followed by chemical use and management (31%), land holding
and use pattern and farm infrastructure (21% each), and water management (13%).
Figure 4.32 Changes in shrimp farms during 2005 to 2010
0 20 40 60 80 100 120
Land holding & use patterns
Farm infrastructure
Production patterns
Labour patterns
Feed management
Water management
Chemical use & management
Number of shrimp farmers (n=206)

169
The changes which occurred in shrimp farms varied according to farm scales (Fig. 4.33).
The top three changes for large farms were labour patterns (75%), production patterns
(50%) and feed management (50%), whereas for medium farms, changes were mainly in
production patterns (65%), feed management (55%) and labour patterns (53%). For small
farms, most changes were in feed management (51%), production (42%) and labour
patterns (31%).
For shrimp farms, the majority of changes in labour patterns included the following
(n=117):
Changed the labour/worker (18%)
Increased the number due to increase in area, and more production (13%)
Moved towards more hired labour from either no hired labour or use of
exchanged labour as previously did by own self (8%)
Reduced labour due to autofeeder, or managed by owners themselves (7%)
Changes in the type of labour (from Thai to migrant worker) (2%)
Changes due to cultural and working/life style differences
Increased labour costs
Increased difficulty in finding workers
Increased seasonal hiring
Changes in chemical use and management were the most important among small (27%)
and medium (42%) farms, whereas for large farms, the next most important change was
in farm infrastructure (31%). The least changes occurred in water management in all
farms (10% small, 20% medium and 13% large).

170
For chemical use changes, the main trends for shrimp farms were (n=109):
Use of probiotics instead of other types of chemicals
Changes in the brands of probiotics and other substances used
Chemicals were used only when problems occurred
Decreased use of any substances
Use substances now but before did not use
Increased use of substances or using more now than before
Figure 4.33 Changes in shrimp farms in various categories during 2005 to 2010
For tilapia farmers, the changes in various categories faced by cage and pond farmers are
shown in Figure 4.34. Farmers responded most about changes in production patterns and
0
10
20
30
40
50
60
70
small medium large
Nu
mb
er
of
resp
on
ses
Land holding & use patterns Farm infrastructure Production patterns
Labour patterns Feed management Water management
Chemical use & management

171
feed management, followed by land holding and use patterns, chemical use and
management.
Figure 4.34 Changes in tilapia farms 2005 to 2010
Feed management changes were cited by the majority of cage farms (76%), but for pond
farmers, changes in production patterns were most mentioned (39%) (Figure 4.35). The
change occurring in feed management involved changing feed sources or brands, due to
increased cost and lower quality of feed. For production patterns, the changes included
lower production, increased production, change in seed sources and culture species,
harvesting modes, and changed markets.
0 20 40 60 80 100
Land holding & use patterns
Farm infrastructure
Production patterns
Labour patterns
Feed management
Water management
Chemical use & management
Number of tilapia farmers (n=199)

172
Figure 4.35 Changes in tilapia cage and pond farms during 2005 to 2010
4.5.8.2. Transition survey results of shrimp and tilapia farms (2013)
4.5.8.2.1. General changes
This section will report on the results of the transition survey which was described in
Section 4.4.2.
Out of the 120 shrimp farm respondents interviewed by phone, the majority (82% large,
74% medium, 56% small) were farming as normal with some changes (Figure 4.36). There
were also those who were farming as normal without any significant changes (18% large,
19% medium, 16% small). Ten farmers (7% medium, 10% small) stopped farming
permanently. All farm scales had made changes but the small scale farms made more
major changes than large and medium scale farms.
0
10
20
30
40
50
60
70
cage (n=38) pond (n=161)
Nu
mb
er
of
resp
on
ses
Land holding & use patterns Farm infrastructure
Production patterns Labour patterns
Feed management Water management
Chemical use & management

173
Figure 4.36 General status of shrimp farms two years after IFS
N: large=11, medium=27, small=82
For tilapia farms, based on data collected by Burana-osod et al. (2013), the majority (75%
medium, 64% small, 55% cage) of tilapia farmers were farming as normal with no
significant change. More cage farms had major changes than pond farms (Figure 4.37),
ranging from some changes to permanently stopping farming. Whereas the majority of
tilapia farms continued to farm as normal with no significant change or with some
changes, 14% of cage farms had permanently stopped farming. The reasons for stopping
were farm related (flooding, fish mortalities due to bad water quality), and personal
(accident).
0%
10%
20%
30%
40%
50%
60%
70%
80%
90%
100%
Large Medium Small
% o
f re
spo
nse
s Temporarily stopped farmingwith planned restart date
Temporarily stopped farmingwith no planned restart date
Farming as normal with nosignificant change
Temporarily stopped farmingand already restarted
Permanently stopped farming
Farming as normal with somechanges
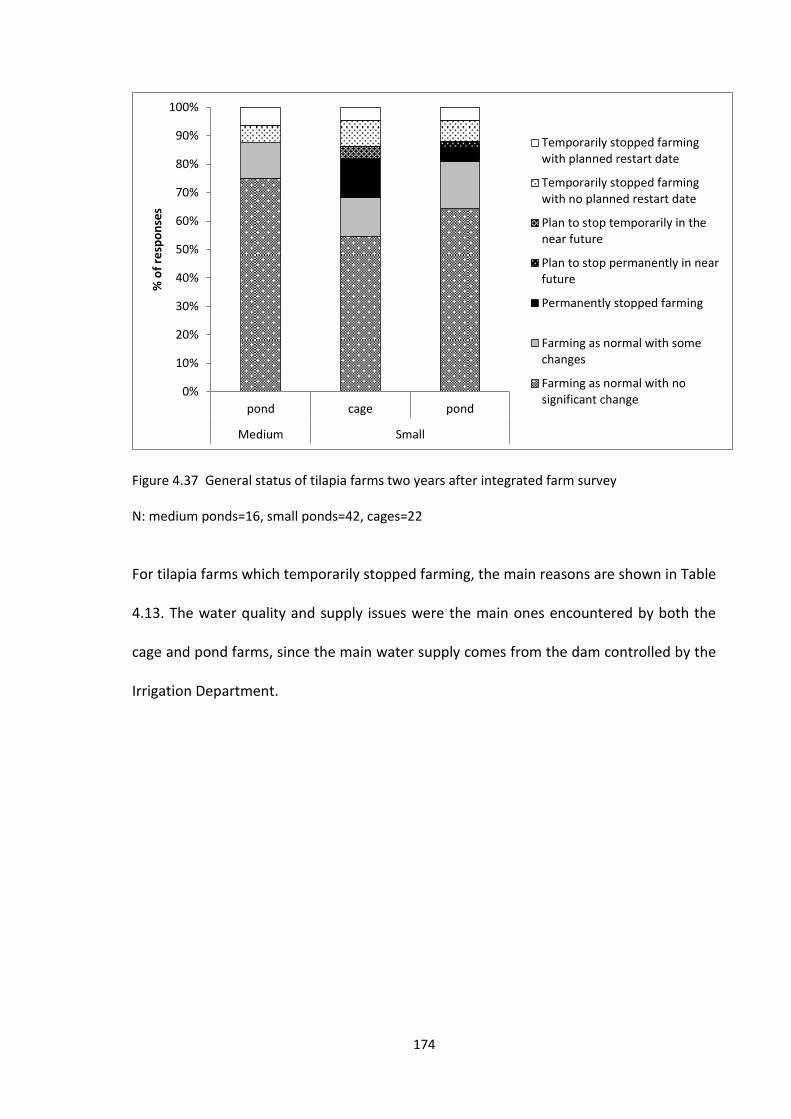
174
Figure 4.37 General status of tilapia farms two years after integrated farm survey
N: medium ponds=16, small ponds=42, cages=22
For tilapia farms which temporarily stopped farming, the main reasons are shown in Table
4.13. The water quality and supply issues were the main ones encountered by both the
cage and pond farms, since the main water supply comes from the dam controlled by the
Irrigation Department.
0%
10%
20%
30%
40%
50%
60%
70%
80%
90%
100%
pond cage pond
Medium Small
% o
f re
spo
nse
s Temporarily stopped farmingwith planned restart date
Temporarily stopped farmingwith no planned restart date
Plan to stop temporarily in thenear future
Plan to stop permanently in nearfuture
Permanently stopped farming
Farming as normal with somechanges
Farming as normal with nosignificant change
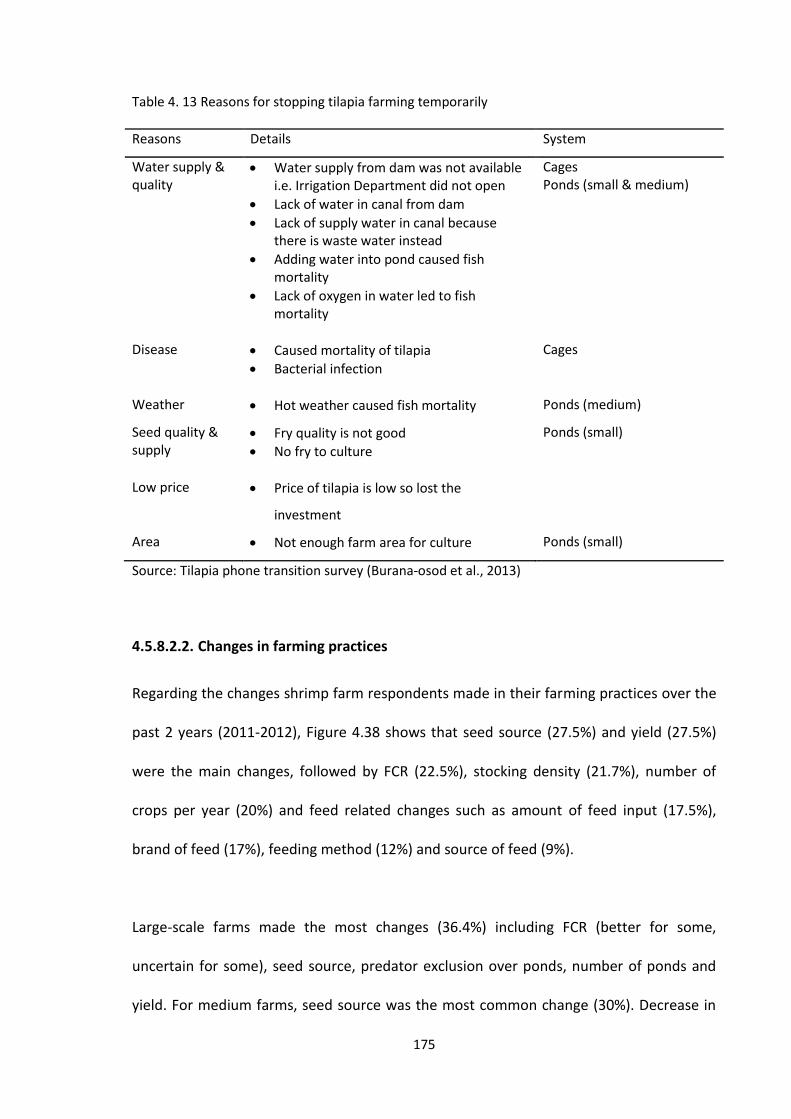
175
Table 4. 13 Reasons for stopping tilapia farming temporarily
Reasons Details System
Water supply & quality
Water supply from dam was not available i.e. Irrigation Department did not open
Lack of water in canal from dam
Lack of supply water in canal because there is waste water instead
Adding water into pond caused fish mortality
Lack of oxygen in water led to fish mortality
Cages Ponds (small & medium)
Disease Caused mortality of tilapia
Bacterial infection
Cages
Weather Hot weather caused fish mortality Ponds (medium)
Seed quality & supply
Fry quality is not good
No fry to culture
Ponds (small)
Low price Price of tilapia is low so lost the
investment
Area Not enough farm area for culture Ponds (small)
Source: Tilapia phone transition survey (Burana-osod et al., 2013)
4.5.8.2.2. Changes in farming practices
Regarding the changes shrimp farm respondents made in their farming practices over the
past 2 years (2011-2012), Figure 4.38 shows that seed source (27.5%) and yield (27.5%)
were the main changes, followed by FCR (22.5%), stocking density (21.7%), number of
crops per year (20%) and feed related changes such as amount of feed input (17.5%),
brand of feed (17%), feeding method (12%) and source of feed (9%).
Large-scale farms made the most changes (36.4%) including FCR (better for some,
uncertain for some), seed source, predator exclusion over ponds, number of ponds and
yield. For medium farms, seed source was the most common change (30%). Decrease in
176
yield due to disease outbreak was the most common change experienced by small scale
farms (27%).
Respondents (n=27) cited that the FCRs increased (i.e. feed conversion was less efficient)
(30%) due to their stock were affected by diseases or feed quality was low, although 26%
observed improved feed efficiencies (decreases in FCR e.g. from 1.8 to 1.5, or from 2.0 to
1.5.)
“The FCR decreased because I changed my feeding method. I am now
using an autofeeder and the amount of feed input has decreased.”
(Mr. W.S., a small-scale shrimp farmer)
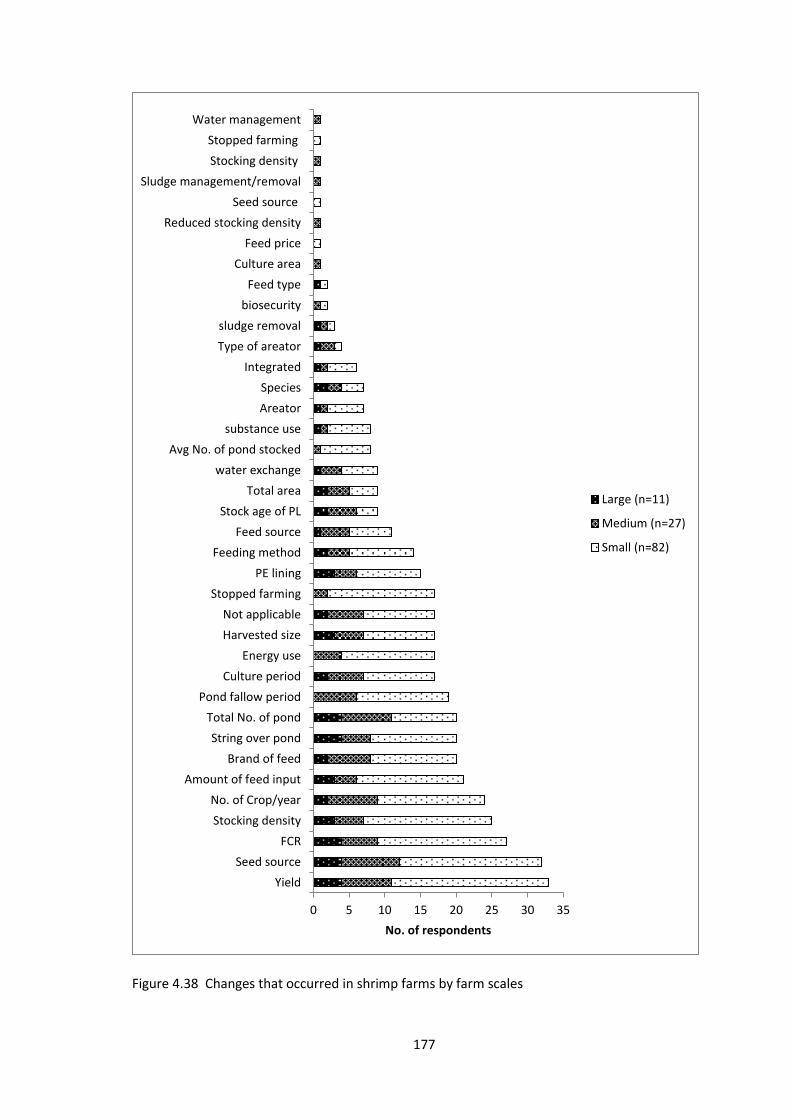
177
Figure 4.38 Changes that occurred in shrimp farms by farm scales
0 5 10 15 20 25 30 35
Yield
Seed source
FCR
Stocking density
No. of Crop/year
Amount of feed input
Brand of feed
String over pond
Total No. of pond
Pond fallow period
Culture period
Energy use
Harvested size
Not applicable
Stopped farming
PE lining
Feeding method
Feed source
Stock age of PL
Total area
water exchange
Avg No. of pond stocked
substance use
Areator
Species
Integrated
Type of areator
sludge removal
biosecurity
Feed type
Culture area
Feed price
Reduced stocking density
Seed source
Sludge management/removal
Stocking density
Stopped farming
Water management
No. of respondents
Large (n=11)
Medium (n=27)
Small (n=82)

178
4.5.8.2.3. Marketing aspects
Regarding marketing aspects, 63 respondents mentioned changes occurring in this
category, the majority of responses were related to product price, regardless of farm
scale. This was also related to the responses regarding market fluctuation, as selling price
was dependent on the market (Figure 4.39). Product quality was also mentioned, in
relation to price as well as checking for residues depending on the buyer. Since the survey
was conducted when the shrimp industry in Thailand was facing the EMS crisis, there has
been the problem of supply in the market which had led to increased prices.
Figure 4.39 Changes in the marketing aspects of shrimp farming
n: large=8, medium=16, small=39 (multiple responses)
0
10
20
30
40
50
Large Medium Small
Nu
mb
er
of
resp
on
ses
Used to have sale contract, none now Selling price depends on market
Quality spec: residue tests (depends on buyer) Quality spec: depends on supply
Higher price Depend on size of shrimp
Change as market fluctuation

179
4.6. Discussion
4.6.1. Certification, standards and farming systems
Based on the summary of certifications and standards in Table 4.3, the focus species in
this research are covered by global certifications and standards. All three standards,
namely Best Aquaculture Practices (BAP), GlobalGAP and Aquaculture Stewardship
Council (ASC) cover tilapia production, whereas only the first two cover shrimp
production. This is evidence that these species can be regarded as key aquaculture
species in the world. In the past, the main driver of development especially in shrimp
aquaculture was to generate foreign exchange earnings for the producing countries as
well as other financial benefits, but consumers in importing countries have been mainly
ignored (Neiland et al., 2001). Nowadays, the rise of global certification and standards
have been mainly driven by market and consumer demands and needs for a better quality
food product which has been produced sustainably and ethically, although there are
limitations to these certifications (Washington & Ababouch 2011; Steering Committee of
the State-of-Knowledge Assessment of Standards and Certification 2012; Bush et al.
2013). Looking at these standards and how they fit with shrimp and tilapia sustainable
production, it could be seen that there is favour towards the environmental and
management aspects, although the legal and social aspects (including human resources)
were also covered. There are no specific guidelines or criteria related to the economic
aspects such as costs and monetary benefits. Thus it could not be concluded that
compliance to these standards equates to sustainable systems.
180
The Thai Government’s response to market and consumer demands especially in the
export market was to set-up various levels of aquaculture standards, from safety level to
the local version of GAP (ThaiGAP), towards the Code of Conduct (CoC) and then on
towards ThaiGAP Plus (any additional standards) (Yamprayoon and Sukhumparnich,
2010). On a regional level, there is the ASEAN-GAP and the ASEAN Shrimp Standards
Project which are still being discussed in the region and yet to be implemented (Prompoj,
2013; USAID-MARKET, 2013). These are attempts to harmonise standards across the
region, benchmarked with the FAO guidelines. The main producer-driven certification
standard which has been recognised by the DoF is the Sustainable Shrimp Project (SSP)
which is viewed as being complimentary to the ThaiGAP. This was developed by the Surat
Thani Shrimp Farmers’ Club based on their practice of promoting no chemical use in the
shrimp production (Ekapoj Yodpinij, personal communication, 2010).
Whereas there are very few shrimp farms in this survey which have already received
global certifications, there are more than 90% which have the ThaiGAP certifications
given by the DoF. Of the shrimp farms surveyed during this research, the large scale farms
were more likely to fit in the certification and standards guidelines into their operations.
As Washington & Ababouch (2011) have stated that the costs of certification are paid by
those upstream rather than those who demand certain product qualities, the cost of
compliance is an issue for smaller scale producers. Therefore it is understandable that
there is more compliance in shrimp farms compared with tilapia farms as shrimp has a
higher market value compared to tilapia.
181
The stocking densities used by shrimp farmers in the survey (small scale 5 to 250 PLs/m2,
medium scale 31 to 120 PLs/m2, large scale 50 to 125 PLs/ m2 at stocking ages of PL2 to
20) are considered highly intensive stocking densities. Whereas densities in extensive
systems are 1 PL/m2, and intensive systems range from 22 to 31 PL/m2 (Bosma et al.,
2012). The ThaiGAP (ACFS, 2009) specifies that appropriate stocking age should be PL12
and density at this stage should be 50 to 94 PL/m2, for a culture period of 120 days.
The mean grow-out days were over a wide range, i.e. 50 to 130 for small scale, 84 to 150
for medium, and 80 to 160 days for large scale, compared with the ponds reported by
Thakur et al. (2010) which ranged from 76 to 126 days, although the ponds in their study
were not classified according to farm scales.
Regarding the source of shrimp broodstock used by hatcheries, smaller shrimp farm
operators were not aware of the source of broodstock, which could reflect on the farm
operations competence or capacity, especially regarding traceability of stock.
Domesticated broodstock programmes for white shrimp was one of the requirements by
DoF to qualify for importing SPF white shrimp broodstock (Tookwinas et al., 2005). It is
also important for biosecurity to know the source of broodstock and whether they are
domesticated and SPF (Lightner, 2005), and should come from a credible source (Merican,
2007). It is possible that smaller scale farm operators obtain PLs from commercial
hatcheries which buy broodstock through intermediaries.

182
4.6.2. Legal aspects
The Thai Government through the Department of Fisheries and other related agencies
have implemented a policy on food safety from ‘pond to plate’, in order to achieve quality
seafood products for consumers (Yamprayoon and Sukhumparnich, 2010). As per the
criterion on legal aspects of the global standards and certifications, it was stipulated that
farms should adhere to the laws of the land, i.e. in relation to environmental,
documentation, land use, and farming related activities (ASC 2012; GlobalGAP 2012; GAA-
BAP 2013). In this case, the local regulations refer to the Good Aquaculture Practices for
Marine Shrimp by the Thai Agricultural Standards Bureau of the Ministry of Agriculture
and Cooperatives, also known as TAS 7401-2009 (ACFS, 2009). The regulations in Thailand
related to farm registrations regarding their food safety policy are linked with the
traceability system initially implemented for shrimp production and processing, and later
on expanded to other species, both food fish and ornamental species (Yamprayoon and
Sukhumparnich, 2010). One notable aspect related to traceability is the issuance of
Fisheries Movement Document (FMDs) at the hatchery and growout phases until the
product is sold to the processing sector.
In this study, the majority (81%) of the shrimp farms regardless of scale responded that
they had GAP registration with the DoF and used the FMD system. The farmers surely saw
the importance of these documents as these are required by the buyers and processors
to ensure traceability of the batch of shrimp bought. This compliance is mainly driven by
the requirements for exporting the products, since the health certificate requested by the
processor to export their products needs to be accompanied by the MD related to the
183
products. In the ThaiGAP for shrimp farms, it is a major requirement for farms to be
registered with the DoF (ACFS, 2009).
However the situation with tilapia is not as positive in relation to documentation, as <
50% are registered with GAP and there are no movement documents. This does not
comply with the standards. This issue needs to be addressed as it defeats the purpose of
the traceability system and only fulfils a small part of the requirement.
Other legal aspects in the global standards are concerned with land ownership or rights,
and registration of business. In the ThaiGAP, it is a major requirement for farms to have
legal land rights or permits, which could be ownership or lease (ACFS, 2009). During the
survey there has been no report of conflicts regarding land ownership or lease. However
regarding the registration of business, there had been some issues, mainly related to the
criteria set by SEAT project on farm scales (Murray et al., 2011). One of the criteria is
business ownership, whereby those owned corporately are distinguished by being
registered as a company with the Department of Business Registration/Development
(Ministry of Commerce), abiding by the Thai Civil and Commercial Code and other
business regulations. With this categorisation of farm scales, most of the traditionally
known ‘large scale’ farms were classified as ‘medium scale’ farms in this research study
since they are not registered as companies as explained above. The main reason cited by
medium scale farm operators for not registering was the tedious and time consuming
documentation processes involved.
184
Washington and Ababouch (2011) suggested that farms follow the national/public
regulations/standards as the foundation to achieve sustainable production, making it
easier to meet the additional criteria from private standards and certifications. Thailand
still has a long way to go to be able to achieve compliance to its local ThaiGAP and FMDs
especially with tilapia production.
Recently in March 2014 the Aquaculture Stewardship Council has launched the global
certification standards for shrimp (ASC, 2014). Also in the process of dialogues and
discussions among stakeholders in the ASEAN region is the ASEAN GAqP, which is
implemented under the ASEAN Economic Community (AEC) Blueprint.
4.6.3. Environmental Management: Effluents
Effluents from aquaculture operations, especially from shrimp, are a big and contentious
environmental issue. Thus national governing bodies would need to consider this issue for
regulation (Boyd, 2003). Farms, especially shrimp farms, are faced with the need to
reduce nutrient loading to the outside environment (Thakur et al., 2010). The importance
of this issue is also foremost in the standards and certifications, providing criteria on
management of effluents, including regular monitoring and proper disposal.
The reduction of nutrients from effluents prior to release into the outside environment is
one reason why the Thai government had a provision in the ThaiGAP for effluent
management (ACFS, 2009). Major requirements in this aspect include the monitoring and
testing of effluent quality to ensure it is not a pollutant, and prevention of release of
185
saline water into freshwater areas (GAA-BAP, 2013). GAA/BAP has a proviso that this
standard “does not apply to farms of < 50 ha” and which do not discharge regularly and <
1% of water is exchanged daily, referring to farms which reuse all the water or have
limited water exchange.
Levels of effluent parameters are also given but in this research study, the effluents were
not measured or monitored. It has been reported that in Thailand, a majority of shrimp
farms practice the closed system, i.e. keeping the water within the farm system and
recycling or reusing it, rather than releasing outside and getting new water. This is linked
with biosecurity to ensure that efforts to keep and maintain good water is maximised. In
the past it was believed that many shrimp and fish farms would be constrained by such
requirements and suffer significant additional costs (Boyd, 2003), which could marginalise
those operations which have a poor resource base.
Thakur et al. (2010) found that the most of the nutrients including suspended solids in
effluents were concentrated at the bottom part of the water/effluent column, thus they
recommended that the bottom portion (last 30 cm) of the effluent at harvest be retained
in the pond during harvest, so it could reduce the nutrient loading discharged outside. In
addition, it could serve as a stock for primary production for the next culture period.
The majority of the shrimp farms (73% out of 159) in this study did not treat their pond
waste water or effluents However in the global standards, treatment was not specified,
rather it was more important not to release effluents or waste water directly into the
external environment. This is complied with by the farms in this study as nearly all
186
discharge their effluents within the farm system, in order to recycle and reuse the
eutrophic waste water for the next culture period.
The availability of sedimentation ponds for treatment of effluents is dependent on farm
scale, as found in this research. Since the large scale farms have these facilities, their
treatment method was mainly allowing effluents to settle in these ponds. Whereas for
medium and small scale farms, most of their treatment is done by adding substances such
as probiotics or effective microorganism, and inorganics such as lime. All farms also use
combinations of settling, adding substances, aeration, and filtration. According to a
regulation of DOF in the early 1990s (under the Fisheries Act of 1947), shrimp farms with
more than 8 hectares area should allocate at least 10% of the farm area for wastewater
treatment and/or sedimentation ponds (Tabthipwon, 2008). The majority of the small and
medium scale farms in this research have less than 8 hectares farm area.
For tilapia pond farms in this study, effluent is not much of a major issue, owing to the
fact that most are semi-intensive polyculture systems, which allow every niche in the
water column to be occupied by various fish species. Thus nutrients present in the water
will be consumed rather than be wasted into the water or pond bottom, although some
other suspended solids/particles will still be present in the water column, such as from
the bacterial floc and inorganic matter. Tabthipwon (2008) reported that total suspended
solids level in tilapia effluents was 55 to 75% less than in snakehead and Clarias catfish
systems, respectively, while 33% more than that in freshwater prawn systems. However
he did not specify what systems they were but mentioned that effluent quality depended
on culture species and feed used. In addition the levels of TSS increase at harvesting
187
period for all systems, due to the organic matter including pond sludge mixing with the
waste water. For tilapia, the TSS level increases by 5.5 times (Tabthipwon, 2008).
Polyculture systems are beneficial not only in environmental terms but also financially, as
it can improve productivity and additional revenue, for e.g. salmon and mussel
polyculture (Whitmarsh et al., 2006), or welfare-wise, preventing transfer of disease
pathogens among stock (Washington & Ababouch 2011), or sustainability and ecological
efficiencies, such as the traditional systems in China (Bostock, 2011).
A major aspect not covered in this research was the potential of the cage systems to add
to eutrophication of the water systems they were placed in (Tabthipwon, 2008).
4.6.4. Environmental management: Water quality monitoring
ThaiGAP recommends that the shrimp farms be closely located to areas where water
quality is suitable for shrimp culture, and that testing of water and recording of water
analysis results be done (ACFS, 2009). These are the only references to water quality
which is not a major requirement. In this study, majority of the farms, (all shrimp farms,
15% of tilapia cage farms and <10% of tilapia pond farms), were adept at monitoring
water quality. The availability of instruments and water quality kits in the market also
facilitates the farmers to be able to monitor water quality on farm on a daily basis. Tilapia
farms are much less compliant in this aspect compared with the shrimp farms, regardless
of farm scales.

188
The GAA/BAP standards have specific criteria for cages regarding water quality
monitoring, in that cage farms are required to monitor water quality to ensure that key
parameters remain within the acceptable ranges stipulated by BAP (GAA-BAP, 2013). In
the case of the 38 tilapia cage farms, only 15% were monitoring the water quality, and the
possible reasons for not doing so would be that the farmers did not deem it important to
do so, and it involved investment in water quality equipment and kits. Tilapia was not as
highly valued as shrimp, and farm gate price is cheaper than shrimp. Thus investing in
water quality equipment such as dissolved oxygen and pH meters as well as water quality
kits for every parameter would be an added cost to the farmers.
Although the ThaiGAP is not explicit about water quality management i.e. water exchange
and water replacement, it is assumed that these are all part of the farm management
manual which is a major requirement for all farms (ACFS, 2009).
4.6.5. Environmental management: Pond sludge
Sediments in ponds could be sinks for nutrients and toxic substances. Pond sludge is
considered as a pollutant and an environmental concern when released directly into the
open waterways outside the farms (Miranda, 2010; Tabthipwon, 2008), resulting in
enrichment of the water body and eutrophication. Standards specify proper disposal of
farm sediments or pond sludge, with GlobalGAP making it as a ‘major must’ (GlobalGAP,
2012). Even though it is a minor requirement in ThaiGAP for non-disposal of sediments
into public or non-permitted areas, it is still suggested that the discharge should not cause
environmental impact and if possible to reuse them. High sludge accumulation on the
189
pond bottom could be reduced by having proper pond design, including placement of
aerators in the pond, and erosion prevention by gravel or vegetation on bare areas
(McIntosh 2010; GAA-BAP 2013).
According to Thakur et al. (2010), shrimp pond sediments samples taken at 10 cm depth
contained 74% nitrogen and 78% phosphorus, higher than in the effluent water.
Therefore they suggested to let the sediments remain in the pond together with the
lower 30 cm of water to reduce nutrient loading if release outside the farm. Actually it is
mainly the practice of both shrimp and tilapia farms surveyed in this study to remove
sediments after more than 1 cycle, with larger shrimp farms removing sediments less
frequently (every 3-4 years) than the small and medium farms (every 1-2 years).
For shrimp farms in this survey, the large scale farms would mainly pump the sludge in
sedimentation ponds and the rest would put them on the pond dikes. It is the reverse for
the medium and small scale farms. A few would reuse them for rice, garden, palm and the
like if their fields are next to the farms. Thus they also realised that pond sludge has
nutrient value for crops. This is similar to the aim of the Sustainable Shrimp Project (SSP)
being implemented by the Surat Thani Shrimp Farmers’ Club, which is to reuse the sludge
from shrimp ponds for growing crops instead of just leaving them on the dikes (Ekapoj
Yodpinij, personal communication, 2010). The “zero-discharge system” is being practiced
widely by the shrimp farms in Thailand, keeping the sludge with in the farm parameters,
to comply with the standards for international trade (Tabthipwon, 2008). Larger farms
have a greater capacity to manage pond sludge, whereas smaller scale farms find it a
challenge to do so (Satapornvanit et al., 2014).

190
The Kung Krabaen Bay Royal Development Center in eastern Thailand is also using shrimp
sludge as a component of compost fertiliser, which they are selling to the public. Shrimp
sludge is rich in nutrients, and it has been reported from the KKBRDC experiment that
growth of vegetables was better, less water was required, absorption of nutrients was
more efficient than chemical fertiliser, less fertiliser or bulk needed, shelf-life is longer
(Hoousiri and Pudtarn, 1992). The high labour requirement might constrain the
sustainability of this approach (Satapornvanit et al., 2014) outside the government
subsidised initiative.
There is also a concern about salinity levels from shrimp pond sludge. However in white
shrimp culture, usually the salinity in the culture water would be less than 5ppt or even 0
ppt at the end of the culture cycle. Direct use with crops especially salt-tolerant species
could be beneficial but capacity of farmers to manage and reuse sludge need to be
strengthened (Satapornvanit et al., 2014).
There are also economic implications on the use of pond sludge. As in the experiment by
Kaewjantawee (2007) on freshwater prawn pond sludge, farmers who used the pond
bottom soil for their Chinese kale did not earn a profit as they incurred more costs. There
might be other factors involved in this such as labour cost and product price. However,
they experienced better growth of the vegetables, and improved soil quality. Therefore
the ecological costs/gain could be factored in when calculating the benefits of using pond
sludge. On the other hand, conversion of abandoned shrimp farms into other aquaculture
(finfish) and agricultural activities (palm oil) proved to be profitable (Banchun, 2012).
191
A public-private sector partnership may be necessary to define ways and means to utilise
the nutrient rich shrimp pond sludge, including strengthening capacities, and the good
practices developed by the Thai shrimp industry need to be packaged into appropriate
technologies for application not only within the shrimp farming community but more
importantly into the wider agricultural community. With shrimp pond sludge as one of
the most contentious issues, it will give advantage and credit to the shrimp farming
industry if the nutrients obtained from shrimp culture and from other inputs are returned
to the environment through recycling and reuse to grow a diverse range of crops to feed
not only rural communities but also urban consumers.
4.6.6. Farm management: Feed management
Feed is one of the major costs in aquaculture as they are expensive (Thongrod, 2007),
especially with shrimp farming and tilapia cage farming, which rely heavily on commercial
industrially produced feeds. Even in tilapia pond farms, majority of the small scale
farmers resort to using industrial feed, more so than the medium scale farmers who
tended to use more on-farm formulated feeds (Burana-osod et al., 2013). High input costs
especially feed costs were one of the main reasons for shrimp farm abandonment in the
early 2000s (Banchun, 2012).
The various standards also had many criteria on feed management, among them the
choice of feed manufacturers, storage, traceability, and record keeping. The standards
guidelines are also geared towards the use of commercial feeds and may be construed as
not favourable towards the use of on-farm formulated feeds, the raw materials of which
192
would include agro-industrial by-products. However, in the ThaiGAP for shrimp farming,
there is a provision regarding preparing feed on-farm, that proper documentation of all
ingredients used should be done and not to use banned ingredients (ACFS, 2009). This will
have implications regarding traceability especially with agro-industrial by-products which
might not have their own documentations regarding origins and production.
Feed manufacturers should have a “sustainable sourcing policy for feed ingredients” (ASC,
2012). The major feed manufacturers chosen by farmers in this research all have visions
of achieving sustainability in their operations, to provide the best quality feed to Thai
farmers (CPF, 2012; McIntosh, 2008c).
The high inclusion of fishmeal in shrimp feed has been a controversial issue for the Thai
shrimp farming industry, and efforts to change shrimp feed formulation to reduce the
amount of fish meal are underway (Patrik Henriksson et al., 2014). Fishmeal is a highly
nutritious feed ingredient, with a high crude protein content ranging from 50 to 60%
(Thongrod, 2007), giving the feed a good flavour and odour to improve the appetite of
organisms. Reduction in fish meal content in feeds will help the environment (Henriksson
et al., 2014), both at the farm level (lower nutrient loading) and externally (less emissions
from the factory), and could reduce cost (Xie et al., 2014). Already, the leading feed
manufacturer in Thailand, Charoen Pokphand Foods, announced in 2013 that it is phasing
out fishmeal from its shrimp feed, substituting it with protein from soybeans and grains,
as tests have shown that shrimp still grew normally even if feeds do not have fishmeal
(The Nation, 2013).
193
For the ThaiGAP guidelines, feed management is part of the pond manual that is required,
but the details on the use of commercial and on-farm feeds, as well as on storage, are of a
minor requirement. It is indeed important in the interest of food safety and animal
welfare, to know the quality of raw materials used for feed (Washington & Ababouch
2011), whether manufactured industrially or made on-farm. Better feed management can
result in better feed utilisation and less organic loading and sediment build-up (PJG
Henriksson et al., 2014).
The standards set on feed management would be difficult to comply with by farmers who
produce their own feeds (such as the tilapia pond farmers) using agro-industrial by-
products or other wet feeds, since there is no provision for this in the standards. Thus
farms especially tilapia producers and the majority of fish producers in the developing
world who choose to produce their own feeds to reduce costs would not be able to
comply with the feed standards and the opportunity to participate in the global trade will
be lost (Belton et al., 2011, 2010; Wilkings, 2012).
The criterion set on preference for better feed manufacturers (ASC, 2012) require
producers to be more informed on the sources of raw materials as ingredients for the
feeds formulated by feed mills. Most often, producers rely on the marketing and
promotional pitches of various feed companies to obtain their custom. As feed is
oftentimes the most cost consuming in aquaculture farm operations, farmers had to
carefully choose the best feed for their stock, in terms of cost as well as quality. The large
feed companies operating in Thailand had to rely on good customer relations through
194
providing information that will be beneficial to both sides (McIntosh, 2008c; The Nation,
2007).
4.6.7. Energy Use
The Aquaculture Stewardship Council (ASC) for tilapia has specified a standard for energy
use, to identify energy sources and then calculate and verify total energy used in kj/mt/yr
of tilapia produced. Similarly, ThaiGAP recommends for farms to have safe electricity
systems as well as to save the use of energy and/or renewable sources.
Among the farms surveyed, none mentioned the use of renewable energy sources such as
solar or wind, but rather the majority of the farms combine various sources mainly to
reduce their costs. There is potential for solar energy in farms but installation and
maintenance costs need to be within their means. Energy use on farms will be important
especially in determining ecological and/or carbon footprints and in life cycle assessments
of aquaculture production. Efficiency in the use of energy to produce fish and shrimp will
be considered as an indicator to determine impacts of the contribution of aquaculture to
the environment (Pullin et al., 2007). Boyd et al. (2007) mentioned that the range of
efficiency of energy use in aquaculture is wide, citing that traditional/extensive systems
(those relying on natural inputs) as the most efficient, and systems which are too
dependent on inputs from industrial production such as feed are at the other end, i.e.
requiring high energy use to produce.
High energy consumption and costs associated with electricity leads farmers to combine
energy sources such as diesel and gasoline to power farm activities, such as pumping. The
195
cost of setting up of a power grid or station within the farm could be uneconomical for
small scale farmers but more cost-efficient for larger scale with various operations
running to use it. Electricity could be cheaper (to use) than diesel if the government has a
policy to reduce tariffs to shrimp farmers who follow standards, thereby affecting relative
competitiveness of the Thai shrimp industry. In a multiple-country Life Cycle Assessment
(LCA) studies conducted by Henriksson et al., (2014), results have shown that the Thai
shrimp industry, along with Bangladesh, has generally lower emissions than China.
Paddlewheels in shrimp farms are usually the highest energy consumers and Henriksson
et al. (2014) suggested better management of aeration systems, and providing more
information to the farm operators so they are better informed to decide on fuel use,
monitoring of oxygen, pond design, and schedule of aeration.
4.6.8. Fish welfare issues
A number of topics related to fish welfare have been covered in this study, among them
fish and shrimp health management, diagnostics, predator control, and biosecurity. The
ability of the farms to comply with the various related standards are dependent on their
resources capacity and, to a certain extent, the farm scales. However there are matters
for e.g. the strings over ponds, screening and the PCR checking of PLs which are similar
across the shrimp farm scales. Although FAO (2000) had pointed out some limitations of
PCR as a diagnostic tool, it has become widely accepted in Thailand especially among
shrimp farmers. There are now locally manufactured PCR equipment or kits available at a
cheaper cost. With shrimp as a more valuable product, more efforts and investments are
placed to protect their stock, than with tilapia farms.

196
In terms of biosecurity, it has been referred to as one indicator of sustainable shrimp
farming, together with genetic improvement (Moss et al., 2010), as it ensures the safety
of stock from diseases. Measures such as pond lining, strings over ponds, screens around
ponds, sanitation wash, use of SPF broodstock and PLs, and a closed culture system,
among others, are being practiced. However, these measures were not able to prevent
the outbreak of EMS which threatened the sustainability of the shrimp farm industry not
only in Thailand but also the region and the world. Rather than just following a trend, i.e.
everyone has black lining and strings over pond, etc., Lightner (2005) suggested
identifying the risks in a system and then to design biosecurity measures to mitigate those
risks.
Fish welfare aspects may still be at its infancy stage in Thailand, unlike in western
aquaculture such as with salmon or tilapia, as elaborated by Young et al. (2010) and
Olesen et al. (2011). However, several of these efforts have been emphasised through
these standards and certifications, and it is expected that these will address the issue in
Thailand. In addition, determining the mindset and perceptions of farmers regarding fish
welfare aspects will help in understanding and in developing approaches in promoting
concerns for fish welfare. Changes from harvesting and distribution on ice to live hauling
of tilapia may need to be incorporated as well.
Compliance to various guidelines especially under this section such as biosecurity and
predator control entails investment costs on the part of the farmers/operators. And yet in
order for the farms to be qualified to sell their products to the processing plants, and to
sustain their production, they will have to comply with them. As it is related to animal

197
welfare, compliance will not only benefit their business but also ensure that the animals
experience good rearing conditions.
Thailand aquaculture’s efforts in promoting food safety has been commendable and leads
the region in promoting good practices in control and regulation (Clausen et al., 2014).
4.6.9. Trends and changes
Changes that occurred and were faced by shrimp and tilapia farmers in Thailand were
varied, ranging from environmental issues, technical advancements, to societal and
economic forces, similar to those discussed by Lebel et al. (2008) and Bostock (2011).
Production and operational changes are constantly occurring for both species. Changing
farming practices especially among shrimp farmers was their way of coping with
difficulties and shocks (Kruijssen et al., 2013). However, for shrimp farmers, labour
pattern changes were more common, especially among large scale farms, during the
period 2005 to 2010. In 2013, majority of the changes among shrimp farms were
specifically seed sources and yield. This was during the period of the EMS epidemic,
wherein there was an issue that the pathogen might come from postlarvae, before the
most likely causes were identified by the scientific community. The DoF together with the
private sectors and practitioners collaborated to come up with mitigation measures and
risk reduction, detailing prioritized needs (DOF, 2013b). For tilapia farms they have not
changed much since the same production and marketing strategies are being used
(Burana-osod et al., 2013). Marketing of live tilapia will make it easier to develop a quality
processing industry and export trade.
198
Some of the changes which farms (especially shrimp farms) had to make were in response
to market and trade demands (Lebel et al., 2008), such as those from the standards and
certifications, in order that their products will be acceptable to processors.
Shrimp farm operators are more dependent on their aquaculture operations for income,
compared to tilapia farm operators, which have other sources of livelihood. This was
shown by the livelihood indicators index (based on the contribution of aquaculture to
household income) calculated by Kruijssen et al. (2013) on a subset of farmers in this
research study, i.e. 0.82 for shrimp and 0.46 for tilapia. This has implications to the farms’
capability to diversify or change to another income source if something drastic happens
to their respective industries. Despite the exposure to financial shocks and damages
(shrimp farmers face more than tilapia farmers), Thai farmers have a higher capability to
survive, based on their varied coping mechanisms, shorter recovery time and level of
damage (Kruijssen et al., 2013).
4.7. Conclusion
Shrimp and tilapia are two important aquaculture species in Thailand for trade. Proof of
the fact is that the globally accepted standards and certifications cover these two species.
However, for Thailand, the majority of the tilapia farms are not yet ready to be audited
against these standards. Aside from the fact that tilapia production is still mainly for the
local market and enjoys a larger market share of 90%, the standards themselves are
geared towards industrial level of monoculture. As most of the tilapia farms are semi-
intensive polyculture systems, with 1 to 4 other species stocked with tilapia in the pond,
the standards are quite complicated to be applied to these types of farms. Likewise, for
199
the tilapia cages, the absence of local governance on how they are managed in public
water areas may also limit the compliance to standards.
The large scale shrimp farms are more able to comply with the various criteria set by the
global standards and certifications (as discussed here), because these standards were
designed with the “industrial” and “intensive” nature of production in mind. Considering
the importance placed by the standards on the environmental aspects of shrimp farming,
the farms across all scales can be said to comply, especially in not releasing effluents and
sludge to the outside environment.
The global standards often refer to the local regulations for the specifics of their
standards. In this case the ThaiGAP should be more specific and clearer and informed to
the farmers/producers so they can easily understand how to comply with the standards.
For general aquaculture, unless the standards provide alternative aquaculture production
systems which cover the other spectrum, i.e. semi-intensive, less-industrial, polyculture
and integrated systems, the medium and small scale farmers/producers may be left out
from selling their products for exports. Compliance to certification standards is more a
gateway for entry to the export trade rather than as an indicator of sustainability.
Changes in farm operations and management occurred due to the changing scenarios
such as environment and weather, disease, and markets (consumer demands, price
fluctuations). It is more difficult for farm operations with high investment costs (for e.g.
shrimp farming) to permanently stop or to diversify to another activity, as they have
already invested heavily on infrastructure in the farms, compared with less capital
200
intensive operations (for e.g. semi-intensive polyculture tilapia pond farming) wherein
other species can still be farmed in the same unit. The dependence on other livelihood
income sources among tilapia farmers could be one of the reasons.
201
5. CHAPTER 5 Assessment of the quality of life of shrimp farm workers in Thailand
5.1. Introduction
The export of seafood from producing countries including Thailand has increased
considerably over the last two decades, for selected species. The intensity of labour use
along the value chain varies among the countries, and in Thailand, there has been an
increase in the use of migrant labour from the three neighbouring countries, namely
Cambodia, Lao PDR and Myanmar. Issues in labour practices particularly in the shrimp
sector in Thailand have been brought out in recent years, particularly related to migrant
labour, child labour and human trafficking (US Department of State, 2013). A number of
studies and reports have been published highlighting the critical issues mainly in the
processing sector (Diallo et al., 2010; EJF, 2013b; Sakaew, 2011; UNIAP, 2011; Vartiala et
al., 2013), and in general, the Thailand situation through the Asian Decent Work Decade
(2006-2015) initiative under the International Labour Organization (ILO) and Human
Rights Watch (2010). Agriculture including fishing has the largest proportion (58.9%) of
informal employment in Thailand, and further defined informal employment as a
category for those workers who do not have social security coverage (ILO, 2013b).
Thailand attracts migrant labour from neighbouring countries due to its shortage of
labour in some sectors (ILO, 2013b), including the aquaculture industry (UNIAP, 2011).
This shortage could be termed as “relative labour shortages” wherein the local workforce
are not willing to do the work, for reasons of low wage, remoteness of area, unsuitable
employers, and unattractive work (Böhning, 1996). Fisheries and aquaculture work are
some of the jobs considered by Thais as 3D (dangerous, difficult and dirty).
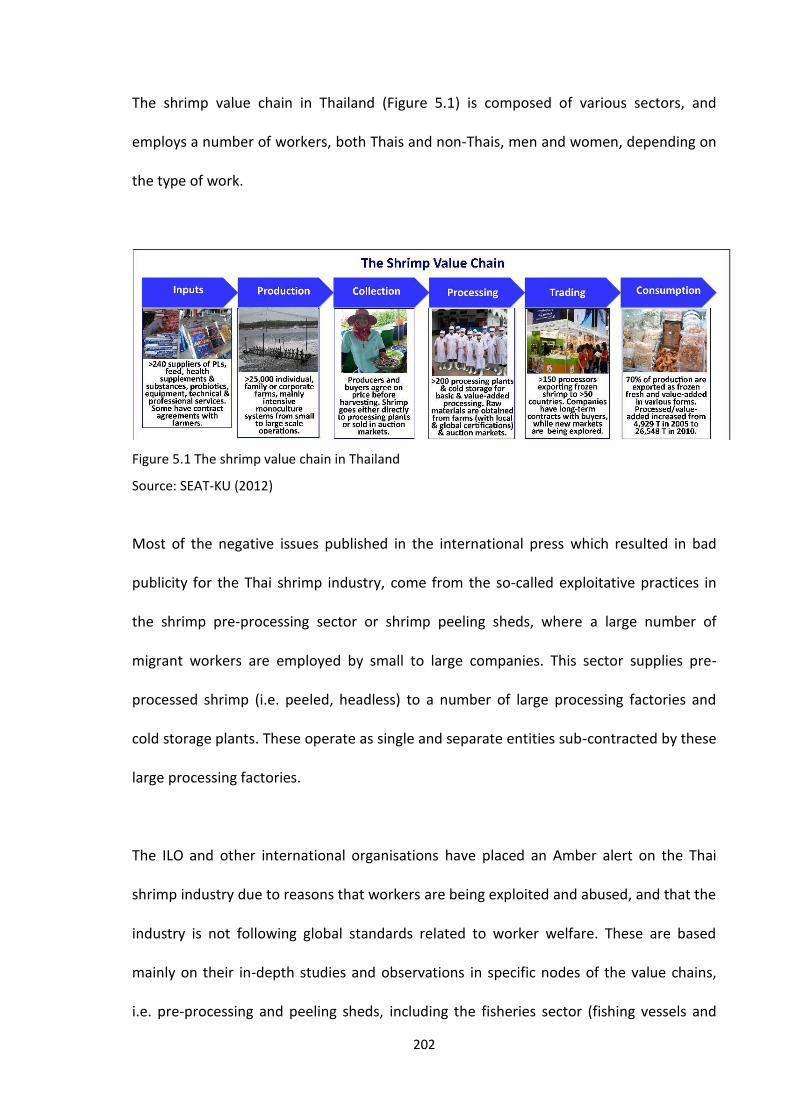
202
The shrimp value chain in Thailand (Figure 5.1) is composed of various sectors, and
employs a number of workers, both Thais and non-Thais, men and women, depending on
the type of work.
Figure 5.1 The shrimp value chain in Thailand
Source: SEAT-KU (2012)
Most of the negative issues published in the international press which resulted in bad
publicity for the Thai shrimp industry, come from the so-called exploitative practices in
the shrimp pre-processing sector or shrimp peeling sheds, where a large number of
migrant workers are employed by small to large companies. This sector supplies pre-
processed shrimp (i.e. peeled, headless) to a number of large processing factories and
cold storage plants. These operate as single and separate entities sub-contracted by these
large processing factories.
The ILO and other international organisations have placed an Amber alert on the Thai
shrimp industry due to reasons that workers are being exploited and abused, and that the
industry is not following global standards related to worker welfare. These are based
mainly on their in-depth studies and observations in specific nodes of the value chains,
i.e. pre-processing and peeling sheds, including the fisheries sector (fishing vessels and

203
fishing port areas) (Derks, 2010; EJF, 2013b; Human Rights Watch, 2010; ILO, 2012;
UNIAP, 2011; US Department of State, 2013). In the media debate around employment
abuses in the sector little differentiation is made regarding the location of the key
problems leading to the impression that abuses and exploitation occur throughout the
shrimp value chain.
Going upstream towards the production sector, i.e. the shrimp farms, labour is also an
important part of farm operations. However, few in-depth studies have been carried out
on the working and living conditions on farms, including the quality of life of workers, and
this data deficiency has driven this research to focus on this sector. There are both Thais
and non-Thais employed on shrimp farms. The ILO has considered this sector as low-risk
at the moment in relation to the other sectors being checked, on the assumption that
worker exploitation is less likely but that a watching brief especially on smaller farms with
migrant families as workers is required. ILO also wants to do more field work in shrimp
farms so there is more understanding of the labour issues in that sector (T. Poutiainen,
personal communication, 2013).
The SEAT Project has used labour as one of the criteria to set the scale of farms, as
described in Chapter 2 General Methodology, and in Murray et al. (2011). A range of farm
scales still exists even though consolidation has occurred. In addition, the lack of Thai
workers willing to work in shrimp farms has led to opportunities for workers from
neighbouring countries to obtain jobs in the farms. A large number of nationals from
Cambodia, Lao PDR and Myanmar, have been coming into Thailand to find jobs in various
sectors as the Thai work force has become scarce for jobs considered the 3 Ds
204
(dangerous, difficult, dirty). As shrimp farm operations are located in various regions
generally away from metropolitan areas mainly in the eastern and southern regions,
there could be a preference for certain ethnicity as well as migrant status. However,
informal networks consisting of familial and business relationships could also influence
choice and contracting of workers.
The ILO reported that in 2010 registered migrant workers in the informal sector generally
received less than half the remuneration the Thai nationals received i.e. average monthly
wages of 5,730 Baht and 12,554 Baht, respectively, with women migrants receiving much
less than male migrants and Thais, at 5,264 Baht/month (ILO, 2013b).
Quality of life (QOL) has many aspects, and, according to Petrosillo et al. (2013), it “can be
seen as a multidimensional concept”. The global standards on human resources in
aquaculture ensure that workers are treated and provided with enough compensation
and good living and working conditions as befits a human being. However, do these
labour standards capture the essence of working in Thai shrimp farms of various scales?
There could be other aspects of shrimp farm work such as the issues mentioned by
Resurreccion & Sajor (2010), wherein the tasks are completed not by the hired person
alone, but shared between two persons, i.e. husband and wife, and yet the wife’s effort in
fulfilling the task is not considered “work” therefore not to be compensated.
Third party certification (TPC) standards cover worker welfare in farms, which shows that
the emerging consensus of this market-led governance is that the labour conditions and
employee welfare on farms are being considered at the same level as environmental

205
management, animal welfare and food safety for sustainable and ethical production of
seafood.
This research therefore has the following research hypotheses (RH) based on the above
labour situation, focusing on compliance to labour standards, exploitation potential, and
sustainability and economic impacts.
RH1: Working conditions in large scale farms are much more compliant with
labour standards set by 3rd party certifications than small scale farms.
RH2: Ethnicity and migrant status affect working and living conditions in shrimp
farms.
RH3: Migrant workers in shrimp farming in Thailand are important to correct a
labour shortage and contribute to the economies of the neighbouring, poorer
states.
Based on these hypotheses, this study aimed to answer the following research questions
(RQ), looking at the various farm scales, origins and gender of the workers.
1. How do workers perceive their quality of life in the farms?
a. Are the workers better or worse off than before working in shrimp farms?
b. Are the workers in large farms more likely to be treated according to the
standards for worker welfare (according to 3rd party standards) than in
small scale farms?
c. Is the quality of life of workers in large scale farms better than those in
small scale farms?

206
2. How do employers treat workers from different ethnic backgrounds and migrant
status?
a. Does a certain ethnic group of workers have more access to assets and
opportunities?
b. Are the registered or documented migrant workers treated better?
3. Why has migrant labour become more common in the shrimp farming industry in
Thailand?
a. Why do migrant workers choose to work in shrimp farms?
b. What is the value of shrimp farming to the economies of the neighbouring
countries where the workers come from?
c. How is Thai labour affected by the influx of migrant labour?
A gender dimension was also attempted to follow and incorporate the gender dimensions
framework in the analysis, especially within the certification standards to make them
more gender-sensitive. Value chain actors are in constant interaction with each other, to
transact business, for business networking, and for family and social activities. Even
within the shrimp farm setting, there are also varying roles by different genders,
interacting with each other. Gender refers to the social differences between men and
women, boys and girls, which are determined by society and may be learned and
changed, and could vary between and within cultures (Arenas and Lentisco, 2011). As
noted by Laven & Verhart (2011), most tools and interventions lean toward non-gender
sensitiveness in working with value chains and rural livelihoods, thus they have attempted
to create a trajectory on gender in value chains by combining gender and women
empowerment with value chain/pro-poor development. Looking at differences among
207
actors in the farm environment based on genders can add a human dimension to the
analysis.
In this research we have attempted to integrate gender aspects into the methodology in
order to bring out some gender related results, which could lead to an understanding of
how gender relations affect decision making among shrimp farm workers and their
families, as well as their opportunities for advancement and access to information and
meeting their needs.
As in Chapter 4, the global certification standards to be used as benchmarks will be the
Best Aquaculture Practices or BAP (GAA-BAP, 2013) and the GlobalGAP (GlobalGAP,
2012), which have standards for shrimp farms. The main areas covered by these
certification standards in relation to farm workers include workers’ safety and occupation
health, worker welfare and living conditions, legal aspects and documentation including
labour laws, as well as knowledge and training. The aspects of quality of life and workers’
perceptions with a gender perspective are not covered in these standards, and it is the
aim of this chapter to add value to the review of workers’ conditions in shrimp farms by
trying to include them.
Two types of employment need to be considered according to the Department of Labour
Protection and Welfare. First is “industrial” which is within the system and covered by the
labour law or code, and the second is “agricultural/domestic/home-based” which is
outside the system and therefore not covered by the labour law or code, as provided by
Ministerial Regulation No. 9 BE 2541 (Ministry of Labour, 1998).
208
The main difference between these two types of employment is the 300 baht/day
minimum wage, which is required if employed under the industrial system. For
employment outside the system, wages could be less or more than this but should have
an agreement between Employer and Employee. Related occupations in aquaculture
under industrial employment i.e. within the system, include work in seafood cold storage
and processing plants, where in this case the employers are registered as companies or
business enterprises. Workers in shrimp farms are considered working outside the system
(unless large scale corporate farms attached to another company affiliate), and to have a
similar status to those working in general agriculture, domestic work, as well as home-
based business for e.g. jewelry making and sales. There are no specific labour laws for
shrimp farm work, in contrast to sea fisheries which has a specific stipulation under the
Ministerial Regulation No. 10 B.E. 2541 (1998) issued under the Labour Protection Act B.E.
2541 (1998) (Ministry of Labour, 1998), which defines wages as “the share which an
Employer agrees to pay an Employee according to the value of the aquatic animals being
caught”. Aquaculture falls outside such a ‘crews share’ system but is also generally not
covered by minimum wage norms (currently set at 300 Baht/day), works involving both
fisheries and aquaculture were excluded (Ministry of Labour, 2012).
5.2. Methodology
A sequential mixed methods approach was applied, wherein systemic survey work and
pattern analysis was followed by an in-depth explanatory qualitative work. The sample
frame of this phase of research was an outcome of the earlier multi-phase sample design.
This approach improves the generalisability of the findings of the study.
209
As mentioned in Chapters 2 and 4, an integrated survey among shrimp and tilapia farmers
was conducted in 2010 to 2011 which included information on gender disaggregated data
on labour aspects to confirm farm scales. In 2013, an in-depth or face to face survey was
conducted among a sub-set of these farms to determine specific changes in labour
patterns, as labour is one of the main determinants in the farm scaling which the SEAT
project has created to categorise the farms.
5.2.1. Survey respondents
The respondents for the face to face surveys on shrimp farm labour consisted of the
following:
Shrimp farm owners or farm managers only
Shrimp farm workers
Key informants from government and non-government groups related to
community and labour issues
Shrimp farm owners and farm managers who were the respondents of the integrated
farm survey conducted in 2010-2011, were the first point of contact for this survey.
Respondents were selected based on a telephone survey regarding changes in shrimp
farming operations. As mentioned in the Methods section in Chapter 4, the transition
survey was conducted during 7 to 15 March 2013. Out of the 165 respondents contacted
by phone, 117 responded to the survey over the phone. The face to face survey on labour
patterns reported in this chapter was conducted from April to May 2013.
210
From the March phone survey, 23 respondents gave direct responses regarding labour
changes. An additional 10 respondents were selected from those whose operations
changed based on the reasons given for labour changes but did not respond directly on
labour changes. They are considered the priority group for the face to face survey. A
second group of respondents was selected as reserve based on the reasons given for
labour changes but did not respond directly on labour changes (Table 5.1).
The respondents were categorized according to farm scales (small, medium, large) and
regions (east, south), aiming to have a total of 30 respondents. The priority group as
explained above was first contacted and the purpose of the face to face survey was
explained, and then appointments were made for interviews with the farm owners or
managers. In addition, it was also requested to grant permission to interview their farm
workers. The intention to interview migrant workers drew an unfavourable reaction with
at least one prospective respondent (farm owner), and she declined even an interview
with herself, saying that migrant labour was a sensitive topic.
The New Year holiday (Thai, Lao, Cambodia and Myanmar) delayed interviews in April and
complicated access to migrant workers who often returned home during this period. Thus
the surveys were extended into May especially in the south. In a few farms where the
schedule to interview fell in April especially in the east and workers were largely absent
only farm owners could be interviewed. In addition to the timing of Thai New Year, the
Early Mortality Syndrome (EMS) outbreak also affected the number of workers on farms
available for interview because shrimp farming operations had slowed down or been
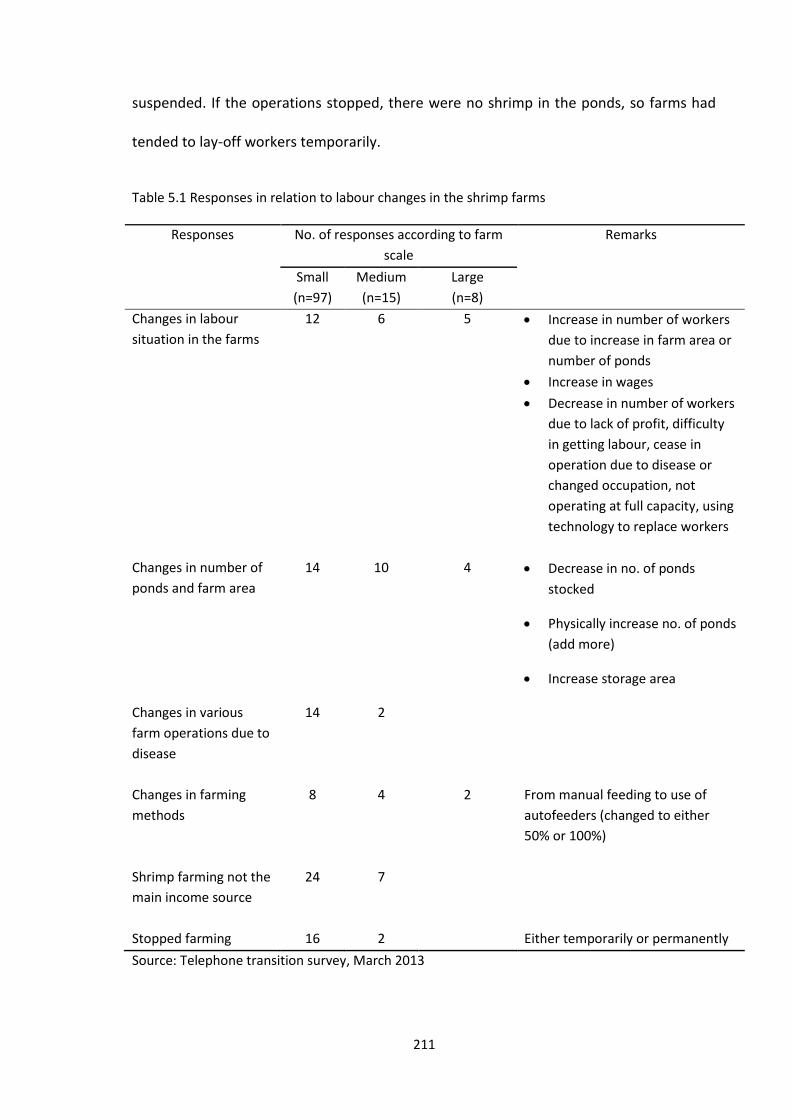
211
suspended. If the operations stopped, there were no shrimp in the ponds, so farms had
tended to lay-off workers temporarily.
Table 5.1 Responses in relation to labour changes in the shrimp farms
Responses No. of responses according to farm
scale
Remarks
Small
(n=97)
Medium
(n=15)
Large
(n=8)
Changes in labour
situation in the farms
12 6 5 Increase in number of workers
due to increase in farm area or
number of ponds
Increase in wages
Decrease in number of workers
due to lack of profit, difficulty
in getting labour, cease in
operation due to disease or
changed occupation, not
operating at full capacity, using
technology to replace workers
Changes in number of
ponds and farm area
14 10 4 Decrease in no. of ponds
stocked
Physically increase no. of ponds
(add more)
Increase storage area
Changes in various
farm operations due to
disease
14 2
Changes in farming
methods
8 4 2 From manual feeding to use of
autofeeders (changed to either
50% or 100%)
Shrimp farming not the
main income source
24 7
Stopped farming 16 2 Either temporarily or permanently
Source: Telephone transition survey, March 2013

212
Shrimp farm owners are those who have the legal ownership of the farms, can be an
individual or a company (if registered as a Thai business), can be co-owners in the case of
husband and wife, or he/she can be the legal lessor of the farm in the case of the farm
being leased from another. These owners may or may not be the managers of the farms,
especially for individual owners. Corporate owners will always have a manager employed.
Farm managers are those who are hired or employed by an individual farm owner or a
corporate farm to manage the shrimp farm enterprise. He or she may or may not hold
ownership or share in the company.
Depending on the scale of operations, shrimp farms have various types and levels of hired
persons to undertake various tasks in the farms. In the Thai language, the term ‘worker’
refers to one who is doing the manual/pond work in the farm, domestic work, driving
vehicles, and guarding the farm. The term ‘employee’ or ‘staff’ refers to one who works in
the office or laboratories or machinery or oversees the workers. This could include the
managers, technicians, and those involved in accounting and administration.
The basic unit of the shrimp farm is the pond. A worker (usually male) is assigned to take
care of one pond. A pond worker can also be a female, but oftentimes, the tasks given to
female workers are ‘female’ or light tasks. If a married couple or a husband and wife team
is hired or contracted to work in the farm, they are assigned at least 2 ponds, or the
whole farm, depending on the size and scale.

213
If farms have a large area and many ponds, the ponds are grouped into zones. Usually one
zone consists of 3-10 ponds. Each zone is usually headed by a technician, who therefore is
in-charge of all the ponds and workers within the zone, as well as additional work
assigned by the owner or manager. Workers may also be given additional assignment
depending on their expertise, such as for machine maintenance or repair, electrical
troubleshooting, and feed measurement, which will cover the whole farm needs.
5.2.2. Face to face interviews
The face to face interviews took about an hour or so with farm employers and key
informants, but about half hour with workers, depending on how long the respondent
provided the answers to the questions. For example when we interviewed a farm
manager and his two female workers, we started the interview with the farm manager at
1500 hrs and finished at 1600 hrs, then the first worker interview at 1600 until 1630 hrs,
then the second one at 1630 to 1700 hrs. Time included translation of questions from
English to Thai, noting down by the translator of some responses in Thai, then translation
of responses from Thai to English, and writing down the responses in English.
As the interviews were semi-structured, follow-up questions were also asked based on
the responses to the questions, as well as clarifications. Thus translation of the responses
back to the main researcher was necessary in order to frame the follow-up question when
necessary. I could follow the conversation and was taking down notes while the Thai
interviewer was talking to the respondents. However, translating back the conversation
helped to confirm the notes taken.
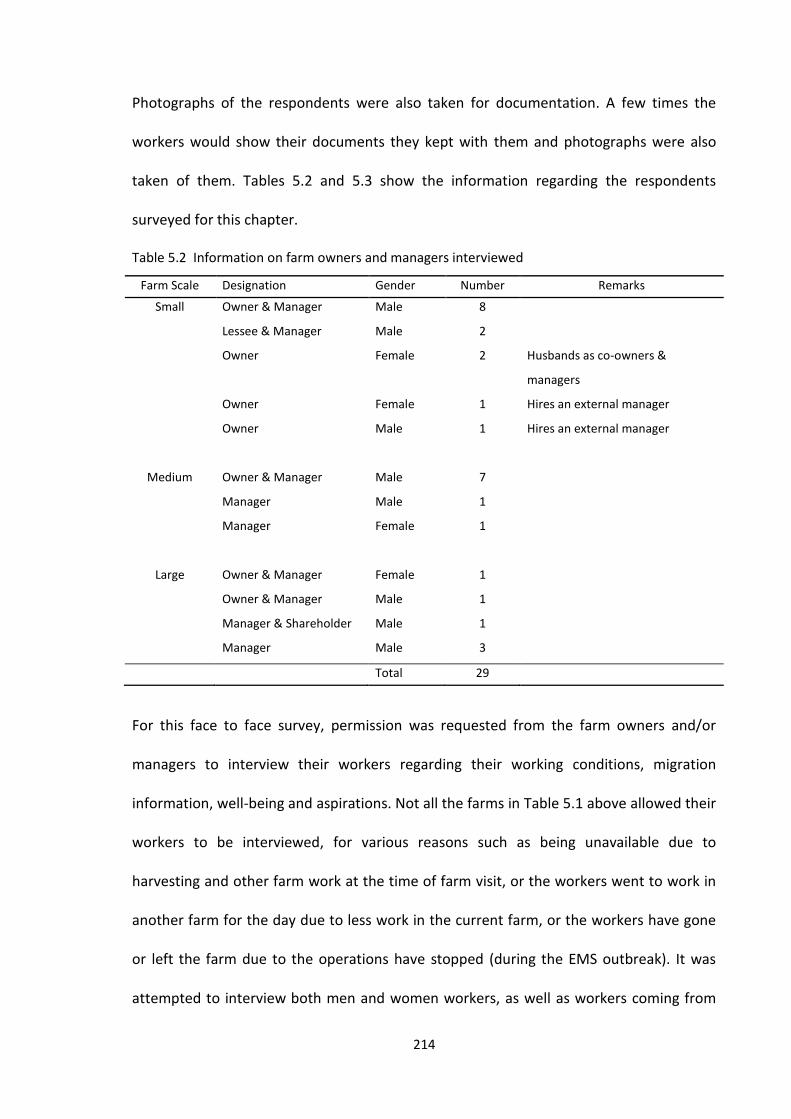
214
Photographs of the respondents were also taken for documentation. A few times the
workers would show their documents they kept with them and photographs were also
taken of them. Tables 5.2 and 5.3 show the information regarding the respondents
surveyed for this chapter.
Table 5.2 Information on farm owners and managers interviewed
Farm Scale Designation Gender Number Remarks
Small Owner & Manager Male 8
Lessee & Manager Male 2
Owner Female 2 Husbands as co-owners &
managers
Owner Female 1 Hires an external manager
Owner Male 1 Hires an external manager
Medium Owner & Manager Male 7
Manager Male 1
Manager Female 1
Large Owner & Manager Female 1
Owner & Manager Male 1
Manager & Shareholder Male 1
Manager Male 3
Total 29
For this face to face survey, permission was requested from the farm owners and/or
managers to interview their workers regarding their working conditions, migration
information, well-being and aspirations. Not all the farms in Table 5.1 above allowed their
workers to be interviewed, for various reasons such as being unavailable due to
harvesting and other farm work at the time of farm visit, or the workers went to work in
another farm for the day due to less work in the current farm, or the workers have gone
or left the farm due to the operations have stopped (during the EMS outbreak). It was
attempted to interview both men and women workers, as well as workers coming from
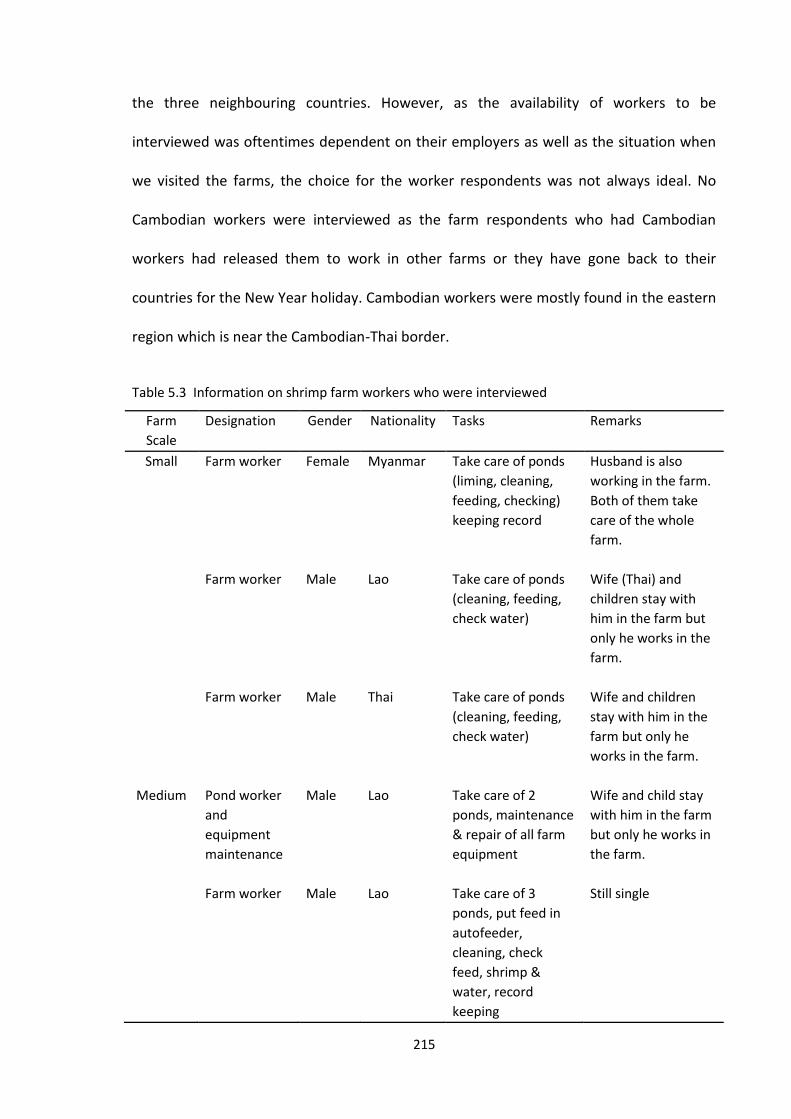
215
the three neighbouring countries. However, as the availability of workers to be
interviewed was oftentimes dependent on their employers as well as the situation when
we visited the farms, the choice for the worker respondents was not always ideal. No
Cambodian workers were interviewed as the farm respondents who had Cambodian
workers had released them to work in other farms or they have gone back to their
countries for the New Year holiday. Cambodian workers were mostly found in the eastern
region which is near the Cambodian-Thai border.
Table 5.3 Information on shrimp farm workers who were interviewed
Farm
Scale
Designation Gender Nationality Tasks Remarks
Small Farm worker Female Myanmar Take care of ponds
(liming, cleaning,
feeding, checking)
keeping record
Husband is also
working in the farm.
Both of them take
care of the whole
farm.
Farm worker Male Lao Take care of ponds
(cleaning, feeding,
check water)
Wife (Thai) and
children stay with
him in the farm but
only he works in the
farm.
Farm worker Male Thai Take care of ponds
(cleaning, feeding,
check water)
Wife and children
stay with him in the
farm but only he
works in the farm.
Medium Pond worker
and
equipment
maintenance
Male Lao Take care of 2
ponds, maintenance
& repair of all farm
equipment
Wife and child stay
with him in the farm
but only he works in
the farm.
Farm worker Male Lao Take care of 3
ponds, put feed in
autofeeder,
cleaning, check
feed, shrimp &
water, record
keeping
Still single
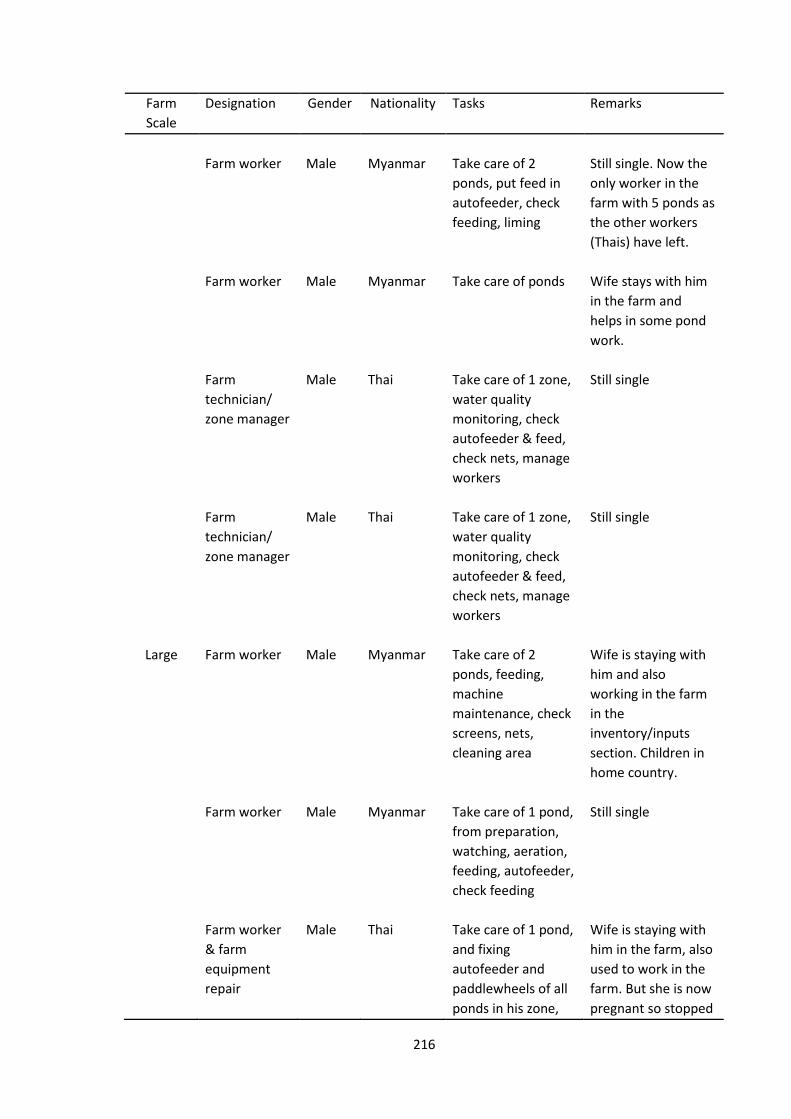
216
Farm
Scale
Designation Gender Nationality Tasks Remarks
Farm worker Male Myanmar Take care of 2
ponds, put feed in
autofeeder, check
feeding, liming
Still single. Now the
only worker in the
farm with 5 ponds as
the other workers
(Thais) have left.
Farm worker Male Myanmar Take care of ponds Wife stays with him
in the farm and
helps in some pond
work.
Farm
technician/
zone manager
Male Thai Take care of 1 zone,
water quality
monitoring, check
autofeeder & feed,
check nets, manage
workers
Still single
Farm
technician/
zone manager
Male Thai Take care of 1 zone,
water quality
monitoring, check
autofeeder & feed,
check nets, manage
workers
Still single
Large Farm worker Male Myanmar Take care of 2
ponds, feeding,
machine
maintenance, check
screens, nets,
cleaning area
Wife is staying with
him and also
working in the farm
in the
inventory/inputs
section. Children in
home country.
Farm worker Male Myanmar Take care of 1 pond,
from preparation,
watching, aeration,
feeding, autofeeder,
check feeding
Still single
Farm worker
& farm
equipment
repair
Male Thai Take care of 1 pond,
and fixing
autofeeder and
paddlewheels of all
ponds in his zone,
Wife is staying with
him in the farm, also
used to work in the
farm. But she is now
pregnant so stopped
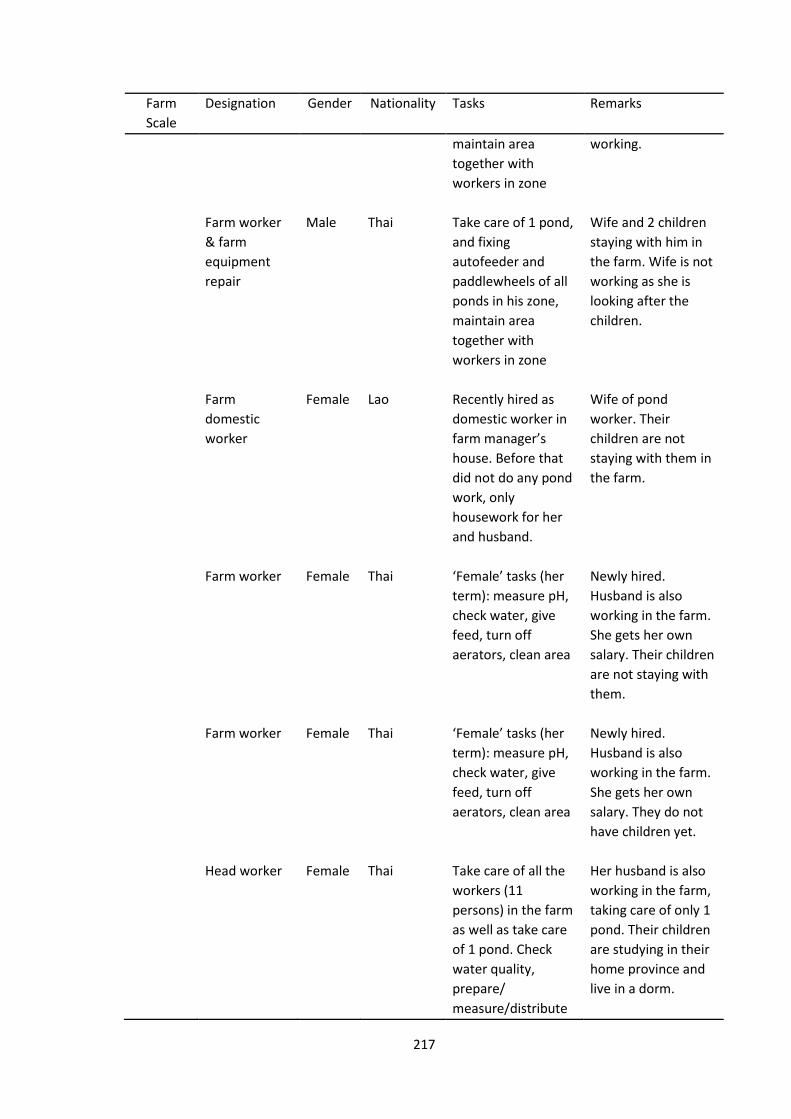
217
Farm
Scale
Designation Gender Nationality Tasks Remarks
maintain area
together with
workers in zone
working.
Farm worker
& farm
equipment
repair
Male Thai Take care of 1 pond,
and fixing
autofeeder and
paddlewheels of all
ponds in his zone,
maintain area
together with
workers in zone
Wife and 2 children
staying with him in
the farm. Wife is not
working as she is
looking after the
children.
Farm
domestic
worker
Female Lao Recently hired as
domestic worker in
farm manager’s
house. Before that
did not do any pond
work, only
housework for her
and husband.
Wife of pond
worker. Their
children are not
staying with them in
the farm.
Farm worker Female Thai ‘Female’ tasks (her
term): measure pH,
check water, give
feed, turn off
aerators, clean area
Newly hired.
Husband is also
working in the farm.
She gets her own
salary. Their children
are not staying with
them.
Farm worker Female Thai ‘Female’ tasks (her
term): measure pH,
check water, give
feed, turn off
aerators, clean area
Newly hired.
Husband is also
working in the farm.
She gets her own
salary. They do not
have children yet.
Head worker Female Thai Take care of all the
workers (11
persons) in the farm
as well as take care
of 1 pond. Check
water quality,
prepare/
measure/distribute
Her husband is also
working in the farm,
taking care of only 1
pond. Their children
are studying in their
home province and
live in a dorm.
218
Farm
Scale
Designation Gender Nationality Tasks Remarks
feed to workers.
Take care of
emergency.
Office and
farm worker
Female Thai Assists farm
manager in
accounting and
reports, to send to
head office in
Bangkok. Assists
head farm worker in
checking feeding,
put feed in
autofeeder, feeding
tray, switch on
autofeeder, data
input in computer
Married with a son,
her husband is not
working in this farm
but also related to
shrimp farming.
They live nearby the
farm (outside) as
they are local
people.
5.2.3. Key informants
A number of key informants were also approached to be interviewed regarding the
general situation of shrimp farm workers in their respective area of assignment, especially
in relation to labour protection, institutional and legal aspects, as well as migrant labour.
Therefore, representatives from the Thai government’s Department of Employment,
Department of Labour Protection and Welfare and the Sub-district Administrative
Organization in the provinces were interviewed. In addition, respondents from NGOs
working closely with migrant workers were also visited, as well as researchers who have
worked with migrant workers. Table 5.4 shows the key informants interviewed.

219
Table 5.4 Key informants interviewed for worker issues, at their place of work
Sector Organization Level Gender Number
Government Department of Employment
Provincial Female
Male
1
1
Department of Labour Protection and Welfare
Provincial Female
Male
2
2
Sub-district Administrative Organization
Sub-district Male 3
Non-
government
Labour Protection Network
National Male 1
Raks Thai Foundation National Female 1
Asian Institute of Technology/Stockholm Environment Institute
Regional Female 1
World Vision International Male 1
International International Labour Organisation
International
Male
1
5.2.4. Survey instruments
A semi-structured questionnaire (Appendix 6) was designed and piloted with a number of
shrimp farm owners and workers in February 2013, after which some of the questions
were revised accordingly. As well, during the interview itself, additional follow-up
questions were asked depending on the answers of the respondents to the questions. The
main topics in the interviews with workers included the following:
Recruitment and migration pathways
Working and living conditions
Worker tasks and benefits

220
Gender dimension on access to assets and opportunities, decision-making
Workers’ family matters
Worker well-being
5.2.5. Analysis
Interview transcripts were coded according to the research questions using NVivo for
data management and coding framework. Analysis was through descriptive statistics for
quantitative data as well as by narrative addressing the research questions.
The QOL framework based on needs suggested by Costanza et al. (2007) was used as a
guide but modified to fit the workers’ perceptions responses.
5.3. Results
5.3.1. Background of workers
A total of 18 shrimp farm workers were interviewed i.e. 9 from large scale, 6 from
medium and 3 from small scale farms. There was an equal number of Thai (9) and migrant
workers (9) interviewed. Figure 5.2 gives details on country of origin and the gender of
respondents.

221
Figure 5.2 Country of origin and gender of shrimp farm workers surveyed
The total number of shrimp farm workers in Thailand is not known. Estimates of the total
number of workers for shrimp farms may be calculated based on the number of ponds if
this information is reported. Shrimp farms usually hire one worker to take care of a single
pond. However, the DoF annual statistics only report the number of farms and the total
area of farms.
5.3.2. Quality of life of workers in shrimp farms
5.3.2.1. Occupation prior to working in shrimp farms
The majority (78%, n=18) of the shrimp farm workers interviewed, both Thai and
migrants, have worked in various occupations before working in shrimp farms. Figure 5.3
is a tag cloud showing that the main occupations of shrimp farm workers previously were
rice farming (22.2%) and construction work (16.7%). Those in rice farming were doing it in
their home countries, whereas those in construction work were already in Thailand, and
moved to the shrimp farming areas to find work in the shrimp farms.
0
1
2
3
4
5
6
7
Female Male Male Female Male
Large Medium Small
Laos Myanmar Thailand
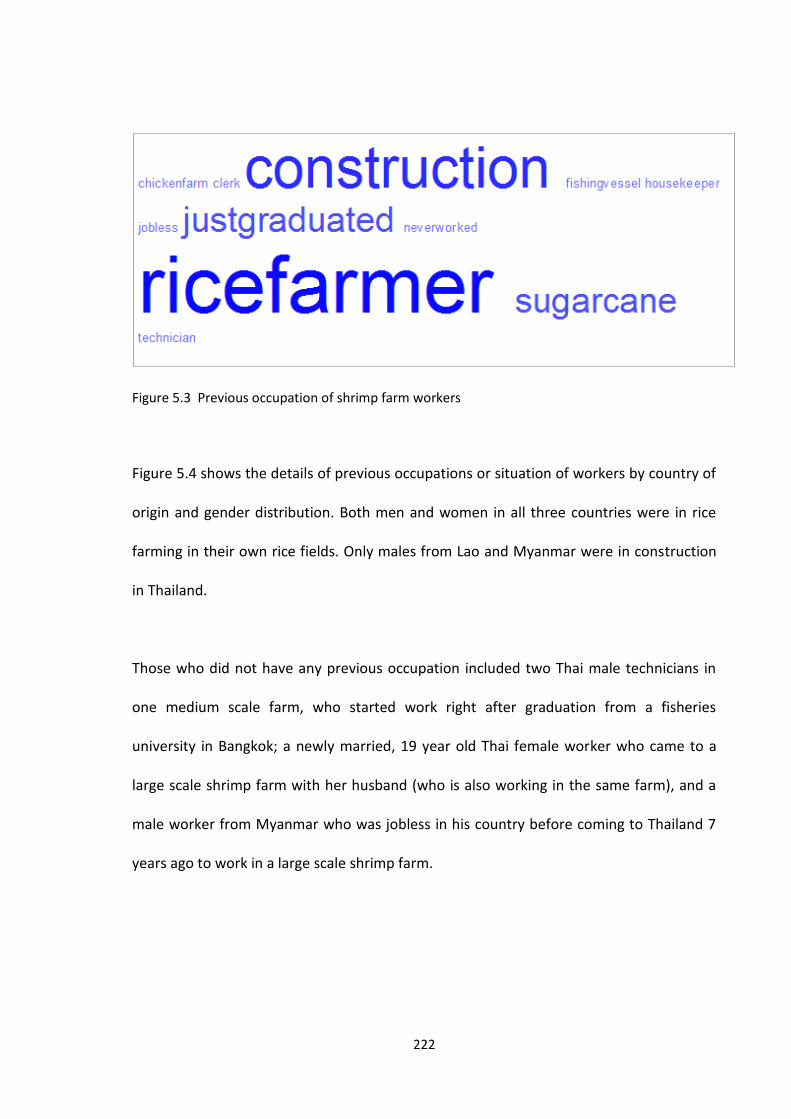
222
Figure 5.3 Previous occupation of shrimp farm workers
Figure 5.4 shows the details of previous occupations or situation of workers by country of
origin and gender distribution. Both men and women in all three countries were in rice
farming in their own rice fields. Only males from Lao and Myanmar were in construction
in Thailand.
Those who did not have any previous occupation included two Thai male technicians in
one medium scale farm, who started work right after graduation from a fisheries
university in Bangkok; a newly married, 19 year old Thai female worker who came to a
large scale shrimp farm with her husband (who is also working in the same farm), and a
male worker from Myanmar who was jobless in his country before coming to Thailand 7
years ago to work in a large scale shrimp farm.
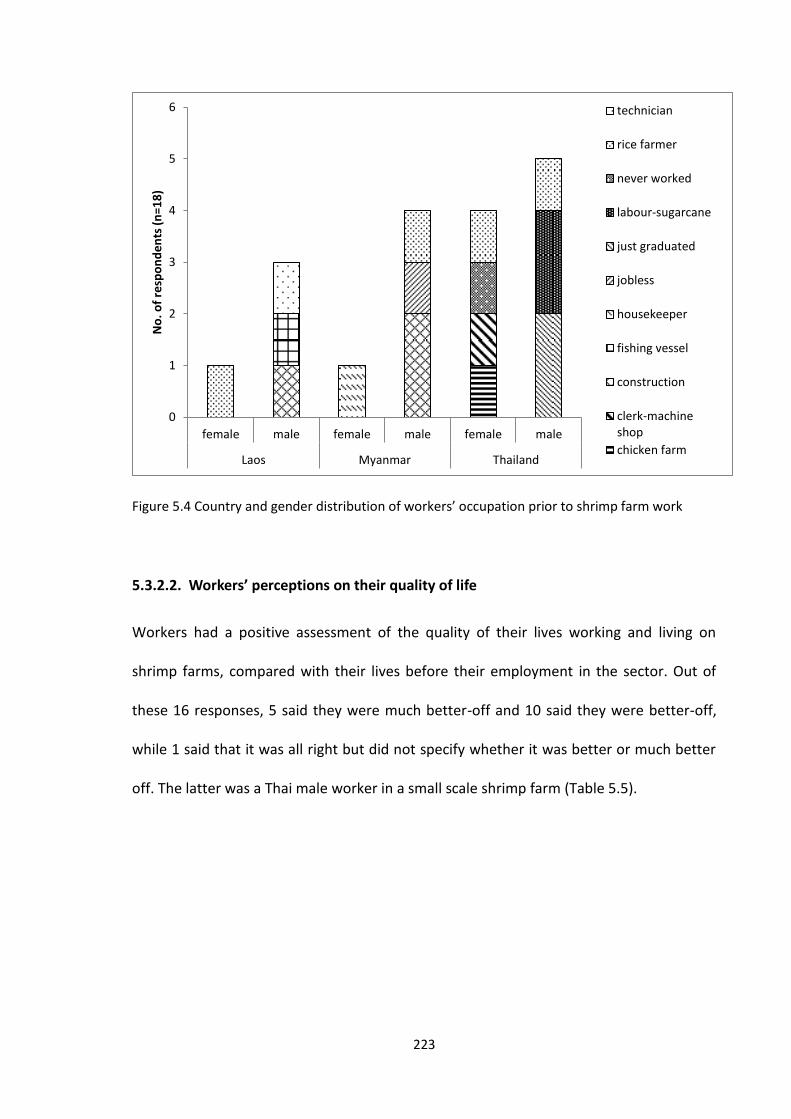
223
Figure 5.4 Country and gender distribution of workers’ occupation prior to shrimp farm work
5.3.2.2. Workers’ perceptions on their quality of life
Workers had a positive assessment of the quality of their lives working and living on
shrimp farms, compared with their lives before their employment in the sector. Out of
these 16 responses, 5 said they were much better-off and 10 said they were better-off,
while 1 said that it was all right but did not specify whether it was better or much better
off. The latter was a Thai male worker in a small scale shrimp farm (Table 5.5).
0
1
2
3
4
5
6
female male female male female male
Laos Myanmar Thailand
No
. of
resp
on
de
nts
(n
=18
)
technician
rice farmer
never worked
labour-sugarcane
just graduated
jobless
housekeeper
fishing vessel
construction
clerk-machineshop
chicken farm

224
Table 5.5 Perceptions of shrimp farm workers on their quality of life
Farm Scale Country of
origin
Gender Much better-
off
Better-off OK
Small Thai Male 1
Lao Male 1
Myanmar Female 1
Medium Thai Male 2
Lao Male 1 1
Myanmar Male 2
Large Thai Female 2 2
Lao Female 1
Myanmar Male 1 1
Total 5 10 1
n = 16
Reasons for shrimp farm workers considering they were much better-off now than before
included economic and financial, as well as emotional, social and physical reasons (Table
5.6). Reasons referring to emotional well-being in Table 5.6 were more frequently
mentioned (12 times), followed by economic and physical (7 times each), then social (4
times). These are based on multiple responses, wherein one worker could cite more than
one reason.

225
Table 5.6 Reasons for workers’ perceptions of a better quality of life
Emotional (12x) Economic (7x) Social (7x) Physical (4x)
No pressure, less
stressful,
happiness factor
Can live together
with spouse
More freedom,
independence
More comfortable
life
Makes a person
more mature and
responsible
No problems
faced
Peaceful
Spend less
money, more to
save & send back
home
Additional income
such as bonus,
benefits
Non-monetary
benefits such as
housing, water,
electricity, meals
Fully paid for
effort made
Owners are kind
Enjoyable working
with employers &
other workers
Respect among
each other in the
farm
Familial
atmosphere living
in the farm
Mechanisation reduced
workload
Work is easier
On-going production
Better living conditions
Closer to nature
Note: Needs categorisation modified from Costanza et al. (2007)
Emotionally, workers experienced that working in shrimp farms was less pressurised and
stressful for them, than in their previous occupations. The work on shrimp farms was
routine and had a schedule that was generally considered favourable; most workers
found it fun, enjoyable, comfortable, and easier than construction or fisheries, except
when disease outbreaks occur. Both male and female workers cited the above reasons, in
addition to the fact that having their spouses and, for some, their children, living with
them in the farms helped in giving them peace of mind. For the employers, one of the
reasons for allowing families to stay together in the farm was that this tended to increase
contentment and productivity of the workforce. In addition, most employers also
226
preferred to hire married workers as they were less likely to seek off farm entertainment
than single employees.
Working on a shrimp farm also gave freedom and independence to the workers,
compared to working under more rigid conditions in other occupations such as
construction, fisheries, factories or domestic work. The assignment of specific ponds to
individual workers gave clear responsibilities and allowed some autonomy of decision-
making.
“We used to work in Bangkok. I worked as a housekeeper in
Bangkok while my husband worked in a market in Rangsit.
We were not staying together, so we only met on weekends.
We wanted to work together and stay together. Working
in a shrimp farm allows us to be together. We have more
freedom here and can make decisions independently.
We have less expenses here.” (Myanmar female shrimp farm worker)
“Working on a shrimp farm makes me feel more free than on a fishing boat…
I can move around and the workload is lighter because of the machinery
we use”. (Lao male shrimp farm worker).
Economic and financial reasons for being better-off included being paid both a basic
monthly salary as well as a bonus which is based on the amount of production. In
addition, non-monetary benefits which workers received from employers reduce the
living expenses of workers. Workers claimed that this directly increased remittances they

227
could send home. Migrant workers usually support their children who are left behind in
their hometowns or countries, for basic living and educational expenses. Single
employees send money back to support their parents and siblings. Workers felt well
compensated overall compared to other types of comparable employment where higher
living costs tended to erode any differences in salary.
Physical aspects of living on the shrimp farm also improved workers’ lives compared to
alternative employment; including the application of technology that resulted in reduced
workload. This, together with the free housing, freedom from commuting to work and a
work environment located in natural surroundings made for emotional well-being.
Socially, people in the farms work together, treat each other as family and friends, and
help each other when their workload was light. There was also respect from the new
worker for the older or existing workers. A migrant male worker mentioned that life on
the shrimp farm was like staying at home. One lead female worker responsible for a
group of other workers mentioned that conflicts among workers tended to be sparked by
minor issue and were generally easy to resolve. One migrant worker who had been on the
same shrimp farm for 10 years, and was the first migrant worker this farm had ever hired,
mentioned that he had not faced any problems in the farm, and that if he had, he would
not have stayed that long in the farm.
5.3.2.3. Key informants’ perceptions on workers’ quality of life
The KI from the one subdistrict administrative organization who is also a shrimp farmer
observed that the living situation of migrant workers is better now compared to 4 to 5
228
years ago. When the migrant workers first came to Thailand at that time, almost all came
and worked illegally, so they were afraid to move around and go out. These problems
were linked to the shrimp sector at that time having no requirement for registration. But
nowadays, most of the migrant workers were registered and had legal IDs so life is much
easier for them.
5.3.3. Status of compliance to labour standards
Third party certification standards for finfish and crustacean aquaculture, namely the
Global Aquaculture Alliance/Best Aquaculture Practices Certification (GAA/BAP) and the
GlobalGAP Risk Assessment in Social Practice (GRASP), emphasise standards and
guidelines promoting worker safety, occupational health and safety, as well as employee
relations, in shrimp farms (GAA-BAP, 2013; GlobalGAP, 2011). This section will look at the
work situation and living conditions of the workers interviewed vis-à-vis the two
standards mentioned above. The standards emphasise that farms should comply with
local and national labour laws in order that workers are adequately safe in the working
environment, not exposed to health issues, compensated properly, and provided with
good on-site living conditions including enough training to perform their specific tasks
related to chemical handling and hygiene standards (GAA-BAP, 2013; GlobalGAP, 2012).
5.3.3.1. Salaries & wages
Salary information obtained from farm owners, managers and workers is shown in Table
5.7. Information from farm owners and managers revealed that salaries of workers are
paid monthly and are based on the number of ponds assigned to them, usually one
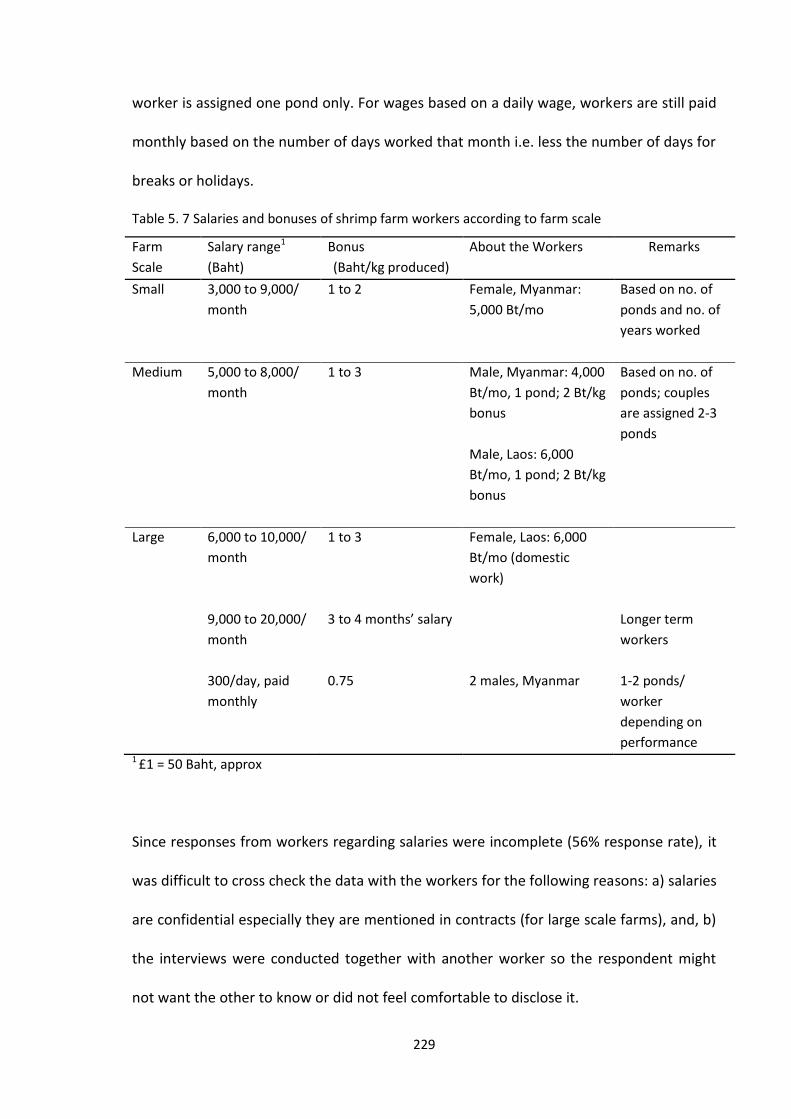
229
worker is assigned one pond only. For wages based on a daily wage, workers are still paid
monthly based on the number of days worked that month i.e. less the number of days for
breaks or holidays.
Table 5. 7 Salaries and bonuses of shrimp farm workers according to farm scale
Farm
Scale
Salary range1
(Baht)
Bonus
(Baht/kg produced)
About the Workers Remarks
Small 3,000 to 9,000/
month
1 to 2 Female, Myanmar:
5,000 Bt/mo
Based on no. of
ponds and no. of
years worked
Medium 5,000 to 8,000/
month
1 to 3 Male, Myanmar: 4,000
Bt/mo, 1 pond; 2 Bt/kg
bonus
Male, Laos: 6,000
Bt/mo, 1 pond; 2 Bt/kg
bonus
Based on no. of
ponds; couples
are assigned 2-3
ponds
Large 6,000 to 10,000/
month
1 to 3 Female, Laos: 6,000
Bt/mo (domestic
work)
9,000 to 20,000/
month
3 to 4 months’ salary Longer term
workers
300/day, paid
monthly
0.75 2 males, Myanmar 1-2 ponds/
worker
depending on
performance 1 £1 = 50 Baht, approx
Since responses from workers regarding salaries were incomplete (56% response rate), it
was difficult to cross check the data with the workers for the following reasons: a) salaries
are confidential especially they are mentioned in contracts (for large scale farms), and, b)
the interviews were conducted together with another worker so the respondent might
not want the other to know or did not feel comfortable to disclose it.
230
For workers in large scale shrimp farms paid based on the 300 Baht/day minimum, if they
take one day off per week, the number of days they can work in a month will range from
25 to 27 days. Thus the salary they receive per month will range from 7,500 to 8,100 Baht.
Large scale farms are registered as companies so they are considered under the industrial
system (Thai Labour Code) which means that they have to abide by the requirement of
the 300 Baht/day minimum wage.
In general, employers expect workers to stay for a minimum of one cropping period. This
is because the complete payment will be paid at the end of the cycle. Usually workers get
paid every 1st and 15th of each month, or once a month, based on the salary rate per
pond. Then at the end of the culture period, the remaining salary (for those taking care of
2 ponds) and bonus (based on production) will be paid.
In most small scale farms, it is often the case that the couple is hired by the farm owner/
manager to manage the whole farm by themselves, regardless of the number of ponds
(usually not more than 5). They are paid as a couple, wherein the payment is given on a
monthly basis. Either they are paid for the whole farm or per pond. For example there are
farms which pay 5,000 Baht/month/pond. If a pond is managed by just the husband or by
a couple, they only receive 5,000 Baht/month salary. But if a person or couple manages 2
ponds, he or they can receive a payment of between 9,000 to 10,000 Baht/month for the
2 ponds. In addition to this, they also receive the bonus commission.

231
5.3.3.2. Benefits
Employers provide the basic benefits to all their staff and workers, regardless of farm
scale and nationality (Table 5.8). These benefits are housing inside the farm or a housing
allowance for those living outside, water (for drinking and domestic use), and electricity.
Basic furnishings and beddings are also included, and especially mentioned by workers in
large scale farms. At least one large scale farm provides their workers access to internet
as well.
Workers may or may not have social security membership, which includes health
insurance. Thai workers without social security could avail of the 30 Baht medical scheme
for Thais by presenting their Thai ID in any medical establishment. A Myanmar male
worker had the 30 Baht medical card which he could use in the district hospital. The farm
manager or head of their zone would bring the workers there when it was necessary to go
to the hospital.
Table 5. 8 Benefits provided to shrimp farm workers
Item Small scale farm Medium scale farm Large scale farm
Housing
Water
Electricity
Social security with health insurance
Meals 3x/day on farm
30 Baht medical card
Plain or sticky rice
Gas

232
Regarding the issue of benefits, the Department of Labour Protection and Welfare
(DLPW) makes sure that employers in Thailand provide their employees the following:
Working hours: 8 hours/day
Holiday: 13 days/year
Treat women and men workers equally
Safety at work
For shrimp farms, which are not considered an industrial work place, the DLPW office also
tries to ensure that employers provide at least the following: safety in the work place,
drinking water, and salary payment of at least once a month. Safety in the work place
refers to ensuring that the workers do not face risk of injury and sickness from
equipment, substances, infrastructure, and human forces. Shrimp farms have the same
basic guidelines in terms of labour as in the law, for e.g. workers need to work within the
time frame, spend some time for meals, work and rest in accommodation. Housing and
bonus are not specified by law for aquaculture farms, but shrimp farmers/operators
provide these to their workers anyway, by their own initiative. The key informants
mentioned that most shrimp farms hire legal workers. However, if they find illegal
workers in any farm, the DLPW will inform the owner or recruitment company to register
the workers at the local Labour Employment office.
5.3.3.3. Child labour (ages of workers)
The ages of the workers interviewed ranged from 18 to 50, with 50% of them aged from
26 to 35 (Fig 5.5). Thirteen of the fourteen married workers live with their spouses and
small children in the farm. According to the KI at the Department of Employment, they do
not usually look at the ages of migrant workers registered with them, but they are usually
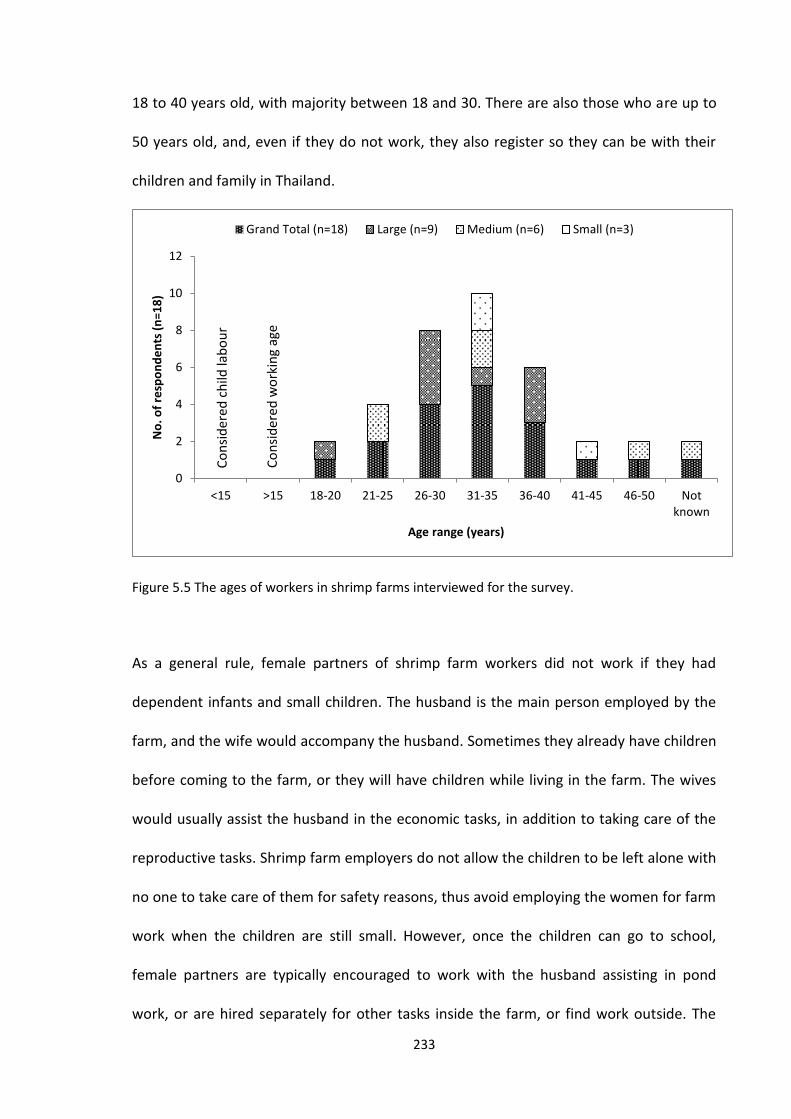
233
18 to 40 years old, with majority between 18 and 30. There are also those who are up to
50 years old, and, even if they do not work, they also register so they can be with their
children and family in Thailand.
Figure 5.5 The ages of workers in shrimp farms interviewed for the survey.
As a general rule, female partners of shrimp farm workers did not work if they had
dependent infants and small children. The husband is the main person employed by the
farm, and the wife would accompany the husband. Sometimes they already have children
before coming to the farm, or they will have children while living in the farm. The wives
would usually assist the husband in the economic tasks, in addition to taking care of the
reproductive tasks. Shrimp farm employers do not allow the children to be left alone with
no one to take care of them for safety reasons, thus avoid employing the women for farm
work when the children are still small. However, once the children can go to school,
female partners are typically encouraged to work with the husband assisting in pond
work, or are hired separately for other tasks inside the farm, or find work outside. The
0
2
4
6
8
10
12
<15 >15 18-20 21-25 26-30 31-35 36-40 41-45 46-50 Notknown
No
. of
resp
on
de
nts
(n
=18
)
Age range (years)
Grand Total (n=18) Large (n=9) Medium (n=6) Small (n=3)C
on
sid
ered
ch
ild la
bo
ur
Co
nsi
der
ed w
ork
ing
age

234
shrimp farms set the production areas with ponds and machinery as off-limits to those
who are not involved in pond production, especially to ensure the safety and protection
of children.
5.3.3.4. Working time
Regarding the workers’ working hours in the farm, thirteen of them responded
specifically on the times they had to work in the ponds.
For the female migrant workers on small scale farms who are employed with their
partner, work starts at 6 am, then at 10 am, 2 pm and 6 pm. Feeding the shrimp takes 10-
15 minutes to do. Her tasks include cutting grass around the ponds, feeding the shrimp,
liming, checking feeding activity of shrimp, and adding supplements to mix with the feed.
She would also record the amount of feed. Checking of feeding trays to monitor feeding
activity is done every 2 hours. Liming of pond is done weekly to increase the pH.
For medium scale farms, the two male Thai workers mentioned that their work is usually
from 6 am to 6 pm, but the last round of checking the nets is at 5 pm. So if the work was
done before 6 pm, they could already rest. They also had time to rest in between when
there was no need for them to be in the ponds. They also had a lunch break for 1 hour.
One migrant worker mentioned that the shrimp takes 5 months to culture, during which
time he needed to be present during the whole period. For the another migrant worker,
auto feeders were filled in the morning, then after 1 hour, feeding trays require checking
to monitor feed response. At night, at around 10 pm to midnight, he would apply lime as
the lime would breakdown easier when the water pH is lower. During the day he could
235
also rest or sleep if he did not have to be in the ponds. Thus the working time and activity
depended on the management system of the farms.
For large scale farms, the workers responded that their working hours are either from 6
am to 6pm or 8 am to 5 pm, but they are not continuously working during this period, as
they could rest for an hour after 2 hours of work during this period. There is usually a one
hour lunch break, and they can also rest in between the other times if there was no need
to be in their ponds, although they are on call all day. Their houses are near their ponds
so it is easy for them to go to rest and back to the ponds when necessary. One of them
said that at night, it is not necessary to stay and watch the ponds; only if there is
something wrong with the machines. One female worker supervisor (Thai) mentioned the
she could not estimate the number of working hours especially during an emergency
when she would have to work longer. But during normal days she would also work during
usual time as the others, although she is on call all the time.
5.3.3.5. Breaks and holidays
Workers are also given longer breaks such as during holidays or for vacation. Workers
regardless of farm scale, usually have a break in between cropping periods when the
ponds are empty. The break can be from 1 week up to a month. During their breaks,
workers would tend to either stay on farm or return to their home town (Thais) or
country (migrants). One of the workers said that during the break of 1 week in between
crops, he would stay at the farm, try to prepare the pond but there are no specific tasks
of what to do compared when the pond is stocked. For another, he and his family would
236
visit his home country for 2 weeks. A third worker said he could take leave at any time,
especially if related to a need for official documentation.
After stocking, leaving the farm is much more constrained although one day break per
week is common for both Thais and foreign workers, when the Thai technicians/zone
leaders would cover duties.
On days off, usually Saturday or Sunday, employers may offer transportation to the local
town, especially for migrant workers. Public or Thai holidays are only taken by farm office
workers. For pond workers, even Thai holidays such as Thai New Year (Songkran holiday)
are not observed if ponds are stocked, as one Thai female worker said, “One could not
stop work in shrimp farming except when in between crops.”
Workers could also take sick leave, and they should inform their employers if they are not
feeling well.
5.3.3.6. Documentation and registration
The documents required of legal migrant workers include a passport with the visa status
stamped into it, worker’s ID and work permit. Passports are either regular or temporary,
depending on their origin; migrant workers usually enter Thailand with valid passports
from their own countries, or without passports, which makes their entry and stay in
Thailand illegal. The Thai government offers a certain period of time for illegal migrants to
register. To obtain a valid passport is a process that requires citizenship verification, and
registration of workers. These two steps, often problematic for applicants to complete,

237
are now offered as a One Stop Service by the Ministry of Labour. Opportunities to register
for illegal migrant workers are only offered for certain periods.
The work permit, issued after the worker has registered, specifies the name of the
employer and the place of work. If the worker changes employer, he/she needs to apply
again but they can keep or continue to use the medical insurance until it expires.
According to a key informant at the DoE, if the worker changes the farm where he/she
works another work permit fee needs to be paid, normally by the new employer. Failure
to re-register with a new employer risks arrest.
The Thai government has set up a Memorandum of Understanding (MOU) with the three
neighbouring countries (Cambodia, Lao PDR and Myanmar) to manage the recruitment
and hiring of migrant workers. Employers in Thailand can find workers through this MOU
to bring workers in legally. Those who are registered in the offices handling the MOU
have legally come to work in Thailand. Government records through the National
Economic and Social Development Board (NESDB) statistics started to show the number
of migrants under the MOU in 2007, at 86,248 migrants (NESDB, 2014). The number has
been increasing every year and by 2012, had increased by almost ten-fold (826,868).
However the records did not specify the nature of employment in which migrants were
engaged. But the MOU limits employment to two types: manual labour and domestic
work. Official data (NESDB, 2014) suggest significant year-on-year variation in application
for registration by illegal migrants.
238
Table 5.9 summarises the various types of migrant workers based on their status when
they come to work in shrimp farms. Basically, there are three major types of migrant
workers, i.e. legal and registered to work, legal (with passport) but not yet registered to
work, and illegal and not registered. Legal means the workers have passports and they
came into Thailand with proper documentation, i.e. with a visa to enter.
There are several steps that employers have to follow to obtain permission to employ
migrant workers. The Department of Employment undertakes the registration process
and issuance of work permits while the Department of Labour Protection and Welfare
ensures that the Labour Code is followed. The Social Security Office processes the medical
insurance and hospital card for the registered workers. Figure 5.6 outlines the basic steps
taken for registration of migrant workers.
Hiring and registering migrant workers involve costs. Table 5.10 summarises these costs
but the list is not exhaustive. The information was obtained from interviews with
employers/managers, key informants and the workers.
An issue of importance to international standards is that all labour is not coerced and
entered into on a voluntary basis. The retention of original identity papers of migrant
workers, namely the passports and work documents is therefore a potential issue. This
research found a mixed situation, some employers kept workers’ papers, but others did
not. Table 5.11 summarises the various opinions related to the retention of workers’
documents by employers.
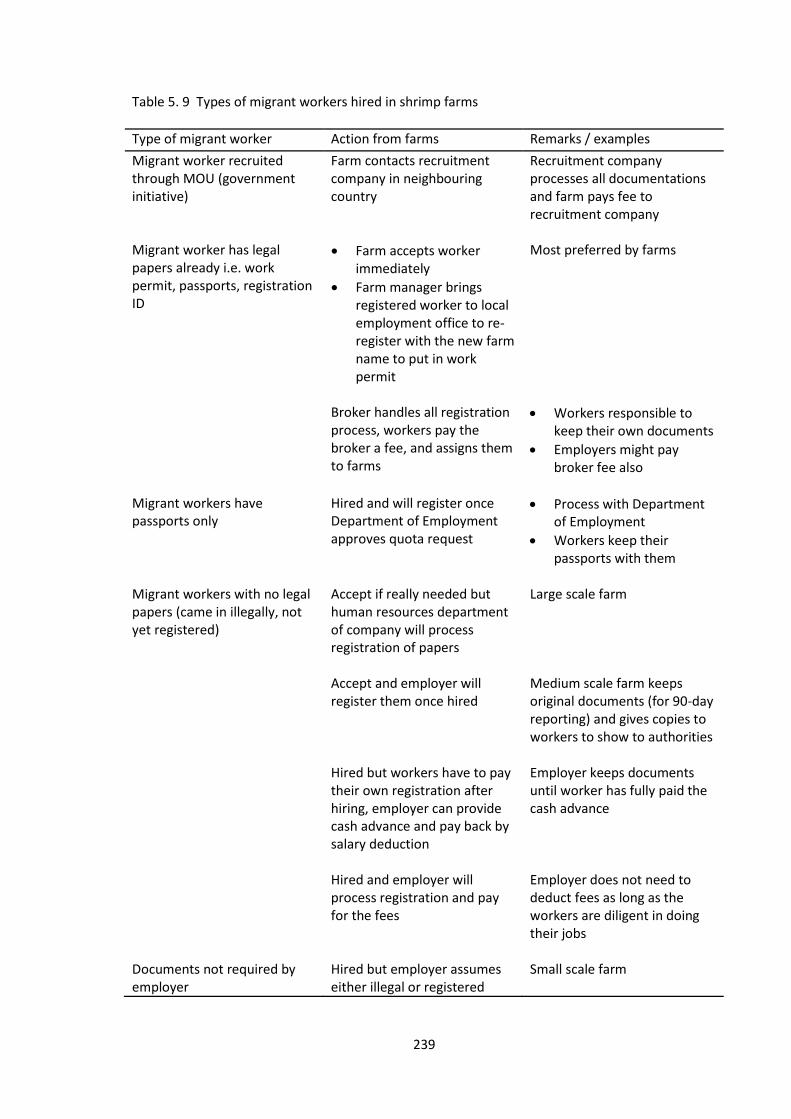
239
Table 5. 9 Types of migrant workers hired in shrimp farms
Type of migrant worker Action from farms Remarks / examples
Migrant worker recruited through MOU (government initiative)
Farm contacts recruitment company in neighbouring country
Recruitment company processes all documentations and farm pays fee to recruitment company
Migrant worker has legal papers already i.e. work permit, passports, registration ID
Farm accepts worker immediately
Most preferred by farms
Farm manager brings registered worker to local employment office to re-register with the new farm name to put in work permit
Broker handles all registration process, workers pay the broker a fee, and assigns them to farms
Workers responsible to keep their own documents
Employers might pay broker fee also
Migrant workers have passports only
Hired and will register once Department of Employment approves quota request
Process with Department of Employment
Workers keep their passports with them
Migrant workers with no legal papers (came in illegally, not yet registered)
Accept if really needed but human resources department of company will process registration of papers
Large scale farm
Accept and employer will register them once hired
Medium scale farm keeps original documents (for 90-day reporting) and gives copies to workers to show to authorities
Hired but workers have to pay their own registration after hiring, employer can provide cash advance and pay back by salary deduction
Employer keeps documents until worker has fully paid the cash advance
Hired and employer will process registration and pay for the fees
Employer does not need to deduct fees as long as the workers are diligent in doing their jobs
Documents not required by employer
Hired but employer assumes either illegal or registered
Small scale farm

240
Figure 5.6 Basic steps for registering migrant workers
Regarding retention of documents and its impact on employment tenure and worker
mobility by keeping the documents of the workers, there are various scenarios if the
documents are still with the employer and the worker wants to leave the farm (in the
case that employer advanced the registration fees on behalf of workers). These are as
follows:
If fee payment has been completed, they can ask for the document from the
owner and owner will return the documents.
If fee payment is not complete yet, worker can pay by cash to the owner, and the
owner will return the documents.
Employers send a request letter for quota for migrant worker to Provincial
Department of Employment
Recruit workers according to quota (based on area of farm)
Annual renewal of registration and social security
If worker has passport If worker has no passport
90-day reporting to Thai Immigration Police (pay fine if
report >90 days)
Register with Department of Employment to obtain work permit
and Social Security for medical insurance, pay fees accordingly
One Stop Service for nationality verification and registration (work
permit and social security), depends on Government schedule
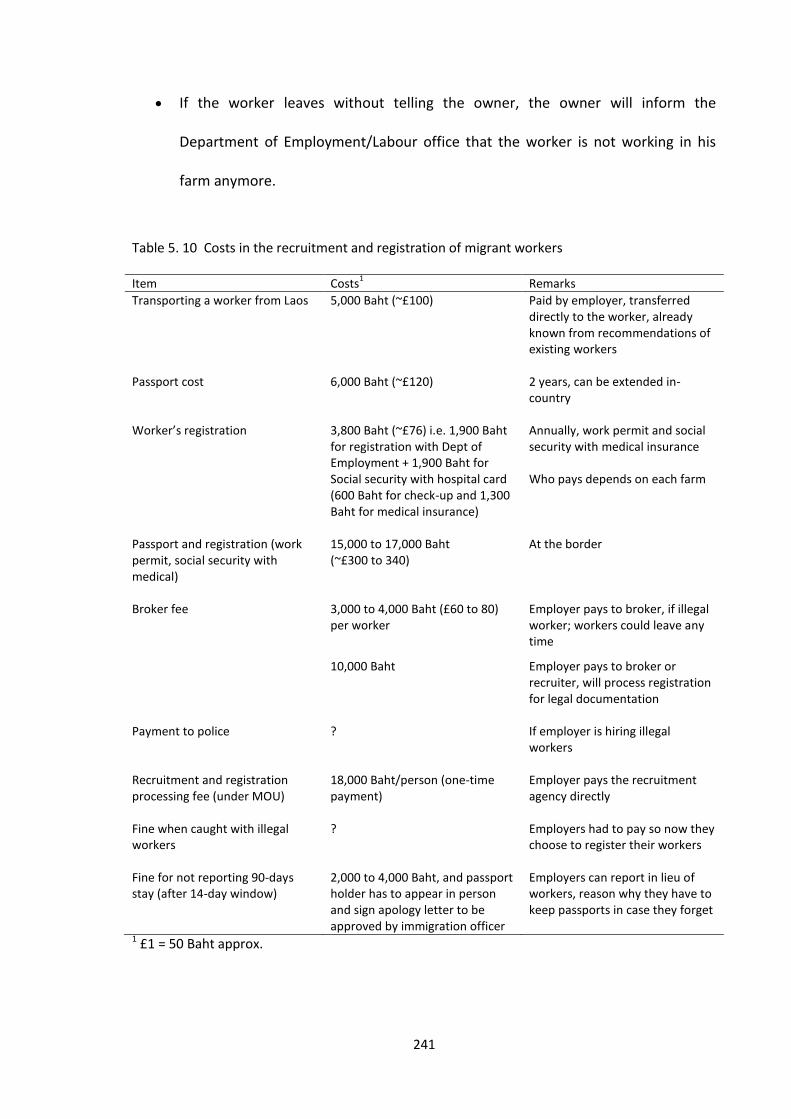
241
If the worker leaves without telling the owner, the owner will inform the
Department of Employment/Labour office that the worker is not working in his
farm anymore.
Table 5. 10 Costs in the recruitment and registration of migrant workers
Item Costs1
Remarks
Transporting a worker from Laos 5,000 Baht (~£100) Paid by employer, transferred directly to the worker, already known from recommendations of existing workers
Passport cost 6,000 Baht (~£120) 2 years, can be extended in-country
Worker’s registration 3,800 Baht (~£76) i.e. 1,900 Baht
for registration with Dept of Employment + 1,900 Baht for Social security with hospital card (600 Baht for check-up and 1,300 Baht for medical insurance)
Annually, work permit and social security with medical insurance Who pays depends on each farm
Passport and registration (work permit, social security with medical)
15,000 to 17,000 Baht (~£300 to 340)
At the border
Broker fee 3,000 to 4,000 Baht (£60 to 80) per worker
Employer pays to broker, if illegal worker; workers could leave any time
10,000 Baht Employer pays to broker or recruiter, will process registration for legal documentation
Payment to police
?
If employer is hiring illegal workers
Recruitment and registration processing fee (under MOU)
18,000 Baht/person (one-time payment)
Employer pays the recruitment agency directly
Fine when caught with illegal workers
? Employers had to pay so now they choose to register their workers
Fine for not reporting 90-days stay (after 14-day window)
2,000 to 4,000 Baht, and passport holder has to appear in person and sign apology letter to be approved by immigration officer
Employers can report in lieu of workers, reason why they have to keep passports in case they forget
1 £1 = 50 Baht approx.
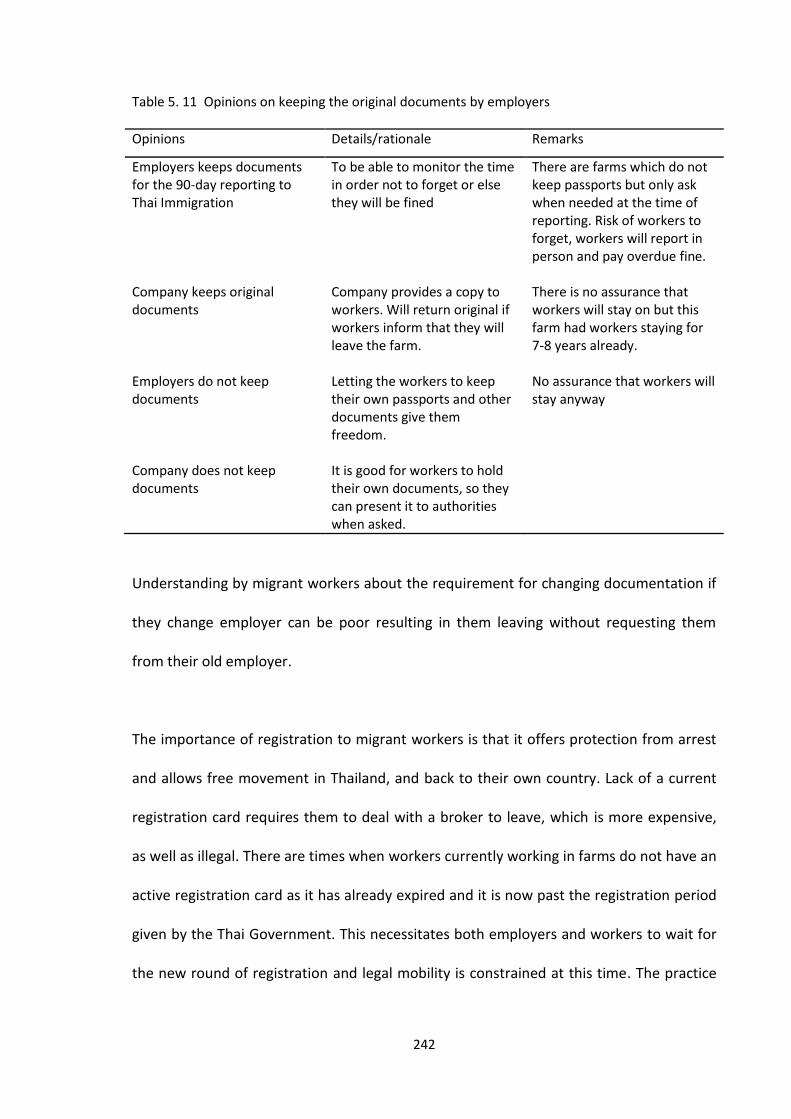
242
Table 5. 11 Opinions on keeping the original documents by employers
Opinions Details/rationale Remarks
Employers keeps documents for the 90-day reporting to Thai Immigration
To be able to monitor the time in order not to forget or else they will be fined
There are farms which do not keep passports but only ask when needed at the time of reporting. Risk of workers to forget, workers will report in person and pay overdue fine.
Company keeps original documents
Company provides a copy to workers. Will return original if workers inform that they will leave the farm.
There is no assurance that workers will stay on but this farm had workers staying for 7-8 years already.
Employers do not keep documents
Letting the workers to keep their own passports and other documents give them freedom.
No assurance that workers will stay anyway
Company does not keep documents
It is good for workers to hold their own documents, so they can present it to authorities when asked.
Understanding by migrant workers about the requirement for changing documentation if
they change employer can be poor resulting in them leaving without requesting them
from their old employer.
The importance of registration to migrant workers is that it offers protection from arrest
and allows free movement in Thailand, and back to their own country. Lack of a current
registration card requires them to deal with a broker to leave, which is more expensive,
as well as illegal. There are times when workers currently working in farms do not have an
active registration card as it has already expired and it is now past the registration period
given by the Thai Government. This necessitates both employers and workers to wait for
the new round of registration and legal mobility is constrained at this time. The practice
243
of intermittent registration opportunities encourages local corruption by police and other
officials.
Farm owners/operators all supported the employment of legal or registered migrants,
because of or despite the difficulties faced in both situations (legal and illegal, registered
and unregistered).
5.3.3.7. Contracts
Contracts, written or verbal, are agreements between two parties, in this case, between
the employer (farm owner/employer/company) and the worker. Written contracts are
the norm for companies, thus workers in large scale shrimp farms had written contracts
issued to them by the human resources department of the companies. It may also be in
the form of an application form where the salaries and benefits, together with the job
description are explained. In both cases the worker affixes his or her signature on the
document.
The written contract, in Thai, has to be explained to the migrant worker before signing, as
explained by a male Myanmar worker, where his direct supervisor, the head of the zone,
explained the contents to him. He received what the contract mentioned in terms of
salary and benefits.
However most commonly contracts are verbal and based on trust on small and medium
scale farms. The general expectation is that although workers knew they could stay as
long as they wanted, they were expected to stay for at least one culture period. This is

244
advantageous for both sides, as the farm owner has assured labour and the employee can
receive their bonus based on the production, in addition to the monthly salary and the
non-monetary benefits. The workers interviewed felt secure in the work even without a
written contract, presumably because of this clear mutual benefit. The terms of work and
benefits were clear to them and they were satisfied with that, referring to their responses
in the quality of life and the salary and benefits sections.
Both parties perceived that it was not necessary to have a written or signed contract as
the agreement comes with trust between the two parties (employer and workers). From
the employers’ side, along with this agreement is treating the workers (Thai and migrant)
as human beings, such as allowing them to have a break or a rest. The employers do not
set specific rules on taking breaks or rest times-allowing workers to set their own specific
routines given the prevailing conditions. Terms of employment were explained by
employers to new workers at the start of their employment, although generally these
would have been explained to them already by those who recruited them and introduced
them to the farm. The employer would also assess the workers according to diligence in
the initial stages and increase benefits if they were performing well. However they could
not specify the time and duration because if the worker wanted to leave the farm they
were free to go.
Written contracts and agreements are meant to protect the interests of both parties. As a
written contract is a requirement for global certifications and standards, the companies
are more likely to comply with it. Table 5.12 summarises the various types of agreements
between employers and workers in shrimp farms
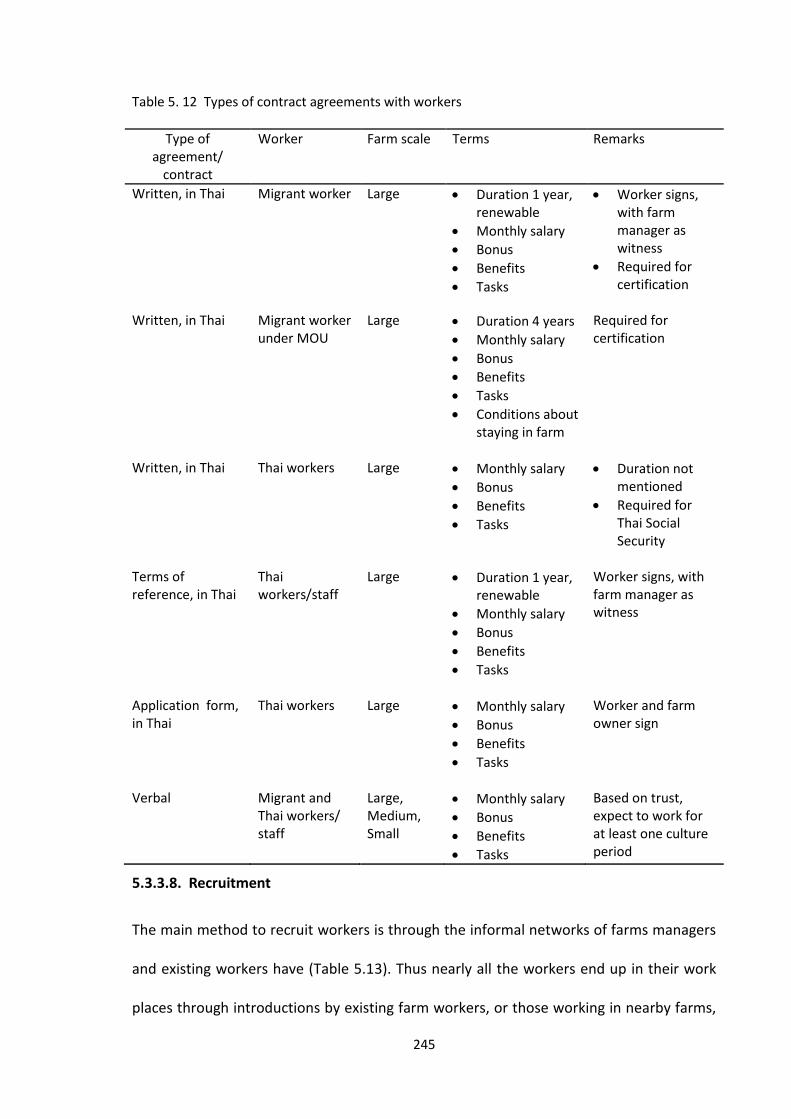
245
Table 5. 12 Types of contract agreements with workers
Type of agreement/
contract
Worker Farm scale Terms Remarks
Written, in Thai Migrant worker Large Duration 1 year, renewable
Monthly salary
Bonus
Benefits
Tasks
Worker signs, with farm manager as witness
Required for certification
Written, in Thai Migrant worker
under MOU Large Duration 4 years
Monthly salary
Bonus
Benefits
Tasks
Conditions about staying in farm
Required for certification
Written, in Thai Thai workers Large Monthly salary
Bonus
Benefits
Tasks
Duration not mentioned
Required for Thai Social Security
Terms of reference, in Thai
Thai workers/staff
Large Duration 1 year, renewable
Monthly salary
Bonus
Benefits
Tasks
Worker signs, with farm manager as witness
Application form, in Thai
Thai workers Large Monthly salary
Bonus
Benefits
Tasks
Worker and farm owner sign
Verbal Migrant and Thai workers/ staff
Large, Medium, Small
Monthly salary
Bonus
Benefits
Tasks
Based on trust, expect to work for at least one culture period
5.3.3.8. Recruitment
The main method to recruit workers is through the informal networks of farms managers
and existing workers have (Table 5.13). Thus nearly all the workers end up in their work
places through introductions by existing farm workers, or those working in nearby farms,
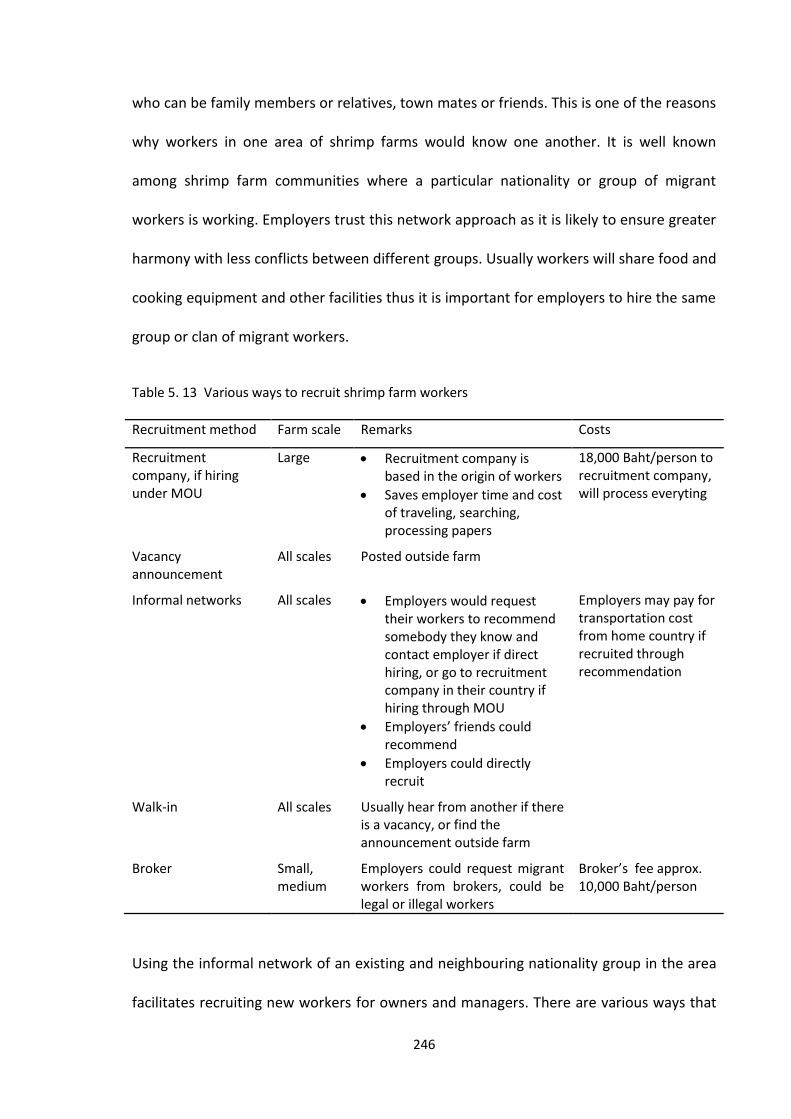
246
who can be family members or relatives, town mates or friends. This is one of the reasons
why workers in one area of shrimp farms would know one another. It is well known
among shrimp farm communities where a particular nationality or group of migrant
workers is working. Employers trust this network approach as it is likely to ensure greater
harmony with less conflicts between different groups. Usually workers will share food and
cooking equipment and other facilities thus it is important for employers to hire the same
group or clan of migrant workers.
Table 5. 13 Various ways to recruit shrimp farm workers
Recruitment method Farm scale Remarks Costs
Recruitment company, if hiring under MOU
Large Recruitment company is based in the origin of workers
Saves employer time and cost of traveling, searching, processing papers
18,000 Baht/person to recruitment company, will process everyting
Vacancy announcement
All scales Posted outside farm
Informal networks All scales Employers would request their workers to recommend somebody they know and contact employer if direct hiring, or go to recruitment company in their country if hiring through MOU
Employers’ friends could recommend
Employers could directly recruit
Employers may pay for transportation cost from home country if recruited through recommendation
Walk-in All scales Usually hear from another if there is a vacancy, or find the announcement outside farm
Broker Small, medium
Employers could request migrant workers from brokers, could be legal or illegal workers
Broker’s fee approx. 10,000 Baht/person
Using the informal network of an existing and neighbouring nationality group in the area
facilitates recruiting new workers for owners and managers. There are various ways that
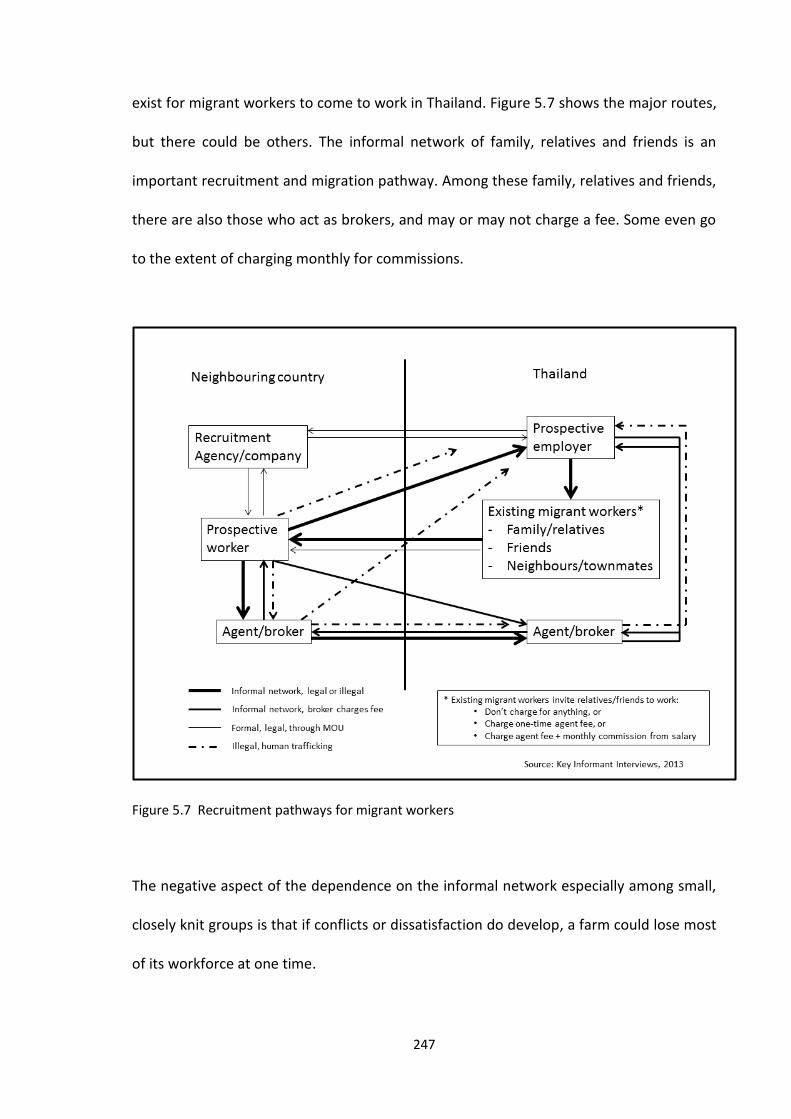
247
exist for migrant workers to come to work in Thailand. Figure 5.7 shows the major routes,
but there could be others. The informal network of family, relatives and friends is an
important recruitment and migration pathway. Among these family, relatives and friends,
there are also those who act as brokers, and may or may not charge a fee. Some even go
to the extent of charging monthly for commissions.
Figure 5.7 Recruitment pathways for migrant workers
The negative aspect of the dependence on the informal network especially among small,
closely knit groups is that if conflicts or dissatisfaction do develop, a farm could lose most
of its workforce at one time.
248
Although farmers prefer to employ workers that are introduced for the reasons
explained, ‘walk-in applications’ are sometimes used. This is perceived as a greater risk
and requires evaluating personality as well as nationality, and judgement as to the
likelihood that they would fit with the existing group of workers. For example a ‘walk-in’
applicant from Laos and married to a Thai, and who had been living in northeast
Thailand, was recruited by a medium scale farm in Chanthaburi. This farm already had a
few Thai workers so the judgement was made that it was acceptable to them.
One of the issues pointed out by a key informant was the social protection for migrant
workers, which should be in place and that they can be regular workers, so that there is
less vulnerability for exploitation and abuse. What employers try to do is to comply with
the requirement of the Departments of Labour Protection and Welfare, and Employment
to register their workers for work permit issuance if they do not have legal status to work.
The burden for payment of fees lies on both the employers and the workers, and there
are various arrangements on who pays. The dilemma of the employers would be that
they sometimes do not have the assurance that having spent for the registration and
documentation, the workers would stay long in the farm. In some experience, most of the
workers would leave and move to another farm which has a better offer for them, and
the former employer, if he/she spent for worker registration, would experience a loss in
their investment. This is the reason why for some, the responsibility for fee payment is
put on the workers.

249
5.3.3.9. Collective bargaining/representative to management
On large scale farms hiring mainly workers from Myanmar, communication is often an
issue. In general one person in the group who knows Thai language well, takes unpaid
responsibility to help explain the tasks to other workers in their language, as well as to
communicate with the zone leaders and manager any problems or issues faced.
The director of the Provincial Department of Labour Protection and Welfare mentioned
that for migrant workers, there are not so many complaints received related to language
problems. His office had hired translators to communicate with migrant workers, through
volunteer workers but the number of complaints was few largely because shrimp farm
workers received higher benefits and payments due to prevailing labour shortages.
According to him, the Thai government was aware of the requirement for ILO members to
permit and facilitate the setting up labour unions for migrant workers (Freedom of
Association). Although discussions were underway as to if such unions should be
workplace–based or at provincial level, in theory migrant workers can already initiate
groups, select representative and negotiate for salary, benefits and the like. Although yet
to be implemented for smaller enterprise, companies with more than 50 workers, where
they have a committee, can already allow a migrant worker to be part of that committee.
This Department also has responsibility for disseminating information regarding rights of
workers and other issues to employers and workers. Information dissemination is done
through many ways such as brochures and posters in various languages, TV and mobile
phone. For some Thai workers, they are not interested about this if there are no issues to
bother them. This Department also invites employers and migrant workers to attend
250
meetings so they can provide information on laws and regulations, and available benefits.
For example, regarding work permit registration, the office prepares materials in many
languages to inform the workers and employers about their rights and the regulations.
They can also communicate through the volunteer groups to tell others in their area.
This Department also looks at drug problems in the work place and has promoted a drug-
free workplace through its “white factory program”.
In terms of communication with volunteers, this office in cooperation with the Police
would invite famous Burmese monks every year, provided they did not talk about politics
and other controversial issues, but provided information about how to work and live with
Thais. They should try to encourage positive thinking among workers, as well as the
spiritual aspect. Since it is a religious activity, they also work with the temple as the base
for meeting/ training, and information dissemination. The workers will go to the temple,
usually their employers will take them there. Workers consider this as good because they
can also go to make merit.
5.3.3.10. Status of surveyed farms according to selected certification standards in
aquaculture (Labour aspects)
The status of compliance to some labour certification standards, as presented and
discussed in the chapter, is presented in Table 5.14. The major issues that need to be
focused on more are as follows:
251
salary payments to couples if the wife also helps, however the issue with the
employers would be that the employment agreement is with the husband, and
they also provided non-monetary benefits for the family
legal employment status of workers in small scale farms
complaint procedures set by the standards need to be revised to ensure they are
applicable to shrimp farming
written contracts for farm of all scales
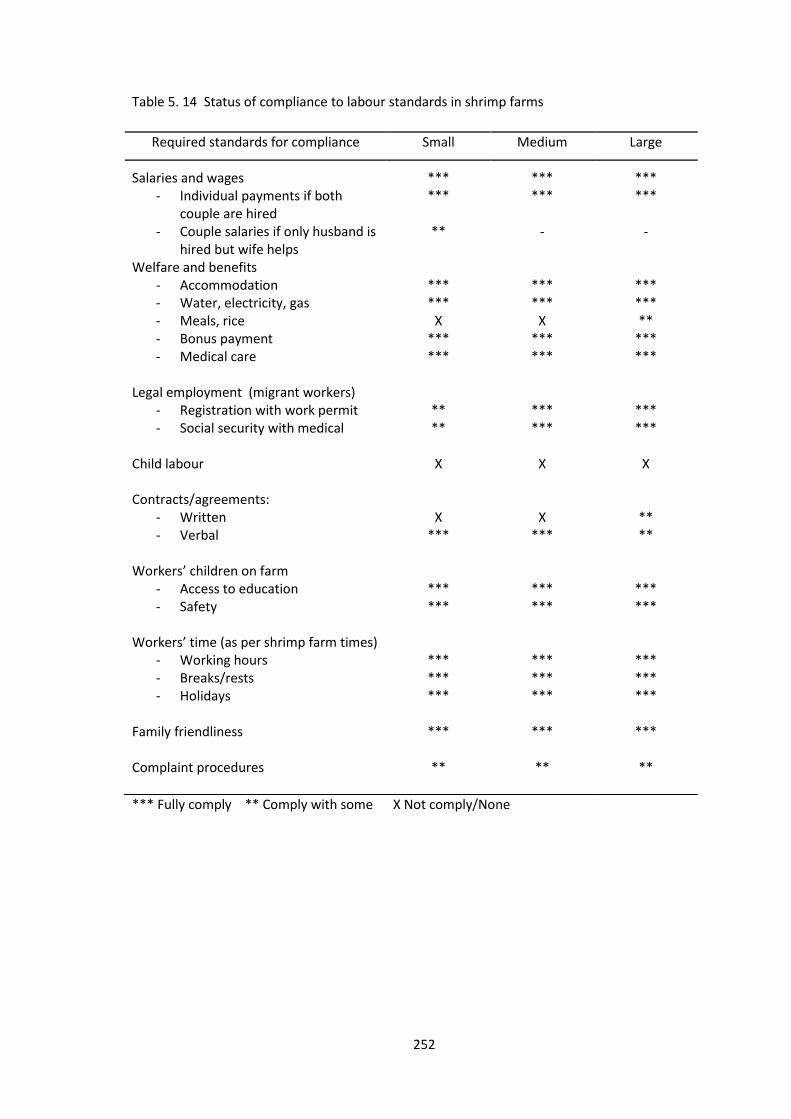
252
Table 5. 14 Status of compliance to labour standards in shrimp farms
*** Fully comply ** Comply with some X Not comply/None
Required standards for compliance Small Medium Large
Salaries and wages *** *** *** - Individual payments if both
couple are hired *** *** ***
- Couple salaries if only husband is hired but wife helps
** - -
Welfare and benefits - Accommodation *** *** *** - Water, electricity, gas *** *** *** - Meals, rice X X ** - Bonus payment *** *** *** - Medical care *** *** ***
Legal employment (migrant workers)
- Registration with work permit ** *** *** - Social security with medical ** *** ***
Child labour X X X Contracts/agreements:
- Written X X ** - Verbal *** *** **
Workers’ children on farm
- Access to education *** *** *** - Safety *** *** ***
Workers’ time (as per shrimp farm times)
- Working hours *** *** *** - Breaks/rests *** *** *** - Holidays *** *** ***
Family friendliness *** *** *** Complaint procedures ** ** **
253
5.3.4. Treatment of workers , especially migrant workers in shrimp farms
5.3.4.1. Nationality preference
Employers and key informants have varied perceptions regarding the characteristics of
migrant workers, which shape their preference or lack of preference for certain
nationalities. Even though Thai workers are preferred by some, most farms could not find
Thai workers. Respondents did not specify which region of Thailand they preferred Thai
workers to originate from.
Knowledge of the Thai language is one of the main considerations in hiring migrant
workers, especially for workers from Myanmar. Lao workers can communicate in Thai
language and many farms do not differentiate between Thais (especially northeastern
Thai) and Laotians.
Differences mainly relate to personality rather than nationality. Important personality
traits are keenness to understand instructions regarding work, inputs and safety, as well
as diligence, responsibility and trustworthiness. Sometimes close cultural or kinship ties
are not considered positively.
“I do not really have a preference for nationality but I do not like
Thai workers especially my relatives because it is difficult to
reprimand or tell them off.” – A small scale farmer whose current workers,
who he has employed for ten years, are a couple from Myanmar
254
Another reason for choosing a certain group is based on location. The same group of
workers would find jobs together in the same area due to the informal network of
introductions. An employer in Surat Thani has hired workers from Myanmar on a
continual basis because they are the group that is most available.
Other considerations identified by one large scale farm manager to explain why Myanmar
workers are in particular demand and very few Thais are hired, include the unresolved
political issues between Cambodia and Thailand, and the long duration of Laotians’
seasonal break.
Table 5.15 summarises some of the opinions and perceptions of shrimp farm employers
in working with various groups of people, both Thai and migrant workers. These are
based on their experiences in working with these groups of people. There are varying and
contrasting opinions, and there could be other factors that affect the behaviour of the
workers, not only their ethnicity.
On the other hand, there are farms which have never hired migrant workers, mostly large
farms. Their reasons include:
They could still find Thais who are willing to work in shrimp farms.
They do not want to encounter communication problems, especially related to
reading and writing due to the technical aspect of shrimp farming.
They do not have courage to hire them.
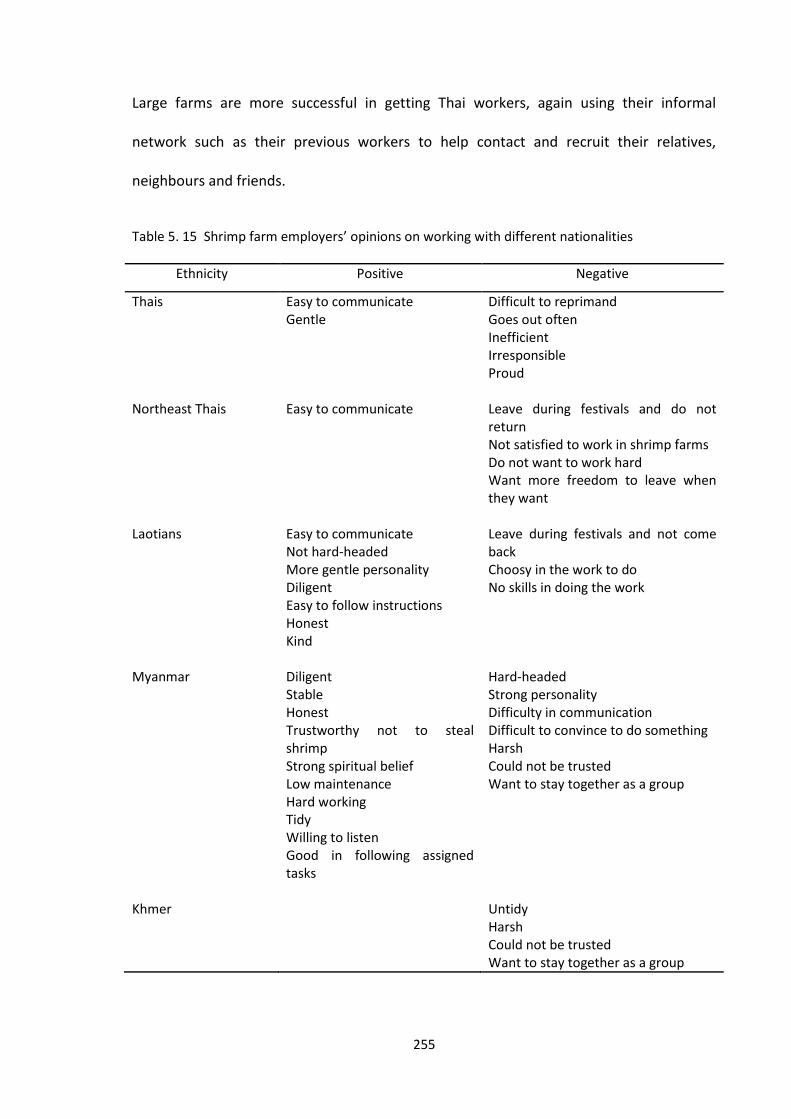
255
Large farms are more successful in getting Thai workers, again using their informal
network such as their previous workers to help contact and recruit their relatives,
neighbours and friends.
Table 5. 15 Shrimp farm employers’ opinions on working with different nationalities
Ethnicity Positive Negative
Thais Easy to communicate Gentle
Difficult to reprimand Goes out often Inefficient Irresponsible Proud
Northeast Thais Easy to communicate Leave during festivals and do not return Not satisfied to work in shrimp farms Do not want to work hard Want more freedom to leave when they want
Laotians Easy to communicate Not hard-headed More gentle personality Diligent Easy to follow instructions Honest Kind
Leave during festivals and not come back Choosy in the work to do No skills in doing the work
Myanmar Diligent Stable Honest Trustworthy not to steal shrimp Strong spiritual belief Low maintenance Hard working Tidy Willing to listen Good in following assigned tasks
Hard-headed Strong personality Difficulty in communication Difficult to convince to do something Harsh Could not be trusted Want to stay together as a group
Khmer Untidy Harsh Could not be trusted Want to stay together as a group
256
5.3.4.2. Access to opportunities for self-development
The majority of workers (Thai and migrant) do not have prior knowledge or experience in
shrimp farming. They learn aquaculture skills ‘on the job’ once on farm mostly from their
employers and co-workers. Technical publications and magazines are not accessible to
migrant workers who could not read and write Thai or English. Thus the following are the
main sources of knowledge for them which provide them with opportunities to better
themselves in their work and in their future occupations:
Hands-on training from employers, managers, experienced co-workers
Technical meetings and discussions with the team on-farm
Company technicians and salespersons who come to the farms
Technical seminars given by companies outside the farm
Consultation and discussions with other shrimp farm workers, face to face or by
phone
Watching television (technical as well as Thai language)
For medium scale farms, the two Thai male workers who graduated from university are
assigned as zone leaders, overseeing the workers in each zone. They are the ones
handling the technical matters including calculations and analysis of parameters such as
for water quality and shrimp behavour. They learned skills from university studies, as well
as from other sources such as magazines, books, CD, internet, etc. They would also talk
with workers who have been in the farm for a long time and have experience, as well as
with other technical staff in other farms when they attended technical seminars.

257
What is beneficial to the workers is the fact that most of the employers or managers
would be on the farm every day to interact with them and train them. For example, a
female employer encourages workers to observe, check and tell her directly about the
situation in their ponds. This makes them eager to learn more about shrimp farming and
working in the farm has given them many opportunities to learn.
Working in the farm and learning from employers/managers, technician and co-workers
help in improving worker skills. One of the male Myanmar workers in a large scale farm is
now assigned by his zone manager to train new workers, after learning the skills. Better
skills can result in them being assigned two ponds rather than one, directly equating to a
bigger bonus if they can make good production.
5.3.4.3. Communication and interaction with employers
Communication with employers, managers, technicians/zone heads and co-workers is
important, together with interaction to share information and present problems and
solutions. The majority do not face problems in communication with employers.
Myanmar workers may not be able to speak clearly in Thai but they can understand what
the employer or manager was saying.
Non-Thai speakers can at least communicate orally and listen to Thai, although reading
and writing are not possible. Thus record keeping task is limited, and the zone managers/
technicians (mainly Thai or long term migrant worker) are the ones doing the record
keeping and technical analysis but the workers assigned in their individual ponds provide
the manual work.

258
The topics of communication have been categorised into the following:
Technical – which includes teaching and training workers with skills and assigning
them tasks
Support – able to communicate directly, easily, and well with
employers/managers, and encouraged to do so
Family – being treated as part of a family or being in a friendly atmosphere
Health – communication related to health matters
Social – positive feeling in communication with employers
Legal – matters related to documents and registration
Workers are all able to communicate directly especially regarding problems such as
diseases in their ponds. These problems could create stress to them but they had to
directly tell their zone leader/technician or manager or employers so a solution could be
made. In addition to problems related to production, they could also communicate to
their managers or employers regarding taking leave and medical matters. Usually the
employers take the migrant workers to the hospital when they are sick.
For all farm scales, the opinion and observation of workers is that living together as an
extended family on the farm with employers, other workers, and their families, is highly
valued.
Communication between employers/managers and workers related to both technical and
non-technical issues, the latter including personal issues. Figure 5.8 shows the main areas
of communications between employer and workers by farm scale.

259
Figure 5.8 Main areas of communication and interaction by farm scales
N: Large=7; Medium=6; Small=3 (multiple responses)
Based on country of origin, Thai and Myanmar workers talked with employers more about
technical than non-technical issues, while the Laotians cited more communications
focused more on the non-technical (Figure 5.9). Legal matters were also mentioned by
the migrant workers.
0 2 4 6 8 10 12
Health
Legal
Social
Support
Technical
Family
Number of responses
Small Medium Large
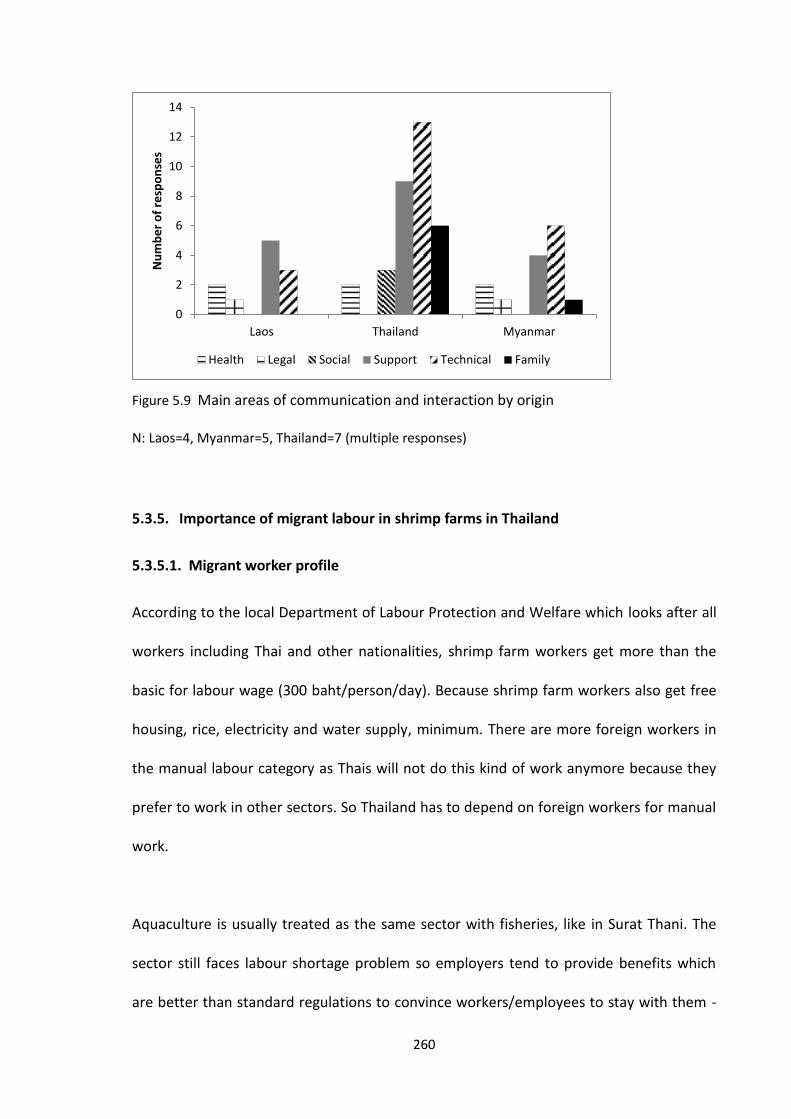
260
Figure 5.9 Main areas of communication and interaction by origin
N: Laos=4, Myanmar=5, Thailand=7 (multiple responses)
5.3.5. Importance of migrant labour in shrimp farms in Thailand
5.3.5.1. Migrant worker profile
According to the local Department of Labour Protection and Welfare which looks after all
workers including Thai and other nationalities, shrimp farm workers get more than the
basic for labour wage (300 baht/person/day). Because shrimp farm workers also get free
housing, rice, electricity and water supply, minimum. There are more foreign workers in
the manual labour category as Thais will not do this kind of work anymore because they
prefer to work in other sectors. So Thailand has to depend on foreign workers for manual
work.
Aquaculture is usually treated as the same sector with fisheries, like in Surat Thani. The
sector still faces labour shortage problem so employers tend to provide benefits which
are better than standard regulations to convince workers/employees to stay with them -
0
2
4
6
8
10
12
14
Laos Thailand Myanmar
Nu
mb
er
of
resp
on
ses
Health Legal Social Support Technical Family
261
give housing, food etc. – not provided by other sectors. The law for migrant workers is
linked with the ILO agreement. Thailand is a member of ILO so it has to abide to treat
everybody equally, whether legal or illegal, and treat them the same as Thai workers.
With the benefits given to migrant workers, it seems that they are even treated better
than Thai workers in other sectors.
Due to labour shortages, employers compete for workers to work for them, so they
provide more and better benefits. When workers know these, they will move to the farm
which gives better benefits. This also poses as a problem to current employers.
Migrant workers also stick together in groups, have strong leadership providing
communication with potential employers and often have high levels of intelligence about
employment options. In contrast, shrimp farmers usually have limited choices regarding
whom they can employ. This imbalance explains the emphasis employers place on
treating their workers well and striving to create a family and fun working and living
environment with maximum flexibility and learning opportunities for them.
5.3.5.2. Reasons for migrant workers to work in shrimp farms in Thailand
Working in a shrimp farm is perceived to earn more monetary benefits than in other work
places.
“It is better to work in a shrimp farm than in construction, especially as the
pay and benefits are better. In construction, I received 150 Baht/day
including housing, but there were no benefits such as bonus, rice, water,
electricity, etc. In addition,the work in the shrimp farm is not too busy, so I
can work without any pressure.” – Lao male worker, medium scale farm
262
Likewise, a worker from Myanmar said that he saw his friend who worked in a shrimp
farm that he earned a lot of money when this friend went back to his hometown. His
friend invited him to work in a shrimp farm so he came to Thailand, by himself and not
through a broker. He knew that there was more income in shrimp farming as long as the
shrimp do not die. He considers that working in shrimp farms is different from another
job, and it is better because he can save money, as there is enough income and there is
no need to spend much. The living conditions are also better in the farm, and life is more
relaxed, as well as he has everything he needed. He never had living conditions like this in
his country and hometown. In the shrimp farm, there is also no need to work all day,
whereas in Bangkok where he had to carry heavy things, the workload was too much. This
view is also shared by other migrant workers from Myanmar as well as Laos.
5.3.5.3. Value of shrimp farming to economies of neighbouring countries where
workers come from
The economic benefits of working in shrimp farms in Thailand have been mentioned
every time by the migrant workers, it being one of the main reasons for coming to
Thailand in the first place. Table 5.16 provides a summary of the plans of migrant workers
after working in Thailand for a number of years.
The couple from Myanmar who are working in a small scale shrimp farm shared that they
have already bought a piece of land (5 rai or 0.8 ha) in their country and have planted it
with rubber trees. They have already started to get a production out of these trees. They
have been working in the shrimp farm in Thailand for 10 years. Each of them earns 5,000
Baht/month/person, so as a family they earn 10,000 Baht/month. Her husband will give

263
her his salary and she is the one who keeps the money and sends some money back to
Myanmar for their son’s education and living expenses. The son lives with his
grandparents. In addition they also receive a bonus of 2 Baht/kg production/cycle. From
the farmer’s reported production of 42 T/year for the whole farm managed by this
couple, they earned a bonus of 84,000 Baht. Thus their total earnings in one year could be
more than 200,000 Baht (joint with her husband).
Table 5. 16 Future plans of migrant workers after working in shrimp farms in Thailand
Plan to do Country/gender No. of years working in shrimp farms in Thailand (scale)
Remarks
Rubber plantation
Myanmar (married couple)
10 (small) Already bought land and planted rubber trees
Shrimp farming / Business
Myanmar (male) > 1 (medium) Will work 2 more years; can save 40,000 to 50,000 Baht/cycle
Rubber plantation
Lao (Couple) 4 (large) Have already bought land; Will work 2 more years
No plans yet Myanmar (couple)
7 (large) Will continue to work in farm and send back to children
Rice field Lao (male) 1 (medium) Will go home to work on rice field then come back to shrimp farm again
No plans yet Lao (male) >10 (medium) Will keep working in the farm, his wife and child are with him
When farms produced 20 T/crop and with 3 crops/year, workers could earn about
100,000 Baht as commission. They could send this money home including their monthly
salary. Workers do not spend much while living in the farm because the employers
provide almost everything for housing and living in the farm. In shrimp farms, if there is
work, they work. The rest of the time is for resting and family. If they go out, usually the

264
employers would provide transportation for them to go to the town or to the temple
especially during festivals.
5.3.5.4. How Thai labour is affected by influx of migrant labour in shrimp farming
The main reason for hiring migrant workers in the majority of shrimp farms is the lack of
Thais who are willing to do farm level work i.e. manual labour, especially in small and
medium scale farms. Large scale farms can still find Thai workers through their own
informal networks, however only a few have 100% Thais in the workforce.
During the interviews, managers and key informants mentioned that Thais nowadays
prefer to work in factories and industries, since Thailand has changed from being mainly
agricultural to a more industrial economy. The 20-30 age bracket work inside the
factories, while the 30-40 age bracket would sell food and other items in front of the
factories. According to a key informant at the sub-district office, in the upcoming
implementation of ASEAN Economic Community in 2015, migrant workers are foreseen to
go back to their own countries when other industries move to their countries. This could
create a problem to Thailand because there will be a lack of migrant workers/labourers.
Although in large scale farms, with other units such as laboratories, administration,
marketing, technical (middle management level) i.e. not manual labour, there are also
Thais employed in the farm. The men are usually farm technicians and heads of zones
while the women work as lab technicians, administrative and accounting staff, and cooks.
265
Now the perception is that no more Thai workers can be found who will work in shrimp
farms, not because the migrant workers are getting their jobs, but because there are no
available Thai workers.
5.3.6. Gender aspects of shrimp farm labour
A male manager of a large shrimp farm mentioned that a single woman could not work in
the shrimp farm setting, as it is a male-dominated workplace. The company has a policy
not to hire single women to work in the farm as it is quite a remote place. Likewise single
women or women who are alone will also not want to come as the farm is far from the
town and they do not feel safe. At the moment there are only two women hired in the
farm for domestic work and cooking assistant. They are wives of the workers and they
stay together in the farm. As the position for women worker is now full, the wives of the
other married workers have to find jobs outside the farm and may or may not stay with
their husbands in the farm, depending on their workplace.
Regarding the issue about payments for couples, there are farms which pay salaries
separately to husband and wife whenever it is clear that they are employed individually
and they have specific tasks. However, in most cases, especially in medium and large-
scale farms, it was the husband that was hired and the wife accompanied the husband to
stay in the farm. The wife is not prohibited to assist the husband, which is their own
decision to do, especially if there are no small children to take care. The wife can help by
cleaning the area around the pond and homestead, and growing vegetables in the farm
which the farm manager or owner provides capital for. The vegetables can be consumed

266
by the farm residents, or the wife can then sell them in the wet market outside the farm
for additional income for the worker’s family.
In terms of decision making and control of assets, women are still entrusted with the
salaries that their husbands earn. In addition, the workers also said that they consult their
spouses when it comes to purchasing large items, although the wives are oftentimes
responsible for marketing, as well as conducting transactions to remit cash back to their
own countries for their children and family. Most of the financial decisions are made by
the wives as they are entrusted with the money to keep and save.
In Thailand, there are specific laws related to women and youth labour. Normally, women
can take leave from work to deliver their babies. Presently there are more children of
migrant workers who are born in Thailand. So this issue is a concern regarding the welfare
of these children. The Thai government supports child education until Grade 6 so there is
no need to pay for tuition fees. The children of migrant workers can study in local schools
up to Grade 6 for free. In some local schools, the migrant children even outnumber the
Thai children. As one key informant from the local administration office puts it, it is good
to have the migrant children to study in the local schools in order to maintain the number
of students needed to keep the school open. Otherwise, according to the Thai Ministry of
Education law, the local school has to be closed if there is not enough number of
students, and the children will have to travel far to get to the nearest school.
There is an issue regarding the increasing number of migrant children who either came
with their parents or who were born in Thailand. Thus the Surat Thani Department of

267
Labour Protection and Welfare had started a project with Raks Thai (a Thai NGO) and ILO-
Surat Thani, to study the living conditions and education situation of migrant children,
and try to come up with a solution for this. They are still studying possible ways to handle
the problem. The two major options are as follows:
let the pregnant migrant worker to go back to her country to give birth there, with
pay, and not bring the baby to Thailand, or,
let the pregnant migrant worker to deliver the baby in Thailand, allow them to
stay and learn the Thai culture
5.4. Discussion
5.4.1. Quality of Life of shrimp farm workers
Improving the quality of life (QOL) is the goal of every individual and organization
(Costanza et al., 2007), which is the reason for working to generate income and to make
lives better. The main concern for looking at working and living conditions of workers in
aquaculture, especially migrant workers, is to determine whether their lives are better off
or worse off now than before, i.e. have the lives of people improved which would make
them valuable members of society. A number of researchers have tried to come up with
ways to measure the quality of life of people, including looking at various factors and
indicators. Even the aquaculture standards and certification guidelines for workers have
these objectives in mind, i.e. protection of workers and assurance that they are provided
a good quality of life while working on farms. Van Egmond & de Vries (2011) mentioned
that quality of life can be viewed according to economic or financial value at one end, and
the human value at the other end. For migrant workers in shrimp farms, when asked
268
about the quality of their lives as shrimp farm workers, all of them mentioned that they
are better off or much better off than before. The ‘before’ part could mean their lives in
their own countries doing agricultural or other jobs or not working at all, or as migrant
workers in Thailand in other occupations such as in construction, agriculture, fisheries (at
sea), manual jobs in markets and service sectors, and domestic work. Their reasons for
perceiving a much better life include both financial and human values, meeting their basic
physical, emotional, spiritual and social needs. Again, Van Egmond & de Vries (2011)
mentioned that the meeting of human needs and their satisfaction depends on people’s
value orientation. However, other views such as that of (Sen, 1993) point out that a
person’s well-being or quality of life depends on a person’s capability, or on what he/she
can achieve. Although terms of employment are not standardized by regulation the
prevailing norm in shrimp farms of all sizes was that responsibilities were given to
workers dependent on their capabilities, which were then linked to monetary benefits.
The standard responsibility for a single pond, on which the monthly salary is based is
incentivized by up to 100% (responsibility for up to 2 ponds) if a workers’ performance
was high, and through bonus payments linked to the yields produced. Shrimp farm
workers vocalized the benefits of this transparent system allowing them to earn more
income.
Costanza et al. (2007) pointed out that defining quality of life and measuring its progress
may be difficult due to varying opinions and disciplines involved, thus they have
suggested an integrative definition of QOL, combining both the objective (or quantitative)
and subjective (perceptions or qualitative) indicators. In reflection, the factors mentioned
by shrimp farm workers as contributing to a better quality of life in the farms can be
269
considered fitting to the definition and diagram created by Costanza et al. (2007). It can
be said that working in shrimp farms is contributing to improving the quality of life of
workers by meeting their needs now and in the future through the opportunities
provided by the shrimp farm working and living environment and because their income
and savings result in remittances back to their home countries, there is a direct effect on
the lives of their families back home, and indirectly the community there benefits as well.
For Lao migrant workers, they remit finances to their homes to support their families,
about two to three times a year (Phouxay, 2008), with 76.6% of families claiming better
circumstances due to the financial support. These remittances were used for house repair
or construction, purchase of farming materials or motorbikes, buy land, family saving,
children’s education, pay outstanding debt, and purchase other items resulting in
improved family relationships and better living conditions.
It could not be denied (based on their accounts) that workers (Thai or migrant) in shrimp
farms in Thailand are able to save more cash than in other comparable occupations due
to their lower spending when living on farm. Other migrant workers like the ones
described by Vungsiriphisal et al. (2010) complained about expenses deducted from their
salaries including accommodation fee and social medical expenses. All of the workers
interviewed shared their plans to save enough to remit back to their families, as well as
for the future, to purchase land in their home towns for agriculture or aquaculture, or to
start a small business. However, there is not enough quantified information in this study
regarding the economics of remittances but suffice to say that during the peak of shrimp
farming in Thailand, workers could earn up to 100,000 baht/year (approx. £1,800-2,000)
270
from their bonuses alone. A discussion by Imai et al. (2014) on their study of migrant
remittances in Asian and Pacific countries concluded that remittances had a direct effect
on reducing poverty, although it is also vulnerable to shocks during an economic crisis
when unemployment in host countries increases, and other economic factors such as
currency depreciation.
Happiness in life is not obtained by economic improvement alone, according to a study by
Bartram (2013) among eastern Europeans who migrated to western Europe. Although
worlds apart, the basic human needs of people are similar, and this was shown by the
way the workers responded in this study, citing not just economic gains as the main
reason for a better-off life. Migrant workers in Thai aquaculture farms were happy as
they did not have the same opportunities in their home countries (Kruijssen et al., 2013).
5.4.2. On compliance to global standards and certifications
Regarding contracts, under the specific standards and certifications, contracts should be
written (GAA-BAP, 2013; GlobalGAP, 2012). However under the Thai labour law (Ministry
of Labour, 1998), contracts may be “written or oral, expressed or implied”, with the
employee agreeing to work for an employer, and the employer agreeing to pay wages for
the work done. Thus in almost all cases especially among small and medium shrimp
farms, there was only oral agreement between shrimp farm owner/manager and the
worker, based on trust on both sides. Trust that the employer will pay the monthly
salaries and the after-production bonuses, as well as provide the benefits for living in the
farms such as housing, and utilities. Large scale farms are differentiated by having written
271
and signed contract agreements, as they are required for the certification of farms to
comply with the requirements of 3rd party certifiers.
As mentioned in the introduction, shrimp farm work does not fit under industry type of
work therefore are considered outside the system governed by the national labour law.
However, key informants from the Department of Labour Protection and Welfare
mentioned that shrimp farm employers/owners try to follow the guidelines set forth
under the Thai labour law, and even provided their workers more than the minimum
required by law. According to the employers themselves, they have to treat their workers
as partners in their shrimp farm operations, because if they get good production, both
sides also benefit. Farm employers know that workers’ attitudes to their work are critical
to high performance especially the need for presence at the side of the pond, attention to
detail, and observation skills, among others. This is a major reason why they allow
workers, who are mainly men, to bring their wives and children with them, so they can
have peace of mind and be happy working on farm, rather than worrying about their
families if they are away from them.
All the farms comply in terms of salaries and benefits, as per the national labour law and
standards, that farms should pay the workers for the work rendered. In addition, workers
received benefits such as housing, water, electricity and sometimes rice or meals,
including bonus or commission from production. According to the officer from the local
Department of Labour Protection and Welfare, housing and bonus are not specified by
law but shrimp farmers/operators provide these to workers anyway, by their own
initiative. Also according to the law, employers should pay salary once a month but the
majority of the shrimp farms pay their workers more than once a month. Large and
272
medium scale farms are more likely to comply with most of the guidelines in the
standards and certifications.
Other aspects in the standards which do not quite fit with the nature of work in the
shrimp farms include working time, breaks, over time, etc.
Resurreccion & Sajor (2010) brought out the issue regarding payments to couples that is
prevalent among shrimp farms. They argued that as the wives are also contributing to the
work, their work effort should also be recognised, therefore wives should also be paid a
salary separately from their husbands. To them, ‘couple payments’ imply that the wives’
contribution in shrimp production is not counted as work. From the shrimp farms visited
in this study, the majority pay individual salaries to men and women workers accordingly,
although indeed there are farms especially the small scale farms that employ the couple
and pay per couple. For the former type of employment, husbands and wives working in
the farms together get their own individual payments, especially when it is clear that the
farms hired them to work and assigned them their own tasks such as taking care of a
pond, cooking the meals of workers, and doing the inventory, among others.
In instances when payment is given to the couple and not individuals, the salary is often
based on the number of ponds assigned. Usually, the farms hire the husband only to work
and take care of a pond. Or two ponds will be assigned to each couple, and if the monthly
salary is based on per pond, this will also mean that each person gets paid the same
salary per month. Male workers are free to bring their wives and children with them to
the farms. Sometimes wives will assist their husbands even though the farms do not
273
‘employ’ them officially. As noted in Table 5.7, the salary ranges and bonuses are varied
according to farm scales and duration of work in the farm.
In a report by ILO (ILO, 2013b), the registered migrant workers who are part of the
informal sector (legally working) receive less than half of what a Thai would receive in
terms of salary. In contrast, this research found that salary levels on the farm depended
on the length of service and the task, and not on nationality.
5.4.3. On treatment of migrant workers by employers
Equal treatment of workers, be they Thais or migrants, male or female, is a provision in
both the national labour law of Thailand (Ministry of Labour, 1998) as well as
international labour law under the ILO. In fact there are specific chapters devoted to
employment of women and young workers in the Thai national labour law, to ensure they
are protected and treated equally. The key informants from the provincial offices of the
Department of Labour Protection and Welfare all have mentioned that they have a
mandate to treat all workers, both Thai and migrant workers, in Thailand equally under
the Thai labour law as well as the ILO regulations. Derks (2013) mentioned that although
the Thai government is accountable for the protection of human rights of migrant
workers, there are still conditions which exclude migrants from being protected. In her
study of Khmer migrant workers in the eastern seaboard, she argued that the issue is not
based on migrant legal status but more on how they are controlled and immobilized, and
that the legal frameworks give employers and local authorities control over the workers.
It seems that the Thai government is contradictory in its stand on protecting migrant
worker rights and yet through the legalisation of undocumented migrant workers,

274
Thailand is in fact controlling migration through “aggressive means to suppress, arrest,
prosecute and deport” the illegals (Derks, 2013; LPN, 2011).
A study on the Thai ethical landscape among various value chain actors and non-
aquaculture actors revealed that the majority considered “respect for minorities” and
“equal working conditions” as undesirable, reflecting on the historical relationship
between Thailand and its neighbours (Bremer et al., 2013). Furthermore, this could
explain that the labour issues among migrant workers especially their poor working
conditions in many sectors in Thailand may be cultural and social in nature.
Shrimp farm workers interviewed all mentioned that they are being treated as family
members in the farms, and that their employers show their care for them through
providing them with the benefits while living in the farm. Employers have also mentioned
the importance of treating their workers well in order to have good production, that it is a
win-win situation for both sides. If the production is good, both of them will benefit from
the revenues. Key informants at the subdistrict and provincial levels expressed that they
are mandated to treat all workers equal according to the law. These experiences shared
by both employers and workers in this study are in contrast to what is being described in
the paper by Derks (2013) related to Cambodian migrant workers’ experiences in fisheries
and construction. Working and living conditions between these jobs and shrimp farms are
vastly different.
She further pointed out that the Thai government has curtailed migrant workers’ rights of
freedom to move around with the issuance of a decree to control migrant workers’ unruly
275
behavior. This is in contrast with the report of Vungsiriphisal et al. (2010) wherein they
found that there is freedom to travel during free time. For workers living in a shrimp farm
with the responsibility to take care of one pond wherein a bonus is attached at the end of
the cropping period, going outside the farm regularly for entertainment (for e.g.
gambling, drinking) is not encouraged but not prevented. In fact migrant workers’
experiences in shrimp farms are in contrast with the accounts of migrant workers in
Derks' (2013) study as the terms of reference are quite different.
Other issues that need to be resolved are in the area of migrant worker registration and
documentation. The period for registration of migrant workers given by the Thai
government is not all throughout the year. This poses a problem to both employers and
workers who could not immediately register themselves and have to wait for the period
to open. Furthermore, the registration period itself is just for a few months.
People perceived that keeping the original documents of the migrant workers might be
the employers’ way of ensuring that the workers will not leave the farm. GAA-BAP (2013)
considered holding of identity papers such as passports as one kind of force or bonded
labour. Under this category also is the prohibition to leave the premises or forcing them
to work.
In their study about recruitment of Cambodian and Lao workers to work in Thailand
through recruitment companies, Vungsiriphisal et al. (2010) concluded that the complex
recruitment process, cost of processing, confusion even among government officials, and
276
recruitment companies taking advantage of loopholes leading to potential exploitation,
are some of the challenges that need to be overcome.
5.4.4. On importance of migrant labour in shrimp farms in Thailand
In the past, majority of the workers in shrimp farms in the east and south were from the
northeast of Thailand (Resurreccion and Sajor, 2011). The migration from rural northeast
to rural east and south came about due to poor or lack of income from arid rice fields
(Ekachai, 1990; ILO, 2013b; Rigg and Salamanca, 2009). However, due to the lack of local
Thai labour force for shrimp farms, and the lack of employment opportunities in
neighbouring countries, namely Cambodia, Laos and Myanmar, there has been an influx
of migrant labour, not only in shrimp farming sector but in many sectors in Thailand in
recent years (ILO, 2013b; Resurreccion, 2010; Vungsiriphisal et al., 2010). This has led to
many issues including human trafficking, child labour, and exploitation, which the
international community and the media have linked with Thailand’s seafood trade e.g.
Derks (2010 and 2013). Since Thailand is the global leader especially in shrimp production
and exports, consumer groups and markets in the west have been vocal about the need
for Thailand to focus and resolve these issues (Bangkok Post 2012; US Department of
State 2013;). The Thai government through the facilitation of the International Labour
Organisation has collaborated with the private sector in abiding by the international
labour laws.
Thailand currently has about a million registered migrant workers and a similar number of
undocumented workers (Boonchalaksi et al., 2012), but the number working in shrimp
farms is not known. Furthermore, they added that the government expectation and

277
assumption that these are temporary migrant workers may not be in place and there is
concern that a number could be staying indefinitely for settlement and integration into
Thai society. It could be true for some, as in this research, half will continue to work in
shrimp farms while the other half mentioned that they planned to go back in a couple of
years to work on the land they have invested from their income in Thai shrimp farms
(Table 5.16).
The use of informal networks for recruitment of migrant workers into Thailand (not only
in shrimp farms) is considered safer than using external brokers, however they could also
be risky depending on the work the migrant workers will be doing, as the case of sex
industry in the Thai-Lao border described by Molland (2012). He further added that
legalisation of migration flows by the Thai and Lao governments is attempted in order to
eliminate brokers and reduce human trafficking. Thus viewing informal networks as
“safer” could be an advantage for shrimp farm worker recruitment as employers rely
heavily on this informal migration flow to find workers.
5.4.5. Gender issues
Shrimp farms especially those located in remote areas are still limited as work places for
women. Concerning the reasons of one company for not hiring women workers who are
single or living alone due to concerns for their safety and security, as well as the remote
farm location, these are similar to the findings of Sritha (2007) in her study about the
constraints for having more women shrimp farm managers, which mentioned about
safety and security issues due to the nature of work in the shrimp farms. This could be

278
due also to stereotyping such as the one pointed out by the Mekong River Commission
(2006) as to why there was less focus on gender and specifically women’s contribution to
fisheries and aquaculture. Thus during this study, it was not possible to set an equal
number of men and women respondents for the surveys.
In terms of decision making and control of assets, women are still entrusted with the
salaries that their husbands earn, similar as reported by Kruijssen et al. (2013). Even then
for those employed in shrimp farms and paid couple salaries instead of individual salaries,
as also raised by Resurreccion & Sajor (2010), it might be necessary to consider the
contribution of the wives to the work effort in relation to production of shrimp from the
ponds assigned to their husbands, i.e. need for ecological and social accounting.
Employers would argue that in addition to the cash salaries and bonuses provided, the
non-monetary benefits such as free housing, rice, water, electricity and the freedom to
live together as a couple or family can also be costed and would correspond to amounts
paid to individual workers. Couple salaries are more common in small and medium scale
shrimp farms, when the farm operators hire couple to manage the whole farm or, hire
only the husbands but the wives also live with them on farm (Resurreccion and Sajor,
2010).
Weeratunge et al. (2010) defined employment as any kind of activity that generates
economic or social gains, in cash or in kind, under an agreement that is either oral or
written, and in any time frame. This concurs with the findings of Resurreccion and Sajor
(2010) in terms of ‘employment’ of partner arrangements for couples living together on
responsibilities for women in financial management of resources and in decision making
279
in the household, were demonstrated in this research. Weeratunge et al. (2010)
suggested that providing opportunities to improve themselves will greatly enhance the
capability of households and the community and society in general. These improvements
could be in the form of “improving their income, educational levels, and access to
information.”
Provision of child care facilities either on-farm or in the local community might be helpful
in providing women more opportunities to perform production or economic roles rather
than just stopping work altogether and concentrate on their reproductive roles. In a study
by Kusakabe and Pearson (2013) of Burmese women migrant workers in Thailand they
documented that these women faced difficulty in finding good child care so that they can
continue to work, adding to the stress of being undocumented and working in
“exploitative conditions.” The wives of shrimp farm workers in this study might not have a
similar experience as the women in Kusakabe and Pearson ( 2013)’s study as they live on
farm with their husbands and did not have to travel.
5.5. Conclusion
In addressing the research questions for this chapter, the following conclusions have been
formed:
Shrimp farm workers from all farm scales perceive that the quality of their lives is better
or much better than before working in the shrimp farms. Using the QOL integrative
definition, it can be said that working in shrimp farms can meet the various needs of
280
workers leading to dignified lives in the farms and when they go back to their own
countries. The monetary as well as non-monetary benefits they receive are more than
what is stipulated in the global labour standards as well as the local labour law.
Employers have varied opinions regarding nationality preferences. However, independent
of nationality, workers experienced that they are being treated well by their employers,
managers and co-workers, and that there is a family and friendly atmosphere in the
shrimp farm environment. Workers are hired in certain areas because they are more
available due to the informal network among workers of the same ethnic backgrounds
which would introduce their own kind to the farms in the same area.
The methodology in this chapter of interviewing workers in the farms, sometimes with
the presence of their employers/managers in some interviews, could lead to a bit of
skepticism in the responses. The presence of farm employers during interviews could
present a potential bias of responses of the shrimp workers interviewed. The conclusions
reached in this chapter i.e. more positive responses related to farm working and living
conditions, are in contrast with what the secondary literature have been describing,
although most of the latter were referring to a different node in the shrimp value chain.
Nevertheless, it is acknowledged that a more balanced approach would have been to also
conduct interviews with shrimp farm workers without the presence of their employers,
preferably outside the farm setting. Other factors to be considered which could have an
effect on responses include the legal status of workers (registration) as well as
recruitment conditions (bonded with brokers or independent). Thus the conclusion can
be taken only as a case study of the specific farms interviewed in this study.
281
Migrant labour in shrimp farms will continue to be important as most Thais do not want
to work in shrimp farms, as Thais consider the work as difficult for them to do. The
benefits from working in Thai shrimp farms will continue to attract migrant workers, as
they see that working in shrimp farms could help them to achieve their dreams of saving
money, sending their children to school, owning land or establishing a business in their
home country when they go back.
Various gender issues still need to be addressed, explicitly in the 3rd party standards and
in the Thai labour law, especially in the area of couple payments, access to opportunities
and skills development, social protection and freedom of association.
Having looked at the detailed farm practices in relation to technical/environmental and
social aspects, and have determined how the farms operate to fulfill market demands, the
following chapter will report on the sustainability concerns of shrimp and tilapia farm
operators and other actors in the value chain that interact with them.
282
6. CHAPTER 6 Shrimp and tilapia value chain actors in Thailand: their perceptions on
sustainability
6.1. Introduction
Thai aquaculture has developed rapidly over the last half century. Its market-driven
characteristics have implications for a wide range of stakeholders rather than being the
domain of the producers or household farmers only. The sector is characterized by a
complex value chain of input production, service provision, marketing, processing and
trade. As it entered into foreign trade through exports of valuable species such as shrimp
and tilapia, more actors have become involved, not only locally but also in many parts of
the world. Thailand has come a long way since over a century ago when it started with
“artisanal aquaculture “ with carps, as influenced by the Chinese traders (Edwards et al.,
1997). Processed snakeskin gourami (Trichogaster pectoralis), the first species to be
produced on a large scale in Thailand, had a long standing trade in Southeast Asia, and
this has given Thailand a good experience in trading with its neighbours as well as beyond
(Yoonpudh and Little, 1997).
Despite the perceived strength of Thailand in shrimp production and exports as well as
industry expansion, shrimp producers have experienced challenges to the sustainability of
their operations, such as disease, price fluctuations and rising input costs. In the midst of
global competitiveness, the “small rural farmers face most of the risks and burdens of the
shrimp production business” (Lebel et al., 2008).
283
For tilapia, the decline in prices and returns relative to off-farm employment
opportunities could pose a challenge to sustaining tilapia farming operations. In 2004,
tilapia farm-gate prices ranged from US$ 0.92 to 1.15/kg, giving gross margins of US$ 0.06
to 0.50/kg (Mariojouls et al., 2004). Whereas in 2010, the prices ranged from US$0.87 to
2.0, depending on the province (DOF, 2013a). Tilapia farm households also have more
diverse sources of income, i.e. aquaculture is not only the main source (Kruijssen et al.,
2013).
Sustainability in aquaculture is complex in that it could not only be addressed by technical
improvement within the farm, but there may be a need to also look at factors outside the
farm, such as governance, defined as “how society organises to use power to manage
natural resources, including the environmental and social impacts of their use” (Lebel et
al., 2008).
Thailand has been leading in the production and exports of shrimp, reaching 540,000 MT
in production in 2012 and exports of >323,102 MT (FAO, 2014). However due to the Early
Mortality Syndrome (EMS) which started to affect shrimp farms in 2012, the production
and export quantity in 2013 dropped to 250,000 MT and 191,446 MT, respectively (FAO,
2014). Whereas for tilapia, Thailand’s domestic market continue to trade 90% of
production from ponds and cages with only 10% exported as frozen whole fish and fillet.
In Chapter 3, the various stakeholders involved in aquaculture were identified, in order to
understand the existing situation in the aquaculture industry and to know the people or
actors who are involved in every process. Through stakeholder analysis, it is aimed that
284
the people or groups who can have an impact on a certain issue can be identified,
including how they can be affected by what is going on around them (Reed et al., 2009),
especially in view of the sustainability of their operations.
Who is then responsible to achieve sustainable aquaculture? Robertson (2014) stated
that in order for people to change they need to be driven by economic rewards, i.e. to
improve their quality of life, which links with both environmental balance and social
equity. Do actors involved in aquaculture value-chains have an understanding of
sustainability? Individual stakeholders might not necessarily share the same perspectives,
even those coming from the same value chain node. There could be many factors within
and outside their own systems which could affect their perceptions leading to different
efforts in responding to these factors to make their operations sustainable. Therefore an
improved or shared understanding of sustainability would enhance and/or accelerate a
drive to more sustainable practices.
6.1.1. Sustainability definitions/theories
Through the years a number of definitions of sustainability have been formulated, mainly
based on the Brundtland Report’s basic definition of “meeting the needs of the present
without compromising the ability of future generations to meet their own needs” (WCED,
1987). Figure 6.1 shows what the elements are to be considered when considering about
sustainable seafood production and trade, as oftentimes sustainability is equated with
just environmental aspects, which is just one part of the whole picture of sustainability.
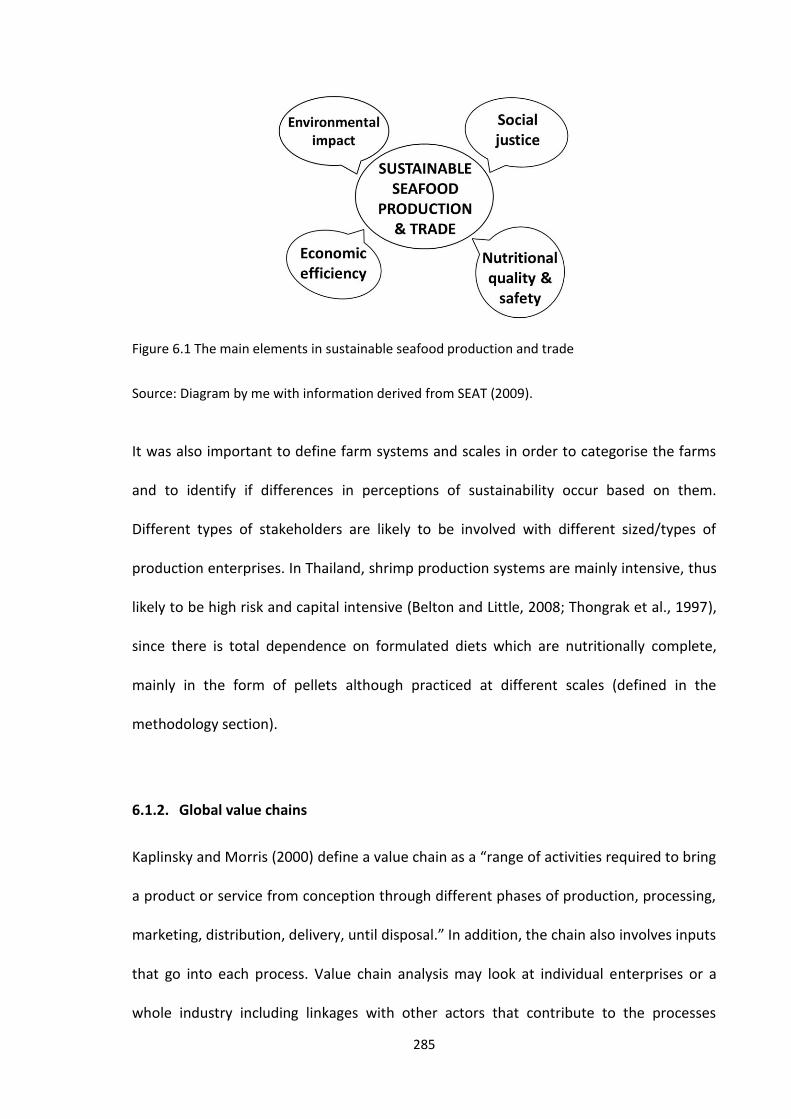
285
Figure 6.1 The main elements in sustainable seafood production and trade
Source: Diagram by me with information derived from SEAT (2009).
It was also important to define farm systems and scales in order to categorise the farms
and to identify if differences in perceptions of sustainability occur based on them.
Different types of stakeholders are likely to be involved with different sized/types of
production enterprises. In Thailand, shrimp production systems are mainly intensive, thus
likely to be high risk and capital intensive (Belton and Little, 2008; Thongrak et al., 1997),
since there is total dependence on formulated diets which are nutritionally complete,
mainly in the form of pellets although practiced at different scales (defined in the
methodology section).
6.1.2. Global value chains
Kaplinsky and Morris (2000) define a value chain as a “range of activities required to bring
a product or service from conception through different phases of production, processing,
marketing, distribution, delivery, until disposal.” In addition, the chain also involves inputs
that go into each process. Value chain analysis may look at individual enterprises or a
whole industry including linkages with other actors that contribute to the processes
286
(Nang’ole et al., 2011). A number of global value chain (GVC) analysis approaches have
been developed to study commodities such as agricultural and forest products (Nang’ole
et al., 2011), coffee (Ponte, 2004), fish and fishery products (Silva, 2011), and seafood
species such as shrimp, tilapia, striped catfish and freshwater prawn (Jespersen et al.,
2014; Ponte et al., 2014). There are also specific studies integrating and looking at gender
aspects of the value chains (Laven and Verhart, 2011; Laven et al., 2009; Mayoux and
Mackie, 2008; Pryck, 2013).
Value chain analysis is important in order to know how to survive or sustain business or
operations in the global market, and with increasing competition there is a need to be
more efficient with operation and use of resources such as labour and other inputs, and
to understand the various forces and the dynamics that are going on (Kaplinsky and
Morris, 2000).
The components looked at in the GVC in coffee by Ponte (2004) included input-output
structure, geographical coverage, form of governance and institutional framework.
Further, the analysis also looks at power of various firms and how their interactions with
each other affect the structure of trade. Bolwig et al. (2010) suggested the integration of
poverty and environmental concerns in the value chains analysis framework in order to
determine and document the impact of enterprises producing for the global markets on
the communities specifically on poverty and gender, and the environment.
In the GVC analysis of seafood products relevant to this study in Thailand, i.e. shrimp and
tilapia, Ponte et al. (2014) found that upgrading has been successful in both farm and

287
processing levels for shrimp, but for tilapia, there could be little room for upgrade as
fillets are already the most popular export form to Europe. Furthermore, public sector
and regulations continue to support product upgrading in terms of value addition and
certification (Ponte et al., 2014).
6.1.3. Research questions
This research was guided by the following research questions:
What does sustainability mean to various stakeholders (in terms of what people
think of their future?)
How diverse are the stakeholders’ perceptions regarding sustainability according
to their roles in the value chain, and among different farm scales, systems and
demographics, including gender differences?
How much importance does each stakeholder place on the factors they perceived
to affect their operations?
6.2. Methodology
This study involved three major activities in connecting with stakeholders. The first two
activities were described in Chapter 2. The methods here will only describe the specific
data collection for sustainability perceptions and analysis.
The first activity was a scoping exercise wherein a number of key informant (KI)
interviews were conducted to obtain perceptions on sustainability of different types of
aquaculture stakeholders in the shrimp and tilapia value chains. These KIs (Table 6.1)
288
represented the various nodes of the value chain for shrimp and tilapia, from both the
government and the private sectors.
A checklist of questions was used to obtain information from the KIs (Appendix 2)
covering various aspects of the SEAT Project. However the question asked related to
sustainability was: What factors (environmental, economic, social, institutional) do you
foresee could affect your aquaculture operations in the future?
The second activity was an integrated farm survey focusing on individual producers
(farmers/operators/managers) of shrimp and tilapia from major production areas in
Thailand. More detailed questions on sustainability and generational factors were asked,
along with other demographic and technical questions. Technical details are reported
mainly in Chapter 4.
The third activity was a state of the system workshop which was conducted to present
the findings from the earlier activities, to triangulate and confirm the findings, and to
come up with a consensus within and between groups regarding factors affecting
sustainability for each group. Representatives from different stakeholder groups
participated in the workshop.
The sections below briefly describe the steps taken during these three activities.

289
6.2.1. Activity 1. Scoping/exploratory research
The scoping/exploratory research activity was conducted from late January 2010 to mid-
July 2010. Primary data on various stakeholders involved in shrimp and tilapia value
chains were collected through the following methods: direct observation and site visits,
semi-structured interviews of value-chain actors and key informants using a question
checklist, and participation in producer organisation (PO) and other stakeholder
meetings.
Secondary data were collected using district and national level government statistic
reports, trade organization statistics and reports, peer-reviewed journal articles, research
and workshop reports, newspaper and technical magazine articles, technical, export and
trade related websites, fisheries movement document and export databases, and thesis
manuscripts. Based on secondary data, provinces were identified for field visits according
to production and trade importance for the target species. The first points of contact
were the provincial fisheries offices and the producers’ associations. As no timely
disaggregateddata could be sourced at the enterprise level, ‘a snow-ball approach’ was
taken to site selection commencing with key informant interviews at association meetings
and exhibitions. A number of farm visits were also made based on published information
(magazines) and recommendations by the local fisheries offices and the producers’
associations.
A number of stakeholders/actors (Table 6.1) in the value chain were visited and/or
interviewed to obtain information on their roles and general information on the physical
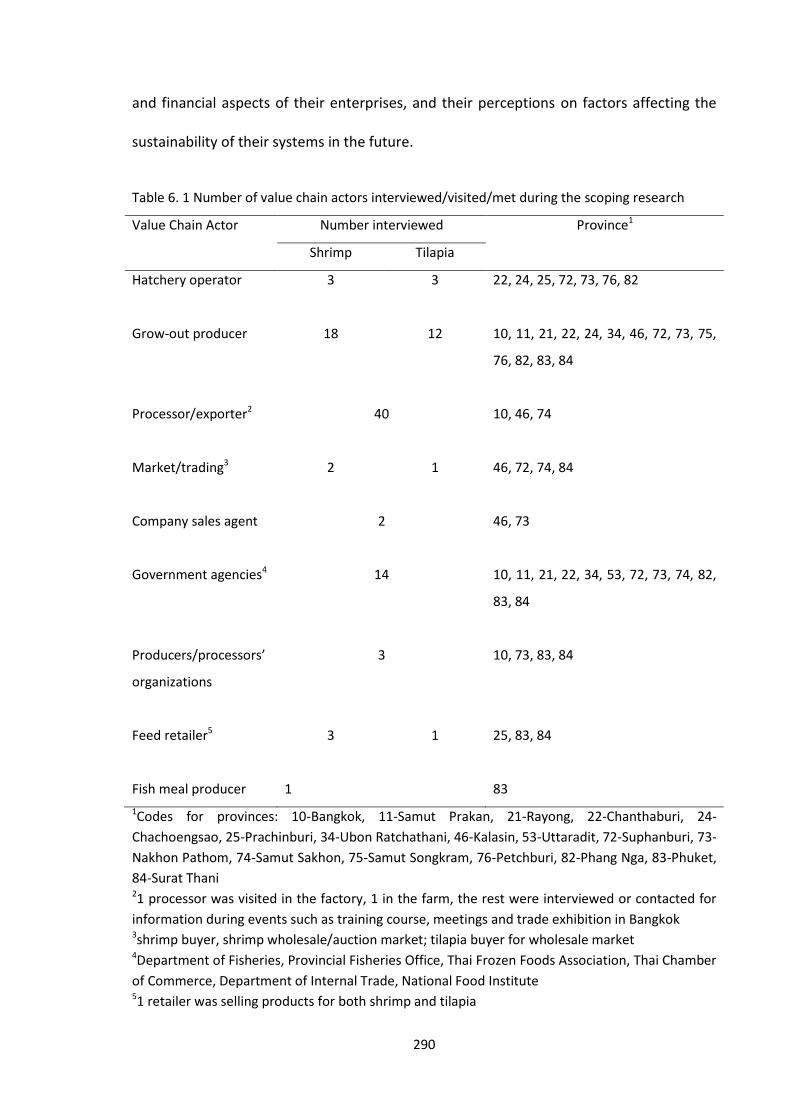
290
and financial aspects of their enterprises, and their perceptions on factors affecting the
sustainability of their systems in the future.
Table 6. 1 Number of value chain actors interviewed/visited/met during the scoping research
Value Chain Actor Number interviewed Province1
Shrimp Tilapia
Hatchery operator 3 3 22, 24, 25, 72, 73, 76, 82
Grow-out producer 18 12 10, 11, 21, 22, 24, 34, 46, 72, 73, 75,
76, 82, 83, 84
Processor/exporter2 40 10, 46, 74
Market/trading3 2 1 46, 72, 74, 84
Company sales agent 2 46, 73
Government agencies4 14 10, 11, 21, 22, 34, 53, 72, 73, 74, 82,
83, 84
Producers/processors’
organizations
3 10, 73, 83, 84
Feed retailer5 3 1 25, 83, 84
Fish meal producer 1 83
1Codes for provinces: 10-Bangkok, 11-Samut Prakan, 21-Rayong, 22-Chanthaburi, 24-
Chachoengsao, 25-Prachinburi, 34-Ubon Ratchathani, 46-Kalasin, 53-Uttaradit, 72-Suphanburi, 73-
Nakhon Pathom, 74-Samut Sakhon, 75-Samut Songkram, 76-Petchburi, 82-Phang Nga, 83-Phuket,
84-Surat Thani 21 processor was visited in the factory, 1 in the farm, the rest were interviewed or contacted for
information during events such as training course, meetings and trade exhibition in Bangkok 3shrimp buyer, shrimp wholesale/auction market; tilapia buyer for wholesale market 4Department of Fisheries, Provincial Fisheries Office, Thai Frozen Foods Association, Thai Chamber
of Commerce, Department of Internal Trade, National Food Institute 51 retailer was selling products for both shrimp and tilapia
291
6.2.2. Activity 2. Integrated Farm Survey (IFS)
The main methodology in this activity is described in Chapter 2. Briefly, shrimp farm
samples were based on production scales, i.e. small, medium and large, whereas for
tilapia, sampling was based on containment system (cages in river, ponds) at the first
instance. Then for tilapia pond farms, they were further divided into farm scales (small,
medium, large).
The questions asked relating to sustainability factors were as follows:
Would you like your children to farm shrimp/tilapia in the future? Why or why
not?
What factors do you perceive could negatively/positively affect your farm
operations in the next two years?
Can you rank these factors according to their order of importance? (1 – most
important)
What do you plan to do about these factors?
These questions were semi-open in that the further questions asked were mainly for
clarification of answers, although enumerators were also instructed to ask “Why?” or to
elaborate more when the responses were not on the list of expected responses. Due to
the survey methodology that this question was one of the more than 30 or so questions,
it was not possible to ask real open questions due to time constraints.
292
6.2.3. Activity 3. State of the System Workshop
A one-day state of the system (SOS) workshop was conducted (May 2011) among various
stakeholders to review and summarise outcomes of systems analyses conducted during
the first phase of the project. The majority of the participants came from the shrimp and
tilapia value chains in the eastern part of Thailand, and representatives of nationally
based value chain actors. As representatives of their respective nodes in the value chains,
the participants were encouraged to discuss the outcomes of the workshop with their
families, friends and associates who were not present. The SOS workshop was attended
by 47 value chain actors representing the following: hatchery/nursery operators, shrimp
and tilapia producers, input and service providers, post-harvest (processors/exporters)
and institutions (local government, academe, non-government organisation). A set of pre-
prepared questions asked during the survey was asked of the stakeholders to clarify and
obtain needed information. An individual exercise on sustainable factors affecting the
value chains in the next 1-2 years was conducted by asking the question: “What factors
do you foresee that could POSITIVELY or NEGATIVELY affect the performance of your
business or service over the next 1-2 years?” They were asked to rank the results in terms
of overall importance.
6.2.4. Analysis
Preliminary information on stakeholder perceptions regarding sustainability from Activity
1 (exploratory/scoping research) were put in a matrix to show similarities and differences,
as well as citation frequencies.
293
Data gathered from the integrated farm survey on generational information and
sustainability perceptions were entered in ACCESS database, together with demographic
and technical information for each farm. Data on sustainability factors were placed in a
matrix according to their effects (negative, positive, uncertain) and ranks as perceived by
the producers, and the frequency based on their ranks was noted. Descriptive statistics
were used to determine trends, and statistical analysis of non-parametric data was used
to analyse significant differences and correlations among variables.
Responses of different stakeholder groups during the SOS workshop were immediately
entered into a pre-prepared relational ACCESS database to obtain combined citation
frequency and rank of factors.
For the farmer groups, the citation frequency of responses to the same question asked in
the integrated farm survey were cross-referenced with the results of this exercise. All
respondents were asked to clarify which of the two project species (shrimp or tilapia)
were of relevance to their operation and/or expertise; this could be one or in some
instances both species. Descriptive statistics was used to determine trends, and statistical
analysis of non-parametric data was used to analyse significant differences and
correlations among variables.
Statistical analyses to determine significant differences of relevant data were conducted
using SPSS ver. 19. Independent variables used were primary species, farm scales, gender
of respondents and children, geographical location of farms and stakeholder groups.
Whereas dependent variables were preference for children to farm shrimp or tilapia in
294
the future, the sustainability factors, and importance of sustainability factors according to
ranking. As data gathered were non-parametric, χ2 test was used for dichotomous data on
generational differences, Friedman’s analysis was used for ranked data of sustainability
factors, both significant differences at P < .05, and the Wilcoxon Signed Ranked Test with
Bonferroni correction to determine differences between two sustainability factor
variables with P = .000758 for shrimp and P = .001389 for tilapia.
6.3. Results
6.3.1. Generational information
Both shrimp and tilapia producers were asked whether they would like their children to
farm shrimp and tilapia, respectively, in the future. In general, the majority of farmers
interviewed (67% of 206 shrimp farmers and 71% of 199 tilapia farmers) did not want
their children to farm shrimp and tilapia, respectively, in the future, and the difference
with those that agree is statistically significant (2 = 49.675, P < .01).
The difference in the responses according to farm scales of all respondents (not by
species) is not significantly different (2 = 4.062, P = .131).
Among shrimp farmers, there is a statistically significant difference in the responses
based on farm scales (2 = 8.515, P = .014) where 75% of small farmers replied that they
would not like their children to continue with the farming business, followed by 67% of
large farmers and 52% of medium farmers. This means that small farmers think more

295
strongly against their children farming shrimp than that of the medium and the large
farmers.
For tilapia, 75% of medium scale and 70% of small scale farmers would not like their
children to farm tilapia in the future which is not different in terms of statistical
significance (2 = 0.275, P = .60). The manager of the only large scale tilapia farm surveyed
replied positively.
There are different responses among farmers based on their level of education. Tilapia
farmers with higher education (Bachelor degree and above) and shrimp farmers with
intermediate and secondary education (mostly from small and medium scales) are more
likely to not want their children to continue farming tilapia and shrimp, respectively
(Figure 6.2). Although statistically, education level among shrimp and tilapia farmers did
not significantly affect their responses (2 = 7.834, P = .05 and 2 = 3.623, P = .305,
respectively).
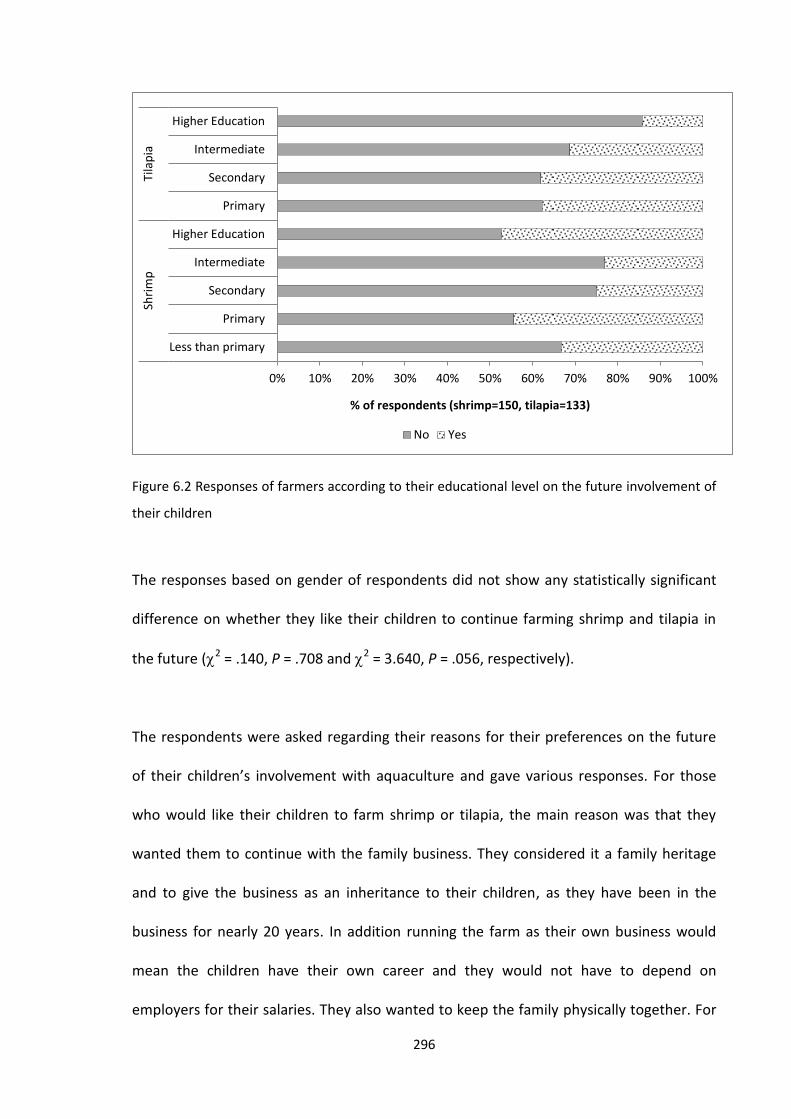
296
Figure 6.2 Responses of farmers according to their educational level on the future involvement of
their children
The responses based on gender of respondents did not show any statistically significant
difference on whether they like their children to continue farming shrimp and tilapia in
the future (2 = .140, P = .708 and 2 = 3.640, P = .056, respectively).
The respondents were asked regarding their reasons for their preferences on the future
of their children’s involvement with aquaculture and gave various responses. For those
who would like their children to farm shrimp or tilapia, the main reason was that they
wanted them to continue with the family business. They considered it a family heritage
and to give the business as an inheritance to their children, as they have been in the
business for nearly 20 years. In addition running the farm as their own business would
mean the children have their own career and they would not have to depend on
employers for their salaries. They also wanted to keep the family physically together. For
0% 10% 20% 30% 40% 50% 60% 70% 80% 90% 100%
Less than primary
Primary
Secondary
Intermediate
Higher Education
Primary
Secondary
Intermediate
Higher Education
Shri
mp
Tila
pia
% of respondents (shrimp=150, tilapia=133)
No Yes
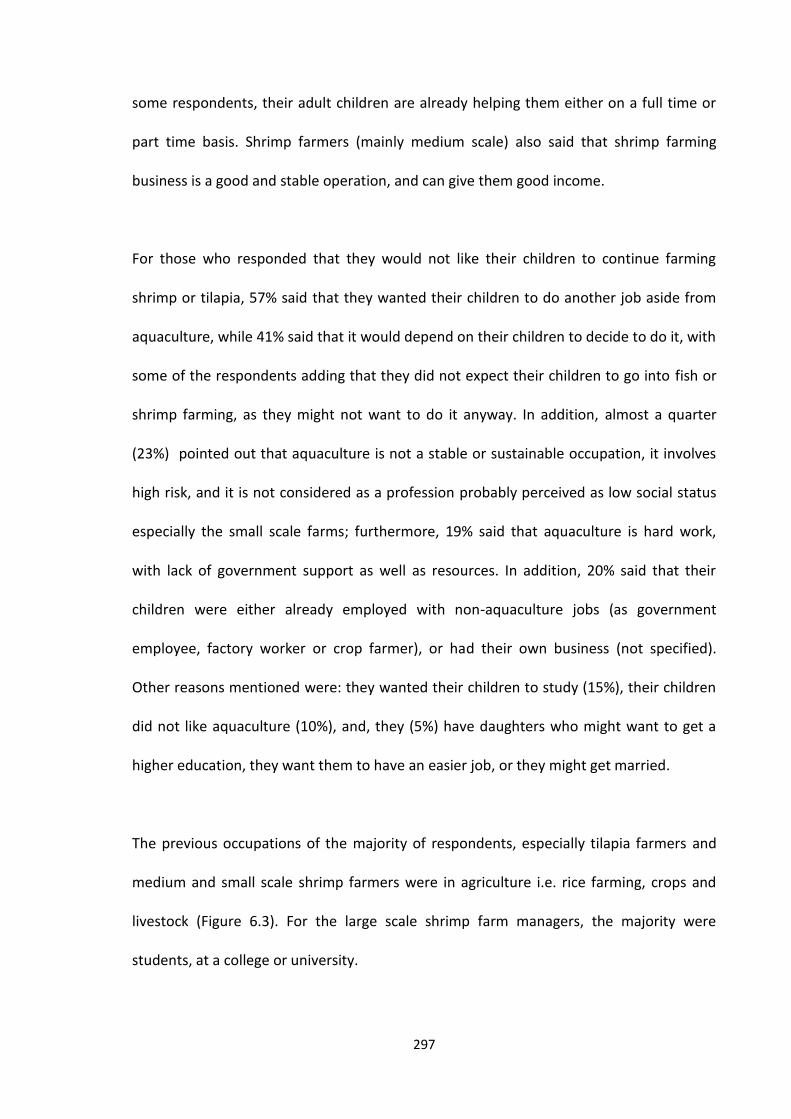
297
some respondents, their adult children are already helping them either on a full time or
part time basis. Shrimp farmers (mainly medium scale) also said that shrimp farming
business is a good and stable operation, and can give them good income.
For those who responded that they would not like their children to continue farming
shrimp or tilapia, 57% said that they wanted their children to do another job aside from
aquaculture, while 41% said that it would depend on their children to decide to do it, with
some of the respondents adding that they did not expect their children to go into fish or
shrimp farming, as they might not want to do it anyway. In addition, almost a quarter
(23%) pointed out that aquaculture is not a stable or sustainable occupation, it involves
high risk, and it is not considered as a profession probably perceived as low social status
especially the small scale farms; furthermore, 19% said that aquaculture is hard work,
with lack of government support as well as resources. In addition, 20% said that their
children were either already employed with non-aquaculture jobs (as government
employee, factory worker or crop farmer), or had their own business (not specified).
Other reasons mentioned were: they wanted their children to study (15%), their children
did not like aquaculture (10%), and, they (5%) have daughters who might want to get a
higher education, they want them to have an easier job, or they might get married.
The previous occupations of the majority of respondents, especially tilapia farmers and
medium and small scale shrimp farmers were in agriculture i.e. rice farming, crops and
livestock (Figure 6.3). For the large scale shrimp farm managers, the majority were
students, at a college or university.
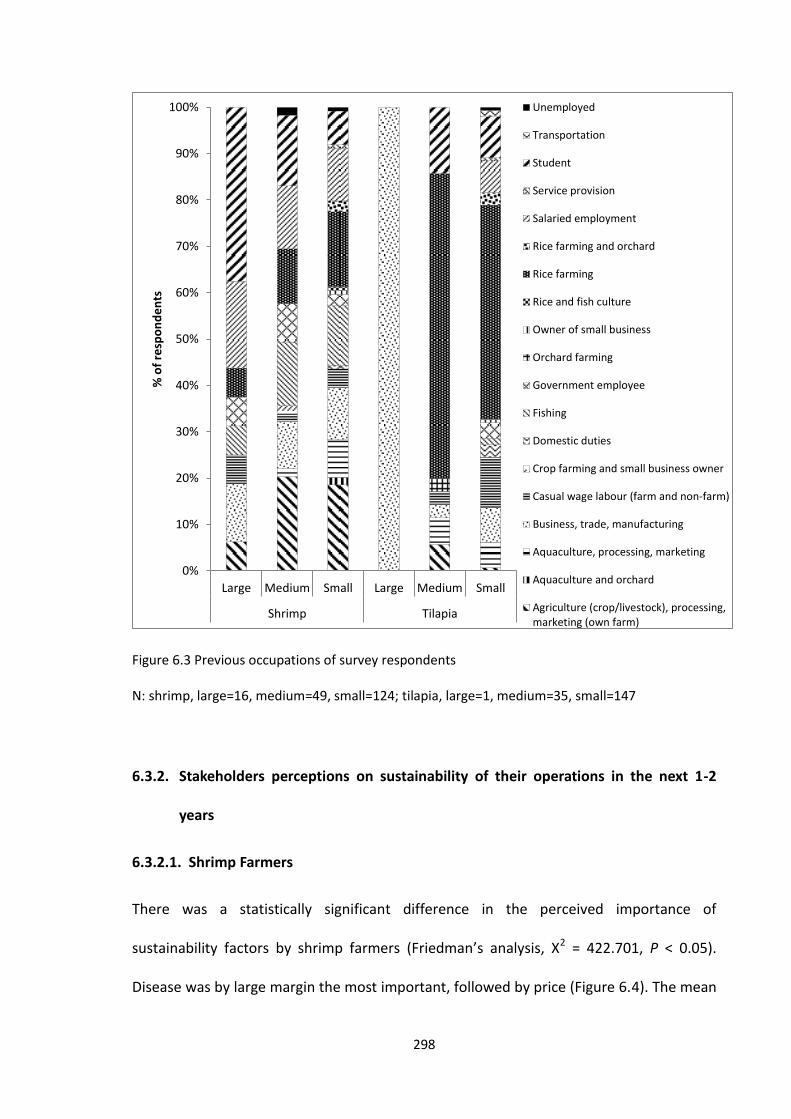
298
Figure 6.3 Previous occupations of survey respondents
N: shrimp, large=16, medium=49, small=124; tilapia, large=1, medium=35, small=147
6.3.2. Stakeholders perceptions on sustainability of their operations in the next 1-2
years
6.3.2.1. Shrimp Farmers
There was a statistically significant difference in the perceived importance of
sustainability factors by shrimp farmers (Friedman’s analysis, X2 = 422.701, P < 0.05).
Disease was by large margin the most important, followed by price (Figure 6.4). The mean
0%
10%
20%
30%
40%
50%
60%
70%
80%
90%
100%
Large Medium Small Large Medium Small
Shrimp Tilapia
% o
f re
spo
nd
en
ts
Unemployed
Transportation
Student
Service provision
Salaried employment
Rice farming and orchard
Rice farming
Rice and fish culture
Owner of small business
Orchard farming
Government employee
Fishing
Domestic duties
Crop farming and small business owner
Casual wage labour (farm and non-farm)
Business, trade, manufacturing
Aquaculture, processing, marketing
Aquaculture and orchard
Agriculture (crop/livestock), processing,marketing (own farm)
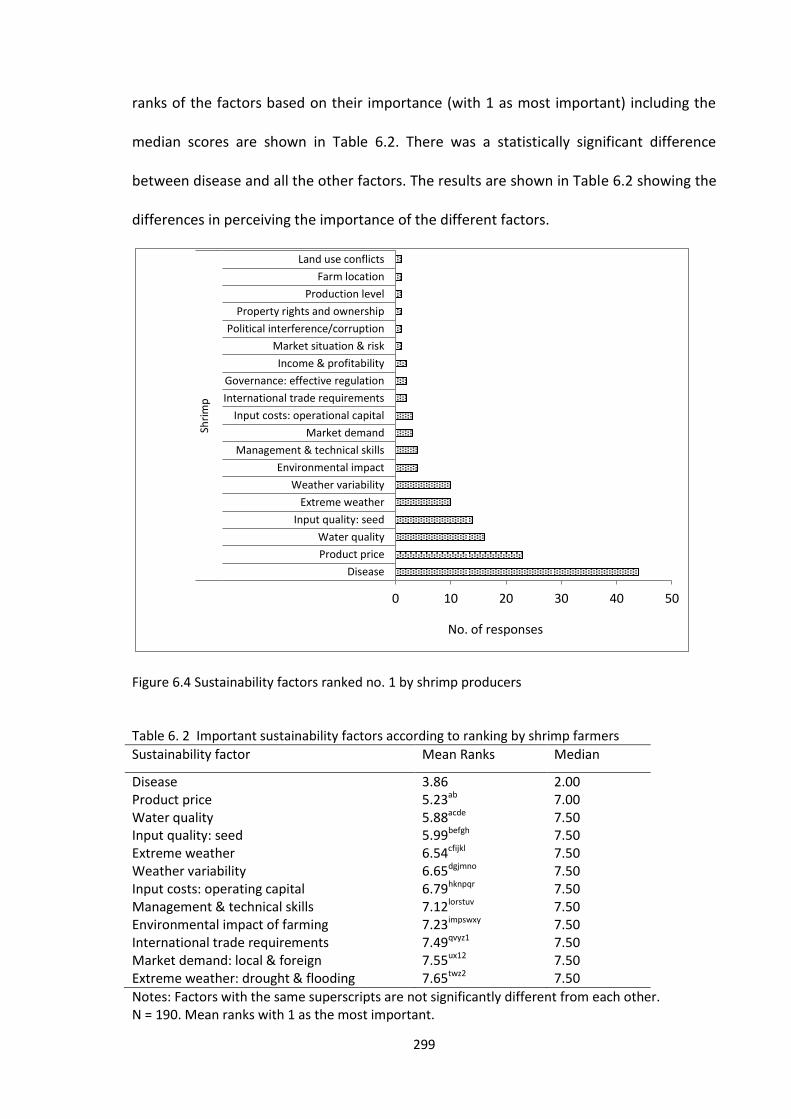
299
ranks of the factors based on their importance (with 1 as most important) including the
median scores are shown in Table 6.2. There was a statistically significant difference
between disease and all the other factors. The results are shown in Table 6.2 showing the
differences in perceiving the importance of the different factors.
Figure 6.4 Sustainability factors ranked no. 1 by shrimp producers
Table 6. 2 Important sustainability factors according to ranking by shrimp farmers
Sustainability factor Mean Ranks Median
Disease 3.86 2.00 Product price 5.23ab 7.00 Water quality 5.88acde 7.50 Input quality: seed 5.99befgh 7.50 Extreme weather 6.54cfijkl 7.50 Weather variability 6.65dgjmno 7.50 Input costs: operating capital 6.79hknpqr 7.50 Management & technical skills 7.12lorstuv 7.50 Environmental impact of farming 7.23impswxy 7.50 International trade requirements 7.49qvyz1 7.50 Market demand: local & foreign 7.55ux12 7.50 Extreme weather: drought & flooding 7.65twz2 7.50
Notes: Factors with the same superscripts are not significantly different from each other. N = 190. Mean ranks with 1 as the most important.
0 10 20 30 40 50
Disease
Product price
Water quality
Input quality: seed
Extreme weather
Weather variability
Environmental impact
Management & technical skills
Market demand
Input costs: operational capital
International trade requirements
Governance: effective regulation
Income & profitability
Market situation & risk
Political interference/corruption
Property rights and ownership
Production level
Farm location
Land use conflicts
Shri
mp
No. of responses
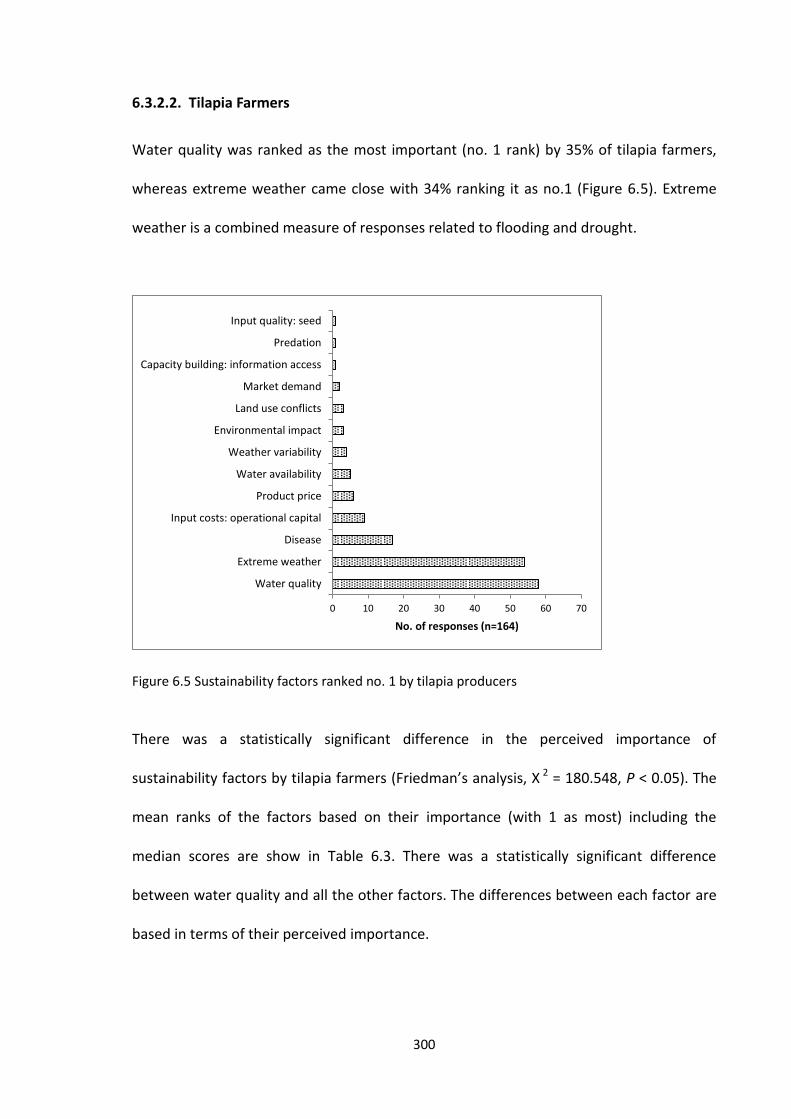
300
6.3.2.2. Tilapia Farmers
Water quality was ranked as the most important (no. 1 rank) by 35% of tilapia farmers,
whereas extreme weather came close with 34% ranking it as no.1 (Figure 6.5). Extreme
weather is a combined measure of responses related to flooding and drought.
Figure 6.5 Sustainability factors ranked no. 1 by tilapia producers
There was a statistically significant difference in the perceived importance of
sustainability factors by tilapia farmers (Friedman’s analysis, X 2 = 180.548, P < 0.05). The
mean ranks of the factors based on their importance (with 1 as most) including the
median scores are show in Table 6.3. There was a statistically significant difference
between water quality and all the other factors. The differences between each factor are
based in terms of their perceived importance.
0 10 20 30 40 50 60 70
Water quality
Extreme weather
Disease
Input costs: operational capital
Product price
Water availability
Weather variability
Environmental impact
Land use conflicts
Market demand
Capacity building: information access
Predation
Input quality: seed
No. of responses (n=164)

301
Table 6. 3 Important sustainability factors according to ranking by tilapia farmers
Sustainability factor Mean Ranks Median
Water quality 3.47 3.00
Disease 4.56abcd 5.50
Extreme weather: drought 4.94aefgh 6.00
Input cost: operating capital 4.96beijk 5.50
Extreme weather 5.00cfilmn 5.50
Product price 5.23dgjlop 5.50
Weather variability 5.45hkmoqr 5.50
Input quality: seed 5.59npqs 6.00
Predation 5.79rs 6.00
Note: Factors with the same superscripts are not significantly different from each other. N=177. Mean ranks with 1 as the most important.
6.3.2.3. Other stakeholder groups
Other stakeholder groups were also interviewed regarding their perceptions on factors
which could affect the sustainability of their operations (hatcheries, input providers and
processors/exporters) in the next 2 years. Likewise representatives from academia and
local institutions were also asked about their perceptions on factors which will affect the
sustainability of aquaculture operations in the next 2 years. This interview was conducted
during the state of the system workshop when a number of stakeholders across the value
chains for both shrimp and tilapia participated.
Input providers and processors consider the costs of raw materials as the main factors for
their specific operations, also related to the supply. The type of raw materials for each
group is different, as they belong to different streams, i.e. upstream (production) and
downstream (processing and delivery), respectively. Raw materials for input providers are
mainly feed ingredients for feed mills, and substances to formulate pond inputs. Whereas
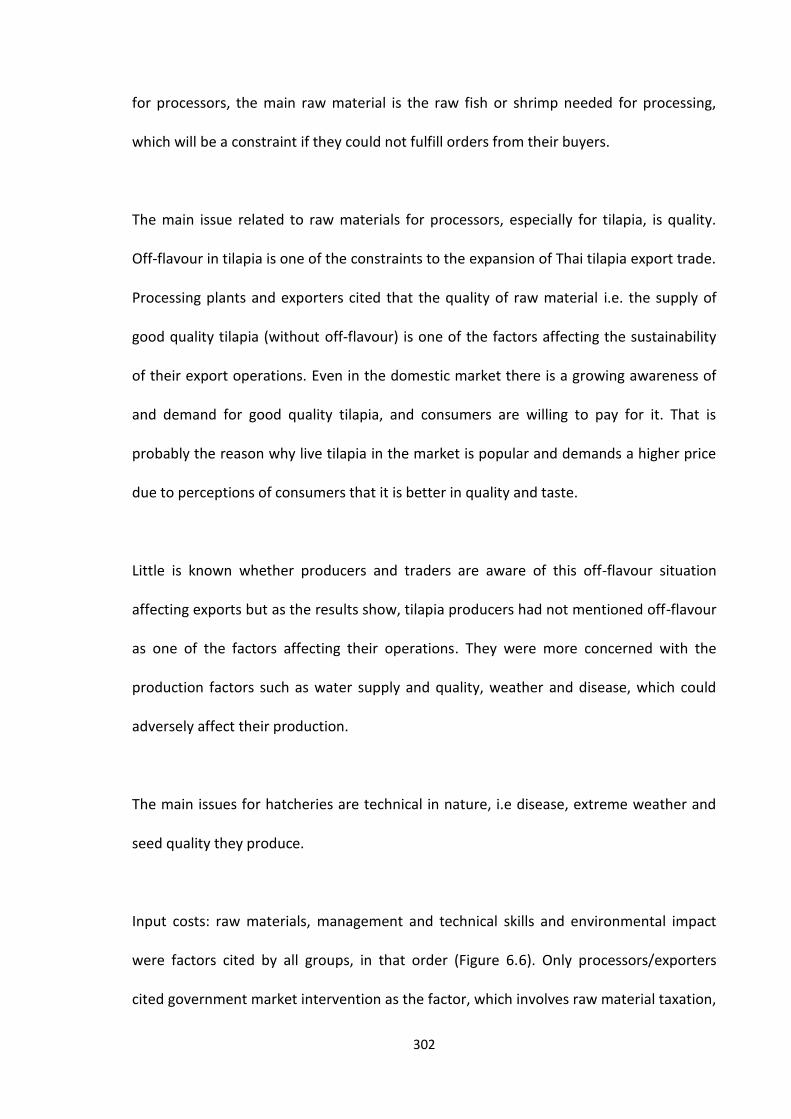
302
for processors, the main raw material is the raw fish or shrimp needed for processing,
which will be a constraint if they could not fulfill orders from their buyers.
The main issue related to raw materials for processors, especially for tilapia, is quality.
Off-flavour in tilapia is one of the constraints to the expansion of Thai tilapia export trade.
Processing plants and exporters cited that the quality of raw material i.e. the supply of
good quality tilapia (without off-flavour) is one of the factors affecting the sustainability
of their export operations. Even in the domestic market there is a growing awareness of
and demand for good quality tilapia, and consumers are willing to pay for it. That is
probably the reason why live tilapia in the market is popular and demands a higher price
due to perceptions of consumers that it is better in quality and taste.
Little is known whether producers and traders are aware of this off-flavour situation
affecting exports but as the results show, tilapia producers had not mentioned off-flavour
as one of the factors affecting their operations. They were more concerned with the
production factors such as water supply and quality, weather and disease, which could
adversely affect their production.
The main issues for hatcheries are technical in nature, i.e disease, extreme weather and
seed quality they produce.
Input costs: raw materials, management and technical skills and environmental impact
were factors cited by all groups, in that order (Figure 6.6). Only processors/exporters
cited government market intervention as the factor, which involves raw material taxation,
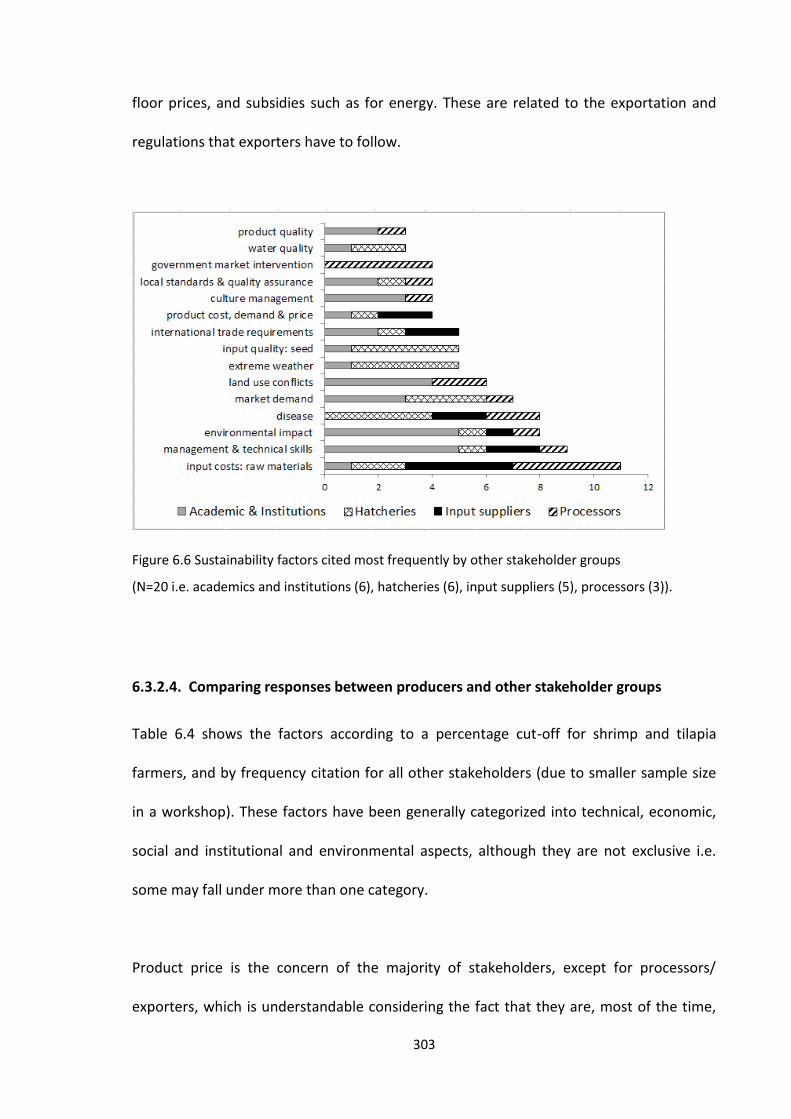
303
floor prices, and subsidies such as for energy. These are related to the exportation and
regulations that exporters have to follow.
Figure 6.6 Sustainability factors cited most frequently by other stakeholder groups
(N=20 i.e. academics and institutions (6), hatcheries (6), input suppliers (5), processors (3)).
6.3.2.4. Comparing responses between producers and other stakeholder groups
Table 6.4 shows the factors according to a percentage cut-off for shrimp and tilapia
farmers, and by frequency citation for all other stakeholders (due to smaller sample size
in a workshop). These factors have been generally categorized into technical, economic,
social and institutional and environmental aspects, although they are not exclusive i.e.
some may fall under more than one category.
Product price is the concern of the majority of stakeholders, except for processors/
exporters, which is understandable considering the fact that they are, most of the time,

304
responsible for setting the price with farmers or traders. However for upstream actors
especially in the production sector, they have to contend with the cost of inputs as well as
the selling price of their products, and in order to make a bigger margin, they have to
reduce costs.
The second most cited constraint which affected production was disease. Among shrimp
producers, disease has been ranked the most important as well. With shrimp as a
valuable commodity, shrimp farmers had the most concerns for sustainability, due to
their investment cost and the less flexibility to change to another occupation compared
with fish production.
It is interesting to note that the academics did not think disease was a factor, while they
cited farm management/sanitation. It is possible that they considered farm management
as the fundamental problem with disease as a result of poor management. Another
possible reason could be the background of members of this group i.e. local government
official, university lecturer, and food safety trainers (NGO staff), who might not have
exposure to the shrimp and fish production sector.
305
Table 6. 4 Sustainability factors most cited by respondents from different stakeholder groups
Factor Input/ service providers
Hatcheries Tilapia farmers
Shrimp farmers
Processors/ exporters
Academics/ institutions
ENVIRONMENT Disease
Water quality
Input quality: seed
Farm mgt, sanitation
Predation
Environmental impact of farming
Extreme weather
Extreme weather: drought
Extreme weather: drought & flooding
ECONOMIC
Input costs: raw material
Product price, market demand
Input costs: operating capital, production cost
International trade requirements
Product quality
SOCIAL/EQUITY
Government intervention
Land use conflicts
Management & technical skills
Source: Survey during State of System Workshop, May 2011
306
6.4. Discussion
6.4.1. Generational information
A significant (p<.01) majority of the farmers (i.e. small shrimp, small & medium tilapia) did
not want their children to farm fish or shrimp in the future, as they regard aquaculture as
hard work, risky and unstable. Medium-scale shrimp farmers are more likely to want their
children to continue with the family business, probably because their operations are
more stable, have a greater degree of autonomy in decision-making and management as
well as enjoying economies of scale to produce and earn an income. In addition, the
passing on of a profitable enterprise as inheritance to the next generation was considered
important.
In Rigg et al. (2008) the industrialisation of areas such as Ayutthaya province in Central
Thailand has led to labour migration, with 70% from the poorest region of Thailand in the
northeast going there to find employment. The farthest province in the northeast (Ubon
Ratchathani) would be about 550 km away from Ayutthaya province. In this research one
of parents’ reasons why they would like their children to continue farming shrimp was
they wanted to keep the family physically together, rather than let their children go too
far to earn an income. Thus it might be important to create an economic activity or
entrepreneurial spirit within the village in order to keep people from migrating to places
that are too far and dangerous. In a later research by Rigg et al. (2014) they found that
local migrants return to their home village with some having skills that could be applied in
the village while some could not apply their skills in the village context.
307
There have been stories told by Ekachai (1990) related to working in far areas and the
dangers which could lead to destroyed lives. Two generations of economic migrants from
Northeast Thailand experienced failure in their search to upgrade their status
economically, in the areas of education, skill and human capacity development (Rigg et
al., 2014).
With Thailand’s efficient infrastructure re: transport, and people having their own cars,
mobility and farm accessibility might not be an issue especially for those whose adult
children are helping their parents on the farm part-time, as they could travel to their
farms to help out. In Northeast Thailand, more people are now working in non-
agricultural jobs, either they have fully stopped or they still work part-time with
agriculture, emigrating outside the northeast region, with incomes earned helping their
families greatly (Grandstaff et al., 2008). They further pointed out that for those who
stayed within the farming occupation, they are also better-off due to the breakthroughs
in the adoption of glutinous rice, with the plain rice providing complementary incomes.
The lack of desire of many smaller and medium–scale shrimp and tilapia farmers to pass
on their fish farming occupations to their children, may also be due to the perceptions
that farm work is menial or manual work, thus they could just hire workers to do the job.
A way to encourage the younger generation to be attracted to farm work could be
through changes in the Thai educational system. UNICEF has raised concerns in terms of
the quality of education in Thailand and are working to mainstream the “Child-Friendly
School” concept, wherein teaching should put the best interests of the child as first
priority (UNICEF, 2014).
308
Most of the respondents said that they would not force their children to go to shrimp or
fish farming, allowing their children to make that decision whether to work in their farms
or not. Education, as pointed out by Rigg (2006), is one of the factors which could
influence the way rural people look at work and farming, including the future of their
children. The emphasis of the Thai government on industrialisation (Rigg and
Nattapoolwat, 2001) including the promotion of technology education as the basis for
developing other sectors including agriculture (Shinatrakool, 2000) could be one of the
reasons why there is less interest in farming or agricultural work as a profession.
Efforts to improve the profile of agriculture and its attractiveness to younger generations
have been made in several countries. For example, the new K to 12 curriculum in the
Philippines, wherein aquaculture is taught since Grade 7 (13 years old) under the
Technical-vocational electives especially in areas where there are existing fisheries and
aquaculture activities (SEAMEO-INNOTECH, 2012). This new curriculum started
implementation only in 2012 under the Education for All Plan, and is part of the
comprehensive education reform to address changing needs in the workplace, to provide
basic competencies at an early age, preparing them for practicalities in the workplace
including entrepreneurship (SEAMEO-INNOTECH, 2012). It might be too early to evaluate
impacts.
In Thailand, fisheries vocational education starts at Year 4 (16 years old), and at university
(18-19 years old). At Kasetsart University, the Faculty of Fisheries provides opportunities
for children of those involved in fisheries and aquaculture activities to apply separately

309
from the general applications, giving them a higher chance of getting into university to
pursue fisheries-related studies, although this may be far too late to garner interest
among the young generation.
Education has been seen as a gateway to be able to achieve occupations which are not
farming related (Rigg et al., 2008), as farming has been perceived as low in status
therefore “to be avoided” (Rigg, 2006). In a study by Garbero and Muttarak (2013)
wherein they investigated the role of education in protecting a community in rural
Thailand from “livelihood and climate shocks”, they found that “education may have a
role in reducing economic vulnerability” as those with higher educational attainment
have more access to government support. This is probably the reason why a large
majority of farmers wanted their children to have more education, so they can have more
professional jobs, and could have more access to economic opportunities and even a
higher status in the community. And yet, several countries, including Thailand, have been
caught in a “middle-income trap” despite their education and involvement in highly
skilled and highly paying employment (Rigg et al., 2014). What will be important to study
is how many of the shrimp and tilapia farmers/operators have advanced from low income
to middle income, and if any have reached the high income category. This is beyond the
scope of this study.
There is a possibility that parents did not foresee themselves working permanently in fish
or shrimp farming. What parents expect their children to be in the future could influence
children’s future career choices (Irwin and Elley, 2013), which has a positive and negative
connotation. Positive if the children are given the freedom to choose, and negative if they

310
will be forced to do what parents want for them. In studies about parents, youth and
employment conducted by McLoyd et al. (2011) and Purtell & McLoyd (2013) in the
United States, they found parents’ involvement in their children’s future career was
important to the subsequent focus and orientation. McLoyd et al. (2011) also mentioned
that children from lower income families have lower expectations about what to do in the
future especially regarding occupations. However, in this present study with Thai parents
having higher and/or different aspirations (more stable income, more comfort, higher
status) for their children to choose a different profession from fish or shrimp farming due
to hard work and unstable income, it could have a positive influence on children’s
decision making regarding their future careers. Their parents’ influence will likely to lead
them away from farming towards urban-industrial livelihoods.
Despite the parents’ seeming detachment regarding their children’s future choices, in
saying that they would leave it to the children to make a choice when it is time, it could
be beneficial to expose their children to their farm, giving them a choice in the future
whether to choose a farm-related occupation, for example aquaculture related careers,
especially in inheriting farm management work, or another profession.
Early positive influences may encourage a return to farming after a period spent in higher
education/industry. One of the respondents to our survey who graduated with a Bachelor
Degree in computer programming four years ago and before returning to, and now
managing, their family’s medium scale shrimp farm in Chanthaburi said:

311
“What influenced me to go back to our shrimp farm was my exposure to the
farm since I was a little boy. I used to tag along with my father and I learned
how my father would manage and handle the day to day operations in the farm.
Now I am working on my computer programming skills to improve our farm
system to make it more efficient.” – Mr. STH, medium scale farm
owner/manager
In a study among Thai students in an international programme of a Thai school/university,
the factors they considered important in future choice of occupations included their
expertise in the subjects, the appeal of the tasks, the assurance that they can obtain the
job and the sufficiency of income from it (McDevitt et al., 2013). Due to the more
international background of students in the study, it was stated that there was more
focus on globalization and technology in their career choices with and more confidence,
compared with those from less privileged background. The authors recommended that
career guidance counselors should consider children’s cultural, family, academic and
socio-economic backgrounds. However this study probably cannot translate to less
advantaged groups.
The general view of the Thai farming population that there is more economic
opportunities in non-farming occupations could be reflected in the changes in the
agricultural landscape in the rural areas, with some spaces now converted into other land
uses (Rigg et al., 2008). With Thailand’s main industry now focused on manufacturing and
trade, there is higher demand for factory workers and skilled technicians in these sectors.
The Thai workforce would prefer working in factories to farms, in an office with air
condition and a desk (Nopporn Kitrattana, Department of Labour Protection and Welfare,
personal communication, 2013). This had led to a shortage in both agricultural and non-
312
agricultural labour that has been filled by migrants. It is worthy to note that in 2010,
skilled agricultural and fishery workers still had the largest share of employment by
occupation, at 38% (ILO, 2013b), with men more than women, followed by the service
sector (23%), with more women than men. This could mean that agricultural and fishery
sector is still an important source of skilled employment.
6.4.2. Sustainability perceptions
The perceptions of stakeholders on what makes their operations sustainable reflect what
they understand about sustainability. The factors cited by the stakeholders have been
categorized into the major pillars of sustainability, namely environment, economics and
social (equity), to fit with the 3 E’s (Robertson, 2014) (Table 6.4).
Stakeholders cited environmental (technical), economic, social and institutional (equity)
aspects of their operations as factors which will affect the sustainability of their
operations. Some studies equate sustainability as an environmental concern, thus
environmental impacts of human activities (such as aquaculture for example) needs to be
quantified into economic terms to measure its benefits to society and human welfare
(Ekins, 2011). This also makes sense but efforts should not limit on the environment only.
Miranda (2010) reported on the destruction of mangroves due to shrimp farm
construction and considered them unsustainable. She further noted efforts for mangrove
replanting but urged the need to monitor the health of the mangroves, and considered
systems which reduce the release of waste water into the environment as more
sustainable.
313
Shrimp farmers put importance on disease as a major factor affecting the continuity of
their operations to survive in the business, and this relates to the state of the
environment in surrounding areas as well as in other areas where the inputs are
produced. The recent events on the Early Mortality Syndrome (EMS) had taken a toll on
the shrimp farming industry in Thailand (Prachachart, 2013), with those able to continue
operations stocking only at 50% capacity, and with a high number of farms stopping
operations for e.g. around 80% in one province alone (Shrimp News International, 2013),
affecting many other factors such as labour, income and general well-being. The shrimp
industry has long been plagued by various shrimp diseases especially with the black tiger
shrimp culture until early 2000 (Briggs et al., 2005). When the industry started to culture
the exotic species Pacific white shrimp (Litopenaeus vannamei) in the early 2000s, the
Department of Fisheries had to formulate regulations to regulate the import of SPF
broodstock to ensure that the industry would not face the same situation as before
(Belton and Little, 2008; Briggs et al., 2005; Mcintosh, 2010; Walker and Mohan, 2009)
from the perspective of introducing diseases, whereas now the situation might be
different.
Differences in sustainability perceptions are also common even in other sectors outside
aquaculture. For example in the exercise to set-up sustainability indicators in the health
services sector between two groups of stakeholders from two different countries,
Cambodia and Somaliland, the responses were based on the respondents’ background
situations in their respective countries (Blanchet and Girois, 2013). Cambodia pointed out
ministerial responsibilities including budget allocation, whereas Somaliland suggested
equity and coverage of services, as key components of sustainability, in their context. The
314
challenge is how to integrate them together to come up with indicators that are relevant
to the whole sector.
Operations leaning towards industrialisation, as premised by Woodhouse (2010) but
referring to agricultural activities, might be unsustainable in the long run, and suggested
smaller scale and more labour-intensive operations as more sustainable. If we look at the
various shrimp farm operations in this study, we might conclude that they fit in the
description in the above-mentioned study, re: “industrial aquaculture”. As an example,
the majority of the farms have switched to autofeeding, which is mainly powered by
electricity, and this is one of the reasons for reduction of labour in the farms. In tilapia
farms, generally managed as semi-intensive and producing a lower value product than
shrimp, operations may not be considered as being industrial in scale, yet most are
already dependent on industrially produced feed, machinery such as pumps and and
increasingly, drugs and other chemical inputs .
Social sustainability is not as well-discussed and studied compared with environmental
and economic, and as Psarikidou & Szerszynski (2012) suggested, “sustainability’s social
dimension has been relatively neglected in studies of sustainable food initiatives”. They
suggested that social aspects should be treated not as a separate entity but part of the
whole process of people in constant interaction with their environment and the economy.
This is where the ethical aspect comes in when we think about food production and
trade, including the moral issue. This includes not only the welfare of the animals being
cultured but also the welfare of actors involved in the value chain. Olesen et al. (2011)
talked about ethical perspectives but focused mainly on the welfare of salmon. Whereas,
315
sustainable aquaculture should lead not only to aquaculture development which will
benefit owners and companies, but also to ensure that those who lose out in the process
do not experience deficiencies in meeting their basic needs (Rivera-Ferre, 2009). This will
be a concern for example for farms not achieving certifications as they lose out on
opportunities to participate in trade, therefore alternative markets will be needed to
market their products.
Ethical issues in Thai aquaculture should also be considered and included in the whole
concept of sustainability, not just focusing on one or two aspects i.e. certification,
environment (Bush et al., 2013). In this way, issues and practices related to human rights
and labour abuses in the workplace as well as environmental degradation and market
manipulation could be addressed, and a balance between environmental protection,
economic development and social equity can be achieved. This will lead to an
improvement in the image of Thai aquaculture among consumers and media, resulting in
the strengthening of an industry on which millions of people, including migrants, are
dependent on for their livelihood (Songsangjinda and Smithrithee, 2008; UNIAP, 2011).
The Thai ethical landscape based on the respondents in this research, studied by Bremer
et al. (2013) showed that Thais considered family and household as most important to a
good life, whereas for a good society, they value health, safety and income security. In
general, their study concluded that Thai ethical landscape is “collectivistic” which focuses
on family and social harmony. Species wise, shrimp farmers put more value on “animal
and nature” while tilapia farmers put more value on “personal prosperity” and “religion’.

316
Understanding the ethical terrain of each value chain actor in relation to sustainability will
enable us to recognise which factors these actors find important to them.
The principles of “solidarity” and “polluter pays” were desirable principles among Thai
respondents (aquaculture and non-aquaculture) conducted by Bremer et al. (2013). This
knowledge could be exploited to be used in campaigns for better management practices
in the farms in achieving sustainability. Social marketing campaigns by some companies in
Thailand make use of this concept by appealing to the Thainess of the audience (Chevron,
2014; PTT, 2014).
Sustainable development of aquaculture may follow the suggestion by Lorek et al. (2012)
to not only focus on economic growth and sustainable consumption and production, but
also to be guided by enabling fair share of resources with everyone, fulfilling basic needs
and ensuring well-being, less materialism and wealth accumulation, social equity and
ecological balance, and community level resilience. The global aquaculture certifications
including the Thai standards covered in this research have components on social and
community impacts. However these need to be a concerted effort and the question is
who will be responsible to lead these initiatives: companies with their corporate social
responsibility programmes, local or national governments, civic and social organisations,
media or private citizens? The migrant workers may be excluded unless they form into
groups and be represented. Bush et al. (2013) suggested that certification schemes
should be integrated with other governance mechanisms and public rulings, including
local standards that are already in place, making use of the existing local expertise.
317
6.5. Conclusion
Each stakeholder group strives to work towards achieving sustainability so they can
remain in operation in the next few years, to survive in the business individually and
corporately, and at the national level, to be the best provider of sustainably and ethically
produced seafood for the world. Farms may need to innovate and evolve their systems to
be more efficient, and to be more responsive to changing buyer requirements.
Information and communication among various value chain actors are important to hear
and learn from each other. The “seminar culture” prevalent in the Thai aquaculture sector
and more widely described by Lebel et al. (2009) has had a good influence in bringing
together actors and encouraging social learning. The differences in perceptions which
exist among these stakeholders should be understood by every sector and efforts should
be made to address them so that there is cohesiveness in efforts and in giving support to
achieve sustainable seafood production and trade.
There should be educational campaigns to encourage young people from aquaculture
families to pursue a career in aquaculture to ensure that individual or family owned
farming business operations can continue to thrive either through upgrading or
outgrading of production systems. The training on sustainability and not just on a
particular discipline will provide a holistic view of aquaculture in relation to all other
factors that give input to and benefit from aquaculture.
Through the upgrading or outgrading of operations, shrimp and tilapia aquaculture
industry in Thailand will remain diverse i.e. operating at various farm scales and
production systems according to resource base and markets, sustaining the livelihoods of
318
various stakeholders along the value chain networks. A strong institutional framework
supporting the shrimp value chain in Thailand has been beneficial in enabling the Thai
shrimp industry to develop capabilities and produce high quality products for the export
market (Jespersen et al., 2014).
The export-focused shrimp industry has a simpler value chain, but this does not mean less
people are involved than the more local tilapia industry. The simpler chain than that of
tilapia could mean better traceability of the product’s life cycle, especially when a good
traceability system is implemented and enforced.
The scale of farm operations is just one of the factors which could affect sustainability, i.e.
larger operations are more likely to stay in business, if sustainability is based just on
compliance to standards. Farm operations regardless of scale should focus on the whole
aspects of sustainability, with moral ethics at the core in order to make decisions that are
beneficial to all (ideally) but in reality, there should be mitigation measures or
compensations for those that will eventually lose out.
The importance of factors affecting sustainability of export orientated aquaculture value
chains varies among stakeholders. Controlling disease and water quality were more
important for farmers, while market and price related factors were cited by almost all
stakeholders. The factors obtained in this study have to be considered when developing
indicators of sustainability from the stakeholders themselves. By considering their varied
perceptions, such sustainability indicators could be more targeted to the real situation of
the industry and of the particular stakeholder group.
319
7. CHAPTER 7 Overall Discussion and Conclusion
7.1. Overall Discussion
This research looked at sustainability issues faced by the various actors in the shrimp and
tilapia value chains in Thailand. The focus was on the perceptions of producers or
farmers, and on their efforts to enhance the positive factors and reduce or mitigate the
negative factors affecting them.
A systems review on the four species being studied under SEAT project, namely penaeid
shrimp, tilapia, freshwater prawn and striped catfish, of which this research was based
on, was conducted. Out of these four species, shrimp and tilapia emerged as the most
important in Thailand, in relation to trade and sustainability aspects.
Thailand aquaculture has both depth and breadth, as it can serve both the important
domestic markets with species which it could not export, such as tilapia, freshwater giant
prawn, and striped catfish, as well as the global market, as evidenced by its leadership in
shrimp production and exports. Seafood produced in Thailand, such as shrimp and tilapia,
are well-known to be of good or better quality than the other competing exporting
countries such as China. Although Zhang (2014) cited that one of the success factors of
Chinese tilapia in export market is its good texture and flavour. The traceability system
being implemented for shrimp production, processing and trade in Thailand should be
properly enforced, especially as it is being expanded to cover tilapia and other aquatic
species to be exported. This will ensure that quality of the products will be maintained,
however, if sustainability aspects will be considered, this is not enough.

320
Thailand has dominated the global shrimp industry for a number of years, starting with
black tiger shrimp since the early 80s, and then followed by the white shrimp in the mid
2000s. In Chapter 3, several factors were brought out pointing to reasons why Thailand
has become the global leader in shrimp production and exports. The long history of
Thailand in fish and shrimp farming provided a strong heritage of fish and shrimp culture
expanding to other related activities (Edwards, 2011; Falvey, 2000; FAO, 2009). The
development of seed production techniques and backyard hatcheries provided sufficient
supply to the growout sector supporting its development (Belton and Little, 2008;
Kongkeo and Davy, 2010; Little and MacNiven, 2001; Little et al., 2002; New and Kutty,
2010). The strong institutional support from both public and private entities, especially in
the technical, financial, trade, marketing and traceability aspects further spurred the
development of the shrimp industry. In addition, private sector initiatives to form farmer
clubs and associations, with support from government such as the Department of
Fisheries encouraged learning and sharing of know-how (Lebel et al., 2009). The
expansion and upgrading of other related sectors supported growout production and
processing activities, such as agricultural feed companies to produce quality aquaculture
feeds, cold storage facilities from capture fisheries processing aquaculture products (basic
and value-added). A well-developed infrastructure, for transport, communications and
logistics, enabled efficient delivery of inputs and products throughout the nodes of the
value chain. Likewise the proactivity of the various sectors, such as technological
innovations in growout production for more efficiency in feeding, water management,
and energy, and responding to global requirements led by the Thai Government
(Yamprayoon and Sukhumparnich, 2010) provided quality products for exports.

321
Regarding the potential of tilapia for exports, the existing demand could not be met,
according to processors, unless tilapia production is intensified in the existing areas.
Water quality and availability continue to be issues that farmers face, and in cage systems
in rivers, this will require coordination among various government departments such as
the Royal Irrigation Department and Pollution Control Department, the sub-district
administration organization and local farmers’ groups (aquaculture and non-aquaculture),
with the Department of Fisheries. With the main competitor, China facing labour shortage
problems in the near future (Zhang, 2014), Thailand could exploit this situation to its
advantage as long as it complies to the certification standards. The issue of off-flavour in
tilapia will remain a constraint for the processors if farmers could not produce on-flavour
tilapia, especially if they do not see the importance of investing capital and management
to improve their systems. Research being undertaken by the private sector in developing
lined and shaded production systems to produce on-flavour fish will be useful but
requires high capital investments.
Narrowing down to the production part, the study looked at the current systems being
followed by the producers in their farms, and the framework of presentation was
according to the guidelines of the global standards and certifications for shrimp and
tilapia farms as described in Chapters 4 and 5. In addition to describing the operations,
following this framework allowed us to see the level of compliance of these farms to
these guidelines, including their motivation to comply and the constraints for low or lack
of compliance.

322
With disease as the most important factor pointed out by shrimp stakeholders, the Early
Mortality Syndrome (EMS) that has affected Thailand since 2012 seemed to threaten the
sustainability of the shrimp farming industry, at all nodes of the shrimp value chain. The
low supply of raw materials to processing plants, due to low production as a high number
of farms were not producing, or the production was too small in volume and individual
shrimp size for the export market, have affected many actors in the value chain,
especially labour and price. And yet a number of farmers continue to produce, while
imports of shrimp have increased to provide raw materials for the processing sector so
they could meet orders for exports. Thai farmers are more resilient to shocks (Kruijssen et
al., 2013) and the concerted efforts of both public and private sectors in working together
to overcome the negative effects of EMS could help them to sustain until the EMS issue is
resolved.
The issues faced by producers, such as costs involved in complying with standards, need
to be considered, especially if they require a large farm area and high capital investments
in order to comply. Other issues could be related to technical capacity, such as analysis of
water quality parameters which are complicated and require investment in on-farm
equipment, and efficient record keeping. These can be rectified by providing training and
mentoring to ensure understanding of the methodologies or the reasons for doing them.
A more difficult issue is on labour aspects especially the employment of migrant labour
who do not have the proper documentation, and the other legalities required such as
registration period set by the government.
323
Those downstream of the value chain, especially certifiers, standard setters including
consumers and the media need to understand the situation of producers in order to avoid
misinterpretation and giving negative publicity or judgment on aquaculture products
which are being exported. One illustration is regarding the working conditions in shrimp
farms, wherein all the shrimp farm workers (Thais and migrants) considered themselves
better-off. The positive outcomes and benefits received as per the QOL framework are
currently not considered by standards setters, as well as the efforts of the employers to
provide the best for their workers.
Standards and certifications have also been criticized in that the companies that run them
have leaned towards their own business interests such as gaining market share rather
than the interests of both the producers and consumers (Steering Committee of the
State-of-Knowledge Assessment of Standards and Certification, 2012). Global
certifications will need to expand their knowledge base and in order to succeed in the
Southeast Asia, it is necessary to recognise the small-scale producers and their capacity
and efforts to comply with the standards (Wilkings, 2012). Vandergeest (2007), for
example, found that local communities and governments are effective in regulating
shrimp farming in South Thailand, thus it is necessary to obtain their inputs or (give them
a voice) on these standards that they have to comply with.
In order for a certification standard to be considered as a tool for “holistic sustainability”,
all the actors in the value chain need to be considered, and not just a few, since standards
and certifications ideally should benefit all of the actors. The perceived dominance of
324
voices from the North to gain control over producers in the South, could lead to exclusion
of the smaller producers in trade participation (Belton et al., 2011).
Labour in shrimp farms is also considered critical and important, although this is one
factor that producers can still manage i.e. to find workers, compared with disease and
market factors which are beyond their control. Farm operators go to great lengths to
identify and manage workers who will stay and do the best job possible, as described in
Chapter 5. Shrimp farms need well-motivated and trained people at the pond side most
of the time to take care of the stock due to the high investment cost and high value of
shrimp. Both farm operators and farm workers have a stake in each pond and they risk
losing money if it is not well-managed, therefore it is not economically sustainable. The
technical complexity of shrimp farming as described in Chapter 4 requires a high level of
management and dedication on the part of workers assigned to each pond.
The issue that the international community, especially the importers, consumers and the
media have been clamoring about re: exploitative working conditions of workers in
“shrimp farming industry” is focused on one very small part of a very long value chain i.e.
peeling sheds, and ignored moves to better practices elsewhere (such as in the farms as
this research has revealed). Most of the reports are based on the downstream sector of
shrimp pre-processing and processing. Reports like these are like wake-up calls to the
local authorities and regulators, to right what is wrong as part of the issues related to
ethical supply chain management and its many challenges. One example is the Rana Plaza
disaster in Bangladesh in April 2013, where it exposed the superficiality of standards
designed to protect the vulnerable. Now ILO is facilitating the Government of Bangladesh
325
together with employers, trade unions and the international community to ensure that
the incident will not be repeated in the future (ILO, 2014). They should also include the
garment factory workers in these discussions in order to know their concerns so they can
be addressed.
There was a need to also look at the shrimp farm workers in order to fill the information
gaps regarding workers conditions, including migrant labour. Thus this research
investigated the quality of life of shrimp farm workers, based on their perceptions as well
as the QOL assessment mentioned by Costanza et al. (2007) and Petrosillo et al. (2013).
Other issues which are oriented towards the welfare of the shrimp farm workers in
particular and which have been used by the negative publicity include the low wages and
the bad living and working conditions in the shrimp farms (Resurreccion and Sajor, 2011).
However, the findings in this study as reported in Chapter 5 through the perceptions of
the workers interviewed have shown that they considered themselves better-off or much
better-off than in previous employments or situation in their own countries. The
description of their working and living conditions followed the framework of the global
standards and certifications for human resources, which farms employing legal migrant
workers are compliant to. Kruijssen et al. (2013) also confirms with the farm migrant
workers interviewed expressing their happiness to work in aquaculture farms in Thailand.
However a cautionary approach has to be taken in taking the responses as a general
indication of shrimp farm worker status as some of the worker interviews were
conducted with the employers present.
326
Thailand’s long term exposure and integration with global markets which began with
processing wild caught stocks (capture fisheries) led to diversification with processing
aquaculture species for export. The openness of Thailand to outside investments and the
transfer and then development of indigenous expertise, for example shrimp hatchery
technology from Japanese/Taiwanese experts, including the investments from Thai
agribusiness companies, all contributed to make Thai aquaculture industry attractive for
business as well as for employment. Migrant workers from poorer neighbouring countries
of Cambodia, Lao PDR and Myanmar consider Thailand as a land of opportunity, creating
a mass migration of both legal and illegal workers (Panam et al., 2008; Phouxay, 2008;
Vungsiriphisal et al., 2010). These countries are also within Thailand’s economic ‘orbit’ as
part of an integrating market for goods and services, traditionally through informal
border trade but now developing based around the ASEAN free trade zone. Thailand is
supporting development in those countries through remittances of cash and expertise,
thus any balanced analysis of the sustainability of Thai shrimp farming must take these
impacts into consideration.
Rural based employment has strengths over urban (processing) especially in a market
where skilled labour is at a premium, and workers can move to a better deal just nearby
or down the road. The vertically integrated tilapia production complex set-up by Grobest
company in Nakhon Phanom, Northeast Thailand is one example. The complex is in a
remote area, with an aqua feed mill, processing plant, offices, and production ponds and
cages along the Mekong River, with the nearest residential village about 1 km away. Their
workers come from northeast, the farthest is from a town 40 km away, and the company
campaigns for people to come back to their hometown to work, citing benefits such as

327
staying near their family and spending time with them more, eating together and better
quality of life. This is appealing to their ethical values map (Bremer et al., 2013) . This is a
better alternative than traveling down to an urban workplace more than 500 km away. In
looking for workers, Grobest choose those who are not into rice farming so they do not
take them away from farming livelihoods. They require labour but the workers still prefer
to go to Bangkok and nearby industrial areas. This is a similar trend with the findings of
Rigg (2013) wherein migration from farming communities to non-farm areas such as
Ayutthaya occurs for employment purposes.
Aspects of the global standards need to be encompassing the nature of Thai aquaculture
or in general Asian aquaculture. The emphasis in the standards is towards industrial
aquaculture, which might not be suitable for sustainable development, as it does not
consider a number of social and ethical issues. However, with the complexity of the
standards as they are now, it will need a simpler framework if more criteria will be added.
All throughout the study the main issues focused on the sustainability of shrimp and
tilapia production, as well as the perceptions of stakeholders on issues affecting their
operations. Certification standards do not cover actual Life Cycle Assessment (LCA) of
products therefore important environmental impact indicators such as greenhouse gas
(GHG) emissions, acidification, and eutrophication could not be determined. LCAs of
shrimp and tilapia farming industry showed that GHG emissions were higher in Thailand
than those in other countries (China, Vietnam) studied due to the fact that feeds used in
Thailand have a higher percentage of fishmeal included (Henriksson et al., 2014). This is
linked to the upstream capture fisheries to collect trash fish as raw materials for fishmeal,
328
which has high GHG emissions. If tilapia polyculture systems with carps and other aquatic
organisms were taken into consideration, there could be a possibility that the calculation
for GHG emissions will be lower, similar to China which yielded lower emissions from
tilapia-carp polyculture systems. Tilapia cage systems were also high in eutrophication
potential due to the excess nutrients from cages are released directly into the water body
environment.
With fishmeal production identified as a major hotspot, the certification standards have
also set a criteria regarding the use of feed, i.e. the use of protein feed ingredients from
terrestrial sources, fish processing and fisheries by-products and from responsibly
managed fisheries (ASC, 2012; GAA-BAP, 2013). It will be worth to benchmark whether
compliance to the standards would result in lower emissions to the environment.
Another aspect of environmental impact from shrimp farming is mangrove destruction.
Often times, when it comes to aquaculture, most people think only about the negative
impacts on the environment. This was due mainly to previous reports that shrimp culture
caused the destruction of mangroves and the coastal ecosystem (Lebel et al., 2002;
Miranda, 2010). Land Use and Land Use change (LULUC) are components of the LCA as
well, and mangrove destruction to accommodate shrimp farms implies higher carbon
emissions (PJG Henriksson et al., 2014). The Thai shrimp standards (ACFS, 2009), GAA-BAP
(2013) and GlobalGAP (2012) all have provisions related to mangrove areas and wetland
conservation, thus acknowledging the importance of these areas for marine ecosystems.
Shrimp farm operators are also aware of the importance, thus one of the large scale

329
farms even bought the land surrounding her shrimp farm so she could plant mangroves
and release crabs and other organisms.
Lately, other issues have come up due to the increasing awareness about food safety and
ethical production and consumption. Aside from animal welfare issues, there has been a
focus as well on the social aspects of aquaculture, such as workers’ rights and their living
and working conditions, social equity and power. The demand for safe and traceable
seafood products has resulted in the setting up of various standards, certifications, and
eco-labels to satisfy the consumers (Bush et al., 2013; Konefal and Hatanaka, 2011;
Roheim et al., 2012). Producers have to contend not only with the challenges on-farm
and marketing within the country, but also with foreign market demands, if their purpose
is to export their products. In addition, producers should not only concern about the
production and technical aspects but also the social dynamics with in the farm, especially
with regards to working and living conditions of workers and their families.
The demand for tilapia in the local market remains high, which could be one of the
limiting factors why, despite the Thai government’s efforts to promote the export of
tilapia, only about 10% of production is exported. Processors reported that their main
constraint is finding good quality tilapia, i.e. fish without off-flavour. However, many
farmers were not really aware about this issue as they were more concerned with water
quality and availability, disease and price. As the demand for tilapia increases, the price in
the local market also increases, thus producers would rather sell to local traders and/or
wholesalers rather than to processors. In addition, producers did not have to follow the
standards and certifications demanded by processors if they would just sell locally. For

330
producers the effort and cost in following the standards and certifications are not
comparable to the market price of their products. However if there is a premium price to
compensate for following the strict guidelines, the producers would surely follow them.
Thai tilapia producers change their production systems to respond to changing conditions
(Belton et al., 2009). Thai tilapia industry has strong sustainability attributes such as
resource use efficiency and appropriation of ecosystem space and services but these
were not considered in the development of a globally accepted tilapia certification
standard (Belton et al., 2010).
The demand for domestic consumption of shrimp has also grown as purchasing power
has grown. Tilapia could follow the same trend if a strong base in terms of domestic
demand could support export market development. However, the market for tilapia is
already quite differentiated, with cage products selling live fish, at a price higher than
what processors could offer, whereas manure fed pond fish have a lower price. China
could successfully export their tilapia due to its lower production cost, competitive prices,
large quantities of production resulting in a stable supply, among the reasons pointed by
Zhang (2014). Probably the main advantages of Chinese tilapia over Thai tilapia
production systems are the lower cost of production, availability of government subsidies
to improve farm system, and larger areas with enough water to support production.
7.2. Reflections on sustainability perceptions of shrimp and tilapia VC actors
The importance that stakeholders placed on various issues relating to sustainability of
their operations is different for each species, as described in Chapter 6. For shrimp, the
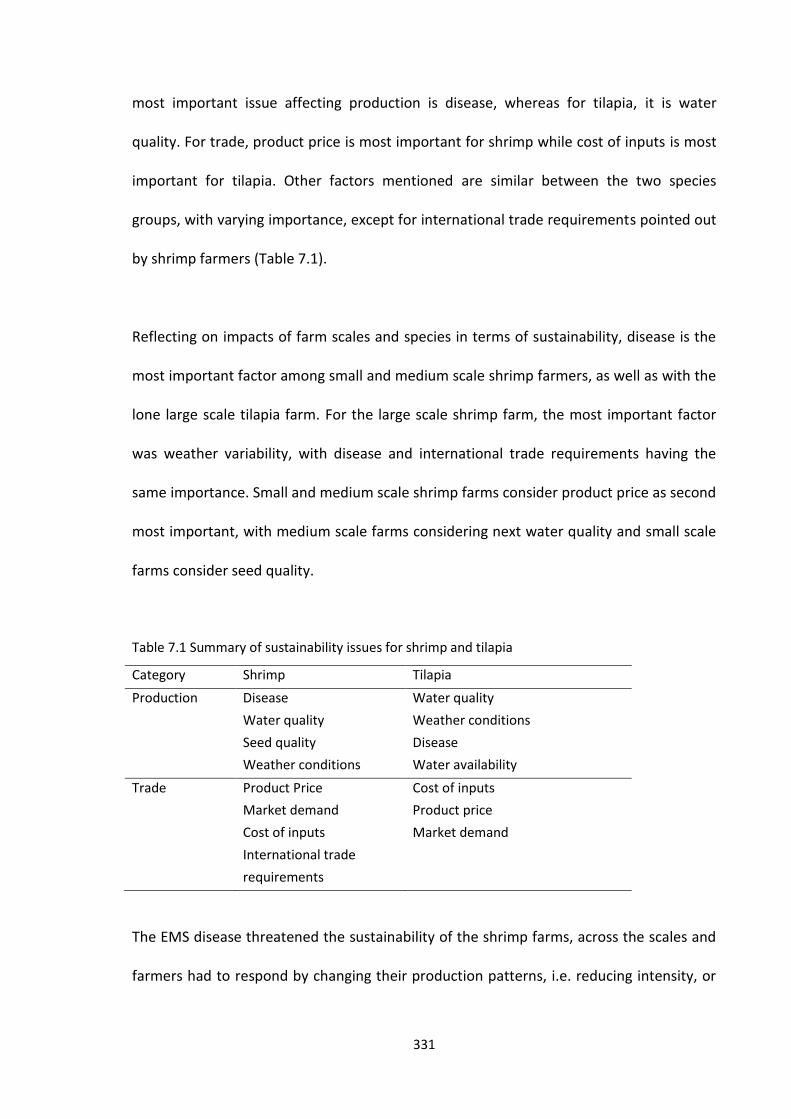
331
most important issue affecting production is disease, whereas for tilapia, it is water
quality. For trade, product price is most important for shrimp while cost of inputs is most
important for tilapia. Other factors mentioned are similar between the two species
groups, with varying importance, except for international trade requirements pointed out
by shrimp farmers (Table 7.1).
Reflecting on impacts of farm scales and species in terms of sustainability, disease is the
most important factor among small and medium scale shrimp farmers, as well as with the
lone large scale tilapia farm. For the large scale shrimp farm, the most important factor
was weather variability, with disease and international trade requirements having the
same importance. Small and medium scale shrimp farms consider product price as second
most important, with medium scale farms considering next water quality and small scale
farms consider seed quality.
Table 7.1 Summary of sustainability issues for shrimp and tilapia
Category Shrimp Tilapia
Production Disease Water quality
Water quality Weather conditions
Seed quality Disease
Weather conditions Water availability
Trade Product Price Cost of inputs
Market demand Product price
Cost of inputs Market demand
International trade
requirements
The EMS disease threatened the sustainability of the shrimp farms, across the scales and
farmers had to respond by changing their production patterns, i.e. reducing intensity, or

332
stopping culture, either temporarily or permanently. The importance of Thai shrimp in
global trade was affected, as production dropped, so did exports, and this resulted in
higher prices for those who could produce. The processing plants responded by importing
white shrimp from countries such as India, Malaysia, Myanmar and Bangladesh, for
around 13,600 T in 2013 (64% from Asian countries), which was 2.4% less than what was
imported in 2012 (TFFA, 2014).
For tilapia all farms scales considered water quality as the most important, with extreme
weather conditions and disease as the next most important for both small and medium
scale tilapia farms. Water supply and quality issues were also reported by Burana-osod et
al. (2013) as reasons affecting tilapia farmers’ operations.
The polyculture of tilapia with white shrimp has been reported to reduce or prevent EMS
occurrence in ponds in Vietnam (Tran et al., 2014). This production system is not new, as
several studies have been done to look at its potential (Yi and Fitzsimmons, 2004; Yi et al.,
2002), and in Thailand, farmers have been practicing it to augment the lower income they
obtain from tilapia and other species. This production system is also beneficial
ecologically as long as algal growth will be managed, and could be considered a more
sustainable choice (diversification) than highly intensive shrimp monoculture. The
carrying capacity of the system has to be taken into consideration to maintain ecological
balance, thereby making this system sustainable. However, certification and standards do
not cover this production system as yet so there is a question whether the shrimp and
tilapia from these systems will be acceptable for export.
333
In terms of technical efficiency and sustainability, Kruijssen et al. (2013) showed that the
sustainability concerns were similar for low, medium and highly efficient farms, wherein
environmental factors are the most important. Other important factors included market
supply and demand, input quality and production costs.
Environment and economic factors are considered important in the sustainability of
operations. However there is a need to also focus on the social aspects especially ethical
issues in production and trade, and how to shape guidelines for best practices and
certification standards based on values that the Thais consider are important (Bremer et
al., 2013). With the migrant workers as important members of the value chain, their
ethical values may need to also be determined to shape human resources guidelines as
well. This requires awareness among all actors of the sustainability concept in order that
they can assess their operations completely. The release of ILO of a manual on employing
foreign workers (Böhning, 1996) shows that migration for work is important. Migrant
workers have a role to play in the economy of their host countries, as they fill in the gap
brought about by labour shortages, as already seen in the case of Thailand. This is a
common phenomenon in labour intensive food production globally, such as the Eastern
Europeans in the United Kingdom (Parutis, 2011; Shubin and Dickey, 2013), Mexicans in
the United States (Sanderson, 2014), or in other parts of the world (Cobble, 2013).
Even the generational aspect of future continuity of the farming business by the children
of farmers and operators need to be considered.
334
7.3. Future perspectives and policy implications
The ASEAN Economic Community which will be implemented in 2015 in all the 10
countries in the ASEAN region will definitely have an impact on sustainable development
of the aquaculture industry in Thailand. Issues that need to be focused on include the
importance of migrant labour in Thailand, as well as the free trade of products including
those from aquaculture, which have food safety issues. Governance issues related to AEC
are discussed at the level of the intergovernmental agency such as the Association of
Southeast Asian Nations (ASEAN), and the readiness of each country to implement
policies at all levels might not be the same. Specifically, it will be beneficial to consider
how the implementation of the AEC in Thailand will affect migration in and out of
Thailand, and how this will impact the shrimp farm industry that is heavily dependent on
migrant labour. It is also worth to study the sustainability impact on the families and
communities of migrant workers, to quantify the perceived benefits reported by the
workers themselves.
The influx of migrant labour not only for shrimp farms but for all other jobs in Thailand for
migrant workers is a big challenge to the immigration policy of the Thai Government,
especially the presence of undocumented workers. As the importance of migrant workers
in Thailand continues to grow, the Thai Government really needs to consider all avenues
to curb illegal migration in order to reduce the opportunities for exploitation and violation
of migrant workers’ rights. This is a serious issue which involves many sectors of the Thai
Government, the neighbouring countries’ Governments, as well as international
organisations involved with labour issues, human rights, security, and trade, among
others.

335
The situation with EMS already has Thailand importing more raw materials to process to
meet orders from importing countries. The free trade area under the AEC will increase
the flow of food products including raw materials for processing into the country. There
needs to be a traceability system in place that is implemented in various countries in the
region. This has been the concern of the DoF as well as other relevant organisations,
because Thailand’s reputation for good quality food is at stake if there is no assurance of
food safety in other ASEAN countries which export raw material products to Thailand. As
a rule in processing and manufacturing, the raw materials may be mentioned in the
package labels, but the label indicating the manufacturer of the finished product should
be the country where the final processing takes place, in this case, Thailand. There should
be a clearer policy on traceability systems which will cover the upstream processes of raw
materials coming into Thailand for processing and re-export. This will require strong
cooperation and collaboration with supplying countries in complying with the traceability
system that adheres to international standards so the products will be acceptable.
Looking more specifically on the compliance to various standards and certifications, it will
be a bit difficult and more complicated for smaller scale farms to comply with them.
Complete compliance to these standards requires changes in current farming practices. It
will be easier to do if it does not entail costs such as capital investments, otherwise, the
producers will still be limited in their participation in trading their products for export.
The Government policy of farm registration for traceability and compliance to local
standards is basic for all farms, but are faithfully adhered to mainly by shrimp farmers as
they are considered requirements for exporting the products. This policy then is not
entirely followed by all farms as the majority of the farms do not participate in the export

336
trade anyway. A changed perception is therefore necessary, such that adherence to the
policy of traceability and standards should be more for improvement of production
systems to benefit farm, the environment and the community.
7.4. Critique of the methodology
Due to the broadness of the topic on sustainable development, this study was not able to
tackle all aspects. In addition, finding one specific framework for the whole thesis was not
possible thus several approaches were employed to suit the type of information and
analysis required.
The study attempted to give voice to other stakeholders who are otherwise not heard in
the scientific world, such as the shrimp farm workers, because in most literature, majority
of labour related issues concentrate on the labour in the processing or fisheries sector,
considering that there are major issues there that also need to be addressed. Securing
interviews with shrimp farm workers required permissions from employers, which is
common courtesy and ethics as the interviews occurred in the work place and using
workers’ time. Oftentimes, the employers and managers were also present in some of the
interviews, and it might or might not have affected the quality or depth of responses.
Ideally, interviews should have been conducted outside the workplace or without the
presence of employers or managers. However, interviewing farm workers without the
knowledge of the employers may not be considered ethical if interviews are conducted in
the work place. If the researcher has the luxury of time then it would have been useful to
337
live in the farms with the workers to observe and interact with them. This would still
require permissions from the employers.
Quantitative methods such as factor analysis and economic modeling especially in
relation to benefits were not employed in this research but technical production
efficiencies and livelihood indicators were analysed elsewhere (Kruijssen et al., 2013) on
the same survey respondents in this research i.e. farm operators only.
Although it was planned to apply the gender dimensions framework at the beginning for
all survey methods, this was still limited in the actual implementation of the research, as
it was a challenge to bring together various disciplines, for example in creating a
harmonised survey instrument that was balanced and not tedious to use, for both
enumerators and respondents. More efforts need to be placed to make sustainability
studies gender sensitive. Equipping aquaculture researchers with gender research tools
should be a priority.
The low response rate for some of the questions in the integrated farm surveys (IFS) was
quite noticeable. At the start of the interviews, as part of the ethical methodology, the
respondents were informed that their responses would be treated as confidential, and
that they were free to respond or not to the questions. The interviewers had to respect
respondents’ decisions if they decided not to respond. During the training of
enumerators, there were some suggestions on how to rephrase the questions in case
respondents did not respond at first, to try to coax them into giving responses. Another
reason based on observations was that the respondents during the integrated farm
338
surveys (IFS) got bored during the interviews due to the length of the questionnaire, thus
they did not respond to them and would keep asking how long until we finished the
interviews. As mentioned in Chapter 2, the IFS was not just for this research, but informed
all the other components of the SEAT project, which covered various topics.
7.5. Recommendations for future study
From this research, a number of emerging issues came up which are recommended to be
further studied, as follows:
The impact of aquaculture activities on the communities where farms and other value
chain activities are located need to be studied, specifically to determine the impacts on
the lives of the people living in the area as well as on their surrounding environment. In
addition, due to the major role of migrant/transnational workers, the impact of working
in Thailand on their lives, the lives of their families left behind, and the conditions in their
communities in their home countries may also need to be studied.
An alternative approach to interview shrimp farm workers outside their working area may
be necessary in order to complement their responses regarding their working conditions
and quality of life perceptions which were obtained within the farms and oftentimes in
the presence of their employers.
It is also recommended to focus on specific aspects from this research, for example
converting perceptions of well-being into quantitative terms as well as indices such as the
339
happiness index. For migrant workers, determining how much benefit their home
countries and their families obtain from migrant work in Thailand will be useful in adding
knowledge to the contribution of aquaculture in poverty alleviation and improving the
quality of life of the family of migrant workers in their home countries.
As already recognised, standards and certification schemes could not totally provide a
complete assessment of the sustainability of aquaculture systems. It is recommended
that aspects related to the environment be benchmarked with tools which measure
environmental impacts, for example Life Cycle Assessment (LCA), and footprinting (i.e.
ecological, carbon, water, other materials). The social aspects may need to include gender
aspects such as relational issues re: couples as workers, spouses as supporters and
children’s well-being. In terms of economics, the assumption is that farms are
economically viable for them to operate.
A comprehensive critical assessment of the various standards and certification schemes
affecting the Thai seafood industry is also recommended.
It is also proposed that sustainability factors obtained from this research be integrated
with the on-going work on formulating aquaculture sustainability indicators to measure
the sustainability of shrimp and tilapia aquaculture systems.
340
7.6. Conclusion
As a conclusion, the sustainability issues facing shrimp and tilapia aquaculture in Thailand
are varied, and oftentimes relative to the current situation they are facing now.
Nevertheless, these issues still fall under the various dimensions of sustainability, and are
to be considered for aquaculture systems to continue over the long term, at all farm
scales.
Environmentally, the efforts of farms to contain their wastes (effluent and sludge) and
not releasing them into the external environment, as well as using less chemicals, for
example, are beneficial and all fall under good and responsible aquaculture practices.
However, the practice of stocking at very high densities, for example in shrimp farms,
might challenge the carrying capacities of their systems. Production systems which are
disease-free, pathogen-resistant or controllable, with good quality water are ideal.
Various policies, guidelines and standards related to proper farm and environmental
management as well as animal welfare are in place and beneficial to the systems only if
they are adhered to. However environmental stability alone is not enough to warrant
sustainable operations.
The desire for higher economic gain drive farmers to go beyond what is required of the
systems in terms of inputs and resources to be used in the farms, and this could adversely
affect their operations. Upstream related to costs of inputs, and downstream in relation
to selling prices of products are all factors affecting decisions regarding farm
management. A balance in the use of resources will be beneficial to both the farm
environment and the people running the farm.
341
Socially, maintaining good family and social relationships extends to the way farmers
interact with their family members, employees, fellow farmers and other actors in the
aquaculture value chain. It also means providing people with equal access to things which
are needed to sustain their lives and enabling the quality of their lives to improve. In the
context of shrimp and tilapia aquaculture, this means that benefits from aquaculture
operations are shared with everyone involved i.e. employers and their workers. These
benefits also extend beyond them, to their families and communities, even beyond the
Thai borders, for the present and future.
Future generations of aquaculture farmers may not come solely from the original owners
of the farms, considering the present situation. However this trend could change if the
younger generation could see that aquaculture is a sustainable occupation.
Strong support from various institutions (government, non-government, civic
organisations, producer clubs, private sector) also contributes to strengthening
aquaculture activities, providing information and good guidelines to promote
sustainability.
Sustainable Thai aquaculture then could mean that the actors in the various nodes in the
value chain could continue to operate because the environment is ideal for their
operations and is not being exploited, resources are used within reasonable levels to
produce to meet market demand, economic benefits from operations are fairly shared
among those involved, social and family relationships maintained and harmonious, and
institutional and regulatory frameworks provide support to every node in the value chain.
342
All stakeholders have to consider themselves agents for change (Robertson, 2014) and
that each one has a role to play to achieve sustainability within their farm system, and in
the external environment as well.
343
8. BIBLIOGRAPHY
ACFS, 2009. Good Aquaculture Practices for Marine Shrimp Farm. R. Gaz. Vol. 126 Sect. 187D, Natl. Bur. Agric. Commod. Food Stand. Minist. Agric. Coop. 27.
ADB, 1996. Project Performance Audit Report on the Brackishwater Shrimp Culture Development Project (Loan No. 787-THA) in Thailand. Manila, Philippines.
Ahmed, N., Allison, E.H., Muir, J.F., 2010. Rice fields to prawn farms: a blue revolution in southwest Bangladesh? Aquac. Int. 18, 555–574.
AIT Outreach, 2000. Fish Seed Quality in Northeast Thailand State of the System Report. Asian Institute of Technology, Bangkok, Thailand. 23pp.
Amilhat, E., Lorenzen, K., Morales, E.J., Yakupitiyage, A., Little, D.C., 2009. Fisheries production in Southeast Asian farmer managed aquatic systems (FMAS) I. Characterisation of systems. Aquaculture 296, 219–226.
Apitoon Group, 2002. Apitoon Group [WWW Document]. URL http://www.apitoon.com/index.html (accessed 9.1.11).
ARCM/IAS/CU, 2013. Survey of Migrant Worker Employment Practices in the Thai Tuna Processing Sector. Asian Reserch Center for Migration, Institute of Asian Studies, Chulalongkorn University, Bangkok, Thailand. 34pp.
Arenas, M.C., Lentisco, A., 2011. Mainstreaming gender into project cycle management in the fisheries sector, RAP Public. ed. Food and Agriculture Organization of United Nations, Bangkok, Thailand. 92pp.
ASC, 2012. ASC Tilapia Standard, Version 1. Aquaculture Stewardship Council, Utrecht, The Netherlands. 44pp.
ASC, 2014. ASC Shrimp Standard V. 1.0 March 2014. Aquaculture Stewardship Council, Utrecht, The Netherlands. 144pp.
BAAC, 2009. Annual Report Fiscal Year 2009 (1 April 2009 to 31 March 2010). Bangkok, Thailand. 217pp.
Bamreurak, W., 2010. Status of Tilapia Export 2010, in: Thailand Aquaculture Association Conference. 20pp.
Banchun, Y., 2012. An Assessment of Farmers’ Strategies to Reuse and Renovate Abandoned Shrimp Ponds in Surat Thani Province, Thailand. MSc Thesis. Asian Institute of Technology, Thailand. 142pp.
Bangkok Companies, 2011. Thai Cold Storage Companies, Thai Cold Storage Equipment [WWW Document]. Ultim. Contact Database. URL http://www.bangkok-companies.com/categories/thai_companies_p558.htm (accessed 11.11.11).
Bangkok Post, 2012. Dirty hands of shrimp trade. Bangkok Post. 12 Dec 2012. Bartram, D., 2013. Happiness and “economic migration”: A comparison of Eastern
European migrants and stayers. Migr. Stud. 1, 156–175. Bell, S., Morse, S., 2008. Sustainability Indicators : Measuring the Immeasurable?, 2nd ed.
earthscan, London, UK. 228 pp. Belton, B., 2012. Culture, social relations and private sector development in the Thai and
Vietnamese fish hatchery sectors. Asia Pac. Viewp. 53, 133–146. Belton, B., Haque, M.M., Little, D.C., Sinh, L.X., 2011. Certifying catfish in Vietnam and
Bangladesh: Who will make the grade and will it matter? Food Policy 36, 289–299. Belton, B., Little, D., 2008. The Development of Aquaculture in Central Thailand :
Domestic Demand versus Export-Led Production. J. Agrar. Chang. 8, 123–143.
344
Belton, B., Little, D., Young, J., 2006. Red tilapia cage culture in central Thailand. Aquac. Asia Mag. 28–30.
Belton, B., Little, D.C., 2011. Immanent and Interventionist Inland Asian Aquaculture Development and its Outcomes. Dev. Policy Rev. 29, 459–484.
Belton, B., Murray, F., Young, J., Telfer, T., Little, D.C., 2010. Passing the Panda Standard: A TAD Off the Mark? Ambio 39, 2–13.
Belton, B., Turongruang, D., Bhujel, R., Little, D.C., 2009. The History , Status , and Future Prospects of Monosex Tilapia Culture in Thailand. Aquac. Asia Mag. XIV, 16–19.
Bhujel, R.C., 2009. Artificial Incubation, Hormonal Sex Reversal Promoted Tilapia Boom. Glob. Aquac. advocate 79–81.
Bhujel, R.C., 2011. How to Produce Billions of High Quality Tilapia Fry, in: Liu, L., Fitzsimmons, K. (Eds.), ISTA 9 Proceedings. pp. 123–131.
Bhujel, R.C., Woollard, M., 2011. Tilapia Farming Faces Expansion Issues In Thailand. Glob. Aquac. advocate 26–28.
Blanchet, K., Girois, S., 2013. Selection of sustainability indicators for health services in challenging environments: balancing scientific approach with political engagement. Eval. Program Plann. 38, 28–32.
Böhning, W.R., 1996. Employing Foreign Workers. International Labour Organization, Geneva. 104pp.
Bolwig, S., Ponte, S., Toit, A. du, Riisgaard, L., Halberg, N., 2010. Integrating Poverty and Environmental Concerns into Value-Chain Analysis: A Conceptual Framework. Dev. Policy Rev. 28, 173–194.
Boonbrahm, M., 1959. Report on the experiment on artificial fertilization of striped catfish at Nakhon Sawan Fisheries Station (Beungborapet). Fish. Gaz. 12, 15–18.
Boonchalaksi, W., Chamratrithirong, A., Huguet, J.W., 2012. Has Permanent Settlement of Temporary Migrant Workers in Thailand Begun? Asian Pacific Migr. J. 21, 387–404.
Bosma, R.H., Tendencia, E.A., Bunting, S., 2012. Financial Feasibility of Green-water Shrimp Farming Associated with Mangrove Compared to Extensive Shrimp Culture in the Mahakam Delta , Indonesia. Asian Fish. Sci. 25, 258–269.
Bostock, J., 2011. The application of science and technology development in shaping current and future aquaculture production systems. J. Agric. Sci. 149, 133–141.
Bostock, J., McAndrew, B., Richards, R., Jauncey, K., Telfer, T., Lorenzen, K., Little, D., Ross, L., Handisyde, N., Gatward, I., Corner, R., 2010. Aquaculture: global status and trends. Philos. Trans. R. Soc. Lond. B. Biol. Sci. 365, 2897–2912.
Boyd, C.E., 2003. Guidelines for aquaculture effluent management at the farm-level. Aquaculture 226, 101–112.
Boyd, C.E., Tucker, C., Mcnevin, A., Bostick, K., Clay, J., 2007. Indicators of Resource Use Efficiency and Environmental Performance in Fish and Crustacean Aquaculture. Rev. Fish. Sci. 15, 327–360.
Brandt, P., Ernst, A., Gralla, F., Luederitz, C., Lang, D.J., Newig, J., Reinert, F., Abson, D.J., von Wehrden, H., 2013. A review of transdisciplinary research in sustainability science. Ecol. Econ. 92, 1–15.
Bremer, S., Johansen, J.C., Gram, W., Haugen, A.S., Kaiser, M., 2013. Mapping Asian aquaculture stakeholders’ realities as “ethical landscapes”. Deliverable 8.10. SEAT-University of Bergen, Bergen, Norway. 129pp.
Briggs, M., Funge-Smith, S., Subasinghe, R., Phillips, M., 2004. Introductions and movement of Penaeus vannamei and Penaeus stylirostris in Asia and the Pacific, RAP
345
Public. ed, RAP publication 2004/10. Food and Agriculture Organization of the United Nations Regional Office for Asia and the Pacific, Bangkok, Thailand. 40pp.
Briggs, M.M., Funge-Smith, S., Subasinghe, R.P., Phillips, M., 2005. Introductions and movement of two penaeid shrimp species in Asia and the Pacific, FAO Fisher. ed, Organization. FAO, Rome. 99pp.
Burana-osod, P., Little, D., Murray, F., 2013. Evaluating change in tilapia-farmer business practices in Thailand and potential for improving sustainable feed management practices. MSc Thesis. University of Stirling, UK. 25pp.
Bush, S.R., Belton, B., Hall, D., Vandergeest, P., Murray, F.J., Ponte, S., Oosterveer, P., Islam, M.S., Mol, A.P.J., Hatanaka, M., Kruijssen, F., Ha, T.T.T., Little, D.C., Kusumawati, R., 2013. Certify Sustainable Aquaculture ? Science (80-. ). 341, 1067–1068.
Chaitrong, W., 2008. BAAC to support domestic shrimp consumption. The Nation. 17 Jan 2008.
Chareontawee, K., Poompuang, S., Na-Nakorn, U., Kamonrat, W., 2007. Genetic diversity of hatchery stocks of giant freshwater prawn (Macrobrachium rosenbergii) in Thailand. Aquaculture 271, 121–129.
Chayaburakul, K., Nash, G., Pratanpipat, P., Sriurairatana, S., Withyachumnarnkul, B., 2004. Multiple pathogens found in growth-retarded black tiger shrimp Penaeus monodon cultivated in Thailand. Dis. Aquat. Organ. 60, 89–96.
Chevron, 2014. The Power of Human Energy [WWW Document]. Chevron. URL http://www.chevron.com (accessed 4.28.14).
Clausen, J., Dalsgaard, A., Li, K., Satapornvanit, K., 2014. Food safety and occupational health in Thailand. SEAT Policy Br. 2pp.
Cobble, D.S., 2013. Gender Equality and Labor Movements : Toward a Global Perspective (The Transformation of Work: Challenged and Strategies). Solidarity Center, Washington, DC. 74pp.
Costanza, R., Fisher, B., Ali, S., Beer, C., Bond, L., Boumans, R., Danigelis, N.L., Dickinson, J., Elliott, C., Farley, J., Gayer, D.E., Glenn, L.M., Hudspeth, T., Mahoney, D., McCahill, L., McIntosh, B., Reed, B., Rizvi, S.A.T., Rizzo, D.M., Simpatico, T., Snapp, R., 2007. Quality of life: An approach integrating opportunities, human needs, and subjective well-being. Ecol. Econ. 61, 267–276.
CPF, 2008. Charoen Pokphand Foods PCL Website [WWW Document]. URL http://www.cpfworldwide.com/index_en.aspx (accessed 8.25.11).
CPF, 2012. Kitchen of the World-Annual Report 2012. Charoen Pokphand Foods Public Co., Ltd., Bangkok, Thailand. 144pp.
Davivongs, V., Yokohari, M., Hara, Y., 2012. Neglected Canals: Deterioration of Indigenous Irrigation System by Urbanization in the West Peri-Urban Area of Bangkok Metropolitan Region. Water 4, 12–27.
De Silva, S.S., Phuong, N.T., 2011. Striped catfish farming in the Mekong Delta, Vietnam: a tumultuous path to a global success. Rev. Aquac. 3, 45–73.
De Silva, S.S., Subasinghe, R.P., Bartley, D.M., Lowther, A., 2004. The introduction and distribution of tilapias in Asia and the Pacific, in: Tilapias as Alien Aquatics in Asia and the Pacifics: A Review. FAO, pp. 3–9.
DEP, 2011. Department of Export Promotion [WWW Document]. URL http://www.depthai.go.th (accessed 9.12.11).
346
Derks, A., 2010. Migrant Labour and the Politics of Immobilisation: Cambodian Fishermen in Thailand. Asian J. Soc. Sci. 38, 915–932.
Derks, A., 2013. Human Rights and (Im)mobility: Migrants and the State in Thailand. J. Soc. Issues Southeast Asia 28, 216–240.
Diallo, Y., Hagemann, F., Etienne, A., Gurbuzer, Y., Mehran, F., 2010. Global child labour developments: Measuring trends from 2004 to 2008. International Labour Office, International Programme on the Elimination of Child Labour (IPEC), ILO, Geneva. 44pp.
DOF, 2009. Statistics of Marine Shrimp Culture Survey 2007, 10/2009 ed. Department of Fisheries, Ministry of Agriculture and Cooperatives, Bangkok. 50pp.
DOF, 2010a. Freshwater Aquaculture Production Survey 2008. Department of Fisheries, Ministry of Agriculture and Cooperatives.
DOF, 2010b. Exports Data 2002-2009, Division of International Affairs-Department of Fisheries. Division of International Affairs-Department of Fisheries.
DOF, 2010c. Fisheries Statistics of Thailand 2008. Department of Fisheries, Ministry of Agriculture and Cooperatives, Bangkok, Thailand.
DOF, 2013a. Fisheries Statistics of Thailand 2011, Document 1. ed. Department of Fisheries, Ministry of Agriculture and Cooperatives, Bangkok, Thailand.
DOF, 2013b. Mitigation Measures for Management and Control of EMS/AHPNS Risk, Strengthening of Credibility for Thai Shrimp Industry. Bangkok, Thailand. 3pp.
DOF, 2013c. Aquaculture Development and Certification Center [WWW Document]. URL http://www.fisheries.go.th/thacert/index.php/about-us/68-admin. Date accessed Nov 2013
DOF-Economics, 2009. Report on Pangasius Production for December 2009 (In Thai). DOF-Economics, 2012. Status of Giant Freshwater Prawn 3Q 2012 (In Thai). Bangkok,
Thailand. DOF-Economics, 2013. Situation of Giant Freshwater Prawn in 2013. Bangkok, Thailand. DOF-Thai Customs Bureau, 2009. Quantity and Value of Various Shrimp Exports 2002-
2009. Bangkok, Thailand. Economics-DOF, 2011. Report on Pangasius in Thailand.(In Thai) Edwards, P., 2011. Recent developments and future prospects of inland aquaculture in
Asia. Aquac. Asia Mag. 3–10. Edwards, P., Hossain, M.S., 2010. Bangladesh Seeks Export Markets For Striped Catfish.
Glob. Aquac. advocate 61–62. Edwards, P., Little, D.C., Yakupitiyage, a, 1997. A comparison of traditional and modified
inland artisanal aquaculture systems. Aquac. Res. 28, 777–788. Edwards, P., Weber, K.E., McCoy, E.W., Chantachaeng, C., Pacharaprakiti, C.,
Kaewpaitoon, K., Nitsmer, S., 1983. Small-Scale Fishery Project in Pathumthani Province, Central Thailand: a Socio-economic and Technological Assessment of Status and Potential. Asian Institute of Technology, Bangkok, Thailand. 269 pp.
EJF, 2013a. The Hidden Cost: Human Rights Abuses in Thailand’s Shrimp Industry. Environmental Justice Foundation, London, UK. 32pp.
EJF, 2013b. Sold to the Sea - Human Trafficking in Thailand’s Fishing Industry. Environmental Justice Foundation, London, UK. 31pp.
Ekachai, S., 1990. Behind the Smile: Voices of Thailand. Thai Development Support Committee, Bangkok, Thailand. 197pp.
347
Ekins, P., 2011. Environmental sustainability : From environmental valuation to the sustainability gap. Prog. Phys. Geogr. 35, 629–651.
Falvey, L., 2000. Thai Agriculture: Golden Cradle of Millennia. Kasetsart University Press, Bangkok, Thailand. 490pp.
FAO, 2000. DNA-based Molecular Diagnostic Techniques: Research Needs for Standardization and Validation of the Detection of Aquatic Animal Pathogens and Diseases, in: Walker, P., Subasinghe, R. (Eds.), Report and Proceesings of the Joint FAO/NACA/CSIRO/ACIAR/DFID Expert Workshop, Bangkok, Thailand, 7-9 February 1999. FAO Fisheries Technical Paper No. 395. FAO, Rome, 93pp.
FAO, 2001. Field Level Handbook: Socio-Economic and Gender Analysis Programme. FAO, Rome. 140pp.
FAO, 2007. Supporting farmer compliance with private standards. Rome. 4pp. FAO, 2008. Yearbook of Fishery Statistics. Rome. FAO, 2009. National Aquaculture Sector Overview-Thailand [WWW Document]. FAO
Website. URL http://www.fao.org/fishery/countrysector/naso_thailand/en (accessed 9.25.11).
FAO, 2010. Report of the FAO – DOF Workshop on the Options for a Potential Insurance Scheme for Aquaculture iin Thailand, Organization. Rome. 143pp.
FAO, 2012. The State of World Fisheries and Aquaculture 2012. FAO Fisheries and Aquaculture Department, Food and Agriculture Organization of the United Nations, Rome. 230pp.
FAO, 2014. FishStatJ, A Tool for Fishery Statistics, V. 2.1.0 (Release date: March 2014). FAO Globefish, 2014. Shrimp - January 2014 [WWW Document]. FAO Globefish. URL
http://www.globefish.org/shrimp-january-2014.html (accessed 3.5.14). FAO-FishStatJ, 2011. FAO FishStatJ [WWW Document]. Date Accessed Oct 2011. Fegan, D., Fitzsimmons, K., 2008. Tilapia: Expanding Supply Meets Growing Global
Market. Glob. Aquac. advocate 46–49. Flaherty, M., Vandergeest, P., 1998. “Low-Salt” Shrimp Aquaculture in Thailand: Goodbye
Coastline, Hello Khon Kaen! Environ. Manage. 22, 817–830. GAA-BAP, 2013. BAP Standards, Guidelines for Finfish and Crustacean Farms, Rev. 4/13.
ed. Global Aquaculture Alliance, St. Louis, MO, USA. 34pp. Garbero, A., Muttarak, R., 2013. Impacts of the 2010 Droughts and Floods on Community
Welfare in Rural Thailand : Differential Effects of Village Educational Attainment. Ecol. Soc. 18, 1–18.
Gentle, J.E., 2003. Random Number Generation and Monte Carlo Methods, 2nd ed. Springer, New York.
GGCA, 2009. Training Manual on Gender and Climate Change. Global Gender and Climate Alliance (GGCA). 262pp.
Giovannucci, D., Ponte, S., 2005. Standards as a new form of social contract? Sustainability initiatives in the coffee industry. Food Policy 30, 284–301.
GlobalGAP, 2011. GLOBALG.A.P. Risk Assessment on Social Practice (GRASP) Module V 1.1. GlobalGAP, Cologne, Germany. 19pp.
GlobalGAP, 2012. GLOBALGAP Integrated Farm Assurance - Aquaculture Module: Control Points and Compliance Criteria, English Ed. ed. GlobalGAP, Cologne, Germany. 83pp.
Goss, J., Burch, D., Rickson, R.E., 2000. Agri-Food Restructuring and Third World Transnationals: Thailand, the CP Group and the Global Shrimp Industry. World Dev. 28, 513–530.
348
Grandstaff, T.B., Grandstaff, S., Limpinuntana, V., Suphanchaimat, N., 2008. Rainfed Revolution in Northeast Thailand. Southeast Asian Stud. 46, 289–376.
Gräslund, S., Holmström, K., Wahlström, a, Graslund, S., Holmstrom, K., Wahlstrom, A., 2003. A field survey of chemicals and biological products used in shrimp farming. Mar. Pollut. Bull. 46, 81–90.
GSJ-UBC, 2010. Cheap Shrimp: Hidden Costs [WWW Document]. URL http://www.internationalreporting.org/shrimp/ (accessed 9.2.11).
GTZ, 2007. Value Links Glossary, in: ValueLinks Manual – The Methodology of Value Chain Promotion. GTZ, pp. 1–7.
Han, H., Immink, A., 2013. A zonal approach for aquaculture sustainability. INFOFISH Int. 26–28.
Henriksson, P., Guinée, J., Satapornvanit, K., 2014. Fishmeal reduction in Thai aquaculture feeds. SEAT Policy Brief. University of Leiden/Kasetsart University, Leiden, Netherlands. 4pp.
Henriksson, P., Zhang, W., Nahid, S., Newton, R., Hai, D., Zhang, Z., Jaithiang, J., Andong, R., Chaimanukl, K., Son, V., Hien, H., Haque, M., Das, R., Kruijssen, F., Satapornvanit, K., Nguyen, P., Phan, L., Liu, Q., Liu, L., Wahab, M., Murray, F., Little, D., Guinee, J., 2014. Final LCA case study report. SEAT Deliverable D3.5. SEAT-Leiden University, Leiden, Netherlands. 182pp.
Holmstron, K., Graslund, S., Wahlstrom, A., Poungshompoo, S., Bengtsson, B.-E., Kautsky, N., 2003. Antibiotic use in shrimp farming and implications for environmental impacts and human health. Int. J. Food Sci. Technol. 38, 255–266.
Hoousiri, L., Pudtarn, N., 1992. Studies on Compost Production From Shrimp Pond Mud ( No. No. 3), Contribution Document. Chanthaburi, Thailand. 3pp.
Hossain, M.Z., Lin, C.K., 2001. Diversified Uses of Abandoned Shrimp Ponds: A Case Study in the Upper Gulf of Thailand, ITCZM Mono. ed, October. AIT, Bangkok, Thailand. 23pp.
Human Rights Watch, 2010. From the Tiger to the Crocodile: Abuse of Migrant Workers in Thailand. Human Rights Watch, NY, USA. 116pp.
ILO, 2012. Thailand’s Shrimp and Seafood Industry – a World Leader. ILO-Decent Work 1–2.
ILO, 2013a. Baseline Surveys on Child Labour in Selected Areas in Thailand. ILO/IPEC. 19pp.
ILO, 2013b. Thailand: A labour market profile, 1st editio. ed. ILO Regional Office for Asia and the Pacific, Bangkok. 73pp.
ILO, 2014. Towards a safer garment industry in Bangladesh [WWW Document]. ILO. URL http://www.ilo.org/global/about-the-ilo/activities/all/safer-garment-industry-in-bangladesh/lang--en/index.htm (accessed 4.29.14).
ILRF/WWU, 2013. The Walmart Effect: Child and Worker Rights Violations at Narong Seafood, Thailand’s Model Shrimp Processing Factory. CA, USA. 7pp.
Imai, K.S., Gaiha, R., Ali, A., Kaicker, N., 2014. Remittances, growth and poverty: New evidence from Asian countries. J. Policy Model. In Press. Available online: Feb 2014. http://dx.doi.org/10.1016/j.jpolmod.2014.01.009
Irwin, S., Elley, S., 2013. Parents’ hopes and expectations for their children's future occupations. Sociol. Rev. 61, 111–130.
Jespersen, K.S., Kelling, I., Ponte, S., Froukje, 2014. Institutional frameworks and the governance of aquaculture value chains: Lessons from Asia (In Press). Food Policy.

349
Jiwyam, W., 2010. Growth and compensatory growth of juvenile Pangasius bocourti Sauvage, 1880 relative to ration. Aquaculture 306, 393–397.
Kaewjantawee, P., 2007. Use of Bottom Soil from Giant Freshwater Prawn Pond for Chinese Kale Cultivation: Case Study of Don Yai Hom Sub-district, Muang District, Nakhon Pathom Province. Kasetsart University, Thailand. 73pp.
Kagawa, M., Bailey, C., 2006. Trade Linkages in Shrimp Exports: Japan, Thailand and Vietnam. Dev. Policy Rev. 24, 303–319.
Kanlapapuk, S., 2010. Feeding Ecology of Bocourti’s Catfish (Pangasius bocourti Sayvage, 1880) in Mekong River Neighboured to Nong Khai Province, Thailand (translated from Thai). Kasetsart University. 116pp.
Kaplinsky, R., Morris, M., 2000. A Handbook for Value Chain. IDRC. 113pp. Karaket, T., Poompuang, S., Na-Nakorn, U., Kamonrat, W., Hallerman, E.M., 2011. DNA
microsatellite-based evaluation of early growth performance among strains of freshwater prawn Macrobrachium rosenbergii de Man. Aquaculture 311, 115–122.
Klungboonkrong, A., 1991. Cost-benefit analysis comparison between giant fresh water prawn culture by the farmers who obtain and don’t obtain credit from BAAC in Kalasin Province. Khon Kaen Agric. J. 19, 212–217.
Konefal, J., Hatanaka, M., 2011. Enacting third-party certification: A case study of science and politics in organic shrimp certification. J. Rural Stud. 27, 125–133.
Kongkeo, H., 2007. Shrimp farming development and challenges in Thailand, including experiences and comparisons between P. vannamei and P. monodon, in: 8th Asian Fisheries Forum. Asian Fisheries Society. 17pp.
Kongkeo, H., Davy, F.B., 2010. Backyard Hatcheries and Small Scale Shrimp and Prawn Farming in Thailand, in: De Silva, S.S. De, Davy, F.B. (Eds.), Success Stories in Asian Aquaculture. NACA/Springer/IDRC, pp. 67–83.
Kritsanaphan, A., Sajor, E.E., 2011. Intermediaries and informal interactions in decentralised environmental management in peri-urban Bangkok. Int. Dev. Plan. Rev. 33, 247–272.
Kruijssen, F., Hong, M.C., Qasim, M., 2013. Livelihood implications of global seafood trade. Deliverable Report 5.8. SEAT Project. Sustaining Ethical Aquaculture Trade Project-WorldFish, Penang, Malaysia. 79pp.
Kusakabe, K., Pearson, R., 2013. Cross-border childcare strategies of Burmese migrant workers in Thailand. Gender, Place Cult. 1–19.
Lambooij, E., Gerritzen, M.A., Reimert, H., Burggraaf, D., Vis, J.W. Van De, 2008. A humane protocol for electro-stunning and killing of Nile tilapia in fresh water. Aquaculture 275, 88 – 95.
Laven, A., Eerdewijk, A. van, Senders, A., Wees, C. Van, Snelder, R., 2009. Gender in Value Chains Emerging Lessons and Questions. 13pp.
Laven, A., Verhart, N., 2011. Addressing gender equality in agricultural value chains : Sharing work in progress. Nijmegen, The Netherlands. 17pp.
Lebel, L., Garden, P., Luers, A., Manuel-Navarrete, D., Giap, D.H., 2009. Knowledge and innovation relationships in the shrimp industry in Thailand and Mexico. Proc. Natl. Acad. Sci. U. S. A. 1-6. DOI: 10.1073/pnas.0900555106
Lebel, L., Lebel, P., Garden, P., Giap, D.H., Khrutmuang, S., Nakayama, S., 2008. Places, Chains, and Plates: Governing Transitions in the Shrimp Aquaculture Production-Consumption System. Globalizations 5, 211–226.
350
Lebel, L., Mungkung, R., Gheewala, S.H., Lebel, P., 2010. Innovation cycles, niches and sustainability in the shrimp aquaculture industry in Thailand. Environ. Sci. Policy 13, 291–302.
Lebel, L., Tri, N.H., Saengnoree, A., Pasong, S., Buatama, U., Thoa, L.K., 2002. Industrial transformation and shrimp aquaculture in Thailand and Vietnam: pathways to ecological, social, and economic sustainability? Ambio 31, 311–23.
Lebel, P., Chaibu, P., Lebel, L., 2009. Women Farm Fish: Gender and Commercial Fish Cage Culture on the Upper Ping River, Northern Thailand. Gend. Technol. Dev. 13, 199–224.
Lightner, D. V., 2005. Biosecurity in Shrimp Farming: Pathogen Exclusion through Use of SPF Stock and Routine Surveillance. J. World Aquac. Soc. 36, 229–248.
Little, D., MacNiven, A., 2001. Report on the Regional Review Workshop for Fish Seed Quality in Asia Project, Quality. 26pp.
Little, D., Skladany, M., Rode, R., 1987. Smallscale hatcheries in Northeast Thailand. Aquac. Fish. Manag. 18, 15–31.
Little, D.C., Satapornvanit, A., Edwards, P., 2002. Freshwater Fish Seed Quality in Asia, in: Edwards, P., Little, D.C., Demaine, H. (Eds.), Rural Aquaculture. CABI Publishing, Oxford, UK, pp. 185–195.
Lorek, S., Vasishth, A., Zoysa, U. De, 2012. Transforming livelihoods and lifestyles for the well-being of all : a Peoples ’ Sustainability Treaty on Consumption and Production 8, 1–3.
LPN, 2011. Raiding Abusive Workplaces, 1st ed. Labour Rights Promotion Network, Samut Sakhon, Thailand. 28pp.
Lymer, D., Funge-Smith, S., Khemakorn, P., Nareupon, S., Ubolratana, S., 2008. A review and synthesis of capture fisheries data in Thailand - Large versus small-scale fisheries (I), 2008/17 ed. FAO Regional Office for Asia and the Pacific, Bangkok, Thailand. 51pp.
Mariojouls, C., Khumsri, M., Worawattanamateekul, W., 2004. Tilapia Cage Farming in Thailand: Industry Evolves From Integrated Company Programs. Glob. Aquac. Advocate 30–32.
Mayoux, L., Mackie, G., 2008. Making The strongest links: A practical guide to mainstreaming gender analysis in value chain development. Inernational Labour Organization. 113pp.
McAndrew, B., 1981. Electrophoretic Analysis of Tilapia from the Dusit Palace Stock, Thailand. Analysis 1–6.
McDevitt, T.M., Hess, C. a., Leesatayakun, M., Sheehan, E.P., Kaufeld, K. a., 2013. A Cross-Sectional Study of Career Aspirations in Thai Children in an International School in Bangkok. J. Career Dev. 40, 531–550.
McIntosh, R., 2008a. Advancing Shrimp Farm Technologies Support Greater Efficiencies, Sustainability. Glob. Aquac. advocate 88–90.
McIntosh, R., 2008b. Selective Breeding, High-Efficiency Seedstock Production Boost Integraated Shrimp Farming Performance. Global Aquaculture Advocate. May-June 2008: 73-74
McIntosh, R., 2008c. From Feeds to Farms. Global Aquaculture Advocate. January-Februray 2008: 63–65.
McIntosh, R., 2010. The True Cost Of Thai Shrimp. Glob. Aquac. Advocate. May-June 2010: 83–85.
351
McLoyd, V.C., Kaplan, R., Purtell, K.M., Huston, A.C., 2011. Assessing the Effects of a Work-Based Antipoverty Program for Parents on Youth’s Future Orientation and Employment Experiences. Child Dev. 82, 113–132.
Mekong River Commission, 2006. Gender and fisheries in the Lower Mekong Basin. 8pp. Merican, Z., 2007. Raising the bar. AQUA Cult. Asia Pacific Mag. 17–18. Ministry of Labour, 1998. Labour Protection Act B.E. 2541 (1998). Department of Labour
Protection and Welfare, Ministry of Labour, Bangkok, Thailand. 104pp. Ministry of Labour, 2012. Notification of the Wage Committee on Minimum Wage Rate
(No. 7). Gov. Gaz. 129, 4. Miranda, I.T., 2010. Farmed Pacific white shrimp: Thailand Final Report. Seafood Watch.
103pp. MOL, 2014. There Were 37.79 Million Employed People In January 2014 [WWW
Document]. Thail. Minist. Labour Website. URL http://www.mol.go.th/en/anonymouse/news/ 36399 (accessed 4.15.14).
Molland, S., 2012. Safe Migration, Dilettante Brokers and the Appropriation of Legality: Lao-Thai “Trafficking” in the Context of Regulating Labour Migration. Pac. Aff. 85, 117–136.
Moss, S.M., Moss, D.R., Otoshi, C.A., Arce, S.M., 2010. An integrated approach to sustainable shrimp farming. Asian Fish. Sci. 23, 591–605.
Murray, F., Zhang, W., Nietes-Satapornvanit, A., Phan, L.T., Haque, M.M., Henriksson, P., Little, D.C., 2011. Report on Boundary Issues. 83pp.
NACA, FAO, DoF, 2007. Expert Workshop on Guidelines for Aquaculture Certification. FAO Fisheries Technical Report, FAO Fisheries Technical Report. Food and Agricultural Organization of the United Nations, Rome. 60pp.
Na-Nakorn, U., Jintasataporn, O., 2012. Current status & prospects of farming the giant river prawn (Macrobrachium rosenbergii de Man 1879) in Thailand. Aquac. Res. 43, 1015–1022.
Na-Nakorn, U., Moeikum, T., 2009. Genetic diversity of domesticated stocks of striped catfish, Pangasianodon hypophthalmus (Sauvage 1878), in Thailand: Relevance to broodstock management regimes. Aquaculture 297, 70–77.
Nang’ole, E., Mithöfer, D., Franzel, S., 2011. Review of guidelines and manuals for value chain analysis for agricultural and forest products. ICRAF Occasional Paper No. 17. World Agroforestry Center, Nairobi, Kenya. 30pp.
Neiland, A.E., Soley, N., Varley, J.B., Whitmarsh, D.J., 2001. Shrimp aquaculture: economic perspectives for policy development. Mar. Policy 25, 265–279.
NESDB, 2014. Social Statistics [WWW Document]. Off. Natl. Econ. Soc. Dev. Board. URL http://www.nesdb.go.th/ (accessed 10 April 2014)
New, M.B., 2005. Freshwater prawn farming : global status , recent research and a glance at the future. Aquaculture 36, 210–230.
New, M.B., 2010. History and Global Status of Freshwater Prawn Farming, in: New, M.B., Valenti, W.C., Tidwell, J.H., D’Abramo, L.R., Kutthy, M.N. (Eds.), Freshwater Prawns Biology and Farming. Wiley-Blackwell, Oxford, UK, pp. 1–11.
New, M.B., Kutty, M.N., 2010. Commercial Freshwater Prawn Farming and Enhancement Around the World, in: New, M.B., Valenti, W.C., Tidwell, J.H., D’Abramo, L.R., Kutty, M.N. (Eds.), Freshwater Prawns: Biology and Farming. Wiley-Blackwell, Oxford, UK, pp. 346–399.
352
New, M.B., Valenti, W.C., Tidwell, J.H., D’Abramo, L.R., Kutty, M.N., 2010. Freshwater Prawns: Biology and Farming. Wiley-Blackwell. 570pp.
Norman-López, A., Bjørndal, T., 2009. Is Tilapia the Same Product Worldwide or Are Markets Segmented? Aquac. Econ. Manag. 13, 138–154.
OECD, 2013. How’s Life? 2013 Measuring well-being. http://www.keepeek.com/Digital-Asset-Management/oecd/economics/how-s-life-2013_9789264201392-en#page1. (Accessed 31 March 2014)
Olesen, I., Myhr, A.I., Rosendal, G.K., 2011. Sustainable Aquaculture: Are We Getting There? Ethical Perspectives on Salmon Farming. J. Agric. Environ. Ethics 24, 381–408.
Panam, A., Zaw, K.M.K., Caouette, T., Punpuing, S., 2008. Migrant Domestic Workers: From Burma to Thailand, in: Thaweesit, S., Vail, P., Sciortino, R. (Eds.), Transborder Issues in the Greater Mekong Sub-Region. Ubon Ratchathani, Thailand, pp. 305–333.
Pangasius Vietnam News, 2013. Thailand’s pangasius exports down, imports up. Pangasius Vietnam News. http://www.pangasius-vietnam.com/Daily-News/442_4448/Thailands-pangasius-exports-down-imports-up.htm (acessed July 16, 2013).
Parks, S., 2012. Divergent pathways of development: a comparative case study of human well-being in two Thai provinces. Environ. Plan. C Gov. Policy 30, 891–909.
Parutis, V., 2011. “Economic Migrants” or “Middling Transnationals”? East European Migrants’ Experiences of Work in the UK. Int. Migr. 52, 36–55.
Payooha, K., 2002. Impact of feeding strategies on the growth and flesh quality of striped catfish (Pangasius hypophthalmus). PhD Thesis. Asian Institute of Technology, Thailand. 183pp.
Payooha, K., Sahee, I., Indanon, C., Thongkaew, C., 2009. Hybrid pangasius culture for exportation in the Mekong River of Thailand: new challenge for Thai fish farmer, in: Asian-Pacific Aquaculture 2009.
Petrosillo, I., Costanza, R., Aretano, R., Zaccarelli, N., Zurlini, G., 2013. The use of subjective indicators to assess how natural and social capital support residents’ quality of life in a small volcanic island. Ecol. Indic. 24, 609–620.
Phan, L.T., 2014. Sustainable development of export-orientated farmed seafood in the Mekong Delta, Vietnam. Ph.D. Thesis. Institute of Aquaculture, University of Stirling, Stirling, UK.
Phan, L.T., Bui, T.M., Nguyen, T.T.T., Gooley, G.J., Ingram, B.A., Nguyen, H. V., Nguyen, P.T., De Silva, S.S., 2009. Current status of farming practices of striped catfish, Pangasianodon hypophthalmus in the Mekong Delta, Vietnam. Aquaculture 296, 227–236.
Phan, L.T., Nguyen, P.T., Francis, M.J., Little, D.C., 2011. State of system: key issues of target farmed species for export in the Mekong Delta, Vietnam. SEAT-Cantho University.
Phillips, M.J., 2002. Freshwater Aquaculture in the Lower Mekong Basin, MRC Techni. ed. Mekong River Commission, Phnom Penh. 62pp.
Phouxay, K., 2008. Consequences of Migration for Lao Migrant Workers in Thailand and their Families Left Behind in Lao PDR: A Case Study of Vientiane Capital, Khammoune and Savannakhet Provinces, in: Thaweesit, S., Vail, P., Sciortino, R. (Eds.), Transborder Issues in the Greater Mekong Sub-Region. Mekong Sub-region Social Research Center, Ubon Ratchathani University, Ubon Ratchathani, Thailand, pp. 273–304.
353
Pongthana, N., Nguyen, N.H., Ponzoni, R.W., 2010. Comparative performance of four red tilapia strains and their crosses in fresh- and saline water environments. Aquaculture 308, S109–S114.
Ponte, S., 2004. Standards and Sustainability in the Coffee Sector: A Global Value Chain Approach. International Institute for Sustainable Development, Manitoba, Canada. 52pp.
Ponte, S., Kelling, I., Jespersen, K.S., Kruijssen, F., 2014. The Blue Revolution in Asia : Upgrading and Governance in Aquaculture Value Chains (In Press). World Dev.
Ponzoni, R.W., 2008. GIFT Tilapia Technology for Successful Selected Strain Continues. Glob. Aquac. Advocate 50–51.
Ponzoni, R.W., Khaw, H.L., Yee, H.Y., 2010. GIFT: The Story Since Leaving ICLARM (now known as The WorldFish Center). Socioeconomic, Access and Benefit Sharing and Dissemination Aspects. Fridtjof Nansen Institute, Lysaker, Norway. 55pp.
Potaros, M., Sitasit, P., 1976. Induced Spawning Pangasius Sutchi (Fowler) ( No. 15), Technical Paper. Bangkok, Thailand. 14pp.
Prachachart, 2013. Thai shrimp have long pause in export (in Thai). Prachchart News.17 June 2013
Pratruangkrai, P., 2013. Shrimp exports on road to recovery. The Nation . 19 Dec 2013. Prell, C., Hubacek, K., Quinn, C., Reed, M., 2008. “Who”s in the Network?’ When
Stakeholders Influence Data Analysis. Syst. Pract. Action Res. 21, 443–458. Prompoj, W., 2013. Thailand Experience on Aquaculture Certification (presentation), in:
Workshop on Aquaculture Certification in Asia: Status, Challenges, Opportunities and Way Forward. VietFISH, Ho Chi Minh City, 46pp.
Pryck, J.D. De, 2013. Good practice policies to eliminate gender inequalities in fish value chains. Food and Agriculture Organization of United Nations, Rome. 120pp.
Psarikidou, K., Szerszynski, B., 2012. Growing the social : alternative agrofood networks and social sustainability in the urban ethical foodscape. Sustain. Sci. Pract. Policy 8, 30–39.
PTT, 2014. Creating Innovation for Sustainable Society [WWW Document]. PTT. URL http://www.pttplc.com/en/sustainability/Pages/sustainability.aspx (accessed 4.29.14).
Pullin, R.S.V., Froese, R., Pauly, D., 2007. Indicators for the Sustainability of Aquaculture, in: Bert, T.M. (Ed.), Ecological and Genetic Implications of Aquaculture Activities. Springer, pp. 53–72.
Purtell, K.M., McLoyd, V.C., 2013. Parents’ participation in a work-based anti-poverty program can enhance their children's future orientation: understanding pathways of influence. J. Youth Adolesc. 42, 777–791.
RASFF, 2010. Rapid Alert System for Food and Feed (RASFF) [WWW Document]. (accessed 10.15.10).
Reed, M.S., Graves, A., Dandy, N., Posthumus, H., Hubacek, K., Morris, J., Prell, C., Quinn, C.H., Stringer, L.C., 2009. Who’s in and why? A typology of stakeholder analysis methods for natural resource management. J. Environ. Manage. 90, 1933–49.
Resurreccion, B.P., 2010. Beyond Cloak Words, Toolkits, and Gender Myths: “Gender, Environment and Development” and Integrative Learning at the Asian Institute of Technology. Gend. Technol. Dev. 14, 67–87.
Resurreccion, B.P., Sajor, E.E., 2010. “Not a Real Worker”: Gendering Migrants in Thailand’s Shrimp Farms. Int. Migr. 48, 102–131.

354
Resurreccion, B.P., Sajor, E.E., 2011. Gender, Technology and Migration in Export-Production of Shrimps: Identity Formation and Labour Practices in Surat Thani Province, Thailand, in: Truong, T.-D., Gasper, D. (Eds.), Transnational Migration and Human Security, Hexagon Series on Human and Environmental Security and Peace. Springer Berlin Heidelberg, Berlin, Heidelberg, pp. 183–195.
Rico, A., Phu, T.M., Satapornvanit, K., Min, J., Shahabuddin, a. M., Henriksson, P.J.G., Murray, F.J., Little, D.C., Dalsgaard, A., Van den Brink, P.J., 2013. Use of veterinary medicines, feed additives and probiotics in four major internationally traded aquaculture species farmed in Asia. Aquaculture 412-413, 231–243.
Rico, A., Satapornvanit, K., Haque, M.M., Min, J., Nguyen, P.T., Telfer, T.C., van den Brink, P.J., 2012. Use of chemicals and biological products in Asian aquaculture and their potential environmental risks: a critical review. Rev. Aquac. 4, 75–93.
Rigg, J., 2006. Land, farming, livelihoods, and poverty: Rethinking the links in the Rural South. World Dev. 34, 180–202.
Rigg, J., 2012. Unplanned Development: Tracking Change in South-East Asia. Zed Books, London, UK. 240pp.
Rigg, J., 2013. From Rural to Urban: A Geography of Boundary Crossing in Southeast Asia. TRaNS Trans -Regional -National Stud. Southeast Asia 1, 5–26.
Rigg, J., Nattapoolwat, S., 2001. Embracing the Global in Thailand: Activism and Pragmatism in an Era of Deagrarianization. World Dev. 29, 945–960.
Rigg, J., Promphaking, B., Le Mare, A., 2014. Personalizing the Middle-Income Trap: An Inter-Generational Migrant View from Rural Thailand. World Dev. 59, 184–198.
Rigg, J., Salamanca, A., 2009. Managing risk and vulnerability in Asia: A (re)study from Thailand, 1982–83 and 2008. Asia Pac. Viewp. 50, 255–270.
Rigg, J., Veeravongs, S., Veeravongs, L., Rohitarachoon, P., 2008. Reconfiguring rural spaces and remaking rural lives in central Thailand. J. Southeast Asian Stud. 39, 355–381.
Rigg, J.D., 1986. The Chinese Agricultural Middleman in Thailand: Efficient or Exploitative? 1Singapore J. Trop. Geogr. 7, 68–79.
Rivera-Ferre, M.G., 2009. Can Export-Oriented Aquaculture in Developing Countries be Sustainable and Promote Sustainable Development? The Shrimp Case. J. Agric. Environ. Ethics 22, 301–321.
Robertson, M., 2014. Sustainability Principles and Practice. Routledge, Taylor & Francis Group, Oxon and NY. 392pp.
Roheim, C.A., Sudhakaran, P.O., Durham, C.A., 2012. Certification of Shrimp and Salmon for Best Aquaculture Practices: Assessing Consumer Preferences in Rhode Island. Aquac. Econ. Manag. 16, 266–286.
Sakaew, S., 2011. The Situation of Migrant Workers , Child Migrants , and Dependants in Samutsakhon Province. Samut Sakhon, Thailand. 2pp.
Sakaew, S., Tangpratchakoon, P., 2009. Brokers and Labor Migration from Myanmar: A Case Study from Samut Sakorn. Labour Rights Promotion Network (LPN)/Chulalongkorn University. 80pp.
Sanderson, M.R., 2014. Networks of capital, networks for migration: political-economic integration and the changing geography of Mexico-US migration. Glob. Networks 14, 23–43.
355
Satapornvanit, K., Murray, F., Little, D., Kuldilok, K., Srisapoome, P., Waley, D., Sritha, W., Nietes-Satapornvanit, A., 2011. State of the System Report: Sustaining Value Chains for Shrimp and Tilapia in Thailand. 119pp.
Satapornvanit, K., Waley, D., Little, D., 2014. Support sludge management and utilization in Thailand through appropriate guidelines. SEAT Policy Brief. 1–3.
Schwantes, V.S., Diana, J.S., Yi, Y., 2009. Social, economic, and production characteristics of giant river prawn Macrobrachium rosenbergii culture in Thailand. Aquaculture 287, 120–127.
SEAFISH, 2008. Seafood Export Profiles: Thailand. SEAFISH, London, UK. 13pp. SEAMEO-INNOTECH, 2012. K to 12 toolkit: Reference Guide for Teacher Educators, School
Administrators and Teachers. Department of Education, Phiilippines. 84pp. SEAT, 2009. Sustaining Ethical Aquaculture Trade : Description of Work (EU-FP7 Project
No. 222889). Project Document. 148pp. SEAT-KU, 2012. Sustaining Shrimp Value Chains in Thailand: a poster. Bangkok, Thailand. Sen, A., 1993. Capability and Well-Being, in: Nussbaum, M., Sen, A. (Eds.), The Quality of
Life. Oxford University Press, pp. 30–53. Shackleton, S., Paumgarten, F., Kassa, H., Husselman, M., Zida, M., 2011. Opportunities
for enhancing poor women’s socio-economic empowerment in the value chains of three African non-timber forest products ( NTFPs ). Int. For. Rev. 13, 136–151.
Shinatrakool, R., 2000. The Development of Science and Technology Education Planning in Vocational and Higher Educational Institutions, in: IWALT 2000 Proceedings. p.277
Shrimp News International, 2010. About Shrimp Farming [WWW Document]. shrimpnews.com. URL http://www.shrimpnews.com/About.html (accessed 8.13.10).
Shrimp News International, 2013. 80% to 90% of Shrimp Ponds Are Dry in Eastern Thailand [WWW Document]. shrimpnews.com. URL http://www.shrimpnews.com/ FreeReportsFolder/TheShrimpList/DryPondsInEasternThailand.html (accessed 1.16.13).
Shubin, S., Dickey, H., 2013. Integration and mobility of Eastern European migrants in Scotland. Environ. Plan. A 45, 2959–2979.
Silva, D.A.D. De, 2011. Value chain of fish and fishery products : origin, functions and application in developed and developing country markets. Food and Agriculture Organization. 63pp.
Singholka, S., New, M.B., Vorasayan, P., 1980. The Status of Macrobrachium Farming in Thailand, THA: 75/00. ed, Production. Food and Agricultural Organization of the United Nations, Bangkok, Thailand. 16pp.
Songsangjinda, P., Smithrithee, M., 2008. Thailand: Status of shrimp industries and strategies for supporting small scale shrimp farmer and their market access, in: Annual Project Meeting for ACIAR, 19-21 November 2008. NACA, Bangkok, Thailand, 25pp.
Sritha, W., 2007. Gender and farm management in technology-intensive shrimp farming in Surat Thani province, Thailand. Asian Institute of Technology. 56pp.
Steering Committee of the State-of-Knowledge Assessment of Standards and Certification, 2012. Toward sustainability: The roles and limitations of certification. RESOLVE, Inc., Washington, DC. 427pp.
Stickney, R.R., 1986. Tilapia Tolerance of Saline Waters: A Review. Progress. Fish-Culturist 48, 161–167.

356
Sukpanich, T., 2011. White shrimp farmers fight dark directive. Bangkok Post. 18 Sept 2011.
Sukphisit, S., 2010. Food for Export: Thailand’s agricultural resources are one of its greatest assets. Bangkok Post. 6 June 2010.
Sukphisit, S., 2011. Simply Irresistible - Jumbo prawns & shrimps [WWW Document]. News Room Tour. Auhthority Thail. (accessed 7 Sept 2011).
Suresh, A. V., Lin, C.K., 1992. Tilapia culture in saline waters : a review. Aquaculture 106, 201–226.
Szuster, B., 2006. Coastal Shrimp Farming in Thailand: Searching for Sustainability, in: Hoanh, C.T., Tuong, T.P., Gowing, J.W., Hardy, B. (Eds.), Environment and Livelihoods in Tropical Coastal Zones. CABI International, pp. 86–98.
Tabthipwon, P., 2008. Aquaculture development toward the sustainable and environmental management in Thailand. Feed Fertil. Technol. Cent. 1–13.
Tanticharoen, M., 2000. Thailand: Biotechnology for Farm Products and Agro-Industries, in: Persley, G.J., Lantin, M.M. (Eds.), Agricultural Biotechnology and the Poor: Proceedings of an International Conference, Washington, D.C., 21-22 October 1999. Consultative Group on International Agricultural Research, pp. 64–73.
Tanticharoen, M., Flegel, T.W., Meerod, W., Grudloyma, U., Pisamai, N., 2008. Aquacultural biotechnology in Thailand: The case of the shrimp industry. Int. J. Biotechnol. 10, 588–603.
TAT, 2008. Samut Sakhon (in Thai). Tourism Authority of Thailand, Samut Sakhon, Thailand. 30pp.
TFFA, 2010a. Thai Frozen Foods Association [WWW Document]. URL http://thai-frozen.or.th
TFFA, 2010b. Directory of TFFA Members. TFFA, Bangkok, Thailand. 156pp. TFFA, 2012. Thailand Seafood Industry Overview: The situation of Thai Shrimps in 2012
and its trend in 2013 [WWW Document]. Thai Frozen Foods Assoc. URL http://www.thai-frozen.or.th/thailand_seafood_02_en.php (accessed 3.24.14).
TFFA, 2014. Statistics [WWW Document]. Thai Frozen Foods Assoc. URL http://www.thai-frozen.or.th/ (accessed 3.19.14).
Thai Customs Department, 2014. Export Statistics [WWW Document]. Import-Export Stat. URL http://www.customs.go.th (accessed 3.15.14).
Thai Royal Gazette, 1997. Official Information Act, BE 2540 (1997). Thai R. Gaz. 114, 1–16. Thai Union Group, 2012. Thai Union Frozen Products PCL [WWW Document]. URL
http://www.thaiuniongroup.com/en/home.ashx (accessed 3.15.14). Thai Union Group, 2014. The World’s Seafood Expert. Thai Union Group, Bangkok,
Thailand. 63pp. Thakur, D.P., Yi, Y., Boromthanarat, S., Tansakul, V., 2010. Harvest Draining Associated
Mass Discharged from Intensive Shrimp Culture Pond : A Case Study of Commercial Shrimp Farms in Chachaengsao , Province of Thailand 23, 270–283.
The Nation, 2007. Betagro opens new feed mills. The Nation. 20 January 2007. The Nation, 2013. CPF to phase out fishmeal from shrimp feed. The Nation. 12 August
2013. The World Bank, 2012. Thai Flood 2011: Rapid Assessment for Resilient Recovery and
Reconstruction Planning. The World Bank, Bangkok, Thailand. 377pp. The World Bank, 2013. World Development Indicators. http://databank.worldbank.org/
data/home.aspx#s_g (accessed 31 March 2014).
357
Thongrak, S., Prato, T., Chiayvareesajja, S., Kurtz, W., 1997. Economic and Water Quality Evaluation of Intensive Shrimp Production Systems in Thailand. Agric. Syst. 121–141.
Thongrod, S., 2007. Analysis of feeds and fertilizers for sustainable aquaculture development in Thailand, in: M.R. Hasan, T. Hecht, S.S.D.S. and A.G.J.T. (Ed.), Study and Analysis of Feeds and Fertilizers for Sustainable Aquaculture Development. FAO, Rome, pp. 309–330.
Tookwinas, S., Chiyakum, K., Somsueb, S., 2005. Aquaculture of white shrimp Penaeus vannamei in Thailand, in: Regional Technical Consultation on the Aquaculture of P. Vannamei and Other Exotic Shrimps in Southeast Asia. SEAFDEC Aquaculture Department, Iloilo, Philippines, pp. 74–80.
Towers, L., 2013. Thailand Tilapia Production Forecast Up for 2013 [WWW Document]. Fish Site. URL http://www.thefishsite.com/fishnews/19750/thailand-tilapia-production-forecast-up-for-2013 (accessed 3.31.13).
Tran, L.H., Fitzsimmons, K., Lightner, D. V., 2014. Tilapia Could Enhance Water Condition, Help Control EMS in Shrimp Ponds. Glob. Aquac. Advocate, Jan-Feb 2014: 11–12.
Trethanya, S., Perera, R., 2009. Environmental Assessment for Small- and Medium-Scale Road Projects Implemented in Local Authority Areas : A Case Study from Thailand. J. Constr. Dev. Ctries. 14, 55–76.
UNIAP, 2011. Estimating Labor Trafficking: A Study of Burmese Migrant Workers in Samut Sakhon, Thailand. United Nations Interagency Project on Human Trafficking (UNIAP), Bangkok, Thailand. 61pp.
UNICEF, 2014. Quality of Education [WWW Document]. UNICEF-Education. URL http://www.unicef.org/thailand/education_15799.html (accessed 4.28.14).
UNRISD, 2012. Gendered Impacts of Globalisation: Employment and Social Protection. UNRISD Research and Policy Brief 13. United Nations Research Institute for Social Development, Geneva, Switzerland. 4pp.
US Department of State, 2013. Trafficking in Persons Report 2013. USA. 417pp. USAID, 2006. A Pro-Poor Analysis of the Shrimp Sector in Bangladesh. USAID-Greater
Access for Trade Expansion Project, Arlington, VA, USA. 93pp. USAID-MARKET, 2013. Steering Committee Meeting for the ASEAN Shrimp Aquaculture
Standards Project. Bangkok, Thailand. 73pp. Van Egmond, N.D., de Vries, H.J.M., 2011. Sustainability: The search for the integral
worldview. Futures 43, 853–867. Vandergeest, P., 2007. Certification and Communities: Alternatives for Regulating the
Environmental and Social Impacts of Shrimp Farming. World Dev. 35, 1152–1171. Vartiala, S., Purje, H., Hall, A., Vihersalo, K., Aukeala, A., 2013. Cheap Has A High Price,
1/2013 ed. Finnwatch, Helsinki. 14pp. Veliu, A., Gessese, N., Ragasa, C., Okali, C., 2009. Gender Analysis of Aquaculture Value
Chain in Northeast Vietnam and Nigeria. Agriculture and Rural Development Discussion Paper 44. The International Bank for Reconstruction and Development/The World Bank, Washington, DC. 158pp.
Vietnamese Fisheries Directorate, 2011. Review on the achievements of 2011plan and implementation of 2012 plan (in Vietnamese). Hanoi.
Vietnamese Fisheries Directorate, 2013. Review on the achievement of 2013 plan and implementation of 2014 plan (in Vietnamese). Hanoi.
Vungsiriphisal, P., Laodumrongchai, S., Eksaengsri, N., Ruengrojpitak, P., Makcharoen, P., Jitpong, W., 2010. Migrant recruitment from Cambodia and Laos into Thailand. Asian

358
Research Center for Migration, Institute of Asian Studies, Chulalongkorn University, Bangkok, Thailand. 213pp.
Walker, P.J., Mohan, C. V., 2009. Viral disease emergence in shrimp aquaculture: origins, impact and the effectiveness of health management strategies. Rev. Aquac. 1, 125–154.
Washington, S., Ababouch, L., 2011. Private standards and certification in fisheries and aquaculture: current practice and emerging issues, FAO Fisher. ed. Food and Agriculture Organization of United Nations, Rome. 181pp.
WCED, 1987. Towards Sustainable Development, in: Our Common Future: Report of the World Commission on Environment and Development. WCED, Oslo, pp. 41–59.
Weeratunge, N., Snyder, K. a, Sze, C.P., 2010. Gleaner, fisher, trader, processor: understanding gendered employment in fisheries and aquaculture. Fish Fish. 11, 405–420.
Whangchai, N., Ungsethaphand, T., Chitmanat, C., 2007. Performance of Giant Freshwater Prawn ( Macrobrachium rosenbergii de Man ) Reared in Earthen Ponds Beneath Plastic Film Shelters. Anim. Genet. 34, 89–96.
Whitmarsh, D., Palmieri, M.G., 2009. Social acceptability of marine aquaculture: The use of survey-based methods for eliciting public and stakeholder preferences. Mar. Policy 33, 452–457.
Whitmarsh, D.J., Cook, E.J., Black, K.D., 2006. Searching for sustainability in aquaculture: An investigation into the economic prospects for an integrated salmon–mussel production system. Mar. Policy 30, 293–298.
Wilkings, A., 2012. Fisheries and Aquaculture Certification: Implications for Southeast Asia. Social Sciences and Humanities Research Council in Canada, Ottawa. 26pp.
Woodhouse, P., 2010. Beyond Industrial Agriculture? Some Questions about Farm Size, Productivity and Sustainability. J. Agrar. Chang. 10, 437–453.
Wyban, J., 2007. Thailand’s White Shrimp Revolution. Glob. Aquac. advocate 56–58. Xie, S., Tian, L., Jin, Y., Yang, H., Liang, G., Liu, Y., 2014. Effect of glycine supplementation
on growth performance, body composition and salinity stress of juvenile Pacific white shrimp, Litopenaeus vannamei fed low fishmeal diet. Aquaculture 418-419, 159–164.
Yamprayoon, J., Noomhorn, A., 2003. Off-flavour in Nile Tilapia (Oreochromis niloticus)1111, in: Rimando, A.M., Schrader, K.K. (Eds.), Off-Flavours in Aquaculture. pp. 235–245.
Yamprayoon, J., Sukhumparnich, K., 2010. Thai Aquaculture: Achieving Quality and Safety through Management and Sustainability. J. World Aquac. Soc. 41, 274–280.
Yi, Y., Bolivar, R., Contreras-Sánchez, W., Fitzsimmons, K., 2002. Survey Study of and Stocking Densities for Tilapia-Shrimp Polycultures. Oregon. http:// pdacrsp.oregonstate.edu/pubs/workplns/wp_10/10NSR3.html (accessed 15.03.14).
Yi, Y., Fitzsimmons, K., 2004. Tilapia-Shrimp Polyculture in Thailand, in: ISTA 6 Proceedings. ISTA, Manila, Philippines, pp. 777–790.
Yoonpudh, R., Little, D., 1997. Trends in the Farming of the Snakeskin Gourami (Trichogaster pectoralis) in Thailand. Naga, ICLARM Q. 18–20.
Young, J. a., Little, D.C., Watterson, A., Murray, F., Boyd, K., Leschen, W., Kodithuwakku, S., 2010. Growing Green: the Emergent Role of Non-Tilapia Attributes in Marketing Tilapia. Aquac. Econ. Manag. 14, 63–79.
359
Zhang, W., 2014. Sustaining Export-Oriented Value Chains of Farmed Seafood in China. Ph.D. Thesis. Institute of Aquaculture, University of Stirling, Stirling, UK.
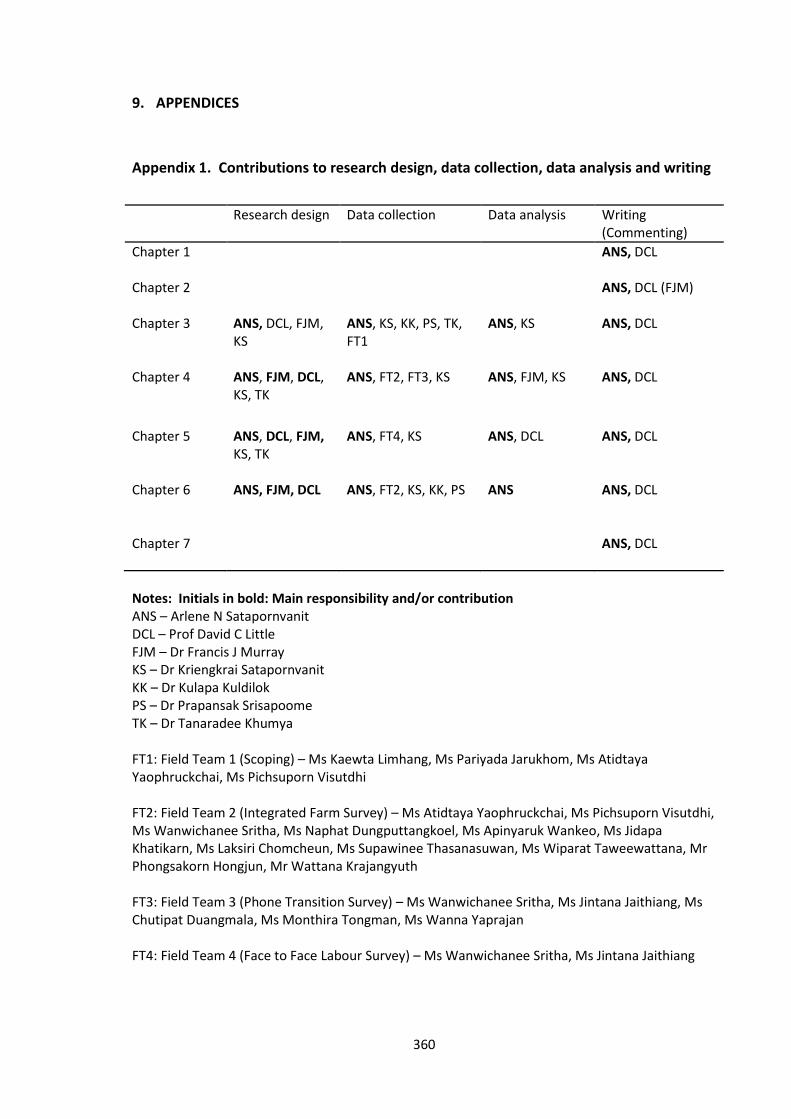
360
9. APPENDICES
Appendix 1. Contributions to research design, data collection, data analysis and writing
Research design Data collection Data analysis Writing (Commenting)
Chapter 1
ANS, DCL
Chapter 2
ANS, DCL (FJM)
Chapter 3
ANS, DCL, FJM, KS
ANS, KS, KK, PS, TK, FT1
ANS, KS
ANS, DCL
Chapter 4
ANS, FJM, DCL, KS, TK
ANS, FT2, FT3, KS ANS, FJM, KS ANS, DCL
Chapter 5
ANS, DCL, FJM, KS, TK
ANS, FT4, KS ANS, DCL ANS, DCL
Chapter 6
ANS, FJM, DCL
ANS, FT2, KS, KK, PS
ANS
ANS, DCL
Chapter 7
ANS, DCL
Notes: Initials in bold: Main responsibility and/or contribution ANS – Arlene N Satapornvanit DCL – Prof David C Little FJM – Dr Francis J Murray KS – Dr Kriengkrai Satapornvanit KK – Dr Kulapa Kuldilok PS – Dr Prapansak Srisapoome TK – Dr Tanaradee Khumya FT1: Field Team 1 (Scoping) – Ms Kaewta Limhang, Ms Pariyada Jarukhom, Ms Atidtaya Yaophruckchai, Ms Pichsuporn Visutdhi FT2: Field Team 2 (Integrated Farm Survey) – Ms Atidtaya Yaophruckchai, Ms Pichsuporn Visutdhi, Ms Wanwichanee Sritha, Ms Naphat Dungputtangkoel, Ms Apinyaruk Wankeo, Ms Jidapa Khatikarn, Ms Laksiri Chomcheun, Ms Supawinee Thasanasuwan, Ms Wiparat Taweewattana, Mr Phongsakorn Hongjun, Mr Wattana Krajangyuth FT3: Field Team 3 (Phone Transition Survey) – Ms Wanwichanee Sritha, Ms Jintana Jaithiang, Ms Chutipat Duangmala, Ms Monthira Tongman, Ms Wanna Yaprajan FT4: Field Team 4 (Face to Face Labour Survey) – Ms Wanwichanee Sritha, Ms Jintana Jaithiang

361
Appendix 2. Checklist on Scoping and Overview of Production Systems
General Questions:
Size
Scale
Ownership
Market Share
Species
System
Specialisation
Final market
Importance of business to the immediate local community
How did they got involved in this business
Labour profiles (gender, roles)
Constraints to sustainability of system (environmental, economic, social, institutional) WP3: Life Cycle Assessment (LCA)
What are the different components of the system?
Who are the people involved in this system (on-farm and off-farm)?
What are the interrelationships of these components, activities and people involved?
How intense are these interactions and relationships between and among them?
What are external factors (i.e. other activities outside) affecting the system?
WP5: Social and Economic Dynamics Global Value Chains (aka Value Chain, Marketing Chain, Supply Chain)
What is your role in the business? Why did you start? How has it changed?
What are your inputs and who are they from? (e.g. hatchery, feed)
To whom do you send your product? (e.g. farmers, traders)
Who tells you what to do? (e.g. retailers, governments, processers)
What do they require? (e.g. quality, price, standards, quantity, safety, timing)
What happens if you do not meet these requirements?
Who do you think has the most power in the value chain?
What benefits and training do you provide to staff?
What are the risks/problems/challenges you face?
What do you see happening in the future?
Are you concerned about environmental or social certification? Sustainable Livelihoods:
Is this activity the main source of income for you and your family?
Why did you start? What did you do before?
What are the benefits of this employment?
What alternatives do you have?
What are the risks/problems/conflicts you face?
Do you have any help to improve your activity? From who? How?
How has the aquaculture business changed since you started?
How does it need to change to increase the benefits to you in the future? Gender specific info:
Labour profiles (gender, roles)
How different are the wages between female and male labour? Why is there a difference, if any?
What are the hierarchies/stereotypes in the work place (farm, processing plant, office, etc.) that exist between women and men?

362
Who gets more benefit from the aquaculture business between women and men in the local community?
WP6: Food Safety and Public Health WP7: Assessment of Contamination Risks Farms
What chemicals are used at your farm and for what purpose and volume? (Type: E.g. Pesticides, disinfectants, antimicrobials, feed additives and volume of each listed chemical)
How do you obtain knowledge of how to use the chemical (E.g. label, training, retail shop etc.)
Have you had any problems with chemical use at your farm on:
Inspection authorities
Contamination of water source
Health issues for farmers/workers at the farm
Have you received any kind of certifications for your farm (National, International, GAPs, BMP, etc)
Farmers/workers: Which types of health problems do you see associated with different working tasks on the farm (Skin rash and/ wound infections or from handling of disinfections/other chemicals etc.)
Processors
What are your perceived main chemical and microbiological food safety issues/problems and their origin in the exported commodities?(E.g. salmonella, disinfections, other chemicals?)
Have you received any kind of certifications for your processing unit (National, International, GAPs, BMP, etc)?
What preventive measure do you have in place to address food safety issues?
Processing managers/workers: |What are the main health problems associated with working on a processing plant (Skin rash, wound infections, Back pain, head ache etc)
Government institutions
What are the national regulations on aquaculture food safety in your country for each of the selected species?
What are the main chemical biological and chemical contaminants you find in feed, aquatic produce, water quality from intensive aquaculture areas?
What certification systems do you have in place for ensuring food safety of aquaculture products (including farm level and processing level measures)?
What chemicals and drugs are banned from being used in aquaculture?
What are the main future challenges/problems you see for the sector in relation to use of chemicals and related environ mental and food safety issues?
WP8: Framing Key Values Within Ethical Framework
What are the consultation processes for standards and licensing? Who is consulted?
Do you have any data on socio-economic impacts of aquaculture?
How do you judge the available capacity for oversight?
What is your perception regarding the requirements for exporting aquatic foods to Europe? WP10: Transparency and utility of trade-related information
How do you access information about regulations in different markets?
How would you like to have such information made available for you/staff? WP11: Policy development and implementation
What is the cost of meeting the current requirements (testings, etc.)
What are the practical difficulties faced (i.e. unexpected inspector visits?)
What are some of the policies you would want to be implemented to ensure sustainability of your production and marketability?
January – July 2010
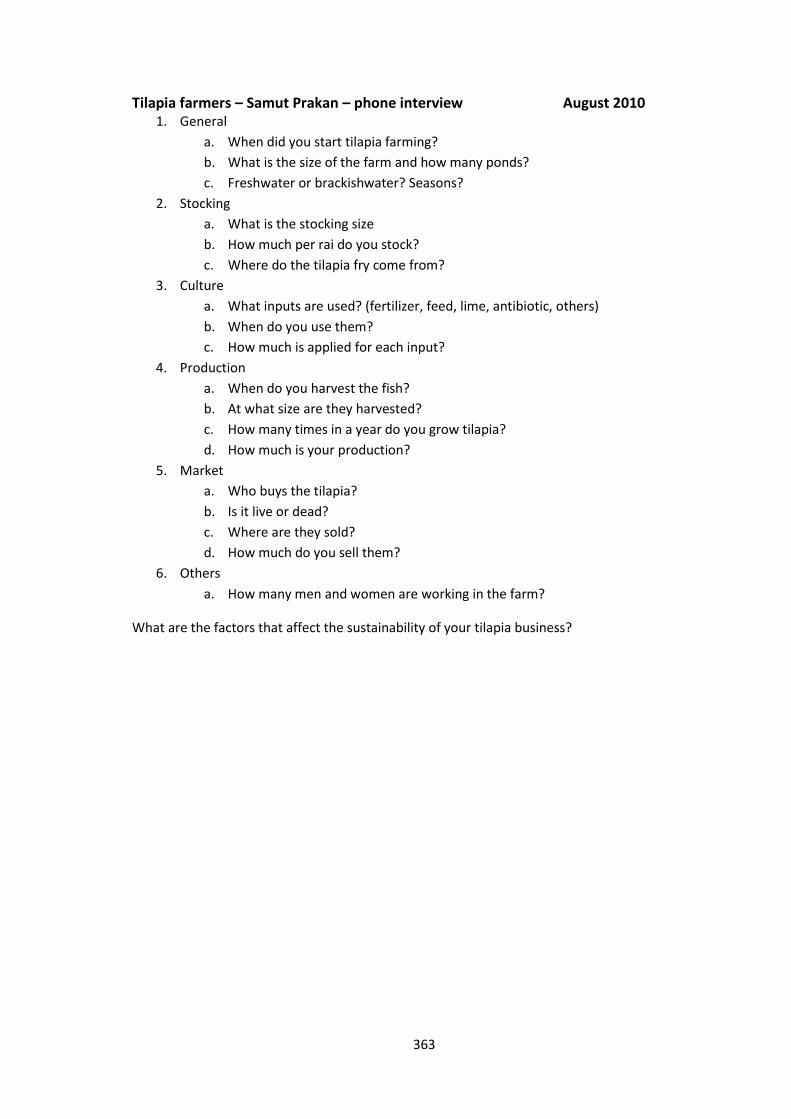
363
Tilapia farmers – Samut Prakan – phone interview August 2010 1. General
a. When did you start tilapia farming?
b. What is the size of the farm and how many ponds?
c. Freshwater or brackishwater? Seasons?
2. Stocking
a. What is the stocking size
b. How much per rai do you stock?
c. Where do the tilapia fry come from?
3. Culture
a. What inputs are used? (fertilizer, feed, lime, antibiotic, others)
b. When do you use them?
c. How much is applied for each input?
4. Production
a. When do you harvest the fish?
b. At what size are they harvested?
c. How many times in a year do you grow tilapia?
d. How much is your production?
5. Market
a. Who buys the tilapia?
b. Is it live or dead?
c. Where are they sold?
d. How much do you sell them?
6. Others
a. How many men and women are working in the farm?
What are the factors that affect the sustainability of your tilapia business?

364
Appendix 3. Details on key informant interviews for sample framing
Key informants (Nov 2010) Note: Information leading to identities were removed as per agreement with persons involved Location Name Contact Action
Tambon Bangkachai Amphur Laemsingh Chanthaburi
JK Shrimp Club
Key informant interview Ask contact info of kamnan
Tambon Nongchim Amphur Laemsingh Chanthaburi
SN Shrimp club
Key informant interview Ask contact info of kamnan
Tambon Huasai Amphur Bangkhla Chachoengsao
PJ Kamnan
Ask contact info of kamnans and/or puyai ban of the following: Tambom Thathongluang, Amphur Bangkhla Tambon Konkaew, King Amphur Klongkuean Tambon Bangkaew, Amphur Muang
Tambon Bangkabao Amphur Bansang Prachinburi
W&TD Aqua shop/tilapia farmer
Key informant interview Ask contact info of kamnan and head of tilapia farmers’ association
Amphur Phunphin Surat Thani
JC Key informant interview Ask contact info of kamnan and/or puyai ban of the following: Tambon Lilet, Amphur Phunphin Tambon Plaiwat, Amphur Kanchanadit Tambon Thathong, Amphur Kanchanadit
Guidelines: 1. Introduction – research project at KU under Dr. KS (SEAT in Thai) 2. Purpose of Key Informant Interviews – part of the sampling framework to know general aquaculture situation/profile of the tambon which was
randomly chosen for survey 3. Conduct the interview according to the KII form 4. Do we need to visit them for more detailed interview especially when we have randomly identified farmers? 5. Closing – thanks, ask if we can contact him again once we have randomly identified farmers
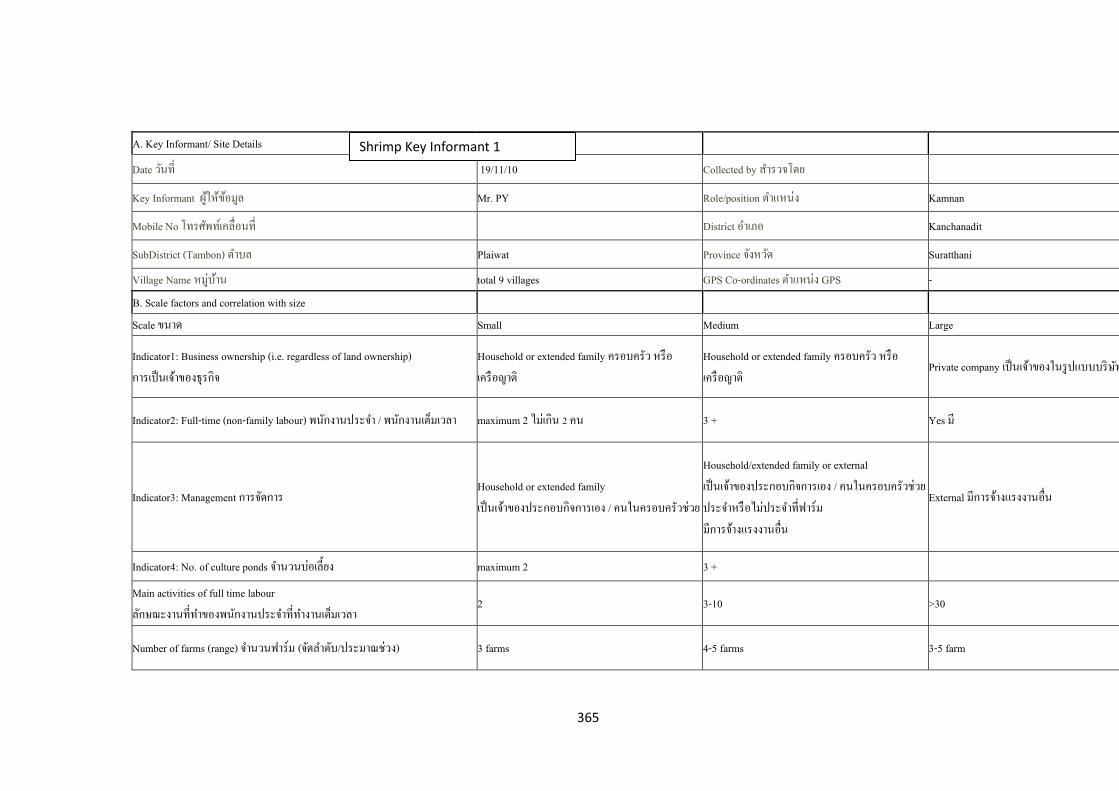
365
A. Key Informant/ Site Details
Date 19/11/10 Collected by ส ำร จโดย
Key Informant Mr. PY Role/position ำ Kamnan
Mobile No โ ร District ำ ภ Kanchanadit
SubDistrict (Tambon) ำบ Plaiwat Province จ ด Suratthani
Village Name บ ำ total 9 villages GPS Co-ordinates ำ GPS - B. Scale factors and correlation with size Scale ำด Small Medium Large
Indicator1: Business ownership (i.e. regardless of land ownership) ำร จ ำ ร จ
Household or extended family ร บ ร ร ร ำ
Household or extended family ร บ ร ร ร ำ
Private company จ ำ ร บบบร
Indicator2: Full-time (non-family labour) ำ ร จ ำ ำ ำ maximum 2 3 + Yes
Indicator3: Management ำรจ ด ำร Household or extended family จ ำ ร บ จ ำร ร บ ร ย
Household/extended family or external จ ำ ร บ จ ำร ร บ ร ย ร จ ำ ร ร จ ำ ำร ำรจ ำ ร ำ
External ำรจ ำ ร ำ
Indicator4: No. of culture ponds จ ำ บ ย maximum 2 3 +
Main activities of full time labour ำ ำ ำ ร จ ำ ำ ำ ำ
2 3-10 >30
Number of farms (range) จ ำ ำร (จ ด ำด บ ร ำ 3 farms 4-5 farms 3-5 farm
Shrimp Key Informant 1
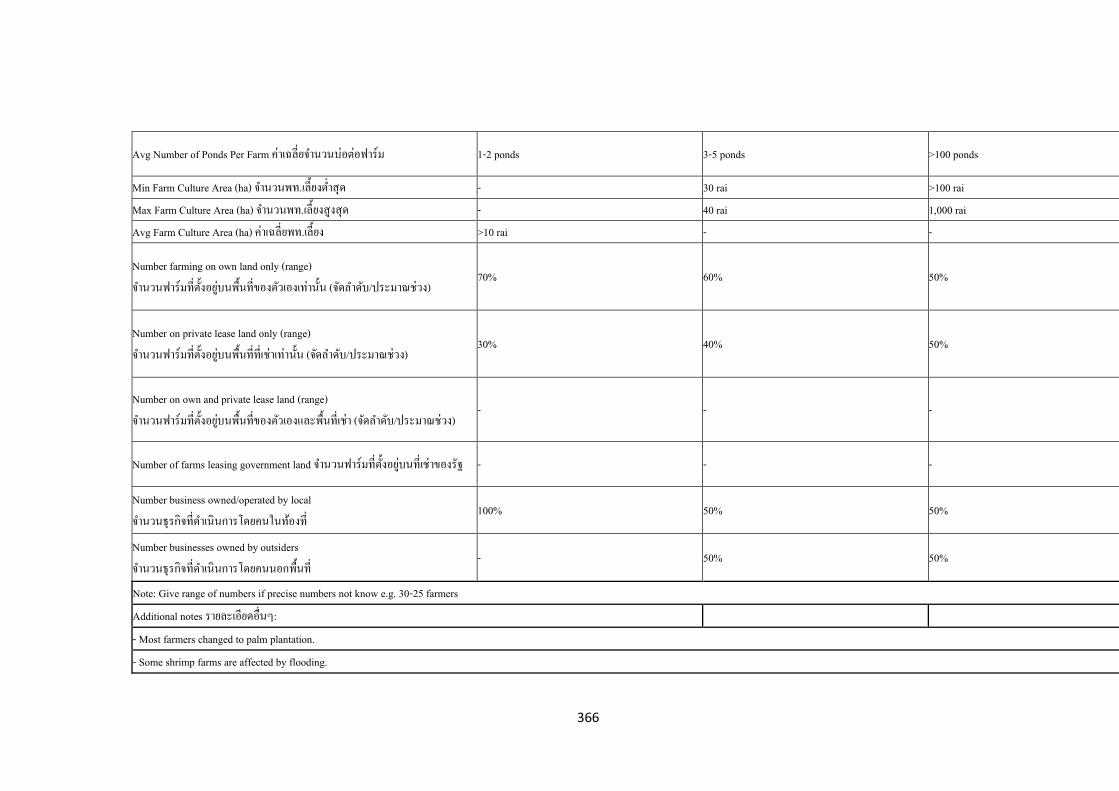
366
Avg Number of Ponds Per Farm ำ ยจ ำ บ ำร 1-2 ponds 3-5 ponds >100 ponds
Min Farm Culture Area (ha) จ ำ ย ำส ด - 30 rai >100 rai Max Farm Culture Area (ha) จ ำ ย ส ส ด - 40 rai 1,000 rai Avg Farm Culture Area (ha) ำ ย ย >10 rai - -
Number farming on own land only (range) จ ำ ำร ย บ ำ จ ด ำด บ ร ำ
70% 60% 50%
Number on private lease land only (range) จ ำ ำร ย บ ำ ำ จ ด ำด บ ร ำ
30% 40% 50%
Number on own and private lease land (range) จ ำ ำร ย บ ำ จ ด ำด บ ร ำ
- - -
Number of farms leasing government land จ ำ ำร ย บ ำ ร - - -
Number business owned/operated by local จ ำ ร จ ด ำ ำรโดย
100% 50% 50%
Number businesses owned by outsiders จ ำ ร จ ด ำ ำรโดย
- 50% 50%
Note: Give range of numbers if precise numbers not know e.g. 30-25 farmers Additional notes รำย ยด - Most farmers changed to palm plantation. - Some shrimp farms are affected by flooding.

367
A. Key Informant/ Site Details
Date 19/11/10 Collected by ส ำร จโดย
Key Informant Mr. CK Role/position ำ ำย บ
Mobile No โ ร District ำ ภ Kanchanadit
SubDistrict (Tambon) ำบ Plaiwat Province จ ด Suratthani
Village Name บ ำ total 9 villages GPS Co-ordinates ำ GPS - B. Scale factors and correlation with size Scale ำด Small Medium Large
Indicator1: Business ownership (i.e. regardless of land ownership) ำร จ ำ ร จ
Household or extended family ร บ ร ร ร ำ
Household or extended family ร บ ร ร ร ำ
Private company จ ำ ร บบบร
Indicator2: Full-time (non-family labour) ำ ร จ ำ ำ ำ maximum 2 3 + Yes
Indicator3: Management ำรจ ด ำร Household or extended family จ ำ ร บ จ ำร ร บ ร ย
Household/extended family or external จ ำ ร บ จ ำร ร บ ร ย ร จ ำ ร ร จ ำ ำร ำรจ ำ ร ำ
External ำรจ ำ ร ำ
Indicator4: No. of culture ponds จ ำ บ ย maximum 2 3 +
Main activities of full time labour ำ ำ ำ ร จ ำ ำ ำ ำ
1 labour per pond - 1 labour per pond
Number of farms (range) จ ำ ำร จ ด ำด บ ร ำ <20 farms - 12-15 farms
Shrimp Key Informant 2

368
Avg Number of Ponds Per Farm ำ ยจ ำ บ ำร 1-2 ponds - -
Min Farm Culture Area (ha) จ ำ ย ำส ด 3 rai - - Max Farm Culture Area (ha) จ ำ ย ส ส ด 5 rai - - Avg Farm Culture Area (ha) ำ ย ย - - >100 rai
Number farming on own land only (range) จ ำ ำร ย บ ำ จ ด ำด บ ร ำ
80% - 80%
Number on private lease land only (range) จ ำ ำร ย บ ำ ำ จ ด ำด บ ร ำ
20% - 20%
Number on own and private lease land (range) จ ำ ำร ย บ ำ จ ด ำด บ ร ำ
- - -
Number of farms leasing government land จ ำ ำร ย บ ำ ร - - some farms are in preservative land.
Number business owned/operated by local จ ำ ร จ ด ำ ำรโดย
100% - -
Number businesses owned by outsiders จ ำ ร จ ด ำ ำรโดย
- - 100%
- should have meeting with large farm scale. - large scale such as CP, seahorse, Mod Deang, Kung Nang, Coorperative of Suthep Therksuwan, CV, Pasert farm, Likit, Poonim, Num Surat.
- There are shrimp culture in Moo 1, 2, 3, 5, 6, and 8; Shrimp farms are not affected by flooding.
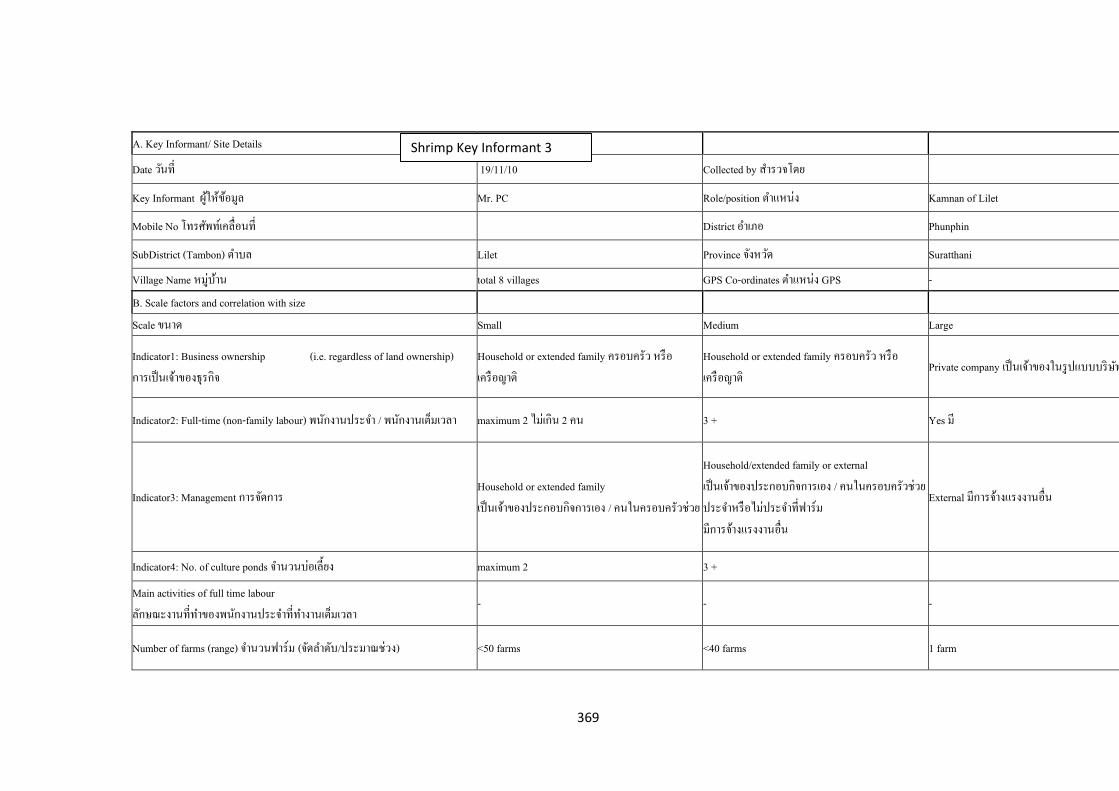
369
A. Key Informant/ Site Details
Date 19/11/10 Collected by ส ำร จโดย
Key Informant Mr. PC Role/position ำ Kamnan of Lilet
Mobile No โ ร District ำ ภ Phunphin
SubDistrict (Tambon) ำบ Lilet Province จ ด Suratthani
Village Name บ ำ total 8 villages GPS Co-ordinates ำ GPS - B. Scale factors and correlation with size Scale ำด Small Medium Large
Indicator1: Business ownership (i.e. regardless of land ownership) ำร จ ำ ร จ
Household or extended family ร บ ร ร ร ำ
Household or extended family ร บ ร ร ร ำ
Private company จ ำ ร บบบร
Indicator2: Full-time (non-family labour) ำ ร จ ำ / ำ ำ maximum 2 2 3 + Yes
Indicator3: Management ำรจ ด ำร Household or extended family จ ำ ร บ จ ำร / ร บ ร ย
Household/extended family or external จ ำ ร บ จ ำร / ร บ ร ย ร จ ำ ร ร จ ำ ำร ำรจ ำ ร ำ
External ำรจ ำ ร ำ
Indicator4: No. of culture ponds จ ำ บ ย maximum 2 3 +
Main activities of full time labour ำ ำ ำ ร จ ำ ำ ำ ำ
- - -
Number of farms (range) จ ำ ำร (จ ด ำด บ/ ร ำ ) <50 farms <40 farms 1 farm
Shrimp Key Informant 3
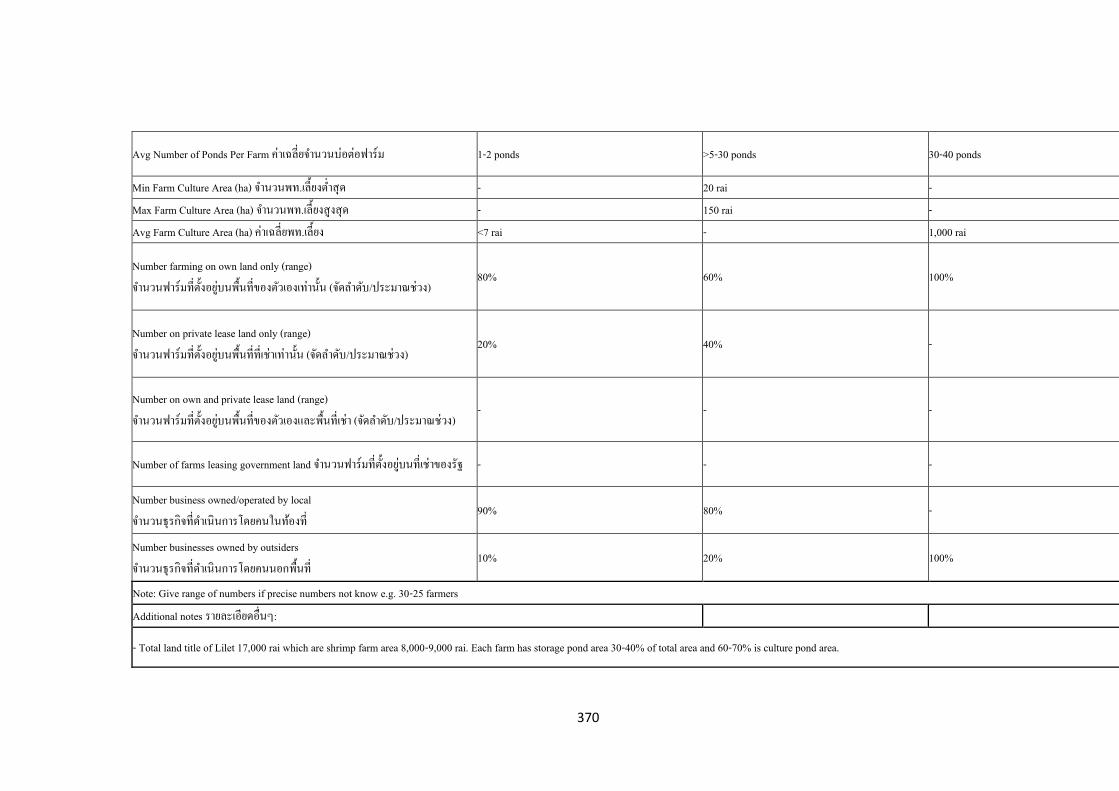
370
Avg Number of Ponds Per Farm ำ ยจ ำ บ ำร 1-2 ponds >5-30 ponds 30-40 ponds
Min Farm Culture Area (ha) จ ำ . ย ำส ด - 20 rai - Max Farm Culture Area (ha) จ ำ . ย ส ส ด - 150 rai - Avg Farm Culture Area (ha) ำ ย . ย <7 rai - 1,000 rai
Number farming on own land only (range) จ ำ ำร ย บ ำ (จ ด ำด บ/ ร ำ )
80% 60% 100%
Number on private lease land only (range) จ ำ ำร ย บ ำ ำ (จ ด ำด บ/ ร ำ )
20% 40% -
Number on own and private lease land (range) จ ำ ำร ย บ ำ (จ ด ำด บ/ ร ำ )
- - -
Number of farms leasing government land จ ำ ำร ย บ ำ ร - - -
Number business owned/operated by local จ ำ ร จ ด ำ ำรโดย
90% 80% -
Number businesses owned by outsiders จ ำ ร จ ด ำ ำรโดย
10% 20% 100%
Note: Give range of numbers if precise numbers not know e.g. 30-25 farmers Additional notes รำย ยด :
- Total land title of Lilet 17,000 rai which are shrimp farm area 8,000-9,000 rai. Each farm has storage pond area 30-40% of total area and 60-70% is culture pond area.
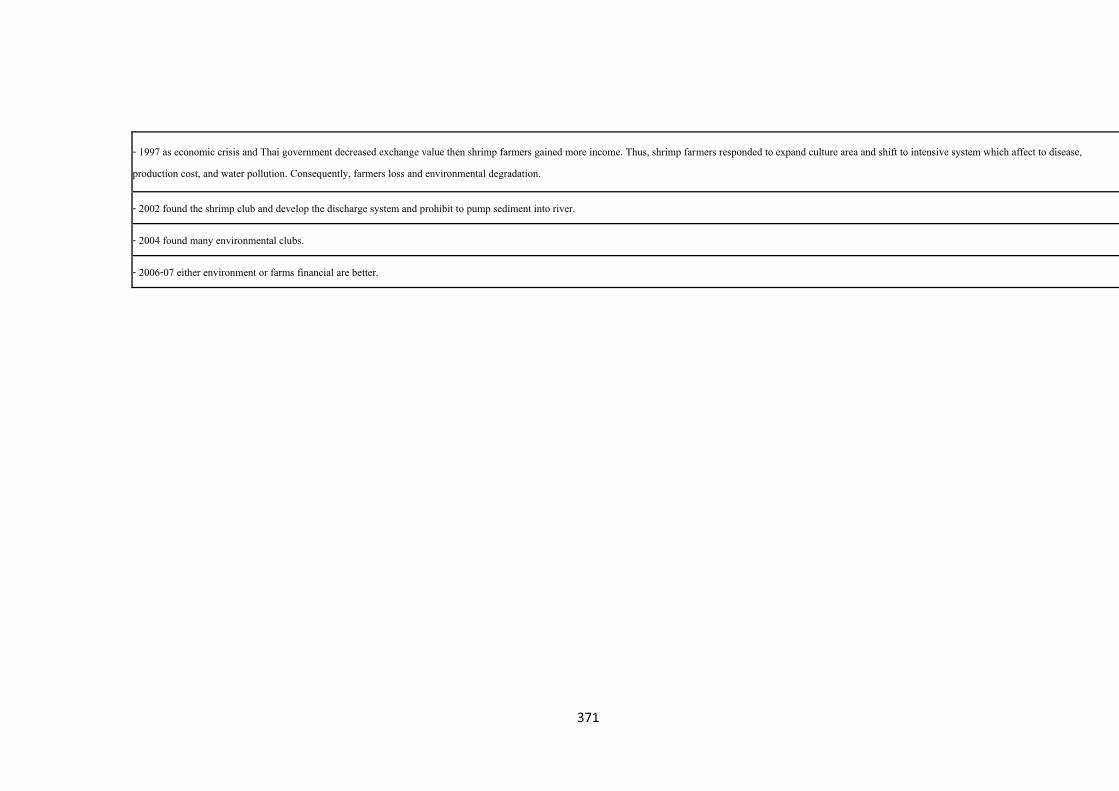
371
- 1997 as economic crisis and Thai government decreased exchange value then shrimp farmers gained more income. Thus, shrimp farmers responded to expand culture area and shift to intensive system which affect to disease, production cost, and water pollution. Consequently, farmers loss and environmental degradation.
- 2002 found the shrimp club and develop the discharge system and prohibit to pump sediment into river.
- 2004 found many environmental clubs.
- 2006-07 either environment or farms financial are better.
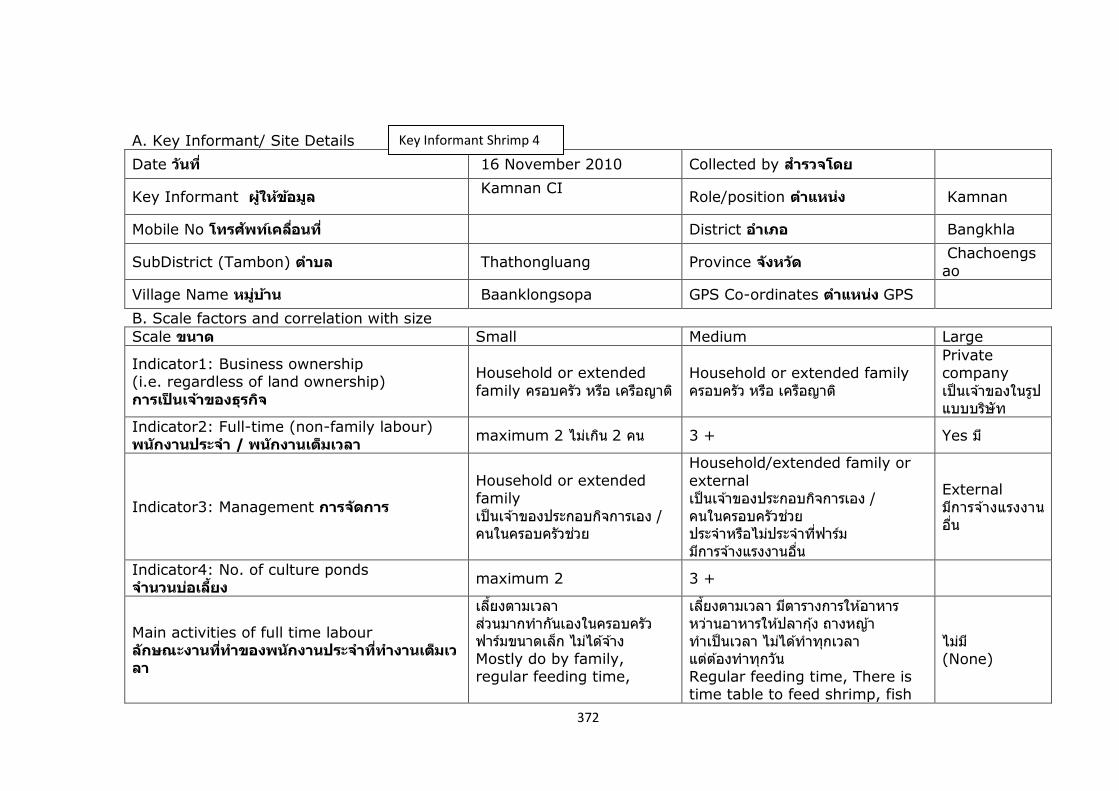
372
A. Key Informant/ Site Details
Date วนัที ่ 16 November 2010 Collected by ส ำรวจโดย
Key Informant ผูใ้หข้อ้มลู Kamnan CI
Role/position ต ำแหนง่ Kamnan
Mobile No โทรศพัทเ์คลือ่นที ่ District อ ำเภอ Bangkhla
SubDistrict (Tambon) ต ำบล Thathongluang Province จงัหวดั Chachoengs
ao
Village Name หมูบ่ำ้น Baanklongsopa GPS Co-ordinates ต ำแหนง่ GPS
B. Scale factors and correlation with size
Scale ขนำด Small Medium Large
Indicator1: Business ownership (i.e. regardless of land ownership)
กำรเป็นเจำ้ของธุรกจิ
Household or extended
family ครอบครัว หรอื เครอืญาต ิHousehold or extended family ครอบครัว หรอื เครอืญาต ิ
Private company
เป็นเจา้ของในรปูแบบบรษัิท
Indicator2: Full-time (non-family labour) พนกังำนประจ ำ / พนกังำนเต็มเวลำ
maximum 2 ไมเ่กนิ 2 คน 3 + Yes ม ี
Indicator3: Management กำรจดักำร
Household or extended family
เป็นเจา้ของประกอบกจิการเอง / คนในครอบครัวชว่ย
Household/extended family or
external เป็นเจา้ของประกอบกจิการเอง / คนในครอบครัวชว่ย ประจ าหรอืไมป่ระจ าทีฟ่ารม์ มกีารจา้งแรงงานอืน่
External มกีารจา้งแรงงานอืน่
Indicator4: No. of culture ponds จ ำนวนบอ่เลีย้ง
maximum 2 3 +
Main activities of full time labour ลกัษณะงำนทีท่ ำของพนกังำนประจ ำทีท่ ำงำนเต็มเวลำ
เลีย้งตามเวลา สว่นมากท ากนัเองในครอบครัว ฟารม์ขนาดเล็ก ไมไ่ดจ้า้ง Mostly do by family, regular feeding time,
เลีย้งตามเวลา มตีารางการใหอ้าหาร หวา่นอาหารใหป้ลากุง้ ถางหญา้ ท าเป็นเวลา ไมไ่ดท้ าทกุเวลา แตต่อ้งท าทกุวัน Regular feeding time, There is time table to feed shrimp, fish
ไมม่ ี(None)
Key Informant Shrimp 4
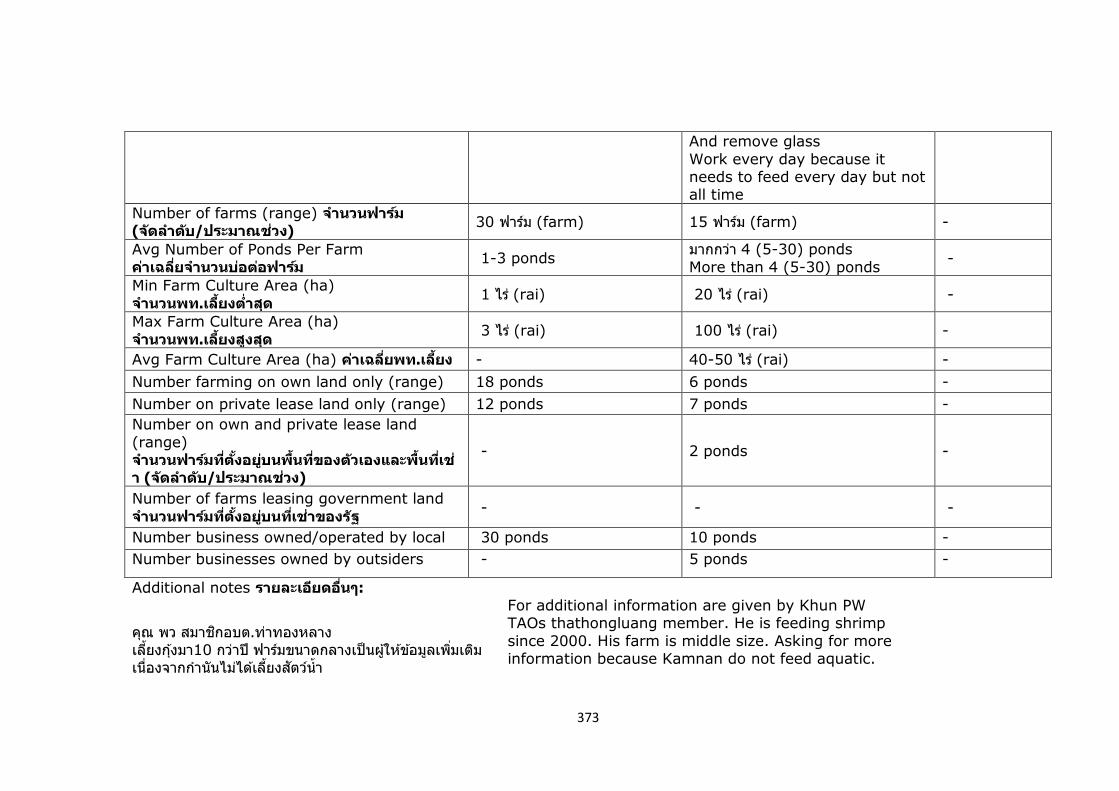
373
And remove glass
Work every day because it needs to feed every day but not all time
Number of farms (range) จ ำนวนฟำรม์ (จดัล ำดบั/ประมำณชว่ง)
30 ฟารม์ (farm) 15 ฟารม์ (farm) -
Avg Number of Ponds Per Farm คำ่เฉลีย่จ ำนวนบอ่ตอ่ฟำรม์
1-3 ponds มากกวา่ 4 (5-30) ponds
More than 4 (5-30) ponds -
Min Farm Culture Area (ha)
จ ำนวนพท.เลีย้งต ำ่สดุ 1 ไร ่(rai) 20 ไร ่(rai) -
Max Farm Culture Area (ha)
จ ำนวนพท.เลีย้งสงูสดุ 3 ไร ่(rai) 100 ไร ่(rai) -
Avg Farm Culture Area (ha) คำ่เฉลีย่พท.เลีย้ง - 40-50 ไร ่(rai) -
Number farming on own land only (range) 18 ponds 6 ponds -
Number on private lease land only (range) 12 ponds 7 ponds -
Number on own and private lease land
(range) จ ำนวนฟำรม์ทีต่ ัง้อยูบ่นพืน้ทีข่องตวัเองและพืน้ทีเ่ช่
ำ (จดัล ำดบั/ประมำณชว่ง)
- 2 ponds -
Number of farms leasing government land
จ ำนวนฟำรม์ทีต่ ัง้อยูบ่นทีเ่ชำ่ของรฐั - - -
Number business owned/operated by local 30 ponds 10 ponds -
Number businesses owned by outsiders - 5 ponds -
Additional notes รำยละเอยีดอืน่ๆ:
คณุ พว สมาชกิอบต.ทา่ทองหลาง เลีย้งกุง้มา10 กวา่ปี ฟารม์ขนาดกลางเป็นผูใ้หข้อ้มลูเพิม่เตมิ เนือ่งจากก านันไมไ่ดเ้ลีย้งสตัวน์ ้า
For additional information are given by Khun PW TAOs thathongluang member. He is feeding shrimp
since 2000. His farm is middle size. Asking for more information because Kamnan do not feed aquatic.

374
Date วนัที ่ 16 Nov, 2010 Collected by ส ำรวจโดย
Key Informant ผูใ้หข้อ้มลู Kamnan RT
Role/position ต ำแหนง่
ก านัน (Kamnan)
Mobile No โทรศพัทเ์คลือ่นที ่ District อ ำเภอ คลองเขือ่น (Klongkuean)
SubDistrict (Tambon) ต ำบล กอ้นแกว้ (Konkeaw)
Province จงัหวดั ฉะเชงิเทรา (Chachoengs
ao)
Village Name หมูบ่ำ้น ดอนสนาม (Donsanam)
GPS Co-ordinates ต ำแหนง่ GPS
B. Scale factors and correlation with size
Scale ขนำด Small Medium Large
Indicator1: Business ownership (i.e. regardless of land ownership)
กำรเป็นเจำ้ของธุรกจิ
Household or extended family ครอบครัว หรอื
เครอืญาต ิ
Household or extended family ครอบครัว หรอื เครอืญาต ิ
Private company เป็นเจา้ของในรปูแบบบรษัิท
Indicator2: Full-time (non-family labour) พนกังำนประจ ำ / พนกังำนเต็มเวลำ
maximum 2 ไมเ่กนิ 2 คน 3 + Yes ม ี
Indicator3: Management กำรจดักำร
Household or extended family
เป็นเจา้ของประกอบกจิการเอง / คนในครอบครัวชว่ย
Household/extended family or
external เป็นเจา้ของประกอบกจิการเอง / คนในครอบครัวชว่ย ประจ าหรอืไมป่ระจ าทีฟ่ารม์ มกีารจา้งแรงงานอืน่
External มกีารจา้งแรงงานอืน่
Indicator4: No. of culture ponds จ ำนวนบอ่เลีย้ง maximum 2 3 +
Main activities of full time labour ลกัษณะงำนทีท่ ำของพนกังำนประจ ำทีท่ ำงำนเต็มเวลำ
เป็นลกัษณะครอบครัว ท ากนัเองใหอ้าหารกุง้ ปลา ท านา
เลีย้งกุง้ ปลา ใหอ้าหาร ใหป้นู Feeding shrimp fish, put lime The activities are the same as
ไมม่ ี
Key Informant Shrimp 5
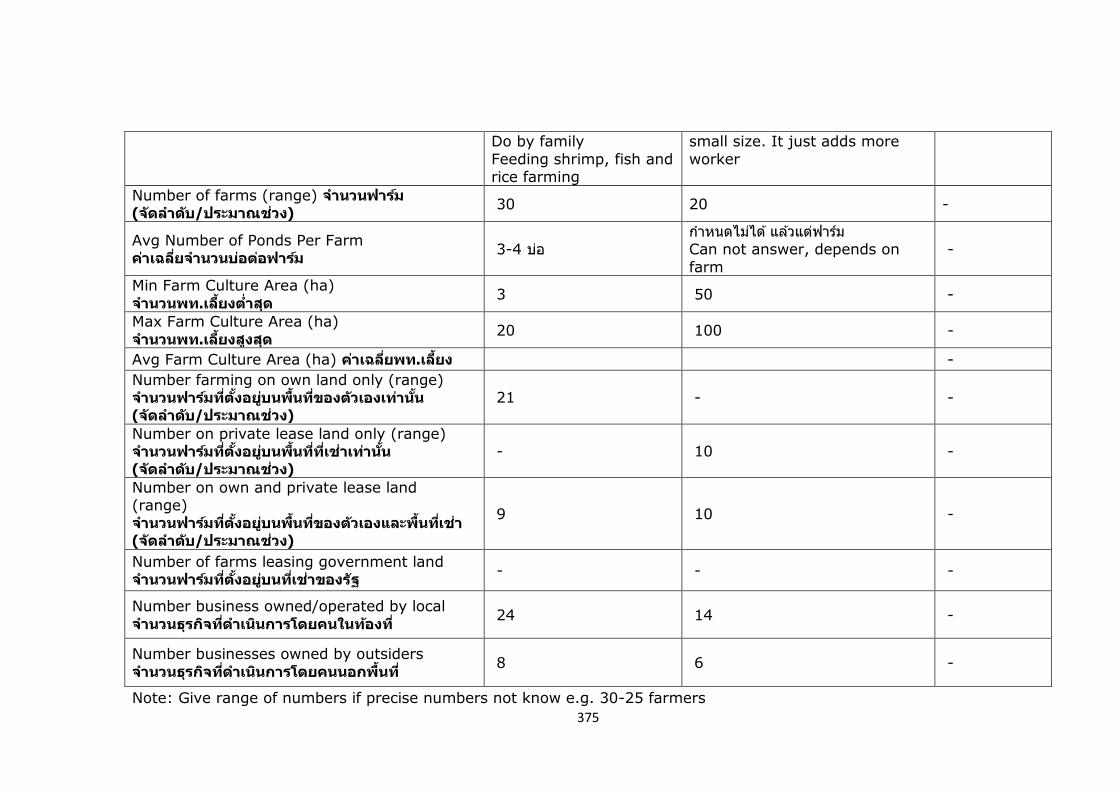
375
Do by family
Feeding shrimp, fish and rice farming
small size. It just adds more
worker
Number of farms (range) จ ำนวนฟำรม์ (จดัล ำดบั/ประมำณชว่ง)
30 20 -
Avg Number of Ponds Per Farm คำ่เฉลีย่จ ำนวนบอ่ตอ่ฟำรม์
3-4 บอ่ ก าหนดไมไ่ด ้แลว้แตฟ่ารม์ Can not answer, depends on
farm
-
Min Farm Culture Area (ha)
จ ำนวนพท.เลีย้งต ำ่สดุ 3 50 -
Max Farm Culture Area (ha)
จ ำนวนพท.เลีย้งสงูสดุ 20 100 -
Avg Farm Culture Area (ha) คำ่เฉลีย่พท.เลีย้ง -
Number farming on own land only (range) จ ำนวนฟำรม์ทีต่ ัง้อยูบ่นพืน้ทีข่องตวัเองเทำ่น ัน้ (จดัล ำดบั/ประมำณชว่ง)
21 - -
Number on private lease land only (range) จ ำนวนฟำรม์ทีต่ ัง้อยูบ่นพืน้ทีท่ ีเ่ชำ่เทำ่น ัน้ (จดัล ำดบั/ประมำณชว่ง)
- 10 -
Number on own and private lease land (range) จ ำนวนฟำรม์ทีต่ ัง้อยูบ่นพืน้ทีข่องตวัเองและพืน้ทีเ่ชำ่ (จดัล ำดบั/ประมำณชว่ง)
9 10 -
Number of farms leasing government land จ ำนวนฟำรม์ทีต่ ัง้อยูบ่นทีเ่ชำ่ของรฐั
- - -
Number business owned/operated by local
จ ำนวนธุรกจิทีด่ ำเนนิกำรโดยคนในทอ้งที ่ 24 14 -
Number businesses owned by outsiders
จ ำนวนธุรกจิทีด่ ำเนนิกำรโดยคนนอกพืน้ที ่ 8 6 -
Note: Give range of numbers if precise numbers not know e.g. 30-25 farmers

376
A. Key Informant/ Site Details
Date วนัที ่ 16 Nov, 2010 Collected by ส ำรวจโดย
Key Informant ผูใ้หข้อ้มูล Kamnan HS
Role/position ต ำแหนง่
ก านัน
Kamnan
Mobile No โทรศพัทเ์คลือ่นที ่ District อ ำเภอ เมอืง
Muang
SubDistrict (Tambon) ต ำบล บางแกว้
Bangkaew Province จงัหวดั
ฉะเชงิเทรา
Chachoengsao
Village Name หมูบ่ำ้น ไผเ่สวก
Paisawek
GPS Co-ordinates ต ำแหนง่
GPS
B. Scale factors and correlation with size
Scale ขนำด Small Medium Large
Indicator1: Business ownership (i.e.
regardless of land ownership) กำรเป็นเจำ้ของธุรกจิ
Household or extended
family ครอบครัว หรอื เครอืญาต ิ
Household or extended
family ครอบครัว หรอื เครอืญาต ิ
Private company เป็นเจา้ของในรูปแบบบ
รษัิท
Indicator2: Full-time (non-family labour) พนกังำนประจ ำ / พนกังำนเต็มเวลำ
maximum 2 ไมเ่กนิ 2 คน 3 + Yes ม ี
Indicator3: Management กำรจดักำร
Household or extended
family เป็นเจา้ของประกอบกจิการเอง /
คนในครอบครัวชว่ย
Household/extended
family or external
เป็นเจา้ของประกอบกจิการเอง / คนในครอบครัวชว่ย
ประจ าหรอืไม่ประจ าทีฟ่ารม์ มกีารจา้งแรงงานอืน่
External มกีารจา้งแรงงานอืน่
Indicator4: No. of culture ponds จ ำนวนบอ่เลีย้ง maximum 2 3 +
Main activities of full time labour
ลกัษณะงำนทีท่ ำของพนกังำนประจ ำทีท่ ำงำนเต็มเวลำ
เลีย้งกนัในครอบครัว ใหอ้าหาร ใสป่นู ตดิเครือ่ง ตดิไฟฟ้า เชค็ไฟ
ใหอ้าหาร ใสป่นู ตดิเครือ่ง ตดิไฟฟ้า เชค็ไฟ
ไมม่ ี
None
Key Informant Shrimp 6
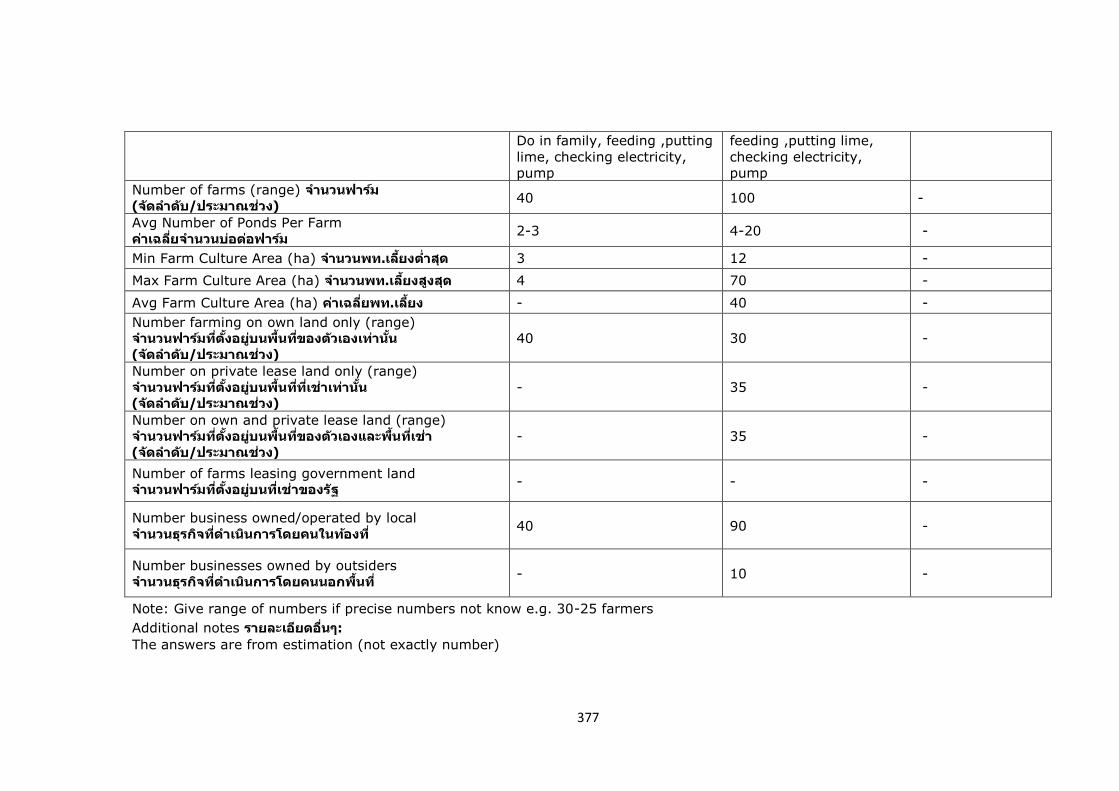
377
Do in family, feeding ,putting
lime, checking electricity,
pump
feeding ,putting lime,
checking electricity,
pump
Number of farms (range) จ ำนวนฟำรม์
(จดัล ำดบั/ประมำณชว่ง) 40 100 -
Avg Number of Ponds Per Farm
คำ่เฉลีย่จ ำนวนบอ่ตอ่ฟำรม์ 2-3 4-20 -
Min Farm Culture Area (ha) จ ำนวนพท.เลีย้งต ำ่สดุ 3 12 -
Max Farm Culture Area (ha) จ ำนวนพท.เลีย้งสงูสดุ 4 70 -
Avg Farm Culture Area (ha) คำ่เฉลีย่พท.เลีย้ง - 40 -
Number farming on own land only (range) จ ำนวนฟำรม์ทีต่ ัง้อยูบ่นพืน้ทีข่องตวัเองเทำ่น ัน้
(จดัล ำดบั/ประมำณชว่ง)
40 30 -
Number on private lease land only (range)
จ ำนวนฟำรม์ทีต่ ัง้อยูบ่นพืน้ทีท่ ีเ่ชำ่เทำ่น ัน้ (จดัล ำดบั/ประมำณชว่ง)
- 35 -
Number on own and private lease land (range) จ ำนวนฟำรม์ทีต่ ัง้อยูบ่นพืน้ทีข่องตวัเองและพืน้ทีเ่ชำ่
(จดัล ำดบั/ประมำณชว่ง) - 35 -
Number of farms leasing government land จ ำนวนฟำรม์ทีต่ ัง้อยูบ่นทีเ่ช่ำของรฐั
- - -
Number business owned/operated by local
จ ำนวนธุรกจิทีด่ ำเนนิกำรโดยคนในทอ้งที ่40 90 -
Number businesses owned by outsiders
จ ำนวนธุรกจิทีด่ ำเนนิกำรโดยคนนอกพืน้ที ่- 10 -
Note: Give range of numbers if precise numbers not know e.g. 30-25 farmers
Additional notes รำยละเอยีดอืน่ๆ:
The answers are from estimation (not exactly number)
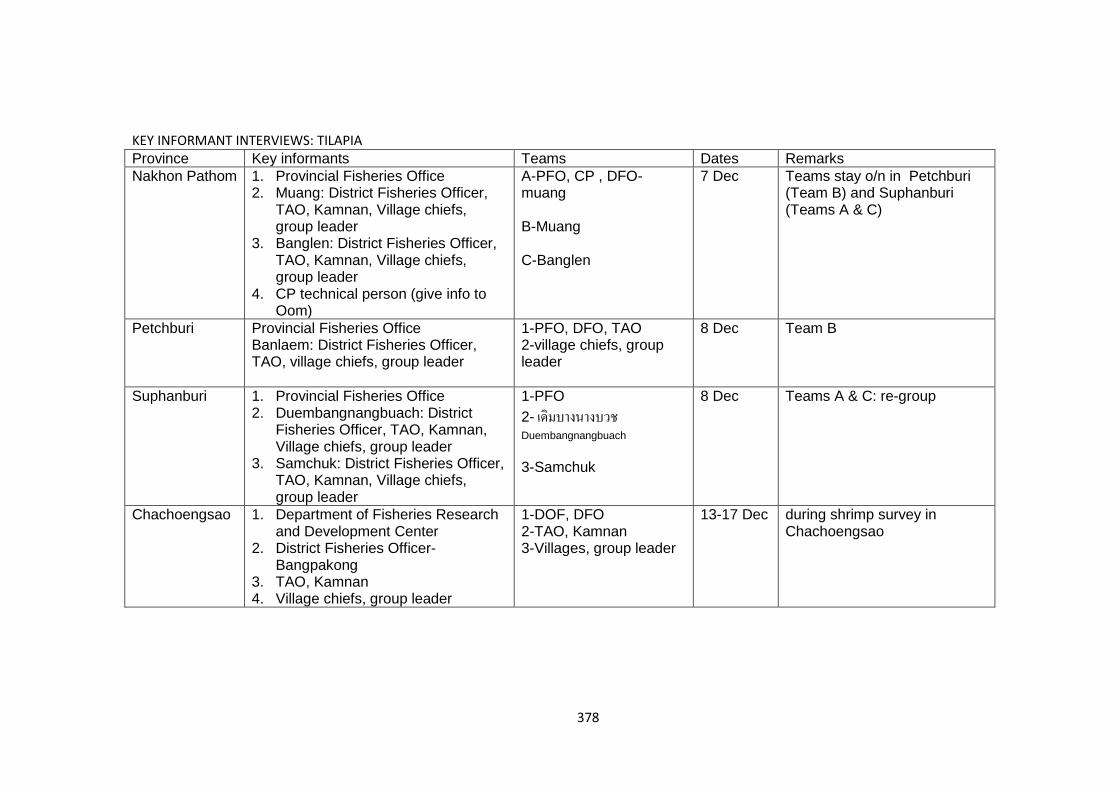
378
KEY INFORMANT INTERVIEWS: TILAPIA Province Key informants Teams Dates Remarks
Nakhon Pathom 1. Provincial Fisheries Office 2. Muang: District Fisheries Officer,
TAO, Kamnan, Village chiefs, group leader
3. Banglen: District Fisheries Officer, TAO, Kamnan, Village chiefs, group leader
4. CP technical person (give info to Oom)
A-PFO, CP , DFO-muang B-Muang C-Banglen
7 Dec Teams stay o/n in Petchburi (Team B) and Suphanburi (Teams A & C)
Petchburi Provincial Fisheries Office Banlaem: District Fisheries Officer, TAO, village chiefs, group leader
1-PFO, DFO, TAO 2-village chiefs, group leader
8 Dec
Team B
Suphanburi 1. Provincial Fisheries Office 2. Duembangnangbuach: District
Fisheries Officer, TAO, Kamnan, Village chiefs, group leader
3. Samchuk: District Fisheries Officer, TAO, Kamnan, Village chiefs, group leader
1-PFO
2- เดิมบางนางบวช
Duembangnangbuach
3-Samchuk
8 Dec Teams A & C: re-group
Chachoengsao 1. Department of Fisheries Research and Development Center
2. District Fisheries Officer-Bangpakong
3. TAO, Kamnan 4. Village chiefs, group leader
1-DOF, DFO 2-TAO, Kamnan 3-Villages, group leader
13-17 Dec during shrimp survey in Chachoengsao

379
KEY INFORMANT INTERVIEWS: TILAPIA (contact persons) Province Key informants Office Contact info Remarks
Nakhon Pathom PD
District Fisheries Office, Banglen
Tel:
PR Provincial Fisheries Office, A. Muang
Tel: Email
Head
SL PFO, Provincial Govt Office Tel: Staff
KP CP Technical Officer Tel:
TAO, kamnan Banglen
Village heads
Petchburi AL Farm Tel: Tilapia farmer, group leader
Provincial Fisheries Office
Pramong Amphur Banglaem
TAO, kamnan Banglaem
Village heads
Suphanburi AN Provincial Fisheries Office Email tel:
Can ask for contact of pramong amphurs
CM Nongbuach Tel: Group leader, tilapia cages
Pramong Amphurs เดิมบางนางบวช Duembangnangbuach
Samchuk
TAOs เดิมบางนางบวช Duembangnangbuach
Samchuk
Chachoengsao DOF Research and Dev Center
Bangpakong Check DOF directory
Pramong Amphur District Fisheries Office, Bangpakong
Check with PFO, Chachoengsao
TAO, kamnan Bangpakong
Village heads
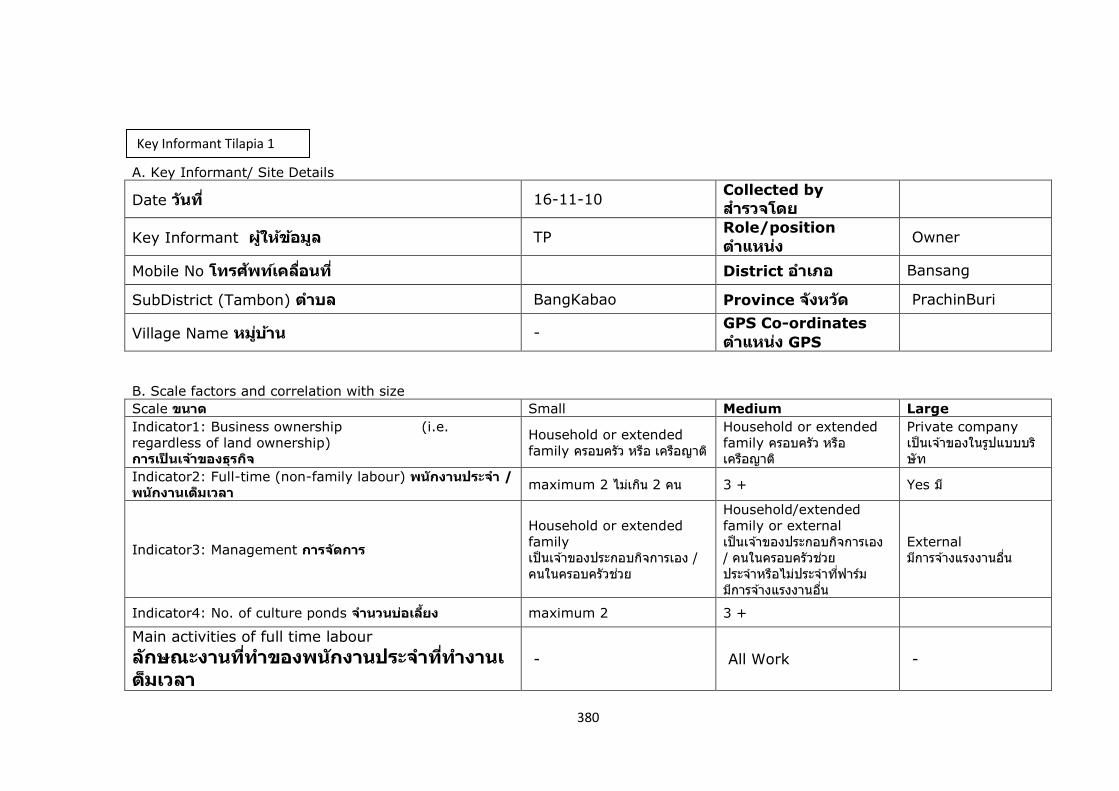
380
A. Key Informant/ Site Details
Date วนัที ่ 16-11-10 Collected by
ส ำรวจโดย
Key Informant ผูใ้หข้อ้มลู TP Role/position
ต ำแหนง่ Owner
Mobile No โทรศพัทเ์คลือ่นที ่ District อ ำเภอ Bansang
SubDistrict (Tambon) ต ำบล BangKabao Province จงัหวดั PrachinBuri
Village Name หมูบ่ำ้น - GPS Co-ordinates
ต ำแหนง่ GPS
B. Scale factors and correlation with size
Scale ขนำด Small Medium Large
Indicator1: Business ownership (i.e.
regardless of land ownership) กำรเป็นเจำ้ของธุรกจิ
Household or extended
family ครอบครัว หรอื เครอืญาต ิ
Household or extended
family ครอบครัว หรอื เครอืญาต ิ
Private company เป็นเจา้ของในรูปแบบบริ
ษัท
Indicator2: Full-time (non-family labour) พนกังำนประจ ำ / พนกังำนเต็มเวลำ
maximum 2 ไมเ่กนิ 2 คน 3 + Yes ม ี
Indicator3: Management กำรจดักำร
Household or extended
family เป็นเจา้ของประกอบกจิการเอง /
คนในครอบครัวชว่ย
Household/extended
family or external
เป็นเจา้ของประกอบกจิการเอง / คนในครอบครัวชว่ย
ประจ าหรอืไม่ประจ าทีฟ่ารม์ มกีารจา้งแรงงานอืน่
External มกีารจา้งแรงงานอืน่
Indicator4: No. of culture ponds จ ำนวนบอ่เลีย้ง maximum 2 3 +
Main activities of full time labour
ลกัษณะงำนทีท่ ำของพนกังำนประจ ำทีท่ ำงำนเต็มเวลำ
- All Work -
Key Informant Tilapia 1
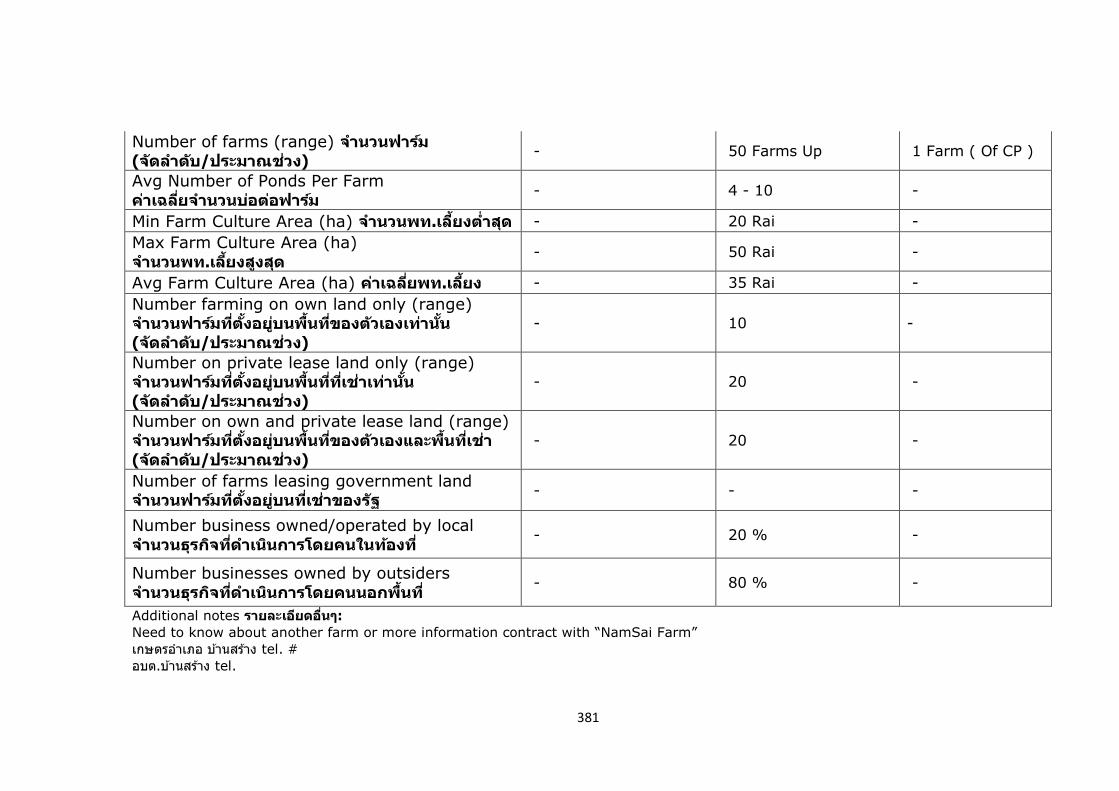
381
Number of farms (range) จ ำนวนฟำรม์ (จดัล ำดบั/ประมำณชว่ง)
- 50 Farms Up 1 Farm ( Of CP )
Avg Number of Ponds Per Farm คำ่เฉลีย่จ ำนวนบอ่ตอ่ฟำรม์
- 4 - 10 -
Min Farm Culture Area (ha) จ ำนวนพท.เลีย้งต ำ่สดุ - 20 Rai -
Max Farm Culture Area (ha) จ ำนวนพท.เลีย้งสงูสดุ
- 50 Rai -
Avg Farm Culture Area (ha) คำ่เฉลีย่พท.เลีย้ง - 35 Rai -
Number farming on own land only (range) จ ำนวนฟำรม์ทีต่ ัง้อยูบ่นพืน้ทีข่องตวัเองเทำ่น ัน้ (จดัล ำดบั/ประมำณชว่ง)
- 10 -
Number on private lease land only (range) จ ำนวนฟำรม์ทีต่ ัง้อยูบ่นพืน้ทีท่ ีเ่ชำ่เทำ่น ัน้ (จดัล ำดบั/ประมำณชว่ง)
- 20 -
Number on own and private lease land (range) จ ำนวนฟำรม์ทีต่ ัง้อยูบ่นพืน้ทีข่องตวัเองและพืน้ทีเ่ชำ่ (จดัล ำดบั/ประมำณชว่ง)
- 20 -
Number of farms leasing government land จ ำนวนฟำรม์ทีต่ ัง้อยูบ่นทีเ่ชำ่ของรฐั
- - -
Number business owned/operated by local จ ำนวนธุรกจิทีด่ ำเนนิกำรโดยคนในทอ้งที ่
- 20 % -
Number businesses owned by outsiders จ ำนวนธุรกจิทีด่ ำเนนิกำรโดยคนนอกพืน้ที ่
- 80 % -
Additional notes รำยละเอยีดอืน่ๆ:
Need to know about another farm or more information contract with “NamSai Farm”
เกษตรอ าเภอ บา้นสรา้ง tel. #
อบต.บา้นสรา้ง tel.

382
A. Key Informant/ Site Details Date 7/12/10 Collected by ส ำร จโดย Key Informant ST Role/position ำ Fisheries volunteer Mobile No โ ร District ำ ภ Banglean SubDistrict (Tambon) ำบ Banglean Province จ ด Nakornpathom Village Name บ ำ 3 GPS Co-ordinates ำ GPS B. Scale factors and correlation with size Scale ำด Small Medium Large Indicator1: Business ownership (i.e. regardless of land ownership) ำร จ ำ ร จ
Household or extended family ร บ ร ร ร ำ
Household or extended family ร บ ร ร ร ำ
Private company จ ำ ร บบบร
Indicator2: Full-time (non-family labour) ำ ร จ ำ ำ ำ
maximum 2 3 + Yes
Key Informant Tilapia 2
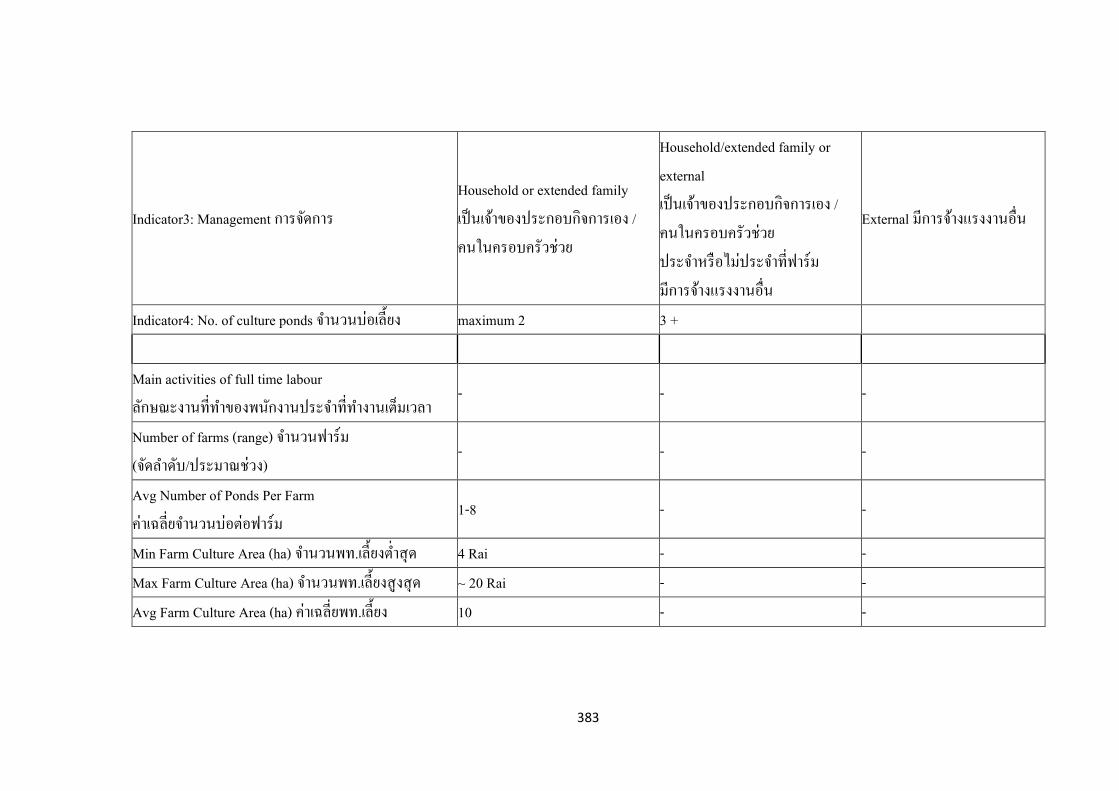
383
Indicator3: Management ำรจ ด ำร Household or extended family จ ำ ร บ จ ำร ร บ ร ย
Household/extended family or external จ ำ ร บ จ ำร ร บ ร ย ร จ ำ ร ร จ ำ ำร ำรจ ำ ร ำ
External ำรจ ำ ร ำ
Indicator4: No. of culture ponds จ ำ บ ย maximum 2 3 + Main activities of full time labour ำ ำ ำ ร จ ำ ำ ำ ำ
- - -
Number of farms (range) จ ำ ำร จ ด ำด บ ร ำ
- - -
Avg Number of Ponds Per Farm ำ ยจ ำ บ ำร
1-8 - -
Min Farm Culture Area (ha) จ ำ ย ำส ด 4 Rai - - Max Farm Culture Area (ha) จ ำ ย ส ส ด ~ 20 Rai - - Avg Farm Culture Area (ha) ำ ย ย 10 - -
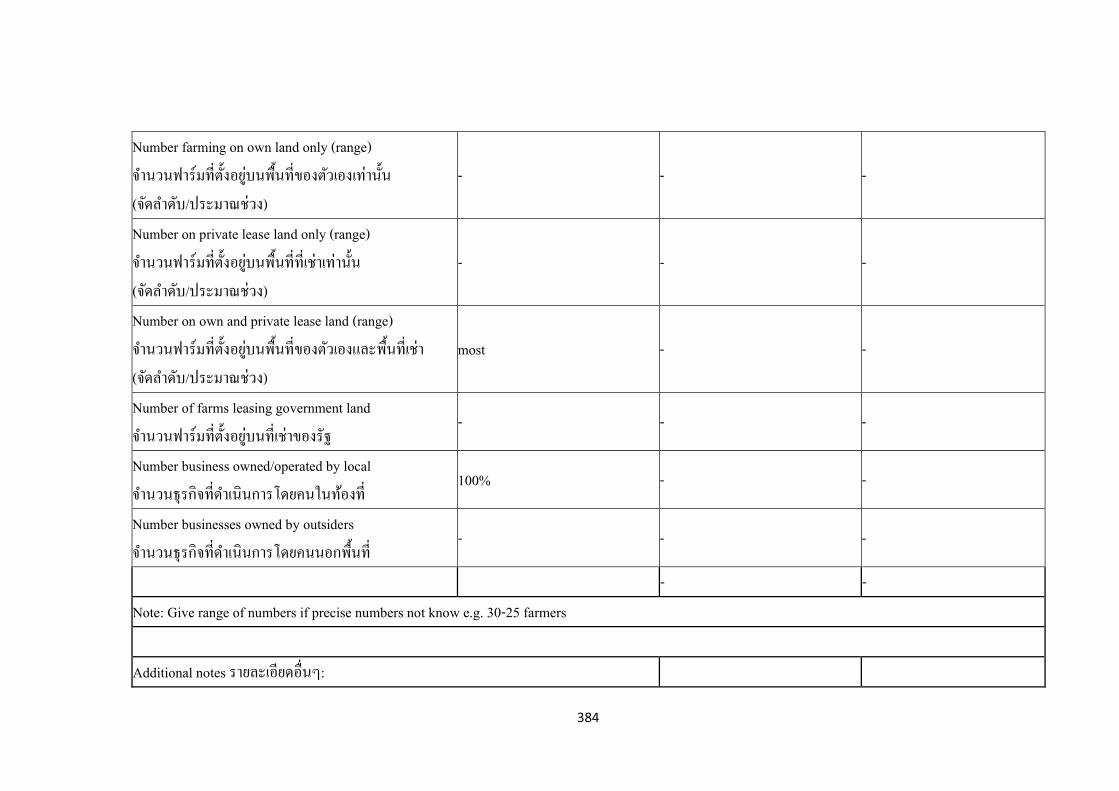
384
Number farming on own land only (range) จ ำ ำร ย บ ำ จ ด ำด บ ร ำ
- - -
Number on private lease land only (range) จ ำ ำร ย บ ำ ำ จ ด ำด บ ร ำ
- - -
Number on own and private lease land (range) จ ำ ำร ย บ ำ จ ด ำด บ ร ำ
most - -
Number of farms leasing government land จ ำ ำร ย บ ำ ร
- - -
Number business owned/operated by local จ ำ ร จ ด ำ ำรโดย
100% - -
Number businesses owned by outsiders จ ำ ร จ ด ำ ำรโดย
- - -
- - Note: Give range of numbers if precise numbers not know e.g. 30-25 farmers Additional notes รำย ยด
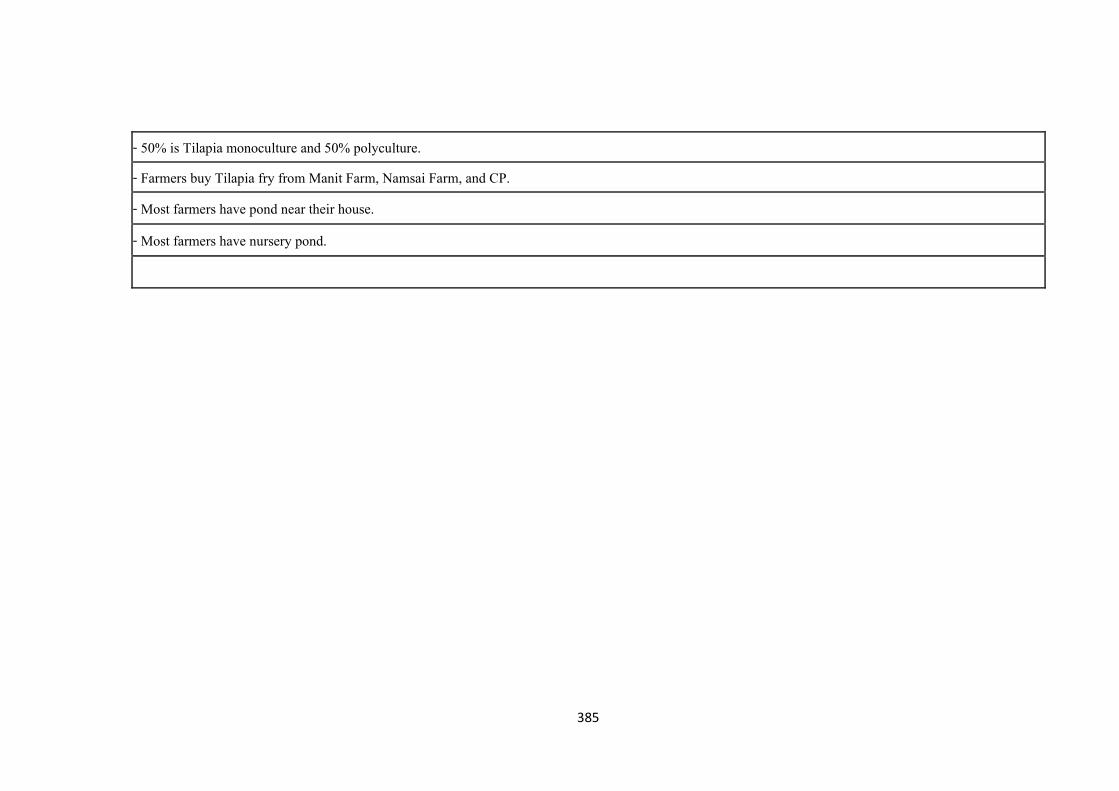
385
- 50% is Tilapia monoculture and 50% polyculture. - Farmers buy Tilapia fry from Manit Farm, Namsai Farm, and CP.
- Most farmers have pond near their house.
- Most farmers have nursery pond.
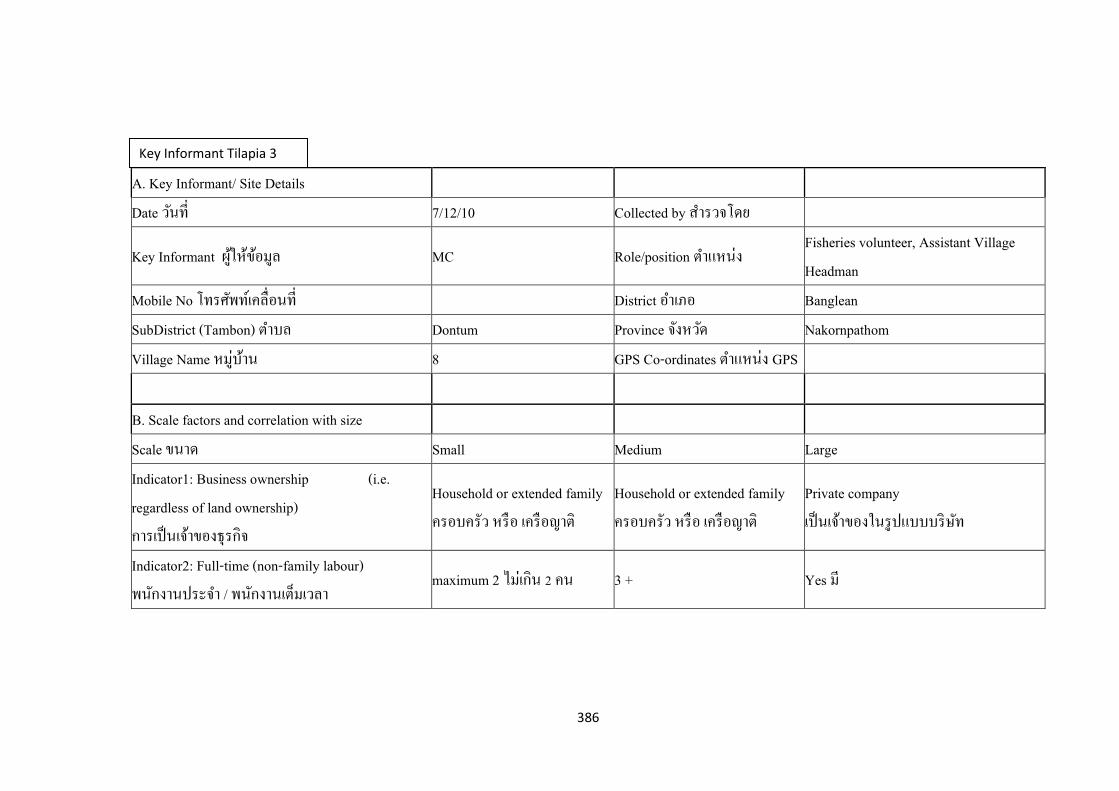
386
A. Key Informant/ Site Details Date 7/12/10 Collected by ส ำร จโดย
Key Informant MC Role/position ำ Fisheries volunteer, Assistant Village Headman
Mobile No โ ร District ำ ภ Banglean SubDistrict (Tambon) ำบ Dontum Province จ ด Nakornpathom Village Name บ ำ 8 GPS Co-ordinates ำ GPS B. Scale factors and correlation with size Scale ำด Small Medium Large Indicator1: Business ownership (i.e. regardless of land ownership) ำร จ ำ ร จ
Household or extended family ร บ ร ร ร ำ
Household or extended family ร บ ร ร ร ำ
Private company จ ำ ร บบบร
Indicator2: Full-time (non-family labour) ำ ร จ ำ ำ ำ
maximum 2 3 + Yes
Key Informant Tilapia 3
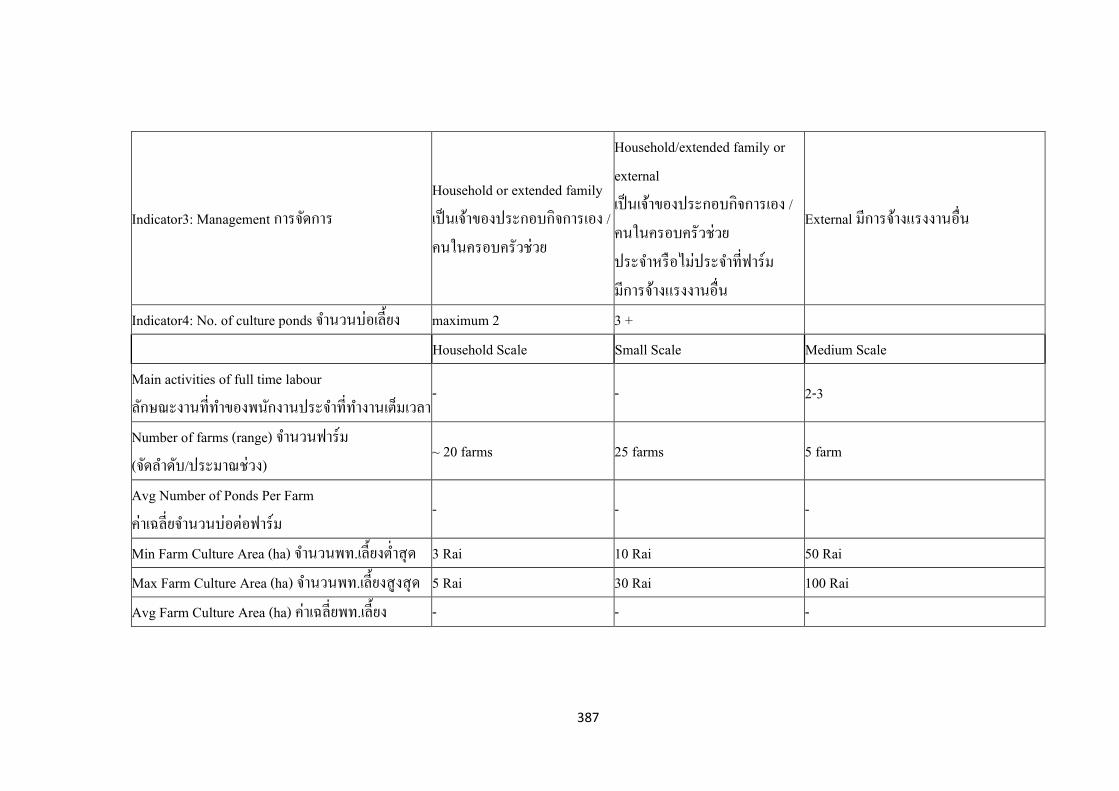
387
Indicator3: Management ำรจ ด ำร Household or extended family จ ำ ร บ จ ำร ร บ ร ย
Household/extended family or external จ ำ ร บ จ ำร ร บ ร ย ร จ ำ ร ร จ ำ ำร ำรจ ำ ร ำ
External ำรจ ำ ร ำ
Indicator4: No. of culture ponds จ ำ บ ย maximum 2 3 + Household Scale Small Scale Medium Scale Main activities of full time labour ำ ำ ำ ร จ ำ ำ ำ ำ
- - 2-3
Number of farms (range) จ ำ ำร จ ด ำด บ ร ำ
~ 20 farms 25 farms 5 farm
Avg Number of Ponds Per Farm ำ ยจ ำ บ ำร
- - -
Min Farm Culture Area (ha) จ ำ ย ำส ด 3 Rai 10 Rai 50 Rai Max Farm Culture Area (ha) จ ำ ย ส ส ด 5 Rai 30 Rai 100 Rai Avg Farm Culture Area (ha) ำ ย ย - - -
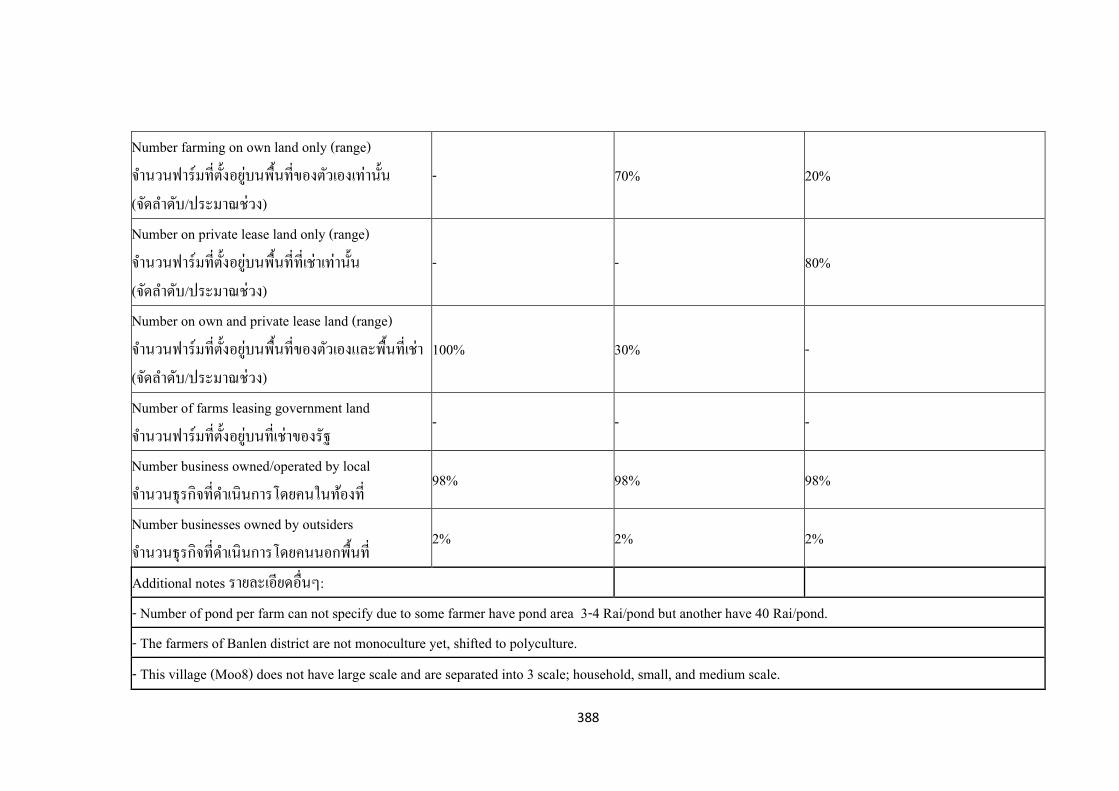
388
Number farming on own land only (range) จ ำ ำร ย บ ำ จ ด ำด บ ร ำ
- 70% 20%
Number on private lease land only (range) จ ำ ำร ย บ ำ ำ จ ด ำด บ ร ำ
- - 80%
Number on own and private lease land (range) จ ำ ำร ย บ ำ จ ด ำด บ ร ำ
100% 30% -
Number of farms leasing government land จ ำ ำร ย บ ำ ร
- - -
Number business owned/operated by local จ ำ ร จ ด ำ ำรโดย
98% 98% 98%
Number businesses owned by outsiders จ ำ ร จ ด ำ ำรโดย
2% 2% 2%
Additional notes รำย ยด - Number of pond per farm can not specify due to some farmer have pond area 3-4 Rai/pond but another have 40 Rai/pond. - The farmers of Banlen district are not monoculture yet, shifted to polyculture.
- This village (Moo8) does not have large scale and are separated into 3 scale; household, small, and medium scale.
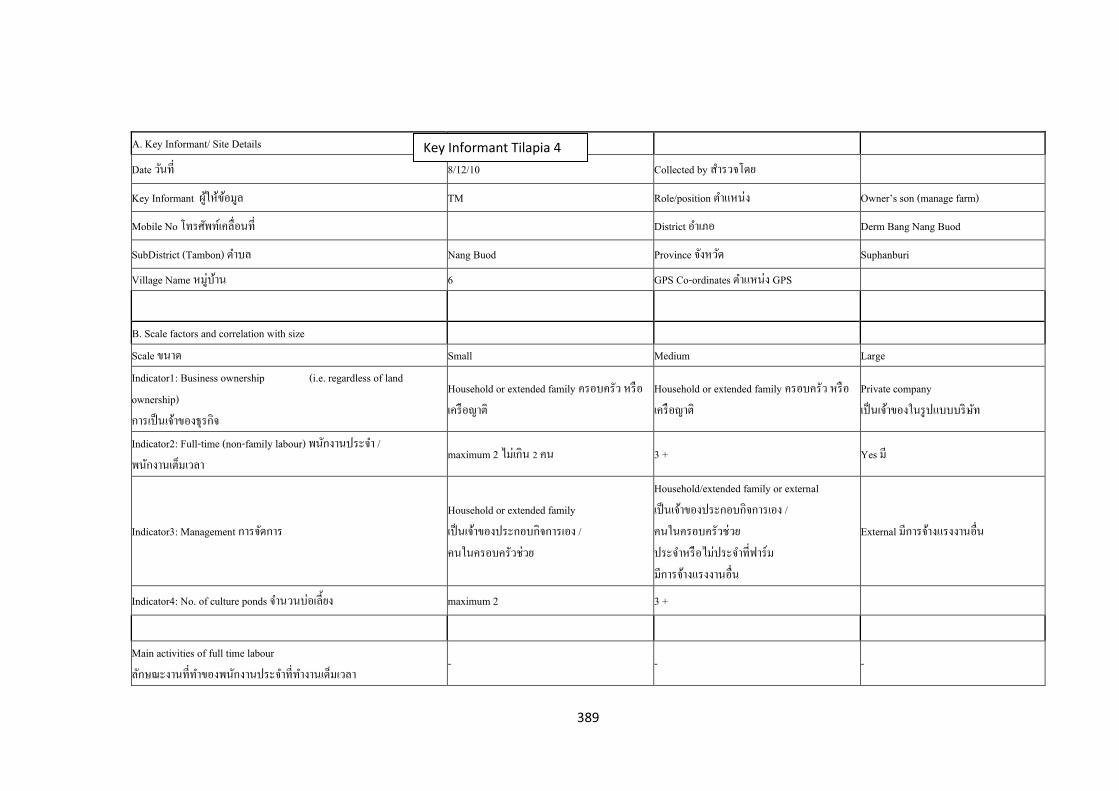
389
A. Key Informant/ Site Details
Date 8/12/10 Collected by ส ำร จโดย
Key Informant TM Role/position ำ Owner’s son manage farm
Mobile No โ ร District ำ ภ Derm Bang Nang Buod
SubDistrict (Tambon) ำบ Nang Buod Province จ ด Suphanburi
Village Name บ ำ 6 GPS Co-ordinates ำ GPS
B. Scale factors and correlation with size Scale ำด Small Medium Large Indicator1: Business ownership (i.e. regardless of land ownership) ำร จ ำ ร จ
Household or extended family ร บ ร ร ร ำ
Household or extended family ร บ ร ร ร ำ
Private company จ ำ ร บบบร
Indicator2: Full-time (non-family labour) ำ ร จ ำ ำ ำ
maximum 2 3 + Yes
Indicator3: Management ำรจ ด ำร Household or extended family จ ำ ร บ จ ำร ร บ ร ย
Household/extended family or external จ ำ ร บ จ ำร ร บ ร ย ร จ ำ ร ร จ ำ ำร ำรจ ำ ร ำ
External ำรจ ำ ร ำ
Indicator4: No. of culture ponds จ ำ บ ย maximum 2 3 +
Main activities of full time labour ำ ำ ำ ร จ ำ ำ ำ ำ
- - -
Key Informant Tilapia 4

390
Number of farms (range) จ ำ ำร จ ด ำด บ ร ำ - - -
Avg Number of Ponds Per Farm ำ ยจ ำ บ ำร 40 cages - -
Min Farm Culture Area (ha) จ ำ ย ำส ด 36 m2 - - Max Farm Culture Area (ha) จ ำ ย ส ส ด 450 m2 - - Avg Farm Culture Area (ha) ำ ย ย 360 m2 - -
Number farming on own land only (range) - - -
Number on private lease land only (range) - - -
Number on own and private lease land (range) 100% - -
Number of farms leasing government land จ ำ ำร ย บ ำ ร
- - -
Number business owned/operated by local จ ำ ร จ ด ำ ำรโดย
100% - -
Number businesses owned by outsiders จ ำ ร จ ด ำ ำรโดย
- - -
Additional notes รำย ยด
- There are 2 districts of Suphanburi that farmers are cage culture of Tilapia; Samchok and Derm Bang Nang Boud.
- For Derm Bang Nang Boud district, there are around 40 farmers, 20 persons are member of K K’s group Only one farmer member is in Samchok district
- K K’s household has 96 cages which are separated into 3 owners; K K father , TM son , and NM son They registered with PFO 3 names but only one GAP registered as K.K.
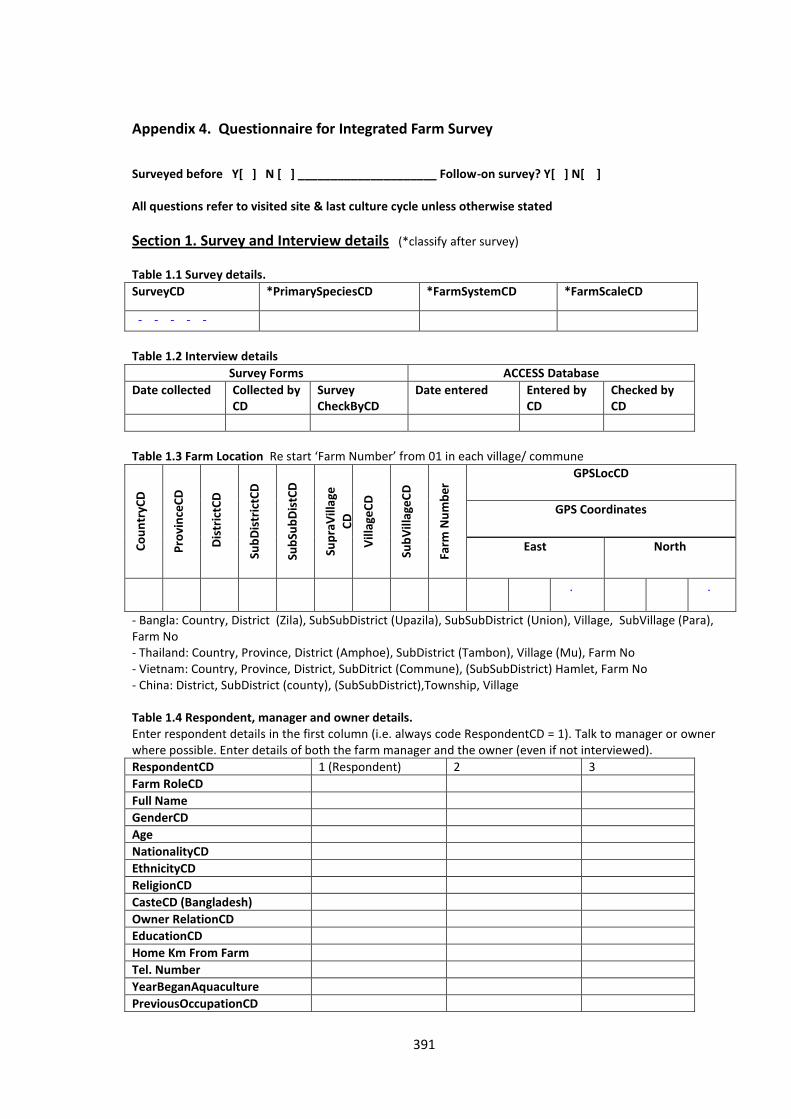
391
Appendix 4. Questionnaire for Integrated Farm Survey
Surveyed before Y[ ] N [ ] _____________________ Follow-on survey? Y[ ] N[ ] All questions refer to visited site & last culture cycle unless otherwise stated
Section 1. Survey and Interview details (*classify after survey)
Table 1.1 Survey details.
SurveyCD *PrimarySpeciesCD *FarmSystemCD *FarmScaleCD
- - - - -
Table 1.2 Interview details
Survey Forms ACCESS Database
Date collected Collected by CD
Survey CheckByCD
Date entered Entered by CD
Checked by CD
Table 1.3 Farm Location Re start ‘Farm Number’ from 01 in each village/ commune
Co
un
tryC
D
Pro
vin
ceC
D
Dis
tric
tCD
Sub
Dis
tric
tCD
Sub
Sub
Dis
tCD
Sup
raV
illa
ge
CD
Vill
age
CD
Sub
Vill
age
CD
Farm
Nu
mb
er GPSLocCD
GPS Coordinates
East North
.
.
- Bangla: Country, District (Zila), SubSubDistrict (Upazila), SubSubDistrict (Union), Village, SubVillage (Para), Farm No - Thailand: Country, Province, District (Amphoe), SubDistrict (Tambon), Village (Mu), Farm No - Vietnam: Country, Province, District, SubDitrict (Commune), (SubSubDistrict) Hamlet, Farm No - China: District, SubDistrict (county), (SubSubDistrict),Township, Village Table 1.4 Respondent, manager and owner details. Enter respondent details in the first column (i.e. always code RespondentCD = 1). Talk to manager or owner where possible. Enter details of both the farm manager and the owner (even if not interviewed).
RespondentCD 1 (Respondent) 2 3
Farm RoleCD
Full Name
GenderCD
Age
NationalityCD
EthnicityCD
ReligionCD
CasteCD (Bangladesh)
Owner RelationCD
EducationCD
Home Km From Farm
Tel. Number
YearBeganAquaculture
PreviousOccupationCD
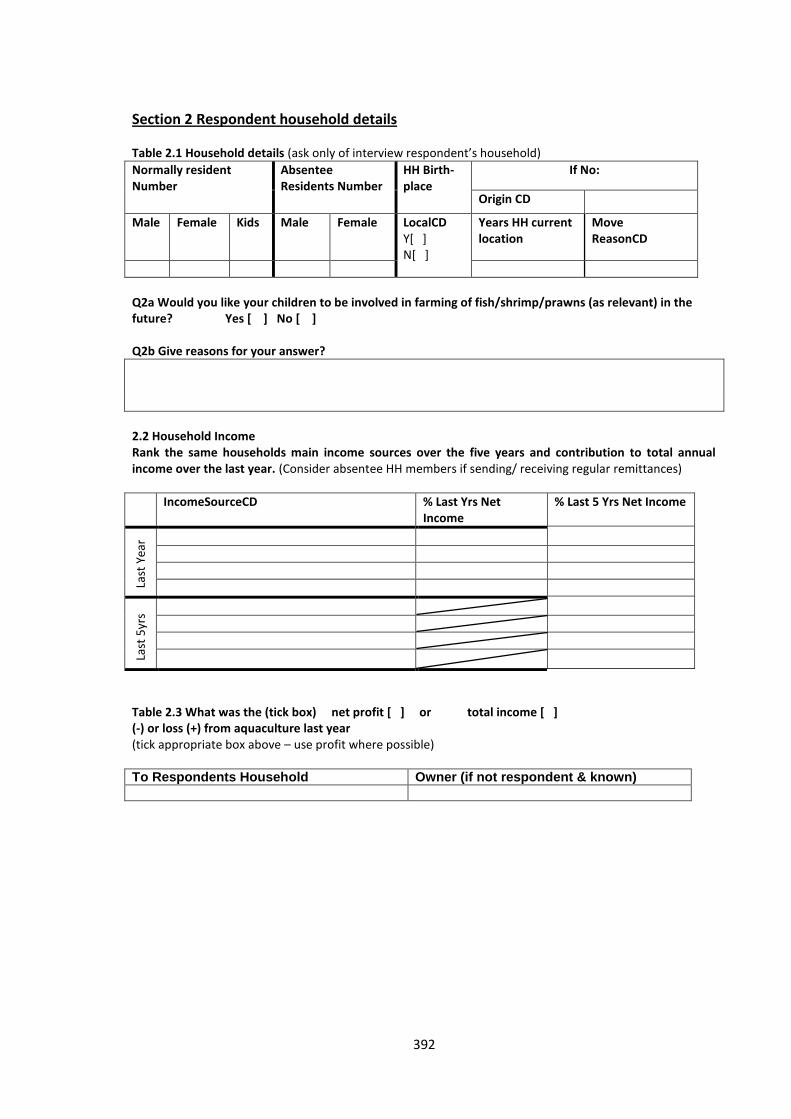
392
Section 2 Respondent household details Table 2.1 Household details (ask only of interview respondent’s household)
Normally resident Number
Absentee Residents Number
HH Birth-place
If No:
Origin CD
Male Female Kids Male Female LocalCD Y[ ] N[ ]
Years HH current location
Move ReasonCD
Q2a Would you like your children to be involved in farming of fish/shrimp/prawns (as relevant) in the future? Yes [ ] No [ ] Q2b Give reasons for your answer?
2.2 Household Income Rank the same households main income sources over the five years and contribution to total annual income over the last year. (Consider absentee HH members if sending/ receiving regular remittances)
IncomeSourceCD % Last Yrs Net Income
% Last 5 Yrs Net Income
Last
Yea
r
Last
5yr
s
Table 2.3 What was the (tick box) net profit [ ] or total income [ ] (-) or loss (+) from aquaculture last year (tick appropriate box above – use profit where possible) To Respondents Household Owner (if not respondent & known)
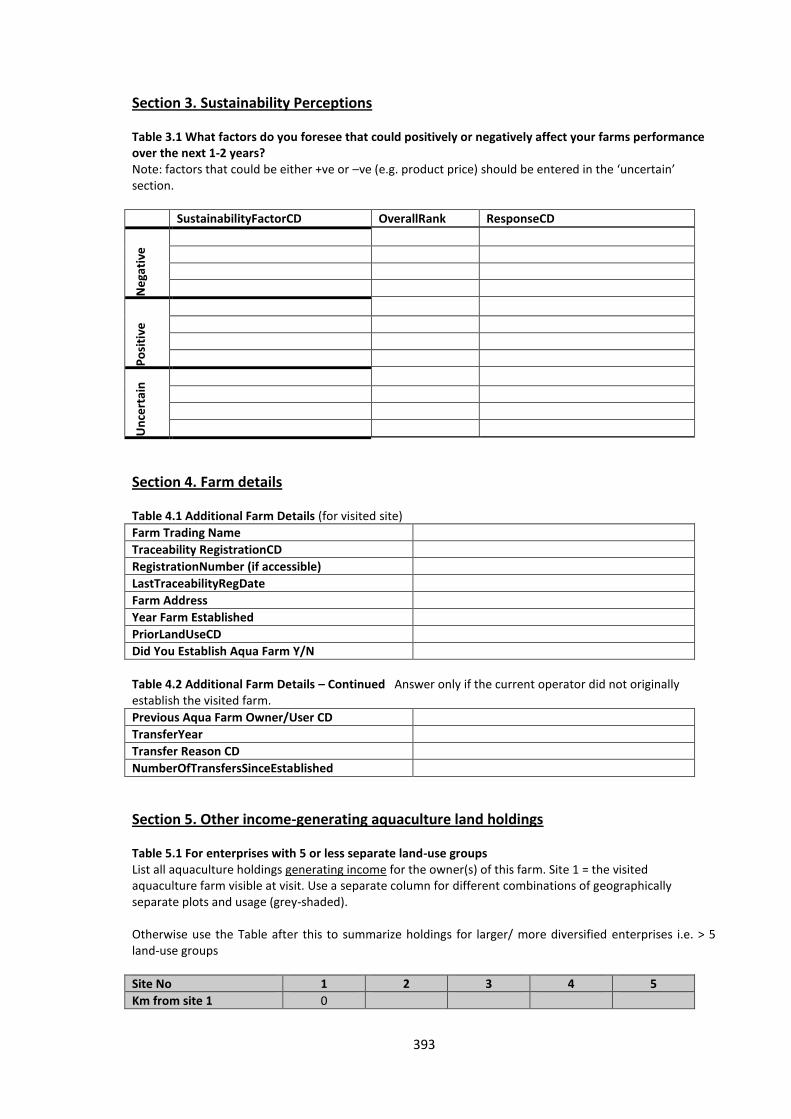
393
Section 3. Sustainability Perceptions Table 3.1 What factors do you foresee that could positively or negatively affect your farms performance over the next 1-2 years? Note: factors that could be either +ve or –ve (e.g. product price) should be entered in the ‘uncertain’ section.
SustainabilityFactorCD OverallRank ResponseCD
Ne
gati
ve
Po
siti
ve
Un
cert
ain
Section 4. Farm details Table 4.1 Additional Farm Details (for visited site)
Farm Trading Name
Traceability RegistrationCD
RegistrationNumber (if accessible)
LastTraceabilityRegDate
Farm Address
Year Farm Established
PriorLandUseCD
Did You Establish Aqua Farm Y/N
Table 4.2 Additional Farm Details – Continued Answer only if the current operator did not originally establish the visited farm.
Previous Aqua Farm Owner/User CD
TransferYear
Transfer Reason CD
NumberOfTransfersSinceEstablished
Section 5. Other income-generating aquaculture land holdings Table 5.1 For enterprises with 5 or less separate land-use groups List all aquaculture holdings generating income for the owner(s) of this farm. Site 1 = the visited aquaculture farm visible at visit. Use a separate column for different combinations of geographically separate plots and usage (grey-shaded). Otherwise use the Table after this to summarize holdings for larger/ more diversified enterprises i.e. > 5 land-use groups
Site No 1 2 3 4 5
Km from site 1 0
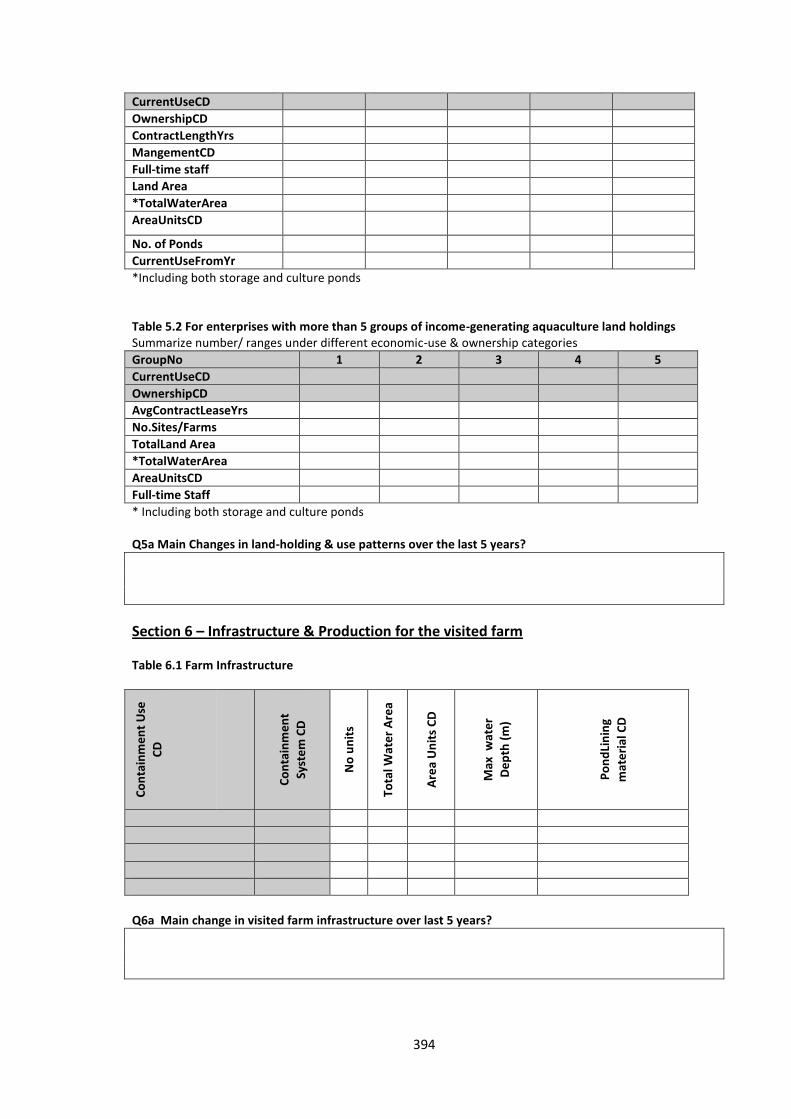
394
CurrentUseCD
OwnershipCD
ContractLengthYrs
MangementCD
Full-time staff
Land Area
*TotalWaterArea
AreaUnitsCD
No. of Ponds
CurrentUseFromYr
*Including both storage and culture ponds Table 5.2 For enterprises with more than 5 groups of income-generating aquaculture land holdings Summarize number/ ranges under different economic-use & ownership categories
GroupNo 1 2 3 4 5
CurrentUseCD
OwnershipCD
AvgContractLeaseYrs
No.Sites/Farms
TotalLand Area
*TotalWaterArea
AreaUnitsCD
Full-time Staff
* Including both storage and culture ponds Q5a Main Changes in land-holding & use patterns over the last 5 years?
Section 6 – Infrastructure & Production for the visited farm Table 6.1 Farm Infrastructure
Co
nta
inm
en
t U
se
CD
Co
nta
inm
en
t
Syst
em
CD
No
un
its
Tota
l Wat
er
Are
a
Are
a U
nit
s C
D
Max
wat
er
De
pth
(m
)
Po
nd
Lin
ing
mat
eri
al C
D
Q6a Main change in visited farm infrastructure over last 5 years?
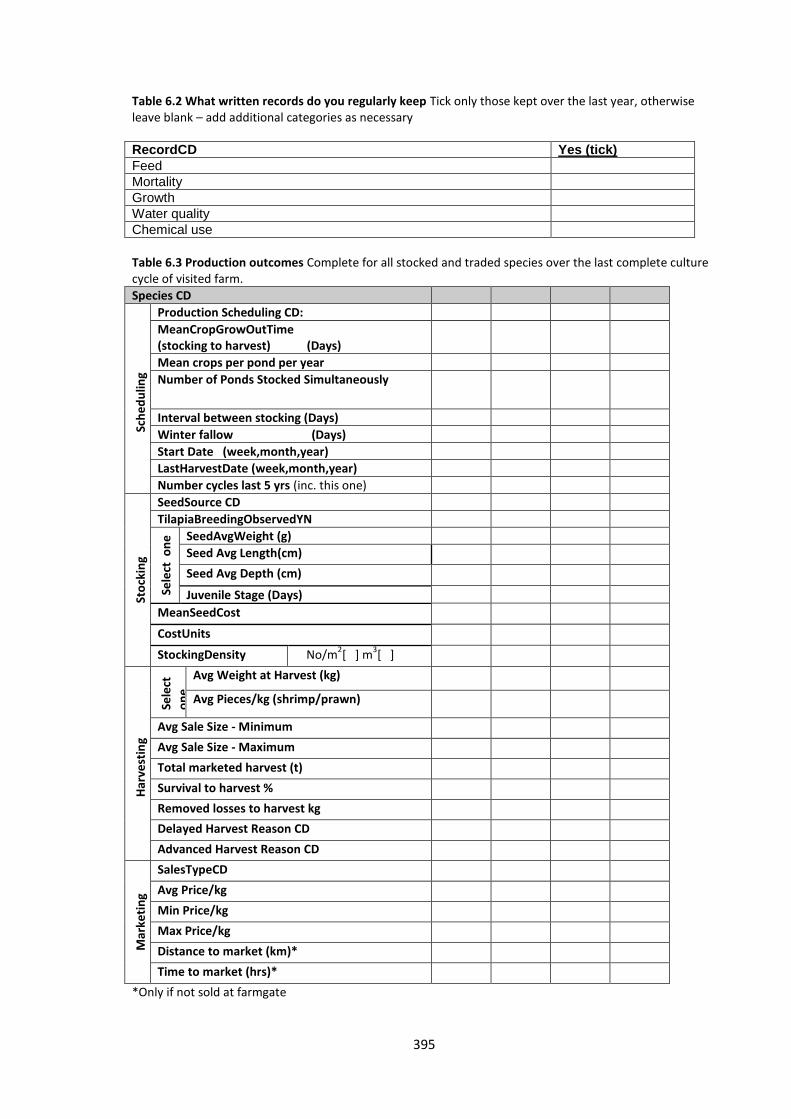
395
Table 6.2 What written records do you regularly keep Tick only those kept over the last year, otherwise leave blank – add additional categories as necessary RecordCD Yes (tick)
Feed
Mortality
Growth
Water quality
Chemical use
Table 6.3 Production outcomes Complete for all stocked and traded species over the last complete culture cycle of visited farm.
Species CD
Sch
ed
ulin
g
Sto
ckin
g
Production Scheduling CD:
MeanCropGrowOutTime (stocking to harvest) (Days)
Mean crops per pond per year
Number of Ponds Stocked Simultaneously
Interval between stocking (Days)
Winter fallow (Days)
Start Date (week,month,year)
LastHarvestDate (week,month,year)
Number cycles last 5 yrs (inc. this one)
Sto
ckin
g
Sto
ckin
g
SeedSource CD
TilapiaBreedingObservedYN
Sele
ct o
ne
SeedAvgWeight (g)
Seed Avg Length(cm)
Seed Avg Depth (cm)
Juvenile Stage (Days)
MeanSeedCost
CostUnits
StockingDensity No/m2[ ] m
3[ ]
Har
vest
ing
Sele
ct
on
e
Avg Weight at Harvest (kg)
Avg Pieces/kg (shrimp/prawn)
Avg Sale Size - Minimum
Avg Sale Size - Maximum
Total marketed harvest (t)
Survival to harvest %
Removed losses to harvest kg
Delayed Harvest Reason CD
Advanced Harvest Reason CD
Mar
keti
ng
Mar
keti
ng
SalesTypeCD
Avg Price/kg
Min Price/kg
Max Price/kg
Distance to market (km)*
Time to market (hrs)*
*Only if not sold at farmgate

396
Q6b Main change in aquaculture production patterns over the last 5 yrs Table 6.4 Other non-stocked catches present in ponds? Yes [ ] No [ ] Answer following questions only if the answer is yes Non-stockedSpeciesCD
Total Production
ProductionUnitsCD
MainUseCD
TotalValue
Table 6.5 Integrated agricultural production during last cycle (e.g. pond dyke production, rice, orchard etc)
AgriSpecies CD FarmSub System CD
Area Cultivated
Area Units ProductionUseCD
Table 6.6 Animals on farm
AnimalCD Count of Animals Production useCD
Inte
grat
e
d (
cou
nt)
No
t-
inte
grat
e
d (
cou
nt)
Wild
anim
als
(Ye
sNo
Yes/ No Rats/ rodents
Birds
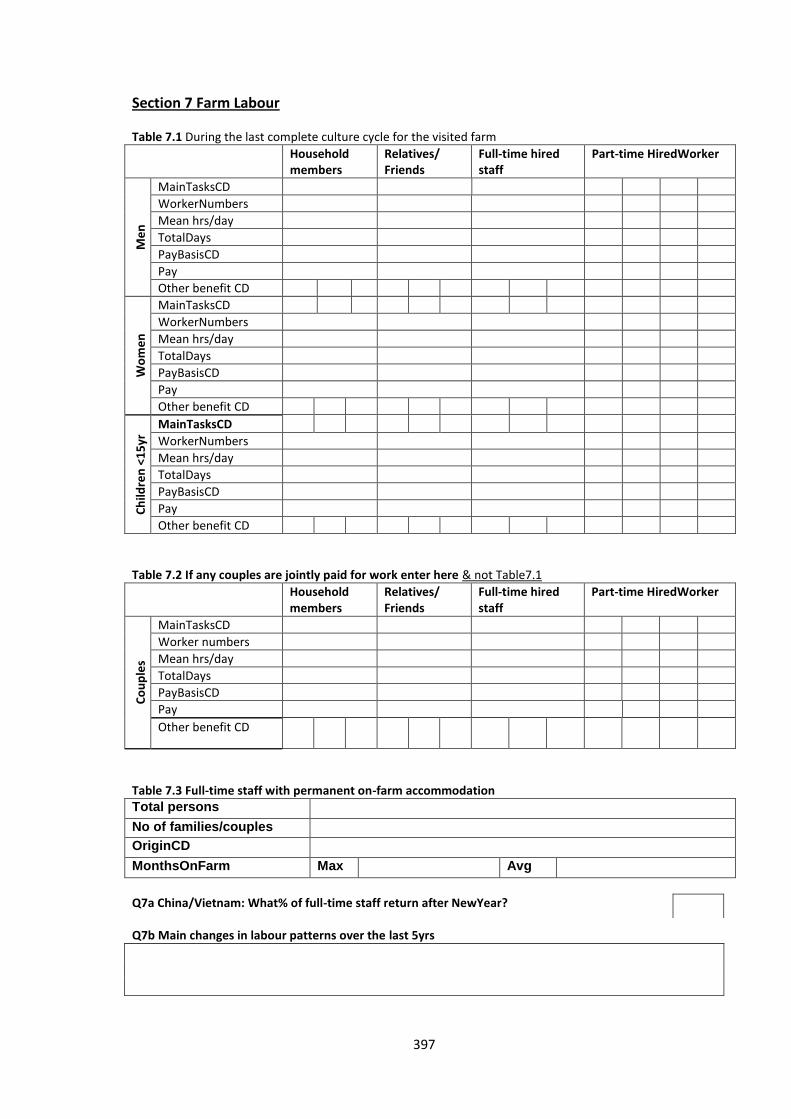
397
Section 7 Farm Labour Table 7.1 During the last complete culture cycle for the visited farm
Household members
Relatives/ Friends
Full-time hired staff
Part-time HiredWorker M
en
MainTasksCD
WorkerNumbers
Mean hrs/day
TotalDays
PayBasisCD
Pay
Other benefit CD
Wo
me
n
MainTasksCD
WorkerNumbers
Mean hrs/day
TotalDays
PayBasisCD
Pay
Other benefit CD
Ch
ildre
n <
15
yr MainTasksCD
WorkerNumbers
Mean hrs/day
TotalDays
PayBasisCD
Pay
Other benefit CD
Table 7.2 If any couples are jointly paid for work enter here & not Table7.1
Household members
Relatives/ Friends
Full-time hired staff
Part-time HiredWorker
Co
up
les
MainTasksCD
Worker numbers
Mean hrs/day
TotalDays
PayBasisCD
Pay
Other benefit CD
Table 7.3 Full-time staff with permanent on-farm accommodation Total persons
No of families/couples
OriginCD
MonthsOnFarm Max Avg
Q7a China/Vietnam: What% of full-time staff return after NewYear? Q7b Main changes in labour patterns over the last 5yrs
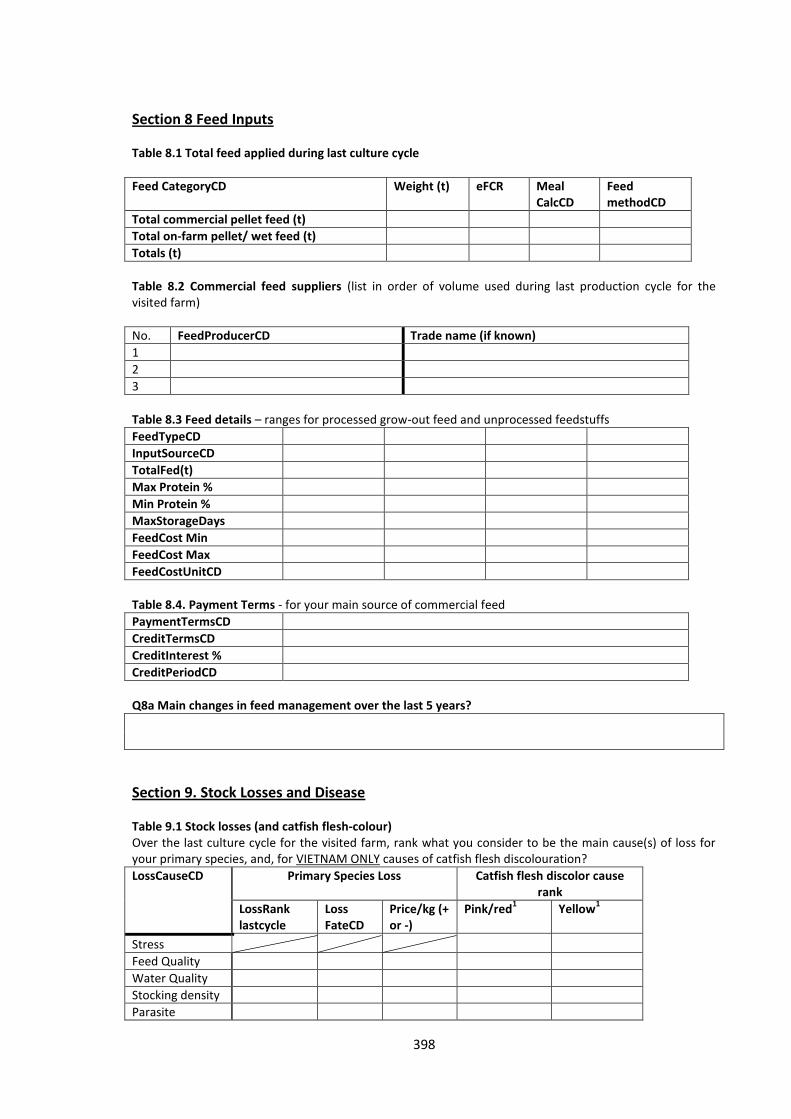
398
Section 8 Feed Inputs Table 8.1 Total feed applied during last culture cycle
Feed CategoryCD Weight (t) eFCR Meal CalcCD
Feed methodCD
Total commercial pellet feed (t)
Total on-farm pellet/ wet feed (t)
Totals (t)
Table 8.2 Commercial feed suppliers (list in order of volume used during last production cycle for the visited farm)
No. FeedProducerCD Trade name (if known)
1
2
3
Table 8.3 Feed details – ranges for processed grow-out feed and unprocessed feedstuffs
FeedTypeCD
InputSourceCD
TotalFed(t)
Max Protein %
Min Protein %
MaxStorageDays
FeedCost Min
FeedCost Max
FeedCostUnitCD
Table 8.4. Payment Terms - for your main source of commercial feed
PaymentTermsCD
CreditTermsCD
CreditInterest %
CreditPeriodCD
Q8a Main changes in feed management over the last 5 years?
Section 9. Stock Losses and Disease Table 9.1 Stock losses (and catfish flesh-colour) Over the last culture cycle for the visited farm, rank what you consider to be the main cause(s) of loss for your primary species, and, for VIETNAM ONLY causes of catfish flesh discolouration?
LossCauseCD Primary Species Loss Catfish flesh discolor cause rank
LossRank lastcycle
Loss FateCD
Price/kg (+ or -)
Pink/red1
Yellow
1
Stress
Feed Quality
Water Quality
Stocking density
Parasite
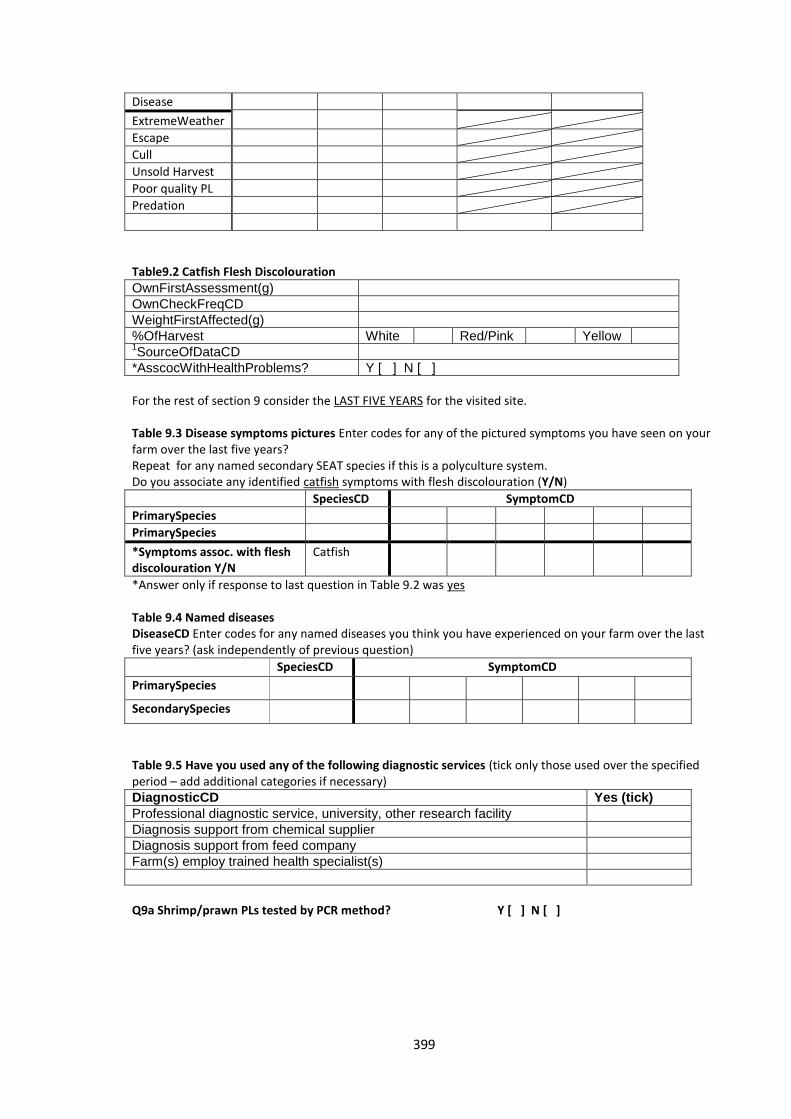
399
Disease
ExtremeWeather
Escape
Cull
Unsold Harvest
Poor quality PL
Predation
Table9.2 Catfish Flesh Discolouration
OwnFirstAssessment(g)
OwnCheckFreqCD
WeightFirstAffected(g)
%OfHarvest White Red/Pink Yellow 1SourceOfDataCD
*AsscocWithHealthProblems? Y [ ] N [ ]
For the rest of section 9 consider the LAST FIVE YEARS for the visited site. Table 9.3 Disease symptoms pictures Enter codes for any of the pictured symptoms you have seen on your farm over the last five years? Repeat for any named secondary SEAT species if this is a polyculture system. Do you associate any identified catfish symptoms with flesh discolouration (Y/N)
SpeciesCD SymptomCD
PrimarySpecies
PrimarySpecies
*Symptoms assoc. with flesh discolouration Y/N
Catfish
*Answer only if response to last question in Table 9.2 was yes Table 9.4 Named diseases DiseaseCD Enter codes for any named diseases you think you have experienced on your farm over the last five years? (ask independently of previous question)
SpeciesCD SymptomCD
PrimarySpecies
SecondarySpecies
Table 9.5 Have you used any of the following diagnostic services (tick only those used over the specified period – add additional categories if necessary) DiagnosticCD Yes (tick)
Professional diagnostic service, university, other research facility
Diagnosis support from chemical supplier
Diagnosis support from feed company
Farm(s) employ trained health specialist(s)
Q9a Shrimp/prawn PLs tested by PCR method? Y [ ] N [ ]

400
Section 10 Water Management Table 10.1 Source and Storage
Sou
rce&
Sto
rage
Main water source CD
DistanceToMainSourceIfPumped(km)
Secondary water source CD
WaterStorageMethodCD
MinStorageBeforeUse (days)
Recirculate&ReuseWaterCD No [ ] Partially [ ] Fully [ ]
Table 10.2 Ignore the next questions on replacement and discharge if response to the last question was ‘Fully’ re-circulated (i.e. water top-up but no discharge)
Dis
char
ge
Max water replacement (@max density)
% [ ] Depth [ ] cm
Water replacement freq (@max density)
DischargeMethodCD
DischageRouteCD
Main water discharge to CD
Effluent treatment method CD
EffluentAgreementCD
Table 10.3 Sediment removal and water quality
Sed
imen
t
Sediment removal frequency CD
Fate of sedimentCD
Regular (min monthly) water monitoring Salinity[ ] min:_______max:_________ pH[ ] NH3[ ] NO3[ ] NO2 [ ] Alk [ ] oC[ ] DO[ ]
Q10a Changes in water management over the last 5 years
Section 11 Other Inputs Table 11.1 Fertilizers
FertTypeCD TotalUse UseUnitsCD Total Cost
*Fert WhenCD
*Fert WhereCD
* Only if human or other animal excreta is used for fertilisation Table 11.2 Soil/water treatment Inc. probiotics (effective micro-organisms), antibiotics, disinfectants, pesticides and alkalines
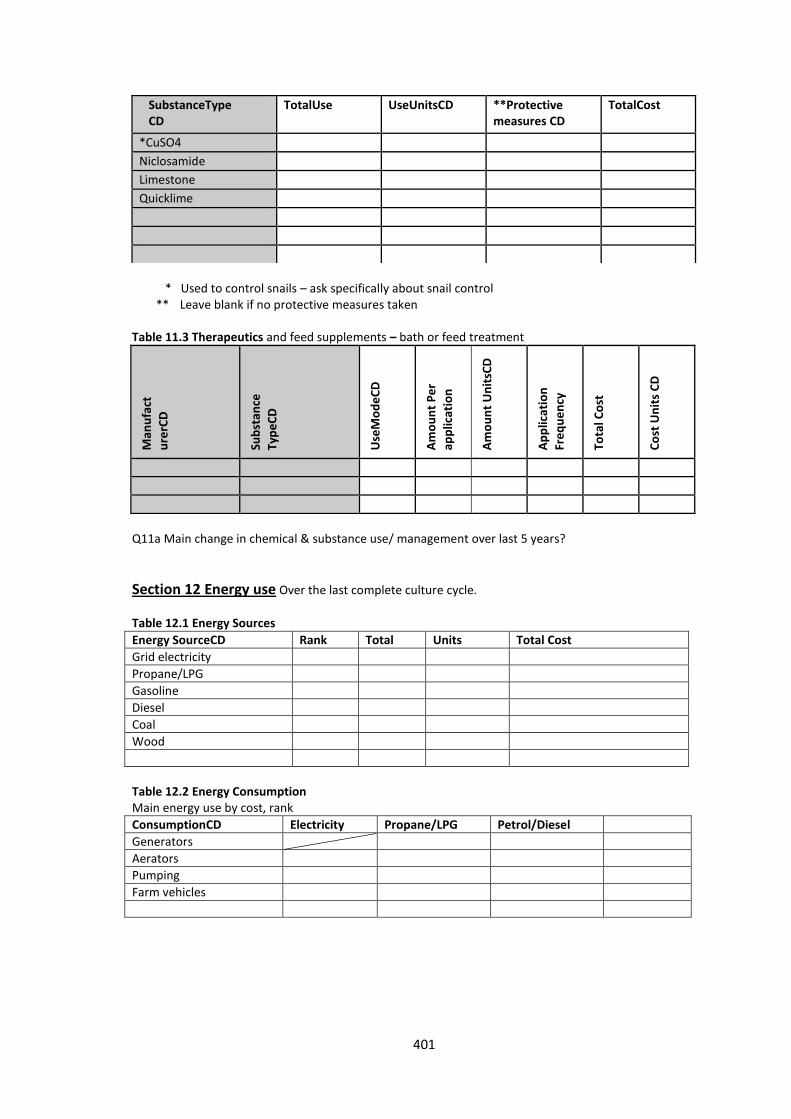
401
* Used to control snails – ask specifically about snail control ** Leave blank if no protective measures taken
Table 11.3 Therapeutics and feed supplements – bath or feed treatment
Man
ufa
ct
ure
rCD
Sub
stan
ce
Typ
eC
D
Use
Mo
de
CD
Am
ou
nt
Pe
r
app
licat
ion
Am
ou
nt
Un
itsC
D
Ap
plic
atio
n
Fre
qu
en
cy
Tota
l Co
st
Co
st U
nit
s C
D
Q11a Main change in chemical & substance use/ management over last 5 years?
Section 12 Energy use Over the last complete culture cycle.
Table 12.1 Energy Sources
Energy SourceCD Rank Total Units Total Cost
Grid electricity
Propane/LPG
Gasoline
Diesel
Coal
Wood
Table 12.2 Energy Consumption Main energy use by cost, rank
ConsumptionCD Electricity Propane/LPG Petrol/Diesel
Generators
Aerators
Pumping
Farm vehicles
SubstanceType CD
TotalUse UseUnitsCD **Protective measures CD
TotalCost
*CuSO4
Niclosamide
Limestone
Quicklime
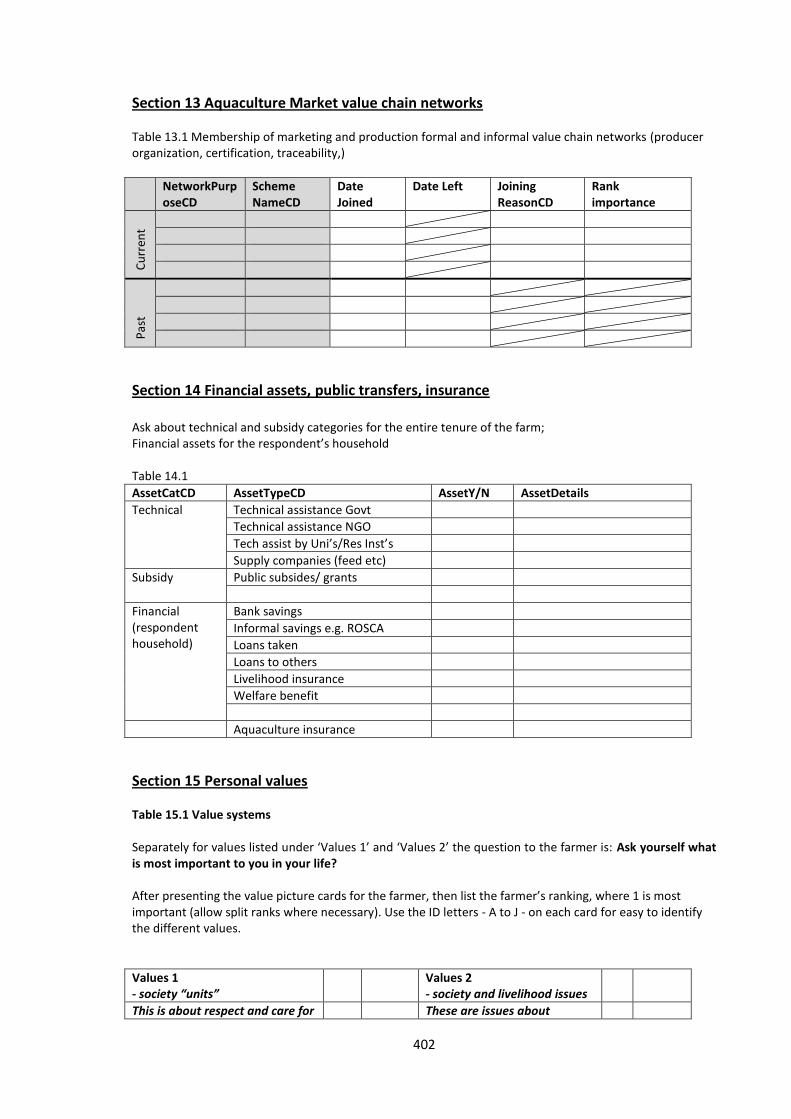
402
Section 13 Aquaculture Market value chain networks Table 13.1 Membership of marketing and production formal and informal value chain networks (producer organization, certification, traceability,)
NetworkPurposeCD
Scheme NameCD
Date Joined
Date Left Joining ReasonCD
Rank importance
Cu
rren
t
Pas
t
Section 14 Financial assets, public transfers, insurance Ask about technical and subsidy categories for the entire tenure of the farm; Financial assets for the respondent’s household Table 14.1
AssetCatCD AssetTypeCD AssetY/N AssetDetails
Technical Technical assistance Govt
Technical assistance NGO
Tech assist by Uni’s/Res Inst’s
Supply companies (feed etc)
Subsidy Public subsides/ grants
Financial (respondent household)
Bank savings
Informal savings e.g. ROSCA
Loans taken
Loans to others
Livelihood insurance
Welfare benefit
Aquaculture insurance
Section 15 Personal values Table 15.1 Value systems Separately for values listed under ‘Values 1’ and ‘Values 2’ the question to the farmer is: Ask yourself what is most important to you in your life? After presenting the value picture cards for the farmer, then list the farmer’s ranking, where 1 is most important (allow split ranks where necessary). Use the ID letters - A to J - on each card for easy to identify the different values.
Values 1 - society “units”
Values 2 - society and livelihood issues
This is about respect and care for These are issues about

403
the different “units” ID
Rank
attitudes and focus areas for having a good society and livelihood
ID
Rank
Personal prosperity, hapiness and well-being
A
Health, safety and income security
A
Family and household B
Equal personal opportunities for such as gender, age, class
B
Friends and relatives C
Individual freedom to such as speech, vote, religion
C
Local community D
Respect between humans D
Country E
Collaboration and cooperation in community
E
Animals and nature F Social harmony F
Future generations of community and country
G
Environmental concerns G
Religion and God H
Strong political leadership H
Other values
Other values
Other Values
Other values
Q15a Would you like to make any further comments based on your understanding of the purpose of this survey
Q15b Would you be willing to participate in a follow-up survey at a later date Y[ ] N[ ]
Section 16 Visual Observation Try to answer all the remaining questions using visual observation (ask the farmer only where visibility is limited e.g. for a very large farm) Q16a Was the farmer willing/happy to participate? Y[ ] N[ ] Q16b Comments on farmer behavior & attitude
Q16c Did the named respondent answer all of the questions? Y[ ] N[ ] Q16d If not why and whom answered which questions?
Q16e Which language(s) did the farmer speak?
English Mandarin Leizhou Bangla
Cantonese Thai Burmese
Lao Khmer Vietnamese
Q16f What precautions are taken against predators and poaching
Q16g Height of dyke above maximum operational water level ____ (m) Q16h Hygiene: sealed latrine visible on visited site? Y[ ] N[ ]
Predator/PoachingPrecautionCD
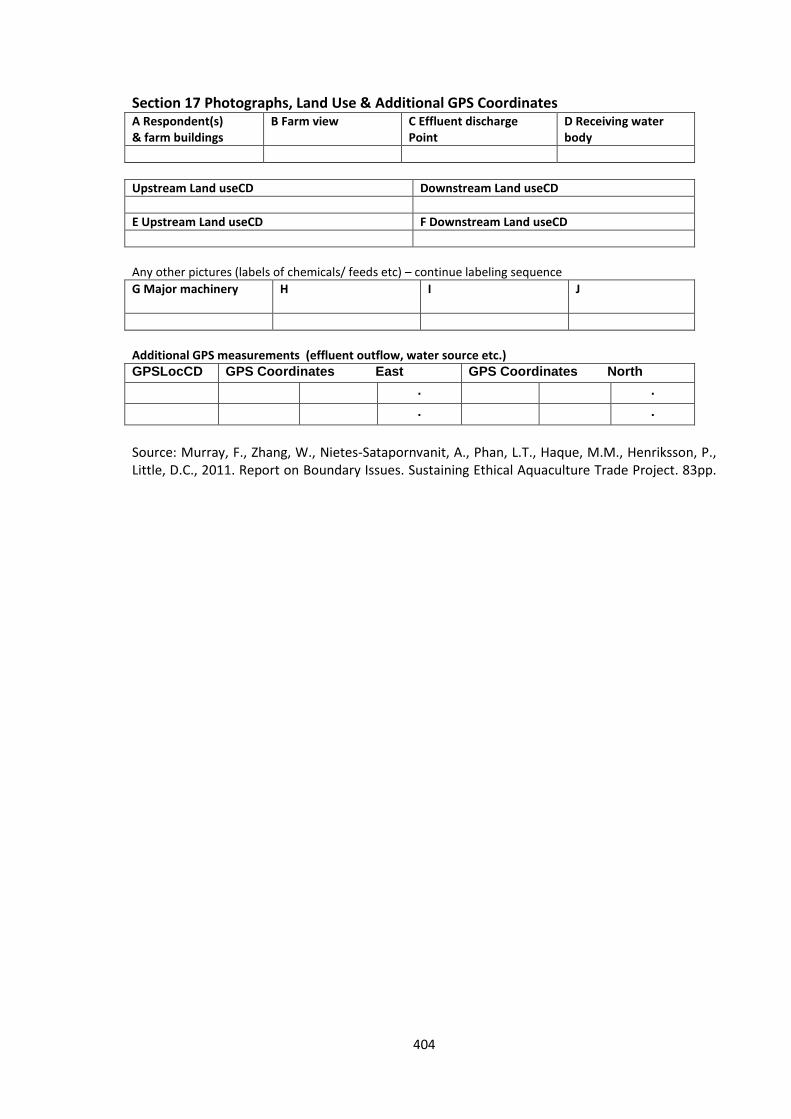
404
Section 17 Photographs, Land Use & Additional GPS Coordinates A Respondent(s) & farm buildings
B Farm view C Effluent discharge Point
D Receiving water body
Upstream Land useCD Downstream Land useCD
E Upstream Land useCD F Downstream Land useCD
Any other pictures (labels of chemicals/ feeds etc) – continue labeling sequence
G Major machinery H
I J
Additional GPS measurements (effluent outflow, water source etc.) GPSLocCD GPS Coordinates East GPS Coordinates North
. .
. .
Source: Murray, F., Zhang, W., Nietes-Satapornvanit, A., Phan, L.T., Haque, M.M., Henriksson, P., Little, D.C., 2011. Report on Boundary Issues. Sustaining Ethical Aquaculture Trade Project. 83pp.

405
Appendix 5. Questionnaire for Shrimp Transition Survey
PART 1. Telephone Survey 1. Survey Details
1.1. SurveyCD Date*
1.2. Interview Date
1.3. Enumerator
1.4. Respondent Full Name
1.5. Farm RoleCD (manager, owner etc)
1.6. Same Respondent? Yes/No ** Survey 1 Survey 2
1.7. Telephone number(s)
1.8. Gender M: F:
* Date of integrated survey (remind the respondent of this date) ** Survey 1 = Integrated survey Survey 2 = WP5 livelihoods
2.1 Farming transition status Are you farming as normal or have there been some changes?
Change Status Tick Month & Year
1 Farming as normal i.e. no significant change
2 Farming as normal with some changes
3 Temporarily stopped farming and already restarted
4 Temporarily stopped farming with planned restart date
5 Temporarily stopped with no planned restart date
6 Permanently stopped farming
7 Plan to stop temporarily in near future
8 Plan to stop permanently in near future
2.2 (only ask if farmer has made the decision to stop farming permanently or temporarily from Q2 items 3-8) Why did you (or do you plan to) permanently or temporarily stop farming?
Stop cause Give details
Stock loss disease
Stock loss other
Seed quality
Low sales price
Lack operational finance
Lack capital finance
Have new business
Land access
Water access
Regulatory burden
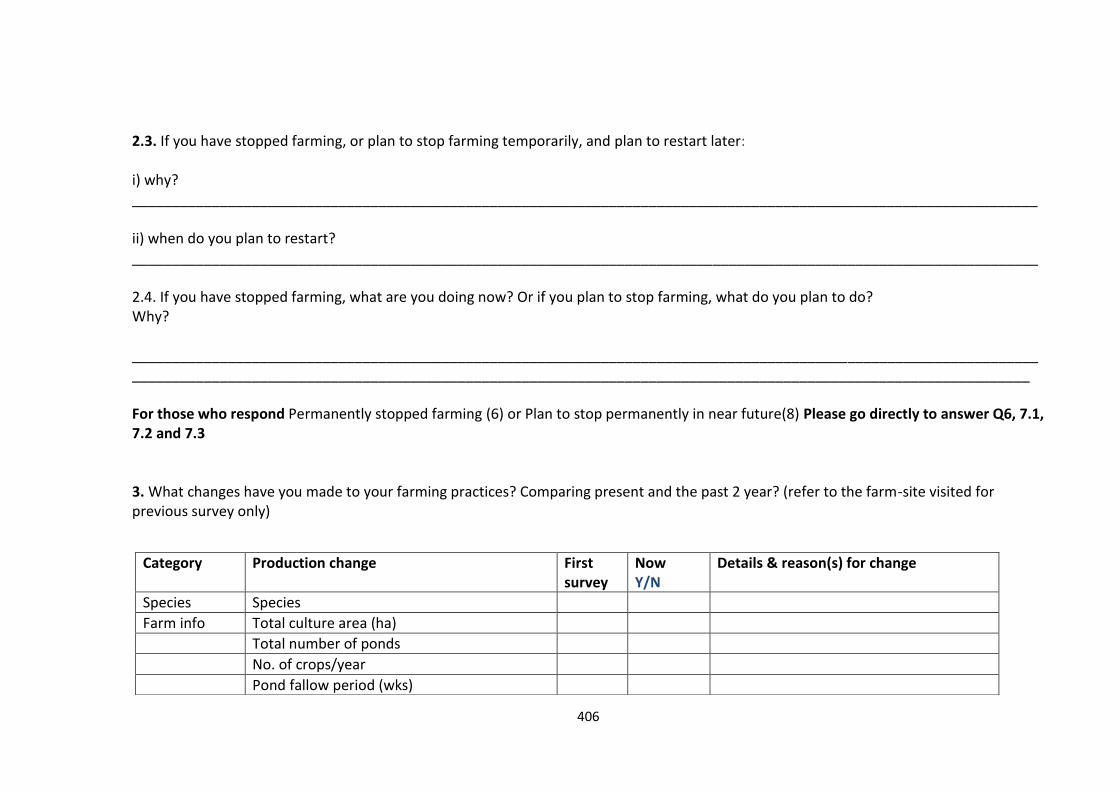
406
2.3. If you have stopped farming, or plan to stop farming temporarily, and plan to restart later: i) why? __________________________________________________________________________________________________________________ ii) when do you plan to restart? __________________________________________________________________________________________________________________ 2.4. If you have stopped farming, what are you doing now? Or if you plan to stop farming, what do you plan to do? Why? __________________________________________________________________________________________________________________ _________________________________________________________________________________________________________________ For those who respond Permanently stopped farming (6) or Plan to stop permanently in near future(8) Please go directly to answer Q6, 7.1, 7.2 and 7.3 3. What changes have you made to your farming practices? Comparing present and the past 2 year? (refer to the farm-site visited for previous survey only)
Category Production change First survey
Now Y/N
Details & reason(s) for change
Species Species
Farm info Total culture area (ha)
Total number of ponds
No. of crops/year
Pond fallow period (wks)
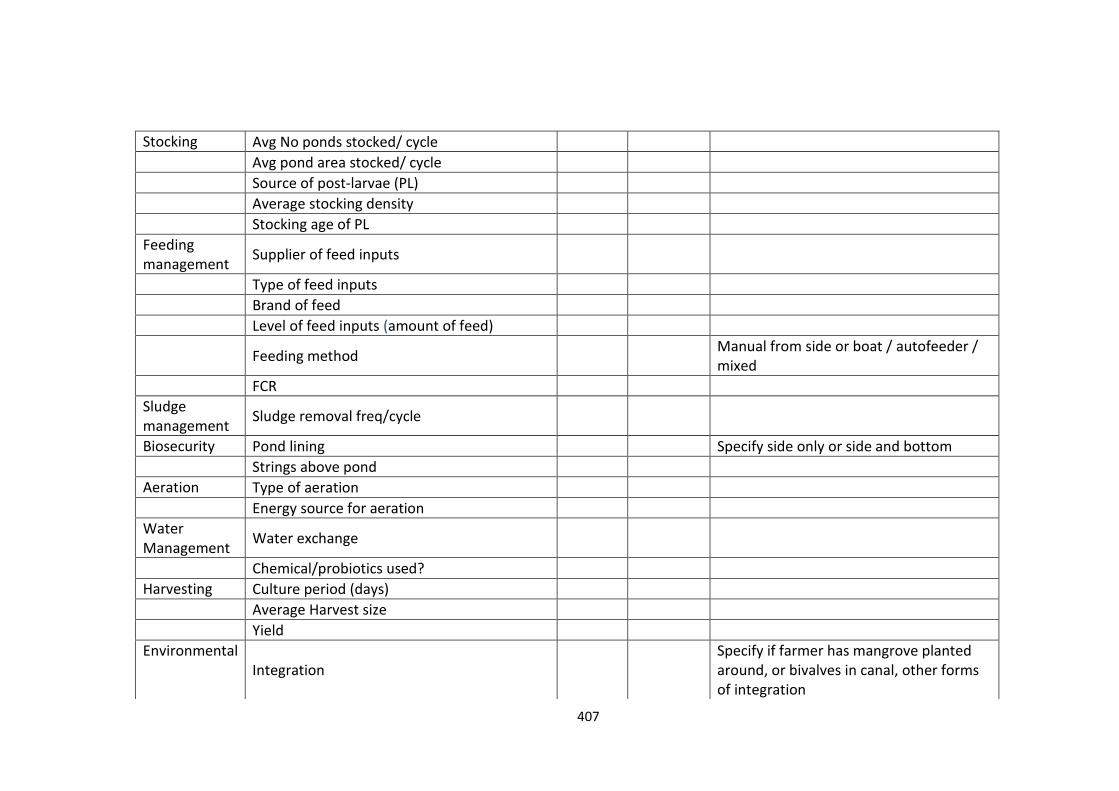
407
Stocking Avg No ponds stocked/ cycle
Avg pond area stocked/ cycle
Source of post-larvae (PL)
Average stocking density
Stocking age of PL
Feeding management
Supplier of feed inputs
Type of feed inputs
Brand of feed
Level of feed inputs (amount of feed)
Feeding method
Manual from side or boat / autofeeder / mixed
FCR
Sludge management
Sludge removal freq/cycle
Biosecurity Pond lining Specify side only or side and bottom
Strings above pond
Aeration Type of aeration
Energy source for aeration
Water Management
Water exchange
Chemical/probiotics used?
Harvesting Culture period (days)
Average Harvest size
Yield
Environmental Integration
Specify if farmer has mangrove planted around, or bivalves in canal, other forms of integration
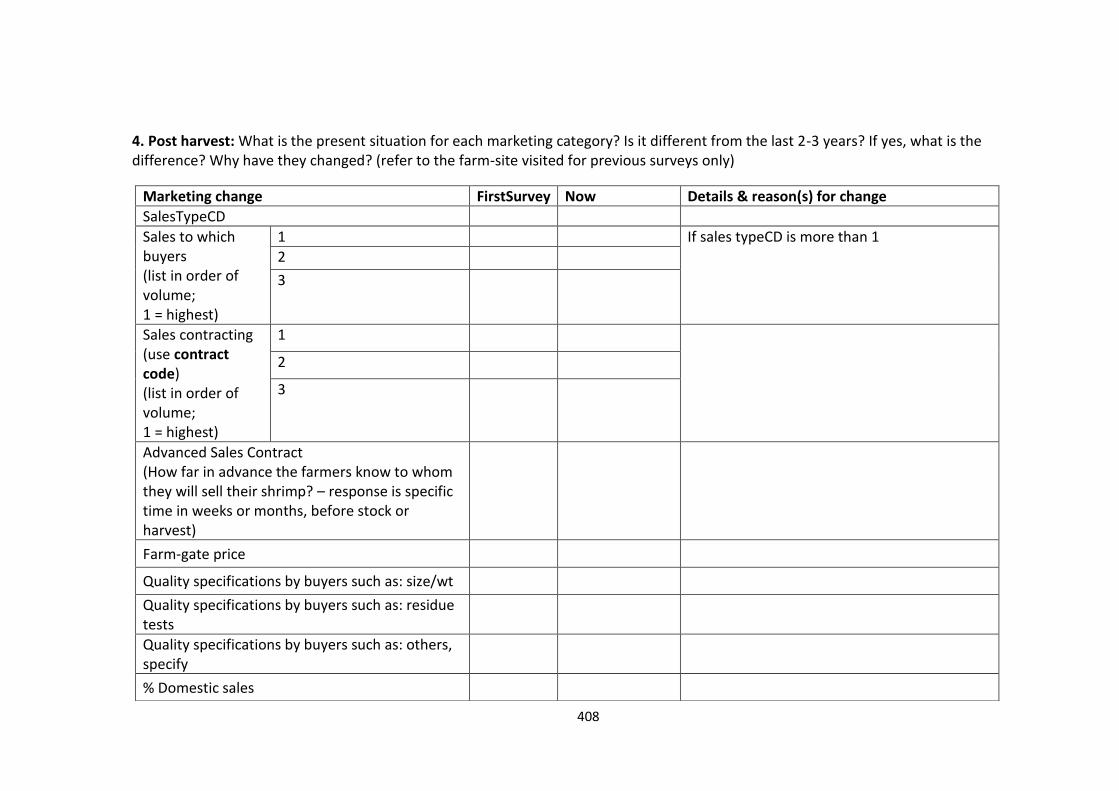
408
4. Post harvest: What is the present situation for each marketing category? Is it different from the last 2-3 years? If yes, what is the difference? Why have they changed? (refer to the farm-site visited for previous surveys only)
Marketing change FirstSurvey Now Details & reason(s) for change
SalesTypeCD
Sales to which buyers (list in order of volume; 1 = highest)
1 If sales typeCD is more than 1
2
3
Sales contracting (use contract code) (list in order of volume; 1 = highest)
1
2
3
Advanced Sales Contract (How far in advance the farmers know to whom they will sell their shrimp? – response is specific time in weeks or months, before stock or harvest)
Farm-gate price
Quality specifications by buyers such as: size/wt
Quality specifications by buyers such as: residue tests
Quality specifications by buyers such as: others, specify
% Domestic sales
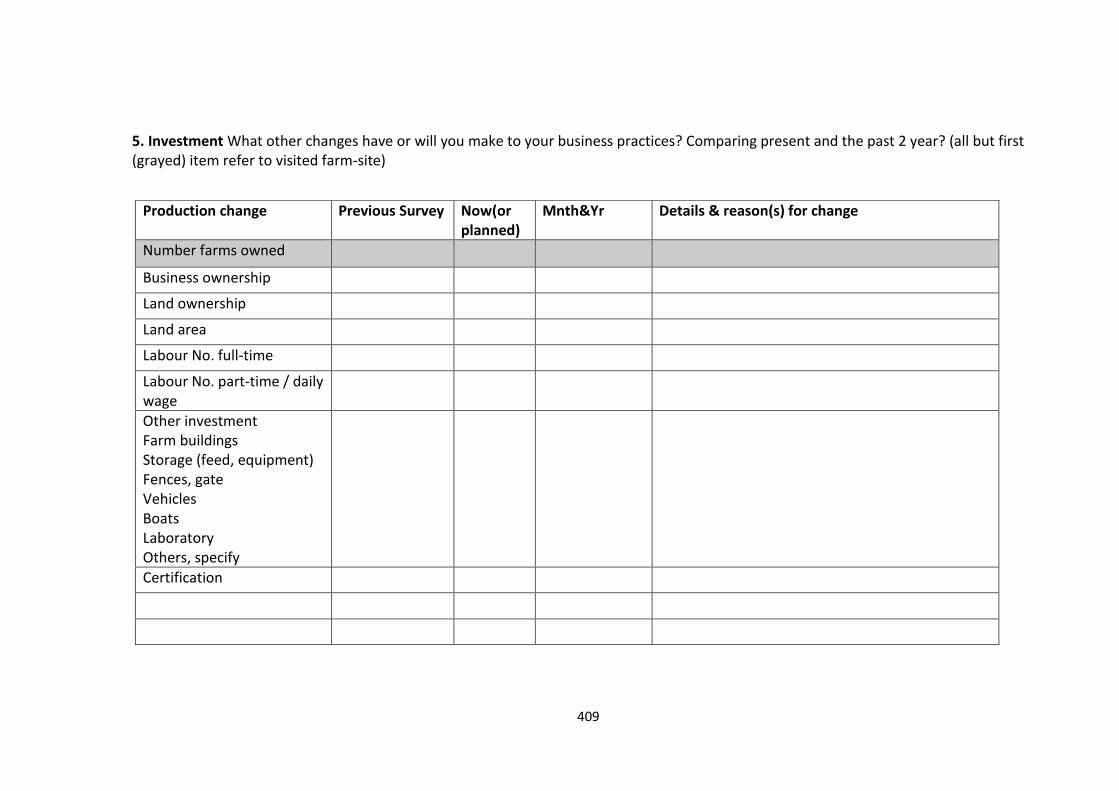
409
5. Investment What other changes have or will you make to your business practices? Comparing present and the past 2 year? (all but first (grayed) item refer to visited farm-site)
Production change Previous Survey Now(or
planned) Mnth&Yr Details & reason(s) for change
Number farms owned
Business ownership
Land ownership
Land area
Labour No. full-time
Labour No. part-time / daily wage
Other investment Farm buildings Storage (feed, equipment) Fences, gate Vehicles Boats Laboratory Others, specify
Certification
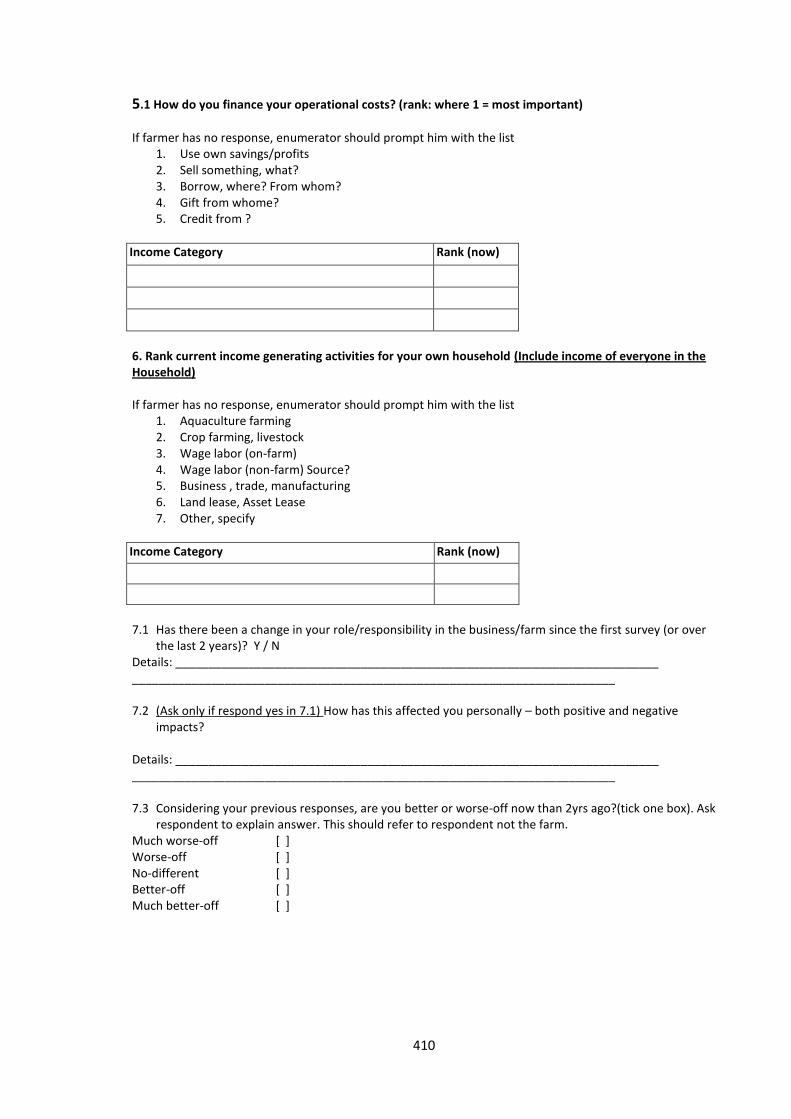
410
5.1 How do you finance your operational costs? (rank: where 1 = most important)
If farmer has no response, enumerator should prompt him with the list
1. Use own savings/profits 2. Sell something, what? 3. Borrow, where? From whom? 4. Gift from whome? 5. Credit from ?
Income Category Rank (now)
6. Rank current income generating activities for your own household (Include income of everyone in the Household) If farmer has no response, enumerator should prompt him with the list
1. Aquaculture farming 2. Crop farming, livestock 3. Wage labor (on-farm) 4. Wage labor (non-farm) Source? 5. Business , trade, manufacturing 6. Land lease, Asset Lease 7. Other, specify
Income Category Rank (now)
7.1 Has there been a change in your role/responsibility in the business/farm since the first survey (or over
the last 2 years)? Y / N Details: _________________________________________________________________________ _________________________________________________________________________ 7.2 (Ask only if respond yes in 7.1) How has this affected you personally – both positive and negative
impacts? Details: _________________________________________________________________________ _________________________________________________________________________ 7.3 Considering your previous responses, are you better or worse-off now than 2yrs ago?(tick one box). Ask
respondent to explain answer. This should refer to respondent not the farm. Much worse-off [ ] Worse-off [ ] No-different [ ] Better-off [ ] Much better-off [ ]
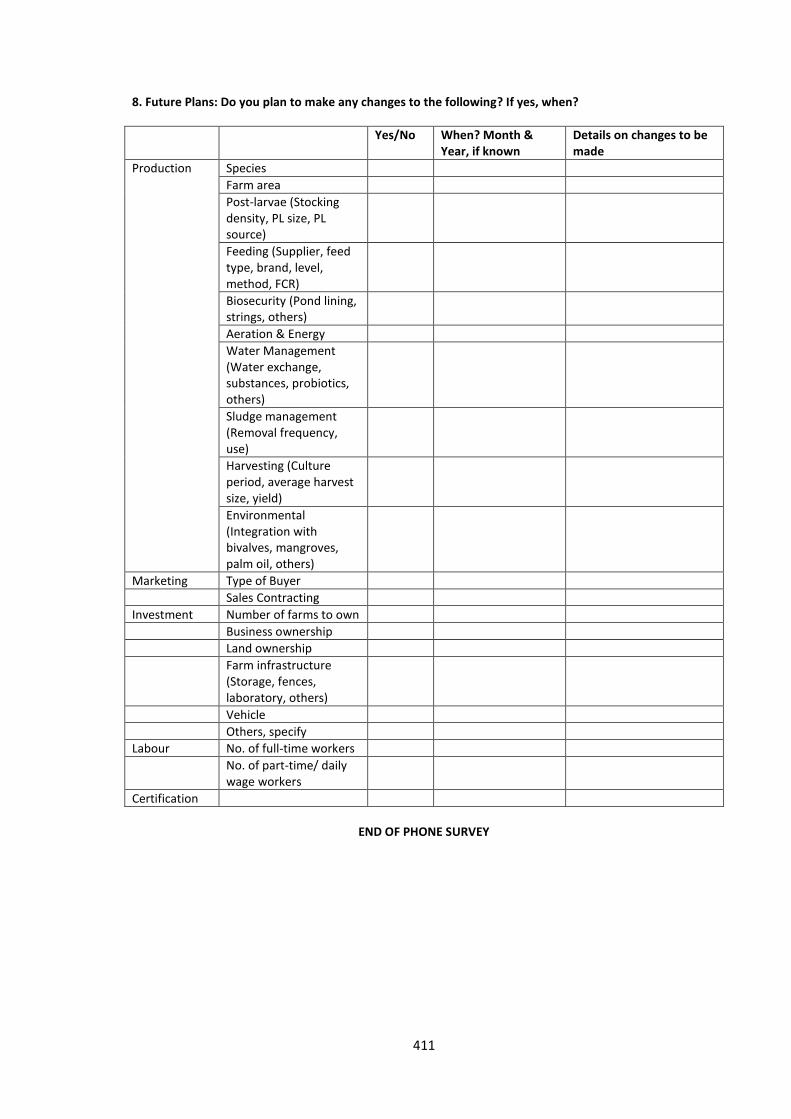
411
8. Future Plans: Do you plan to make any changes to the following? If yes, when?
Yes/No When? Month & Year, if known
Details on changes to be made
Production Species
Farm area
Post-larvae (Stocking density, PL size, PL source)
Feeding (Supplier, feed type, brand, level, method, FCR)
Biosecurity (Pond lining, strings, others)
Aeration & Energy
Water Management (Water exchange, substances, probiotics, others)
Sludge management (Removal frequency, use)
Harvesting (Culture period, average harvest size, yield)
Environmental (Integration with bivalves, mangroves, palm oil, others)
Marketing Type of Buyer
Sales Contracting
Investment Number of farms to own
Business ownership
Land ownership
Farm infrastructure (Storage, fences, laboratory, others)
Vehicle
Others, specify
Labour No. of full-time workers
No. of part-time/ daily wage workers
Certification
END OF PHONE SURVEY
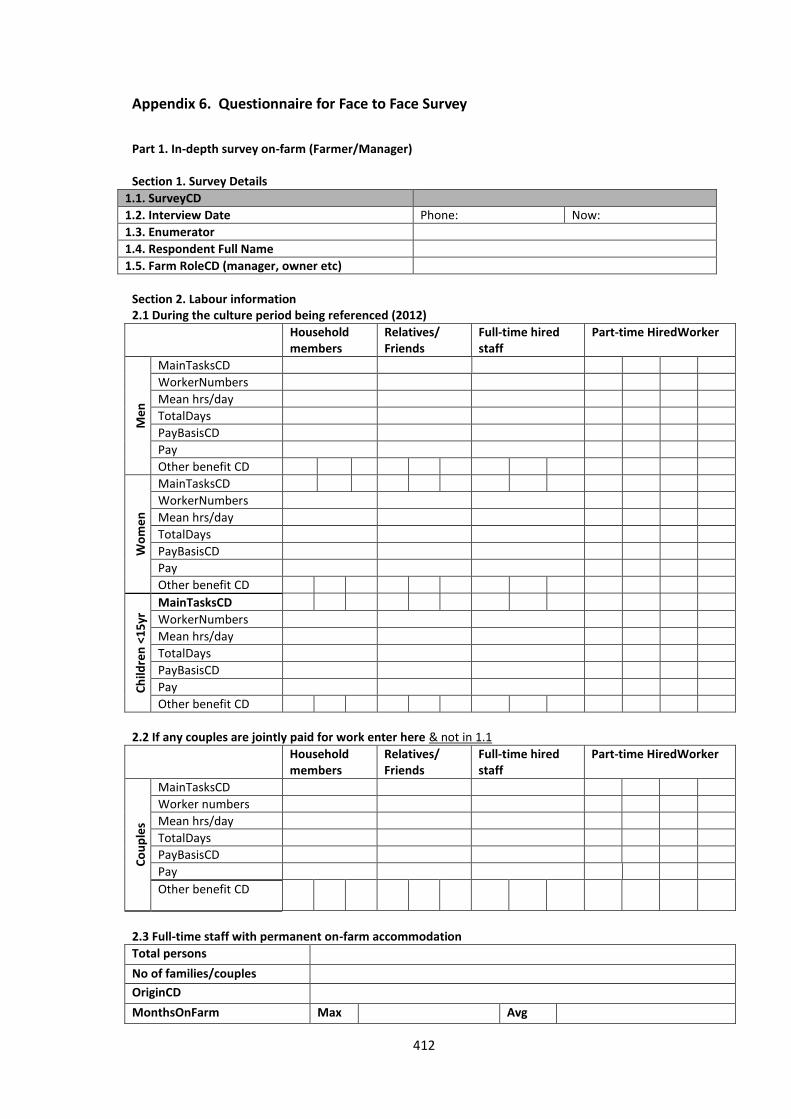
412
Appendix 6. Questionnaire for Face to Face Survey
Part 1. In-depth survey on-farm (Farmer/Manager) Section 1. Survey Details
1.1. SurveyCD
1.2. Interview Date Phone: Now:
1.3. Enumerator
1.4. Respondent Full Name
1.5. Farm RoleCD (manager, owner etc)
Section 2. Labour information 2.1 During the culture period being referenced (2012)
Household members
Relatives/ Friends
Full-time hired staff
Part-time HiredWorker
Me
n
MainTasksCD
WorkerNumbers
Mean hrs/day
TotalDays
PayBasisCD
Pay
Other benefit CD
Wo
me
n
MainTasksCD
WorkerNumbers
Mean hrs/day
TotalDays
PayBasisCD
Pay
Other benefit CD
Ch
ildre
n <
15
yr MainTasksCD
WorkerNumbers
Mean hrs/day
TotalDays
PayBasisCD
Pay
Other benefit CD
2.2 If any couples are jointly paid for work enter here & not in 1.1
Household members
Relatives/ Friends
Full-time hired staff
Part-time HiredWorker
Co
up
les
MainTasksCD
Worker numbers
Mean hrs/day
TotalDays
PayBasisCD
Pay
Other benefit CD
2.3 Full-time staff with permanent on-farm accommodation
Total persons
No of families/couples
OriginCD
MonthsOnFarm Max Avg
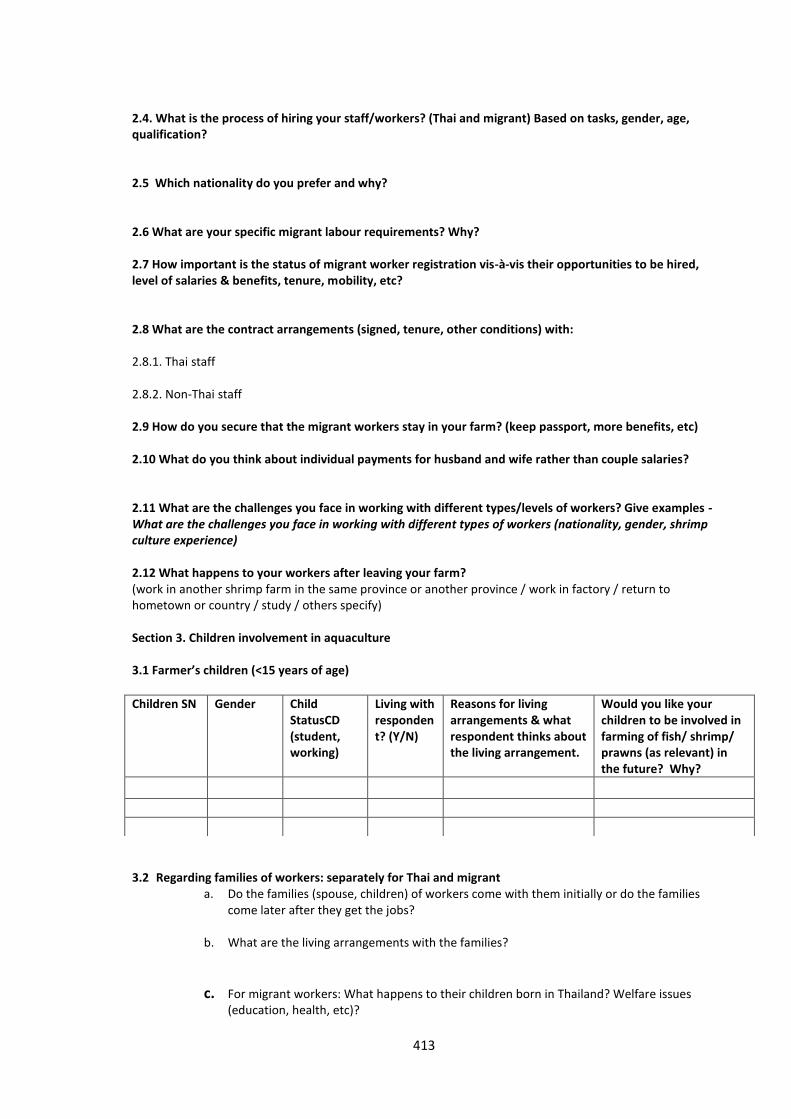
413
2.4. What is the process of hiring your staff/workers? (Thai and migrant) Based on tasks, gender, age, qualification? 2.5 Which nationality do you prefer and why? 2.6 What are your specific migrant labour requirements? Why? 2.7 How important is the status of migrant worker registration vis-à-vis their opportunities to be hired, level of salaries & benefits, tenure, mobility, etc? 2.8 What are the contract arrangements (signed, tenure, other conditions) with: 2.8.1. Thai staff 2.8.2. Non-Thai staff 2.9 How do you secure that the migrant workers stay in your farm? (keep passport, more benefits, etc) 2.10 What do you think about individual payments for husband and wife rather than couple salaries? 2.11 What are the challenges you face in working with different types/levels of workers? Give examples - What are the challenges you face in working with different types of workers (nationality, gender, shrimp culture experience) 2.12 What happens to your workers after leaving your farm? (work in another shrimp farm in the same province or another province / work in factory / return to hometown or country / study / others specify) Section 3. Children involvement in aquaculture 3.1 Farmer’s children (<15 years of age)
3.2 Regarding families of workers: separately for Thai and migrant
a. Do the families (spouse, children) of workers come with them initially or do the families come later after they get the jobs?
b. What are the living arrangements with the families?
c. For migrant workers: What happens to their children born in Thailand? Welfare issues (education, health, etc)?
Children SN Gender Child StatusCD (student, working)
Living with respondent? (Y/N)
Reasons for living arrangements & what respondent thinks about the living arrangement.
Would you like your children to be involved in farming of fish/ shrimp/ prawns (as relevant) in the future? Why?

414
Section 4. Sustainability perceptions 4.1 What factors do you foresee that could positively or negatively affect your farms performance over the next 1-2 years? Note: If the respondent is not the owner or the manager - the question should address the employee’s perceptions of factor likely to influence his future with the enterprise. Factors that could be either +ve or –ve (e.g. product price) should be entered in the ‘uncertain’ section.
4.2 Rank the specified factors in order of importance for the enterprise 4.3 What do you plan to do about the specified sustainability factors (leave blank if nothing). 4.4 Why are the factors different now from the first survey in 2010-2011? First Survey
SusFactorCD 4.1 Sustainability FactorCD
4.2 OverallRank 4.3 ResponseCD 4.4 Reasons for different responses
Ne
gati
ve
Po
siti
ve
Un
cert
ain
Ask respondent if we can interview one of their workers. If yes, go to Section 5 to ask the worker (next page) …
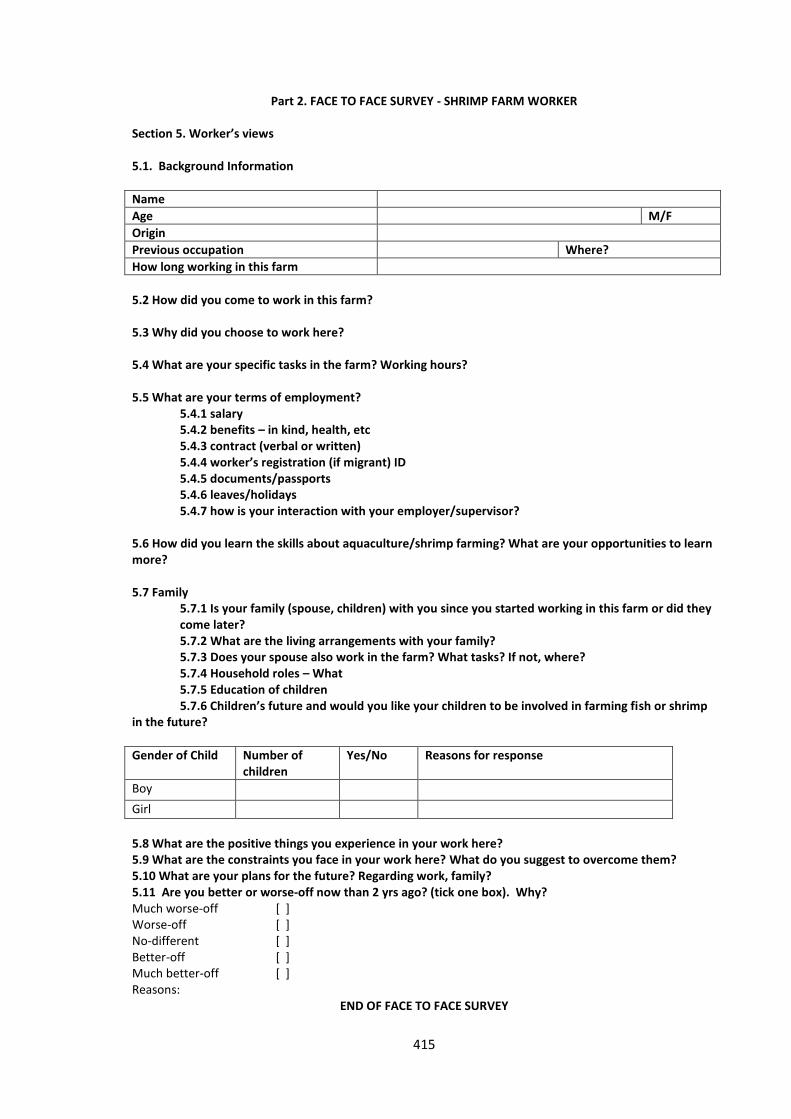
415
Part 2. FACE TO FACE SURVEY - SHRIMP FARM WORKER Section 5. Worker’s views 5.1. Background Information
Name
Age M/F
Origin
Previous occupation Where?
How long working in this farm
5.2 How did you come to work in this farm? 5.3 Why did you choose to work here? 5.4 What are your specific tasks in the farm? Working hours? 5.5 What are your terms of employment?
5.4.1 salary 5.4.2 benefits – in kind, health, etc 5.4.3 contract (verbal or written) 5.4.4 worker’s registration (if migrant) ID 5.4.5 documents/passports 5.4.6 leaves/holidays 5.4.7 how is your interaction with your employer/supervisor?
5.6 How did you learn the skills about aquaculture/shrimp farming? What are your opportunities to learn more? 5.7 Family
5.7.1 Is your family (spouse, children) with you since you started working in this farm or did they come later?
5.7.2 What are the living arrangements with your family? 5.7.3 Does your spouse also work in the farm? What tasks? If not, where?
5.7.4 Household roles – What 5.7.5 Education of children
5.7.6 Children’s future and would you like your children to be involved in farming fish or shrimp in the future?
Gender of Child Number of children
Yes/No Reasons for response
Boy
Girl
5.8 What are the positive things you experience in your work here? 5.9 What are the constraints you face in your work here? What do you suggest to overcome them? 5.10 What are your plans for the future? Regarding work, family? 5.11 Are you better or worse-off now than 2 yrs ago? (tick one box). Why? Much worse-off [ ] Worse-off [ ] No-different [ ] Better-off [ ] Much better-off [ ] Reasons:
END OF FACE TO FACE SURVEY
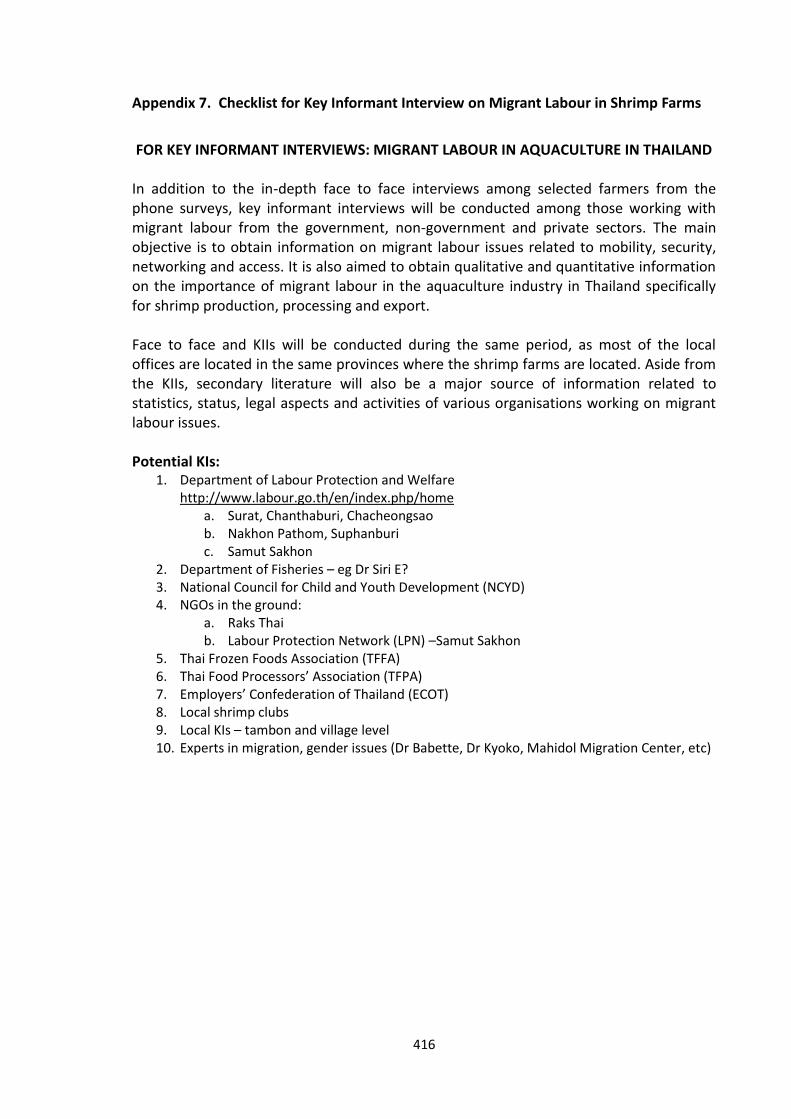
416
Appendix 7. Checklist for Key Informant Interview on Migrant Labour in Shrimp Farms
FOR KEY INFORMANT INTERVIEWS: MIGRANT LABOUR IN AQUACULTURE IN THAILAND
In addition to the in-depth face to face interviews among selected farmers from the phone surveys, key informant interviews will be conducted among those working with migrant labour from the government, non-government and private sectors. The main objective is to obtain information on migrant labour issues related to mobility, security, networking and access. It is also aimed to obtain qualitative and quantitative information on the importance of migrant labour in the aquaculture industry in Thailand specifically for shrimp production, processing and export. Face to face and KIIs will be conducted during the same period, as most of the local offices are located in the same provinces where the shrimp farms are located. Aside from the KIIs, secondary literature will also be a major source of information related to statistics, status, legal aspects and activities of various organisations working on migrant labour issues. Potential KIs:
1. Department of Labour Protection and Welfare http://www.labour.go.th/en/index.php/home
a. Surat, Chanthaburi, Chacheongsao b. Nakhon Pathom, Suphanburi c. Samut Sakhon
2. Department of Fisheries – eg Dr Siri E? 3. National Council for Child and Youth Development (NCYD) 4. NGOs in the ground:
a. Raks Thai b. Labour Protection Network (LPN) –Samut Sakhon
5. Thai Frozen Foods Association (TFFA) 6. Thai Food Processors’ Association (TFPA) 7. Employers’ Confederation of Thailand (ECOT) 8. Local shrimp clubs 9. Local KIs – tambon and village level 10. Experts in migration, gender issues (Dr Babette, Dr Kyoko, Mahidol Migration Center, etc)
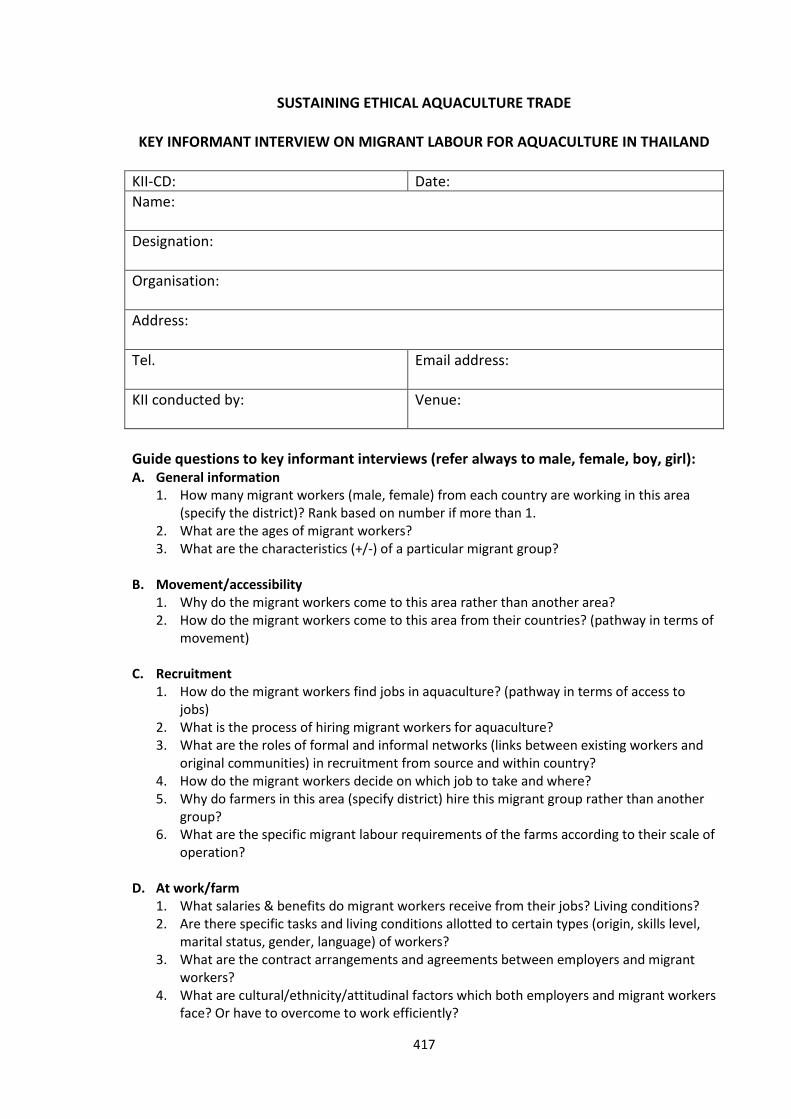
417
SUSTAINING ETHICAL AQUACULTURE TRADE
KEY INFORMANT INTERVIEW ON MIGRANT LABOUR FOR AQUACULTURE IN THAILAND
KII-CD: Date:
Name:
Designation:
Organisation:
Address:
Tel.
Email address:
KII conducted by:
Venue:
Guide questions to key informant interviews (refer always to male, female, boy, girl): A. General information
1. How many migrant workers (male, female) from each country are working in this area (specify the district)? Rank based on number if more than 1.
2. What are the ages of migrant workers? 3. What are the characteristics (+/-) of a particular migrant group?
B. Movement/accessibility
1. Why do the migrant workers come to this area rather than another area? 2. How do the migrant workers come to this area from their countries? (pathway in terms of
movement)
C. Recruitment 1. How do the migrant workers find jobs in aquaculture? (pathway in terms of access to
jobs) 2. What is the process of hiring migrant workers for aquaculture? 3. What are the roles of formal and informal networks (links between existing workers and
original communities) in recruitment from source and within country? 4. How do the migrant workers decide on which job to take and where? 5. Why do farmers in this area (specify district) hire this migrant group rather than another
group? 6. What are the specific migrant labour requirements of the farms according to their scale of
operation?
D. At work/farm 1. What salaries & benefits do migrant workers receive from their jobs? Living conditions? 2. Are there specific tasks and living conditions allotted to certain types (origin, skills level,
marital status, gender, language) of workers? 3. What are the contract arrangements and agreements between employers and migrant
workers? 4. What are cultural/ethnicity/attitudinal factors which both employers and migrant workers
face? Or have to overcome to work efficiently?
418
5. How does ethnicity affect Thai employers/workers’ attitudes in interacting / relating with migrant workers? Vice versa?
6. What are the constraints faced by Thai employers, Thai workers and migrant workers in working together in the farms?
7. Examples on how they positively & negatively work together
E. Social/legal 2. How important is the status of migrant workers’ registration vis-à-vis their opportunities
to be hired, salaries, benefits, tenure, mobility…? 3. Regarding families of migrant workers:
a. Do the families (spouse, children) of migrant workers come with them initially or do the families come later after they get the jobs?
b. What are the living arrangements with the families? c. What happens to their children born in Thailand? Welfare issues? d. Do their sons and/or daughters eventually work in aquaculture and related
occupations? Why? 4. How does ethnicity affect people’s attitudes in interacting / relating with migrant
workers? Vice versa? 5. Is criminalization in the aquaculture migrant labour community common? Why? 6. Why are migrant workers vulnerable to criminalization? 7. What type of protection (legal, social, economic etc) is provided to migrant workers? 8. Who provides protection (specify type) to migrant workers?
F. Access to skills development and other opportunities:
1. How varied are the skill levels of the migrant workers, specific to aquaculture? 2. What opportunities do they have to develop and/or improve their skills in aquaculture? In
other fields? 3. What access do they have to avail of these opportunities? 4. What are their attitudes towards developing and/or improving their skills?
G. Additional information:
Copyright © 2022 FDOKUMEN