Report Name:Korea Seafood Market Update 2021 - USDA ...
23
THIS REPORT CONTAINS ASSESSMENTS OF COMMODITY AND TRADE ISSUES MADE BY USDA STAFF AND NOT NECESSARILY STATEMENTS OF OFFICIAL U.S. GOVERNMENT POLICY Voluntary Report – Voluntary - Public Distribution Date: June 01, 2021 Report Number: KS2021-0014 Report Name: Korea Seafood Market Update 2021 Country: Korea - Republic of Post: Seoul ATO Report Category: Fishery Products Prepared By: Sunyoung Yoo Approved By: Andrew Anderson-sprecher Report Highlights: Korean seafood imports totaled $5.27 billion in 2020, down 3.0 percent from 2019. Korean seafood imported from the United States decreased 7.2 percent to $215 million in 2020. The United States remains the fifth largest seafood exporter to Korea with a 4.1 percent market share. U.S. seafood is generally perceived as high quality and safe, but it is often underpriced by regional competitors.
-
Upload
khangminh22 -
Category
Documents
-
view
1 -
download
0
Transcript of Report Name:Korea Seafood Market Update 2021 - USDA ...
THIS REPORT CONTAINS ASSESSMENTS OF COMMODITY AND TRADE ISSUES MADE BY USDA STAFF AND NOT NECESSARILY STATEMENTS OF OFFICIAL U.S. GOVERNMENT POLICY
Voluntary Report – Voluntary - Public Distribution Date: June 01, 2021
Report Number: KS2021-0014
Report Name: Korea Seafood Market Update 2021
Country: Korea - Republic of
Post: Seoul ATO
Report Category: Fishery Products
Prepared By: Sunyoung Yoo
Approved By: Andrew Anderson-sprecher
Report Highlights:
Korean seafood imports totaled $5.27 billion in 2020, down 3.0 percent from 2019. Korean seafood
imported from the United States decreased 7.2 percent to $215 million in 2020. The United States
remains the fifth largest seafood exporter to Korea with a 4.1 percent market share. U.S. seafood is
generally perceived as high quality and safe, but it is often underpriced by regional competitors.

TABLE OF CONTENTS
SECTION I: KOREAN SEAFOOD MARKET OVERVIEW
1. PRODUCTION 2. CONSUMPTION
SECTION II: TRADE, TARIFFS, COMPETITORS AND MARKETING
1. TRADE a. World Trade
b. U.S. Imports
2. TARIFFS & QUOTAS 3. COMPETITORS
4. MARKETING
SECTION III: FURTHER INFORMATION AND KEY CONTACTS
APPENDIX: KOREAN SEAFOODF TRADE STATISTICS
SECTION I: KOREAN SEAFOOD MARKET OVERVIEW
1. PRODUCTION
Korean seafood production totaled 3.71 million metric tons in 2020, down 3.9 percent from 2019.
Production from adjacent waters increased by 2.2 percent, while shallow sea aquaculture production
(including seaweed) decreased 4.2 percent and distant water production decreased 13.3 percent.
Productions from inland waters also decreased 3.8 percent.
Table 1. Korean Seafood Production by Waters (1,000 MT)
Year Total Adjacent
Waters
Shallow Sea
Aquaculture
Distant
Waters
Inland
Waters
2014 3,305 1,059 1,547 669 30
2015 3,337 1,058 1,668 578 33
2016 3,269 908 1,872 454 35
2017 3,725 927 2,316 446 36
2018 3,791 1,012 2,251 493 35
2019 3,861 912 2,410 504 35
2020 3,711 932 2,308 437 34
Source: Ministry of Oceans and Fisheries (MOF), Fishery Information Portal (www.fips.go.kr)
Domestic fish production has fluctuated between 100,000-400,000 metric tons over the past seven years.
Domestic fish production is not expected to increase significantly in the future due to the depletion of
fishery resources in adjacent waters and the enforcement of Exclusive Economic Zones by neighboring

countries. Bilateral and multilateral fishing accords limit total harvest. The harvest from adjacent waters
consists primarily of anchovy, mackerel, hairtail, horse mackerel, Spanish mackerel, herring, croaker,
blue mackerel, monkfish, and flatfish.
Seaweed is a common ingredient in Korean cuisine and processed foods. Seaweed production overtook
fish production by weight in 2016 for the first time and has expanded rapidly in response to increased
consumption of dried, seasoned laver and exports of seaweed products to new consumers overseas.
The local squid catch has dropped significantly in recent years due to changing water temperatures. This
has caused the price of local squid to double and increased demand for imported squid. Squid (HS
03074) imports surged 42 percent in 2018 to 118,796 metric tons. In 2019, local production and stocks
had recovered and imports declined 8.6 percent to 108,577 metric tons. In 2020, local production still
fell short of demand and import increased again by 16.5 percent to 126,526 metric tons.
Source: Ministry of Oceans and Fisheries (MOF), Fishery Information Portal (www.fips.go.kr)
The number of Korean fishing vessels has steadily decreased over the past 20 years as fishery resources
have been depleted. The Korean government is working to accelerate downsizing of the Korean fishing
fleet. The government has successfully promoted shallow water aquaculture production. This segment
now accounts for 62 percent of Korean seafood production, compared to only 47 percent in 2014. The
government is also looking into ways to secure higher fishing quotas in foreign waters and is seeking to
purchase fishing quotas from other countries, including Russia.
0
200
400
600
800
1,000
1,200
1,400
1,600
1,800
2,000
2014 2015 2016 2017 2018 2019 2020
Korean Seafood Production by Products (1,000 M/T)
Fishes Shellfish Crustacean Molluscs Other aquatic animals Seaweed

The Korean Ministry of Oceans and Fisheries (MOF) establishes Total Allowable Catch limits for 14
species. In 2018 MOF switched from a calendar year TAC limit to a July-June schedule. MOF also sets
limits on the fishing season, fishing areas, the number of fishing boats, and fishing methods.
Table 2. Korean Total Allowable Catch in 2020-2021 (Metric Tons)
Species 2017
Jan-Dec
2018
(July 2018 ~
June 2019)
2019
(July 2019 ~
June 2020)
2020
(July 2020 ~
June 2021)
Mackerels 123,000 110,078 132,452 123,527
Jack mackerels 16,600 14,610 30,727 29,424
Red snow crabs 38,000 30,971 26,630 25,516
Snow crabs 906 917 1,003 1,036
Purplish Washington clams 1,800 1,570 1,551 1,507
Pen shells 5,332 7,777 7,437 8,582
Horned turban 1,432 1,720 1,275
Blue crabs 6,000 5,700 5,798 5,033
Squids 141,750 111,254 97,103 89,078
Sailfin sandfish 5,037 4,725 2,821 2,196
Mottled Skate 203 321 377 447
Hairtails
29,174 21,350
Manila clams 1,561 1,638
Yellow corvina 20,481 22,935
Spanish Mackerel - 27,876
Total 340,060 289,643 358,390 360,145
Source: Ministry of Oceans and Fisheries (MOF), Resource Management Division
Korea produced 1.09 million tons of processed seafood products in 2019, down twenty percent from the
year before. This is the lowest production level in the last 8 years. There has been a decline in demand
from the institutional and food service sectors. Seafood processors also face higher production cost due
to minimum wage increases and higher raw material costs. The COVID-19 pandemic may have caused
production to drop further, but 2020 data is not yet available to confirm this.
Table 3. Korean Production of Processed Seafood
Year Production (MT) Value (Million K/Won)
2012 1,885,489 7,770,232
2013 1,819,693 7,422,605
2014 2,337,313 7,523,432
2015 1,829,025 7,097,394
2016 1,574,951 5,962,884
2017 1,291,639 5,916,672
2018 1,356,579 6,202,073
2019 1,085,523 6,063,543
Source: Korea Statistics Service (http://kosis.kr)

2. CONSUMPTION
Seafood consumption has continued to grow despite stagnant production. The Korean seafood industry
has successfully promoted seafood as a healthy alternative to red meat. Seafood consumption grew on
average 3.5 percent a year between 2000 and 2018, compared to an average growth of three percent for
meat products. Seafood businesses have also worked to diversify fish products, improve quality, and
research new processing technologies. The major seafood species consumed in Korea are Alaska
pollack, squid, mackerel, shrimp, crabs, monkfish, anchovy, flat fish, oyster, and octopus.
Table 4. Korean Seafood Demand and Supply (Unit: 1,000 tons)
Total Domestic
Consumption
Domestic
Production
Self-sufficiency
rate
2014 4,541 3,305 72.8%
2015 4,605 3,337 72.5%
2016 4,583 3,270 71.4%
2017 5,696 3,728 65.4%
2018 5,418 3,754 69.3%
2019 (Est.) 5,361 3,860 72.0%
2020 (Est.) 5,278 3,711 70.3%
Source: Korean Fisheries Yearbook 2020, KMI Fishery Outlook 2021
Korean consumers place a high value on freshness, origin, taste, cost, and food safety. Price, quality, and
timeliness are the most important factors for U.S. seafood exports to Korea. U.S. seafood products are
generally viewed as high quality but tend to be more expensive. As a result, Korea primarily imports
premium products from the United States. An example is Alaska pollock surimi, which enjoys a
reputation for high quality and limited supply in Korea.
Korean per capita fish and shellfish consumption has held steady over the last decade despite declining
consumption by young consumers. Per capita seaweed consumption, in contrast, has nearly doubled
over the last decade. Koreans eat fresh, chilled, and frozen fish in order of preference. Some fish are
consumed raw (“Hoi”, or “Sashimi”), and command a price premium. Korean consumers believe fresh
fish taste better than frozen fish after cooking. Accordingly, fresh or chilled fish tend to be substantially
more expensive than frozen fish.
Table 5. Korean Annual Per Capita Consumption of Seafood Products (Kg)
Product Category 2012 2013 2014 2015 2016 2017 2018 2019
(est.)
2020
(est.)
2021
(est.)
Fish and Shellfish 38.3 37.1 41.6 38.5 36.3 45.0 41.5 38.4 39.1 40.6
Seaweed 15.9 17.4 16.9 18.6 21.1 27.7 26.6 28.5 27.8 29.4

Total (kg/year) 54.2 54.5 58.5 57.1 57.4 72.7 68.1 66.9 66.9 70.0
Source: Korea Rural Economy Institute (KREI) 2018 Food Balance Sheet, KMI Fishery Outlook 2021
Demand for precooked, prepared, and preserved foods is growing quickly. This includes processed
ready-to-eat seafood products and home meal replacement (HMR) products incorporating seafood
ingredients. The trend has been driven by a steady rise in the labor participation rate for women and the
increasing number of single-person households. The COVID-19 pandemic also escalated this trend by
increasing “un-tact” food sales through online market. Industry experts forecast seafood HMR sales will
reach 60 billion won in 2021, 3.75 times higher than the 16 billion in sales in 2016.
CJ Cheil Jedang (a large food processor) launched a new meal brand “Bibigo Grilled Fish” in 2020. The
brand features pre-cooked and portioned fish in a microwavable room-temperature stable package. The
first batch of this product was introduced to the Korean HMR market with five fish species (flat fish,
mackerel, Spanish mackerel, Atka mackerel, and Pacific saury). The product is designed for direct
consumption as a side dish for rice.
Hotels and department stores generally use high quality seafood and charge a higher price. Some five-
star hotels and leading department stores have already done special promotions featuring U.S. seafood
products such as lobster and cod. These promotions are often timed with the opening of a new fishing
season and sometimes commemorate an anniversary of the Korea-United States Free Trade Agreement
(KORUS FTA). The institutional feeding and food service sector generally uses cheaper food
ingredients. The most popular fish products in this market include frozen flatfish (mostly yellowfin
sole), croaker (aka yellow corvina), mackerel (from Norway), Atka mackerel (from Russia), Alaska
pollack, shrimp (from Vietnam), and hairtail (from Senegal).
SECTION II: TRADE, TARIFFS, COMPETITORS AND MARKETING
1. TRADE
Growing domestic demand and limited supplies made Korea a net importer of seafood in 2001 for the
first time. In 2020 Korea imported $3.7 billion more in seafood than it exported. Korean seafood
imports are expected to continue to grow, creating opportunities for U.S. seafood exporters. Korea’s
largest seafood export is seaweed.
a. World Trade
Korea’s seafood imports from all origins totaled $5.27 billion in 2020, down three percent from 2019.
China is the largest supplier, exporting $1.2 billion in seafood to Korea in 2020. Russia is the second
largest supplier, followed by Vietnam, Norway, and the United States. The largest imports by value in

2020 were frozen squid, peeled shrimps & prawns, live king crab, fresh Atlantic salmon, frozen Alaska
pollack, fish surimi, and webfoot octopus. The largest imports by volume were frozen Alaska pollack,
squid, fish surimi, sand lance, sardine, mackerel, and peeled shrimps & prawns .
Source: Korean Government Import Data (www.kita.net, CIF Value)
Source: Korean Government Import Data (www.kita.net, CIF Value)
b. U.S. Imports
Korea imported $215 million worth of U.S. seafood in 2020, down 7.2 percent from 2019. U.S. market
share remained above 4 percent. The top ten seafood imports from the U.S. by value in 2020 were
Alaska pollack surimi, frozen Alaska pollack fish, flat fish, live lobster, livers/roes/milt of Alaska
0
200
400
600
800
1,000
1,200
1,400
1,600
0
1,000
2,000
3,000
4,000
5,000
6,000
2012 2013 2014 2015 2016 2017 2018 2019 2020
1,0
00
Met
ric
To
ns
Mil
lio
n U
S$
South Korean Seafood Imports by Year
Value (Million, US$) Volume (1,000 Metric Tons)
1,200
924
742429215
194
150
127
100
94
1,092
2020 South Korean Seafood Imports by Country (Value, Million US$)
China Russia
Vietnam Norway
U.S.A. Peru
Thailand Japan
Argentina Canada
Others

pollack, cod, fish fins/heads/tails/maws/other edible fish offals, frozen squid, live hagfish, and
livers/roes/milt of fish other than Alaska pollack. The top ten imports by volume were Alaska pollack
surimi, frozen Alaska pollack fish, flat fish, cod, livers/roes/milt of fish other than Alaska pollack, fish
fins/heads/tails/maws/other edible fish offals, rockfish including Pacific Ocean perch, frozen squid,
livers/roes/milt of Alaska pollack, and other fish frozen.
South Korea Seafood Imports from the United States by Year
Source: Korean Government Import Data (www.kita.net, CIF Value)
Top 10 Korean Seafood Imports from the United States in 10 Digit HS Code (Million US$)
Note: These 10 products accounted for 80 percent of Korea’s seafood imports from the United States.
See Table 14 in the Annex for more details.
0
10
20
30
40
50
60
70
80
90
0
50
100
150
200
250
300
2012 2013 2014 2015 2016 2017 2018 2019 2020
1,0
00
Metr
ic T
on
s
Mil
lio
n U
S$
Value (Million, US$) Volume (1,000 Metric Tons)
74.7
14.0
12.1
9.5
9.4
9.3
9.3
6.66.6 6.2
Source: Korean Government Impot Data (www.kita.net, CIF Value)
Alaska Pollack Surimi
Frozen Alaska Pollack Fish
Flat Fish
Live Lobster
Livers, Roes and Milt of Alaska Pollack
Cod
Fish Fins, Heads, Tails, Maws and Other Edible Fish Offals
Frozen Squid
Live Hagfish
Livers, Roes and Milt of Fish other than Alaska Pollack

2. TARIFFS & QUOTAS
U.S seafood has benefited from the elimination of 5 to 20 percent import duties under the KORUS FTA.
Customs duties for fishery products imported from the United States were either cut to zero or phased
out over the 3 to 10 years. For example, duties on U.S. frozen Sockeye salmon were immediately
eliminated, while duties on U.S. trout and sea bass were phased out over 3 and 10 years respectively.
Korea imposes Tariff Rate Quotas (TRQ) on three fish species from the United States under the KORUS
FTA. Importers can use the quota on a first-come first-serve basis. The duty-free allotments under the
TRQs are increased each year as shown below. More details on the KORUS FTA, including the tariff
schedule, can be found on the KORUS FTA Official Homepage and ATO Seoul website.
Table 8. Korea-United States FTA Seafood Tariff Rate Quotas (Metric Tons)
Year
Flatfish/Frozen
(HS 0303.34.0000,
0303.39.0000)
Alaska pollack/Frozen
(HS 0303.67.0000,
0303.69.9000)
Croaker/Frozen
(HS 0303.79.9095)
2021 3,058 8,688 1,551
2022 3,303 9,469 1,629
2023 unlimited 10,322 unlimited
2024 11,251
2025 12,263
2026 unlimited
Negotiated customs duties on certain seafood products under the KORUS FTA are higher than the
current Most Favored Nation (MFN) applied base rate. Korea applies the lower of the two rates to
imports from the United States. An example is provided in table nine. The duties paid on imports from
the United States are highlighted in green.
Table 9. KORUS FTA Tariff Schedule Applied to Frozen Skate Products Product Tariff
Rate
2012 2013 2014 2015 2016 2017 2018 2019 2020 2021
Frozen Skate
(HS0303.82.2000)
MFN 10% 10% 10% 10% 10% 10% 10% 10% 10% 10%
KORUS 24.3% 21.6% 18.9% 16.2% 13.5% 10.8% 8.1% 5.4% 2.7% 0.0%
Korea has tried to insulate domestic seafood producers from import competition, particularly from
China. “Adjustment tariffs” ranging from 22 to 50 percent were imposed on nine fish species not subject
to tariff bindings under WTO agreements. These nine species previously were subject to tariffs ranging
from 10 to 20 percent. However, the Korea-China FTA implemented on December 20, 2015, led to a
surge in price-competitive seafood imports from China. Frozen Alaska pollack (HS0303670000,

0303699000) is the only U.S. seafood export significantly impacted by adjustment tariffs. Currently the
first 8,688 tons of U.S. Alaska pollack exports to Korea enter duty free, while any exports over that
amount face a 22 percent adjustment tariff. The quota will gradually increase until trade is unrestricted
in 2026.
3. COMPETITORS
Korea imports seafood from about 100 different countries. Major suppliers of fishery products to Korea
include China, Russia, Vietnam, Norway, United States, Peru, Thailand, Japan, Argentina, and Canada.
The United States is the fifth largest exporter of seafood to Korea. The United States briefly became the
fourth largest exporter of seafood in 2012 after Japanese seafood exports dropped following the nuclear
power plant accident in Fukushima. However, Norway overtook the United States in 2016 due to strong
sales of salmon and mackerel. Despite strong competition, U.S. seafood will likely remain a top choice
for Korean consumers as it has established a reputation for good quality and stable supply.
Korea Seafood Imports from Top 7 Countries
Source: Korean Government Import Data (www.kita.net)
Korea has entered into new trade agreements with several competing seafood exporters in recent years,
increasing competition. As an example, U.S. lobster exports to Korea jumped 50 percent in 2014 after
tariffs were cut to eight percent as part of the KORUS FTA. The United States dominated the Korean
lobster market that year. However, Canada started to quickly take over market share as tariffs on
Canadian lobster fell under the Korea-Canada FTA.
0.0
5.0
10.0
15.0
20.0
25.0
30.0
2013 2014 2015 2016 2017 2018 2019 2020
Ma
rket
Sh
are
(%
)
China
Russia
Vietnam
Norway
U.S.A.
Peru
Thailand

Table 10. Korean Tariff Phase-Out Schedule for Lobster Products under FTA’s
Description Country Base Rate 2012 2013 2014 2015 2016 2017
Live, Fresh, Chilled
Lobsters (Homarus)
USA 20%
16% 12% 8% 4% 0% 0%
Canada 20% 20% 20% 13.3% 6.6% 0%
Description Country Base Rate 2012 2013 2014 2015 2016 2017
Frozen Lobsters
(Homarus)
USA 20%
16% 12% 8% 4% 0% 0%
Canada 20% 20% 20% 0% 0% 0%
Table 11. Korean Lobster Imports (Homarus Spp.)
Country 2017 2018 2019 2020
$1,000 MT $1,000 MT $1,000 MT $1,000 MT
World 107,208 4,730 122,709 5,368 120,915 5,253 89,321 4,210
Canada 82,003 3,604 102,153 4,509 102,627 4,538 78,019 3,717
United States 25,128 1,124 20,106 830 17,790 673 11,266 489
Others 77 2 450 29 498 42 36 4
Source: Korea Customs and Trade Development Institute, HS 0306320000, HS0306129000
A dozen countries, including China, Russia, Japan, Norway, Thailand, Chile, Canada, and Indonesia,
participate in the Busan International Seafood & Fisheries Expo annually. These competitors exhibit a
wide variety of seafood products targeting importers, wholesalers, distributors, retailers, hotels,
restaurants, and food processors. ATO Seoul organized a U.S. pavilion at the 2020 Busan International
Seafood and Fisheries Expo, partnering with the Alaska Seafood Marketing Institute and Food Export
USA Northeast to showcase U.S. seafood. Most exporting countries, however, canceled their
participation in the 2020 show due to COVID-19 travel restrictions. Many competitors such as Norway,
Canada and Japan are expected to redouble efforts to promote their seafood exports in the Korean market
after the COVID-19 pandemic is over,
4. MARKETING
Seafood importers generally sell directly to the hotel and the food service industries, and/or to
distributors who sell to traditional markets and restaurants. When the volume is large, importers
generally sell directly to retailers such as supermarkets, discount stores and department stores. When the
volume is small, importers sell to distributors. U.S. suppliers should contact seafood importers to sell
their fishery products to Korea.
Consumers like to purchase species they are accustomed to, and importers tend to import species that
have strong consumer demand. Thirty species accounted for more than 97 percent of Korea’s seafood
imports from the United States in 2020. U.S. exporters can invest in building consumer interest in new

species, but most will find it easier and more cost effective to focus on one of the commonly imported
fish species.
Exporters can find more market information by contacting Korean importers, U.S. state departments of
agriculture, and by visiting the Seoul Agricultural Trade Office’s website. Participating in local food
shows can be an effective way to find potential importers and assess market potential. Many Korean
importers attend these shows looking to establish reliable long-term trading relationships. Show
participation enhances initial contacts with importers, agents, wholesalers, distributors, retailers and
others in the food and beverage industry. The two major seafood shows in Korea are the Seoul
International Seafood Show and the Busan International Seafood and Fisheries Expo.
Seoul International Seafood Show (3S): Sponsored by the Ministry of Oceans and Fisheries (MOF),
this is the only show held in Seoul specializing in seafood, fishery, nursery, aquaculture, processing
machinery and related equipment. The show was canceled in 2020 due to the COVID-19 outbreak. The
2021 show was held in-person in Seoul on May 5-7, 2021. Check the show website for further details.
Busan International Seafood & Fisheries Expo (BIFSE) 2021 will be held in Busan at the BEXCO
convention center, November 3-5, 2021. It offers an excellent opportunity to explore possible market
opportunities in Korea. This show is held in every year in late October or early November and targets
importers, wholesalers, distributors, retailers, hotels, restaurants, food processors, and media. Currently,
it is the only seafood show held in Korea supported by ATO Seoul. ATO Seoul has participated in this
show for 16 years in cooperation with State Regional Trade Groups and USDA cooperator group such as
SUSTA, Food Export USA Northeast and ASMI. Check BISFE’s website for detailed information on
the show and contact ATO Seoul for questions on the USA Pavilion.

SECTION III: FURTHER INFORMATION AND KEY CONTACTS
General information on the Korean market and exporting to Korea can be found in the 2020 Exporter
Guide. For further information about the Korean market please contact:
U .S. Agricultural Trade Office (ATO)
Local address: Rm 303, Leema B/D, 42, Jongro 1-gil, Jongro-gu, Seoul, Korea 03152
U.S. mailing address: ATO, U.S. Embassy - Seoul, Unit 9600 Box 0050, DPO, AP 96209-0050
Phone: 82-2-6951-6848
Fax: 82-2-720-7921
E-mail: [email protected]
Home Page: www.atoseoul.com
Agricultural Affairs Office, U.S. Embassy Seoul (AAO)
Korean Address: U.S. Embassy, 188 Sejong-daero, Jongro-gu, Seoul, Korea
Telephone: +82-2 397-4297 Fax: +82-2 738-7147
E-mail: [email protected]
U.S. Animal Plant and Health Inspection Service Seoul (APHIS)
Local address: Rm 303, Leema B/D, 42, Jongro 1-gil, Jongro-gu, Seoul, Korea 03152
Telephone: +82-2 725-5495 Fax: +82-2 725-5496
E-mail: [email protected] Internet Homepage: www.aphis.usda.gov
USDA Cooperators, States, SRTG, State Offices and AMCHAM in Korea
USDA Cooperators in Korea
U.S. State Regional Trade Groups (SRTG)
U.S. State Offices in Korea
American Chamber of Commerce (AMCHAM)
Korean Government
Ministry of Oceans and Fisheries (MOF)
Ministry of Agriculture, Food and Rural Affairs (MAFRA)
Ministry of Food and Drug Safety (MFDS)
Ministry of Trade, Industry and Energy (MOTIE)
Ministry of Foreign Affairs (MOFA)

APPENDIX: KOREAN SEAFOOD TRADE STATISTICS
TABLE OF CONTENTS
Table 12. Korea’s Total Seafood Imports by Year ($million) Table 12-1. Korean Seafood Imports from Major Countries ($million)
Table 13. Korean Seafood Exports to Major Countries ($million)
Table 14. Top 30 Fish Imported to Korea from the United States ($1,000)
Table 15. Korean Imports of Fish Roes, Urchin Roes, Caviar and Liver (MT)
Table 16. Korean Imports of Flatfish (MT)
Table 17. Korean Import of Ground Fish (MT)
Table 18. Korean Imports of Fillet/Surimi (MT)
Table 19. Korean Imports of Crustaceans (MT)
Table 19-1. Korean Imports of Lobsters (Homarus Spp.): Not Frozen
Table 19-2. Korean Imports of Lobsters (Homarus Spp.): Frozen
Table 20. Korean Imports of Mollusks (MT)
Table 21. Korean Tariff Schedule for Major U.S. Fishery Products Sold to Korea
Appendix
Table 12. Korea’s Total Seafood Imports by Year ($million)
Year From World From USA U.S.
Market Share
2012 3,646 169 4.6%
2013 3,565 211 5.9%
2014 4,161 222 5.3%
2015 4,241 233 5.5%
2016 4,502 227 5.1%
2017 4,985 233 4.7%
2018 5,794 261 4.5%
2019 5,431 232 4.3%
2020 5,267 215 4.1%
Source: www.kita.net Korea’s Trade Statistics Database for 2020

Table 12-1. Korean Seafood Imports from Major Countries ($million)
Reporting Country: Korea, Republic of Top 15 Ranking
Import Percent change
(2019~2020) 2018 2019 2020
China 1,456 1,279 1,200 -6.2%
Russia 910 922 924 0.2%
Vietnam 850 789 742 -5.9%
Norway 408 418 429 2.5%
United States 261 232 215 -7.2%
Peru 161 201 194 -3.2%
Thailand 177 140 150 7.2%
Japan 144 133 127 -4.5%
Argentina 64 63 100 59.3%
Canada 119 119 94 -21.7%
Chile 149 84 87 3.2%
Taiwan 117 107 74 -31.0%
Indonesia 58 62 68 10.0%
Ecuador 73 71 56 -21.7%
Malaysia 42 64 54 -15.6%
Other 806 747 753 0.8%
Total 5,794 5,431 5,267 -3.0%
Source: www.kita.net Korea’s Trade Statistics Database for 2020
Table 13. Korea’s Total Seafood Exports by Year ($million)
Year To World To USA
2012 1,973 129
2013 1,749 136
2014 1,642 133
2015 1,481 146
2016 1,637 157
2017 1,671 180
2018 1,695 167
2019 1,739 167
2020 1,534 156
Source: www.kita.net Korea’s Trade Statistics Database for 2020
Table 13-1. Korean Seafood Exports to Major Countries ($million)
Reporting Country: Korea, Republic of Top 10 Ranking
Export
2018 2019 2020
Japan 564 520 454
China 296 385 331
United States 167 167 156
Thailand 140 131 121
Vietnam 108 123 112
Hong Kong 44 52 51
Italy 38 35 34
France 48 40 31
Taiwan 23 27 27
Other 266 259 218
Total 1,695 1,739 1,534
Source: www.kita.net Korea’s Trade Statistics Database for 2020

Table 14-1. Top 30 Fish Imported to Korea from USA in 2020 (In Value, $1,000)
Fish Species HS Code Number From USA
($1,000)
From World
($1,000)
U.S. Market
Share
Surimi of Alaska Pollack (Theragra chalcogramma),
Frozen 0304.94.1000 74,699 74,699 100.0%
Alaska Pollack (Theragra chalcogramma), Frozen 0303.67.0000 13,977 195,227 7.2%
Other Flat Fish (Excluding Fillets, Livers and Roes),
Frozen 0303.39.0000 12,129 58,192 20.8%
Lobsters (Homarus Spp.), Live, Fresh, Or Chilled 0306.32.0000 9,483 56,392 16.8%
Livers, Roes and Milt of Alaska Pollack, Frozen 0303.91.2010 9,360 67,788 13.8%
Cod (Gadus morhua, Gadus ogac, Gadus
macrocephalus), Frozen 0303.63.0000 9,306 57,235 16.3%
Fish Fins (Other Than Shark), Heads, Tails, Maws
and Other Edible Fish Offals, Frozen 0303.99.0000 9,301 16,902 55.0%
Other Squid, Frozen 0307.43.2090 6,633 296,227 2.2%
Hagfish, Live 0301.99.7000 6,627 8,542 77.6%
Livers, Roes and Milt of Fish other than Alaska
Pollack, Frozen 0303.91.2090 6,178 23,421 26.4%
Hagfish (Pacific, Atlantic), Frozen 0303.89.9070 5,385 6,603 81.6%
Fillet of Plaice, Frozen 0304.83.1000 5,126 6,288 81.5%
Atka Mackerel, Frozen 0303.89.9040 5,070 22,535 22.5%
Skates, Frozen 0303.82.2000 5,056 28,886 17.5%
Other Fish (NESOI), Frozen 0303.89.9099 4,947 44,628 11.1%
Angler (Monkfish), Frozen 0303.89.9060 4,654 42,967 10.8%
Rock fish (including Pacific Ocean perch), Frozen 0303.89.9050 4,610 22,725 20.3%
Fillet of Alaska Pollack (Theragra chalcogramma),
Frozen 0304.75.0000 3,477 49,016 7.1%
Adductors of Shellfish 0307.92.1000 1,835 10,778 17.0%
Lobsters (Homarus Spp.), Including in- shell, Cooked
by Steaming or by Boiling in Water, Frozen 0306.12.9000 1,783 32,928 5.4%
Fillet of Other Fish (NESOI), Frozen 0304.89.9000 1,437 31,482 4.6%
Fillet of Cod (Gadus morhua, Gadus ogac, Gadus
macrocephalus), Frozen 0304.71.0000 1,352 4,680 28.9%
Cold-Water Shrimps and Prawns (Pandalus Spp.,
Crangon Crangon), Frozen 0306.16.9090 1,282 4,591 27.9%
Other Pacific salmon (Oncorhynchus gorbuscha,
Oncorhynchus keta, Oncorhynchus tschawytscha,
Oncorhynchus kisutch, Oncorhynchus masou and
Oncorhynchus rhodurus)
0303.12.0000 1,210 24,358 5.0%
Surimi of Alaska Pollack (Other than Theragra
chalcogramma), Frozen 0304.99.1000 1,153 173,967 0.7%
Sea Urchin, Live, Fresh or Chilled 0308.21.0000 986 8,289 11.9%
Fillet of Pacific salmon (Oncorhynchus nerka,
Oncorhynchus gorbuscha, Oncorhynchus keta,
Oncorhynchus tschawytscha, Oncorhynchus kisutch,
Oncorhynchus masou and Oncorhynchus rhodurus),
Atlantic salmon (Salmo salar) and Danube salmon
(Hucho hucho)
0304.81.0000 949 6,781 14.0%
Crabs (Other than King Crab and Blue Crab), Frozen 0306.14.9090 697 70,630 1.0%
King Crab, Live 0306.33.9000 588 239,729 0.2%
Surimi of Alaska Pollack (Theragra chalcogramma),
Not Frozen 0304.94.9000 408 922 44.3%
Total 209,698 1,687,408 12.4%
Source: www.kita.net Korea’s Trade Statistics Database for 2020
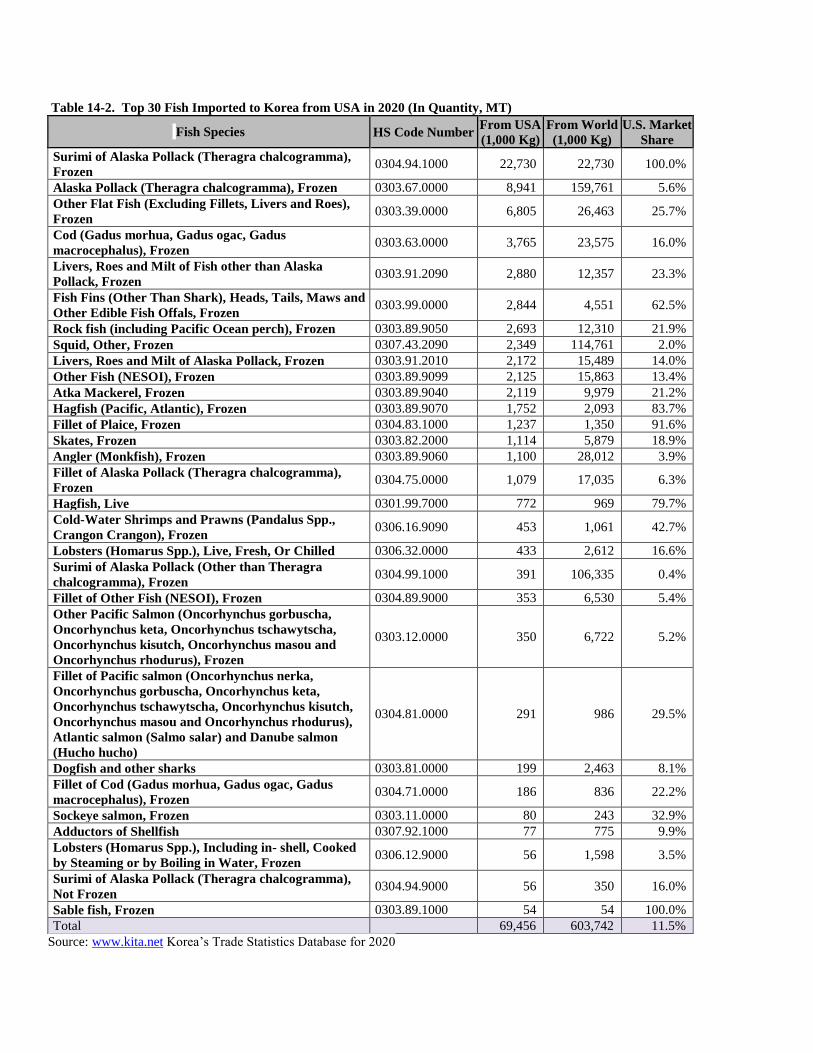
Table 14-2. Top 30 Fish Imported to Korea from USA in 2020 (In Quantity, MT)
Fish Species HS Code Number From USA
(1,000 Kg)
From World
(1,000 Kg)
U.S. Market
Share
Surimi of Alaska Pollack (Theragra chalcogramma),
Frozen 0304.94.1000 22,730 22,730 100.0%
Alaska Pollack (Theragra chalcogramma), Frozen 0303.67.0000 8,941 159,761 5.6%
Other Flat Fish (Excluding Fillets, Livers and Roes),
Frozen 0303.39.0000 6,805 26,463 25.7%
Cod (Gadus morhua, Gadus ogac, Gadus
macrocephalus), Frozen 0303.63.0000 3,765 23,575 16.0%
Livers, Roes and Milt of Fish other than Alaska
Pollack, Frozen 0303.91.2090 2,880 12,357 23.3%
Fish Fins (Other Than Shark), Heads, Tails, Maws and
Other Edible Fish Offals, Frozen 0303.99.0000 2,844 4,551 62.5%
Rock fish (including Pacific Ocean perch), Frozen 0303.89.9050 2,693 12,310 21.9%
Squid, Other, Frozen 0307.43.2090 2,349 114,761 2.0%
Livers, Roes and Milt of Alaska Pollack, Frozen 0303.91.2010 2,172 15,489 14.0%
Other Fish (NESOI), Frozen 0303.89.9099 2,125 15,863 13.4%
Atka Mackerel, Frozen 0303.89.9040 2,119 9,979 21.2%
Hagfish (Pacific, Atlantic), Frozen 0303.89.9070 1,752 2,093 83.7%
Fillet of Plaice, Frozen 0304.83.1000 1,237 1,350 91.6%
Skates, Frozen 0303.82.2000 1,114 5,879 18.9%
Angler (Monkfish), Frozen 0303.89.9060 1,100 28,012 3.9%
Fillet of Alaska Pollack (Theragra chalcogramma),
Frozen 0304.75.0000 1,079 17,035 6.3%
Hagfish, Live 0301.99.7000 772 969 79.7%
Cold-Water Shrimps and Prawns (Pandalus Spp.,
Crangon Crangon), Frozen 0306.16.9090 453 1,061 42.7%
Lobsters (Homarus Spp.), Live, Fresh, Or Chilled 0306.32.0000 433 2,612 16.6%
Surimi of Alaska Pollack (Other than Theragra
chalcogramma), Frozen 0304.99.1000 391 106,335 0.4%
Fillet of Other Fish (NESOI), Frozen 0304.89.9000 353 6,530 5.4%
Other Pacific Salmon (Oncorhynchus gorbuscha,
Oncorhynchus keta, Oncorhynchus tschawytscha,
Oncorhynchus kisutch, Oncorhynchus masou and
Oncorhynchus rhodurus), Frozen
0303.12.0000 350 6,722 5.2%
Fillet of Pacific salmon (Oncorhynchus nerka,
Oncorhynchus gorbuscha, Oncorhynchus keta,
Oncorhynchus tschawytscha, Oncorhynchus kisutch,
Oncorhynchus masou and Oncorhynchus rhodurus),
Atlantic salmon (Salmo salar) and Danube salmon
(Hucho hucho)
0304.81.0000 291 986 29.5%
Dogfish and other sharks 0303.81.0000 199 2,463 8.1%
Fillet of Cod (Gadus morhua, Gadus ogac, Gadus
macrocephalus), Frozen 0304.71.0000 186 836 22.2%
Sockeye salmon, Frozen 0303.11.0000 80 243 32.9%
Adductors of Shellfish 0307.92.1000 77 775 9.9%
Lobsters (Homarus Spp.), Including in- shell, Cooked
by Steaming or by Boiling in Water, Frozen 0306.12.9000 56 1,598 3.5%
Surimi of Alaska Pollack (Theragra chalcogramma),
Not Frozen 0304.94.9000 56 350 16.0%
Sable fish, Frozen 0303.89.1000 54 54 100.0%
Total 69,456 603,742 11.5%
Source: www.kita.net Korea’s Trade Statistics Database for 2020

Table 15. Korean Imports of Fish Roes, Urchin Roes, Caviar and Livers by Country of Origin (MT)
2019 2020
USA 6,177 USA 5,055
Russia 19,934 Russia 21,856
Norway 1,083 Norway 1,109
New Zealand 1,471 New Zealand 650
Iceland 1,363 Iceland 423
Indonesia 203 Indonesia 178
Others 681 Others 734
Total 30,912 Total 30,005
Source: www.kita.net Korea’s Trade Statistics Database for 2020
Table 15-1. Korean Imports of Fish Roes, Urchin Roes, Caviar and Liver by HS Code (MT)
Species 2020 H.S. Code 2019 2020
World USA World USA
Livers, Frozen 0303.91.1000 10 1 75 0
Roes/AK Pollack, Frozen 0303.91.2010 15,285 2,668 15,489 2,172
Roes/Other Fish, Frozen 0303.91.2090 12,782 3,487 12,357 2,880
Caviar and Caviar Substitutes 1604.31.0000
1604.32.0000 2,835 1 2,084 3
Total 30,912 6,177 30,005 5,055
Source: www.kita.net Korea’s Trade Statistics Database for 2020
Table 16. Korean Imports of Flatfish by Country of Origin (MT)
2019 2020
USA 8,882 USA 6,805
Russia 16,668 Russia 14,845
China 3,193 China 2,352
Guinea 2,576 Guinea 1,694
Senegal 865 Senegal 659
Italy 341 Italy 121
Others 43 Others 1,043
Total 32,568 Total 27,519
Source: www.kita.net Korea’s Trade Statistics Database for 2020
Table 16-1. Korean Imports of Flatfish by HS Code (MT)
Species 2020 H.S. Code 2019 2020
World USA World USA
Flat Fish, Live / Plaice, Fresh 0301.99.8000
0302.22.0000 554 0 529 0
Halibut, Frozen 0303.31.0000 384 0 110 0
Plaice, Frozen 0303.32.0000 695 225 142 0
Sole, Frozen 0303.33.0000 314 0 275 0
Others, Frozen 0303.39.0000 30,621 8,657 26,463 6,805
Total 32,568 8,882 27,519 6,805
Source: www.kita.net Korea’s Trade Statistics Database for 2020

Table 17. Korean Imports of Ground Fish by Country of Origin (MT)
2019 2020
USA 11,057 USA 15,450
Russia 150,581 Russia 177,889
Portugal 3,654 Portugal 4,870
Japan 2,207 Japan 1,798
Others 7,034 Others 6,141
Total 174,551 Total 206,148
Source: www.kita.net Korea’s Trade Statistics Database for 2020
Table 17-1. Korean Import of Ground Fish by HS Code (MT)
Species 2020 H.S. Code 2019 2020
World USA World USA
Cod, Fresh 0302.51.0000 815 0 555 0
Alaska Pollack, Fresh 0302.55.0000 2,240 0 1,700 0
Cod, Frozen 0303.63.0000 23,395 2,650 23,575 3,765
Hake, Frozen 0303.66.0000 294 51 94 51
Alaska Pollack 0303.67.0000 129,146 6,627 159,761 8,941
Rockfish (Pacific Ocean perch) 0303.89.9050 10,092 1,736 12,310 2,693
Alaska Pollack, Dried 0305.59.3000 8,569 11 8,153 0
Total 174,551 11,057 206,148 15,450
Source: www.kita.net Korea’s Trade Statistics Database for 2020
Table 18. Korean Imports of Fillet/Surimi by Country of Origin (MT)
2019 2020
USA 26,392 USA 26,382
Vietnam 59,068 Vietnam 54,782
China 29,255 China 39,063
Russia 17,654 Russia 16,233
India 6,315 India 5,966
Indonesia 5,104 Indonesia 5,766
Norway 3,242 Norway 4,479
Pakistan 2,372 Pakistan 1,955
Thailand 1,184 Thailand 1,627
Others 9,988 Others 10,161
Total 160,574 Total 166,414
Source: www.kita.net Korea’s Trade Statistics Database for 2020

Table 18-1. Korean Imports of Fillet/Surimi by HS Code (MT)
Species 2021 H.S. Code 2019 2020
World USA World USA
Fillet of Alaska Pollack/frozen 0304.75.0000 18,257 1,210 17,035 1,079
Fillet of Cod/frozen 0304.71.0000 896 349 836 186
Fillet of Plaice/frozen 0304.83.1000 1,604 1,425 1,350 1,237
Fillet of Other Fish/frozen
0304.72.0000
0304.73.0000
0304.74.0000
0304.79.0000
0304.81.0000
0304.82.0000
0304.83.9000
0304.84.0000
0304.85.0000
0304.86.0000
0304.87.XXXX
0304.88.XXXX
0304.89.XXXX
16,321 679 16,123 659
Surimi of Alaska Pollack/frozen 0304.94.1000 21,780 21,780 22,730 22,730
Other type of fish meat of Alaska
Pollack/frozen 0304.94.9000 360 33 350 56
Surimi of other fish/frozen 0304.95.1000
0304.99.1000 99,208 916 106,355 411
Other type of fish meat of other
fish/fresh or chilled, frozen
0304.91.9000
0304.92.9000
0304.93.9000
0304.95.9000
0304.99.9000
2,148 0 1,635 24
Total 160,574 26,392 166,414 26,382
Source: www.kita.net Korea’s Trade Statistics Database for 2020
Table 19. Korean Imports of Crustaceans by Country of Origin (MT)
2019 2020
USA 798 USA 536
Vietnam 36,505 Vietnam 37,004
China 40,101 China 33,832
Russia 9,717 Russia 10,324
Ecuador 10,054 Ecuador 8,506
Malaysia 5,174 Malaysia 4,356
Canada 4,605 Canada 3,789
India 2,925 India 2,721
Thailand 2,025 Thailand 2,490
Bahrain 2,608 Bahrain 1,776
Others 13,324 Others 19,684
Total 127,836 Total 125,018
Source: www.kita.net Korea’s Trade Statistics Database for 2020

Table 19-1. Korean Imports of Crustaceans by HS Code (MT)
Species 2021 H.S. Code 2019 2020
World USA World USA
Frozen lobsters (Homarus spp.) 0306.12.9000 2,431 98 1,598 56
Frozen peeled cold-water shrimps and prawns 0306.16.1090 7 0 9 0
Frozen other type of shrimps and prawns 0306.17.1090
0306.17.9090 56,939 1 57,328 0
Frozen crab meat 0306.14.1090 0 0
Frozen king crabs 0306.14.2090 90 0 43 0
Frozen blue crabs 0306.14.3090 26,321 30 20,716 0
Frozen other type of crabs 0306.14.9090 10,977 93 12,237 37
Not frozen lobsters (Homarus spp.) 0306.32.0000 2,822 575 2,612 433
Live, fresh, or chilled shrimps and prawns 0306.35.0000
0306.36.0000 131 0 9 0
Salted or in brine shrimps and prawns 0306.95.1030
0306.95.9030 18,224 0 18,146 0
Live, fresh, or chilled snow crab 0306.33.2000 7,311 1 8,390 4
Frozen, Salted or in brine Rock Lobster, other sea
crawfish, dried shrimps, crabs, etc.
0306.11.9000
0306.91.3000
0306.93.2000
0306.95.1020
0306.95.9020
0306.99.2000
2,583 1 3,930 6
Total 127,836 798 125,018 536
Source: www.kita.net Korea’s Trade Statistics Database for 2020
Table 19-2. Korean Imports of Lobsters (Homarus Spp.): Live, Fresh, Chilled, Dried, Salted, In Brine, Not Frozen
Country 2017 2018 2019 2020
$1,000 MT $1,000 MT $1,000 MT $1,000 MT
World 82,905 3,708 85,552 3,581 69,044 2,822 56,393 2,612
Canada 61,734 2,706 67,777 2,811 55,070 2,246 46,893 2,178
United States 21,116 1,001 17,751 769 13,945 575 9,483 433
Others 55 1 24 1 29 1 17 1
Source: Korea Customs and Trade Development Institute, HS 0306.32.0000
Table 19-3. Korean Imports of Lobsters (Homarus Spp.): Including In Shell, Cooked by Steaming or by Boiling in
Water, Frozen
Country 2017 2018 2019 2020
$1,000 MT $1,000 MT $1,000 MT $1,000 MT
World 24,303 1,022 37,157 1,787 51,871 2,431 32,928 1,598
Canada 20,269 898 34,376 1,698 47,557 2,292 31,126 1,539
United States 4,012 123 2,355 61 3,845 98 1,783 56
Others 22 1 426 28 469 41 19 3
Source: Korea Customs and Trade Development Institute, HS 0306.12.9000
Table 20. Korean Imports of Mollusks by Country of Origin (MT)
2019 2020
USA 985 USA 2,436
China 118,694 China 119,763
Peru 40,850 Peru 34,614
Vietnam 33,210 Vietnam 32,231

Argentina 4,659 Argentina 14,051
Chile 11,273 Chile 13,940
Japan 6,308 Japan 9,217
Thailand 6,717 Thailand 7,548
Indonesia 2,249 Indonesia 3,467
Mauritania 3,001 Mauritania 2,126
Others 10,645 Others 12,815
TOTAL 238,591 TOTAL 252,208
Source: www.kita.net Korea’s Trade Statistics Database for 2020
Table 20-1. Korean Imports of Mollusks by HS Code (MT)
Species 2021 H.S. Code 2019 2020
World USA World USA
Scallops 0307.2X.XXXX 7,419 1 10,088 0
Cuttlefish 0307.4X.XXXX 108,577 884 126,526 2,349
Octopus 0307.5X.XXXX 64,992 0 66,338 10
Hard clams, abalones, top shells, pearl oyster, ark
shells, cockles, adductors of shellfish, sea
urchins, sea cucumbers, hen clams, baby clams,
jelly fish
0307.7X.XXXX
0307.8X.XXXX
0307.9X.XXXX
57,542 100 49,130 77
Oysters, mussels 0307.1X.XXXX
0307.3X.XXXX 61 0 126 0
Total 238,591 985 252,208 2,436
Source: www.kita.net Korea’s Trade Statistics Database for 2020
Table 21. Korean Tariff Schedule for Fishery Products
Description H.S. Code
2012
Base
Rate
Live Fish, Ornamental, Other Live
0301.XX.XXXX except
0301.92.1000, 0301.92.2000 and
0301.99.4010
10%
Live Fish, Other, Eels, Glass Eels (not exceeding 0.3g per unit, for
aquaculture) and Sea Bream Fry (for aquaculture) 0301.92.1000 and 0301.99.4010 0%
Live Fish, Other, Eels, Young Eels (exceeding 0.3g and not exceeding
50g per unit, for aquaculture) 0301.92.2000 5%
Fish, Fresh or Chilled 0302.XX.XXXX 20%
Fish, Frozen 0303.XX.XXXX 10%
Fish Fillets and Other Fish Meat - Fresh or Chilled Fillets of Tilapias,
Catfish, Pacific Salmon, Trout, Flat Fish, Swordfish, Toothfish, and
Other Fish
0304.3X.XXXX, 0304.4X.XXXX,
0304.5X.XXXX 20%
Fish Fillets and Other Fish Meat - Frozen Fillets of Tilapias, Catfish,
Cod, Haddock, Coalfish, Hake, Alaska Pollack, Pacific Salmon, Trout,
Flat Fish, Swordfish, Toothfish, Herrings, Tunas and Other Fish
0304.6X.XXXX, 0304.7X.XXXX,
0304.8X.XXXX, 0304.9X.XXXX 10%
Fish, Dried, Salted or in Brine, Smoked Fish, whether or not cooked
before or during the smoking process, Flours, Meals and Pellets of
Fish, Fit for Human Consumption
0305.XX.XXXX 20%
Crustaceans, whether in shell or not, Live, Fresh, Chilled, Frozen,
Dried, Salted or in Brine, Smoked Crustaceans, whether or not cooked
before or during the smoking process, Crustaceans, in shell or not,
Cooked by Steaming or by Boiling in Water, whether or not chilled,
Frozen, Dried, Salted in Brine, Flours, Meals and Pellets of
Crustaceans, Fit for Human Consumption
0306.XX.XXXX 10%

Mollusks, whether in shell or not, Live, Fresh, Chilled, Frozen, Dried,
Salted or in Brine, Smoked Mollusks, whether in shell or not, whether
or not cooked before or during the smoking process, Flours, Meals and
Pellets of Mollusks, Fit for Human Consumption – Oysters, Scallops,
Mussels, Smoked Cuttle Fish and Squid, Octopus, Snails, Clams,
Cockles, Ark Shells, Abalone, Top Shells and Adductors of Shellfish
0307.1X.XXXX, 0307.2X.XXXX,
0307.3X.XXXX, 0307.4X.XXXX,
0307.5X.XXXX, 0307.6X.XXXX,
0307.7X.XXXX, 0307.8X.XXXX
and 0307.9x.XXXX except
0307.11.1010, 0307.11.1090,
0307.41.XXXX, 0307.49.10XX,
0307.49.2000, 0307.49.3000,
0307.71.2010 and 0307.91.2010
20%
Mollusks, whether in shell or not, Live, Fresh, Chilled, Frozen, Dried,
Salted or in Brine, Smoked Mollusks, whether in shell or not, whether
or not cooked before or during the smoking process, Flours, Meals and
Pellets of Mollusks, Fit for Human Consumption - Live, Fresh or
Chilled Oyster Spat, Ark Shell and Pearl Oyster for Seed
0307.11.1010, 0307.71.2010,
0307.91.2010 0%
Mollusks, whether in shell or not, Live, Fresh, Chilled, Frozen, Dried,
Salted or in Brine, Smoked Mollusks, whether in shell or not, whether
or not cooked before or during the smoking process, Flours, Meals and
Pellets of Mollusks, Fit for Human Consumption - Live, Fresh or
Chilled Oyster Spat Other
0307.11.1090 5%
Mollusks, whether in shell or not, Live, Fresh, Chilled, Frozen, Dried,
Salted or in Brine, Smoked Mollusks, whether in shell or not, whether
or not cooked before or during the smoking process, Flours, Meals and
Pellets of Mollusks, Fit for Human Consumption – Cuttle Fish, Squid
0307.41.XXXX, 0307.49.10XX,
0307.49.2000, 0307.49.3000 10%
Aquatic Invertebrates Other Than Crustaceans and Mollusks,
Live, Fresh, Chilled, Frozen, Dried, Salted or in Brine, Smoked
Aquatic Invertebrates Other Than Crustaceans and Mollusks, whether
or not cooked before or during the smoking process, Flours, Meals and
Pellets of Aquatic Invertebrates Other Than Crustaceans and Mollusks,
Fit for Human Consumption – Sea Cucumber, Sea Urchins, Jellyfish
and Other
0308.XX.XXXX except
0308.90.1011 20%
Aquatic Invertebrates Other Than Crustaceans and Mollusks,
Live, Fresh, Chilled, Frozen, Dried, Salted or in Brine, Smoked
Aquatic Invertebrates Other Than Crustaceans and Mollusks, whether
or not cooked before or during the smoking process, Flours, Meals and
Pellets of Aquatic Invertebrates Other Than Crustaceans and Mollusks,
Fit for Human Consumption – Live, Fresh or Chilled Sea-Squirts for
Seed
0308.90.1011 0%
Extracts and Juices of Fish or Crustaceans, Mollusks or Other
Aquatic Invertebrates 1603.00.3000 and 1603.00.4000 30%
Prepared or Preserved Fish, Caviar and Substitutes Prepared from
Fish Eggs – Salmon, Herrings, Sardines, Tunas, Mackerel, Anchovies,
Eels, Saury, Jerk Filefish, Fish Pastes, Fish Marinade, Fish Cake,
Caviar and Caviar Substitutes
1604.XX.XXXX 20%
Crustaceans, Mollusks and Other Aquatic Invertebrates, Prepared
or Preserved – Crab, Shrimps and Prawns, Lobster, Oysters, Scallops,
Mussels, Cuttle Fish, Squid, Octopus, Clams, Abalone, Snails, Sea
Cucumber, Sea Urchins, Jellyfish and Other Fish
1605.XX.XXXX 20%
Source: Korea Customs and Trade Development Institute, Import/Export Customs Clearance General Guidebook of Korea,
2021
Attachments:
No Attachments.