sustainable development of export- orientated farmed seafood ...
Upload
independentCategory
view
0download
0
An AFLP-based survey of genetic diversity and relationshipsof major farmed cultivars and geographically isolated wildpopulations of Saccharina japonica (Phaeophyta)along the northwest coasts of the Pacific
Ti Feng Shan & Shao Jun Pang & Yu Rong Zhang &
Irina M. Yakovleva & Anna V. Skriptsova
# Springer Science+Business Media B.V. 2010
Abstract The genetic diversity and relationships of sixrepresentative cultivars and six geographically isolated wildpopulations of Saccharina japonica along the northwestcoasts of the Pacific Ocean were investigated using AFLPmarkers. A total of 547 bands were generated across allsamples by ten primer combinations. At the cultivar orpopulation level, the percentage of polymorphic loci (P),gene diversity (H), and Shannon’s information index (I)was highest in Dalian population (P 59.05%; H 0.2057; I0.3062) and lowest in Lianjiang cultivar (P 9.87%; H0.0331; I 0.0497). At the species level, P, H, and I were85.01%, 0.1948, and 0.3096, respectively. Unique bandswere detected in all the six wild populations, with Dalianbeing the most. In comparison, only Yanza cultivarpossessed one unique band. The GST value was 0.6226and the gene flow (Nm) was 0.1515, indicating stronggenetic differentiation among cultivars and populations.
Two UMPGA dendrograms were constructed based on theDice similarity coefficients among individuals and ongenetic distances among cultivars and populations, whichgenerally revealed three major clades corresponding tothree countries. Analysis of molecular variance revealedthat a larger proportion (60.21%) of the total geneticvariation was attributable to differences among cultivarsand populations. The Mantel test suggested that geneticdifferentiation was positively correlated with geographicdistance (r=0.7962, P=0.011) in the six wild populations,agreeing with the isolation by distance model. On thewhole, low to moderate genetic diversity within cultivarsand populations (except Dalian population) and highgenetic differentiation among cultivars and populationswere detected.
Keywords AFLP. Cultivar . Genetic differentiation .
Genetic diversity . Population structure .
Saccharina japonica
Introduction
Saccharina japonica (Areschoug) Lane, Mayes, Druehl,and Saunders, a kelp native to the northwest coasts of thePacific Ocean, has been farmed by the Chinese as humanfood and raw industrial materials for more than 50 years(Tseng 2001). The largest scale and highest annualproduction of this seaweed among all farmed seaweedsdetermine its fundamental impact on the life of local peopleas well as the coastal ecology of the near-shore waters (Fei2004). According to Tseng (2001), S. japonica is notindigenous to China but was accidentally introduced to theChinese coast from Japan around 1927. Now, this species
T. F. Shan : S. J. Pang (*)Marine Biological Culture Collection Center,Institute of Oceanology, Chinese Academy of Sciences,7 Nanhai Rd,Qingdao 266071, Chinae-mail: [email protected]: www.mbccc.ac.cn
Y. R. ZhangFisheries Research Institute of Zhejiang Province,Zhoushan 316100, China
I. M. Yakovleva :A. V. SkriptsovaInstitute of Marine Biology,Far Eastern Branch of Russian Academy of Sciences,Palchevskogo 17,Vladivostok 690041, Russia
DOI 10.1007/s10811-010-9530-xJ Appl Phycol (2011) 23:35–45
Received: 28 July 2009 /Revised and accepted: 26 April 2010 /Published online: 22 May 2010

naturally occurs from Liaodong peninsula in the north tothe south as far as 36° N latitude in China (http://www.fao.org/docrep/field/003/AB724E/AB724E01.htm).
Since the initiation of cultivation of S. japonica in China inthe 1950s, more than a dozen of cultivars characterized byimproved agronomical features have been bred throughmethods of physical mutation and steady selection incombination with successive self-breeding (Fang et al.1962, 1983; Tian and Yuan 1989; Wu and Lin 1987). Thesecultivars have played crucial roles at different periods in thefarming history in terms of improvement of production orthe expansion in the farming area, especially to thesubtropical south (http://www.fao.org/docrep/field/003/AB724E/AB724E01.htm). However, in the current cultiva-tion system of summer sporeling-raising technique adoptedby most algal farms (Tseng et al. 1955), seedlings areannually produced from the spores of a collection ofhundreds of parental sporophytes. The recirculated coldseawater is shared in the course of seedling productionprocess, resulting in potential contamination of differentcultivars. As such, a cultivar may lose the initial agronomicalcharacteristics after a few years of repeated use in practicalfarming. One of the examples of such degeneration andcontamination is the well-known elite cultivar recently usedin China, i.e., cultivar 90-1 (Xia et al. 2005; Zhang et al.2007a). One solution to solve the aforementioned degener-ation and contamination problem in application of a selectedcultivar is the use of vegetative gametophytes which wastermed 'free-living technique' when first applied in masscultivation of another brown alga, i.e., Undaria pinnatifida(Harvey) Suringar (Perèz et al. 1992; Pang and Wu 1996;Pang et al. 1997). The core of this technique is to preserveand multiply the selected female and male gametophyteclones in bioreactors (or simply in large culture bottles)under restricted light and temperature regimes. The male andfemale lines of the haploid stage can be propagated andpreserved for repeated use, similar to the preservation ofdifferent lines of male and female parental plants in rice forbreeding (Yuan 1997). In comparison with terrestrial crops,an alga of the genus of Saccharina has the advantage that thehaploid gametophyte can be vegetatively propagated. Incontrast, in rice, special crossing schemes by use of differentlines of the diploid parental plants have to be used (Yuan1997, 2004; Cheng et al. 2004). Several cultivars have beenreported to be bred using vegetative gametophytes in S.japonica (Li et al. 2007, 2008a). Offspring derived from thismono-crossing program gave high identity in geneticbackground (Shan and Pang 2009). In Saccharina farmingin China, the percentage of offsprings of the cultivars thathave been bred through selected gametophyte crossings isincreasing in recent years (Li et al. 2007, 2008a). Basically,individuals of the farmed populations along the Chinese
coast are composed of offspring of different cultivars, eithervia spore or gametophyte methods. Unfortunately, there hasbeen no comprehensive investigation of the genetic structureon a China-wide level due to lack of proper techniques inearly years or lack of attention nowadays even thoughseveral molecular methods are readily available for suchanalysis (Zhou et al. 2003; Wang et al. 2004, 2005; Shi et al.2007, 2008; Li et al. 2008b; Zhang et al. 2008a).
In practical farming of S. japonica, selection of desirableparents is an important task to initiate an intraspecifichybrid-breeding program. Because heterosis is associatedwith the interaction of different alleles at a locus (Jones1945), it is suggested that molecular marker diversity may beused to select parents for building a hybridization scheme(Zhang et al. 2007b). In various land crops, much effort hasbeen made to investigate the relationship between DNAmarker-based genetic variation of the parents to be used in ahybrid-breeding program and the resulting heterosis (Stuberet al. 1992; Martin et al. 1995; Zhao et al. 1999; Zhang et al.2007b; Kiula et al. 2008). Thus, it is crucial to understandthe genetic relationship of individuals from the farmed, aswell as the wild populations, by use of DNA markers for abetter choice of parental plants in breeding practice.
Amplified fragment length polymorphism (AFLP) hasbeen widely used for analysis of genetic structure ofpopulations in many organisms especially to plants (Benschand Åkesson 2005). It has been applied also to species ofSaccharina for analysis of phylogeny, genetic diversity andrelationships, construction of genetic linkage maps, andparentage assignment (Erting et al. 2004; Li et al. 2007;Zhang et al. 2008a; Li et al. 2009). The multilocus markerAFLP is advantageous because of its high resolution,repeatability, and the capacity to detect a large number ofloci quickly. As a dominant marker, however, AFLP alsohas its drawbacks such as size homoplasy (Vekemans et al.2002; Bonin et al. 2007; Meudt and Clarke 2007; Caballeroet al. 2008).
The principal goal of this investigation was to analyzethe genetic diversity and relationships of representativecultivars and wild populations of S. japonica along thenorthwestern coasts of the Pacific by the use of AFLPmarkers. It is anticipated that the results of this investiga-tion will help us make a better choice of the desiredparental plants in the hybrid-breeding program.
Materials and methods
Sampling design
From August to September of 2008, six cultivars of S.japonica were collected from its two principal cultivation
J Appl Phycol (2011) 23:35–4536

grounds of China. Five of them, namely Zhenhaidai (ZH),Daban (DB), Fujian (FJ), Yanza (YZ), and Benniu (BN),were collected from Weihai city, Shandong province. One(Lianjiang, LJ) was sampled from Lianjiang county, Fujianprovince (Fig. 1). They are representative cultivars that areamong the most extensively farmed ones of S. japonica inChina. Since most of these cultivars were named by thefarmers, it is thus difficult to explore their genuine pedigree.It is assumed that the ancestor of cultivar ZH wasintroduced from Japan, and FJ and LJ are descendants ofnorthern population transplanted to Fujian province, andYZ is the hybrid between S. japonica and Saccharinalongissima (Miyabe) Lane, Mayes, Druehl, and Saunders.For DB and BN, however, nothing related to their origin isavailable to our knowledge. Meanwhile, six geographicallyisolated wild populations were sampled from Dalnegorsk(DG) and Vladivostok (VL) in Russia; Kangnung (KR) inKorea; and Dalian (DL), Weihai (GW), and Qingdao (QD)in China (Fig. 1), respectively. DG and VL are two typical
populations indigenous to the Far East of Russia. KR is onerepresentative population nowadays naturally distributed inthe northeast coast of Korea. DL and QD putatively standfor the most northern and southern populations thatnaturally occur in China, respectively, and GW is in themiddle of them in latitude. Wild populations in thisinvestigation are defined as those that are not artificiallyfarmed in the wild. One small piece of blade (approximate-ly 100 g, fresh weight) was cut from each individualsporophyte, transported to Qingdao in an ice box, and thenpreserved at −80°C. For each cultivar and wild population,ten samples were selected randomly for DNA isolation andAFLP analysis.
DNA isolation
Sporophyte tissue was washed several times with sterilizedsea water, dried with filter paper, and ground to fine powderin liquid nitrogen using a mortar and pestle. Up to 100 mg
Fig. 1 Geographic locations ofthe sampling sites of sixcultivars (ZH, DB, FJ, YZ, BN,and LJ) and six wild populations(DL, QD, GW, VL, DG,and KR) of S. japonica alongthe northwest coasts of thePacific
J Appl Phycol (2011) 23:35–45 37
of the powder was transferred to a 1.5-mL microcentrifugetube and kept in a refrigerator at −80°C. Genomic DNAwas extracted from each of 120 individuals according to themethod of Wang et al. (2006) and Shan and Pang (2009).Seven hundred microliters of cetyl trimethyl ammoniumbromide (CTAB) buffer [3% CTAB (w/v), 1.4 M NaCl,20 mM EDTA, 100 mM Tris–HCl, pH 8.0, 1% polyvinylpyrrolidone (w/v), 1% β-mercaptoethanol (v/v), 10 μg mL−1
RNase A] was added to the tube, and the mixture wasincubated at 65°C for 60 min with gentle inversionoccasionally. One third volume of 5 M KAc (pH8.0) wasadded to the mixture and kept on ice for 15 min.Centrifugation was followed at 13,523×g for 15 min, andthe upper phase was transferred to a new tube. One volumeof chloroform-isoamyl alcohol (24:1) was added andcentrifuged at 13,523×g for 10 min. This step was repeatedonce. The aqueous phase was precipitated with one volumeof cold isopropanol at −20°C for 30 min and collected bycentrifugation at 13,523×g for 10 min. Finally, the precip-itate was washed with 75% ethanol, dried, and dissolved indouble-distilled water. The concentration and the quality ofisolated DNA were assessed by electrophoresis on 0.8%agarose gel. DNA concentration of each sample was adjustedto 50 ng μL−1.
AFLP analysis AFLP analysis was carried out based on theprocedures described by Vos et al. (1995). Enzymedigestion and adaptor ligation reactions were performedsimultaneously at 37°C for 6 h in a total volume of 12.5 μLsolution including 1×T4 ligase buffer (66 mM Tris–HCl,pH7.6, 6.6 mM MgCl2, 10 mM dithiothreitol, 0.1 mMATP), 100 μg mL−1 BSA, 0.2 μM EcoRI adaptor, 2 μMMseI adaptor, 4.5 U EcoRI (TAKARA Biotechnology Co.,Ltd., China), 2.5 U MseI (New England Biolabs, Ltd.,China), 70 U T4 ligase (TAKARA Biotechnology Co.,Ltd., China), and 50 ng of genomic DNA.
Preselective amplification was performed in a 20 μLsolution containing 3 μL of ligated DNA product, 1×PCRbuffer (10 mM Tris–HCl, pH8.3, 50 mM KCl), 2 mMMgCl2, 200 μM dNTPs, 40 ng of each of the preamplifi-cation primers of EcoRI + 0 and MseI + 0, 0.6 U TaqPolymerase (TAKARA Biotechnology Co., Ltd., China).Preamplification product DNA was diluted 40-folds withsterile double-distilled water and was then used as templatefor the selective amplification.
The selective amplification PCR reaction was performedin a final volume of 20 μL containing 4 μL of dilutedpreamplified sample DNA, 40 ng of each EcoRI + 2 andMseI + 3 primers, 1×PCR buffer (10 mM Tris–HCl, pH8.3, 50 mM KCl), 2 mM MgCl2, 200 μM dNTPs, and0.6 U Taq polymerase. Both preamplification and selectiveamplification were carried out according to the programs ofSubudhi et al. (2005) in a T-gradient thermocycler
(Biometra, Göttingen, Germany). Ten EcoRI + MseI primercombinations were used: EcoRI-AA/MseI-CAC, EcoRI-AA/MseI-CAG, EcoRI-AA/MseI-CAT, EcoRI-AA/MseI-CTA,EcoRI-AA/MseI-CGT, EcoRI-AT/MseI-CAT, EcoRI-AT/MseI-GAC, EcoRI-AT/MseI-CGA, EcoRI-CC/MseI-CGA,and EcoRI-CT/MseI-CGT.
The selective PCR products were mixed with formamideloading buffer (98% deionized formamide, 10 mM EDTA,0.05% bromophenol blue, and 0.05% xylene cyanol) anddenatured at 95°C for 5 min and immediately placed on ice.Six microliters of PCR mixture was loaded onto a 5%denaturing polyacrylamide gel. Electrophoresis was per-formed on a DNA sequencing system (Junyi-DongfangElectrophoresis Equipment Co., Ltd., Beijing, China) at aconstant 60 W for 2 h. Finally, the DNA bands on the gelwere visualized by silver staining according to theprocedures of Bassam et al. (1991).
Data analysis
Unambiguous bands ranging in size from 100 to 750 bpwere manually scored as present (1) or absent (0). Eachband was assumed as a locus. Binary matrices wereprepared for analysis using software NTSYSpc (version2.10e, Rohlf 2000). Individual-wise genetic similaritieswere calculated with Dice coefficient (Dice 1945) followingthe formula: Sij=2a/(2a+b+c), where Sij is the similaritybetween two individuals i and j, a the number of bandspresent in both individuals, b the number of bands presentin i and absent in j, and c is the number of bands absent in iand present in j. Similarity matrices were subjected tocluster analysis using the unweighted pair group methodwith the arithmetic averages (UPGMA) clustering approachand a dendrogram was constructed using a tree plot module.By use of the matrix comparison plot module, a copheneticcorrelation was computed to test the goodness of fit or thecorrelation of the two matrices (cophenetic and tree matrix).Bootstrap analysis was performed to determine the strengthof the clusters using software WINBOOT with 1,000replications (Yap and Nelson 1996). Multilocus genotypeswere analyzed hierarchically to reveal the genotypicdiversity within cultivars and wild populations, amongcultivars and populations, and also among differentcountries.
Genetic diversity within cultivars or populations wasestimated using POPGENE version 1.31 (Yeh et al. 1999)in three ways: (1) the percentage of polymorphic loci (P),(2) Nei’s (1973) gene diversity (H), assuming Hardy–Weinberg equilibrium, and (3) Shannon’s information index(I, Lewontin 1972).
The genetic differentiation among cultivars and popula-tions was analyzed also in three ways: (1) geneticdifferentiation coefficient (GST) and gene flow (Nm) were
J Appl Phycol (2011) 23:35–4538

calculated using POPGENE software. GST was calculatedaccording to the method of Nei (1987). Nm was estimatedaccording to the formula: Nm=(1−GST)/4 GST (Slatkin andBarton 1989). (2) Cultivar and population pairwise geneticdistances were calculated by Nei’s (1978) unbiased distancemeasures. A dendrogram was constructed to show therelationships among sampled cultivars and wild populationsbased on the genetic distance matrix using TFPGA software(Miller 1997). During bootstrapping, 1,000 permutationswere performed to evaluate the robustness of the groupings.(3) Analysis of molecular variance (AMOVA) was per-formed using ARLEQUIN version 3.11 (Excoffier et al.2005) to partition the genetic variation among cultivars andpopulations, within cultivars and populations. Permutationprocedures (1,000 replicates) for significance testing ofvariance components were performed. Cultivar and popu-lation pairwise FST (the fixation index) values werecalculated and displayed in a matrix.
In order to determine whether the genetic differentiations(FST) were positively correlated to geographical distance,Mantel tests were performed between matrices of FST andgeographical distance among the selected six wild popula-tions (DL, QD, GW, VL, DG, KR).
Results
AFLP polymorphism and genetic variation
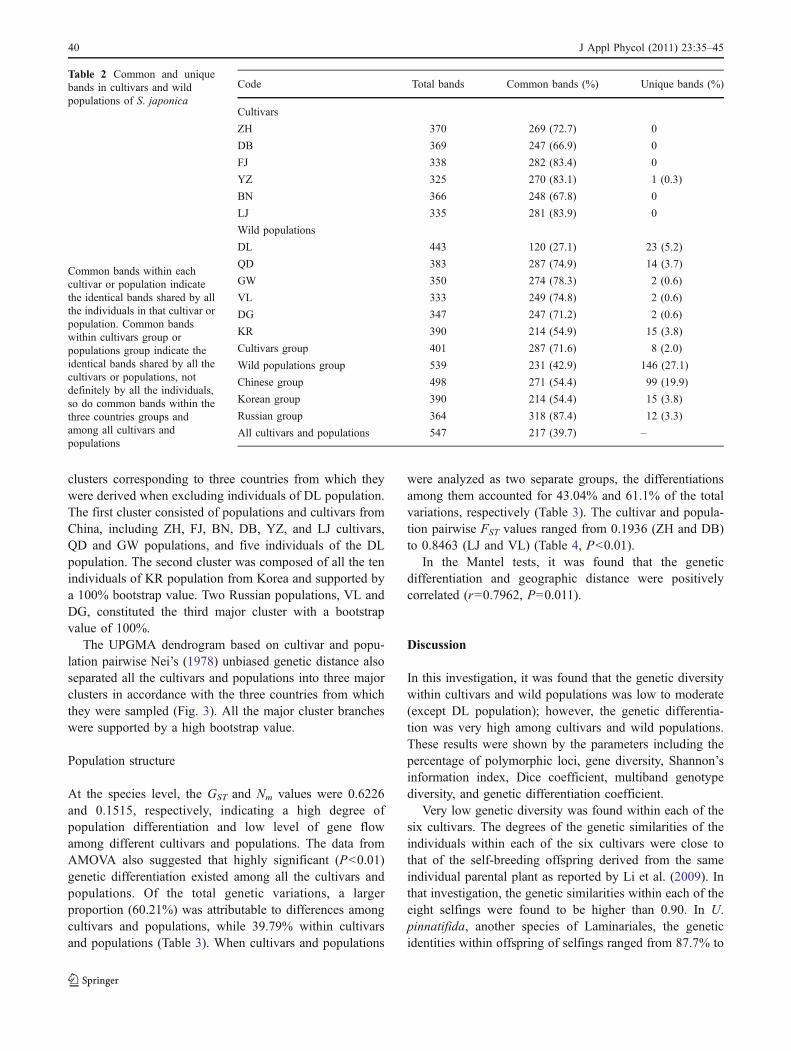
A total of 547 AFLP bands were identified in 120individual sporophytes, with average 54.7 bands generatedby each pair of primer combination. Among these bands,465 were polymorphic across all individuals. The percent-age of polymorphic loci (P), gene diversity (H), andShannon’s information index (I) for each cultivar orpopulation is presented in Table 1. The DL wild populationhad the highest P (59.05%), H (0.2057), and I (0.3062),while the LJ cultivar had the lowest P (9.87%), H (0.0331),and I (0.0497). P, H, and I across all the cultivars andpopulations were 85.01%, 0.1948, and 0.3096, respectively(Table 1). The common bands shared by all the individualswithin each cultivar or wild population accounted for27.1% (DL) to 83.9% (LJ) of the total bands (Table 2).The numbers of common bands shared among all thecultivars and among all the wild populations were 287 and231, accounting for 71.6% and 42.9% of the total bands,respectively. 39.7% of total bands were possessed by all thecultivars and wild populations. Unique bands were detectedin all the wild populations, with DL having the most. Incomparison, only YZ possessed one unique band in all thesix cultivars. When taken as separate groups, wildpopulations and cultivars possessed 146 and 8 uniquebands, respectively. The unique bands belonging to China,
Korea, and Russia were 99, 15, and 12, respectively(Table 2). In general, the genetic diversity at the cultivaror population level was low to moderate, except for the DLpopulation which contained much more variations than anyother cultivar or population. However, the genetic diversityat the species level was high (Tables 1 and 2).
Cluster analysis
The UPGMA cluster analysis based on individual pairwiseDice similarity coefficients reveals the genetic relationshipamong 120 individuals of S. japonica from six cultivars andsix populations sampled from three countries. The cophe-netic correlation coefficient (r value) was 0.97, indicative ofa very good fit between the dendrogram clusters and thesimilarity matrices from which they were derived. Ingeneral, individuals belonging to the same cultivar or wildpopulation were clustered priorly. For example, individualsfrom FJ, LJ, and YZ cultivars and GW, QD, and KRpopulations grouped together first, respectively, with highbootstrap values (Fig. 2). However, there were also a fewexceptions. Individuals from ZH cultivar and VL and DGpopulations formed a cluster, respectively, with ZH10,VL01, and DG04 as exceptions. Individuals from DB andBN cultivars grouped together respectively as two and threeseparate clusters. Due to the high genetic variation amongthem, individuals from the DL population were disperseddistantly at several positions in the dendrogram. On thewhole, all these individuals were assigned into three major
Table 1 Genetic polymorphism in six cultivars and six wildpopulations of S. japonica across 547 AFLP loci
Code Polymorphic bands P (%) H I
Cultivars
ZH 101 18.46 0.0663 0.0983
DB 122 22.30 0.0761 0.1142
FJ 56 10.24 0.0405 0.0590
YZ 55 10.05 0.0395 0.0576
BN 118 21.57 0.0761 0.1135
LJ 54 9.870 0.0331 0.0497
Wild populations
DL 323 59.05 0.2057 0.3062
QD 96 17.55 0.0643 0.0951
GW 76 13.89 0.0507 0.0748
VL 84 15.36 0.0541 0.0804
DG 100 18.28 0.0625 0.0940
KR 176 32.18 0.1131 0.1696
Total 465 85.01 0.1948 0.3096
Total means at the species level
P percentage of polymorphic loci, H Nei's (1973) gene diversity, IShannon's information index
J Appl Phycol (2011) 23:35–45 39
clusters corresponding to three countries from which theywere derived when excluding individuals of DL population.The first cluster consisted of populations and cultivars fromChina, including ZH, FJ, BN, DB, YZ, and LJ cultivars,QD and GW populations, and five individuals of the DLpopulation. The second cluster was composed of all the tenindividuals of KR population from Korea and supported bya 100% bootstrap value. Two Russian populations, VL andDG, constituted the third major cluster with a bootstrapvalue of 100%.
The UPGMA dendrogram based on cultivar and popu-lation pairwise Nei’s (1978) unbiased genetic distance alsoseparated all the cultivars and populations into three majorclusters in accordance with the three countries from whichthey were sampled (Fig. 3). All the major cluster brancheswere supported by a high bootstrap value.
Population structure
At the species level, the GST and Nm values were 0.6226and 0.1515, respectively, indicating a high degree ofpopulation differentiation and low level of gene flowamong different cultivars and populations. The data fromAMOVA also suggested that highly significant (P<0.01)genetic differentiation existed among all the cultivars andpopulations. Of the total genetic variations, a largerproportion (60.21%) was attributable to differences amongcultivars and populations, while 39.79% within cultivarsand populations (Table 3). When cultivars and populations
were analyzed as two separate groups, the differentiationsamong them accounted for 43.04% and 61.1% of the totalvariations, respectively (Table 3). The cultivar and popula-tion pairwise FST values ranged from 0.1936 (ZH and DB)to 0.8463 (LJ and VL) (Table 4, P<0.01).
In the Mantel tests, it was found that the geneticdifferentiation and geographic distance were positivelycorrelated (r=0.7962, P=0.011).
Discussion
In this investigation, it was found that the genetic diversitywithin cultivars and wild populations was low to moderate(except DL population); however, the genetic differentia-tion was very high among cultivars and wild populations.These results were shown by the parameters including thepercentage of polymorphic loci, gene diversity, Shannon’sinformation index, Dice coefficient, multiband genotypediversity, and genetic differentiation coefficient.
Very low genetic diversity was found within each of thesix cultivars. The degrees of the genetic similarities of theindividuals within each of the six cultivars were close tothat of the self-breeding offspring derived from the sameindividual parental plant as reported by Li et al. (2009). Inthat investigation, the genetic similarities within each of theeight selfings were found to be higher than 0.90. In U.pinnatifida, another species of Laminariales, the geneticidentities within offspring of selfings ranged from 87.7% to
Code Total bands Common bands (%) Unique bands (%)
Cultivars
ZH 370 269 (72.7) 0
DB 369 247 (66.9) 0
FJ 338 282 (83.4) 0
YZ 325 270 (83.1) 1 (0.3)
BN 366 248 (67.8) 0
LJ 335 281 (83.9) 0
Wild populations
DL 443 120 (27.1) 23 (5.2)
QD 383 287 (74.9) 14 (3.7)
GW 350 274 (78.3) 2 (0.6)
VL 333 249 (74.8) 2 (0.6)
DG 347 247 (71.2) 2 (0.6)
KR 390 214 (54.9) 15 (3.8)
Cultivars group 401 287 (71.6) 8 (2.0)
Wild populations group 539 231 (42.9) 146 (27.1)
Chinese group 498 271 (54.4) 99 (19.9)
Korean group 390 214 (54.4) 15 (3.8)
Russian group 364 318 (87.4) 12 (3.3)
All cultivars and populations 547 217 (39.7) –
Table 2 Common and uniquebands in cultivars and wildpopulations of S. japonica
Common bands within eachcultivar or population indicatethe identical bands shared by allthe individuals in that cultivar orpopulation. Common bandswithin cultivars group orpopulations group indicate theidentical bands shared by all thecultivars or populations, notdefinitely by all the individuals,so do common bands within thethree countries groups andamong all cultivars andpopulations
J Appl Phycol (2011) 23:35–4540

98.4% (Shan and Pang 2009). These comparison valuesindicated that individuals of the six cultivars were theoffspring of the parental plants after rather intensiveinbreeding. These results proved that the summer-seedlingproduction technique tends to homogenize a cultivar on ahigher level after a few generations of repeated use. Due tointensive inbreeding, the expected agronomical features(fast-growing rates or higher productivity) might be loststeadily, whereas harmful recessive genes might be aggre-gated. This conclusion was confirmed by communicationwith the algal farmers who often complain about thedegeneration of economic features. As a result, a cultivarwas usually quickly abandoned in practical production aftera few years (Li et al. 2008a). Crossbreeding by use ofselected parental plants isolated from different cultivars hasbeen rather popularly used in history in breeding practice(Li et al. 2008a). But, again, these new strains/cultivarsfaced the same fate. As indicated by the pairwise FST values(Table 4), the degrees of genetic differentiation among theprincipal cultivars presently farmed in China were suffi-ciently high to maintain their identity (Wright 1978). The
Fig. 3 Dendrogram of six cultivars (ZH, DB, FJ, YZ, BN, and LJ)and six wild populations (DL, QD, GW, VL, DG, and KR) of S.japonica based on the pairwise genetic distance matrix. Bootstrapvalues greater than 50% are indicated. The scale bar shows the valuesof the genetic distance
Fig. 2 Dendrogram of 120 sporophytic individuals of S. japonicabelonging to six cultivars (ZH, DB, FJ, YZ, BN, and LJ) and six wildpopulations (DL, QD, GW, VL, DG, and KR) constructed by UPGMAclustering based on the Dice similarity coefficient matrix that were
derived from 547 AFLP markers. Bootstrap values higher than 50%are indicated. The scale bar shows the values of Dice similaritycoefficient
J Appl Phycol (2011) 23:35–45 41

cluster analysis also showed clear genetic boundariesbetween different cultivars. It is interesting to note thatZH and DB which were the only two cultivars sampledfrom the same hatchery site shared the lowest pairwise FST
values, indicating a more frequent gene exchange betweenthese two. The exceptional individuals in ZH, DB, and BNthat were not grouped together in the cluster analysis werepossibly caused by contamination in the course of seedlingproduction under the summer sporeling-raising system. LJ,as the main cultivar widely used in the subtropical Fujianand Guangdong provinces, demonstrated the highest sim-ilarity among individuals within the population. It is strangeto note that, although FJ cultivar also originated fromFujian province, FJ and LJ did not show the nearest geneticrelationship. Instead, FJ was more similar to the cultivars inShandong province (ZH, DB, and BN). One reasonableexplanation of this result is that, after decades of mixedfarming with other cultivars, the original genetic back-ground of FJ cultivar has been changed. YZ, which wassupposed to be the hybrid resulting from interspecific
hybridization, had the highest genetic distance with allother cultivars.
Low to moderate genetic diversity existed within eachwild population (except DL); however, high geneticdifferentiation existed among wild populations. In manycases, characteristics of the life history act as accuratepredictors of genetic diversity and population structure. Inmarine animals, benthic invertebrates with limited larvaldispersal showed higher degrees of genetic differentiationthan species that are able to disperse over greater distances(Hellberg 1994, 1995; Féral 2002). In kelps, there are atleast three means of dispersal, i.e., gametophytes, spores,and drifting fronds. Some of the previous investigationsimplied that kelps had limited dispersal ability, thusdisplaying high genetic differentiation in fine geographicscale. For examples, in the sea palm kelp Postelsiapalmaeformis Ruprecht, most dispersal occurs over adistance of 1–5 m (Dayton 1973; Coyer et al. 1997). Thekelps Alaria esculenta (Linnaeus) Greville and Macrocystispyrifera (Linnaeus) Agardh have a dispersal radius of 5 m
Table 4 Pairwise FST values between different cultivars and populations of S. japonica
ZH DB FJ YZ BN LJ DL QD GW VL DG KR
ZH
DB 0.1936
FJ 0.2856 0.3426
YZ 0.5413 0.4547 0.6637
BN 0.2425 0.2392 0.3303 0.3925
LJ 0.4987 0.4917 0.4699 0.7144 0.4078
DL 0.3320 0.2956 0.3306 0.4362 0.2843 0.3408
QD 0.4957 0.5166 0.5468 0.6818 0.4782 0.5203 0.3811
GW 0.4747 0.4740 0.5016 0.6988 0.4278 0.5252 0.3653 0.5438
VL 0.7962 0.7667 0.8392 0.8355 0.7718 0.8463 0.5859 0.8067 0.8194
DG 0.7679 0.7381 0.8130 0.8054 0.7371 0.8191 0.5644 0.7864 0.7911 0.3368
KR 0.5918 0.5439 0.6314 0.6393 0.5481 0.6212 0.4214 0.5998 0.6081 0.6263 0.5791
All tested effects were highly significant (P<0.01)
Table 3 AMOVA for 120 individuals in six cultivars and six wild populations of S. japonica
Source of variation Degrees of freedom Sum of squares Variance components Percentage of variation
All cultivars and populations as a group
Among cultivars and populations 11 3,859.417 32.91061 60.21
Within cultivars and populations 108 2,349.000 21.75000 39.79
Cultivars and populations as two respective groups
Among cultivars 5 682.917 12.06185 43.04
Within cultivars 54 862.100 15.96481 56.96
Among populations 5 2,299.917 43.24481 61.10
Within populations 54 1,486.900 27.53519 38.90
All tested effects were highly significant (P<0.01)
J Appl Phycol (2011) 23:35–4542

(Sundene 1962; Anderson and North 1966). S. japonicamay likewise have a limited dispersal radius. It has longbeen established that the pheromone released by femalegametophytes in Laminariales can attract spermatozoidsfrom male gametophytes, providing the gametophytes arewithin a few millimeters of each other (Lüning and Müller1978; Müller et al. 1979, 1985; Müller 1981; Boland et al.1983; Maier and Müller 1986; Reed et al. 1992; Coyer et al.1997). In spite of this, poor dispersal can be compensatedfor by long-distance travel of floating reproductive thalliand water movement. In species of Sargassum polyceratiumMontagne and Halidrys dioica Gardner, the existence of thefloating reproductive fronds was the major reason for highgenetic diversity and low genetic differentiation in smallscale (Lu and Willliams 1994; Engelen et al. 2001). Reed etal. (1988) observed that turbulent water flow associated withwinter storms contributed to resuspension of kelp sporesoccurring near the bottom and allowed them to be trans-ported for greater distances by prevailing currents. Kusumoand Druehl (2000) suggested that water movement may beparamount in determining genetic variation at the geographicscales they investigated. In this study, the scale of eachsample site of the wild population was within 100 m due tothe difficulty of sampling in some regions. QD, GW, VL,and DG population were collected from semi-enclosed baywhere water movement is rather limited. These fourpopulations showed high similarity, which was probablyattributable to the high incidence of inbreeding resultingfrom the limited dispersal ability. It is reasonable to expectthat these populations were offspring originating fromreproductive sporophytes that were genetically related.
As for the question of why KR and DL populations hadmoderate to high genetic diversity, it is hypothesized that thecharacteristics of seawater currents in the two sampling placesmight enhance the dispersal distance. Taking DL populationas an example, it was sampled from a rocky plateau at 3-mwater depth in between two small islands where swift watercurrents prevail. In the subtidal waters in adjacent areas,robust wild populations of S. japonica are present (Pang, S.J.personal observation). Thus, the dispersal and hence thecrossing of different individuals were hypothesized to begreatly facilitated, resulting in greater genetic diversity. Thegeographic distances between the sample sites of the six wildpopulations were all greater than 200 km. Large geographicdistance is believed to be the major barrier that restrictedgene flow within S. japonica, resulting in high degree ofgenetic differentiation among populations. The geneticdifferentiation was found to be positively correlated togeographic distance in the Mantel test, agreeing with theIBD model (Wright 1946). This model was supported by thedendrogram constructed based on genetic distances in whichpopulations that were close in space clustered priorly andvice versa. The same model was also reported in Laminaria
digitata, Sargassum thunbergii (Mertens ex Roth) Kuntze,and Sargassum muticum (Yendo) Fensholt (Billot et al.2003; Zhao et al. 2007, 2008).
Polymorphic AFLP bands that were unique to singlewild populations were found in this investigation. Thismeans different wild populations possess their respectiveprivate alleles. In breeding practice, high genetic diversitywithin the species provides rich materials for parentalselection. The wild germplasm resources may be useful inkelp breeding to broaden its genetic base (Xu et al. 2000).High level of genetic differentiations among populationsmakes it possible for obtaining hybrid vigor throughintraspecific hybridization (Zhang et al. 2007b). Li et al.(2008c) established a linear relationship between geneticdistance of parental gametophyte clones and the heterosisof economic traits in hybrid sporophyte offspring. Theybelieved this could be used to predict the heterosis ofSaccharina hybrids. It has been demonstrated that thestrong genetic differentiation has resulted in reproductiveisolation to a certain degree, as the hybridizations betweenpopulations or cultivars with high FST value were found tohave lower fertility than the controls (Pang et al.,unpublished results). In spite of this, private geneticresources possessed by different cultivars or populationsmight be aggregated through hybridization. Data obtainedin this investigation may become important for futureapplication studies and selection of populations to be usedfor crossing trials in open sea. Since AFLP is a dominantmarker, it is impossible to distinguish between heterozy-gous and homozygous genotypes. It also suffers from theproblem of size homoplasy. In this investigation, we havetaken measures, including preferably scoring the largerbands (100–750 bp) and selecting a suitable number ofselective nucleotides in the primer sequence to obtainmoderate number of bands (54.7 on average), to minimizethe effect of the size homoplasy (Vekemans et al. 2002).However, it is inevitable to bring about biases in theanalyses of genetic diversity and population structure(Vekemans et al. 2002; Bonin et al. 2007; Meudt andClarke 2007; Caballero et al. 2008). As an alternative,microsatellite markers may be specifically useful to addressthe unanswered question in AFLP analyses. Analyzing thesame data set by microsatellites and comparing the resultsbetween microsatellites and AFLP analyses could be aninteresting perspective for the next study.
Acknowledgements The authors wish to thank Hyung Geun Kimand Kyu Sam Han from Kangnung-Wonju National University forcollecting the algal samples, Su Qin Gao, Shi Guo Li, Chun HuaSong, and Jing Pu Zhang for the great help in sample handling andsome of the experimental work. Special thanks go to the anonymousreviewers for their invaluable suggestions and comments. Thisinvestigation was financially supported by the following programs:
J Appl Phycol (2011) 23:35–45 43

(1) the 863 Hi-Tech Research and Development Program of China(2006AA10A412;2006AA10A416); (2) a project from the ChineseAcademy of Sciences (KSCX2-YW-N-47-07); (3) a project from theMinistry of Science and technology of China (2006DKA30470-017);(4) a China–Russia bilateral cooperation program between the ChineseAcademy of Sciences and the Far East Branch of Russian Academy ofSciences (program no. 2008-21#); (5) a project from Ministry ofAgriculture of China (200903030).
References
Anderson EK, North WJ (1966) In situ studies of spore productionand dispersal in the giant kelp Macrocystis. In: Young EG,McLochlan JL (eds) Proc Int Seaweed Symp, vol 5. Pergamon,Oxford, pp 73–86
Bassam JB, Caetano-Anolles G, Gresshoff PM (1991) Fast andsensitive silver staining of DNA in polyacrylamide gels. AnalBiochem 196:80–83
Bensch S, Åkesson M (2005) Ten years of AFLP in ecology andevolution: why so few animals? Mol Ecol 14:2899–2914
Billot C, Engel CR, Rousvoal S, Kloareg B, Valero M (2003) Currentpatterns, habitat discontinuities and population genetic structure:the case of the kelp Laminaria digitata in the English Channel.Mar Ecol Prog Ser 253:111–121
Boland W, Marner FJ, Jaenicke L, Müller DG, Folster E (1983)Comparative receptor study in gamete chemotaxis of theseaweeds Ectocarpus siliculosus and Cutleria multifida: anapproach to interspecific communication of algal gametes. EurJ Biochem 134:97–103
Bonin A, Ehrich D, Manel S (2007) Statistical analysis of amplifiedfragment length polymorphism data: a toolbox for molecularecologists and evolutionists. Mol Ecol 16:3737–3758
Caballero A, Quesada H, Rolan-Alvarez E (2008) Impact of amplifiedfragment length polymorphism size homoplasy on the estimationof population genetic diversity and the detection of selective loci.Genetics 179:539–554
Cheng SH, Cao LY, Yang SH, Zhai HQ (2004) Forty years’ developmentof hybrid rice: China’s experience. Rice Sci 11:225–230
Coyer JA, Olsen JL, Stam TW (1997) Genetic variability and spatialseparation in the sea palm kelp Postelsia palmaeformis (Phaeo-phyceae) as assessed with M13 fingerprints and RAPDs. JPhycol 33:561–568
Dayton PK (1973) Dispersion, dispersal, and persistence of the annualintertidal alga, Postelsia palmaeformis Ruprecht. Ecology54:433–438
Dice LR (1945) Measures of the amount of ecological associationbetween species. Ecology 26:297–302
Engelen AH, Olsen JL, Breeman AM, Stam WT (2001) Geneticdifferentiation in Sargassum polyceratium (Fucales: Phaeophy-ceae) around the island of Curacao (Netherlands Antilles). MarBiol 139:267–277
Erting L, Daugbjerg N, Pedersen PM (2004) Nucleotide diversitywithin and between four species of Laminaria (Phaeophyceae)analyzed using partial LSU and ITS rDNA sequences and AFLP.Eur J Phycol 39:243–256
Excoffier L, Laval G, Schneider S (2005) Arlequin ver. 3.0: anintegrated software package for population genetics data analysis.Evol Bioinform Online 1:47–50
Fang TC, Wu CY, Jiang Y, Li TT, Ren GZ (1962) The breeding of anew breed of Haidai (Laminaria japonica Aresch.) and itspreliminary genetic analysis. Acta Bot Sin 10:197–209, (inChinese with English abstract)
Fang TC, Cui JJ, Ou YL, Dai JX, Wang ML (1983) Breeding of thenew variety “Danhai No. 1” of Laminaria japonica by using a
female haploid clone of the kelp. J Shandong Coll Oceanol13:63–70, (in Chinese with English abstract)
Fei XG (2004) Solving the coastal eutrophication problem by largescale seaweed cultivation. Hydrobiologia 512:145–151
Féral JP (2002) How useful are the genetic markers in attempts tounderstand and manage marine biodiversity? J Exp Mar BiolEcol 268:121–145
Hellberg ME (1994) Relationships between inferred levels of geneflow and geographic distance in a philopatric coral, Balanophyl-lia elegans. Evolution 48:1829–1854
Hellberg ME (1995) Stepping-stone gene flow in the solitary coralBalanophyllia elegans: equilibrium and nonequilibrium at differ-ent spatial scales. Mar Biol Berl 123:573–581
Jones DF (1945) Heterosis resulting from degenerative changes.Genetics 30:527–542
Kiula BA, Lyimo NG, Botha AM (2008) Association between AFLP-based genetic distance and hybrid performance in tropical maize.Plant Breed 127:140–144
Kusumo HT, Druehl LD (2000) Variability over space and time in thegenetic structure of the winged kelp Alaria marginata. Mar Biol136:397–409
Lewontin RC (1972) The apportionment of human diversity. EvolBiol 6:381–398
Li XJ, Cong YZ, Yang GP, Shi YY, Qu SC, Li ZL, Wang GW, ZhangZZ, Luo SJ, Dai HL, Xie JZ, Jiang GL, Liu JL, Wang TY (2007)Trait evaluation and trial cultivation of Dongfang No. 2, thehybrid of a male gametophyte clone of Laminaria longissima(Laminariales, Phaeophyta) and a female one of L. japonica. JAppl Phycol 19:139–151
Li BJ, Shi YY, Yang GP, Che S, Li XJ, Cong YZ (2008a)Microsatellite DNA variation of the gametophyte clones isolatedfrom introduced Laminaria japonica (Phaeophyta) and L. long-issima of China and varieties derived from them. J Integr PlantBiol 50:352–359
Li XJ, Liu JL, Cong YZ, Qu SC, Zhang ZZ, Dai HL, Luo SJ, HanXB, Huang SS, Wang QY, Liang GJ, Sun J, Jin Y, Wang DQ,Yang GP (2008b) Breeding and trial cultivation of DongfangNo. 3, a hybrid of Laminaria gametophyte clones with a morethan intraspecific but less than interspecific relationship.Aquaculture 280:76–80
Li XJ, Yang GP, Shi YY, Cong YZ, Che S, Qu SC, Li ZL (2008c)Prediction of the heterosis of Laminaria hybrids with the geneticdistance between their parental gametophyte clones. J ApplPhycol 20:1097–1102
Li SG, Shan TF, Hou HS, Pang SJ (2009) Genetic analyses ofprincipal farmed cultivars of Laminaria japonica in China (I):AFLP analyses of self-breeding F1 of nine cultivars. J Fish SciChina 16:214–220 (in Chinese with English abstract)
Lu TT, Willliams SL (1994) Genetic diversity and genetic structure inthe brown alga Halidrys dioica (Fucales: Cystoseiraceae) inSouthern California. Mar Biol 121:363–371
Lüning K, Müller DG (1978) Chemical interaction in sexualreproduction of several Laminariales (Phaeophyceae): releaseand attraction of spermatozoids. Z Pflanzenphysiol 89:333–341
Maier I, Müller DG (1986) Sexual pheromones in algae. Biol Bull170:145–175
Martin JM, Talbert LE, Lanning SP, BlakeNK (1995) Hybrid performancein wheat as related to parental diversity. Crop Sci 35:104–108
Meudt HM, Clarke AC (2007) Almost forgotten or latest practice? AFLPapplications, analyses and advances. Trends Plant Sci 12:106–117
Miller MP (1997) Tools for population genetic analyses (TFPGA) 1.3:a Windows program for the analysis of allozyme and molecularpopulation genetic data. Computer software distributed by author
Müller DG (1981) Sexuality and sexual attraction. In: Lobban CS,Wynne JJ (eds) The biology of seaweeds. Bot. Monogr., vol. 17,pp 661–674
J Appl Phycol (2011) 23:35–4544

Müller DG, Gassman G, Lüning K (1979) Isolation of a spermatozoid-releasing and -attracting substance from female gametophytes ofLaminaria digitata. Nature 279:430–431
Müller DG, Maier I, Gassman G (1985) Survey on sexual pheromonespecificity in Laminariales (Phaeophyceae). Phycologia 24:475–484
Nei M (1973) Analysis of gene diversity in subdivided populations.Proc Natl Acad Sci U S A 70:3321–3323
Nei M (1978) Estimation of average heterozygosity and genetic distancefrom a small number of individuals. Genetics 89:583–590
Nei M (1987) Molecular evolutionary genetics. Columbia UniversityPress, New York, pp 159–166
Pang SJ, Wu CY (1996) Study on gametophyte vegetative growth ofUndaria pinnatifida and its application. Chin J Oceanol Limnol14:205–210
Pang SJ, Hu XY, Wu CY (1997) Intraspecific crossings on Undariapinnatifida (Harv.) Sur.: a possible time-saving way of strainselection. Chin J Oceanol Limnol 15:227–235
Perèz R, Kaas R, Campelle F, Arbault S, Barbaroux O (1992) Laculture de l’algue Undaria pinnatifida (Harvey) Suringar. In:Perèz R (ed) La Culture des Algues Marines dans le Monde.Service de la Documentation et des Publications (SDP)IFREMER, Brest, pp 425–462
Reed DC, Laur DR, Ebeling AW (1988) Variation in algal dispersaland recruitment: the importance of episodic events. Ecol Monogr58:321–335
Reed DC, Amsler CD, Ebeling AW (1992) Dispersal in kelps: factorsaffecting spore swimming and competency. Ecology 73:1577–1583
Rohlf FJ (2000) NTSYSpc: numerical taxonomy and multivariateanalysis system, version 2.1. Exeter Software, Setauket, New York
Shan TF, Pang SJ (2009) Assessing genetic identity of sporophyticoffspring of the brown algaUndaria pinnatifida derived from mono-crossing of gametophyte clones by use of amplified fragment lengthpolymorphism and microsatellite markers. Phycol Res 57:36–44
Shi YY, YangGP, Liu YJ, LiaoMJ, Li XJ, CongYZ (2007) Developmentof 18 polymorphic microsatellite DNA markers of Laminariajaponica (Phaeophyceae). Mol Ecol Notes 7:620–622
Shi YY, Yang GP, Liao MJ, Liu YJ, Shang S, Li XJ, Cong YZ (2008)Comparative study on the microsatellite DNA polymorphism ofthe gametophytes of Laminaria japonica and Laminaria long-issima. Periodical Ocean Univer China 38:303–308
Slatkin M, Barton NH (1989) A comparison of three indirect methodsfor estimating average levels of gene flow. Evolution 36:1349–1368
Stuber CW, Lincoln SE, Wolff DW, Helentijars T, Lander ES (1992)Identification of genetic factors contributing to heterosis in ahybrid from two elite maize inbred lines using molecularmarkers. Genetics 132:823–839
Subudhi KP, Parami PN, Harrison AS, Materne DM, Murphy JP, NashD (2005) An AFLP-based survey of genetic diversity amongaccessions of sea oats (Uniola paniculata, Poaceae) from thesoutheastern Atlantic and Gulf coast states of the United States.Theor Appl Genet 111:1632–1641
Sundene O (1962) The implications of transplant and culture experi-ments on the growth and distribution of Alaria esculenta. NyttMag Bot 9:155–174
Tian Z, Yuan B (1989) Report of the breeding of a novel kelp variety,“Zaohoucheng No.1”. Mariculture 1:7–17, (in Chinese)
Tseng CK (2001) Algal biotechnology industries and researchactivities in China. J Appl Phycol 13:375–380
Tseng CK, Sun KY, Wu CY (1955) On the cultivation of Haidai(Laminaria japonica Aresch) by summering young sporophytesat low temperature. Acta Bot Sin 4:255–264 (in Chinese withEnglish abstract)
Vekemans X, Beauwens T, Lemaire M, Roldan-Ruiz I (2002) Datafrom amplified fragment length polymorphism (AFLP) markers
show indication of size homoplasy and of a relationship betweendegree of homoplasy and fragment size. Mol Ecol 11:139–151
Vos P, Hogers R, Bleeker M, Reijans M, van de Lee T, Hornes M, FrijtersA, Pot J, Peleman J, Kuiper M, Zabeau M (1995) AFLP: a newtechnique for DNA fingerprinting. Nucleic Acids Res 23:4407–4414
Wang XL, Yang YX, Cong YZ, Duan DL (2004) DNA fingerprintingof selected Laminaria (Phaeophyta) gametophytes by RAPDmarkers. Aquaculture 238:143–153
Wang XL, Liu CL, Li XJ, Cong YZ, Duan DL (2005) Assessment ofgenetic diversities of selected Laminaria (Laminariales, Phaeo-phyta) gametophytes by inter-simple sequence repeat analysis. JIntegr Plant Biol 47:753–758
Wang D, Wang XL, Li DP, Wang FJ, Duan DL (2006) The geneticanalysis and germplasm identification of the gametophytes ofUndaria pinnatifida (Phaeophyceae) with RAPD method. J ApplPhycol 18:801–809
Wright S (1946) Isolation by distance under diverse systems ofmating. Genetics 31:39–59
Wright S (1978) Evolution and genetics of populations. Variabilitywithin and among natural populations, vol 4. University ofChicago Press, Chicago, 649 pp
Wu CY, Lin GH (1987) Progress in the genetics and breeding ofeconomic seaweeds in China. Hydrobiologia 151/152:57–61
Xia P, Wang XL, Li XJ, Zhao YS, Yao L, Duan DL (2005) Geneticstudy of Kelp “901” strain. Chin J Oceanol Limnol 23:152–157
Xu RQ, Tomooka N, Vaughan DA (2000) AFLP markers forcharacterizing the azuki bean complex. Crop Sci 40:808–815
Yap I, Nelson R (1996) WinBoot: a program for performing bootstrapanalysis of binary data to determine the confidence limits ofUPGMA-based dendrograms. IRRI discussion paper series no.14. IRRI, Manila
Yeh FC, Yang RC, Boyle T (1999) POPGENE (version 1.3.1).Microsoft Window-based freeware for population genetic analy-sis. http://www.ualberta.ca/∼fyeh/. University of Alberta and theCentre for International Forestry Research, Edmonton, Canada
Yuan LP (1997) Current status and developing prospects in two-linehybrid rice research in China. Res Agric Modernization 18:1–3(in Chinese with English abstract)
Yuan LP (2004) Hybrid rice for food security in the world. FAO RiceConference. FAO, Rome
Zhang QS, Tang XX, Cong YZ, Qu SC, Luo SJ, Yang GP (2007a)Breeding of an elite Laminaria variety 90-1 through inter-specific gametophyte crossing. J Appl Phycol 19:303–311
Zhang XQ, Wang XD, Jiang PD, Hua SJ, Zhang HP, Dutt Y (2007b)Relationship between molecular marker heterozygosity andhybrid performance in intra- and interspecific hybrids of cotton.Plant Breed 126:385–391
Zhang QS, Shi YY, Cong YZ, Qu SC, Yang GP (2008) AFLP analysisof the gametophyte clones derived from introduced Laminaria(Phaeophyta) and cultured varieties of China. Periodical OceanUniver China 38:429–435
Zhao MF, Li XH, Yang JB, Xu CJ, Hu RY, Liu DJ, Zhang QF (1999)Relationship between molecular marker heterozygosity andhybrid performance in intra- and inter-subspecific cross of rice.Plant Breed 118:139–144
Zhao FJ, Wang XL, Liu JD, Duan DL (2007) Population geneticstructure of Sargassum thunbergii (Fucales, Phaeophyta) detectedby RAPD and ISSR markers. J Appl Phycol 19:409–416
Zhao FJ, Liu FL, Liu JD, Ang PO Jr, Duan DL (2008) Geneticstructure analysis of natural Sargassum muticum (Fucales,Phaeophyta) populations using RAPD and ISSR markers. J ApplPhycol 20:191–198
Zhou ZG, Shi XZ, Hu YJ, Sun YP (2003) Genetic relationship amongbrown seaweed Laminaria longissima and various cultivars of L.japonica in China revealed by isozyme and RAPD markers. J FishSci China 10:474–480, (in Chinese with English abstract)
J Appl Phycol (2011) 23:35–45 45
Copyright © 2022 FDOKUMEN