Genetic variability of farmed and free-living populations of red foxes (Vulpes vulpes)
12
Ann. Anim. Sci., Vol. 12, No. 4 (2012) 501–512, DOI: 10.2478/v10220-012-0042-2 GENETIC VARIABILITY OF FARMED AND FREE-LIVING POPULATIONS OF RED FOXES (VULPES VULPES)* * Grażyna Jeżewska-Witkowska 1 , Beata Horecka 1 , Andrzej Jakubczak 1 , Kornel Kasperek 1 , Brygida Ślaska 1 , Monika Bugno-Poniewierska 2, 3 , Małgorzata Piórkowska 2 1 Department of Biological Basis of Animal Production, University of Life Sciences in Lublin, Akademicka 13, 20-950 Lublin, Poland 2 Laboratory of Genomics, National Research Institute of Animal Production, 32-083 Balice n. Kraków, Poland 3 Department of Genetics, University of Rzeszów, Rejtana 16 C, 35-959 Rzeszów, Poland Corresponding authors: [email protected], [email protected] Abstract This study was designed to determine the degree of genetic distinctiveness between farmed and wild foxes (Vulpes vulpes). Analysis of polymorphism in 16 microsatellite sequences led to the conclusion that red foxes raised on Polish farms and wild foxes living in Poland are two groups of genetically distinct animals. Farmed Polish foxes are genetically more similar to the popula- tion of wild animals from North America than they are to the free-living population in Poland, as confirmed by the fact that the farmed animals are descended from animals raised in Canada. The small genetic distance between wild Canadian foxes (indicated as the progenitor of farmed Polish foxes) and farmed Polish foxes possibly suggests that the differences between the farmed and wild Polish populations may result from the fact that Canadian and Polish foxes took separate evolutionary paths. Key words: Vulpes vulpes, wild and farmed animals, microsatellites, domestication For many years, the domestication process has been the subject of study by re- searchers in both animal and human sciences. The first scientific definition of do- mestication was proposed in 1868 by Charles Darwin, who described morphologi- cal changes in domesticated animals. Over the years, the definition was repeatedly expanded and modified. It is now believed that domestication occurs after many generations of taming and captive reproduction under human control. These ani- mals will develop new heritable characteristics that will distinguish them from their Research work financed from NCBiR funds, development project no. NR 12-0140-10. Unauthenticated Download Date | 6/18/16 8:37 PM
Transcript of Genetic variability of farmed and free-living populations of red foxes (Vulpes vulpes)

Ann. Anim. Sci., Vol. 12, No. 4 (2012) 501–512, DOI: 10.2478/v10220-012-0042-2
Genetic variability of farmed and free-livinG populations of red foxes (Vulpes Vulpes)* *
G r a ż y n a J e ż e w s k a - W i t k o w s k a 1 , B e a t a H o r e c k a 1 , A n d r z e j J a k u b c z a k 1 , K o r n e l K a s p e r e k 1 , B r y g i d a Ś l a s k a 1 , M o n i k a B u g n o - P o n i e w i e r s k a 2 , 3 ,
M a ł g o r z a t a P i ó r k o w s k a 2
1Department of Biological Basis of Animal Production, University of Life Sciences in Lublin, Akademicka 13, 20-950 Lublin, Poland
2Laboratory of Genomics, National Research Institute of Animal Production, 32-083 Balice n. Kraków, Poland
3Department of Genetics, University of Rzeszów, Rejtana 16 C, 35-959 Rzeszów, PolandCorresponding authors: [email protected], [email protected]
abstractthis study was designed to determine the degree of genetic distinctiveness between farmed and wild foxes (Vulpes vulpes). analysis of polymorphism in 16 microsatellite sequences led to the conclusion that red foxes raised on polish farms and wild foxes living in poland are two groups of genetically distinct animals. farmed polish foxes are genetically more similar to the popula-tion of wild animals from north america than they are to the free-living population in poland, as confirmed by the fact that the farmed animals are descended from animals raised in canada. the small genetic distance between wild canadian foxes (indicated as the progenitor of farmed polish foxes) and farmed polish foxes possibly suggests that the differences between the farmed and wild polish populations may result from the fact that canadian and polish foxes took separate evolutionary paths.
Key words: Vulpes vulpes, wild and farmed animals, microsatellites, domestication
For many years, the domestication process has been the subject of study by re-searchers in both animal and human sciences. The first scientific definition of do-mestication was proposed in 1868 by Charles Darwin, who described morphologi-cal changes in domesticated animals. Over the years, the definition was repeatedly expanded and modified. It is now believed that domestication occurs after many generations of taming and captive reproduction under human control. These ani-mals will develop new heritable characteristics that will distinguish them from their
� Research work financed from NCBiR funds, development project no. NR 12-0140-10.
UnauthenticatedDownload Date | 6/18/16 8:37 PM

G. Jeżewska-Witkowska et al.502
wild ancestors. The only way these characteristics develop is through selection (La-sota-Moskalewska, 2005). The domestic dog (Canis familiaris) is a first example of a domesticated species. However, it remains unclear when and where the dog be-came a domesticated species encompassing today a number of phenotypically di-verse breeds. Red fox (Vulpes vulpes) is one of the best studied wild animals world-wide (Wandeler and Funk, 2006). However, the domestication of the red fox has a short history. This species has been farmed worldwide since the 1890s. In Poland, first farms of silver foxes were established around 1924 in Upper Silesia and around 1927 near Gdańsk (Sławoń and Woliński, 1975). Experimental domestication proc-ess gave rise to a population whose behaviour showed the characteristics of the do-mestic dog, namely devotion, friendliness and a desire to form bonds with humans (Trut, 1999). There are also many morphological and physiological changes associ-ated with domestication (Trut et al., 2004).
Molecular analyses provide insight into organismal variation at the most basic level, that of DNA. They can be used, among others, to examine phylogenetic rela-tionships between different groups of animals. In case of fur-bearing animals this is supported by the results of molecular studies with both silver foxes (Statham et al., 2011) and other farmed species of Canidae, such as arctic foxes (Norén et al., 2009) and raccoon dogs (Ślaska et al., 2010).
The aim of the study was, based on microsatellite analysis, to determine genetic distances within and between farmed and wild populations of red foxes in Poland and North America.
material and methods
A total of 178 red foxes (Vulpes vulpes), including 100 unrelated animals from a farm in southern Poland and 78 wild animals (31 from two parts of Poland and 47 from Canada) were used for the present study. Peripheral blood was col-lected from the saphenous vein of farmed animals into vacuum tubes containing EDTA. Soft tissues and pieces of skin served as a source of DNA for wild fox-es from Poland and Canada, respectively. DNA from blood was isolated with a QIAamp DNA Blood Mini Kit, and from tissues with a QIAamp DNA Mini Kit (QIAGEN).
Based on the literature, 17 microsatellite markers from the domestic dog ge-nome were chosen for the analysis: Ren01E05, Ren02K21, Ren06C11, Ren13J22, Ren37H09, Ren39L15, Ren41D20, Ren44K10, Ren67C18, Ren02C20, Ren02P03, Ren04M22 (Jouquand et al., 2000); INU005, INU013, INU014, INU019, and INU020 (Ichikawa et al., 2002).
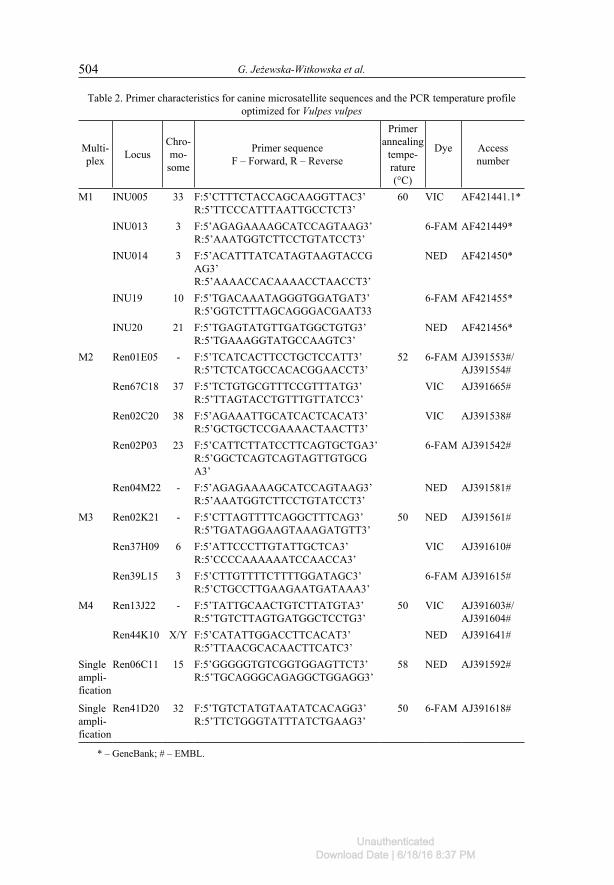
PCR was performed using AmpliTaq Gold 360 DNA Polymerase in an MJ Re-search PTC 225 Tetrad thermal cycler. Optimization of the physical and chemical parameters of PCR made it possible to group the 15 microsatellites into 4 multi-plexes. An individual PCR was performed for two markers. Composition of the reac-tion mixture, primer characteristics and the PCR temperature/time profiles are given in Tables 1 and 2. Each reaction consisted of 10 µl: 9 µl reaction mixture and 1 µl
UnauthenticatedDownload Date | 6/18/16 8:37 PM
Genetic variability in red fox population 503
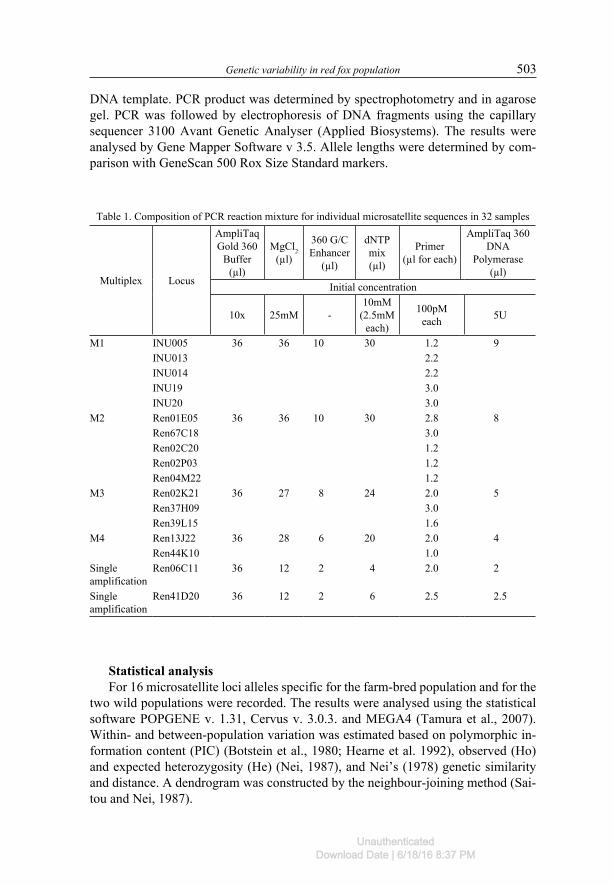
DNA template. PCR product was determined by spectrophotometry and in agarose gel. PCR was followed by electrophoresis of DNA fragments using the capillary sequencer 3100 Avant Genetic Analyser (Applied Biosystems). The results were analysed by Gene Mapper Software v 3.5. Allele lengths were determined by com-parison with GeneScan 500 Rox Size Standard markers.
Table 1. Composition of PCR reaction mixture for individual microsatellite sequences in 32 samples
Multiplex Locus
AmpliTaq Gold 360
Buffer (µl)
MgCl2 (µl)
360 G/C Enhancer
(µl)
dNTP mix (µl)
Primer (µl for each)
AmpliTaq 360 DNA
Polymerase (µl)
Initial concentration
10x 25mM -10mM
(2.5mM each)
100pM each 5U
M1 INU005 36 36 10 30 1.2 9INU013 2.2INU014 2.2INU19 3.0INU20 3.0
M2 Ren01E05 36 36 10 30 2.8 8Ren67C18 3.0Ren02C20 1.2Ren02P03 1.2Ren04M22 1.2
M3 Ren02K21 36 27 8 24 2.0 5Ren37H09 3.0Ren39L15 1.6
M4 Ren13J22 36 28 6 20 2.0 4Ren44K10 1.0
Single amplification
Ren06C11 36 12 2 4 2.0 2
Single amplification
Ren41D20 36 12 2 6 2.5 2.5
statistical analysisFor 16 microsatellite loci alleles specific for the farm-bred population and for the
two wild populations were recorded. The results were analysed using the statistical software POPGENE v. 1.31, Cervus v. 3.0.3. and MEGA4 (Tamura et al., 2007). Within- and between-population variation was estimated based on polymorphic in-formation content (PIC) (Botstein et al., 1980; Hearne et al. 1992), observed (Ho) and expected heterozygosity (He) (Nei, 1987), and Nei’s (1978) genetic similarity and distance. A dendrogram was constructed by the neighbour-joining method (Sai-tou and Nei, 1987).
UnauthenticatedDownload Date | 6/18/16 8:37 PM
G. Jeżewska-Witkowska et al.504
Table 2. Primer characteristics for canine microsatellite sequences and the PCR temperature profile optimized for Vulpes vulpes
Multi-plex Locus
Chro-mo-
some
Primer sequenceF – Forward, R – Reverse
Primer annealing
tempe-rature(°C)
Dye Access number
M1 INU005 33 F:5’CTTTCTACCAGCAAGGTTAC3’R:5’TTCCCATTTAATTGCCTCT3’
60 VIC AF421441.1�
INU013 3 F:5’AGAGAAAAGCATCCAGTAAG3’R:5’AAATGGTCTTCCTGTATCCT3’
6-FAM AF421449�
INU014 3 F:5’ACATTTATCATAGTAAGTACCGAG3’R:5’AAAACCACAAAACCTAACCT3’
NED AF421450�
INU19 10 F:5’TGACAAATAGGGTGGATGAT3’R:5’GGTCTTTAGCAGGGACGAAT33
6-FAM AF421455�
INU20 21 F:5’TGAGTATGTTGATGGCTGTG3’R:5’TGAAAGGTATGCCAAGTC3’
NED AF421456�
M2 Ren01E05 - F:5’TCATCACTTCCTGCTCCATT3’R:5’TCTCATGCCACACGGAACCT3’
52 6-FAM AJ391553#/AJ391554#
Ren67C18 37 F:5’TCTGTGCGTTTCCGTTTATG3’R:5’TTAGTACCTGTTTGTTATCC3’
VIC AJ391665#
Ren02C20 38 F:5’AGAAATTGCATCACTCACAT3’R:5’GCTGCTCCGAAAACTAACTT3’
VIC AJ391538#
Ren02P03 23 F:5’CATTCTTATCCTTCAGTGCTGA3’R:5’GGCTCAGTCAGTAGTTGTGCGA3’
6-FAM AJ391542#
Ren04M22 - F:5’AGAGAAAAGCATCCAGTAAG3’R:5’AAATGGTCTTCCTGTATCCT3’
NED AJ391581#
M3 Ren02K21 - F:5’CTTAGTTTTCAGGCTTTCAG3’R:5’TGATAGGAAGTAAAGATGTT3’
50 NED AJ391561#
Ren37H09 6 F:5’ATTCCCTTGTATTGCTCA3’R:5’CCCCAAAAAATCCAACCA3’
VIC AJ391610#
Ren39L15 3 F:5’CTTGTTTTCTTTTGGATAGC3’R:5’CTGCCTTGAAGAATGATAAA3’
6-FAM AJ391615#
M4 Ren13J22 - F:5’TATTGCAACTGTCTTATGTA3’R:5’TGTCTTAGTGATGGCTCCTG3’
50 VIC AJ391603#/ AJ391604#
Ren44K10 X/Y F:5’CATATTGGACCTTCACAT3’R:5’TTAACGCACAACTTCATC3’
NED AJ391641#
Singleampli-fication
Ren06C11 15 F:5’GGGGGTGTCGGTGGAGTTCT3’R:5’TGCAGGGCAGAGGCTGGAGG3’
58 NED AJ391592#
Single ampli-fication
Ren41D20 32 F:5’TGTCTATGTAATATCACAGG3’R:5’TTCTGGGTATTTATCTGAAG3’
50 6-FAM AJ391618#
� – GeneBank; # – EMBL.
UnauthenticatedDownload Date | 6/18/16 8:37 PM

Genetic variability in red fox population 505
results
Sixteen microsatellite loci could be analysed. Because no amplification product was obtained in foxes for the INU005 sequence, this marker was excluded from further analysis.
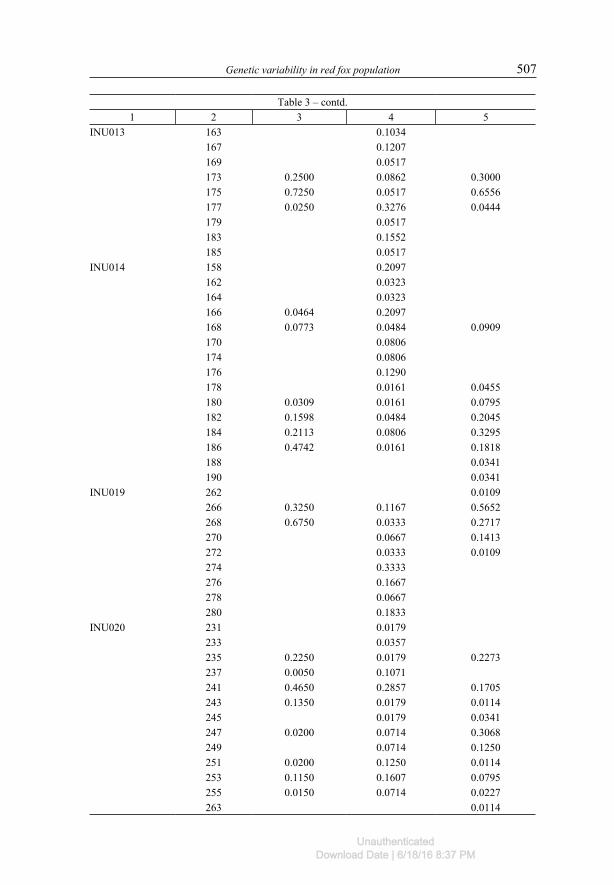
Table 3. Length and frequency of alleles found within the populations studied
Locus Allele length(bp)
Allele frequency
Farmed foxes Wild Polish foxes Wild Canadian foxes
1 2 3 4 5Ren44K10 198 0.0167
200 0.0667 0.0106202 0.1968 0.3000 0.1383204 0.2660 0.3833 0.3936206 0.4309 0.1500 0.1489208 0.0957 0.0167 0.2128210 0.0667 0.0319212 0.0319214 0.0106 0.0319
Ren67C18 158 1.0000 1.0000 1.0000
Ren02C20 292 0.0051 0.1500 0.0532294 0.2296 0.2500 0.1277296 0.0765 0.2667 0.0213298 0.0333300 0.0333 0.1064302 0.4031 0.1333 0.1277304 0.0153 0.1489306 0.0051 0.1000 0.0213308 0.0204 0.0167310 0.1786 0.2553312 0.0663 0.0532314 0.0167 0.0851
Ren01E05 394 0.0106396 0.0319398 0.0206 0.1277400 0.2165 0.1489402 0.1000 0.0957404 0.6649 0.2667 0.2340406 0.0052 0.1833 0.0532408 0.3833 0.1809410 0.0500 0.0851412 0.0103 0.0167 0.0319414 0.0670
UnauthenticatedDownload Date | 6/18/16 8:37 PM

G. Jeżewska-Witkowska et al.506
Table 3 – contd.1 2 3 4 5
Ren02K21 280 0.0484288 0.0645 0.0326290 0.0051 0.4348292 0.4040 0.1452 0.2174294 0.4343 0.1613 0.1304296 0.0909 0.3548 0.0652298 0.0202 0.1129 0.1087300 0.0253 0.0484 0.0109302 0.0202 0.0645
Ren06C11 86 1.0000 1.0000 1.0000Ren13J22 404 0.0109
406 0.0217408 0.0109 0.1379 0.0109410 0.7609 0.4483 0.5978412 0.2283 0.3621 0.2174416 0.0217418 0.0517 0.0978422 0.0217
Ren37H09 196 1.0000 1.0000 1.0000Ren39L15 214 0.0101
220 0.0323226 0.0960228 0.6869 0.0161 0.4468230 0.0253 0.0645 0.0957232 0.1515 0.1290 0.1915234 0.2258 0.0106236 0.4516 0.0319238 0.0484 0.0319240 0.0303 0.0161 0.1064242 0.0161 0.0638244 0.0106246 0.0106
Ren41D20 192 1.0000 1.0000 1.0000Ren02P03 163 0.1212 0.2979
165 0.0152 0.1667167 0.8232 0.7500 0.7021171 0.0404 0.0167173 0.0667
Ren04M22 179 0.2167 0.0106181 0.3990 0.0833 0.1277183 0.3586 0.0500 0.4362185 0.0101 0.0500 0.0638187 0.1000 0.2234189 0.0051 0.4167 0.1064191 0.0455 0.0833 0.0213193 0.1818 0.0106
UnauthenticatedDownload Date | 6/18/16 8:37 PM
Genetic variability in red fox population 507
Table 3 – contd.1 2 3 4 5
INU013 163 0.1034167 0.1207169 0.0517173 0.2500 0.0862 0.3000175 0.7250 0.0517 0.6556177 0.0250 0.3276 0.0444179 0.0517183 0.1552185 0.0517
INU014 158 0.2097162 0.0323164 0.0323166 0.0464 0.2097168 0.0773 0.0484 0.0909170 0.0806174 0.0806176 0.1290178 0.0161 0.0455180 0.0309 0.0161 0.0795182 0.1598 0.0484 0.2045184 0.2113 0.0806 0.3295186 0.4742 0.0161 0.1818188 0.0341190 0.0341
INU019 262 0.0109266 0.3250 0.1167 0.5652268 0.6750 0.0333 0.2717270 0.0667 0.1413272 0.0333 0.0109274 0.3333276 0.1667278 0.0667280 0.1833
INU020 231 0.0179233 0.0357235 0.2250 0.0179 0.2273237 0.0050 0.1071241 0.4650 0.2857 0.1705243 0.1350 0.0179 0.0114245 0.0179 0.0341247 0.0200 0.0714 0.3068249 0.0714 0.1250251 0.0200 0.1250 0.0114253 0.1150 0.1607 0.0795255 0.0150 0.0714 0.0227263 0.0114
UnauthenticatedDownload Date | 6/18/16 8:37 PM

G. Jeżewska-Witkowska et al.508
The highest number of alleles (15) within all populations was seen for the INU014 locus. More than 10 alleles were found for Ren39L15 (13), INU020 (13), Ren02C20 (12) and Ren01E05 loci (11). The population of farmed foxes was characterized by the lowest number of unique alleles (Table 3). Most specific alleles were noted for the group of wild foxes from Poland. At the INU013 locus, 6 out of 9 alleles were specific to this group (163, 167, 169, 179, 183 and 185 bp). Likewise at the INU014 locus, 6 out of 15 alleles were only found in the wild Polish population. They were 158, 162, 164, 170, 174 and 176 bp in size. At the INU019 locus, 4 of all detected alleles were specific to this group of animals (274, 276, 278 and 280 bp). For the wild Canadian population at the Ren13J22 locus, 4 of 8 alleles were char-acteristic. These alleles were 404, 406, 416 and 422 bp in size. At the Ren44K10, Ren02C20, Ren01E05, Ren02K21, Ren02P03 and Ren04M22 loci, alleles common to the farmed Polish population and free-living Canadian population did not occur in the wild Polish population (Table 3).
The values of PIC, He and Ho are listed in Table 4. The highest PIC values were found in both wild populations. In the Polish population, only at the Ren02P03 locus PIC was lower than 0.5 (0.368). At the Ren13J22 locus, polymorphic information content was 0.579 and in the other loci it reached values around 0.7 or higher. The highest PIC value in this group of animals was found for the INU014 locus (0.855). In the Canadian population, the Ren02C20 locus had the highest PIC of 0.839. PIC values below 0.5 were noted for two loci: Ren02P03 (0.331) and INU013 (0.399). PIC was 0.541 for the Ren13J22 locus and 0.523 for the INU019 locus. For the other eight loci, PIC was close to or higher than 0.7. The lowest polymorphism at the analysed loci was observed in the group of farmed foxes. PIC exceeded 0.5 in only six loci, with the highest value of 0.706 at the Ren02C20 locus. Like in the other populations, the lowest polymorphic information content was noted at the Ren02P03 locus (0.283).
The analysed loci differed considerably for their observed heterozygosity. How-ever, it can be observed that in all the populations studied, high observed hetero-zygosities were detected for INU020. They were 0.810 in farmed foxes, 0.821 in wild foxes from Poland, and 0.795 in the wild population from Canada. In addi-tion, high Ho values were found at the INU014 locus for farmed foxes (0.866) and Canadian wild foxes (0.955). Meanwhile, in the Polish free-living population, high observed heterozygosity was characteristic of the INU013 (0.828) and Ren02K21 loci (0.871). The lowest observed heterozygosity was noted at the Ren02P03 locus in the population of wild Canadian foxes (0.213). An equally low Ho value at the same locus (0.232) was seen in farmed foxes. Low observed heterozygosity in all analysed groups was characteristic of Ren13J22. It was 0.283 in farmed foxes, 0.276 in the wild Polish population, and 0.304 in the wild Canadian population. In the last-mentioned population, low observed heterozygosity was also characteristic of INU013 (0.289).
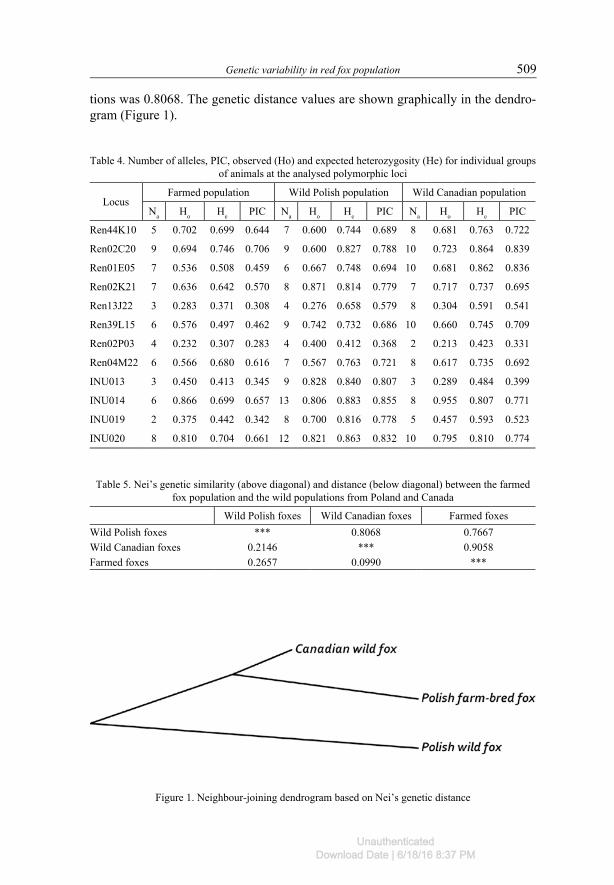
Table 5 presents genetic similarities and distances among the populations stud-ied. The farmed Polish population is genetically more similar to the population of wild animals from Canada (similarity of 0.9058) than it is to the wild population from Poland (similarity of 0.7667). Genetic similarity between the two wild popula-
UnauthenticatedDownload Date | 6/18/16 8:37 PM
Genetic variability in red fox population 509
tions was 0.8068. The genetic distance values are shown graphically in the dendro-gram (Figure 1).
Table 4. Number of alleles, PIC, observed (Ho) and expected heterozygosity (He) for individual groups of animals at the analysed polymorphic loci
LocusFarmed population Wild Polish population Wild Canadian population
Na Ho He PIC Na Ho He PIC Na Ho He PIC
Ren44K10 5 0.702 0.699 0.644 7 0.600 0.744 0.689 8 0.681 0.763 0.722
Ren02C20 9 0.694 0.746 0.706 9 0.600 0.827 0.788 10 0.723 0.864 0.839
Ren01E05 7 0.536 0.508 0.459 6 0.667 0.748 0.694 10 0.681 0.862 0.836
Ren02K21 7 0.636 0.642 0.570 8 0.871 0.814 0.779 7 0.717 0.737 0.695
Ren13J22 3 0.283 0.371 0.308 4 0.276 0.658 0.579 8 0.304 0.591 0.541
Ren39L15 6 0.576 0.497 0.462 9 0.742 0.732 0.686 10 0.660 0.745 0.709
Ren02P03 4 0.232 0.307 0.283 4 0.400 0.412 0.368 2 0.213 0.423 0.331
Ren04M22 6 0.566 0.680 0.616 7 0.567 0.763 0.721 8 0.617 0.735 0.692
INU013 3 0.450 0.413 0.345 9 0.828 0.840 0.807 3 0.289 0.484 0.399
INU014 6 0.866 0.699 0.657 13 0.806 0.883 0.855 8 0.955 0.807 0.771
INU019 2 0.375 0.442 0.342 8 0.700 0.816 0.778 5 0.457 0.593 0.523
INU020 8 0.810 0.704 0.661 12 0.821 0.863 0.832 10 0.795 0.810 0.774
Table 5. Nei’s genetic similarity (above diagonal) and distance (below diagonal) between the farmed fox population and the wild populations from Poland and Canada
Wild Polish foxes Wild Canadian foxes Farmed foxesWild Polish foxes *** 0.8068 0.7667Wild Canadian foxes 0.2146 *** 0.9058Farmed foxes 0.2657 0.0990 ***
Figure 1. Neighbour-joining dendrogram based on Nei’s genetic distance
UnauthenticatedDownload Date | 6/18/16 8:37 PM
G. Jeżewska-Witkowska et al.510
discussion
High genetic variation was found for the populations of free-living foxes, for which very high PIC values were observed for most of the analysed loci. These populations were also characterized by a considerable observed heterozygosity. In addition, wild Polish foxes were found to carry several alleles not found in the other populations studied. In the group of farmed animals, the pool of alleles at individual loci was distinctly smaller and the PIC values of the analysed loci were also much smaller for these animals. The limited number of alleles is probably the result of animal selection. Each year basic herd replacement is done but breeding programmes are practised at all farms. On the other hand, detection of specific alleles at micros-atellite loci in the group of farmed fur bearing animals can be useful if it is associ-ated with the occurrence of a specific value of production trait (Ślaska et al., 2008). Together with the information about genetic determination of these traits (Ślaska et al., 2007; Przysiecki et al., 2000), microsatellite markers might be a helpful tool in animal selection.
It is useful to determine differences between farmed and wild populations of fur animals in the context of escapes of farmed animals, their environmental adaptation, and the possibility of crossbreeding with wild members of their species. Using analy-sis of microsatellite sequences and mitochondrial DNA, Norén et al. (2005) investi-gated arctic foxes to assess differentiation within Scandinavian farm-bred and free-living populations, and to develop a method for distinguishing between these groups and identifying their hybrid progenies. At the microsatellite loci, the authors detected alleles specific for the farmed population and the wild animals. In both groups, the observed heterozygosity showed different values that were close to expected hetero-zygosity values. The genetic diversity indicated that the populations were highly dif-ferent, although it did not allow for an unambiguous distinction between farmed and wild arctic foxes. However, mitochondrial haplotypes of the control region revealed clear differences between farmed and free-living animals.
Genetic differentiation within farmed and wild populations of another canid, the raccoon dog, was studied by Ślaska et al. (2010). They analysed animals raised on three farms from different provinces of Poland and a Polish population of wild ani-mals. Nei’s genetic distances between these groups were calculated based on random amplified polymorphic DNA (RAPD) profiles obtained using three primer sequenc-es. The distances between the wild population and the 3 farmed populations were 0.211, 0.208 and 0.179, respectively. The genetic distance between animals from different farms was invariably lower at 0.067, 0.112 and 0.126. In our study with red foxes, the distance between the wild Polish population and the wild Canadian population was 0.2146. The largest distance was noted between farmed Polish ani-mals and the group of free-living animals from Poland. Such a considerable genetic difference can be useful in detecting immigrating red foxes from these populations. The smallest genetic distance occurred between the farmed Polish population and the wild Canadian population, thus allowing the conclusion that the animals raised on Polish farms are descendants from red foxes brought from North America. This is in agreement with historical data (Piórkowska, 2010). Because of the small genetic
UnauthenticatedDownload Date | 6/18/16 8:37 PM
Genetic variability in red fox population 511
distance between wild Canadian foxes (indicated as the progenitor of farmed Polish foxes) and farmed Polish foxes, it can be concluded that the differences between the farmed and wild Polish populations reflect their different origin.
To determine the origin of the Russian populations of silver foxes, Statham et al. (2011) sequenced two regions of mitochondrial DNA of farmed foxes from Novosi-birsk and of animals representing the native populations from Europe, Asia, Alaska, Eastern and Western Canada, and Western Mountains of the USA. The identification of haplotypes and their comparison between individual groups revealed the greatest similarity between the Russian farmed population and Eastern Canadian wild popu-lation, confirming the historically documented origin of the Russian farmed popula-tion through imports from Prince Edward Island, Canada.
The data relating to wild foxes might be useful to compare it with historical sam-ples of wild foxes not only from Poland but also from other countries. It can be used in a wide range of ecological studies. Genetic characteristics of modern and ancient red foxes enabled Teacher et al. (2011) to investigate phylogeographical patterning of these species in relation to historical climate changes.
Not surprisingly, the data indicate that the wild populations are more diverse than farmed populations. The currently farmed foxes are genetically different from the wild members of their species. In addition, the genetic distance between the farmed and free-living Polish populations indicates a considerable phylogenetic distance be-tween these groups. To gain a more accurate assessment of the genetic differences, the study will be continued using analysis of mitochondrial gene polymorphism.
references
B o t s t e i n D., W h i t e R.L., S k o l n i c k i M., D a v i s R.W. (1980). Construction of a genetic linkage map in man using restriction fragment length polymorphism. Am. J. Hum. Genet., 32: 314–331.
H e a r n e C.M., G h o s h S., T o d d J.A. (1992). Microsatellites for linkage analysis of genetic traits. Trends Ecol. Evol., 8: 288–294.
I c h i k a w a Y., T a k a h a s h i Y., T s u m a g a r i S., T a k e i s h i M., I s h i h a m a K., M o r i t a M., K a n e m a k i M., M i n e z a w a M., T a k a h a s h i H. (2002). Identification and characterization of 40 dinucleotide microsatellites in the dog genome. Anim. Genet., 33: 377–405.
J o u q u a n d S., P r i a t C., H i t t e C., L a c h a u m e P., A n d r é C., G a l i b e r t F. (2000). Identifi-cation and characterization of a set of 100 tri- and dinucleotide microsatellites in the canine genome. Anim. Genet., 31: 266–272.
L a s o t a - M o s k a l e w s k a A. (2005). Domesticated animals in human history (in Polish). Wydaw- nictwo Uniwersytetu Warszawskiego.
N e i M. (1978). Estimation of average heterozygosity and genetic distance from a small number of individuals. Genetics, 89, 583–590.
N e i M. (1987). Molecular Evolutionary Genetics. Columbia University Press: New York.N o r é n K., D a l é n L., K v a l ø y K., A n g e r b j ö r n A. (2005). Detection of farm fox and hybrid
genotypes among wild arctic foxes in Scandinavia. Conserv. Genet., 6: 885–894.N o r é n K., K v a l ø y K., N y s t r ö m V., L a n d a A., D a l é n L., E i d e N.E., Ø s t b y e E., H e n t -
t o n e n H., A n g e r b j ö r n A. (2009). Farmed arctic foxes on the Fennoscandian mountain tundra: implications for conservation. Anim. Conserv., 12: 434–444.
P i ó r k o w s k a M. (2010). Foxes – prospects on breeding (in Polish). Wiad. Zoot., 4: 85–97.
UnauthenticatedDownload Date | 6/18/16 8:37 PM
G. Jeżewska-Witkowska et al.512
P r z y s i e c k i P., W i e r z b i c k i H., F i l i s t o w i c z A. (2000). Genetic determination of reproduc-tion traits in silver fox (Vulpes vulpes). Anim. Sci. Pap. Rep., 18, 3: 209–216.
S a i t o u N., N e i M. (1987). The neighbor-joining method: A new method for reconstructing phyloge-netic trees. Mol. Biol. Evol., 4: 406–425.
S ł a w o ń J., W o l i ń s k i Z. (1975). Fox breeding (in Polish). Wydawnictwo Rolnicze i Leśne, War- szawa.
S t a t h a m M.J., T r u t L.N., S a c k s B.N., K h a r l a m o v a A.V., O s k i n a I.N., G u l e v i c h R.G., J o h n s o n J.L., T e m n y k h S.V., A c l a n d G.M., K u k e k o v a A.V. (2011). On the origin of a domesticated species: identifying the parent population of Russian silver foxes (Vulpes vulpes). Biol. J. Linn. Soc., 103, 1: 168–175.
Ś l a s k a B., Z i ę b a G., R o z e m p o l s k a - R u c i ń s k a I., J e ż e w s k a - W i t k o w s k a G., J a k u b c z a k A. (2010). Evaluation of genetic biodiversity in farm-bred and wild raccoon dogs in Poland. Folia biologica (Kraków), 58, 3–4: 195–199.
Ś l a s k a B., J e ż e w s k a - W i t k o w s k a G., Z i ę b a G., P i e r z c h a ł a M. (2008). Genetic vari-ability and linkage of selected microsatellite markers in the Chinese raccoon dog (Nyctereutes pro-cyonoides procyonoides). Arch. Tierzucht, 51, 2: 187–198.
Ś l a s k a B., J e ż e w s k a G., Z i ę b a G., Ł u k a s z e w i c z M. (2007). Genetic determination of selected reproduction traits in raccoon dog (Nyctereutes procyonoides). Anim. Sci. Pap. Rep., 25, 3: 153–159.
T a m u r a K., D u d l e y J., N e i M., K u m a r S. (2007). MEGA4: Molecular Evolutionary Genetics Analysis (MEGA) software version 4.0. Mol. Biol. Evol., 24: 1596–1599.
T e a c h e r A.G.F., T h o m a s J.A., B a r n e s I. (2011). Modern and ancient red fox (Vulpes vulpes) in Europe show an unusual lack of geographical and temporal structuring, and differing responses within the carnivores to historical climatic change. BMC Evol. Biol., 11, p. 214.
T r u t L.N. (1999). Early canid domestication: The farm-fox experiment. Am. Sci., 87, 2: 169–169.T r u t L.N., P l y u s n i n a I.Z., O s k i n a I.N. (2004). An experiment on fox domestication and debat-
able issues of evolution of the dog. Rus. J. Genet., 40, 6: 644–655. W a n d e l e r P., F u n k S.M. (2006). Short microsatellite DNA markers for the red fox (Vulpes vulpes).
Mol. Ecol. Notes, 6: 98–100.
Accepted for printing 13 VI 2012
GRAżYNA JEżEWSKA-WITKOWSKA, BEATA HORECKA, ANDRZEJ JAKUBCZAK, KORNEL KASPEREK, BRYGIDA ŚLASKA, MONIKA BUGNO-PONIEWIERSKA,
MAŁGORZATA PIóRKOWSKA
Zróżnicowanie genetyczne populacji hodowlanej i wolno żyjącej lisów pospolitych (Vulpes vulpes)
STRESZCZENIE
Polimorfizm szesnastu sekwencji mikrosatelitarnych (Ren01E05, Ren02K21, Ren06C11, Ren13J22, Ren37H09, Ren39L15, Ren41D20, Ren44K10, Ren67C18, Ren02C20, Ren02P03, Ren04M22, INU013, INU014, INU019, INU020) badano w celu oceny zróżnicowania genetycznego polskiej populacji hodowlanej oraz dwóch populacji wolno żyjących (z Polski i Kanady) należących do gatunku Vulpes vulpes. Wyższymi wartościami indeksu stopnia polimorfizmu oraz heterozygotyczności obserwowanej i oczekiwanej charakteryzowały się obie grupy osobników dziko żyjących. Na podstawie frekwencji alleli ustalono dystans genetyczny dzielący badane populacje zwierząt. Stwierdzono, iż polskie lisy hodowlane wykazują większe podobieństwo genetyczne do populacji osobników dzikich z Ameryki Północnej niż do rodzimej populacji wolno żyjącej. Zatem lisy pospolite hodowane na polskich fermach i lisy dziko żyjące zamieszkujące tereny Polski stanowią dwie grupy zwierząt wysoce odrębne pod względem genetycznym.
UnauthenticatedDownload Date | 6/18/16 8:37 PM