Immunophenotype-defined sub-populations are ... - Nature
6
comparison had a lower P-value and had a higher degree of deregulation than the differentially expressed genes from the comparison TET2 mutated versus wild type (Figure 1 b; Supplementary Figure 1 and Supplementary Tables 2 and 3). These results indicate that 5hmC levels are most likely a more relevant measurement to define biologically distinct secondary leukemia subtypes than the TET2 (or IDH1/2) mutational status. The fact that in some patient samples with low 5hmC levels neither TET2 nor IDH1/2 mutations could be identified suggests that additional genes might be directly or indirectly involved in the regulation of 5hmC levels. To further elucidate the regulation of 5hmC levels and their role in leukemogenesis, larger groups of sAML as well as de novo AML patients need to be studied. Conflict of interest The authors declare no conflict of interest. Acknowledgements SKB, KS and HL are supported by grants from the Deutsche Forschungsgemeinschaft (SFB 684 and SPP 1463). SKB is supported by a grant from the German Ministry of Education and Research (BMBF) National genome research network (NGFNplus; PKL-01GS0876-6) and by institutional funding from the Helmholtz Zentrum Munich, German Research Center for Environmental Health. We thank Natalia Huk for technical assistance and Alexander Kohlmann, Torsten Haferlach and Claudia Haferlach for primary gene expression data and cytogenetic data. Author Contributions NK and FS designed and performed the mutation screening with the help of AD and BK, and wrote the manuscript. SB, AS and HL designed and performed the 5hmC measurements and wrote the manuscript. HL supervised the project. PMK and SS performed cytogenetics and fluorescence in situ hybridization analysis. TH and MM analyzed the GEPs. KS designed experiments and wrote the manuscript. SKB designed experi- ments, analyzed the data, supervised the project and wrote the manuscript. N Konstandin 1,2,4 , S Bultmann 3,4 , A Szwagierczak 3 , A Dufour 1 , B Ksienzyk 1,2 , F Schneider 1,2 , T Herold 1 , M Mulaw 2 , PM Kakadia 1,2 , S Schneider 1 , K Spiekermann 1,2 , H Leonhardt 3,4 and SK Bohlander 1,2,4 1 Laboratory of Leukemia Diagnostics, Department of Medicine III, University of Munich Hospital, Munich, Germany; 2 Helmholtz Zentrum Munich, National Research Center for Environmental Health, Clinical Cooperative Group ‘Leukemia’, Munich, Germany and 3 Department of Biology II, Center for Integrated Protein Science, Ludwig Maximilians University Munich, Planegg-Martinsried, Germany E-mail: [email protected] or [email protected] 4 These authors contributed equally to this work. References 1 Tahiliani M, Koh KP, Shen Y, Pastor WA, Bandukwala H, Brudno Y et al. Conversion of 5-methylcytosine to 5-hydroxymethylcytosine in mammalian DNA by MLL partner TET1. Science 2009; 324: 930–935. 2 Ono R, Taki T, Taketani T, Taniwaki M, Kobayashi H, Hayashi Y. LCX, leukemia-associated protein with a CXXC domain, is fused to MLL in acute myeloid leukemia with trilineage dysplasia having t(10;11)(q22;q23). Cancer Res 2002; 62: 4075–4080. 3 Lorsbach RB, Moore J, Mathew S, Raimondi SC, Mukatira ST, Downing JR. TET1, a member of a novel protein family, is fused to MLL in acute myeloid leukemia containing the t(10;11)(q22;q23). Leukemia 2003; 17: 637–641. 4 Mohamedali AM, Smith AE, Gaken J, Lea NC, Mian SA, Westwood NB et al. Novel TET2 mutations associated with UPD4q24 in myelodysplastic syndrome. J Clin Oncol 2009; 27: 4002–4006. 5 Langemeijer SM, Kuiper RP, Berends M, Knops R, Aslanyan MG, Massop M et al. Acquired mutations in TET2 are common in myelodysplastic syndromes. Nat Genet 2009; 41: 838–842. 6 Delhommeau F, Dupont S, Della Valle V, James C, Trannoy S, Masse ´A et al. Mutation in TET2 in myeloid cancers. N Engl J Med 2009; 360: 2289–2301. 7 Ko M, Huang Y, Jankowska AM, Pape UJ, Tahiliani M, Bandukwala HS et al. Impaired hydroxylation of 5-methylcytosine in myeloid cancers with mutant TET2. Nature 2010; 468: 839–843. 8 Szwagierczak A, Bultmann S, Schmidt CS, Spada F, Leonhardt H. Sensitive enzymatic quantification of 5-hydroxymethylcytosine in genomic DNA. Nucleic Acids Res 2010; 38: e181. 9 Xu W, Yang H, Liu Y, Yang Y, Wang P, Kim SH et al. Oncometabolite 2-hydroxyglutarate is a competitive inhibitor of a-ketoglutarate-dependent dioxygenases. Cancer Cell 2011; 19: 17–30. 10 Figueroa ME, Abdel-Wahab O, Lu C, Ward PS, Patel J, Shih A et al. Leukemic IDH1 and IDH2 mutations result in a hypermethylation phenotype, disrupt TET2 function, and impair hematopoietic differentiation. Cancer Cell 2010; 18: 553–567. Supplementary Information accompanies the paper on the Leukemia website (http://www.nature.com/leu) Immunophenotype-defined sub-populations are common at diagnosis in childhood B-cell precursor acute lymphoblastic leukemia Leukemia (2011) 25, 1652–1657; doi:10.1038/leu.2011.136; published online 17 June 2011 Neoplasms often display significant heterogeneity in morpho- logy, gene expression (including cell surface markers), genetic aberrations, cell proliferation kinetics and response to therapy. 1 Heterogeneity in antigen marker expression is well known in acute myeloid leukemia (AML); 2 however, has rarely been studied in acute lymphoblastic leukemia (ALL). In ALL, shifts in immunophenotypic and genetic profiles can occur between Letters to the Editor 1652 Leukemia
-
Upload
khangminh22 -
Category
Documents
-
view
0 -
download
0
Transcript of Immunophenotype-defined sub-populations are ... - Nature

comparison had a lower P-value and had a higher degreeof deregulation than the differentially expressed genes fromthe comparison TET2 mutated versus wild type (Figure 1 b;Supplementary Figure 1 and Supplementary Tables 2 and 3).These results indicate that 5hmC levels are most likely a morerelevant measurement to define biologically distinct secondaryleukemia subtypes than the TET2 (or IDH1/2) mutational status.The fact that in some patient samples with low 5hmC levelsneither TET2 nor IDH1/2 mutations could be identified suggeststhat additional genes might be directly or indirectly involved inthe regulation of 5hmC levels. To further elucidate theregulation of 5hmC levels and their role in leukemogenesis,larger groups of sAML as well as de novo AML patients needto be studied.
Conflict of interest
The authors declare no conflict of interest.
Acknowledgements
SKB, KS and HL are supported by grants from the DeutscheForschungsgemeinschaft (SFB 684 and SPP 1463). SKB issupported by a grant from the German Ministry of Educationand Research (BMBF) National genome research network(NGFNplus; PKL-01GS0876-6) and by institutional funding fromthe Helmholtz Zentrum Munich, German Research Center forEnvironmental Health. We thank Natalia Huk for technicalassistance and Alexander Kohlmann, Torsten Haferlach andClaudia Haferlach for primary gene expression data andcytogenetic data.
Author Contributions
NK and FS designed and performed the mutation screening withthe help of AD and BK, and wrote the manuscript. SB, AS andHL designed and performed the 5hmC measurements and wrotethe manuscript. HL supervised the project. PMK and SSperformed cytogenetics and fluorescence in situ hybridizationanalysis. TH and MM analyzed the GEPs. KS designedexperiments and wrote the manuscript. SKB designed experi-ments, analyzed the data, supervised the project and wrote themanuscript.
N Konstandin1,2,4, S Bultmann3,4, A Szwagierczak3,A Dufour1, B Ksienzyk1,2, F Schneider1,2, T Herold1,
M Mulaw2, PM Kakadia1,2, S Schneider1, K Spiekermann1,2,H Leonhardt3,4 and SK Bohlander1,2,4
1Laboratory of Leukemia Diagnostics, Department ofMedicine III, University of Munich Hospital,
Munich, Germany;2Helmholtz Zentrum Munich, National Research Center for
Environmental Health, Clinical Cooperative Group‘Leukemia’, Munich, Germany and
3Department of Biology II, Center for Integrated ProteinScience, Ludwig Maximilians University Munich,
Planegg-Martinsried, GermanyE-mail: [email protected] or
[email protected] authors contributed equally to this work.
References
1 Tahiliani M, Koh KP, Shen Y, Pastor WA, Bandukwala H, Brudno Yet al. Conversion of 5-methylcytosine to 5-hydroxymethylcytosinein mammalian DNA by MLL partner TET1. Science 2009; 324:930–935.
2 Ono R, Taki T, Taketani T, Taniwaki M, Kobayashi H, Hayashi Y.LCX, leukemia-associated protein with a CXXC domain, is fused toMLL in acute myeloid leukemia with trilineage dysplasia havingt(10;11)(q22;q23). Cancer Res 2002; 62: 4075–4080.
3 Lorsbach RB, Moore J, Mathew S, Raimondi SC, Mukatira ST,Downing JR. TET1, a member of a novel protein family, is fused toMLL in acute myeloid leukemia containing the t(10;11)(q22;q23).Leukemia 2003; 17: 637–641.
4 Mohamedali AM, Smith AE, Gaken J, Lea NC, Mian SA,Westwood NB et al. Novel TET2 mutations associated withUPD4q24 in myelodysplastic syndrome. J Clin Oncol 2009; 27:4002–4006.
5 Langemeijer SM, Kuiper RP, Berends M, Knops R, Aslanyan MG,Massop M et al. Acquired mutations in TET2 are common inmyelodysplastic syndromes. Nat Genet 2009; 41: 838–842.
6 Delhommeau F, Dupont S, Della Valle V, James C, Trannoy S,Masse A et al. Mutation in TET2 in myeloid cancers. N Engl J Med2009; 360: 2289–2301.
7 Ko M, Huang Y, Jankowska AM, Pape UJ, Tahiliani M,Bandukwala HS et al. Impaired hydroxylation of 5-methylcytosinein myeloid cancers with mutant TET2. Nature 2010; 468:839–843.
8 Szwagierczak A, Bultmann S, Schmidt CS, Spada F, Leonhardt H.Sensitive enzymatic quantification of 5-hydroxymethylcytosine ingenomic DNA. Nucleic Acids Res 2010; 38: e181.
9 Xu W, Yang H, Liu Y, Yang Y, Wang P, Kim SH et al.Oncometabolite 2-hydroxyglutarate is a competitive inhibitor ofa-ketoglutarate-dependent dioxygenases. Cancer Cell 2011; 19:17–30.
10 Figueroa ME, Abdel-Wahab O, Lu C, Ward PS, Patel J, Shih Aet al. Leukemic IDH1 and IDH2 mutations result in ahypermethylation phenotype, disrupt TET2 function, andimpair hematopoietic differentiation. Cancer Cell 2010; 18:553–567.
Supplementary Information accompanies the paper on the Leukemia website (http://www.nature.com/leu)
Immunophenotype-defined sub-populations are common at diagnosis in childhoodB-cell precursor acute lymphoblastic leukemia
Leukemia (2011) 25, 1652–1657; doi:10.1038/leu.2011.136;published online 17 June 2011
Neoplasms often display significant heterogeneity in morpho-logy, gene expression (including cell surface markers), genetic
aberrations, cell proliferation kinetics and response to therapy.1
Heterogeneity in antigen marker expression is well known inacute myeloid leukemia (AML);2 however, has rarely beenstudied in acute lymphoblastic leukemia (ALL). In ALL, shifts inimmunophenotypic and genetic profiles can occur between
Letters to the Editor
1652
Leukemia

diagnosis and relapse.3 Such changes of immune gene-rearrangement profiles can reflect the presence at diagnosis ofminor, but genomically distinct sub-populations.4 Likewise,changes in immunophenotype might reflect phenotypicallydistinct sub-populations at diagnosis that potentially couldbe detected in a more sensitive flow-cytometric analysis thanused routinely. If such sub-populations are present and differentimmunophenotypes are related to differences in gene rearrange-ment profiles, this could cause discordances between themethods for minimal residual disease (MRD) monitoring,that is, flow-cytometric immunophenotyping and PCR-baseddetection of clonotypic immunoglobulin (Ig)/T-cell receptor(TCR) gene rearrangements. Importantly, sub-populationsare also relevant for the understanding of the ontogenesisof the malignant cells and might give clues for under-standing the biological mechanisms of therapy resistance andrelapse.In this study, we explored the presence at diagnosis of
immunophenotypically heterogeneous leukemic cell popula-tions, that is, distinct sub-populations with bimodal markerexpression or populations with broad marker expression,in childhood B-cell precursor (BCP) ALL. Immunopheno-typically heterogeneous cells were isolated by flow sortingand investigated for the clone-defining cytogenetic markerand a broad spectrum of clonal Ig/TCR gene rearrange-ments.We studied 40 bone marrow (BM) samples and one peripheral
blood sample obtained at diagnosis from 41 consecutivepatients, with childhood (below 18 years of age) BCP-ALLdiagnosed from March 2008 to July 2009. Three patientsdiagnosed during this time period could not be included dueto lack of diagnostic samples (two patients) or lack of flow data(one patient). One additional patient diagnosed in October2009, who had immunophenotypically distinct sub-populations,was included only in the cytogenetic/molecular analysis. Thediagnosis was established according to the conventional criteria.In all, 39 of the patients were enrolled in the NordicOrganization for Pediatric Hematology and Oncology(NOPHO) ALL-2000 or NOPHO ALL-2008 treatment protocols.Two infant patients were enrolled in the Interfant-06 protocol. InALL-2000, BM samples were obtained from patients admitted toThe University Hospital Rigshospitalet, Copenhagen (account-ing for approximately half of Danish patients), whereas inALL-2008, samples were obtained from all Danish patients.Samples were collected in heparin-RPMI1640 and processedwithin 24 h of collection. All patients/parents gave informedconsent to participate in this study according to the guide-lines of the Danish Ethics Committee (HC-2008-081 and 2001-10205).Samples for FC analysis were subjected to Lymphoprep
separation of mononuclear cells. Staining for flow-cytometricimmunophenotyping was performed with standard proceduresaccording to the NOPHO guidelines. Data acquisition wasperformed on FACSAria cytometer equipped with the FACSDiva 6 software (Becton Dickinson, San Jose, CA, USA). Aminimum of 100 000 events was acquired. Dead cells anddebris were excluded in forward scatter (FSC)/side scatter (SSC)dot plots based on propidium-iodide staining. Aggregated cellswere excluded based on FSC height versus FSC area dot plots.BCP blast populations were identified using CD45/CD19 dotplots. By using backgating into FSC/SSC plots, we verified thatminor sub-populations were always located in the region whereviable blasts are normally found.Immunophenotypic marker expression on blast populations
was given a score as negative (�), positive dim (þ ), positive
normal (þ þ ) or positive bright (þ þ þ ), as compared with theexpression on normal precursor B cells. Normal BM sampleswere analyzed in parallel using the same flow-cytometrysettings. Antigens not expressed by normal precursors wereonly scored as negative or positive. Only antigen markersnormally expressed by precursors were scored referring tothe normal expression. Special attention was given to dimpopulations, which were defined as positive dim when morethan 20% of the population was brighter than the correspondingisotype control. Distinct sub-populations were defined asseparate populations, each having their own peak in contourplots (In FACSDiva 6; resolution: 128, percentage: 10) andhistograms (described as bimodal expression). The size limit towhat was named sub-populations was set to 42% of total blastcount, as populations smaller than this were difficult to classifyby our FC setup (4- or 6-color and 100000 cells analyzed). Wedefined broad expression of a marker to occur whena population that only has one peakFusing the outer line ofthe 10% contour plot as boundaryFextends from one score intothe middle of the neighboring score.
Patients from the ALL-2000 protocol were analyzed using thefollowing protocol-defined four-color combinations: CD45/CD34/CD19/CD10; CD10/CD20/CD19/CD45; CD34/CD22/CD19/CD45; CD34/CD38/CD19/CD45; TdT/CD10/CD19/CD45.Additional antibody combinations were used: CD10/CD13þ33/CD19/CD34; kappa/lambda/CD19/CD45; CD7/CD2/HLA-DR/CD45; cyMPO/cyCD79a/cyIgM/cyCD22; CD66c/CD135/CD34/CD133.
Fluorochromes in the four channels were: FITC/PE/PC5/APC,respectively.
Patients from ALL-2008 protocol were analyzed with theprotocol-defined six-color combinations:CD10/CD20/CD34/CD19/CD38/CD45; CD66c/CD123/CD34/CD19/CD22/CD45; TdT/CD58/CD34/CD19/CD10/CD45. Additional tubes used were: CD10/CD58/CD34/CD19/CD133/CD45; cyMPO/cyCD79a/cyIgM/CD19/cyCD22/CD45; kappa/lambda/CD33/CD19/CD13/CD45; HLA-DR/CD7/CD34/CD2/CD1a/CD45.
Fluorochromes in the channels were: FITC/PE/PerCP-Cy5.5/PE-Cy7/APC/APC-Cy7, respectively. The following abbreviationsare used: cy, cytoplasmic; kappa, Ig kappa light chain;lambda, Ig lambda light chain; TdT, terminal deoxynucleotidyltransferase; HLA, human leukocyte antigen.
Flow sorting was performed on FACSAria (BectonDickinson). Sorting was carried out in ‘high speed’ with a70-mm nozzle, sheath pressure of 70 PSI and sort precisionmode set to ‘Purity’. When feasible with respect to sample sizeand cell number, a part of the sorted populations werereanalyzed, showing a sorting purity of minimum 98%. Cellsfor fluorescence in situ hybridization (FISH) analysis weresorted onto polylysine-coated glass slides into a droplet(50–100 ml) of phosphate-buffered saline or CytoFix (BectonDickinson) placed on the slide. When cells were not fixatedbefore sorting and sorted into a phosphate-buffered salinedroplet, the cells on the slides were fixated in methanol/glacialacid (3:1). Fixated slides were dehydrated and then keptat –201C for later FISH analysis. Cells to be analyzed by PCRwere sorted into eppendorf tubes containing 500 ml RPMImedium, and cell pellets were kept at �80 1C for later DNApurification.
As part of the diagnostics for childhood ALL, chromosomeanalyses (G-banding) and FISH were carried out on diagnosticBM samples of all ALL patients. The applied FISH probeswere MLL dual color, break apart rearrangement probe,TCF3/PBX1 dual color, dual fusion probe, BCR/ABL dual color,dual fusion probe, EVT6/RUNX1(TEL/AML1) ES dual color
Letters to the Editor
1653
Leukemia

probe (all probes from Vysis, Abbott, Weisbaden, Germany).Patients with a normal or failed karyotype were in additionscreened with FISH probes for chromosomes 4, 10 and 17(CEP4, CEP10, CEP17, Vysis, Abbott). The flow-sorted cellpopulations were analyzed for the clone-defining FISH markerusing a selected FISH probe in each patient (for details, seeSupplementary Table). FISH was performed according tostandard procedures. At least 50 nuclei were analyzed whenpossible.
DNA from the sorted-cell populations was purified by theSpinTissue XS kit (Macherey-Nagel, Duren, Germany) andeluted in 30 ml H2O. As the PCR clonality assay requires largeramount of DNA, we used whole-genome amplified DNA astemplate. Whole-genome amplification (WGA) was performedusing REPLI-g Mini Kit (Qiagen, Hilden, Germany) according tothe manufacturer’s instructions, with a minimum of B10-nginput DNA to minimize amplification bias. WGA was performedon DNA from both unsorted and sorted specimens, andamplified DNA (WGA-DNA) was purified using the QIAampDNA Mini Kit (Qiagen). WGA-DNA from sorted-cell popula-tions was analyzed for the presence of a broad spectrum ofclonal Ig and TCR gene rearrangements (IGH VH-JH, IGH DH-JH,IGK V-Kde/intronRSS-Kde, TCRB Vb-Jb, TCRB Db-Jb, TCD andTCRG) using the IdentiClone Clonality Assays (InVivoScribeTechnologies, San Diego, CA, USA). The gene loci studiedcovers the majority of all possible gene rearrangements. All theIg/TCR gene loci were analyzed in each unsorted BM samplesand in flow-sorted each cell population. For each patient, thegene rearrangement profiles were compared between: genomicDNA from unsorted sample, WGA-DNA from unsorted sampleand WGA-DNA from sorted subfractions. GeneScanning of PCRproducts were performed by capillary electrophoresis (3130Genetic Analyzer, Carlsbad, CA, USA). In cases whereunexpected clonal products were found, the WGA and PCRwere repeated for verification of the findings.5
Analyzing the expression of the 14 antigen markers (CD10,CD34, CD38, CD45, TdT, HLA-DR, CD19, CD20, CD22,cyCD22, cyCD79a, lambda, kappa and cyIgM), we observedimmunophenotypically distinct sub-populations defined by theirbimodal antigen expression in more than half (27/41) of thepatients studied (Table 1 and Figure 1). The sub-populationswere most commonly characterized by a bimodal expressionof CD34 (18/41 patients) and of TdT (11/41 patients), but fivepatients showed bimodal expression of both CD34 and TdT.Few examples of bimodal expression of other markers were alsoobserved: for example, CD10 (two patients), CD45 (twopatients) and lambda (two patients). The sub-populations oftencomprised more than 10% of the total blast count, seen in 15 ofthe 18 patients with bimodal CD34 expression and in 6 of the 11patients with bimodal TdT expression. In the cases with bimodalCD34 expression, it was random whether the major populationhad the highest or lowest expression. In contrast, in almost all ofthe cases with bimodal TdT expression (10 cases out of 11),the major population had the highest TdT expression, beingpositive normal in all cases.
Broad expression, as defined above, of one or more markerswas observed in almost all patients, that is, 38/41 of thepatients studied. The markers involved were most commonlyCD20 (23 patients), CD45 (14 patients) and TdT (13 patients)(Table 1). The broad expression patterns were verified bysingle-color FC in seven representative cases (threeCD20broad, two TdTbroad and two CD34broad) from fiveBM samples. There was no tendency that broad expression ofone marker was specifically correlated to broad expressionof another specific marker.
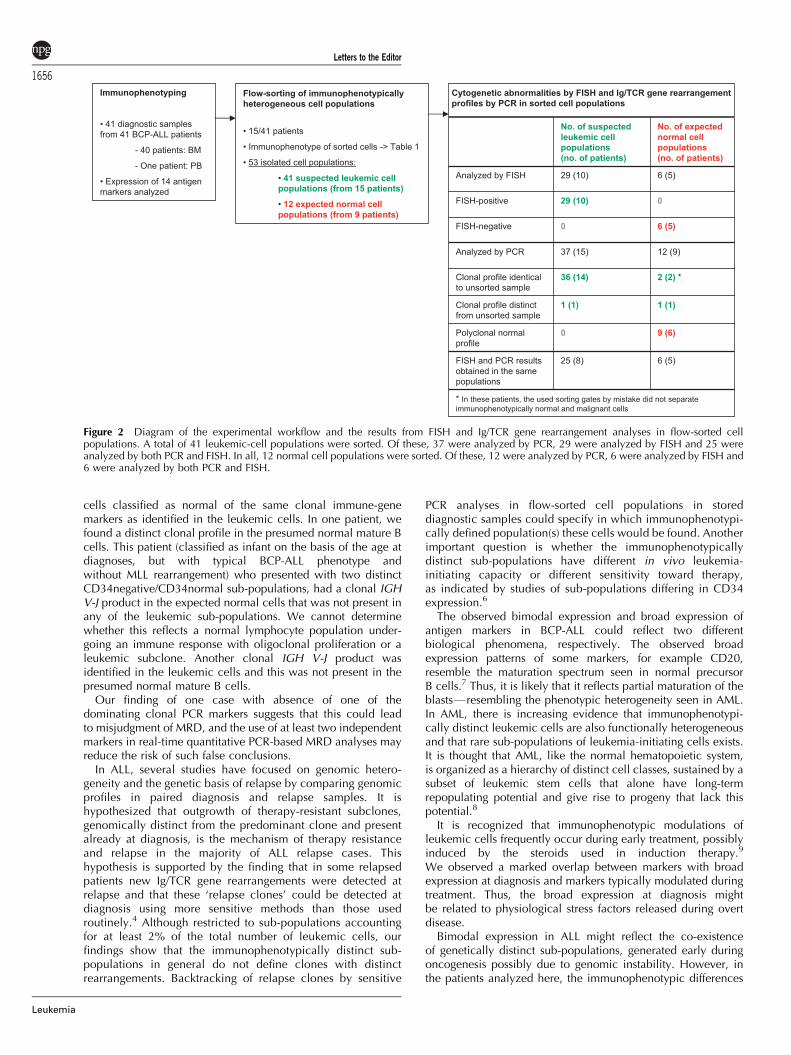
In 15 of the patients in whom distinct sub-populationsor broad expression emerged, the immunophenotypicallyheterogeneous populations were isolated by flow sorting forsubsequent genomic analyses (Figure 2). As the cytogeneticabnormalities are considered a primary event in leukemogenesis,we analyzed the flow-sorted populations by FISH to verify themalignant state of the cells. We found that all flow-sortedpresumed leukemic cell populations showed similar dominanceof cytogenetic aberrant cells by having 60–100% FISH-positivecells (29 populations from 10 patients), irrespective of bimodalor broad expression of the defining marker. In the remainingfive patients, we did not obtain FISH results due to bad quality ofthe cells or lack of a FISH marker. Expected normal cellpopulations with normal immunophenotype (six populationsfrom five patients) had normal karyotype (92–100%FISH-negative cells).
Screening each flow-sorted cell population (37 suspectedleukemic and 12 expected normal cell populations from 15patients) for a broad spectrum of Ig/TCR targets, we found that in14 out of the 15 patients analyzed, the unsorted sample and allsorted expected leukemic subfractions (36) shared identicalpatterns of clonal gene rearrangements (Figure 2): Clonal Ig/TCRgene rearrangements detected in the unsorted specimen werealso detected in all malignant subfractions at similar signalintensities when analyzing equal amounts of DNA. In unsortedspecimens with polyclonal normal rearrangements, no clearclonal products were subsequently detected in sorted leukemicsubfractions. One patient, however, had a distinct Ig/TCR generearrangement profile in one sub-population. This patientshowed two clonal IGH-VJ rearrangements in a population ofCD34dim cells, but only one clonal product in theCD34normal cells. Both of these populations had an immuno-phenotype consistent with common BCP-ALL. Loss of onemarker in one sub-population may be due to secondaryrearrangements or deletion of a chromosomal segment (genomicinstability affecting this gene locus), as has been suggestedin cases of loss of IG/TCR markers at relapse.
Table 1 Number of patients showing bimodal and/or broadexpression of the analyzed markers
Marker Patients with bimodalexpression/Patients
analyzeda
Patients with broadexpression/Patients
analyzeda
CD34 18/41 (7) 8/41 (4)TdT 11/41 (1) 13/41CD10 2/41 (2) 10/41CD45 2/41 (1) 14/41Lambda 2/41 (2) 0/41CD22 1/41 4/41CD66c 2/25 3/25CD20 0/41 23/41 (3)CD38 0/41 6/41cyCD79a 0/41 5/41CD123 0/25 4/25
The following markers were also analyzed: CD19 (41 patients),cyCD22 (41 patients), HLA-DR (41 patients), CD33 (41 patients),kappa (41 patients), cyIgM (41 patients), CD13 (41 patients), CD2(31 patients), CD7 (39 patients) and CD133 (10 patients), but no casesof bimodal expression of these markers were observed, and broadexpression was observed in none or less than 10% of patientsanalyzed.aNumbers in parentheses show number of patients in whom theimmunophenotypically heterogeneous cell populations were isolatedby flow sorting.
Letters to the Editor
1654
Leukemia

Cell populations regarded to be normal were analyzed in ninepatients. In six of these patients with clear separation betweenimmunophenotype-defined normal and malignant cells, the
flow-sorted normal cells had normal IG/TCR polyclonal profiles.In two patients, normal cells were incompletely separated fromthe malignant cells, resulting in presence among the flow-sorted
Patient ICD34bimodal
Patient IICD34broad
Patient IIICD10bimodal
andCD20broad
Patient IIICD10bimodal
andTdTbimodal
Gated on Q2+Q4 (CD10++)
Gated on Q1+Q2 (CD20+)
Gated on Q3+Q4 (CD10-)Gated on Q1+Q2 (CD10++)
Gated on Q1+Q3 (cTdT+)
Gated on Q3+Q4 (CD20-)
Gated on Q1+Q3 (CD10-)
Gated on Q2+Q4 (cTdT++)
Figure 1 Examples of heterogeneous antigen expression at diagnosis in BCP-ALL. The left hand dot plots (a) are all gated on cells with blast FSC/SSC characteristics, while the right hand plots (b) are further gated on CD19-positive cells. Green color denotes leukemic cells; and red colordenotes normal mature B cells. The histograms (c) are gated on the CD19-positive leukemic cells. (A) Examples of bimodal and broad expression ofCD34. (B) Examples of simultaneous bimodal/broad expression of two markers in one antibody combination. Histograms (c) are gated on selectedfractions of leukemic cells as described below each plot.
Letters to the Editor
1655
Leukemia
cells classified as normal of the same clonal immune-genemarkers as identified in the leukemic cells. In one patient, wefound a distinct clonal profile in the presumed normal mature Bcells. This patient (classified as infant on the basis of the age atdiagnoses, but with typical BCP-ALL phenotype andwithout MLL rearrangement) who presented with two distinctCD34negative/CD34normal sub-populations, had a clonal IGHV-J product in the expected normal cells that was not present inany of the leukemic sub-populations. We cannot determinewhether this reflects a normal lymphocyte population under-going an immune response with oligoclonal proliferation or aleukemic subclone. Another clonal IGH V-J product wasidentified in the leukemic cells and this was not present in thepresumed normal mature B cells.
Our finding of one case with absence of one of thedominating clonal PCR markers suggests that this could leadto misjudgment of MRD, and the use of at least two independentmarkers in real-time quantitative PCR-based MRD analyses mayreduce the risk of such false conclusions.
In ALL, several studies have focused on genomic hetero-geneity and the genetic basis of relapse by comparing genomicprofiles in paired diagnosis and relapse samples. It ishypothesized that outgrowth of therapy-resistant subclones,genomically distinct from the predominant clone and presentalready at diagnosis, is the mechanism of therapy resistanceand relapse in the majority of ALL relapse cases. Thishypothesis is supported by the finding that in some relapsedpatients new Ig/TCR gene rearrangements were detected atrelapse and that these ‘relapse clones’ could be detected atdiagnosis using more sensitive methods than those usedroutinely.4 Although restricted to sub-populations accountingfor at least 2% of the total number of leukemic cells, ourfindings show that the immunophenotypically distinct sub-populations in general do not define clones with distinctrearrangements. Backtracking of relapse clones by sensitive
PCR analyses in flow-sorted cell populations in storeddiagnostic samples could specify in which immunophenotypi-cally defined population(s) these cells would be found. Anotherimportant question is whether the immunophenotypicallydistinct sub-populations have different in vivo leukemia-initiating capacity or different sensitivity toward therapy,as indicated by studies of sub-populations differing in CD34expression.6
The observed bimodal expression and broad expression ofantigen markers in BCP-ALL could reflect two differentbiological phenomena, respectively. The observed broadexpression patterns of some markers, for example CD20,resemble the maturation spectrum seen in normal precursorB cells.7 Thus, it is likely that it reflects partial maturation of theblastsFresembling the phenotypic heterogeneity seen in AML.In AML, there is increasing evidence that immunophenotypi-cally distinct leukemic cells are also functionally heterogeneousand that rare sub-populations of leukemia-initiating cells exists.It is thought that AML, like the normal hematopoietic system,is organized as a hierarchy of distinct cell classes, sustained by asubset of leukemic stem cells that alone have long-termrepopulating potential and give rise to progeny that lack thispotential.8
It is recognized that immunophenotypic modulations ofleukemic cells frequently occur during early treatment, possiblyinduced by the steroids used in induction therapy.9
We observed a marked overlap between markers with broadexpression at diagnosis and markers typically modulated duringtreatment. Thus, the broad expression at diagnosis mightbe related to physiological stress factors released during overtdisease.
Bimodal expression in ALL might reflect the co-existenceof genetically distinct sub-populations, generated early duringoncogenesis possibly due to genomic instability. However, inthe patients analyzed here, the immunophenotypic differences
Figure 2 Diagram of the experimental workflow and the results from FISH and Ig/TCR gene rearrangement analyses in flow-sorted cellpopulations. A total of 41 leukemic-cell populations were sorted. Of these, 37 were analyzed by PCR, 29 were analyzed by FISH and 25 wereanalyzed by both PCR and FISH. In all, 12 normal cell populations were sorted. Of these, 12 were analyzed by PCR, 6 were analyzed by FISH and6 were analyzed by both PCR and FISH.
Letters to the Editor
1656
Leukemia
were, in most cases, not related to differences in the immunegene-rearrangement profiles. Thus, these populations must haveevolved from a common clonal origin, and the rearrangementprocess must have been completed early in the commonprogenitor cell. Consequently, possible genomic differencesmust be at loci other than the Ig/TCR genes, or might involveepigenetic differences, for example, DNA methylation andchromatin remodeling.In conclusion, immunophenotypically distinct sub-popula-
tions are common at diagnosis in BCP-ALL. Occasionally,leukemic sub-populations may lack the dominating PCR MRDmarker, which could result in underestimation of MRD, the riskof which may be reduced by the use of several independent PCRmarkers. Furthermore, awareness of the sub-populations isimportant in flow-cytometric MRD monitoring to avoid under-estimation of residual disease.
Conflict of interest
The authors declare no conflict of interest.
Acknowledgements
This study has received financial support from the Ministry ofHealth (Grant number 2006-12103-250), the Novo NordicFoundation, the Danish Research Council for Health and Disease(Grant number R20-A1156-10-S2), the Danish Childhood CancerFoundation (Grant no. 2008/2) and the Otto Christensen Founda-tion. Kjeld Schmiegelow holds the Danish Childhood CancerFoundation Professorship in Pediatric Oncology.
NF Øbro1, HV Marquart1, HO Madsen1, LP Ryder1,MK Andersen2, B Lausen3, BK Albertsen4, PS Wehner5,
J Helgestad6 and K Schmiegelow3,7
1Department of Clinical Immunology, University HospitalRigshospitalet, Copenhagen, Denmark;
2Department of Clinical Genetics, University HospitalRigshospitalet, Copenhagen, Denmark;
3Department of Pediatrics, University Hospital Rigshospitalet,Copenhagen, Denmark;
4Department of Pediatrics, Aarhus University Hospital Skejby,Aarhus, Denmark;
5Department of Pediatric Hematology and Oncology,H. C. Andersen Children0s Hospital, Odense University
Hospital, Odense, Denmark;6Department of Pediatrics, Aarhus University Hospital
Aalborg, Aalborg, Denmark and7The Institute of Gynecology, Obstetrics and Pediatrics,
The Faculty of Medicine, University of Copenhagen,Copenhagen, Denmark
E-mail: [email protected]
References
1 Marusyk A, Polyak K. Tumor heterogeneity: causes andconsequences. Biochim Biophys Acta 2010; 1805: 105–107.
2 Al-Mawali A, Gillis D, Lewis I. The role of multiparameter flowcytometry for detection of minimal residual disease (MRD) in acutemyeloid leukemia (AML). Am J Clin Pathol 2009; 131: 16–26.
3 Borowitz MJ, Pullen DJ, Winick N, Martin PL, Bowman WP,Camitta B. Comparison of diagnostic and relapse flow cytometryphenotypes in childhood acute lymphoblastic leukemia: implica-tions for residual disease detection: a report from the children’soncology group. Cytometry B Clin Cytom 2005; 68: 18–24.
4 Choi S, Hendersen MJ, Ewans E, Beesley AH, Sutton R, Bahar AYet al. Relapse in children with acute lymphoblastic leukemiainvolving selection of a pre-existing drug-resistant subclone. Blood2007; 110: 632–639.
5 Obro NF, Madsen HO, Ryder LP, Andersen MK, Schmiegelow K,Marquart HV. Approaches for cytogenetic and molecular analysesof small flow-sorted cell populations from childhood leukemia bonemarrow samples. J Immunol Methods 2011; e-pub ahead of print 6May 2011.
6 Stahnke K, Eckhoff S, Mohr A, Meyer LH, Debatin KM. Apoptosisinduction in peripheral leukemia cells by remission inductiontreatment in vivo: selective depletion and apoptosis in a CD34+subpopulation of leukemia cells. Leukemia 2003; 17: 2130–2139.
7 Lucio P, Parreira A, van den Beemd MW, van Lochem EG, vanWering ER, Baars E et al. Flow cytometric analysis of normal B celldifferentiation: a fram of reference for the detection of minimalresidual disease in precursor B-ALL. Leukemia 1999; 13: 419–427.
8 Dick JE. Stem cell concepts renew cancer research. Blood 2008;112: 4793–4807.
9 Dworzak MN, Gaipa G, Schumich A, Maglia O, Ratei R, Veltroni Met al. Modulation of antigen expression in B-cell precursor acutelymphoblastic leukemia during induction therapy is partly transient:evidence for a drug-induced regulatory phenomenon. Results of theAIEOP-BFM-ALL-FLOW-MRD-Study Group. Cytometry B ClinCytom 2010; 78: 147–153.
Supplementary Information accompanies the paper on the Leukemia website (http://www.nature.com/leu)
Donor KIR haplotype B improves progression-free and overall survival after allogeneichematopoietic stem cell transplantation for multiple myeloma
Leukemia (2011) 25, 1657–1661; doi:10.1038/leu.2011.138;published online 7 June 2011
Allogeneic hematopoietic stem cell transplantation from relatedor unrelated donor has become a standard treatment for manypatients with hematological malignancies, but the role of thistreatment approach in the treatment of multiple myelomaremains controversial, as high risk of relapse remains a majorconcern.1 In acute leukemias, especially acute myeloid leuke-mias, alloreactive donor-derived natural killer cells (NK cells)
have been correlated with an improved survival, especially afterT-cell-depleted transplant procedures such as haploidenticalstem cell transplantation.2 Small reports after allogeneic stemcell transplantation for multiple myeloma as well as pre-clinicalmodels showed that alloreactive NK cells might have a roleregarding cytotoxicity and relapse prevention in multiplemyeloma.3 The NK cell function is determined by severalreceptor families including activating and inhibitory killercell immunoglobulin-like receptors (KIRs). For the majority,especially for the active KIRs, the correspondent ligands are
Letters to the Editor
1657
Leukemia


![Structural and thermoelectric properties of Bi[sub 2]Sr[sub 2]Co[sub 2]O[sub y] thin films on LaAlO[sub 3] (100) and fused silica substrates](https://static.fdokumen.com/doc/165x107/634467196cfb3d406409325f/structural-and-thermoelectric-properties-of-bisub-2srsub-2cosub-2osub-y.jpg)