Toxic effects of pure anatoxin-a on biomarkers of rainbow trout, Oncorhynchus mykiss
Upload
independentCategory
view
0download
0
BioMed CentralBMC Genetics
ss
Open AcceResearch articleA second generation genetic map for rainbow trout (Oncorhynchus mykiss)Caird E Rexroad III*, Yniv Palti, Scott A Gahr and Roger L VallejoAddress: USDA/ARS National Center for Cool and Cold Water Aquaculture, Leetown, West Virginia, USA
Email: Caird E Rexroad* - [email protected]; Yniv Palti - [email protected]; Scott A Gahr - [email protected]; Roger L Vallejo - [email protected]
* Corresponding author
AbstractBackground: Genetic maps characterizing the inheritance patterns of traits and markers havebeen developed for a wide range of species and used to study questions in biomedicine, agriculture,ecology and evolutionary biology. The status of rainbow trout genetic maps has progressedsignificantly over the last decade due to interest in this species in aquaculture and sport fisheries,and as a model research organism for studies related to carcinogenesis, toxicology, comparativeimmunology, disease ecology, physiology and nutrition. We constructed a second generationgenetic map for rainbow trout using microsatellite markers to facilitate the identification ofquantitative trait loci for traits affecting aquaculture production efficiency and the extraction ofcomparative information from the genome sequences of model fish species.
Results: A genetic map ordering 1124 microsatellite loci spanning a sex-averaged distance of2927.10 cM (Kosambi) and having 2.6 cM resolution was constructed by genotyping 10 parents and150 offspring from the National Center for Cool and Cold Water Aquaculture (NCCCWA)reference family mapping panel. Microsatellite markers, representing pairs of loci resulting from anevolutionarily recent whole genome duplication event, identified 180 duplicated regions within therainbow trout genome. Microsatellites associated with genes through expressed sequence tags orbacterial artificial chromosomes produced comparative assignments with tetraodon, zebrafish,fugu, and medaka resulting in assignments of homology for 199 loci.
Conclusion: The second generation NCCCWA genetic map provides an increased microsatellitemarker density and quantifies differences in recombination rate between the sexes in outbredpopulations. It has the potential to integrate with cytogenetic and other physical maps, identifyingparalogous regions of the rainbow trout genome arising from the evolutionarily recent genomeduplication event, and anchoring a comparative map with the zebrafish, medaka, tetraodon, andfugu genomes. This resource will facilitate the identification of genes affecting traits of interestthrough fine mapping and positional cloning of candidate genes.
BackgroundGenetic maps characterizing the inheritance patterns oftraits and markers have been developed and utilized for awide range of species and applications associated with
studies addressing biomedical, agricultural, ecologicaland evolutionary questions. These applications often tar-get the discovery of allelic variation affecting traits andhave the eventual goal of identifying the exact DNA
Published: 19 November 2008
BMC Genetics 2008, 9:74 doi:10.1186/1471-2156-9-74
Received: 3 March 2008Accepted: 19 November 2008
This article is available from: http://www.biomedcentral.com/1471-2156/9/74
© 2008 Rexroad et al; licensee BioMed Central Ltd. This is an Open Access article distributed under the terms of the Creative Commons Attribution License (http://creativecommons.org/licenses/by/2.0), which permits unrestricted use, distribution, and reproduction in any medium, provided the original work is properly cited.
Page 1 of 14(page number not for citation purposes)

BMC Genetics 2008, 9:74 http://www.biomedcentral.com/1471-2156/9/74
sequences underlying phenotypes [1]. Other studies high-light differences in recombination rates between the sexesas observed in the earliest linkage maps [2-4], or suggestmechanisms of chromosomal evolution through theidentification of regions of conserved synteny across spe-cies. For instance, comparisons of conserved synteny andconserved gene orders have been conducted extensivelywithin the vertebrates [5-8]. Whole genome sequenceshave enabled comparative genomic studies which employcomputational approaches [9], including the identifica-tion of functional elements [10,11]. As a result, one addi-tional goal for mapping in species not having access to awhole genome reference sequence is to develop high-den-sity comparative maps with whole genome sequences ofrelated species. This may be accomplished throughgenetic, cytogenetic, radiation hybrid, bacterial artificialchromosome (BAC), and integrated mapping approaches[12-16]. These maps not only enable the use of informa-tion across species, but may be used within a species to aidwhole genome sequence assembly [17].
The construction of genetic maps for many species beginsby genotyping reference families with markers such asmicrosatellites [18] which were initially developed forpopulation genetic analyses. Microsatellites are often themarker of choice as they exhibit co-dominant inheritance,have high degrees of heterozygosity, are widely distrib-uted throughout the genome, and may provide compara-tive information between closely related species[19].When associated with a gene, these markers can providecomparative information across a great diversity of taxa.The limiting factors of microsatellites for map construc-tion are the time and resources required for marker devel-opment and genotyping. Alternatively, amplifiedfragment length polymorphisms (AFLPs) [20] and ran-dom amplified polymorphic DNAs (RAPDs) [21] markersare inexpensive to develop and are conducive to highthroughput genotyping protocols. Although large num-bers of loci can be mapped rather inexpensively in a shortamount of time, these markers are not associated withunique sequences and are specific to each mapping popu-lation. These efforts result in first generation linkage mapscontaining hundreds of markers which represent much ofthe genome with a low resolution of microsatellites [22-28]. As additional markers become available, includingthose associated with candidate genes, second generationmaps containing several hundred to over one thousandmarkers spanning the entire genome at higher resolutionsare constructed [29-38]. The ultimate genetic maps havesub-centiMorgan (cM) resolution and include anywherefrom thousands to millions of markers [39-41]. Currently,high-density mapping efforts for human, model organ-ism, and agriculturally important species with wholegenome sequences are using single nucleotide polymor-phism (SNP) [42] markers. Similar to microsatellites,
SNPs are abundant, widely distributed throughout thegenome, and are associated with a unique sequence.Although SNPs are amenable to genotyping with high-throughput protocols, they are less polymorphic and willrequire large numbers of crosses for mapping.
The status of rainbow trout genetic maps has progressedsignificantly over the last decade due to interest in theireconomic impacts as an aquaculture species and on sportfisheries, and as a model research organism for studiesrelated to carcinogenesis, toxicology, comparative immu-nology, disease ecology, physiology and nutrition [43].Rainbow trout have a genome size estimated to be 2.4 ×10⁹ bp [44]. While the karyotype of this species variesfrom 2 N = 58–64, the number of chromosome arms isconserved at 104. An evolutionarily recent whole genomeduplication event is estimated to have occurred 25–100mya [45], and the genome is estimated to be 1/3 of theway along the process of re-diploidization, [46]. Severallaboratories have constructed genetic maps includingAFLPs, microsatellites, and SNPs to identify quantitativetrait loci (QTL) affecting time to hatch, development rate,growth, thermal tolerance, natural killer cell-like activity,albinism and disease resistance [47-56]. The first geneticmap based on molecular markers was constructed byYoung et al. [57] who observed the inheritance of 476 loci(332 AFLPs) on 76 doubled haploid fish. The resultingmap contained 31 large linkage groups and spanned atotal of 2627.5 cM. In 2000, Sakamoto et al. [19] mapped208 loci (191 microsatellites) to 29 linkage groups by gen-otyping 186 fish from 3 backcross families. This effortrevealed large recombination rate differences between thesexes (3.25:1 female to male) and a female map lengthover 1000 cM Morgans which is an underestimation asacknowledged by the authors. In 2003, Nichols et al. [58]added to the map of Young et al[57], ordering 1359 lociconsisting primarily of 973 AFLPs and 226 microsatellites,and forming 30 large linkage groups with a map length of4590 cM. Most recently, Guyomard et al. [59] used 120offspring from two doubled haploid mitogynogeneticfamilies to map 903 microsatellite loci with a map lengthof 2750 cM. Concurrently, Phillips et al. [60] integratedthe cytogenetic and genetic maps by assigning linkagegroups from Nichols et al[61] to specific chromosomes ofthe OSU doubled haploid line. Using microsatellites ascomparative loci between salmonids, Danzmann et al.[62] added genetic markers to the map of Sakamoto et al.[19], reporting homeologous chromosome arm assign-ments within species resulting from the genome duplica-tion event and pairwise homologous assignmentsbetween rainbow trout, artic char and Atlantic salmon.
In an effort to support the selective breeding of rainbowtrout for aquaculture production efficiency, we con-structed a genetic map to identify QTL affecting important
Page 2 of 14(page number not for citation purposes)
BMC Genetics 2008, 9:74 http://www.biomedcentral.com/1471-2156/9/74
traits and facilitate positional candidate cloning [63-66].Most of the markers mapped were anonymous microsat-ellites from random enriched libraries, but our focus wasto add markers with comparative information betweenthe trout genome and other salmonids, and with thegenome sequences of model fish species. By genotyping30 offspring from each of 5 outbred families related to ourbroodstock germplasm, 1124 loci were ordered into 29linkage groups representing each chromosome. Thisallowed for the observation of differences in recombina-tion rate between the sexes and the creation of compara-tive maps. Anchoring of EST sequence on the genomesequences of other fishes has enabled the construction ofcomparative maps to facilitate genome research in regionsof interest. The development and mapping of a largenumber of microsatellite loci will facilitate genome map-ping efforts in rainbow trout and other salmonids.
ResultsGenotypingA total of 1435 microsatellite markers were developed orobtained from the literature including anonymous mark-ers [19,59,61,67-80], markers developed in other salmo-nids [62,81-83], markers identified from BACs eithercontaining genes or cytogenetic assignments [60,84], ormarkers representing expressed sequence tags (ESTs) andserving as comparative loci with sequenced genomes ofmodel fish species [80,85] (see Additional File 1, Work-sheet 1). In all, 930 new microsatellite markers weredeveloped and mapped for this project. These markerswere genotyped on the 10 parents and 150 offspring ofthe NCCCWA reference family panel. One hundredtwenty three markers were scored as duplicates containingtwo sets of segregating alleles resulting in evaluation of1558 loci. Of the 1435 markers attempted, 268 amplifiedpoorly and were discarded. Another 87 were not informa-tive in our reference families. A total of 1181 loci wereinformative for either the male or female map, with 1100loci informative in the female and 1068 loci informativefor the male; 991 loci were informative for both sexes (SeeAdditional File 1, Worksheet 6). A total of 18 loci wereobserved to demonstrate pseudolinkage in the males [86],therefore only female data for those markers wereincluded for linkage analysis.
Linkage AnalysisTwo-point linkage analysis placed 1124 loci into 29 majorlinkage groups having 16 or more loci at LOD ≥ 10, anadditional 56 were informative but were not localized tosingle linkage groups with significant LOD scores (SeeAdditional File 1, Worksheet 10). The total combined sexaveraged map distance was 2927.10 cM (Kosambi), a maprepresenting OMY10 is presented in Figure 1, and mapsrepresenting all chromosomes are presented in AdditionalFiles 2 (comparative map) and 3 (genetic map only). Thenumbers of markers included in a framework map created
at LOD ≥ 4 was 137 and ranged from 0–9 markers perchromosome. Chromosomes OMY1, 5, 21, or 23 did notcontain any framework markers. Additional loci wereadded at LOD ≥ 3 (343), ≥ 2 (67) ≥ 1 (30), and ≥ 0 (547).Additional File 1, Worksheet 10 contains this informationand can be used to recreate maps using MapChart soft-ware [87]. The average resolution of the genome map was2.6 cM with individual chromosome maps ranging from1.64 to 4.09 cM. The map contains 1095 gaps, ~84% ofwhich are less than 5 cM and ~94% are less than 10 cM(See Figure 2). The markers used to assign linkage groupsto the cytogenetic map of Phillips et al. [60] are presentedin Additional File 1, Worksheet 7 in addition to markerscomparing linkage groups across genetic maps as modi-fied from Guyomard et al. and Nichols et al. reported inWorksheet 8 [59,61]. Overall statistics for the map andeach chromosome are given in Additional File 1, Work-sheet 9 including chromosome, number of markers,number of markers from ESTs, number of markers fromBACs, number of markers with homology assignments togenome sequences of 4 model fish species, number ofmarkers ordered at each LOD threshold, total map length,female map length, male map length, female:male recom-bination ratios, recombination rate correlations and mapresolution. The female:male recombination ratio was1.68:1, with the female having a map length of 4,317.60cM and the male map 2,564.10 cM. This ratio varied bychromosome, ranging from 0.73:1 to 12.22:1 (Kosambi)(See Table 1). Figure 3 shows a map representing the dif-ferences in recombination rate between the sexes alongthe chromosome length for OMY16. Maps for the otherchromosomes are presented in Additional File 4.
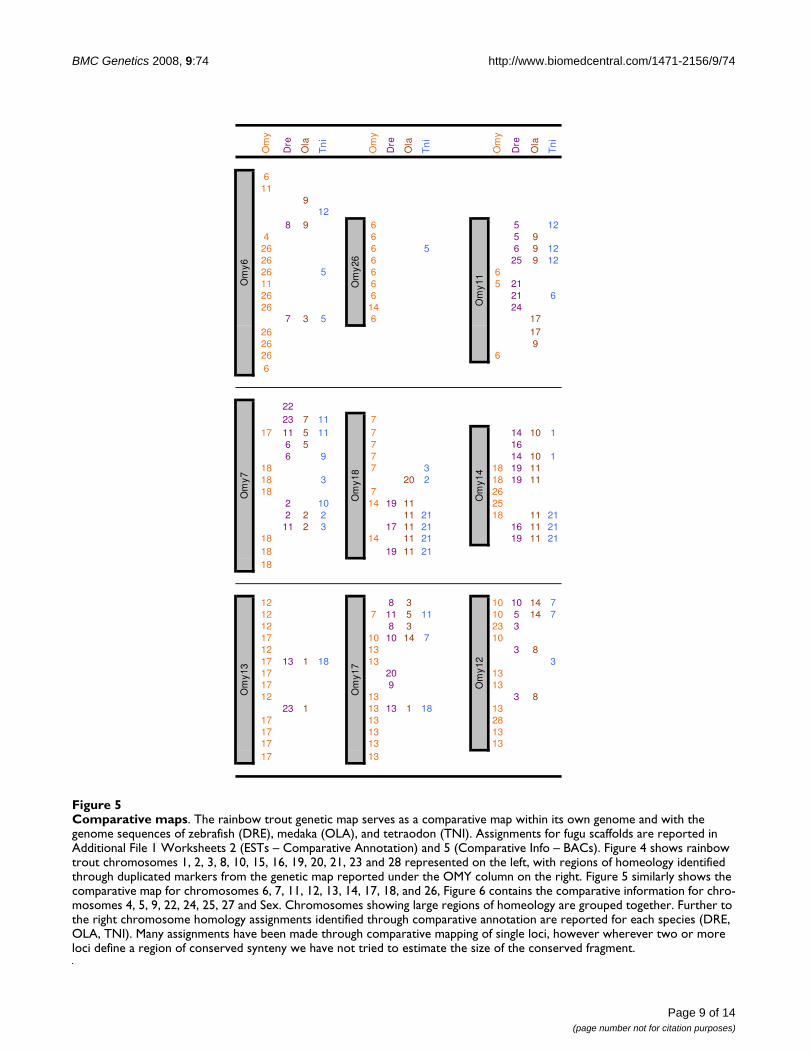
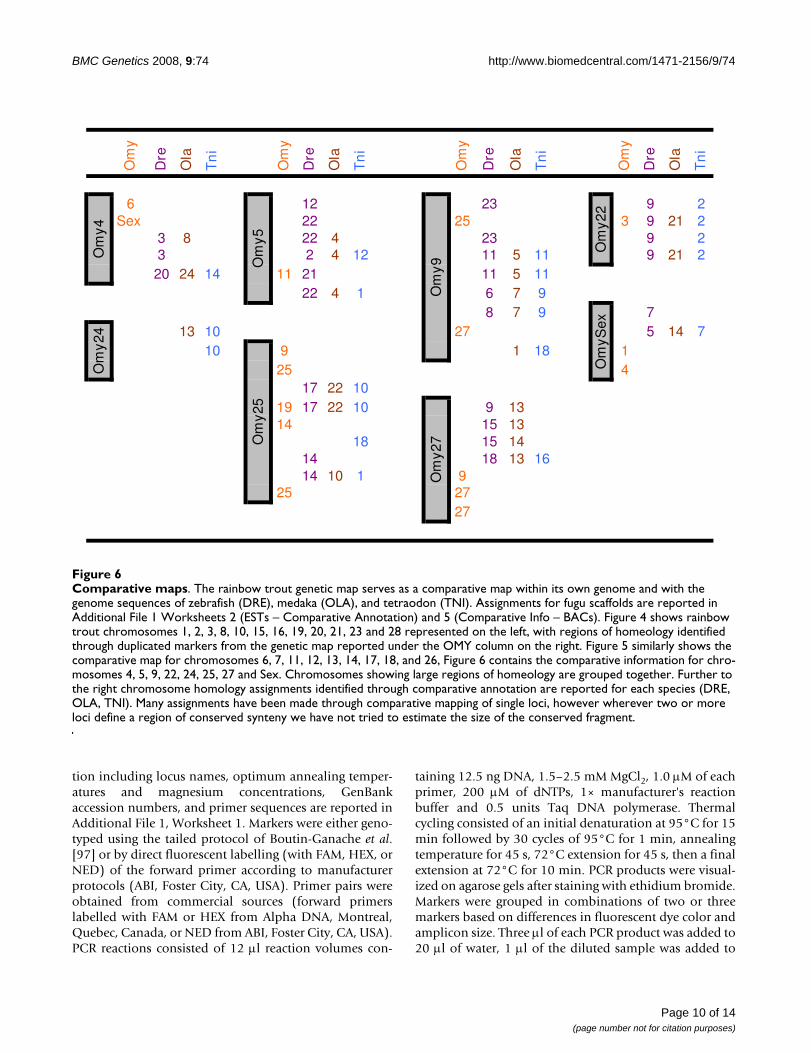
Homeologous AssignmentsThe frequency of duplicated microsatellite loci in rainbowtrout is very high as a result of the recent salmonid wholegenome duplication. We were able to score two loci for123 markers, denoting the loci names with a lower case"a" or "b." Although two loci were informative for all 123of these markers, in many cases only one locus was suc-cessfully ordered on the map. Our map revealed 180duplicated marker regions, including 30 pairs of homeo-logues from ESTs and 10 pairs identified from BACs thatharbor genes of interest (Figures 4, 5, 6). In addition, 149loci are potential duplicates with monomorphic ampli-cons at a putative second locus.
Comparative AssignmentsThe ability to use microsatellites developed from one sal-monid in other salmonid species provides comparativemapping information. To this end, our map includes 33markers from Atlantic salmon, 8 from sockeye salmon, 3from pink salmon, and 1 from Chinook salmon. In addi-tion to comparative maps with the salmonids, our mapincludes markers representing 325 ESTs and 57 loci fromBACs that harbor genes of interest. These have the poten-
Page 3 of 14(page number not for citation purposes)

BMC Genetics 2008, 9:74 http://www.biomedcentral.com/1471-2156/9/74
tial to serve in developing comparative maps with thegenome sequences of model fish species. Additional File1, Worksheet 2 contains comparative assignments ofhomology for markers developed from ESTs, which havemarkers names in the OMM5000 series or GenBank acces-sion numbers. Two strategies were used to assign func-tional annotation to these markers. First, Worksheet 3contains functional annotation for those markers deriveddirectly from blastx hits. Secondly, Worksheet 4 identifiesthe corresponding Unigene [88] or Rainbow Trout GeneIndex [89] record, including the EST from which eachmarker was designed. Functional annotation throughBLAST and GO assignments are available through theseresources. Worksheet 5 contains assignments of compara-tive homology for markers derived from BACs that con-tain genes of interest. These marker names are in theOMM3000 series. Homologs for 199 loci were identifiedin zebrafish (146), medaka (123), tetraodon (164), orfugu (131) (Figures 4, 5, 6).
DiscussionMap OverviewThe NCCCWA genetic map of rainbow trout was con-structed by observing the inheritance of 1124 microsatel-lite markers in 5 families containing 30 offspring each.Although all linkage groups were identified with a highlevel of confidence, many markers were ordered at lowLOD scores, primarily the result of a low number ofinformative meiosis. This was especially true for mostduplicated markers where only one family with a maxi-mum of 30 offspring could be scored. The map containsmany markers which provide comparative information byidentifying regions of homeology within the troutgenome or regions of conserved synteny with genomesequences of model fish species. We observed wholegenome map lengths of 4317.6 cM and 2564.1 cM forfemales and males, respectively, which is similar to thedistances reported by Young et al. (2627.5 cM)[90],Nichols et al. (4590 cM) [61], and Guyomard et al. (2750cM) [59]. However, our female map length differs signifi-
Table 1: Chromosome specific differences in recombination rates between sexes
Chr Sex-Averaged cM Female cM Male cM Female:Male
1 96.8 218.8 17.9 12.222 93 128.7 62.4 2.063 142.2 187 103.9 1.84 120.5 182.8 108.9 1.685 109.8 118.1 161.9 0.736 82.2 146.9 54.2 2.717 128.3 164.6 86.9 1.898 115.5 122.3 118.3 1.039 106.4 113.7 92.9 1.2210 117.1 214.6 79 2.7211 125.9 189.5 99.7 1.912 139.2 215.2 105.6 2.0413 94.7 95.4 70.2 1.3614 130 146 167.5 0.8715 101.8 237.3 51.8 4.5816 88.6 94.7 110.3 0.8617 136.5 218.8 91.9 2.3818 110.2 225.3 81.2 2.7719 155.6 242.6 236.5 1.0320 105.7 115.6 98.8 1.1721 83.1 117.9 57.3 2.0622 61.2 68.4 83.5 0.8223 57.2 153.8 19.3 7.9724 37.6 45.8 29.8 1.5425 146.9 178.2 142.2 1.2526 58 162 26.4 6.1427 74.3 86.2 74.4 1.1628 50.3 64.1 63.6 1.01Sex 58.5 63.3 67.8 0.93
total 2,927.10 4,317.60 2,564.10 1.68
The overall female:male recombination ratio was 1.68:1, with the female having a map length of 4,317.60 cM and the male map 2,564.10 cM. However, individual chromosome and regions of chromosomes varied, with a range of .73:1 to 12.22:1. This table shows the sum of sex averaged (r total), female (r F) and male (r M) recombination fractions between adjacent pairs of loci and the ratio of female to male (F:M). In some cases the sex-averaged recombination rate is lower than that for either of the sexes, this is because different sets of loci are informative for each analysis.
Page 4 of 14(page number not for citation purposes)
BMC Genetics 2008, 9:74 http://www.biomedcentral.com/1471-2156/9/74
cantly from the 10 Morgans reported by Sakamoto et al.[19] who reported the differences in sex recombinationratio to be 3.25:1. We observed an average sex recombina-tion ratio of 1.68:1, but it varied greatly by chromosomeand sub-chromosomal region. One explanation is that themicrosatellites used in our map and the AFLPs used in theprevious map differ with respect to their co-location withrecombination hot spots. Another explanation is likelydue to the marker densities on specific linkage groupswhich show higher ratios than the rest of the map. Thechromosome specific ratios of 12.22:1, 4.58:1, 7.97:1,and 6.14:1, observed for chromosomes OMY 1, 15, 23,and 26, respectively, are well outside of the range for therest of the chromosomes (.73:1 – 2.77:1). Having less
drastic difference in this ratio than observed by Sakamotoet al. [19] facilitated the construction of a sex-averagedmap in which we could include loci informative in anyone of the 10 parents in the NCCCWA mapping referencefamilies. However, the differences in recombination ratiosare significant and sex should be accounted for whendesigning QTL experiments.
Genome DuplicationDue to the evolutionarily recent whole genome duplica-tion event, many microsatellite markers in salmonids existas two copies in the genome, frequently resulting in twoloci which can be genotyped per primer set[19,43,45,46,78,80,91]. In some instances the two loci
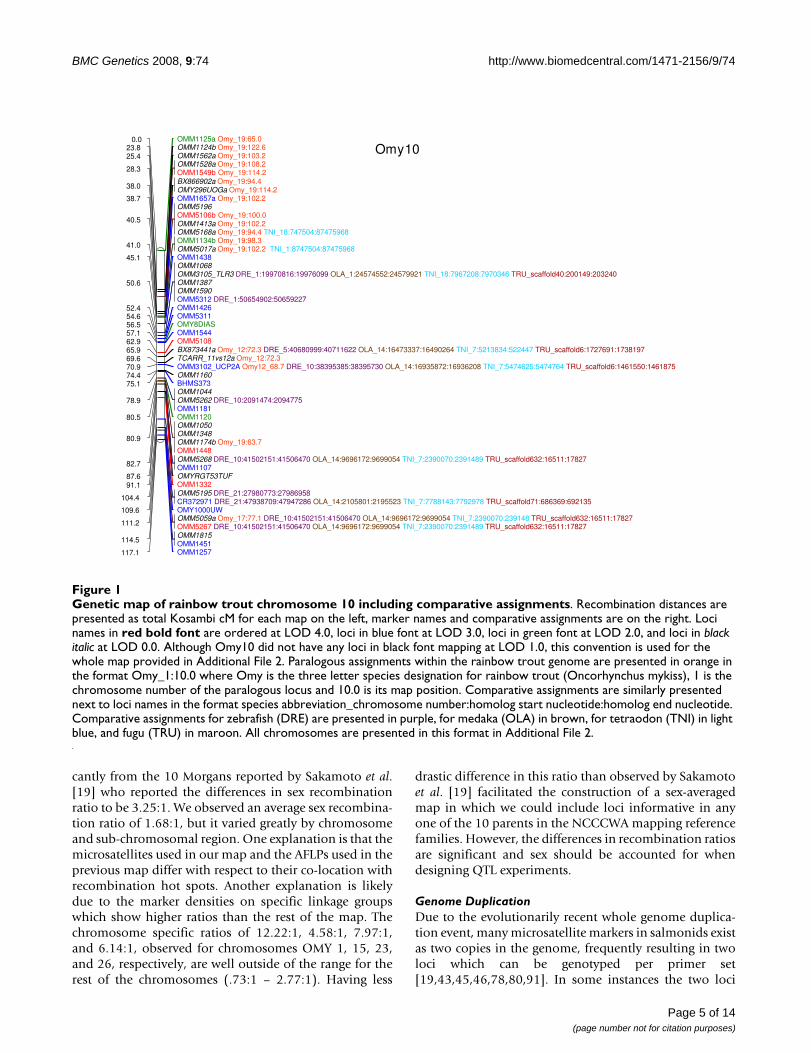
Genetic map of rainbow trout chromosome 10 including comparative assignmentsFigure 1Genetic map of rainbow trout chromosome 10 including comparative assignments. Recombination distances are presented as total Kosambi cM for each map on the left, marker names and comparative assignments are on the right. Loci names in red bold font are ordered at LOD 4.0, loci in blue font at LOD 3.0, loci in green font at LOD 2.0, and loci in black italic at LOD 0.0. Although Omy10 did not have any loci in black font mapping at LOD 1.0, this convention is used for the whole map provided in Additional File 2. Paralogous assignments within the rainbow trout genome are presented in orange in the format Omy_1:10.0 where Omy is the three letter species designation for rainbow trout (Oncorhynchus mykiss), 1 is the chromosome number of the paralogous locus and 10.0 is its map position. Comparative assignments are similarly presented next to loci names in the format species abbreviation_chromosome number:homolog start nucleotide:homolog end nucleotide. Comparative assignments for zebrafish (DRE) are presented in purple, for medaka (OLA) in brown, for tetraodon (TNI) in light blue, and fugu (TRU) in maroon. All chromosomes are presented in this format in Additional File 2.
Omy10OMM1125a Omy_19:65.00.0OMM1124b Omy_19:122.623.8OMM1562a Omy_19:103.225.4OMM1528a Omy_19:108.2OMM1549b Omy_19:114.228.3
BX866902a Omy_19:94.4OMY296UOGa Omy_19:114.238.0
OMM1657a Omy_19:102.238.7OMM5196OMM5106b Omy_19:100.0OMM1413a Omy_19:102.2OMM5168a Omy_19:94.4 TNI_18:747504:87475968
40.5
OMM1134b Omy_19:98.3OMM5017a Omy_19:102.2 TNI_1:8747504:8747596841.0
OMM143845.1OMM1068OMM3105_TLR3 DRE_1:19970816:19976099 OLA_1:24574552:24579921 TNI_18:7967208:7970346 TRU_scaffold40:200149:203240OMM1387OMM1590OMM5312 DRE_1:50654902:50659227
50.6
OMM142652.4OMM531154.6OMY8DIAS56.5OMM154457.1OMM510862.9BX873441a Omy_12:72.3 DRE_5:40680999:40711622 OLA_14:16473337:16490264 TNI_7:5213834:522447 TRU_scaffold6:1727691:173819765.9TCARR_11vs12a Omy_12:72.369.6OMM3102_UCP2A Omy12_68.7 DRE_10:38395385:38395730 OLA_14:16935872:16936208 TNI_7:5474625:5474764 TRU_scaffold6:1461550:146187570.9OMM116074.4BHMS37375.1OMM1044OMM5262 DRE_10:2091474:2094775OMM1181
78.9
OMM112080.5OMM1050OMM1348OMM1174b Omy_19:63.7OMM1448
80.9
OMM5268 DRE_10:41502151:41506470 OLA_14:9696172:9699054 TNI_7:2390070:2391489 TRU_scaffold632:16511:17827OMM110782.7
OMYRGT53TUF87.6OMM133291.1OMM5195 DRE_21:27980773:27986958CR372971 DRE_21:47938709:47947286 OLA_14:2105801:2195523 TNI_7:7788143:7792978 TRU_scaffold71:686369:692135104.4
OMY1000UW109.6OMM5059a Omy_17:77.1 DRE_10:41502151:41506470 OLA_14:9696172:9699054 TNI_7:2390070:239148 TRU_scaffold632:16511:17827OMM5267 DRE_10:41502151:41506470 OLA_14:9696172:9699054 TNI_7:2390070:2391489 TRU_scaffold632:16511:17827111.2
OMM1815OMM1451114.5
OMM1257117.1
Page 5 of 14(page number not for citation purposes)
BMC Genetics 2008, 9:74 http://www.biomedcentral.com/1471-2156/9/74
can be distinguished due to drastic differences in allelesizes, but more often the loci have overlapping and iden-tical allele sizes and include null alleles. In the latter case,the loci often can be scored in only one family, reducingthe observed number of informative meioses supportingmap construction. The benefit of these markers is thatthey identify chromosome fragments that probably sharea common ancestor, and are likely to have similar com-plements of genes in various states of re-diploidization. Aspresented in Figures 4, 5, 6, we identified 180 assignmentsof homeology in the rainbow trout genome. As observedpreviously [19,59,61,62], several chromosomes showedhomeology primarily with one other chromosome,including the pairs OMY1/OMY23, OMY8/OMY28,OMY10/OMY19, OMY2/OMY3, OMY15/OMY21,OMY16/OMY20, OMY6/OMY26, OMY7/OMY18, andOMY13/OMY17. Chromosomes OMY2, OMY6, OMY19,OMY25, and OMY27 showed regions of homeologywithin the chromosome. The mapping of duplicated mic-rosatellites from BACs and ESTs suggests that the genecomplements of these regions may be similar and is usefulfor comparative mapping these regions with other salmo-nids and with the genomes of model fish species.
Comparative AssignmentsThrough the development of microsatellite markers from325 ESTs and 57 BACs, we identified homologs for 199loci in zebrafish, medaka, tetraodon, and/or fugu for theconstruction of a comparative map. Assignments include146 for zebrafish, 123 for medaka, 164 for tetraodon, and131 for fugu. As the fugu genome is not fully assembled,we report comparative assignments only for zebrafish,
medaka, and tetraodon in Figures 4, 5, 6. There were 34,30, and 22 comparative assignments for zebrafish,medaka, and tetraodon, respectively, where more than 2markers from the same chromosome were assigned to thesame rainbow trout chromosome. There were 29, 26, and17 blocks of conserved synteny as defined by two or moreconsecutive assignments from the same chromosome forzebrafish, medaka, and tetraodon, respectively. Theseassignments of homology will facilitate candidate genediscovery, potentially providing comparative genomesequence information to marker intervals of interest (e.g.from QTL detection experiments).
ConclusionThis second generation NCCCWA rainbow trout geneticmap provides an increased microsatellite marker density,estimates of sex specific recombination rates across thegenome of outbred populations and a framework for pro-ducing an integrated genetic and physical map. The mapidentifies paralogous regions of the rainbow trout genomearising from the evolutionarily recent salmonid genomeduplication, and serves as a starting point for comparativemaps with the zebrafish, medaka, tetraodon, and fugugenomes. This resource will facilitate the identification ofgenes affecting traits of interest through fine mapping andpositional candidate cloning.
MethodsReference Family PanelReference families for mapping studies were selected fromthe National Center for Cool and Cold Water Aquacul-ture's 2002 brood year including 10 parental fish originat-ing from the following strains: Clear Spring (CS),Troutlodge (TL), and Donaldson from the University ofWashington (UW) [92]. The majority of karyotypes forfish related to the parents were determined to have 2 N =58 chromosomes, with low frequencies of variation of upto 2 N = 64. Parental fin clips and 30 offspring from eachmating, including one intra-strain cross (CS × CS) and 4inter-strain crosses (2 TL × UW, 2 UW × TL), were sampledfor DNA extractions using the phenol-chloroform methoddescribed in Sambrook and Russell [93]. DNA sampleswere quantified by spectrophotometer (Beckman DU640, Beckman Instruments, St. Louis, MO, USA) anddiluted to a concentration of 12.5 ng/ul for PCR.
Microsatellite GenotypingA total of 1435 microsatellite markers were developed orobtained from the literature including anonymous mark-ers [19,59,61,67-80], markers developed in other salmo-nids [62,81-83], markers identified from BACs eithercontaining genes or cytogenetic assignments [60,84,94-96], or markers representing expressed sequence tags(ESTs) and serving as comparative loci with sequencedgenomes of model fish species [80,85]. Marker informa-
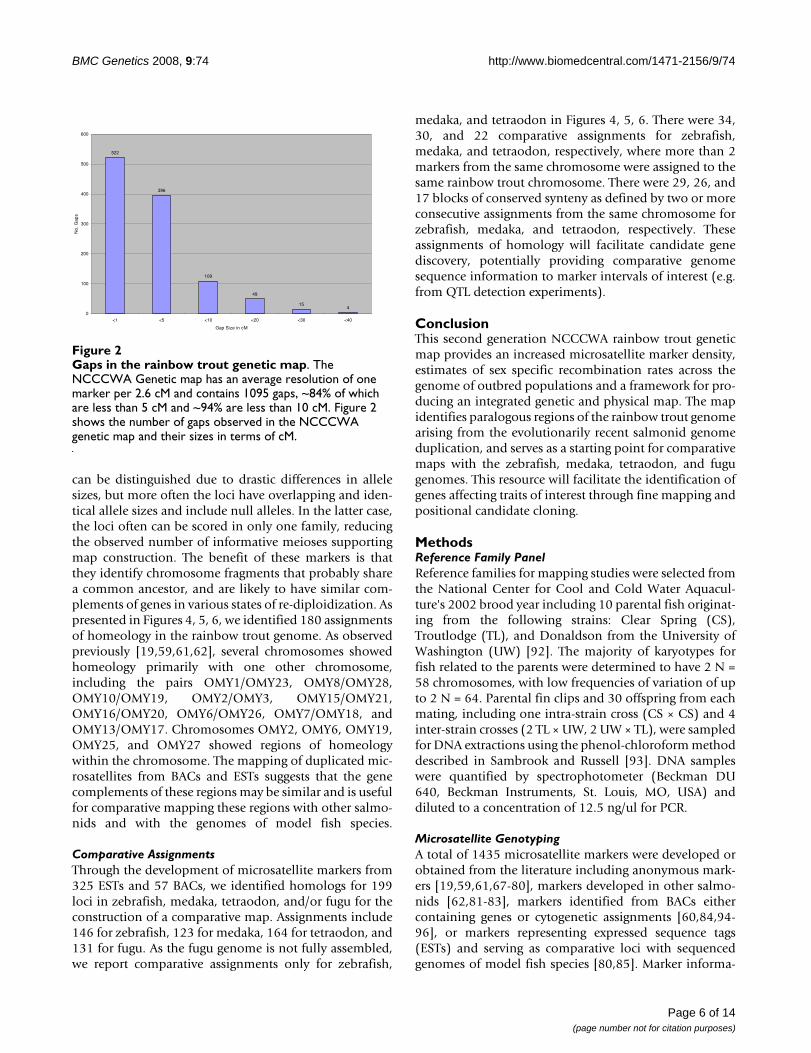
Gaps in the rainbow trout genetic mapFigure 2Gaps in the rainbow trout genetic map. The NCCCWA Genetic map has an average resolution of one marker per 2.6 cM and contains 1095 gaps, ~84% of which are less than 5 cM and ~94% are less than 10 cM. Figure 2 shows the number of gaps observed in the NCCCWA genetic map and their sizes in terms of cM.
522
396
109
49
154
0
100
200
300
400
500
600
<1 <5 <10 <20 <30 <40
Gap Size in cM
No
. Gap
s
Page 6 of 14(page number not for citation purposes)
BMC Genetics 2008, 9:74 http://www.biomedcentral.com/1471-2156/9/74
Page 7 of 14(page number not for citation purposes)
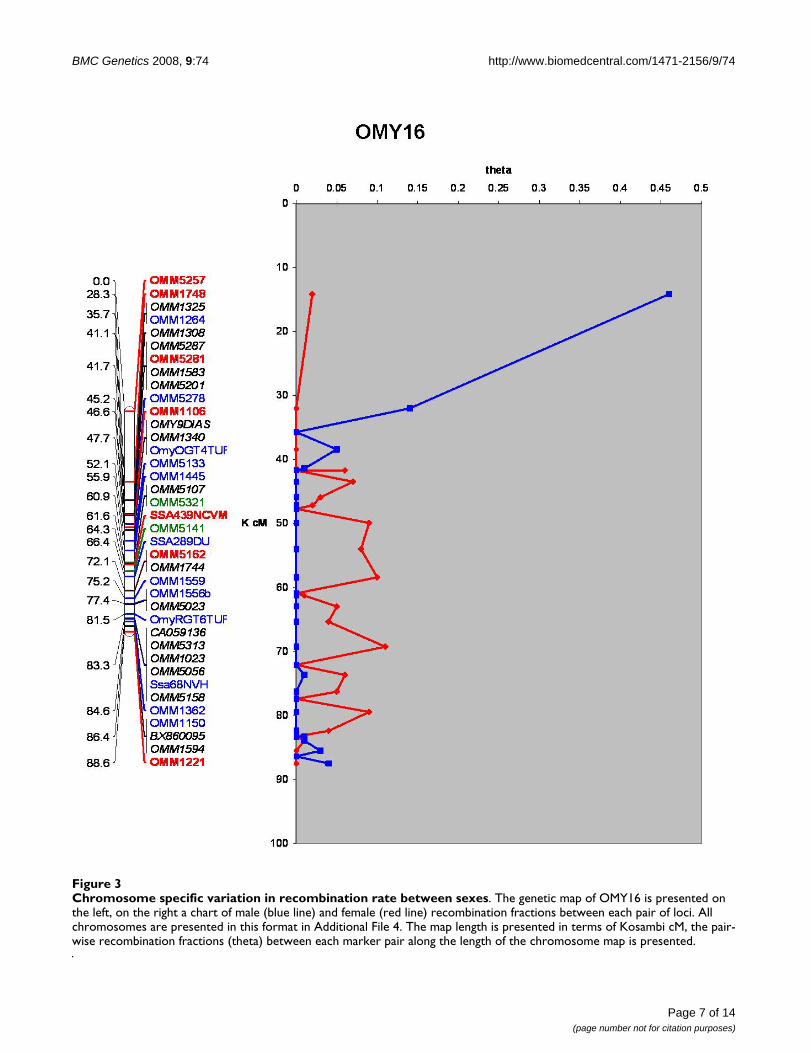
Chromosome specific variation in recombination rate between sexesFigure 3Chromosome specific variation in recombination rate between sexes. The genetic map of OMY16 is presented on the left, on the right a chart of male (blue line) and female (red line) recombination fractions between each pair of loci. All chromosomes are presented in this format in Additional File 4. The map length is presented in terms of Kosambi cM, the pair-wise recombination fractions (theta) between each marker pair along the length of the chromosome map is presented.
BMC Genetics 2008, 9:74 http://www.biomedcentral.com/1471-2156/9/74
Page 8 of 14(page number not for citation purposes)
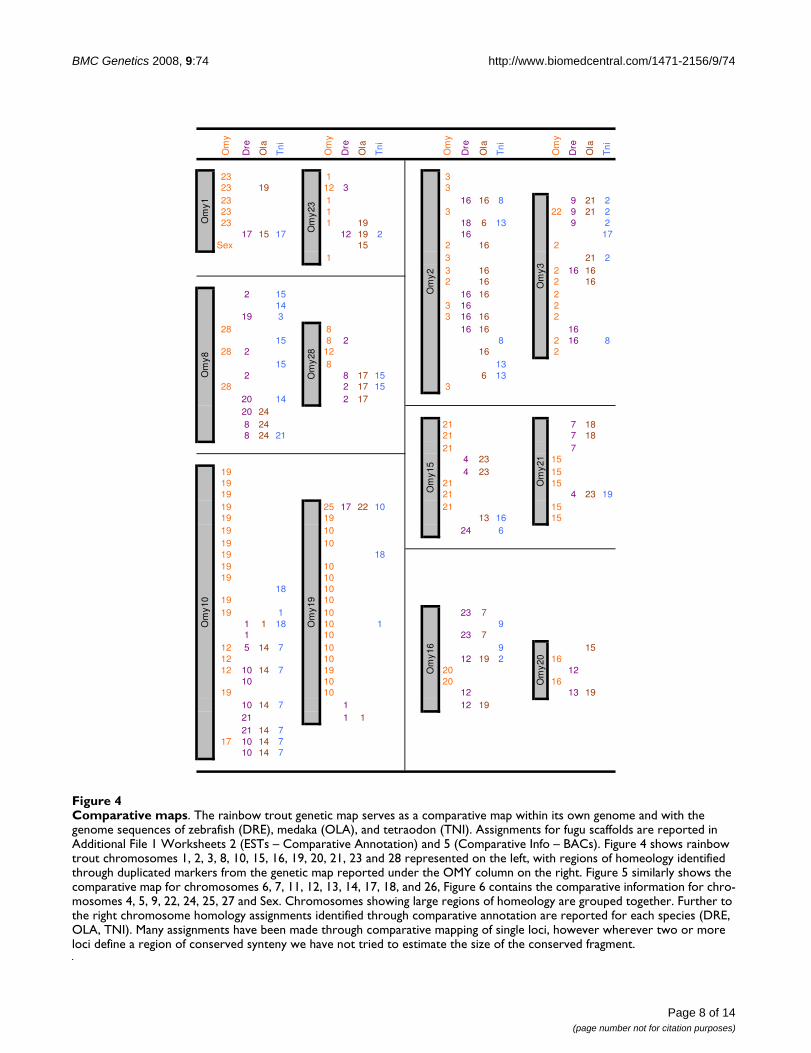
Comparative mapsFigure 4Comparative maps. The rainbow trout genetic map serves as a comparative map within its own genome and with the genome sequences of zebrafish (DRE), medaka (OLA), and tetraodon (TNI). Assignments for fugu scaffolds are reported in Additional File 1 Worksheets 2 (ESTs – Comparative Annotation) and 5 (Comparative Info – BACs). Figure 4 shows rainbow trout chromosomes 1, 2, 3, 8, 10, 15, 16, 19, 20, 21, 23 and 28 represented on the left, with regions of homeology identified through duplicated markers from the genetic map reported under the OMY column on the right. Figure 5 similarly shows the comparative map for chromosomes 6, 7, 11, 12, 13, 14, 17, 18, and 26, Figure 6 contains the comparative information for chro-mosomes 4, 5, 9, 22, 24, 25, 27 and Sex. Chromosomes showing large regions of homeology are grouped together. Further to the right chromosome homology assignments identified through comparative annotation are reported for each species (DRE, OLA, TNI). Many assignments have been made through comparative mapping of single loci, however wherever two or more loci define a region of conserved synteny we have not tried to estimate the size of the conserved fragment.
Om
y
Dre
Ola
Tn
i
Om
y
Dre
Ola
Tn
i
Om
y
Dre
Ola
Tn
i
Om
y
Dre
Ola
Tn
i
Om
y1
23
Om
y23
1
Om
y2
323 19 12 3 323 1 16 16 8
Om
y3
9 21 223 1 3 22 9 21 223 1 19 18 6 13 9 2
17 15 17 12 19 2 16 17Sex 15 2 16 2
1 3 21 23 16 2 16 162 16 2 16
Om
y8
2 15 16 16 214 3 16 2
19 3 3 16 16 228
Om
y28
8 16 16 1615 8 2 8 2 16 8
28 2 12 16 215 8 13
2 8 17 15 6 1328 2 17 15 3
20 14 2 1720 248 24
Om
y15
21
Om
y21
7 188 24 21 21 7 18
21 74 23 15
Om
y10
19 4 23 1519 21 1519 21 4 23 1919
Om
y19
25 17 22 10 21 1519 19 13 16 1519 10 24 619 1019 1819 1019 10
18 1019 1019 1 10
Om
y16
23 71 1 18 10 1 91 10 23 7
12 5 14 7 10 9
Om
y20
1512 10 12 19 2 1612 10 14 7 19 20 12
10 10 20 1619 10 12 13 19
10 14 7 1 12 1921 1 121 14 7
17 10 14 710 14 7
BMC Genetics 2008, 9:74 http://www.biomedcentral.com/1471-2156/9/74
Page 9 of 14(page number not for citation purposes)
Comparative mapsFigure 5Comparative maps. The rainbow trout genetic map serves as a comparative map within its own genome and with the genome sequences of zebrafish (DRE), medaka (OLA), and tetraodon (TNI). Assignments for fugu scaffolds are reported in Additional File 1 Worksheets 2 (ESTs – Comparative Annotation) and 5 (Comparative Info – BACs). Figure 4 shows rainbow trout chromosomes 1, 2, 3, 8, 10, 15, 16, 19, 20, 21, 23 and 28 represented on the left, with regions of homeology identified through duplicated markers from the genetic map reported under the OMY column on the right. Figure 5 similarly shows the comparative map for chromosomes 6, 7, 11, 12, 13, 14, 17, 18, and 26, Figure 6 contains the comparative information for chro-mosomes 4, 5, 9, 22, 24, 25, 27 and Sex. Chromosomes showing large regions of homeology are grouped together. Further to the right chromosome homology assignments identified through comparative annotation are reported for each species (DRE, OLA, TNI). Many assignments have been made through comparative mapping of single loci, however wherever two or more loci define a region of conserved synteny we have not tried to estimate the size of the conserved fragment.
Om
y
Dre
Ola
Tn
i
Om
y
Dre
Ola
Tn
i
Om
y
Dre
Ola
Tn
i
Om
y6
611
912
8 9
Om
y26
6
Om
y11
5 124 6 5 926 6 5 6 9 1226 6 25 9 1226 5 6 611 6 5 2126 6 21 626 14 24
7 3 5 6 1726 1726 926 66
Om
y7
2223 7 11
Om
y18
717 11 5 11 7
Om
y14
14 10 16 5 7 166 9 7 14 10 1
18 7 3 18 19 1118 3 20 2 18 19 1118 7 26
2 10 14 19 11 252 2 2 11 21 18 11 2111 2 3 17 11 21 16 11 21
18 14 11 21 19 11 2118 19 11 2118
Om
y13
12
Om
y17
8 3
Om
y12
10 10 14 712 7 11 5 11 10 5 14 712 8 3 23 317 10 10 14 7 1012 13 3 817 13 1 18 13 317 20 1317 9 1312 13 3 8
23 1 13 13 1 18 1317 13 2817 13 1317 13 1317 13
BMC Genetics 2008, 9:74 http://www.biomedcentral.com/1471-2156/9/74
tion including locus names, optimum annealing temper-atures and magnesium concentrations, GenBankaccession numbers, and primer sequences are reported inAdditional File 1, Worksheet 1. Markers were either geno-typed using the tailed protocol of Boutin-Ganache et al.[97] or by direct fluorescent labelling (with FAM, HEX, orNED) of the forward primer according to manufacturerprotocols (ABI, Foster City, CA, USA). Primer pairs wereobtained from commercial sources (forward primerslabelled with FAM or HEX from Alpha DNA, Montreal,Quebec, Canada, or NED from ABI, Foster City, CA, USA).PCR reactions consisted of 12 μl reaction volumes con-
taining 12.5 ng DNA, 1.5–2.5 mM MgCl2, 1.0 μM of eachprimer, 200 μM of dNTPs, 1× manufacturer's reactionbuffer and 0.5 units Taq DNA polymerase. Thermalcycling consisted of an initial denaturation at 95°C for 15min followed by 30 cycles of 95°C for 1 min, annealingtemperature for 45 s, 72°C extension for 45 s, then a finalextension at 72°C for 10 min. PCR products were visual-ized on agarose gels after staining with ethidium bromide.Markers were grouped in combinations of two or threemarkers based on differences in fluorescent dye color andamplicon size. Three μl of each PCR product was added to20 μl of water, 1 μl of the diluted sample was added to
Comparative mapsFigure 6Comparative maps. The rainbow trout genetic map serves as a comparative map within its own genome and with the genome sequences of zebrafish (DRE), medaka (OLA), and tetraodon (TNI). Assignments for fugu scaffolds are reported in Additional File 1 Worksheets 2 (ESTs – Comparative Annotation) and 5 (Comparative Info – BACs). Figure 4 shows rainbow trout chromosomes 1, 2, 3, 8, 10, 15, 16, 19, 20, 21, 23 and 28 represented on the left, with regions of homeology identified through duplicated markers from the genetic map reported under the OMY column on the right. Figure 5 similarly shows the comparative map for chromosomes 6, 7, 11, 12, 13, 14, 17, 18, and 26, Figure 6 contains the comparative information for chro-mosomes 4, 5, 9, 22, 24, 25, 27 and Sex. Chromosomes showing large regions of homeology are grouped together. Further to the right chromosome homology assignments identified through comparative annotation are reported for each species (DRE, OLA, TNI). Many assignments have been made through comparative mapping of single loci, however wherever two or more loci define a region of conserved synteny we have not tried to estimate the size of the conserved fragment.
Om
y
Dre
Ola
Tn
i
Om
y
Dre
Ola
Tn
i
Om
y
Dre
Ola
Tn
i
Om
y
Dre
Ola
Tn
i
Om
y4
6
Om
y5
12
Om
y9
23
Om
y22 9 2
Sex 22 25 3 9 21 23 8 22 4 23 9 23 2 4 12 11 5 11 9 21 220 24 14 11 21 11 5 11
22 4 1 6 7 98 7 9
Om
ySex
7
Om
y24 13 10 27 5 14 7
10
Om
y25
9 1 18 125 4
17 22 1019 17 22 10
Om
y27
9 1314 15 13
18 15 1414 18 13 1614 10 1 9
25 2727
Page 10 of 14(page number not for citation purposes)
BMC Genetics 2008, 9:74 http://www.biomedcentral.com/1471-2156/9/74
12.5 μl of loading mixture made up with 12 μl of HiDiformamide and 0.5 of Genscan 400 ROX internal sizestandard. Samples were denatured at 95°C for 5 min andkept on ice until loading on an automated DNA sequencerABI 3730 DNA Analyzer (ABI, Foster City, CA, USA). Out-put files were analyzed using GeneMapper version 3.7(ABI, Foster City, CA, USA), formatted using MicrosoftExcel and stored in Microsoft Access. As a result of the evo-lutionarily recent genome duplication, microsatellitemarkers in salmonids are often present in two copies inthe genome, each copy potentially having overlappingallele size ranges and possibly including alleles havingidentical sizes. Markers which were duplicated werescored as independent loci, adding an "a" and "b" to dif-ferentiate their locus names. Duplicated loci with overlap-ping and/or identical allele sizes were scored only in thefamily containing the most informative meiosis.
Linkage AnalysesGenotype data combined for both sexes were formattedusing MAKEPED of the LINKAGE [98] program andchecked for inconsistencies with Mendelian inheritanceusing PEDCHECK [99]. RECODE [100] and LNKTOCRI[101] were used to assemble the data into CRIMAP [102]format. MULTIMAP [103] was used to conduct two-pointand multi-point linkage analyses. Two-point linkage anal-ysis included parameters of LOD ≥ 10 and recombinationfraction r ≤ 0.5. Multipoint linkage analysis was con-ducted on individual linkage groups, including lociunlinked at LOD ≥ 10 but linked to loci in that linkagegroup at LOD ≥ 4. Framework maps were constructedusing default parameters, markers were added to compre-hensive maps by lowering the LOD threshold one integerat a time and starting with the previous order. Resultingmaps are consensus maps, accounting for co-informativemeiosis across the five families.
Linkage Group NomenclatureLinkage groups were assigned chromosome names usingthe integrated cytogenetic/linkage map of Phillips et al.[60]. Specific markers used to identify cytogenetic chro-mosome names are listed in Additional File 1 Worksheet7 (Markers for Map Integration). In an effort to identifycommon linkage groups between published maps, Addi-tional File 1 Worksheet 8 (Linkage Group Translation) hasbeen adapted from Guyomard et al. [59].
Estimating Differences in Recombination Rates between the SexesMultimap reports sex averaged, female and male recombi-nation rates for any given map order. Whole-genome maplengths were obtained by adding the total cM for eachchromosome for the sex-averaged, female, and malemaps. To estimate the genome wide female:male recom-
bination ratio, the entire map length for the female wasdivided by that of the male. To evaluate chromosome spe-cific rates, pairwise distances in cM between adjacent mapintervals were calculated and presented in Figure 3 andAdditional File 4, chromosome specific ratios are reportedin Additional File 1 Worksheet 9 (Chromosome Informa-tion).
Comparative AssignmentsExpressed Sequences associated with microsatellites(OMM5000 and GenBank accession no. designations) formarkers were BLASTed [104] using blastn against the tran-scripts of each genome obtained from http://www.ensembl.org. Only matches having a minimumalignment length over 50 bp and percent identity over78% were treated as potential matches. Data were handchecked and assignments which were questionable wereremoved. Microsatellites identified from bacterial artifi-cial chromosomes were annotated with genes known tobe contained within those clones by sequence analysis.
Authors' contributionsCER designed the study, collected genotypes and con-ducted the linkage analysis. RV developed the linkageanalysis pipeline and participated in linkage analysis, YPparticipated in marker development and genotyping, SAGparticipated in marker development. Dr. Jeffrey Silversteinparticipated in cross design and execution.
Additional material
Additional file 1Marker and Mapping Information. Additional Files are included as numbered spreadsheets in a MS Excel file:1 Marker PCR Information (PCR primers, conditions, etc...)2 ESTs – Comparative Assignments (identification of homologs of OMM5000 markers, developed from ESTs, in the zebrafish, medaka, tetraodon, and fugu genomes)3 ESTs – BLASTx Annotation (Functional annotation for EST markers assigned through blastx of the GenBank nr database)4 ESTs – RTGI and Unigene (Identi-fication of Rainbow Trout Gene Index and Unigene Assemblies for which EST markers belong)5 Comparative Info – BACs (Comparative informa-tion for OMM3000 markers derived from BACs containing genes of inter-est)6 Inf Mei and Allele#s (informative meiosis and number of alleles for markers screened on the NCCCWA reference families)7 Markers for Map Integration (Markers used to integrate NCCCWA linkage groups and the rainbow trout cytogenetic map)8 Linkage Group Translation (identifying names of common linkage groups between published rainbow trout genetic maps)9 Chromosome Info (Linkage analysis information broken down by chromosome)10 2pt Info for loci informative but not mapped (Reporting loci which were informative in the NCCCWA reference families but not able to be placed on the map)11 Maps (Genetic map data which can be used to recreate map figues in MapChart)Click here for file[http://www.biomedcentral.com/content/supplementary/1471-2156-9-74-S1.xls]
Page 11 of 14(page number not for citation purposes)

BMC Genetics 2008, 9:74 http://www.biomedcentral.com/1471-2156/9/74
AcknowledgementsThe authors wish to acknowledge Roseanna Long, Kristy Shewbridge, and M. Renee Fincham for their excellent technical expertise, Dr. Jeffrey Silver-stein for providing the crosses, Dr. Ruth Phillips for ongoing collaboration on physical/genetic map integration, and Dr. Thomas Kocher, Dr. Roy Danzmann and Dr. Gary Rohrer for providing expert advice on linkage analysis.
References1. Lander ES, Botstein D: Mapping mendelian factors underlying
quantitative traits using RFLP linkage maps. Genetics 1989,121(1):185-199.
2. Haldane J: Sex ratio and unisexual sterility in hybrid animals.Journal of Genetics 1922, 12:101-109.
3. Huxley J: Sexual difference of linkage in Gammarus cheyreuxi.Journal of Genetics 1928, 20:145-156.
4. Dunn L, Bennett D: Sex differences in recombination of linkedgenes in animals. Genetic Research 1967, 9:211-220.
5. O'Brien SJ, Womack JE, Lyons LA, Moore KJ, Jenkins NA, CopelandNG: Anchored reference loci for comparative genome map-ping in mammals. Nat Genet 1993, 3:103-112.
6. Burt DW: Comparative mapping in farm animals. Brief FunctGenomic Proteomic 2002, 1:159-168.
7. Nadeau JH: Maps of linkage and synteny homologies betweenmouse and man. Trends Genet 1989, 5:82-86.
8. Serikawa T, Cui Z, Yokoi N, Kuramoto T, Kondo Y, Kitada K, GuenetJL: A comparative genetic map of rat, mouse and humangenomes. Exp Anim 1998, 47:1-9.
9. Miller W, Rosenbloom K, Hardison RC, Hou M, Taylor J, Raney B,Burhans R, King DC, Baertsch R, Blankenberg D, et al.: 28-way ver-tebrate alignment and conservation track in the UCSCGenome Browser. Genome Res 2007, 17:1797-1808.
10. Kheradpour P, Stark A, Roy S, Kellis M: Reliable prediction of reg-ulator targets using 12 Drosophila genomes. Genome Res 2007,17:1919-1931.
11. Siepel A, Diekhans M, Brejova B, Langton L, Stevens M, Comstock CL,Davis C, Ewing B, Oommen S, Lau C, et al.: Targeted discovery ofnovel human exons by comparative genomics. Genome Res2007, 17:1763-1773.
12. Breen M, Hitte C, Lorentzen TD, Thomas R, Cadieu E, Sabacan L,Scott A, Evanno G, Parker HG, Kirkness EF, et al.: An integrated4249 marker FISH/RH map of the canine genome. BMCGenomics 2004, 5:65.
13. Kayang BB, Fillon V, Inoue-Murayama M, Miwa M, Leroux S, Feve K,Monvoisin JL, Pitel F, Vignoles M, Mouilhayrat C, et al.: Integratedmaps in quail (Coturnix japonica) confirm the high degree ofsynteny conservation with chicken (Gallus gallus) despite 35million years of divergence. BMC Genomics 2006, 7:101.
14. Snelling WM, Gautier M, Keele JW, Smith TP, Stone RT, Harhay GP,Bennett GL, Ihara N, Takasuga A, Takeda H, et al.: Integrating link-age and radiation hybrid mapping data for bovine chromo-some 15. BMC Genomics 2004, 5:77.
15. Kitada K, Voigt B, Kondo Y, Serikawa T: An integrated ratgenome map based on genetic and cytogenetic data. ExpAnim 2000, 49:119-126.
16. Mellersh CS, Hitte C, Richman M, Vignaux F, Priat C, Jouquand S,Werner P, Andre C, DeRose S, Patterson DF, et al.: An integratedlinkage-radiation hybrid map of the canine genome. MammGenome 2000, 11:120-130.
17. Jann OC, Aerts J, Jones M, Hastings N, Law A, McKay S, Marques E,Prasad A, Yu J, Moore SS, et al.: A second generation radiationhybrid map to aid the assembly of the bovine genomesequence. BMC Genomics 2006, 7:283.
18. Weber JL, May PE: Abundant class of human DNA polymor-phisms which can be typed using the polymerase chain reac-tion. Am J Hum Genet 1989, 44(3):388-396.
19. Sakamoto T, Danzmann RG, Gharbi K, Howard P, Ozaki A, Khoo SK,Woram RA, Okamoto N, Ferguson MM, Holm LE, et al.: A micros-atellite linkage map of rainbow trout (Oncorhynchusmykiss) characterized by large sex-specific differences inrecombination rates. Genetics 2000, 155(3):1331-1345.
20. Vos P, Hogers R, Bleeker M, Reijans M, Lee T van de, Hornes M, Fri-jters A, Pot J, Peleman J, Kuiper M, et al.: AFLP: a new techniquefor DNA fingerprinting. Nucleic Acids Res 1995, 23:4407-4414.
21. Williams JG, Kubelik AR, Livak KJ, Rafalski JA, Tingey SV: DNA pol-ymorphisms amplified by arbitrary primers are useful asgenetic markers. Nucleic Acids Res 1990, 18:6531-6535.
22. Dawson E, Abecasis GR, Bumpstead S, Chen Y, Hunt S, Beare DM,Pabial J, Dibling T, Tinsley E, Kirby S, et al.: A first-generation link-age disequilibrium map of human chromosome 22. Nature2002, 418:544-548.
23. Kayang BB, Vignal A, Inoue-Murayama M, Miwa M, Monvoisin JL, ItoS, Minvielle F: A first-generation microsatellite linkage map ofthe Japanese quail. Anim Genet 2004, 35:195-200.
24. Khatkar MS, Collins A, Cavanagh JA, Hawken RJ, Hobbs M, ZengerKR, Barris W, McClintock AE, Thomson PC, Nicholas FW, RaadsmaHW: A first-generation metric linkage disequilibrium map ofbovine chromosome 6. Genetics 2006, 174:79-85.
25. Lallias D, Beaumont AR, Haley CS, Boudry P, Heurtebise S, LapegueS: A first-generation genetic linkage map of the European flatoyster Ostrea edulis (L.) based on AFLP and microsatellitemarkers. Anim Genet 2007, 38:560-568.
Additional file 2Genetic Map. This Adobe PDF file includes figures representing the 29 linkage groups/chromosomes of the NCCCWA rainbow trout genetic map. Recombination distances are presented as total Kosambi cM for each map on the left, marker names and comparative assignments are on the right. Loci names in red bold font are ordered at LOD 4.0, loci in blue font at LOD 3.0, loci in green font at LOD 2.0, loci in black font at LOD 1.0 and loci in black italic at LOD 0.0. Paralogous assignments within the rainbow trout genome are presented in orange in the format Omy_1:10.0 where Omy is the three letter species designation for rainbow trout (Oncorhynchus mykiss), 1 is the chromosome number of the paralogous locus and 10.0 is its map position. Comparative assignments are similarly presented next to loci names in the format species abbreviation_chromosome number:homolog start nucleotide:homolog end nucleotide. Comparative assignments for zebrafish are presented in pur-ple, for medaka in brown, for tetraodon in light blue, and fugu in maroon.Click here for file[http://www.biomedcentral.com/content/supplementary/1471-2156-9-74-S2.pdf]
Additional file 3Genetic Map. This Adobe PDF file includes figures representing the 29 linkage groups/chromosomes of the NCCCWA rainbow trout genetic map. Recombination distances are presented as total Kosambi cM for each map on the left, marker names are on the right. Loci names in red bold font are ordered at LOD 4.0, loci in blue font at LOD 3.0, loci in green font at LOD 2.0, loci in black font at LOD 1.0 and loci in black italic at LOD 0.0.Click here for file[http://www.biomedcentral.com/content/supplementary/1471-2156-9-74-S3.pdf]
Additional file 4Sex Recombination Ratios. This Adobe PDF file includes figures repre-senting the 29 linkage groups/chromosomes of the NCCCWA rainbow trout genetic map and figures representing the differences in recombina-tion rate between the sexes along each chromosome. The map length is pre-sented in terms of Kosambi cM, the pairwise recombination fractions (theta) between each marker pair along the length of the chromosome map is presented.Click here for file[http://www.biomedcentral.com/content/supplementary/1471-2156-9-74-S4.pdf]
Page 12 of 14(page number not for citation purposes)
BMC Genetics 2008, 9:74 http://www.biomedcentral.com/1471-2156/9/74
26. Samollow PB, Kammerer CM, Mahaney SM, Schneider JL, Westen-berger SJ, VandeBerg JL, Robinson ES: First-generation linkagemap of the gray, short-tailed opossum, Monodelphis domes-tica, reveals genome-wide reduction in female recombina-tion rates. Genetics 2004, 166:307-329.
27. Swinburne J, Gerstenberg C, Breen M, Aldridge V, Lockhart L, MartiE, Antczak D, Eggleston-Stott M, Bailey E, Mickelson J, et al.: Firstcomprehensive low-density horse linkage map based on two3-generation, full-sibling, cross-bred horse reference fami-lies. Genomics 2000, 66:123-134.
28. Tobler A, Kapan D, Flanagan NS, Gonzalez C, Peterson E, Jiggins CD,Johntson JS, Heckel DG, McMillan WO: First-generation linkagemap of the warningly colored butterfly Heliconius erato.Heredity 2005, 94:408-417.
29. Cox LA, Mahaney MC, Vandeberg JL, Rogers J: A second-genera-tion genetic linkage map of the baboon (Papio hamadryas)genome. Genomics 2006, 88:274-281.
30. de Gortari MJ, Freking BA, Cuthbertson RP, Kappes SM, Keele JW,Stone RT, Leymaster KA, Dodds KG, Crawford AM, Beattie CW: Asecond-generation linkage map of the sheep genome. MammGenome 1998, 9:204-209.
31. Guerin G, Bailey E, Bernoco D, Anderson I, Antczak DF, Bell K, BirosI, Bjornstad G, Bowling AT, Brandon R, et al.: The second genera-tion of the International Equine Gene Mapping Workshophalf-sibling linkage map. Anim Genet 2003, 34:161-168.
32. Joobeur T, Periam N, de Vicente MC, King GJ, Arus P: Develop-ment of a second generation linkage map for almond usingRAPD and SSR markers. Genome 2000, 43:649-655.
33. Kappes SM, Keele JW, Stone RT, McGraw RA, Sonstegard TS, SmithTP, Lopez-Corrales NL, Beattie CW: A second-generation link-age map of the bovine genome. Genome Res 1997, 7:235-249.
34. Lee BY, Lee WJ, Streelman JT, Carleton KL, Howe AE, Hulata G, Slet-tan A, Stern JE, Terai Y, Kocher TD: A second-generation geneticlinkage map of tilapia (Oreochromis spp.). Genetics 2005,170:237-244.
35. Matise TC, Chen F, Chen W, De La Vega FM, Hansen M, He C,Hyland FC, Kennedy GC, Kong X, Murray SS, et al.: A second-gen-eration combined linkage physical map of the humangenome. Genome Res 2007, 17:1783-1786.
36. Neff MW, Broman KW, Mellersh CS, Ray K, Acland GM, Aguirre GD,Ziegle JS, Ostrander EA, Rine J: A second-generation geneticlinkage map of the domestic dog, Canis familiaris. Genetics1999, 151(2):803-820.
37. Paglia GP, Olivieri AM, Morgante M: Towards second-generationSTS (sequence-tagged sites) linkage maps in conifers: agenetic map of Norway spruce (Picea abies K.). Mol Gen Genet1998, 258:466-478.
38. Weissenbach J: A second generation linkage map of the humangenome based on highly informative microsatellite loci. Gene1993, 135:275-278.
39. Altshuler D, Pollara VJ, Cowles CR, Van Etten WJ, Baldwin J, LintonL, Lander ES: An SNP map of the human genome generatedby reduced representation shotgun sequencing. Nature 2000,407:513-516.
40. Frazer KA, Ballinger DG, Cox DR, Hinds DA, Stuve LL, Gibbs RA,Belmont JW, Boudreau A, Hardenbol P, Leal SM, et al.: A secondgeneration human haplotype map of over 3.1 million SNPs.Nature 2007, 449:851-861.
41. Frazer KA, Eskin E, Kang HM, Bogue MA, Hinds DA, Beilharz EJ,Gupta RV, Montgomery J, Morenzoni MM, Nilsen GB, et al.: Asequence-based variation map of 8.27 million SNPs in inbredmouse strains. Nature 2007, 448:1050-1053.
42. Botstein D, White RL, Skolnick M, Davis RW: Construction of agenetic linkage map in man using restriction fragmentlength polymorphisms. Am J Hum Genet 1980, 32(3):314-331.
43. Thorgaard GH, Bailey GS, Williams D, Buhler DR, Kaattari SL, RistowSS, Hansen JD, Winton JR, Bartholomew JL, Nagler JJ, et al.: Statusand opportunities for genomics research with rainbow trout.Comp Biochem Physiol B Biochem Mol Biol 2002, 133:609-646.
44. Ohno S, Atkin NB: Comparative DNA values and chromosomecomplements of eight species of fishes. Chromosoma 1966,18:455-466.
45. Allendorf FW, Thorgaard GH: Tetraploidy and the evolution ofsalmonid fishes. In Evolutionary Genetics of Fishes Edited by: TurnerBJ. New York: Plenum Press; 1984:1-46.
46. Palti Y, Gahr SA, Hansen JD, Rexroad CE 3rd: Characterization ofa new BAC library for rainbow trout: evidence for multi-locus duplication. Anim Genet 2004, 35:130-133.
47. Leder EH, Danzmann RG, Ferguson MM: The candidate gene,Clock, localizes to a strong spawning time quantitative traitlocus region in rainbow trout. J Hered 2006, 97:74-80.
48. Martinez V, Thorgaard G, Robison B, Sillanpaa MJ: An applicationof Bayesian QTL mapping to early development in doublehaploid lines of rainbow trout including environmentaleffects. Genet Res 2005, 86:209-221.
49. Nichols KM, Broman KW, Sundin K, Young JM, Wheeler PA, Thor-gaard GH: Quantitative trait loci × maternal cytoplasmic envi-ronment interaction for development rate in Oncorhynchusmykiss. Genetics 2007, 175:335-347.
50. O'Malley KG, Sakamoto T, Danzmann RG, Ferguson MM: Quantita-tive trait loci for spawning date and body weight in rainbowtrout: testing for conserved effects across ancestrally dupli-cated chromosomes. J Hered 2003, 94:273-284.
51. Perry GM, Danzmann RG, Ferguson MM, Gibson JP: Quantitativetrait loci for upper thermal tolerance in outbred strains ofrainbow trout (Oncorhynchus mykiss). Heredity 2001,86:333-341.
52. Perry GM, Ferguson MM, Sakamoto T, Danzmann RG: Sex-linkedquantitative trait loci for thermotolerance and length in therainbow trout. J Hered 2005, 96:97-107.
53. Robison BD, Wheeler PA, Sundin K, Sikka P, Thorgaard GH: Com-posite interval mapping reveals a major locus influencingembryonic development rate in rainbow trout (Oncorhyn-chus mykiss). J Hered 2001, 92:16-22.
54. Zimmerman AM, Evenhuis JP, Thorgaard GH, Ristow SS: A singlemajor chromosomal region controls natural killer cell-likeactivity in rainbow trout. Immunogenetics 2004, 55:825-835.
55. Ozaki A, Sakamoto T, Khoo S, Nakamura K, Coimbra MR, Akutsu T,Okamoto N: Quantitative trait loci (QTLs) associated withresistance/susceptibility to infectious pancreatic necrosisvirus (IPNV) in rainbow trout (Oncorhynchus mykiss). MolGenet Genomics 2001, 265:23-31.
56. Nakamura K, Ozaki A, Akutsu T, Iwai K, Sakamoto T, Yoshizaki G,Okamoto N: Genetic mapping of the dominant albino locus inrainbow trout (Oncorhynchus mykiss). Mol Genet Genomics2001, 265:687-693.
57. Young WP, Wheeler PA, Coryell VH, Keim P, Thorgaard GH: Adetailed linkage map of rainbow trout produced using dou-bled haploids. Genetics 1998, 148(2):839-850.
58. Nichols KM, Young WP, Danzmann RG, Robison BD, Rexroad CE3rd, Noakes M, Phillips RB, Bentzen P, Spies I, Knudsen K, et al.: Aconsolidated linkage map for rainbow trout (Oncorhynchusmykiss). Anim Genet 2003, 34:102-115.
59. Guyomard R, Mauger S, Tabet-Canale K, Martineau S, Genet C, KriegF, Quillet E: A type I and type II microsatellite linkage map ofrainbow trout (Oncorhynchus mykiss) with presumptivecoverage of all chromosome arms. BMC Genomics 2006, 7:302.
60. Phillips RB, Nichols KM, DeKoning JJ, Morasch MR, Keatley KA,Rexroad C 3rd, Gahr SA, Danzmann RG, Drew RE, Thorgaard GH:Assignment of rainbow trout linkage groups to specific chro-mosomes. Genetics 2006, 174:1661-1670.
61. Nichols KM, Young WP, Danzmann RG, Robison BD, Rexroad C,Noakes M, Phillips RB, Bentzen P, Spies I, Knudsen K, et al.: A con-solidated linkage map for rainbow trout (Oncorhynchusmykiss). Anim Genet 2003, 34:102-115.
62. Danzmann RG, Cairney M, Davidson WS, Ferguson MM, Gharbi K,Guyomard R, Holm LE, Leder E, Okamoto N, Ozaki A, et al.: A com-parative analysis of the rainbow trout genome with 2 otherspecies of fish (Arctic charr and Atlantic salmon) within thetetraploid derivative Salmonidae family (subfamily: Salmon-inae). Genome 2005, 48:1037-1051.
63. Liu ZJ, Cordes JF: DNA marker technologies and their applica-tions in aquaculture genetics. Aquaculture 2004, 238:1-37.
64. Womack JE, Kata SR: Bovine genome mapping: evolutionaryinference and the power of comparative genomics. Curr OpinGenet Dev 1995, 5:725-733.
65. Collins FS: Positional cloning moves from perditional to tradi-tional. Nat Genet 1995, 9:347-350.
66. Chistiakov DA, Hellemans B, Volckaert FAM: Microsatellites andtheir genomic distribution, evolution, function and applica-
Page 13 of 14(page number not for citation purposes)
BMC Genetics 2008, 9:74 http://www.biomedcentral.com/1471-2156/9/74
Publish with BioMed Central and every scientist can read your work free of charge
"BioMed Central will be the most significant development for disseminating the results of biomedical research in our lifetime."
Sir Paul Nurse, Cancer Research UK
Your research papers will be:
available free of charge to the entire biomedical community
peer reviewed and published immediately upon acceptance
cited in PubMed and archived on PubMed Central
yours — you keep the copyright
Submit your manuscript here:http://www.biomedcentral.com/info/publishing_adv.asp
BioMedcentral
tions: A review with special reference to fish genetics. Aqua-culture 2006, 255:1-29.
67. Holm LE: Omy0002DIAS: a highly polymorphic dinucleotidemicrosatellite in rainbow trout (Oncorhynchus mykiss). AnimGenet 1998, 29(6):465.
68. Ozaki A, Khoo SK, Sakamoto T, Okamoto N: Two highly polymor-phic dinucleotide microsatellites in rainbow trout (Onco-rhynchus mykiss): OmyRGT7TUF and OmyRGT8TUF. AnimGenet 1999, 30:393-394.
69. Khoo SK, Ozaki A, Sakamoto T, Okamoto N: Rapid communica-tion: two highly polymorphic dinucleotide microsatellites inrainbow trout (Oncorhynchus mykiss): OmyRGT18TUF andOmyRGT23TUF. J Anim Sci 2000, 78(2):490-491.
70. Khoo SK, Ozaki A, Sakamoto T, Okamoto N: Four highly poly-morphic dinucleotide microsatellites in rainbow trout(Oncorhynchus mykiss). Anim Genet 2000, 31:73-74.
71. Rexroad CE 3rd, Coleman RL, Martin AM, Hershberger WK, KilleferJ: Thirty-five polymorphic microsatellite markers for rain-bow trout (Oncorhynchus mykiss). Anim Genet 2001,32:317-319.
72. Palti Y, Fincham MR, Rexroad CE 3rd: Characterization of 38 pol-ymorphic microsatellite markers for rainbow trout (Onco-rhynchus mykiss). Molecular Ecology Notes 2002, 2:449-452.
73. Rexroad CE 3rd, Coleman RL, Gustafson AL, Hershberger WK,Killefer J: Development of rainbow trout microsatellite mark-ers from repeat enriched libraries. Mar Biotechnol (NY) 2002,4:12-16.
74. Rexroad CE 3rd, Coleman RL, Hershberger WK, Killefer J: Rapidcommunication: Thirty-eight polymorphic microsatellitemarkers for mapping in rainbow trout. J Anim Sci 2002,80(2):541-542.
75. Rexroad CE, Coleman RL, Hershberger WK, Killefer J: Eighteenpolymorphic microsatellite markers for rainbow trout(Oncorhynchus mykiss). Anim Genet 2002, 33:76-78.
76. Ozaki A, Khoo SK, Sakamoto T, Okamoto N: Thirty-one polymor-phic microsatellite markers for genetic mapping in rainbowtrout (Oncorhynchus mykiss). Anim Genet 2003, 34:315-317.
77. Palti Y, Danzmann RG, Rexroad CE 3rd: Characterization andmapping of 19 polymorphic microsatellite markers for rain-bow trout (Oncorhynchus mykiss). Anim Genet 2003,34:153-156.
78. Rexroad CE 3rd, Palti Y: Development of Ninety-Seven Poly-morphic Microsatellite Markers for rainbow trout (Onco-rhynchus mykiss). Transactions of the American Fisheries Society2003, 132:1214-1221.
79. Rodriguez FM, Rexroad CE 3rd, Palti Y: Characterization oftwenty-four microsatellite markers for rainbow trout(Oncorhynchus mykiss). Molecular Ecology Notes 2003, 3:619-622.
80. Coulibaly I, Gharbi K, Danzmann RG, Yao J, Rexroad CE 3rd: Char-acterization and comparison of microsatellites derived fromrepeat-enriched libraries and expressed sequence tags. AnimGenet 2005, 36:309-315.
81. Gilbey J, Verspoor E, McLay A, Houlihan D: A microsatellite link-age map for Atlantic salmon (Salmo salar). Anim Genet 2004,35:98-105.
82. Gharbi K, Gautier A, Danzmann RG, Gharbi S, Sakamoto T, HoyheimB, Taggart JB, Cairney M, Powell R, Krieg F, et al.: A linkage map forbrown trout (Salmo trutta): chromosome homeologies andcomparative genome organization with other salmonid fish.Genetics 2006, 172:2405-2419.
83. Moen T, Hoyheim B, Munck H, Gomez-Raya L: A linkage map ofAtlantic salmon (Salmo salar) reveals an uncommonly largedifference in recombination rate between the sexes. AnimGenet 2004, 35:81-92.
84. Rodriguez MF, Gahr SA, Rexroad CE 3rd, Palti Y: Rapid microsat-ellite detection from rainbow trout (Oncorhynchus mykiss)bacterial artificial chromosome using PCR screeningmethod. Marine Biotechnology 2006, 8:346-350.
85. Rexroad CE 3rd, Rodriguez MF, Coulibaly I, Gharbi K, Danzmann RG,Dekoning J, Phillips R, Palti Y: Comparative mapping ofexpressed sequence tags containing microsatellites in rain-bow trout (Oncorhynchus mykiss). BMC Genomics 2005, 6:54.
86. Davisson MT, Wright JE, Atherton LM: Cytogenetic Analysis ofPseudolinkage of Ldh Loci in the Teleost Genus Salvelinus.Genetics 1973, 73(4):645-658.
87. Voorrips RE: MapChart: software for the graphical presenta-tion of linkage maps and QTLs. J Hered 2002, 93:77-78.
88. Rainbow Trout Unigene [http://www.ncbi.nlm.nih.gov/UniGene/UGOrg.cgi?TAXID=8022]
89. Rainbow Trout Gene Index. .90. Young WP, Wheeler PA, Fields RD, Thorgaard GH: DNA finger-
printing confirms isogenicity of androgenetically derivedrainbow trout lines. J Hered 1996, 87(1):77-80.
91. Phillips RB, Nichols KM, DeKoning JJ, Morash MR, Keatley KA,Rexroad CE 3rd, Danzmann RG, Drew RE, Thorgaard GH: Assign-ment of Rainbow Trout Linkage Groups to Specific Chromo-somes. Genetics 2006, 174:1661-1670.
92. Silverstein JT, King T, Rexroad CE 3rd: Genetic Variation Meas-ured by Microsatellites Among Three Strains of Domesti-cated Rainbow Trout. Aquaculture Research 2004, 35:40-48.
93. Sambrook J, Russell D: Molecular cloning : a laboratory manual 3rd edi-tion. Cold Spring Harbor, N.Y.: Cold Spring Harbor Laboratory Press;2001.
94. Coulibaly I, Danzmann RG, Palti Y, Vallejo R, Gahr SA, Yao J, RexroadCE: Mapping of genes in a region associated with upper tem-perature tolerance in rainbow trout. Anim Genet 2006,37:598-599.
95. Palti Y, Rodriguez MF, Vallejo R, III CER: Mapping of toll-likereceptor (TLR) genes in rainbow trout. Animal Genetics 2006,37:597-598.
96. Johnson N, Vallejo R, Silverstein J, Welch T, Wiens G, Hallerman E,Palti Y: Suggestive association of major histocompatibility IBgenetic markers with resistance to bacterial cold water dis-ease in rainbow trout (Oncorhynchus mykiss). Mar Biotechnol(NY) 2008, 10(4):429-437.
97. Boutin-Ganache I, Raposo M, Raymond M, Deschepper CF: M13-tailed primers improve the readability and usability of mic-rosatellite analyses performed with two different allele-siz-ing methods. Biotechniques 2001, 31(1):24-26, 28.
98. Lathrop GM, Lalouel JM, Julier C, Ott J: Strategies for multilocuslinkage analysis in humans. Proc Natl Acad Sci USA 1984,81:3443-3446.
99. O'Connell JR, Weeks DE: PedCheck: a program for identifica-tion of genotype incompatibilities in linkage analysis. Am JHum Genet 1998, 63:259-266.
100. Weeks DE: RECODE. 1995.101. Kashuk C, Chakravarti A, Matise T: Documentation for LNK-
TOCRI++. 1997.102. Lander ES, Green P: Construction of multilocus genetic linkage
maps in humans. Proc Natl Acad Sci USA 1987, 84:2363-2367.103. Matise TC, Perlin M, Chakravarti A: Automated construction of
genetic linkage maps using an expert system (MultiMap): ahuman genome linkage map. Nat Genet 1994, 6:384-390.
104. Altschul SF, Gish W, Miller W, Myers EW, Lipman DJ: Basic localalignment search tool. J Mol Biol 1990, 215:403-410.
Page 14 of 14(page number not for citation purposes)
Copyright © 2022 FDOKUMEN