Hepatic gene expression profiles in juvenile rainbow trout ( Oncorhynchus mykiss) fed fishmeal or...
15
Hepatic gene expression profiles in juvenile rainbow trout (Oncorhynchus mykiss) fed fishmeal or fish oil-free diets Ste ´phane Panserat 1 *, Cathy Kolditz 1 , Nade `ge Richard 1 , Elisabeth Plagnes-Juan 1 , Francois Piumi 2 , Diane Esquerre ´ 2,3 , Francoise Me ´dale 1 , Genevieve Corraze 1 and Sadavisam Kaushik 1 1 INRA, UMR1067 Nutrition Aquaculture and Genomics, Po ˆle d’Hydrobiologie, CD 918, F-64310 Saint-Pe ´e-sur-Nivelle, France 2 INRA, DGA, UMR 314, Laboratoire de Radiobiologie et d’Etude du Ge ´nome, CRB GADIE, F-78350 Jouy-en-Josas, France 3 CEA, DSV, IRCM, SREIT, Laboratoire de Radiobiologie et d’Etude du Ge ´nome, F-78352 Jouy-en-Josas, France (Received 30 November 2007 – Revised 25 February 2008 – Accepted 25 February 2008 – First published online 28 April 2008) Reducing the reliance on fishery by-products as amino acid and fatty acid sources in feeds for farmed fish is a major objective today. We evaluated the effect of dietary fish oil or dietary fishmeal replacement by vegetable oils and plant proteins respectively through analysis of hepatic transcri- ptomes in rainbow trout (Oncorhynchus mykiss). Fish were fed right from first feeding with diets based on plant by-products before being killed. We analysed the hepatic gene profile using trout cDNA microarrays (9K). Our data showed that seventy-one and seventy-five genes were affected after fish oil and fishmeal replacement respectively. The major part of modified gene expression coding for proteins of the metabolic pathways was as follows: (i) a lower level of expression for genes of energy metabolism found in fish after fishmeal and fish oil replacement; (ii) a lower level of gene expression for fatty acid metabolism (biosynthesis) in fish fed with vegetable oils; (iii) a differential expression of actors of detoxification metabolism in trout fed with vegetable oils; (iv) a lower level of expression of genes involved in protein metabolism in fish fed with plant proteins. Overall, our data suggest that dietary fish oil replacement is linked to a decreased capacity of fatty acid biosynthesis (fatty acid synthase) and variation of detoxification metabolism (cytochrome P450s) whereas dietary fishmeal replacement may depress protein metabolism in the liver as reflected by glutamine synthetase. Fish nutrition: Plant products: Fish oil: Fishmeal: Liver: Transcriptomics: Rainbow trout Feed for intensively farmed fish still relies heavily on feed- stuffs of marine origin, fishmeal and fish oil. This impairs the sustainability of fish production, while aquaculture should be a solution to the generally observed decline in fish- ery resources (1) . Research is intense for finding ways to replace marine feedstuffs (fishmeal and fish oil) by plant feed- stuffs (2) . In the past 20 years, fish feeds have included large amounts of fish oil, given the beneficial effects on N utilisation and environmental load (3,4) . Partial and total replacement of fishmeal by vegetable protein sources is similarly the object of several studies in almost all species (2,5) . Efforts towards replacement of fishmeal by other alterna- tive protein sources have been undertaken for more than two decades and there is a vast amount of literature on partial replacement of fishmeal by plant feedstuffs (6) . A number of disadvantages have been ascribed to the use of plant protein sources: relatively low protein content, amino acid imbal- ance, low palatability, presence of endogenous anti-nutri- tional factors and large amounts of carbohydrates (2,7,8) . Attempts have been made to develop fishmeal-free diets for different species including salmonids either with single ingre- dients duly supplemented with amino acids (9) or using a mixture of different protein sources (10 – 13) . It is clear that a substantial reduction in the dietary levels of fishmeal can be achieved although total replacement of fishmeal by plant ingredients is still not common in salmonids. Some earlier studies have shown that total replacement of fishmeal by plant proteins leads to decreased growth of rainbow trout possibly linked to a modification of a number of hepatic metabolic pathways (14) . Several studies with salmonids (rainbow trout, brown trout, Atlantic salmon, Pacific salmons) have shown that it is possible to replace fish oil by a single vegetable oil or mixture of vegetable oils without affecting growth or feed efficiencies (4,15) . Since the flesh fatty acid composition is known to be affected by the dietary fatty acid profiles, it is also known that once the fish are grown with vegetable oils over the major part of the life cycle, a finishing diet based on fish oil as the major lipid source can be used to tailor the final flesh fatty acid composition with the levels of n-3 PUFA (EPA and DHA) ideally suited for human nutrition and health (15 – 17) . The metabolic consequences are also numerous, mediated by a number of interacting pathways. * Corresponding author: Dr Stephane Panserat, fax þ33 5 59 54 51 52, email [email protected] Abbreviations: FAS, fatty acid synthase; INRA, French National Institute for Agricultural Research; REST, Relative Expression Software tool; TMEV, TIGR Multiple Experiment Viewer. British Journal of Nutrition (2008), 100, 953–967 doi:10.1017/S0007114508981411 q The Authors 2008 British Journal of Nutrition
-
Upload
independent -
Category
Documents
-
view
1 -
download
0
Transcript of Hepatic gene expression profiles in juvenile rainbow trout ( Oncorhynchus mykiss) fed fishmeal or...

Hepatic gene expression profiles in juvenile rainbow trout
(Oncorhynchus mykiss) fed fishmeal or fish oil-free diets
Stephane Panserat1*, Cathy Kolditz1, Nadege Richard1, Elisabeth Plagnes-Juan1, Francois Piumi2,
Diane Esquerre2,3, Francoise Medale1, Genevieve Corraze1 and Sadavisam Kaushik1
1INRA, UMR1067 Nutrition Aquaculture and Genomics, Pole d’Hydrobiologie, CD 918, F-64310 Saint-Pee-sur-Nivelle, France2INRA, DGA, UMR 314, Laboratoire de Radiobiologie et d’Etude du Genome, CRB GADIE, F-78350 Jouy-en-Josas, France3CEA, DSV, IRCM, SREIT, Laboratoire de Radiobiologie et d’Etude du Genome, F-78352 Jouy-en-Josas, France
(Received 30 November 2007 – Revised 25 February 2008 – Accepted 25 February 2008 – First published online 28 April 2008)
Reducing the reliance on fishery by-products as amino acid and fatty acid sources in feeds for farmed fish is a major objective today. We evaluated
the effect of dietary fish oil or dietary fishmeal replacement by vegetable oils and plant proteins respectively through analysis of hepatic transcri-
ptomes in rainbow trout (Oncorhynchus mykiss). Fish were fed right from first feeding with diets based on plant by-products before being killed.
We analysed the hepatic gene profile using trout cDNA microarrays (9K). Our data showed that seventy-one and seventy-five genes were affected
after fish oil and fishmeal replacement respectively. The major part of modified gene expression coding for proteins of the metabolic pathways was
as follows: (i) a lower level of expression for genes of energy metabolism found in fish after fishmeal and fish oil replacement; (ii) a lower level of
gene expression for fatty acid metabolism (biosynthesis) in fish fed with vegetable oils; (iii) a differential expression of actors of detoxification
metabolism in trout fed with vegetable oils; (iv) a lower level of expression of genes involved in protein metabolism in fish fed with plant proteins.
Overall, our data suggest that dietary fish oil replacement is linked to a decreased capacity of fatty acid biosynthesis (fatty acid synthase) and
variation of detoxification metabolism (cytochrome P450s) whereas dietary fishmeal replacement may depress protein metabolism in the liver
as reflected by glutamine synthetase.
Fish nutrition: Plant products: Fish oil: Fishmeal: Liver: Transcriptomics: Rainbow trout
Feed for intensively farmed fish still relies heavily on feed-stuffs of marine origin, fishmeal and fish oil. This impairsthe sustainability of fish production, while aquacultureshould be a solution to the generally observed decline in fish-ery resources(1). Research is intense for finding ways toreplace marine feedstuffs (fishmeal and fish oil) by plant feed-stuffs(2). In the past 20 years, fish feeds have included largeamounts of fish oil, given the beneficial effects on N utilisationand environmental load(3,4). Partial and total replacement offishmeal by vegetable protein sources is similarly the objectof several studies in almost all species(2,5).
Efforts towards replacement of fishmeal by other alterna-tive protein sources have been undertaken for more thantwo decades and there is a vast amount of literature on partialreplacement of fishmeal by plant feedstuffs(6). A number ofdisadvantages have been ascribed to the use of plant proteinsources: relatively low protein content, amino acid imbal-ance, low palatability, presence of endogenous anti-nutri-tional factors and large amounts of carbohydrates(2,7,8).Attempts have been made to develop fishmeal-free diets fordifferent species including salmonids either with single ingre-dients duly supplemented with amino acids(9) or using a
mixture of different protein sources(10 – 13). It is clear that asubstantial reduction in the dietary levels of fishmeal canbe achieved although total replacement of fishmeal by plantingredients is still not common in salmonids. Some earlierstudies have shown that total replacement of fishmeal byplant proteins leads to decreased growth of rainbow troutpossibly linked to a modification of a number of hepaticmetabolic pathways(14).
Several studies with salmonids (rainbow trout, browntrout, Atlantic salmon, Pacific salmons) have shown thatit is possible to replace fish oil by a single vegetable oilor mixture of vegetable oils without affecting growth orfeed efficiencies(4,15). Since the flesh fatty acid compositionis known to be affected by the dietary fatty acid profiles,it is also known that once the fish are grown with vegetableoils over the major part of the life cycle, a finishing dietbased on fish oil as the major lipid source can be used totailor the final flesh fatty acid composition with the levelsof n-3 PUFA (EPA and DHA) ideally suited for humannutrition and health(15 – 17). The metabolic consequencesare also numerous, mediated by a number of interactingpathways.
*Corresponding author: Dr Stephane Panserat, fax þ33 5 59 54 51 52, email [email protected]
Abbreviations: FAS, fatty acid synthase; INRA, French National Institute for Agricultural Research; REST, Relative Expression Software tool; TMEV, TIGR
Multiple Experiment Viewer.
British Journal of Nutrition (2008), 100, 953–967 doi:10.1017/S0007114508981411q The Authors 2008
British
Journal
ofNutrition

The objective of the present study was to analyse the hepa-tic gene expression profile in rainbow trout (Oncorhynchusmykiss) fed over a long period diets with or withouteither fish oil or fishmeal, replaced respectively by amixture of plant oils or plant proteins. We analysed speci-fically the liver since this is the main organ involvedin nutrient utilisation as the centre of intermediary meta-bolism in animals. After transcriptomic analysis, differentiallyexpressed genes were identified and some were specificallystudied in rainbow trout liver following the plant-based dietintake.
Experimental methods
Feeds, fish rearing and sampling
Triploid rainbow trout were reared in the French NationalInstitute for Agricultural Research (INRA) experimental fishfarm at constant water temperature (17 ^ 18C) and undernatural photoperiod conditions (Donzacq, Landes, France).To test the effect of fish oil replacement, fish were fedfrom first feeding to commercial size during 62 weeks withtwo isoproteic (51 % crude protein), isolipidic (30 % crudefat) and isoenergetic (26 kJ/g) diets, differing only by thelipid source, i.e. either fish oil or a mixture of vegetable oils(30 % palm, 15 % linseed, 55 % rapeseed) as previouslydescribed(18) (Table 1).
To test the effect of fishmeal replacement, fish were fedfrom first feeding to commercial size during 52 weeks withtwo isonitrogenous, isolipidic and isoenergetic diets, differingonly by the protein source, i.e. either fishmeal or a mixture ofplant proteins (Table 2). These diets were produced by feedmanufacturers (Nutreco, Stavanger, Norway and Le GouessantAquaculture, Lamballe, France, respectively).
Fish were randomly distributed into triplicate tanks per die-tary treatment. Each diet was distributed by hand to visualsatiation 6 d over 7 d and feed consumption was recordedevery week. At the end of the growth trial, six fish fromeach group (two per tank) were randomly sampled 24 h afterthe last meal in order to have data following the long-termplant-diet adaptation. Fish were killed by a sharp blow tothe head. Livers were weighed and immediately frozen inliquid N2 and kept at 2808C pending analyses.
Chemical composition of the diets
The experimental diets were analysed using the followingprocedures. DM was determined after drying at 1058C for24 h. Gross energy was determined using an adiabatic bombcalorimeter (IKA; Heitersheim Gribheimer, Germany).Protein content (N £ 6·25) was determined by the Kjeldahlmethod after acid digestion. Total lipid content was deter-mined by the method of Folch et al. (19), after extraction bydichloromethane rather than chloroform. Fatty acid compo-sition of the diets (and the whole body of fish fed withor without fish oil) was determined in the total lipidextract after acid-catalysed transmethylation as previouslydescribed(18). Amino acid composition was determined afteracid hydrolysis: amino acids were separated by ion-exchangechromatography using pH gradient elution followed by
post-column derivatisation ninhydrin according to themethod of Moore & Stein(20).
cDNA microarrays
Nylon microarrays were obtained from INRA-GADIE biolo-gical resources centre (Jouy-en-Josas, France; http://www-crb.jouy.inra.fr/). A total of 9023 rainbow trout cDNA originatingfrom a pooled-tissue library(21) plus 193 controls were spottedafter PCR amplification. PCR products were spotted ontoHybond N þ membranes as described by Nguyen et al. (22).Positive (plant luciferase cDNA depot) and negative (waterdepot) controls were also spotted on each microarray.
Hybridisation, scanning and quantification of microarrays
Total RNA were extracted from rainbow trout liver usingTRIzolw reagent (Invitrogen, Carlsbad, CA, USA). Fourhepatic RNA samples corresponding to four individuals per
Table 1. Composition of the diets used in the fish oil replacementstudies*
FO diet VO diet
Ingredients (g/kg feed)Fishmeal (Scandinavian LT-fish meal;
Norsildmel, Norway)466·9 466·9
Maize gluten meal (Cargill, Staley, NC, USA) 135·2 135·2Soyabean meal (Denofa, Fredrikstad, Norway) 100·0 100·0Whole wheat (Statkorn, Oslo, Norway) 46·1 46·1Capelin oil (Nordsildmel, Norway) 226·8 –Rapeseed oil (Oelmuhle, Hamburg, Germany) – 124·7Palm oil (Denofa, Fredrikstad, Norway) – 68·1Linseed oil (Oliefabriek, Lictervelde, Belgium) – 34·0Vitamin and mineral premixes† 25·0 25·0
Analytical compositionDM (%) 92·2 92·5CP (% DM) 50·9 51·3Crude fat (% DM) 29·7 29·5Gross energy (kJ/g DM) 26·4 26·1
Fatty acid composition (g/100 g total fatty acids)14 : 0 9·9 2·016 : 0 13·4 19·518 : 0 1·5 2·7Total saturates 26·0 25·416 : 1 10·0 1·618 : 1 14·4 39·920 : 1 16·6 2·022 : 1 10·9 1·6Total monounsaturates 52·5 45·218 : 2n-6 3·6 13·720 : 2n-6 0·2 0·0620 : 4n-6 0·2 0·06Total n-6 PUFA 6·5 14·418 : 3n-3 0·8 10·018 : 4n-3 2·3 0·720 : 4n-3 0·3 0·120 : 5n-3 4·5 1·522 : 5n-3 0·3 0·122 : 6n-3 3·9 1·6Total n-3 PUFA 12·2 14·0
FO diet, fish oil diet; VO, vegetable oil diet; CP, crude protein.* For further details, see Richard et al. (18). Diets were produced at Nutreco
Technology Centre, Norway as extruded pellets.† Mineral and vitamin premix according to National Research Council
recommendations.
S. Panserat et al.954
British
Journal
ofNutrition

dietary group were used for microarray hybridisation at INRAUMR1067 transcriptomic facility (St-Pee-sur-Nivelle, France)according to the following procedure. RNA quality was deter-mined using an Agilent bioanalyser. A first hybridisation wasperformed at 428C for 48 h using g33P-labelled T7 promoteroligonucleotide (50-CACTATAGGGAATTTGGCC-30) to esti-mate the amount of cDNA in each spot. After stripping (3 h at688C, 0.1X SSC, 0·2 % SDS), hybridisations with hepaticcDNA were performed. Microarrays were prehybridised for1 h at 658C in hybridisation buffer (5X Denhardt, 5X SSC,0·5 % SDS). Labelled cDNA were prepared from 5mg RNAby simultaneous reverse transcription and labelling for 1 h at428C in the presence of 1·85 MBq (50mCi) [a- 33P] dCTP,5mM-cold dCTP and 800mM each of dATP, dGTP anddTTP and 200 units SuperScripte III RT (Invitrogen) in30ml final volume. A positive control corresponding to theluciferase mRNA (20 ng) (Promega, Madison, WI, USA)was simultaneously prepared. RNA was degraded by treat-ment at 688C for 30 min with 10 % SDS (1ml), 0·5 M-EDTA(1ml) and 3 M-NaOH (3ml) and then equilibrated at roomtemperature for 15 min. Neutralisation was done by adding1 M-2-amino-2-hydroxymethyl-propane-1,3-diol-HCl (10ml)and 2 M-HCl (3ml). Microarrays were then incubated withthe corresponding denatured labelled cDNA for 48 h at 658Cin hybridisation solution. After three washes (1 h at 688Cwith 0.1X SSC, 0·2 % SDS), microarrays were exposed for
65 h to phosphor-imaging plates that were scanned using aFuji BAS-5000 (Fuji, Tokyo, Japan). Signal intensities werequantified using AGScan software (bioinformatic platformSigenae; INRA; http://www.sigenae.org/)(23,24).
Microarray data analysis
Data microarrays were deposited in BioArray SoftwareEnvironment (BASE) database(25), a ‘minimum informationabout a microarray experiment’ (MIAME) supportive custo-misable database available at the bioinformatic platformSigenae. Signal processing was performed using vector oligo-nucleotide data to correct the relative amount of DNA pre-sent in each spot. At this step, low nucleotide signals (lessthan three times the background level) were excluded fromthe analysis. After correction, the signal was normalised bydividing each gene expression by the median value of thearray before log transformation. Data were subsequently ana-lysed using statistical TIGR Multiple Experiment Viewersoftware (TMEV; The Institute for Genomic Research,J. Craig Venter Institute, Rockville, MD, USA), which is asuite of microarray data analysis applications. Variation ofgene expressions between two dietary treatments wastermed significant when the P value was ,0·01 using thetwo-sample t test for microarrays(26) and followed by super-vised hierarchical clustering for significant genes only.Organisation of genes for biological interpretation in thecontext of gene ontology was performed using GoMiner soft-ware (Genomics and Bioinformatics Group, National Insti-tutes of Health, Bethesda, MD, USA; http://discover.nci.nih.gov/gominer/)(27).
Data mining
Rainbow trout sequences originating from INRA Agenae(21)
and the US Department of Agriculture(28) and expressedsequence tag (EST) sequencing programs were used to gene-rate publicly available contigs (http://public-contigbrowser.sigenae.org:9090/index.html). The 4th version (om.4) wasused for BlastX (version 4 (om.4); Basic Local AlignmentSearch Tool; http://www.ncbi.nlm.nih.gov/blast/) comparison.The score of each alignment was retrieved after performing aBlastX comparison.
Real-time RT-PCR
Gene expression levels were determined by real-time RT-PCRusing six RNA including those used for microarray analysis.Total RNA (1mg) was reverse transcribed to cDNA with theSuperscripte III RNAse H RT kit (Invitrogen, Carlsbad, CA,USA) using oligo dT primers. Real-time PCR was performed inthe iCycler iQe (Bio-Rad, Hercules, CA, USA). QuantitativePCR analyses for gene expressions were performed on 10mlof the RT reaction mixture using the iQe SYBRw GreenSupermix (Bio-Rad). The total volume of the PCR reactionwas 25ml containing 200 nM of each primer. Primers weredesigned so that they were overlapping an intron when itwas possible (Primer3 software; http://biotools.umassmed.edu/bioapps/primer3_www.cgi) using known sequences in nucleotidedatabases (Table 3).
Table 2. Composition of the diets used in the fishmeal replacementstudies*
FM diet PP diet
Ingredients (g/kg feed)Fishmeal (LT 94, Norway, CP 70 %) 472·20 –White lupin (Cana, France, CP 41 %) – 100·00Maize gluten meal (CP 60 %) – 150·00Wheat gluten (CP 81 %) – 250·40Extruded whole wheat 361·00 94·00Dehulled peas (Aquatex, France, CP 22 %) – 25·00Soyabean meal (CP 46 %) – 120·00L-Lysine (liquid form, Eurolysine, France) – 17·20Calcium monophosphate – 35·70Fish oil (Feedoil, Sopropeche, France) 159·50 200·50Astaxanthin (Carophyll pink, DSM, France) 0·25 0·25Vitamin and mineral premix (INRA, France)† 6·55 6·55Betaine HCl 0·50 0·50
Analytical compositionDM(%) 94·4 95·9CP (% DM) 39·1 41·9Crude fat (% DM) 26·5 28·4Gross energy (kJ/g DM) 22·8 24·5
Amino acid composition (g/16 g N)Arginine 7·1 5·4Histidine 2·6 2·3Isoleucine 3·8 4·1Leucine 7·3 9·1Lysine 6·9 5·3Methionine þ cystine 3·8 3·7Phenylalanine þ tyrosine 7·3 8·6Threonine 4·0 3·4Tryptophan 1·1 0·9Valine 4·7 4·5
FM diet, fishmeal diet; PP diet, plant-protein diet; CP, crude protein.* Diets were produced at Le Gouessant Aquaculture, France as extruded pellets.† Mineral and vitamin premix according to National Research Council
recommendations.
Hepatic transcriptome in fed trout 955
British
Journal
ofNutrition

Thermal cycling was initiated with the incubation at 958C for90 s for hot-start iTaqeDNA polymerase activation. Thirty-fivesteps of PCR were performed, each one consisting of heating at958C for 20 s for denaturing, and at 598C for 30 s for annealingand extension. Following the final cycle of the PCR, meltingcurves were systematically monitored (with a gradient of0·58C per 10 s from 55 to 948C) to ensure that only one fragmentwas amplified. Samples without RT and samples without RNAwere run for each reaction as negative controls.
Data analysis
Data are presented as mean values and standard deviations.We analysed the effects of the different diets with an unpairedtwo-tailed Student’s t test (Systat 9 software products; SPSS,Inc., Chicago, IL, USA), except for microarray data (seebefore) and quantitative RT-PCR data. For the latter, signifi-cant differences were considered at P,0·05. Relative quanti-fication of the target gene transcript with the ef1a referencegene transcript(29) was made following the Pfaffl methodwith the Relative Expression Software tool (RESTq)(30,31).This mathematical algorithm computes an expression ratio,based on real-time PCR efficiency and the crossing pointdeviation of the unknown sample v. a control group:
R ¼ ððEtarget geneÞDCTðmean control2mean unknown sampleÞtarget gene
Þ=
ððEEF1aÞDCTðmean control2mean unknown sampleÞEF1a Þ;
where E is PCR efficiency determined by standard curvesusing serial dilution of cDNA (cDNA dilutions from 1/16 upto 1/512), DCT being the crossing point deviation of anunknown sample v. a control. Statistical differences in geneexpression between control and sample were evaluated ingroup means by randomisation tests(31) using RESTq soft-ware. A total of 2000 random allocations were performedand significant differences were considered at P,0·05.
Results
Fish rearing and endpoint analysis: growth rate, feedefficiencies and whole-body composition
In the fish fed with fish oil and vegetable oils, growth perform-ance was similar throughout the long-term study irrespectiveof dietary treatment; at the end of the growth study the twogroups reached a final body weight of about 1 kg (see Richardet al. (18) for further details). No differences were found infeed efficiency, protein feed efficiency and feed intake(Table 4). As it is well known that replacement of fish oilby vegetable oils may produce major changes in fatty acidcomposition of fish, we also analysed the whole-body fattyacid composition for the fish oil- and vegetable oil-fed fishes(Table 5); the whole-body fatty acid composition reflected lar-gely the composition of the diet (Table 1). The fish fed veg-etable oils exhibited the highest levels of 18 : 1, 18 : 2n-6and 18 : 3n-3, whereas the fish fed the fish oil diet had avery high percentage of long-chain MUFA (14·1 % for 20 : 1and 6·9 % for 22 : 1) and also the highest proportion of EPAand DHA (2·4 and 5·2 % respectively). In contrast to thefish fed with vegetable oils, trout fed with plant proteins hadT
able
3.
Prim
er
pairs
for
analy
sis
by
real-tim
eP
CR
of
sele
cte
dgenes*
Gene
Nam
e50–
30fo
rward
prim
er
Nam
e50–
30re
vers
eprim
er
Elo
ngation
facto
r1a
EF
17/8
50 -T
CC
TC
TT
GG
TC
GT
TT
CG
CT
G-3
0E
F19
50 -
AC
CC
GA
GG
GA
CA
TC
CT
GT
G-3
0
Experim
ent
with
fish
oil
repla
cem
ent
Cath
epsin
BC
AT
B-3
50 -T
GG
GC
CT
GT
AG
AG
GG
TG
CT
T-3
0C
AT
B-4
50 -
CC
AC
CA
TC
TC
CG
AC
TC
GA
TG
-30
Fatt
yacid
synth
ase
FA
S-1
50 -T
GA
TC
TG
AA
GG
CC
CG
TG
TC
A-3
0F
AS
-250 -
GG
GT
GA
CG
TT
GC
CG
TG
GT
AT
-30
Ubiq
uin
olcyto
chro
me
c-r
educta
se
pro
tein
2†
UC
R-2
50 -T
GG
GC
CT
GT
AG
AG
GG
TG
CT
T-3
0U
CR
-250 -
AG
GG
GA
TT
CG
CG
AA
TA
AG
T-3
0
CY
P1A
3/A
11A
3-3
50 -T
TT
GT
CA
TG
GG
CT
GT
TG
TG
T-3
01A
3-4
50 -
CG
GA
AG
AT
CT
CC
AG
GA
TG
AA
-30
CY
P3A
27
3A
27-3
50 -A
TC
TT
CG
CC
GG
CT
AC
GA
GA
C-3
03A
27-4
50 -
CG
TC
TT
CT
TG
GC
GA
CC
CT
CT
-30
Experim
ent
with
fishm
ealre
pla
cem
ent
Rib
osom
alpro
tein
60S
L27
RL27-1
50 -C
AC
AA
CC
AT
GG
GC
AA
GA
AG
A-3
0R
L27-2
50 -
TC
AG
GG
CA
GG
GT
CT
CT
GA
AG
-30
Rib
osom
alpro
tein
40S
L35
RL35-1
50 -T
CG
CA
AG
TT
CG
CT
GT
CA
AG
G-3
0R
L35-2
50 -
AC
GG
TG
TA
CC
GC
GT
TC
CA
AT
-30
Rib
osom
alpro
tein
40S
S6
RS
16-3
50 -T
TT
CA
GG
TG
GC
GA
AA
CA
TG
C-3
0R
S16-4
50 -
GG
GG
TC
TG
CC
AT
TC
AC
CT
TG
-30
Rib
osom
alpro
tein
40S
S7
RP
S-1
50 -G
CG
AA
AA
GC
CA
GA
TG
AG
TT
C-3
0R
PS
-350 -
CC
GC
TG
AA
CT
TC
TT
TT
CC
AG
-30
Glu
tam
ine
synth
eta
se
GLN
A-5
50 -A
AC
GC
AA
GC
CT
GC
AG
AA
AC
-30
GLN
A-6
50 -
GG
GA
CC
AG
GG
AA
GC
CG
TT
AG
-30
Glu
tam
ine
synth
eta
se
GS
01
(AF
390021)
GS
01-1
50 -C
TG
CA
GT
CT
GT
GT
GT
TC
AG
GG
TA
GA
-30
GS
01-2
50 -
CA
TC
TG
TC
TG
GA
AT
TG
TT
AA
GT
CC
AT
A-3
0
Glu
tam
ine
synth
eta
se
GS
02
(AF
390022)
GS
02-1
50 -G
GC
AG
TG
TC
TT
TA
AA
TG
GC
AA
CA
-30
GS
02-2
50 -
AC
GC
TA
CA
AT
TG
GC
AA
GA
CT
GA
-30
Glu
tam
ine
synth
eta
se
GS
03
(AF
390023)
GS
03-1
50 -G
TG
TA
TC
AA
TT
TG
CT
AC
TC
AT
GT
TT
AA
CA
T-3
0G
S03-2
50 -
AA
AA
TG
GG
TT
CT
TG
AT
AC
AA
CT
TC
TA
CT
AA
-30
*N
ucle
otide
sequences
were
extr
acte
dfr
om
the
Sig
enae
data
base
(htt
p:/
/ww
w.s
igenae.o
rg/)
except
for
GS
01,
GS
02
and
GS
03
from
Genbank(4
5) .
†R
evers
etr
anscription
with
random
prim
ers
.
S. Panserat et al.956
British
Journal
ofNutrition

significantly lower growth rates, lower feed efficiency andlower protein feed efficiency than fish fed with fishmeal(P,0·05; Student’s t test) (Table 6), even though the feedintake was higher in the fish fed vegetable proteins. Thesedata suggest a low capacity of metabolic adaptation of thefish fed with plant proteins from first feeding.
Differentially expressed genes in the liver of rainbow troutlinked to diet composition
Analysis of microarray data showed that almost 0·8 % of geneswere differentially expressed in our two experimentalcomparisons: (i) between the fish fed fish oil and vegetableoils, and (ii) between the fish fed fishmeal and plantproteins (Tables 7–10) (P,0·01, t test; TMEV). Among theseventy-one genes differentially expressed between the fish
fed with fish oil and those fed with vegetable oils, sixteenand fifty-five hepatic transcripts exhibited, in the fish fedwith vegetable oils, higher and lower abundance respectively(Tables 7 and 8). Moreover, among the seventy-five genes dif-ferentially expressed between the fish fed with fishmeal andthose fed with plant protein, fifteen and sixty hepatic trans-cripts exhibited respectively higher or lower abundance inthe fish fed with plant proteins (Tables 9 and 10).
Biological significance of the results: data clusteringand gene ontology
We researched the significance of our data analysingsome genes expressed in the clusters linked to specific biolo-gical process (Figs. 1 and 2). First, for the fish fed with orwithout fish oil, we observed three main clusters after analy-sing gene expression (Fig. 1 (a)). Cluster I was composedof numerous genes playing key roles in lysosomal andproteasomal proteolysis (cathepsins B and D, subunit ofproteasomes) which were more expressed in the fish fedwith vegetable oils (P,0·01, t test; TMEV). We found alsoin this cluster one gene, CYP1A3, involved in xenobioticmetabolism. Cluster II was found to be mainly composed ofgenes involved in intermediary metabolism especially energymetabolism (succinate dehydrogenase, ubiquinol dehydrog-enase) and lipid metabolism (fatty acid synthase (FAS) andlong-chain fatty acid elongase). In this cluster, some genesalso play roles in mRNA processing (splicing, maturation)(for details see Fig. 1 (b)). All the genes in cluster II wereexpressed at a lower level in the fish fed with vegetable oils(P,0·01, t test; TMEV). Finally, cluster III was mainlycomposed of genes involved in cell growth and maintenance(keratin, kindlin, actin): they were expressed at a higherlevel in the fish fed with vegetable oils than in those fedthe fish oil-based diet (P,0·01, t test; TMEV). Overall,after dietary fish oil replacement by a blend of vegetableoils, a number of genes involved in lipid metabolism (lipogen-esis, steroid synthesis, xenobiotic detoxification), protein cata-bolism, and transcription regulation were detected by geneontology analysis (Table 11).
Second, for the fish fed with plant proteins and fishmeal,four clusters were detected (Fig. 2 (a)). Whereas cluster Iwas composed of miscellaneous genes, cluster III was linked
Table 6. Effects of fishmeal replacement on growth performance andfeed efficiency in juvenile rainbow trout over 52 weeks (initial bodyweight (IBW) 0·215 g)
(Mean values and standard deviations for three tanks)
FM diet PP diet
Mean SD Mean SD P *
FBW (g) 775 26 659 24 0·005Daily growth index† 2·35 0·02 2·22 0·03 0·003Feed efficiency‡ 1·06 0·02 0·95 0·03 0·01Protein efficiency ratio§ 2·71 0·06 2·28 0·07 0·002
FM diet, fishmeal diet; PP diet, plant-protein diet; FBW, final body weight.* By Student’s t test.† Daily growth index¼100 £ (FBW1/3 2 IBW1/3)/duration (49 d).‡ Feed efficiency ¼ wet weight gain (g)/dry feed intake (g).§ Protein efficiency ratio ¼ wet weight gain (g)/crude protein intake (g).
Table 4. Effects of fish oil replacement on growth performance andfeed efficiency in juvenile rainbow trout over 62 weeks (initial bodyweight (IBW) 0·120 g)*
(Mean values and standard deviations for three tanks)
FO diet VO diet
Mean SD Mean SD
FBW (g) 1011 40 1019 63Daily growth index† 1·85 0·08 1·85 0·15Feed efficiency‡ 0·95 0·04 0·95 0·08Protein efficiency ratio§ 1·86 0·07 1·86 0·15
FO diet, fish oil diet; VO, vegetable oil diet; FBW, final body weight.* There was no significant difference between the groups (P.0·05; Student’s
t test).† Daily growth index ¼ 100 £ (FBW1/3 2 IBW1/3)/duration (49 d).‡ Feed efficiency ¼ wet weight gain (g)/dry feed intake (g).§ Protein efficiency ratio ¼ wet weight gain (g)/crude protein intake (g).
Table 5. Effect of fish oil replacement on mean fatty acid compositionof whole-body lipids after feeding the experimental diets for 62 weeks
Fatty acid composition(g/100 g total fatty acids)
FO diet(n 3)
VO diet(n 3)
14 : 0 7·93 1·80*16 : 0 16·03 17·2618 : 0 2·08 2·91Total saturates 26·97 22·70*16 : 1 9·45 2·41*18 : 1 21·56 41·41*20 : 1 14·11 3·39*22 : 1 6·85 1·63*Total monounsaturates 52·26 48·93*18 : 2n-6 4·48 12·78*20 : 2n-6 0·29 0·6020 : 4n-6 0·16 0·16Total n-6 PUFA 5·04 13·72*18 : 3n-3 1·03 6·97*18 : 4n-3 1·12 0·7520 : 4n-3 0·70 0·5420 : 5n-3 2·38 0·97*22 : 5n-3 0·64 0·3622 : 6n-3 5·16 3·43*Total n-3 PUFA 11·20 13·57*
FO diet, fish oil diet; VO, vegetable oil diet.* Mean value was significantly different from that of the fish fed the FO diet
(P,0·05).
Hepatic transcriptome in fed trout 957
British
Journal
ofNutrition

to intermediary metabolism, especially energy metabolism(quinone oxidoreductase, ubiquinol reductase), amino acidmetabolism (arginase) and amino acid transport. Cluster IIand cluster IV, even though also associated with metabolism,were focused on protein metabolism respectively with proteo-lytic (cathepsin, proteasome) and proteosynthetic (eight ribo-somal proteins) pathways (for details, see Fig. 2 (b)).Clusters II, III and IV were composed of genes that wereexpressed much less in the fish fed with plant proteins(P,0·01, t test; TMEV). Globally, the replacement of fish-meal by the plant protein sources indeed leads to a largenumber of genes involved in protein and amino acid meta-bolism being revealed by the gene ontology analysis (Table 12).
Focus on specific differentially expressed genes
We focused the present study on specific genes that can illustratethe major pathways modified by the diet variation on rainbowtrout liver. In the context of dietary fish oil replacement, fivegenes involved in proteolysis (cathepsin), energy metabolismin mitochondria (ubiquinol cytochrome c reductase), lipidmetabolism (FAS and long-chain fatty acid CoA ligase) anddetoxification metabolism (cytochromes P450) have beenselected (Table 13). Using six individuals per dietary groupand the quantitative RT-PCR, except for the cathepsin D, weconfirmed that cathepsin B, ubiquinol cytochrome c reductase,FAS and cytochrome P4501A3 were expressed less in the fishfed with vegetable oils (P,0·05; REST test). Moreover, wealso checked that the cytochrome P4503A4 was more highlyexpressed in the liver of the fish fed with vegetable oils(P,0·05; REST test). Also, in the context of dietary fishmealreplacement, genes involved in proteosynthesis (ribosomal pro-teins) and amino acid metabolism (glutamine synthetase) wereselected to be analysed by quantitative RT-PCR (Table 14).We confirmed by quantitative RT-PCR that the expression ofthe glutamine synthetase gene was lower in the livers of thefish fed with plant proteins than in those fed fishmeal(P,0·05; REST test): we analysed more precisely three gluta-mine synthase paralogous genes by specific amplification of
the isoforms and we confirmed that GS01 and GS03 geneexpressions were depressed by almost 7-fold in these fish. How-ever, all the analysed genes coding for ribosomal proteins (fourgenes coding for ribosomal proteins of the 40S (6S and 7S) and60S (L27 and L35) subunits) were not differentially expressed(P.0·05; REST test): these latter results did not confirm themicroarray data.
Discussion
Overview
In the present study, the substitution of dietary fishmeal byvegetable proteins seems to have some adverse consequenceson fish growth whereas no differences were found in fish fedvegetable oils as previously observed(13,14,18). This is the firstever set of nutrigenomics data in fish fed diets devoid of eitherfish oil or fishmeal. Analysis of the hepatic transcriptomesrevealed that less than 100 genes were differentially expressedbetween all the nutritional conditions (,1 %), which is arelatively low number of differentially expressed genes.Two possible explanations are (i) that the cDNA microarrayused in the present study is a generic rainbow trout cDNAtool (issue from 9023 cDNA extracted from different tissuesat different developmental stages(21)), and not a specific rain-bow trout liver cDNA microarray; and (ii) that although thediets differed in terms of ingredients (marine v. plant origins),they were not drastically different in terms of proximate com-position (Tables 1–3). It is also interesting to note that whenwe analysed globally the data about differentially expressedgenes, we observed no common genes between the two setsof experiments, with enrichment of differentially expressedgenes in lipid metabolism and protein metabolism after fishoil and fishmeal replacements respectively. This suggeststhat the modification of liver transcriptomes was highly depen-dent of the origin of the ingredient, i.e. vegetable oil and plantproteins. Thus, in the following discussion, we will analyseseparately the data from the two nutritional experiments byfocusing on specific molecular actors.
Table 7. Hepatic transcripts exhibiting higher abundance in fish fed with vegetable oils after microarray analysis*
Clone name Sigenae contig† Swissprot-hit description P
tcay0031b.c.17 tcay0025b.p.18_3.1.om.4 FXN2_HUMAN Human T-cell leukemia virus enhancer factor 6·9 £ 1024
tcba0021c.m.22 tcay0011b.k.02_5.1.om.4 ZN41_HUMAN Zinc finger protein 41 0·0011RT149O15_A_H08 15021467.1.om.4 SNXN_HUMAN Sorting nexin 23 0·002tcay0011b.d.05 15029633.1.om.4 AR1A_HUMAN Actin-related protein 2/3 complex subunit 1A 0·004tcak0001a.e.11 tcad0004a.b.23_3.1.om.4 IF39_HUMAN Eukaryotic translation initiation factor 3 subunit 9 0·006tcbk0041c.m.02 tcbk0041c.m.02_5.1.om.4 DLX6_BRARE Homeobox protein DLX-6 0·006tcac0002c.h.01 AF267126.1.om.4 CP3R_ONCMY Cytochrome P450 3A27 (EC 1.14.14.1) 0·007tcay0038b.c.08 tcay0036b.l.02_3.1.om.4 CSP7_HUMAN Cofactor required for Sp1 transcriptional activation subunit 7 0·0071RT88C17_A_B09 15026549.1.om.4 MPP5_HUMAN MAGUK p55 subfamily member 5 0·007tcbk0019c.d.07 tcbk0019c.d.07_5.1.om.4 UNKNOWN 0·007tcbk0036c.i.08 tcay0036b.p.22_5.1.om.4 LPB1_HUMAN Liprin-beta 1 0·007tcad0001a.b.13 tcad0001a.b.13_5.1.om.4 CRBA_DROME Cyclic-AMP response element binding protein A 0·008tcbk0026c.f.15 tcay0015b.j.03_3.1.om.4 K1CR_XENLA Keratin 0·008tcbk0003c.k.15 tcbk0003c.k.15_5.1.om.4 YB85_YEAST Hypothetical 124·0 kDa protein in PBP2-ABD1 intergenic region 0·009tcay0031b.d.23 tcay0031b.d.23_3.1.om.4 URP1_MOUSE Unc-112 related protein 1 (Kindlin-1) (Fragment) 0·009tcbk0026c.d.10 17236272.2.om.4 MUSC_HUMAN Musculin 0·009
* Where P,0·01 by t test (TIGR Multiple Experiment Viewer software; The Institute for Genomic Research, J. Craig Venter Institute, Rockville, MD, USA). The sixteen genesare classified following the P values.
† http://public-contigbrowser.sigenae.org:9090/index.html
S. Panserat et al.958
British
Journal
ofNutrition

Table 8. Hepatic transcripts exhibiting lower abundance in fish fed with vegetable oils after microarray analysis*
Clone name Sigenae contig† Swissprot-hit description P
1RT121N04_D_G02 15060218.1.om.4 MAFK_MOUSE Transcription factor MafK 1·36 £1024
1RT156K02_C_F01 15078821.1.om.4 ROAA_MOUSE Heterogeneous nuclear ribonucleoprotein A/B 2·07 £ 1024
1RT67M18_C_G09 tcad0003a.n.17_3.1.om.4 DHSB_HUMAN Succinate dehydrogenase [ubiquinone]iron-sulfur protein
3·26 £ 1024
tcba0008c.g.18 tcba0008c.g.18_5.1.om.4 SYN_HUMAN Asparaginyl-tRNA synthetase 3·84 £ 1024
tcba0003c.g.01 tcba0003c.g.01_5.1.om.4 TERA_RAT Transitional endoplasmic reticulum ATPase 4·03 £ 1024
1RT77M23_A_G12 15025059.1.om.4 SGK3_HUMAN Serine/threonine-protein kinase Sgk3 (EC 2.7.1.37) 6·54 £ 1024
1RT80C06_C_B03 15026055.1.om.4 ANXD_HUMAN Annexin A13 0·001tcag0002b.n.03 AF059711.1.om.4 CP13_ONCMY Cytochrome P450 1A3 (EC 1.14.14.1) 0·001tcad0006a.f.22 tcad0006a.f.22_3.1.om.4 PRSX_HUMAN 26S protease regulatory subunit S10B
(Proteasome subunit p42)0·002
tcba0014c.h.05 tcay0018b.k.17_3.1.om.4 HS47_CHICK 47 kDa heat shock protein precursor(Collagen-binding protein 1)
0·002
tcab0001c.e.06 tcab0001c.e.06_5.1.om.4 FAS_CHICK Fatty acid synthase (EC 2.3.1.85) 0·0021RT121J10_D_E05 15018967.1.om.4 UNKNOWN 0·0031RT122N23_B_G12 15017668.1.om.4 LCF4_RAT Long-chain-fatty-acid–CoA ligase 4 (EC 6.2.1.3) 0·003tcba0018c.g.23 tcba0018c.g.23_5.1.om.4 UNKNOWN 0·0031RT108I09_A_E05 15061441.1.om.4 EGL1_HUMAN Egl nine homolog 1 (EC 1.14.11.-) 0·0031RT34K04_C_F02 15076953.1.om.4 ELK3_MOUSE ETS-domain protein Elk-3 0·0031RT114N22_D_G11 15066941.1.om.4 SARA_HUMAN GTP-binding protein SAR1a 0·0041RT54E07_A_C04 15022193.1.om.4 UNKNOWN 0·0041RT65M18_C_G09 15023915.1.om.4 T9S3_HUMAN Transmembrane 9 superfamily protein member
3 precursor0·004
1RT106E04_C_C02 tcad0002a.a.16_3.1.om.4 PR39_YEAST Pre-mRNA processing protein PRP39 0·0041RT158E21_A_C11 15089300.1.om.4 PUB1_SCHPO Ubiquitin–protein ligase pub1 (EC 6.3.2.-) 0·004tcay0009b.b.09 tcay0023b.g.13_3.1.om.4 YCD1_HUMAN Hypothetical protein CGI-131 0·0051RT160F10_D_C05 tcad0003a.l.14_5.1.om.4 KCY_PIG UMP-CMP kinase (EC 2.7.4.14) 0·0051RT49M06_C_G03 15080981.1.om.4 YMN0_YEAST Hypothetical 65·0 kDa protein in COX14-COS3
intergenic region precursor0·005
1RT77N13_B_G07 15025133.1.om.4 PGS2_HORSE Decorin precursor 0·0051RT78F08_D_C04 15025579.1.om.4 UNKNOWN 0·0051RT85P10_D_H05 15015655.1.om.4 TBA_ONCKE Tubulin alpha chain 0·0051RT121P18_D_H09 tcad0002a.f.16_3.1.om.4 NFX1_HUMAN Transcriptional repressor NF-X1 (EC 6.3.2.-) 0·0051RT121E14_C_C07 15063507.1.om.4 THA1_MOUSE THAP domain protein 1 0·0061RT146D15_B_B08 tcay0029b.b.09_5.1.om.4 HS47_CHICK 47 kDa heat shock protein precursor 0·0061RT116G12_C_D06 15026944.1.om.4 SMD2_HUMAN Small nuclear ribonucleoprotein Sm D2 0·0061RT95I04_C_E02 tcad0007a.c.03_3.1.om.4 VATL_HUMAN Vacuolar ATP synthase 16 kDa proteolipid
subunit (EC 3.6.3.14)0·006
tcbk0025c.b.12 tcbk0004c.f.11_5.1.om.4 FAS_ANSAN Fatty acid synthase (EC 2.3.1.85) 0·0061RT130F18_D_C09 6187098.1.om.4 TCPB_HUMAN T-complex protein 1 0·006tcay0001b.e.11 tcay0028b.l.18_3.1.om.4 DD15_MOUSE Putative pre-mRNA splicing factor RNA
helicase0·006
1RT80E07_A_C04 tcav0003c.j.08_3.1.om.4 YE6A_SCHPO Hypothetical protein C6G10.10c in chromosome I 0·0061RT135H16_D_D08 15029400.1.om.4 PNPO_MOUSE Pyridoxine-50-phosphate oxidase (EC 1.4.3.5) 0·006tcad0001a.i.06 tcad0001a.i.06_3.1.om.4 RSP6_CHLRE Flagellar radial spoke protein 6 0·007tcad0006a.g.21 tcad0006a.g.21_3.1.om.4 GCSP_MOUSE Glycine dehydrogenase 0·0071RT101L17_B_F09 tcay0032b.m.12_3.1.om.4 NEK1_HUMAN Serine/threonine-protein kinase Nek1 (EC 2.7.1.37) 0·0071RT138J19_B_E10 15064382.1.om.4 HP28_RAT 28 kDa heat- and acid-stable phosphoprotein 0·0071RT103A16_C_A08 tcad0003a.m.01_3.1.om.4 CATD_CLUHA Cathepsin D precursor (EC 3.4.23.5) 0·0071RT126E19_A_C10 15019695.1.om.4 KLF4_MOUSE Kruppel-like factor 4 0·0081RT148G07_A_D04 15015121.1.om.4 SYQ_HUMAN Glutaminyl-tRNA synthetase (EC 6.1.1.18) 0·0081RT151H09_B_D05 15021715.1.om.4 ACS1_RHIME Acetyl-coenzyme A synthetase 1 (EC 6.2.1.1) 0·0081RT132N07_B_G04 tcay0027b.l.03_3.1.om.4 PGBM_HUMAN Basement membrane-specific heparan
sulfate proteoglycan core protein precursor0·008
1RT140L18_D_F09 15020168.1.om.4 SHO2_HUMAN Leucine-rich repeat protein SHOC-2 0·0081RT75D05_B_B03 15024751.1.om.4 G2A_MOUSE Lysophosphatidylcholine receptor G2A 0·009tcbk0032c.i.16 tcav0001c.d.12_5.1.om.4 UCR2_HUMAN Ubiquinol-cytochrome c reductase complex
core protein 20·009
1RT108E12_C_C06 15020717.1.om.4 UNKNOWN 0·0091RT116C04_C_B02 tcad0001a.p.06_3.1.om.4 CATB_CHICK Cathepsin B precursor (EC 3.4.22.1) 0·009tcay0027b.m.22 tcay0020b.d.06_3.1.om.4 ACTT_FUGRU Actin 0·011RT62D24_D_B12 15023633.1.om.4 UNKNOWN 0·011RT41M15_A_G08 15077566.1.om.4 PUM1_MOUSE Pumilio homolog 1 0·01tcac0002c.p.03 15014607.1.om.4 LCB1_HUMAN Serine palmitoyltransferase 1 (EC 2.3.1.50) 0·01
* Where P,0·01 by t test (TIGR Multiple Experiment Viewer software; The Institute for Genomic Research, J. Craig Venter Institute, Rockville, MD, USA). The fifty-five genesare classified following the P values.
† http://public-contigbrowser.sigenae.org:9090/index.html
Hepatic transcriptome in fed trout 959
British
Journal
ofNutrition

Gene profiling after fish oil replacement by vegetable oilmixture: focus on specific genes
We found that replacement of fish oil by vegetable oils has amajor impact on lipid, energy and xenobiotic metabolism.
As regards key actors involved in intermediary metabolism,we analysed FAS, which is the key enzyme of fatty acid bio-synthesis in vivo; this metabolic pathway is highly active inrainbow trout liver(32). Two FAS cDNA were spotted on themicroarrays and both of them were detected (and clustered)to be down-regulated in the fish fed with vegetable oils andconfirmed by quantitative RT-PCR. FAS gene expressionwas 10-fold lower in the fish fed with vegetable oils. Thelower level of hepatic FAS gene expression in the trout fedwith vegetable oils could be explained by the diets based onvegetable oils having higher levels of linoleic (18 : 2n-6) andlinolenic (18 : 3n-3) acids than the fish oil(18) and by linolenicacid known to decrease FAS mRNA levels(33). The unambigu-ous finding in the present study of a significantly lower(10-fold) FAS gene expression in the fish fed with vegetableoils was not linked with a decrease of liver FAS activity inthe same fish. This was even though FAS activity (IU/gliver) tended to be lower (P¼0·051) for the fish fed vegetableoils (4·0 (SD 0·9)) compared with fish fed fish oil (6·1 (SD 1·8))(see Richard et al. (18)). It cannot also explain the modificationof whole-body fatty acid composition which reflected mainlythe composition of the diets (Tables 1 and 5). Our dataabout FAS mRNA levels suggest once more that moleculardata (measures of gene expression level) are not alwaysassociated with significant effects at the protein-metabolicpathway level.
The second actor is one involved in lysosomal proteolysis,which includes proteases such as cathepsin B(34). Cell proteinsare always in a dynamic equilibrium between synthesisand degradation depending on nutritional status(35). Lowerexpression of the CATB gene in the trout fed with vegetableoils cannot be presently explained and it is difficult to provideany putative biological consequence of this observation. Thethird gene is the ubiquinol cytochrome c reductase (UCR)which is involved in mitochondrial metabolism, i.e. oxidative
phosphorylation. We found that the expression of UCR wasdown-regulated in the fish fed with vegetable oils. This is inagreement with the data of Barzanti et al. (36) in rats, whichshowed a putative modification of UCR gene expression bydietary lipids.
Part of our analysis in the fish fed with vegetable oils dealtwith the hepatic detoxification metabolism which is catalysedby a multi-enzyme family, namely the cytochromes P450s inrainbow trout(37). These enzymes have generally a large spec-trum of endogenous as well as exogenous substrates, andCYP1A members catalyse the biotransformation of environ-mental disruptors or pollutants such as polychlorinated biphe-nyls in the liver before their elimination. Because CYP1Agenes are induced by the presence of their substrates(37), thelower expression of the CYP1A3 gene in the liver of the troutfed diets with vegetable oils could be due to the lower levelsof pollutants such as dioxins in these diets. This result is not sur-prising given that the fish oil is susceptible to contaminationwith lipophilic organic chemicals that are now ubiquitousin the marine ecosystems and consequently in aquaculturesystems(38,39). Our own results (G Corraze, unpublishedresults) show that the muscle levels of dioxins and polychlori-nated biphenyls are reduced in trout fed vegetable oils comparedwith those fed fish oils (WHO toxic equivalent: 1·96 pg/g and1·08 pg/g for fish oil and vegetable oil groups, respectively).The CYP3A27 in rainbow trout which metabolises testosteronecan be reduced by phyto-oestrogen; however, this cannot pre-sently easily explain the higher CYP3A27 gene expression inthe fish fed vegetable oils. Moreover, CYP3A27 also has somesimilarities with the human CYP3A4(40) which can convertcholesterol to 4-b-hydroxycholestrol before its elimination inbile salts(41). Thus, the higher expression of the CYP3A27gene in the rainbow trout fed with vegetable oils can be relatedto the lower level of plasma cholesterol observed in these fish(6·45 (SD 1·07) v. 3·97 (SD 0·23) g/l for fish fed fish oil and vege-table oils respectively; see Richard et al. (18)), suggesting thathigher CYP3A27 activities can be the cause of the lower levelof cholesterol in plasma. This needs further study to confirmand understand the link between fish oil replacement and thehigher level of the CYP3A27 gene. Overall, the two hepatic
Table 9. Hepatic transcripts exhibiting higher abundance in fish fed with vegetable proteins after microarray analysis*
Clone name Sigenae contig† Swissprot-hit description P
tcay0001b.g.18 AF281350.1.om.4 UNKNOWN 0·0011RT120N05_B_G03 15062971.1.om.4 DTD_HUMAN Sulfate transporter 0·002tcbk0031c.h.14 15015934.1.om.4 BRD2_HUMAN Bromodomain-containing protein 2 0·0021RT120C23_A_B12 15062875.1.om.4 YQIK_BACSU Hypothetical protein yqiK 0·002tcba0020c.o.23 tcba0020c.o.23_5.1.om.4 UNKNOWN 0·003tcbk0052c.c.07 tcbk0052c.c.07_5.1.om.4 SMF1_HUMAN SWI/SNF-related 0·0041RT151D10_D_B05 tcay0015b.p.08_3.1.om.4 PTPA_RABIT Protein phosphatase 2A 0·0071RT90J08_D_E04 15016677.1.om.4 RBB5_HUMAN Retinoblastoma-binding protein 5 0·0071RT42N11_B_G06 15079057.1.om.4 AGM1_HUMAN Phosphoacetylglucosamine mutase (EC 5.4.2.3) 0·0091RT162N09_B_G05 15083591.1.om.4 LAT2_RAT Large neutral amino acids transporter small subunit 2 0·0091RT35I10_C_E05 15077084.1.om.4 DYN1_HUMAN Dynamin-1 (EC 3.6.5.5) 0·009tcba0023c.h.11 tcba0023c.h.11_5.1.om.4 UNKNOWN 0·009tcbk0016c.a.07 tcbk0016c.a.07_5.1.om.4 ACTM_APLCA Actin 0·009tcbk0021c.h.05 tcbk0021c.h.05_5.1.om.4 KELC_DROME Ring canal kelch protein 0·009tcac0003c.h.09 tcac0003c.h.09_3.1.om.4 PAB5_ARATH Polyadenylate-binding protein 5 0·009
* Where P,0·01 by t test (TIGR Multiple Experiment Viewer software; The Institute for Genomic Research, J. Craig Venter Institute, Rockville, MD, USA). The fifteen genesare classified following the P values.
† http://public-contigbrowser.sigenae.org:9090/index.html
S. Panserat et al.960
British
Journal
ofNutrition

Table 10. Hepatic transcripts exhibiting lower abundance in fish fed with vegetable proteins after microarray analysis*
Clone name Sigenae contig† Swissprot-hit description P
tcba0020c.j.10 tcav0004c.f.03_5.1.om.4 MTL2_MOUSE Methyltransferase-like protein 2 (EC 2.1.1.-) 9·7 £ 1024
tcad0009a.k.02 tcad0009a.k.02_3.1.om.4 CRB1_CHICK Beta crystallin B1 3·2 £ 1024
tcay0021b.b.07 tcay0021b.b.07_3.1.om.4 CPM1_ONCMY Cytochrome P450 2M1 (EC 1.14.14.1) 3·4 £ 1024
tcay0011b.k.04 tcay0011b.k.04_5.1.om.4 CAO3_HUMAN Acyl-coenzyme A oxidase 3 3·4 £ 1024
tcbi0009d.l.22 tcbi0009d.l.22_5.1.om.4 RL13_BRARE 60S ribosomal protein L13 0·001tcay0023b.k.09 tcay0023b.k.09_3.1.om.4 MEPD_PIG Thimet oligopeptidase (EC 3.4.24.15)
(Endopeptidase 24.15)0·001
1RT148H10_D_D05 tcay0038b.p.14_5.1.om.4 SN24_HUMAN Possible global transcriptionactivator SNF2L4
0·001
tcbk0002c.e.02 15012882.1.om.4 RL35_HUMAN 60S ribosomal protein L35 0·002tcad0004a.f.19 tcad0004a.f.19_3.1.om.4 NIFU_RICPR NifU-like protein 0·0021RT165A11_A_A06 tcaj0001a.a.12_5.1.om.4 U520_HUMAN U5 small nuclear ribonucleo
protein 200 kDa helicase (EC 3.6.1.-)0·002
tcba0008c.m.21 tcay0022b.h.16_3.1.om.4 SEP8_HUMAN Septin 8 0·003tcac0003c.f.09 15077731.1.om.4 SFR2_MOUSE Splicing factor 0·003tcba0011c.d.17 tcba0011c.d.17_5.1.om.4 KAP2_BOVIN cAMP-dependent protein kinase
type II-alpha regulatory chain0·003
tcac0002c.a.04 AF390023.1.om.4 GLNA_SQUAC Glutamine synthetase 0·003tcba0018c.b.23 tcay0014b.h.22_3.1.om.4 UCR1_MOUSE Ubiquinol-cytochrome c reductase
complex core protein I0·003
tcab0002c.l.09 tcab0002c.l.09_5.1.om.4 RL27_HUMAN 60S ribosomal protein L27 0·004tcbk0020c.f.18 tcay0014b.i.10_3.1.om.4 CN7B_SCHPO COP9/signalosome complex subunit 7B 0·004tcal0001a.o.19 15029915.1.om.4 CCR4_RAT C-X-C chemokine receptor type 4 0·004tcbk0058c.g.14 15060181.1.om.4 CWFF_SCHPO Cell cycle control protein cwf15 0·004tcba0006c.l.19 tcay0018b.i.17_5.1.om.4 TFR1_CRIGR Transferrin receptor protein 1 0·004tcbk0044c.l.01 15025792.1.om.4 RLA2_BRAFL 60S acidic ribosomal protein P2 0·005tcab0002c.e.12 tcab0002c.e.12_5.1.om.4 YFW7_SCHPO Hypothetical protein PB2B4.07
in chromosome I0·005
tcbk0051c.f.12 tcbk0005c.o.13_5.1.om.4 RS16_HUMAN 40S ribosomal protein S16 0·0051RT119C21_A_B11 tcad0001a.m.03_3.1.om.4 CIA1_HUMAN WD-repeat containing protein Ciao 1 0·005tcaa0002c.f.02 tcaa0002c.f.02_5.1.om.4 VATB_CHICK Vacuolar ATP synthase subunit B (EC 3.6.3.14) 0·005tcay0012b.b.15 tcay0030b.e.18_3.1.om.4 CWFO_SCHPO Cell cycle control protein cwf24 0·005tcam0002b.e.05 tcad0009a.e.24_3.1.om.4 SPRC_RAT SPARC precursor 0·005tcad0008a.p.16 tcad0003a.i.20_5.1.om.4 IUNH_CRIFA Inosine-uridine preferring nucleoside
hydrolase (EC 3.2.2.1)0·005
tcbk0018c.n.07 tcay0017b.j.17_3.1.om.4 ACPM_MOUSE Acyl carrier protein 0·005tcba0009c.f.23 tcba0009c.f.23_5.1.om.4 ABC1_HUMAN ATP-binding cassette 0·006tcay0013b.g.06 15068153.1.om.4 SGTB_HUMAN Small glutamine-rich tetratricopeptide
repeat-containing protein B0·006
tcay0031b.j.13 tcay0018b.l.03_3.1.om.4 TPM4_HORSE Tropomyosin alpha 4 chain 0·006tcay0008b.h.15 15073662.1.om.4 ARGI_HUMAN Arginase 1 (EC 3.5.3.1) 0·006tcbk0053c.i.13 tcba0028c.p.14_5.1.om.4 INPP_MOUSE Inositol polyphosphate 1-phosphatase (EC 3.1.3.57) 0·006tcad0002a.k.18 tcad0002a.k.18_5.1.om.4 RGS5_MOUSE Regulator of G-protein signaling 5 (RGS5) 0·006tcbk0002c.l.10 tcay0025b.o.12_3.1.om.4 PSB7_RAT Proteasome subunit beta type 7 precursor (EC 3.4.25.1) 0·006tcbk0036c.m.09 tcay0016b.p.23_3.1.om.4 M2OM_MOUSE Mitochondrial 2-oxoglutarate/malate carrier protein (OGCP) 0·006tcbk0018c.b.15 15019342.1.om.4 SHP_MOUSE Orphan nuclear receptor SHP 0·007tcay0028b.g.04 tcay0028b.g.04_3.1.om.4 IF2A_RAT Eukaryotic translation initiation factor 2 subunit 1 (eIF-2-alpha) 0·007tcay0003b.g.15 15073721.1.om.4 QOR_HUMAN Quinone oxidoreductase (EC 1.6.5.5) 0·007tcay0020b.j.18 tcay0020b.j.18_3.1.om.4 ICMT_XENLA Protein-S isoprenylcysteine O-methyltransferase (EC 2.1.1.100) 0·007tcbk0024c.f.12 17239246.2.om.4 RL28_MOUSE 60S ribosomal protein L28 0·008tcac0001c.i.22 tcac0001c.i.22_3.1.om.4 UNKNOWN 0·008tcac0006c.n.11 15064666.1.om.4 DIM1_HUMAN Spliceosomal U5 snRNP-specific 15 kDa protein 0·008tcbk0005c.c.21 tcbk0005c.c.21_5.1.om.4 CT20_HUMAN Protein C20orf20 0·008tcbk0033c.o.02 tcbk0033c.o.02_5.1.om.4 PRTP_HUMAN Lysosomal protective protein precursor
(EC 3.4.16.5) (Cathepsin A)0·008
1RT102K01_A_F01 15017476.1.om.4 UNKNOWN 0·008tcav0003c.h.07 tcav0003c.h.07_3.1.om.4 ARH7_HUMAN Rho guanine nucleotide exchange factor 7 0·008tcba0001c.m.17 tcba0001c.m.17_5.1.om.4 KBTA_RAT Kelch repeat and BTB domain containing protein 10 0·009tcac0006c.p.12 AF115536.1.om.4 TAP1_HUMAN Antigen peptide transporter 1 (APT1) 0·009tcbk0022c.f.06 tcay0028b.c.20_3.1.om.4 P44_PANTR Non-A non-B hepatitis-associated
microtubular aggregates protein (Antigen p44)0·009
tcad0006a.e.03 tcad0002a.o.04_3.1.om.4 ARLL_HUMAN ADP-ribosylation factor-like protein 4L 0·009tcba0002c.p.17 17244760.2.om.4 COXO_MOUSE Cytochrome c oxidase polypeptide VIIc 0·009tcay0001b.i.04 tcay0016b.j.19_3.1.om.4 AR34_HUMAN ARP2/3 complex 34 kDa subunit (P34-ARC) 0·009tcad0005a.c.22 tcad0005a.c.22_5.1.om.4 AATM_RAT Aspartate aminotransferase 0·009tcbk0050c.m.05 tcay0018b.g.16_3.1.om.4 ASAH_HUMAN Acid ceramidase precursor (EC 3.5.1.23) 0·01tcad0006a.d.14 tcad0006a.d.14_3.1.om.4 CB45_RAT 45 kDa calcium-binding protein precursor 0·01tcbk0057c.p.24 tcay0027b.m.18_3.1.om.4 TAM2_HUMAN Translocation associated membrane protein 2 0·01tcac0003c.k.15 15014990.1.om.4 PSA1_HUMAN Proteasome subunit alpha type 1 (EC 3.4.25.1) 0·01tcay0039b.h.02 tcay0033b.m.11_5.1.om.4 RL2_GEOSL 50S ribosomal protein L2 0·01
* Where P,0·01 by t test (TIGR Multiple Experiment Viewer software; The Institute for Genomic Research, J. Craig Venter Institute, Rockville, MD, USA). The sixty genes areclassified following the P values.
† http://public-contigbrowser.sigenae.org:9090/index.html
Hepatic transcriptome in fed trout 961
British
Journal
ofNutrition

Fig. 1. (a) Hierarchical classification of differentially expressed genes between fish fed with or without fish oil (FO) (P,0·01, t test, TIGR Multiple Experiment
Viewer software; The Institute for Genomic Research, J. Craig Venter Institute, Rockville, MD, USA). Seventy-one hepatic genes were differentially expressed
between the two dietary groups: sixteen were over-expressed (in red) and fifty-five were under-expressed (in green) in fish fed with vegetable oils (VO).
(b) Detailed description of cluster II.
S. Panserat et al.962
British
Journal
ofNutrition
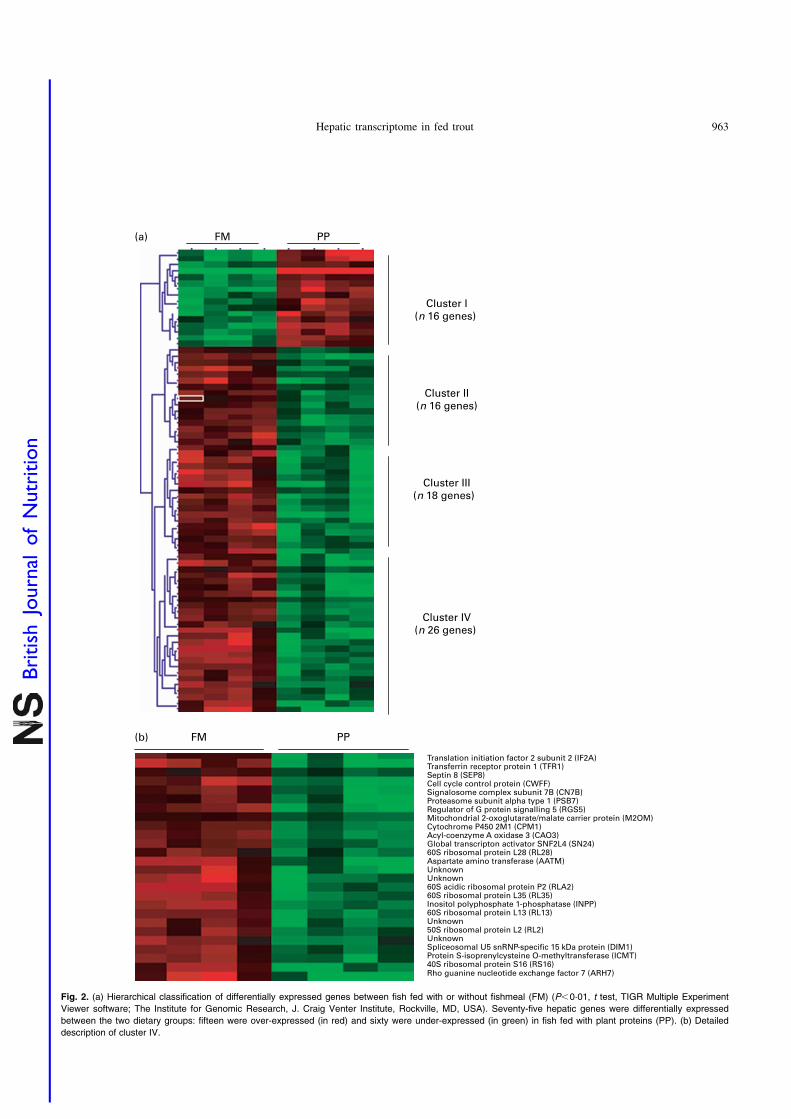
Fig. 2. (a) Hierarchical classification of differentially expressed genes between fish fed with or without fishmeal (FM) (P,0·01, t test, TIGR Multiple Experiment
Viewer software; The Institute for Genomic Research, J. Craig Venter Institute, Rockville, MD, USA). Seventy-five hepatic genes were differentially expressed
between the two dietary groups: fifteen were over-expressed (in red) and sixty were under-expressed (in green) in fish fed with plant proteins (PP). (b) Detailed
description of cluster IV.
Hepatic transcriptome in fed trout 963
British
Journal
ofNutrition

cytochrome P450s described here can be proposed as molecularmarkers of dietary fish oil replacement by vegetable oils eventhough measures of enzymic activities will be necessary toconfirm this status.
Gene profiling after fishmeal replacement by plant proteins:focus on specific genes
As the trout fed with plant proteins had significantly lowergrowth than the fish fed fishmeal, it was worth searchingpotential molecular actors to explain this phenotype, such asribosomal proteins and glutamine synthetase.
A relatively high number of genes (n 8) coding for riboso-mal proteins were detected in microarrays to be down-regu-lated in these fish. Moreover, we could classify them in thesame cluster (IV) and considered that this set to be relatedto the lower growth of fish (for example, lower protein syn-thesis). Unfortunately, it was not possible to confirm thesedata by quantitative RT-PCR. We have no explanation tounderstand the discrepancy between the microarray and quan-titative RT-PCR data. It is possible that these genes are falsepositive even though the data of microarrays seem unequi-vocal in humans (eight ribosomal genes with differentialexpression). An another explanation may be found in thespecificity of the ribosomal genes: (i) there are more thanseventy-nine ribosomal genes and, in trout, these are poten-tially in higher number due to pseudotetraploidy of the salmo-nids linked to a recent duplication of the genome(42,43) and (ii)all these genes are not under the same control of theirexpression(44). Thus, it is possible that we have not analysedthe most appropriate ribosomal protein genes by quantitativeRT-PCR. Overall, we prefer to take these data about ribosomalproteins with caution even though the growth rate and feedefficiency (which are major endpoints of the present nutri-tional experiments linked to the proteosynthesis potential)
were unambiguously lower in the fish fed plant proteins thanthe fish fed fishmeal (P,0·01).
We found that the glutamine synthetase mRNA levels werelower in the fish fed with plant proteins. Indeed, the lower gluta-mine synthetase gene expression (8-fold) observed in microarraysseems to be due to the lower levels of the two isoforms of the glu-tamine synthetase, i.e. GS01 (7-fold) and GS03 (6·9-fold), twogenes highly correlated with rising levels of ammonia in rainbowtrout(45). Glutamine synthetase catalyses the transformation ofglutamic acid into glutamine, leading to the elimination of ammo-nia(46). Rainbow trout do have an active ammonia detoxificationsystem, and glutamine synthetase activity increases after a mealnaturally rich in proteins(47) not only in the brain but also in theliver(45). In the present study, the fishmeal replacement by plantproteins was associated with lower hepatic glutamine synthetasegene expression, thus potentially lowering the capacity of ammo-nia detoxification, possibly explaining the lower growth of thesefish. However, the link between fishmeal replacement by plantproteins (naturally rich in glutamate) and lower glutamine synthe-tase gene expression is not clear and needs further study,especially at the level of enzyme activities.
Comparison with others nutrigenomic studies in fish
Very few studies have used nutrigenomics as a tool for theanalysis of dietary fatty acids–gene interactions in aquaculturenutrition. Jordal et al. (48) found regulation of several indivi-dual genes (for example, D6-desaturase, peroxysome prolifera-tor-activated receptor, mitochondrial genes) after replacementof fish oil by 75 % rapeseed oil in Atlantic salmon. We donot find any common differentially expressed genes betweenthe two studies. Indeed, we do not observe any change inD6-desaturase gene expression following the microarray ana-lysis (data not shown) in contrast to Jordal et al. (48), suggestingthat the effects on gene profiling by vegetable oil replacement
Table 11. Major functional groups of hepatic transcripts exhibiting lower abundance in fish fed with vegetable oils after gene ontologyanalysis (GoMiner)*
Biological process Function best_swissprot_hit_accession number
Lipid metabolism Fatty acid biosynthesis FAS_CHICKFatty acid biosynthesis FAS_ANSANFatty acid metabolism LCF4_RATSphingolipid metabolism LCB1_HUMANFatty acid, steroid and xenobiotic oxidation CP13_ONCMYLipid biosynthesis (isoprenoid biosynthesis) ACS1_RHIME
Protein catabolism Protein metabolism EGL1_HUMANProtein repair YCD1_HUMANProteolysis CATD_CLUHAProteolysis UCR2_HUMANProteolysis CATB_CHICKProteolysis (ubiquitin mediated) PUB1_SCHPOProtein catabolism PRSX_HUMANAmino acid metabolism (glycine, serine and threonine metabolism) GCSP_MOUSE
Protein modification Protein amino acid phosphorylation; mitosis NEK1_HUMANProtein amino acid phosphorylation SGK3_HUMANProtein biosynthesis SYQ_HUMANProtein folding TCPB_HUMAN
Transcription regulation Aminoacyl-tRNA biosynthesis SYN_HUMANmRNA splicing SMD2_HUMANmRNA splicing PR39_YEASTmRNA splicing DD15_MOUSE
* GoMiner software (Genomics and Bioinformatics Group, National Institutes of Health, Bethesda, MD, USA; http://discover.nci.nih.gov/gominer/).
S. Panserat et al.964
British
Journal
ofNutrition

in fish may possibly vary with vegetable oil source and/orwith fish species.
Concerning the analysis of dietary protein–gene interactionat the integrative level, an earlier study analysed the effect ofdietary plant-protein substitution on hepatic metabolism using
a proteomic approach(14). The majority of the up-regulated pro-teins affected by the plant-protein diets were involved in energyproduction (NADPH, electron transferring flavoproteins).This is in contrast to data from the present study, inwhich lower expression levels of genes involved in energy
Table 12. Major functional groups of hepatic transcripts exhibiting lower abundance in fish fed with vegetable proteins after gene ontology analysis(GoMiner)*
Biological process Function best_swissprot_hit_accession number
Lipid metabolism Fatty acid biosynthesis; oxidative phosphorylation ACPM_MOUSEFatty acid metabolism (sphingolipid metabolism) ASAH_HUMANFatty acid oxidation CAO3_HUMANCholesterol metabolism ABC1_HUMAN
Amino acid metabolism Amino acid catabolism AATM_RATAmino acid metabolism GLNA_SQUACAmino acid metabolism MTL2_MOUSEAmino acid metabolism ARGI_HUMAN
Protein biosynthesis Ribosome assembly RLA2_BRAFLRibosome assembly RL27_HUMANRibosome assembly CB45_RATRibosome assembly RL28_MOUSERibosome assembly RL35_HUMANRibosome assembly RL13_BRARERibosome assembly RL2_GEOSLRibosome assembly RS16_HUMANProtein biosynthesis PAB5_ARATHTranslation initiation IF2A_RAT
Protein transport Intracellular protein transport TAM2_HUMANIntracellular protein transport PRTP_HUMANIntracellular protein transport ICMT_XENLA
Transcription regulation mRNA splicing DIM1_HUMANmRNA splicing CWFO_SCHPOmRNA splicing CWFF_SCHPOmRNA splicing U520_HUMANmRNA splicing SFR2_MOUSETranscription regulation CT20_HUMANTranscription regulation SN24_HUMAN
Generation of metaboliteprecursors and energy
ATP biosynthesis VATB_CHICK
Oxidative phosphorylation (electron transport) CPM1_ONCMYOxidative phosphorylation (electron transport) UCR1_MOUSEOxidative phosphorylation, electron transport COXO_MOUSEProtein catabolism (proteasome) PSB7_RATProtein catabolism (proteasome) PSA1_HUMANPurine salvage IUNH_CRIFARepair iron-sulfur proteins NIFU_RICPR
Signal transduction Signal transduction KAP2_BOVINSignal transduction INPP_MOUSESignal transduction RGS5_MOUSESignal transduction ARLL_HUMAN
* GoMiner software (Genomics and Bioinformatics Group, National Institutes of Health, Bethesda, MD, USA; http://discover.nci.nih.gov/gominer/).
Table 13. Selected genes analysed by real-time PCR: effect of dietary fish oil (FO) replacement by vegetableoils (VO)*
Gene Fold-regulation (in VO fish)† P CV (%) FO CV (%) VO
Fatty acid synthase 210·1 ,0·02 2·5 18·4Ubiquinol-cytochrome c reductase 23·1 0·001 1·1 1·3Cathepsin B 22·3 ,0·05 1·7 1·1CYP1A (3A/A1) 22·7 ,0·02 4·2 2·5CYP3A (A27) þ2·7 ,0·005 2·9 2·3
* Statistical differences in gene expression were evaluated between group means (six samples per group) by randomisation testsusing the Relative Expression Software tool (RESTq)(23). The transcript level of target genes was normalised with EF1a-expressed transcripts.
† Positive and negative regulation means that the target gene is expressed at a higher or lower level, respectively.
Hepatic transcriptome in fed trout 965
British
Journal
ofNutrition

metabolism were found. However, we should recognise thatcomparison between transcriptomic and proteomic data is diffi-cult. A recent study by Salem et al. (49) on the hepatic geneexpression profiles between fasted and fed rainbow troutshowed an inhibition of protein synthesis gene expression(ribosomal protein) in fasted fish; these data can be related toours on trout fed with plant-protein diets having reduced growth.
Conclusion
Our data based on a transcriptomic approach and confirmed byquantitative RT-PCR enable us to identify modifications ofhepatic gene expression after intake of a plant-based diet by rain-bow trout. This non-exhaustive list of genes could be useful andused in the future as powerful tools to more closely monitor theeffects of the evolution of feeds used for farmed fish(50).
Acknowledgements
We acknowledge M. J. Borthaire and C. Nunez for their excel-lent technical assistance. We thank F. Terrier, Y. Hontang andF. Sandres for rearing fish in the INRA experimental farm(Donzacq, Landes, France).
The present study was financed by the AGENAE Frenchprogramme (Analyse du GENome des Animaux d’Elevage),CIPA (Comite Interprofessionnel des Produits de l’Aquacul-ture), OFIMER (Office National Interprofessionnel desProduits de la Mer et de l’Aquaculture), Aquitaine Region(no. CCRRDT-20051303004AB), 5th European projects(FAIR no. QLK5-2000-30068, ‘Perspectives of Plant Proteinuse in Aquaculture’ (PEPPA) and FAIR no. Q5RS-2000-30058, ‘Researching Alternatives to Fish Oils in Aquaculture’(RAFOA)) and a 6th PCRD European project (contract no.016249-2, ‘Sustainable Aquafeeds to Maximise the HealthBenefits of Farmed Fish for Consumers’ (AQUAMAX)).
F. P. and D. E. were responsible for generating the troutmicroarrays. C. K. was co-responsible for generating statis-tical analysis of the microarray data. E. P.-J. generatedthe quantitative RT-PCR data. N. R., G. C., F. M. and S. K.conducted the nutritional experiments in fish. S. P. wasresponsible for project development, drafted the manuscriptand is the corresponding author.
There are no conflicts of interest.
References
1. Food and Agriculture Organization (2006) State of world aqua-
culture. ftp://ftp.fao.org/docrep/fao/009/a0874e/a0874e00.pdf
2. Gatlin DM III, Barrows FT, Brown P, et al. (2007) Expanding
the utilization of sustainable plant products in aquafeeds: a
review. Aquaculture Res 38, 551–579.
3. Cho C & Kaushik SJ (1990) Nutritional energetics in fish:
energy and protein utilization in rainbow trout (Salmo gaird-
neri). World Rev Nutr Diet 61, 132–172.
4. Sargent JR & Tacon AGJ (1999) Development of farmed fish: a
nutritionally necessary alternative to meat. Proc Nutr Soc 58,
377–383.
5. Webster CD & Lim C (2002) Nutrient Requirements and Feeding of
Finfish for Aquaculture. Wallingford, UK: CABI Publishing.
6. Webster C, Lim C & Lee S-C (2007) Use of Alternative Protein
Sources in Aquaculture Diets. Binghampton, NY: The Haworth
Press.
7. Francis G, Makkar H & Becker K (2001) Antinutritional factors
present in plant-derived alternate fish feed ingredients and their
effects in fish. Aquaculture 199, 197–227.
8. Kaushik SJ (1990) Use of alternative protein sources for the
intensive rearing of carnivorous fishes. In Mediterranean Aqua-
culture, pp. 125–138 [R Flos, L Tort and P Torres, editors].
Chichester, UK: Ellis Horwood.
9. Kaushik SJ, Cravedi JP, Lalles JP, Sumpter J, Fauconneau B &
Laroche M (1995) Partial or total replacement of fish meal by
soybean proteins on growth, protein utilization, potential oestro-
genic or antigenic effects, cholesterolemia and flesh quality in
rainbow trout. Aquaculture 133, 257–274.
10. Watanabe T, Aoki H, Shimamoto K, Hadzuma M, Maita M,
Yamagata Y, Viswanath K & Satoh S (1999) A trial to culture
yellowtail with non-fishmeal diets. Fisheries Sci 64, 505–512.
11. Watanabe T, Verakunpiriya V, Watanabe K, Viswanath K &
Satoh S (1998) Feeding of rainbow trout with non-fish meal
diets. Fisheries Sci 63, 258–266.
12. Kaushik SJ, Coves D, Dutto G & Blanc D (2004) Almost total
replacement of fishmeal by plant protein sources in the diets for
European seabass (Dicentrarchus labrax). Aquaculture 230,
391–404.
13. Gomez-Requeni P, Mingarro M, Calduch-Giner JA, Medale F,
Martin SAM, Houlihan DF, Kaushik S & Perez-Sanchez J
(2004) Protein growth performance, amino acid utilisation and
somatotropic axis responsiveness to fish meal replacement by
plant protein sources in gilthead sea bream (Sparus aurata).
Aquaculture 232, 493–510.
14. Vilhelmsson OT, Martin SAM, Medale F, Kaushik SJ &
Houlihan DF (2004) Dietary plant protein substitution affects
hepatic metabolism in rainbow trout. Br J Nutr 92, 71–80.
Table 14. Selected genes analysed by real-time PCR: effect of dietary fishmeal (FM) replacement by plantproteins (PP)*
Gene Fold-regulation (in PP fish)† P CV (%) FM CV (%) PP
Glutamine synthetase 28·0 0·001 0·5 0·2Glutamine synthetase GS03 27·1 0·007 1·22 9·06Glutamine synthetase GS02 þ2·1 0·26 11·73 13·03Glutamine synthetase GS01 26·9 ,0·02 3·85 5·14Ribosomal protein L35 þ1·4 0·42 1·9 4·4Ribosomal protein L27 21·1 0·48 1·0 1·0Ribosomal protein S6 21·4 0·08 0·2 0·9Ribosomal protein S7 þ1·4 0·08 1·0 1·6
* Statistical differences in gene expression were evaluated between group means (six samples per group) by randomisationtests using the Relative Expression Software tool (RESTq)(23). The transcript level of target genes was normalised withEF1a-expressed transcripts.
† Positive and negative regulation means that the target gene is expressed at a higher or lower level, respectively.
S. Panserat et al.966
British
Journal
ofNutrition

15. Bell JG, Tocher DR, Henderson RJ, Dick JR & Crampton VO
(2003) Altered fatty acid compositions in Atlantic salmon
(Salmo salar) fed diets containing linseed and rapeseed oils
can be partially restored by a subsequent fish oil finishing
diet. J Nutr 133, 2793–2801.
16. Glencross BD, Hawkins WE & Curnow JG (2003) Restoration
of the fatty acid composition of red seabream (Pagrus auratus)
using a fish oil finishing diet after growth-out on plant based
diet. Aquaculture Nutr 9, 409–418.
17. Regost C, Arzel J, Robin G, Rosenlund G & Kaushik SJ (2003)
Total replacement of fish oil by soybean or linseed oil with a
return to fish oil in turbot (Psetta maxima). Aquaculture 220,
737–747.
18. Richard N, Kaushik S, Larroquet L, Panserat S & Corraze G
(2006) Replacing dietary fish oil by vegetable oils has little
effect on lipogenesis, lipid transport and tissue lipid uptake
in rainbow trout (Oncorhynchus mykiss). Br J Nutr 96,
299–309.
19. Folch J, Lees M & Sloane Stanley GH (1957) A simple method for
the isolation and purification of total lipides from animal tissues.
J Biol Chem 226, 497–509.
20. Moore S & Stein WH (1951) Chromatography of amino acid on
sulfonated polystyrene resin. J Biol Chem 192, 663–681.
21. Govoroun M, Le Gac F & Guiguen Y (2006) Generation of a
large scale repertoire of expressed sequences tags (ESTs) from
normalised rainbow trout cDNA libraries. BMC Genomics 7,
196–203.
22. Nguyen C, Rocha D, Granjeaud S, Baldif M, Bernard K, Naquet P
& Jordan B (1995) Differential gene expression in the murine
thymus assayed by quantitative hybridization of arrayed cDNA
clones. Genomics 29, 207–216.
23. Lopez F, Rougemont J, Loriod B, Bourgeois A, Loi L, Bertucci F,
Hingamp P, Houlgatte R & Granjeaud S (2004) Feature extraction
and signal processing for nylon DNA microarrays. BMC Geno-
mics 5, 38.
24. Cathelin R, Lopez F & Klopp C (2007) AGScan: a pluggable
microarray image quantification software based on the ImageJ
library. Bioinformatics 23, 247–248.
25. Saal LH, Troein C, Vallon-Christersson J, Gruvberger S, Borg A
& Peterson C (2002) Bioarray software environment (BASE):
a platform for comprehensive management and analysis of
microarray data. Genome Biol 3, software0003.1–software0003.6
(epublication 15 July 2002).
26. Pan W (2002) A comparative review of statistical methods for
discovering differentially expressed genes in replicate micro-
array experiments. Bioinformatics 21, 546–554.
27. Zeeberg BR, Feng W, Wang G, et al. (2003) GoMiner: a
resource for biological interpretation of genomic and proteomic
data. Genome Biol 4, R28.
28. Rexroad CE III, Lee Y, Keele JW, Karamycheva S, Brown G,
Koop B, Gahr SA, Palti Y & Quackenbush J (2003) Sequence
analysis of a rainbow trout cDNA library and creation of a
gene index. Cytogenet Genome Res 102, 347–354.
29. Olsvik P, Lie K, Jordal A, Nilsen T & Hordvik I (2005) Evalu-
ation of potential reference genes in real time RT-PCR studies
of Atlantic salmon. BMC Mol Biol 17, 6–21.
30. Pfaffl MW (2001) A new mathematical model for relative
quantification in real-time RT-PCR. Nucleic Acids Res 29,
2002–2007.
31. Pfaffl MW, Horgan GW & Dempfle L (2002) Relative
expression software tool (RESTq) for group-wise comparison
and statistical analysis of relative expression results in real-
time PCR. Nucleic Acids Res 30, 9–36.
32. Sargent JR, Tocher DR & Bell JG (2002) The lipids. In Fish
Nutrition, 3rd ed., pp. 181–258 [JE Halver and RW Hardy,
editors]. San Diego: Academic Press.
33. Jump DB, Clarke SD, Thelen A & Liimatta M (1994) Coordi-
nate regulation of glycolytic and lipogenic gene expression by
polyunsaturated fatty acids. J Lipid Res 35, 1076–1084.
34. McGrath ME (1999) The lysosomal cysteine protease. Annu Rev
Biophys Biomol Struct 28, 181–204.
35. Mortimore GE & Kadowaki M (2001) Regulation of protein
metabolism in liver. In Handbook of Physiology. Section 7 –
The Endocrine System. Volume II – The Endocrine Pancreas
and Regulation of Metabolism, pp. 553–577 [LS Jefferson and
AD Cherrington, editors]. New York: Oxford University Press.
36. Barzanti V, Battino M, Baracca A, Cavazzoni M, Cocchi M,
Noble R, Maranesi M, Turchetto E & Lenaz G (1994) The
effect of dietary lipid changes on the fatty acid composition
and function of liver, heart and brain mitochondria in the rat
at different ages. Br J Nutr 71, 193–202.
37. Buhler DR & Wang-Buhler JL (1998) Rainbow trout cyto-
chrome P450s: purification, molecular aspects, metabolic
activity, induction and role in environmental monitoring.
Comp Biochem Physiol 121, 107–137.
38. Jacobs MN, Covaci A, Gheorghe A & Schepens P (2004) Time
trend investigation of PCBs, PBDEs, and organochlorine pesti-
cides in selected n-3 polyunsaturated fatty acid rich dietary fish
oil and vegetable oil supplements; nutritional relevance for
human essential n-3 fatty acid requirements. J Agric Food
Chem 52, 1780–1788.
39. Jacobs MN, Covaci A & Schepens P (2002) Investigation of
selected persistent organic pollutants in farmed Atlantic samon
(Salmo salar), salmon aquaculture feed, and fish oil components
of the feed. Environ Sci Technol 36, 2797–2805.
40. Lee SJ & Buhler DR (2002) Functional properties of a rainbow
trout CYP3A27 expressed by recombinant baculovirus in insect
cells. Drug Metab Dispos 30, 1406–1412.
41. Pikuleva IA (2006) Cytochrome P450s and cholesterol homeo-
stasis. Pharmacol Ther 112, 761–773.
42. Wool IG, Chan Y & Gluck A (1994) Structure and evolution of
mammalian ribosomal proteins. Biochem Cell Biol 73, 933–947.
43. Meyer A & Van de Peer Y (2005) From 2R to 3R: evidence for
a fish-specific genome duplication (FSGD). Bioessays 27,
937–945.
44. Ishii K, Washio T, Uechi T, Yoshihama M, Kenmochi N &
Tomita M (2006) Characteristics and clustering of human ribo-
somal protein genes. BMC Genomics 7, 37.
45. Essex-Fraser PA, Steele SL, Bernier NJ, Murray BW, Stevens ED
& Wright PA (2005) Expression of four glutamine synthetase
genes in the early stages of development of rainbow trout (Oncor-
hynchus mykiss) in relationship to nitrogen excretion. J Biol Chem
280, 20268–20273.
46. Labow BI, Souba WW & Abcouwer SF (2001) Mechanisms gov-
erning the expression of the enzymes of glutamine metabolism –
glutaminase and glutamine synthetase. J Nutr 131, Suppl. 9,
2467S–2474S.
47. Wicks DJ & Randall BJ (2002) The effect of sub-lethal ammo-
nia exposure on fed and unfed rainbow trout: the role of
glutamine in regulation of ammonia. Comp Biochem Physiol
132B, 275–285.
48. Jordal AE, Torstensen BE, Tsoi S, Tocher DR, Lall SP &
Douglas SE (2005) Dietary rapeseed oil affects the expression
of genes involved in hepatic lipid metabolism in Atlantic
salmon (Salmo salar L.). J Nutr 135, 2355–2361.
49. Salem M, Silverstein J, Rexroad CE III & Yao J (2007) Effect of
starvation on global gene expression and proteolysis in rainbow
trout (Oncorhynchus mykiss). BMC Genomics 8, 328.
50. Naylor RL, Goldberg RJ, Primavera JH, Kautsky N, Beveridge
MCM, Clay J, Folke C, Libchenko J, Mooney H & Troell M
(2000) Effect of aquaculture on world fish supplies. Nature 405,
1017–1024.
Hepatic transcriptome in fed trout 967
British
Journal
ofNutrition

![The effects of benzo[a]pyrene on leucocyte distribution and antibody response in rainbow trout (Oncorhynchus mykiss)](https://static.fdokumen.com/doc/165x107/63254a034643260de90dad35/the-effects-of-benzoapyrene-on-leucocyte-distribution-and-antibody-response-in.jpg)