Changes induced by dietary energy intake and divergent selection for muscle fat content in rainbow...
16
BioMed Central Page 1 of 16 (page number not for citation purposes) BMC Genomics Open Access Research article Changes induced by dietary energy intake and divergent selection for muscle fat content in rainbow trout (Oncorhynchus mykiss), assessed by transcriptome and proteome analysis of the liver Catherine-Ines Kolditz 1 , Gilles Paboeuf 2 , Maïena Borthaire 1 , Diane Esquerré 3 , Magali SanCristobal 4 , Florence Lefèvre 2 and Françoise Médale* 1 Address: 1 INRA, UMR 1067 Nutrition Aquaculture & Genomics – Pôle d'Hydrobiologie, F-64310 Saint-Pée-sur-Nivelle, France, 2 INRA, UR 1037 SCRIBE – Campus de Beaulieu – F-35042 Rennes Cedex, France, 3 INRA, DGA, UMR 314, Laboratoire de Radiobiologie et d'Etude du Génome, CRB GADIE, F-78350 Jouy en Josas, France and 4 INRA, UMR 444, Laboratoire de Génétique Cellulaire, F-31326 Castanet-Tolosan, France Email: Catherine-Ines Kolditz - [email protected]; Gilles Paboeuf - [email protected]; Maïena Borthaire - [email protected]; Diane Esquerré - [email protected]; Magali SanCristobal - magali.san- [email protected]; Florence Lefèvre - [email protected]; Françoise Médale* - [email protected] * Corresponding author Abstract Background: Growing interest is turned to fat storage levels and allocation within body compartments, due to their impact on human health and quality properties of farm animals. Energy intake and genetic background are major determinants of fattening in most animals, including humans. Previous studies have evidenced that fat deposition depends upon balance between various metabolic pathways. Using divergent selection, we obtained rainbow trout with differences in fat allocation between visceral adipose tissue and muscle, and no change in overall body fat content. Transcriptome and proteome analysis were applied to characterize the molecular changes occurring between these two lines when fed a low or a high energy diet. We focused on the liver, center of intermediary metabolism and the main site for lipogenesis in fish, as in humans and most avian species. Results: The proteome and transcriptome analyses provided concordant results. The main changes induced by the dietary treatment were observed in lipid metabolism. The level of transcripts and proteins involved in intracellular lipid transport, fatty acid biosynthesis and anti-oxidant metabolism were lower with the lipid rich diet. In addition, genes and proteins involved in amino-acid catabolism and proteolysis were also under expressed with this diet. The major changes related to the selection effect were observed in levels of transcripts and proteins involved in amino-acid catabolism and proteolysis that were higher in the fat muscle line than in the lean muscle line. Conclusion: The present study led to the identification of novel genes and proteins that responded to long term feeding with a high energy/high fat diet. Although muscle was the direct target, the selection procedure applied significantly affected hepatic metabolism, particularly protein and amino acid derivative metabolism. Interestingly, the selection procedure and the dietary treatment used to increase muscle fat content exerted opposite effects on the expression of the liver genes and proteins, with little interaction between the two factors. Some of the molecules we identified could be used as markers to prevent excess muscle fat accumulation. Published: 29 October 2008 BMC Genomics 2008, 9:506 doi:10.1186/1471-2164-9-506 Received: 11 July 2008 Accepted: 29 October 2008 This article is available from: http://www.biomedcentral.com/1471-2164/9/506 © 2008 Kolditz et al; licensee BioMed Central Ltd. This is an Open Access article distributed under the terms of the Creative Commons Attribution License (http://creativecommons.org/licenses/by/2.0 ), which permits unrestricted use, distribution, and reproduction in any medium, provided the original work is properly cited.
-
Upload
independent -
Category
Documents
-
view
0 -
download
0
Transcript of Changes induced by dietary energy intake and divergent selection for muscle fat content in rainbow...

BioMed CentralBMC Genomics
ss
Open AcceResearch articleChanges induced by dietary energy intake and divergent selection for muscle fat content in rainbow trout (Oncorhynchus mykiss), assessed by transcriptome and proteome analysis of the liverCatherine-Ines Kolditz1, Gilles Paboeuf2, Maïena Borthaire1, Diane Esquerré3, Magali SanCristobal4, Florence Lefèvre2 and Françoise Médale*1Address: 1INRA, UMR 1067 Nutrition Aquaculture & Genomics – Pôle d'Hydrobiologie, F-64310 Saint-Pée-sur-Nivelle, France, 2INRA, UR 1037 SCRIBE – Campus de Beaulieu – F-35042 Rennes Cedex, France, 3INRA, DGA, UMR 314, Laboratoire de Radiobiologie et d'Etude du Génome, CRB GADIE, F-78350 Jouy en Josas, France and 4INRA, UMR 444, Laboratoire de Génétique Cellulaire, F-31326 Castanet-Tolosan, France
Email: Catherine-Ines Kolditz - [email protected]; Gilles Paboeuf - [email protected]; Maïena Borthaire - [email protected]; Diane Esquerré - [email protected]; Magali SanCristobal - [email protected]; Florence Lefèvre - [email protected]; Françoise Médale* - [email protected]
* Corresponding author
AbstractBackground: Growing interest is turned to fat storage levels and allocation within body compartments, due totheir impact on human health and quality properties of farm animals. Energy intake and genetic background aremajor determinants of fattening in most animals, including humans. Previous studies have evidenced that fatdeposition depends upon balance between various metabolic pathways. Using divergent selection, we obtainedrainbow trout with differences in fat allocation between visceral adipose tissue and muscle, and no change inoverall body fat content. Transcriptome and proteome analysis were applied to characterize the molecularchanges occurring between these two lines when fed a low or a high energy diet. We focused on the liver, centerof intermediary metabolism and the main site for lipogenesis in fish, as in humans and most avian species.
Results: The proteome and transcriptome analyses provided concordant results. The main changes induced bythe dietary treatment were observed in lipid metabolism. The level of transcripts and proteins involved inintracellular lipid transport, fatty acid biosynthesis and anti-oxidant metabolism were lower with the lipid rich diet.In addition, genes and proteins involved in amino-acid catabolism and proteolysis were also under expressed withthis diet. The major changes related to the selection effect were observed in levels of transcripts and proteinsinvolved in amino-acid catabolism and proteolysis that were higher in the fat muscle line than in the lean muscleline.
Conclusion: The present study led to the identification of novel genes and proteins that responded to long termfeeding with a high energy/high fat diet. Although muscle was the direct target, the selection procedure appliedsignificantly affected hepatic metabolism, particularly protein and amino acid derivative metabolism. Interestingly,the selection procedure and the dietary treatment used to increase muscle fat content exerted opposite effectson the expression of the liver genes and proteins, with little interaction between the two factors. Some of themolecules we identified could be used as markers to prevent excess muscle fat accumulation.
Published: 29 October 2008
BMC Genomics 2008, 9:506 doi:10.1186/1471-2164-9-506
Received: 11 July 2008Accepted: 29 October 2008
This article is available from: http://www.biomedcentral.com/1471-2164/9/506
© 2008 Kolditz et al; licensee BioMed Central Ltd. This is an Open Access article distributed under the terms of the Creative Commons Attribution License (http://creativecommons.org/licenses/by/2.0), which permits unrestricted use, distribution, and reproduction in any medium, provided the original work is properly cited.
Page 1 of 16(page number not for citation purposes)

BMC Genomics 2008, 9:506 http://www.biomedcentral.com/1471-2164/9/506
BackgroundThe levels of fat storage and allocation within body com-partments have become the focus of critical interest dur-ing the last few years, due to their impact on humanhealth [1] and meat quality of farm animals [2,3]. Dietarymanipulation and genetic selection constitute the twoways to manage body fat content in farm animals. Energyintake and genetic factors also have a major influence onfattening in humans [4].
Storage of triglycerides in the different body compart-ments depends on the availability of plasma lipids origi-nating from either the diet or lipogenesis. In fish, humanand most avian species, lipogenesis mainly takes place inthe liver [5,6] and is negligible in muscle [7,8]. The liverhas a central role in metabolic homeostasis and in coordi-nating body metabolism in response to dietary condi-tions. An increase in dietary lipid generally leads tomodification of lipid metabolism in most animals, withinhibition of lipogenic enzymes [9,6,10], and stimulationof fatty acid oxidation [11], especially when the dietaryfatty acids are provided as polyunsaturated fatty-acids(PUFAs) [12-14]. However, most of the studies investigat-ing the hepatic metabolic changes induced by long termfeeding a high fat diet focused on lipid metabolism.
Body fat distribution is clearly a heritable trait [15]. Infarm animals, genetic selection has been used to managefat content of target body compartments [16,17], but itgenerally leads to changes in whole body fat content. Inhumans, studies comparing groups with different fat dis-tribution patterns have highlighted differences in post-
prandial plasma metabolites [18-20], suggestingdifferences in fat, glucose and protein metabolism. How-ever, the physiological mechanisms responsible for thesedifferences have not been described to date.
Using divergent selection on muscle fat content in rain-bow trout, we obtained animals that were characterizedby differences in fat allocation between visceral adiposetissue and muscle, with no change in overall body fat con-tent between lines. We then decided to characterize thedifferences in metabolic changes occurring between thesetwo lines when fed a low or a high energy diet. We focusedon the liver, since this organ is the center of intermediarymetabolism and main site for lipogenesis in fish [5]. Theaims of the study were 1) to assess the overall changes ingene and protein expression induced in the rainbow troutliver by long term feeding of a high energy/high fat diet,2) to identify the differences in gene and protein expres-sion profiles induced in the liver as a consequence of theselection for muscle fattening, and 3) to evaluate to whatextent the two factors used to modulate muscle fat contentmay have interacted on the different metabolism-relatedgenes and proteins. This was achieved through two com-plementary approaches at the transcriptomic and pro-teomic levels, using microarray and bidimensionalelectrophoresis.
ResultsGrowth, biometry and biochemical parameters (Table 1)The higher energy content of the HE diet enhanced growthrate (p = 10-4) of fish irrespective of the line. At the end ofthe feeding trial, fish of the lean muscle line (L) showed
Table 1: Fish growth, morphological and biochemical parameters, and whole body and muscle lipid content
L line F line p-values
Diet LE HE LE HE Diet Line Line*Diet
Daily Growth index (% day-1)2.57 ± 0.04 2.67 ± 0.05 2.37 ± 0.01 2.52 ± 0.03 p = 0.011 p = 0.043 p = 0.64
Final body weight (g)73.0 ± 2.9 92.4 ± 2.9 57.8 ± 2.0 77.4 ± 2.5 p = 10-4 p = 10-4 p = 0.66
Whole body lipid content (% WW)9.5 ± 0.2 15.3 ± 1.1 10.8 ± 0.5 15.2 ± 1.0 p = 10-4 p = 0.27 p = 0.16
HSI (%)1.3 ± 0.2 1.2 ± 0.2 1.3 ± 0.2 1.3 ± 0.3 p = 0.14 p = 0.99 p = 0.33
VSI (%)8.3 ± 0.8c 12.4 ± 1.3a 7.7 ± 0.9d 11.0 ± 1.9b p = 10-4 p = 10-4 p = 0.003
Muscle lipid content (% WW)4.3 ± 0.8c 6.4 ± 1.2b 6.3 ± 1.2b 10.1 ± 2.3a p < 10-4 p < 10-4 p = 0.003
Plasma triglycerides (g/l)5.52 ± 0.77 4.38 ± 1.31 5.74 ± 0.84 4.83 ± 1.31 p < 10-4 p = 0.03 p = 0.47
Plasma glucose (mg/l)81.42 ± 6.68 80.90 ± 5.61 81.34 ± 6.16 81.01 ± 5.71 p = 0.61 p = 0.97 p = 0.91
% WW, percentage of wet weight. Values are expressed as means ± SD (n = 57 individuals in all groups, except for muscle lipid content, for which n = 30); HIS, hepato-somatic index; VSI, Viscero-somatic index; p-values are presented in italics when the differences are significant (p < 0.05, MANOVA 2 factors). Means with different superscript letters are significantly different (p < 0.05, ANOVA).
Page 2 of 16(page number not for citation purposes)
BMC Genomics 2008, 9:506 http://www.biomedcentral.com/1471-2164/9/506
higher whole body weight (p = 10-4) compared to those ofthe fat muscle line (F). Whole body lipid content wasincreased in fish fed the HE diet compared to those fed thelow energy diet (LE), and was similar for the two lines fedthe same diet. Muscle lipid content was higher in fish fedthe HE diet (p < 10-4) and in the F line (p < 10-4). Viscero-somatic index (VSI), used as an indicator of fat depositionas visceral adipose tissue, was increased in fish fed the HEdiet (p = 10-4) and in fish from the L line (p = 10-4).Plasma triglyceride levels were higher in fish fed the LEdiet (p = 10-4) and in fish of the F line (p = 0.02). Glyc-emia was not significantly different between diets (p =0.61) or lines (p = 0.97) 24 hours after the meal.
Microarray data analysisHepatic transcripts differentially expressed between the dietary treatmentsThe results derived from ANOVA (p < 0.01) and SAM(FDR < 0.15) analysis for global dietary effects (whateverthe lines) on hepatic gene expression are summarized inTable 2. A comparison of the two lists of genes generatedby these two analytical methods [see additional file 1]revealed that 106 genes were significant according to bothstatistical analyses. With regard to the ontology of these106 clones, 83 were attributed a biological function(Table 2). Our study was focused more particularly ongenes involved in the metabolic process since it was thelargest category represented (44.6% of the transcripts thathad a biological function). Lipid metabolism was the met-abolic pathway that contained the majority of the differ-
entially expressed transcripts (40.5%), with, in particular,genes encoding for proteins involved in lipid transport(acyl-CoA binding protein [ACBP], heart-type fatty acid-binding protein [H-FABP]), fatty acid desaturation (delta-6-desaturase [Δ6-FAD]) and cholesterol/steroid metabo-lism (cholesteryl ester transfer protein [CETP]), down-reg-ulated in trout from both lines fed the HE diet (Table 3).There were two different transcripts corresponding to theH-FABP protein (of ~800 bp and ~600 bp) that shared88% of sequence similarity. Their deduced amino acidsequences contained 94% similar residues, suggesting thatthese two transcripts may be different isoforms of H-FABP.
Several clones corresponding to enzymes involved in gen-eration of precursor metabolites and energy (6-phos-phogluconate dehydrogenase [6-PGD], pyruvatecarboxylase [PC] and subunits of the respiratory chaincomplexes), amino acid metabolism (D-3-phosphoglyc-erate dehydrogenase [3-PGDH], cystathionine γ-lyase[CGL] and acetylcholinesterase precursor [AChE]) andproteolysis were also found to be significantly reduced inthe livers of fish fed the HE diet compared to those fed theLE diet.
Hepatic transcripts affected by the selection procedureThe results derived from ANOVA (p < 0.01) and SAM(FDR < 0.15) analysis for global genetic selection effects(whatever the diet) on hepatic gene expression are sum-marized in Table 4. [For a complete list of genes identified
Table 2: Overview of transcripts in livers of rainbow trout significantly affected by the dietary treatment (HE vs LE diet)1
Statistical analysis ANOVA (p < 0.01) SAM FDR ≤ 0.15 ANOVA∩SAM
Total 165 111 106HE > LE 37 8 8HE < LE 128 103 98
Number of transcripts with known biological function 132 87 83Biological functionMetabolism 52 (39.4%) 38 (43.7%) 37 (44.6%)
Lipid 19 (14.4%) 15 (17.2%) 15 (18.1%)Energy 7 (5.3%) 5 (5.7%) 5 (6.0%)Carbohydrate 1 (< 1%) 1 (1.1%) 1 (1.2%))Amino acid and derivative 5 (3.8%) 3 (3.4%) 3 (3.6%)Protein folding/synthesis/breakdown 11 (8.3%) 6 (6.9%) 6 (7.2%)Xenobiotic and oxidant metabolism 5 (3.8%) 4 (4.6%) 4 (4.8%)Purine and pyrimidine 4 (3%) 4 (4.6%) 3 (3.6%)
Transcription/translation 21 (15.9%) 13 (15.1%) 12 (14.5%)Cell cycle 13 (9.8%) 6 (6.9%) 6 (7.2%)Trafficking 9 (6.8%) 6 (6.9%) 6 (7.2%)Signal transduction 8 (6.1%) 7 (8.0%) 7 (8.4%)Extracellular matrix and structural components 6 (4.5%) 5 (5.7%) 5 (6%)Immune and stress response 6 (4.5%) 5 (5.7%) 4 (4.8%)Others 17 (12.9%) 7 (8.0%) 6 (7.2%)
1 According to ANOVA (p < 0.01), SAM analysis (FDR < 0.15) and both statistical methods
Page 3 of 16(page number not for citation purposes)
BMC Genomics 2008, 9:506 http://www.biomedcentral.com/1471-2164/9/506
as significantly different between the two lines accordingto each statistical approach see Additional file 2]. Seventytranscripts were found to be significant by both statisticalmethods. Transcripts involved in metabolic pathwaysaccounted for 46% of the transcripts that had received abiological function (Table 4). Only two of these tran-
scripts were involved in lipid metabolism (ceramidekinase 1 and a nonspecific lipid-transfer protein) (Table5). A greater proportion of differential transcripts encodedfor proteins involved in xenobiotic and oxidant metabo-lism (22.2%), generation of precursors and energy (6-PGDH, malate dehydrogenase [MDH], ubiquinol cyto-
Table 3: Metabolism-related hepatic transcripts exhibiting differential expression between the two dietary groups (HE vs LE)1
Biological function HE/LE ratio ANOVA SAM
GenBank Acc. N° Best-hit Swiss-Prot description L line F line P-value FDR cut off
Lipid metabolism (40.5%)CA344881 Trifunctional enzyme subunit alpha, mitochondrial precursor -1.3 -1.4 < 5.10-4 0BX885839 Acetyl-CoA acetyltransferase, cytosolic (ACAT2) -1.5 -2.1 < 10-3 0BX861803 Phosphatidylinositol-glycan biosynthesis class F protein (PIG-F) -1.3 -1.2 0.003 0.1BX080468 Ectonucleotide pyrophosphatase/phosphodiesterase 7 precursor -1.3 -1.1 0.004 0.15Fatty acid desaturation (2.7%)CA371783 putative delta-6 fatty acid desaturase (Δ6-FAD) -1.9 -2.0 0.005 0.05Lipid transport (10.8%)CU069821 Acetyl coenzyme A binding protein (ACBP) -2.1 -1.9 < 5.10-5 0BX078901 Vitellogenin precursor (VTG) -1.2 -1.4 < 10-3 0.05CU069693 Heart-type fatty acid binding protein (H-FABP) -1.4 -1.5 < 10-3 0BX298066 Heart-type fatty acid binding protein (H-FABP) -1.6 -1.5 0.004 0.05Cholesterol metabolism (16.2%)BX875391 Probable ergosterol biosynthetic protein 28 (ERG28) -1.8 -2.3 < 5.10-6 0CU069450 24-dehydrocholesterol reductase precursor (DHC24) -1.8 -2.7 < 5.10-4 0CA344888 Retinol dehydrogenase 12 (RDH12) -1.2 -2.0 0.003 0.05CA382526 Orphan nuclear receptor NR1D2 (Rev-erbβ) -1.2 -1.2 0.004 0.15CA377380 C-4 methylsterol oxidase (ERG25) -1.2 1.5 0.006 0.1CU069541 Cholesteryl ester transfer protein precursor (CETP) -1.4 -1.2 0.006 0.15Generation of precursor metabolites and energy (13.5%)BX084640 6-phosphogluconate dehydrogenase, decarboxylating (6-PGD) -1.4 -2.2 < 5.10-4 0BX080843 Ubiquinol-cytochrome c reductase complex 9.5 kDa protein -1.4 -1.3 < 5.10-4 0BX886412 ATP synthase subunit alpha, mitochondrial precursor (ATPA) -1.1 -1.4 0.001 0.1CA377924 Vacuolar ATP synthase subunit δ (V-ATPase δ subunit) -1.2 -1.4 0.002 0.05CU067427 Pyruvate carboxylase, mitochondrial precursor -1.2 -1.1 0.008 0.15Carbohydrate metabolism (2.7%)CA383037 Solute carrier family 2, facilitated glucose transporter member 11 -1.7 -1.6 < 10-4 0Amino-acid derivative metabolism (8.1%)CU068986 Acetylcholinesterase precursor (EC 3.1.1.7) (AChE) -1.7 -1.7 < 5.10-4 0CU070780 D-3-phosphoglycerate dehydrogenase (3-PGDH) -1.4 -1.2 0.002 0.05CU067302 Cystathionine gamma-lyase (CGL) -1.4 -1.0 0.008 0.15Protein folding/synthesis/breakdown (16.2%)CU072931 Tripeptidyl-peptidase 2 -1.3 -1.7 < 10-4 0CA362332 Ubiquitin-conjugating enzyme E2 E1 (UB2E1) -1.3 -1.3 0.002 0.15CU068585 STIP1 homology and U box-containing protein 1 -1.4 -1.5 0.003 0.05BX307921 McKusick-Kaufman/Bardet-Biedl syndromes putative chaperonin -1.2 -1.4 0.005 0.15CA342952 Proteasome subunit beta type 7 precursor (PSB7) -1.2 -1.1 0.01 0.15CU066852 F-box/WD repeat protein 2 -1.4 -1.1 0.03 0.1Xenobiotic and oxidant metabolism (10.8%)CU070243 Peptide methionine sulfoxide reductase -1.3 -1.3 10-3 0.05CU071592 Cytochrome P450 2J2 (Arachidonic acid epoxygenase) 1.9 2.2 0.003 0.1BX081745 Matrix metalloproteinase-16 precursor 1.9 1.6 0.003 0.15BX308633 Stress-activated protein kinase 3 (MK12) -1.2 -1.3 0.008 0.15Purine metabolism (8.1%)CU073027 Ectonucleoside triphosphate diphosphohydrolase 1 -1.3 -1.1 < 10-3 0.05CA363765 Adenylate kinase isoenzyme 2, mitochondrial -1.3 -1.2 < 10-4 0.05CA371563 Ribonucleoside-diphosphate reductase large subunit 2.6 3.9 0.001 0.05
1 According to both ANOVA (p < 0.01) and SAM (FDR < 0.15) analysis
Page 4 of 16(page number not for citation purposes)

BMC Genomics 2008, 9:506 http://www.biomedcentral.com/1471-2164/9/506
chrome c reductase), amino-acid metabolism (transcriptsencoding for two aspartate aminotransferases [GOT], abetaine-homocysteine S-methyltransferase [BHMT] and a4-aminobutyrate aminotransferase) and proteolysis (pro-teasome and protein ubiquitinylation components). Allwere expressed at higher levels in the F line than in the Lline (Table 5).
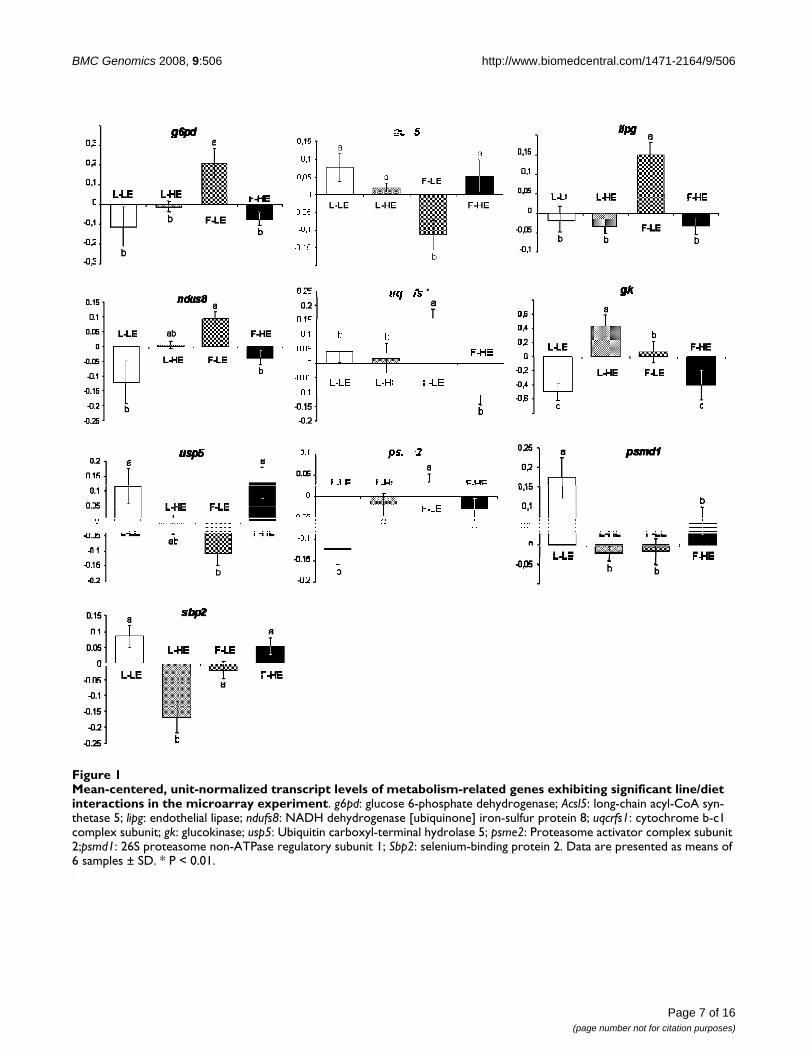
Hepatic transcripts involved in a line per diet interactionTwenty-six transcripts for which the effects of the diet weredependent on genotype were detected by the two-wayANOVA. Two of these encoded for proteins involved inimmune function, eight in cellular processes, and one intrafficking, four encoded for transcription factors, and tenwere involved in metabolic pathways. The latter are repre-sented in figure 1. It is of note that six of the ten significantinteractions that concerned metabolic genes occurred inthe F-LE group: transcript levels of four genes involved inlipid metabolism and energy production (glucose 6-phos-phate dehydrogenase [g6pd], endothelial lipase [lipg],NADH dehydrogenase [ubiquinone] iron-sulfur protein 8(ndus8), and cytochrome b-c1 complex subunit [uqcrfs1])were increased in the F-LE group, whereas the expressionof long-chain acyl-CoA synthetase 5 [acsl5], involved inthe activation of long chain fatty acids, and ubiquitin car-boxyl-terminal hydrolase [usp5], involved in proteolysis,were concomitantly decreased.
Confirmation of microarray data by real time RT-PCRChanges in gene expression demonstrated by microarrayanalysis were further confirmed with a small set of genesusing real time RT-PCR performed on nine trout liver sam-ples per experimental group, including the samples weused in the microarray experiment (see additional file 3).Genes were selected for each category of effects weobserved, i.e. fads2 (encoding for the protein Δ6-FAD, ordelta-6-desaturase) and pgdh3 (D3-phosphoglyceratedehydrogenase), which exhibited a significant diet-induced change, got2 (aspartate aminotransferase) andmdh (malate dehydrogenase), that were found to be dif-ferentially expressed between lines, pgd (6-phosphogluco-nate dehydrogenase), that was regulated by both factors,and finally g6pd (glucose-6-phospahte dehydrogenase)and gk (glucokinase), for which a line/diet interaction wasdetected. The real time RT-PCR analysis of fads2 (delta-6-desaturase) not only confirmed the dietary effect detectedby microarray analysis, but also revealed a significant lineeffect, with higher expression in the F line than in the Lline.
2-D gel analysis of soluble liver proteinsOver 900 different spots were detected in at least oneexperimental condition, and 570 were detected in all fourgroups. According to the two-way ANOVA analysis, 265protein spots showed a change in abundance betweenexperimental conditions (p < 0.05). Of them, 70 were
Table 4: Overview of hepatic transcripts exhibiting differential expression between the two genotypes (F vs L)1
Statistical analysis ANOVA (p < 0.01) SAM FDR ≤ 0.15 ANOVA∩SAM
Total 154 77 70F > L 90 65 58F < L 64 12 12
Transcripts with known biological function 127 64 58
Biological functionMetabolism 47 (37.0%) 30 (46.7%) 27 (46.6%)
Lipid (4.67%) 2 (3.1%) 2 (3.4%)Precursor metabolites and energy 7 (5.5%) 6 (9.4%) 5 (8.6%)Carbohydrate 2 (1.6%) 1 (1.6%) 1 (1.7%)Amino acid and derivative 9 (7.1%) 6 (9.4%) 5 (8.6%)Protein folding/synthesis/breakdown 11 (8.7%) 6 (9.4%) 5 (8.6%)Xenobiotic and oxidant 7 (5.5%) 6 (9.4%) 6 (10.3%)Purine and pyrimidine 3 (2.4%) 3 (4.7%) 2 (3.4%)Iron 2 (1.6%) 1 (1.6%) 1 (1.7%)
Transcription/translation 19 (15.0%) 3 (4.7%) 2 (3.4%)Immune response 7 (5.5%) 5 (7.8%) 5 (8.6%)Trafficking 11 (8.7%) 5 (7.8%) 5 (8.6%)Signal transduction 7 (5.5%) 3 (4.7%) 3 (5.2%)Cell cycle 9 (7.1%) 5 (7.8%) 4 (6.9%)Extracellular matrix and structural components 9 (7.1%) 3 (4.7%) 2 (3.4%)Others 18 (14.2%) 10 (15.6%) 10 (17.2%)
1 According to ANOVA (p < 0.01), SAM analysis (FDR < 0.15) and both statistical methods
Page 5 of 16(page number not for citation purposes)
BMC Genomics 2008, 9:506 http://www.biomedcentral.com/1471-2164/9/506
deemed to be of sufficient quality to allow peptide massfingerprinting, and 36 yielded significant identities (seeAdditional file 4). Of the 36 proteins identified, 28 corre-sponded to proteins involved in metabolic pathways(78%). In particular, we identified two protein species ofheart-type fatty acid binding protein (H-FABP), with dif-ferent isoelectric points and molecular weights (figure 2).The best match for trypsin digest products from these twospots corresponded to the two EST printed on the micro-array that we found to be differentially expressed usingtranscriptome analysis (Genbank accession numbersBX298066 and CU069693). We also identified two α-1enolase and two transketolase protein species.
Three proteins involved in intracellular lipid transport(two H-FABPs and ACBP) were reduced with the HE diet,
in agreement with the results observed with the transcrip-tome analysis. In addition, the two H-FABPs showedgreater abundance in the F line than in the L line, an effectthat was not evidenced at the transcript level. Glycerol-3-phosphate dehydrogenase (G3PDH) that is involved inphospholipid biosynthesis was also more highlyexpressed in the F line than in the L line. Finally, apolipo-protein A-1 (Apo A-1), the major protein in high-densityplasma lipoprotein, was specifically up-regulated in the Lline fed the HE diet (L-HE group).
Two proteins involved in the generation of precursormetabolites and energy were identified, i.e. NADP-dependent isocitrate dehydrogenase (ICDH-NADP),which was lower in fish fed the HE diet, and ubiquinolcytochrome c reductase, a component of the respiratory
Table 5: Hepatic transcripts exhibiting differential expression between the two genotypes (F vs L)1
Biological function F/L ratio ANOVA SAM
GenBank Acc. N° Best-hit Swiss-Prot description LE diet HE diet P-value FDR cut off
Lipid metabolism (7.4%)BX857103 Ceramide kinase -1.6 -2.8 < 10-3 0.1CA376046 Nonspecific lipid-transfer protein (NLTP) 1.4 1.1 10-3 0.1Generation of precursor metabolites and energy (18.5%)CA366638 10-formyltetrahydrofolate dehydrogenase 1.8 1.5 < 5.10-4 0CA342644 6-phosphogluconate dehydrogenase (6-PGDH) 2.0 1.3 0.002 0.15BX860760 10-formyltetrahydrofolate dehydrogenase 2.0 1.9 0.003 0CA351158 Malate dehydrogenase, cytoplasmic (MDH) 1.4 1.2 0.003 0.1BX301878 Ubiquinol-cytochrome c reductase iron-sulfur subunit 1.6 1.4 0.006 0.1Carbohydrate metabolism (3.7%)BX306300 Protein phosphatase 1 regulatory subunit 3D 1.3 1.5 0.008 0.15Amino-acid derivative metabolism (18.5%)CA343008 Betaine-homocysteine S-methyltransferase (BHMT) 1.5 1.2 < 5.10-4 0BX076291 Aspartate aminotransferase, mitochondrial (GOT2) 1.6 1.2 10-3 0.1CA353510 Aspartate aminotransferase, mitochondrial (GOT2) 1.1 1.2 0.004 0.15CA345122 4-aminobutyrate aminotransferase, mitochondrial (GABT) 1.4 1.1 0.004 0.15CA365793 Histone H3-K9 methyltransferase 4 1.3 1.2 0.006 0.15Protein folding/synthesis/breakdown (18.5%)CA345680 Calpain-9 1.3 1.1 < 5.10-4 0.15CA362332 Ubiquitin-conjugating enzyme E2 E1 (UB2E1) 1.3 1.4 < 10-3 0.1CA351453 α-1,3-mannosyl-glycoprotein
2-beta-N-acetylglucosaminyltransferase 1.3 1.2 < 10-3 0.1CA342952 Proteasome subunit beta type 7 precursor (PSB7) 1.6 1.5 0.002 0.1BX302854 Proteasome-associated protein ECM29 homolog 1.5 1.6 0.003 0.1Xenobiotic and oxidant (22.2%)CA359966 UDP-glucuronosyltransferase 2A1 precursor 1.3 1.6 < 5.10-4 0BX302905 Metal-regulatory transcription factor 1 1.2 1.4 0.003 0.1CA387417 Stress-activated protein kinase 3 (MK12) 1.5 1.3 0.004 0.15BX078145 7,8-dihydro-8-oxoguanine triphosphatase 1.8 1.0 0.004 0.15BX305962 ATP-binding cassette sub-family G member 2 1.5 1.6 0.007 0.1BX299516 Cytochrome P450 2K4 1.3 1.2 0.007 0.15Purine and pyrimidine metabolism (15%)BX295336 Nucleoside diphosphate kinase A -1.3 -1.1 < 5.10-4 0.15CA381176 Equilibrative nucleoside transporter 1 -1.4 -1.4 < 10-3 0.15Iron metabolism (3.7%)BX909008 Transferrin receptor protein 1 -1.6 -1.4 0.005 0.15
1 According to both ANOVA (p < 0.01) and SAM (FDR < 0.15) analysis
Page 6 of 16(page number not for citation purposes)
BMC Genomics 2008, 9:506 http://www.biomedcentral.com/1471-2164/9/506
Page 7 of 16(page number not for citation purposes)
Mean-centered, unit-normalized transcript levels of metabolism-related genes exhibiting significant line/diet interactions in the microarray experimentFigure 1Mean-centered, unit-normalized transcript levels of metabolism-related genes exhibiting significant line/diet interactions in the microarray experiment. g6pd: glucose 6-phosphate dehydrogenase; Acsl5: long-chain acyl-CoA syn-thetase 5; lipg: endothelial lipase; ndufs8: NADH dehydrogenase [ubiquinone] iron-sulfur protein 8; uqcrfs1: cytochrome b-c1 complex subunit; gk: glucokinase; usp5: Ubiquitin carboxyl-terminal hydrolase 5; psme2: Proteasome activator complex subunit 2;psmd1: 26S proteasome non-ATPase regulatory subunit 1; Sbp2: selenium-binding protein 2. Data are presented as means of 6 samples ± SD. * P < 0.01.

BMC Genomics 2008, 9:506 http://www.biomedcentral.com/1471-2164/9/506
chain, that was more abundant in the F line than in the Lline. ICDH-NADP was in addition markedly reduced in Lfish fed the HE diet (L-HE group).
Six proteins involved in carbohydrate metabolism, partic-ularly in glycolysis/gluconeogenesis (GAPDH, transaldo-lase, two α-1 enolase and two transketolase species) wereexpressed at lower levels in fish fed the HE diet comparedto fish fed the LE diet. With regard to the selection effect,GAPDH, phosphoglucomutase (PGM), one α-enolaseand one transketolase were more abundant in the F linethan in the L line. In addition, line/diet interactions wereobserved for PGM, the two α-1 enolases and the two tran-
sketolases that were considerably less abundant in L fishfed the HE diet (L-HE group).
Several key enzymes involved in amino acid metabolismwere identified: glutamate dehydrogenase (GDH) andalanine:glyoxylate aminotransferase (AGX), bothinvolved in amino acid transamination, and betaine alde-hyde dehydrogenase (BADH), involved in sulfur aminoacid bioconversion pathways, were expressed at lower lev-els in fish fed the HE diet, whereas serine hydroxymethyltransferase was expressed at higher level in these fish.Aspartate aminotransferase (GOT), GDH, AGX andhomogentisate 1, 2-dioxygenase (HGD) were detected ingreater abundance in the F line than in the L line. In con-
Representative two-dimensional gel electrophoresis of rainbow trout liver proteinsFigure 2Representative two-dimensional gel electrophoresis of rainbow trout liver proteins. Total liver protein extract (150 μg) was separated first by IEF on 3–10 non-linear IPG drystrips, and then SDS-PAGE was performed on 12.5% polyacryla-mide gel. The proteins were revealed by silver staining as described by Heukeshoiven and Dernick (1985). Differentially abun-dant proteins positively identified by trypsin digest fingerprinting are located by arrows, with their corresponding identity and spot ID.
Page 8 of 16(page number not for citation purposes)

BMC Genomics 2008, 9:506 http://www.biomedcentral.com/1471-2164/9/506
trast, serine hydroxymethyltransferase (SHMT) and 4-hydroxyphenylpyruvate dioxygenase (4HPPD) wereexpressed at higher levels in the L line.
Finally, we identified four proteins related to oxidativecell status, i.e. glutathione peroxidase (GPX) and glutath-ione S transferase (GST), involved in the anti-oxidantprocess, as well as stress-activated protein kinase 3(MK12) and arylamine N-acetyltransferase, that areinduced by oxidative stress conditions. Lower levels of thetwo anti-oxidant enzymes were detected in the F line thanin the L line, whereas the two stress-induced proteins wereless abundant in the latter. Of these four proteins, onlyGPX showed a diet-induced change in abundance, withhigher protein levels upon HE diet feeding.
DiscussionAgreement between transcriptome and proteome analysesTranscriptome and proteome analysis constitute powerfultools for obtaining a view of the changes induced bygenetic selection procedures and molecular adaptations todietary treatments. The combination of the twoapproaches was justified in several respects. Indeed, theexpression of a transcript and that of its correspondingprotein are not necessarily related. Although much rele-vant information can be obtained from proteome analysisalone, the current proteomics technologies have somelimitations of a technical order [21]. In addition, we arecurrently limited in the sequenced proteins available forfish species, in particular rainbow trout. About half of thespectra generated in this study led to significant proteinidentification. The combination of microarray and pro-teome analyses therefore makes it possible, to someextent, to get round the drawbacks associated with eachmethod and to extract complementary information fromthese two independent methods.
In the present study, these two overall approaches pro-vided consistent results. Some of the differentiallyexpressed proteins we identified were also found onmicroarray to have altered mRNA levels (two H-FABPs,ACBP, GOT, GAPDH and the stress-activated proteinkinase 3 [MK12]). The changes in abundance detected forthese proteins were in accordance with the changesobserved at the mRNA level.
Long term effects of a high energy/high lipid diet on the hepatic gene and protein expression profilesOne of the aims of the present study was to examine thechanges in hepatic gene and protein expression profilesinduced by long term feeding of a high energy/high fatdiet. As could be expected, given the large number ofgenes that are transcriptionally regulated by dietary fattyacids, particularly PUFAs [22], a high proportion of thetranscripts that showed differential expression between
dietary groups were involved in lipid metabolism. Threeproteins involved in intracellular fatty acid transport (oneACBP and two H-FABPs) exhibited lower abundance atboth mRNA and protein levels in fish fed the HE diet. H-FABPs belong to a family of small, cytosolic proteins thatbind long-chain fatty acids and cholesterol. They are pre-dominantly expressed in the heart, skeletal muscle andtestes of mammals [23], but have been detected in a widerrange of tissues, including the liver, in several fish speciessuch as zebrafish, mummichog and lamprey [24-26].Whereas H-FABP is thought to be involved in fatty aciduptake and transport toward mitochondrial β-oxidationin muscle tissues, as evidenced in mammals and Atlanticsalmon [27-29], indications that H-FABP may also medi-ate intracellular fatty acid sequestration and transporttoward the lipogenic process in the liver and oocytes havebeen reported in zebrafish [26]. Our results support thelatter assumption, since the change in H-FABP level coin-cided with a decrease in the activity of key lipogenicenzymes [30]. ACBP is an intracellular lipid-binding pro-tein that selectively binds medium and long chain acyl-CoA esters (C14–C22) with high specificity [31]. Studiesin yeast [32] and the mouse [33] have suggested thatACBP may play a role in the synthesis of very long chainfatty acids, with dual regulation by both PPARα andSREBP-1, as for Δ5 and Δ6 desaturases [34]. The HE dietdown-regulated the gene expression of 6-phosphogluco-nate dehydrogenase (6-pgd), a key enzyme of the pentosephosphate pathway that provides NADPH for the lipo-genic process. The HE diet also decreased transcript levelof Δ6-desaturase (Δ6-fad), a rate-limiting enzyme for thesynthesis of highly unsaturated fatty acids (HUFAs). Fishoil is particularly rich in (n-3) polyunsaturated fatty acidand several studies performed in mammals [35] and sal-monids [36-38] have demonstrated that a HUFA-rich dietreduces hepatic mRNA levels of Δ5- and Δ6-desaturases.Increasing the level of dietary (n-3) fatty acid supply hasbeen shown to enhance enzymes of the antioxidantdefense system such as GPX and catalase at both activityand mRNA levels [39]. Accordingly, we found that proteinlevels of GPX, a key enzyme in the antioxidant defensesystem, were increased in fish fed the HE diet, which con-tained 15% fish oil.
The protein abundance of GDH and AGX, two keyenzymes of amino acid transamination and indicators ofmetabolic utilization of dietary amino acids, was lower infish that received the HE diet. Some transcripts involved inproteasome-dependent proteolysis were also expressed atlower level with this diet. Fish swiftly use proteins as oxi-dative substrates [40,41]. Thus, increasing non-proteinenergy-yielding nutrients such as lipids generally leads toa protein sparing effect, probably by redirecting dietaryprotein and amino acids from energy production towardtissue deposition [42,43]. This is consistent with the
Page 9 of 16(page number not for citation purposes)

BMC Genomics 2008, 9:506 http://www.biomedcentral.com/1471-2164/9/506
enhanced protein efficiency ratio and growth perform-ance observed in fish fed the HE diet, as previouslydescribed [30]. Feeding the HE diet was also associatedwith reduced levels of transcripts and proteins involved insulfur amino acid bioconversion, such as 3-PGDH, CGL,or BADH. This might reflect a decrease in amino acid turn-over in response to higher lipid supply, a nutritional con-text that would allow the cell to rely less heavily on the useof essential amino acids such as methionine to meet theirenergy requirements.
Long term feeding a diet supplemented in fish oil hasbeen shown to induce substantial lowering of blood trig-lycerides (at least in part) by inhibiting the productionand secretion of triglyceride-rich lipoprotein particles bythe liver [44]. The plasma triglyceride level was consist-ently lower in fish fed the HE diet than in fish fed the LEdiet. A reduction in lipogenesis associated to a stimulationof fatty acid oxidation in the liver, as suggested by our pre-vious results [30], resulting from the higher level of fishoil provided by the HE diet might have decreased triglyc-eride and VLDL secretion in circulating blood.
Hepatic transcripts and proteins affected by the selection procedureIn contrast to the results observed regarding the dietaryeffect on hepatic gene expression, the transcriptome anal-yses revealed minor changes in lipid metabolism inducedby the selection procedure. However, the proteomeapproach yielded some complementary information, ashigher levels of the two H-FABP proteins were present inthe livers of the F line compared to the L line. This mighthave been due to post-transcriptional regulation, or toincreased stability of these two proteins in the F line hepa-tocytes. Abundance of G3PDH, involved in phospholip-ids biosynthesis, was also increased in F fish livers. Inaddition, real time RT-PCR measurement of fads2, encod-ing for the delta-6-desaturase, an enzyme involved in fattyacid desaturation, showed increased mRNA levels in the Fline. All these results, together with increased gene expres-sion of 6-PGD, a key enzyme that provide NADPH forlipogenic process, suggest greater hepatic lipid biosynthe-sis in the F line. This is in good agreement with the higheractivity of acetyl-CoA carboxylase, as previously evidenced[30], although no differences in fatty acid synthase activitycould be found between the two lines [30].
However, most of the alterations induced by the selectionprocedure we observed occurred in protein and aminoacid metabolism. In particular, levels of mitochondrialaspartate aminotransferase (GOT), GDH and AGX, threekey enzymes that play a major role in amino acid catabo-lism, were increased in the livers of F fish. Transcripts andproteins that functioned in amino acid bioconversion(BHMT and GABT) and in proteasome-dependent prote-
olysis were also enhanced in this line. All these findingsmay reflect an increase in hepatic flux for energy produc-tion through amino acid metabolism in the F line com-pared to the L line. This is in agreement with the lowergrowth rate and protein efficiency observed for the F line[30]. Interestingly, some studies have reported strong evi-dence that amino acid catabolism may be negatively reg-ulated by the peroxisome proliferator-activated receptor α(PPARα) in rodent liver [45-47]. In agreement with this,PPARα expression was lower in the F line than in the Lline [30]. The increase in amino acid metabolism sug-gested here could thus be mediated through weaker inhi-bition of related genes by PPARα. This phenomenon haspreviously only been described in the mouse and rat.Although this remains to be confirmed by appropriateexperiments in fish, the fact that such a mechanism mightalso operate in lower vertebrates would support the ideathat regulation of amino acid metabolism by PPARαmight be evolutionarily conserved throughout verte-brates.
The lower protein levels of two key enzymes in the anti-oxidant defense system (GPX and GST) observed in the Fline might be explained by a lower production of reactiveoxygen species (ROS) derived from fatty acid oxidation.
Taken together, all these findings suggest that a differencein nutrient utilization occurs between the two lines, the Lline having a higher propensity to oxidize fatty acids thanthe F line [30], which may use comparatively more pro-tein and amino acids for energy production. This differ-ence in nutrient utilization could be at least in partorchestrated by PPARα, exerting opposing controls offatty acid oxidation and amino-acid catabolism.
Plasma triglyceride levels were higher in the F line than inthe L line. Increased fatty acid synthesis and decreasedfatty acid oxidation in the liver of the F line might have ledto enhanced fatty acid availability for triglyceride and sub-sequently VLDL production. Another hypothesis might bethat a decreased extra-hepatic tissue lipid uptake in the Fline compared to the L line also contribute to their higherblood triglyceride levels by lowering triglyceride clearancefrom plasma. Further analysis of the muscle and visceraladipose tissue lipid uptake should enlight this point.
Comparing the effects of the HE diet and upward selection for muscle fat content on hepatic expression profilesSignificant effect exerted by both dietary treatment andgenetic background were observed for some liver tran-scripts and proteins involved in processes such as cellcycle, transcription/translation, immune response andmetabolic pathways. Overall, the HE diet and upwardselection for muscle fat content exerted opposite effects inthe liver. In particular, the expression of genes and pro-
Page 10 of 16(page number not for citation purposes)

BMC Genomics 2008, 9:506 http://www.biomedcentral.com/1471-2164/9/506
teins involved in lipid biosynthesis and amino acid andprotein catabolism were decreased by the HE diet, andwere increased in the F line compared to the L line. Sometranscripts and proteins were involved in line/diet interac-tions, but they did not fall into function-related groups,except for the protein involved in glycolysis/neoglucogen-esis, the abundance of which was decreased in the livers offish from the L-HE group. Gene expression level of GK, akey enzyme of glycolysis that plays a major role in glucosehomeostasis, was particularly high in the L-HE groupcompared to the three other groups. We are currently notable to explain the magnitude of changes observed for GKgene expression, since these changes are not correlatedwith glycaemia. This might reflect a disturbance of carbo-hydrate metabolism in the L line. Further analyses areneeded, such as glucose tolerance test or post-prandialkinetics of glycaemia and GK gene expression. The relativefew number of genes and proteins affected by both factorsas well as line/diet interactions observed in the presentwork is in agreement with the results derived from ourprevious study [30]. All together, these results suggest thatthe dietary treatment and the genetic selection used in thisstudy to manage muscle fattening are likely to act throughdifferent metabolic actors in the liver. The present studyreveals that the cumulative effect exerted by the geneticselection and the high energy diet on muscle fattening isnot associated with cumulative changes of hepatic meta-bolic pathways.
ConclusionThe combination of liver transcriptome and proteomeanalysis led to the identification of several molecules thatresponded to the dietary treatments and the genetic selec-tion for muscle fattening.
The increase in dietary energy and lipid supply providedby the HE diet induced significant changes in the hepatictranscriptome and proteome. The present findings con-firmed the effects of long term feeding of a high-PUFA dieton the expression of genes and proteins involved in fattyacid desaturation and anti-oxidant metabolism previouslydescribed in mammals, suggesting that the underlyingmolecular mechanisms are evolutionarily conserved. Theuse of high throughput technologies led to the identifica-tion of previously unappreciated molecular actors, such asthose involved in amino acid and protein metabolism,which responded to long term feeding with a high energy/high fat diet. They provide complementary informationon the effects of dietary fat levels on genes involved in theregulation of energy metabolism.
Although muscle was the direct target, the selection proce-dure applied significantly affected hepatic metabolism.The main changes observed were in transcripts and pro-teins involved in amino acid and protein catabolism that
were higher in the F line than in the L line. Some tran-scripts involved in lipogenesis were also increased in the Fline compared to the L line. To our knowledge, the presentstudy is the first that provides insights into the hepaticmetabolic changes associated with differences in body fatdistribution in a context of similar whole body fat con-tent. We identified genes and proteins that could be usedas markers to prevent excess muscle fat accumulation.
Further analysis of the muscle and visceral adipose tissuetranscriptome and/or proteome will provide greaterunderstanding of the mechanisms that are responsible forthe differences in fat allocation between the two lines andof the fattening effects of a high energy/high fat diet onthese body compartments.
MethodsExperimental animals and dietsThe animals used in this study were the same as thosedescribed in Kolditz et al. [30]. Briefly, two lines of rain-bow trout, a lean muscle line (L) and a fatty muscle line(F), were obtained after three generations of divergentselection for high or low muscle fat content, evaluatedusing a non-destructive method (Distell Fish Fatmeter) inlive fish. Triplicate groups of fish of both lines were feddiets containing either 100 g (LE diet) or 230 g (HE diet)lipids/kg dry matter, from the first feeding for six months.Both diets were made from the same fishmeal-based mix-ture. About 15% fish oil was added to the HE diet to createa large difference in lipid content between the two diets.The inclusion of fish oil in the HE diet resulted in anincrease in the overall energy content of the HE diet(+13%) compared to the LE diet. The main change innutrient content involved the lipid fraction (+135%higher level in the HE diet) with an increase in n-3/n-6polyunsaturated fatty acids ratio (+67% in the HE diet).Minor changes occurred in protein and starch content,both being decreased in the HE diet (-11% and -24%,respectively) as a consequence of a dilution effect (Table6). At the end of the 6 month feeding trial, all fish wereanesthetized with 2-phenoxyethanol at the recommendeddose for surgical procedures (0.2 ml/l) 24 hours after themeal, and individually weighed. Nineteen fish per tankwere sacrificed by a sharp blow on the head. Livers and
Table 6: Chemical composition of experimental diets
Diets LE HE
DM (%) 93.0 93.3Protein (% DM) 57.6 51.1Lipid (% DM) 9.8 23.1
n-3 FA/n-6 FA 1.5 2.5Starch (% DM) 12.1 9.2Energy (kJ/g DM) 21.0 23.8
DM, Dry Matter; FA, Fatty acids
Page 11 of 16(page number not for citation purposes)

BMC Genomics 2008, 9:506 http://www.biomedcentral.com/1471-2164/9/506
viscera were weighed in order to calculate the hepato-somatic index (HSI (%) = [100 × (liver weight/bodyweight)]), and the viscero-somatic index (VSI (%) = [100× (total viscera weight/body weight)]). Fillets from the leftside of the fish were kept after trimming and skin removalas samples for analysis of lipid content. The livers of threefish per tank were sampled under RNAse-free conditionsto perform gene and protein expression analysis. All thetissue samples were frozen in liquid nitrogen and storedat -80°C until analysis. The experiment was conductedaccording to the National Guidelines for Animal Care of theFrench Ministry of Research.
RNA extractionThe RNA extracts used for the present microarray and realtime PCR analyses were the same as used by Kolditz et al.[30]. Total RNA was extracted from 9 individual livers perexperimental condition using the TRIzol reagent method(Invitrogen, Carlsbad, CA, USA). Total RNA was quanti-fied using spectrophotometry based on absorbance at 260nm, and integrity was ascertained using the Agilent 2100Bioanalyzer (Agilent Technologies, Kista, Sweden).
cDNA microarray productionNylon microarrays were obtained from the INRA-GADIEBiological Resources Center (Jouy-en-Josas, France) [48].The microarrays contained 9023 distinct rainbow troutcDNAs originating from a normalized multi-tissue library[49]. Positive (luciferase) and negative (water) controlswere also spotted on each microarray. This rainbow troutgeneric array was deposited in the Gene Expression Omni-bus (GEO) database (Platform# GPL3650) [50].
Microarray hybridizationSix hepatic RNA samples out of the 9 that were extractedfrom each experimental condition were randomly chosenand used for microarray hybridization at the INRAUMR1067 transcriptome facility (St-Pée-sur-Nivelle,France). A first hybridization was performed at 42°C for48 h using a 33P-labelled oligonucleotide (TAATACGACT-CACTATAGGG, sequence which is present at the extrem-ity of each PCR product) to monitor the amount of cDNAin each spot. After stripping (3 hours 68°C, 0.1× SSC,0.2% SDS), arrays were prehybridized for 1 h at 42°C inhybridization solution (5× Denhardt's, 5× SSC, 0.5%SDS). Labelled cDNAs were prepared from 3 μg of RNA bysimultaneous reverse transcription and labelling for 1hour at 42°C in the presence of 30 μCi [alpha-33P] dCTP,0.6 μl 120 μM cold dCTP, 0.6 μl 20 mM dATP, dTTP,dGTP and 200 units SuperScript™ III Reverse Transcriptase(Invitrogen, Carlsbad, CA, USA) in 30 μL final volume.RNA was degraded by treatment at 68°C for 30 min with1 μl 10% SDS, 1 μl 0.5 M EDTA and 3 μl 3 M NaOH, andthen equilibrated at room temperature for 15 min. Neu-tralization was done by adding 10 μl 1 M Tris-HCl plus 3
μl 2N HCl. 2 μg of PolydA 80 mers were then added to thesolution to saturate polyA tails. Arrays were incubatedwith the corresponding denatured labelled cDNAs for 48h at 65°C in hybridization solution. After 3 washes (1hours 68°C, 0.1× SSC 0.2% SDS), arrays were exposed 60hours to phosphor-imaging plates before scanning usinga FUJI BAS 5000.
Microarray signal processingSignal intensities were quantified using AGScan software[51], and normalization was performed using BASE soft-ware (BioArray Software Environnement), a MIAME-com-pliant database available at the bioinformatics facilitySIGENAE [52]. Spots with an oligonucleotide signal lowerthan three times the background level were excluded fromthe analysis. After this filtering step, signal processing wasperformed using the vector oligonucleotide data to correcteach spot signal according to the actual amount of DNApresent in each spot. After correction, the signal was nor-malized by dividing each gene expression value by themedian value of the array and then log transformed.Microarray data from this study have been deposited inthe GEO database (Series# GSE12031) [50].
Statistical analysis of microarray dataA total of 7740 clones out of 9023 (86%) passed throughthe background filter and were kept for further analysis.To evaluate potential interactions of diet and genotype,variations in gene expression were analyzed by two-wayANOVA (p < 0.01) for each gene, using Tiger TMEV 3.1software [53], with dietary treatment and genotype asindependent variables. When interactions were signifi-cant, means were compared using the Student NewmanKeuls test. Analysis of the global effect of each mean factor(diet or genotype) was complemented by a two classunpaired comparison of Significance Analysis of Microar-ray (SAM) [54] using the Microsoft Excel software. TheSAM analyses were performed on the whole set of datausing different FDR cut offs (from 0 to 25% estimatedfalse positives) on the following group comparisons: 1)HE vs LE, whatever the line 2) L vs F, whatever the diet. Wechose a moderate FDR cut off of 0.15 that allow sufficientpower while keeping the estimated number of false posi-tives acceptable. Only transcripts concordantly identifiedby both statistical approaches were considered in thepresent study to assess the global effect of the diet on onehand, of the genotype on the other hand. Their expressionratios were calculated as 10log(A)-log(B), A and B beingrespectively the mean expression value of HE and LE cal-culated within each line, or F and L, calculated withineach dietary group.
Data miningRainbow trout sequences originating from INRA AGENAE[55] and USDA [56] EST sequencing programs were used
Page 12 of 16(page number not for citation purposes)

BMC Genomics 2008, 9:506 http://www.biomedcentral.com/1471-2164/9/506
to generate publicly available contigs. The 8th version(Om.8, released January 2006) was used for BlastX [57]comparison against the Swiss-Prot database (January2006) [58]. This was performed automatically for eachEST spotted onto the membrane and used to annotate the9023 clones of the microarray. For all genes identified asdifferentially abundant in the transcriptome analysis,ontologies were obtained using the GoMiner software[59] and complemented when necessary with informa-tion from the literature. When feasible, functional catego-ries were allocated as they related to liver biology.
Gene expression analysis: qRT-PCRNine individual samples per experimental condition wereused as biological replicates, including the six samplesused for microarray hybridization. Real-time PCR meas-urements were performed as described in Kolditz et al.[30] on a set of genes selected for each category of effectsobserved (dietary effect alone, selection effect alone, die-tary effect + selection effect, line/diet interaction). TheGenbank accession numbers, the sequences of the for-ward and reverse primers and the corresponding anneal-ing temperature used for each gene tested for itsexpression are described in Additional file 5. Relativequantification of the target gene transcript with ef1α refer-ence gene transcript [60] was made following the methoddescribed by Pfaffl [61] using the equation 1. The effect ofdietary treatment, lines and line/diet interaction on real-time PCR data were tested using the statistical softwareSAS® by means of a two-way ANOVA. Differences wereconsidered significant when the probability level was <0.05. When interactions were significant, means werecompared using the Student-Newman-Keuls test.
Protein extractionFive individual liver samples for each experimental condi-tion were used for proteome analyses. They were ran-domly chosen among the 6 animals per condition usedfor microarray analysis. Samples (100 mg) of frozen tissuewere homogenized in lysis buffer (8 M urea, 4% (w/v)CHAPS, 40 mM Tris-HCl, 1 mM EDTA, 50 mM DTT, 1mM AEBSF, 10 μM E-64) at room temperature, using anUltra-Turrax homogenizer. Following homogenization,the tissue lysates were first centrifugated at 15,000 g for 30min at 18°C, and subsequent supernatants were then cen-trifugated at 105,000 g for 1 hour at 18°C to remove anyinsoluble particles. The supernatant was then added to1% (w/v) IPG buffer pH 3–10 NL (Amersham Bio-sciences) and stored at 70°C until gel electrophoresis wasperformed.
Two-dimensional polyacrylamide gel electrophoresisGels were made in triplicate for each sample. Samples(150 μg total proteins) were diluted to 450 μL withDeStreak solution supplemented with 0.5% IPG bufferpH 3–10 NL (Amersham Biosciences). After incubation
for 1 hour at room temperature, samples were loadedonto a 24 cm nonlinear immobiline dry strip, pH range3–10 (IPG drystrips 3–10 NL, 24 cm; Amersham Bio-sciences). Isoelectric focusing (IEF) was performed usingan IPGphor IEF system (Amersham Biosciences). Afteractive in-gel sample rehydration, carried out at 30V over12 hours, proteins were focused using five phases ofstepped voltages from 200 to 8000 V, with total focusingof 78,810 Vh (all stages at 2 mA and 5 W). The strips werethen equilibrated twice for 15 min with gentle shaking inequilibration solution containing 6 M urea, 50 mM Tris-HCl buffer, 30% glycerol, 2% SDS. DTT (65 mM) wasadded to the first equilibration solution in order to reducedisulfide bridges. Iodoacetamide (2.5%) and 0.5%bromophenol blue were added to the second solution.SDS-PAGE was then carried out using an Ettan Dalt6 unit(Amersham Biosciences). The IPG strip was laid onto a12.5% constant concentration polyacrylamide slab gel(24 × 18 cm). Running was conducted using a two-stepprogram, with 2.5 W/gel for 40 min, and then increasedto 17 W/gel for 4 hours. For subsequent image analysis,fixed 2-D gels were silver-stained as described by Heuke-shoven and Dernick [62]. Molecular masses of the pro-teins were determined by coelectrophoresis with standardprotein markers. Isoelectric points were determinedaccording to the IPG strip manufacturer's specifications.
Analysis of 2D gelsThe gels were scanned at a resolution of 200 dpi using anImageScanner apparatus (GE Healthcare) and stored asTIF files. Subsequent analysis of the gel images was per-formed using the software package Image Master 2D Plat-inum Version 5.0 (Amersham Biosciences). Protein spotswere detected using an automated procedure from thesoftware combined with manual editing to remove arte-facts. A reference gel was developed using 200 μg of totalprotein from a pool of all sample protein extracts in orderto represent all the proteins they expressed, and againstwhich all the remaining gels were matched using standardroutines from the software. After the matching procedure,all protein spots were assigned a spot number from thereference gel. Individual protein spot abundance wasdetermined by the area of the spot, multiplied by the den-sity and referred to as the volume. The spot volumes werenormalized to the total volume of all proteins detected oneach gel. The normalized spot volume is described as theabundance of a particular protein spot. Data were subse-quently analyzed using two-way ANOVA. The level of sig-nificance of difference was set at P < 0.05.
Protein identification by peptide mass mappingFor protein identification, proteins resolved by 2D-PAGEwere detected using silver staining compatible with pro-tein mass spectrometry identification, as described by Yanet al. [63] and Coomassie Blue G250 [64]. Sample loadingwas increased from 150 μg to 600 μg. Proteins of interest
Page 13 of 16(page number not for citation purposes)

BMC Genomics 2008, 9:506 http://www.biomedcentral.com/1471-2164/9/506
were excised from the stained gel and subjected to in-geltrypsin digestion, as described by Com et al. [65]. Theeluted peptides were subsequently analyzed by mass fin-gerprinting in a Matrix-assisted laser desorption time offlight (MALDI-TOF) mass spectrometer (Bruker Dalton-ics, Bremen, Germany). For protein identification, trypsinpeptide masses were used to search the National Centerfor Biotechnology Information (NCBI) non-redundantsequences database using the MASCOT search program[66]. To utilize the EST nucleotide sequences now availa-ble for salmonid fish (108,000 sequences), the trypsindigest products were searched for in a database containingall fish cDNA sequences available (last update September2006).
Authors' contributionsCIK performed sample preparation, microarray hybridiza-tions, bidimensional-electrophoresis, integrated the dataand drafted the manuscript. GP contributed to the pro-teome analysis. MB performed quantitative RT-PCR. DEproduced the microarrays. MS participated to statisticalanalysis. FL supervised the proteome analysis. FM super-vised the whole study, conceived the experimental design,formulated diets and participated in writing the manu-script. All authors read and approved the final manuscript.
Additional material
AcknowledgementsAuthors would like to thank the technical staff of the INRA experimental facilities PEIMA (Drennec, Sizun, Finistère, France). We acknowledge A. Le Cam, J. Montfort and G. Guernec from INRA-SCRIBE genomics facility (Rennes, France) for excellent technical assistance, the SIGENAE team (INRA Toulouse, France) and P. Bardou for development of bioinformatic tools and assistance. We also thank the Proteomics core facility at OUEST-genopole (Rennes, France), Dr. Nathalie Guitton for valuable technical assistance in 2D electrophoresis and D. Raine for revision of the English text. The first author received a fellowship from the "Institut National de la Recherche Agronomique" (INRA) and the Aquitaine region. This work was supported by funds from the French national program AGENOP (contract no. A02483, Systematic Analysis of Rainbow Trout Genome) and the 6th PCRD [European Project, contract no. 016249-2, Sustainable Aquafeeds to Maximize the Health Benefits of Farmed Fish for Consumers (AQUA-MAX)].
References1. Sowers JR: Obesity and cardiovascular disease. Clin Chem 1998,
44:1821-1825.2. Robb DHF, Kestin SC, Warriss PD, Nute GR: Muscle lipid content
determines the eating quality of smoked and cooked Atlan-tic salmon (Salmo salar). Aquaculture 2002, 205:345-358.
3. Wood JD, Richardson RI, Nute GR, Fisher AV, Campo MM, Kasapi-dou E, Sheard PR, Enser M: Effects of fatty acids on meat quality:a review. Meat Sci 2003, 66:21-32.
4. Pérusse L, Bouchard C: Gene-diet interactions in obesity. Am JClin Nutr 2000, 72:1285S-1290S.
5. Henderson RJ, Sargent J: Lipid biosynthesis in rainbow trout,Salmo gairdnerii, fed diets differing in lipid content. Comp Bio-chem Physiol C 1981, 69C(1):31-37.
6. Hillgartner FB, Salati LM, Goodridge AG: Physiological and molec-ular mechanisms involved in nutritional regulation of fattyacid synthesis. Physiol Rev 1995, 75:47-76.
7. Schwarz JM, Neese RA, Turner S, Dare D, Hellerstein MK: Short-term alterations in carbohydrate energy intake in humans.Striking effects on hepatic glucose production, de novo lipo-genesis, lipolysis, and whole-body fuel selection. J Clin Invest1995, 96:2735-2743.
8. Rollin X, Médale F, Gutieres S, Blanc D, Kaushik SJ: Short- and long-term nutritional modulation of acetyl-CoA carboxylaseactivity in selected tissues of rainbow trout (Oncorhynchusmykiss). Br J Nutr 2003, 89:803-810.
9. Clarke SD, Hembree J: Inhibition of triiodothyronine's induc-tion of rat liver lipogenic enzymes by dietary fat. J Nutr 1990,120:625-630.
Additional file 1Transcripts exhibiting differential expression between the two dietary treatments (HE vs LE). The data provided represent the complete list of transcripts exhibiting differential expression between the two dietary treat-ments (HE vs LE) derived from each statistical method (ANOVA, p < 0.01 and SAM, FDR cut-off = 0,15).Click here for file[http://www.biomedcentral.com/content/supplementary/1471-2164-9-506-S1.xls]
Additional file 2Transcripts exhibiting differential expression between the two genetic lines (F vs L). The data provided represent the complete list of transcripts exhib-iting differential expression between the two lines (F vs L) derived from each statistical method (ANOVA, p < 0.01 and SAM, FDR cut-off = 0,15).Click here for file[http://www.biomedcentral.com/content/supplementary/1471-2164-9-506-S2.xls]
Additional file 3Hepatic mRNA level of selected genes measured by RT-PCR (controls of the microarray data). mRNA levels of delta-6-desaturase, D-3-phos-phoglycerate dehydrogenase, 6-phosphogluconate dehydrogenase, malate dehydrogenase, glucose 6-phosphate dehydrogenase and glucokinase in the liver of trout of both lines fed the diet LE or HE. Expression values (arbitrary units) are normalized with α-elongation factor 1 (EF1α)-expressed transcripts.Click here for file[http://www.biomedcentral.com/content/supplementary/1471-2164-9-506-S3.doc]
Additional file 4Hepatic proteins exhibiting differential expression between the experimen-tal groups. The data provided represent the complete list of liver proteins exhibiting differential expression according to two-way ANOVA (p < 0.05), and positively identified by trypsin digest fingerprinting.Click here for file[http://www.biomedcentral.com/content/supplementary/1471-2164-9-506-S4.doc]
Additional file 5Accession numbers and primer sequences of genes selected for analysis by real time RT-PCR. Reverse and forward primer sequences and annealing temperature used to measure expression of 8 selected genes by real time RT-PCR.Click here for file[http://www.biomedcentral.com/content/supplementary/1471-2164-9-506-S5.doc]
Page 14 of 16(page number not for citation purposes)
http://www.ncbi.nlm.nih.gov/entrez/query.fcgi?cmd=Retrieve&db=PubMed&dopt=Abstract&list_uids=9702991
http://www.ncbi.nlm.nih.gov/entrez/query.fcgi?cmd=Retrieve&db=PubMed&dopt=Abstract&list_uids=6113089
http://www.ncbi.nlm.nih.gov/entrez/query.fcgi?cmd=Retrieve&db=PubMed&dopt=Abstract&list_uids=7831398
http://www.ncbi.nlm.nih.gov/entrez/query.fcgi?cmd=Retrieve&db=PubMed&dopt=Abstract&list_uids=7831398
http://www.ncbi.nlm.nih.gov/entrez/query.fcgi?cmd=Retrieve&db=PubMed&dopt=Abstract&list_uids=7831398
http://www.ncbi.nlm.nih.gov/entrez/query.fcgi?cmd=Retrieve&db=PubMed&dopt=Abstract&list_uids=8675642
http://www.ncbi.nlm.nih.gov/entrez/query.fcgi?cmd=Retrieve&db=PubMed&dopt=Abstract&list_uids=8675642
http://www.ncbi.nlm.nih.gov/entrez/query.fcgi?cmd=Retrieve&db=PubMed&dopt=Abstract&list_uids=8675642

BMC Genomics 2008, 9:506 http://www.biomedcentral.com/1471-2164/9/506
10. Gélineau A, Corraze G, Boujard T, Larroquet L, Kaushik S: Relationbetween dietary lipid level and voluntary feed intake,growth, nutrient gain, lipid deposition and hepatic lipogene-sis in rainbow trout. Reprod Nutr Dev 2001, 41:487-503.
11. Kim S, Sohn I, Ahn JI, Lee KH, Lee YS, Lee YS: Hepatic geneexpression profiles in a long-term high-fat diet-induced obes-ity mouse model. Gene 2004, 340:99-109.
12. Berge RK, Nilsson A, Husoy AM: Rapid stimulation of liverpalmitoyl-CoA synthetase, carnitine palmitoyltransferaseand glycerophosphate acyltransferase compared to peroxi-somal β-oxidation and palmitoyl-CoA hydrolase in rats fedhigh fat diets. Biochim Biophys Acta 1988, 960:417-426.
13. Thomassen MS, Christiansen EN, Norum KR: Characterization ofthe stimulatory effect of high fat diets on peroxisomal β-oxi-dation in rat liver. Biochem J 1982, 206:195-202.
14. Jump DB, Botolin D, Wang Y, Xu J, Demeure O, Christian B:Docosahexaenoic acid (DHA) and hepatic gene transcrip-tion. Chem Phys Lipids 2008, 153:3-13.
15. Bouchard C, Tremblay A: Genetic influences on the response ofbody fat and fat distribution to positive and negative energybalances in human identical twins. J Nutr 1997, 127:943S-947S.
16. Hetzer HO, Miller LR: Selection for high and low fatness inswine: correlated responses of various carcass traits. J AnimSci 1973, 37:1289-1301.
17. Hermier D: Lipoprotein metabolism and fattening in poultry.J Nutr 1997, 127:805S-808S.
18. Solini A, Bonora E, Bonadonna R, Castellino P, DeFronzo RA: Pro-tein metabolism in human obesity: Relationship with glucoseand lipid metabolism and with visceral adipose tissue. J ClinEndocrinol Metab 1997, 82:2552-2558.
19. Mekki N, Christophilis MA, Charbonnier M, Atlan-Gepner C,Defoort C, Juhel C, Borel P, Portugal H, Pauli AM, Vialettes B, LaironD: Influence of obesity and body fat distribution on postpran-dial lipemia and triglyceride-rich lipoproteins in adultwomen. J Clin Endocrinol Metab 1999, 84:184-191.
20. Wajchenberg BL: Subcutaneous and visceral adipose tissue:their relation to the metabolic syndrome. Endocrine Reviews2000, 21:697-738.
21. Garbis S, Lubec G, Fountoulakis M: Limitations of current pro-teomics technologies. J Chromatogr 2005, 1077(A):1-18.
22. Duplus E, Glorian M, Forest C: Fatty acid regulation of genetranscription. J Biol Chem 2000, 275:30749-30752.
23. Heuckeroth RO, Birkenmeier EH, Levin MS, Gordon JI: Analysis ofthe tissue specific expression, developmental regulation andlinkage relationships of a rodent gene encoding heart fattyacid binding protein. J Biol Chem 1987, 262(20):9709-9717.
24. Baba K, Takahashi Y, Aoyagi Y, Odani S: The amino acid sequenceof a lamprey (Entosphenus japonicus) liver fatty acid-bindingprotein identified its close relationship to cardiac fatty acid-binding proteins of Mammalia. Comp Biochem Phys B Biochem MolBiol 1999, 123:223-228.
25. Bain LJ: cDNA cloning, sequencing, and differential expressionof a heart-type fatty acid-binding protein in the mummichog(Fundulus heteroclitus). Mar Environ Res 2002, 54:379-383.
26. Liu RZ, Denovan-Wright EM, Wright JM: Structure, linkage map-ping and expression of the heart-type fatty acid-binding gene(fabp3) from zebrafish (Danio rerio). Eur J Biochem 2003,270:3223-3234.
27. Hertzel AV, Bernlohr DA: The mammalian fatty acid-bindingprotein multigene family: molecular and genetic insightsinto function. Trends Endocrinol Metab 2000, 11:175-180.
28. Haunerland NH, Spener F: Fatty acid-binding proteins – insightsfrom genetic manipulations. Prog Lipid Res 2004, 43:328-349.
29. Jordal AEO, Hordvik I, Pelsers M, Bernlohr DA, Torstensen BE:FABP3 and FABP10 in Atlantic salmon (Salmo salar L.)-Gen-eral effects of dietary fatty acid composition and life cyclevariations. Comp Biochem Physiol B Biochem Mol Biol 2006,145(2):147-158.
30. Kolditz C, Borthaire M, Richard N, Corraze G, Panserat S, Vachot C,Lefèvre F, Médale F: Liver and muscle metabolic changesinduced by dietary energy content and genetic selection inrainbow trout (Oncorhynchus mykiss). Am J Physiol Regul IntegrComp Physiol 2008, 294:R1154-R1164.
31. Rasmussen JT, Borchers T, Knudsen J: Comparison of the bindingaffinities of acyl-CoA-binding protein and fatty acid-binding
protein for long-chain acyl-CoA esters. Biochem J 1990,265(3):849-855.
32. Gaigg B, Neergaard TBF, Schneiter R, Hansen JK, Færgeman NJ,Jensen NA, Andersen JR, Friis J, Sandhoff R, Schrøder HD, Knudsen J:Depletion of acyl-coenzyme A-binding protein affects sphin-golipid synthesis and causes vesicle accumulation and mem-brane defects in Saccharomyces cerevisiae. Mol Biol Cell 2001,12:1147-1160.
33. Sandberg MB, Bloksgaard M, Duran-Sandoval D, Duval C, Staels B,Mandrup S: The gene encoding acyl-CoA-binding protein issubject to metabolic regulation by both sterol regulatoryelement-binding protein and peroxisome proliferator-acti-vated receptor α in hepatocytes. J Biol Chem 2005,280:5258-5266.
34. Matsuzaka T, Shimano H, Yahagi N, Amemiya-Kudo M, Yoshikawa T,Hasty AH, Tamura Y, Osuga J, Okazaki H, Iizuka Y, Takahashi A, SoneH, Gotoda T, Ishibashi S, Yamada N: Dual regulation of mouse Δ5-and Δ6-desaturase gene expression by SREBP-1 and PPARα.J Lipid Res 2002, 43:107-114.
35. Cho HP, Nakamura MT, Clarke SD: Cloning, expression, andnutritional regulation of the mammalian Delta-6 desaturase.J Biol Chem 1999, 274:471-477.
36. Seiliez I, Panserat S, Kaushik S, Bergot P: Cloning, tissue distribu-tion and nutritional regulation of a Δ6-desaturase-likeenzyme in rainbow trout. Comp Biochem Physiol B Biochem Mol Biol2001, 130(1):83-93.
37. Zheng XZ, Tocher DR, Dickson CA, Bell JG, Teale AJ: Effects ofdiets containing vegetable oils on expression of genesinvolved in highly unsaturated fatty acid biosynthesis in liverof Atlantic salmon (Salmo salar). Aquaculture 2004, 236:467-483.
38. Jordal AEO, Tortensen BE, Tsoi S, Tocher DR, Lall SP, Douglas SE:Dietary rapeseed oil affects the expression of genes involvedin hepatic lipid metabolism in Atlantic salmon (Salmo salarL.). J Nutr 2005, 135:2355-2361.
39. Nanji AA, Griniuviene B, Sadrzadeh SMH, Levitsky S, McCullyf JD:Effect of type of dietary fat and ethanol on antioxidantenzyme mRNA induction in rat liver. J Lipid Res 1995,36:736-744.
40. Thillart G Van den: Energy metabolism of swimming trout (S.gairdneri). Oxidation rates of palmitate, glucose, lactate,alanine, leucine and glutamate. J Comp Physiol 1986,156(B):511-520.
41. Dabrowski K, Guderley H: Intermediary metabolism. In FishNutrition Edited by: Halver JE, Hardy RW. San Diego: Academic Press;2002:309-365.
42. Takeuchi T, Watanabe T, Ogino C: Optimum ratio of dietaryenergy to protein for rainbow trout. Bull Jpn Soc Sci Fish 1978,44:729-732.
43. Hillestad M, Johnsen F: High-energy/low-protein diets for Atlan-tic salmon: effects on growth, nutrient retention and slaugh-ter quality. Aquaculture 1994, 124:109-116.
44. Nestel PJ, Connor WE, Reardon MR, Connor S, Wong S, Boston R:Suppression by diets rich in fish oil of very low density lipo-protein production in man. J Clin Invest 1984, 74:72-89.
45. Kersten S, Mandard S, Escher P, Gonzalez FJ, Tafuri S, Desvergne B,Wahli W: The peroxisome proliferator receptor α regulatesamino acid metabolism. FASEB J 2001, 15:1971-1978.
46. Edvardsson U, Brockenhuus Von Löwenhielm H, Panfilov O, NyströmAC, Nilsson F, Dahllöf B: Hepatic protein expression of leanmice and obese diabetic mice treated with peroxisome pro-liferator-activated receptor activators. Proteomics 2003,3:468-478.
47. Sheikh K, Camejo G, Lanne B, Halvarsson T, Landergren MR, OakesND: Beyond lipids, pharmacological PPARα activation hasimportant effects on amino-acid metabolism as studied inthe rat. Am J Physiol Endocrinol Metab 2004, 292:E1157-E1165.
48. INRA-GADIE Biologicals Resources Centre home page[http://w3.jouy.inra.fr/unites/lreg/CRB/BRC/index.html]
49. Govoroun M, Le Gac F, Guiguen Y: Generation of a large scalerepertoire of expressed sequences tags (ESTs) from normal-ised rainbow trout cDNA libraries. BMC Genomics 2006,7:196-203.
50. Gene Expression Omnibus [http://www.ncbi.nlm.nih.gov/geo/]51. Cathelin R, Lopez F, Klopp C: AGScan: a pluggable microarray
image quantification software based on the Image J library.Bioinformatics 2007, 23:247-248.
Page 15 of 16(page number not for citation purposes)
http://www.ncbi.nlm.nih.gov/entrez/query.fcgi?cmd=Retrieve&db=PubMed&dopt=Abstract&list_uids=2898261
http://www.ncbi.nlm.nih.gov/entrez/query.fcgi?cmd=Retrieve&db=PubMed&dopt=Abstract&list_uids=2898261
http://www.ncbi.nlm.nih.gov/entrez/query.fcgi?cmd=Retrieve&db=PubMed&dopt=Abstract&list_uids=7150240
http://www.ncbi.nlm.nih.gov/entrez/query.fcgi?cmd=Retrieve&db=PubMed&dopt=Abstract&list_uids=7150240
http://www.ncbi.nlm.nih.gov/entrez/query.fcgi?cmd=Retrieve&db=PubMed&dopt=Abstract&list_uids=9164270
http://www.ncbi.nlm.nih.gov/entrez/query.fcgi?cmd=Retrieve&db=PubMed&dopt=Abstract&list_uids=9164270
http://www.ncbi.nlm.nih.gov/entrez/query.fcgi?cmd=Retrieve&db=PubMed&dopt=Abstract&list_uids=9164270
http://www.ncbi.nlm.nih.gov/entrez/query.fcgi?cmd=Retrieve&db=PubMed&dopt=Abstract&list_uids=9164241
http://www.ncbi.nlm.nih.gov/entrez/query.fcgi?cmd=Retrieve&db=PubMed&dopt=Abstract&list_uids=9253333
http://www.ncbi.nlm.nih.gov/entrez/query.fcgi?cmd=Retrieve&db=PubMed&dopt=Abstract&list_uids=9253333
http://www.ncbi.nlm.nih.gov/entrez/query.fcgi?cmd=Retrieve&db=PubMed&dopt=Abstract&list_uids=9253333
http://www.ncbi.nlm.nih.gov/entrez/query.fcgi?cmd=Retrieve&db=PubMed&dopt=Abstract&list_uids=9920081
http://www.ncbi.nlm.nih.gov/entrez/query.fcgi?cmd=Retrieve&db=PubMed&dopt=Abstract&list_uids=9920081
http://www.ncbi.nlm.nih.gov/entrez/query.fcgi?cmd=Retrieve&db=PubMed&dopt=Abstract&list_uids=9920081
http://www.ncbi.nlm.nih.gov/entrez/query.fcgi?cmd=Retrieve&db=PubMed&dopt=Abstract&list_uids=3036869
http://www.ncbi.nlm.nih.gov/entrez/query.fcgi?cmd=Retrieve&db=PubMed&dopt=Abstract&list_uids=3036869
http://www.ncbi.nlm.nih.gov/entrez/query.fcgi?cmd=Retrieve&db=PubMed&dopt=Abstract&list_uids=3036869
http://www.ncbi.nlm.nih.gov/entrez/query.fcgi?cmd=Retrieve&db=PubMed&dopt=Abstract&list_uids=2306218
http://www.ncbi.nlm.nih.gov/entrez/query.fcgi?cmd=Retrieve&db=PubMed&dopt=Abstract&list_uids=2306218
http://www.ncbi.nlm.nih.gov/entrez/query.fcgi?cmd=Retrieve&db=PubMed&dopt=Abstract&list_uids=2306218
http://www.ncbi.nlm.nih.gov/entrez/query.fcgi?cmd=Retrieve&db=PubMed&dopt=Abstract&list_uids=9867867
http://www.ncbi.nlm.nih.gov/entrez/query.fcgi?cmd=Retrieve&db=PubMed&dopt=Abstract&list_uids=9867867
http://www.ncbi.nlm.nih.gov/entrez/query.fcgi?cmd=Retrieve&db=PubMed&dopt=Abstract&list_uids=7616120
http://www.ncbi.nlm.nih.gov/entrez/query.fcgi?cmd=Retrieve&db=PubMed&dopt=Abstract&list_uids=7616120

BMC Genomics 2008, 9:506 http://www.biomedcentral.com/1471-2164/9/506
Publish with BioMed Central and every scientist can read your work free of charge
"BioMed Central will be the most significant development for disseminating the results of biomedical research in our lifetime."
Sir Paul Nurse, Cancer Research UK
Your research papers will be:
available free of charge to the entire biomedical community
peer reviewed and published immediately upon acceptance
cited in PubMed and archived on PubMed Central
yours — you keep the copyright
Submit your manuscript here:http://www.biomedcentral.com/info/publishing_adv.asp
BioMedcentral
52. SIGENAE home page [http://www.sigenae.org/]53. Saeed AI, Sharov V, White J, Li J, Liang W, Bhagabat N, Braisted J,
Klapa M, Currier T, Thiagarajan M, Sturn A, Snuffin M, Rezantsev A,Popov D, Ryltsov A, Kostukovich E, Borisovsky I, Liu Z, Vinsavich A,Trush V, Quackenbush J: TM4: a free, open-source system formicroarray data management and analysis. Biotechniques2003, 34(2):374-378.
54. Tusher VG, Tibshirani R, Chu G: Significance analysis of micro-arrays applied to the ionizing radiation response. Proc NatAcad Sci 2001, 98:5116-5121.
55. Aegerter S, Baron D, Carpentier C, Chauvigne F, Dantec C, EstampesA, Goupil AS, Jumel A, Jutel I, Mazurais D, Melaine N, Montfort J,Bobe J, Chardon P, Chevalet C, Fauconneau B, Fostier A, GovorounM, Le Cam A, Le Gac F, Klopp C, Panserat S, Piumi F, Rallière C, Res-can PY, Guiguen Y: The INRA AGENAE program and the Age-nae trout EST collections: first results applied to fishphysiology research. Comp Biochem Physiol 2004, 137(A):135-141.
56. Rexroad CE, Lee Y, Keele JW, Karamycheva S, Brown G, Koop B,Gahr SA, Palti Y, Quackenbush J: Sequence analysis of a rainbowtrout cDNA library and creation of a gene index. CytogenetGenome Res 2003, 102:347-354.
57. Gish W, States DJ: Identification of protein coding regions bydatabase similarity search. Nat Genet 1993, 3:266-272.
58. The Swiss-Prot database [http://www.expasy.org/sprot/]59. GoMiner software home page [http://discover.nci.nih.gov/gom
iner/]60. Olsvik P, Lie K, Jordal A, Nilsen T, Hordvik I: Evaluation of poten-
tial reference genes in real time RT-PCR studies of Atlanticsalmon. BMC Mol Biol 2005, 6:21.
61. Pfaffl MW: A new mathematical model for relative quantifica-tion in real time RT-PCR. Nucleic Acids Res 2001, 29:2002-2007.
62. Heukeshoven J, Dernick R: Simplified method for silver stainingof proteins in polyacrylamide gels and the mechanism of sil-ver staining. Electrophoresis 1985, 6:103-112.
63. Yan JX, Wait R, Berkelman T, Harry RA, Westbrook JA, WheelerCH, Dunn MJ: A modified silver staining protocol for visualiza-tion of proteins compatible with matrix-assisted laser des-orption/ionization and electrospray ionization massspectrometry. Electrophoresis 2000, 21:3666-3672.
64. Candiano G, Bruschi M, Musante L, Santucci L, Ghiggeri GM,Carnemolla B, Orecchia P, Zardi L, Righetti PG: Blue silver: A verysensitive colloidal Coomassie G-250 staining for proteomeanalysis. Electrophoresis 2004, 25:1327-1333.
65. Com E, Evrard B, Roepstorff P, Aubry F, Pineau C: New insightsinto the rat spermatogonial proteome: identification of 156additional proteins. Mol Cell Proteomics 2003, 2:248-261.
66. MASCOT search program home page [http://www.matrix sci-ence.com]
Page 16 of 16(page number not for citation purposes)
http://www.ncbi.nlm.nih.gov/entrez/query.fcgi?cmd=Retrieve&db=PubMed&dopt=Abstract&list_uids=8485583