Acoustic, aerodynamic, physiologic, and perceptual properties of modal and vocal fry registers
Upload
independentCategory
view
1download
0
Aquaculture 297 (2009) 141–150
Contents lists available at ScienceDirect
Aquaculture
j ourna l homepage: www.e lsev ie r.com/ locate /aqua-on l ine
Effects of dietary phosphorus and calcium level on growth and skeletal developmentin rainbow trout (Oncorhynchus mykiss) fry
Stéphanie Fontagné a,⁎, Nadia Silva b, Didier Bazin a, Angela Ramos b, Peyo Aguirre a, Anne Surget a,Antonio Abrantes c, Sadasivam J. Kaushik a, Deborah M. Power b
a INRA, UMR 1067 NuAGe, Pôle d'Hydrobiologie, F-64310 Saint Pée-sur-Nivelle, Franceb CCMAR, Universidade do Algarve, Campus de Gambelas, 8005-139 Faro, Portugalc Escola Superior de Saúde de Faro, Universidade do Algarve, Av. Dr. Adelino da Palma Carlos, 8000-510 Faro, Portugal
⁎ Corresponding author. Tel.: +33 5 59 51 59 51; faxE-mail address: [email protected] (S. Fontagné
0044-8486/$ – see front matter © 2009 Elsevier B.V. Aldoi:10.1016/j.aquaculture.2009.09.022
a b s t r a c t
a r t i c l e i n f oArticle history:Received 14 May 2009Received in revised form 16 September 2009Accepted 23 September 2009
Keywords:Rainbow troutFryPhosphorusCalciummineralizationSkeletal development
The effects of dietary levels of phosphorus (P) and calcium (Ca) on skeletal development andmineral depositionin rainbow trout (Oncorhynchus mykiss) fry were studied. Six semi-purified diets were formulated with gradedlevels of P andCa. The basal diet A containedonly P supplied by casein at 0.5%of drymatter. Other diets B, C, D andEwere supplementedwith 0.4, 0.8, 1.2 and 1.6% P supplied as a 1:1 mixture of NaH2PO4/KH2PO4 resulting in 0.8,1.2, 1.6 and 2.2% total P, respectively. These five diets were supplementedwith 1% Ca supplied as CaCO3 whereasanother diet F, supplementedwith 0.8%P,was Ca-free. Each dietwas distributed to 3 replicate tanks of 600 swim-up fry (initial meanweight: 0.1 g) at a water temperature of 17 °C over a 12-week growth trial. Fish were hand-fed 6 times a day to visual satiety.There was no significant effect of dietary P (0 to 1.6%) or Ca (0 or 1%) supplementation on growth (final meanweight: 4.0±1.2 g). Survival of fish fedwith diet E containing a high level of Pwas significantly lower compared toother groups (10% vs. 65%, respectively). Fish fed with diet A displayed lower whole-body ash and P contentcompared to other groups (1.98 vs. 2.49% and 0.35 vs. 0.46% wet weight, respectively). Phosphorus retentiondecreased with increasing dietary P level (from 100% in group A to about 20% in group E). The quantitative imageanalysis of 28-day-old fry double stainedwith Alcian blue and Alizarin red S revealed that individuals from group Awere less ossified compared to individuals from other dietary groups. Quantitative analysis of skeletal formationusing cumulative counts of endochondral and dermal structures revealed a significant delay in ossification ofendochondral structures at day11 infish fedwithmineral richorpoordiets (dietsA, E andF).However, at day28, nosignificant difference in ontogeny of endochondral or dermal structures was found between the trout fed with thecontrol diet and those fedwith a high P diet (E) or a lowCadiet (F), suggesting recovery is possible in rainbow trout.In conclusion, we found that both dietary deficiency and excess of P are detrimental to rainbow trout frydevelopment: excess P affects survival, while P deficiency affects bone calcification. Calcium deficiency appears toexert some delay in ossification processes without affecting final bone mineralization.
: +33 5 59 54 51 52.).
l rights reserved.
© 2009 Elsevier B.V. All rights reserved.
1. Introduction
A relatively high incidence of malformed fish has been observed infarm stocks irrespective of fish species. In salmonids, skeletal deformitieshavebeenrecognizedasa recurringproblem(Poynton, 1987;Gjerdeet al.,2005; Deschamps et al., 2008). These anomalies also have implicationsfrom an animal welfare point of view. Skeletal deformities usually lead todecreased survival, slow growth and poor nutrient utilization entailingsevere losses to hatchery production (McKay and Gjerde, 1986; Aunsmoet al., 2008). Moreover, as malformed fish represent a less acceptableproduct to consumers and may cause severe problems when processing
fillets, they need to be discarded or downgraded (Vågsholm and Djupvik,1998; Helland et al., 2005; Sullivan et al., 2007b).
A wide range of risk factors for development of skeletal abnormal-ities in salmonids have been identified, including infections (Kvellestadet al., 2000), toxins (Holm et al., 2005), genetics (Gjerde et al., 2005),environmental (Takle et al., 2005) and nutritional factors (Helland et al.,2005). Inadequate feeding, especially during early development, hasbeen reported to induce malformations in fish (Cahu et al., 2003).
Among the nutritional components suspected to affect skeletaldevelopment, phosphorus (P) and calcium (Ca) are of special interestas these key minerals are directly involved in the development andmaintenance of the skeletal system (Lall and Lewis-McCrea, 2007). It haslong been known that fish can absorb Ca and P directly from water,however, the concentration of P is low in both freshwater and seawaterand diet is themain source (Lall, 2002).With the trend towards replacingfish meal with plant ingredients in fish feeds, the P availability is highly

Table 1Formulation and composition of experimental diets (g/100 g dry weight).
Diet A B C D E F
IngredientsCasein-dextrin basisa 82.5 82.5 82.5 82.5 82.5 82.5Vitamin mixtureb 5 5 5 5 5 5Mineral mixture without P and Cac 2.5 2.5 2.5 2.5 2.5 2.5Monobasic sodium and potassiumphosphates (50/50)d
0.00 1.68 3.36 5.04 6.72 3.36
Calcium carbonate 2.50 2.50 2.50 2.50 2.50 0.00α-Cellulose 7.50 5.82 4.14 2.46 0.78 6.64Available P 0.0 0.4 0.8 1.2 1.6 0.8Available Ca 1.0 1.0 1.0 1.0 1.0 0.0
Proximate compositionDry matter (%) 93.4 92.1 92.6 92.4 94.0 93.6Crude protein 51.3 52.0 51.1 51.2 52.7 52.4Total lipid 16.3 16.8 16.8 16.9 16.7 16.9Gross energy (kJ/g dry matter) 23.0 22.9 22.5 22.3 21.9 23.1Ash 4.7 5.9 7.3 8.7 10.6 6.1Total phosphorus 0.5 0.8 1.2 1.6 2.2 1.3Total calcium 0.8 na 0.8 na 0.8 0.1
na: not analyzed.a Casein-dextrin basis (% diet): 52% casein (VWR 22 544.292, Fontenay-sous-Bois,
France); 0.65% D,L-methionine (Ajinomoto Eurolysine, Paris, France); 0.85% L-arginineHCl (Ajinomoto Eurolysine); 8% soybean lecithin (Louis François, St Maur des Fossés,France); 8% fish oil (La Lorientaise, Lorient, France); 12% dextrin (Sigma D2256, Saint-Quentin Fallavier, France); 1% sodium alginate.
b Vitamin mixture (per kg vitamin mix): retinyl acetate, 500,000 IU; cholecalciferol,250,000 IU; DL-α-tocopherol acetate, 5 g; menadione, 1 g; thiamin-HCl, 0.1 g; riboflavin,0.4 g; D-calcium panthothenate, 2 g; pyridoxine-HCl, 0.3 g; cyanocobalamin, 1 mg; niacin,1 g; choline, 100 g; ascorbic acid (L-ascorbyl-2-polyphosphate), 5 g; folic acid, 0.1 g;D-biotin,20 mg; meso-inositol, 30 g. All ingredients were diluted with α-cellulose.
c Mineral mixture (g/kg mineral mix): KCl, 180; KI, 0.08; NaCl, 80; CuSO4·5H2O, 6;ZnSO4·7H2O, 8; CoSO4, 0.04; FeSO4·7H2O, 40; MnSO4·H2O, 6; MgOH, 248; Na2SeO3,0.06; NaF, 2. All ingredients were diluted with α-cellulose.
d Inorganic phosphorus from NaH2PO4/KH2PO4 is highly available (98%) to rainbowtrout according to Ogino et al. (1979).
142 S. Fontagné et al. / Aquaculture 297 (2009) 141–150
variable and some P deficiencies can occur. Signs of dietary P deficiencyinclude poor bone mineralization and skeletal abnormalities such assoft bones, curved spines and ribs (Baeverfjord et al., 1998). The dietaryavailable P requirement of salmonids is estimated to be approximately0.6% of diet (National Research Council, 1993) but can vary according tothe feeding scheme, the response criterion used such as growth rate orbone mineralization (Rodehutscord, 1996), the size of fish (Lellis et al.,2004) and the dietary mineral composition in calcium and zinc(Shearer and Hardy, 1987). Most studies undertaken so far on Prequirement, availability or utilization have relied on the use ofinorganic phosphate mostly in the form of calcium phosphate. Asregards Ca, no clear data is available on dietary Ca levels required forrainbow trout. The impact of dietary P supply thus needs to bedistinguished from that of dietary Ca.
The objective of the present study was hence to evaluate theimpact of different dietary levels of P and Ca on skeletal developmentand mineral deposition in rainbow trout (Oncorhynchus mykiss) fry.
2. Materials and methods
2.1. Experimental fish and dietary trial conditions
All-female diploid rainbow trout (O. mykiss) embryos (230degree-days post-fertilization) were provided by Aqualande (Landes,France) to the INRA experimental fish farm in Lées-Athas (Pyrénées-Atlantiques, France). One day before the swim-up stage, rainbowtrout fry were transferred to the INRA experimental fish farm inDonzacq (Landes, France) and randomly distributed into 18 tanks(600 fish per 50 l fiberglass tank) in a flow through system suppliedby spring water at 17±1 °C. From the swim-up stage (53 days, 450degree-days post fertilization) defined as day 0 of the experiment, fish(initial mean weight: 0.10±0.01 g) were hand-fed six times per dayto excess or visual satiety. Each diet was distributed to 3 replicatetanks over a 12-week growth trial.
2.2. Experimental diets
Six semi-purified casein based diets (52% crudeprotein and 16% lipidbydryweight)were formulatedwithgraded levels of P andCa (Table 1).The basal diet A contained only P supplied by casein, 0.5%. Other diets B,C, D and E were supplemented with 0.4, 0.8, 1.2 and 1.6% availableP supplied as a 1:1 mixture of NaH2PO4/KH2PO4 resulting in 0.8, 1.2, 1.6and 2.2% total P, respectively. These five diets were supplemented with1% Ca supplied as CaCO3 whereas another diet F, supplemented with0.8% available P, considered as the control level of P, was Ca-free.
2.3. Sample collection
The survival of fish was calculated from dailymortality and from thefinal number of the surviving trout fry recorded in each tank. Samples offishwerewithdrawnonday 0 and fromeach tank on days 11, 28, 55 and87 (636, 925, 1382 and 1925 degree-days post fertilization, respective-ly) after starvation for 24 h. They were anaesthetized in diluted 2-phenoxyethanol for wet weight determination and frozen in liquidnitrogen and stored at−80 °C prior to chemical analysis or fixed in 10%formalin or 4% paraformaldehyde prior to quantitative image analysis.
2.4. Chemical analyses
Proximate composition of diets was determined according to thefollowing procedures: dry matter after drying at 105 °C for 24 h,protein (N×6.25) by the Kjeldahl method after acid digestion, ash byincineration at 550 °C for 16 h and gross energy in an adiabatic bombcalorimeter. Total lipid was extracted and measured gravimetricallyaccording to Folch et al. (1957) using dichloromethane instead ofchloroform. Total phosphorus was determined by the molybdate-
blue/ascorbic acid method at 820 nm after mineralization and aciddigestion (AFNOR, 1992).
Proximate composition of fish was determined on groups of wholefish by the same procedures as the ones used for diets. Total calciumwas determined on fish fed with the control diet C or modified diets A(with low P level), E (with high P level) and F (with low Ca level). Theash content of these trout fry was digested with 50 µl nitric acid for24 h at 25 °C and neutralized with equal volumes of 2 M NaOH. Thevolume of the digest was increased to 1 ml with deionized water.Total calcium in the digest was measured in duplicate using acolorimetric assay at 570 nm (Calcium-oC v/v, Spinreact, Spain).
2.5. Whole mount skeletal preparation and analysis
Fishfixed in 10% formalin onday 28 of the growth trial (10 individualsper tank) were double stained with Alcian blue and Alizarin red Saccording to Dudzinski and Neff (1990). Images of the stained specimensin100%glycerolwere capturedat 600 dpiusing ahigh-resolutionflat-bedscanner (Epson Perfection Photo 4990). All devices were calibrated andICC color management was applied on digital images with Photoshopsoftware (Adobe Systems France SAS, Paris, France) according to Bazin(2008). Adobe RGB (1998) was chosen as destination color space. Theskeletal structures were differentiated using hue in Hue–Saturation–Intensity color model (with color wheel). The surface and relativeproportion of cartilage (Alcian blue stained area) and calcified bone(Alizarin red S stained area) and total length (TL) were determined usingautomated analysis with the image analysis software Image-Pro Plus(Media Cybernetics, Bethesda, MD, USA).
The ontogeny of the skeleton was determined using severalindividuals randomly selected from day 0 (n=5) and from day 11and 28 for each of the dietary groups A, C, E and F (n=15 per dietarygroup andper time point sampled) and subject towholemount staining

Table 2Skeletal structures studied to assess the progression of chondrogenesis and osteogenesis in rainbow trout fed diets supplemented with different levels of available phosphorus (0, 0.8and 1.6%) and calcium (0 and 1%).
Vertebral column Pectoral fin Dorsal fin Caudal fin Supra-neurals Pelvic fin Anal fin
CleitrumActinosts
Pleural ribs Rays HypuralsVertebra centra Coracoid Pterygiophores Epurals Pterygiophores Basipterigium PterygiophoresNeural arches Scapula Rays Rays Rays RaysHaemal arches Radial Urostyle
PostcleitrumSupracleitrum
143S. Fontagné et al. / Aquaculture 297 (2009) 141–150
using Alcian blue and Alizarin red staining (Taylor and Van Dyke, 1985;Faustino and Power, 1998). In order to compare the skeletaldevelopment in fish from the different dietary treatments, a group ofdermal and endochondral structures from the vertebral column, dorsal,anal, pectoral, caudal and pelvic fin was selected for analysis (Table 2).The initiation and completion of chondrogenesis and the initiation anddegree of ossification (intensity of Alizarin red staining) and theprevalence of abnormalities were analyzed. In order to determineskeletal development, the cumulative counts of the structures includedin the analysis were plotted against skeletal stage (endochondralcartilage; endochondral cartilage/bone transition; endochondral ossi-fied; transition dermal; ossified dermal). Prior to staining, the standardlength (SL) of each samplewasmeasured fromthe tip of the snout to thebase of the caudal fin complex. Images of rainbow trout fry, fordetermining length and status of cartilage and bone development, werecaptured using a stereomicroscope (Olympus SZ-40) with a digitalcamera attachment (Olympus DP-11) linked to a computer. Dataprocessing was carried out with Optimas 5.2 software (MediaCybernetics, Bethesda, MD, USA).
2.6. Morphometric analysis
The number of vertebrae in the vertebral column of rainbow troutfed with the different diets was determined in whole mount Alcianblue/Alizarin red stained specimens from day 55 or using X-rays inspecimens from day 87 (obtained as described below). A preliminarystudy indicated that by day 55, all vertebrae of the vertebral columnhad developed in all experimental groups and so vertebral counts of55 and 87-day trout fry were pooled for analysis (n=14 individualsper group except for the dietary group E, n=11 individuals).
Preliminary studies were carried out to determine the optimalexposuremode for X-ray studies of paraformaldehyde (4%) and formalin(5%) fixed rainbow trout sampled on day 87 of the experiment. Wholerainbow trout which were fed with the control diet C or diets A (lowP level, n=15), E (high P level, n=6) and F (low Ca level, n=15) wereanalyzed using a Senographe DMR Mammography System (General
Fig. 1. Radiography of rainbow trout showing the four distinct regions considered during mecaudal, V31–V51; and caudal, V52–V64.
Electric Medical Systems, Slough, UK), and themanual exposuremode togive 40 mAs and 40 kV. Several rainbow trout of the same age andapproximate size were X-rayed simultaneously. All X-rays were carriedout on rainbow trout samples using exactly the same conditions. In orderto read and process the digital X-rays, a FUJIFILM Computed RadiographyCR Console connected to theMammographyWorkstationMV-SR657 FCRPROFECT CSwas used and the digital X-rays archived as JPEG 8bit imagesuntil subsequent analysis.
Thedigital radiographies of rainbow troutwere analyzedusing ImageJ(freeware — NIH, http://rsbweb.nih.gov/ij/). The SL, TL and length of thehead (HL) of each X-rayed rainbow trout sampled on day 87 weredetermined. In each individual, threevertebrae in themidpoint of the fourdifferent anatomical regions previously identified in the vertebral columnof rainbow trout (Kacem et al., 2003), viz-cranial (V1–V8), trunco-cranial(V9–V30), trunco-caudal (V31–V51) and caudal (V52–V60), wereanalyzed (Fig. 1). The height (H), length (L) of vertebrae andintervertebral space were measured. The vertebral area was alsoestablished by assuming that vertebra approximately resemble a cylinderand applying the formula, area=2π×(H/2)×L.
The degree of ossification of X-rayed rainbow trout sampled on day87 was estimated using “the mean grey value approach” and imageanalysis software, ImageJ. Five vertebrae situated in the midpoint ofeach of the anatomical areas used for morphometry were selected formeasurement in rainbow trout fromeach experimental group (n=9 fordiet A, C and F and n=6 for diet E). The analysis is based on the fact thatbone which is more calcified has a higher mean grey value (Versluiset al., 2000).
The detection of external and internal abnormalities was carried outby visual inspection of the trout before X-ray analysis and alsophotographing specimens in order to permit external images to becompared with radiographies of the same specimens (n=9 for diet A, Cand F and n=6 for diet E). Digital radiographies of rainbow trout werecarefully inspected to score for the presence and type of abnormality. Inorder to validate themethod used and eliminate the possibility that someof the internal abnormalities detected might be artifacts arising fromminor variations in the position of the trout during X-ray analysis, the
asurement of the vertebral column: viz-cranial, V1–V8; trunco-cranial, V9–V30; trunco-
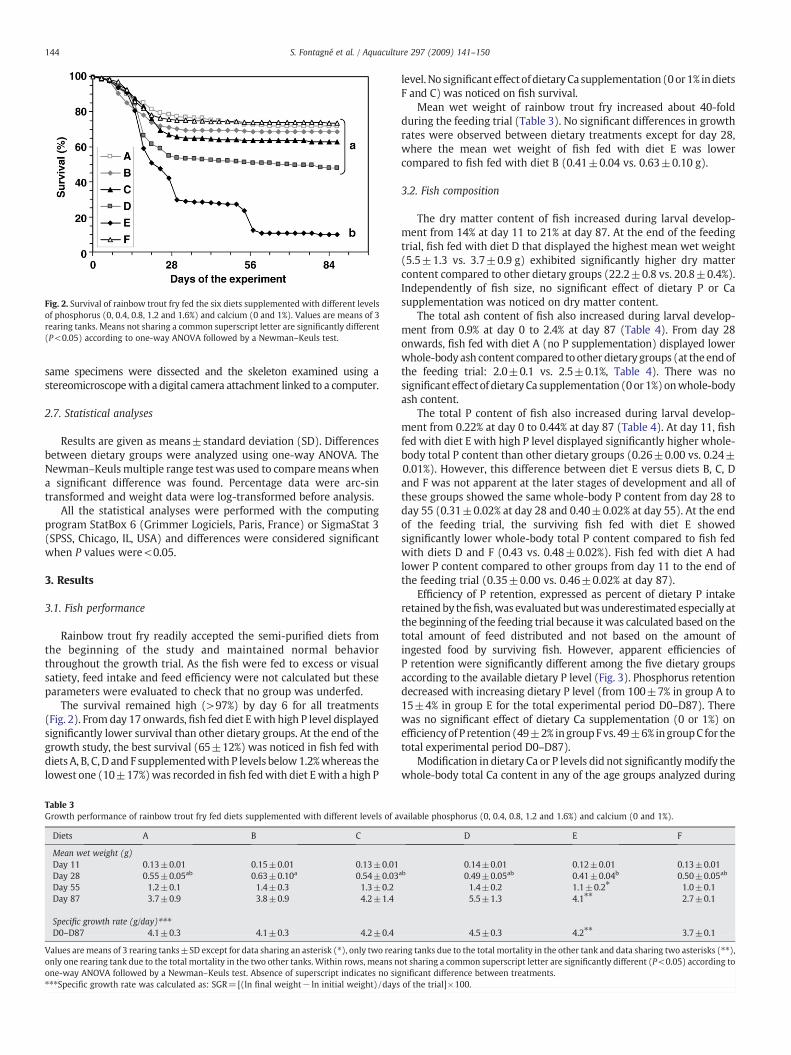
Fig. 2. Survival of rainbow trout fry fed the six diets supplemented with different levelsof phosphorus (0, 0.4, 0.8, 1.2 and 1.6%) and calcium (0 and 1%). Values are means of 3rearing tanks. Means not sharing a common superscript letter are significantly different(P<0.05) according to one-way ANOVA followed by a Newman–Keuls test.
144 S. Fontagné et al. / Aquaculture 297 (2009) 141–150
same specimens were dissected and the skeleton examined using astereomicroscopewith a digital camera attachment linked to a computer.
2.7. Statistical analyses
Results are given as means±standard deviation (SD). Differencesbetween dietary groups were analyzed using one-way ANOVA. TheNewman–Keulsmultiple range test was used to comparemeanswhena significant difference was found. Percentage data were arc-sintransformed and weight data were log-transformed before analysis.
All the statistical analyses were performed with the computingprogram StatBox 6 (Grimmer Logiciels, Paris, France) or SigmaStat 3(SPSS, Chicago, IL, USA) and differences were considered significantwhen P values were<0.05.
3. Results
3.1. Fish performance
Rainbow trout fry readily accepted the semi-purified diets fromthe beginning of the study and maintained normal behaviorthroughout the growth trial. As the fish were fed to excess or visualsatiety, feed intake and feed efficiency were not calculated but theseparameters were evaluated to check that no group was underfed.
The survival remained high (>97%) by day 6 for all treatments(Fig. 2). Fromday 17 onwards, fish fed diet Ewith high P level displayedsignificantly lower survival than other dietary groups. At the end of thegrowth study, the best survival (65±12%) was noticed in fish fed withdiets A, B, C, D and F supplementedwith P levels below1.2%whereas thelowest one (10±17%)was recorded in fish fedwith diet Ewith a high P
Table 3Growth performance of rainbow trout fry fed diets supplemented with different levels of a
Diets A B C
Mean wet weight (g)Day 11 0.13±0.01 0.15±0.01 0.13±0.01Day 28 0.55±0.05ab 0.63±0.10a 0.54±0.03Day 55 1.2±0.1 1.4±0.3 1.3±0.2Day 87 3.7±0.9 3.8±0.9 4.2±1.4
Specific growth rate (g/day)⁎⁎⁎D0–D87 4.1±0.3 4.1±0.3 4.2±0.4
Values aremeans of 3 rearing tanks±SD except for data sharing an asterisk (⁎), only two rearonly one rearing tank due to the total mortality in the two other tanks. Within rows, means none-way ANOVA followed by a Newman–Keuls test. Absence of superscript indicates no sig⁎⁎⁎Specific growth rate was calculated as: SGR=[(ln final weight− ln initial weight) /days
level.No significant effect of dietaryCa supplementation (0or1% indietsF and C) was noticed on fish survival.
Mean wet weight of rainbow trout fry increased about 40-foldduring the feeding trial (Table 3). No significant differences in growthrates were observed between dietary treatments except for day 28,where the mean wet weight of fish fed with diet E was lowercompared to fish fed with diet B (0.41±0.04 vs. 0.63±0.10 g).
3.2. Fish composition
The dry matter content of fish increased during larval develop-ment from 14% at day 11 to 21% at day 87. At the end of the feedingtrial, fish fed with diet D that displayed the highest mean wet weight(5.5±1.3 vs. 3.7±0.9 g) exhibited significantly higher dry mattercontent compared to other dietary groups (22.2±0.8 vs. 20.8±0.4%).Independently of fish size, no significant effect of dietary P or Casupplementation was noticed on dry matter content.
The total ash content of fish also increased during larval develop-ment from 0.9% at day 0 to 2.4% at day 87 (Table 4). From day 28onwards, fish fed with diet A (no P supplementation) displayed lowerwhole-body ash content compared toother dietary groups (at theendofthe feeding trial: 2.0±0.1 vs. 2.5±0.1%, Table 4). There was nosignificant effect of dietary Ca supplementation (0or 1%)onwhole-bodyash content.
The total P content of fish also increased during larval develop-ment from 0.22% at day 0 to 0.44% at day 87 (Table 4). At day 11, fishfed with diet E with high P level displayed significantly higher whole-body total P content than other dietary groups (0.26±0.00 vs. 0.24±0.01%). However, this difference between diet E versus diets B, C, Dand F was not apparent at the later stages of development and all ofthese groups showed the same whole-body P content from day 28 today 55 (0.31±0.02% at day 28 and 0.40±0.02% at day 55). At the endof the feeding trial, the surviving fish fed with diet E showedsignificantly lower whole-body total P content compared to fish fedwith diets D and F (0.43 vs. 0.48±0.02%). Fish fed with diet A hadlower P content compared to other groups from day 11 to the end ofthe feeding trial (0.35±0.00 vs. 0.46±0.02% at day 87).
Efficiency of P retention, expressed as percent of dietary P intakeretainedby thefish,was evaluated butwasunderestimated especially atthe beginning of the feeding trial because it was calculated based on thetotal amount of feed distributed and not based on the amount ofingested food by surviving fish. However, apparent efficiencies ofP retention were significantly different among the five dietary groupsaccording to the available dietary P level (Fig. 3). Phosphorus retentiondecreased with increasing dietary P level (from 100±7% in group A to15±4% in group E for the total experimental period D0–D87). Therewas no significant effect of dietary Ca supplementation (0 or 1%) onefficiency of P retention (49±2% ingroupFvs. 49±6% ingroupC for thetotal experimental period D0–D87).
Modification in dietary Ca or P levels did not significantlymodify thewhole-body total Ca content in any of the age groups analyzed during
vailable phosphorus (0, 0.4, 0.8, 1.2 and 1.6%) and calcium (0 and 1%).
D E F
0.14±0.01 0.12±0.01 0.13±0.01ab 0.49±0.05ab 0.41±0.04b 0.50±0.05ab
1.4±0.2 1.1±0.2⁎ 1.0±0.15.5±1.3 4.1⁎⁎ 2.7±0.1
4.5±0.3 4.2⁎⁎ 3.7±0.1
ing tanks due to the total mortality in the other tank and data sharing two asterisks (⁎⁎),ot sharing a common superscript letter are significantly different (P<0.05) according tonificant difference between treatments.of the trial]×100.

Table 4Whole-body composition of rainbow trout fry fed diets supplemented with different levels of available phosphorus (0, 0.4, 0.8, 1.2 and 1.6%) and calcium (0 and 1%).
Diets A B C D E F
Total ash (% wet weight)Day 11 1.3±0.1 1.3±0.1 1.2±0.2 1.3±0.2 1.1±0.2 1.1±0.1Day 28 1.3±0.0b 1.7±0.1a 1.8±0.0a 1.7±0.0a 1.8±0.0a 1.7±0.1a
Day 55 1.8±0.1b 2.2±0.1a 2.3±0.1a 2.2±0.1a 2.2±0.0⁎a 2.3±0.1a
Day 87 2.0±0.1b 2.4±0.0a 2.5±0.1a 2.5±0.1a 2.4 ⁎⁎a 2.6±0.1a
Total phosphorus (% wet weight)Day 11 0.21±0.01c 0.24±0.00b 0.25±0.00b 0.24±0.00b 0.26±0.00a 0.24±0.01b
Day 28 0.22±0.01c 0.30±0.02b 0.32±0.01ab 0.30±0.02b 0.33±0.00a 0.32±0.01ab
Day 55 0.31±0.01b 0.39±0.01a 0.40±0.00a 0.42±0.03a 0.39±0.00⁎a 0.41±0.03a
Day 87 0.35±0.00d 0.45±0.02bc 0.46±0.01abc 0.48±0.02a 0.43 ⁎⁎c 0.47±0.02ab
Total calcium (% wet weight)Day 11 0.06±0.01 na 0.07±0.03 na 0.07±0.00⁎ 0.07±0.02Day 28 0.10±0.03 na 0.19±0.01⁎ na 0.21±0.04 0.19±0.05Day 55 na na 0.31⁎⁎ na 0.33±0.05⁎ 0.30⁎⁎
Day 87 0.34±0.20 na 0.43±0.12 na 0.59⁎⁎ 0.45±0.05
Values are means of 3 rearing tanks±SD except for data sharing an asterisk (⁎), only two rearing tanks due to the total mortality in the third tank or sample availability and datasharing two asterisks (⁎⁎), only one rearing tank due to the total mortality in the two other tanks or sample availability. Within rows, means not sharing a common superscript letterare significantly different (P<0.05) according to one-way ANOVA followed by a Newman–Keuls test. Absence of superscript indicates no significant difference between treatments.na: not analyzed.
145S. Fontagné et al. / Aquaculture 297 (2009) 141–150
the experiment (Table 4). The whole-body Ca content of the troutincreased 5 fold from day 11 when relatively few skeletal structureswere calcified to day 87 when most of the skeleton was calcified.
3.3. Ossification of rainbow trout vertebrae
Rainbow trout fry sampled on days 0 and 11 had very littleossification compared to fish sampled at later stages (Fig. 4A).Quantitative examination of level of ossification in fish sampled onday 28 revealed that for an equivalent size, fish fedwith diet Awith lowP level, were less ossified compared to individuals from other dietarygroups (Fig. 4B). The TL of fish fed with diet E was significantly lowercompared to other groups (29±2 vs. 36±2 mm) in agreement withmean wet weight data. These fish of a smaller size exhibited asignificantly higher proportion of cartilage and lower proportion ofcalcified bone compared to fish fed with diets B, C, D and F. Nonethelessfish fed with diet E were more ossified than fry fed with diet A.
When comparing specifically the impact of low P level in diet A,high P level in diet E or low Ca level in diet F to the control diet C, theSL of rainbow trout were not significantly different at any stage duringdevelopment (11–87 days after first feeding), indicating that in early
Fig. 3. Apparent phosphorus retention of rainbow trout fry fed the six diets supplementedwith different levels of phosphorus (0, 0.4, 0.8, 1.2 and 1.6%) and calcium (0 and 1%).Apparent phosphorus retention was calculated as: [whole-body P gain in surviving fish(g)/dietary P intake (g)]×100 over the different periods duringwhich experimental dietswere fed and fish sampled and analyzed for total phosphorus. Values are means of 3rearing tanks except for data of dietary group E: 2 rearing tanks for D29–D55 and 1 rearingtank for D56–D87. Means not sharing a common superscript letter are significantlydifferent (P<0.05) according to one-way ANOVA followed by a Newman–Keuls test.
stages of rainbow trout, modifications in mineral content of the dietdoes not significantly affect growth and length increment.
Classification of skeletal structures as dermal or endochondral bonewas based upon their affinity for the histological stains Alcian blue andAlizarin red and revealed that the origin of the skeletal elements studieddid not differ from that seen in other teleosts. Moreover, modification inthe mineral content of the diet did not induce modifications in theorigin, dermal or endochondral, of skeletal elements. However, it didsignificantly change the ontogeny of the skeleton from that of fish fedwith control diet C and for example, in fish fed with P-deficient diet A,calcification of both dermal and endochondral structures was signifi-cantly delayed (Fig. 5).
Comparison of skeletal ontogeny in the trout fry fed for 11 days afterfirst feedingwith a control diet or a diet rich (E) or poor in P (A) or Ca (F)revealed a significantly higher number of cartilage structures in fish fedwithmineral richor poordiets (Fig. 5A). As expected, thiswas linked to asignificant reduction in structures in transition from cartilage toendochondral bone in the trout fry fed with diets A, E and F comparedto the control diet C. The diets had a lesser impact on the development ofdermal structures and only the trout fed with the P-deficient diet A hadsignificantly fewer transitional dermal structures than rainbow trout fryfed with the control diet C or diets E or F.
Interestingly, 28 days after first feeding, no significant difference inontogeny of endochondral or dermal structures was found between thetrout fed with the control diet and those fed with a high P diet (E) or alow Ca diet (F), suggesting recovery is possible in rainbow trout(Fig. 5B). In contrast, persistent modifications in dermal and endochon-dral ontogeny were evident one month after feeding the trout fry withP-deficient diets. In particular, the numbers of transitional or ossifiedendochondral structures in fish fed with the P-poor diet A weresignificantly higher and lower than fish fed with the control diet C.
The effect of diets on the ontogeny of dermal structures was lessevident 28 days after first feeding (Fig. 5B). No significant differences incumulative counts of transitional dermal structures were recordedbetween fish fed with diets A, E and F and the control diet C. However,a significant reduction in the number of calcified dermal structures wasobserved in fish fed with the low P diet A compared to fish fed with lowCa (F), high P (E) or control (C) diets.
3.4. Morphometric analysis
In rainbowtrout fry fedwith the control diet versusotherdietsA, E andF, no significant differenceswere found in the head length versus SL (data

Fig. 4. Rainbow trout fry from each time point sampled during the experiment, fixed in 10% formalin and stainedwith Alcian blue for cartilage and Alizarin red for calcified bone (A)withfocus on the level of ossification of rainbow trout fry fed the six diets supplementedwith different levelsof phosphorus (0, 0.4, 0.8, 1.2 and1.6%) and calcium(0and1%) at day28 (B).Valuesare means of 3 rearing tanks. Means not sharing a common superscript letter are significantly different (P<0.05) according to one-way ANOVA followed by a Newman–Keuls test.
146 S. Fontagné et al. / Aquaculture 297 (2009) 141–150
not shown). Analysis of the number of vertebrae in fish from day 55 and87 revealed that the number varied between59 and64 and themeanwasnot significantly modified by diet (Fig. 6). However, the frequencydistributionchangedandover55%of the trout fedwith aP-richorCa-poordiet had 62 vertebrae while in rainbow trout fed with control and P-poordiets a similar number of individuals had 61, 62 or 63 vertebrae.
Fig. 5. Assessment of the developmental ontogeny of the skeleton using cumulativecounts (see Table 2 for structures analyzed) in rainbow trout fry fed diets A, C, E or F andsampled on day 11 (A) and 28 (B) of the experiment. Means not sharing a commonsuperscript letter for a given ontogenetic process are significantly different (P<0.05)according to one-way ANOVA followed by a Newman–Keuls test.
As observed previously (Kacem et al., 2003) the morphology ofvertebrae along the columnwas variable and analysiswas conducted onthe 4 main regions. Analysis of the length, height and area of vertebraeand intervertebral space in the mid-region of the 4 main areas of the
Fig. 6. Frequency plot of the number of vertebrae present in the fully formed vertebralcolumn of trout fed diets A, C, E or F with different levels of phosphorus (0, 0.8 and 1.6%)and calcium (0 and 1%) and sampled on day 55 and 87 of the experiment (n=14individuals per group except for the dietary group E, n=11 individuals).

Table 5Length, height and area of 3 vertebrae in themidpoint of each of the 4 regions identifiedin the vertebral column of rainbow trout fry sampled on day 87 and fed diets supple-mented with different levels of available phosphorus (0, 0.8 and 1.6%) and calcium (0and 1%).
Column region Diet Vertebralheight (mm)
Vertebrallength (mm)
Intervertebrallength (mm)
Vertebralarea (mm2)
Viz-cranial A 0.88±0.10a 0.48±0.07b 0.58±0.10b 1.32±0.29ab
C 0.82±0.08ab 0.51±0.06ab 0.65±0.12ab 1.33±0.16ab
E 0.87±0.13a 0.57±0.08a 0.69±0.10a 1.54±0.27a
F 0.76±0.14b 0.48±0.08b 0.65±0.07ab 1.13±0.27b
Trunco-cranial A 0.91±0.10a 0.57±0.08ab 0.73±0.10ab 1.65±0.36a
C 0.85±0.08ab 0.59±0.09a 0.73±0.10ab 1.57±0.29a
E 0.90±0.13a 0.64±0.11a 0.80±0.13a 1.80±0.32a
F 0.75±0.15b 0.51±0.10b 0.69±0.09b 1.22±0.36b
Trunco-caudal A 0.95±0.11a 0.64±0.09ab 0.84±0.11ab 1.90±0.38a
C 0.94±0.11a 0.68±0.09a 0.85±0.11ab 2.01±0.39a
E 1.00±0.18a 0.68±0.14a 0.89±0.14a 2.13±0.44a
F 0.84±0.15b 0.59±0.14b 0.78±0.11b 1.55±0.46b
Caudal A 0.81±0.11a 0.42±0.07b 0.65±0.10 1.08±0.26C 0.76±0.09ab 0.46±0.09ab 0.65±0.12 1.11±0.26E 0.81±0.12a 0.51±0.13a 0.73±0.13 1.30±0.36F 0.72±0.09b 0.46±0.08ab 0.66±0.10 1.05±0.24
Values aremeans of 9fish fromtriplicate tanks±SDexcept for diet Ewhich corresponds to6 samples from a single rearing tank due to the totalmortality in the other two tanks. For agiven vertebral regionmeans not sharing a common superscript letterwithin columns aresignificantly different (P<0.05) according to one-way ANOVA followed by a Newman–Keuls test. Absence of superscript indicates no significant difference between treatments.
147S. Fontagné et al. / Aquaculture 297 (2009) 141–150
column ineachof the experimental groups revealed theeffect of dietsonthe vertebral column in rainbow trout from day 87 (Table 5).
The Ca-poor diet F had the most significant impact on the vertebralcolumn in the viz-cranial, trunco-cranial and trunco-caudal region. Inthe viz-cranial region there was a significant reduction in the area ofvertebrae relative to rainbow trout fed with the P-rich diet. In thetrunco-cranial and trunco-caudal regions, the area of vertebrae wassignificantly smaller than that of rainbow trout fed with control, P-pooror P-rich diets and reflected a general change in the height and length ofvertebrae with the low Ca diet (F). An additional modification in thetrunco-cranial and trunco-caudal region was a significant reduction inthe intervertebral space of rainbow trout fed with the low Ca diet (F)compared to the high P diet (E) (Table 5). In conclusion, reduced Ca inthe diet of developing rainbow trout fry results in smaller vertebrae inthe anterior and mid-region of the vertebral column. No consistent orsignificant changes were seen in the height, length or area of vertebraein rainbow trout fed with a low P or a high P diet compared to those fedwith the control diet (Table 5).
Fig. 7. Whole-body autoradiographies of rainbow trout fry sampled on day 87 (n=9per experimental group except for the dietary group E, n=6) were used to determinethe mean grey value (a proxy for density) of five vertebrae in each of the main regionsof the vertebral column. Note that trout fed the P-poor diet A had significantly lowermean grey values for vertebrae in the trunco-cranial, trunco-caudal and caudal areathan trout fry fed the control diet C. Means not sharing a common superscript letter fora given vertebral region are significantly different (P<0.05) according to one-wayANOVA followed by a Newman–Keuls test.
The small size of the rainbow trout fry specimens analyzedprecluded direct analysis of Ca and P content of individual vertebraeand instead a “mean grey value” approach (proxy for density) wastaken. In rainbow trout frymaintained on the P-poor diet A, vertebrae inthe trunco-cranial, trunco-caudal and caudal region had a significantlylower “mean grey value” than in fish maintained on control or P-richdiets (Fig. 7). Diets poor in Ca or rich in P did not significantlymodify the“mean grey value” from that of fish fed with the control diet C. Inconclusion, the P-poor diet A which significantlymodifies the ontogenyof both the endochondral and dermal skeleton also significantly reducesthe “density” of the axial skeleton.
3.5. Incidence of abnormalities
Rainbow trout fedwith control (C), low Ca (F), low P (A) or high P (E)diets and sampled on day 87 were inspected externally to determine theincidence and severity of abnormalities visible (Fig. 8A). Radiographieswere used to determine the presence, incidence and character of internalskeletal abnormalities (Fig. 8B and Fig. 9). The principal abnormalityevident externally was kyphosis and the incidence varied with diet, thelowest incidence (~10%) was detected in the control group C and thehighest incidence (~45%) in rainbow trout fed with the low Ca diet Fwhichwas also the group inwhich significant alterations in the vertebraewere observed (Table 5). Detailed analysis of internal skeletal structuresusing radiography revealed a much higher incidence of abnormalities,although they did not cause perceptible external modifications inrainbow trout fed with any of the experimental diets (Fig. 8A). The
Fig. 8. Percentage of rainbow trout sampled on day 87 of the feeding trial and fedmodified (A, E and F) or control (C) diets in which malformations were visible as amodification in the external morphology and internal malformations detected afterdetailed examination of radiographies (Panel A). Note, a high incidence of internalmalformations were detected which did not lead to a perceptible change in externalmorphology. Panel B – Represents the frequency of each malformation considered as aproportion of the total number of internal malformations (100%) detected perexperimental group. Results are presented for each group of rainbow trout fedmodified (A, E and F) or control (C) diets (n=9 individuals per group, except for thedietary group E, n=6 individuals).

Fig. 9. Representative radiographies of rainbow trout sampled on D87 illustrating some of the most frequent malformations observed in the vertebral column. A) shows the irregulardisposition of the vertebrae in the column; B) twisted neural and haemal arches; C) fused vertebrae in the caudal region (note, that 2 haemal and neural arches are associatedwith a singlevertebra); D) vertebrae in the form of a “ring” compared to “normal” (D') vertebrae in the viz-cranial region; E) compression of vertebrae in the viz-cranial region and F) kyphosis in thecranial region. All images of the same amplification and scale bar=2 cm.
148 S. Fontagné et al. / Aquaculture 297 (2009) 141–150
highest incidence of internal abnormalities was found in rainbow troutfed with a low P (~98%) or low Ca (~80%) diet, these were also groups inwhich skeletal ontogeny and vertebrae morphology were significantlymodified (Fig. 5 and Table 5). Interestingly, the group with the lowestincidenceof internal abnormalitieswasnot the control groupbut rainbowtrout fed with the high P diet (~45%). The very high incidence of internalabnormalities registered in general probably reflects the inclusion in theanalysis of subtlemodifications such as twisted arches, irregular vertebralcolumn and compressed vertebrae.
Internal skeletal abnormalities were grouped into 6 main categories:irregular disposition of vertebrae, twisted haemal and neural arches,fusion of vertebrae in the caudal region, “ring” vertebrae in the viz-cranialregion, vertebral compression in theviz-cranial regionandkyphosisof thecolumn. These abnormalities are illustrated in the digital X-ray imagespresented inFig. 9. The frequencyof eachabnormalitywasconsideredas aproportion of the total number of abnormalities detected per experimen-tal group (Fig. 8B). In keeping with the observed modifications invertebral structure and high incidence of externally visible kyphosis, inrainbow trout fed with the low Ca diet (F), kyphosis and irregularplacement of vertebraewere themost frequent internal modifications. Inrainbow trout fed with the low P diet (A), the principal abnormalitieswere irregular placement of vertebrae and twisted arches. In all groups ofrainbow trout even those fed with the control diet C an irregularplacement of vertebrae in the column was evident.
4. Discussion
Present results showed that excess dietary P leads to decreasedsurvival in rainbow trout fry whereas the surviving individuals displayedthe lowest incidence of skeletal abnormalities. On the other hand, dietary
P restriction induced mineralization defects with a lowered calcificationof both endochondral and dermal skeleton resulting in reduced “density”of the axial skeleton and irregular placement of vertebrae with twistedarches. No effect of dietary Ca deficiency was noticed on growthperformance and fish composition. The effect on bone mineralizationwas less clear as dietary Ca deficiency appears to exert some delay inossification processes with an impact on the vertebral column morphol-ogy (smaller vertebrae in the anterior and mid-region of the vertebralcolumn and irregular placement of the vertebrae in the column).
One major observation is that mineral composition of rainbow troutfrywas affected by dietary P level but not by the dietary Ca level. Our dataon whole-body ash and P concentrations which were responsive todietary P intake after only 11 days for P and 28 days for total ash confirmthe observations of Skonberg et al. (1997).We also showed an increase inwhole-body ash, P and Ca concentrations during fish development. The Pcontent of rainbow trout juveniles is expected to be in the range of 0.4–0.5% whereas lower values indicate a dietary P deficiency (Shearer andHardy, 1987; Lall, 2002; Lellis et al., 2004). At the end of the feeding trial,all groups of rainbow trout fry had a P content above 0.43% except forthose fed with the P-poor diet A (0.35%), which implies a dietaryP deficiencywhen fedwith a diet containing 0.5% total P. Thewhole-bodyP composition reflected the dietary P deficiency in group A very early, assoon as 11 days of feeding. The ratio of Ca to P in the whole body ofrainbow trout fry ranged from 0.9 to 1.4 in the present study, with thelowest value in thegroup fedwith the control diet and thehighest value inthe group fed with the P-rich diet. These values of Ca to P ratios in thewhole body are in the range of 0.7 to 1.6 as previously described by Lall(2002) for differentfish species. According toHellandet al. (2005), in caseof dietary P deficiency in fast-growing Atlantic salmon parr (Salmo salar),mineralized calcium phosphate is mobilized and excess Ca is excreted

149S. Fontagné et al. / Aquaculture 297 (2009) 141–150
which results in reducedwhole-body Ca and P levels and reduced ratio ofCa toP. In thepresent study, dietaryPdeficiencydelayedossificationbut itremains to be established if this was a consequence of reduced calciumphosphate deposition or due to its mobilization during skeletaldevelopment. However, during skeletal development, calciumphosphateaccumulation is probably favoured to ensure full calcification even withdietary P deficiency. Nonetheless, in common with juvenile Japaneseflounder (Paralichthys olivaceus), Atlantic salmon parr and post-smolts(Baeverfjord et al., 1998; Helland et al., 2005; Uyan et al., 2007) reduceddietary P availability in the developing trout resulted in reduced whole-body ash and P content whichwas reflected in reducedmineralization ofvertebrae.
Fish fed with the P-poor diet A exhibited a very high apparentP retention, close to 100%. This demonstrates very clearly that inorganicP as supplied here as monobasic sodium and potassium phosphate wascompletely available to the trout. Moreover, P contained in casein waseffectively utilized by rainbow trout fry confirming the very earlyobservations of Ogino et al. (1979). The apparent P retention in thecontrol groupwas close to 50% in accordancewith the value reported byLellis et al. (2004) whereas the apparent retention in the group B fedwith a diet containing 0.8% total P (83±4%) was closer to the value of86% reported by Satoh et al. (1993). According to the whole-bodyP composition of the trout fry and if we consider that the addition of anexcess amount of P above the requirement reduced the P absorption, thedietary P requirementwas fulfilledwith diet Bwhich contains 0.8% totalP with 0.4% P supplied as monobasic sodium and potassium phosphate.The increasingly efficient utilization of P when it is restricted in the dietis partially explained in rainbow trout adults by modifications intranscription of genes and their protein products which are implicatedin P absorption and metabolism (Sugiura and Ferraris, 2004a). Forexample, in P restricted rainbow trout, the sodium-phosphate cotran-sporter (NaPi-II) mRNA is up-regulated in the intestine and is relatedwith increased P uptake relative to fish fed with adequate dietary P(Sugiura et al., 2003; Sugiura and Ferraris, 2004b). Clearly it will be ofinterest in the future to assess if similar changes in gene transcriptionunderlie the efficiency of P utilization in the trout fry fed with diets lowin available P.
Contrary to whole-body composition, growth of rainbow trout frywas not affected by dietary P or Ca level in agreement with severalother studies that have shown that the requirement for P is lower forgrowth than for maximum P deposition (Shearer and Hardy, 1987;Rodehutscord, 1996; Skonberg et al., 1997; Bureau and Cho, 1999).The maximum P deposition and the best skeletal conformation of fishwas achieved with the highest dietary P level even if an initial delay inthe skeletal development was evident in this group. However, thehighmortality registered in this group could have selected individualswith a good skeletal conformation making it difficult to establish inthe present study if it was a direct effect of high dietary P levels.
Another observation is that excess dietary P supplied at twice therequirement level decreased survival of early trout fry. Impairment ofsurvival has also been observed in rainbow trout fed with high P levelsby Satoh et al., (1993). According to these authors, the increase inmortality was more related to the supply of P in the form of sodiumphosphate than to P levels per se, as the trout fed with high P levelsupplied as calcium or potassium phosphates displayed growthdepression and not a decrease in survival. Sincewe used here a mixtureof sodium and potassium phosphates, any adverse effect of highconcentrations of sodium and potassium could not be excluded.However, the impairment of survival is most likely due to high dietaryP levels per se. Diets were tested with first-feeding trout fry which aremore susceptible and generally display higher mortality than juveniles.Sincenogrowth reductionwasnoticed between groups at the endof thefeeding trial, the results suggest that, within the group fed with the P-rich diet, the smallestfish exhibited highermortality thanbigger ones assomesignificantdifferences in growthwere seen betweengroups at day28 but not at later stages. The decrease in survival of the trout fry fed
with excess P may be related to the growth reduction previouslyreported in juvenile fish fed with excess P supplied as calcium,potassium or sodium phosphates (Porn-Ngam et al., 1993; Satoh et al.,1993, 1996; Skonberg et al., 1997; Vielma and Lall, 1998; Vielma et al.,2002). According to Satoh et al., (1996), the decrease in growthperformances can also be associatedwith a reduction of zinc availabilityand protein utilization in fish fed with high P diets. The reducedabsorption of trace elements at a high dietary P intake could be due tocomplex formation with P (Lall, 2002).
Dietary P deficiency induced critical reductions in whole body andskeleton as visualized by staining and radiography of rainbow trout fry.The P-depletion in whole body of rainbow trout fry had a significantimpact on the ontogeny of the endochondral and dermal skeleton andcaused a significant delay in its development. Some skeletal abnormal-ities such as twisted arches were registered with dietary P restriction inaccordance with several other studies describing skeletal abnormalitiessuch as curved spines, soft bones, compressed vertebral bodies andtwisted pleural ribs (Lall, 2002; Lall and Lewis-McCrea, 2007).
Visible external abnormalities were principally associated with thespine and differed in incidence between thefish fedwith different diets.It seems unlikely that the variable incidence of abnormalities wasrelated to genetic differences as eggs from broodstock were pooled andrandomly distributed between experimental tanks. Among differentfactors exerting an influence on spinal abnormalities in Atlantic salmon,genetics appears to play only a minor role (McKay and Gjerde, 1986;Gjerde et al., 2005; Sullivan et al., 2007a). Kyphosis, the main visibleexternal abnormality in the trout frywasmost prevalent in fish fedwitha low Ca diet which is in keeping with the modification in vertebraeobserved by radiography. Although Ca deficiency is uncommon in fishbecause of its availability in water, the present study indicatesnonetheless, that reduction in available dietary Ca delays the ontogenyof skeletal developmentwithout affecting final bonemineralization andleads to modifications in the shape and size of vertebrae. A clearrelationship between reduced P availability, bone mineralization andthe incidence of skeletal malformations has been demonstrated(Baeverfjord et al., 1998; Vielma and Lall, 1998; Helland et al., 2005;Sullivan et al., 2007c; Uyan et al., 2007). In the present study,radiography revealed that the trout fry fed with a P-deficient diet hada high incidence of vertebral abnormalities similar to Atlantic salmonparr and Japanese founder juveniles (Helland et al., 2005; Uyan et al.,2007). However, an increase in the incidence of operculum deforma-tions was not observed in fish fed with a P-deficient diet. Given theshort-term nature of the present study, it is not possible to establishwhether modifications in skeletal ontogeny and abnormalities detect-able by radiography in the trout fry will lead to deformed trout at thelater stages of development.
An important observation was that although low Ca or P supple-mented diets caused an initial delay in the early ontogeny of the troutskeleton, at the later stages fish recovered and the ontogeny wassimilar to that of the control trout. Dietary Ca deficiency did not affectgrowth performance or whole-body composition. The results of thepresent study confirm that the requirement of rainbow trout fry canbe met in large part by absorption of Ca through gills and skin infreshwater (Lall, 2002), especially when the Ca content of water isrelatively high (83 mg/L) as in the present study. However, dietary Cadeficiency appeared to affect vertebral column morphology withsmaller vertebrae in the anterior and mid-region of the vertebralcolumn and irregular placement of the vertebrae along the column.
In conclusion, the present work indicates a different effect of dietarycalcium and phosphorus deficiencies on skeletal development andmineral deposition in rainbow trout fry. Dietary Ca deficiency induces adelay in the ontogeny of skeletal development without affecting finalbone mineralization and leads to modifications in the shape and size ofvertebraewhereasdietaryPdeficiency induces aP-depletion in thewholebody and a lowered or delayed calcification of both endochondral anddermal skeleton. Both dietary deficiency and excess of P are detrimental
150 S. Fontagné et al. / Aquaculture 297 (2009) 141–150
to rainbow trout fry development as Pdeficiency affects bone calcificationwhile excess P affects survival. Thus a special attention should be paid tothe level and availability of phosphorus in the formulation of diets fornormal vertebral development during early ontogeny of rainbow trout.
Acknowledgements
This studywas supported inpart by the EuropeanCollective researchproject “Fine Fish” devoted towards understanding the origin of thedevelopment of skeletal disorders in larval and juvenile fish (Contractno. COLL-CT-2005-012451). The authors wish to thank F. Terrier,F. Sandres, Y. Hontang and I. Irijalba Claramunt for the care of fish andA. Josserand and M.-J. Borthaire for the technical assistance. They arealsovery grateful to the radiologydepartmentat theHospitalDistrital deFaro, Portugal who assisted in X-ray analysis.
References
AFNOR, 1992. Viandes, préparations de viande et produits à base de viande —
Détermination de la teneur en phosphore total. NF V04-406.Aunsmo, A., Guttvik, A., Midtlyng, P.J., Larssen, R.B., Evensen, Ø., Skjerve, E., 2008.
Association of spinal deformity and vaccine-induced abdominal lesions in harvest-sized Atlantic salmon, Salmo salar L. J. Fish Dis. 31, 515–524.
Baeverfjord, G., Åsgård, T., Shearer, K.D., 1998. Development and detection of phosphorusdeficiency in Atlantic salmon, Salmo salar L., parr and post-smolts. Aquac. Nutr. 4, 1–11.
Bazin, D., 2008. Mesure de l'ossification de poissons à de jeunes stades. Cah. Techn. Inra63, 5–14.
Bureau, D.P., Cho, C.Y., 1999. Phosphorus utilization by rainbow trout (Oncorhynchusmykiss): estimationofdissolvedphosphoruswasteoutput. Aquaculture 179, 127–140.
Cahu, C., Zambonino Infante, J., Takeuchi, T., 2003. Nutritional components affectingskeletal development in fish larvae. Aquaculture 227, 245–258.
Deschamps, M.-H., Kacem, A., Ventura, R., Courty, G., Haffray, P., Meunier, F.J., Sire, J.-Y.,2008. Assessment of “discreet” vertebral abnormalities, bone mineralization andbone compactness in farmed rainbow trout. Aquaculture 279, 11–17.
Dudzinski, K.M., Neff, N.A., 1990. A technique for the combination of clearing, staining,and injecting small mammals. Stain Technol. 65, 113–118.
Faustino, M., Power, D.M., 1998. Development of osteological structures in the seabream: vertebral column and caudal fin complex. J. Fish Biol. 52, 11–22.
Folch, J., Lees, M., Sloane-Stanley, G.H., 1957. A simple method for the isolation andpurification of total lipids from animal tissues. J. Biol. Chem. 226, 497–509.
Gjerde, B., Pante, M.J.R., Baeverfjord, G., 2005. Genetic variation for a vertebraldeformity in Atlantic salmon (Salmo salar). Aquaculture 244, 77–87.
Helland, S., Refstie, S., Espmark, A., Hjelde, K., Baeverfjord, G., 2005.Mineral balance andboneformation in fast-growing Atlantic salmon parr (Salmo salar) in response to dissolvedmetabolic carbon dioxide and restricted dietary phosphorus supply. Aquaculture 250,364–376.
Holm, J., Palace, V., Siwik, P., Sterling, G., Evans, R., Baron, C., Werner, J., Wautier, K.,2005. Developmental effects of bioaccumulated selenium in eggs and larvae of twosalmonid species. Environ. Toxicol. Chem. 24, 2373–2381.
Kacem, A., Meunier, F.J., Aubin, J., Haffray, P., 2003. A histo-morphological character-ization of malformations in the vertebral skeleton of rainbow trout (Oncorhynchusmykiss) after various triploidization treatments. Cybium 27S, 1–9.
Kvellestad, A., Høie, S., Thorud, K., Tørud, B., Lyngøy, A., 2000. Platyspondyly andshortness of vertebral column in farmed Atlantic salmon Salmo salar in Norway —description and interpretation of pathologic changes. Dis. Aquat. Org. 39, 97–108.
Lall, S.P., 2002. The minerals, In: Halver, J.E., Hardy, R.W. (Eds.), Fish Nutrition, 3rd ed.Academic Press Inc., San Diego, pp. 259–308.
Lall, S.P., Lewis-McCrea, L.M., 2007. Role of nutrients in skeletal metabolism andpathology in fish — an overview. Aquaculture 267, 3–19.
Lellis, W.A., Barrows, F.T., Hardy, R.W., 2004. Effects of phase-feeding dietaryphosphorus on survival, growth, and processing characteristics of rainbow troutOncorhynchus mykiss. Aquaculture 242, 607–616.
McKay, L.R., Gjerde, B., 1986. Genetic variation for a spinal deformity in Atlantic salmon,Salmo salar. Aquaculture 52, 263–272.
National Research Council, 1993. Nutrient Requirements of Fish. National AcademyPress, Washington, DC, USA. 114 pp.
Ogino, C., Takeuchi, L., Takeda, H., Watanabe, T., 1979. Availability of dietaryphosphorus in carp and rainbow trout. Bull. Jpn. Soc. Sci. Fish. 45, 1527–1532.
Porn-Ngam, N., Satoh, S., Takeuchi, T., Watanabe, T., 1993. Effect of the ratio ofphosphorus to calcium on zinc availability to rainbow trout in high phosphorusdiet. Nippon Suisan Gakkaishi 59, 2065–2070.
Poynton, S.L., 1987. Vertebral column abnormalities in brown trout, Salmo trutta L. J.Fish Dis. 10, 53–57.
Rodehutscord, M., 1996. Response of rainbow trout (Oncorhynchus mykiss) growingfrom 50 to 200 g to supplements of dibasic sodium phosphate in a semipurifieddiet. J. Nutr. 126, 324–331.
Satoh,S., Porn-Ngam,N., Takeuchi, T.,Watanabe,T., 1993. Effectofvarious typesofphosphateson zinc availability to rainbow trout. Nippon Suisan Gakkaishi 59, 1395–1400.
Satoh, S., Porn-Ngam, N., Takeuchi, T.,Watanabe, T., 1996. Influence of dietary phosphoruslevels on growth and mineral availability in rainbow trout. Fish. Sci. 62, 483–487.
Shearer, K.D., Hardy, R.W., 1987. Phosphorus deficiency in rainbow trout fed a dietcontaining deboned fillet scrap. Prog. Fish-Cult. 49, 192–197.
Skonberg, D.I., Yogev, L., Hardy, R.W., Dong, F.M., 1997. Metabolic response to dietaryphosphorus intake in rainbow trout (Oncorhynchus mykiss). Aquaculture 157, 11–24.
Sugiura, S.H., Ferraris, R.P., 2004a. Dietary phosphorus-responsive genes in theintestine, pyloric ceca, and kidney of rainbow trout. Am. J. Physiol. 287, R541–R550.
Sugiura, S.H., Ferraris, R.P., 2004b. Contributions of different NaPi cotransporterisoforms to dietary regulation of P transport in the pyloric caeca and intestine ofrainbow trout. J. Exp. Biol. 207, 2055–2064.
Sugiura, S.H., McDaniel, N.K., Ferraris, R.P., 2003. In vivo fractional Pi absorption andNaPi-II mRNA expression in rainbow trout are upregulated by dietary P restriction.Am. J. Physiol. 285, 770–781.
Sullivan, M., Guy, D.R., Roberts, R.J., Manchester, N.J., 2007a. The aetiology of spinaldeformity in Atlantic salmon, Salmo salar L.: influence of genetic factors on thefrequency and severity in freshwater stages. J. Fish Dis 30, 753–758.
Sullivan, M., Hammond, G., Roberts, R.J., Manchester, N.J., 2007b. Spinal deformation incommercially cultured Atlantic salmon, Salmo salar L.: a clinical and radiologicalstudy. J. Fish Dis 30, 745–752.
Sullivan, M., Reid, S.W.J., Ternent, H., Manchester, N.J., Roberts, R.J., Stone, D.A.J., Hardy, R.W.,2007c. The aetiology of spinal deformity in Atlantic salmon, Salmo salar L.: influence ofdifferent commercial diets on the incidence and severity of the preclinical condition insalmon parr under two contrasting husbandry regimes. J. Fish Dis. 30, 759–767.
Takle, H., Baeverfjord, G., Lunde, M., Kolstad, K., Andersen, Ø., 2005. The effect of heatand cold exposure on HSP70 expression and development of deformities duringembryogenesis of Atlantic salmon (Salmo salar). Aquaculture 249, 515–524.
Taylor, W.R., Van Dyke, G.C., 1985. Revised procedures for staining and clearing smallfishes and other vertebrates for bone and cartilage study. Cybium 9, 107–119.
Uyan, O., Koshio, S., Ishikawa, M., Uyan, S., Ren, T., Yokoyama, S., Komilus, C.F., Michael,F.R., 2007. Effects of dietary phosphorus and phospholipid level on growth, andphosphorus deficiency signs in juvenile Japanese flounder, Paralichthys olivaceus.Aquaculture 267, 44–54.
Vågsholm, I., Djupvik, H.O., 1998. Risk factors for spinal deformities in Atlantic salmon,Salmo salar L. J. Fish Dis. 21, 47–53.
Versluis, R.G.J.A., Petri, H., Vismans, F.J.F.E., van de Ven, C.M., Springer, M.P., Papapoulos,S.E., 2000. The relationship between phalangeal bone density and vertebraldeformities. Calcif. Tissue Int. 66, 1–4.
Vielma, J., Lall, S.P., 1998. Phosphorus utilization by Atlantic salmon (Salmo salar) rearedin freshwater is not influenced by higher dietary calcium intake. Aquaculture 160,117–128.
Vielma, J., Koskela, J., Ruohonen, K., 2002. Growth, bone mineralization, and heat andlow oxygen tolerance in European whitefish (Coregonus lavaretus L.) fed withgraded levels of phosphorus. Aquaculture 212, 321–333.
Copyright © 2022 FDOKUMEN