Status Review Update for Coho Salmon (Oncorhynchus kisutch)
115
Status Review Update for Coho Salmon (Oncorhynchus kisutch) from the Central California Coast and the California portion of the Southern Oregon/Northern California Coasts Evolutionarily Significant Units Prepared by the Southwest Fisheries Science Center Santa Cruz Laboratory 12 April 2001 (revision 1 ) 1 This document was originally printed on 31 March 2001. This revised version contains the completed appendices as well as a few minor editorial changes to the text; no substantive changes were made.
-
Upload
khangminh22 -
Category
Documents
-
view
1 -
download
0
Transcript of Status Review Update for Coho Salmon (Oncorhynchus kisutch)

Status Review Update for Coho Salmon (Oncorhynchus kisutch) from the Central California Coast and the California portion of the Southern Oregon/Northern California Coasts Evolutionarily Significant Units Prepared by the Southwest Fisheries Science Center Santa Cruz Laboratory
12 April 2001 (revision1)
1 This document was originally printed on 31 March 2001. This revised version contains the completed appendices as well as a few minor editorial changes to the text; no substantive changes were made.

(blank page)

CONTENTS
Summary i Introduction 1 Listing History 1 Methods 2 Presence-Absence Analysis 2 Population Trends 3 Results 5 Presence/Absence 5 Population Trends 7
Summary of Southern Oregon/Northern California ESU Trend Data 11 Summary of California Portion of Southern Oregon/
Northern California Coasts ESU Trend Data 13
Artificial Propagation 13 Conclusions 14 Central California Coast ESU 14 California Portion of the Southern Oregon/Northern
California Coasts ESU 15 Literature Cited 15 Figures 18 Tables 38 Appendices 41
Appendix A 42 Appendix B 67
References 93

i
SUMMARY Coho salmon (Oncorhynchus kisutch) data in California were reviewed to provide an update of its status. This review was based only on biological information and uses the “best available data” to analyze the current condition of this species. The geographical area covered includes the Central California Coast ESU and the California portion of the Southern Oregon/Northern California Coasts ESU. In previous status reviews, findings were that the Central California Coast ESU was presently in danger of extinction and that the Southern Oregon/Northern California Coasts ESU was likely to become endangered in the foreseeable future. Two general types of data were analyzed: presence-absence data and population trend data. Presence-absence data included in the analysis were collected using a number of different sampling techniques over different periods of time between 1989 and 2000. It is important to note that a record of “presence” does not necessarily indicate persistent populations. Nor does a record of “absence” preclude the possibility of coho salmon within the system, only that they were not detected during sampling. Population trend data came from a wide variety of sampling methods including juvenile surveys, downstream migrant trapping, upstream migrant trapping, and spawning and redd surveys. For the trend analysis, we used population data only from streams where a minimum of six years of sampling had been conducted at the same location and using consistent methods. This was done so that the analysis would include at least two complete cycles of the coho life history. The percentage of sampled streams for which coho salmon were found to be present declined over the 1989-2000 time period, with greater declines occurring in the southern part of the range. In the Central California Coast ESU, coho historical presence was identified in 278 streams. The percentage of these streams for which presence has been detected at least once during the three-year period has remained relatively constant (between 44% and 48%) through time, the notable exception being the 1995-1997 period, when 61% of the surveyed streams were found to have coho salmon. In the California portion of the Southern Oregon/Northern California Coasts ESU, the percentage of streams with coho present was higher than the Central California Coast ESU, but declined from 1989 to 2000. Because of the substantial difference in the number of streams included in the analysis, these results are not directly comparable to those presented in Brown and Moyle (1991). Population trend data indicate a general downward trend throughout the state, though there is some variation among streams. In the Central California Coast ESU, abundances in the 1990’s were clearly lower than in the mid-to-late 1980’s. The values of coho replacement rates (CRR) were less than one for 126 of 229 observations, indicating a significantly (p = 0.0045) higher likelihood that abundance decreased rather than increased. The 1996 and to a lesser degree 1997 year classes were clearly strong ones. This is relevant because the BRT conclusions were based largely on data collected in those years. In the California portion of the Southern Oregon/Northern California Coasts ESU, there appears to be a general decline in abundance, but trend data are more limited in this area and there is variability among streams and years. Here, the value of CCR was less than one for 40 of 67 observations, which was significantly (p = 0.0278) higher than expected based on a probability of 0.5. Levels of hatchery production of coho salmon in California are much lower than in Oregon and Washington. In the Central California Coast ESU, coho hatchery production has decreased with Warm Springs Hatchery being converted into a captive broodstock facility and Monterey Bay Salmon and Trout unable to get sufficient numbers of fish for broodstock in recent years. Only the Noyo Station program is still consistently in operation but has missed production years. In the California portion of the Southern Oregon/Northern California Coasts ESU, Trinity River Hatchery maintains large production and is thought to create significant straying to natural populations. Irongate and Rowdy Creek Hatcheries has experienced low numbers of returns and therefore limited production. This status review update agrees with previous BRT conclusions. The Central California Coast ESU is presently in danger of extinction. The condition of coho salmon populations in this ESU is worse than indicated by previous reviews. The California portion of the Southern Oregon/Northern California Coasts ESU is likely to become endangered in the foreseeable future.

1
INTRODUCTION Previous status reviews for coho salmon (Onchorhynchus kisutch) in California have noted the lack of long-term data for assessing population trends for coho salmon in the state (Moyle et al. 1994; Weitkamp et al. 1995; Schiewe 1996). The decline in salmon abundance and the subsequent listing of coho salmon as “threatened” under the Endangered Species Act (ESA) in two Evolutionarily Significant Units (ESUs) in California has prompted an increase in the amount of monitoring of coho populations over the last six to eight years. Although there remains a limit on the ability to directly compare current population abundance with historical abundance, the availability of consistently gathered survey data and hence the ability to track coho salmon status has increased in the last several years.
The purpose of this document is to provide an updated review of coho salmon status in California, focusing on data collected over the last twelve years. This review is based on “best available data,” but there are still sources of data that were unavailable to the Southwest Fisheries Science Center (SWFSC). The review considers only biological data and not habitat quality. The conclusions herein represent the consensus of opinion by SWFSC biologists that have been active in the Bilogical Review Team (BRT) process. This analysis covers those areas of the coho salmon’s historical range that lie within the Central California Coast ESU and the California portion of the Southern Oregon/Northern California Coasts ESU. The Central California Coast ESU extends from the San Lorenzo River in Central California to Punta Gorda in Northern California, including tributaries to San Francisco Bay, but excluding populations from the Sacramento-San Joaquin River system. Coho salmon have occasionally been observed in streams south of the San Lorenzo River, including two confirmed reports in Aptos Creek (Patrick Colson, CDFG, pers. comm.). Whether these reports are isolated cases of straying or successful re-establishment of populations in this creek is not known. There are also anecdotal historical reports of coho salmon in the Big Sur and Carmel Rivers (Hassler et al. 1991). These populations are considered part of the Central California Coast ESU if they are not the result of stock transfers (Weitkamp et al. 1995). The Southern Oregon/Northern California Coasts ESU extends from Punta Gorda to Cape Blanco in southern Oregon, inclusive of the Klamath-Trinity River system (Weitkamp et al. 1995). For this ESU, we considered only streams within California, including tributaries to rivers that enter the ocean north of the Oregon border (i.e., the Illinois and Winchuk Rivers).
LISTING HISTORY In 1993, the National Marine Fisheries Service (NMFS) received a petition to list coho salmon in Scott and Waddell creeks as a threatened or endangered species from the Santa Cruz County Planning Department (Bryant 1994). In 1994, NMFS announced its determination that coho salmon from Scott and Waddell creeks do not constitute an ESA species (i.e., distinct population segment) and that a listing was not warranted (NMFS 1994). However, as a result of this and other petitions to list local stocks of coho salmon, NMFS initiated a coastwide review of coho salmon status (NMFS 1993). Coho salmon data were reviewed by the BRT in the original status review (Weitkamp et al. 1995) and again after the one-year comment period, considering new data submitted during that time (Schiewe 1996, 1997). The BRT concluded that coho salmon in the Central California Coast ESU were presently in danger of extinction and that coho salmon in the Southern Oregon/Northern California Coasts ESU were likely become endangered in the foreseeable future. These decisions were largely based on presence/absence data for coho salmon in streams where they had historically occurred as described in Brown and Moyle (1991) and Adams et al. (1999). Subsequently, the Central California Coast coho ESU was listed as threatened on Oct. 13, 1996 and the Southern Oregon/Northern California Coasts coho ESU was listed as threatened on May 6, 1997.

2
METHODS
Presence-Absence Analysis Historical Presence We compiled a list of streams for which there was historical evidence of coho salmon presence using a variety of published and unpublished sources. Principle among published sources were the reviews of Brown and Moyle (1991), Hassler et al. (1991), Ellis (1997), Adams et al. (1999), and Kier Associates (1999). These reviews in turn drew heavily on several key sources including Cherr and Griffen (1979a,b,c,d,e,f), Boberg and Kenyon (1979a,b,c,d), and Mills (1983). Additional unpublished information was obtained from agency biologists, scientists, private landowners, water districts, nonprofit groups, and consultants.
The list of streams with historical evidence of coho salmon presence is provided in Appendix A. We chose to organize the list geographically as follows. River basins are listed from north to south according to where the eventual outlet stream or river enters the Pacific Ocean. Within a basin, tributary streams and rivers are listed in the order that they enter the mainstem as one moves upstream from the river mouth. A similar hierarchy was employed for tributaries, with streams listed in order from mouth to headwaters. Where a river splits into two or more major forks, we listed the north or west fork first followed by the south or east fork. This geographic arrangement was chosen to reduce confusion that has occurred in past reviews where multiple streams with the same name occur in the same watershed.
Current Present-Absence For each stream on the historical list, we attempted to find any available information on coho salmon presence or absence based on surveys conducted from 1989 to 2000, which, given the coho three-year life cycle typical in California, covers the last four generations. Data were gathered from a variety of sources including published literature, unpublished reports, unpublished data and personal communications from agencies, tribes, private landowners, and nonprofit groups. Survey methods used by various sources included electrofishing, snorkeling, downstream or upstream migrant traps, spawning surveys, and carcass counts. For each stream, we recorded whether coho salmon were observed (present) or not (absent) in each year that a survey was conducted. Interpretation of these data should be tempered by several facts. First, a record of “presence” indicates that at least one individual representing one or more life stages (e.g., young-of-the-year [YOY], yearlings, or adults) was observed during that particular year. For adult surveys that spanned portions of two calendar years were listed as occurring in the first year (i.e., spawners observed in the 1999-2000 spawning season were listed as present in 1999 but not necessarily 2000).
Second, although records of presence definitively establish that coho salmon occurred at a particular site, it does not necessarily mean that populations are persistent. In more than one instance, we were informed by researchers that coho salmon were absent from streams in the fall where they had been previously observed in spring or summer. Nevertheless, we tallied these as “presences” since there was no way to determine whether similar phenomena occurred in other data or in the historical record of presence-absence data. Additionally, its should be noted that our analysis weighs sites equally with respect to presence regardless of the number of fish observed. Thus, while at a coarse level, changes in the percentage of streams with coho present provide some indication of population trends, region-level declines can be masked by the presence of small numbers of fish. Conversely, although we specifically noted where the number of observed fish was small (five or fewer), certain sampling protocols (e.g., sampling of short reaches, or presence/absence surveys where sampling was terminated when coho were found, such as used by Adams et al. [1999] and Kier Associates [1999]) could lead to the appearance of small numbers of fish when in fact they are more abundant.

3
Finally, it is also important to note that a record of “absence” does not preclude the possibility that fish were present in the system. Many of the sample sites used in the analysis are index reaches of limited length (often 30 m to 100 m) and may not reflect conditions elsewhere in the watershed, though frequently index reaches are selected based on known historic occurrence of fish. Coho salmon are commonly patchily distributed within a watershed, and the occupied area may vary from year to year based on environmental conditions or where adults happen to spawn. As populations become smaller in size, the probability that short index reaches will contain fish is expected to decline. Despite these limitations, the consistent temporal patterns of presence-absence (and abundance) that occur across large areas (whole watersheds and even regionally) suggest that these index reaches do capture gross patterns of presence-absence through time, even if data from individual years at a site may be inaccurate. Presence-absence data for each stream and year are presented in Appendix B. Analysis For our analysis, we examine trends in the percentage of streams surveyed that showed coho presence from 1989 to 2000. Data are presented both on an annual basis and as summaries for three-year intervals: 1989-1991, 1992-1994, 1995-1997, and 1998-2000. These temporal blocks are used for two reasons: to encompass the three potential brood lineages in a particular system and to facilitate comparisons with previous analyses. Data are summarized by ESU, as well as by counties and major river basins within ESUs.
Weighted logistic regression was used to synthesize and describe the joint effects of geography and year on the probability that a survey would indicate “presence” of coho salmon. Survey data were roughly aggregated by geography, using county and major drainages to guide classification. The proportion of “presences”, p, in the available data was calculated for each year for each geographic region. We fit the model
( ) ( ) ( ) δβα ++= stp **logit (1)
to the resulting dataset, where the logit(p) is defined as ln(p/(1-p)), t represents year, g represents space (the geographic “index” of the groups defined in Table 1), and greek letters are the fitted coefficients. We used the number of observations used to calculate a given proportion present to weight the importance of that proportion in the regression. Population Trends Current population trends were analyzed for 41 streams in 17 major watersheds in the Central California Coast ESU and 9 streams in 3 major watersheds in the California portion of the Southern Oregon-Northern California ESU. Ideally long-term records (e.g., more than 10 years) of abundance of either adult migrants (or spawners) or outmigrants provide the best information on population trends, though the former can be substantially influenced by ocean harvest. Such records, however, are exceedingly rare in California, and the majority of populations for which these records are available have been substantially influenced by hatchery operations and thus may or may not reflect abundance trends in naturally spawning populations. Where such records exist, we report population numbers and make note of potential biases in the data. Whereas long-term records of abundance are lacking, a number of monitoring programs were initiated in the 1990s by agencies, tribes, private landowners, water districts, nonprofit groups, and others, and these efforts have resulted in a number of shorter-term records of abundance. The criterion we used for including a stream in this report was a minimum of six years of data for which sample sites and survey methods were consistent over all years. The six-year criterion was chosen to encompass two full generations of coho salmon. The consistency criteria excluded several sites where longer-term records are available, but where comparing numbers among years might lead to erroneous conclusions.
Among the data sets we used, researchers and authors employed a variety of survey and analytical methods, and the robustness of these methods for assessing population trends is highly variable. A brief

4
discussion of different types of surveys and analyses, as well as their potential limitations and biases, is warranted. Juvenile surveys
By far the most widely available data on salmonid abundance in California has been generated by juvenile surveys (electrofishing or snorkeling) conducted in rearing habitats. In most cases, data are collected each year at one or more index sites within a stream at approximately the same time of year, usually summer or fall when flows are lowest. Generally, selection of index sites is nonrandom and dictated by ease of access or local knowledge (or presumed knowledge) of fish presence or relative abundance. Additionally, because the same sites are sampled each year, interannual shifts in spatial distribution of coho salmon among years due to random events or changes in habitat resulting from natural or anthropgenic disturbances both can influence the number of fish observed at a particular site. Finally, if time of sampling differs from year to year, then data are confounded by the natural rate of mortality. For all of these reasons, conclusions about population trends based on limited sampling at index reaches should be viewed cautiously.
Abundance information for juveniles was reported in a variety of different units including 1) number of fish per linear distance of stream sampled; 2) number of fish per square meter of habitat (averaged over all habitat types sampled); and 3) expanded population estimates where habitat-specific density is multiplied by available habitat in a stream to obtain an overall population estimate (i.e., number of fish) for the stream. In this report, in all cases, where fish are reported as fish per linear distance of stream (Waddell and Scott creeks in Santa Cruz County, Gazos Creek in San Mateo County, and Redwood Creek in Marin County), these values represent total counts data rather than true density estimates, since no attempt was made to correct for variability in capture efficiency among years. Thus, differences in fish counts may reflect, in part, differences in sampling efficiency due to visibility, stream discharge, or operating efficiency of the electrofisher. Where there was a choice between using density estimates or expanded population estimates, we reported the expanded estimates, provided the expansions accounted for habitat unit types. The reliability of these expanded estimates, however, depends on the fraction of total habitat sampled for fish, and an appropriate distribution of fish sampling sites among the potential habitats. Downstream migrant trapping
A handful of data sets derived from downstream migrant trap operations were available. We included data only for yearling fish, since numbers of YOY fish caught in migrant traps can fluctuate dramatically for reasons unrelated to population density. Often in these trapping efforts, coho salmon were caught incidentally by researchers collecting data on chinook salmon and steelhead. We used trapping data for trend analysis only if the sampling period consistently encompassed the period in spring when coho are most likely to emigrate—from March to May or June.
Data from outmigrant trapping efforts are most commonly reported in terms of total number of individuals captured. Consequently, assessing trends in abundance is potentially risky, since capture efficiencies vary substantially within and among years as a function of streamflow. Nevertheless, we present these data because they appear to capture gross trends in abundance reasonably well. Where population estimates were calculated (based on mark-recapture estimates of trap efficiency), we used these data rather than fish counts. Upstream migrant trapping
Traps or weirs for collecting upstream migrant adults provided data for a few streams; however, virtually all of the upstream migrant data included in this report was gathered at facilities associated with hatcheries. Consequently, population trends apparent in these data may or may not reflect trends among wild populations. Additionally, in some cases (e.g., Noyo Egg Colleting Station), adult fish are usually collected only up until the desired number of brood fish is attained. Thus, these counts may

5
underestimate abundance, particularly in years with high returns. At other locations (e.g., Shasta River), counting of coho salmon was incidental to counting of steelhead or chinook salmon; thus, the numbers presented may represent an incomplete census. Spawning Surveys and Redd Counts
Spawning surveys for coho salmon were also relatively rare. Because coho typically spawn during periods of high flow, visual observation of coho can be difficult. In the few data sets we found, data were reported as the maximum live/dead count, which is the maximum number of live fish plus carcasses observed on any one survey. Although there are methods for obtaining population estimates from repeated surveys of this type, no such data were available to us.
We also report redd count data from a single watershed (Lagunitas Creek). In general, redd counts tend to underestimate total spawning population; however, like other data types they can provide an index of relative abundance among years. Potential biases in using redd data for trend detection include variable observing conditions among years, superimposed redds, or multiple redds resulting from a single individual. Analysis
Analysis of population trends is summarized by geographic regions corresponding to those delineated in the presence-absence analysis. Plots of abundance estimates or indices over time are presented for major watersheds and, when possible, for subwatersheds within larger basins. Due to the generally consistent three-year life cycle of female coho salmon in California, comparison of interannual changes in abundance is largely meaningless, since any changes in environmental factors affecting coho populations at annual time scales are confounded by differences between largely independent brood-year lineages. Therefore, we estimated cohort replacement rates (CRR) for each generation of each brood-year lineage for which we had an estimate or index of abundance at year t and year t+3. The cohort replacement rate CRR is calculated as the ratio tt NN /3+ , and describes the rate of population growth over a single generation. Values greater than one indicate an increase in abundance; values less than one indicate a decrease in abundance. Cohort replacement rates were calculated only for pairs of data that did not include an abundance estimate or index of zero.
Assuming 1) that populations of coho salmon have exhibited no net change in population size in recent years, and 2) that the method used to estimate abundance within each time series has an equal probability of overestimating or underestimating abundance (or at least that the method of estimating abundance exhibits consistent bias, such that if bias were removed, the assumption of equal probability of overestimation or underestimation would hold), it may be expected that any given estimate of λ has an equal probability of exceeding one or or falling below one. To determine if the distribution of cohort replacement rates indicated systematic changes in abundance of coho salmon across cohorts and geography, we tested the null hypothesis that cohort replacement rates did not indicate systematic decline by calculating the probability of observing the number of CRR < 1 in a binomial sample with Pr[CRR < 1] = 0.5.
RESULTS Presence/Absence We found some evidence of coho salmon occurrence in 877 streams in California. The increase in number over the 582 streams reported by Brown et al. (1994) reflects several factors. First, for a number of streams, new historical records have been uncovered since 1991. Additionally, surveying of streams for a number of salmonids has intensified during the 1990s and coho have been found in locations where no previous records were available. Kier Associates (1999) reported records of occurrence in 123

6
streams not reported in Brown and Moyle (1991) in the Southern Oregon/Northern California Coasts ESU. We also reported coho salmon in streams regardless of the size of the stream or the linear distance of stream accessible to salmon. In several cases, fish were reported near the mouths of streams that were tributary to known coho producing streams. It is quite possible that these fish migrated into these systems from adjacent waters. Finally, while the number of streams listed as potential coho streams here is larger then previously reported, there is no way to be certain how many of these observations of occurrence represent persistent populations of coho and how many are isolated occurrences of straying by coho into streams that typically do not support them. Overall in California, the percentage of surveyed streams showing coho salmon presence has declined with time (Figure 1). In 1989 and 1990, coho salmon were found in approximately 80 percent of the historical streams surveyed. From 1998 to 2000, that percentage has dropped to between 51 and 66 percent (average 58). Comparison among time intervals should be done with some caution. The number of streams surveyed has varied over the last twelve years, with the greatest percentage of historic streams being surveyed in the 1994, 1995, 1996, and 2000 period. Thus, some of the changes in percentage may be an artifact of increased sampling intensity. It is difficult, however, to gage the influence of sampling intensity. On one hand, the listing of coho salmon under ESA likely simulated sampling in some habitats not formerly believed to be good coho habitat. On the other hand, much recent monitoring work has focused on those streams that are believed to be the most likely sites to find coho salmon.
A logistic regression analysis indicated a significant relationship between the probability of finding fish present in a stream and both time and geographic index. This relationship is described by the equation:
( ) ( ) ( )indexgeographictimep _*0.1456*0.11272.7027logit −−=
The response surface generated suggests that the likelihood of detecting a coho “presence” in streams where they were historically present has decreased throughout California from 1989 to 2000, and that the trend has been more pronounced in the southern part of the range (Figure 2).
Direct comparison of the percentages presented in this report with those in previously published papers for the purpose of analyzing trends through time is not advised. Previous authors have used different criteria for establishing presence (e.g., different time frames, professional judgement rather than direct observation), and the number of streams surveyed has varied widely. Central California Coast ESU
Overall, we found evidence of historical coho salmon occurrence in 278 streams in the Central Coast ESU. Current (within the last 12 years) presence-absence information for these streams is summarized in three-year time intervals: 1989-1991, 1992-1994, 1995-1997, and 1998-2000 (Table 2). The percentage of these streams for which presence has been detected at least once during the three-year period has remained relatively constant (between 44% and 48%) through time, the notable exception being the 1995-1997 period, when 61% of surveyed streams were found to have coho salmon. This was the most intensively sampled period, with 58 percent of historical coho streams being sampled at least once during the three-year interval, and coincided with the relatively strong year classes of 1996 and 1997. Eighteen fewer streams were sampled in the 1998-2000 period. However, this difference in sampling intensity alone cannot account for the change in percent presence of coho from 1995-1997 to 1998-2000.
Southern Oregon/Northern California Coasts ESU
In the California portion of the Southern Oregon/Northern California Coasts ESU, the percent of streams with coho present in at least one brood year has shown a decline from 1989-1991 to the present. In 1989-1991 and 1992-1995, coho were found in over 80 percent of the streams surveyed. Since then, the percentage has declined to 69 percent in the most recent three-year interval. As with the Central

7
California Coast ESU, fewer streams were sampled in the most recent interval; however, this again cannot account for the declining trend observed.
Population Trends – Central California Coast ESU Santa Cruz County, San Mateo County, and San Francisco Bay
Long-term data on the abundance of coho salmon in streams within Santa Cruz and San Mateo counties are limited. Records of adult spawners and outmigrating smolts from Waddell Creek between 1933 and 1942 (Shapovalov and Taft 1954) constitute the only historical record of abundance in the county; there are no current adult data for comparison. Juvenile surveys in Scott and Waddell creeks in Santa Cruz County, and Gazos Creek in San Mateo County have been conducted by Jerry Smith (San Jose State University) since 1992. Surveys have also been conducted regularly in the San Lorenzo River and its tributaries; however, no juvenile coho salmon have been documented since the 1980s (Don Alley, D.W. Alley & Associates, personal communication). We found no systematic surveys of streams in the San Francisco Bay area, where coho appear to be extinct.
Adults Historical Population Information - Adult coho salmon were enumerated at Waddell Creek weir during the nine-year period between 1933 and 1942 (Shapovalov and Taft 1954). On average, 247 adults passed through the fishway each season (range 84-583). Additionally, an average of 66 adults either passed directly over the dam or spawned in Waddell Creek below the dam; thus, the total spawning population averaged 312 fish during the nine-year period (Figure 3).
Historical information on population sizes of coho salmon in Scott Creek is limited to three years of adult counts from the 1936/1937 to the 1938/1939 spawning seasons (Shapovalov and Taft 1954). During this period, an average of 523 coho (range 374-681) passed through the trapping facility each season (Shapovalov and Taft 1954). These numbers may represent an incomplete census of spawners as the purpose of the study was to examine the proportion of 2- and 3-year old spawners in the population. These historical numbers are complicated by the fact that between 1933 and 1936, an average of 12,215 hatchery juveniles (size unknown) were planted in Scott Creek annually (CDFG 1998). Current Population Information – No current datasets with six or more years of record are available. Smolts Historical Population Information - From 1933 to 1942, the average number of smolts1 passing downstream through the trap was 2,040 (range 152-4,911)(Figure 4). These counts from Shapovalov and Taft (1954) subtantially underestimate total smolt production in the Waddell Creek system. During April and May, the period during which the majority of coho smolts emigrated, only about 25% of the total flow typically was routed through the trap, with the remaining 75% of the flow passing over the dam (Shapovalov and Taft 1954); thus, large numbers of fish passed over the dam without being counted. All smolts moving through the trap were marked; thus, by examining the ratio of marked to unmarked fish in subsequent adult populations, a crude estimate of total population size was gained. Based on these estimates, Shapovalov and Taft (1954) concluded that only about one-third of the smolt population was captured each year. Thus, it is reasonable to assume that average annual smolt production was at least 6,000 fish during the nine years of sampling.
Another piece of circumstantial evidence supports the contention that smolt populations in Waddell Creek were larger by a factor of three or more than the numbers of fish collected in the
1 Although fish are reported as smolts, about 8% of downstream migrants exited the stream in the period from November to February and were unlikely to have had the physiological morphological characteristics typically associated with smolts.

8
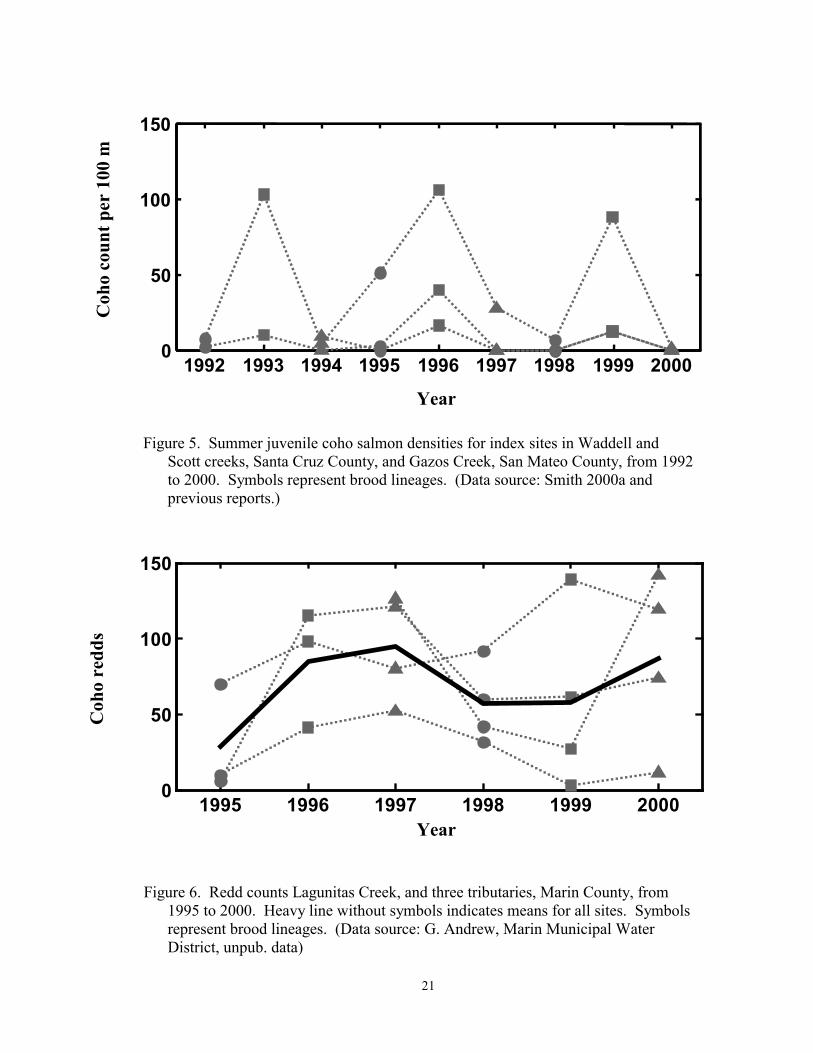
outmigrant trap. For 2,040 smolts (the nine-year average catch) to produce 313 adults (the average estimated number of spawners during this period), ocean survival would have had to exceed 15%. Such a high ocean survival rate for coho salmon is extremely unlikely, given that even during periods of favorable ocean conditions, marine smolt-to-adult survival of coho salmon typically is 5% or less. If one assumes 5% marine survival for a mean spawning population of 312 fish, the corresponding number of smolts is 6,240—very close to Shapovalov and Taft’s (1954) estimates. Current Population Information – No current datasets with six or more years of record are available. Juveniles Historical Population Information - No historical datasets with six or more years of record are available. Current Population Information - Systematic sampling of juvenile coho salmon in Waddell and Scott Creeks has been conducted in 1988 and then annually from 1992 to the present (Smith 2001a). Gazos Creek has been surveyed annually since 1994. The number of stations surveyed in each of these streams has varied among years and streams. To facilitate interannual comparisons, we considered data only from sites that have been sampled in all years of the time series. Abundance is reported as fish per 100 lineal feet of stream; however, these are simply fish counts rather than population estimates for the habitats sampled; no correction was made to account for capture efficiency. The data from Waddell, Scott, and Gazos creeks indicate that over the past decade coho were most abundant in 1993, 1996, and 1999 (Figure 5). The 1994/1997/2000 brood lineage appears to have been extirpated from Waddell and Gazos creeks, and is very weak in Scott Creek. Smith (2001b) reported that coho numbers were lower in 2000 than in any of the previous nine years. The 1992/1995/1998 brood lineage is weak in all three streams, but particularly so in Gazos and Waddell Creeks. Marin County Adults Historical Population Information – Adult coho spawner surveys have been conducted sporadically in Lagunitas Creek and its tributaries since the 1950s. Early surveys from 1950-1970 were conducted by California Department of Fish and Game. Although these surveys document distribution and could provide a coarse index of abundance in certain reaches, they are not sufficiently robust to be used in a more detailed assessment of population trends (R. Smith, National Park Service, pers. comm.). Current Population Information – A more consistent record of redd counts in Lagunitas Creek and three of its tributaries, Olema Creek, Devils Gulch, and San Geronimo Creek is available from 1995 to 2000. The number of redds in these streams has remained fairly constant over the past six years, with the highest accounts occurring in the 1996-97, 1997-98, and 1999-2000 spawning seasons (Figure 6). Smolts Historical Population Information – No historical datasets with six or more years of record are available. Current Population Information – No current datasets with six or more years of record are available. Juveniles Historical Population Information – No historical datasets with six or more years of record are available. Current Population Information – Data on summer juvenile abundance is available for Lagunitas Creek and two of its tributaries for the period from 1993 to 2000. Although population expansions based on density within different habitat types are available for some years, expansions have not been completed

9
for the 1998-2000 period (E. Ettinger, Marin Municipal Water District, pers. comm.). Thus, only total fish counts are presented here. Both the 1994 and 1997 brood years were relatively strong in Lagunitas Creek and its tributaries; however, the overall trend suggests a decline in abundance (Figure 7). The average abundances (all streams combined) are lower for 1998, 1999, and 2000 than in any of the five preceding years.
Juvenile abundance has also been reported for Redwood Creek in the Golden Gate National Recreation Area for years 1994 to 2000 (Smith 2001b). As with the time series from Waddell, Scott, and Gazos creek, we considered only sites that were sampled every year during that period to provide a consistent index of abundance. The data indicate that the 1995 and 1996 brood years were relatively strong, but that populations have declined since then (Figure 8).
Sonoma County Long-term records of coho salmon abundance in Sonoma County are exceedingly rare, both historic and current. We found only one site with records meeting out criteria for inclusion in the trend analysis. Adults Historical Population Information – No historical datasets with six or more years of record are available. Current Population Information – No current datasets with six or more years of record are available. Smolts Historical Population Information – No historical datasets with six or more years of record are available. Current Population Information – No current datasets with six or more years of record are available. Juveniles Historical Population Information – No historical data with a minimum of six years of data are available. Current Population Information – Two sites on the Little North Fork Gualala River have been sampled by the California Department of Fish and Game (CDFG) in all years since 1988, except for 1994, 1996, and 1997. Coho salmon were present in the first year of sampling, but have not been reported since (Scott Harris, CDFG, unpub. data).
Although there are scattered electrofishing records in tributaries of the Russian River, we found no datasets that met our criterion of six or more years of consistent record. Mendocino County Compared with other regions of California, records of coho salmon abundance in streams entering the ocean in Mendocino County are relatively abundant, though most of these records are fairly recent. We found consistent records for 31 sites in Mendocino County, representing 9 major watersheds (Caspar Creek, Little River, Big River, Usal Creek, Ten Mile River, Pudding Creek, Noyo River, Albion River, and Big Salmon Creek). Adults Historical Population Information – No historical datasets with six or more years of record are available. Current Population Information – No current datasets with six or more years of record are available.

10
Smolts Historical Population Information – Downstream migrant traps have been operated annually on Caspar Creek and Little River by the California Department of Fish and Game since 1986. These data are discussed under current population information below. No other long-term records of outmigrating smolts are available for this geographic region. Current Population Information – The Caspar Creek and Little River downstream migrant traps are rotary screw traps and thus sample only a portion of the water column. Estimates of capture efficiency are only available for the last year of sampling, so values reported are counts of fish, rather than population estimates.
Trends in abundance are similar for both systems. Smolt counts were highest in the first four years of sampling and have declined since, though numbers are somewhat variable (Figures 9 and 10). The 1992/1995/1998 brood lineage appears to be the weakest in both streams, though Caspar Creek shows reasonably strong numbers in 1998. Juveniles Historical Population Information – No historical datasets with six or more years of record are available. Current Population Information – Juvenile abundance surveys have been conducted by both private landowners and the California Department of Fish and Game on a number of streams and rivers in Mendocino County since the late 1980s and early 1990s. Streams surveyed include Usal Creek, Howard Creek, DeHaven Creek, Ten Mile River, Pudding Creek, Noyo River, Caspar Creek, Little River, Albion River, and Big Salmon Creek. In all cases, data are juvenile densities for index reaches; no population expansions are available.
Surveys in three smaller watersheds in the northern part of Mendocino County, Usal Creek, Howard Creek, and Dehaven Creek have yielded few fish in recent years. Usal Creek has been sampled annually since 1993; however, coho salmon were found only in 1993 and 1996 (Figure 11). Howard Creek was surveyed in 1986, 1988-1991, and 1998-1999. Fish were found only in 1988 and 1998. No fish have been found in DeHaven Creek in surveys covering 1993-1995 and 1998-2000. Thus, all three brood lineages in these coastal streams appear weak if not essentially extinct.
Sampling on index reaches on the South Fork of the Ten Mile River indicate that coho numbers have been generally low over the past eight years with 1996 being the notable exception (Figure 12). Of particular concern is the fact that very few fish have been captured in surveys from 1998-2000; a combined total of seven fish have been captured at eight index sites within this time period. Temporal patterns in fish abundance in the North Fork Ten Mile system are very similar, with very low densities of fish in all years except 1996, and a combined total of only nine fish reported over the past three years (Figure 13). The Middle Fork Ten Mile River and its tributaries have shown few coho juveniles since 1993, with modest increases in numbers at a single site in 1997 and 1999 being the only deviations from a general pattern of few or no fish (Figure 14). Only one fish has been reported since 1993 in a tributary to the mainstem Ten Mile River (Campbell Timberland Management, unpub. data).
Index sites on Pudding Creek were sampled annually between 1983 and 1995 (excluding 1990) by the California Department of Fish and Game, and from 1993 to 2000 by Campbell Timberland Management. The CDFG data indicates a decline in abundance after 1989 extending to the last year of sampling (Figure 15). Data from 1993 to 2000 from a second site shows increases in numbers for the 1996 and 1999 broad years; however, overall densities remain low (Figure 16). Because sampling occurred at different sites in these two time series, direct comparison of these densities is inappropriate.
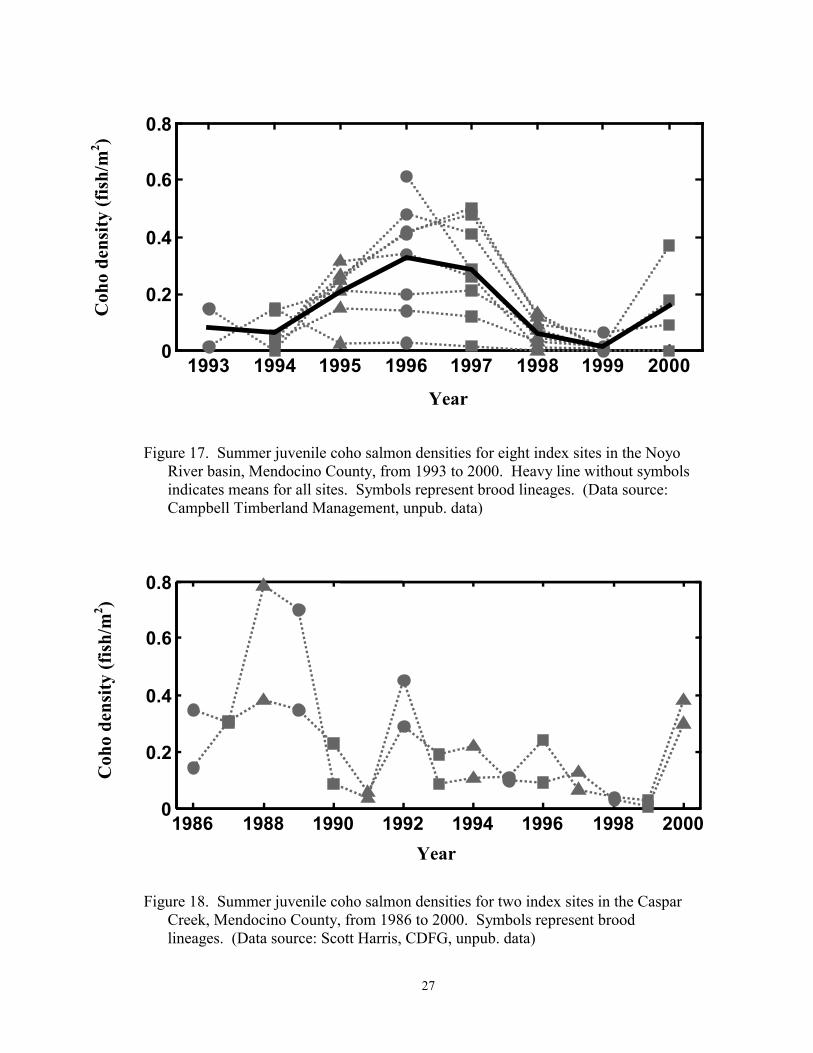
Data from the Noyo River and its tributaries from 1993 to 2000 indicate that, like other Mendocino County rivers to the north, 1996 was a relatively strong year; however, unlike systems to the north, 1995 and 1997 were also comparatively strong years (Figure 17). Abundance decreased in 1998 and 1999, indicating that the strong years in 1995 and 1996 did not carry over into the subsequent generation. A modest increase in numbers was observed in 2000.

11
Juvenile density data at index sites has been collected by California Department of Fish and Game since 1986 in Caspar Creek and Little River. In both systems, the temporal patterns of abundance are similar. The highest densities of fish were observed from 1986 to 1989, and have generally declined since then (Figures 18 and 19). The relatively strong 1996 year class in the region was reflected in comparatively large numbers of fish in both these systems, though still not approaching numbers from the late 1980s. The years 1992 and 2000 were also moderately strong in Caspar Creek. Data from two sites on the Big River indicate considerable variation among years, but not obvious trends in abundance. Again the strong 1996 year class observed elsewhere along the coast was evident in Big River surveys, but comparable densities were also observed in 1995, 1997, and 1999 (Figure 20). Abundance data from index sites in the Albion River and its tributaries were collected annually from 1988 to 1996, and then again in 1999 and 2000. The data suggest a general downward trend from peak abundances in 1992 and 1993, though numbers have remained fairly constant since then (Figure 21). As with most other sites in this ESU, the 1996 year class was the strongest within the last five years. Big Salmon Creek, the southern-most coho-bearing stream in Mendocino County has been surveyed annually since 1993. Strong years classes were apparent in both 1996 and 1997, much like in the Noyo and Big rivers (Figure 22). Numbers declined to pre-1996 levels in the past three years. Summary of Central California Coast ESU Trend Data The vast majority of time series data on coho salmon abundance available for the Central California Coast coho salmon ESU consists of summer density estimates derived from sampling at index sites of relatively short length. Most of these time series are short—six to eight years in duration—but a few extend back into the mid-to-late 1980s. Because of the nature of these data, conclusions must be drawn cautiously. Nevertheless, consistent patterns found in most basins within the ESU suggest that while these data may not be particularly robust in detecting trends within a specific stream reach, they do appear to track large-scale trends in abundance over watersheds and larger geographic areas reasonably well. Several consistent patterns emerge from these data. Although time series data dating back to the 1980s were available for only three streams (Caspar Creek smolts and juveniles; Little River, smolts and juveniles; and Pudding Creek juveniles), in each case, the abundance in the 1990s was clearly lower than in the mid-to-late 1980s. Thus it is important to consider that variability in abundance observed in the 1990s is potentially variation around population means that are substantially lower than they were historically. It is also clear from the data that 1996 and, to a more limited degree, 1997 were relatively strong year classes compared with other years in the 1990s. This is relevant since the BRT conclusions made in 1996 were in part based on presence-absence information gathered in 1995 and 1996 (Schiewe 1996). Finally, although there is some variability among sites, the general overall trend during the 1990s is one of continued decline. Values of CRR (abundance at time t+3/ abundance at time t) for all paired observations of abundance (non-zero values only) are plotted in Figure 23. Overall, 126 of 229 CRR values were less than 1, indicating a significantly (p = 0.0045) higher likelihood that abundance decreased rather than increased at a particular site. Were a population increase as likely as a population decrease, and equal number of observations would be expected to fall above and below CRR =1. Population Trends – California Portion of Southern Oregon/Northern California ESU Humboldt County With the exception of records from the Eel River basin, long-term trend data—either historical or current—for coho salmon in Humboldt County (or Mendocino County streams that eventually enter the ocean in Humboldt County) are scarce. Two historical records of adult fish at Benbow Dam on the South

12
Fork Eel River and Sweasy Dam on the Mad River provide information on adult run sizes from late 1930s to the mid 1960s (Sweasy) and 1970s (Benbow); however, no current records exist for comparison. Juvenile surveys have been conducted on a number of streams in the 1990s in the Eel River basin. Additional surveys have been conducted in the Redwood Creek, Mad River, and Mattole River watersheds; however, none of these datasets met our criteria of having six or more years of data collected in a consistent fashion. Adults Historical Population Information – Numbers of adult coho salmon at Benbow Dam showed a long and general decline from an average of more than 13,000 fish in the 1930s and 1940s (range 7,327 to 25,289) to about 5,700 fish in the 1950s and 1960s (range 1,289 to 14,316), to fewer than 1700 fish in the 1970s (range 509 to 3,993) before the dam and counting facility were removed (Figure 24). At Sweasy Dam, coho adult counts averaged almost 400 fish in the years between 1938 and 1951 (range 73 to 725), before falling to an average of 37 fish in the seven years from 1952-1958 (range 2 to 91) (Figure 25). The population increased dramatically in 1962 and 1963, with the highest recorded counts occurring in those two years. A similar increase was observed in the South Fork Eel River during those years. Current Population Information – No current datasets with six or more years of record are available. Smolts Historical Population Information – No historical datasets with six or more years of record are available. Current Population Information – No current datasets with six or more years of record are available. Juveniles Historical Population Information – No historical datasets with six or more years of record are available. Current Population Information – Summer surveys of coho salmon juveniles have been conducted in a number of index reaches in the South Fork Eel River drainage by both private landowners and California Department of Fish and Game. Data from these surveys indicate no obvious trends in abundance (Figure 26). The 1996 and 1997 year classes were relatively strong, as was the 1999 year class. The 1995, 1998, and 2000 year classes were comparatively weak A longer-term data set from two sites in Hollow Tree Creek, a tributary to the South Fork Eel River, indicates a somewhat different pattern. As was seen in Mendocino County, a general decline in abundance has been observed since the late 1980s (Figure 27), and numbers in 1998 through 2000 are lower than for the rest of the 1990s. There is some suggestion in the data that the 1995/1998 brood lineage is the weakest in the South Fork Eel and its tributaries. A final tributary to the main fork of the Eel River, Ryan Creek has been surveyed by the California Department of Fish and Game since 1986. Coho salmon were found in modest numbers in 1988 and 1989, and lower numbers in 1992. However, no fish have been captured at this site n the last eight years (Scott Harris, CDFG, unpub. data) Del Norte County Population trend data for Del Norte County, including the Klamath-Trinity system, are scarce aside from hatchery records. Monitoring of downstream migrants has occurred on two tributaries of the Trinity River (Willow and Horse Linto creeks); however, sampling has targeted other salmonids and the majority of coho salmon have typically migrated before traps are installed in the spring. Additional monitoring programs have been initiated in the Klamath-Trinity system by the Hoopa Valley and Yurok tribes; however, data are available for the past five or fewer years. A limited amount of information is

13
available on both adults and smolts in the Mill Creek, a tributary to the Smith River, and Wilson Creek, which enters the Pacific Ocean south of the Smith River. Adults Historical Population Information – No historical datasets with six or more years of record are available other than hatchery records described in the Artificial Propagation section below. Current Population Information – Counts of adult spawners have been made annually on the West Branch of Mill Creek in the Smith River basin since 1980. Data reported are the maximum number of live fish and carcasses observed on any one survey. Maximum live/dead counts have ranged from a high of 28 to a low of 2 over the 20 years of record, with no obvious trend through time, though counts have been comparatively low over the past four years (Figure 28). Nor is there any evidence that the variability observed among years is related to the strength or weakness of any particular brood lineages. A second set of spawning surveys has been conducted on both the west and east branches of Mill Creek and associated tributaries. These show maximum live/dead counts of between 30 and 40 in the period from 1993 to 1996 but counts of less than 11 in all subsequent years (Figure 29). Smolts Historical Population Information – No historical datasets with six or more years of record are available. Current Population Information – Downstream migrant traps have been operated on the East and West Branches of Mill Creek from 1994 to 2000. Although expanded population estimates were provided, a discrepancy in numbers between data provided to us and other published documents led us to present total counts instead. These data suggest a relatively strong year in 1998 (1997 brood year) for both Branches of Mill Creek, and a similarly strong year on West Branch, but not East Branch in 1995 (Figure 30). Overall, it is difficult to discern a specific trend in these data. Juveniles Historical Population Information – No historical datasets with six or more years of record are available. Current Population Information – Surveys of juvenile coho density in summer have been conducted in Wilson Creek since 1995. Population size has dropped precipitously during that time from an estimated population of almost 1400 in 1995 to fewer than 50 fish in 1999 and 2000. Summary of Southern Oregon/Northern California ESU Trend Data Current trend data for the California portion of the Southern Oregon/Northern California ESU are less available than for the Central Coast ESU, and we found only one dataset that contained information dating back into the 1980s. Consequently, drawing conclusions about changes in the status of coho salmon in this ESU is more difficult. Nevertheless, analysis of coho replacement rates (CRRs) indicates that a general decline in abundance for those populations analyzed. In 40 of 67 paired observations, the value of CRR was less than one, indicating a decrease in numbers from time t to time t+3 (Figure 31). This number was significantly higher than expected (p = 0.0278) based on a probability of 0.5.
ARTIFICIAL PROPAGATION
Artificial propagation of coho salmon by state, county, and private hatcheries has a long history in California dating back until at least until the 1890's. Transfer of eggs from other basins including out-of-state sources and out-of-basin releases of hatchery coho were common until 1980's. Even if records

14
were complete, the impacts of these activities are unknown. Therefore, the best approximation of the potential for hatchery impacts on the natural populations of coho salmon is a review of the relative magnitude and pattern of hatchery operations.
There are currently seven hatcheries producing coho salmon in California. Three of the hatcheries are in the Central California Coast ESU; Monterey Bay Salmon and Trout, Warm Springs, and Noyo Station Hatcheries. Monterey Bay Salmon and Trout Hatchery is a small privately supported operation started in 1976 on Big Creek, a tributary to Scott Creek, Santa Cruz County. There have been hatchery activities in this area since the 1890's. Warm Springs Hatchery is a CDFG-operated mitigation facility started in 1980 on Dry Creek, a tributary to the Russian River, Sonoma County. The Noyo Station Hatchery is a CDFG-operated enhancement facility started in 1962 on the South Fork of the Noyo River, Mendocino County. There are four coho hatcheries in California’s portion of the Southern Oregon/Northern California Coasts ESU: Mad River, Trinity River, Irongate, and Rowdy Creek hatcheries. Mad River Hatchery is a CDFG operated enhancement facility started in 1970 on the Mad River, Humboldt County. Trinity River Hatchery is a CDFG operated mitigation facility started in 1958 on the Trinity River, Trinity County. Irongate Hatchery is a CDFG mitigation facility started in 1965 on the Klamath River, Siskiyou County. Rowdy Creek Hatchery is a small privately operated hatchery started in 1972 on Rowdy Creek, a tributary to the Smith River, Del Norte County.
Levels of hatchery production of coho salmon in California are smaller than those in Oregon and Washington and have been declining in recent years. Annual averaged (over a 5-year period, 1987-91) coho hatchery releases for the Central California Coast ESU are less than 0.3 percent of total coastwide hatchery releases of coho salmon. Hatcheries in the California portion of the Southern Oregon/Northern California Coasts ESU account for less than 1 percent of coastwide releases (Weitkamp et. al 1995, Table 5). In recent years, several hatcheries have not produced brood years due to a lack of spawning adults. Monterey Bay Salmon and Trout Hatchery has not produced coho since the 1997 release. Warm Springs Hatchery has terminated their coho program due to lack of returning adults and is planning to use the facility as a captive broodstock operation (Figure 32). Noyo Station and Rowdy Creek Hatcheries were unable to get adults for spawning in year 2000 (Figures 33 and 34). Mad River and Irongate Hatcheries both have reduced numbers of adult returns in recent years (Figures 35 and 36). Only Trinity River Hatchery has been able to maintain production (Figure 37).
In the Central California Coast ESU, hatchery operations are relatively small, but still may have a significant impact due to the small natural populations in the area. These hatchery operations have probably masked the true degree of coho decline in this ESU, but are also probably responsible for the coho=s continued existence in the south. In the last ten years, hatchery practices have been limited to within basin stocks which would pose the least threat to genetic integrity. In the Southern Oregon/Northern California Coasts ESU, the principal concern is the large production of the Trinity River Hatchery. Potential outbreeding due to the large numbers of hatchery fish spawning in natural areas poses a significant threat to the genetic integrity of natural populations.
CONCLUSIONS
Central California Coast ESU The BRT previously concluded that coho salmon stocks south of Punta Gorda are depressed
relative to past abundance but that there are limited data to assess population numbers or trends (Weitkamp et al. 1995). Nevertheless, in 1995 the BRT unanimously concluded that natural populations of coho salmon in this ESU were in danger of extinction. In a subsequent status review that considered additional presence-absence information gathered in 1995-1996, it was reported that the percent of streams with coho salmon present was higher than previously estimated (Schiewe 1996). This did not fundamentally alter the BRTs conclusion; a majority of the BRT concluded that coho salmon were in danger of extinction, while a minority concluded that it was not presently in danger of extinction but that it was likely to become so in the foreseeable future.

15
Collectively, the recent presence-absence and population trend data presented in this report strongly suggest that throughout much of this ESU coho salmon continue to decline. Although the periods of high and low abundance vary somewhat among river basins, the majority show that the 1996 and 1997 brood years were relatively strong compared with years both before and after this period. Consequently, the picture resulting from presence-absence analysis conducted during the 1995-1996 period, which was considered in the decision to list coho as “threatened” in this ESU, may have been overly optimistic. Declines have been observed in several streams (e.g., Scott Creek, Santa Cruz County, and Lagunitas Creek, Marin County) where populations had before been considered relatively stable.
After considering this information, we conclude that the Central California Coast ESU is presently in danger of extinction. California Portion of the Southern Oregon/Northern California Coasts ESU The BRT previously concluded that coho salmon stocks between Punta Gorda, California, and Cape Blanco, Oregon are depressed relative to historical abundance, but again there was limited information from which to assess population abundance or trends (Weitkamp et al. 1995). They concluded that coho salmon in this ESU were not in danger of extinction, but were likely to become endangered in the foreseeable future. Subsequent status reviews (Schiewe 1996, 1997) concluded that more recent presence-absence information for the California portion of this ESU showed a lower percentage of streams with coho present than earlier reviews. However, their conclusion regarding the overall status of the ESU remained essentially unchanged. Both the presence-absence and trend data presented in this report suggest that many coho salmon populations in this ESU continue to decline. Presence-absence information from the past twelve years indicates fish have been extirpated or at least reduced in numbers sufficiently to reduce the probability of detection in conventional surveys. Unlike the Central California Coast ESU, the percentage of streams in which coho were documented did not experience a strong increase in the 1995-1997 period. Population trend data were less available in this ESU, nevertheless, for those sites that did have trend information, evidence suggests declines in abundance. After considering this information, we conclude that the Southern Oregon/Northern California Coasts ESU is presently not at risk of extinction, but is likely to become endangered in the foreseeable future. The conclusion is tempered by the fact that population trend data was limited, and further analysis may reveal declines sufficient to conclude that the California portion of this ESU is in danger of extinction.
LITERATURE CITED
Adams, P. B., M. J. Bowers, H. E. Fish, T. E. Laidig, and K. R. Silberberg. 1999. Historical and current
presence-absence of coho salmon (Oncorhynchus kisutch) in the Central California Coast Evolutionarily Significant Unit. National Marine Fisheries Service, Southwest Fisheries Science Center, Administrative Report SC-99-02. 24 p.
Boberg, J. and Kenyon, C. 1979a. Stream inventory: Humboldt County. California Department of Fish
and Game.
Boberg, J. and Kenyon, C. 1979b. Stream inventory: Siskiyou County. California Department of Fish and Game.
Boberg, J. and Kenyon, C. 1979c. Stream Inventory: Del Norte County. California Department of Fish and Game.

16
Boberg, J. and Kenyon, C. 1979d. Stream inventory: Trinity County. California Department of Fish and Game.
Brown, L. R., and P. B. Moyle. 1991. Status of coho salmon in California. Report to the National Marine Fisheries Service. 114 p + appendices.
Brown, L. R., P. B. Moyle, and R. M. Yoshiyama. 1994. Historical decline and current status of coho
salmon in California. North American Journal of Fisheries Management 14:237-261. Bryant, G. J. 1994. Status review of coho salmon in Scott Creek and Waddell Creek, Santa Cruz County,
California. National Marine Fisheries Service, Southwest Region, Protected Species Division, 102 p. CDFG (California Department of Fish and Game). 1998. Draft strategic plan for restoration of the
endangered coho salmon south of San Francisco Bay. 44 p. + appendices. Cherr and Griffin. 1979a. Stream inventory: Marin County. California Department of Fish and Game.
Cherr and Griffin. 1979b. Stream Inventory: Mendocino County. California Department of Fish and Game.
Cherr and Griffin. 1979c. Stream inventory: San Mateo County. California Department of Fish and Game.
Cherr and Griffin. 1979d. Stream inventory: Santa Cruz County. California Department of Fish and Game.
Cherr and Griffin. 1979e. Stream inventory: Sonoma County. California Department of Fish and Game.
Ellis, R. H. 1997. Comments to National Marine Fisheries Service regarding the proposed listing of coho salmon as threatened in the Southern Oregon/Northern California ESU. Submitted on behalf of: California Forestry Association and California Forest Resources Council, Sacramento, CA. 41 p.
Hassler, T. J., C. M. Sullivan, and G. R. Stern. 1991. Distribution of coho salmon in California. U.S.
Fish and Wildlife Service, California Cooperative Fisheries Unit. Humboldt State University. Final report submitted to California Department of Fish and Game, Contract No. FG7292.
Kier Associates. 1999. Historical and current presence and absence of coho salmon, Oncorhynchus
kisutch, in the Northern California portion of the Southern Oregon-Northern California Evolutionary [sic] Significant Unit. Prepared for the U.S. Department of Commerce, NOAA, National Marine Fisheries Service, Southwest Fisheries Science Center pursuant to Service Order 40-ABNF-7-01479. 8 p. + appendices.
National Marine Fisheries Service (NMFS). 1993. Listing endangered and threatened species and
designating critical habitat: Petition to list five stocks of Oregon coho salmon. Federal Register [Docket 93-26365, 27 October 1993] 58(206):57770-57771.
National Marine Fisheries Service (NMFS). 1994. Endangered and threaten species: coho salmon in
Scott and Waddell Creeks, CA. Federal Register [Docket 940408-4108] 59(80): 21744-21746. Schiewe, M. H. 1996. Conclusions regarding the updated status of West Coast coho salmon. Northwest
Fisheries Science Center. Seattle, Washington. 47 p + appendices.

17
Schiewe, M. H. 1997. Conclusions regarding the updated status of coho salmon from Northern California
and Oregon Coasts. Northwest Fisheries Science Center. Seattle, Washington. 70 p + appendices. Smith, J. J. 2001a. Distribution and abundance of juvenile coho and steelhead in Gazos, Waddell and
Scott Creeks in 2000. Department of Biological Sciences, San Jose State University. 9 p. + appendices.
Smith, J. J. 2001b. Distribution and abundance of juvenile coho and steelhead in Redwood Creek in Fall
2000. Department of Biological Sciences, San Jose State University. 9 p. + appendices. Weitkamp, L. A., T. C. Wainwright, G. J. Bryant, G. B. Milner, D. J. Teel, R. G. Kope, and R. S. Waples.
1995. Status review of coho salmon from Washington, Oregon, and California. U.S. Dep. Commer., NOAA Tech. Memo. NMFS-NWFSC-24, 258 p.

18
FIGURES

19
Figure 1. Percentage of historical coho salmon streams surveyed showing presence in years 1989 through 2000. Values indicate the number of sites that were surveyed for the particular year.
Figure 2. Response surface showing relationship between probability of presence in relation to year (1989-2000) and the geographical index (1 = northern-most, 21 = southern-most). See text for further discussion.
`89 `90 `91 `92 `93 `94 `95 `96 `97 `98 `99 `000
0.2
0.4
0.6
0.8
1
(59)(78)
(113)
(117) (140)
(249) (240)(237) (157)
(183)(151)
(222)
Year
Prop
ortio
n of
stre
ams
w
/coh
o pr
esen
t
Geographical IndexYear
510
15
19901992
19941996
19982000
0
0.2
0.4
0.6
0.8
1

20
1933 1934 1935 1936 1937 1938 1939 1940 19410
200
400
600
800
Figure 3. Estimated number of spawners in Waddell Creek, Santa Cruz County from 1933-1941. (Data source: Shapovalov and Taft 1954).
1933 1934 1935 1936 1937 1938 1939 1940 19410
1000
2000
3000
4000
5000
Figure 4. Counts of outmigrating smolts in Waddell Creek, Santa Cruz County from 1933-1941. (Data source: Shapovalov and Taft 1954).
Year
Num
ber
of c
oho
adul
ts
Num
ber
of c
oho
smol
ts
Year
21
1992 1993 1994 1995 1996 1997 1998 1999 2000 0
50
100
150
Figure 5. Summer juvenile coho salmon densities for index sites in Waddell and Scott creeks, Santa Cruz County, and Gazos Creek, San Mateo County, from 1992 to 2000. Symbols represent brood lineages. (Data source: Smith 2000a and previous reports.)
1995 1996 1997 1998 1999 20000
50
100
150
Figure 6. Redd counts Lagunitas Creek, and three tributaries, Marin County, from 1995 to 2000. Heavy line without symbols indicates means for all sites. Symbols represent brood lineages. (Data source: G. Andrew, Marin Municipal Water District, unpub. data)
Year
Coh
o co
unt p
er 1
00 m
Year
Coh
o re
dds

22
1993 1994 1995 1996 1997 1998 1999 20000
100
200
300
Figure 7. Summer juvenile coho salmon counts (total fish captured) for Lagunitas Creek and two tributaries, Devils Gulch, and San Geronimo Creek, Marin County, from 1993 to 2000. Heavy line without symbols indicates means for all sites. Symbols represent brood lineages. (Data source: Greg Andrew, Marin Municipal Water District, unpub. data)
1994 1995 1996 1997 1998 1999 20000
50
100
150
Figure 8. Summer juvenile coho salmon densities for index sites in Redwood Creek, Marin County, from 1992 to 2000. Symbols represent brood lineages. (Data source: Smith 2000a and previous reports.)
Year
Num
ber
of c
oho
Year
Coh
o co
unt
per
100
m

23
1988 1990 1992 1994 1996 1998 2000500
1000
1500
2000
2500
Figure 9. Coho salmon smolt counts in Caspar Creek, Mendocino County, from 1987 to 1999. Symbols represent brood lineages. (Data source: Scott Harris, CDFG, unpub. data)
1988 1990 1992 1994 1996 1998 20000
500
1000
1500
2000
2500
Figure 10. Coho salmon smolt counts in Little River, Mendocino County, from 1987 to 1999. Symbols represent brood lineages. (Data source: Scott Harris, CDFG, unpub. data)
Year
Tot
al c
oho
smol
ts
Year
Tot
al c
oho
smol
ts

24
1993 1994 1995 1996 1997 1998 1999 20000
0.1
0.2
0.3
0.4
0.5
Figure 11. Summer juvenile coho salmon densities for three index sites in the Usal Creek basin, Mendocino County, from 1993 to 2000. Heavy line without symbols indicates means for all sites. Symbols represent brood lineages. (Data source: Campbell Timberland Management, unpub. data)
1993 1994 1995 1996 1997 1998 1999 20000
0.1
0.2
0.3
0.4
0.5
Figure 12. Summer juvenile coho salmon densities for eight index sites in the South Fork Ten Mile River basin, Mendocino County, from 1993 to 2000. Heavy line without symbols indicates means for all sites. Symbols represent brood lineages. (Data source: Campbell Timberland Management, unpub. data)
Coh
o de
nsity
(fis
h/m
2 )
Year
Coh
o de
nsity
(fis
h/m
2 )
Year

25
1993 1994 1995 1996 1997 1998 1999 20000
0.1
0.2
0.3
0.4
0.5
Figure 13. Summer juvenile coho salmon densities for six index sites in the North Fork Ten Mile River basin, Mendocino County, from 1993 to 2000. Heavy line without symbols indicates means for all sites. Symbols represent brood lineages. (Data source: Campbell Timberland Management, unpub. data)
1993 1994 1995 1996 1997 1998 1999 20000
0.1
0.2
0.3
0.4
0.5
Figure 14. Summer juvenile coho salmon densities for three index sites in the Middle Fork Ten Mile River basin, Mendocino County, from 1993 to 2000. Heavy line without symbols indicates means for all sites. Symbols represent brood lineages. (Data source: Campbell Timberland Management, unpub. data)
Coh
o de
nsity
(fis
h/m
2 )
Year
Coh
o de
nsity
(fis
h/m
2 )
Year

26
1984 1986 1988 1990 1992 1994 1996 1998 20000
0.2
0.4
0.6
0.8
1
Figure 15. Summer juvenile coho salmon densities for an index site in Pudding Creek, Mendocino County, from 1983 to 1995. Symbols represent brood lineages. (Data source: Scott Harris, CDFG, unpub. data)
1993 1994 1995 1996 1997 1998 1999 2000 0
0.1
0.2
0.3
0.4
0.5
Figure 16. Summer juvenile coho salmon densities for two index sites in upper Pudding Creek, Mendocino County, from 1993 to 2000. Symbols represent brood lineages. (Data source: Campbell Timberland Management, unpub. data)
Year
Coh
o de
nsity
(fis
h/m
2 ) C
oho
dens
ity (f
ish/
m2 )
Year
27
1993 1994 1995 1996 1997 1998 1999 20000
0.2
0.4
0.6
0.8
Figure 17. Summer juvenile coho salmon densities for eight index sites in the Noyo River basin, Mendocino County, from 1993 to 2000. Heavy line without symbols indicates means for all sites. Symbols represent brood lineages. (Data source: Campbell Timberland Management, unpub. data)
1986 1988 1990 1992 1994 1996 1998 2000 0
0.2
0.4
0.6
0.8
Figure 18. Summer juvenile coho salmon densities for two index sites in the Caspar
Creek, Mendocino County, from 1986 to 2000. Symbols represent brood lineages. (Data source: Scott Harris, CDFG, unpub. data)
Year
Coh
o de
nsity
(fis
h/m
2 )
Year
Coh
o de
nsity
(fis
h/m
2 )

28
1986 1988 1990 1992 1994 1996 1998 2000 0
0.2
0.4
0.6
0.8
Figure 19. Summer juvenile coho salmon densities for two index sites in Little River, Mendocino County, from 1986 to 2000. Symbols represent brood lineages. (Data source: Scott Harris, CDFG, unpub. data)
1993 1994 1995 1996 1997 1998 1999 2000 0
0.1
0.2
0.3
0.4
0.5
Figure 20. Summer juvenile coho salmon densities for two index sites in Big River, Mendocino County, from 1986 to 2000. Symbols represent brood lineages. (Data source: Campbell Timberland Management, unpub. data)
Coh
o de
nsity
(fis
h/m
2 )
Year
Coh
o de
nsity
(fis
h/m
2 )
Year

29
1988 1990 1992 1994 1996 1998 20000
0.5
1
1.5
2
Figure 21. Summer juvenile coho salmon densities for seven index sites in Albion River and its tributaries, Mendocino County, from 1986 to 2000. Heavy line without symbols indicates means for all sites. Symbols represent brood lineages. (Data source: Mendocino Redwood Company, unpub. data)
1993 1994 1995 1996 1997 1998 1999 20000
0.2
0.4
0.6
0.8
Figure 22. Summer juvenile coho salmon densities for six index sites in Big Salmon Creek and its tributaries, Mendocino County, from 1986 to 2000. Heavy line without symbols indicates means for all sites. Symbols represent brood lineages. (Data source: Campbell Timberland Management, unpub. data)
Coh
o de
nsity
(fis
h/m
2 )
Year
Year
Coh
o de
nsity
(fis
h/m
2 )

30
0
5
10
15
20
25
0 1 2 3 4 ≥≥≥≥ 5
Figure 23. Frequency distribution of cohort replacement rates CRR for streams and rivers in the Central California Coast ESU indicating a significantly (p = 0.0045) higher likelihood of numbers decreasing with time. Values less than 1 indicate a decline in the abundance index from time t to time t+3.
1940 1945 1950 1955 1960 1965 1970 19750
10000
20000
30000
Figure 24. Adult coho counts at Benbow Dam, South Fork Eel River, from 1938 to 1975. (Data source: StreamNet 2001)
Freq
uenc
y
CRR
Year
Adu
lt m
igra
nts

31
1940 1945 1950 1955 19600
1000
2000
3000
4000
Figure 25. Adult coho counts at Sweasy Dam, Mad River, from 1938 to 1975. (Data
source: StreamNet 2001)
1994 1995 1996 1997 1998 1999 20000
0.5
1
1.5
Figure 26. Summer juvenile coho salmon densities for five index sites in the South Fork Eel River and its tributaries, Mendocino and Humboldt counties, from 1986 to 2000. Heavy line without symbols indicates means for all sites. Symbols represent brood lineages. (Data source: Campbell Timberland Management, unpub. data)
Year
Adu
lt m
igra
nts
Coh
o de
nsity
(fis
h/m
2 )
Year

32
1984 1986 1988 1990 1992 1994 1996 1998 2000 0
0.5
1
1.5
Figure 27. Summer juvenile coho salmon densities for two index sites Hollow Tree Creek, Mendocino County, from 1986 to 2000. Symbols represent brood lineages. (Data source: Scott Harris, CDFG, unpub. data)
1980 1985 1990 1995 20000
10
20
30
Figure 28. Maximum live/dead spawner counts for West Branch of Mill Creek, Del Norte County, from 1980 to 2000. Symbols represent brood lineages. (Data source: Waldvogel 1988; Jim Waldvogel, Cooperative Extension, unpub. data)
Year
Coh
o de
nsity
(fis
h/m
2 )
Year
Max
imum
live
/dea
d co
unt

33
1993 1994 1995 1996 1997 1998 1999 2000 0
20
40
60
Figure 29. Maximum live/dead spawner counts for West Branch of Mill Creek, Del Norte County, from 1980 to 2000. Symbols represent brood lineages. (Data source: Paul Albro, Stimson Timber, unpub. data)
1994 1995 1996 1997 1998 1999 2000 0
500
1000
1500
Figure 30. Total smolt counts from downstream migrant traps in West Branch and East Branch of Mill Creek, Del Norte County, from 1994 to 2000. Symbols represent brood lineages. (Data source: Stimson Lumber Company, 2000)
Max
imum
Liv
e/D
ead
Cou
nts
Year
Tot
al S
mol
t Cou
nt
Year

34
0
2
4
6
8
10
0 1 2 3 4 ≥≥≥≥ 5
Figure 31. Frequency distribution of cohort replacement rates CRR for streams and rivers in the Southern Oregon/Northern California Coasts ESU indicating a significantly (p = 0.0278) higher likelihood of numbers decreasing with time. Values less than 1 indicate a decline in the abundance index from time t to time t+3.
Freq
uenc
y
CRR

35
1980 1985 1990 1995 20000
200
400
600
800
1000
Figure 32. Adult coho salmon returns to Warm Springs Hatchery on Dry Creek
(Russian River), Sonoma County, from 1980 to 1996.
1965 1970 1975 1980 1985 1990 1995 20000
1000
2000
3000
4000
5000
Figure 33. Adult coho salmon returns to Noyo Egg Collecting Station, Mendocino County, from 1965 to 2000.
Year
Year
Adu
lt R
etur
ns
Adu
lt R
etur
ns
Adu
lt R
etur
ns

36
1990 1992 1994 1996 1998 20000
50
100
150
Figure 34. Adult coho salmon returns to Rowdy Creek Hatchery, De Norte County, from 1989 to 2000.
1975 1980 1985 1990 1995 20000
500
1000
1500
2000
2500
Figure 35. Adult coho salmon returns to Mad River Hatchery, Humboldt County, from 1971 to 1997.
Year
Adu
lt R
etur
ns
Year
Adu
lt R
etur
ns

37
1965 1970 1975 1980 1985 1990 1995 20000
1000
2000
3000
4000
5000
Figure 36. Adult coho salmon returns to Iron Gate Hatchery (Klamath River), Siskiyou County, from 1963 to 1999.
1960 1965 1970 1975 1980 1985 1990 1995 20000
0.5
1
1.5
2
2.5x 10⁴
Figure 37. Adult coho salmon returns to Trinity Hatchery, Trinity County, from 1963 to 1999.
Adu
lt R
etur
ns
Year
Year
Adu
lt R
etur
ns

38
TABLES

39
ESU/County Watershed Group Geographical Index
Southern Oregon/Northern California ESU
Del Norte Coastal 1Smith River 2Klamath River 3
Humboldt Coastal 4Redwood Creek 5Mad River 6Eel River 7Mattole river 8
Central California Coast ESU
Mendocino Coastal 9Ten Mile River 10Noyo River 11Big River 12Navarro River 13
Sonoma Coastal 14Gualala River 15Russian River 16
Marin Coastal 17
San Francisco Bay Coastal 18
San Mateo Coastal 19
Santa Cruz Coastal 20
Monterey Coastal 21
Table 1. Geographical regions used to aggregate data for logistic regression analysis of presence-absence data. Regions are arranged north to south, as described in the text.

40
1989-19911992-1994
1995-19971998-2000
County
Num
ber of Stream
s with
Historical
PresenceN
umber
Surveyed1
Coho
Present 2C
oho A
bsent 3N
o D
ataN
umber
Surveyed1
Coho
Present 2C
oho A
bsent 3N
o D
ataN
umber
Surveyed1
Coho
Present 2C
oho A
bsent 3N
o D
ataN
umber
Surveyed1
Coho
Present 2C
oho A
bsent 3N
o D
ata
Southern Oregon/N
orthern California C
oasts ESU
Del N
orteC
oastal12
0-
-12
1100%
0%11
1100%
0%11
683%
17%6
Smith R
.52
580%
20%47
1669%
31%36
3563%
37%17
1443%
57%38
Klam
ath R.
18962
95%5%
127105
90%10%
8461
70%30%
12872
69%31%
117
Hum
boldtC
oastal46
9100%
0%37
8100%
0%38
1392%
8%33
2286%
14%24
Redw
ood Cr.
233
100%0%
2010
90%10%
1313
69%31%
1011
91%9%
12M
ad R.
232
100%0%
211
100%0%
224
100%0%
194
100%0%
19Eel R
.205
5060%
40%155
7782%
18%128
6489%
11%141
3067%
33%175
Mattole R
.49
560%
40%44
1060%
40%39
1788%
12%32
2176%
24%28
ESU Total
599136
81%19%
463228
85%15%
371208
78%22%
391180
69%27%
419
Central C
alifornia Coast E
SU
Mendocino
Coastal
7415
53%47%
5937
51%49%
3747
60%40%
2747
47%53%
27Ten M
ile R.
1810
20%80%
813
31%69%
514
71%29%
413
54%46%
5N
oyo R.
253
67%33%
2211
82%18%
1417
82%18%
818
56%44%
7B
ig R.
231
0%100%
2214
21%79%
916
81%19%
713
23%77%
10N
avarro R.
281
0%100%
2715
27%73%
1317
65%35%
1116
44%56%
12
Sonoma
Coastal
110
--
110
--
110
--
110
--
11G
ualala R.
151
0%100%
144
0%100%
116
0%100%
94
0%100%
11R
ussian R.
461
100%0%
459
78%22%
3720
45%55%
2614
7%93%
32
Marin
Coastal
163
100%0%
135
100%0%
1112
83%17%
410
80%20%
6
San Francisco Bay
Coastal
60
--
60
--
61
0%100%
50
--
6
San Mateo
Coastal
50
--
51
100%0%
45
20%80%
03
67%33%
2
Santa Cruz
Coastal
90
--
93
67%33%
65
60%40%
46
50%50%
3
Monterey
Coastal
20
--
20
--
22
0%100%
00
--
2
ESU Total
27835
46%54%
243112
48%52%
166162
61%39%
116144
44%56%
1341 Total num
ber of steams surveyed at least once w
ithin the three-year interval2 Percentage of surveyed stream
s where coho w
ere present in one or more years during the inerval
3 Percentage of surveyed streams w
here coho were absent in all years of survey during the interval
Table 2. Percent of surveyed streams in the historic range of coho salm
on with coho salm
on present for four time intervals: 1989-1991, 1992-1994, 1995-1997, and 1998-
2000. Results are sum
marized by ESU
and county at the mouth of the stream
or river system.

41
APPENDICES

42
APPENDIX A
DescriptionTable A-1 lists all streams within the Central California Coast and Southern Oregon/Northern
California Coasts coho salmon ESUs for which we found some historical (pre-1989) or current (1989-2000) record of coho salmon occurrence.
The list is arranged geographically according to the following conventions. River basins arelisted from north to south according to where the eventual outlet stream or river enters the Pacific Ocean.Within a basin, tributary streams and rivers are listed in the order that they enter the mainstem as onemoves upstream from the river mouth. An identical hierarchy is employed for tributaries, with streamslisted in order from mouth to headwaters. Where a river splits into two or more major forks ofcomparable area, we listed the north or west fork first followed by the south or east fork. Where twoforks drain areas of unequal size, the smaller drainage is treated as the tributary.
Stream names were derived from 7.5 minute United States Geologic Survey (USGS) topographicmaps where possible. Frequently, we found data records in which streams were referred to by alternatenames or spellings. These alternative spellings are listed in parentheses next to the name found on USGSmaps. We also found records of coho salmon occurring in streams that we could not locate on USGSmaps. In most cases, these names are likely local names given to unnamed tributaries. In these instances,a parenthetical (location?) is placed after the name, indicating that we believe the stream lies near towhere it is placed in the table but that the precise location could not be determined from the informationavaiable to us.
Township (T), range (R), section (S), quarter section (¼), and quarter of quarter sections (¼ of ¼)are given where such information was readily available from the sources we used. Some errors werefound in published TRS descriptions and these were changed; however, we did not check the accuracy ofall geographic coordinates.
The historical sources listed represent both original documents and sources cited in variousreviews including Brown and Moyle (1991), Hassler et al. (1991), Adams et al. (1999), and KierAssociates (1999). The bibliography at the end of the appendices denotes whether we have examined theoriginal source or whether we rely on the work of these other authors in documenting historical cohooccurrence. If the cell for historical sources is blank, it means that the first record of presence we foundwas between the years 1989 and 2000, inclusive. It should be noted that we found several inconsistenciesin records among authors, often due to the fact that certain common stream names are found multipletimes within a watershed. We attempted to resolve these discrepancies as much as possible, but there arestill likely a few omissions or duplications within the stream list.
Finally, these appendices will be continuously updated as new information becomes available.We encourage readers of this report who discover errors or omissions in this list to contact Dr. BrianSpence at the following address:
National Marine Fisheries ServiceSouthwest Fisheries Science Center110 Shaffer RoadSanta Cruz, CA [email protected]

43
Table A-1. List of streams for which historical (pre-1989) or current (1989-2000) records exist documenting the occurrence of coho salmon.
Location
Stream T R S¼ of
¼ ¼Historicalsources
Brownand Moyle
1991Hassler et al.
1991Adams et al.
1999
KierAssociates
1999
SOUTHERN OREGON/NORTHERN CALIFORNIA ESU
Del Norte County
Illinois RiverWest Fork Illinois River
Elk Creek 19N 4E 35 NW 12 x x xBroken Kettle Creek 18N 4E 2 NW 12 x x x
South Fork Broken Kettle CreekEast Fork Illinois River x
Dunn Creek 19N 5E 34 NW 12,180 x x xNorth Fork Dunn Creek
South Fork Winchuck River 19N 1W 33 NW NW 12,38,216 x x xSmith River 18N 1W 17 SW SE 6,11,12,179,308 x x x
Rowdy Creek 18N 1W 34 SE NW 143,317 x x xDominie Creek 18N 1W 26 NW NE 12 x x xSouth Fork Rowdy Creek (Low Divide Road) 18N 1E 30 SE NW x
Savoy Creek 18N 1E 30 SW SE 12 x x xCopper Creek 18N 1E 16 NE NE 12 x x x
Morrison Creek 18N 1W 34 SE SE 30,143 x x xLittle Mill Creek (=Jaqua or Iaqua) 17N 1W 12 SW SE 92 x xSultan Creek 17N 1W 13 SE SE xPeacock Creek 17N 1E 30 SW SW xClarks Creek 17N 1E 31 SW SE xMill Creek 16N 1E 8 SW SE 12,22,30,92,317 x x x
West Branch Mill Creek (=West Fork) 16N 1E 32 SW NW 12,22,92 x x xEast Branch Mill Creek (=East Fork) 16N 1E 32 SW NW 22,92 x x x
Kelly Creek xBummer Lake Creek 15N 1E 4 NW NE 22 x x xLow Divide Creek x
South Fork Smith River 16N 1E 10 SW NW 12 x x xCraigs Creek 16N 1E 11 SE SE 12 x x xCoon Creek 16N 2E 19 SE NW 12 x x xRock Creek 16N 2E 32 SW xHurdygurdy Creek (=Hurdy Gurdy) 15N 2E 23 SW NE 12,180,249 x x xJones Creek 15N 2E 24 SW NE 12 x x x
Muzzleloader Creek (=Muzzle Loader) 15N 3E 8 NW 12 x x xBuck Creek 15N 3E 33 NW 12 x x x

44
Location
Stream T R S¼ of
¼ ¼Historicalsources
Brownand Moyle
1991Hassler et al.
1991Adams et al.
1999
KierAssociates
1999Quartz Creek 15N 3E 33 NE 12 x x xEightmile Creek (=Eight Mile) 15N 3E 34 SE 12,241 x x x
Williams Creek 14N 3E 12 NW 12 x x xPrescott Fork Smith River 15N 4E 18 NE 12 x x x
Middle Fork Smith River 17N 2E 20 NW SE 12 x x xMyrtle Creek 16N 1E 10 NE NW 12 x x xHardscrabble Creek 17N 1E 25 SE 12 x x xNorth Fork Smith River 17N 2E 20 NW SE 12 x x x
Stoney Creek (=Stony) 17N 2E 17 SW 240 xPeridotite Canyon (=Peridodite Creek) 17N 2E 6 NE 12 x x xStill Creek 18N 2E 18 SW 12 x x xDiamond Creek 18N 2E 9 SW 12 x x x
Bear Creek 18N 2E 10 SE 244 xNorth Fork Diamond Creek 18N 2E 2 SE 12,243 x
Eighteenmile Creek (=Eighteen Mile) 17N 2E 23 SW 12 x x xPatrick Creek 17N 3E 16 NW 12 x x x
Twelvemile Creek (=Twelve Mile) 17N 3E 8 NW 12 x x xShelly Creek 17N 3E 5 NE 12 x x xElevenmile Creek (=Eleven Mile) 17N 3E 5 NE 12 x x xTenmile Creek (=Ten Mile) 18N 3E 32 SE 12 x x xWest Fork Patrick Creek 18N 3E 3 NE 12 x x x
Monkey Creek 17N 3E 10 NE 12,245 x x xSiskiyou Fork Smith River 17N 3E 11 NW 12,245 x x xPacksaddle Creek 18N 4E 31 SW 12 x x xGriffin Creek (=Griffen) 18N 4E 29 SW 12 x x xKnopti Creek (=Knopki) 18N 4E 27 NW 12 x x x
Lake Earl 317 x xJordan Creek 17N 1W 33 SE SE 12,38,92 x x xYonker Creek (=Yonkers) 30 x x x
Elk Creek 16N 1W 28 SW NW 12,317 x x xWilson Creek 14N 1E 18 NW SW 12,92,143,317 x x x
Del Norte/Siskiyou/Humboldt Counties
Klamath River 13N 1E 5 SE NW 6,11,14,13,12,308 x x xHunter Creek 13N 1E 4 SE NW 13,12,59,89,92,143 x x
Salt Creek (includes High Praire Creek) 13N 1E 4 SW NE 12,59,92,143,248,247,317 x x xMynot Creek (=Minot) 13N 1E 4 NW NE 12,216,317 x x xEast Fork Hunter Creek 14N 1E 23 SW NW
Unnamed tributary 14N 1E 13 SW SW

45
Location
Stream T R S¼ of
¼ ¼Historicalsources
Brownand Moyle
1991Hassler et al.
1991Adams et al.
1999
KierAssociates
1999Richardson Creek 13N 1E 10 SE SW 59 x x xHoppaw Creek 13N 1E 15 NE NW 12,143 x x
North Fork Hoppaw CreekWaukell Creek 13N 1E 15 SW NE 12,59 x x x
Saugep Creek 13N 1E 15 SE SE 12,59 x x xTurwar Creek (=Terwer=Turwur) 13N 1E 13 NE 12,59,92,216 x x xMcGarvey Creek 13N 1E 24 NE 12,59,92,317 x x x
West Fork McGarvey CreekTarup Creek 13N 2E 20 NE 12 x x xOmagar Creek (=Omager=Omagaar) 13N 2E 29 SE 12,59 x x xBlue Creek 13N 3E 34 SW 13,12,59 x x x
Pularvasar Creek 12N 2E 15 SW SE xunnamed tributary (=One Mile Creek) xWest Fork Blue Creek 13N 2E 36 SW 13,12 x x x
Potato Patch Creek (=Potatoe Patch) 13N 3E 31 SW 13,12 x x xNickowitz Creek (=Nikowitz) 12N 4E 6 SW 13,12,59 x x xCrescent City Fork Blue Creek 13N 3E 34 NW 59 x x x
Ah Pah Creek 12N 2E 22 NW 13,59 x x xNorth Fork Ah Pah Creek 12N 2E 22 NWSouth Fork Ah Pah Creek x x
Bear Creek 12N 2E 27 NE 59 x x xTectah Creek 11N 2E 1 SW 13,59 x x xLittle Creek (=Surpur) 12N 2E 35 SW xJohnson Creek (=Johnsons) 11N 3E 18 NE xPecwan Creek 11N 3E 17 NE 13,59 x x x
East Fork Pecwan Creek 11N 3E 17 NEMettah Creek 11N 3E 30 SE 13 x x xPanther (location?) xRoach Creek (=Roaches) 59 x x xMiners Creek 59 x x xTully Creek 10N 3E 25 NE xPine Creek 9N 4E 5 NW 59 x x x
Little Pine Creek 9N 3E 24 SW 13 x x xTrinity River 7N 5E 33 SE 11,15,13,21,59 x x x
Soctish Creek (=Scotish, Scottish) 8N 4E 10 SE 13,59 x x xNorth Fork Soctish Creek (=Scottish, Scotish) 8N 4E 9 SE x
Mill Creek 8N 4E 10 SE 13 x x xHostler Creek 8N 4E 14 SE 13,59 x x xSupply Creek 8N 4E 25 NW 59 x x xCampbell Creek 7N 5E 6 NE 59 x x x

46
Location
Stream T R S¼ of
¼ ¼Historicalsources
Brownand Moyle
1991Hassler et al.
1991Adams et al.
1999
KierAssociates
1999Tish Tang A Tang Creek 7N 5E 5 NW 13,59 x x xHorse Linto Creek 7N 5E 4 SW 13,59,96,181,247 x x x
Cedar Creek 7N 5E 4 SE xWillow Creek 7N 5E 29 SE 13,28 x x xSouth Fork Trinity River 6N 5E 15 SE 6,11,15,13,59 x x x
Madden Creek 6N 5E 22 NW xEltapom Creek (=Ectapom) 3N 6E 3 SW 15 x x xHayfork Creek 3N 6E 25 NW 15,59 x x x
Olsen Creek 3N 6E 12 SE 15 x x xButter Creek 2N 6E 12 NE 15 x x xRattlesnake Creek 1S 8E 19 NE 15,59 x x x
Sharber Creek 6N 5E 13 NENew River 6N 6E 35 SW 15,59,250 x x x
Big Creek 250 xEast Fork New River 7N 7E 23 NE 250 x
Pelletreau Creek 3N 6E 23 NW 15 x x xBig French Creek 5N 8E 29 NW xPrice Creek 33N 12W 5 NW xManzanita Creek 33N 12W 5 NE 15,59 x x xNorth Fork Trinity River 59 x x x
East Fork North Fork Trinity River xIndian Creek x x x
Canyon Creek 33N 11W 12 NE 59,98,255 x x xSoldier Creek 33N 10W 29 NW xDutch Creek 32N 10W 5 NE xMaxwell Creek xBrowns Creek 6,59,250 x x x
Hazel Gulch xMiddleton Gulch x
Dutton Creek (=Dulton) 33N 10W 35 NW xReading Creek 32N 10W 12 SW xWeaver Creek 32N 10W 1 SE 204 x x
East Weaver Creek 33N 9W 18 NW xWest Weaver Creek 33N 9W 18 NW x
Indian Creek 32N 9W 5 SWTom Lang Gulch xGrass Valley Creek 33N 9W 26 NW xRush Creek 33N 9W 13 NE 9,59 x x xDeadwood Creek 33N 8W 17 NW 9,250 x x xConner Creek (location?) 34N 11W 36 SW x

47
Location
Stream T R S¼ of
¼ ¼Historicalsources
Brownand Moyle
1991Hassler et al.
1991Adams et al.
1999
KierAssociates
1999Aikens Creek xBluff Creek 10N 5E 19 SW 13 x x xSlate Creek 10N 5E 19 NE 13,59 x x xRed Cap Gulch (=Red Cap Creek) 10N 5E 15 SW 13,59 x x x
Leary Creek 10N 6E 30 NW xBoise Creek 10N 5E 2 SE 13,59 x x xCamp Creek 10N 5E 1 NW 13,59,260 x x xSalmon River 6,14,252 x x x
Wooley Creek 6,14,59 x x xHaypress Creek x
Nordheimer Creek 14,59 x x xNorth Fork Salmon River 14,59 x x x
Little North Fork Salmon River xSpecimen Creek x
Whites Gulch xNorth Russian Creek 14 x x xSouth Russian Creek 14,59 x x x
South Fork Salmon River 14,59 x x xKnownothing Creek 14,59 x x xNegro Creek 252 xMethodist Creek 14,59,252 x x xIndian Creek xEast Fork South Fork Salmon River 14,59,157 x x x
Taylor Creek 14,59 x x xIrving Creek 253 x x xDillon Creek 14 x x x
North Fork Dillon Creek xCopper Creek x
Swillup Creek (=Swillop) 253 x xCoon CreekUkonom Creek 14 x x xKing Creek (=Kings)Independence Creek 253 x x xClear Creek 6,14,59 x x x
South Fork Clear Creek xOak Flat Creek xElk Creek 14,41,253 x x x
East Fork Elk Creek 253 x x xCougar Creek 253 x xTwin Creeks x

48
Location
Stream T R S¼ of
¼ ¼Historicalsources
Brownand Moyle
1991Hassler et al.
1991Adams et al.
1999
KierAssociates
1999Bear Creek 253 x xBeaver Creek (location?) x
Little Grider Creek xIndian Creek 15,14,41,59,251,253 x x x
Doolittle Creek xSouth Fork Indian Creek 14,59 x x xEast Fork Indian Creek 59,253 x x xMill Creek 253 x x x
China Creek 157,253 x x xThompson Creek 14,253 x x xFort Goff Creek xPortuguese Creek xWest Grider Creek 14 x x xSeiad Creek 14,59,251 x x x
West Fork Seiad Creek xEast Fork Seiad Creek x
Grider Creek 14,59,157 x x xWalker Creek xScott River 6,14,59 x x
Mill Creek xWooliver Creek xTompkins Creek 14,59 x x xKelsey Creek 14,254 x x xCanyon Creek 14,254 x x xBoulder Creek xShackelford Creek 14,31,32,59 x x x
Mill Creek 14,59,246 x x xPatterson Creek 14,37,155,156 x x xKidder Creek 14,31,33,59,246 x x xEtna Creek 14,34,59 x x xFrench Creek 14,59 x x x
Miners Creek 14 x x xSugar Creek 14,59 x x xSouth Fork Scott River 14 x x xEast Fork Scott River 14 x x x
Big Mill Creek 14 x x xGrouse Creek 4N 6E 7 SW 13 x
Horse Creek 14,31,59 x x xBuckhorn Creek 14,59 x x xMiddle Creek 14 x x x

49
Location
Stream T R S¼ of
¼ ¼Historicalsources
Brownand Moyle
1991Hassler et al.
1991Adams et al.
1999
KierAssociates
1999Salt Gulch 14 x x x
Barkhouse Creek (=Bark House) 14 x x xLittle Humbug Creek xBeaver Creek 14,41,59,157 x x x
West Fork Beaver Creek 176 xCow Creek x
Grouse Creek xLong John Creek (location?) x
Lumgrey Creek xEmpire Creek xHumbug Creek 14,59 x x xShasta River 14,55,59,67 x x x
Big Springs Creek 14 x x xFall Creek (location?) 66 xWilliams Creek xCottonwood Creek 14,59 x x xKlamathon Racks 19 xWillow Creek 14,59 x x xLittle Bogus Creek xDry Creek xBogus Creek 14,39 x x x
Cold Creek x
Humboldt County
Redwood Creek 11N 1E 32 NW SW 11,13,99,143,308 x x xPraire Creek 11N 1E 34 NE NW 6,13,38,68,92,99,142,247 x x x
Little Lost Man Creek 11N 1E 23 NE NW 13,92 x x xLost Man Creek 11N 1E 23 NE NW 13,92 x x xMay Creek (=Mae) 11N 1E 14 NE NW 13,92 x x xGodwood Creek 11N 1E 2 NW SE 13,22 x x xBoyes Creek 11N 1E 2 NW SE 92 x xBrowns Creek 30 x x x
North Fork Brown CreekSouth Fork Brown Creek
Streelow Creek 30 x x xMcArthur Creek 10N 1E 2 SE SWElam Creek 10N 1E 11 NW SETom McDonald Creek 9N 1E 1 NE NW 13,99 x x xEmerald (location?)

50
Location
Stream T R S¼ of
¼ ¼Historicalsources
Brownand Moyle
1991Hassler et al.
1991Adams et al.
1999
KierAssociates
1999Bridge Creek 9N 2E 6 SE SE 13,99 x x xCoyote Creek 8N 2E 2 NE NW 99 x x xPanther Creek 8N 2E 14 NE NE 13,99 x x xLacks Creek 8N 3E 19 SE 6,13 x x xKaren Creek (location?)Cole Creek (location?)Hayes Creek (location?)Davison Creek (location?)
McDonald Creek (tributary to Stone Lagoon) 10N 1E 29 NW NW 13,143 x xFresh Creek 10N 1E 29 SE NW 13 x x x
Big Lagoon 7 x xMaple Creek 9N 1E 18 SE SE 38 x
Pitcher Creek 9N 1E 19 NE SELittle River 7N 1E 6 NW NW 13,92 x x x
South Fork Little River 7N 1E 9 NE NW 13 x x xRailroad CreekLower South Fork Little River 8N 1E 36 SW SW 13 x xUpper South Fork Little River 8N 2E 36 SW SW 13 x xCarson Creek (location?)
Strawberry Creek 7N 1W 18 SW NW 13 x x xMad River 7N 1W 36 NW NE 6,11,13,142,308 x x x
Warren Creek 6N 1E 15 NE SE 13,308 x x xLindsay Creek 6N 1E 14 NW SE 13,92,197 x x x
Grassy Creek 6N 1E 11 NW SE 13,92 x x xSquaw Creek 6N 1E 2 SE NW 13,143,197 x x xMather Creek 7N 1E 27 NE NE 13 x x x
Hall Creek 6N 1E 14 SW SW 13 x x xNoisy Creek 6N 1E 13 SE SE 13,92 x x xMill Creek 6N 1E 13 NE NE 13 x x x
Camp Bauer Creek 92 x xPowers Creek 30 x x xLeggit Creek 6N 1E 24 NE SW 13 x x xNorth Fork Mad River 6N 1E 24 NW NW 13 x x x
Sullivan Gulch (=Sullivan Creek) 6N 2E 28 SW 13 x x xLong Praire Creek 6N 2E 11 SE 13 x x x
Kelly Creek (=Kelley) 30 x x xPalmer Creek 6N 2E 30 SW 13 x xQuarry Creek 6N 2E 30 SE 13 x x xDry Creek 5N 2E 8 SE 13 x x xCannon Creek (=canon) 7N 2E 28 SE 13,197 x x x

51
Location
Stream T R S¼ of
¼ ¼Historicalsources
Brownand Moyle
1991Hassler et al.
1991Adams et al.
1999
KierAssociates
1999Maple Creek 4N 3E 6 NW 13 x x xBlack Creek 30 x x xBoulder Creek 4N 3E 31 NW SW 13 x x x
McDaniel SloughJanes Creek (=Jones) 103 x xJolly Giant Creek 6N 1E 32 SW SE 13,103 x x x
Arcata oxidation ponds 30 xJacoby Creek 5N 1E 4 NW SW 13,71,103 x x xRocky Gulch Creek 30 x x xFay Slough
Cochran Creek 5N 1E 20 SW NE 13,103 x x xEureka Slough
Freshwater SloughRyan Slough
Ryan Creek 5N 1E 31 NW NW 13 x x xtributary to Ryan Creek (location?)Henderson Gulch xGuptil Gulch x
Freshwater Creek 5N 1E 29 NW SW 13,71,99,103,191 x x xMcCready Gulch 30 x x xLittle Freshwater Creek 30 x x xCloney Gulch 4N 1E 3 NE SE 13,191 x x x
Falls Gulch 30 x x xGraham Gulch 4N 1E 3 SE SE 13 x xSouth Fork Freshwater Creek 30,191 x x x
Elk River 5N 1W 32 NE SE 13,71,92,99 x x xSwain Slough
Martin Slough 4N 1E 4 SE SE 13 x x xNorth Fork Elk River 4N 1W 26 SW NE 13,99 x x x
McWhinney CreekNorth Branch North Fork Elk River xSouth Branch North Fork Elk River x
South Fork Elk River 4N 1W 26 SW NE 13 x x xTom GulchLittle South Fork Elk River 3N 1W 5 NW 13 x x x
unnamed creek (=College of Redwoods Creek) 30 x x xSalmon Creek 4N 1W 31 NE SE 13,71 x xBridge Creek (location?) x
Humboldt/Mendocino Counties

52
Location
Stream T R S¼ of
¼ ¼Historicalsources
Brownand Moyle
1991Hassler et al.
1991Adams et al.
1999
KierAssociates
1999Eel River 3N 2W 16 NW SW 15,13,61,105,183,308 x x x
Shaw Creek (tributary to Eel River estuary) 30 xSalt River 3N 2W 17 SE SE 13,178 x x x
Cutoff Slough 3N 2W 29 NE NESmith Creek 3N 2W 29 SW NERuss Creek 3N 2W 32 NW SW 13
Reas Creek 3N 2W 34 NW SW 13,178 x x xPalmer Creek 3N 2W 34 SW NW 92 x xRohner Creek 2N 1W 3 NE NE 178 x xStrongs Creek 2N 1W 3 NE NE xVan Duzen River 2N 1W 15 SE SE 6,11,15,13 x x x
Barber Creek 2N 1E 19 SE SWWolverton Gulch 2N 1E 19 NE SW 178 x x
Yager Creek 2N 1E 28 NE SW 13,59,178 x x xCooper Mill Creek (=Copper Mill) 2N 1E 15 SE NW 13,92 x x xBlanton Creek 2N 1E 12 NE NE xLawrence Creek 2N 2E 6 SE 13,79 x x x
Corner Creek xShaw Creek 40,79 x xFish Creek xBooths Run (=Booths Creek) xBell Creek x
South Fork Yager Creek 2N 2E 10 SE xNorth Fork Yager Creek 2N 2E 2 SW xMiddle Fork Yager Creek x
Cuddeback Creek 217 x xFielder Creek 2N 1E 26 SE 13,92 x x xCummings Creek 2N 1E 26 NW x xHely Creek 92 x xRoot Creek 1N 2E 16 NE NE 13 x x xGrizzly Creek 1N 2E 12 SW NW 13,92,178 x x x
Stevens Creek 1N 2E 1 SW SW 13 x x xHoagland Creek 1N 3E 14 SW NE 13 x x xLittle Larabee Creek 1N 3E 12 SE NE 13 x x x
unnamed tributary 13 xunnamed trib 13 xWilson Creek 2N 1E 21 SE 13,178 x x x
South Fork Van Duzen RiverPanter Creek (=Panther; location?) x
Price Creek 217,312 x x x

53
Location
Stream T R S¼ of
¼ ¼Historicalsources
Brownand Moyle
1991Hassler et al.
1991Adams et al.
1999
KierAssociates
1999Howe Creek 2N 1W 35 SW NW 13,178 x x x
Atwell Creek 1N 1W 3 NE SW 13,178 x x xNanning Creek 1N 1E 5 SW NE xMonument Creek 1N 1E 18 NW NE xKiler Creek 1N 1E 20 NW NE xDinner Creek 1N 1E 21 SW NW 216 x xTwin Creek 1N 1E 21 SW NE xStitz Creek 1N 1E 22 NW NE xJordan Creek 1N 1E 26 NE NW 30,92 x x xGreenlow Creek (=Greenlaw) 1N 1E 26 NW NE xShively Creek 1N 2E 29 NE NW 178 x x
Panther CreekPanther Creek tributary (location?) 1N 2E 29 SE NW
Bear Creek 1N 2E 32 NE NW 79 x xChadd Creek 1N 2E 32 NW SE 13,79,178 x x xLarabee Creek 1S 2E 3 NE SE 13,178,312 x x x
Balcom Creek 1S 2E 1 NE SW xCarson Creek 1S 2E 1 NE SE 79 x xScott Creek x
Allen Creek 1S 2E 11 SE SW x
All tributaries to Eel River, exact loctions uncertainArnold Creek (location?) xAtill Creek (location?) xMud Creek (location?) xIber Creek (location?) x
South Fork Eel River 1S 2E 26 NW NE 6,9,11,13,61,105,312 x x xBull Creek 1S 2E 34 NW NE 13,69,178,312 x x x
Connick Creek 1S 2E 29 NE SE xSquaw Creek 1S 2E 30 NE SE 13,79 x x xAlbee Creek 1S 2E 30 SW NW 13 x x xMill Creek 1S 1E 25 NE SW 13 x x xNorth Fork Cuneo Creek 1S 1E 35 SE NW xPanther Creek 2S 1E 24 NE NEPreacher Gulch 2S 1E 24 NE NE
Pollock Creek xMill Creek xMowry Creek xCanoe Creek x x

54
Location
Stream T R S¼ of
¼ ¼Historicalsources
Brownand Moyle
1991Hassler et al.
1991Adams et al.
1999
KierAssociates
1999Bridge Creek (=Bridges) 2S 3E 20 NE NE 217 x xElk Creek 216 x xSalmon Creek 3S 3E 3 SW NW 13,216 x x x
Mill CreekBear Butte Creek (=Butte) 216 x xFish Creek 3S 3E 11 SE NE 13,216 x x xAnderson Creek 79 x x xDean Creek 30,216 x xLeggett Creek xRedwood Creek 4S 3E 10 SW 13,69,99,178 x x x
Seely Creek 4S 3E 9 SE NW 13,178 x x xMiller Creek 4S 2E 24 178 x xChina Creek 4S 2E 24 NW 13,178 x x xDinner Creek 4S 2E 23 178 x x
Bear Canyon Creek 3S 3E 10 13 xSproul Creek (=Sprowel, Sprowl) 4S 3E 34 SE 13,75,190 x x x
Little Sproul Creek 4S 3E 34 SE 13 x x xWarden Creek 5S 3E 5 NE 13 x x xWest Fork Sproul Creek 5S 3E 8 NW 13 x x x
East Branch West Fork Sproul CreekCox Creek (location?) x
East Branch of South Fork Eel River 4S 3E 36 SE 13,69 x x xSquaw Creek 4S 4E 33 178 x x
Schofield Creek 30 xDurphy Creek 5S 3E 13 NW 13,178,217 x x xMilk Ranch Creek 5S 3E 24 SE 13,178 x x xLow Gap Creek 5S 3E 24 SW SE 178 x x xunnamed tributary 312 xunnamed tributary 105,312 xIndian Creek 312 x x x
Jones Creek xMoody Creek 24N 18W 5 SE NE xSebbas Creek 24N 18W 5 NW NE xCoulborn Creek x
Piercy Creek 5S 3E 35 NW SE 105 x x xStandley Creek 24N 18W 1 SE 61,178 x x xMcCoy Creek 24N 17W 6 SE 61,178 x x xBear Pen Creek 24N 17W 7 SE SE 61,178 x x x
Cub Creek 24N 17W 18 SW SW 61,178 x x xRed Mountain Creek 24N 17W 17 SW NE 178 x x

55
Location
Stream T R S¼ of
¼ ¼Historicalsources
Brownand Moyle
1991Hassler et al.
1991Adams et al.
1999
KierAssociates
1999Wildcat Creek 24N 17W 20 NW SE 61,99,105,106,178 x x x
unnamed trib 24N 17W 31 NE NW 61 xHollow Tree Creek 23N 17W 10 NE SW 61,78,106,178 x x x
Mule Creek 23N 17W 29 SE NW 61,178 x x xMiddle Creek 23N 17W 29 NW SE xWalters Creek 61 x x xRedwood Creek 22N 17W 9 NW NE 61,78,106,178 x x x
South Fork Redwood Creek xBond Creek (=Bonds) 22N 17W 15 NE NW 78,106 x x xMichaels Creek 22N 17W 14 78,178 x x x
unnamed trib to Michaels CreekDoctors Creek x
Waldron Creek 22N 17W 14 SW SW 61,106,178 x x xButler Creek 22N 17W 24 NW NW 61,106 x x xHuckleberry Creek 22N 17W 23 SE SW 61,78,178 x x x
Bear Wallow Creek 22N 17W 26 SW NW xLittle Bear Wallow Creek
Bear Creek (location?)Cedar Creek 23N 17W 14 61 x x xLow Gap Creek 23N 16W 19 SW SW 61 x x
Little Low Gap Creek 23N 17W 25 SE NERattlesnake Creek 23N 16W 20 SW SW 61,178,312 x x x
Cummings Creek 23N 15W 19 SE NE 8,61 x x xTen Mile Creek 22N 16W 16 NW SW 61,79,312 x x x
Grub Creek 22N 15W 18 NW NE 61,178 x xStreeter Creek (=Streetcar) 22N 15W 22 NW SW 61,79 x x xBig Rock Creek 22N 15W 29 NE NE 61,178 x x xMud Springs Creek 21N 15W 11 NE NW 61,178 x xMill Creek 21N 15W 11 SW NE 61,178 x x xCahto Creek 21N 15W 13 NW 61,178 x x x
Barnwell Creek 22N 16W 20 NE NE 61 xFox Creek 22N 16W 21 178 x xElder Creek 21N 16W 29 x xunnamed tributary (location?) 312 xunnamed tributary (location?) 312 xunnamed tributary (location?) 312 xJack of Hearts Creek 22N 16W 29 SW 61,105,178,186 x x xDeer Creek 21N 16W 4 NE NW 61,178 x x xLittle Charlie Creek 21N 16W 9 NE NW 61 x x xDutch Charlie Creek 21N 16W 9 NW 61,79,178 x x x

56
Location
Stream T R S¼ of
¼ ¼Historicalsources
Brownand Moyle
1991Hassler et al.
1991Adams et al.
1999
KierAssociates
1999Redwood Creek 21N 16W 16 NW NW 61,178 x x xRock Creek 21N 16W 9 SE SW 61,178,312 x x xKenny Creek 21N 16W 22 SW NW 61,178 x x xHaun Creek 21N 16W 26 SW NW 61 x x xTaylor Creek 21N 16W 25 NW SW 61,178 x x xBear Creek 21N 16W 36 NW NE 61,178 x x x
Poison Oak Creek 1S 2E 36 NW NWNewman Creek 1S 2E 25 SE SW 13,178,216 x x xKapple Creek 1S 3E 29 SW SEThompson Creek 1S 3E 29 SE SE xJewett Creek 4S 5E 11 NW NW 13,178 x x xKekawaka Creek 4S 6E 29 NE NE 30 x x xNorth Fork Eel River 24N 7E 4 SW SW
Bluff Creek 178 x xMiddle Fork Eel River 22N 13W 6 NW NE 6,9,11,61,105 x x x
Salt Creek 21N 13W 11 xRattlesnake Creek 25N 11W 35 178 x xNorth Fork Middle Fork Eel River (location?) 25N 11W 9
Morrison Camp Creek (=Morrison; location?) 25N 11W 6Rock Creek (location?) 26N 11W 32 178 x x
Elk Creek 21N 11W 9Eden Creek 21N 11W 9Sanhedrin Creek 20N 11W 8
Thatcher Creek 21N 11W 7Mill Creek 22N 12W 25 178 x x
Grist Creek 22N 12W 9 NW NW 61,178 x xunnamed tributary 22N 13W 15 SE NE 61 x
Williams Creek 23N 11W 31 NW NWBlack Butte CreekSpanish Creek (location?)
Outlet Creek 21N 13W 31 SE SE 79,105,179 x x xBloody Run Creek 2N 4E 1 105 x xLong Valley Creek 20N 14W 28 SW x xSherwood Creek
Rowes Creek 19N 14W 23 NW SW 105 x xRyan Creek 19N 14W 26 NE NE 79,106 x x
South Fork Ryan Creek xReeves Canyon 19N 14W 11 SW 79 x xMill Creek 19N 13W 31 SE 105 x x
Willits Creek 18N 14W 13 NW NW 79 x x

57
Location
Stream T R S¼ of
¼ ¼Historicalsources
Brownand Moyle
1991Hassler et al.
1991Adams et al.
1999
KierAssociates
1999Dutch Henry Creek 105 x x
Broaddus Creek (=Brouddus) 18N 13W 18 NE 79,105 x x xBaechtel Creek 19N 13W 31 SW 79 x x
Haehl Creek 18N 13W 18 SE 79 x xIndian Creek 20N 13W 9 SE SW 61,178 x xTomki Creek 18N 12W 12 SE SW
Scott Creek 18N 12W 8 SE SERocktree Creek 19N 13W 36 SE SE 61,178 x x x
String Creek 19N 13W 36 SW NW 61,178 x x xTartar Creek (=Tarter) 19N 13W 26 178 x x
Guthrie Creek 2N 3W 24 SW NW 13 x x xBear River 1N 3W 10 SE SE 13 x x x
Bonanza Gulch 1N 2W 16 SW SE 13 x x xSouth Fork Bear River 1N 2W 21 NE NE 13 x x x
Hollister Creek 1N 3W 34 SW NW 13 x x xMcNutt Gulch (=McNut) 1S 3W 25 SW NW 13 x x x
Humboldt County
Mattole River 2S 3W 12 SW SE 13,106,308 x x xBear Creek 2S 2W 18 SW SE 13,75 x x x
South Fork Bear Creek 4S 1E 9 SE NE 197 x xStansberry Creek 2S 2W 18 SW SE 13 xMill Creek 2S 2W 16 SW NWNorth Fork Mattole River 2S 2W 4 SE SE 13 x x xMill Creek 2S 2W 10 NW NE 13 x x xClear Creek 2S 2W 11 SW NW 13 x x xConklin Creek 2S 2W 12 NE SE 13 x x xMcGinnis Creek 2S 2W 12 NE SE 13 x x xIndian Creek 2S 2W 24 NW NW 13 x x xSquaw Creek 2S 1W 30 SE NW 13 x x xPritchard Creek (=Pritchett) 2S 1W 28 SE SW 13 x x xGranny Creek 2S 1W 28 SW SW 13 x x xSaunders Creek 2S 1W 33 NW NE 13 x x xWoods Creek 3S 1W 2 SE SW 13 x x xUpper North Fork Mattole River 3S 1W 1 NE NW 13 x x
Oil Creek 2S 1E 19 NW NE 13 x x xDevils Creek 2S 1W 2 SW NE 13 x x x
Rattlesnake Creek 2S 1E 19 NW NE 13 x x xHoneydew Creek 3S 1E 6 NW SW 13 x x x
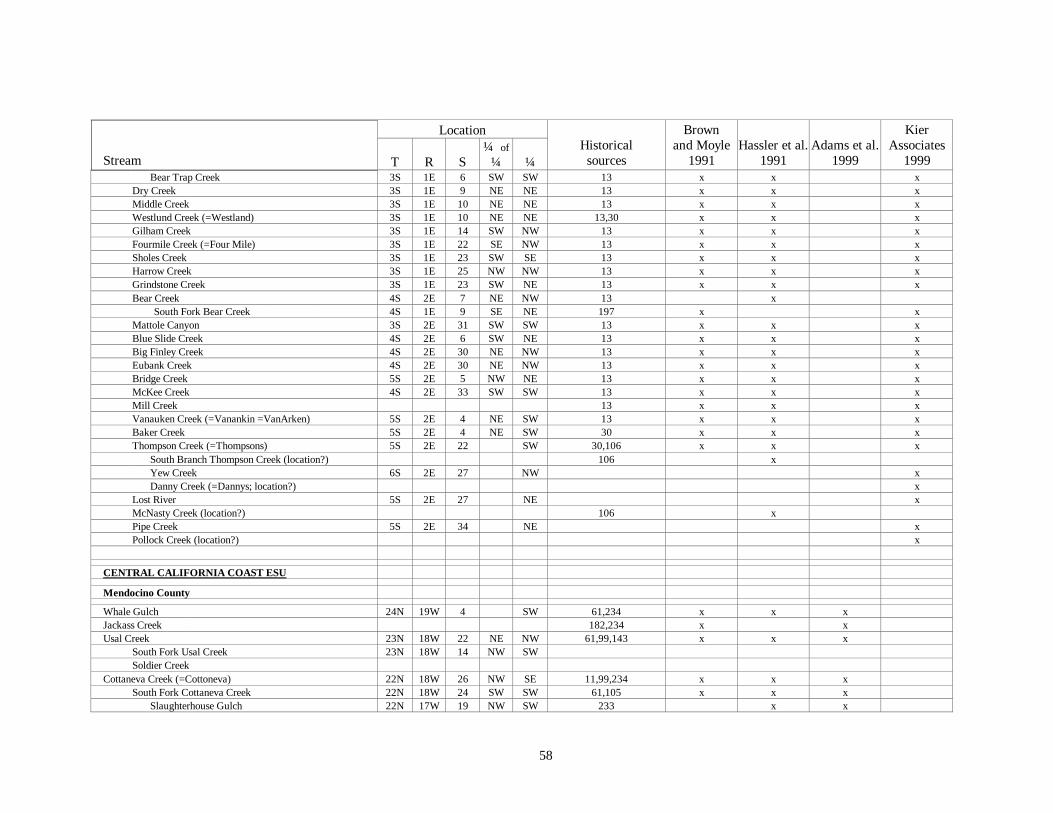
58
Location
Stream T R S¼ of
¼ ¼Historicalsources
Brownand Moyle
1991Hassler et al.
1991Adams et al.
1999
KierAssociates
1999Bear Trap Creek 3S 1E 6 SW SW 13 x x x
Dry Creek 3S 1E 9 NE NE 13 x x xMiddle Creek 3S 1E 10 NE NE 13 x x xWestlund Creek (=Westland) 3S 1E 10 NE NE 13,30 x x xGilham Creek 3S 1E 14 SW NW 13 x x xFourmile Creek (=Four Mile) 3S 1E 22 SE NW 13 x x xSholes Creek 3S 1E 23 SW SE 13 x x xHarrow Creek 3S 1E 25 NW NW 13 x x xGrindstone Creek 3S 1E 23 SW NE 13 x x xBear Creek 4S 2E 7 NE NW 13 x
South Fork Bear Creek 4S 1E 9 SE NE 197 x xMattole Canyon 3S 2E 31 SW SW 13 x x xBlue Slide Creek 4S 2E 6 SW NE 13 x x xBig Finley Creek 4S 2E 30 NE NW 13 x x xEubank Creek 4S 2E 30 NE NW 13 x x xBridge Creek 5S 2E 5 NW NE 13 x x xMcKee Creek 4S 2E 33 SW SW 13 x x xMill Creek 13 x x xVanauken Creek (=Vanankin =VanArken) 5S 2E 4 NE SW 13 x x xBaker Creek 5S 2E 4 NE SW 30 x x xThompson Creek (=Thompsons) 5S 2E 22 SW 30,106 x x x
South Branch Thompson Creek (location?) 106 xYew Creek 6S 2E 27 NW xDanny Creek (=Dannys; location?) x
Lost River 5S 2E 27 NE xMcNasty Creek (location?) 106 xPipe Creek 5S 2E 34 NE xPollock Creek (location?) x
CENTRAL CALIFORNIA COAST ESU
Mendocino County
Whale Gulch 24N 19W 4 SW 61,234 x x xJackass Creek 182,234 x xUsal Creek 23N 18W 22 NE NW 61,99,143 x x x
South Fork Usal Creek 23N 18W 14 NW SWSoldier Creek
Cottaneva Creek (=Cottoneva) 22N 18W 26 NW SE 11,99,234 x x xSouth Fork Cottaneva Creek 22N 18W 24 SW SW 61,105 x x x
Slaughterhouse Gulch 22N 17W 19 NW SW 233 x x

59
Location
Stream T R S¼ of
¼ ¼Historicalsources
Brownand Moyle
1991Hassler et al.
1991Adams et al.
1999
KierAssociates
1999Middle Fork Cottaneva Creek xNorth Fork Cottaneva Creek 105,106 x x x
Hardy Creek 21N 18W 1 NW NE 61,234 x x xJuan Creek 21N 18W 1 NW NE 61,234 x x x
Little Juan Creek 21N 17W 6 SW 61 x x xHoward Creek 106,236 x xDeHaven Creek 21N 17W 19 NE SW 56,61,106,182 x x xWages Creek 21N 17W 30 NE 105,106,234 x x xAbalobadiah Creek 20N 17W 28 NW SWSeaside Creek 20N 17W 33 NW NW 61 x x
Frazer Creek 20N 17W 33 NE NW 61 xTen Mile River 20N 17W 33 SW 61,234 x x x
South Fork Ten Mile River 19N 17W 3 SW NW 6,61 x x xSmith Creek 19N 17W 11 SW NW 61 x x x
North Fork Smith Creekunnamed tributary 19N 16W 7 NE NW 61 x
Campbell Creek 19N 17W 14 SE NE 61 x x xChurchman Creek (=Churchmans) 19N 16W 20 SE SW 61 x x xRedwood Creek 19N 16W 23 SE NW x xGulch Eleven 19N 16W 25 NE 61 x
Mill Creek 20N 17W 34 SE 61 x x xNorth Fork Ten Mile River 20N 17W 25 NW NW 6,61 x x x
Little North Fork Ten Mile River 61,106 x x xBuckhorn Creek 20N 17W 13 NW SW x
Bald Hill Creek 20N 16W 9 SW SE xMiddle Fork Ten Mile River (=Clark Fork) 20N 17W 25 NW 61 x x x
Bear Haven Creek x xLittle Bear Haven Creek 20N 16W 33 SE 61 x x
Pudding Creek 18N 18W 1 NE NE 6,61,106 x x xLittle Valley Creek 19N 17W 35 NW 61 x x x
unnamed tributary 19N 17W 26 SE SW 61 xunnamed tributary 19N 17W 26 NE NW 61 x
Noyo River 18N 18W 13 NE 6,11,61,105 x x xHayshed Gulch 18N 17W 15 NW NE 61 x xunnamed tributary 18N 15W 17 NW NE 61 xunnamed tributary 18N 15W 15 NE NE 61 xSouth Fork Noyo River 18N 17W 14 NW 61,106 x x x
Kass Creek 18N 17W 14 SE 36,61,106 x x xNorth Fork South Fork Noyo River 18N 16W 30 NW SE 61,106 x x xPeterson Gulch x

60
Location
Stream T R S¼ of
¼ ¼Historicalsources
Brownand Moyle
1991Hassler et al.
1991Adams et al.
1999
KierAssociates
1999Bear Gulch 18N 16W 29 SW 61 x xParlin Creek 17N 16W 4 NW NW 61 x x x
unnamed tributaryunnamed tributaryLittle North Fork Noyo River 18N 17W 1 SE SE 22,61,106,233 x x xDuffy Gulch 18N 16W 12 SE NE 36,61 x x xNorth Fork Noyo River 18N 15W 17 NE NE 36,61 x x x
Marble Gulch 18N 15W 9 NW 36,61 x x xHayworth Creek 19N 15W 33 SW 36,61 x x x
North Fork Hayworth Creek 19N 15W 26 SWMiddle Fork North Fork Noyo River 19N 15W 29 NE SE 35,61 x xDewarren Creek (=DeWarren) 19N 15W 29 NE NW 36
unnamed tributaryOlds Creek 18N 15W 14 NE NW 36,61 x x xRedwood Creek 18N 15W 4 NE 36,61,233 x x xMcMullen Creek 36
Hare Creek 18N 18W 13 SE 61,106 x x xCovington Gulch 106 x xBunker Gulch 18N 17W 26 SW SW 61,106 x x xSouth Fork Hare Creek (location?) 18N 17W 27 SE 61,106 x x xWalton Gulch Creek (location?) 106 x
Jug Handle Creek 18N 18W 36 NE SW 61,236 x x xCaspar Creek 17N 18W 1 NW SE 10,61,105,106 x x
North Fork Casper Creek 247 x x xSouth Fork Casper Creek 247 x x xBlue Gum Creek
Doyle Creek 17N 17W 26 NW SW 61,106 x x xRussian Gulch 17N 17W 18 SW SW 61 x xRyan Creek (location?) xBig River 17N 17W 30 SE 6,11,61,105,234 x x x
Railroad Gulch xLittle North Fork Big River 17N 17W 24 SW SE 61 x x x
East Branch Little North Fork Big River 17N 16W 8 SE SW 106,233 x x xBerry Gulch 17N 16W 8 NE SW 106 x x
North Fork Berry Gulch 233 x xTwo Log Creek 17N 16W 23 SW NE 105,106,233 x x xTramway Gulch 17N 16W 25 SW SW 233 x x xNorth Fork Big River 17N 15W 29 SE 61 x x x
East Branch North Fork Big River 17N 15W 20 NE NE 61 xBull Pen Gulch (location?)

61
Location
Stream T R S¼ of
¼ ¼Historicalsources
Brownand Moyle
1991Hassler et al.
1991Adams et al.
1999
KierAssociates
1999Chamberlain Creek 17N 15W 5 SW SE 61,106 x x x
Water Gulch 17N 15W 5 SE xWest Chamberlain (location?) 18N 15W 32 SE SW xArvola Gulch 18N 15W 28 SW SW 61 x x x
James Creek 17N 15W 11 NW 61,233 x x xNorth Fork James Creek 18N 15W 35 NE 61 x x x
South Fork Big River 17N 15W 28 SE SE 61 x x xRamon Creek 16N 15W 2 NW SE x x
North Fork Ramon CreekDaugherty Creek (=Dougherty) 16N 14W 19 NE SW 61 x x x
Gates Creek 16N 14W 32 NW NE xJohnson Creek 16N 14W 33 NE NE 233 x x x
Little River 16N 17W 6 SE 61,105,106 x x xBuckhorn Creek 16N 17W 8 SE SW 61 x x x
unnamed tributary 16N 17W 8 NE SE 61 xAlbion River 16N 17W 21 SW SW 61,105,106,234 x x x
Deadman GulchRailroad Gulch 16N 17W 23 NE NE 61 x x x
Pleasant Valley Creek 16N 17W 23 NE NE xDuckpond Gulch (=Duck Pond) 16N 17W 13 NE SWSouth Fork Albion River 16N 16W 17 NW NW 61 x x x
Little North Fork South Fork Albion RiverBull Team Gulch
Railroad Gulch (=East Railroad Gulch) 16N 16W 9 SW NE 61Tom Bell Creek 16N 16W 9 NE NE xNorth Fork Albion River 16N 17W 11 NE NE 61 x x x
Soda Springs 17N 16W 35 SE SE xMarsh Creek (=March) 16N 16W 12 SE 61 x x x
unnamed tributaryunnamed tributary (=Slaughterhouse Gulch)
Little Salmon Creek 16N 17W 28 SW 61 x xunnamed tributary 16N 17W 27 SE SW 61
Big Salmon Creek 17N 17W 28 SW SW 61,105,106 x x xDonnelly Creek xHazel Gulch 16N 16W 32 NW SE 61 x x x
West Branch Hazel Gulch 16N 16W 29 SW NE 61 x xNavarro River 15N 17W 5 SE NE 6,11,61,105 x x x
Marsh Gulch 15N 17W 11 SE NE xMurray Gulch 15N 17W 12 SW SW xNorth Fork Navarro River 15N 16W 16 SW 61 x x x

62
Location
Stream T R S¼ of
¼ ¼Historicalsources
Brownand Moyle
1991Hassler et al.
1991Adams et al.
1999
KierAssociates
1999Dead Horse Gulch 15N 16W 15 SW SE xTramway Gulch xFlynn Creek 15N 16W 13 SE NW 106 x x x
Camp 16 Gulch xTank 4 Gulch (=Tank Ford) 16N 16W 36 SE NE x
North Fork Flynn Creek (location?) 105 xNorth Branch North Fork Navarro River 15N 15W 7 NW SW 61 x x x
Cook Creek 15N 16W 14 NW SW xJohn Smith Creek 16N 15W 33 NE NE 61,106 x x xLittle North Fork Navarro River 16N 15W 33 NE NE 61 x x
South Branch North Fork Navarro River 15N 15W 7 SW 61 x x xBridge Creek 15N 14W 19 NE NE 61 x x x
Mill Creek 14N 15W 3 SW 61 x x xIndian Creek 14N 14W 19 NW SE 61 x x x
North Fork Indian Creek 14N 14W 14 NW 61 x x xGut Creek 14N 13W 18 SW NE 61 x x xDick Creek 14N 14W 13 SW NW 61 x x
Anderson Creek 14N 14W SE SERobinson Creek 13N 14W 2 SW SE 61 x x
Rancheria Creek 15N 14W 19 SW SE 143 x xHam Canyon 14N 14W 30 SE 61 x xHorse Creek 13N 15W 1 SE SE 61 x x xMinnie Creek 13N 14W 17 NW 61 x x xCamp Creek 13N 14W 21 NW NW 61 x x x
German Creek 13N 14W 33 NW SW 61 x x xGreenwood Creek 15N 17W 35 NE NW 61 x x xElk Creek 14N 17W 2 NE SE 61 x x x
South Fork Elk CreekThree Springs Creek 14N 16W 25 SW 61 x x xSoda Fork Creek 14N 15W 31 SE 61 x x xSulphur Creek (=Sulphur Fork) 14N 16W 36 SE NE 61 x x x
Mallo Pass Creek 14N 17W 36 SE NE 61 x x xBrush Creek 13N 17W 23 NW SE 61,233 x x xGarcia River 13N 17W 34 NW NE 6,11,61,105,196 x x x
South Fork Garcia River 106,169 x xFleming Creek 11N 15W 4 SE NW 106,169 x x
Schooner Gulch 12N 16W 32 NW NE 61 x x xNorth Fork Schooner Gulch 12N 16W 29 SE SE 22,61 x x x
Fish Rock Gulch 11N 15W 18 SW NE 61 x x x

63
Location
Stream T R S¼ of
¼ ¼Historicalsources
Brownand Moyle
1991Hassler et al.
1991Adams et al.
1999
KierAssociates
1999Sonoma County
Gualala River 11N 14W 27 SW 6,64,61,68,105,196 x x xNorth Fork Gualala River x
Little North Fork Gualala River 11N 15W 23 NW 61,106,234 x xDoty Creek 11N 15W 10 NW NW 61 x x x
South Fork Gualala River 11N 14W 26 NE NE 64,68 x x xBuckeye Creek 10N 14W 6 NW SE x
Franchini Creek 10N 14W 1 SE NW 64 x x xWheatfield Fork Gualala River 10N 14W 20 SE NE 64 x x
Fuller Creek 10N 13W 32 SE NW 8,64,68 x x xNorth Fork Fuller Creek 10N 13W 17 NE SE 64,68 x xSouth Fork Fuller Creek 10N 13W 17 NE SE 64,68 x x
Haupt Creek 10N 13W 33 SW SW 8,64,68 x x xHouse Creek 9N 12W 6 NE NW 64 x x x
Marshall Creek 9N 13W 27 NW NE 64 x x xSproule Creek 9N 13W 25 SW NE 68 x x ?
Fort Ross Creek 8N 12W 30 NW NW 8,64,68 x x xRussian Gulch 56,61,68,106 x x x
Middle Branch Russian Gulch 7N 12W 11 NW SW 61 x x xEast Branch Russian Gulch 7N 12W 2 SE SW 61 x x x
Russian River 12N 11W 25 SE SE 6,11,64,61,68 x x xJenner Gulch 7N 11W 18 NE SEWillow Creek 7N 11W 20 SE NE 64,68 x x xSheephouse Creek 7N 11W 17 NE SE 64,68 x x x
unnamed tributary 7N 11W 16 NW NW 64 x xFreezeout Creek 7N 11W 14 NE SW 64,68 x x xAustin Creek 7N 11W 11 SE NW 64,68 x x x
Kohute Gulch 7N 11W 2 SW NW 64 x xKidd Creek 8N 11W 34 SW NW 64,68 x x xEast Austin Creek 9N 12W 24 NW NE 64,68 x x x
Gilliam Creek 8N 11W 2 SW SW 64 x x xGray Creek 9N 11W 34 NE NW 8 x x
Ward Creek 8N 11W 16 SW NW 8 x xRed Slide Creek 9N 11W 31 SE NW 64 x x
Dutch Bill Creek 7N 10W 7 NE SW 64,68,143 x x xHulbert Creek 8N 10W 31 NW SE 143,216 x x
Mission Creek 8N 11W 25 SW SW 68 x xGreen Valley Creek 8N 10W 25 SE SE 248 x x
Purrington Creek 7N 9W 19 SE NE xunnamed tributary

64
Location
Stream T R S¼ of
¼ ¼Historicalsources
Brownand Moyle
1991Hassler et al.
1991Adams et al.
1999
KierAssociates
1999Mark West Creek 8N 9W 32 NE SE 64 x x
Laguna de Santa Rosa 7N 9W 10 NW NESanta Rosa Creek (location?) 7N 9W 14 NW SWunnamed tributary (=Griffen Creek; location?)Mark Slide Creek (location?) 64,68 xDry Creek 11N 12W 11 SW SE 64,61,142 x x x
Mill Creek 9N 9W 33 NW NW 143 x xFelta Creek 9N 9W 32 NE SW xWallace Creek 9N 10W 25 NE SE 143 x xPalmer Creek 9N 10W 34 NE SE
Pena Creek 10N 10W 22 SW NW 143 x xWarm Springs Creek 10N 10W 18 NW NE x x
Maacama Creek 9N 8W 20 NE SWRedwood Creek
East Fork Russian River 15N 12W 5 NE NE 61 x x xYork Creek 16N 12W 33 NW 61 x x xForsythe Creek 16N 12W 7 SE SN x x
Seward Creek 16N 12W 7 SW NE x xEldridge Creek 16N 13W 11 NE x xJack Smith Creek 16N 13W 11 NE x x
Mill Creek 17N 13W 36 SW xSalt Hollow Creek 16N 12W 9 SW SW 61 x x xRocky Creek 17N 12W 20 SW NW 61 x x xMariposa Creek 17N 12W 18 SW 61 x x xFisher Creek 17N 12W 17 NW SW 61 x x xCorral Creek 17N 12W 17 NW 61 x x x
Scotty Creek 6N 11W 9 NW NE 64,68 x xSalmon Creek 6N 11W 15 SE SW 6,64,68 x x x
Finley Creek 6N 11W 13 NE SE 8,64,68 x x xColeman Valley Creek 6N 10 13 NW SW 8,64,68 x x xFay Creek 6N 10W 18 SE SE 8,64,68 x x xTannery Creek 6N 10W 19 NE NE 68 x x x
Valley Ford Creek 6 x
Coastal Marin County
Walker Creek 4N 10W 2 SE NE 60,68,73 x x xSalmon Creek 4N 8W 30 NW NE 60 x x xArroyo Sausal Creek 4N 8W 30 NW NE 60 x x x
Lagunitas Creek 4N 9W 22 SE SE 6,11,60,68,74,90 x x x

65
Location
Stream T R S¼ of
¼ ¼Historicalsources
Brownand Moyle
1991Hassler et al.
1991Adams et al.
1999
KierAssociates
1999Haggerty Gulch Creek 4N 9W 35 NE NW 60 x xOlema Creek 3N 9W 2 NE NE 68 x x x
Quarry GulchGiacomini Creek
Nicasio Creek 4N 8W 29 SW SW 60 x x xDevils Gulch Creek 2N 8W 10 SW SW 60,68,74 x x xSan Geronimo Creek 2N 8W 23 NW SE 60,68,74 x x x
Bolinas Lagoon xPine Gulch Creek 1N 8W 24 SE NE 60,68 x x
Redwood Creek 1S 6W 7 SW NW 60,68 x x xunnamed tributary (=Kent Creek)unnamed tributary (=Fern Creek)
San Francisco Bay
Alameda Creek 102 x xSan Pablo Creek 146 x xWalnut Creek 145 x xCorte Madera Creek 1N 6W 146 x x
San Anselmo Creek 1N 6W 88,146 x xMill Valley Creek 1N 6W 146 x x
San Mateo County
San Gregorio Creek 7S 5W 307 x x xPescadero Creek 7S 5W 62,227,230,307 x x x
Peters Creek 8S 3W 8 NE SWButano Creek 8S 5W 307 x x xGazos Creek 9S 5W 62 x x x
Santa Cruz County
Waddell Creek 10S 4W 2 SW NW 230,307 x x xEast Branch Waddell Creek 9S 4W 23 SW SE 6,63,227,307 x xHenry Creek 9S 4W 11 SE SW
Scott Creek 10S 3W 6,63,227,307 x x xBig Creek 10S 3W 18 NW NE x

66
Location
Stream T R S¼ of
¼ ¼Historicalsources
Brownand Moyle
1991Hassler et al.
1991Adams et al.
1999
KierAssociates
1999San Vicente Creek 11S 3W 4 NW NE 63 x xSan Loreonzo River 11S 1W 19 NE NW 104 x x x
Hare Creek 6,63,227,307 x x xSoquel Creek 11S 1W 15 NW NE 9 xAptos Creek 11S 1E 18 SW SW 9,307 x x
Monterey County
Carmel River 11 x xBig Sur River 11 x x
67
APPENDIX B
DescriptionTable B-1 shows modern (1989-2000) presence-absence information for all streams within the
Central California Coast and Southern Oregon/Northern California Coasts coho salmon ESUs for whichwe found some historical or current record of coho salmon occurrence. The geographical organizationand naming conventions for this table are identical to those used in Appendix A.
The values in the table are coded as follows:
P (upper case) = stream surveyed and juvenile coho salmon found to be present in the yearindicated; the number of fish either >5 or unknown.
p (lower case) = stream surveyed and 5 or fewer juvenile coho salmon observedA = stream surveyed, no juvenile coho found{ } = adult survey[ ] = literature report; date of actual observation of coho salmon presence or absence not known.
Adult spawning surveys often spanned a portion of two calendar years. In this table, we attributepresence or absence only to the first year of a spawning season (i.e., if coho salmon are observed duringthe 1991-1992 spawning season, a value of {P} is entered only in 1991.
For all analyses discussed in the text, only data for which year of sampling was known (i.e., allvalues not in square brackets) were included.

68
Table B-1. Records of modern occurrence of coho salmon in California streams by year. P = presence of juvenile; p = 5 or fewer juveniles observed;A = absence; { } = adult survey; [ ] = year of observation unknown, date is publication date.
Modern presenceStream 1989 1990 1991 1992 1993 1994 1995 1996 1997 1998 1999 2000 References
SOUTHERN OREGON/NORTHERN CALIFORNIA ESU
Del Norte County
Illinois RiverWest Fork Illinois River
Elk Creek P 116Broken Kettle Creek A 113
South Fork Broken Kettle Creek P P 126,133East Fork Illinois River
Dunn Creek p 115North Fork Dunn Creek P P 122,129
South Fork Winchuck River P P P A A 224,225Smith River
Rowdy Creek {P} {P} {P} {P} {P} {P}P P {P} {P} {P} 210,212Dominie CreekSouth Fork Rowdy Creek (Low Divide Rd) P p 210
Savoy Creek A 209Copper Creek P p 114,210
Morrison Creek P [A] 210,213Little Mill Creek (=Jaqua or Iaqua) P [P] 210,213Sultan Creek P P 202,210,213Peacock Creek A P 4,210,213Clarks Creek P P P 4,210,213Rock Creek [{A}] [{A}] {A} {A} A 137,210Mill Creek P P P 4,210,318
West Branch Mill Creek (=West Fork) {P} {P} {P} P{P} P{P} P{P} P{P} P{P} P{P} P{P} P{P} P{P} 2,4,210,211,212,213,214,318East Branch Mill Creek (=East Fork) P{P} P{P} P{P} P{P} P{P} P{p} P{p} P{P} 2,205,206,207
Kelly Creek P{P} P P 206,207Bummer Lake Creek {P} {P} {P} 2,206,207Low Divide Creek [{A}] [P]{P} 2,207
South Fork Smith River [P] P 291,320Craigs Creek [A] P 210,291,320Coon Creek P 210Rock Creek P 210Hurdygurdy Creek (=Hurdy Gurdy) P A{P} P A 140,210,298,291

69
Modern presenceStream 1989 1990 1991 1992 1993 1994 1995 1996 1997 1998 1999 2000 References
Jones Creek P P A A 120,137,210,212,213,291Muzzleloader Creek (=Muzzle Loader) [A] 298,291
Buck Creek [A] A 210,298Quartz Creek [A] 298Eightmile Creek (=Eight Mile) P P 210,309,320
Williams CreekPrescott Fork Smith River
Middle Fork Smith RiverMyrtle Creek A 210Hardscrabble Creek A 210North Fork Smith River [A] [A] 291
Stoney Creek (=Stony) [A] 291Peridotite Canyon (=Peridodite Creek)Still CreekDiamond Creek [A] 291
Bear Creek A 291North Fork Diamond Creek A 291
Eighteenmile Creek (=Eighteen Mile) A 210Kelly Creek (location?) A 210Patrick Creek p P A 140,210,212,213,291
Twelvemile Creek (=Twelve Mile)Shelly Creek A P A A 125,132,210,213,288Elevenmile Creek (=Eleven Mile) A 210Tenmile Creek (=Ten Mile) A 210West Fork Patrick Creek A 210
Monkey Creek A [A] A 137,288,291Siskiyou Fork Smith River [P] [A] A 210,286,291Packsaddle Creek A 137,210Griffin Creek (=Griffen) [A] A A 137,291Knopti Creek (=Knopki) [A] A A 137,210,291
Lake EarlJordan CreekYonker Creek (=Yonkers)
Elk CreekWilson Creek P A [A] 4,235
Del Norte/Siskiyou/Humboldt Counties
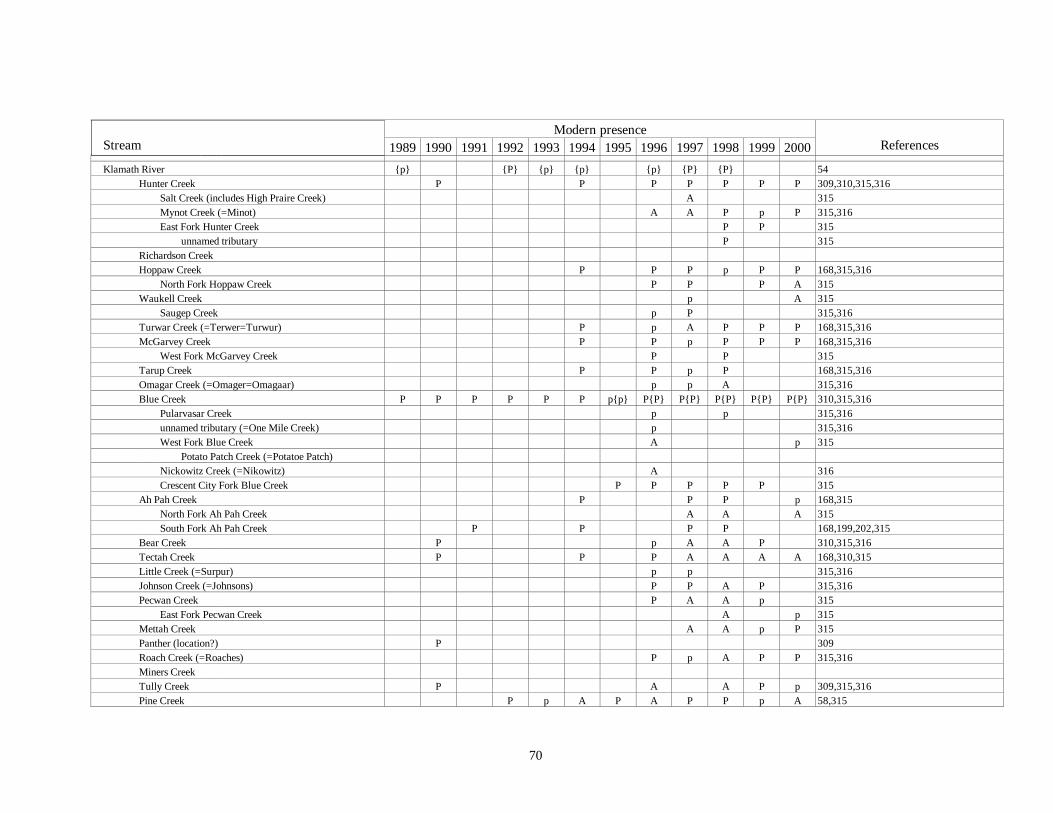
70
Modern presenceStream 1989 1990 1991 1992 1993 1994 1995 1996 1997 1998 1999 2000 References
Klamath River {p} {P} {p} {p} {p} {P} {P} 54Hunter Creek P P P P P P P 309,310,315,316
Salt Creek (includes High Praire Creek) A 315Mynot Creek (=Minot) A A P p P 315,316East Fork Hunter Creek P P 315
unnamed tributary P 315Richardson CreekHoppaw Creek P P P p P P 168,315,316
North Fork Hoppaw Creek P P P A 315Waukell Creek p A 315
Saugep Creek p P 315,316Turwar Creek (=Terwer=Turwur) P p A P P P 168,315,316McGarvey Creek P P p P P P 168,315,316
West Fork McGarvey Creek P P 315Tarup Creek P P p P 168,315,316Omagar Creek (=Omager=Omagaar) p p A 315,316Blue Creek P P P P P P p{p} P{P} P{P} P{P} P{P} P{P} 310,315,316
Pularvasar Creek p p 315,316unnamed tributary (=One Mile Creek) p 315,316West Fork Blue Creek A p 315
Potato Patch Creek (=Potatoe Patch)Nickowitz Creek (=Nikowitz) A 316Crescent City Fork Blue Creek P P P P P 315
Ah Pah Creek P P P p 168,315North Fork Ah Pah Creek A A A 315South Fork Ah Pah Creek P P P P 168,199,202,315
Bear Creek P p A A P 310,315,316Tectah Creek P P P A A A A 168,310,315Little Creek (=Surpur) p p 315,316Johnson Creek (=Johnsons) P P A P 315,316Pecwan Creek P A A p 315
East Fork Pecwan Creek A p 315Mettah Creek A A p P 315Panther (location?) P 309Roach Creek (=Roaches) P p A P P 315,316Miners CreekTully Creek P A A P p 309,315,316Pine Creek P p A P A P P p A 58,315

71
Modern presenceStream 1989 1990 1991 1992 1993 1994 1995 1996 1997 1998 1999 2000 References
Little Pine CreekTrinity River {P} {P} {P} {P} {P} {P} {P} {P} {P} P{P} P 226
Soctish Creek (=Scotish, Scottish)North Fork Soctish Creek (=Scotish, Scottish) P 188
Mill Creek P P P P p P A A P 58Hostler Creek P A A P p 58Supply Creek P p P p A P p p P 58Campbell Creek p p A A 58Tish Tang A Tang Creek p P P A A P P A P 58Horse Linto Creek P P P P P P P p A 16,118,237,275,274,297,301,306,319
Cedar Creek P 272,271Willow Creek P P P{P} P{P} {P} A p A A p 242,266,281,275,289South Fork Trinity River {P} A P 138,270,291
Madden Creek P [P] P 121,281,291Eltapom Creek (=Ectapom)Hayfork Creek A A 280,291
Olsen Creek A 265Butter Creek A 265Rattlesnake Creek A A 259,291
Sharber Creek P P 124,131,291New River A A 280
Big CreekEast Fork New River
Pelletreau Creek A 285Big French Creek [A] P A 112,137,140,291Price Creek [P] A 140,291Manzanita Creek P 267North Fork Trinity River [P] A 140,291
East Fork North Fork Trinity River P [P] P 140,296,305Indian Creek {P} {P} {P} 221,222,223
Canyon Creek [P] P 140,296Soldier Creek {P} {P} {P} 221,221,222,222,223Dutch Creek P A P 219,219,223,265Maxwell Creek {P} {P} 221,222Browns Creek P 219,223
Hazel Gulch {P} {P} 221,222Middleton Gulch P 220
Dutton Creek (=Dulton) {P} {P} 221,222Reading Creek P 219,265

72
Modern presenceStream 1989 1990 1991 1992 1993 1994 1995 1996 1997 1998 1999 2000 References
Weaver Creek P {P} {P} 221,222,311East Weaver Creek P 311West Weaver Creek P 219,311
Indian Creek P P A A 119,137Tom Lang Gulch {P} {P} {P} {P} 218,219,220,221Grass Valley Creek {P} 221,222Rush Creek P P{P} P{P} P P 140,221,222,291Deadwood Creek P {P} {P} 85,86,221,222,265Conner Creek (location?) P 265
Aikens Creek P 290Bluff Creek P P A 287,299Slate Creek P 266Red Cap Gulch (=Red Cap Creek) P P P P 260,273,282,299
Leary Creek P 299Boise Creek [A] 291Camp Creek P P P P P 140,204,261,273,282,299Salmon River
Wooley Creek P 276Haypress Creek P 292
Nordheimer CreekNorth Fork Salmon River P P P 252,263,292
Little North Fork Salmon River P 292Specimen Creek P 292
Whites Gulch P 292North Russian Creek A 140South Russian Creek P A 140,294
South Fork Salmon River P P P 252,263,292Knownothing Creek P P P 141,252,276Negro CreekMethodist Creek P P A 140,252,276Indian Creek P 277East Fork South Fork Salmon River [P] P A 19,140,277
Taylor Creek P A 140,277Irving Creek [P] P 19,293Dillon Creek P 293
North Fork Dillon Creek P 293Copper Creek P 293
Swillup Creek (=Swillop) [P] P 140,291Coon Creek [A] 291

73
Modern presenceStream 1989 1990 1991 1992 1993 1994 1995 1996 1997 1998 1999 2000 References
Ukonom Creek [A] 291King Creek (=Kings) [A] 291Independence Creek {P} P P 50,264Clear Creek P [A] A 140,278,291
South Fork Clear Creek P 293Oak Flat Creek P 284Elk Creek {P} P{P} P P P{P} P P 91,257,264,278,284,293
East Fork Elk Creek P P P 91,264Cougar CreekTwin Creeks P 293Bear CreekBeaver Creek (location?) P 257
Little Grider Creek P 269Indian Creek P{P} {P} {P} P 257,284,293,303
Doolittle Creek P P 264,269South Fork Indian CreekEast Fork Indian Creek P 269Mill Creek P P 269
China Creek P P 269,303Thompson Creek P A 140,264Fort Goff Creek P P 85Portuguese Creek P P 85West Grider CreekSeiad Creek P P [P] P P 123,130,140,268,277
West Fork Seiad Creek P 85East Fork Seiad Creek P 85
Grider Creek P P P A 44,82,140,256,283Walker Creek P 84,268Scott River P P P P 161,162,258,295,300,304
Mill Creek [P] 291Wooliver Creek P 304Tompkins Creek A 140Kelsey Creek P A 140,295Canyon Creek P A 50,140Boulder Creek P 50Shackelford Creek P P A 48,161,300,304
Mill Creek P P 46,161,279Patterson Creek P A A 159,173,300,304Kidder Creek P P P 48,161,162,300,304

74
Modern presenceStream 1989 1990 1991 1992 1993 1994 1995 1996 1997 1998 1999 2000 References
Etna Creek [A] A A 291,300,304French Creek P P P A 159,161,283,300,304
Miners Creek P P 158,159,283Sugar Creek P P P 159,300,304South Fork Scott River P P 159,161,291East Fork Scott River P 159
Big Mill CreekGrouse Creek P 159
Horse Creek P P P P 83,117,140,277,291Buckhorn Creek A 173Middle Creek P A 83,262Salt Gulch A P 140,291
Barkhouse Creek (=Bark House) A 140Little Humbug Creek P 140Beaver Creek P{P} P P P P p 20,44,87,111,140,173,256,277
West Fork Beaver Creek P A 82,302Cow Creek P A 81,173
Grouse Creek P 81Long John Creek (location?) P P 81,82
Lumgrey Creek P A A 83,140Empire Creek P A 173,177Humbug Creek P P P P 82,128,140,277Shasta River P 256
Big Springs CreekFall Creek (location?)Williams Creek P 48Cottonwood Creek P A 86,173Klamathon RacksWillow CreekLittle Bogus Creek P P P 160,161,162Dry Creek P P 161,162Bogus Creek P 50
Cold Creek P 50
Humboldt County
Redwood Creek [P] {P} 203Praire Creek {P} {P} [P]{P} {P} {P} P{P} P P{P} P{P} P P 29,167,203
Little Lost Man Creek P P P P 4,167,203

75
Modern presenceStream 1989 1990 1991 1992 1993 1994 1995 1996 1997 1998 1999 2000 References
Lost Man Creek {P} {P} {P} {P} {P} P 4,203May Creek (=Mae) P P P 4Godwood Creek P 4Boyes Creek P {p} P 4,29Browns Creek A P P 4,167
North Fork Brown Creek P 4South Fork Brown Creek P 4
Streelow Creek P P{P} P P 4,29,167McArthur Creek P 4Elam Creek P 167Tom McDonald Creek P P P 4Emerald (location?) P 4Bridge Creek P P A A 4Coyote Creek APanther Creek ALacks Creek A 4Karen Creek (location?) 4Cole Creek (location?) P 100Hayes Creek (location?) P 100Davison Creek (location?) P 100
McDonald Creek (tributary to Stone Lagoon)Fresh Creek
Big LagoonMaple Creek P 167
Pitcher Creek P 167Little River P P 167
South Fork Little River {P} {P} 167Railroad Creek P P P 225Lower South Fork Little River P{P} P{P} P 167,225Upper South Fork Little River P P P 225Carson Creek (location?) P 225
Strawberry CreekMad River P P 287
Warren Creek P 198Lindsay Creek P 200
Grassy CreekSquaw CreekMather Creek
Hall Creek

76
Modern presenceStream 1989 1990 1991 1992 1993 1994 1995 1996 1997 1998 1999 2000 References
Noisy CreekMill Creek
Camp Bauer CreekPowers CreekLeggit CreekNorth Fork Mad River {P} P 167,202,225
Sullivan Gulch (=Sullivan Creek) {P} {P} {P} P{P} P 167,202Long Praire Creek
Kelly CreekPalmer CreekQuarry CreekDry CreekCannon Creek (=Canon) P [P] P{P} A{P} P{P} P{P} P{P} 167,225Maple CreekBlack CreekBoulder Creek
McDaniel SloughJanes Creek (=Jones)Jolly Giant Creek
Arcata oxidation pondsJacoby Creek P 167Rocky Gulch CreekFay Slough
Cochran CreekEureka Slough
Freshwater SloughRyan Slough
Ryan Creek P 51tributary to Ryan Creek (location?) P 51Henderson Gulch P 150Guptil Gulch P 150
Freshwater Creek P P P P P P P P P P P 144,167,193,202McCready Gulch P A P P 144,167,202Little Freshwater Creek P P P P P P P 40,144,193,202Cloney Gulch P P P P 40,49,167,202
Falls Gulch P P P P 49,144,167,202Graham Gulch P P A 144,167,191,193,202South Fork Freshwater Creek P P P P P P P P 193,202
Elk River P P P P P P 51

77
Modern presenceStream 1989 1990 1991 1992 1993 1994 1995 1996 1997 1998 1999 2000 References
Swain Slough 51Martin SloughNorth Fork Elk River P P {P} P P P 42,49,144,149,167,202
McWhinney Creek A 167North Branch North Fork Elk River P p P P P 42,49,144,189,302South Branch North Fork Elk River P P {P} P P 23,42,49,144,189,202
South Fork Elk River P P 144,167Tom Gulch P 167Little South Fork Elk River P 167
unnamed creek (=College of Redwoods Creek)Salmon Creek P A 167,201Bridge Creek (location?) P 42
Humboldt/Mendocino Counties
Eel RiverShaw Creek (tributary to Eel River estuary) P P P P P P 193Salt River
Cutoff SloughSmith CreekRuss Creek
Reas CreekPalmer CreekRohner CreekStrongs Creek P 51Van Duzen River A 286
Barber CreekWolverton Gulch
Yager Creek P P P 144,192,194,291Cooper Mill Creek (=Copper Mill) A P P 144,192,194Blanton Creek A P P 144,192,194Lawrence Creek p{p} p Pp P p 47,49,144
Corner Creek A P P 144,192,194Shaw Creek P P P P{p} P{p} P P 24,42,45,47,49,101,144Fish Creek P P 192,194Booths Run (=Booths Creek) A P P 144,192,194Bell Creek A A P P 144,192,194
South Fork Yager Creek A P P 144,192,194North Fork Yager Creek A P P 144,192,194

78
Modern presenceStream 1989 1990 1991 1992 1993 1994 1995 1996 1997 1998 1999 2000 References
Middle Fork Yager Creek A P P 144,192,194Cuddeback CreekFielder CreekCummings Creek A P 51,144Hely Creek A P 51,144Root Creek P 43,144Grizzly Creek P 51
Stevens Creek P P 51,144Hoagland CreekLittle Larabee Creek A 144
unnamed tribunnamed tribWilson Creek
South Fork Van Duzen RiverPanter Creek (=Panther, location?) P 45
Price CreekHowe Creek
Atwell CreekNanning Creek P 45,49,144Monument Creek P 45,144Kiler Creek A P 51,144Dinner Creek P 51Twin Creek A P 51,144Stitz Creek A P 51,144Jordan Creek p {P} 51,144Greenlow Creek (=Greenlaw) A P 51,144Shively Creek A P 51,144
Panther CreekPanther Creek tributary (location?) P 45
Bear Creek A P {P} 51,144Chadd Creek p P P 51,144Larabee Creek A P 51,144
Balcom Creek A P 51Carson Creek [P] A P 51,144Scott Creek A P 45,144
Allen Creek P 51
All tributaries to Eel River, exact location uncertainArnold Creek (location?) P 51

79
Modern presenceStream 1989 1990 1991 1992 1993 1994 1995 1996 1997 1998 1999 2000 References
Atill Creek (location?) P 51Mud Creek (location?) P 51Iber Creek (location?) P 51
South Fork Eel River P P P P P P {P} 40,42,43,45,47,49,202Bull Creek
Connick Creek P 26Squaw CreekAlbee Creek A 144Mill Creek P 42North Fork Cuneo Creek P 43Panther Creek P 40Preacher Gulch P 45
Pollock Creek P {P} 47,53Mill Creek P A A 45,152,170Mowry Creek P 47Canoe CreekBridge Creek (=Bridges)Elk Creek P 97Salmon Creek P 45,144
Mill Creek P 42Bear Butte Creek (=Butte)Fish Creek P 26Anderson Creek p 144Dean Creek A 144Leggett Creek P 25Redwood Creek P P p{P} P 43,70,97,106,135,144,147
Seely CreekMiller Creek P 51China Creek {P} 51,52Dinner Creek {P} 53
Bear Canyon Creek P 25Sproul Creek (=Sprowel, Sprowl) {P} {P} P 52,53,147,314
Little Sproul Creek P 52Warden CreekWest Fork Sproul Creek P P P 47,136,314
East Branch West Fork Sproul Creek P P 47,314Cox Creek (location?) P 47
East Branch of South Fork Eel River

80
Modern presenceStream 1989 1990 1991 1992 1993 1994 1995 1996 1997 1998 1999 2000 References
Squaw CreekSchofield CreekDurphy CreekMilk Ranch Creek P 47Low Gap Creek P 23unnamed tributary (location?)unnamed tributary (location?)Indian Creek P P P P P p P 57,144
Jones Creek P 25Moody Creek P 47,144Sebbas Creek P 26,47,144Coulborn Creek P 26,144
Piercy Creek P P P p P P A 42,57Standley Creek P P 57,144McCoy CreekBear Pen Creek p 144
Cub CreekRed Mountain CreekWildcat Creek p 144
unnamed tributaryHollow Tree Creek P P{p} P{P} P{P} P{P} P{P} P{P} P{A} P P{P} P P 23,40,43,52,53,94,95,144,152,172,170
Mule Creek A A A A 152,170Middle Creek P A A A 45,144,151,152,170Walters Creek A A A A 152,170Redwood Creek P P P P P 43,152,170
South Fork Redwood Creek P P P P 148,149,150,152,170Bond Creek (=Bonds) P P P P P p 95,148,150,152,170,218Michaels Creek P P P P 148,149,150,152,170
unnamed trib to Michaels Creek P 139Doctors Creek A P P p 149,150,151,152,170
Waldron Creek A A A P A A A A 47,95,152,170Butler Creek P P P P P 144,148,149,150,170Huckleberry Creek P P P P P 144,148,149,150,170
Bear Wallow Creek P P{P} P{P} P{P} P 144,148,149,150,152,170Little Bear Wallow Creek P A P P 148,149,150,152,170
Bear Creek (location?) P 144Cedar Creek A 95Low Gap Creek P 23
Little Low Gap Creek

81
Modern presenceStream 1989 1990 1991 1992 1993 1994 1995 1996 1997 1998 1999 2000 References
Rattlesnake Creek P 47Cummings Creek
Ten Mile CreekGrub CreekStreeter Creek (=Streetcar)Big Rock Creek P 27Mud Springs CreekMill CreekCahto Creek A 95
Barnwell CreekFox Creek 45,144,150,152,170Elder Creekunnamed tributary (location?)unnamed tributary (location?)unnamed tributary (location?)Jack of Hearts Creek P P p 45,144,150,152,170Deer CreekLittle Charlie CreekDutch Charlie Creek P P P P P P P 57,144Redwood Creek P P P P P P 57,170Rock Creek P 45Kenny CreekHaun CreekTaylor CreekBear Creek
Poison Oak Creek P 26Newman CreekKapple Creek A P 51,144Thompson Creek P 51Jewett CreekKekawaka CreekNorth Fork Eel River
Bluff CreekMiddle Fork Eel River A A A A A A A A A A A 95,140,291
Salt Creek P 49Rattlesnake Creek [A] A 140,291North Fork Middle Fork Eel River (location?) [A] A 140,291
Morrison Camp Creek (=Morrison; location?) [A] 291Rock Creek (location?) [A] 291

82
Modern presenceStream 1989 1990 1991 1992 1993 1994 1995 1996 1997 1998 1999 2000 References
Elk Creek [A] 291Eden Creek [A] 291Sanhedrin Creek [A] 291
Thatcher Creek [A] 291Mill Creek
Grist Creekunnamed tributary
Williams Creek [A] 291Black Butte Creek [A] 291Spanish Creek (location?) [A] 291
Outlet Creek A [P] P 51,95,106Bloody Run Creek [P]Long Valley Creek [P] {P} 51Sherwood Creek
Rowes Creek A 95Ryan Creek P A{A} A{A} P{A} p{A} A{A} P{A} A{A} A{A} A{A} A{A} A 51,94,95
South Fork Ryan Creek P 150Reeves Canyon [P]Mill Creek A 95
Willits Creek A A A A 95Dutch Henry Creek
Broaddus Creek (=Brouddus) A p 95Baechtel Creek
Haehl CreekIndian CreekTomki Creek
Scott CreekRocktree Creek
String CreekTartar Creek (=Tarter)
Guthrie CreekBear River
Bonanza Gulch A 144South Fork Bear River
Hollister CreekMcNutt Gulch (=McNut)
Humboldt County

83
Modern presenceStream 1989 1990 1991 1992 1993 1994 1995 1996 1997 1998 1999 2000 ReferencesMattole River P {P} P{P} P{P} P{P} P{p} 106,140,195,202,208
Bear Creek {P} P P 140,163,202,208Stansberry CreekMill Creek P P P P P P P A P A{A} 195North Fork Mattole RiverMill Creek P P P P P P P A P A 208Clear CreekConklin CreekMcGinnis Creek {P} 202Indian CreekSquaw Creek A {A} 195Pritchard Creek (=Pritchett)Granny CreekSaunders CreekWoods CreekUpper North Fork Mattole River P 208
Oil Creek A A A A A 101,144Devils Creek
Rattlesnake Creek A A A A 144Honeydew Creek A A A A A A{A} 195,208
Bear Trap CreekDry CreekMiddle CreekWestlund Creek (=Westland) P A 208Gilham CreekFourmile Creek (=Four Mile)Sholes CreekHarrow CreekGrindstone CreekBear Creek {P} P A A{A} 208,215
South Fork Bear Creek {P} {P} P{P} P P{A} 165,166,208Mattole Canyon {P} 163Blue Slide Creek A A A 208Big Finley Creek P P P P 140,208Eubank Creek p 208Bridge Creek P {A} 140,195,208McKee Creek P {A} 195,215Mill CreekVanauken Creek (=Vanankin =VanArken) A A A 208

84
Modern presenceStream 1989 1990 1991 1992 1993 1994 1995 1996 1997 1998 1999 2000 References
Baker Creek P {p} {P} P{P} p A{p} 127,164,166,200,208,215,215Thompson Creek (=Thompsons) P P P{P} P{P} P P{A} 134,140,201,208,215
South Branch Thompson Creek (location?)Yew Creek P {P} P P P{P} P P{p} 140,163,166,201,208Danny Creek (=Dannys, location?) {P} {A} 166,195
Lost River P P P P A 140,208,215McNasty Creek (location?)Pipe Creek P {A} 140Pollock Creek (location?) P P 72
CENTRAL CALIFORNIA COAST ESU
Mendocino County
Whale GulchJackass CreekUsal Creek
South Fork Usal Creek P A A P A A A A 57,95Soldier Creek A A p A A A A 57
Cottaneva Creek (=Cottoneva Creek) P A A {A} P 152,171,170South Fork Cottaneva Creek P P P P 152,170
Slaughterhouse Gulch A A P p 152,170Middle Fork Cottaneva Creek P A P A 152,170North Fork Cottaneva Creek P A P A 152,170
Hardy Creek A A A A 152,170Juan Creek A A A A 152,170
Little Juan Creek A A A A 152,170Howard Creek A A A A A A p A{A} P 95,152,170DeHaven Creek A A A A A A A A A{A} A 57,95Wages Creek A A A A A A P* p p{A} P 57,93,95Abalobadiah Creek A A A A A A A 57Seaside Creek
Frazer CreekTen Mile River
South Fork Ten Mile River A A A A{P} P A A p A 57,95,153Smith Creek A A A p{p} P{p} P A A A 57,95,153,154
North Fork Smith Creek {A} 154unnamed tributary
Campbell Creek A P P p{P} P{A} p A p A 57,95

85
Modern presenceStream 1989 1990 1991 1992 1993 1994 1995 1996 1997 1998 1999 2000 References
Churchman Creek (=Churchmans) A A A{p} P P p p A 57Redwood Creek p A A A A A A A 57Gulch Eleven
Mill Creek A A A A A p A A 57North Fork Ten Mile River A A A A P A A p A 57,95
Little North Fork Ten Mile River A P A A{P} P p p p p 57,95,153Buckhorn Creek A A A A P A A A 57,95
Bald Hill Creek p A A A p A A A A 57,95Middle Fork Ten Mile River (=Clark Fork) A A A A A{P} p A A A A 57,95,153
Bear Haven Creek P p A A{P} p P A P p 57,95,153Little Bear Haven Creek A A A A A A A A A 57,95
Pudding Creek P p P P P p P P P P P{A} P 57,94,95Little Valley Creek P A 57
unnamed tributaryunnamed tributary
Noyo River A P P P {P} P 94,95,152,170Hayshed Gulch P P p p P 57unnamed tributaryunnamed tributarySouth Fork Noyo River {P} {P} {P} {P} {P} {P} {P} {P} {P} P{P} {P} P 93,107,108,109,110,321
Kass Creek P A P P P P P P 57North Fork South Fork Noyo River P P 93,107,321Peterson Gulch A 321Bear Gulch P 321Parlin Creek P 321
unnamed tributary p 321unnamed tributary P P 152Little North Fork Noyo River P P P P P P P{A} P 57,93,95,313Duffy Gulch p P p p P A A A 57North Fork Noyo River P A P p 152,170
Marble Gulch P A 152,170Hayworth Creek P A P A 152,170
North Fork Hayworth Creek A A P A 152,170Middle Fork North Fork Noyo River P A P A 152,170Dewarren Creek (=DeWarren) A A A 152
unnamed tributary P 152Olds Creek A A 152,170Redwood Creek P P P P A 95,152,170McMullen Creek A A 152

86
Modern presenceStream 1989 1990 1991 1992 1993 1994 1995 1996 1997 1998 1999 2000 ReferencesHare Creek P P P P 93,95
Covington GulchBunker GulchSouth Fork Hare Creek (location?)Walton Gulch Creek (location?)
Jug Handle Creek A 95Caspar Creek P P{p} P{P} P{p} P{P} P{P} P{P} P{P} P{P} P{P} P{P} P 93,95,153
North Fork Casper Creek {P} {p} 153,154South Fork Casper Creek {P} {p} 153,154Blue Gum Creek p 95
Doyle CreekRussian Gulch A 93Ryan Creek (location?)Big River A A A P p 152,170
Railroad Gulch p 95Little North Fork Big River P P P P P P P{A} P 57
East Branch Little North Fork Big RiverBerry Gulch P 95
North Fork Berry GulchTwo Log Creek p A P P P p P P 57,152,170Tramway Gulch A A A A 152,170North Fork Big River A A P {A} A 95,152,170
East Branch North Fork Big River A A P A 152,170Bull Pen Gulch (location?) P 152Chamberlain Creek {A} 93
Water GulchWest Chamberlain (location?)Arvola Gulch
James Creek A A 95North Fork James Creek
South Fork Big River A A P A 152,170Ramon Creek A P P A 152,170
North Fork Ramon Creek A P A A 152,170Daugherty Creek (=Dougherty) A A P A 152,170
Gates Creek A A A A A A P A 95,152,169,170Johnson Creek A A A A 152,170
Little River P P{A} P{P} p{p} P{A} P{p} P{P} P{A} P{A} P{p} P{P} P 93,95Buckhorn Creek A 170
unnamed trib A 170

87
Modern presenceStream 1989 1990 1991 1992 1993 1994 1995 1996 1997 1998 1999 2000 ReferencesAlbion River P P P P P P P P P P 95,152,169,170
Deadman Gulch A P 152,170Railroad Gulch P P A A P P P P P P 152,169,170
Pleasant Valley Creek A P A p 152,170Duckpond Gulch P p 152,170South Fork Albion River P A P P P P P P P P 95,152,169,170
Little North Fork South Fork Albion River A A P p 152,170Bull Team Gulch
Railroad Gulch (=East Railroad Gulch) P P 152,170Tom Bell Creek P P A 152,170North Fork Albion River P P P p 95,152,170
Soda SpringsMarsh Creek (=March)
unnamed tributary P p 152,170unnamed tributary (=Slaughterhouse gulch) P A 152,170
Little Salmon Creekunnamed tributary
Big Salmon Creek P P P P P P P P 57Donnelly Creek P p P P P p p P 57Hazel Gulch P p P P P P P A 57
West Branch Hazel GulchNavarro River A A A A 152,170
Marsh Gulch A A P p 152,170Murray Gulch A P A A 152,170North Fork Navarro River p p P P p 95,152,170
Dead Horse Gulch A A A p 152,170Tramway Gulch A A A A 152,170Flynn Creek A P P P 152,170
Camp 16 Gulch A A P A 152,170Tank 4 Gulch (=Tank Ford) A P P A 152,170
North Fork Flynn Creek (location?)North Branch North Fork Navarro River P P P p 95,152,170
Cook Creek A P P A 95,152,170John Smith Creek P P P p 95,152,170Little North Fork Navarro River A A P p 95,152,170
South Branch North Fork Navarro River A P A P A 95,152,170Bridge Creek A A 152,170
Mill CreekIndian Creek
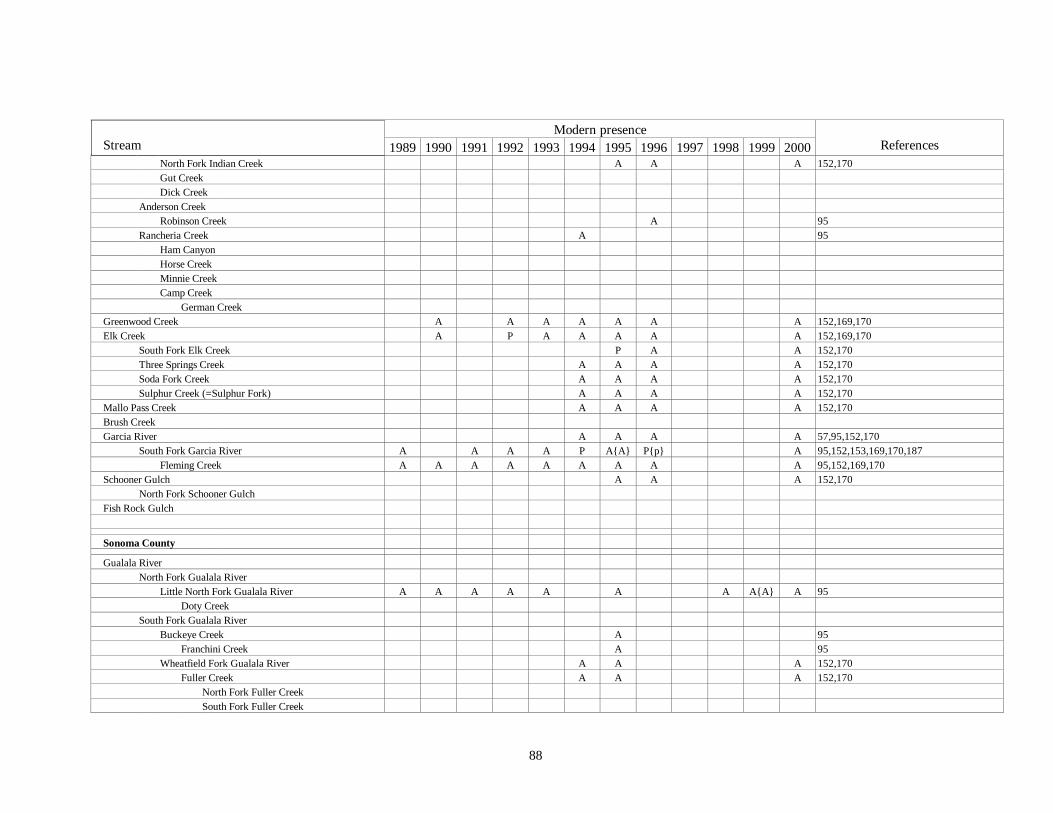
88
Modern presenceStream 1989 1990 1991 1992 1993 1994 1995 1996 1997 1998 1999 2000 References
North Fork Indian Creek A A A 152,170Gut CreekDick Creek
Anderson CreekRobinson Creek A 95
Rancheria Creek A 95Ham CanyonHorse CreekMinnie CreekCamp Creek
German CreekGreenwood Creek A A A A A A A 152,169,170Elk Creek A P A A A A A 152,169,170
South Fork Elk Creek P A A 152,170Three Springs Creek A A A A 152,170Soda Fork Creek A A A A 152,170Sulphur Creek (=Sulphur Fork) A A A A 152,170
Mallo Pass Creek A A A A 152,170Brush CreekGarcia River A A A A 57,95,152,170
South Fork Garcia River A A A A P A{A} P{p} A 95,152,153,169,170,187Fleming Creek A A A A A A A A A 95,152,169,170
Schooner Gulch A A A 152,170North Fork Schooner Gulch
Fish Rock Gulch
Sonoma County
Gualala RiverNorth Fork Gualala River
Little North Fork Gualala River A A A A A A A A{A} A 95Doty Creek
South Fork Gualala RiverBuckeye Creek A 95
Franchini Creek A 95Wheatfield Fork Gualala River A A A 152,170
Fuller Creek A A A 152,170North Fork Fuller CreekSouth Fork Fuller Creek

89
Modern presenceStream 1989 1990 1991 1992 1993 1994 1995 1996 1997 1998 1999 2000 References
Haupt Creek A A A 152,170House Creek
Marshall CreekSproule Creek
Fort Ross CreekRussian Gulch
Middle Branch Russian GulchEast Branch Russian Gulch
Russian RiverJenner Gulch A 65Willow Creek P A A A A p A A A 65,152,169,170Sheephouse Creek p A 65
unnamed tributaryFreezeout Creek A p A A 65,152,170Austin Creek A 65
Kohute GulchKidd CreekEast Austin Creek A 65
Gilliam Creek A 65Gray Creek A 65
Ward Creek pRed Slide Creek
Dutch Bill Creek A 65Hulbert Creek A 65
Mission Creek A 65Green Valley Creek p p P P P p 65,76,174,175
Purrington Creek p 65unnamed tributary
Mark West Creek p p p A A A 65,76,175Laguna de Santa Rosa p 174
Santa Rosa Creek (location?) p p A 174,175unnamed tributary (=Griffen Creek; location?) p 65Mark Slide Creek (location?)Dry Creek
Mill Creek P A 65Felta CreekWallace Creek A 65Palmer Creek A A 65
Pena Creek A 65

90
Modern presenceStream 1989 1990 1991 1992 1993 1994 1995 1996 1997 1998 1999 2000 References
Warm Springs CreekMaacama Creek P p p{P} A A A 65,77,174,175
Redwood Creek P p A A A A 65,77,175East Fork Russian RiverYork CreekForsythe Creek A 65
Seward Creek A 65Eldridge Creek A 65Jack Smith Creek A A A A 65,152,170
Mill Creek A 65Salt Hollow CreekRocky CreekMariposa CreekFisher CreekCorral Creek
Scotty CreekSalmon Creek
Finley CreekColeman Valley CreekFay CreekTannery Creek
Valley Ford Creek
Coastal Marin County
Walker Creek ASalmon Creek AArroyo Sausal Creek
Lagunitas Creek P p P P{P} P{P} P{P} P{P} P{P} P{P} 5,231,238,239Haggerty Gulch CreekOlema Creek {P} {P} {P} P{P} P{P} P{P} {P} 5,232
Quarry Gulch {p} P P 17,18,232Giacomini Creek {p} P p 17,18,232
Nicasio CreekDevils Gulch Creek P P P P{P} P{P} P{P} P{P} P{P} P{P} 5,238,239San Geronimo Creek P{P} P P P{P} P{P} P{P} P{P} P{P} P{P} 5,238,239
Bolinas LagoonPine Gulch Creek P A A 17,18,232
Redwood Creek P P P P{P} P{P} P{P} P{P} P 80,229

91
Modern presenceStream 1989 1990 1991 1992 1993 1994 1995 1996 1997 1998 1999 2000 References
Unnamed tributary (=Kent Creek) {p} {P} 17,18,232Unnamed tributary (=Fern Creek) {P} {A} 17,18,232
San Francisco Bay
Alameda CreekSan Pablo CreekWalnut CreekCorte Madera Creek A 184
San Anselmo CreekMill Valley Creek
San Mateo County
San Gregorio Creek A 185Pescadero Creek A A A A A 185
Peters Creek A A A p A 185Butano Creek A 185Gazos Creek A P P P A P P A 228
Santa Cruz County
Waddell Creek P P A P P A P P A 228East Branch Waddell CreekHenry Creek
Scott Creek P P P P P P P P P 228Big Creek A 185
San Vicente Creek p A A P A 185San Loreonzo River A A A A A A A 3
Hare CreekSoquel CreekAptos Creek P A A A A 185
Monterey County
Carmel River A 1Big Sur River A 1

92

93
REFERENCES
1. Adams, P.B. 2001. Personal communication. National Marine Fisheries Service, SouthwestFisheries Science Center, Santa Cruz Laboratory, Santa Cruz, California 95060.
2. Albro, P. 2001. Personal communication. Stimson Lumber Company.
3. Alley, D. 2001. Personal communication. D.W. Alley & Associates.
4. Anderson, D. 1999. Unpublished data. Redwood National and State Parks tributary juvenile fishdistribution. Redwood National and State Park.
5. Andrew, G. 2001. Unpublished data. Marin Municiple Water District .
6. Atkinson, C.J., J. Rose, and T. Duncan. 1967. Pacific salmon in the United States. Salmon of theNorth Pacific Ocean-Part IV. Spawning populations of North Pacific salmon. InternationalNorth Pacific Fisheries Commission Bulletin 23:43-223.
7. Bailey, E.D. and J.B. Kimsey. 1952. (cited in Brown and Moyle 1991).
8. Baker, P. 1991. Personal communication. California Department of Fish and Game. Based onentry in Preserve Design Diversity Database. University of California, Davis (cited in Brownand Moyle 1991).
9. Baker, P. and F. Reynolds. 1986. Life history, habitat requirements,and status of coho salmon inCalifornia. California Department of Fish and Game, Report to the California Fish and GameCommission, September 1986.
10. Barnhart, R. 1988. Personal communication. U.S. Fish and Wildlife Service, Arcata, California(cited in Hassler et al. 1991).
11. Berger, J. 1982. Anadromous salmonid genetic reources: an assessment and plan for California.California Gene Resources Program. National Council of Gene Resources, Berkeley,California.
12. Boberg, J. and C. Kenyon. 1979. Stream Inventory: Del Norte County. California Department ofFish and Game.
13. Boberg, J. and C. Kenyon. 1979. Stream inventory: Humboldt County. California Department ofFish and Game.
14. Boberg, J. and C. Kenyon. 1979. Stream inventory: Siskiyou County. California Department ofFish and Game.
15. Boberg, J. and C. Kenyon. 1979. Stream inventory: Trinity County. California Department ofFish and Game.

94
16. Boberg, J. and J.S. Thornburgh. 1996. Unpublished data. Multi-year population assessment ofanadromous salmonid populations in Horse Linto Creek, California. Six Rivers NationalForest.
17. Brown, G.G., K.N. Kundargi, D.J. Manning, and R.W. Smith. 1998. Coho and steelheadrestoration project, annual Section 10 permit data report June 30, 1997-July 1, 1998. NationalPark Service, Golden Gate National Recreation Area.
18. Brown, G.G., K.N. Kundargi, D.J. Manning, and R.W. Smith. 1999. Coho and steelheadrestoration project, annual Section 10 permit data report June 30, 1998 - July 1, 1999. NationalPark Service, Golden Gate National Recreation Area.
19. Brown, L.R. and P.B. Moyle. 1991. Status of coho salmon in California. Report to the NationalMarine Fisheries Service. Department of Wildlife and Fisheries Biology, University ofCalifornia, Davis, Davis, California 95616.
20. Brownell, N. 1999. Unpublished data (cited in Kier Associates 1999).
21. Buck, M.K. 1986. Evaluation of artificial salmonid spawning riffles, Trinity River, California.M.S. Thesis. Humboldt State University, Arcata, California.
22. Burns, J.W. 1971. The carrying capacity for juvenile salmonids in some northern Californiastreams. California Fish and Game 57:44-57.
23. Byrne, M. 1990. Unpublished data. California Department of Fish and Game (cited in KierAssociates 1999).
24. Byrne, M. 1991. Unpublished data. California Department of Fish and Game (cited in KierAssociates 1999).
25. Byrne, M. 1992. Unpublished data. California Department of Fish and Game (cited in KierAssociates 1999).
26. Byrne, M. 1993. Unpublished data. California Department of Fish and Game (cited in KierAssociates 1999).
27. Byrne, M. 1994. Unpublished data. California Department of Fish and Game (cited in KierAssociates 1999).
28. California Cooperative Fishery Research Unit. 1989. Unit files. California Cooperative FisheryResearch Unit, Humboldt State University, Arcata, California 95521 (cited in Hassler et al.1991).
29. California Cooperative Fishery Research Unit. 2000. Survival of coho salmon in northernCalifornia streams of varying habitat quality. California Cooperative Fishery Research Unit,Humboldt State University, Arcata, California 95521.
30. California Department of Fish and Game. 19?? Files. Eureka, California (cited in Hassler et al.1991).

95
31. California Department of Fish and Game. 1954. Unpublished data. Yreka Office (cited in KierAssociates 1999).
32. California Department of Fish and Game. 1955. Unpublished data. Yreka Office (cited in KierAssociates 1999).
33. California Department of Fish and Game. 1957. Unpublished data. Yreka Office (cited in KierAssociates 1999).
34. California Department of Fish and Game. 1958. Unpublished data. Yreka Office (cited in KierAssociates 1999).
35. California Department of Fish and Game. 1966. Unpublished data. Stream survey records(available through KRIS Coho Project).
36. California Department of Fish and Game. 1967. Unpublished data. Stream surveys records(available through KRIS Coho Project).
37. California Department of Fish and Game. 1982. Unpublished data. Yreka Office (cited in KierAssociates 1999).
38. California Department of Fish and Game. 1983. Office memorandum. California Department ofFish and Game, Eureka, California (cited in Hassler et al. 1991).
39. California Department of Fish and Game. 1986. Hatchery records. Iron Gate Hatchery,Hornbrook, California (cited in Hassler et al. 1991).
40. California Department of Fish and Game. 1988. Unpublished data (cited in Ellis 1997).
41. California Department of Fish and Game. 1989. Off-hatchery site releases. Iron Gate Hatchery,Hornbrook, California (cited in Hassler et al. 1991).
42. California Department of Fish and Game. 1990. Unpublished data (cited in Ellis 1997).
43. California Department of Fish and Game. 1991. Unpublished data (cited in Ellis 1997).
44. California Department of Fish and Game. 1991. Unpublished data. Yreka Office (cited in KierAssociates 1999).
45. California Department of Fish and Game. Unpublished data (cited in Ellis 1997).
46. California Department of Fish and Game. 1992. Unpublished data. Yreka Office (cited in KierAssociates 1999).
47. California Department of Fish and Game. 1993. Unpublished data (cited in Ellis 1997).
48. California Department of Fish and Game. 1993. Unpublished data. Yreka Office (cited in KierAssociates 1999).
49. California Department of Fish and Game. Unpublished data (cited in Ellis 1997).

96
50. California Department of Fish and Game. 1994. Unpublished data. Yreka Office (cited in KierAssociates 1999).
51. California Department of Fish and Game. Unpublished data (cited in Ellis 1997).
52. California Department of Fish and Game. 1996. Unpublished data (cited in Ellis 1997).
53. California Department of Fish and Game. 1997. Unpublished data (cited in Ellis 1997).
54. California Department of Fish and Game. 1999. Iron Gate Hatchery Release. Data fromStreamNet 2001.
55. California Department of Fish and Game. 1999. Shasta River counts. Data from StreamNet 2001.
56. California Department of Parks and Recreation. 1990. Office records. Department of Parks andRecreation, Sacramento, California (cited in Brown and Moyle 1991).
57. Campbell Timberland Management Company. 2001. Unpublished data.
58. Carlson, M. 2001. Unpublished data. Hoopa Valley Tribal Fisheries.
59. CH2M Hill. 1985. Klamath River Basin Fisheries Resources Plan. U.S. Department of theInterior (cited in Hassler et al. 1991).
60. Cherr and Griffin. 1979. Stream inventory: Marin County. California Department of Fish andGame.
61. Cherr and Griffin. 1979. Stream Inventory: Mendocino County. California Department of Fishand Game.
62. Cherr and Griffin. 1979. Stream inventory: San Mateo County. California Department of Fish andGame.
63. Cherr and Griffin. 1979. Stream inventory: Santa Cruz County. California Department of Fishand Game.
64. Cherr and Griffin. 1979. Stream inventory: Sonoma County. California Department of Fish andGame.
65. Coey, R. 2001. Unpublished data. California Department of Fish and Game.
66. Coots, M. 1957. Shasta River, Siskiyou county, 1955 king salmon count, and some notes on the1956 run. California Department of Fish and Game, Inland Fisheries, Administrative Report57-5.
67. Coots, M. 1958. Shasta River salmon count, 1957. California Department of Fish and Game,Inland Fisheries, Administrative Report 58-4 (cited in Brown and Moyle 1991).
68. Cox, B. 1986. Personal communication. California Department of Fish and Game, Sebastopol,California (cited in Hassler et al. 1991).

97
69. Downie, S. 1991. Unpublished data. Results of downstream migrant trapping on streams of theSouth Fork Eel River 1986-1988. Pacific Coast Federation of Fisherman's Assocations, Inc.Eel River Salmon Restoration Project (cited in Brown and Moyle 1991).
70. Eel River Salmon Restoration Project. 1999. Cooperative fish rearing program. Final Report.Contract Number FG 8020 IF. Eel River Salmon Restoration Project, P.O. Box 589, Miranda,California, 95553.
71. Ellingwood, J. 1988. Personal communication. Humboldt Fish Action Council, Eureka,California (cited in Hassler et al. 1991).
72. Ellis, R.H. 1997. The proposed listing of coho salmon as threatened in the SouthernOregon/Northern California Evolutionarily Significant Unit. Comments to National MarineFisheries Service. California Forestry Association and California Forest Resources Council,Sacramento, California.
73. Emig, J.W. 1984. Fish population survey, Walker Creek, Marin County, 1981. State of California,The Resources Agency, Department of Fish and Game, Anadromous Fisheries Branch,Administrative Report 84-02.
74. Emig, J.W. 1985. Fish population survey, Lagunitas Creek Drainage, Marin County, 1982. Stateof California, The Resources Agency, Department of Fish and Game, Anadromous FisheriesBranch, Administrative Report 85-05.
75. Farro, M. 1990. Personal communication. Trinidad Fisherman Marketing Association, Trinidad,California (cited in Hassler et al. 1991).
76. Fawcett, M.H. 1997. Unpublished data. California Department of Fish and Game (cited in Adamset al. 1999).
77. Fawcett, M.H. 1997. Unpublished data. Seine data. Chanslor Wetlands, 2660 Coast Highway 1,P.O. Box 1510, Bodega Bay, California 94923.
78. Flosi, G. 1988. Personal communication. California Department of Fish and Game, Weott,California (cited in Hassler et al. 1991).
79. Flosi, G. 1991. Unpublished data. Results of carcass count surveys in the Eel River drainage1987-1990. California Department of Fish and Game (cited in Brown and Moyle 1991).
80. Fong, D. 1997. Draft 1996 outmigrant trapping program, Redwood Creek, Marin County,Callifornia. Golden Gate National Recreation Area.
81. Fox, S. 1992. Unpublished data. U.S.D.A. Forest Service, Klamath National Forest (cited in KierAssociates 1999).
82. Fruit Growers Supply Company. 1989. Unpublished data (cited in Ellis 1997).
83. Fruit Growers Supply Company. 1990. Unpublished data (cited in Ellis 1997).
84. Fruit Growers Supply Company. 1991. Unpublished data (cited in Ellis 1997).
85. Fruit Growers Supply Company. 1992. Unpublished data (cited in Ellis 1997).

98
86. Fruit Growers Supply Company. 1993. Unpublished data (cited in Ellis 1997).
87. Fruit Growers Supply Company. 1997. Unpublished data (cited in Ellis 1997).
88. Fry, D.H.Jr. 1936. Life history of Hesperoleucus venustus Snyder. California Fish and Game22:65-98.
89. Gibbs, E.D. and J.B. Kimsey. 1955. The 1951 creel census on the boat fishery of the KlamathRiver estuary, Del Norte County. California Department of Fish and Game, Inland Fisheries,Administrative Report 55-16.
90. Giddings, A. 1959. Record silver salmon taken in Papermill Creek, Marin County. California Fishand Game 45:353.
91. Grumbaum, J. 1998. U.S.D.A. Forest Service, Klamath National Forest, Happy Camp RangerDistrict.
92. Hallock, R.J., G.H. Warner, and D.H.J. Fry. 1952. California's part in a three-state salmonfingerling marking program. California Fish and Game 38:301-332.
93. Harris, S. 2000. Inland and anadromous sport fish management and research. Annualperformance report, Federal Aid in Sport Fish Restoration Act. Project 22, North CentralDistrict Salmon and Steelhead Management. Job number 2, downstream (out) migration ofjuvenile salmon and steelhead. July 1, 1999 through June 30, 2000.
94. Harris, S. 2000. Inland and anadromous sport fish management and research. Annualperformance report, Federal Aid in Sport Fish Restoration Act. Project 22, North CentralDistrict Salmon and Steelhead Management. Job number 3, salmon spawning stockinventory. July 1, 1999 through June 30, 2000.
95. Harris, S. 2001. Unpublished data. California Department of Fish and Game.
96. Hart, M. 1988. Personal communication. Humboldt State University Fisheries Department,Arcata, California.
97. Harvey, B. 2001. Personal communication. U.S.D.A. Forest Service, Redwood SciencesLaboratory, Arcata, California.
98. Hassler, T.H., W.L. Somer, and G.R. Stern. 1986. Impacts of suction dredge mining onanadromous fish, invertebrates, and habitat in Canyon Creek, California. CaliforniaCooperative Fishery Research Unit, Humboldt State University, Arcata, California (cited inHassler et al. 1991).
99. Hofstra, T. 1988. Personal communication. Redwood National Park, Arcata, California (cited inHassler et al. 1991).
100. Holden, B. 2000. Unpublished data. Fish distribution survey report. Fish and Wildlife Branch,Division of Resource Management and Science, Redwood National and State Parks.

99
101. Hopelain, J.S., G. Flosi, and S. Downie. 1997. Stream monitoring progress report for five smallstreams in northwestern California, Lawrence, Shaw, Oil, Rattlesnake, and Green RidgeCreeks 1991 through 1995. California Department of Fish and Game, Inland Fisheries,Administrative Report 97-6.
102. Hopkirk, J. 1984. Unpublished data (cited in Leidy 1984).
103. Hull, D. 1987. Salmon restoration in Humboldt Bay: a model of citizen and governmentparticipation. Coastal Zone 87:1821-1835.
104. Johansen, R.R. 1975. San Lorenzo River (Santa Cruz County) winter steelhead and salmonfishery 1971-1972 and 1972-1973 seasons. State of California, The Resources Agency,Department of Fish and Game, Anadromous Fisheries Branch, Administrative Report 75-61975.
105. Jones, W. 1988. Personal communication. California Department of Fish and Game, Ukiah,California (cited in Hassler et al. 1991).
106. Jones, W.E. 1991. Juvenile salmon and steelhead standing crop Mendocino County. Draft Report.California Department of Fish and Game, Ukiah, California.
107. Jones, W. 1998. Downstream migrant trapping results, South Fork Noyo River, MendocinoCounty, summary report of 1998 operations. Prepared for U.S. Department of Commerce,NOAA National Marine Fisheries Service, Southwest Fisheries Science Center .
108. Jones, W. 1998. South Fork Noyo River coho salmon egg collecting station. A summary report of1997-1998 operations. Prepared for U.S. Department of Commerce, NOAA National MarineFisheries Service, Southwest Fisheries Science Center.
109. Jones, W. 1999. Soth Fork Noyo River coho salmon egg collecting station summary report of1998-1999 operations. Prepared for U.S. Department of Commerce, NOAA National MarineFisheries Service, Southwest Fisheries Science Center.
110. Jones, W. 2000. South Fork Noyo River coho salmon egg collecting station. A summary report of1999-2000 operations. Prepared for U.S. Department of Commerce, NOAA National MarineFisheries Service, Southwest Fisheries Science Center.
111. Jong, B. 1998. 1998 field sampling, Beaver Creek (Siskiyou County). North Coast CaliforniaAnadromous Salmonid Project, California Department of Fish and Game.
112. Jong, B. 1998. 1998 field sampling, Big French Creek (Trinity County). North Coast CaliforniaAnadromous Salmonid Project, California Department of Fish and Game.
113. Jong, B. 1998. 1998 field sampling, Broken Kettle Creek (Del Norte County). North CoastCalifornia Anadromous Salmonid Project, California Department of Fish and Game.
114. Jong, B. 1998. 1998 field sampling, Copper Creek (Del Norte County). North Coast CaliforniaAnadromous Salmonid Project, California Department of Fish and Game.
115. Jong, B. 1998. 1998 field sampling, Dunn Creek (Del Norte County). North Coast CaliforniaAnadromous Salmonid Project, California Department of Fish and Game.

100
116. Jong, B. 1998. 1998 field sampling, Elk Creek (Del Norte County). North Coast CaliforniaAnadromous Salmonid Project, California Department of Fish and Game.
117. Jong, B. 1998. 1998 field sampling, Horse Creek (Siskyou County). North Coast CaliforniaAnadromous Salmonid Project, California Department of Fish and Game.
118. Jong, B. 1998. 1998 field sampling, Horse Linto Creek (Humboldt County). North CoastCalifornia Anadromous Salmonid Project, California Department of Fish and Game.
119. Jong, B. 1998. 1998 field sampling, Indian Creek (Trinity County). North Coast CaliforniaAnadromous Salmonid Project, California Department of Fish and Game.
120. Jong, B. 1998. 1998 field sampling, Jones Creek (Del Norte County). North Coast CaliforniaAnadromous Salmonid Project, California Department of Fish and Game.
121. Jong, B. 1998. 1998 field sampling, Madden Creek (Humboldt County). North Coast CaliforniaAnadromous Salmonid Project, California Department of Fish and Game.
122. Jong, B. 1998. 1998 field sampling, North Fork Dunn Creek (Del Norte County). North CoastCalifornia Anadromous Salmonid Project, California Department of Fish and Game.
123. Jong, B. 1998. 1998 field sampling, Seiad Creek (Siskyou County). North Coast CaliforniaAnadromous Salmonid Project, California Department of Fish and Game.
124. Jong, B. 1998. 1998 field sampling, Sharber Creek (Trinity County). North Coast CaliforniaAnadromous Salmonid Project, California Department of Fish and Game.
125. Jong, B. 1998. 1998 field sampling, Shelly Creek (Del Norte County). North Coast CaliforniaAnadromous Salmonid Project, California Department of Fish and Game.
126. Jong, B. 1998. 1998 field sampling, South Fork Broken Kettle Creek (Del Norte County). NorthCoast California Anadromous Salmonid Project, California Department of Fish and Game.
127. Jong, B. 2000. 1999 field sampling, Baker Creek (Mattole River Basin), Humboldt County. NorthCoast California Anadromous Salmonid Project, California Department of Fish and Game.
128. Jong, B. 2000. 1999 field sampling, Humbug Creek (Siskiyou County). North Coast CaliforniaAnadromous Salmonid Project, California Department of Fish and Game.
129. Jong, B. 2000. 1999 field sampling, North Fork Dunn Creek (Del Norte County). North CoastAnadromous Salmonid Project, California Department of Fish and Game.
130. Jong, B. 2000. 1999 field sampling, Seiad Creek (Siskiyou County). North Coast CaliforniaAnadromous Salmonid Project, California Department of Fish and Game.
131. Jong, B. 2000. 1999 field sampling, Sharber-Peckham Creek (Trinity County). North CoastCalifornia Anadromous Salmonid Project, California Department of Fish and Game.
132. Jong, B. 2000. 1999 field sampling, Shelly Creek (Del Norte County). North Coast CaliforniaAnadromous Salmonid Project, California Department of Fish and Game.

101
133. Jong, B. 2000. 1999 field sampling, South Fork Broken Kettle Creek (Del Norte County). NorthCoast California Anadromous Salmonid Project, California Department of Fish and Game.
134. Jong, B. 2000. 1999 field sampling, Thompson Creek (Humboldt County). North CoastCalifornia Anadromous Salmonid Project, California Department of Fish and Game.
135. Jong, B. 2000. 1999 field sampling, Upper Redwood Creek (Pollock Creek), Humboldt County.North Coast California Anadromous Salmonid Project, California Department of Fish andGame.
136. Jong, B. 2000. 1999 field sampling, West Fork Sproul Creek (Humboldt County). North CoastCalifronia Anadromous Salmonid Project, California Department of Fish and Game.
137. Jong, B. 2000. 1999 juvenile coho salmon presence/absence surveys (Del Norte and TrinityCounties). North Coast California Anadromous Salmonid Project, California Department ofFish and Game.
138. Jong, W.H. and T. Mills. 1992. 1984-89 adults (cited in Kier Associates 1999).
139. Kelley, D.W. 1976. The possibility of restoring salmon and steelhead runs in Walker Creek,Marin County. Prepared for the Marin Municipal Water District.
140. Kier Associates. 1999. Historical and current presence and absence of coho salmon,Oncorhynchus kisutch, in the northern California portion of the southern Oregon-northernCalifornia Evolutionary Significant Unit. Prepared for the U.S. Department of Commerce,NOAA National Marine Fisheries Service, Southwest Fisheries Science Center, Service Order40-ABNF-7-01479.
141. Kilgore, J. 1998. Unpublished data. U.S.D.A. Forest Service, Klamath National Forest, SalmonRiver District.
142. Kimsey, J.B. 1952. Fish rescue and stream improvement work in the North Coast area in 1951.California Department of Fish and Game, Bureau of Fish Conservation Administrative Report.
143. Kimsey, J.B. 1953. Fish rescue and stream improvement work in the North Coast in 1952.California Department of Fish and Game, Anadromous Fisheries Branch, AdministrativeReport 53-9.
144. KRIS Coho Project. 1999. KRIS Coho Project, P.O. Box 11170, Eugene, Oregon, 97440-3370.
145. Leidy, R.A. 1983. Distribution of fishes in streams of the Walnut Creek basin, California.California Fish and Game 69:23-32.
146. Leidy, R.A. 1984. Distribution and ecology of stream fishes in the San Francisco Bay drainage.Hilgardia 52:1-175.
147. Leos, R. and T. Mills. 1983. Eel River juvenile salmon trapping program, 1983. In, Status reportof California wild and scenic rivers salmon and steelhead fisheries. State of CaliforniaResources Agency, California Department of Fish and Game.
148. Louisiana Pacific. 1994. Unpublished data (cited in Ellis 1997).

102
149. Louisiana Pacific. Unpublished data (cited in Ellis 1997).
150. Louisiana Pacific. 1996. Unpublished data (cited in Ellis 1997).
151. Louisiana Pacific. 1997. Unpublished data (cited in Ellis 1997).
152. Louisiana Pacific Corporation. 1996. Unpublished data. Fish distribution for watersheds inLouisiana Pacific's Coastal Mendocino/Sonoma Management Unit, 1994-1996.
153. Maahs, M. 1996. A spawning and habitat evaluation for portions of the Ten Mile River, CasparCreek and Garcia River 1995-96. Prepared by Michael Maahs with the Salmon TrollersMarketing Association, Inc., P.O. Box 137, Fort Bragg, California 95437 for HumboldtCounty Resource Conservation District.
154. Maahs, M. 1997. The 1996-97 salmonid spawning survey for portions of the Ten Mile River,Garcia River and Caspar Creek. Prepared by Salmon Trollers Marketing Association, Inc, P.O.Box 137, Fort Bragg, CA 95437. Prepared for Humboldt County Resource ConservationDistrict.
155. Maria, D. 1954. Unpublished data. California Department of Fish and Game, Yreka Office (citedin Kier Associates).
156. Maria, D. 1959. Unpublished data. California Department of Fish and Game, Yreka Office (citedin Kier Associates).
157. Maria, D. 1989. Unpublished data. California Department of Fish and Game. Based on entry inPreserve Design Diversity Database. University of California, Davis (cited in Brown andMoyle 1991).
158. Maria, D. 1993. Unpublished data. California Department of Fish and Game, Yreka Office (citedin Kier Associates 1999).
159. Maria, D. 1994. Unpublished data. California Department of Fish and Game, Yreka Office (citedin Kier Associates 1999).
160. Maria, D. 1995. Unpublished data. California Department of Fish and Game, Yreka Office (citedin Kier Associates 1999).
161. Maria, D. 1996. Unpublished data. California Department of Fish and Game, Yreka Office (citedin Kier Associates 1999).
162. Maria, D. 1997. Unpublished data. California Department of Fish and Game, Yreka Office (citedin Kier Associates 1999).
163. Mattole Salmon Group. 1995. Unpublished data (cited in Kier Associates 1999).
164. Mattole Salmon Group. 1996. Unpublished data (cited in Kier Associates 1999).
165. Mattole Salmon Group. 1997. Unpublished data (cited in Kier Associates 1999).
166. Mattole Salmon Group. 1998. Unpublished data (cited in Kier Associates 1999).

103
167. McCanne, D. 2001. Unpublished data. Forest Science Project, Humboldt State University.
168. McCleod, D. 1994. Unpublished data. California Department of Fish and Game (cited in KierAssociates 1999).
169. Mendocino Redwood Company. 1999. Summary of fish index site monitoring in watershedswithin Mendocino Redwood Company's ownership in Mendocino and Sonoma Counties:1987-1996. Fort Bragg, California.
170. Mendocino Redwood Company. 2000. Fish Distribution for watersheds in Mendocino RedwoodCompany forest lands, 2000. Mendocino County, California.
171. Mendocino Redwood Company. 2000. Outmigrant trapping on Cottaneva Creek. Draft.Mendocino County, California.
172. Mendocino Redwood Company. 2000. Outmigrant trapping on Hollow Tree Creek. Draft.Mendocino County, California.
173. Meriwether, F.I. 1997. Unpublished data. Fruit Growers Supply Company 1997 snorkel survey.Fruit Growers Supply Company.
174. Merrit Smith Consulting. 1995. Unpublished data. Merritt Smith Consulting, EnvironmentalScience and Communication, 3675 Mt. Diablo Blvd., Number 120, Lafayette, California94549.
175. Merritt Smith Consulting. 1996. Anadromous fish migration study program 1991-1995. SantaRosa subregional long-term wasterwater project. Prepared for City of Santa Rosa and U.S.Corps of Engineers. Merritt Smith Consulting, Environmental Science and Communication,3675 Mt. Diablo Blvd., Number 120, Lafayette, California 94549.
176. Miller, E. 1985. Unpublished data. U.S.D.A. Forest Service, Klamath National Forest (cited inKier Associates 1999).
177. Miller, E. 1992. Unpublished data. U.S.D.A. Forest Service, Klamath National Forest (cited inKier Associates 1999).
178. Mills, T. 1983. Appendix H, Utilization of Eel River tributary streams by anadromous salmonids.In, F.L. Reynolds, editor. Status report of California wild and scenic river salmon andsteelhead fisheries. California Department of Fish and Game.
179. Moreau, J. 1988. Personal communication. Six Rivers National Forest. Gasquet, Califoria (citedin Hassler et al. 1991).
180. Moyle, P.B. 1991. Personal observation. University of California, Davis (cited in Brown andMoyle 1991).
181. Moyle, P.B. 1991. Unpublished data and California Fish and Diversity Database. University ofCalifornia, Davis, California (cited in Brown and Moyle 1991).

104
182. Murphy, G. 1950. Returns from marked fall spawning rainbow trout planted in severalMendocino County coastal streams in 1948. Unpublished report to the Bureau of FishConservation, California, California Department of Fish and Game (Brown and Moyle 1991).
183. Murphy, G.I. and J.W.Jr. De Witt. 1951. Notes on the fishes and fishery of the lower Eel River,Humboldt County, California. Unpublished report to Bureau of Fish Conservation, CaliforniaDepartment of Fish and Game.
184. Nelson, J. 1996. Unpublished electrofishing records. California Department of Fish and Game, 20Lower Ragsdale Drive, Suite 100, Monterey, California 93940.
185. Nelson, J. 2001. Personal communication. California Department of Fish and Game.
186. Nielsen, J.L., M. Maahs, and G. Balding. 1991. Anadromous salmonid resources of Mendocinocoastal and inland rivers 1989-1990: An evaluation of rehabilitation efforts based on carcassrecovery and spawning activity. Funded by the California Department of Fish and Game,Fisheries Division, Fisheries Restoration Program, Work Progesss Report 1990, Contract No.FG9364.
187. North Coast Regional Water Quality Control Board. 1997. Assessment of aquatic conditions inthe Garcia River watershed. Appendix 1-20.
188. Norton, K. 1999. Unpublished data. Hoopa Valley Tribal Fisheries (cited in Kier Associates1999).
189. Oliver, G. 2001. Unpublished data. Scotia Pacific Company.
190. Pacific Fishery Management Council. 1990. Review of 1989 ocean salmon fisheries. PacificFishery Management Council. Portland, Oregon.
191. Pacific Lumber Company. 1988. Unpublished data (cited in Ellis 1997).
192. Pacific Lumber Company. 1993. Unpublished data (cited in Ellis 1997).
193. Pacific Lumber Company. 1994. Unpublished data, 1988-1994 (cited in Ellis 1997).
194. Pacific Lumber Company. Unpublished data (cited in Ellis 1997).
195. Peterson, G. 2001. Progress report: spawning gravel surveys, 2000-2001 season. Mattole Riverwatershed. Mattole Salmon Group, Bureau of Land Management cooperative agreement1422-B300-A7-1010, task order 004.
196. Pister, E.P. 1965. Population sampling on three north coastal streams closed to summer troutfishing - 1955 season. California Department of Fish and Game, Inland Fisheries,Administrative Report 65-12 .
197. Preston, L. 1984. Unpublished data. California Department of Fish and Game (cited in Brown andMoyle 1991).
198. Preston, L. 1989. Unpublished data. California Department of Fish and Game (cited in Brown andMoyle 1991).

105
199. Preston, L. 1991. Unpublished data. California Department of Fish and Game (cited in Brown andMoyle 1991).
200. Preston, L. 1995. Unpublished data. California Department of Fish and Game (cited in KierAssociates 1999).
201. Preston, L. 1996. Unpublished data. California Department of Fish and Game (cited in KierAssociates 1999).
202. Preston, L. 1997. Unpublished data. California Department of Fish and Game (cited in KierAssociates 1999).
203. Redwood National Park. 2001. Scale collection, Redwood National Park museum collection.
204. Regnart, J.R. 1991. Physical parameters associated with coho salmon redds in northwestCalifornia. Master of Science Thesis. Humboldt State University, Arcata, California.
205. Rellim Redwood Company. 1993. Unpublished data (cited in Ellis 1997).
206. Rellim Redwood Company. 1994. Unpublished data (cited in Ellis 1997).
207. Rellim Redwood Company. 1995. Unpublished data (cited in Ellis 1997).
208. Roche, M. 2001. Personal communication.
209. Scriven, J. 1994. Unpublished data. Six Rivers National Forest (cited in Kier Associates 1999).
210. Scriven, J. and T. Hayden. 1995. Unpublished data. List compiled by Zack Larson, Smith RiverAdvisory Council, 2001.
211. Scriven, J. and T. Roelofs. 1993. Unpublished data (cited in Ellis 1997).
212. Scriven, J. and T. Roelofs. 1994. Unpublished data (cited in Ellis 1997).
213. Scriven, J. and T. Roelofs. 1995. Unpublished data (cited in Ellis 1997).
214. Scriven, J. and T. Roelofs. 1996. Unpublished data (cited in Ellis 1997).
215. Scriven, J. and T. Roelofs. 1997. Unpublished data. United States Forest Service (cited in Ellis1997).
216. Shapovalov, L. 1940. Fish rescue work in the North Coast district in 1939. California Departmentof Fish and Game, Bureau of Fish Conservation, Administrative Report.
217. Shapovalov, L. 1941. Fish rescue work in the North Coast district in 1940. California Departmentof Fish and Game, Bureau of Fish Conservation, Administrative Report (cited in Brown andMoyle 1991).
218. Sierra Pacific. 1989. Unpublished data (cited in Ellis 1997).
219. Sierra Pacific. 1990. Unpublished data (cited in Ellis 1997).

106
220. Sierra Pacific. 1991. Unpublished data (cited in Ellis 1997).
221. Sierra Pacific. 1992. Unpublished data (cited in Ellis 1997).
222. Sierra Pacific. 1993. Unpublished data (cited in Ellis 1997).
223. Sierra Pacific. 1997. Unpublished data (cited in Ellis 1997).
224. Simpson Timber Company. 1996. Unpublished data (cited in Ellis 1997).
225. Simpson Timber Company. 2000. Coho salmon monitoring summary: 1995-2000.
226. Sinnen, W., C. Reese, T. Moore, P. Garrison, and S. Borok. 2000. Annual report: Trinity Riverbasin salmon and steelhead monitoring project. State of California, The Resources Agency,Department of Fish and Game.
227. Smith, J. 1988. Personal communication. San Jose State University, San Jose, California (citedHassler et al. 1991).
228. Smith, J. 2000. Distribution and abundance of juvenile coho and steelhead in Gazos, Waddell andScott creeks in 2000. Department of Biological Sciences, San Jose State University, San Jose,CA 95192.
229. Smith, J. 2000. Distribution and abundance of juvenile coho and steelhead in Redwood Creek infall 2000.
230. Smith, J.J. 1987. Aquatic habitat and fish utilization of Pescadero, San Gregorio, Waddell, andPomponio Creek Estuary/Lagoon system. Report. Interagency Agreement 4-8233-6004.Trustees for California Sate University and California Department of Parks andRecreation.
231. Smith, R. 2001. Personal communication. National Park Service, Golden Gate NationalRecreation Area.
232. Smith, R.W., S.S. Beamish, G.G. Brown, K.N. Kundargi, D.J. Manning, and D.T. Press. 1999.Coho Salmon and Steelhead Trout Restoration Project progress report, November 1999.National Parks Service, Golden Gate National Recreation Area.
233. Snyder, R. 1988. Personal communication. California Department of Fish and Game, Yountville,California (cited in Hassler et al. 1991).
234. Sommerstrom, S. 1984. Mendocino County Salmon and Steelhead Plan. Mendocino County Fishand Game Advisory Committee. Ukiah, California (cited in Brown and Moyle 1991).
235. Stimson Lumber Company. 1997. Unpublished data. Habitat Conservation Plan.
236. Taylor, T. 1991. Unpublished data. California Department of Parks and Recreation. Based onentry in Preserve Design Diversity Database. University of California, Davis (cited in Brownand Moyle 1991).
237. Thornburgh, J.S. 1995. Unpublished data. Multi-year population assessment of anadromoussalmonid populations in Horse Linto Creek, California. Six Rivers National Forest.

107
238. Trihey and Associates. 1994. Lagunitas Creek anadromous fish monitoring report fall 1994.Prepared by Trihey and Associates, 4180 Treat Boulevard, Suite N, Concord, California94518 for Marin Municipal Water District, 220 Nelson Drive, Corte Madera, California94925.
239. Trihey and Associates. 1995. Lagunitas Creek anadromous fish monitoring report fall 1995. 4180Treat Boulevard, Concord, California 94518.
240. U.S.D.A. Forest Service. 1962. Unpublished data. Six Rivers National Forest, Gasquet, California(cited in Kier Associates 1999).
241. U.S.D.A. Forest Service. 1963. Unpublished data. Six Rivers National Forest, Gasquet, California(cited in Kier Associates 1999).
242. U.S.D.A. Forest Service. 1975. Unpublished data. Six Rivers National Forest, Orleans RangerDistrict (cited in Kier Associates 1999).
243. U.S.D.A. Forest Service. 1977. Unpublished data. Six Rivers National Forest, Gasquet, California(cited in Kier Associates 1999).
244. U.S.D.A. Forest Service. 1979. Unpublished data. Six Rivers National Forest, Gasquet, California(cited in Kier Associates 1999).
245. U.S.D.A. Forest Service. 1980. Unpublished data. Six Rivers National Forest, Gasquet, California(cited in Kier Associates 1999).
246. U.S.D.A. Forest Service. 1985. Unpublished data. Klamath National Forest, Scott River RangerDistrict (cited in Kier Associates 1999).
247. U.S.D.A. Forest Service. 1986. Office memorandum. Pacific Southwest Forest and RangeExperiment Station. Arcata, California (cited in Hassler et al. 1991).
248. U.S.D.A. Forest Service. 1986. Office memorandum. U.S. Forest Service, Pacific SouthwestForest and Range Experiment Station, FRES, Arcata, California (cited in Hassler et al. 1991).
249. U.S.D.A. Forest Service. 1986. Unpublished data. Six Rivers National Forest, Gasquet, California(cited in Kier Associates 1999).
250. U.S.D.A. Forest Service. 1987. Memorandum to Trinity Basin Fisheries Coordinator, TrinityBasin species inventory. Shasta Trinity National Forest, Redding, CA.
251. U.S.D.A. Forest Service. 1987. Unpublished data. Klamath National Forest, Happy Camp RangerDistrict (cited in Kier Associates 1999).
252. U.S.D.A. Forest Service. 1988. Unpublished data. Klamath National Forest (cited in KierAssociates 1999).
253. U.S.D.A. Forest Service. 1988. Unpublished data. Klamath National Forest, Happy Camp RangerDistrict (cited in Kier Associates 1999).
254. U.S.D.A. Forest Service. 1988. Unpublished data. Klamath National Forest, Scott River RangerDistrict (cited in Kier Associates 1999).
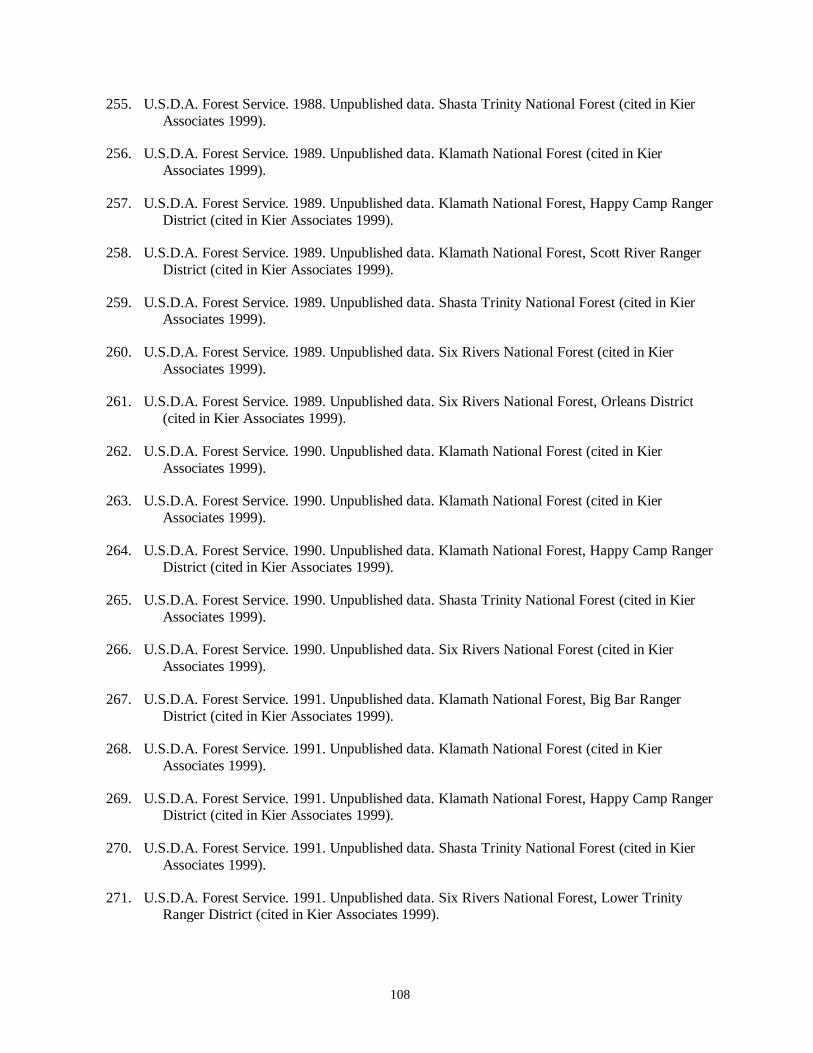
108
255. U.S.D.A. Forest Service. 1988. Unpublished data. Shasta Trinity National Forest (cited in KierAssociates 1999).
256. U.S.D.A. Forest Service. 1989. Unpublished data. Klamath National Forest (cited in KierAssociates 1999).
257. U.S.D.A. Forest Service. 1989. Unpublished data. Klamath National Forest, Happy Camp RangerDistrict (cited in Kier Associates 1999).
258. U.S.D.A. Forest Service. 1989. Unpublished data. Klamath National Forest, Scott River RangerDistrict (cited in Kier Associates 1999).
259. U.S.D.A. Forest Service. 1989. Unpublished data. Shasta Trinity National Forest (cited in KierAssociates 1999).
260. U.S.D.A. Forest Service. 1989. Unpublished data. Six Rivers National Forest (cited in KierAssociates 1999).
261. U.S.D.A. Forest Service. 1989. Unpublished data. Six Rivers National Forest, Orleans District(cited in Kier Associates 1999).
262. U.S.D.A. Forest Service. 1990. Unpublished data. Klamath National Forest (cited in KierAssociates 1999).
263. U.S.D.A. Forest Service. 1990. Unpublished data. Klamath National Forest (cited in KierAssociates 1999).
264. U.S.D.A. Forest Service. 1990. Unpublished data. Klamath National Forest, Happy Camp RangerDistrict (cited in Kier Associates 1999).
265. U.S.D.A. Forest Service. 1990. Unpublished data. Shasta Trinity National Forest (cited in KierAssociates 1999).
266. U.S.D.A. Forest Service. 1990. Unpublished data. Six Rivers National Forest (cited in KierAssociates 1999).
267. U.S.D.A. Forest Service. 1991. Unpublished data. Klamath National Forest, Big Bar RangerDistrict (cited in Kier Associates 1999).
268. U.S.D.A. Forest Service. 1991. Unpublished data. Klamath National Forest (cited in KierAssociates 1999).
269. U.S.D.A. Forest Service. 1991. Unpublished data. Klamath National Forest, Happy Camp RangerDistrict (cited in Kier Associates 1999).
270. U.S.D.A. Forest Service. 1991. Unpublished data. Shasta Trinity National Forest (cited in KierAssociates 1999).
271. U.S.D.A. Forest Service. 1991. Unpublished data. Six Rivers National Forest, Lower TrinityRanger District (cited in Kier Associates 1999).

109
272. U.S.D.A. Forest Service. 1991. Unpublished data. Six Rivers National Forest, Lower TrinityRanger District (cited in Kier Associates 1999).
273. U.S.D.A. Forest Service. 1991. Unpublished data. Six Rivers National Forest, Orleans District(cited in Kier Associates 1999).
274. U.S.D.A. Forest Service. 1992. Unpublished data. Downstream migrant trap final report: HorseLinto Creek, 1991. Six Rivers National Forest, Humboldt County, California. Six RiversNational Forest, Lower Trinity Ranger District.
275. U.S.D.A. Forest Service. 1992. Unpublished data. Downstream migrant trap final report: WillowCreek, 1991. Six Rivers National Forest, Lower Trinity Ranger District.
276. U.S.D.A. Forest Service. 1992. Unpublished data. Klamath National Forest (cited in KierAssociates 1999).
277. U.S.D.A. Forest Service. 1992. Unpublished data. Klamath National Forest (cited in KierAssociates 1999).
278. U.S.D.A. Forest Service. 1992. Unpublished data. Klamath National Forest, Happy Camp RangerDistrict (cited in Kier Associates 1999).
279. U.S.D.A. Forest Service. 1992. Unpublished data. Klamath National Forest, Scott River RangerDistrict (cited in Kier Associates 1999).
280. U.S.D.A. Forest Service. 1992. Unpublished data. Shasta Trinity National Forest (cited in KierAssociates 1999).
281. U.S.D.A. Forest Service. 1992. Unpublished data. Six Rivers National Forest, Lower TrinityRanger District (cited in Kier Associates 1999).
282. U.S.D.A. Forest Service. 1992. Unpublished data. Six Rivers National Forest, Orleans District(cited in Kier Associates 1999).
283. U.S.D.A. Forest Service. 1993. Unpublished data. Klamath National Forest (cited in KierAssociates 1999).
284. U.S.D.A. Forest Service. 1993. Unpublished data. Klamath National Forest, Happy Camp RangerDistrict (cited in Kier Associates 1999).
285. U.S.D.A. Forest Service. 1993. Unpublished data. Shasta Trinity National Forest (cited in KierAssociates 1999).
286. U.S.D.A. Forest Service. 1993. Unpublished data. Six Rivers National Forest (cited in KierAssociates 1999).
287. U.S.D.A. Forest Service. 1993. Unpublished data. Six Rivers National Forest (cited in KierAssociates 1999).
288. U.S.D.A. Forest Service. 1993. Unpublished data. Six Rivers National Forest, Gasquet, California(cited in Kier Associates 1999).

110
289. U.S.D.A. Forest Service. 1993. Unpublished data. Six Rivers National Forest, Lower TrinityRanger District (cited in Kier Associates 1999).
290. U.S.D.A. Forest Service. 1993. Unpublished data. Six Rivers National Forest, Orleans District(cited in Kier Associates 1999).
291. U.S.D.A. Forest Service. 1994. Coho status review (cited in Kier Associates 1999).
292. U.S.D.A. Forest Service. 1994. Unpublished data. Klamath National Forest (cited in KierAssociates 1999).
293. U.S.D.A. Forest Service. 1994. Unpublished data. Klamath National Forest, Happy Camp RangerDistrict (cited in Kier Associates 1999).
294. U.S.D.A. Forest Service. 1994. Unpublished data. Klamath National Forest, Salmon RiverRanger District (cited in Kier Associates 1999).
295. U.S.D.A. Forest Service. 1994. Unpublished data. Klamath National Forest, Scott River RangerDistrict (cited in Kier Associates 1999).
296. U.S.D.A. Forest Service. 1994. Unpublished data. Shasta Trinity National Forest (cited in KierAssociates 1999).
297. U.S.D.A. Forest Service. 1994. Unpublished data. Six Rivers National Forest (cited in KierAssociates 1999).
298. U.S.D.A. Forest Service. 1994. Unpublished data. Six Rivers National Forest, Gasquet, California(cited in Kier Associates 1999).
299. U.S.D.A. Forest Service. 1994. Unpublished data. Six Rivers National Forest, Orleans District(cited in Kier Associates 1999).
300. U.S.D.A. Forest Service. 1996. Unpublished data. Klamath National Forest, Scott River RangerDistrict (cited in Kier Associates 1999).
301. U.S.D.A. Forest Service. 1997. Unpublished data. 1997 downstream migrant trap report: HorseLinto Creek. Six Rivers National Forest.
302. U.S.D.A. Forest Service. 1997. Unpublished data. Klamath National Forest (cited in KierAssociates 1999).
303. U.S.D.A. Forest Service. 1997. Unpublished data. Klamath National Forest, Happy Camp RangerDistrict (cited in Kier Associates 1999).
304. U.S.D.A. Forest Service. 1997. Unpublished data. Klamath National Forest, Scott River RangerDistrict (cited in Kier Associates 1999).
305. U.S.D.A. Forest Service. 1998. Unpublished data. Shasta Trinity National Forest (cited in KierAssociates 1999).

111
306. U.S.D.A. Forest Service. 1999. Unpublished data. 1998 to 1999 Willow Creek anadromousmonitoring, spawning, and downstream migrant trap report. Six Rivers National Forest, LowerTrinity Ranger District.
307. Ulmer, L. 1988. Personal communication. California Department of Fish and Game, BenLomond, California (cited in Hassler et al. 1991).
308. United State Fish and Wildlife Service. 1960. A preliminary survey of fish and wildlife resourcesof northwestern California. U.S. Fish and Wildlife Service, Portland, Oregon (cited in Hassleret al. 1991).
309. United States Fish and Wildlife Service. 1990. Unpublished data. U.S. Fish and Wildlife Service,Arcata, Office (cited in Kier Associates 1999).
310. United States Fish and Wildlife Service. 1994. Unpublished data. U.S. Fish and Wildlife Service,Arcata, Office (cited in Kier Associates 1999).
311. United States Fish and Wildlife Service. 1999. Unpublished data. U.S. Fish and Wildlife Service,Weaverville Office (cited in Kier Associates 1999).
312. United States of Army Corps of Engineers. 1980. Eel River Basin resource analysis. Army Corpsof Engineers, San Francisco, California (cited in Hassler et al. 1991).
313. Valentine, B. and M. Jameson. 1994. Little North Fork Noyo study, 1992. Calfiornia Departmentof Foresty and Fire Protection. Coast Cascade Region, P.O. Box 670, Santa Rosa, California95401.
314. Vaughn, H. 2000. Sproul Creek downstream migrant trapping program. Report submitted toBarnum Timber Company.
315. Voight, H. 2001. Unpublished data. Yurok Tribal Fisheries.
316. Voight, H.N. and D.B. Gale. 1998. Distribution of fish species of the lower Klamath River: aninterim report, FY 1996. Yurok Tribal Fisheries, Habitat Assessment and BiologicalMonitoring Division technical report number 3, Klamath, California.
317. Waldvogel, J. 1988. Personal communication. California Sea Grant. Crescent City, California(cited in Hassler et al. 1991).
318. Waldvogel, J. 1996. Unpublished data. University of California Sea Grant Extension (cited inKier Associates 1999).
319. Walker, C.A. and W. Arey Kent. 1996. Unpublished data. 1996 downstream migrant trap report:Horse Linto Creek. Lower Trinity Ranger District, Six Rivers National Forest.
320. Weseloh, T. 1995. Personal communication (cited in Kier Associates 1999).
321. Williams, T.H. 2001. Unpublished data. National Marine Fisheries Service, Southwest FisheriesScience Center, Santa Cruz Laboratory, Santa Cruz, California 95060.