Replacing dietary fish oil by vegetable oils has little effect on lipogenesis, lipid transport and...
11
Replacing dietary fish oil by vegetable oils has little effect on lipogenesis, lipid transport and tissue lipid uptake in rainbow trout (Oncorhynchus mykiss) Nade `ge Richard, Sadasivam Kaushik, Laurence Larroquet, Ste ´phane Panserat and Genevie `ve Corraze* UMR Nutrition Aquaculture Ge ´nomique, INRA Po ˆle Hydrobiologie, 64310 Saint Pe ´e-sur-Nivelle, France (Received 14 October 2005 – Revised 23 March 2006 – Accepted 24 March 2006) In order to investigate the effects of dietary lipid sources on mechanisms involved in lipid deposition, two groups of rainbow trout were fed from first-feeding to the commercial size of 1 kg (for 62 weeks) with two diets differing only by lipid source: 100 % fish oil or 100 % blend of vegetable oils (55 % rapeseed oil, 30 % palm oil, 15 % linseed oil). The activities and levels of gene expression of lipogenic enzymes (fatty acid synthetase, glucose-6-phosphate dehydrogenase and malic enzyme) in liver and of lipoprotein lipase in perivisceral adipose tissue, white muscle and liver were determined. Transport of lipid was studied by determining lipid composition of plasma and lipoprotein classes. We also examined the clearance of LDL by assaying the level of LDL receptor gene expression in several tissues. Total replacement of dietary fish oil by the blend of vegetable oils did not affect growth of rainbow trout and did not modify muscle lipid content. Hepatic lipogenesis and lipid uptake in perivisceral adipose tissue, white muscle and liver were also not modified by dietary treatments. Diets containing the blend of vegetable oils induced a decrease in plasma cholesterol and LDL. In trout fed the vegetable oils diet, expression of LDL receptor gene in the liver was down-regulated. Lipid transport: Lipogenesis: Rainbow trout: Vegetable oils Fish meal and fish oil are the main raw materials used in the formulation of fish feeds. Due to the expansion of aquaculture, marine fisheries will not be able to sustain the needs of aqua- culture in the not too distant future. The global demand for fishmeal for aquafeeds may exceed total available supplies around the year 2020 and for fish oil well before 2010 (New & Wijkstroem, 2002). Thus, alternatives to the use of marine materials in fish feeds must be found. Several studies have investigated the replacement of fish oil by vegetable oils in fish feed. Partial replacement of fish oils by vegetable oils such as rapeseed, soyabean, linseed or palm oils in fish feeds has no negative impacts on growth and survival of Atlantic salmon (Rosenlund et al. 2001), brook char (Guillou et al. 1995), gilthead sea bream and European seabass (Izquierdo et al. 2003) and rainbow trout (Greene & Seli- vonchick, 1990; Caballero et al. 2002). Fatty acid composition of fish lipids generally reflects the fatty acid profile of the diets (Watanabe, 1982). Vegetable oils contain higher levels of saturated and n-6 PUFA than fish oil which is richer in n-3 PUFA, mainly EPA and docosahexaenoic acid (DHA), and in long-chain MUFA. Lipid deposition in fish tissues involves several metabolic processes: lipogenesis, lipid transport by lipoproteins, tissue lipid uptake (mediated by lipoprotein lipase (LPL)) and storage of lipids (Sheridan, 1988; Tocher, 2003). The main fat deposition sites in salmonids are perivisc- eral adipose tissue and white muscle (Corraze & Kaushik, 1999). In higher vertebrates, many studies have shown that changes in dietary fatty acid composition can induce modifi- cation of hepatic lipogenesis (Blake & Clarke, 1990; Clarke et al. 1990, Salati & Amir-Ahmady, 2001), lipid transport in blood (Grundy & Denke, 1990; Fernandez & West, 2005) and tissue lipid uptake (Montalto & Bensadoun, 1993; Raclot et al. 1997). In rainbow trout, little information is available concerning how dietary fatty acids influence these processes. Some studies have shown that activities of hepatic lipogenic enzymes such as fatty acid synthetase (FAS), the main lipo- genic enzyme which produces fatty acid, and also glucose-6- phosphate dehydrogenase (G6PD) and malic enzyme (ME), which are the purveyors of NADPH, essential for FAS activity, are not modified by partial or total replacement of fish oil by rapeseed oil in Atlantic salmon (Torstensen et al. 2004) or by soyabean or linseed oils in turbot (Regost et al. 2003). PUFA such as EPA or DHA and a high level of lino- lenic acid inhibit activities of FAS and G6PD in rainbow trout hepatocyte cultures (Alvarez et al. 2000). It was reported that PUFA inhibit expression of G6PD gene by a post-tran- scriptional mechanism in liver of mice and in rat hepatocytes in vitro (Stabile et al. 1996, 1998). Dietary PUFA decreased the hepatic abundance of FAS mRNA in rats by an inhibition of FAS transcription (Blake & Clarke, 1990; Clarke et al. 1990). In fish, regulation of lipogenic gene expression by diet- ary fatty acids has not yet been studied. * Corresponding author: Dr Genevie `ve Corraze, fax þ33 5 59 54 51 52, email [email protected] Abbreviations: DHA, docosahexaenoic acid; FAS, fatty acid synthetase; G6PD, glucose-6-phosphate dehydrogenase; LDL-R, LDL receptor; LPL, lipoprotein lipase; ME, malic enzyme. British Journal of Nutrition (2006), 96, 299–309 DOI: 10.1079/BJN20061821 q The Authors 2006
Transcript of Replacing dietary fish oil by vegetable oils has little effect on lipogenesis, lipid transport and...

Replacing dietary fish oil by vegetable oils has little effect on lipogenesis, lipid
transport and tissue lipid uptake in rainbow trout (Oncorhynchus mykiss)
Nadege Richard, Sadasivam Kaushik, Laurence Larroquet, Stephane Panserat and Genevieve Corraze*
UMR Nutrition Aquaculture Genomique, INRA Pole Hydrobiologie, 64310 Saint Pee-sur-Nivelle, France
(Received 14 October 2005 – Revised 23 March 2006 – Accepted 24 March 2006)
In order to investigate the effects of dietary lipid sources on mechanisms involved in lipid deposition, two groups of rainbow trout were fed from
first-feeding to the commercial size of 1 kg (for 62 weeks) with two diets differing only by lipid source: 100 % fish oil or 100 % blend of vegetable
oils (55 % rapeseed oil, 30 % palm oil, 15 % linseed oil). The activities and levels of gene expression of lipogenic enzymes (fatty acid synthetase,
glucose-6-phosphate dehydrogenase and malic enzyme) in liver and of lipoprotein lipase in perivisceral adipose tissue, white muscle and liver were
determined. Transport of lipid was studied by determining lipid composition of plasma and lipoprotein classes. We also examined the clearance of
LDL by assaying the level of LDL receptor gene expression in several tissues. Total replacement of dietary fish oil by the blend of vegetable oils
did not affect growth of rainbow trout and did not modify muscle lipid content. Hepatic lipogenesis and lipid uptake in perivisceral adipose tissue,
white muscle and liver were also not modified by dietary treatments. Diets containing the blend of vegetable oils induced a decrease in plasma
cholesterol and LDL. In trout fed the vegetable oils diet, expression of LDL receptor gene in the liver was down-regulated.
Lipid transport: Lipogenesis: Rainbow trout: Vegetable oils
Fish meal and fish oil are the main raw materials used in theformulation of fish feeds. Due to the expansion of aquaculture,marine fisheries will not be able to sustain the needs of aqua-culture in the not too distant future. The global demand forfishmeal for aquafeeds may exceed total available suppliesaround the year 2020 and for fish oil well before 2010 (New& Wijkstroem, 2002). Thus, alternatives to the use ofmarine materials in fish feeds must be found. Several studieshave investigated the replacement of fish oil by vegetableoils in fish feed. Partial replacement of fish oils by vegetableoils such as rapeseed, soyabean, linseed or palm oils in fishfeeds has no negative impacts on growth and survival ofAtlantic salmon (Rosenlund et al. 2001), brook char (Guillouet al. 1995), gilthead sea bream and European seabass(Izquierdo et al. 2003) and rainbow trout (Greene & Seli-vonchick, 1990; Caballero et al. 2002). Fatty acid compositionof fish lipids generally reflects the fatty acid profile of the diets(Watanabe, 1982). Vegetable oils contain higher levels ofsaturated and n-6 PUFA than fish oil which is richer in n-3PUFA, mainly EPA and docosahexaenoic acid (DHA), andin long-chain MUFA. Lipid deposition in fish tissues involvesseveral metabolic processes: lipogenesis, lipid transport bylipoproteins, tissue lipid uptake (mediated by lipoproteinlipase (LPL)) and storage of lipids (Sheridan, 1988; Tocher,2003). The main fat deposition sites in salmonids are perivisc-eral adipose tissue and white muscle (Corraze & Kaushik,1999).
In higher vertebrates, many studies have shown thatchanges in dietary fatty acid composition can induce modifi-cation of hepatic lipogenesis (Blake & Clarke, 1990; Clarkeet al. 1990, Salati & Amir-Ahmady, 2001), lipid transport inblood (Grundy & Denke, 1990; Fernandez & West, 2005)and tissue lipid uptake (Montalto & Bensadoun, 1993;Raclot et al. 1997). In rainbow trout, little information isavailable concerning how dietary fatty acids influence theseprocesses.
Some studies have shown that activities of hepatic lipogenicenzymes such as fatty acid synthetase (FAS), the main lipo-genic enzyme which produces fatty acid, and also glucose-6-phosphate dehydrogenase (G6PD) and malic enzyme (ME),which are the purveyors of NADPH, essential for FASactivity, are not modified by partial or total replacement offish oil by rapeseed oil in Atlantic salmon (Torstensen et al.2004) or by soyabean or linseed oils in turbot (Regost et al.2003). PUFA such as EPA or DHA and a high level of lino-lenic acid inhibit activities of FAS and G6PD in rainbowtrout hepatocyte cultures (Alvarez et al. 2000). It was reportedthat PUFA inhibit expression of G6PD gene by a post-tran-scriptional mechanism in liver of mice and in rat hepatocytesin vitro (Stabile et al. 1996, 1998). Dietary PUFA decreasedthe hepatic abundance of FAS mRNA in rats by an inhibitionof FAS transcription (Blake & Clarke, 1990; Clarke et al.1990). In fish, regulation of lipogenic gene expression by diet-ary fatty acids has not yet been studied.
*Corresponding author: Dr Genevieve Corraze, fax þ33 5 59 54 51 52, email [email protected]
Abbreviations: DHA, docosahexaenoic acid; FAS, fatty acid synthetase; G6PD, glucose-6-phosphate dehydrogenase; LDL-R, LDL receptor; LPL, lipoprotein lipase;
ME, malic enzyme.
British Journal of Nutrition (2006), 96, 299–309 DOI: 10.1079/BJN20061821q The Authors 2006
Other important processes involved in lipid deposition arelipid transport and fatty acid uptake in tissues. In fish, trans-port of endogenous and dietary lipids to peripheral tissues ismediated by lipoproteins, of which the basic molecularorganization and role in lipid metabolism are similar tothose of mammals (Sheridan, 1988; Babin & Vernier 1989;Tocher, 2003). Fatty acid composition of dietary lipids affectslipid composition of plasma and plasma lipoproteins in mam-mals (Jeffery et al. 1996; Temme et al. 1997; Salter et al.1998; Chang et al. 2004) and in Atlantic salmon (Lie et al.1993; Torstensen et al. 2000, 2004). In mammals, total choles-terol in plasma and LDL are increased by saturated fatty acidsand decreased by PUFA (Grundy & Denke, 1990). In Atlanticsalmon, replacement of fish oil (rich in n-3 PUFA) by rape-seed oil (rich in oleic acid and n-6 PUFA) led to changes infatty acid composition of plasma lipoproteins but had nomarked effect on their relative lipid class composition(Torstensen et al. 2004). Clearance of LDL from the plasmais mediated by the LDL receptors (LDL-R; Tocher, 2003).Activity and expression of LDL-R are modulated by fattyacids. In mammals, saturated fatty acids tend to decreaseLDL-R activity, protein and mRNA abundance while oleicacid and PUFA increase them (Dietschy, 1998; Fernandez &West, 2005).
Uptake of fatty acids by tissues is mediated by LPL. LPLhydrolyses triacylglycerols of triacylglycerol-rich lipoproteins(chylomicrons and VLDL) and generates fatty acids that aretaken up by tissues. Dietary fish oil increases LPL activityin soleus muscle of rat (Baltzell et al. 1991), LPL mRNA inepididymal adipose tissue of rat (Murphy et al. 1993) andpost-heparin LPL activity in man (Zampelas et al. 1994).An in vitro study reported that linoleic acid and EPA butnot oleic acid lowered the mRNA level, synthesis and levelof secretion of LPL in chick adipocytes (Montalto & Bensa-doun, 1993). Raclot et al. (1997) reported that in rat, n-3PUFA, mainly DHA, lowered the level of LPL mRNA in ret-roperitoneal but not in subcutaneous adipose tissue. In fish,little information is available on the regulation of LPL bythe nutritional status. Nevertheless, studies in red sea bream(Pagrus major) indicated that dietary fatty acids regulate, ina tissue-specific fashion, LPL gene expression in liver andvisceral adipose tissue (Liang et al. 2002a,b).
The objective of the present study was to investigate theimpacts of dietary lipid sources on mechanisms involved inlipid deposition in rainbow trout using biochemical and mol-ecular tools. We determined activities and levels of geneexpression of lipogenic enzymes (FAS, G6PD and ME) inliver, and of LPL in several tissues (perivisceral adiposetissue, white muscle and liver). We also examined the trans-port of lipid by determining the lipid composition of plasmaand lipoprotein classes. The clearance of LDL was assessedby measuring the level of gene expression of LDL-Rin several tissues (liver, white muscle and perivisceral adiposetissue).
Materials and methods
Fish and diets
Triploid female rainbow trout (Oncorhynchus mykiss) fry,having an initial body weight of 0·12 g, were reared in the
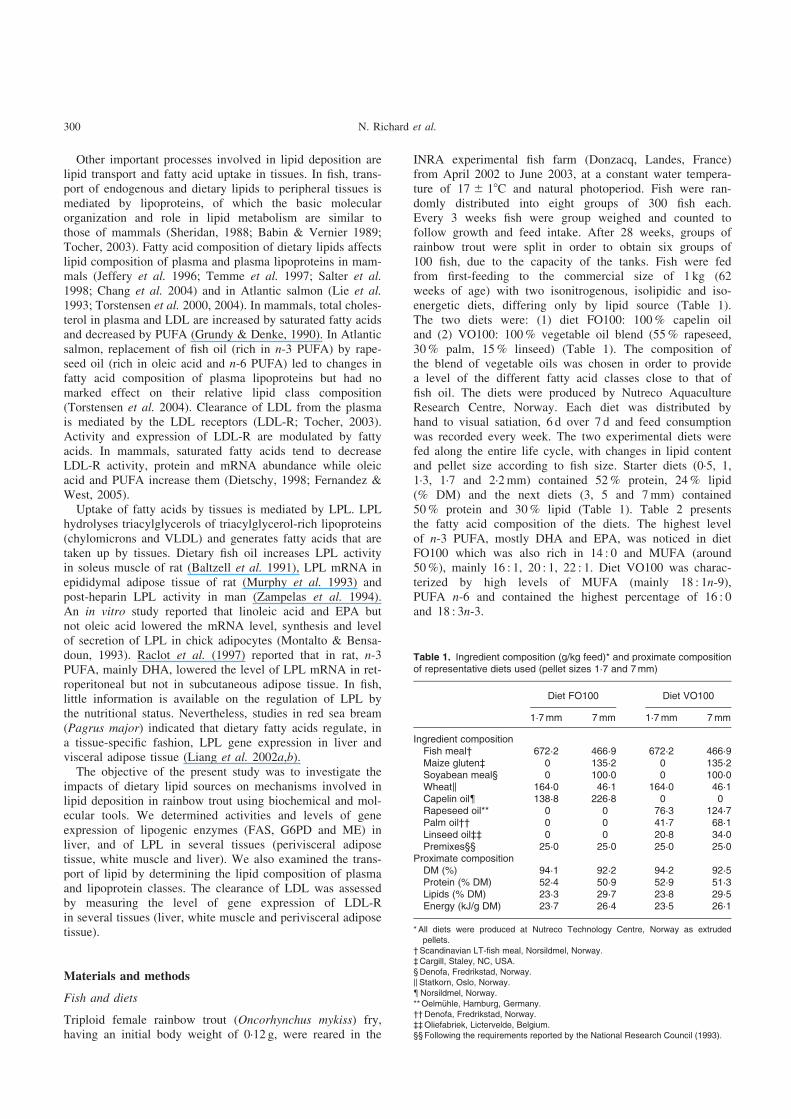
INRA experimental fish farm (Donzacq, Landes, France)from April 2002 to June 2003, at a constant water tempera-ture of 17 ^ 18C and natural photoperiod. Fish were ran-domly distributed into eight groups of 300 fish each.Every 3 weeks fish were group weighed and counted tofollow growth and feed intake. After 28 weeks, groups ofrainbow trout were split in order to obtain six groups of100 fish, due to the capacity of the tanks. Fish were fedfrom first-feeding to the commercial size of 1 kg (62weeks of age) with two isonitrogenous, isolipidic and iso-energetic diets, differing only by lipid source (Table 1).The two diets were: (1) diet FO100: 100 % capelin oiland (2) VO100: 100 % vegetable oil blend (55 % rapeseed,30 % palm, 15 % linseed) (Table 1). The composition ofthe blend of vegetable oils was chosen in order to providea level of the different fatty acid classes close to that offish oil. The diets were produced by Nutreco AquacultureResearch Centre, Norway. Each diet was distributed byhand to visual satiation, 6 d over 7 d and feed consumptionwas recorded every week. The two experimental diets werefed along the entire life cycle, with changes in lipid contentand pellet size according to fish size. Starter diets (0·5, 1,1·3, 1·7 and 2·2 mm) contained 52 % protein, 24 % lipid(% DM) and the next diets (3, 5 and 7 mm) contained50 % protein and 30 % lipid (Table 1). Table 2 presentsthe fatty acid composition of the diets. The highest levelof n-3 PUFA, mostly DHA and EPA, was noticed in dietFO100 which was also rich in 14 : 0 and MUFA (around50 %), mainly 16 : 1, 20 : 1, 22 : 1. Diet VO100 was charac-terized by high levels of MUFA (mainly 18 : 1n-9),PUFA n-6 and contained the highest percentage of 16 : 0and 18 : 3n-3.
Table 1. Ingredient composition (g/kg feed)* and proximate compositionof representative diets used (pellet sizes 1·7 and 7 mm)
Diet FO100 Diet VO100
1·7 mm 7 mm 1·7 mm 7 mm
Ingredient compositionFish meal† 672·2 466·9 672·2 466·9Maize gluten‡ 0 135·2 0 135·2Soyabean meal§ 0 100·0 0 100·0Wheatk 164·0 46·1 164·0 46·1Capelin oil{ 138·8 226·8 0 0Rapeseed oil** 0 0 76·3 124·7Palm oil†† 0 0 41·7 68·1Linseed oil‡‡ 0 0 20·8 34·0Premixes§§ 25·0 25·0 25·0 25·0
Proximate compositionDM (%) 94·1 92·2 94·2 92·5Protein (% DM) 52·4 50·9 52·9 51·3Lipids (% DM) 23·3 29·7 23·8 29·5Energy (kJ/g DM) 23·7 26·4 23·5 26·1
* All diets were produced at Nutreco Technology Centre, Norway as extrudedpellets.
† Scandinavian LT-fish meal, Norsildmel, Norway.‡ Cargill, Staley, NC, USA.§ Denofa, Fredrikstad, Norway.kStatkorn, Oslo, Norway.{Norsildmel, Norway.** Oelmuhle, Hamburg, Germany.†† Denofa, Fredrikstad, Norway.‡‡ Oliefabriek, Lictervelde, Belgium.§§ Following the requirements reported by the National Research Council (1993).
N. Richard et al.300

Proximate composition of diets
Proximate composition of the diets was analysed using the fol-lowing procedures: DM after drying at 1058C for 24 h, fat bypetroleum ether extraction (Soxtherm, Gerhardt, Germany)and gross energy in an adiabatic bomb calorimeter (IKA, Hei-tersheim Gribheimer, Germany). Protein content (N £ 6·25)was determined by the Kjeldahl method after acid digestion.Cholesterol content of diets was determined by the Lieber-mann-Burchard reaction.
Sampling procedure
Samplings were made when rainbow trout reached market sizeof 1 kg (62 weeks of age) and at the intermediary size of 450 g(44 weeks of age). Fish were killed by a blow on the head 16 hafter the meal in order to avoid the presence of chylomicronsin plasma. Liver from six fish for each dietary treatment weresampled to analyse the activity of FAS, G6PD and ME and thegene expression of FAS and G6PD. Whole fillet, without redmuscle, of six fish per diet were collected for lipid contentanalyses. Nine other fish were also withdrawn to measurethe activity and gene expression of LPL in white muscle(anterior-dorsal part), liver and perivisceral adipose tissue.All the tissues sampled were frozen in liquid nitrogen andstored at 2808C until analysis.
From eighteen fish per diet at 44 weeks and twenty fish perdiet at 62 weeks, blood was withdrawn over 0·01 % EDTAfrom the caudal vein, 16 h after feeding. Plasma was obtainedby centrifugation at 3000g for 10 min. Sodium azide wasadded to the plasma (final concentration 0·04 %). Individualplasma sampled at 44 weeks was stored at 2208C until theanalysis of lipid class composition. For the final sampling(62 weeks), twenty plasma samples for each dietary treatmentwere pooled (four pools of five fish). An aliquot of each pool
(5 ml) was used for lipoprotein fractionation and the remnantswere stored at 2208C until analysis of plasma lipid classcomposition.
Lipids and fatty acid analyses
Total lipids of diets were extracted according to Folch et al.(1957) and quantified gravimetrically. Fatty acid compo-sition was determined on the total lipid extract. Fatty acidmethyl esters were prepared by acid-catalysed transmethyl-ation of total lipids using boron trifluoride in methanolaccording to Shantha & Ackman (1990) and were analysedin a Varian 3800 gas chromatograph (Varian, Les Ulis,France). The chromatograph was equipped with a DBWax fused silica capillary column (30 m £ 0·25 mm internaldiameter, film thickness 0·25mm; J&W Scientific, Folsom,CA, USA). Helium was used as carrier gas (1·4 ml/min)and the thermal gradient was 100–1808C at 88/min, 180–2208C at 48/min and a constant temperature of 2208C for20 min. Injector and flame ionization detector temperatureswere 260 and 2508C, respectively. Fatty acid methyl esterswere identified by comparison with known standard mixtures(Sigma, St Louis, MO, USA) and their relative proportionsdetermined using a computer.
Lipogenic enzymes and lipoprotein lipase assays
For measurement of activities of lipogenic enzymes in liver,samples of liver were homogenized in three volumes of ice-cold buffer (0·02 mol/l Tris-HCl, 0·25 mol/l sucrose, 2 mmol/l EDTA, 0·1 mol/l NaF, 0·5 mmol/l phenylmethylsulphonylfluoride, 0·01 mol/l b-mercaptoethanol, pH 7·4). Homogenateswere centrifuged at 15 000g for 20 min at 48C and activities oflipogenic enzymes were measured on the supernatant. Activi-ties of G6PD (EC 1.1.1.49) and ME (EC 1.1.1.40) wereassayed according to the methods of Bautista et al. (1988)and Ochoa (1955), respectively, following NADPH pro-duction. FAS activity was performed by an isotopic methodaccording to Hsu et al. (1969), measuring fatty acid syn-thesized from [14C]acetyl-CoA.
LPL activity was measured in liver, muscle and perivisceraladipose tissue. LPL assay was performed with 10 % Intralipid(Fresenius Kabi, Sweden) which was labelled with tri[9,10-3-
H]oleyl glycerol by sonication, and with rat serum as thesource of apo C-II. Tissue samples (1 g) were homogenizedin nine volumes of ice-cold buffer (25 mmol/l ammonia,5 mmol/l EDTA, 1 % Triton X-100, 0·1 % SDS, 1250 IUheparin, 1ml/ml pepstatin A, 10mg/ml leupeptin, 4·25 IUaprotinin, pH 8·2). Homogenates were centrifuged at20 000g at 48C for 20 min. The clear supernatant was recov-ered and LPL activity determined according to Bengtsson-Oli-vecrona & Olivecrona (1992).
Enzyme activity units (IU), defined as mmol substrate con-verted to the product per min at the assay temperature (258Cfor LPL assay and 308C for lipogenic enzymes assays), wereexpressed per mg soluble protein (specific activity) and pergram of tissue (wet weight). Protein concentration of tissuehomogenates was determined by the method of Bradford(1976) using a protein assay kit (Bio-Rad, Munich, Germany)with bovine serum albumin as a standard.
Table 2. Fatty acid composition of the diets (g/100 g total fatty acid)(pellet sizes 0·5–2·2 and 3–7 mm)
Diet FO100 Diet VO100
0·5–2·2 mm 3–7 mm 0·5–2·2 mm 3–7 mm
14 : 0 8·1 9·5 2·3 1·716 : 0 13·5 13·1 17·4 18·918 : 0 1·3 1·3 2·4 2·5Saturates 24·9 25·8 23·6 24·916 : 1 9·0 9·6 2·1 1·418 : 1 14·6 16·0 36·0 40·620 : 1 15·4 16·3 3·5 1·922 : 1 11·5 10·7 3·1 1·4MUFA 50·6 53·2 44·9 45·418 : 2n-6 3·3 3·8 12·9 14·218 : 3 0·1 0·1 0·0 0·020 : 2 0·2 0·2 0·1 0·120 : 4 0·3 0·2 0·1 0·1n-6 PUFA 6·0 6·0 13·9 14·818 : 3n-3 1·0 1·1 8·7 10·618 : 4 2·5 2·0 0·8 0·520 : 5 5·7 4·3 2·8 1·422 : 6n-3 5·2 3·7 3·1 1·5n-3 PUFA 15·5 12·0 15·9 14·2Saturates/PUFA 1·2 1·4 0·8 0·8n-3/n-6 2·6 2·0 1·1 1·0
Vegetable oils and lipid metabolism in fish 301

Cloning of partial glucose-6-phosphate dehydrogenase andfatty acid synthetase cDNA of rainbow trout
For cloning G6PD cDNA partial sequence, primers wereselected on the rainbow trout G6PD sequence (TIGR acces-sion number TC38722) at positions 634–653 and 1236–1255 (Table 3). For cloning FAS cDNA partial sequence, pri-mers were chosen on trout expressed sequence tag (tcaa0001 c.m.06_5·1) issue of SIGENAE bank (French programof Analysis of Breeding Animals’ Genome, AGENAE,http://www.sigenae.org) (Table 3).
Total hepatic RNA of rainbow trout, extracted with TRIzolreagent (Invitrogen, Carlsbad, CA, USA) were reverse tran-scripted in cDNA (Reverse Transcription System; Promega,Madison, WI, USA). Total RNA (3ml) was annealed with0·25mg random primers and incubated with 15 U avian mye-loblastosis virus RT in a final volume of 20ml, for 10 min at258C and 1 h at 428C. cDNA (8ml) was amplified by PCRusing 16 pmol of each primer in a reaction mixture contain-ing 1·5 mmol/l MgCl2, 50 mmol/l KCl, 10 mmol/l Tris-HCl,0·1 % Triton X-100, 0·2 mmol/l dNTP and 4 U Taq DNApolymerase (Promega), in a final volume of 100ml. Fortycycles of denaturation, 20 s at 948C, annealing at annealingtemperature (Table 3) for 20 s and extension at 728C for20 s were performed. PCR products were subjected to electro-phoresis in 1 % agarose gel, and fragments of the expectedsize range (620 bp for G6PD and 454 bp for FAS) were pur-ified (Amicon, Millipore Corporation, Beldford, MA, USA).The purified DNA fragments were inserted into thepCRw2·1-TOPOw plasmid and used for transformation ofTOP10 One Shotw chemically competent cells (Invitrogen).Inserts were detected by Eco RI digestion of the extractedplasmid DNA. Clones with inserts were sequenced (Sequen-tia, Evry, France). Nucleotide sequences were compared: (1)for G6PD with DNA sequence of flounder (Platichthys flesus;EMBL accession number AJ310438·1) and fathead minnows(Pimephales promelas GenBank accession numberAF206637·2); (2) for FAS with human (GenBank accessionnumber BC014631·1) and chicken (GenBank accessionnumber J04485·1) DNA sequences using the BLAST algor-ithm (Altschul et al. 1990). Sequence alignments and percen-tage of nucleotide conservation were assessed with theClustal-W multiple alignment algorithm (Higgins & Sharp,1989) using the cloned trout G6PD or FAS sequences andsequences corresponding to the amplified regions from thespecies mentioned earlier.
Analysis of gene expression: real-time PCR and Northern blot
Analysis of FAS, G6PD and LPL gene expression was done atthe first sampling time (44 weeks) and analysis of LDL-R geneexpression was done at the final sampling (62 weeks) asanalysis of composition of plasma lipoproteins was done atthe final sampling. Analysis of FAS and G6PD geneexpression was performed on trout liver and analysis of LPLand LDL-R gene expression was performed on trout whitemuscle, liver and perivisceral adipose tissue. Due to the lowlevel of FAS, LPL and LDL-R gene expression, analysis ofgene expression was performed using real-time RT–PCR incontrast to G6PD (analysis by Northern blot).
Total RNA was extracted from rainbow trout liver, whitemuscle and perivisceral adipose tissue using TRIzol reagent.To avoid genomic DNA amplification during real-time RT–PCR, RNA extracted from liver and muscle was treated byRQ1 RNase-Free DNase (Promega) prior to RT–PCR. Thiswas not done on RNA extracted from adipose tissue becauseof the low concentration of RNA in this tissue. Total RNAwas quantified based on absorbance at 260 nm. cDNA weregenerated from 1mg DNase-treated RNA using 200 U Super-Scripte III RT (Invitrogen) and 500 ng oligo(dT)15 primers(Promega) in a total volume of 20ml. For each sample, reversetranscription was performed in duplicate. Real-time PCR wasperformed with the iCycler iQe (Bio-Rad, Hercules, CA,USA) on 10ml RT reaction using iQe SYBRw Green Super-mix (Bio-Rad). The total volume of the PCR reaction was25ml, containing 200 nmol/l primers. Primers for LPLmRNA amplification were chosen at positions 445–464 and590–608 of rainbow trout cDNA LPL sequence (GenBankaccession number AJ224693) (Table 3). Primers for FASmRNA amplification were selected on the sequence of therainbow trout FAS cDNA fragment cloned (Table 3). ForLDL-R mRNA amplification, primers were chosen at positions1118–1137 and 1284–1303 of rainbow trout cDNA LDL-Rsequence (Genbank accession number AF542091) (Table 3).Primers were defined with Primer3 software. Forward primersfor LPL and FAS mRNA amplification were overlapping anintron. Thermal cycling was initiated with the incubation at958C for 3 min for hot-start iTaqe DNA polymerase acti-vation. Thirty-five steps of PCR were performed, each oneconsisting of heating at 958C for 20 s for denaturing, and at598C for 30 s for annealing and extension. Following thefinal cycle of the PCR, melting curves were systematicallymonitored (increase set-point temperature from 55 to 948C
Table 3. Nucleotide sequences of the primers used for cDNA cloning sequences and the primers used to assay geneexpression by real-time PCR
Forward primer Reverse primerAnnealing
temperature (8C)PCR productlength (bp)
Primers for cDNA cloningG6PD cactacctgggcaaggagat ttgctcatcatcttggcgta 55 620FAS tacgccaattctgccatgga tcttgttgatggtgagctgt 54 454
Primers for real-time PCRFAS gagacctagtggaggctgtc tcttgttgatggtgagctgt 59 186LPL taattggctgcagaaaacac cgtcagcaaactcaaaggt 59 164LDL-R aactgcggtcacaggtcaaa acggggttgtcaaagtggat 59 186EF1a tcctcttggtcgtttcgctg acccgagggacatcctgtg 59 159
EF1a, elongation factor 1a; FAS, fatty acid synthetase; G6PD, glucose-6-phosphate dehydrogenase; LDL-R, LDL receptor; LPL, lipoprotein lipase.
N. Richard et al.302

by 0·58C/10 s). Relative quantification of the target gene tran-script with the elongation factor 1a transcript was made fol-lowing the Pfaffl method with the Relative ExpressionSoftware Tool (RESTq; Pfaffl et al. 2002). This mathematicalalgorithm, which needs no calibration curve, computes anexpression ratio (R), based on real-time PCR efficiency andthe crossing-point deviation of the unknown sample (dietVO100) versus the control (diet FO100):
R ¼½ðEgeneÞDCTgeneðmean FO1002mean VO100Þ�=
½ðEEF1aÞDCTEF1aðmean FO1002mean VO100Þ�;
where E is PCR efficiency determined by a standard curveusing serial dilution of cDNA; DCT is the crossing-point devi-ation of an unknown sample (VO100) versus a control(FO100); and EF1a is elongation factor 1a.
Hepatic G6PD gene expression was determined by Northernblot. Total extracted RNA (20mg) from rainbow trout liverwas submitted to electrophoresis in 1 % agarose gel containing5 % formaldehyde and capillary transferred on to nylon mem-brane (Hybond-Nþ; Amersham, UK). After transfer, RNAblots were stained with methylene blue to locate 28S and18S rRNA and to determine the relative amounts of loadedRNA. Membranes were hybridized with rainbow trout a32P-labelled G6PD DNA probes labelled by random priming (Stra-tagene, La Jolla, CA, USA). After stringent washing (2 £
saline sodium citrate (SSC) for 15 min; 0·5 £ SSC, 0·1 %SDS for 15 min; 0·1 £ SSC, 0·1 % SDS for 15 min; 0·1 £
SSC, 1 % SDS for 15 min), the membrane was exposed toX-ray film (Merck Eurolab, Nogent-sur-Marne, France) andthe resulting images were quantified using Visio-Mic II soft-ware (Genomic, Lyon, France).
Separation of lipoproteins and analysis of lipid compositionof plasma and lipoprotein classes
VLDL, LDL and HDL were obtained by sequential ultracen-trifugal flotation of plasma as Torstensen et al. (2000), usinga Kontron T-2060 ultracentrifuge (Kontron Instruments, StQuentin-en-Yvelines, France) equipped with a TFT 65·13rotor. The density intervals were obtained by addition ofKBr solution containing 0·04 % NaN3 and 0·01 % EDTA.The density intervals were: VLDL, ,1·015 g/ml; LDL,1·015 to ,1·085 g/ml; HDL, 1·085 to ,1·21 g/ml. Purity ofthe different fractions was verified by agarose gelelectrophoresis.
Concentrations of triacylglycerol, total cholesterol, phos-pholipid and NEFA were determined on plasma and lipopro-teins fractions by colorimetric enzymatic methods usingcommercial kits (Triglycerides PAP 150, Cholesterol RTUand Phospholipides PAP 150 from Biomerieux, MarcyI’Etoile France; NEFA C from Wako Chemicals GmbH,Neuss, Germany). Concentration of protein was determinedby the method of Bradford (1976).
Statistical analysis
Results are expressed as means and standard deviations. Datawere analysed by one-way ANOVA to test the effect inducedby dietary treatments on enzyme activities, lipid and protein
composition of plasma and lipoprotein classes. Means werecompared using Duncan’s test. Differences were consideredto be significant at P¼0·05. All statistics were performedusing Statistical Analysis Systems statistical package softwareversion 7.4 (SAS Institute, Cary, NC, USA).
Results
Growth performance of rainbow trout was similar all along thelong-term study, irrespective of dietary treatment and the twogroups reached a final body weight of around 1 kg at the endof the feeding experiment (Table 4). Among the two groups offish, no significant differences were observed in feed effi-ciency (weight gain (g)/feed intake (g)), which was 0·95 (SD
0·04) for group FO100 and 0·95 (SD 0·08) for group VO100.Liver to body weight ratio was the same for each dietary treat-ment at 44 and 62 weeks and was lower at both samplingtimes in trout fed diet VO100 (Table 4). Viscerosomaticindex was higher at 62 than 44 weeks and did not significantlydiffer between dietary treatments (Table 4). No significantdifferences were found between groups of trout for musclelipid content at 44 and 62 weeks (Table 4).
FAS, G6PD and ME activities measured in liver of rainbowtrout fed diets for 44 and 62 weeks are presented in Fig. 1.After 44 weeks, hepatic G6PD activity was about 3·3 timeshigher than ME activity. Dietary treatment had no effect onFAS, ME and G6PD activities when expressed per g liver orper mg protein (data not shown), at the two sampling times.At the end of the study (62 weeks), activities of the three lipo-genic enzymes were higher than at 44 weeks and G6PDactivity was about 1·5 times higher than ME activity.
Analysis of G6PD and FAS gene expression was under-taken at 44 weeks (Tables 5A,B). The G6PD mRNA observedwas around 1·8 kb. Expression of the G6PD gene was not sig-nificantly different between the two groups of rainbow trout.As FAS gene expression was very low, its analysis was per-formed using real-time RT–PCR and computed using
Table 4. Morphometric parameters and muscle lipid content of rainbowtrout fed diets at 44 (n 18) and 62 weeks (n 15)*
(Mean values and standard deviations)
Diet FO100 Diet VO100
Mean SD Mean SD
44 weeksFBW (g) 459 21 463 8HSI† 1·0a 0·1 0·9b 0·1VSI‡ 9·2 1·4 8·7 1·3Muscle lipids (% fresh) 10·3 1·2 9·9 0·9
62 weeksFBW (g) 1011 40 1019 63HSI† 1·0a 0·1 0·9b 0·1VSI‡ 10·2 1·5 9·2 1·6Muscle lipids (% fresh) 12·5 3·1 11·0 0·7
FBW, final body weight.a,b Mean values within a row with unlike superscript letters were significantly differ-
ent (P,0·05).* For details of procedures and diets, see p. 300–302 and Tables 1 and 2.† Hepatosomatic index (HSI) ¼ (liver weight/body weight) £ 100.‡ Viscerosomatic index (VSI) ¼ (viscera weight/body weight) £ 100.
Vegetable oils and lipid metabolism in fish 303

RESTq. FAS gene expression of fish fed diets FO100 andVO100 were not significantly differentially regulated.
Triacylglycerol, total cholesterol, phospholipid, NEFA andtotal protein were analysed in plasma after 44 and 62 feedingweeks (Table 6). The level of triacylglycerol in plasmaincreased about 3-fold from 44 weeks to the final sampling.Levels of cholesterol, phospholipid, NEFA and protein werequite the same for the two sampling times. Replacement offish oil by the vegetable oil blend lowered phospholipid andcholesterol levels in plasma at 44 and 62 weeks. Plasma
NEFA level was decreased by diet VO100 at 44 weeks butthere were no significant differences between the two groupsof fish at 62 weeks. Levels of triacylglycerol and protein inplasma did not differ with dietary treatment at either samplingtime.
Plasma lipoprotein classes (VLDL, LDL, HDL) were separ-ated after 62 weeks of feeding and their composition of tria-cylglycerol, total cholesterol, phospholipid, NEFA and totalprotein was determined. The level of analysed componentsof the VLDL, LDL and HDL classes is expressed as concen-tration in lipoproteins of plasma (Table 7) and as percentageof lipoprotein fraction (Table 8). When results were expressedas concentration in lipoproteins of total plasma, the VO100group had a lower level of cholesterol in the three lipoproteinclasses and had a lower level of all components analysed inthe LDL fraction. Amounts of VLDL and HDL wereunchanged by dietary treatment whereas the amount of LDLwas reduced by around 40 % with diet VO100. When com-ponents analysed were expressed as percentage of lipoproteinfraction there were no significant differences in the compo-sition of LDL and HDL fractions between dietary groups. Inthe VLDL fraction, triacylglycerol and NEFA levels were
0
4
8
12
16
20
G6PD ME FAS G6PD ME FAS
44 weeks 62 weeks
Act
ivit
y(I
U/g
or
mIU
/g)
Fig. 1. Activities of glucose-6-phosphate dehydrogenase (G6PD), malic enzyme (ME) and fatty acid synthetase (FAS) in liver of rainbow trout after 44 and 62
weeks of feeding with diet FO100 ( ) or diet VO100 ( ). For details of procedures and diets, see pp. 300–303 and Tables 1 and 2. Values are expressed in IU
(G6PD and ME) or mIU/g tissue (FAS). Values are means with their standard deviation depicted by vertical bars (n 6). Means values were not significantly differ-
ent for a selected enzyme between dietary groups (P,0·05).
Table 5B. Gene expression analysis at 44 weeks by Northern blot: glu-cose-6-phosphate dehydrogenase (G6PD) gene expression in the liver(n 9)*
(Mean values and standard deviations)
FO100 VO100
Gene Mean† SD Mean† SD
G6PD mRNA/18S rRNA(arbitary units)
0·89 0·22 0·99 0·27
* For details of procedures and diets, see pp. 300–303 and Tables 1 and 2. TheG6PD mRNA was around 1·8 kb. The 18S rRNA served as an internal controlfor loading.
†Mean values were not significantly different (Duncan’s test, P,0·05).
Table 6. Triacylglycerol, total cholesterol, phospholipid, NEFA and totalprotein in rainbow trout plasma (g/l) at 44 (n 18) and 62 weeks (n 4)*
(Mean values and standard deviations)
Diet FO100 Diet VO100
Mean SD Mean SD
44 weeksTriacylglycerol (g/l) 4·08 1·4 3·51 0·90Cholesterol (g/l) 7·88a 1·92 4·50b 0·63Phospholipid (g/l) 12·05a 2·15 8·90b 1·37NEFA (g/l) 0·25a 0·04 0·16b 0·02Protein (g/l) 37·97 5·03 39·24 4·85
62 weeksTriacylglycerol (g/l) 10·28 1·54 9·90 1·23Cholesterol (g/l) 6·45a 1·07 3·97b 0·23Phospholipid (g/l) 13·20a 1·45 10·44b 0·98NEFA (g/l) 0·38 0·05 0·33 0·08Protein (g/l) 42·96 4·99 40·97 2·47
* For details of procedures and diets, see pp. 300–303 and Tables 1 and 2.a,b Mean values within a row with unlike superscript letters were significantly differ-
ent (P,0·05).
Table 5A. Gene expression analysis at 44 weeks by real-time PCR:comparison of fatty acid synthetase (FAS; liver), LPL (lipoprotein lipase;liver, white muscle and perivisceral adipose tissue) and LDL receptor(LDL-R; liver, white muscle and perivisceral adipose tissue) geneexpression, diet VO100 compared to diet FO100 (n 6)*
Gene x-Fold† P valueCVVO100
(%)CVFO100
(%)
FAS (liver) 21·01 0·978 5·1 8·1LPL (liver) 22·11 0·023 5·5 2·4LPL (white muscle) þ1·04 0·894 14·9 5·7LPL (adipose tissue) 21·54 0·046 5·6 9·2LDL-R (liver) 23.92 0·002 2·4 3·5LDL-R (white muscle) 22·10 0·098 4·5 7·6LDL-R (adipose tissue) 21·57 0·001 1·2 1·4
* For details of procedures and diets, see pp. 300–303 and Tables 1 and 2.† Alterations in mRNA expression are presented as an x-fold up- (þ ) or down- (2 )
regulation (statistical RESTq analyses; Pfaffl et al. 2002). Expression resultswere normalized by elongation factor 1a gene expression.
N. Richard et al.304

raised in trout fed diet VO100 whereas cholesterol, phospho-lipid and protein levels were decreased.
Data on LDL-R mRNA expression in perivisceral adiposetissue, white muscle and liver of rainbow trout at 62 weeksare reported in Tables 5A. In perivisceral adipose tissue andin liver, LDL-R gene expression was significantly down-regu-lated (by a factor of 1·6 and 3·9, respectively) in fish fed dietVO100. In the white muscle, LDL-R gene expression was notsignificantly different between the two dietary groups.
LPL activity measured in perivisceral adipose tissue, whitemuscle and liver of trout fed diets for 44 weeks and 62 weeksis shown in Fig. 2. LPL activity was higher in adipose tissuethan in muscle and liver (about eight and four times, respect-ively) at the two sampling times. After 44 weeks of feeding,LPL activity in adipose tissue and white muscle did notdiffer among the two groups whereas in liver, LPL activitywas reduced in fish fed diet VO100. At the end of the experi-ment (62 weeks), in the three tissues studied, LPL activity waslower than at 44 weeks. No significant differences in LPLactivity were observed between the groups whatever thetissue after 62 weeks of feeding.
0
100
200
300
400
500
600
AT WM L AT WM L
44 weeks 62 weeks
ba
Lip
op
rote
in li
pas
eac
tivi
ty(m
IU/g
tis
sue)
Fig. 2. Lipoprotein lipase activity in perivisceral adipose tissue (AT), white muscle (WM) and liver (L) of rainbow trout after 44 and 62 weeks of feeding with diet
FO100 ( ) or diet VO100 ( ). For details of procedures and diets, see pp. 300–303 and and Tables 1 and 2. Values are means with their standard deviation
depicted by vertical bars (n 9). a,b Mean values within dietary groups for a selected tissue with unlike superscript letters were significantly different (P,0·05).
Table 7. Triacylglycerol, total cholesterol, phospholipid, NEFA and pro-tein in VLDL, LDL and HDL expressed as concentration in lipoproteinsof plasma (g/l plasma) and amount of lipoprotein class (g/l plasma) after62 weeks of feeding (n 4)*
(Mean values and standard deviations)
Diet FO100 Diet VO100
Mean SD Mean SD
VLDLTriacylglycerol 4·16 0·48 4·16 1·37Cholesterol 1·48a 0·24 0·80b 0·32Phospholipid 1·99 0·31 1·45 0·49NEFA 0·020b 0·004 0·031a 0·003Protein 1·04 0·16 0·72 0·20Amount VLDL 8·70 1·14 7·17 2·38
LDLTriacylglycerol 2·69a 0·37 1·85b 0·27Cholesterol 2·22a 0·48 1·25b 0·15Phospholipid 3·37a 0·56 2·03b 0·13NEFA 0·022 0·009 0·011 0·005Protein 3·95a 0·68 2·29b 0·15Amount LDL 12·25a 2·02 7·43b 0·31
HDLTriacylglycerol 1·43 0·24 1·30 0·20Cholesterol 1·38a 0·10 1·10b 0·12Phospholipid 4·68 0·28 4·28 0·27NEFA 0·072 0·008 0·061 0·007Protein 6·90 0·50 6·15 0·51Amount HDL 14·45 0·96 12·89 0·92
* For details of procedures and diets, pp. 300–303 and Tables 1 and 2.a,b Mean values within a row with unlike superscript letters were significantly differ-
ent (P,0·05).
Table 8. Triacylglycerol, total cholesterol, phospholipid, NEFA and pro-tein in VLDL, LDL and HDL expressed as a percentage of the lipopro-tein fraction after 62 weeks of feeding (n 4)*
(Mean values and standard deviations)
Diet FO100 Diet VO100
Mean SD Mean SD
VLDLTriacylglycerol (%) 47·9b 1·9 58·1a 0·4Cholesterol (%) 17·0a 1·1 10·9b 0·9Phospholipid (%) 22·9a 0·9 20·3b 0·3NEFA (%) 0·24b 0·08 0·47a 0·14Protein (%) 11·9a 0·5 10·2b 0·6
LDLTriacylglycerol (%) 22·0 1·3 24·9 3·5Cholesterol (%) 18·0 1·5 16·8 1·7Phospholipid (%) 27·5 0·7 27·3 0·7NEFA (%) 0·17 0·05 0·14 0·06Protein (%) 32·2 1·0 30·9 1·8
HDLTriacylglycerol (%) 9·9 1·5 10·1 1·4Cholesterol (%) 9·5 0·1 8·6 0·7Phospholipid (%) 32·4 1·1 33·2 0·7NEFA (%) 0·50 0·03 0·48 0·07Protein (%) 47·7 0·5 47·7 1·3
* For details of procedures and diets, see pp. 300–303 and Tables 1 and 2.a,b Mean values within a row with unlike superscript letters were significantly differ-
ent (P,0·05).
Vegetable oils and lipid metabolism in fish 305

At 44 weeks, analysis of LPL gene expression was doneby real-time RT–PCR in the three tissues (Tables 5A).In fish fed diet VO100, LPL gene expression was 2·1-folddown-regulated in liver and slightly lowered in adiposetissue (1·5-fold, P¼0·046). In white muscle, LPL geneexpression was not affected by dietary treatments.
Discussion
Studies have reported that partial replacement (at least 50 %,up to 80 %) of dietary fish oil by vegetable oils (soyabeanoil, rapeseed oil, blends of olive and palm oils or rapeseedand palm oils) in rainbow trout with initial weight 250 g(Caballero et al. 2002) and total replacement by soyabeanoil or linseed oil in rainbow trout with initial weight 80 g(Greene & Selivonchick, 1990) did not have a negativeimpact on fish growth. The present study is the first ever inrainbow trout to demonstrate that it is possible to replacetotally fish oil by a blend of vegetable oils right from first-feeding up to a body weight of 1 kg without compromisingtheir growth or feed nutrient utilization. Several parametersof flesh quality were also assessed and no differences in sen-sory quality were found (unpublished results). Total replace-ment of fish oil by palm oil, oleic acid-enriched sunfloweroil, rapeseed oil, or a blend of rapeseed and linseed oils inAtlantic salmon (Torstensen et al. 2000; Bell et al. 2001,2002; Bendiksen et al. 2003) or by soyabean or rapeseedoils in brook charr (Guillou et al. 1995), do not also seemto have any significant effect on growth.
The increase in hepatic lipogenic enzyme activities betweenthe two sampling times is in agreement with the observationsof Walzem et al. (1991) who showed that activities of G6PDand ME (IU/liver) correlated by a regression coefficient of0·87 and 0·88, respectively, with body mass gains of fish.This increase in lipid neo-synthesis could contribute to therise in lipid content of fish with age. G6PD activity wasabout 1·5-fold higher than ME activity. This is in accordancewith earlier data that the pentose phosphate pathway is theprincipal purveyor of cytoplasmic reducing equivalentNADPH in rainbow trout (Walzem et al. 1991; Hung & Stor-ebakken, 1994; Gelineau et al. 2001) as in European seabass(Dias et al. 1998), coho salmon (Lin et al. 1977), turbot(Regost et al. 2001) or gilthead sea bream (Gomez-Requeniet al. 2003). In Atlantic salmon, however, G6PD activity isreported to be lower than that of ME (Menoyo et al. 2003;Torstensen et al. 2004).
Studies of Menoyo et al. (2003) indicated that in Atlanticsalmon, G6PD and ME activities were higher with a low n-3 PUFA diet (29 % v. 15 % of the total fatty acids). Alvarezet al. (2000) also observed in vitro an inhibitory effect ofEPA, DHA and linolenic acid on G6PD and FAS activitiesin rainbow trout hepatocytes. In gilthead sea bream, linseedoil, rich in linolenic acid, also induces a decrease in hepaticlipogenesis (Menoyo et al. 2004) although in turbot it hasno effect (Regost et al. 2003), possibly indicating inter-speciesdifferences. In the present study, replacing fish oil by theblend of vegetable oils did not modify hepatic lipogenesis inrainbow trout, either at the molecular or enzymatic levels.Similar results on enzyme activities have been observed ingilthead sea bream and turbot fed soyabean oil (Regost et al.2003; Menoyo et al. 2004) and in Atlantic salmon fed graded
levels of rapeseed oil (Torstensen et al. 2004). This lack ofeffect may be due to the fact that in these vegetable oil-based diets, both the increase in linolenic acid and thedecrease in EPA and DHA are too low to induce significantchanges in lipogenesis.
With around 13·5 g/l plasma, HDL was the dominant lipo-protein class in plasma of rainbow trout, as in all teleosts(Babin & Vernier, 1989). The lipid composition of lipoproteinclasses of rainbow trout was in accordance with the data ofChapman et al. (1978) and Babin & Vernier (1989). Themajor component of the VLDL class was triacylglycerol(around 53 % of fraction), reflecting its major role in the trans-port of triacylglycerol from the liver to the tissues where theywill be stored or oxidized (Sheridan, 1988; Tocher, 2003).LDL, resulting from VLDL hydrolysis, contained less triacyl-glycerol (23·5 %) than VLDL and was the richest class incholesterol (17 %). The HDL class contained mainly protein(48 %) and phospholipid (33 %).
The decrease in plasma cholesterol level by around 40 % atboth sampling times with the diet containing the vegetable oilblend appeared to be due to a decrease in the amount ofplasma LDL, as shown by plasma lipoprotein analyses per-formed at the final sampling. Plasma LDL amount was low-ered by similar levels to plasma total cholesterol after 62weeks of feeding.
In many species, plasma total cholesterol and LDL choles-terol concentrations increase with the addition of cholesterolto the diet (Spady & Dietschy, 1988; Grundy & Denke,1990; Mustad et al. 1996; Matsuyama et al. 2005). In the pre-sent study, the difference in cholesterol content of the diets(2·1 % total lipid for diet FO100 and 1·3 % for diet VO100)seems to be too low to mainly explain the hypocholesterolae-mic effect of vegetable oils. The nature of dietary fatty acid isalso known to affect plasma cholesterol concentration. Inmammals, an increase in dietary saturated fatty acids inducesa rise in plasma LDL cholesterol whereas oleic acid andPUFA reduce this level (Grundy & Denke, 1990; Fernandez& West, 2005). In the present study, the decrease in plasmacholesterol and LDL when rainbow trout were fed with thevegetable oil diet could be related to the higher levels ofoleic and linolenic acids in this diet. Several studies haveshown that the effect of dietary fatty acids on the amountof plasma LDL is mainly mediated by modifications ofplasma LDL clearance which occur via LDL-R-mediateduptake. Thus hepatic LDL-R activity was found to beimpaired by saturated fatty acids and increased by PUFA(Dietschy, 1998; Fernandez & West, 2005). In hamster andpig, changes in hepatic LDL-R activity induced by dietaryfatty acids were accompanied by parallel changes in hepaticLDL-R protein and mRNA levels (Horton et al. 1993;Mustad et al. 1996). Nevertheless, in the present study,with diet VO100, we observed a down-regulation of LDL-Rgene expression in the liver (3·9-fold) and to a lesser extentin adipose tissue (1·6-fold). Studies undertaken in primatesalso did not find any apparent relationship between changesin hepatic LDL-R mRNA level and changes in plasma LDLcholesterol concentration induced by saturated or unsaturatedfats (Fox et al. 1987; Sorci-Thomas et al. 1989). Another wayby which dietary fatty acids possibly affect plasma LDLclearance involve membrane fluidity as reported by Kuoet al. (1990), who showed an increase in LDL binding and
N. Richard et al.306

uptake when hepatocyte membrane fluidity is increased byunsaturated fatty acid enrichment. Further work on LDL-Ractivity and affinity in rainbow trout will be useful in orderto confirm whether the response observed on LDL-R geneexpression with replacement of dietary fish oil by vegetableoils is typical for this species.
Plant oils also contain phytosterols (Phillips et al. 2002)which are known to decrease total cholesterol and LDLcholesterol in man (Moghadasian & Frohlich, 1999; Mat-vienko et al. 2002; Vanstone et al. 2002) as well as in someteleosts (Gilman et al. 2003), by decreasing intestinal choles-terol absorption efficiency (Normen et al. 2000; Vanstone et al.2002). Indeed phytosterols have a higher affinity than choles-terol for binding to bile acid micelles in the intestinal lumenand displace cholesterol from micelles (Armstrong & Carey,1987). Phytosterols contained in the blend of vegetable oilsused in the present study may also explain the hypocholester-olaemic effect of diet VO100 in rainbow trout. Phytosterollevels were not measured in the diets, but rapeseed oil, themain lipid source of diet VO100 (55 %), contains around7·2 g/kg phytosterols composed mainly of sitosterol, campes-terol and brassicasterol, and palm oil contains 0·5 g/kg phytos-terols, mainly sitosterol, campesterol and stigmasterol(Phillips et al. 2002). It is, however, worth stating that theremight be differences between species and vegetable oilsused. In Atlantic salmon, replacing dietary fish oil by anoleic acid-enriched sunflower oil or palm oil, with a low con-tent of phytosterols (about 2·6 g/kg in sunflower oil and 0·5 g/kg in palm oil; Phillips et al. 2002), did not affect plasma orlipoprotein cholesterol levels (Torstensen et al. 2000).
LPL activity in adipose tissue was about 4-fold and 8-foldhigher, respectively, than in white muscle and liver of rainbowtrout in accordance with the fact that perivisceral adiposetissue and to a lesser extent white muscle are the main lipidstorage tissues in rainbow trout (Corraze & Kaushik, 1999).Although the activity of LPL in the liver was low, the presentdata confirm that the LPL gene is also expressed in the liver ofrainbow trout as in red sea bream (Lindberg & Olivecrona,1995; Liang et al. 2002b). In accordance with observationsin red sea bream, where hepatic LPL mRNA levels increasedwith dietary long-chain n-3 PUFA (Liang et al. 2002a), weobserved a higher LPL activity and gene expression in theliver of rainbow trout fed with the fish oil diet after 44weeks feeding. The regulation of LPL gene transcription(Michaud & Renier, 2001) as well as post-transcriptionnalregulation (Amri et al. 1996; Michaud & Renier, 2001) bydietary fatty acids has also been suggested in mammals. Inthe present study, LPL gene expression was slightly down-regulated (by a factor of 1·5, P¼0·046) in perivisceral adiposetissue of rainbow trout fed diet VO100 compared to the FO100group. The high level of oleic acid in the VO100 diet couldexplain the present results as in red sea bream LPL mRNAlevels in adipose tissue were reduced with a diet supplementedwith oleic acid (Liang et al. 2002a). However, the decrease inLPL gene expression seems to be really too weak to inducemodification in LPL activity. The present results on tissuelipid uptake, evaluated by LPL activity, are in accordancewith the absence of variation in the viscero-somatic indexand muscle lipid content between the two groups of fish.
The present study showed that in rainbow trout it is poss-ible to replace totally fish oil in diet by a blend of vegetable
oils from first-feeding without compromising growth ornutrient utilization. Hepatic lipogenesis is not modified bythis substitution. Dietary vegetable oils decreased circulatingcholesterol and plasma LDL levels. The present resultscould not be related to changes in LPL and/or LDL-Rexpression. The mechanisms linked to the hypocholestero-laemic effect of fish oil replacement need further investi-gation, in particular on lipoprotein receptor number andaffinity.
Acknowledgements
This work was partially supported by an INRA-IFREMERgrant to the first author. This research was funded by the Euro-pean Commission (FAIR no. Q5RS-2000-30 058, ResearchingAlternatives to Fish Oils in Aquaculture (RAFOA)) and theAquitaine region (no. CCRRDT-2002-0308002C). Weacknowledge M. Cluzeaud and E. Plagnes-Juan for technicalassistance as well as technical staff at the fish farm (F. Terrier,F. Sandres and Y. Hontang).
References
Altschul SF, Gish W, Miller W, Myers EW & Lipman DJ (1990)
Basic local alignment search tool. J Mol Biol 215, 403–410.
Alvarez MJ, Diez A, Lopez-Bote C, Gallego M & Bautista JM (2000)
Short-term modulation of lipogenesis by macronutrients in rainbow
trout (Oncorhynchus mykiss) hepatocytes. Br J Nutr 84, 619–628.
Amri EZ, Teboul L, Vannier C, Grimaldi PA & Ailhaud G (1996)
Fatty acids regulate the expression of lipoprotein lipase gene and
activity in preadipose and adipose cells. Biochem J 314, 541–546.
Armstrong MJ & Carey MC (1987) Thermodynamic and molecular
determinants of sterol solubilities in bile salt micelles. J Lipid
Res 28, 1144–1155.
Babin PJ & Vernier JM (1989) Plasma lipoproteins in fish. J Lipid
Res 30, 467–489.
Baltzell JK, Wooten JT & Otto DA (1991) Lipoprotein lipase in rats
fed fish oil: apparent relationship to plasma insulin levels. Lipids
26, 289–294.
Bautista JM, Garrido-Pertierra A & Soler G (1988) Glucose-6-phos-
phate dehydrogenase from Dicentrarchus labrax liver: kinetic
mechanism and kinetics of NADPH inhibition. Biochim Biophys
Acta 967, 354–363.
Bell JG, McEvoy J, Tocher DR, McGhee F, Campbell PJ & Sargent
JR (2001) Replacement of fish oil with rapeseed oil in diets of
Atlantic salmon (Salmo salar) affects tissue lipid compositions
and hepatocyte fatty acid metabolism. J Nutr 131, 1535–1543.
Bell JG, Henderson RJ, Tocher DR, McGhee F, Dick JR, Porter A,
Smullen RP & Sargent JR (2002) Substituting fish oil with crude
palm oil in the diet of Atlantic salmon (Salmo salar) affects
muscle fatty acid composition and hepatic fatty acid metabolism.
J Nutr 132, 222–230.
Bendiksen EA, Berg OK, Jobling M, Arnesen AM & Masoval K
(2003) Digestibility, growth and nutrient utilisation of Atlantic
salmon parr (Salmo salar L.) in relation to temperature, feed fat
content and oil source. Aquaculture 224, 283–299.
Bengtsson-Olivecrona G & Olivecrona T (1992) Assay of lipoprotein
lipase and hepatic lipase. In Lipoprotein Analysis, pp. 169–185 [C
Converse and ER Skinner, editors]. Oxford: Oxford University
Press.
Blake WL & Clarke SD (1990) Suppression of rat hepatic fatty acid
synthase and S14 gene transcription by dietary polyunsaturated fat.
J Nutr 120, 1727–1729.
Vegetable oils and lipid metabolism in fish 307

Bradford MM (1976) A rapid and sensitive method for the quanti-
tation of microgram quantities of protein utilizing the principle
of protein-dye binding. Anal Biochem 72, 248–254.
Caballero MJ, Obach A, Rosenlund G, Montero D, Gisvold M &
Izquierdo MS (2002) Impact of different dietary lipid sources on
growth, lipid digestibility, tissue fatty acid composition and his-
tology of rainbow trout, Oncorhynchus mykiss. Aquaculture 214,
253–271.
Chang NW, Wu CT, Chen FN & Huang PC (2004) High polyunsatu-
rated and monounsaturated fatty acid to saturated fatty acid ratio
increases plasma very low density lipoprotein lipids and reduces
the hepatic hypertriglyceridemic effect of dietary cholesterol in
rats. Nutr Res 24, 73–83.
Chapman MJ, Goldstein S, Mills GL & Leger C (1978) Distribution
and characterization of the serum lipoproteins and their apoproteins
in the rainbow trout (Salmo gairdnerii). Biochemistry 17,
4455–4464.
Clarke SD, Armstrong MK & Jump DB (1990) Dietary polyunsatu-
rated fats uniquely suppress rat liver fatty acid synthase and S14
mRNA content. J Nutr 120, 225–231.
Corraze G & Kaushik S (1999) Lipids from marine and freshwater
fish. Oleagineux Corps Gras Lipides 6, 111–115.
Dias J, Alvarez MJ, Diez A, Arzel J, Corraze G, Bautista JM &
Kaushik SJ (1998) Regulation of hepatic lipogenesis by dietary
protein/energy in juvenile European seabass (Dicentrarchus
labrax). Aquaculture 161, 169–186.
Dietschy JM (1998) Dietary fatty acids and the regulation of plasma
low density lipoprotein cholesterol concentrations. J Nutr 128,
444S–448S.
Fernandez ML & West KL (2005) Mechanisms by which dietary fatty
acids modulate plasma lipids. J Nutr 135, 2075–2078.
Folch J, Lees M & Sloane Stanley GH (1957) A simple method for
the isolation and purification of total lipids from animal tissues.
J Biol Chem 226, 497–509.
Fox JC, McGill HC Jr, Carey KD & Getz GS (1987) In vivo regu-
lation of hepatic LDL receptor mRNA in the baboon. Differential
effects of saturated and unsaturated fat. J Biol Chem 262,
7014–7020.
Gelineau A, Corraze G, Boujard T, Larroquet L & Kaushik S (2001)
Relation between dietary lipid level and voluntary feed intake,
growth, nutrient gain, lipid deposition and hepatic lipogenesis in
rainbow trout. Reprod Nutr Dev 41, 487–503.
Gilman CI, Leusch FDL, Breckenridge WC & MacLatchy DL (2003)
Effects of a phytosterol mixture on male fish plasma lipoprotein
fractions and testis P450scc activity. Gen Comparative Endocrinol
130, 172–184.
Gomez-Requeni P, Mingarro M, Kirchner S, Calduch-Giner JA,
Medale F, Corraze G, Panserat S, Martin SAM, Houlihan DF,
Kaushik SJ & Perez-Sanchez J (2003) Effects of dietary amino
acid profile on growth performance, key metabolic enzymes and
somatotropic axis responsiveness of gilthead sea bream (Sparus
aurata). Aquaculture 220, 749–767.
Greene DHS & Selivonchick DP (1990) Effects of dietary vegetable,
animal and marine lipids on muscle lipid and haematology of rain-
bow trout (Oncorhynchus mykiss). Aquaculture 89, 165–182.
Grundy SM & Denke MA (1990) Dietary influences on serum lipids
and lipoproteins. J Lipid Res 31, 1149–1172.
Guillou A, Soucy P, Khalil M & Adambounou L (1995) Effects of
dietary vegetable and marine lipid on growth, muscle fatty acid
composition and organoleptic quality of flesh of brook charr (Sal-
velinus fontinalis). Aquaculture 136, 351–362.
Higgins DG & Sharp PM (1989) Fast and sensitive multiple sequence
alignments on a microcomputer. Comput Appl Biosci 5, 151–153.
Horton JD, Cuthbert JA & Spady DK (1993) Dietary fatty acids regu-
late hepatic low density lipoprotein (LDL) transport by altering
LDL receptor protein and mRNA levels. J Clin Invest 92,
743–749.
Hsu RY, Butterworth PHW & Porter JW (1969) Pigeon liver fatty
acid synthetase. In Methods of Enzymology, vol. 14, pp. 33–39
[JM Lowenstein, editor]. New York: Academic Press.
Hung SSO & Storebakken T (1994) Carbohydrate utilization by rain-
bow-trout is affected by feeding strategy. J Nutr 124, 223–230.
Izquierdo MS, Obach A, Arantzamendi L, Montero D, Robaina L &
Rosenlund G (2003) Dietary lipid sources for seabream and sea-
bass: growth performance, tissue composition and flesh quality.
Aquacult Nutr 9, 397–407.
Jeffery NM, Yaqoob P, Wiggins D, Gibbons GF, Newsholme EA &
Calder PC (1996) Characterization of lipoprotein composition in
rats fed different dietary lipids and of the effects of lipoproteins
upon lymphocyte proliferation. J Nutr Biochem 7, 282–292.
Kuo P, Weinfeld M & Loscalzo J (1990) Effect of membrane fatty
acyl composition on LDL metabolism in Hep G2 hepatocytes. Bio-
chemistry 29, 6626–6632.
Liang XF, Ogata HY & Oku H (2002a) Effect of dietary fatty acids
on lipoprotein lipase gene expression in the liver and visceral adi-
pose tissue of fed and starved red sea bream Pagrus major. Comp
Biochem Physiol A Mol Integr Physiol 132, 913–919.
Liang XF, Oku H & Ogata HY (2002b) The effects of feeding con-
dition and dietary lipid level on lipoprotein lipase gene expression
in liver and visceral adipose tissue of red sea bream Pagrus major.
Comp Biochem Physiol A Mol Integr Physiol 131, 335–342.
Lie O, Sandvin A & Waagbo R (1993) Influence of dietary fatty acids
on the lipid composition of lipoproteins in farmed Atlantic salmon
(Salmo salar). Fish Physiol Biochem 12, 249–260.
Lin H, Romsos DR, Tack PI & Leveille GA (1977) Influence of diet-
ary lipid on lipogenic enzyme activities in coho salmon, Oncor-
hynchus kisutch (Walbaum). J Nutr 107, 846–854.
Lindberg A & Olivecrona G (1995) Lipase evolution: trout, Xenopus
and chicken have lipoprotein lipase and apolipoprotein C-II-like
activity but lack hepatic lipase-like activity. Biochim Biophys
Acta 1255, 205–211.
Matsuyama H, Sato K, Nakamura Y, Suzuki K & Akiba Y (2005) Modu-
lation of regulatory factors involved in cholesterol metabolism in
response to feeding of pravastatin- or cholesterol-supplemented
diet in chickens. Biochim Biophys Acta 1734, 136–142.
Matvienko OA, Lewis DS, Swanson M, Arndt B, Rainwater DL,
Stewart J & Alekel DL (2002) A single daily dose of soybean phy-
tosterols in ground beef decreases serum total cholesterol and LDL
cholesterol in young, mildly hypercholesterolemic men. Am J Clin
Nutr 76, 57–64.
Menoyo D, Lopez-Bote CJ, Bautista JM & Obach A (2003) Growth,
digestibility and fatty acid utilization in large Atlantic salmon
(Salmo salar) fed varying levels of n-3 and saturated fatty acids.
Aquaculture 225, 295–307.
Menoyo D, Izquierdo MS, Robaina L, Gines R, Lopez-Bote CJ &
Bautista JM (2004) Adaptation of lipid metabolism, tissue compo-
sition and flesh quality in gilthead sea bream (Sparus aurata) to the
replacement of dietary fish oil by linseed and soyabean oils. Br J
Nutr 92, 41–52.
Michaud SE & Renier G (2001) Direct regulatory effect of fatty acids
on macrophage lipoprotein lipase: potential role of PPARs. Dia-
betes 50, 660–666.
Moghadasian MH & Frohlich JJ (1999) Effects of dietary phytosterols
on cholesterol metabolism and atherosclerosis: clinical and exper-
imental evidence. Am J Med 107, 588–594.
Montalto MB & Bensadoun A (1993) Lipoprotein lipase synthesis
and secretion: effects of concentration and type of fatty acids in
adipocyte cell culture. J Lipid Res 34, 397–407.
Murphy MC, Zampelas A, Puddicombe SM, Furlonger NP, Morgan
LM & Williams CM (1993) Pretranslational regulation of the
expression of the lipoprotein lipase (EC 3.1.1.34) gene by dietary
fatty acids in the rat. Br J Nutr 70, 727–736.
Mustad VA, Ellsworth JL, Cooper AD, Kris-Etherton PM & Etherton
TD (1996) Dietary linoleic acid increases and palmitic acid
N. Richard et al.308

decreases hepatic LDL receptor protein and mRNA abundance in
young pigs. J Lipid Res 37, 2310–2323.
National Research Council (1993) Nutrient Requirements of Fish.
Washington, DC: National Academy Press.
New MB & Wijkstroem UN (2002) Use of Fishmeal and Fish Oil in
Aquafeeds. Futher Thoughts on the Fishmeal Trap. FAO Fisheries
Circular no. 975. Rome: FAO.
Normen L, Dutta P, Lia A & Andersson H (2000) Soy sterol esters
and beta-sitostanol ester as inhibitors of cholesterol absorption in
human small bowel. Am J Clin Nutr 71, 908–913.
Ochoa S (1955) Malic enzyme. In Methods of Enzymology, vol. 11,
pp. 739–753 [SP Colowick and NO Kaplan, editors]. New York:
Academic Press.
Pfaffl MW, Horgan GW & Dempfle L (2002) Relative expression
software tool (REST q)) for group-wise comparison and statistical
analysis of relative expression results in real-time PCR. Nucleic
Acids Res 30, 1–10.
Phillips KM, Ruggio DM, Toivo JI, Swank MA & Simpkins AH
(2002) Free and esterified sterol composition of edible oils and
fats. J Food Compost Anal 15, 123–142.
Raclot T, Groscolas R, Langin D & Ferre P (1997) Site-specific regu-
lation of gene expression by n-3 polyunsaturated fatty acids in rat
white adipose tissues. J Lipid Res 38, 1963–1972.
Regost C, Arzel J, Cardinal M, Robin J, Laroche M & Kaushik SJ
(2001) Dietary lipid level, hepatic lipogenesis and flesh quality
in turbot (Psetta maxima). Aquaculture 193, 291–309.
Regost C, Arzel J, Robin J, Rosenlund G & Kaushik SJ (2003) Total
replacement of fish oil by soybean or linseed oil with a return to
fish oil in turbot (Psetta maxima) –1. Growth performance, flesh
fatty acid profile, and lipid metabolism. Aquaculture 217,
465–482.
Rosenlund G, Obach A, Sandberg MG, Standal H & Tveit K (2001)
Effect of alternative lipid sources on long-term growth perform-
ance and quality of Atlantic salmon (Salmo salar L.). Aquacult
Res 32, 323–328.
Salati LM & Amir-Ahmady B (2001) Dietary regulation of
expression of glucose-6-phosphate dehydrogenase. Annu Rev
Nutr 21, 121–140.
Salter AM, Mangiapane EH, Bennett AJ, Bruce JS, Billett MA,
Anderton KL, Marenah CB, Lawson N & White DA (1998) The
effect of different dietary fatty acids on lipoprotein metabolism:
concentration-dependent effects of diets enriched in oleic, myristic,
palmitic and stearic acids. Br J Nutr 79, 195–202.
Shantha NC & Ackman RG (1990) Nervonic acid versus tricosanoic
acid as internal standards in quantitative gas chromatographic ana-
lyses of fish oil longer-chain n-3 polyunsaturated fatty acid methyl
esters. J Chromatogr B Biomed Appl 533, 1–10.
Sheridan MA (1988) Lipid dynamics in fish: aspects of absorption,
transportation, deposition and mobilization. Comp Biochem Phy-
siol B Biochem Mol Biol 90, 679–690.
Sorci-Thomas M, Wilson MD, Johnson FL, Williams DL & Rudel LL
(1989) Studies on the expression of genes encoding apolipoproteins
B100 and B48 and the low density lipoprotein receptor in nonhu-
man primates. Comparison of dietary fat and cholesterol. J Biol
Chem 264, 9039–9045.
Spady DK & Dietschy JM (1988) Interaction of dietary cholesterol
and triglycerides in the regulation of hepatic low density lipopro-
tein transport in the hamster. J Clin Invest 81, 300–309.
Stabile LP, Hodge DL, Klautky SA & Salati LM (1996) Posttran-
scriptional regulation of glucose-6-phosphate dehydrogenase by
dietary polyunsaturated fat. Arch Biochem Biophys 332,
269–279.
Stabile LP, Klautky SA, Minor SM & Salati LM (1998) Polyunsa-
turated fatty acids inhibit the expression of the glucose-6-phos-
phate dehydrogenase gene in primary rat hepatocytes by a
nuclear posttranscriptional mechanism. J Lipid Res 39,
1951–1963.
Temme EHM, Mensink RP & Hornstra G (1997) Effects of medium
chain fatty acids (MCFA), myristic acid, and oleic acid on serum
lipoproteins in healthy subjects. J Lipid Res 38, 1746–1754.
Tocher DR (2003) Metabolism and functions of lipids and fatty acids
in teleost fish. Fish Sci 11, 107–184.
Torstensen BE, Lie O & Froyland L (2000) Lipid metabolism and
tissue composition in Atlantic salmon (Salmo salar L.) – effects
of capelin oil, palm oil, and oleic acid-enriched sunflower oil as
dietary lipid sources. Lipids 35, 653–664.
Torstensen BE, Froyland L & Lie O (2004) Replacing dietary fish oil
with increasing levels of rapeseed oil and olive oil – effects on Atlan-
tic salmon (Salmo salar L.) tissue and lipoprotein lipid composition
and lipogenic enzyme activities. Aquacult Nutr 10, 175–192.
Vanstone CA, Raeini-Sarjaz M, Parsons WE & Jones PJ (2002) Unes-
terified plant sterols and stanols lower LDL-cholesterol concen-
trations equivalently in hypercholesterolemic persons. Am J Clin
Nutr 76, 1272–1278.
Walzem RL, Storebakken T, Hung SS & Hansen RJ (1991) Relation-
ship between growth and selected liver enzyme activities of indi-
vidual rainbow trout. J Nutr 121, 1090–1098.
Watanabe T (1982) Lipid nutrition in fish. Comp Biochem Physiol B
Biochem Mol Biol 273, 3–15.
Zampelas A, Murphy M, Morgan LM & Williams CM (1994) Post-
prandial lipoprotein lipase, insulin and gastric inhibitory polypep-
tide responses to test meals of different fatty acid composition:
comparison of saturated, n-6 and n-3 polyunsaturated fatty acids.
Eur J Clin Nutr 48, 849–858.
Vegetable oils and lipid metabolism in fish 309