Oxysterol Binding Protein Induces Upregulation of SREBP-1c and Enhances Hepatic Lipogenesis
18
ISSN: 1524-4636 Copyright © 2007 American Heart Association. All rights reserved. Print ISSN: 1079-5642. Online 7272 Greenville Avenue, Dallas, TX 72514 Arteriosclerosis, Thrombosis, and Vascular Biology is published by the American Heart Association. DOI: 10.1161/ATVBAHA.106.138545 published online Feb 15, 2007; Arterioscler Thromb Vasc Biol Seppo Ylä-Herttuala, Matti Jauhiainen and Vesa M. Olkkonen Daoguang Yan, Markku Lehto, Laura Rasilainen, Jari Metso, Christian Ehnholm, Hepatic Lipogenesis Oxysterol Binding Protein Induces Upregulation of SREBP-1c and Enhances http://atvb.ahajournals.org/cgi/content/full/ATVBAHA.106.138545/DC1 Data Supplement (unedited) at: http://atvb.ahajournals.org located on the World Wide Web at: The online version of this article, along with updated information and services, is http://www.lww.com/reprints Reprints: Information about reprints can be found online at [email protected] 410-528-8550. E-mail: Fax: Kluwer Health, 351 West Camden Street, Baltimore, MD 21202-2436. Phone: 410-528-4050. Permissions: Permissions & Rights Desk, Lippincott Williams & Wilkins, a division of Wolters http://atvb.ahajournals.org/subscriptions/ Biology is online at Subscriptions: Information about subscribing to Arteriosclerosis, Thrombosis, and Vascular by on May 21, 2011 atvb.ahajournals.org Downloaded from
-
Upload
independent -
Category
Documents
-
view
1 -
download
0
Transcript of Oxysterol Binding Protein Induces Upregulation of SREBP-1c and Enhances Hepatic Lipogenesis

ISSN: 1524-4636 Copyright © 2007 American Heart Association. All rights reserved. Print ISSN: 1079-5642. Online
7272 Greenville Avenue, Dallas, TX 72514Arteriosclerosis, Thrombosis, and Vascular Biology is published by the American Heart Association.
DOI: 10.1161/ATVBAHA.106.138545 published online Feb 15, 2007; Arterioscler Thromb Vasc Biol
Seppo Ylä-Herttuala, Matti Jauhiainen and Vesa M. Olkkonen Daoguang Yan, Markku Lehto, Laura Rasilainen, Jari Metso, Christian Ehnholm,
Hepatic Lipogenesis Oxysterol Binding Protein Induces Upregulation of SREBP-1c and Enhances
http://atvb.ahajournals.org/cgi/content/full/ATVBAHA.106.138545/DC1Data Supplement (unedited) at:
http://atvb.ahajournals.org
located on the World Wide Web at: The online version of this article, along with updated information and services, is
http://www.lww.com/reprintsReprints: Information about reprints can be found online at
[email protected]. E-mail:
Fax:Kluwer Health, 351 West Camden Street, Baltimore, MD 21202-2436. Phone: 410-528-4050. Permissions: Permissions & Rights Desk, Lippincott Williams & Wilkins, a division of Wolters
http://atvb.ahajournals.org/subscriptions/Biology is online at Subscriptions: Information about subscribing to Arteriosclerosis, Thrombosis, and Vascular
by on May 21, 2011 atvb.ahajournals.orgDownloaded from

Oxysterol Binding Protein Induces Upregulation ofSREBP-1c and Enhances Hepatic Lipogenesis
Daoguang Yan, Markku Lehto, Laura Rasilainen, Jari Metso, Christian Ehnholm, Seppo Yla-Herttuala,Matti Jauhiainen, Vesa M. Olkkonen
Background—Oxysterol binding protein (OSBP) has previously been implicated as a sterol sensor that regulatessphingomyelin synthesis and the activity of extracellular signal-regulated kinases (ERK).
Methods and Results—We determined the effects of adenovirus-mediated hepatic overexpression of OSBP and itshomologues ORP1L and ORP3 on mouse serum lipids. Whereas ORP1L and ORP3 had no effect on serum lipids, OSBPinduced a marked increase of VLDL triglycerides (TG). Also, the liver tissue TG were elevated in the AdOSBP-injectedmice, and their TG secretion rate was increased by 70%. The messenger RNAs for enzymes of fatty acid synthesis andtheir transcriptional regulator, SREBP-1c, as well as the Insig-1 mRNA, were upregulated two-fold in the OSBP-expressing livers. No change occurred in the messages of liver X receptor target genes ABCA1, ABCG5, and CYP7A1,and the Insig-2a mRNA was reduced. The phosphorylation of ERK was decreased in AdOSBP-infected liver andcultured hepatocytes. Importantly, silencing of OSBP in hepatocytes suppressed the induction of SREBP1-c by insulinand resulted in a reduction of TG synthesis.
Conclusion—Our results demonstrate that OSBP regulates hepatic TG metabolism and suggest the involvement of OSBPin the insulin signaling pathways that control hepatic lipogenesis. (Arterioscler Thromb Vasc Biol. 2007;27:000-000.)
Key Words: OSBP � oxysterol binding protein � lipogenesis � liver � SREBP-1c� triglyceride synthesis � VLDL secretion
The liver plays a central role in triglyceride (TG) andcholesterol homeostasis. Complex regulatory circuits
within hepatocytes maintain the body lipid homeostasis undervarying environmental conditions. Hepatic lipid synthesesand fluxes are controlled by transcription factors that respondto signals from a variety of lipidous ligands. The synthesis ofcholesterol and fatty acids as well as the uptake of cholesteroland hepatic glucose use are controlled by sterol regulatoryelement binding proteins, SREBP.1,2 A two-step proteolyticcleavage of SREBP precursors occurs within the Golgicomplex and releases a basic helix-loop-helix-leucine zipper(bHLH-LZ) transcription factor denoted nuclear SREBP(nSREBP). The cleavage is controlled by the endoplasmicreticulum (ER) cholesterol content, which is sensed bySREBP cleavage activating protein (SCAP). SCAP, togetherwith Insig proteins, retains SREBP within the ER whencholesterol is abundant but escorts it to the Golgi complex oncholesterol depletion. In addition to cholesterol, exogenouslyadded oxysterol 25-hydroxycholesterol (25OH) is a potentinducer of SREBP activation, suggesting that also endoge-nous cellular oxysterols regulate the SREBP machinery.2 Ofthe 3 SREBPs, SREBP-1c is particularly abundant in the liverwhere its expression is regulated by insulin and glucagon, and
it plays a major role in controlling hepatic lipogenesis andglucose use.1,3 SREBP-2, also expressed at relatively highlevels in the liver, is responsible for control of cholesterolmetabolism. The third family member, SREBP-1a, functionsin both cholesterol and TG metabolism. In cultured cells,SREBP-1a is expressed at much higher levels than SREBP-1c.4 The cleavage of SREBP-1a and -2 precursors is regulatedby cholesterol status, whereas the expression and maturationof SREBP-1c are primarily regulated by nutritional factors.SREBP-1c expression in liver, white adipose tissue, andskeletal muscle is depressed during fasting but increaseswhen animals are re-fed a high carbohydrate diet, whereassuch manipulations induce only minor effects on the otherSREBP isoforms.1,3
Liver X receptors (LXR), central oxysterol-responsivenuclear receptors, form heterodimers with retinoid X receptor(RXR) and regulate a number of genes involved in hepaticfunctions such as bile acid synthesis, biliary sterol secretion,and synthesis of nascent high-density lipoproteins. LXRs alsoimpact on hepatic lipogenesis by controlling the expression ofSREBP-1c.5
Proteins displaying homology to the C-terminal ligandbinding domain of oxysterol binding protein (OSBP) are
Original received October 6, 2006; final version accepted January 23, 2007.From the Department of Molecular Medicine (D.Y., M.L., L.R., J.M., C.E., M.J., V.M.O.), National Public Health Institute, Biomedicum, Helsinki;
and A.I. Virtanen Institute (S.Y.-H.), University of Kuopio, Finland.Correspondence to Vesa M. Olkkonen, Department of Molecular Medicine, National Public Health Institute, Biomedicum, P.O.Box 104, FI-00251
Helsinki, Finland. E-mail [email protected]© 2007 American Heart Association, Inc.
Arterioscler Thromb Vasc Biol. is available at http://www.atvbaha.org DOI: 10.1161/ATVBAHA.106.138545
1 by on May 21, 2011 atvb.ahajournals.orgDownloaded from

present in practically all eukaryotic organisms.6 The OSBP-related proteins (ORP) have been implicated in diverseaspects of cellular physiology, including sterol and phospho-lipid metabolism, vesicle transport, and cell signaling. Thefounder member of the family, OSBP, was suggested to act asa sterol sensor that regulates the transport of ceramides fromthe ER to the Golgi apparatus for sphingomyelin synthesis.7
On the other hand, OSBP was reported to act as a sterol-dependent scaffolding protein that controls the activity ofextracellular signal regulated kinases, ERK.8 The presentstudy provides evidence that OSBP impacts on the expres-sion/maturation of SREBP-1c, the insulin responsiveness ofhepatic lipogenesis, and the serum levels of VLDL.
Materials and Methods
ReagentsThe antibodies and other special reagents used are specified in theonline supplement (available at http://atvb.ahajournals.org).
Construction of Recombinant AdenovirusesThe rabbit OSBP (acc. No. J05056) and human ORP1L and ORP3cDNAs (acc. Nos. AF323726 and NM_015550) were inserted intothe BglII site of pAdenovator-CMV5-IRES-GFP (QbioGene,Illkirch, France), and recombinant adenoviruses (AdOSBP,AdORP1L, AdORP3) generated in HEK293 cells as described in theonline supplement.
Intravenous Injections of C57B/6 MiceFemale C57B/6JOlaHsd mice were injected with recombinant ad-enoviruses as described (please see the online supplement).
Analysis of Plasma Lipids/Lipoproteins andHepatic LipidsPlasma and liver lipid concentrations were determined and lipopro-tein fractionation performed using standard methodology (for detailssee the online supplement).
Quantitative RT-PCRMessenger RNAs in liver tissue or cultured mouse Hepa1–6 hepa-toma cells were quantified by real-time RT-PCR as described in theonline supplement. Sequences of the primers used are listed insupplemental Table I.
Analysis of Nuclear and Precursor SREBPs inLiver TissueNuclear extracts were prepared from liver tissue as described.9 Forty�g of nuclear protein was analyzed by Western blotting (see theonline supplement) with monoclonal antibodies against SREBP-1 orSREBP-2. The precursor forms of the SREBPs were analyzed fromtissue total protein preparations.
Silencing of OSBP Expression and InsulinStimulation of Hepa-1 to -6 CellsMouse Hepa1–6 cells were transfected with OSBP-specific siRNAs(siOSBP.1, sense strand AGGCUACCAGCGGCGAUGGdTdT;siOSBP.2, sense strand GAUCCCAAUGCCGGUAAACdTdT) or ascrambled control siRNA (sense strand UAGCGACUAAACACAU-CAAdTdT; Sigma-Aldrich/Proligo) for 36 hours using the HiPerFectreagent (Qiagen), followed by incubation in serum-free medium inthe absence or presence of 100 nmol/L insulin (Sigma-Aldrich) for 6hours. Total RNA was thereafter isolated and the mRNAs for OSBP,SREBP-1c, and FAS quantified as described (see the onlinesupplement).
Assay for Triglyceride SynthesisHepa1–6 cells on 12-well plates were treated with control or OSBPsiRNAs and with 100 nmol/L insulin as above, and labeled for 3hours with [3H]oleic acid (7.0 Ci/mmol, GE Healthcare)-bovineserum albumin complexes (4.2 �Ci/well) as described.10 The syn-thesized TG were quantified according to.11
ResultsAdenoviral-Mediated Expression of OSBP,ORP1L, and ORP3 in Mouse LiverThe recombinant adenoviruses (AdOSBP, AdORP1L,AdORP3) or a control virus encoding GFP (AdGFP) wereinjected into female C57B/6 mice through the tail vein at theviral dose 5�108 pfu per animal. Each of the 3 OSBP/ORPproteins was efficiently expressed in the liver tissue ofinjected animals (Figure 1). The endogenous ORP1 andORP3 protein levels in mouse liver were under detectionthreshold by Western blotting with the available antibodies.However, the endogenous hepatic OSBP was readily detect-able. Densitometric analysis of the OSBP Western signalsrevealed that the AdOSBP transduction resulted in 4-foldoverexpression as compared with the endogenous proteinlevel.
Adenoviral-Mediated Expression of OSBPIncreases Plasma VLDL TG LevelsThe plasma total cholesterol, TG, and choline-containingphospholipid (PL) concentrations were determined for themice at 3, 5, and 7 days after Ad injection. The resultssummarized in the Table revealed a significant increase ofplasma TG in AdOSBP-injected animals as compared withAdGFP-injected controls at the 3- and 5-day time points,whereas AdOSBP transduction did not affect plasma choles-terol or PL levels. Expression of ORP1L or ORP3 had nosignificant effect on plasma lipid parameters. As comparedwith the values of uninjected C57B/6 mice, the plasmacholesterol and PL levels of all Ad-injected animals increasedduring the experiments, whereas the TG concentration in theAd-injected animals, except for the AdOSBP-transducedones, was lower than in the uninjected mice. Analysis of thedistribution of lipids in fast protein liquid (FPLC)-separatedlipoproteins revealed a marked increase of TG in the VLDLfractions for the plasma of AdOSBP-injected animals at all 3time points, whereas the distribution of cholesterol and PLremained unchanged (shown for 3 days in Figure 2A and 2B).
AdGFP AdOSBP/ORP
90
108
101
OSBP
ORP3
ORP1L
KDa
Figure 1. Western analysis of Ad-mediated OSBP/ORP overex-pression in mouse liver. Equal amounts (20 �g/lane) of liver totalprotein from mice after 3-day infection with AdGFP, AdOSBP,AdORP1L, or AdORP3 were resolved by SDS-PAGE and West-ern blotted using antibodies against OSBP, ORP1L, or ORP3(indicated on the left). The apparent molecular masses of theimmunoreactive proteins are indicated.
2 Arterioscler Thromb Vasc Biol. May 2007
by on May 21, 2011 atvb.ahajournals.orgDownloaded from

The relative increase of TG in the VLDL fractions was 95%at the 3-day time point, 64% at 5 days, and 52% at 7 days (the% values are representative of 2 plasma pools, 3 to 5 animalseach). Transduction with AdORP1L or AdORP3 had noeffect on the lipoprotein profile (data not shown; Figure 2C).SDS-PAGE analysis of apoB100 and apoB48 from lipopro-teins isolated from the plasma of AdGFP- or AdOSBP-transduced animals by ultracentrifugation at density 1.063g/mL revealed a 50% increase of apoB100 and 40% increaseof apoB48 in AdOSBP-injected animals (Figure 2D), dem-onstrating that not only the lipid but also the protein moietyof VLDL was increased.
Liver Tissue TG Are Increased inAdOSBP-Injected AnimalsPrompted by the observed increase of VLDL triglycerides inthe plasma of AdOSBP-injected animals, we analyzed lipidsin the liver tissue of these animals. A significant increase ofliver TG in AdOSBP-injected mice as compared withAdGFP-transduced controls was evident at the 3- and 5-daytime points (supplemental Table II). Histological analysis ofliver tissue on days 3 and 5 after infection revealed lipiddroplet accumulation, visualized as large unstained vacuolar-like structures, in the hepatocytes of AdOSBP-transducedanimals. These structures were absent in sections of AdGFP-infected liver (supplemental Figure I).
The Rate of TG Secretion Is Enhanced inAdOSBP-Injected MiceTo measure TG secretion rate, mice transduced withAdOSBP or AdGFP were injected with Triton WR1339, andplasma TG concentration as a function of time was moni-tored. The results show a significant increase in the slope ofthe TG secretion curve in AdOSBP injected animals ascompared with the controls (Figure 2E), which reflects anapproximately 1.7-fold increase in TG secretion rate (Figure2F).
The Lipogenic Pathway Genes Are Induced inOSBP Expressing AnimalsThe OSBP-induced increase of both plasma and livertissue TG as well as hepatic TG secretion rate suggestedthat the synthesis of fatty acids and TG is enhanced in theAdOSBP-transduced animals. We therefore quantified themRNAs for 3 major enzymes of the lipogenic pathway,acetyl-coenzyme A (CoA) synthetase (AceCS), fatty acidsynthase (FAS), and stearoyl CoA desaturase 1 (SCD-1) inliver tissue from AdOSBP- and AdGFP-injected animals atthe 3-day time point. All 3 mRNAs were found to besignificantly upregulated (AceCS, 2.1-fold; FAS, 2.1-fold;SCD-1, 2.0-fold) in AdOSBP-transduced liver as com-pared with AdGFP-injected controls. Furthermore, themessage for the major transcriptional regulator of thelipogenic pathway enzymes, SREBP-1c, was induced 1.8-fold (supplemental Figure II). No difference in the mRNAfor apolipoprotein A5, a regulator of TG metabolism, wasobserved between AdOSBP-transduced and control liver.Furthermore, the mRNA level of medium-chain acyl-CoAdehydrogenase (MCAD), a key enzyme in fatty acid�-oxidation, was not affected by AdOSBP transduction.Because the gene encoding SREBP-1c is target of LXR, wequantified the messages for LXR�, LXR�, and the LXRtargets ABCA1, ABCG5, and CYP7A1. All these mRNAswere unaffected by OSBP expression. We also quantifiedthe mRNAs for the main regulator of hepatic cholesterolhomeostasis, SREBP-2, and the major rate limiting en-zyme of the cholesterol biosynthetic pathway, 3-hydroxy-3-methylglutaryl (HMG)-CoA reductase. The latter wasmildly upregulated in OSBP expressing liver, whereas theSREBP-2 mRNA was not significantly altered. The matu-ration of SREBPs in the liver is controlled by Insig-2a, themRNA expression of which is subject to downregulationby insulin,12,13 and Insig-1, a variant induced by insu-lin.14,15 The Insig-2a mRNA was downregulated by 34%and the Insig-1 message upregulated by 60% in OSBP-expressing liver.
Plasma Lipids of Mice Transduced With Recombinant Adenoviruses (Ad) Expressing GFP (control), OSBP, ORP1L, or ORP3
Days post-inf. Chol1 mmol/l TG2 mmol/l PL3 mmol/l
AdGFP 3 1.86�0.124 0.58�0.04 1.50�0.09
5 2.31�0.09 0.48�0.04 2.19�0.16
7 2.75�0.10 0.62�0.06 2.54�0.18
AdOSBP 3 1.77�0.10 0.75�0.05** 1.48�0.12
5 2.29�0.12 0.73�0.04** 2.10�0.17
7 2.80�0.20 0.74�0.05* 2.44�0.21
AdORP1L 3 1.77�0.11 0.49�0.08 1.48�0.09
5 2.17�0.10 0.50�0.05 1.98�0.10
7 2.60�0.09 0.45�0.07 2.30�0.14
AdORP3 3 1.78�0.11 0.48�0.08 1.32�0.10
5 2.18�0.14 0.41�0.04 2.22�0.13
7 2.60�0.17 0.48�0.05 2.73�0.40
Uninjected 0 1.60�0.02 0.70�0.02 1.395
1Total cholesterol; 2Triglycerides; 3Choline-containing phospholipids.4Mean�SD; n�4 to 6; 5The value was measured for a pooled plasma sample.*P�0.05, **P�0.01; Student t test, comparison with corresponding AdGFP-transduced group.
Yan et al OSBP Enhances Hepatic Lipogenesis 3
by on May 21, 2011 atvb.ahajournals.orgDownloaded from

The Nuclear Form of SREBP-1c Is Increased inAdOSBP-Transduced LiverTo study whether the observed increase of SREBP-1c mRNAtranslates into an increase of mature nuclear SREBP-1c, weanalyzed by Western blotting nuclear fractions and totalprotein preparations of livers from mice infected for 3 dayswith AdGFP, AdOSBP, or AdORP3. As compared withAdGFP-transduced liver, the amount of nuclear SREBP-1cwas elevated by 128% (n�4, P�0.01) in the OSBP-expressing liver, whereas no change was observed innSREBP-2 (Figure 3). ORP3 overexpression had no impacton the level of either nSREBP-1c or nSREBP-2. The quantityof the SREBP precursor forms was not significantly affected
in AdOSBP- or AdORP3-transduced liver. These resultssuggest that not only the expression level but also theproteolytic activation of SREBP-1c or the stability ofnSREBP-1c is enhanced by OSBP overexpression.
OSBP Overexpression ReducesERK PhosphorylationBecause OSBP was reported to regulate the dephosphoryla-tion and thus the activity of ERKs,8 we analyzed by Westernblotting the ERK1/2 phosphorylation status in the liver ofAdGFP or AdOSBP-infected mice, as well as in the mousehepatocyte cell line Hepa1–6 transduced with the sameadenoviruses at a multiplicity of 100 pfu/cell. Analysis of the
AdORP3
0
0.05
0.1
0.15
0.2
14 19 24 29 34 39Fraction
mm
ol/l
Chol
TG
PL
AdGFP
00.020.040.060.080.1
0.120.140.160.180.2
14 19 24 29 34 39
Fraction
mm
ol/l
Chol
TG
PL
AdOSBP
00.020.040.060.08
0.10.120.140.160.18
0.2
14 19 24 29 34 39
Fraction
mm
ol/l
Chol
TG
PL
AdGFP AdOSBP
apoB-100
apoB-48
00.5
11.5
22.5
33.5
44.5
5
1 30 60 90
Time(min)
Pla
sma
TG
mm
ol/L
AdOSBP
AdGFP
**
**
**
*
**
A B
C D
E
00.20.40.60.8
11.21.41.61.8
2
AdGFP AdOSBP
Rel
ativ
e T
G
pro
duc
tio
n r
ate
F
**
Figure 2. Hepatic overexpression of OSBP induces an increase of VLDL triglycerides. Pooled plasma specimens (4 animals each) frommice infected with AdOSBP (A), AdGFP (B), or AdORP3 (C) were fractionated on a size exclusion column. Total cholesterol (Chol), tri-glycerides (TG), and choline-containing phospholipid (PL) concentrations in the fractions are shown. The position of VLDL is indicatedwith arrows. The data are representative of 2 pools analyzed with similar results. D, Coomassie blue-stained gel with apoB-containinglipoproteins (apoB48, apoB100) isolated by ultracentrifugation from plasma pools of AdGFP and AdOSBP-infected mice. E, TG secre-tion in AdGFP- and AdOSBP-infected mice monitored using the Triton WR1339 approach (mean�SD, n�6). F, Relative TG secretionrates calculated from the time courses (the rate for AdGFP-transduced animals was set at 1). *P�0.05; **P�0.01; Student t test.
4 Arterioscler Thromb Vasc Biol. May 2007
by on May 21, 2011 atvb.ahajournals.orgDownloaded from

ratio of pERK to total ERK revealed a significant 30%reduction of ERK phosphorylation in AdOSBP-transducedliver (Figure 4). In the Hepa1–6 cells, ERK phosphorylationwas reduced by almost 70%, supporting the view that OSBPis involved in regulation of the MEK–ERK pathway.
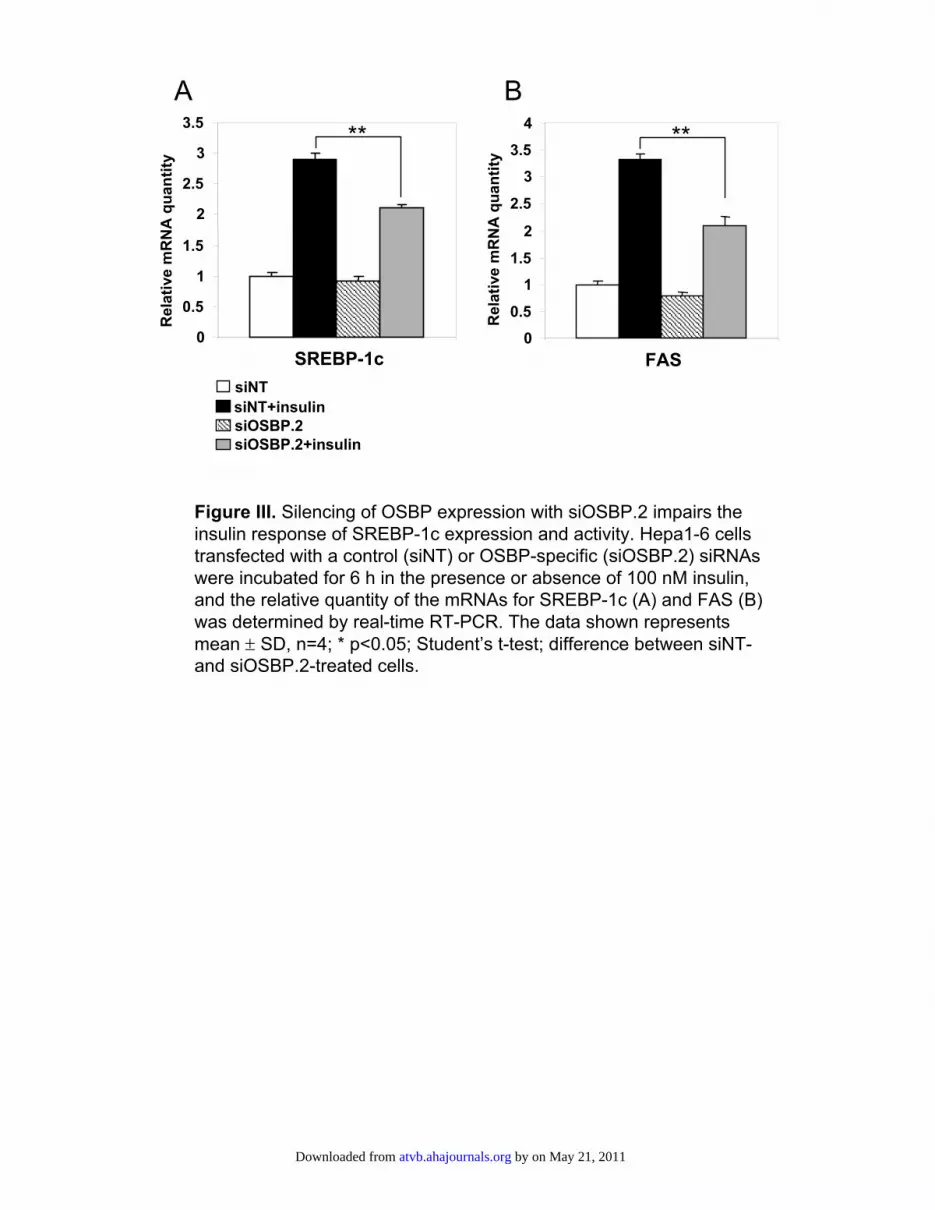
Silencing of OSBP Expression Disturbs SREBP-1cRegulation by InsulinThe observed effects of OSBP overexpression on SREBP-1cand its targets, as well as on Insig-1 and Insig-2a, are similarto the responses elicited in hepatocytes by insulin. Further-more, the ERKs are known to play an important role ininsulin signaling.16–18 We therefore silenced OSBP expres-sion in cultured hepatocytes and monitored whether thisaffects the enhancement of SREBP-1c expression and activityby insulin. The treatments with 2 independent siRNAs,siOSBP-1 and siOSBP-2, reduced the OSBP mRNA quantityby 92% to 93% (data not shown). The siRNA-transfectedcells were incubated with 100 nmol/L insulin for 6 hours,after which the mRNAs for SREBP-1c and its target fatty acidsynthase (FAS) were quantified. In cells treated with thecontrol siRNA, the insulin treatment induced a 180% increaseof the SREBP-1c message (Figure 5A) and 234% inductionof FAS mRNA (Figure 5B). In cells treated with siOSBP.1,both mRNAs were induced to a significantly lower degree(SREBP-1c, 126%; FAS, 161%; Figure 5A and 5B). Asimilar result was obtained with siOSBP.2 (supplementalFigure III). Silencing of OSBP thus inhibited the response ofSREBP-1c and FAS mRNAs to insulin by 30% to 35%. Thisprovides evidence for a role of OSBP in the relay of theinsulin signal to SREBP-1c.
Silencing of OSBP Expression Causes a Reductionof Triglyceride SynthesisWe next determined the effect of OSBP silencing on TGsynthesis in cells stimulated with insulin, by metaboliclabeling with [3H]oleic acid. The results revealed a significant30% reduction of [3H]oleic acid incorporation into TG in the
pSREBP-1c
nSREBP-1c
AdOSBP AdGFP
nSREBP-2
pSREBP-2
pSREBP-2
pSREBP-1c
nSREBP-1c
nSREBP-2
AdORP3 AdGFP
Figure 3. The nuclear form of SREBP-1c is increased inAdOSBP-transduced liver. Equal amounts of nuclear or totalprotein (40 �g/lane) from the liver of mice infected for 3 dayswith AdOSBP, AdGFP, or AdORP3 were Western blotted withanti-SREBP-1 or anti–SREBP-2. Data for 2 animals from eachgroup are shown. nSREBP-1c, nSREBP-2, the nuclear forms ofSREBP; pSREBP-1c, pSREBP-2, the precursor forms ofSREBP.
A
AdGFP AdOSBP
B
*
0
0.2
0.4
0.6
0.8
1
1.2
1.4
1.6
P-E
RK
/ER
K r
atio
-actin
ERK
P-ERK
AdGFP AdOSBP
-actin
ERK
P-ERK
**
0
0.2
0.4
0.6
0.8
1
1.2
1.4
1.6
P-E
RK
/ER
K r
atio
**
*
AdGFPAdOSBP
Figure 4. ERK phosphorylation is decreased on OSBP overexpression. Protein preparations from AdGFP- or AdOSBP-transduced liver(A) or the Hepa1–6 cell line infected with the recombinant adenoviruses (B) were Western blotted with antibodies against phospho-ERK1/2 (P-ERK), ERK1/2 (ERK), or �-actin. Data for 4 mice and 4 Hepa1–6 cell specimens are shown. The panels at the bottom repre-sent the phospho (P)-ERK/ERK ratio (in arbitrary units) obtained by densitometric quantification of the Western signals (mean�SD).*P�0.05; **P�0.01; Student t test; difference between AdGFP and AdOSBP-infected specimens.
Yan et al OSBP Enhances Hepatic Lipogenesis 5
by on May 21, 2011 atvb.ahajournals.orgDownloaded from
cells treated with siOSBP.1, as compared with cells incubatedwith control siRNA (Figure 5C). This shows that the reduc-tion in SREBP-1c and FAS mRNA expression by OSBPknock-down also translates to a reduced synthesis of TG.
DiscussionWe analyzed the effects of hepatic overexpression of OSBPor its homologues ORP1L and ORP3 on plasma lipids, toclarify the function of these proteins in lipid metabolism invivo. We show that moderate adenovirus-mediated OSBPoverexpression promotes hepatic lipogenesis concomitantwith enhancement of the expression of SREBP-1c and itstarget genes responsible for fatty acid synthesis. The effect isspecific for OSBP, as it was not observed in mice infectedwith adenoviruses encoding GFP, ORP1L, or ORP3.
OSBP was isolated as an oxysterol receptor anticipated tobe responsible for the transcriptional regulation of genesmaintaining cellular sterol homeostasis.19,20 This task was,however, found to be executed by the SREBPs.2 Nishimura etal21 demonstrated that silencing of OSBP expression in HeLacells has no effect on the 25OH-induced inhibition of HMG-CoA reductase and squalene epoxidase mRNA expression,implying that OSBP is not a major regulator of sterol
homeostasis. According to a simplistic scheme, OSBP couldact as a buffer for cellular oxysterols, thus tuning down theirinhibitory effects on SREBP activation. However, severalobservations argue against this interpretation. (1) Activationof SREBP-1c is only weakly affected by cellular sterols1; (2)Sequestration of oxysterols should lead to a general reductionof LXR transactivation potential, but we observed no changesin the mRNA expression of LXR target genes other thanSREBP-1c; (3) OSBP expression had no effect on plasmacholesterol status, and the hepatic cholesterol level was onlymildly affected.
We now show that OSBP overexpression increases TGlevels in both liver tissue and serum. Furthermore, silencingof OSBP expression in insulin-treated cultured hepatocytesreduces their TG synthesis. These alterations coincide withalterations of SREBP-1c expression and the abundance ofnuclear SREBP-1c. Hepatic overexpression of NH2-terminaltranscriptionally active SREBP-1a and SREBP-1c fragmentsin transgenic mice resulted in fatty liver but no elevation ofplasma TG,22 unlike in the present study. In the case ofSREBP-1a, the lack of plasma TG elevation was shown to beattributable to simultaneous upregulation of LDL receptorexpression, which masked the enhanced hepatic VLDL pro-
*
siOSBP.1+insulin
*
A
0
0.5
1
1.5
2
2.5
3
3.5
4
SREBP-1c
RelativemRNAquantity
siNTsiNT+insulinsiOSBP.1
*
0
0.5
1
1.5
2
2.5
3
3.5
4
FAS
B
0
2000
4000
6000
8000
10000
12000
14000
DPM/mgprotein
siNTsiOSBP.1
C
*
Figure 5. Silencing of OSBP expression impairs the insulin response of SREBP-1c expression and activity. Hepa1–6 cells transfectedwith a control (siNT) or OSBP-specific (siOSBP.1) siRNAs were incubated for 6 hours in the presence or absence of 100 nmol/L insulin,and the relative quantity of the mRNAs for SREBP-1c (A) and FAS (B) was determined by real-time RT-PCR. The data shown repre-sents mean �SD, n�5; *P�0.05; Student t test; difference between siNT- and siOSBP.1-treated cells. C, Cells were treated in a similarmanner with siRNAs and insulin, followed by determination of [3H]oleic acid incorporation into TG. The data represent DPM per mg cellprotein, mean�SD (n�5; *P�0.05).
6 Arterioscler Thromb Vasc Biol. May 2007
by on May 21, 2011 atvb.ahajournals.orgDownloaded from

duction.22,23 On the other hand, the absence of SREBP-1c wasshown to ameliorate fatty liver development in ob/ob mice.24
The relationship of hepatic TG accumulation and VLDLsecretion is complex.11,25 Overexpression of the nuclearforms of SREBP-1 represents an extreme situation leading togross alterations of hepatic lipid metabolism not comparableto the present study, in which the observed effects onlipogenesis and SREBP-1c expression/maturation were rela-tively mild.
Insulin induces lipogenesis via phosphoinositide-3-kinase(PI-3-K) and Akt-dependent signaling cascades that upregu-late SREBP-1c transcription.26–28 Moreover, insulin enhancesthe proteolytic activation of SREBP-1c and increases thehalf-life of nSREBP-1c.26,29 In addition to the PI-3-K/Aktsignaling pathway, the activity of SREBPs is subject toregulation by the MEK-ERK pathway.16–18 The presentfindings provide 3 mechanistic clues to the observed upregu-lation of SREBP-1c: (1) siRNA-mediated silencing of OSBPattenuates the response of SREBP-1c and FAS mRNA levelsto insulin; (2) OSBP decreases the expression of Insig-2a andincreases that of Insig-1, resembling the response of thesegenes to insulin; (3) ERK1/2 phosphorylation is significantlyreduced in the liver of AdOSBP-infected animals and inOSBP-expressing cultured hepatocytes.
How could OSBP affect the MEK–ERK signaling path-way? Wang et al8 showed that, with cholesterol bound, OSBPfacilitates the integrity of a cytosolic phosphatase complexthat dephosphorylates ERKs, resulting in their inactivation. Inthe presence of 25OH, the OSBP-phosphatase complex dis-sociated, leading to the hyperphosphorylation of ERKs.Consistent with the fact that cholesterol is in cells vastly moreabundant than oxysterols, our finding suggests that theoverexpressed OSBP tends to adopt a cholesterol-boundconformation facilitating the dephosphorylation of ERKs.Expression of Insig-1 is regulated by insulin in a MEK–ERK-dependent manner.17 Furthermore, Botolin et al30 recentlyshowed that the abundance of nSREBP-1 is regulated byERKs via control of proteasomal degradation. According tothe findings by Botolin et al, the increase of nuclearSREBP-1c in AdOSBP-transduced liver could be at least inpart attributable to reduction of phospho-ERK, resulting inincreased stability of the nSREBP-1c. However, alteration ofsignaling through the MEK-ERK pathway could also affectthe hepatic TG metabolism via other mechanisms.31
The results of both overexpression and silencing of OSBPdemonstrate a new function for the protein as a regulator ofhepatic TG metabolism. Furthermore, our findings suggestthe involvement of OSBP in the insulin signaling pathwaysthat control hepatic lipogenesis and play central roles in thedevelopment of insulin resistance and diabetes mellitus.
AcknowledgmentsWe are grateful to Sari Jarvelainen, Sari Nuutinen, Seija Puomilahti,and Pirjo Ranta for expert technical assistance.
Sources of FundingThe study was supported by grants from the Academy of Finland(206298, 113013, 118720), the Sigrid Juselius Foundation, theFinnish Foundation for Cardiovascular Research, the Magnus Ehrn-rooth Foundation, and the Finnish Society of Sciences and Letters.
DisclosuresNone.
References1. Eberle D, Hegarty B, Bossard P, Ferre P, Foufelle F. SREBP transcription
factors: master regulators of lipid homeostasis. Biochimie. 2004;86:839–848.
2. Goldstein JL, DeBose-Boyd RA, Brown MS. Protein sensors formembrane sterols. Cell. 2006;124:35–46.
3. Horton JD, Goldstein JL, Brown MS. SREBPs: activators of the completeprogram of cholesterol and fatty acid synthesis in the liver. J Clin Invest.2002;109:1125–1131.
4. Shimomura I, Shimano H, Horton JD, Goldstein JL, Brown MS. Differ-ential expression of exons 1a and 1c in mRNAs for sterol regulatoryelement binding protein-1 in human and mouse organs and cultured cells.J Clin Invest. 1997;99:838–845.
5. Tontonoz P, Mangelsdorf DJ. Liver X receptor signaling pathways incardiovascular disease. Mol Endocrinol. 2003;17:985–993.
6. Olkkonen VM. Oxysterol binding protein and its homologues: new reg-ulatory factors involved in lipid metabolism. Curr Opin Lipidol. 2004;15:321–327.
7. Perry RJ, Ridgway ND. Oxysterol-binding protein and vesicle-associatedmembrane protein-associated protein are required for sterol-dependentactivation of the ceramide transport protein. Mol Biol Cell. 2006;17:2604–2616.
8. Wang PY, Weng J, Anderson RG. OSBP is a cholesterol-regulatedscaffolding protein in control of ERK 1/2 activation. Science. 2005;307:1472–1476.
9. Blanquart C, Barbier O, Fruchart JC, Staels B, Glineur C. Peroxisomeproliferator-activated receptor alpha (PPARalpha) turnover by theubiquitin-proteasome system controls the ligand-induced expression levelof its target genes. J Biol Chem. 2002;277:37254–37259.
10. Leung KC, Ho KK. Stimulation of mitochondrial fatty acid oxidation bygrowth hormone in human fibroblasts. J Clin Endocrinol Metab. 1997;82:4208–4213.
11. Edvardsson U, Ljungberg A, Linden D, William-Olsson L, Peilot-SjogrenH, Ahnmark A, Oscarsson J. PPARalpha activation increases triglyceridemass and adipose differentiation-related protein in hepatocytes. J LipidRes. 2006;47:329–340.
12. Yabe D, Brown MS, Goldstein JL. Insig-2, a second endoplasmicreticulum protein that binds SCAP and blocks export of sterol regulatoryelement-binding proteins. Proc Natl Acad Sci U S A. 2002;99:12753–12758.
13. Yabe D, Komuro R, Liang G, Goldstein JL, Brown MS. Liver-specificmRNA for Insig-2 down-regulated by insulin: implications for fatty acidsynthesis. Proc Natl Acad Sci U S A. 2003;100:3155–3160.
14. Bortoff KD, Zhu CC, Hrywna Y, Messina JL. Insulin induction of pip 92,CL-6, and novel mRNAs in rat hepatoma cells. Endocrine. 1997;7:199–207.
15. Yang T, Espenshade PJ, Wright ME, Yabe D, Gong Y, Aebersold R,Goldstein JL, Brown MS. Crucial step in cholesterol homeostasis: sterolspromote binding of SCAP to INSIG-1, a membrane protein that facilitatesretention of SREBPs in ER. Cell. 2002;110:489–500.
16. Keeton AB, Amsler MO, Venable DY, Messina JL. Insulin signal trans-duction pathways and insulin-induced gene expression. J Biol Chem.2002;277:48565–48573.
17. Keeton AB, Bortoff KD, Franklin JL, Messina JL. Blockade of rapidversus prolonged extracellularly regulated kinase 1/2 activation has dif-ferential effects on insulin-induced gene expression. Endocrinology.2005;146:2716–2725.
18. Virkamaki A, Ueki K, Kahn CR. Protein-protein interaction in insulinsignaling and the molecular mechanisms of insulin resistance. J ClinInvest. 1999;103:931–943.
19. Dawson PA, Van der Westhuyzen DR, Goldstein JL, Brown MS. Puri-fication of oxysterol binding protein from hamster liver cytosol. J BiolChem. 1989;264:9046–9052.
20. Taylor FR, Saucier SE, Shown EP, Parish EJ, Kandutsch AA. Correlationbetween oxysterol binding to a cytosolic binding protein and potency inthe repression of hydroxymethylglutaryl coenzyme A reductase. J BiolChem. 1984;259:12382–12387.
21. Nishimura T, Inoue T, Shibata N, Sekine A, Takabe W, Noguchi N, AraiH. Inhibition of cholesterol biosynthesis by 25-hydroxycholesterol isindependent of OSBP. Genes Cells. 2005;10:793–801.
Yan et al OSBP Enhances Hepatic Lipogenesis 7
by on May 21, 2011 atvb.ahajournals.orgDownloaded from

22. Shimano H, Horton JD, Shimomura I, Hammer RE, Brown MS,Goldstein JL. Isoform 1c of sterol regulatory element binding protein isless active than isoform 1a in livers of transgenic mice and in culturedcells. J Clin Invest. 1997;99:846–854.
23. Horton JD, Shimano H, Hamilton RL, Brown MS, Goldstein JL. Dis-ruption of LDL receptor gene in transgenic SREBP-1a mice unmaskshyperlipidemia resulting from production of lipid-rich VLDL. J ClinInvest. 1999;103:1067–1076.
24. Yahagi N, Shimano H, Hasty AH, Matsuzaka T, Ide T, Yoshikawa T,Amemiya-Kudo M, Tomita S, Okazaki H, Tamura Y, Iizuka Y, Ohashi K,Osuga J, Harada K, Gotoda T, Nagai R, Ishibashi S, Yamada N. Absenceof sterol regulatory element-binding protein-1 (SREBP-1) amelioratesfatty livers but not obesity or insulin resistance in Lep(ob)/Lep(ob) mice.J Biol Chem. 2002;277:19353–19357.
25. Li L, Stillemark-Billton P, Beck C, Bostrom P, Andersson L, Rutberg M,Ericsson J, Magnusson B, Marchesan D, Ljungberg A, Boren J, OlofssonSO. Epigallocatechin gallate increases the formation of cytosolic lipiddroplets and decreases the secretion of apoB-100 VLDL. J Lipid Res.2006;47:67–77.
26. Hegarty BD, Bobard A, Hainault I, Ferre P, Bossard P, Foufelle F.Distinct roles of insulin and liver X receptor in the induction and cleavage
of sterol regulatory element-binding protein-1c. Proc Natl Acad SciU S A. 2005;102:791–796.
27. Ribaux PG, Iynedjian PB. Analysis of the role of protein kinase B(cAKT) in insulin-dependent induction of glucokinase and sterol regu-latory element-binding protein 1 (SREBP1) mRNAs in hepatocytes.Biochem J. 2003;376:697–705.
28. Shimomura I, Bashmakov Y, Ikemoto S, Horton JD, Brown MS,Goldstein JL. Insulin selectively increases SREBP-1c mRNA in the liversof rats with streptozotocin-induced diabetes. Proc Natl Acad Sci U S A.1999;96:13656–13661.
29. Yellaturu CR, Deng X, Cagen LM, Wilcox HG, Park EA, Raghow R,Elam MB. Posttranslational processing of SREBP-1 in rat hepatocytes isregulated by insulin and cAMP. Biochem Biophys Res Commun. 2005;332:174–180.
30. Botolin D, Wang Y, Christian B, Jump DB. Docosahexaneoic acid (22:6,n-3) regulates rat hepatocyte SREBP-1 nuclear abundance by Erk- and26S proteasome-dependent pathways. J Lipid Res. 2006;47:181–192.
31. Andersson L, Bostrom P, Ericson J, Rutberg M, Magnusson B,Marchesan D, Ruiz M, Asp L, Huang P, Frohman MA, Boren J, OlofssonSO. PLD1 and ERK2 regulate cytosolic lipid droplet formation. J CellSci. 2006;119:2246–2257.
8 Arterioscler Thromb Vasc Biol. May 2007
by on May 21, 2011 atvb.ahajournals.orgDownloaded from

1
Materials and Methods Reagents
Rabbit polyclonal and mouse monoclonal antibodies against OSBP were kind gifts from
Drs. Ignacio Rodriguez (NIH, Bethesda, MD) and Neale Ridgway (Dalhousie Univ.,
Halifax, Canada). Rabbit antibodies against ORP1L and ORP3 were described in
(Johansson et al., Mol Biol Cell. 2005;16:5480-92) and in (Lehto et al., Cell Tissue Res.
2004;315:39-57), respectively. The monoclonal anti-SREBP-1 (clone 2A4) was from BD
Biosciences (Erembodegem, Belgium) and anti-SREBP-2 (clone 1C6) from BD
Biosciences (San Jose, CA). Antibodies against p44/42 MAP kinase (ERK1/2) and
phospho-p44/42 MAP kinase were from Cell Signaling Technology (Danvers, MA).
Triton WR1339 (Tyloxapol) and bovine insulin were from Sigma-Aldrich (St. Louis,
MO).
Construction of recombinant adenoviruses
The rabbit OSBP (acc. No. J05056) and human ORP1L and ORP3 cDNAs (acc. Nos.
AF323726 and NM_015550) were inserted into the BglII site of pAdenovator-CMV5-
IRES-GFP (QbioGene, Illkirch, France), and recombinant adenoviruses (AdOSBP,
AdORP1L, AdORP3) generated in HEK293 cells using the AdEasy system according to
the manufacturer’s instructions. The amino acid identity of rabbit OSBP and human
ORP1L and ORP3 with their mouse counterparts is 96%, 92%, and 91%, respectively. A
control adenovirus encoding GFP alone (AdGFP) was generated from the plain
pAdenovator transfer vector. The recombinant viruses were plaque purified, expanded
and purified on CsCl gradients as previously described (Laitinen et al., Hum Gene Ther.
1998;9:1481-6).
.
Intravenous injections of C57B/6 mice
Female C57B/6JOlaHsd mice were purchased from Harlan Nederland (AD Horst, the
Netherlands), housed in a humidity (40-50%) and temperature (21-22 oC) controlled
room with a 12:12 h dark/light cycle, and maintained on Rat&Mouse Maintenance Diet
1324 (Altromin, Lage, Germany). For adenovirus injections, 10-week-old animals were
by on May 21, 2011 atvb.ahajournals.orgDownloaded from

2
calmed with Hypnorm-Dormicum (Vetapharma, Leeds, UK) and injected through the tail
vein with 5 x 10⁸ pfu of adenovirus in PBS per mouse. At 3, 5, or 7 days after injection,
the animals were fasted for 5 h, and blood and liver tissue samples were collected. One
mg/ml EDTA was immediately added in the blood samples and plasma prepared by
centrifugation. To determine the hepatic TG secretion rate, animals were fasted overnight
and, on day 5 after adenoviral infection, injected through the tail vein with 500 mg/kg
body weight of Triton WR1339, and blood samples were withdrawn from the tail at 0, 15,
30, 60, and 90 min. All animal protocols were carried out according to a license (# STU
446A) from the regional government of Southern Finland.
Analysis of plasma lipids and lipoproteins
Total plasma cholesterol (Kit 1489232, Roche Diagnostics GmbH, Mannheim,
Germany), choline-containing phospholipids (Kit 990-54009, Wako Chemicals GmbH,
Neuss, Germany) and triglycerides (Kit 1488872, Roche Diagnostics) were measured
using fully enzymatic methods. Serum lipoproteins were fractionated by fast-performance
liquid chromatography (FPLC) using a Superose 6HR 10/30 size-exclusion
chromatography column (GE Healthcare, Buckinghamshire, UK). The column was
equilibrated with Tris-buffered saline (10 mM Tris-HCL, 150 mM NaCl, pH 7.4) at a
flow rate of 0.5 ml/min and 0.5 ml fractions were collected for lipid analyses. Serum
pools from 3-5 mice (vol. 200 µl) were analyzed. The apolipoprotein B (apoB)-
containing lipoproteins were isolated from plasma by ultracentrifugation. Briefly, 200 µl
of pooled plasma was adjusted to density 1.055g/ml, placed in a 3 ml tube, and overlaid
with 1.8 ml of δ=1.063g/ml NaBr solution. The specimens were spun at 400,000 x g for 3
hours in Optima TL Ultracentrifuge (Beckman, Brea, CA). The top 0.6 ml of solution,
which contains the apoB-rich particles, was concentrated by Nanosep Centrifugal
Devices (Pall Life Sciences, Dreieich, Germany). To analyze the apolipoprotein
composition, the isolated apoB-rich particles (20 µl, corresponding to 20 µl plasma) were
run on 5% SDS-PAGE gels and the proteins visualized by Coomassie Blue Staining.
by on May 21, 2011 atvb.ahajournals.orgDownloaded from
3
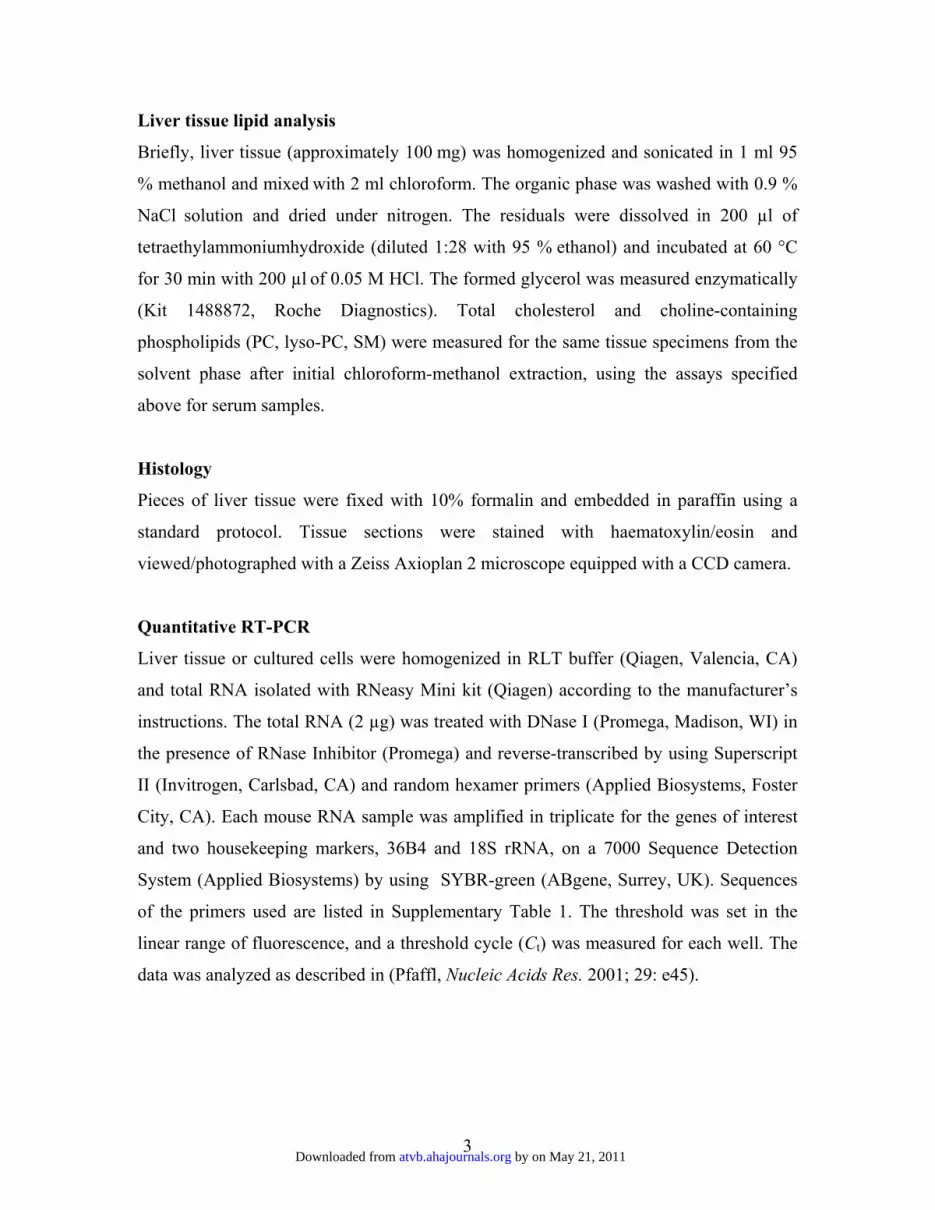
Liver tissue lipid analysis
Briefly, liver tissue (approximately 100 mg) was homogenized and sonicated in 1 ml 95
% methanol and mixed with 2 ml chloroform. The organic phase was washed with 0.9 %
NaCl solution and dried under nitrogen. The residuals were dissolved in 200 µl of
tetraethylammoniumhydroxide (diluted 1:28 with 95 % ethanol) and incubated at 60 °C
for 30 min with 200 µl of 0.05 M HCl. The formed glycerol was measured enzymatically
(Kit 1488872, Roche Diagnostics). Total cholesterol and choline-containing
phospholipids (PC, lyso-PC, SM) were measured for the same tissue specimens from the
solvent phase after initial chloroform-methanol extraction, using the assays specified
above for serum samples.
Histology
Pieces of liver tissue were fixed with 10% formalin and embedded in paraffin using a
standard protocol. Tissue sections were stained with haematoxylin/eosin and
viewed/photographed with a Zeiss Axioplan 2 microscope equipped with a CCD camera.
Quantitative RT-PCR
Liver tissue or cultured cells were homogenized in RLT buffer (Qiagen, Valencia, CA)
and total RNA isolated with RNeasy Mini kit (Qiagen) according to the manufacturer’s
instructions. The total RNA (2 µg) was treated with DNase I (Promega, Madison, WI) in
the presence of RNase Inhibitor (Promega) and reverse-transcribed by using Superscript
II (Invitrogen, Carlsbad, CA) and random hexamer primers (Applied Biosystems, Foster
City, CA). Each mouse RNA sample was amplified in triplicate for the genes of interest
and two housekeeping markers, 36B4 and 18S rRNA, on a 7000 Sequence Detection
System (Applied Biosystems) by using SYBR-green (ABgene, Surrey, UK). Sequences
of the primers used are listed in Supplementary Table 1. The threshold was set in the
linear range of fluorescence, and a threshold cycle (Ct) was measured for each well. The
data was analyzed as described in (Pfaffl, Nucleic Acids Res. 2001; 29: e45).
by on May 21, 2011 atvb.ahajournals.orgDownloaded from

4
Western blotting
Proteins specimens for SDS-PAGE were prepared by homogenizing liver tissue or
cultured cells in 250 mM Tris-HCl, pH 6.8, 8% SDS, protease inhibitor cocktail (Roche
Diagnostics). The crude extracts were cleared by centrifugation at 16,000 x g for 3 min,
and protein concentration of the supernatant determined by the DC assay (BioRad,
Hercules, CA). The proteins were electrophoresed and Western blotted using the primary
antibodies specified above. The bound antibodies were visualized by using horseradish
peroxidase-conjugated goat anti-mouse or anti-rabbit IgG (Bio-rad, Hercules, CA) and
enhanced chemiluminescence (ECL; GE Healthcare).
by on May 21, 2011 atvb.ahajournals.orgDownloaded from

Table I. Oligonucleotide primers used for mRNA quantification by real-time RT-PCR
The abbreviations are: SREBP, sterol regulatory element binding protein; FAS, fatty acid synthetase; AceCS, acetyl coenzyme A synthetase; SCD-1, stearoyl coenzyme A desaturase 1; MCAD, medium-chain acyl-coenzyme A dehydrogenase; apoA5, apolipoprotein a5; HMGCoAR, 3-hydroxy-3-methylglutaryl coenzyme A reductase; LXR, liver X receptor; ABC, ATP-binding cassette transporter; CYP7A1, gene encoding cholesterol-7α-hydroxylase; Insig, insulin-induced gene; OSBP, oxysterol binding protein; 36B4, acidic ribosomal phosphoprotein 36B4
mRNA Forward primer 5’-3’ Reverse primer 5’- 3’ SREBP-1c gga gcc atg gat tgc aca tt gct tcc aga gag gag gcc ag FAS gct gcg gaa act tca gga aat aga gac gtg tca ctc ctg gac tt AceCS gct gcc gac ggg atc ag tcc aga cac att gag cat gtc at SCD-1 ccg gag acc cct tag atc ga tag cct gta aaa gat ttc tgc aaa cc MCAD gat cgc aat ggg tgc ttt tga tag aa agc tga ttg gca atg tct cca gca aa apoA5 ctc tgt ccc aca aac tca cac g agg tag gtg tca tgc cga aaa g SREBP-2 gcg ttc tgg aga cca tgg a aca aag ttg ctc tga aaa caa atc a HMGCoAR ctt gtg gaa tgc ctt gtg att g agc cga agc agc aca tga t LXRα ggg agg agt gtg tgc tgt cag gag cgc ctg tta cac tgt tgc LXRβ aag cag gtg cca ggg ttc t tgc att ctg tct cgt ggt tgt ABCA1 cgt ttc cgg gaa gtg tcc ta gct aga gat gac aag gag gat gga ABCG5 tgg atc caa cac ctc tat gct aaa ggc agg ttt tct cga tga act g CYP7A1 agc aac taa aca acc tgc cag tac ta gtc cgg ata ttc aag gat gca Insig-1 tgc aga tcc agc gga atg t cca ggc gga gga gga gat g Insig-2a tgt gag ctg gac tag ctt gct cct aag ccg taa aac aaa atg OSBP gta cca tca acc tcg cca cag act ctt cat ctc ctg agt cat c 18SrRNA ggg agc ctg aga aac ggc ggg tcg gga gtg ggt aat ttt 36B4 cat gct caa cat ctc ccc ctt ctc c ggg aag gtg taa tcc gtc tcc aca g
by on May 21, 2011 atvb.ahajournals.orgDownloaded from

Table II. Hepatic lipids in mice transduced with AdGFP or AdOSBP
1Total cholesterol, 2Triglycerides, 3Choline-containing phospholipids per gram tissue 4Mean ± SD; n = 4-6 * p<0.05, ** p<0.01; Student’s t-test, comparison with corresponding AdGFP-transduced group
Days post-inf. Chol1 µmol/g TG2 µmol/g PL3 µmol/g AdGFP 3 4.32 ± 0.304 8.76 ± 0.54 6.18 ± 0.48 5 3.78 ± 0.30 6.12 ± 0.90 10.38 ± 0.24 7 3.66 ± 0.42 3.90 ± 0.24 12.42 ± 1.08 AdOSBP 3 2.88 ± 0.60 11.10 ± 0.60* 6.42 ± 0.72 5 2.82 ± 0.30 9.84 ± 0.48** 11.52 ± 0.84 7 3.06 ± 0.36 5.10 ± 0.36 11.40 ± 0.48
by on May 21, 2011 atvb.ahajournals.orgDownloaded from

AdGFP AdOSBP
Figure I. Histological observation reveals hepatic steatosis in AdOSBP-infected mice. Liver tissue from mice injected with AdGFP or AdOSBP was, on day 3 post-infection, fixed with formalin, embedded in paraffin and stained with haematoxylin/eosin. Neutral lipid accumulation in hepatocytes is seen as unstained structures in the cytoplasm (arrows).
by on May 21, 2011 atvb.ahajournals.orgDownloaded from

0
0.5
1
1.5
2
2.5
FAS
AceCS
SCD-1
SREBP-1c
Insig-2a
apoA5
MCAD
Rel
ativ
e m
RN
A q
uant
ity AdGFPAdOSBP
0
0.5
1
1.5
2
2.5
LXRß
CYP7A1
ABCG5
ABCA1
SREBP-2
HMG-CoAR
Insig-1
Rel
ativ
e m
RN
A q
uant
ity AdGFPAdOSBP
** ** ** *
*
**
LXRα
Figure II. Transcripts of the lipogenic pathway genes are up-regulated in OSBP expressing animals. Total RNA isolated on day 3 post-infection from the liver of mice transduced with AdGFP or AdOSBPwas subjected to real-time RT-PCR analysis of selected mRNAs (identified at the bottom) using a SYBR-green assay. Relative mRNA quantity is shown. The value for AdGFP-transduced liver was set at 1. The data represents a mean ± SD from 4 animals. * p<0.05; ** p<0.01; Student’s t-test; difference between AdGFP and AdOSBP-infected mice.
by on May 21, 2011 atvb.ahajournals.orgDownloaded from
0
0.5
1
1.5
2
2.5
3
3.5
Rel
ativ
e m
RN
A q
uant
ity
0
0.5
11.5
2
2.5
33.5
4
1
Rel
ativ
e m
RN
A q
uant
ity
siNTsiNT+insulinsiOSBP.2siOSBP.2+insulin
Figure III. Silencing of OSBP expression with siOSBP.2 impairs the insulin response of SREBP-1c expression and activity. Hepa1-6 cells transfected with a control (siNT) or OSBP-specific (siOSBP.2) siRNAswere incubated for 6 h in the presence or absence of 100 nM insulin, and the relative quantity of the mRNAs for SREBP-1c (A) and FAS (B) was determined by real-time RT-PCR. The data shown represents mean ± SD, n=4; * p<0.05; Student’s t-test; difference between siNT-and siOSBP.2-treated cells.
SREBP-1c FAS
** **
A B
by on May 21, 2011 atvb.ahajournals.orgDownloaded from