Maternal high-fat feeding primes steatohepatitis in adult mice offspring, involving mitochondrial...
13
Maternal High-Fat Feeding Primes Steatohepatitis in Adult Mice Offspring, Involving Mitochondrial Dysfunction and Altered Lipogenesis Gene Expression Kimberley D. Bruce, 1 Felino R. Cagampang, 1 Marco Argenton, 2 Junlong Zhang, 3 Priya L. Ethirajan, 1 Graham C. Burdge, 1 Adrian C. Bateman, 4 Geraldine F. Clough, 1 Lucilla Poston, 2 Mark A. Hanson, 1 Josie M. McConnell, 2 and Christopher D. Byrne 1 Nonalcoholic fatty liver disease (NAFLD) describes an increasingly prevalent spectrum of liver disor- ders associated with obesity and metabolic syndrome. It is uncertain why steatosis occurs in some individuals, whereas nonalcoholic steatohepatitis (NASH) occurs in others. We have generated a novel mouse model to test our hypothesis: that maternal fat intake contributes to the development of NAFLD in adult offspring. Female mice were fed either a high-fat (HF) or control chow (C) diet before and during gestation and lactation. Resulting offspring were fed either a C or a HF diet after weaning, to generate four offspring groups; HF/HF, HF/C, C/HF, C/C. At 15 weeks of age, liver histology was normal in both the C/C and HF/C offspring. Kleiner scoring showed that although the C/HF off- spring developed nonalcoholic fatty liver, the HF/HF offspring developed NASH. At 30 weeks, histological analysis and Kleiner scoring showed that both the HF/C and C/HF groups had NAFLD, whereas the HF/HF had a more severe form of NASH. Therefore, exposure to a HF diet in utero and during lactation contributes toward NAFLD progression. We investigated the mechanisms by which this developmental priming is mediated. At 15 weeks of age, hepatic mitochondrial electron transport chain (ETC) enzyme complex activity (I, II/III, and IV) was reduced in both groups of offspring from HF-fed mothers (HF/C and HF/HF). In addition, measurement of hepatic gene expression indicated that lipogenesis, oxidative stress, and inflammatory pathways were up-regulated in the 15-week-old HF/C and HF/HF offspring. Conclusion: Maternal fat intake contributes toward the NAFLD pro- gression in adult offspring, which is mediated through impaired hepatic mitochondrial metabolism and up-regulated hepatic lipogenesis. (HEPATOLOGY 2009;50:1796-1808.) See Editorial on Page 1696. N onalcoholic fatty liver disease (NAFLD) is one of the most common causes of chronic liver dis- ease in Western countries. 1 The pathogenesis of NAFLD is the subject of substantial research interest, be- cause its incidence in adults and children is rising rapidly because of ongoing epidemics of obesity and type 2 dia- betes. 2,3 NAFLD occurs commonly with metabolic syn- drome (central obesity, type 2 diabetes, dyslipidemia, and cardiovascular disease) and is considered the hepatic man- ifestation of this condition. 4-6 Recent estimates of preva- lence in the United States are 20% to 30% for hepatic steatosis and 3.5% to 5% for nonalcoholic steatohepatitis Abbreviations: C, control; C/C, control fed offspring from control fed dams; C/HF, high fat fed offspring from control fed dams; ETC, electron transport chain; HF, high fat; HF/C, control fed offspring from high fat fed dams; HF/HF, high fat fed offspring from high fat fed dams; NAFLD, nonalcoholic fatty liver disease; NASH, nonalcoholic steatohepatitis; PCR, polymerase chain reaction; TAG, triacylglycerol; TG, triglyceride. From the 1 Institute of Developmental Sciences, University of Southampton, Southampton General Hospital, Southampton, UK; the 2 Maternal and Fetal Research Unit, Division of Reproduction and Endocrinology, Kings College London, London, UK; the 3 Clinical Science Research Institute, University Warwick Medical School, University Hospital—Walsgrave Campus, Coventry, UK; and the 4 Histopathology Unit, Southampton General Hospital, Southampton, UK. Received May 1, 2009; accepted July 28, 2009. Supported by a Grant from the UK Biotechnology and Biological Sciences Research Council awarded to C.D.B. Address reprint requests to: Dr. Kimberley Bruce, University of Southampton, Southampton General Hospital, Institute of Developmental Sciences, Mailpoint 887 (DOHaD Division), Tremona Road, Southampton SO16 6YD, United Kingdom. E-mail: [email protected] fax: 02380-785255. Copyright © 2009 by the American Association for the Study of Liver Diseases. Published online in Wiley InterScience (www.interscience.wiley.com). DOI 10.1002/hep.23205 Potential conflict of interest: Nothing to report. Additional Supporting Information may be found in the online version of this article. 1796
-
Upload
independent -
Category
Documents
-
view
0 -
download
0
Transcript of Maternal high-fat feeding primes steatohepatitis in adult mice offspring, involving mitochondrial...
Maternal High-Fat Feeding Primes Steatohepatitis inAdult Mice Offspring, Involving Mitochondrial
Dysfunction and Altered Lipogenesis Gene ExpressionKimberley D. Bruce,1 Felino R. Cagampang,1 Marco Argenton,2 Junlong Zhang,3 Priya L. Ethirajan,1
Graham C. Burdge,1 Adrian C. Bateman,4 Geraldine F. Clough,1 Lucilla Poston,2 Mark A. Hanson,1 Josie M. McConnell,2
and Christopher D. Byrne1
Nonalcoholic fatty liver disease (NAFLD) describes an increasingly prevalent spectrum of liver disor-ders associated with obesity and metabolic syndrome. It is uncertain why steatosis occurs in someindividuals,whereasnonalcoholicsteatohepatitis (NASH)occurs inothers.Wehavegeneratedanovelmouse model to test our hypothesis: that maternal fat intake contributes to the development ofNAFLDinadultoffspring.Femalemicewerefedeitherahigh-fat (HF)orcontrolchow(C)dietbeforeand during gestation and lactation. Resulting offspring were fed either a C or a HF diet after weaning,to generate four offspring groups; HF/HF, HF/C, C/HF, C/C. At 15 weeks of age, liver histology wasnormal in both the C/C and HF/C offspring. Kleiner scoring showed that although the C/HF off-spring developed nonalcoholic fatty liver, the HF/HF offspring developed NASH. At 30 weeks,histological analysis and Kleiner scoring showed that both the HF/C and C/HF groups had NAFLD,whereas the HF/HF had a more severe form of NASH. Therefore, exposure to a HF diet in utero andduring lactation contributes toward NAFLD progression. We investigated the mechanisms by whichthis developmental priming is mediated. At 15 weeks of age, hepatic mitochondrial electron transportchain (ETC) enzyme complex activity (I, II/III, and IV) was reduced in both groups of offspring fromHF-fed mothers (HF/C and HF/HF). In addition, measurement of hepatic gene expression indicatedthat lipogenesis, oxidative stress, and inflammatory pathways were up-regulated in the 15-week-oldHF/C and HF/HF offspring. Conclusion: Maternal fat intake contributes toward the NAFLD pro-gression in adult offspring, which is mediated through impaired hepatic mitochondrial metabolismand up-regulated hepatic lipogenesis. (HEPATOLOGY 2009;50:1796-1808.)
See Editorial on Page 1696.
Nonalcoholic fatty liver disease (NAFLD) is oneof the most common causes of chronic liver dis-ease in Western countries.1 The pathogenesis of
NAFLD is the subject of substantial research interest, be-cause its incidence in adults and children is rising rapidly
because of ongoing epidemics of obesity and type 2 dia-betes.2,3 NAFLD occurs commonly with metabolic syn-drome (central obesity, type 2 diabetes, dyslipidemia, andcardiovascular disease) and is considered the hepatic man-ifestation of this condition.4-6 Recent estimates of preva-lence in the United States are 20% to 30% for hepaticsteatosis and 3.5% to 5% for nonalcoholic steatohepatitis
Abbreviations: C, control; C/C, control fed offspring from control fed dams; C/HF, high fat fed offspring from control fed dams; ETC, electron transport chain; HF, highfat; HF/C, control fed offspring from high fat fed dams; HF/HF, high fat fed offspring from high fat fed dams; NAFLD, nonalcoholic fatty liver disease; NASH, nonalcoholicsteatohepatitis; PCR, polymerase chain reaction; TAG, triacylglycerol; TG, triglyceride.
From the 1Institute of Developmental Sciences, University of Southampton, Southampton General Hospital, Southampton, UK; the 2Maternal and Fetal Research Unit,Division of Reproduction and Endocrinology, Kings College London, London, UK; the 3Clinical Science Research Institute, University Warwick Medical School, UniversityHospital—Walsgrave Campus, Coventry, UK; and the 4Histopathology Unit, Southampton General Hospital, Southampton, UK.
Received May 1, 2009; accepted July 28, 2009.Supported by a Grant from the UK Biotechnology and Biological Sciences Research Council awarded to C.D.B.Address reprint requests to: Dr. Kimberley Bruce, University of Southampton, Southampton General Hospital, Institute of Developmental Sciences, Mailpoint 887
(DOHaD Division), Tremona Road, Southampton SO16 6YD, United Kingdom. E-mail: [email protected] fax: 02380-785255.Copyright © 2009 by the American Association for the Study of Liver Diseases.Published online in Wiley InterScience (www.interscience.wiley.com).DOI 10.1002/hep.23205Potential conflict of interest: Nothing to report.Additional Supporting Information may be found in the online version of this article.
1796
(NASH), and up to 80% of people with type 2 diabetesmay have some form of NAFLD.7,8 NAFLD is linked toexcessive triglyceride (TG) accumulation and encom-passes a broad spectrum of liver disease, ranging fromsimple fatty liver (steatosis) to nonalcoholic steatohepati-tis (NASH) with fibrosis that may progress to liver cirrho-sis, portal hypertension, and even hepatocellularcarcinoma.5,9
It is unlikely that such a high prevalence of NAFLDcan be explained by obesity alone, because not all obeseindividuals develop NAFLD, and not all individuals withsimple steatosis progress to NASH. In fact, the patho-genic mechanisms involved in the disease progressionfrom simple steatosis to NASH are uncertain. One can-didate factor for disease progression is maternal obesity,since one third of women at childbearing age in theUnited States are currently obese.10 Maternal obesity atconception has been shown to alter gestational metabo-lism and affects placental, embryonic, and fetal growthand development.10 In addition, there is increasing evi-dence to show that exposure to poor nutrition in thedevelopmental environment increases the risk of develop-ing noncommunicable disease, specifically features of themetabolic syndrome such as dysglycemia, type 2 diabetes,and obesity later in life.11-18 Our group has recently pre-sented preliminary data to suggest that maternal high fatfeeding can influence the development of hepatic steatosisin adult (36-week-old) mice.19 However, the role of ma-ternal nutrition on the development of more severeNASH onset in adulthood is unknown. More impor-tantly, the biochemical and molecular mechanisms un-derlying this increased susceptibility are yet to bedetermined.
Because mitochondria are a major site of fatty acidoxidation and are maternally inherited, they provide anideal candidate mechanism for the inheritance of diet-induced maternal stress. Mitochondrial dysfunction haspreviously been described in animal models and in humanpatients with diet-induced NASH.20-26 Specifically, adultrats fed a high-fat diet for several weeks have been shownto exhibit hepatic steatosis, reduced electron transportchain (ETC) capacity, and increased oxidative stress inliver mitochondria.27 However, hepatic mitochondrialimpairment and hepatic steatosis resulting from a high-fatdiet fed early in development has not previously beendescribed.
NAFLD is primarily a result of inappropriate fat stor-age, an issue that is emerging as central to the pathogenesisof metabolic syndrome components such as insulin resis-tance and cardiovascular disease. Any mechanism leadingto “ectopic” fat accumulation, influenced by nutrition inthe developmental period, must involve persistent alter-
ations in lipid homeostasis. Recently, several mouse mod-els have helped to clarify the molecular mechanismsleading to the development of hepatic steatosis in thepathogenesis of NAFLD. These are multiple and includeenhanced nonesterified fatty acid release from adiposetissue (lipolysis), increased de novo fatty acid and TGsynthesis (lipogenesis), and decreased �-oxidation.28
However, similar to mitochondrial function, the influ-ence of maternal high fat feeding on these pathways re-mains unknown.
In response to these observations, the aim of this studywas to test the hypothesis that offspring of dams fed ahigh-fat (HF) diet during gestation and lactation are pre-disposed to develop a liver condition similar to humanNASH in adulthood, because of persistent alterations inmitochondrial metabolism and lipogenesis. We alsoaimed to test whether offspring of dams fed a HF diet thatalso consumed a HF diet after weaning (in other words,suffering both a developmental and adult nutritional in-sult HF/HF) would exhibit a exacerbated form of thedisease, in keeping with human NASH. We now reportthat offspring of dams fed an HF diet before or duringpregnancy and lactation exhibit impaired mitochondrialETC complex activity and up-regulated lipogenesis geneexpression, contributing to the development and diseaseprogression of a NASH-like phenotype.
Materials and Methods
Animal Model. All studies were conducted under UKHome Office License. Female C57 BL6J mice (n � 20),were maintained under controlled conditions and ran-domly assigned to either a HF diet (HF; 45% kcal fat,20% kcal protein, 35% kcal carbohydrate; Special DietServices, UK) or standard chow diet (C; 21% kcal fat,17% kcal protein, 63% kcal carbohydrate; RM1—Spe-cial Diet Services, UK) (for more detailed dietary constit-uents, see Supporting Table 1). Dams were fed 4 weeksbefore conception and during gestation and lactation.Weight gain and food intake were measured at these pe-riods. Litter size was standardized to six pups, to ensure nolitter was nutritionally biased. At weaning, the offspringwere assigned either HF or C diet, generating four exper-imental groups: HF/HF (n � 8), HF/C (n � 7), C/HF(n � 8), C/C (n � 6), which represents prenatal, preg-nancy, and lactation versus the postweaning diet, respec-tively (Supporting Fig. 1). Offspring body weights wererecorded at weekly intervals. Offspring were killed at 15weeks of age, and a subgroup were allowed to grow until30 weeks old. Fat depots (in other words, gonadal, retro-peritoneal, intrascapular, inguinal, and perirenal) weredissected and weighed. Cumulative weights of the fat de-
HEPATOLOGY, Vol. 50, No. 6, 2009 BRUCE ET AL. 1797
pots for each animal and body fat as a percentage of totalbody weight were calculated. The livers were dissected,fixed in 10% neutral buffered formaldehyde, and storedfor further histological analyses. Data from males andfemales showed the same pattern in the variables mea-sured; therefore, for the purpose of this manuscript, weonly present female data.
Histology. Fixed liver sections were stained with he-matoxylin-eosin for visual assessment of steatosis andcellular infiltrate. Alternate sections were stained withOil-Red-O to visualize lipid accumulation. CD44 pro-tein expression was visualized using an anti-CD44 an-tibody (Abcam ab41478). Antigen retrieval wasperformed by microwaving for 25 minutes in 0.01 Mcitrate buffer pH6.0. Sections were then washed inTris-buffered saline (3 � 2 minutes), and avidin solu-tion was applied for 20 minutes. Slides were repeatedlywashed with Tris-buffered saline (3 � 2 minutes), fol-lowed by incubation in biotin solution for 20 minutes.The sections were washed once more, followed by ap-plication of culture medium for 20 minutes, and incu-bated in a 1/1000 dilution with anti-CD44 antibodyovernight at 4°C. Sections were then washed in Tris-buffered saline (3 � 5 minutes) and were incubatedwith biotinylated swine anti-rabbit secondary antibody(1/400 dilution) for 30 minutes, followed by additionof strepdavidin biotin-peroxidase vectors (1/75 dilu-tion) for 30 minutes. CD44 protein was visualized afteraddition of 3,3�-diaminobenzidine substrate for 5 min-utes, sections were counterstained with Mayer’s hema-toxylin, and photomicrographs were taken.
Kleiner Scores. The Kleiner scoring system was usedto assess the severity of NAFLD.29 An activity score wasgenerated by adding the individual scores for the follow-ing features; steatosis (�5% � 0, 5%-33% � 1, 33%-66% � 2, �66% � 3); ballooning (none � 0, few � 1,prominent � 2); and lobular inflammation (none � 0,�2 foci � 1, 2-4 foci � 2, �4 foci � 3). A score of lessthan 3 correlates with mild nonalcoholic fatty liver, ascore of 3 to 4 correlates with moderate nonalcoholic fattyliver, and a score of 5 or more correlates with NASH. Theaverage (mode) score for each histological characteristic ineach group was used.
Plasma Analysis. Plasma insulin concentrations weredetermined using a mouse insulin enzyme-linked immu-nosorbent assay kit. Glucose and cholesterol concentrationswere measured. �-hydroxybutyrate concentrations were de-termined using 150 �L plasma from each animal, using aRanbut test (Randox, according to manufacturer’s instruc-tions) on an autoanalyzer (RX series, Daytona).
Mitochondrial Complex Activity. Liver was homog-enized on ice in 1:9 (wt/vol) buffer; 320 mM sucrose, 1
mM ethylenediaminetetra-acetic acid dipotassium salt,10 mM Trizma-base, using a mechanical homogenizer(Kinematica, Switzerland). Samples were snap-frozen inliquid nitrogen in 50-�L aliquots and stored at �80°C.The activities of the electron transport chain enzymesfrom the offspring’s liver tissue were determined using aspectrophotomic activity assay as previously described.30
For assay of nicotinamide adenine dinucleotide phos-phate, reduced form, coenzyme Q1 (complex I), 20 �Lsample was added to a cuvette and 1 mM rotenone addedfor assessment of rotenone-dependent complex I enzymeby spectrophotometry. For assay of succinate cytochromec reductase (complex II � III), antimycin was added forassessment of the antimycin-dependent complex II � IIIenzyme rate. For assay of cytochrome c oxidase (complexIV), 20 �L sample was added to a cuvette containing 980�L 100 mM potassium phosphate buffer, pH 7.5, 50 �Mreduced cytochrome c. The reaction was run for 5 min-utes, and k was calculated from the curve. For assay ofcitrate synthase, 20 �L sample was added to a cuvettecontaining 980 �L 100 mM Tris/0.1% (vol/vol) Triton,pH 8.0, 10 mM acetyl CoA, 20 mM oxaloacetate, and 20mM 5,5�-dithio-bis (2-nitrobenzoic acid). The reactionwas run for 5 minutes, and the rate was calculated fromthe linear part of the curve in nanomoles per minute permilliliter. Protein content was determined by a commer-cial modified Lowry method (Bio-Rad, UK).
Mitochondrial copy number was quantified by deter-mining the ratio of mitochondrial 16S to genomic18S.Total DNA was extracted using a Wizard genomic DNApurification kit (Promega) according to the manufactur-er’s instructions. Mitochondrial 16S and genomic 18Scopy number was determined using Sybr green real-timepolymerase chain reaction (PCR).
Microarray Analysis. Because of financial con-straints, we could not perform a whole genome array foreach biological replicate. To obtain a reliable estimate ofthe mean gene expression for each of the four offspringgroups, we performed microarray with pooled RNA sam-ples, a method that has been shown to be appropriate andstatistically valid for efficient microarray experiments.31
Total RNA was extracted from liver tissue using TRIzolreagent (Invitrogen, UK) according to the manufacturer’sinstructions. RNA was further purified using an RNAclean up kit (Zymo Research). Total RNA from eachoffspring group was pooled (1 �g total RNA from eachsample, n � 6 each group) and sent for whole genomegene expression analysis (Nimblegen, Iceland). Eachpooled sample was hybridized to a 4-plex whole genomemouse array (44k oligonucleotides), and initial analysis(normalization) was performed. ArrayStar (DNASTAR)software was used to compare arbitrary expression values
1798 BRUCE ET AL. HEPATOLOGY, December 2009
from each group exposed to an HF diet (C/HF, HF/C,and HF/HF) against those from the control group (C/C),generating a fold difference value for each gene. Expres-sion changes were noted for genes with greater than 1.7-fold change relative to the C/C group.
Hepatic Gene Expression for Validation of Mi-croarray Analysis. Complementary DNA was synthe-sized from total RNA extracts. Specific primer and probesequences were designed using primer express, or Univer-sal ProbeLibrary online assay design center (Roche). Oli-gonucleotide sequences were synthesized by EurogentecLtd (Romsey, UK), and real-time PCR was performed tomeasure the messenger RNA levels of each gene (see Sup-porting Table 2 for primer and probe sequences). Eachassay was performed in a single 96-well plate, with eachsample measured in duplicate. A mean quantity value foreach sample was then extrapolated from a standard curvegenerated with known concentration standards to gainmeasurement of expression levels. Levels of expression foreach gene of interest were presented as percentage expres-sion of appropriate housekeeping gene (beta-actin). Reac-tion conditions were 95°C for 15 minutes (hotstart), and95°C for 15 seconds, 60°C for 30 seconds, and 72°C for30 seconds.
Statistical Analysis. The data were normally distrib-uted and were expressed as mean � standard error of themean. Differences between the groups were determinedby analysis of variance with Bonferroni post hoc tests, to
correct for type 1 statistical error. Statistical significancewas accepted when P � 0.05, and changes were consid-ered as trends when 0.05 � P � 0.1. To determine theindependent effects of maternal and postweaning diets oneach parameter, the data were also analyzed using a two-way analysis of variance (Supporting Tables 3, 4).
Results
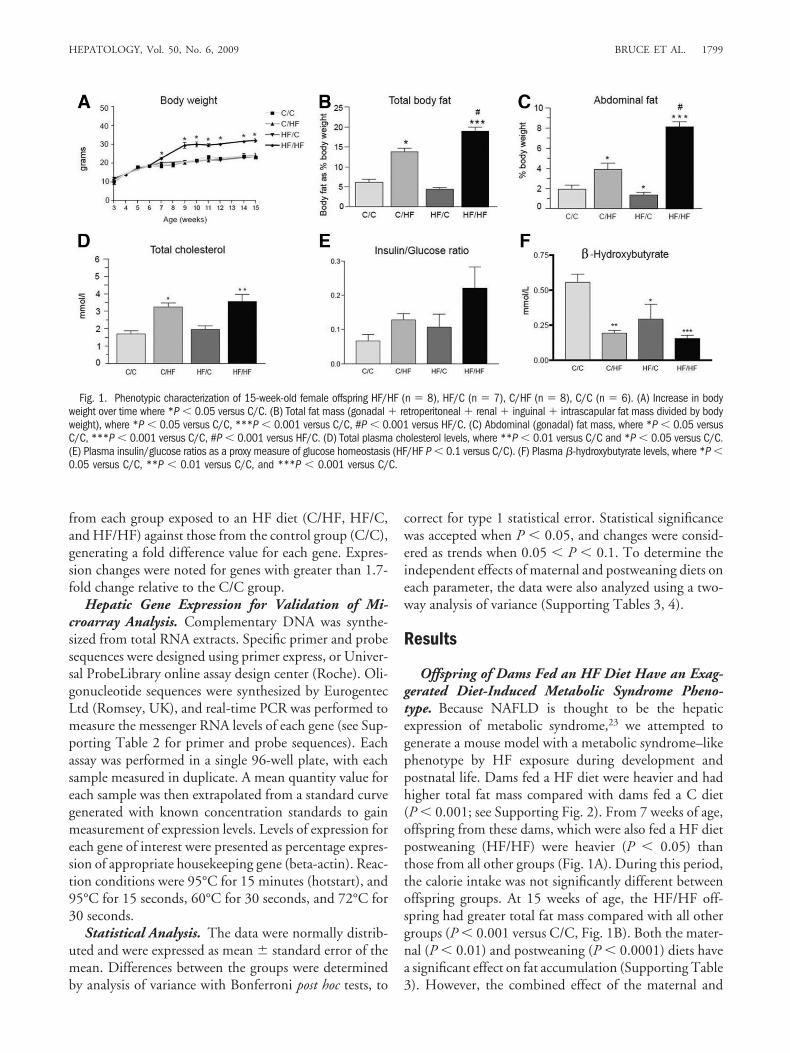
Offspring of Dams Fed an HF Diet Have an Exag-gerated Diet-Induced Metabolic Syndrome Pheno-type. Because NAFLD is thought to be the hepaticexpression of metabolic syndrome,23 we attempted togenerate a mouse model with a metabolic syndrome–likephenotype by HF exposure during development andpostnatal life. Dams fed a HF diet were heavier and hadhigher total fat mass compared with dams fed a C diet(P � 0.001; see Supporting Fig. 2). From 7 weeks of age,offspring from these dams, which were also fed a HF dietpostweaning (HF/HF) were heavier (P � 0.05) thanthose from all other groups (Fig. 1A). During this period,the calorie intake was not significantly different betweenoffspring groups. At 15 weeks of age, the HF/HF off-spring had greater total fat mass compared with all othergroups (P � 0.001 versus C/C, Fig. 1B). Both the mater-nal (P � 0.01) and postweaning (P � 0.0001) diets havea significant effect on fat accumulation (Supporting Table3). However, the combined effect of the maternal and
Fig. 1. Phenotypic characterization of 15-week-old female offspring HF/HF (n � 8), HF/C (n � 7), C/HF (n � 8), C/C (n � 6). (A) Increase in bodyweight over time where *P � 0.05 versus C/C. (B) Total fat mass (gonadal � retroperitoneal � renal � inguinal � intrascapular fat mass divided by bodyweight), where *P � 0.05 versus C/C, ***P � 0.001 versus C/C, #P � 0.001 versus HF/C. (C) Abdominal (gonadal) fat mass, where *P � 0.05 versusC/C, ***P � 0.001 versus C/C, #P � 0.001 versus HF/C. (D) Total plasma cholesterol levels, where **P � 0.01 versus C/C and *P � 0.05 versus C/C.(E) Plasma insulin/glucose ratios as a proxy measure of glucose homeostasis (HF/HF P � 0.1 versus C/C). (F) Plasma �-hydroxybutyrate levels, where *P �0.05 versus C/C, **P � 0.01 versus C/C, and ***P � 0.001 versus C/C.
HEPATOLOGY, Vol. 50, No. 6, 2009 BRUCE ET AL. 1799

postweaning diets (that is, HF/HF) has a greater effect(P � 0.0001) on fat accumulation. We also determinedabdominal fat deposition as a marker of central obesity.Our observations (Fig. 1C) show the HF/HF exposureresulted in the biggest increase (P � 0.0001, SupportingTable 1) in abdominal fat accumulation. Although expo-sure to a HF diet postweaning (C/HF) had a significanteffect on serum cholesterol concentrations (P � 0.05 ver-sus C/C), once again this effect was exacerbated in theHF/HF animals (P � 0.01 versus C/C, Fig. 1D). Insulin-to-glucose (I/G) ratios (absolute values for which are pro-vided in Supporting Fig. 3), which is a proxy measure ofinsulin sensitivity (Fig. 1E), showed a trend toward higherratios and lower insulin sensitivity in the HF/HF groupversus C/C.
Offspring of Dams Fed a HF Diet Have an Exag-gerated Form of Diet-Induced Fatty Liver. We as-sessed liver morphology in 15-week-old offspring livers.No lipid accumulation and a normal hepatic architecturewere observed in livers from the C/C group (Fig. 2A). Inlivers from HF/C offspring, few lipid droplets were ob-served (Fig. 2B). C/HF offspring livers showed mild ste-atosis (Fig. 2C). However, in HF/HF livers, extensive fataccumulation was observed (Figs. 2D-F), with evidenceof severe inflammation and a marked mixed lympho-monocytic perivenular infiltrate (Fig. 2E). The severity ofthe NAFLD in the offspring livers was assessed using theKleiner scoring system,29 which allows scoring of individ-ual features, including steatosis, ballooned hepatocytes,and inflammation. Whereas both the C/C and HF/C off-spring received no scores, the C/HF offspring achieved ascore of 2, indicative in human histopathology Kleinerscoring as mild NAFLD (Table 1). In contrast, theHF/HF liver generated a necro-inflammatory score of 6,which is compatible with a diagnosis of NASH (Table 1).These findings demonstrate that exposure to a postwean-ing HF diet causes hepatic steatosis and that this effect ismarkedly exaggerated when the offspring also have beenexposed to an HF diet in the early developmental periodleading to development of NASH in the offspring.
Maternal Fat Intake Contributes Toward NAFLDProgression in Adult Offspring. We also determinedthe NAFLD severity in a subgroup of older (30-week-old)offspring to determine whether the liver condition pro-gressed as the animal aged. The phenotype of these ani-mals is very similar to that observed for the 15-week-oldanimals (Fig. 5), and corresponds to histological observa-tions. Similarly to the earlier time point, both histology(Fig. 2G) and Kleiner scoring (Table 1) revealed normalhepatic architecture in the C/C group. In contrast, theHF/C group showed moderate levels of steatosis at 30weeks (Fig. 2H) that had progressed from the 15-week
point. At 30 weeks, both the C/HF and HF/HF offspringlivers showed a NASH-like histology, the severity ofwhich was worse in the HF/HF group. This was of asimilar pattern to the earlier time point of 15 weeks. Inaddition, the 30-week HF/HF livers exhibited a distinctmicroanatomy with both microvesicular and macrove-sicular steatosis within the distinct acinar zones (Fig. 2J).
Offspring of Dams Fed an HF Diet Exhibit Up-regulated CD44 Protein Expression. To further ex-
Fig. 2. Histological analysis (A-J), in 15-week-old (unless stated) off-spring livers HF/HF (n � 8), HF/C (n � 7), C/HF (n � 8), C/C (n � 6). (A)Hematoxylin-eosin–stained C/C liver. (B) Hematoxylin-eosin–stained HF/Cliver. (C) Hematoxylin-eosin–stained C/HF liver showing mild steatosis (ar-row). (D) Hematoxylin-eosin–stained HF/HF liver showing steatosis (arrow).(E) Hematoxylin-eosin–stained HF/HF mouse showing a mixed perivenularlymphomonocytic infiltrate (arrow). (F). Oil Red O–stained HF/HF liver show-ing extensive fat accumulation (arrow). (G) Hematoxylin-eosin–stained 30-week C/C liver. (H) Hematoxylin-eosin–stained 30-week C/C liver showingmild steatosis (arrow). (I) Hematoxylin-eosin–stained 30-week C/HF livershowing steatosis (arrow). (J) Hematoxylin-eosin–stained 30-week HF/HFliver showing microvesicular (large arrow) and macrovesicular (small arrow)steatosis.
1800 BRUCE ET AL. HEPATOLOGY, December 2009
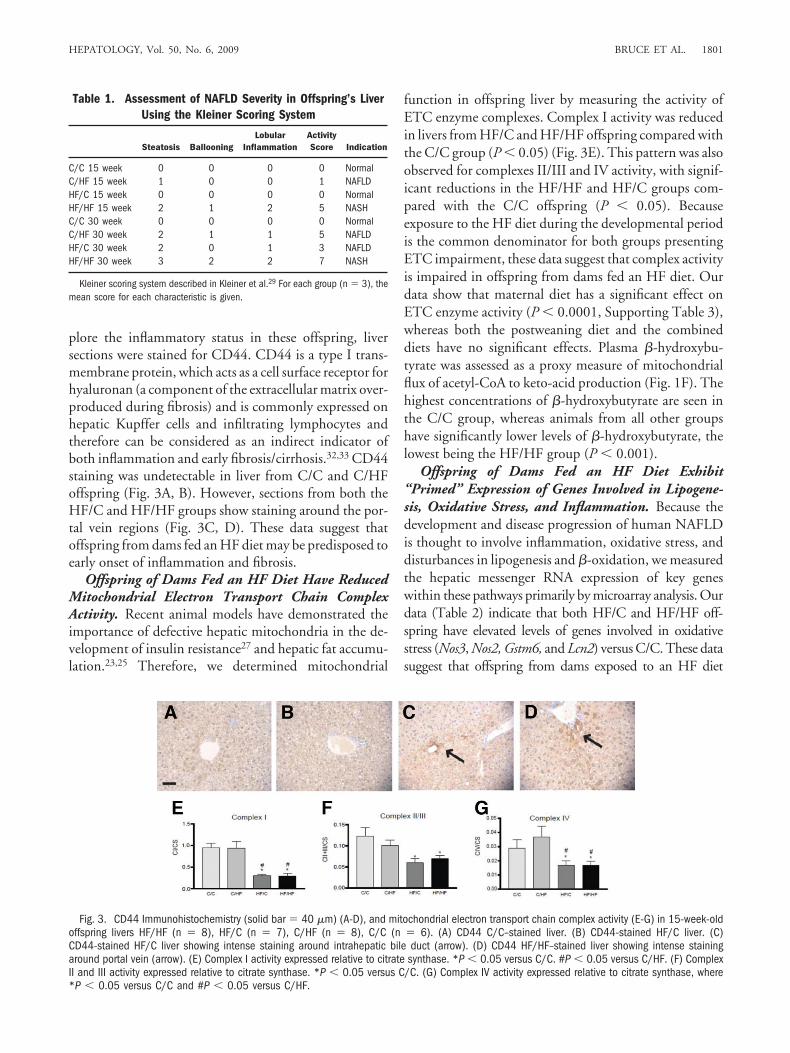
plore the inflammatory status in these offspring, liversections were stained for CD44. CD44 is a type I trans-membrane protein, which acts as a cell surface receptor forhyaluronan (a component of the extracellular matrix over-produced during fibrosis) and is commonly expressed onhepatic Kupffer cells and infiltrating lymphocytes andtherefore can be considered as an indirect indicator ofboth inflammation and early fibrosis/cirrhosis.32,33 CD44staining was undetectable in liver from C/C and C/HFoffspring (Fig. 3A, B). However, sections from both theHF/C and HF/HF groups show staining around the por-tal vein regions (Fig. 3C, D). These data suggest thatoffspring from dams fed an HF diet may be predisposed toearly onset of inflammation and fibrosis.
Offspring of Dams Fed an HF Diet Have ReducedMitochondrial Electron Transport Chain ComplexActivity. Recent animal models have demonstrated theimportance of defective hepatic mitochondria in the de-velopment of insulin resistance27 and hepatic fat accumu-lation.23,25 Therefore, we determined mitochondrial
function in offspring liver by measuring the activity ofETC enzyme complexes. Complex I activity was reducedin livers from HF/C and HF/HF offspring compared withthe C/C group (P � 0.05) (Fig. 3E). This pattern was alsoobserved for complexes II/III and IV activity, with signif-icant reductions in the HF/HF and HF/C groups com-pared with the C/C offspring (P � 0.05). Becauseexposure to the HF diet during the developmental periodis the common denominator for both groups presentingETC impairment, these data suggest that complex activityis impaired in offspring from dams fed an HF diet. Ourdata show that maternal diet has a significant effect onETC enzyme activity (P � 0.0001, Supporting Table 3),whereas both the postweaning diet and the combineddiets have no significant effects. Plasma �-hydroxybu-tyrate was assessed as a proxy measure of mitochondrialflux of acetyl-CoA to keto-acid production (Fig. 1F). Thehighest concentrations of �-hydroxybutyrate are seen inthe C/C group, whereas animals from all other groupshave significantly lower levels of �-hydroxybutyrate, thelowest being the HF/HF group (P � 0.001).
Offspring of Dams Fed an HF Diet Exhibit“Primed” Expression of Genes Involved in Lipogene-sis, Oxidative Stress, and Inflammation. Because thedevelopment and disease progression of human NAFLDis thought to involve inflammation, oxidative stress, anddisturbances in lipogenesis and �-oxidation, we measuredthe hepatic messenger RNA expression of key geneswithin these pathways primarily by microarray analysis. Ourdata (Table 2) indicate that both HF/C and HF/HF off-spring have elevated levels of genes involved in oxidativestress (Nos3, Nos2, Gstm6, and Lcn2) versus C/C. These datasuggest that offspring from dams exposed to an HF diet
Table 1. Assessment of NAFLD Severity in Offspring’s LiverUsing the Kleiner Scoring System
Steatosis BallooningLobular
InflammationActivityScore Indication
C/C 15 week 0 0 0 0 NormalC/HF 15 week 1 0 0 1 NAFLDHF/C 15 week 0 0 0 0 NormalHF/HF 15 week 2 1 2 5 NASHC/C 30 week 0 0 0 0 NormalC/HF 30 week 2 1 1 5 NAFLDHF/C 30 week 2 0 1 3 NAFLDHF/HF 30 week 3 2 2 7 NASH
Kleiner scoring system described in Kleiner et al.29 For each group (n � 3), themean score for each characteristic is given.
Fig. 3. CD44 Immunohistochemistry (solid bar � 40 �m) (A-D), and mitochondrial electron transport chain complex activity (E-G) in 15-week-oldoffspring livers HF/HF (n � 8), HF/C (n � 7), C/HF (n � 8), C/C (n � 6). (A) CD44 C/C–stained liver. (B) CD44-stained HF/C liver. (C)CD44-stained HF/C liver showing intense staining around intrahepatic bile duct (arrow). (D) CD44 HF/HF–stained liver showing intense stainingaround portal vein (arrow). (E) Complex I activity expressed relative to citrate synthase. *P � 0.05 versus C/C. #P � 0.05 versus C/HF. (F) ComplexII and III activity expressed relative to citrate synthase. *P � 0.05 versus C/C. (G) Complex IV activity expressed relative to citrate synthase, where*P � 0.05 versus C/C and #P � 0.05 versus C/HF.
HEPATOLOGY, Vol. 50, No. 6, 2009 BRUCE ET AL. 1801
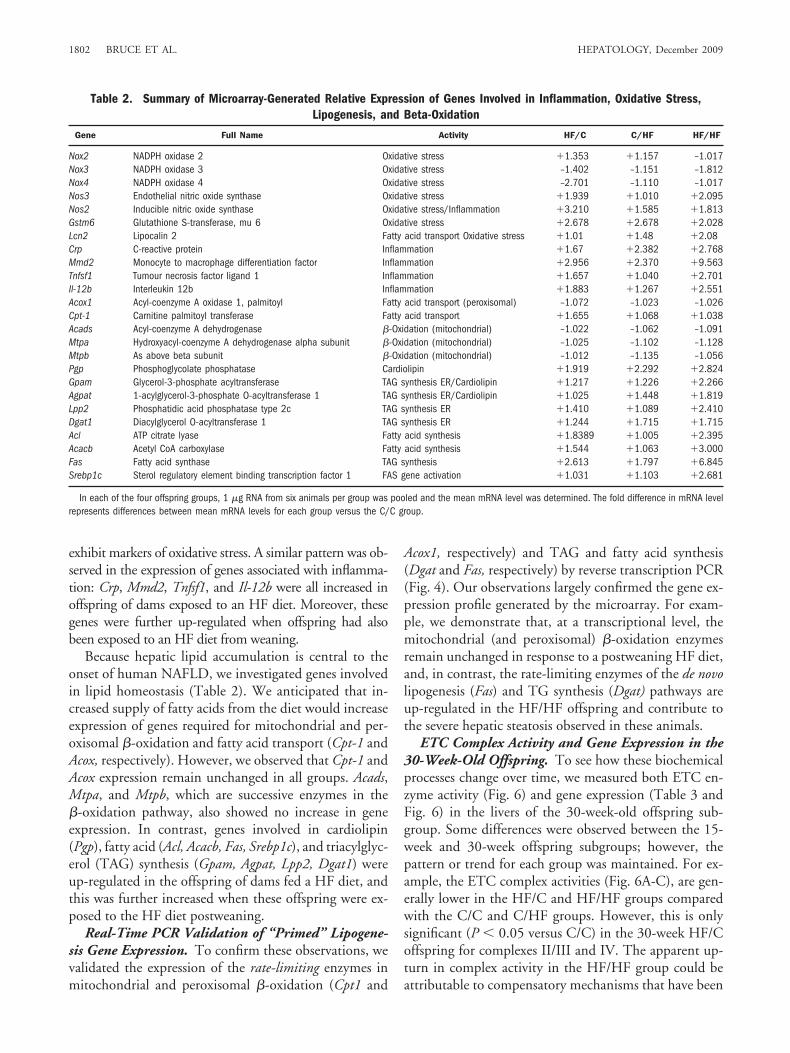
exhibit markers of oxidative stress. A similar pattern was ob-served in the expression of genes associated with inflamma-tion: Crp, Mmd2, Tnfsf1, and Il-12b were all increased inoffspring of dams exposed to an HF diet. Moreover, thesegenes were further up-regulated when offspring had alsobeen exposed to an HF diet from weaning.
Because hepatic lipid accumulation is central to theonset of human NAFLD, we investigated genes involvedin lipid homeostasis (Table 2). We anticipated that in-creased supply of fatty acids from the diet would increaseexpression of genes required for mitochondrial and per-oxisomal �-oxidation and fatty acid transport (Cpt-1 andAcox, respectively). However, we observed that Cpt-1 andAcox expression remain unchanged in all groups. Acads,Mtpa, and Mtpb, which are successive enzymes in the�-oxidation pathway, also showed no increase in geneexpression. In contrast, genes involved in cardiolipin(Pgp), fatty acid (Acl, Acacb, Fas, Srebp1c), and triacylglyc-erol (TAG) synthesis (Gpam, Agpat, Lpp2, Dgat1) wereup-regulated in the offspring of dams fed a HF diet, andthis was further increased when these offspring were ex-posed to the HF diet postweaning.
Real-Time PCR Validation of “Primed” Lipogene-sis Gene Expression. To confirm these observations, wevalidated the expression of the rate-limiting enzymes inmitochondrial and peroxisomal �-oxidation (Cpt1 and
Acox1, respectively) and TAG and fatty acid synthesis(Dgat and Fas, respectively) by reverse transcription PCR(Fig. 4). Our observations largely confirmed the gene ex-pression profile generated by the microarray. For exam-ple, we demonstrate that, at a transcriptional level, themitochondrial (and peroxisomal) �-oxidation enzymesremain unchanged in response to a postweaning HF diet,and, in contrast, the rate-limiting enzymes of the de novolipogenesis (Fas) and TG synthesis (Dgat) pathways areup-regulated in the HF/HF offspring and contribute tothe severe hepatic steatosis observed in these animals.
ETC Complex Activity and Gene Expression in the30-Week-Old Offspring. To see how these biochemicalprocesses change over time, we measured both ETC en-zyme activity (Fig. 6) and gene expression (Table 3 andFig. 6) in the livers of the 30-week-old offspring sub-group. Some differences were observed between the 15-week and 30-week offspring subgroups; however, thepattern or trend for each group was maintained. For ex-ample, the ETC complex activities (Fig. 6A-C), are gen-erally lower in the HF/C and HF/HF groups comparedwith the C/C and C/HF groups. However, this is onlysignificant (P � 0.05 versus C/C) in the 30-week HF/Coffspring for complexes II/III and IV. The apparent up-turn in complex activity in the HF/HF group could beattributable to compensatory mechanisms that have been
Table 2. Summary of Microarray-Generated Relative Expression of Genes Involved in Inflammation, Oxidative Stress,Lipogenesis, and Beta-Oxidation
Gene Full Name Activity HF/C C/HF HF/HF
Nox2 NADPH oxidase 2 Oxidative stress �1.353 �1.157 –1.017Nox3 NADPH oxidase 3 Oxidative stress –1.402 –1.151 –1.812Nox4 NADPH oxidase 4 Oxidative stress –2.701 –1.110 –1.017Nos3 Endothelial nitric oxide synthase Oxidative stress �1.939 �1.010 �2.095Nos2 Inducible nitric oxide synthase Oxidative stress/Inflammation �3.210 �1.585 �1.813Gstm6 Glutathione S-transferase, mu 6 Oxidative stress �2.678 �2.678 �2.028Lcn2 Lipocalin 2 Fatty acid transport Oxidative stress �1.01 �1.48 �2.08Crp C-reactive protein Inflammation �1.67 �2.382 �2.768Mmd2 Monocyte to macrophage differentiation factor Inflammation �2.956 �2.370 �9.563Tnfsf1 Tumour necrosis factor ligand 1 Inflammation �1.657 �1.040 �2.701Il-12b Interleukin 12b Inflammation �1.883 �1.267 �2.551Acox1 Acyl-coenzyme A oxidase 1, palmitoyl Fatty acid transport (peroxisomal) –1.072 –1.023 –1.026Cpt-1 Carnitine palmitoyl transferase Fatty acid transport �1.655 �1.068 �1.038Acads Acyl-coenzyme A dehydrogenase �-Oxidation (mitochondrial) –1.022 –1.062 –1.091Mtpa Hydroxyacyl-coenzyme A dehydrogenase alpha subunit �-Oxidation (mitochondrial) –1.025 –1.102 –1.128Mtpb As above beta subunit �-Oxidation (mitochondrial) –1.012 –1.135 –1.056Pgp Phosphoglycolate phosphatase Cardiolipin �1.919 �2.292 �2.824Gpam Glycerol-3-phosphate acyltransferase TAG synthesis ER/Cardiolipin �1.217 �1.226 �2.266Agpat 1-acylglycerol-3-phosphate O-acyltransferase 1 TAG synthesis ER/Cardiolipin �1.025 �1.448 �1.819Lpp2 Phosphatidic acid phosphatase type 2c TAG synthesis ER �1.410 �1.089 �2.410Dgat1 Diacylglycerol O-acyltransferase 1 TAG synthesis ER �1.244 �1.715 �1.715Acl ATP citrate lyase Fatty acid synthesis �1.8389 �1.005 �2.395Acacb Acetyl CoA carboxylase Fatty acid synthesis �1.544 �1.063 �3.000Fas Fatty acid synthase TAG synthesis �2.613 �1.797 �6.845Srebp1c Sterol regulatory element binding transcription factor 1 FAS gene activation �1.031 �1.103 �2.681
In each of the four offspring groups, 1 �g RNA from six animals per group was pooled and the mean mRNA level was determined. The fold difference in mRNA levelrepresents differences between mean mRNA levels for each group versus the C/C group.
1802 BRUCE ET AL. HEPATOLOGY, December 2009
previously reported in middle-age and old-age mouse kid-ney and may allow the cell to transiently balance the de-crease in enzymatic activity with age, or in this case severeliver pathological conditions.34 Interestingly, at 30 weeks,
the C/HF animals show a significantly reduced complexIV activity, which may correspond to a progressing livercondition. The results of the microarray data also show asimilar pattern of expression of genes involved in inflam-
Fig. 4. Hepatic gene expression of rate-limiting lipogenesis and fat oxidation enzymesin 15-week-old offspring HF/HF (n � 8),HF/C (n � 7), C/HF (n � 8), C/C (n � 6)(mean � standard error of the mean). **P �0.01 versus C/C. ***P � 0.001 versus C/C.#P � 0.05 versus C/HF. (A) Aox1 (acyl-coenzyme A oxidase 1). (B) Cpt1 (carnitinepalmitoyltransferase 1). (C) Dgat (diacylglyc-erol O-acyltransferase 1). (D) Fas (fatty acidsynthase).
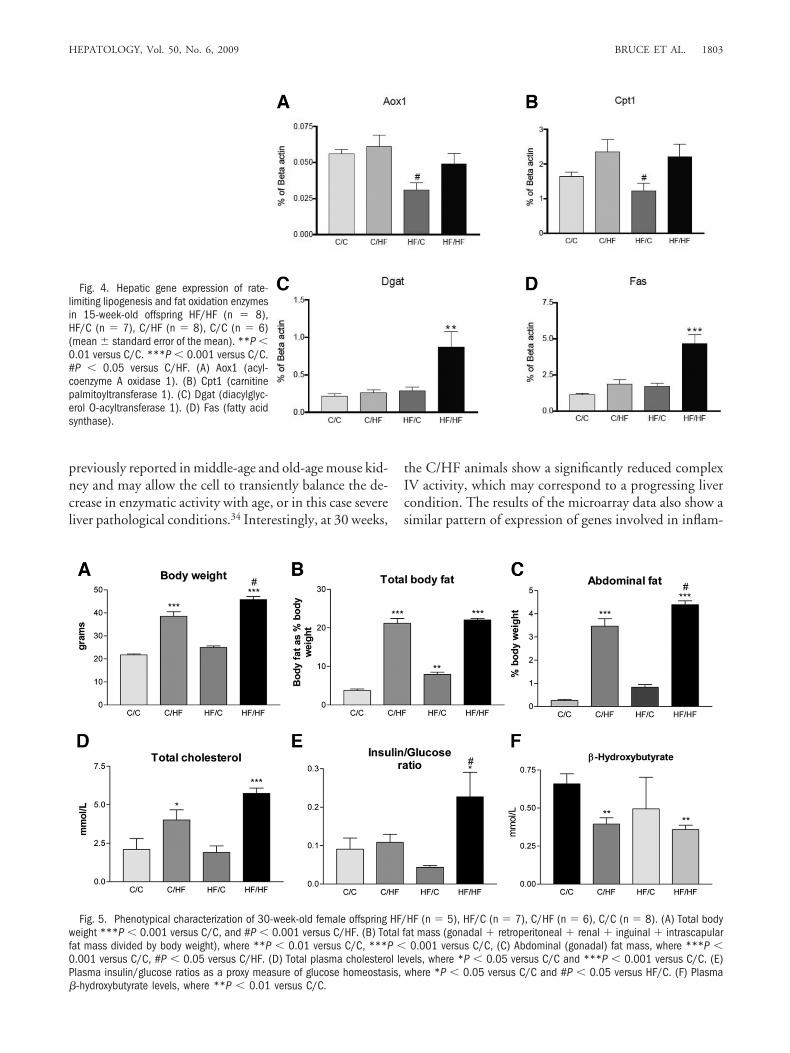
Fig. 5. Phenotypical characterization of 30-week-old female offspring HF/HF (n � 5), HF/C (n � 7), C/HF (n � 6), C/C (n � 8). (A) Total bodyweight ***P � 0.001 versus C/C, and #P � 0.001 versus C/HF. (B) Total fat mass (gonadal � retroperitoneal � renal � inguinal � intrascapularfat mass divided by body weight), where **P � 0.01 versus C/C, ***P � 0.001 versus C/C, (C) Abdominal (gonadal) fat mass, where ***P �0.001 versus C/C, #P � 0.05 versus C/HF. (D) Total plasma cholesterol levels, where *P � 0.05 versus C/C and ***P � 0.001 versus C/C. (E)Plasma insulin/glucose ratios as a proxy measure of glucose homeostasis, where *P � 0.05 versus C/C and #P � 0.05 versus HF/C. (F) Plasma�-hydroxybutyrate levels, where **P � 0.01 versus C/C.
HEPATOLOGY, Vol. 50, No. 6, 2009 BRUCE ET AL. 1803
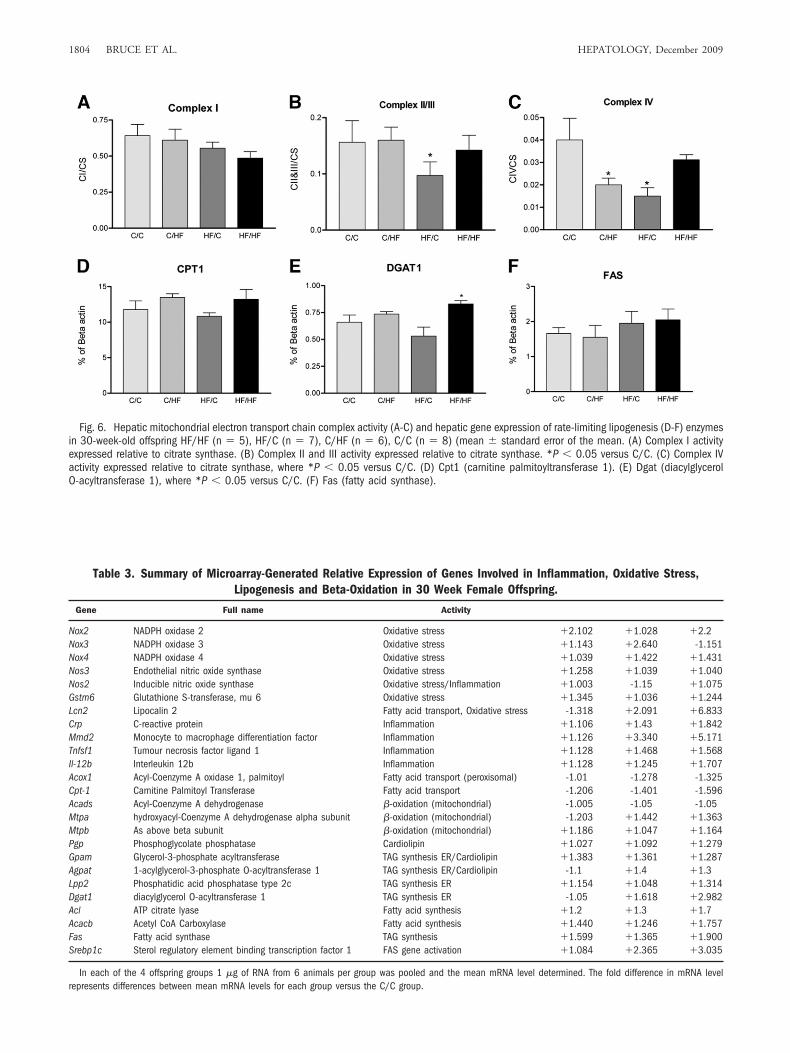
Fig. 6. Hepatic mitochondrial electron transport chain complex activity (A-C) and hepatic gene expression of rate-limiting lipogenesis (D-F) enzymesin 30-week-old offspring HF/HF (n � 5), HF/C (n � 7), C/HF (n � 6), C/C (n � 8) (mean � standard error of the mean. (A) Complex I activityexpressed relative to citrate synthase. (B) Complex II and III activity expressed relative to citrate synthase. *P � 0.05 versus C/C. (C) Complex IVactivity expressed relative to citrate synthase, where *P � 0.05 versus C/C. (D) Cpt1 (carnitine palmitoyltransferase 1). (E) Dgat (diacylglycerolO-acyltransferase 1), where *P � 0.05 versus C/C. (F) Fas (fatty acid synthase).
Table 3. Summary of Microarray-Generated Relative Expression of Genes Involved in Inflammation, Oxidative Stress,Lipogenesis and Beta-Oxidation in 30 Week Female Offspring.
Gene Full name Activity
Nox2 NADPH oxidase 2 Oxidative stress �2.102 �1.028 �2.2Nox3 NADPH oxidase 3 Oxidative stress �1.143 �2.640 -1.151Nox4 NADPH oxidase 4 Oxidative stress �1.039 �1.422 �1.431Nos3 Endothelial nitric oxide synthase Oxidative stress �1.258 �1.039 �1.040Nos2 Inducible nitric oxide synthase Oxidative stress/Inflammation �1.003 -1.15 �1.075Gstm6 Glutathione S-transferase, mu 6 Oxidative stress �1.345 �1.036 �1.244Lcn2 Lipocalin 2 Fatty acid transport, Oxidative stress -1.318 �2.091 �6.833Crp C-reactive protein Inflammation �1.106 �1.43 �1.842Mmd2 Monocyte to macrophage differentiation factor Inflammation �1.126 �3.340 �5.171Tnfsf1 Tumour necrosis factor ligand 1 Inflammation �1.128 �1.468 �1.568Il-12b Interleukin 12b Inflammation �1.128 �1.245 �1.707Acox1 Acyl-Coenzyme A oxidase 1, palmitoyl Fatty acid transport (peroxisomal) -1.01 -1.278 -1.325Cpt-1 Carnitine Palmitoyl Transferase Fatty acid transport -1.206 -1.401 -1.596Acads Acyl-Coenzyme A dehydrogenase �-oxidation (mitochondrial) -1.005 -1.05 -1.05Mtpa hydroxyacyl-Coenzyme A dehydrogenase alpha subunit �-oxidation (mitochondrial) -1.203 �1.442 �1.363Mtpb As above beta subunit �-oxidation (mitochondrial) �1.186 �1.047 �1.164Pgp Phosphoglycolate phosphatase Cardiolipin �1.027 �1.092 �1.279Gpam Glycerol-3-phosphate acyltransferase TAG synthesis ER/Cardiolipin �1.383 �1.361 �1.287Agpat 1-acylglycerol-3-phosphate O-acyltransferase 1 TAG synthesis ER/Cardiolipin -1.1 �1.4 �1.3Lpp2 Phosphatidic acid phosphatase type 2c TAG synthesis ER �1.154 �1.048 �1.314Dgat1 diacylglycerol O-acyltransferase 1 TAG synthesis ER -1.05 �1.618 �2.982Acl ATP citrate lyase Fatty acid synthesis �1.2 �1.3 �1.7Acacb Acetyl CoA Carboxylase Fatty acid synthesis �1.440 �1.246 �1.757Fas Fatty acid synthase TAG synthesis �1.599 �1.365 �1.900Srebp1c Sterol regulatory element binding transcription factor 1 FAS gene activation �1.084 �2.365 �3.035
In each of the 4 offspring groups 1 �g of RNA from 6 animals per group was pooled and the mean mRNA level determined. The fold difference in mRNA levelrepresents differences between mean mRNA levels for each group versus the C/C group.
1804 BRUCE ET AL. HEPATOLOGY, December 2009
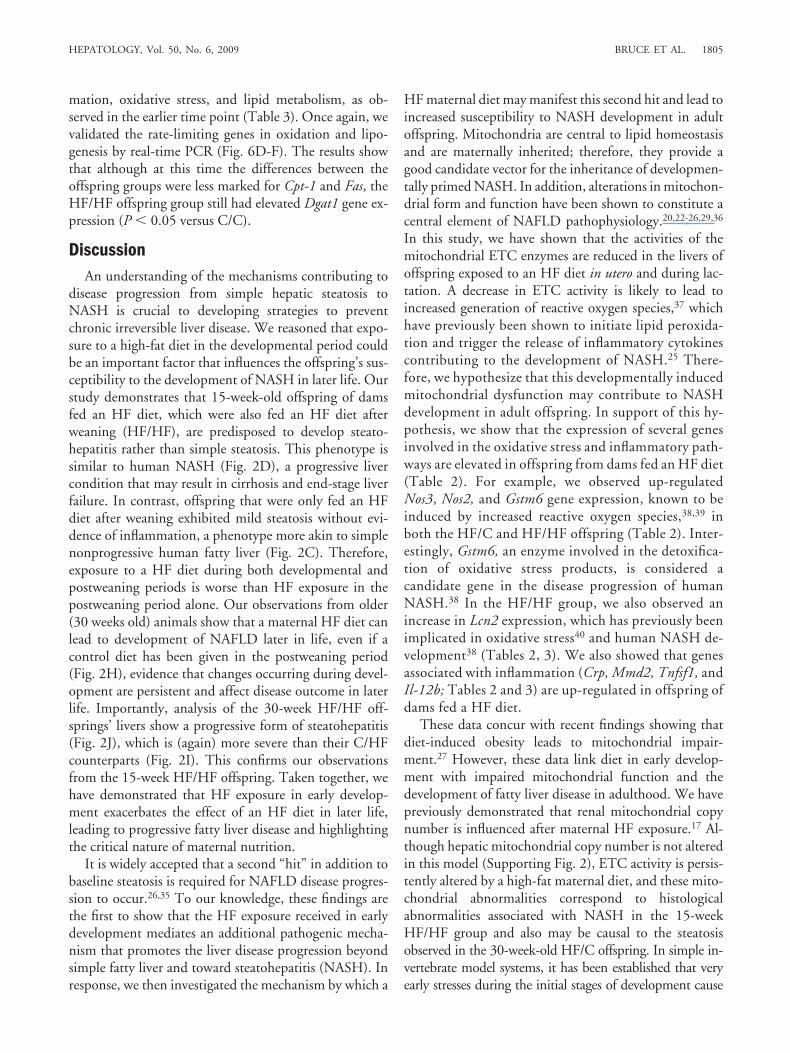
mation, oxidative stress, and lipid metabolism, as ob-served in the earlier time point (Table 3). Once again, wevalidated the rate-limiting genes in oxidation and lipo-genesis by real-time PCR (Fig. 6D-F). The results showthat although at this time the differences between theoffspring groups were less marked for Cpt-1 and Fas, theHF/HF offspring group still had elevated Dgat1 gene ex-pression (P � 0.05 versus C/C).
DiscussionAn understanding of the mechanisms contributing to
disease progression from simple hepatic steatosis toNASH is crucial to developing strategies to preventchronic irreversible liver disease. We reasoned that expo-sure to a high-fat diet in the developmental period couldbe an important factor that influences the offspring’s sus-ceptibility to the development of NASH in later life. Ourstudy demonstrates that 15-week-old offspring of damsfed an HF diet, which were also fed an HF diet afterweaning (HF/HF), are predisposed to develop steato-hepatitis rather than simple steatosis. This phenotype issimilar to human NASH (Fig. 2D), a progressive livercondition that may result in cirrhosis and end-stage liverfailure. In contrast, offspring that were only fed an HFdiet after weaning exhibited mild steatosis without evi-dence of inflammation, a phenotype more akin to simplenonprogressive human fatty liver (Fig. 2C). Therefore,exposure to a HF diet during both developmental andpostweaning periods is worse than HF exposure in thepostweaning period alone. Our observations from older(30 weeks old) animals show that a maternal HF diet canlead to development of NAFLD later in life, even if acontrol diet has been given in the postweaning period(Fig. 2H), evidence that changes occurring during devel-opment are persistent and affect disease outcome in laterlife. Importantly, analysis of the 30-week HF/HF off-springs’ livers show a progressive form of steatohepatitis(Fig. 2J), which is (again) more severe than their C/HFcounterparts (Fig. 2I). This confirms our observationsfrom the 15-week HF/HF offspring. Taken together, wehave demonstrated that HF exposure in early develop-ment exacerbates the effect of an HF diet in later life,leading to progressive fatty liver disease and highlightingthe critical nature of maternal nutrition.
It is widely accepted that a second “hit” in addition tobaseline steatosis is required for NAFLD disease progres-sion to occur.26,35 To our knowledge, these findings arethe first to show that the HF exposure received in earlydevelopment mediates an additional pathogenic mecha-nism that promotes the liver disease progression beyondsimple fatty liver and toward steatohepatitis (NASH). Inresponse, we then investigated the mechanism by which a
HF maternal diet may manifest this second hit and lead toincreased susceptibility to NASH development in adultoffspring. Mitochondria are central to lipid homeostasisand are maternally inherited; therefore, they provide agood candidate vector for the inheritance of developmen-tally primed NASH. In addition, alterations in mitochon-drial form and function have been shown to constitute acentral element of NAFLD pathophysiology.20,22-26,29,36
In this study, we have shown that the activities of themitochondrial ETC enzymes are reduced in the livers ofoffspring exposed to an HF diet in utero and during lac-tation. A decrease in ETC activity is likely to lead toincreased generation of reactive oxygen species,37 whichhave previously been shown to initiate lipid peroxida-tion and trigger the release of inflammatory cytokinescontributing to the development of NASH.25 There-fore, we hypothesize that this developmentally inducedmitochondrial dysfunction may contribute to NASHdevelopment in adult offspring. In support of this hy-pothesis, we show that the expression of several genesinvolved in the oxidative stress and inflammatory path-ways are elevated in offspring from dams fed an HF diet(Table 2). For example, we observed up-regulatedNos3, Nos2, and Gstm6 gene expression, known to beinduced by increased reactive oxygen species,38,39 inboth the HF/C and HF/HF offspring (Table 2). Inter-estingly, Gstm6, an enzyme involved in the detoxifica-tion of oxidative stress products, is considered acandidate gene in the disease progression of humanNASH.38 In the HF/HF group, we also observed anincrease in Lcn2 expression, which has previously beenimplicated in oxidative stress40 and human NASH de-velopment38 (Tables 2, 3). We also showed that genesassociated with inflammation (Crp, Mmd2, Tnfsf1, andIl-12b; Tables 2 and 3) are up-regulated in offspring ofdams fed a HF diet.
These data concur with recent findings showing thatdiet-induced obesity leads to mitochondrial impair-ment.27 However, these data link diet in early develop-ment with impaired mitochondrial function and thedevelopment of fatty liver disease in adulthood. We havepreviously demonstrated that renal mitochondrial copynumber is influenced after maternal HF exposure.17 Al-though hepatic mitochondrial copy number is not alteredin this model (Supporting Fig. 2), ETC activity is persis-tently altered by a high-fat maternal diet, and these mito-chondrial abnormalities correspond to histologicalabnormalities associated with NASH in the 15-weekHF/HF group and also may be causal to the steatosisobserved in the 30-week-old HF/C offspring. In simple in-vertebrate model systems, it has been established that veryearly stresses during the initial stages of development cause
HEPATOLOGY, Vol. 50, No. 6, 2009 BRUCE ET AL. 1805
persistent changes to mitochondrial activity,41 thus establish-ing a precedent for “priming” of the mitochondria. Specifi-cally, this study provides the first evidence in a mammaliansystem showing that exposure to a maternal HF diet can leadto developmental induction of impaired ETC enzymes,which persists into adulthood and contributes to the adultonset of NAFLD and the progression to NASH when theHF exposure is continued into adulthood.
The role of oxidative stress and inflammation inNASH development are well documented. However,does this mitochondrial dysfunction also play a role inincreased fat deposition? We reason that exposure to anHF diet in the developmental environment has compro-mised the liver’s metabolic capacity (through mitochon-drial impairment in the first instance) to deal with thehigh levels of dietary fat it receives in the adult environ-ment, resulting in increased steatosis and progression to-ward a NASH-like phenotype. We measured serumconcentrations of �-hydroxybutyrate as an indicator ofhepatic capacity for mitochondrial ketogenesis via �-oxi-dation (Fig. 1E) and therefore a proxy measure for mito-chondrial metabolism as a whole. As expected, the levelsof plasma �-hydroxybutyrate were lowest in the HF/HF
offspring (threefold lower versus C/C). Gene expressionof the rate-limiting enzyme involved in mitochondrial�-oxidation (Cpt1) was unchanged in the HF/HF groupcompared with the control offspring. This implies thatmitochondrial metabolism is unresponsive to the in-creased demand for �-oxidation coming from the post-weaning HF diet (Fig. 2D). Subsequently, the reductionin mitochondrial function occurring in the developmen-tal period steers the surplus flux of intracellular acyl-CoAtoward TG synthesis pathways, rather than �-oxidation(Fig. 7). In response, a developmental “priming” occurs.Genes involved in TAG (Gpam, Agpat, Lpp2, Dgat1) syn-thesis pathways are up-regulated to cope with these excessnutrients. These elevated expression profiles then persistinto early adulthood. Therefore, offspring that have re-ceived a HF diet in development and are also exposed to aHF diet in adulthood (HF/HF offspring) shuttle theircytosolic fatty acids toward lipogenesis (Fig. 7), resultingin severe steatosis and a NASH-like phenotype. Con-versely, this hypothesis also explains why the offspringexposed to a HF diet in adult life do not exhibit such asevere phenotype, because their mitochondrial function ismaintained and their lipogenesis pathways are not devel-
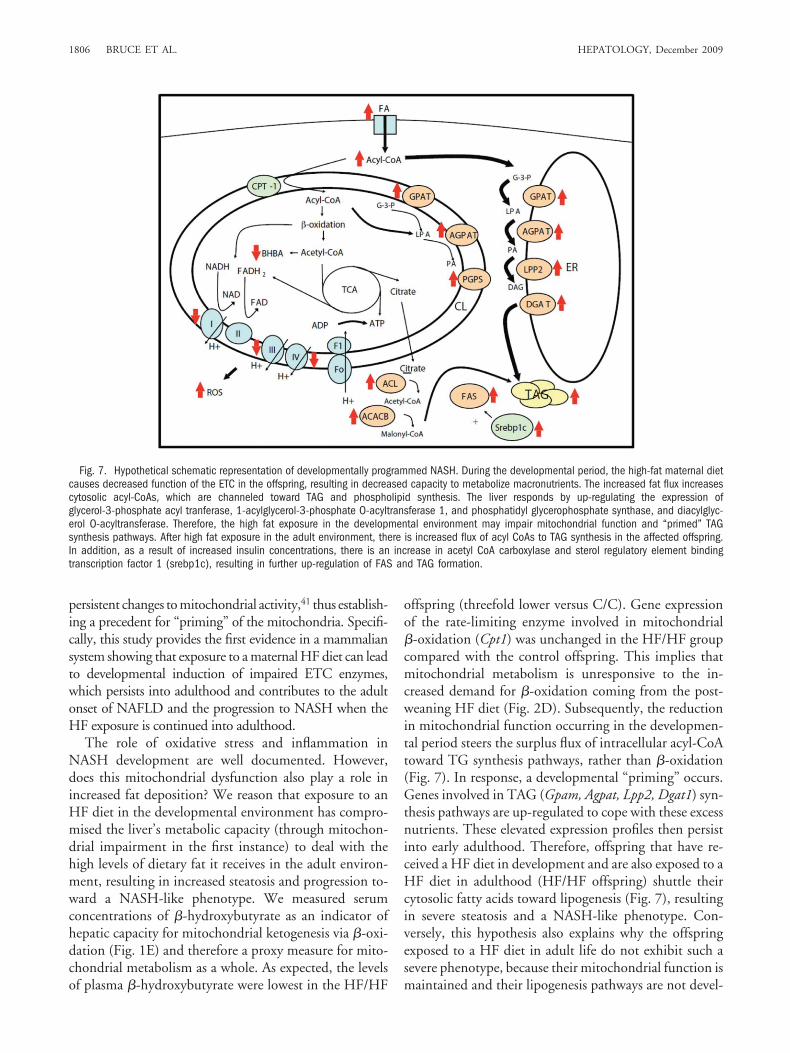
Fig. 7. Hypothetical schematic representation of developmentally programmed NASH. During the developmental period, the high-fat maternal dietcauses decreased function of the ETC in the offspring, resulting in decreased capacity to metabolize macronutrients. The increased fat flux increasescytosolic acyl-CoAs, which are channeled toward TAG and phospholipid synthesis. The liver responds by up-regulating the expression ofglycerol-3-phosphate acyl tranferase, 1-acylglycerol-3-phosphate O-acyltransferase 1, and phosphatidyl glycerophosphate synthase, and diacylglyc-erol O-acyltransferase. Therefore, the high fat exposure in the developmental environment may impair mitochondrial function and “primed” TAGsynthesis pathways. After high fat exposure in the adult environment, there is increased flux of acyl CoAs to TAG synthesis in the affected offspring.In addition, as a result of increased insulin concentrations, there is an increase in acetyl CoA carboxylase and sterol regulatory element bindingtranscription factor 1 (srebp1c), resulting in further up-regulation of FAS and TAG formation.
1806 BRUCE ET AL. HEPATOLOGY, December 2009
opmentally primed. This study shows for the first timethat early life exposure to HF feeding developmentallyand biochemically “primes” metabolic pathways associ-ated with NAFLD disease onset and progression in theoffspring. Specifically, in the case of the offspring exposedto a HF diet in both developmental and adult environ-ments, these “primed” pathways are induced to a greatereffect, resulting in a florid NASH phenotype.
At this point, we are unable to define a mechanism thatleads to this developmental priming of both impairedETC function and gene expression. However, it is plau-sible to speculate that suboptimal nutrition during thedevelopmental period may alter the epigenetic profile ofkey metabolic genes, subsequently leading to persistentmodulations in gene transcription, and increasing the riskof developing NASH in adulthood.42 Further studies areneeded to investigate these priming mechanisms and tofully elucidate the timing of events on the causal pathwayto NAFLD onset and progression to NASH.
In conclusion, our data provide evidence that exposureto a HF diet during early periods of development primesan increased susceptibility to hepatic steatosis and inflam-mation in adult offspring. Specifically, if previously“primed” offspring (with increased maternal fat intake)are subsequently fed a HF diet, this results in severe dis-ease similar to progressive human NASH. These data em-phasize the importance of a balanced diet duringpregnancy and lactation and the consequences for inci-dence of chronic disease if an unhealthy diet is consumedacross generations.
Acknowledgment: The authors thank Debbie Smith,Dyan Sellayah, and Frederick Anthony for technical andanalytical support during the project.
References1. Angulo P, Lindor KD. Non-alcoholic fatty liver disease. J Gastroenterol
Hepatol 2002;17(Suppl):S186-S190.2. Charlton M. Nonalcoholic fatty liver disease: a review of current understand-
ing and future impact. Clin Gastroenterol Hepatol 2004;2:1048-1058.3. Fraser A, Longnecker MP, Lawlor DA. Prevalence of elevated alanine
aminotransferase among US adolescents and associated factors: NHANES1999-2004. Gastroenterology 2007;133:1814-1820.
4. Angulo P. Obesity and nonalcoholic fatty liver disease. Nutr Rev 2007;65:S57-S63.
5. Bugianesi E, Vanni E, Marchesini G. NASH and the risk of cirrhosis andhepatocellular carcinoma in type 2 diabetes. Curr Diab Rep 2007;7:175-180.
6. Nobili V, Marcellini M, Marchesini G, Vanni E, Manco M, Villani A, et al.Intrauterine growth retardation, insulin resistance, and nonalcoholic fattyliver disease in children. Diabetes Care 2007;30:2638-2640.
7. Browning JD, Szczepaniak LS, Dobbins R, Nuremberg P, Horton JD,Cohen JC, et al. Prevalence of hepatic steatosis in an urban population inthe United States: impact of ethnicity. HEPATOLOGY 2004;40:1387-1395.
8. Preiss D, Sattar N. Non-alcoholic fatty liver disease: an overview of prev-alence, diagnosis, pathogenesis and treatment considerations. Clin Sci(Lond) 2008;115:141-150.
9. McCullough AJ. Pathophysiology of nonalcoholic steatohepatitis. J ClinGastroenterol 2006;40:S17-S29.
10. King JC. Maternal obesity, metabolism, and pregnancy outcomes. AnnuRev Nutr 2006;26:271-291.
11. Yajnik CS, Deshmukh US. Maternal nutrition, intrauterine programmingand consequential risks in the offspring. Rev Endocr Metab Disord 2008;9:203-211.
12. Godfrey KM. Maternal regulation of fetal development and health in adultlife. Eur J Obstet Gynecol Reprod Biol 1998;78:141-150.
13. Jones HN, Woollett LA, Barbour N, Prasad PD, Powell TL, Jansson T.High-fat diet before and during pregnancy causes marked up-regulation ofplacental nutrient transport and fetal overgrowth in C57/BL6 mice.FASEB J 2008;23:271-278.
14. Ozanne SE, Hales CN. Pre- and early postnatal nongenetic determinantsof type 2 diabetes. Exp Rev Mol Med 2002;4:1-14.
15. Samuelsson AM, Matthews PA, Argenton M, Christie MR, McConnellJM, Jansen EH, et al. Diet-induced obesity in female mice leads to off-spring hyperphagia, adiposity, hypertension, and insulin resistance: a novelmurine model of developmental programming. Hypertension 2008;51:383-392.
16. Srinivasan M, Katewa SD, Palaniyappan A, Pandya JD, Patel MS. Mater-nal high-fat diet consumption results in fetal malprogramming predispos-ing to the onset of metabolic syndrome-like phenotype in adulthood. Am JPhysiol Endocrinol Metab 2006;291:E792-E799.
17. Taylor PD, McConnell J, Khan IY, Holemans K, Lawrence KM, Asare-Anane H, et al. Impaired glucose homeostasis and mitochondrial abnor-malities in offspring of rats fed a fat-rich diet in pregnancy. Am J PhysiolRegul Integr Comp Physiol 2005;288:R134-R139.
18. Taylor PD, Poston L. Developmental programming of obesity in mam-mals. Exp Physiol 2007;92:287-298.
19. Elahi MM, Cagampang FR, Mukhtar D, Anthony FW, Ohri SK, HansonMA. Long-term maternal high-fat feeding from weaning through preg-nancy and lactation predisposes offspring to hypertension, raised plasmalipids and fatty liver in mice. Br J Nutr 2009;Feb 10:1-6.
20. Begriche K, Igoudjil A, Pessayre D, Fromenty B. Mitochondrial dysfunc-tion in NASH: causes, consequences and possible means to prevent it.Mitochondrion 2006;6:1-28.
21. Caldwell SH, Swerdlow RH, Khan EM, Iezzoni JC, Hespenheide EE,Parks JK, et al. Mitochondrial abnormalities in non-alcoholic steatohepa-titis. J Hepatol 1999;31:430-434.
22. Cortez-Pinto H, Chatham J, Chacko VP, Arnold C, Rashid A, Diehl AM.Alterations in liver ATP homeostasis in human nonalcoholic steatohepati-tis: a pilot study. JAMA 1999;282:1659-1664.
23. Machado M, Cortez-Pinto H. Non-alcoholic steatohepatitis and meta-bolic syndrome. Curr Opin Clin Nutr Metab Care 2006;9:637-642.
24. Perez-Carreras M, Del Hoyo P, Martı́n MA, Rubio JC, Martı́n A, Castel-lano G, et al. Defective hepatic mitochondrial respiratory chain in patientswith nonalcoholic steatohepatitis. HEPATOLOGY 2003;38:999-1007.
25. Pessayre D. Role of mitochondria in non-alcoholic fatty liver disease. JGastroenterol Hepatol 2007;22(Suppl 1):S20-S27.
26. Serviddio G, Bellanti F, Tamborra R, Rollo T, Romano AD, Giudetti AM,et al. Alterations of hepatic ATP homeostasis and respiratory chain duringdevelopment of non-alcoholic steatohepatitis in a rodent model. Eur J ClinInvest 2008;38:245-252.
27. Raffaella C, Francesca B, Italia F, Marina P, Giovanna L, Susanna I. Al-terations in hepatic mitochondrial compartment in a model of obesity andinsulin resistance. Obesity (Silver Spring) 2008;16:958-964.
28. Postic C, Girard J. Contribution of de novo fatty acid synthesis to hepaticsteatosis and insulin resistance: lessons from genetically engineered mice.J Clin Invest 2008;118:829-838.
29. Kleiner DE, Brunt EM, Van Natta M, Behling C, Contos MJ, CummingsOW, et al. Design and validation of a histological scoring system fornonalcoholic fatty liver disease. HEPATOLOGY 2005;41:1313-1321.
30. Shelley P, Tarry-Adkins J, Martin-Gronert M, Poston L, Heales S, Clark J,et al. Rapid neonatal weight gain in rats results in a renal ubiquinone(CoQ) deficiency associated with premature death. Mech Ageing Dev2007;128:681-687.
HEPATOLOGY, Vol. 50, No. 6, 2009 BRUCE ET AL. 1807
31. Peng X, Wood CL, Blalock EM, Chen KC, Landfield PW, Stromberg AJ.Statistical implications of pooling RNA samples for microarray experi-ments. BMC Bioinformatics 2003;4:26.
32. Bajorath J. Molecular organization, structural features, and ligand bindingcharacteristics of CD44, a highly variable cell surface glycoprotein withmultiple functions. Proteins 2000;39:103-111.
33. Satoh T, Ichida T, Matsuda Y, Sugiyama M, Yonekura K, Ishikawa T, et al.Interaction between hyaluronan and CD44 in the development of di-methylnitrosamine-induced liver cirrhosis. J Gastroenterol Hepatol 2000;15:402-411.
34. Choksi KB, Nuss JE, Boylston WH, Rabek JP, Papaconstantinou J. Age-related increases in oxidatively damaged proteins of mouse kidney mito-chondrial electron transport chain complexes. Free Radic Biol Med 2007;43:1423-1438.
35. Day CP, James OF. Steatohepatitis: a tale of two “hits”? Gastroenterology1998;114:842-845.
36. Caldwell SH, de Freitas LA, Park SH, Moreno ML, Redick JA, Davis CA,et al. Intramitochondrial crystalline inclusions in nonalcoholic steatohepa-titis. HEPATOLOGY 2009;49:1888-1895.
37. Skulachev VP. Membrane-linked systems preventing superoxide forma-tion. Biosci Rep 1997;17:347-366.
38. Sato W, Horie Y, Kataoka E, Ohshima S, Dohmen T, Iizuka M, et al. Hepaticgene expression in hepatocyte-specific Pten deficient mice showing steatohepa-titis without ethanol challenge. Hepatol Res 2006;34:256-265.
39. Zhen J, Lu H, Wang XQ, Vaziri ND, Zhou XJ. Upregulation of endothe-lial and inducible nitric oxide synthase expression by reactive oxygen spe-cies. Am J Hypertens 2008;21:28-34.
40. Roudkenar MH, Kuwahara Y, Baba T, Roushandeh AM, Ebishima S,Abe S, et al. Oxidative stress induced lipocalin 2 gene expression:addressing its expression under the harmful conditions. J Radiat Res(Tokyo) 2007;48:39-44.
41. Dillin A, Hsu AL, Arantes-Oliveira N, Lehrer-Graiwer J, Hsin H, FraserAG, et al. Rates of behavior and aging specified by mitochondrial functionduring development. Science 2002;298:2398-2401.
42. Gluckman PD, Lillycrop KA, Vickers MH, Pleasants AB, Phillips ES,Beedle AS, et al. Metabolic plasticity during mammalian development isdirectionally dependent on early nutritional status. Proc Natl Acad Sci U SA 2007;104:12796-12800.
1808 BRUCE ET AL. HEPATOLOGY, December 2009
![L'identification des enfants. Un concept utile pour l'analyse des primes socialisations [article dans Sociologie, 2015]](https://static.fdokumen.com/doc/165x107/63233cb2078ed8e56c0ac3fa/lidentification-des-enfants-un-concept-utile-pour-lanalyse-des-primes-socialisations.jpg)