Five DNA markers predict Legionella pneumophila pathogenicity
Upload
khangminh22Category
view
1download
0
Increased lipogenesis and impaired β-oxidation predict type 2diabetic kidney disease progression in American Indians
Farsad Afshinnia, … , Matthias Kretzler, Subramaniam Pennathur
JCI Insight. 2019. https://doi.org/10.1172/jci.insight.130317.
In-Press Preview
Graphical abstract
Clinical Medicine Metabolism Nephrology
Find the latest version:
https://jci.me/130317/pdf
1
Increased lipogenesis and impaired -oxidation predict type 2 diabetic kidney disease
progression in American Indians
Authors:
Farsad Afshinnia1, Viji Nair1, Jiahe Lin2, Thekkelnaycke M. Rajendiran3,4, Tanu Soni3, Jaeman
Byun1, Kumar Sharma5, Patrice E. Fort6, Thomas W. Gardner6, Helen C. Looker7, Robert G.
Nelson7, Frank C. Brosius8, Eva L. Feldman9, George Michailidis10, Matthias Kretzler1,
Subramaniam Pennathur1,3,11
Affiliations: 1University of Michigan, Department of Internal Medicine-Nephrology, Ann Arbor, MI, USA 2University of Michigan, Department of Statistics, Ann Arbor, MI, USA
3University of Michigan, Michigan Regional Comprehensive Metabolomics Resource Core, Ann
Arbor, MI, USA 4University of Michigan, Department of Pathology, Ann Arbor, MI, USA 5Department of Internal Medicine-Nephrology, University of Texas Health at San Antonio, San
Antonio, TX, USA 6Department of Ophthalmology and visual sciences, University of Michigan, Ann Arbor, MI, USA 7Chronic Kidney Disease Section, National Institute of Diabetes and Digestive and Kidney
Diseases, Phoenix, AZ, USA 8Department of Medicine, Division of Nephrology, University of Arizona, Tuscan, AZ, USA 9Department of Neurology, University of Michigan, Ann Arbor, MI, USA 10Department of Statistics and the Informatics Institute, University of Florida, Gainesville, FL,
USA 11University of Michigan, Department of Molecular and Integrative Physiology, Ann Arbor, MI,
USA
Address Correspondence to:
Subramaniam Pennathur, Division of Nephrology, 5309 Brehm Center, 1000 Wall Street,
University of Michigan, Ann Arbor MI 48105 Email: [email protected] Phone (734) 936-
5645 Fax (734) 232-8175
Running Title: Lipidomics and DKD
Word count: 11363
Tables: 3, Figures: 9, Supplements: 1
Support: Supported by the NIH grants R24DK082841, K08DK106523, R03DK121941,
P30DK089503, P30DK081943, P30DK020572, the Program for Neurology Research and
Discovery at Michigan Medicine (www.feldmanpnrd.org) and the Intramural Research Program
of the National Institute of Diabetes and Digestive and Kidney Diseases.
Key words: Diabetes, Diabetic kidney disease, Lipidomics, Mass spectrometry, System biology
Role of funding agency: Financial support of the project
2
Abstract:
Background: In this study, we identified the lipidomic predictors of early type 2 diabetic
kidney disease (DKD) progression, which are currently undefined.
Methods: This longitudinal study included 92 American Indians with type 2 diabetes. Serum
lipids (406 from 18 classes) were quantified using mass spectrometry from baseline samples
when iothalamate glomerular filtration rate (GFR) was ≥90 mL/min. Affymetrix GeneChip
Array was used to measure renal transcript expression. DKD progression was defined as ≥40%
decline in GFR during follow up.
Results: Participants had a mean age of 45±9 years and median urine albumin-creatinine ratio of
43 (interquartile range 11 to 144). The 32 progressors had significantly higher relative abundance
of polyunsaturated triacylglycerols (TAG)s and a lower abundance of C16-20 acylcarnitines
(AC)s (p<0.001). In a Cox regression model, the main effect terms of unsaturated free fatty acids
and phosphatidylethanolamines and the interaction terms of C16-20 ACs and short, low-double-
bond TAGs by categories of albuminuria independently predicted DKD progression. Renal
expression of acetyl-CoA carboxylase encoding gene (ACACA) correlated with serum
diacylglycerols in the glomerular compartment (r=0.36, p=0.006), and with low-double-bond
TAGs in the tubulointerstitial compartment (r=0.52, p<0.001).
Conclusion: Collectively, the findings reveal a previously unrecognized link between lipid
markers of impaired mitochondrial β-oxidation and enhanced lipogenesis and DKD progression,
in individuals with preserved GFR. Renal acetyl-CoA carboxylase activation accompanies these
lipidomic changes and suggests that it may be the underlying mechanism linking lipid
abnormalities to DKD progression.

3
Funding: R24DK082841, K08DK106523, R03DK121941, P30DK089503, P30DK081943,
P30DK020572
Trial Registration: ClinicalTrials.gov, NCT00340678
4
Introduction:
Diabetes is the leading cause of end-stage kidney disease in the United States and many
other parts of the world (1). According to the 2018 United States Renal Data System report, the
prevalence of end-stage kidney disease from diabetes continues to increase (2) and is expected to
increase by 44% by 2030 (3). Efforts aimed at risk modification and halting diabetic kidney
disease (DKD) progression are focused on the early stages of DKD, when treatment to slow
disease development may be most successful. Clinical care of DKD patients presently relies on
traditional biomarkers such as estimated glomerular filtration rate (eGFR) and urine albumin-
creatinine ratio (ACR), which have limited precision and prognostic value early in the disease.
Accordingly, there is a need for biomarkers that predict DKD progression early in its course for
proper risk stratification and for rational targeted intervention.
Lipid studies in human clinical research are often limited to measuring a traditional panel
of lipids, including total cholesterol, lipoproteins, and total triacylglycerols (TAG)s (4-8)).
However, lipids are the most abundant and diverse class of molecules in the circulation with
numerous physiological and metabolic functions (9, 10). Mass spectrometry (MS) based
technological advances for identifying and quantifying lipids in biological samples have revealed
the diversity of lipids, and also uncovered their clinical relevance in a number of diseases (9-17).
In a cross-sectional study of 214 patients from the Clinical Phenotyping and Resource Biobank
Core (CPROBE) cohort with chronic kidney disease (CKD), we found progressive differences in
the human plasma lipidome from CKD stage 2 to stage 5 (18). In particular, we demonstrated an
increase in the abundance of C16-C20 saturated free fatty acids (FFA) and polyunsaturated
longer chain complex lipids in the later stages of CKD. In more advanced CKD, this lipid
phenotype was associated with a lower long (C16-20)-to-intermediate chain (C6-C14)
5
acylcarnitine (AC) ratio, a marker of impaired β-oxidation of long chain (C16-C20) fatty acids.
This leads to an increased abundance of C16-C20 carbon FFAs, rather than their acylation with
carnitine to generate ACs and longer polyunsaturated complex lipids (18). In the lipidomic
analysis of the Chronic Renal Insufficiency Cohort (CRIC), we found a higher abundance of
phosphatidylethanolamines (PE)s in progressors compared to non-progressors (19). While there
have been several efforts to identify progressive renal decline in diabetic patients with impaired
renal function (19-24), less is known about the mechanisms, determinants and markers of early
decline in patients with preserved renal function. Early decline was studied recently by the Joslin
group and markers of tubular damage were identified as predictors of progression (23, 25). The
central hypothesis of our present study was that the differential lipid alterations observed at more
advanced DKD stages are a continuum of a process that starts prior to the onset of clinical DKD.
Additionally, lipid alterations identified earlier may serve as markers of early DKD progression
when traditional biomarkers such as eGFR and urine ACR are still normal. DKD has been
characterized extensively over many years in American Indians from the Gila River Indian
Community (26-31). In the present study, we examined the lipidomic predictors of DKD
progression in this cohort. We hypothesized, based on our earlier observations (18, 19) that a
subset of ACs, TAGs, FFA, and PEs would predict DKD progression at an early stage in patients
with type 2 diabetes with preserved GFR (>90 mL/min) and normal urinary albumin excretion
(ACR<30 mg/g). The presence of extensive clinical phenotyping and longitudinal follow-up, and
the availability of matched serum and kidney biopsy specimens at a time when renal function is
well-preserved, makes this cohort ideal for performing systems integration of lipidomic and renal
lipid gene expression profiling. Our studies reveal previously unrecognized novel lipidomic
signature of early DKD progression.
6
Results:
Patient characteristics: American Indians from the Gila River Indian Community participated
in a longitudinal study of diabetes and its complications. 169 of the study participants were
recruited between 1996 and 2001 for a randomized, double-blind, placebo-controlled, clinical
trial to assess the efficacy of the angiotensin receptor blocker losartan on onset and progression
of diabetic nephropathy in type 2 diabetes (ClinicalTrials.gov, number NCT00340678).
Iothalamate based GFR was measured annually (32, 33). Of 169 participants in the clinical trial,
111 underwent a protocol kidney biopsy at the end of 6 years of treatment. We selected 92
participants who underwent a kidney biopsy and had both a GFR ≥90 mL/min and serum
samples available that had been collected during the GFR measurement taken closest to the
kidney biopsy. This examination was considered the baseline (Figure 1). The primary outcome
was defined as a sustained decline in GFR by 40% in follow up examinations, an outcome which
is accepted as a surrogate marker of CKD progression (34). Time to event was defined as the
interval between the date of baseline GFR measurement and the date of the primary outcome. A
GFR<90, <60, and <30 mL/min were defined as secondary outcomes. The 92 participants,
including 67 women and 25 men, were followed for a maximum of 13.6 years (median 9.6 years
and interquartile range 7.3 to 11.0 years). Their mean age was 45±9 years, and body mass index
(BMI) was 36.1±8.3 kg/m2 in the female participants and 34.2±7.9 kg/m2 in the male participants
(p=0.33). Thirty-two of the participants reached the primary renal outcome of 40% decline in
measured GFR during follow up.
Baseline characteristics: The baseline characteristics of progressors and non-progressors are
shown in Table 1. Most characteristics were similar in the two groups, except for statistically
7
higher mean diastolic blood pressure, fasting plasma glucose (FPG), HbA1c, GFR, and urine
ACR in the progressors. Baseline and last measured GFRs for both groups are shown in Figure 2.
Baseline lipidomic profile of progressors and non-progressors: We measured 406 lipids from
18 classes including TAGs, diacylglycerols (DAG)s, monoacylglycerols (MAG)s,
phosphatidylcholines (PC)s, PEs, plasmenyl-PCs (pPC)s, plasmenyl-PEs (pPE)s, lyso-PCs
(LPC)s, lyso-PEs (LPE)s, FFAs, cholesteryl-esters (CE)s, cardiolipins, phosphatidic acids (PA)s,
phosphatidylinositols (PI)s, phosphatidylglycerol (PG)s, phosphatidylserine (PS)s,
sphingomyelins (SM)s, and ceramide-phosphates in positive and negative ionization modes
(Supplement Table 1). After combining the different adducts of the same feature and eliminating
the classes consisting of 2 or fewer lipid molecules (PA, PG, PS, pPC, ceramide phosphate, and
MAG), 236 unique lipids including 16 FFAs (6.8%), 76 glycerolipids (32.2%), 83 phospholipids
(35.1%), 12 CEs (5.1%), 20 SM (8.5%), and 29 ACs (12.3%) were included in the analysis.
In progressors (≥40% decline in GFR), there was a higher relative abundance of longer TAGs
with more double bonds (p<0.0001) (Figure 3A). Conversely, in non-progressors there was a
lower relative abundance of longer TAGs with more double bonds at baseline (p=0.022) (Figure
3A). The alterations in lipid abundance by carbon number or saturation status were independent
of baseline GFR, ACR, weight, FPG, and HbA1c. Similar alterations in the relative abundance of
TAGs were observed when all participants were divided based on whether they reached a
sustained GFR<90 mL/min, <60 mL/min, or <30 mL/min with stronger trends with increased
CKD severity (p<0.0001) (Figure 3B). There were no significant alterations between progressors
and non-progressors in the levels of other complex lipids by differences in the number of carbons
or double bonds.

8
Baseline AC profiles in progressors and non-progressors: For the primary outcome of ≥40%
GFR decline (Figure 3C), there was a significantly lower abundance of serum ACs with a longer
chain length (C16-20) in progressors (p<0.001). Conversely, the non-progressors exhibited a
higher abundance of serum ACs with longer chain length (p=0.026). These changes were inverse
to the alterations observed in TAGs in progressors and non-progressors. Similar changes in the
abundance of longer chain length ACs (C16-20) were observed when all participants were
divided based on whether they reached a sustained GFR<90 mL/min (Figure 3D, left panel), <60
mL/min (Figure 3D, middle panel), or <30 mL/min (Figure 3D, right panel). Overall, the
abundance of C16-C20 ACs was significantly lower in participants who reached the GFR
threshold compared to those who did not (p≤0.015), suggesting impaired -oxidation.
Baseline long-chain-to-intermediate-chain AC ratio correlation with chain length and
saturation of other complex lipids: The data in figure 3A-D suggest that the abundance of
longer chain ACs correlates directly with shorter TAGs and inversely with longer TAGs. We
also examined the correlation of the long-to-intermediate chain ACs with different principal
components (Supplement Table 2) characterized by their length and saturation status. We found
a significant direct correlation between long-to-intermediate chain AC ratio and the short
complex lipids with fewer double bonds in the TAG, pPE, PE, and DAG lipid classes (Figure 4).
We also observed a significant inverse correlation between long-to-intermediate chain AC and
the longer chain complex lipids with more double bonds in the CE classes (Figure 4).
Alteration of ACs by categories of urinary ACR: The abundance of ACs in progressors and
non-progressors by change in number of carbons and double bonds was also compared when
stratified by the baseline ACR category (Figure 5). The heat map suggests a trend toward lower
levels of long chain ACs (C16-20) from non-progressors with ACR<30 mg/g to progressors with
9
ACR>300 mg/g. Within each ACR category, the change in AC abundance by increased carbon
number reached statistical significance and increased in non-progressors with ACR 30-299 mg/g
(p=0.006), and decreased in progressors with ACR>300 mg/g (p<0.0001). Overall, the mean
level of C16-20 ACs in progressors with ACR>300 mg/g was significantly lower than in any
other subgroup (p≤0.004), except non-progressors with ACR>300 mg/g where the difference did
not reach statistical significance.
Risk prediction of DKD progression from lipid changes: We used the lipid principal
components (Supplement Table 2) to construct Cox regression models for risk prediction of
DKD progression. We applied different models with varying levels of adjustment. First, we built
the base model, which included the study principal components without adjusting for the clinical
variables (Table 2, Model 1: ACR+GFR). In this model, each 1 standard deviation (SD) increase
in unsaturated PEs was associated with 1.78-fold higher risk of progression (95% confidence
interval [CI]: 1.24 to 2.57, p=0.002), and each 1 SD increase in unsaturated FFAs was associated
with 0.66-fold lower risk of progression (95% CI: 0.46 to 0.95, p=0.026) independent of other
lipid factors. In the next step, we identified the principal components with a significant
interaction term by ACR category and then added them to the base model (Table 2, Model 2:
Lipids). By doing so, we observed strengthening of the significance of unsaturated PEs and
unsaturated FFAs. However, we also noted that each 1 SD increase in C16-20 ACs in
participants with ACR<30 mg/g, compared to ACR≥300 mg/g, was associated with a 3.36-fold
higher risk of DKD progression (95% CI: 1.00 to 11.28, p=0.05). Similarly, each 1 SD increase
in short low double bond TAGs was associated with significantly lower risk of progression in
participants with ACR<30 or ACR 30-299 mg/g compared to ACR≥300 mg/g (Table 2, Model 2:
Lipids). Further adjusting using baseline GFR, ACR, FPG, and HbA1c did not alter the results
10
and similar estimations were obtained in the fully adjusted model (Table 2, Model 3;
ACR+GFR+Lipids).
Next, we compared the probabilistic risk scores of progressors and non-progressors obtained
from these 3 models. Model 3 (ACR+GFR+Lipids) showed the largest difference between the
risk score of progressors and non-progressors, on average, compared with the other two models
(Figure 6A). When percentage with progression was compared by the risk-score quartiles, the
first quartile of the full model was more likely to consist of non-progressors and its fourth
quartile was more likely to consist of progressors compared to the other two models (Table 3).
Differential network analysis: To understand changes in the potential interactions between
lipids, we performed differential network analysis using sparse correlations networks in the
progressor and non-progressor subgroups. The differential network analysis revealed a
significant loss of inter and intra-class correlation of lipids in progressors compared to non-
progressors. This was observed most frequently in the TAG, PE, and AC subclasses and, to a
lesser extent, in other subclasses (Figure 7). Overall, out of 55,460 possible permutations of
bivariate correlations in 236 lipids, non-progressors had 1028 significant edges while progressors
had 547 (p<0.0001). Among classes with at least five significant correlations with other lipids,
there were 519 significant edges in non-progressors and 287 edges in progressors, a 50% decline
(p<0.0001).
Systems integration of renal transcriptomics and serum lipidomics: Because a protocol
kidney biopsy taken near the time of baseline serum collection was available, we had the unique
opportunity to perform an integrative transcriptomic analysis using dissected glomerular and
tubulointerstitial kidney tissue and serum lipids. The transcriptomic-lipidomic analysis in the
glomerular compartment revealed significant correlations between lipid factors, including FAs,
11
glycerolipids, and ACs with the genes regulating their synthesis and metabolism (Supplement
Table 4). Specifically, a higher abundance of longer polyunsaturated DAGs was associated with
higher gene expression of the acetyl-CoA carboxylase (ACACA; p=0.0062, FDR=0.060).
Conversely, the abundance of long chain ACs was inversely correlated with expression of fatty
acid metabolism encoding genes (p≤0.0052, FDR≤0.052). In the tubulointerstitial compartment,
there were significant correlations between fatty acids, glycerolipids, phospholipids, and ACs
and the expression of genes involved in the synthesis and metabolism of fatty acids,
phospholipids, glycerolipids, and sterol lipids. There were a larger number of significant
correlations between the genes responsible for de novo synthesis, desaturation, elongation, and β-
oxidation of various serum fatty acids, glycerolipids, and long chain ACs (Supplement Table 5).
Specifically, a higher abundance of intermediate-chain low-double-bond TAGs was associated
with a higher ACACA expression (p=0.0042, FDR=0.009). Additionally, in the tubulointerstitial
compartment, we noticed a significant direct correlation between fatty acid abundance in serum
and the expression of genes responsible for de novo fatty acid biosynthesis (ACSL5 and LYPLA3
or PLA2G15) and their β-oxidation (ACAD10). We also observed a direct correlation between
short-low-double bond DAGs and unsaturated FFAs and genes responsible for elongation
(ELOVL1 and ELOVL5) and desaturation (DEGS1). There were inverse correlations between
high-double-bond TAGs and saturated FFA and genes coding elongation (ELOVL1 and
ELOVL4) and between short-low-double-bond DAGs and TAGs, unsaturated FFA, and long-
chain AC and genes regulating β-oxidation (Supplement Table 5). Ingenuity Pathway Analysis
based on the top lipid-transcripts revealed enrichment of G-Protein coupled signaling pathways
as regulators of de novo lipogenesis in both glomerular (Figure 8A) and tubulointerstitial
compartments (Figure 8B). The genes involved in lipid metabolism downstream of the nuclear
12
hormone-activated receptors peroxisome proliferator–activated receptor γ (PPARG) and
peroxisome proliferator–activated receptor A (PPARA) were expressed with a high degree of
similarity in both glomerular (Figure 8C) and tubulointerstitial compartments (Figure 8D),
suggesting similar lipogenic processes are activated in both compartments by these upstream
regulators.

13
Discussion:
We identified novel, previously unrecognized lipid predictors of progressive DKD in
diabetic American Indians with preserved kidney function, as indicted by GFR≥90 mL/min.
Lipid factors representative of unsaturated FFA and PEs, short-low-double-bond TAGs, and
long-chain ACs predicted DKD progression in these patients. A transcriptomic-lipidomic
integrative analysis revealed significant correlation between serum FFAs and genes regulating de
novo fatty acid synthesis in the glomerular compartment. Similarly, the integrative analysis
showed a significant correlation between serum FFAs, glycerolipids, and ACs and genes
regulating de novo fatty acid synthesis, desaturation, elongation, and β-oxidation. Importantly,
the gene regulating acetyl-CoA carboxylase (ACACA) was directly associated with long
polyunsaturated DAGs in the glomerular compartment, and with low-double-bond intermediate-
length TAGs in the tubulointerstitial compartment. The differential networks identified in the
present study reflect a differential interactome among various lipids by status of DKD
progression.
The results of this study carry significant clinical implications. While tubular markers
have been proposed as indicators of early renal function decline, there are no known lipid
predictors of DKD progression at a stage when GFR is preserved and other patients’
characteristics are non-informative. The proposed panel accurately predicts DKD onset and
progression and, therefore, may have clinical applicability for risk stratification in patients with
diabetes. Second, the lipid markers unravel novel mechanism underlying DKD progression:
impaired mitochondrial -oxidation and altered complex lipid remodeling. Importantly, the
ability to perform integrative renal gene expression with serum lipids was uncovered ACC
activation as a critical determinant. Consequently, ACC inhibition might be a therapeutic
14
strategy to prevent DKD or slow its progression. Not all patients with diabetes develop DKD,
therefore, the possible contribution of ACC polymorphisms to renal outcomes needs to be
investigated. Furthermore, in an earlier study of this cohort, progressors were shown to have a
higher mesangial fractional volume, percentage of global glomerular sclerosis, non-podocyte cell
number per glomerulus, glomerular basement membrane width, mean glomerular volume, and
podocyte foot process width. However, they had lower glomerular filtration surface density, with
fewer endothelial fenestrations after adjustment for baseline age, sex, duration of diabetes,
HbA1c, GFR, and treatment assignment during the clinical trial (26). Although, such early
histological alterations provided a readout of future decline in renal function, lipid alterations
provide a noninvasive readout of similar long-term outcomes and demonstrate potential for early
stage risk stratification in clinical practice.
There are a number of similarities in the results of this study and our previous lipidomic
study in CRIC (19). However, a few differences between these two studies are worth noting. At
baseline examination, participants of CRIC had CKD stage 3A or 3B, while in this study all were
at stage 1 (GFR>90 mL/min). Only 50% of the CRIC participants had type 2 diabetes, whereas
every participant in this study has type 2 diabetes. FFAs and ACs were not measured in CRIC
nor were kidney biopsies routinely obtained as part of research data collection. Despite these
differences, we noted a higher risk of DKD progression at higher levels of unsaturated PEs in
American Indians with diabetes, which is aligned with enrichment of PE as a class and its higher
abundance in CKD progressors in the CRIC study (19). In a metabolomic investigation in
participants of the African American Study of Kidney Disease and Hypertension (AASK) and
the Modification of Diet in Renal Disease (MDRD), a significant enrichment of PEs was noted
among the top metabolites associated with proteinuria in CKD patients (35). Aligned with these

15
observations, a diabetic mouse model showed accumulation of the Amadori-PEs species in
tubular cells (36). The mechanistic link between PE and DKD progression has yet to be
identified. However, PEs have diverse cellular functions including oxidative phosphorylation,
mitochondrial biogenesis, and autophagy. PEs are phosphatidylcholines precursors, substrates for
posttranslational modifications, influence membrane topology, and promote cell and organelle
membrane fusion (37). Cell culture experiments also suggest that exposure to PE alters the
plasma membrane bilayer with total loss of asymmetrical aminophospholipids, and promotes
apoptosis (38) and autophagy (39).
Another finding in our study was a lower risk of DKD progression with higher
unsaturated FFA abundance. This finding is aligned with earlier studies that illuminated salutary
effects of longer unsaturated FFAs, such as oleate and eicosapentaenoic acid, on inflammation,
endoplasmic reticulum stress, and eventually better podocyte and pancreatic cell survival
compared with the effect of saturated FFA palmitate (40-43). In a cross-sectional analysis of the
CPROBE study, we showed that at more advanced CKD stages, there was a significantly greater
abundance of longer polyunsaturated TAGs and a lower abundance of C16-20 ACs (18). Patients
at CKD stage 5 thus had the highest abundance of longer polyunsaturated TAGs and the lowest
abundance of C16-20 ACs. Replication of this pattern was seen in this study in DKD
progressors, but at a much earlier stage when GFR was still above 90 mL/min. In the CRIC
study, although DAGs as a class were enriched in CKD progressors, TAGs were not significantly
different (19), a finding inconsistent with CPROBE and the current study. A likely explanation is
the narrow range of baseline GFRs in CRIC participants compared to the CPROBE study whose
patients were at all stages, and the marked heterogeneity in CRIC enrollees compared to the
homogeneity of American Indian cohort. TAGs differ in their renal toxicities by their acyl length

16
and number of double bonds, and in part by the characteristics of their acyl constituents,
especially when they are non-esterified (prior to utilization in the construct of TAGs or after their
lipolysis). Overall, the main renal toxicities are determined by saturated fatty acids such as
palmitate, through mechanisms that involve activation of AMP-activated protein kinase (AMPK)
and mammalian target of rapamycin complex-1 (mTOR1) signaling pathways. Furthermore, they
can promote insulin resistance, mitochondrial superoxide generation, and endoplasmic reticulum
stress. Other mechanisms of toxicity include impairment of the podocyte actin cytoskeleton,
induction of autophagy, and eventual triggering of apoptosis and cell death (40, 42, 44-49).
Within the tubulointerstitial compartment, palmitate upregulates the monocyte chemoattractant
protein-1, leading to intracellular activation of DAG followed by protein kinase C(PKC), which
further promotes renal tubular cell injury (43). Abundance of saturated fatty acids (specifically
palmitate) upregulates the elongation and desaturation of shorter free fatty acids and their
incorporation in the construct of TAGs. The longer polyunsaturated TAGs have a higher melting
temperature with greater fluidity, and thus are less toxic than the non-esterified saturated fatty
acids. Therefore, although they served as a surrogate marker of DKD progression, their higher
abundance in progressors likely signifies upregulation of adaptive compensatory processes
(elongation, desaturation) to convert more toxic lipids (saturated non-esterified fatty acids) into
less toxic lipids (polyunsaturated long TAGs). The progressors were also characterized by lower
abundance of shorter TAGs with fewer double bonds. This probably reflects a lower abundance
of fatty acids with ≤14 carbons, which become the dominant mitochondrial substrates in
progressors whose mitochondrial shuttling of fatty acids with ≥16 carbons is impaired due to
carnitine palmitoyltransferase I (CPT-1)inhibition (50). This response leads to a relatively lower
abundance, and thus lower likelihood of their incorporation into corresponding (short) TAGs.
17
Therefore, while the high abundance of longer polyunsaturated TAGs signifies upregulation of
elongation and desaturation as compensatory mechanisms, the lower abundance of shorter and
saturated TAGs reflects low abundance of the corresponding non-esterified fatty acids (≤14 C),
which indicates impaired β-oxidation of fatty acids with ≥16 carbons. When stratified by levels
of albuminuria, progressors with normal albumin excretion (ACR<30 mg/g) had significantly
higher AC levels compared with progressors with overt proteinuria (ACR>300 mg/g), suggesting
that β-oxidation may be upregulated as a compensatory mechanism in the early stages of DKD,
but that β-oxidation becomes impaired over time with progression to overt proteinuria. These
observations suggest that the lipid phenotype associated with advanced DKD may be a
continuum that begins mechanistically at an early stage, allowing early discrimination of
progressors from non-progressors and risk stratification during early kidney disease when no
other prognostic tools are available.
The Ingenuity Pathway Analysis highlights the enrichment of the G-protein signaling
pathways in both glomerular and tubulointerstitial compartments. G-Proteins promote
transcriptional activation of metabolic genes by carbohydrate-response element-binding protein
(ChREBP), and regulate downstream lipogenic genes, including acetyl-CoA carboxylase
(ACACA), fatty acid synthetase, acyl CoA synthase and glycerol phosphate acyl transferase
(https://www.ncbi.nlm.nih.gov/biosystems/1270101?Sel=geneid:2771#show=genes). In
particular, the significant association of ACACA gene expression with DAGs in the glomerular
and TAGs in the tubulointerstitial compartments supports the hypothesis that the observed
differential serum lipids may be regulated, in part, by renal ACC. The direct correlation of
shorter low double bond DAGs with elongase and desaturase imply that a higher abundance of
such lipids may upregulate the renal cortical elongation and desaturation of fatty acids as a
18
compensatory mechanism that converts shorter and relatively more saturated, toxic lipids into
longer, relatively more unsaturated, less toxic products. On the other hand, the direct correlation
of saturated FFAs with ACAD10, a β-oxidation regulatory gene, suggests they may upregulate β-
oxidation, at least in early-stage DKD, a process which may be reversed with DKD progression
or by unsaturated FFAs, due to their inverse correlation with ACAT2, β-oxidation regulatory
gene. Altogether, the differential lipid alterations associated with DKD progression suggest
accelerated renal de novo lipogenesis and impaired β-oxidation (18).
Acceleration of de novo lipogenesis is a major contributor to dyslipidemia in insulin
resistance states such as in type 2 diabetes (51). De novo lipogenesis of long-chain fatty acids is
dependent on the activity of three cytosolic enzymes: ATP citrate lyase, ACC, and fatty acid
synthetase (52). ACC is a key regulatory enzyme in lipogenesis and its activity is under
hormonal regulation by insulin, glucagon, and epinephrine. During insulin-resistance, increased
insulin promotes ACC activation via its protein-phosphatase mediated dephosphorylation (53). A
recent expression Quantitative Trait Loci (eQTL) analysis of participants of Nephrotic Syndrome
Study Network revealed a significant differential expression of G/C ACACA variant in both
glomerular and tubulointerstitial compartments of the participants (54), suggesting possibility of
ACACA polymorphism on ACC activity. ACC activation inhibits CPT-1, lowering cytosolic
conversion of long-chain acyl-CoA to long-chain AC, decreased substrate for the carnitine
shuttle, impaired β-oxidation of long-chain fatty acids, and increased cytosolic abundance of
palmitate (52). Increased palmitate promotes elongation and desaturation, as evidenced by
upregulation of stearoyl-CoA desaturase (SCD) 1 and 2 (Figure 9) (55). It also exerts its
deleterious effects on podocytes and tubulointerstitial cells by upregulating AMPK and mTOR1
signaling, intracellular serial DAG and PKC activation, induction of mitochondrial superoxide
19
generation, endoplasmic reticulum stress, and, eventually, promotion of autophagy, apoptosis
and cell death (40, 42, 43, 46-49).
Based on these data, we propose a model to account in part for these serum lipidomic
changes that predict DKD progression (Figure 9). Upregulation of renal (and possibly liver)
ACC in the diabetic milieu enhances de novo lipogenesis, which generates excess saturated fatty
acids (e.g., palmitate). Although kidney ACC expression is modified, the liver may also
influence circulating levels of fatty acids and complex lipids. With elongation and desaturation,
palmitate is converted to longer unsaturated fatty acids, which are incorporated into complex
lipids (e.g., glycerolipids). In addition, ACC upregulation can inhibit CPT1, which impairs β-
oxidation. Finally, elevated free fatty acids present in the diabetic state can exacerbate
mitochondrial dysfunction, especially in the setting of impaired fatty acid oxidation. The net
effect will be a pattern of complex lipid remodeling and diminished fatty acid -oxidation, as
observed in our studies.
This study has several strengths, including the longitudinal study design, rigorous quality
control with good reproducibility metrics in a robust LC/MS lipidomic platform, and excellent
phenotyping of a well-characterized cohort of type 2 diabetes patients. Yearly follow ups and
iothalamate-based GFR measurements provided accurate evaluation of kidney outcomes. A
kidney biopsy near the time of baseline serum collection permitted a novel integrative lipidomic-
transcriptomic analysis. The availability of data and samples prior to the onset of clinical DKD
provided the opportunity to identify early prognostic DKD markers.
This study also has limitations. Although existing knowledge of the de novo lipogenesis
pathway, along with the results obtained from the transcriptomic-lipidomic integrative analysis,
support the hypothesis that ACC activation may be responsible, in part, for the differential lipid

20
pattern, our results cannot distinguish whether the increased renal ACC expression is a cause or a
consequence of the differential plasma lipid profile. In a recent study, we assessed individual
lipid features present in plasma from control and diabetic db/db mice (56). Plasma lipid levels
and DAG saturation status corresponded to kidney levels in diabetic mice compared to control,
suggesting that plasma DAG metabolism may be reflected in the kidney. However, this
relationship is not known in humans and technically not feasible to assess given the difficulty in
obtaining adequate kidney biopsy specimen for lipidomic analysis. The study sample size is
small, and replication of the study, including the risk prediction model, in larger cohorts and in
other racial/ethnic groups is warranted. Like any other omic-type research, this study has a large
number of variables due to the high-throughput data generated by the lipidomic platform. We
applied a number of strategies to minimize the need for multiple testing including application of
mixed-linear models to study alterations at the group level versus individual lipids, reducing the
data to a smaller number of principal components for downstream analysis, partial correlation-
based sparsing techniques for the study of the differential networking, and FDR correction for
multiple testing in lipidomic-transcriptomic integrative analysis. Although we observed a
significant interaction between categories of albuminuria in the risk prediction model, with
advancing DKD, the differential lipid alterations were independent of proteinuria in our prior
cross-sectional study (18). Routinely, frequency of follow up declines over time, and participants
with worse kidney function tend to attend research examinations less often than participants with
preserved kidney function, raising the possibility of differential censoring by outcome (29, 30).
However, in this particular subset of participants, the duration and number of follow-up visits
were almost equal in progressors and non-progressors, so the potential for ascertainment bias due
to differences in follow up is low. The current study is also limited by its sample size to
21
investigate ACACA polymorphism despite evidence for ACACA polymorphism in other renal
eQTL studies (54).
This study has important clinical implications and illustrated that a panel of lipid
biomarkers may predict decline at early stage when kidney function is still preserved (GFR>90
mL/min). It provides a valuable opportunity for early stage risk stratification when there is a
paucity of reliable biomarkers at early stage. The proposed underpinning mechanism suggests
targeted interventions at early stage. Inhibition of kidney fibrosis by modulating fatty acid
receptors (57) provides further encouraging evidence for the success of such interventions. We
conclude that lipid alterations that typify advanced DKD are present before the onset of clinical
DKD and are characterized by higher abundance of unsaturated PEs, longer polyunsaturated
TAGs, but lower abundance of unsaturated FFAs and C16-20 ACs. In patients with GFR>90
mL/min, a panel of lipids consisting of unsaturated FFA and PEs, short-low-double-bond TAGs,
and long-chain ACs predicts the onset and progression of DKD. The underlying mechanism may
depend on impairment of fatty acid -oxidation and renal ACC activation, thus providing a
potential therapeutic target (Figure 9).
22
Methods:
Patients: Details of the study population and participant recruitment are published elsewhere
(31).
Sample preparation and mass spectrometry: We applied previously published methods for
sample preparation (18, 19, 58). In brief, we used the modified Bligh-Dyer method for lipid
extraction. We retrieved 10 µL of serum and added water/methanol/dichloromethane at room
temperature with 2:2:2 volume ratio, followed by spiking internal standards PC17:0/17:0, LPC
17:0, PG 17:0/17:0, PE 17:0/17:0, TAG 17:0/17:0/17:0, SM 18:1/17:0, MAG 17:0, DAG
16:0/18:1, CE 17:0, ceramide d 18:1/17:0, PA 17:0, PI 17:0/20:4, and PS 17:0/17:0. After
collecting the organic layer, we dried the extracts under nitrogen and reconstituted them by
adding 100 μL of acetonitrile/water/isopropyl alcohol (10:5:85) followed by 10 mM ammonium
acetate (NH4OAc). Then we subjected the extracts to liquid chromatography-mass spectrometry
(LC/MS), utilizing ABSciex quadrupole time of flight (TOF)-5600 mass spectrometer equipped
with a Turbo VTM ion source (AB Sciex, Concord, Canada) and Shimadzu CTO-20A Nexera X2
UHPLC with water acquity UPLC HSS T3 1.8 µm column (Waters, Milford, MA). ACs were
quantified by LC/MS using an Agilent 6410 Triple quadrupole tandem mass spectrometer
(Agilent, Santa Clara, CA) with a targeted method described previously (59).
Quality Control: A pool of study samples was injected at the beginning and after every 20 MS
runs in the lipidomic study and after every 15 MS runs in the AC study to assess the stability of
the measures over time and to identify any batch effects (Supplement Figures 1 and 2).
Transcriptomic Analysis: We manually microdissected kidney biopsy specimens to isolate
glomerular and tubulointerstitial tissue. Glomerular and tubular gene expression profiling was
performed as described previously on Affymetrix Gene Chip Array Human Genome series
23
U133A and Plus 2.0 (Affymetrix, Inc., Santa Clara, CA) (60, 61). Cell files were processed,
normalized (Robust Multi Array method) and batch corrected (COMBAT) on the R statistical
platform. We used Human Entrez Gene custom CDF from Brainarray for annotations
(http://brainarray.mbni.med.umich.edu/). Normalized and log2 transformed expression profiles
were used in all the downstream analyses.
Statistical analysis: We applied mean ± SD or frequency (percentage) for description of
normally distributed continuous and categorical variables, respectively. Median and interquartile
range were used to describe non-normally distributed variables. To compare the baseline
characteristics of progressors and non-progressors we used the t-test for normally distributed
continuous variables, the Kolmogorov-Smirnov test for skewed continuous variables, and the
chi-square test for categorical variables. We used the relative abundance of the peak intensities
for the downstream analysis. To prepare the lipidomics data for downstream analysis, the batch
normalized raw peak intensities were sum normalized by lipid members within each lipid sub-
class, logit transformed, and z-score standardized (18). We used principal component analysis
(PCA) to reduce the number of lipids of the TAG, DAG, PE, pPE, CE, FFA, and AC classes to
subclasses to generate secondary variables representative of various chain lengths within these
classes (Supplement Table 2). Long-chain AC (C16-C20)-to-intermediate-chain AC (C6-C14)
ratio was applied as a marker of efficiency of β-oxidation (62). Multiple linear regression
analysis was applied to explore the relationships between the long-chain-to-intermediate-chain
AC ratio (predictor variable) with the resulting principal components (secondary variables) of
complex lipids. We used generalized linear mixed models to test the intra-class alteration in lipid
abundance (standardized, logit transformed, normalized lipid intensities used as the dependent

24
variable) by change in carbon number and number of double bonds (saturation status) as the
predicting variables.
We applied a Cox proportional hazard model to identify the independent lipid predictors
of DKD progression and to estimate the risk associated with their change. Violation to
proportional hazard assumption was ruled out by confirming the random distribution of the
scaled Schoenfeld residuals also known as partial residuals of the predicting variables over time.
We adjusted the models by BMI, fasting plasma glucose (FPG), hemoglobin A1c (HbA1c), and
ACR followed by elimination of non-significant covariates from the model. The probability of
progression by various panels was estimated using the logit score of the corresponding predictors
in each panel and their conversion to probabilistic risk scores (63). Risk score calculation was
performed separately for the baseline ACR and GFR, the lipids proposed by Cox model, and the
proposed lipids plus baseline ACR and GFR. The risk analysis was performed separately for the
baseline model (Model 1: ACR+GFR), the model incorporated lipid components with a
significant interaction term by ACR categories (Model 2: Lipids), and the model adjusted further
by baseline GFR, ACR, FPG, and HbA1c (Model 3: ACR+GFR+Lipids).
Because baseline TAG levels were different between progressors and non-progressors,
the glycerolipid factors and their upstream regulators (FFAs and ACs) were tested for their
correlation with corresponding renal tissue transcripts. We used MetScape to map lipid
identifiers to gene symbols responsible for lipid metabolism (64). The log2 z-score standardized
values of the corresponding genes were calculated, aimed at finding their lipid correlates. Then,
the z-score standardized values of the principal components derived from the glycerolipids
(TAGs and DAGs), FFAs, and ACs were correlated with the transcriptomic profiles for the
mapped genes using Pearson correlations. We used matching samples from both compartments
25
to run the correlation analysis. Ingenuity Pathway Analysis based on the top lipid-transcript
significant correlations was applied to identify the corresponding enriched pathways. Benjamini-
Hochberg procedure was applied to minimize the false discovery rate (FDR) (65).
For differential network analysis aimed at identifying differential lipid correlates (inter- and
intra-lipid class) by progression, we obtained the sparse partial correlation networks that capture
interdependencies between lipids for the non-progressor and progressor participant groups. We
utilized the following approach that leveraged (i) similarity information between lipids that is
concordant with data obtained from a diabetic mouse model (Supplement Table 3) and (ii) the
assumption that many interconnections, especially across lipid classes, are not present in both
groups and hence we can utilize all 92 samples to estimate them more robustly. Throughout the
technical developments, 𝑝 denotes the total number of lipids under consideration,
𝑛𝑛𝑜𝑛−𝑝𝑟𝑜𝑔𝑟𝑒𝑠𝑠𝑜𝑟 and 𝑛𝑝𝑟𝑜𝑔𝑟𝑒𝑠𝑠𝑜𝑟 denote the sample sizes for non-progressors and progressors,
respectively, while 𝑥𝑖𝑗𝑘 denotes the relative abundance of lipid 𝑗 for sample 𝑖 in condition 𝑘 (non-
progressor, progressor). Further, we arrange the data 𝑥𝑖𝑗𝑘 ’s in matrix form 𝐗𝑘as:
𝐗𝑘 ≔ [
𝑥11𝑘 ⋯ 𝑥1𝑝
𝑘
⋮ ⋱ ⋮𝑥𝑛𝑘1
𝑘 ⋯ 𝑥𝑛𝑘𝑝𝑘
] , 𝑘 ∈ {𝑛𝑜𝑛 − 𝑝𝑟𝑜𝑔𝑟𝑒𝑠𝑠𝑜𝑟, 𝑝𝑟𝑜𝑔𝑟𝑒𝑠𝑠𝑜𝑟},
and let 𝐗𝑗𝑘denote its 𝑗th column.
The main steps of the proposed estimation procedure include obtaining the lipid grouping
structure, the superset of the network skeleton, and the final stabilized network structure. To
obtain lipid grouping structure (Step 1), we constructed groups among lipids based on their
correlation structure using spectral clustering in progressors and non-progressors (66), and
denoted the collections of groups as 𝒢𝑛𝑜𝑛−𝑝𝑟𝑜𝑔𝑟𝑒𝑠𝑠𝑜𝑟and 𝒢𝑝𝑟𝑜𝑔𝑟𝑒𝑠𝑠𝑜𝑟, respectively. In particular,
26
the number of clusters is pre-specified at 20 for both conditions, hence |𝒢𝑛𝑜𝑛−𝑝𝑟𝑜𝑔𝑟𝑒𝑒𝑠𝑠𝑜𝑟| =
|𝒢𝑝𝑟𝑜𝑔𝑟𝑒𝑠𝑠𝑜𝑟| = 20. Further, we only retained the groups that were common in both conditions,
that is, let 𝒢 = 𝒢𝑛𝑜𝑛−𝑝𝑟𝑜𝑔𝑟𝑒𝑠𝑠𝑜𝑟 ∩ 𝒢𝑝𝑟𝑜𝑔𝑟𝑒𝑠𝑠𝑜𝑟, and the resulting common group 𝒢 contains 7
subsets (groups), primarily encompassing FFAs and selected PCs, TAGs, lysoPCs and lysoPEs,
and pPEs. As a confirmatory step, these groups were also detected in the mice serum data (56)
where they exhibit strong correlations (co-expression signal). We allowed 𝒢𝑐to denote the
indices of lipids that did not belong in any of these 7 groups, that is:
𝒢𝑐 = {1, … , 𝑝}\{∪ 𝑔𝑙 , 𝑔_𝑙 ∈ 𝒢}.
To obtain a superset of the network skeleton (Step 2), we estimated the skeleton (edges present)
of the non-progressor and progressor partial correlation networks based on a variation of the
node-wise regression approach (67), while incorporating lipid group information extracted from
Step 1 and encouraging common sparsity structure (absence of edges in both networks) between
the two groups (68). Toward this end, by considering the distribution of lipid 𝑗 conditional on all
the other lipids, their relative abundance levels satisfied the following relationship:
𝐗𝑗𝑘 = 𝐗−𝑗
𝑘 𝛽𝑗𝑘 + 𝐄𝑗 , 𝛽𝑗
𝑘 ∈ ℝ𝑝−1,
where each coordinate of the vector 𝛽𝑗𝑘encompassed the scaled partial covariance of lipid 𝑗 with
all other lipids 𝑗′(𝑗′ ≠ 𝑗). Built upon the original node-wise regression formulation (67), to
encourage similar sparsity structure incurred by lipids that were within the same group 𝑔 ∈ 𝒢, we
imposed a group-penalty on their coefficients in the form of a vector ℓ2norm. On the other hand,
for lipids that did not belong to any group, i.e., the elements in 𝒢𝑐, we modeled the coefficient
𝛽𝑗,𝑗′𝑘 as 𝛽𝑗,𝑗′
𝑘 = 𝛾𝑗,𝑗′𝑘 𝜃𝑗,𝑗′ , 𝜃𝑗,𝑗′ ≥ 01110 (68) and penalized their individual absolute values to
27
encourage the presence of common (thus, absence of edges in the networks) across the non-
progressor and progressor groups. Formally, the optimization problem was formulated as:
min𝛽𝑗
𝑘,𝛾𝑗𝑘,𝜃𝑗,𝑗∈{1,…,𝑝},𝑘∈{𝑛𝑜𝑛−𝑝𝑟𝑜𝑔𝑟𝑒𝑠𝑠𝑜𝑟,𝑝𝑟𝑜𝑔𝑟𝑒𝑠𝑠𝑜𝑟}
∑ {∑1
2𝑛𝑘‖𝐗𝑗
𝑘 − 𝐗−𝑗𝑘 𝛽𝑗
𝑘‖2
2+ ∑ 𝜆𝑔‖𝛽𝑗|𝑔
𝑘 ‖2
𝑔∈𝒢
+ 𝜂 ∑ |𝛾𝑗,𝑗′𝑘 |
𝑗′∈𝒢𝑐
𝑝
𝑗=1
}
𝑘
+ ∑ 𝜃𝑗,𝑗′
𝑗∈𝒢𝑐
. (∗)
The optimization problem in (*) estimated the non-progressor and progressor partial correlation
networks jointly, thus efficiently utilizing all 106 samples. Further, this objective function is
separable in 𝑗 = 1, … , 𝑝, and thus can be solved by splitting it into 𝑝 parallel sub-problems. For
each sub-problem indexed by 𝑗, it is equivalent to solving the following optimization problem
obtained after some algebraic manipulations (68) (Lemma 2):
min𝛽𝑗
𝑘,𝑘∈{𝑛𝑜𝑛−𝑝𝑟𝑜𝑔𝑟𝑒𝑠𝑠𝑜𝑟,𝑝𝑟𝑜𝑔𝑟𝑒𝑠𝑠𝑜𝑟}∑ {
1
2𝑛𝑘‖𝐗𝑗
𝑘 − 𝐗−𝑗𝑘 𝛽𝑗
𝑘‖2
2+ ∑ 𝜆𝑔‖𝛽𝑗|𝑔
𝑘 ‖2
𝑔∈𝒢
}
𝑘
+ 𝜌 ∑ (∑|𝛽𝑗,𝑗′𝑘 |
𝐾
)
12
𝑗∈𝒢𝑐
, 𝑤ℎ𝑒𝑟𝑒 𝜌 = 2𝜂12. (∗∗)
In the above formulation, 𝜆𝑔, 𝜂, 𝜌 were all pre-specified tuning parameters, and they determined
the ultimate sparsity level of the estimated networks, through the tuning of the corresponding
norms. The solution to (*) contained the skeleton (presence/absence of edges) information of the
partial correlation networks of interest; in particular, the nonzero elements in 𝛽𝑗�̂� point to the
presence of edges in the network. At this step, we set the tuning parameters at a small relative
value, to eliminate edges with a weak signal and to obtain a superset of the network skeleton.
We denoted the obtained skeleton superset as 𝒮𝑠𝑢𝑝𝑒𝑟, and at this step, the estimated skeletons for
both conditions corresponded to networks with density level at around 10% (i.e. out of the
possible 𝑝2
2 edges, only 10% are present; for a technical justification of why only sparse partial
correlation networks can be estimated from data when the sample size is smaller than the number
of lipids (69).
28
To obtain the final stabilized network structures, we employed the technique of stability
selection (70) coupled with the graphical lasso (71) network estimation procedure and also
utilized the skeleton information in 𝒮𝑠𝑢𝑝𝑒𝑟as follows. We imposed a small lasso penalty for
edges that are in 𝒮𝑠𝑢𝑝𝑒𝑟 and a larger one if in its complement. The stability selection step yielded
the final network skeleton structure that was stable and robust to the choice of the tuning
parameters, and the networks had a respective density level of 3% (non-progressor) and 2.7%
(progressor). Finally, based on the skeleton, we estimated the magnitude of the edges
(correlations), which after proper normalization, corresponded to the strength of the partial
correlation amongst lipids in the two groups.
Study approval: The study was approved by the Institutional Review Board (IRB)#0000006 at
the National Institute of Diabetes, Digestive, and Kidney Diseases, Bethesda, Maryland. All
participants gave signed informed consent prior to their participation in the study.

29
Author contributions: FA designed the lipidomic study, prepared serum samples for mass
spectrometry, analyzed and interpreted the data, and wrote the first draft. VN performed the
transcriptomic-lipidomic analysis and contributed to manuscript drafting. JL and GM performed
the differential network analysis and contributed to manuscript drafting. TMR and JB helped
with serum sample preparation for lipidomic analysis and mass spectrometry runs. TS retrieved
mass-spectrometry data. HCL and RGN contributed to clinical study design, data collection,
manuscript drafting, and critical evaluation of the paper. SP contributed to the lipidomic study
design, mass spectrometry, data interpretation and manuscript drafting. All authors have
critically evaluated the paper and have approved the final version.
Acknowledgment: Authors would like to thank Lois Jones, RN, Enrique Diaz, RN, Bernadine
Waseta, and Camille Waseta for seeing the patients, performing the research studies, and
collecting and processing the samples.
Disclosure: KS reports receipt of consult fee from Boerhinger Ingelheim outside the submitted
work. TWG reports grants from Zebra Biologics, outside the submitted work. MK reports grants
from NIH, non-financial support from the University of Michigan, during the conduct of the
study; grants from JDRF, Astra-Zeneca, NovoNordisc, Eli Lilly, Gilead, Goldfinch Bio, Merck,
Janssen, and Boehringer-Ingelheim outside the submitted work; also has a patent Biomarkers for
CKD progression (encompassing urinary EGF as biomarker of CKD progression) issued. Other
authors have declared that no conflict of interest exists.
30
References:
1. USRDS. Chapter 1: Incidence, Prevalence, Patient Characteristics, and Treatment Modalities
https://www.usrds.org/2017/download/v2_c01_IncPrev_17.pdf. 2017.
2. USRDS. United States Renal Data System. 2018 Annual Data Report
https://www.usrds.org/2018/view/Default.aspx. 2018.
3. Diabetes 2030 Forecasts, 2015. United States Diabetes Data & Forecasts
http://www.altfutures.org/pubs/diabetes2030/UNITEDSTATESDataSheet.pdf. 2015.
4. Rahman M, Yang W, Akkina S, Alper A, Anderson AH, Appel LJ, He J, Raj DS, Schelling J, Strauss L,
et al. Relation of serum lipids and lipoproteins with progression of CKD: The CRIC study. Clin J
Am Soc Nephrol. 2014;9(7):1190-8.
5. Reis A, Rudnitskaya A, Chariyavilaskul P, Dhaun N, Melville V, Goddard J, Webb DJ, Pitt AR, and
Spickett CM. Top-down lipidomics of low density lipoprotein reveal altered lipid profiles in
advanced chronic kidney disease. Journal of lipid research. 2015;56(2):413-22.
6. Reiss AB, Voloshyna I, De Leon J, Miyawaki N, and Mattana J. Cholesterol Metabolism in CKD.
American journal of kidney diseases : the official journal of the National Kidney Foundation.
2015;66(6):1071-82.
7. Tsuruya K, Yoshida H, Nagata M, Kitazono T, Iseki K, Iseki C, Fujimoto S, Konta T, Moriyama T,
Yamagata K, et al. Impact of the Triglycerides to High-Density Lipoprotein Cholesterol Ratio on
the Incidence and Progression of CKD: A Longitudinal Study in a Large Japanese Population.
American journal of kidney diseases : the official journal of the National Kidney Foundation.
2015;66(6):972-83.
8. Wahl P, Ducasa GM, and Fornoni A. Systemic and renal lipids in kidney disease development and
progression. American journal of physiology Renal physiology. 2016;310(6):F433-45.
31
9. Quehenberger O, Armando AM, Brown AH, Milne SB, Myers DS, Merrill AH, Bandyopadhyay S,
Jones KN, Kelly S, Shaner RL, et al. Lipidomics reveals a remarkable diversity of lipids in human
plasma. Journal of lipid research. 2010;51(11):3299-305.
10. Quehenberger O, and Dennis EA. The human plasma lipidome. The New England journal of
medicine. 2011;365(19):1812-23.
11. Graessler J, Schwudke D, Schwarz PE, Herzog R, Shevchenko A, and Bornstein SR. Top-down
lipidomics reveals ether lipid deficiency in blood plasma of hypertensive patients. PLoS One.
2009;4(7):e6261.
12. Kontush A, Lhomme M, and Chapman MJ. Unraveling the complexities of the HDL lipidome.
Journal of lipid research. 2013;54(11):2950-63.
13. Pietilainen KH, Sysi-Aho M, Rissanen A, Seppanen-Laakso T, Yki-Jarvinen H, Kaprio J, and Oresic
M. Acquired obesity is associated with changes in the serum lipidomic profile independent of
genetic effects--a monozygotic twin study. PLoS One. 2007;2(2):e218.
14. Stegemann C, Drozdov I, Shalhoub J, Humphries J, Ladroue C, Didangelos A, Baumert M, Allen
M, Davies AH, Monaco C, et al. Comparative lipidomics profiling of human atherosclerotic
plaques. Circulation Cardiovascular genetics. 2011;4(3):232-42.
15. Stegemann C, Pechlaner R, Willeit P, Langley SR, Mangino M, Mayr U, Menni C, Moayyeri A,
Santer P, Rungger G, et al. Lipidomics profiling and risk of cardiovascular disease in the
prospective population-based Bruneck study. Circulation. 2014;129(18):1821-31.
16. Rhee EP, Cheng S, Larson MG, Walford GA, Lewis GD, McCabe E, Yang E, Farrell L, Fox CS,
O'Donnell CJ, et al. Lipid profiling identifies a triacylglycerol signature of insulin resistance and
improves diabetes prediction in humans. The Journal of clinical investigation. 2011;121(4):1402-
11.

32
17. Rhee EP, Clish CB, Ghorbani A, Larson MG, Elmariah S, McCabe E, Yang Q, Cheng S, Pierce K, Deik
A, et al. A combined epidemiologic and metabolomic approach improves CKD prediction. Journal
of the American Society of Nephrology : JASN. 2013;24(8):1330-8.
18. Afshinnia F, Rajendiran TM, Soni T, Byun J, Wernisch S, Sas KM, Hawkins J, Bellovich K, Gipson D,
Michailidis G, et al. Impaired beta-Oxidation and Altered Complex Lipid Fatty Acid Partitioning
with Advancing CKD. Journal of the American Society of Nephrology : JASN. 2018;29(1):295-306.
19. Afshinnia F, Rajendiran TM, Karnovsky A, Soni T, Wang X, Xie D, Yang W, Shafi T, Weir MR, He J,
et al. Lipidomic Signature of Progression of Chronic Kidney Disease in the Chronic Renal
Insufficiency Cohort. Kidney Int Rep. 2016;1(4):256-68.
20. Niewczas MA, Gohda T, Skupien J, Smiles AM, Walker WH, Rosetti F, Cullere X, Eckfeldt JH, Doria
A, Mayadas TN, et al. Circulating TNF receptors 1 and 2 predict ESRD in type 2 diabetes. Journal
of the American Society of Nephrology : JASN. 2012;23(3):507-15.
21. Niewczas MA, Sirich TL, Mathew AV, Skupien J, Mohney RP, Warram JH, Smiles A, Huang X,
Walker W, Byun J, et al. Uremic solutes and risk of end-stage renal disease in type 2 diabetes:
metabolomic study. Kidney international. 2014.
22. Looker HC, Colombo M, Hess S, Brosnan MJ, Farran B, Dalton RN, Wong MC, Turner C, Palmer
CN, Nogoceke E, et al. Biomarkers of rapid chronic kidney disease progression in type 2 diabetes.
Kidney international. 2015;88(4):888-96.
23. Saulnier PJ, Gand E, Velho G, Mohammedi K, Zaoui P, Fraty M, Halimi JM, Roussel R, Ragot S,
Hadjadj S, et al. Association of Circulating Biomarkers (Adrenomedullin, TNFR1, and NT-proBNP)
With Renal Function Decline in Patients With Type 2 Diabetes: A French Prospective Cohort.
Diabetes care. 2017;40(3):367-74.
24. Choudhury D, Tuncel M, and Levi M. Diabetic nephropathy -- a multifaceted target of new
therapies. Discovery medicine. 2010;10(54):406-15.

33
25. Nowak N, Skupien J, Smiles AM, Yamanouchi M, Niewczas MA, Galecki AT, Duffin KL, Breyer MD,
Pullen N, Bonventre JV, et al. Markers of early progressive renal decline in type 2 diabetes
suggest different implications for etiological studies and prognostic tests development. Kidney
international. 2018;93(5):1198-206.
26. Fufaa GD, Weil EJ, Lemley KV, Knowler WC, Brosius FC, 3rd, Yee B, Mauer M, and Nelson RG.
Structural Predictors of Loss of Renal Function in American Indians with Type 2 Diabetes. Clin J
Am Soc Nephrol. 2016;11(2):254-61.
27. Nelson RG, Bennett PH, Beck GJ, Tan M, Knowler WC, Mitch WE, Hirschman GH, and Myers BD.
Development and progression of renal disease in Pima Indians with non-insulin-dependent
diabetes mellitus. Diabetic Renal Disease Study Group. The New England journal of medicine.
1996;335(22):1636-42.
28. Pavkov ME, Knowler WC, Hanson RL, and Nelson RG. Diabetic nephropathy in American Indians,
with a special emphasis on the Pima Indians. Current diabetes reports. 2008;8(6):486-93.
29. Saulnier PJ, Wheelock KM, Howell S, Weil EJ, Tanamas SK, Knowler WC, Lemley KV, Mauer M,
Yee B, Nelson RG, et al. Advanced Glycation End Products Predict Loss of Renal Function and
Correlate With Lesions of Diabetic Kidney Disease in American Indians With Type 2 Diabetes.
Diabetes. 2016;65(12):3744-53.
30. Tanamas SK, Saulnier PJ, Fufaa GD, Wheelock KM, Weil EJ, Hanson RL, Knowler WC, Bennett PH,
and Nelson RG. Long-term Effect of Losartan on Kidney Disease in American Indians With Type 2
Diabetes: A Follow-up Analysis of a Randomized Clinical Trial. Diabetes care. 2016;39(11):2004-
10.
31. Weil EJ, Fufaa G, Jones LI, Lovato T, Lemley KV, Hanson RL, Knowler WC, Bennett PH, Yee B,
Myers BD, et al. Effect of losartan on prevention and progression of early diabetic nephropathy
in American Indians with type 2 diabetes. Diabetes. 2013;62(9):3224-31.
34
32. Lemley KV, Blouch K, Abdullah I, Boothroyd DB, Bennett PH, Myers BD, and Nelson RG.
Glomerular permselectivity at the onset of nephropathy in type 2 diabetes mellitus. Journal of
the American Society of Nephrology : JASN. 2000;11(11):2095-105.
33. Lemley KV, Boothroyd DB, Blouch KL, Nelson RG, Jones LI, Olshen RA, and Myers BD. Modeling
GFR trajectories in diabetic nephropathy. American journal of physiology Renal physiology.
2005;289(4):F863-70.
34. Levey AS, Inker LA, Matsushita K, Greene T, Willis K, Lewis E, de Zeeuw D, Cheung AK, and
Coresh J. GFR decline as an end point for clinical trials in CKD: a scientific workshop sponsored
by the National Kidney Foundation and the US Food and Drug Administration. American journal
of kidney diseases : the official journal of the National Kidney Foundation. 2014;64(6):821-35.
35. Luo S, Coresh J, Tin A, Rebholz CM, Appel LJ, Chen J, Vasan RS, Anderson AH, Feldman HI,
Kimmel PL, et al. Serum Metabolomic Alterations Associated with Proteinuria in CKD. Clin J Am
Soc Nephrol. 2019;14(3):342-53.
36. Grove KJ, Voziyan PA, Spraggins JM, Wang S, Paueksakon P, Harris RC, Hudson BG, and Caprioli
RM. Diabetic nephropathy induces alterations in the glomerular and tubule lipid profiles. Journal
of lipid research. 2014;55(7):1375-85.
37. Calzada E, Onguka O, and Claypool SM. Phosphatidylethanolamine Metabolism in Health and
Disease. International review of cell and molecular biology. 2016;321(29-88.
38. Emoto K, Toyama-Sorimachi N, Karasuyama H, Inoue K, and Umeda M. Exposure of
phosphatidylethanolamine on the surface of apoptotic cells. Experimental cell research.
1997;232(2):430-4.
39. Rockenfeller P, Koska M, Pietrocola F, Minois N, Knittelfelder O, Sica V, Franz J, Carmona-
Gutierrez D, Kroemer G, and Madeo F. Phosphatidylethanolamine positively regulates
autophagy and longevity. Cell death and differentiation. 2015;22(3):499-508.

35
40. Karaskov E, Scott C, Zhang L, Teodoro T, Ravazzola M, and Volchuk A. Chronic palmitate but not
oleate exposure induces endoplasmic reticulum stress, which may contribute to INS-1
pancreatic beta-cell apoptosis. Endocrinology. 2006;147(7):3398-407.
41. Sieber J, and Jehle AW. Free Fatty acids and their metabolism affect function and survival of
podocytes. Frontiers in endocrinology. 2014;5(186.
42. Sieber J, Lindenmeyer MT, Kampe K, Campbell KN, Cohen CD, Hopfer H, Mundel P, and Jehle
AW. Regulation of podocyte survival and endoplasmic reticulum stress by fatty acids. American
journal of physiology Renal physiology. 2010;299(4):F821-9.
43. Soumura M, Kume S, Isshiki K, Takeda N, Araki S, Tanaka Y, Sugimoto T, Chin-Kanasaki M, Nishio
Y, Haneda M, et al. Oleate and eicosapentaenoic acid attenuate palmitate-induced inflammation
and apoptosis in renal proximal tubular cell. Biochemical and biophysical research
communications. 2010;402(2):265-71.
44. Martinez-Garcia C, Izquierdo-Lahuerta A, Vivas Y, Velasco I, Yeo TK, Chen S, and Medina-Gomez
G. Renal Lipotoxicity-Associated Inflammation and Insulin Resistance Affects Actin Cytoskeleton
Organization in Podocytes. PLoS One. 2015;10(11):e0142291.
45. Lennon R, Pons D, Sabin MA, Wei C, Shield JP, Coward RJ, Tavare JM, Mathieson PW, Saleem
MA, and Welsh GI. Saturated fatty acids induce insulin resistance in human podocytes:
implications for diabetic nephropathy. Nephrology, dialysis, transplantation : official publication
of the European Dialysis and Transplant Association - European Renal Association.
2009;24(11):3288-96.
46. Jiang XS, Chen XM, Wan JM, Gui HB, Ruan XZ, and Du XG. Autophagy Protects against Palmitic
Acid-Induced Apoptosis in Podocytes in vitro. Scientific reports. 2017;7(42764.
47. Lee E, Choi J, and Lee HS. Palmitate induces mitochondrial superoxide generation and activates
AMPK in podocytes. Journal of cellular physiology. 2017.

36
48. Xu S, Nam SM, Kim JH, Das R, Choi SK, Nguyen TT, Quan X, Choi SJ, Chung CH, Lee EY, et al.
Palmitate induces ER calcium depletion and apoptosis in mouse podocytes subsequent to
mitochondrial oxidative stress. Cell death & disease. 2015;6(e1976.
49. Yasuda M, Tanaka Y, Kume S, Morita Y, Chin-Kanasaki M, Araki H, Isshiki K, Araki S, Koya D,
Haneda M, et al. Fatty acids are novel nutrient factors to regulate mTORC1 lysosomal
localization and apoptosis in podocytes. Biochimica et biophysica acta. 2014;1842(7):1097-108.
50. Rhee EP, Souza A, Farrell L, Pollak MR, Lewis GD, Steele DJ, Thadhani R, Clish CB, Greka A, and
Gerszten RE. Metabolite profiling identifies markers of uremia. Journal of the American Society
of Nephrology : JASN. 2010;21(6):1041-51.
51. Otero YF, Stafford JM, and McGuinness OP. Pathway-selective insulin resistance and metabolic
disease: the importance of nutrient flux. The Journal of biological chemistry.
2014;289(30):20462-9.
52. Song Z, Xiaoli AM, and Yang F. Regulation and Metabolic Significance of De Novo Lipogenesis in
Adipose Tissues. Nutrients. 2018;10(10).
53. Carlson CA, and Kim KH. Regulation of hepatic acetyl coenzyme A carboxylase by
phosphorylation and dephosphorylation. Archives of biochemistry and biophysics.
1974;164(2):478-89.
54. Gillies CE, Putler R, Menon R, Otto E, Yasutake K, Nair V, Hoover P, Lieb D, Li S, Eddy S, et al. An
eQTL Landscape of Kidney Tissue in Human Nephrotic Syndrome. Am J Hum Genet.
2018;103(2):232-44.
55. Sieber J, Weins A, Kampe K, Gruber S, Lindenmeyer MT, Cohen CD, Orellana JM, Mundel P, and
Jehle AW. Susceptibility of podocytes to palmitic acid is regulated by stearoyl-CoA desaturases 1
and 2. The American journal of pathology. 2013;183(3):735-44.

37
56. Sas KM, Lin J, Rajendiran TM, Soni T, Nair V, Hinder LM, Jagadish HV, Gardner TW, Abcouwer SF,
Brosius FC, 3rd, et al. Shared and distinct lipid-lipid interactions in plasma and affected tissues in
a diabetic mouse model. Journal of lipid research. 2018;59(2):173-83.
57. Li Y, Chung S, Li Z, Overstreet JM, Gagnon L, Grouix B, Leduc M, Laurin P, Zhang MZ, and Harris
RC. Fatty acid receptor modulator PBI-4050 inhibits kidney fibrosis and improves glycemic
control. JCI Insight. 2018;3(10).
58. Afshinnia F, Rajendiran TM, Wernisch S, Soni T, Jadoon A, Karnovsky A, Michailidis G, and
Pennathur S. Lipidomics and Biomarker Discovery in Kidney Disease. Seminars in nephrology.
2018;38(2):127-41.
59. Sas KM, Kayampilly P, Byun J, Nair V, Hinder LM, Hur J, Zhang H, Lin C, Qi NR, Michailidis G, et al.
Tissue-specific metabolic reprogramming drives nutrient flux in diabetic complications. JCI
Insight. 2016;1(15):e86976.
60. Cohen CD, Frach K, Schlondorff D, and Kretzler M. Quantitative gene expression analysis in renal
biopsies: a novel protocol for a high-throughput multicenter application. Kidney international.
2002;61(1):133-40.
61. Schmid H, Boucherot A, Yasuda Y, Henger A, Brunner B, Eichinger F, Nitsche A, Kiss E, Bleich M,
Grone HJ, et al. Modular activation of nuclear factor-kappaB transcriptional programs in human
diabetic nephropathy. Diabetes. 2006;55(11):2993-3003.
62. Overmyer KA, Evans CR, Qi NR, Minogue CE, Carson JJ, Chermside-Scabbo CJ, Koch LG, Britton
SL, Pagliarini DJ, Coon JJ, et al. Maximal oxidative capacity during exercise is associated with
skeletal muscle fuel selection and dynamic changes in mitochondrial protein acetylation. Cell
metabolism. 2015;21(3):468-78.

38
63. Muller CJ, and MacLehose RF. Estimating predicted probabilities from logistic regression:
different methods correspond to different target populations. International journal of
epidemiology. 2014;43(3):962-70.
64. Karnovsky A, Weymouth T, Hull T, Tarcea VG, Scardoni G, Laudanna C, Sartor MA, Stringer KA,
Jagadish HV, Burant C, et al. Metscape 2 bioinformatics tool for the analysis and visualization of
metabolomics and gene expression data. Bioinformatics. 2012;28(3):373-80.
65. Benjamini Y, and Hochberg Y. Controlling the false discovery rate: a practical and powerful
approach to multiple testing. Journal of the Royal Statistical Society, Series B. 1995;57(1):289-
300.
66. Ng AY, Jordan MI, and Weiss Y. Advances in Neural Information Processing Systems 2002:849-56.
67. Meinshausen N, and Buhlmann P. High-dimensional graphs and variable selection with the lasso.
The Annals of Statistics. 2006;34(3):1436-62.
68. Guo J, Levina E, Michailidis G, and Zhu J. Joint estimation of multiple graphical models.
Biometrika. 2011;98(1):1-15.
69. Basu S, Duren W, Evans CR, Burant CF, Michailidis G, and Karnovsky A. Sparse network modeling
and metscape-based visualization methods for the analysis of large-scale metabolomics data.
Bioinformatics. 2017;33(10):1545-53.
70. Meinshausen N, and Bühlmann P. Stability selection. Journal of the Royal Statistical Society:
Series B (Statistical Methodology). 2010;72(4):417-73.
71. Friedman J, Hastie T, and Tibshirani R. Sparse inverse covariance estimation with the graphical
lasso. Biostatistics. 2008;9(3):432-41.
39
Figure Legends:
Figure 1: Flow diagram of analytical strategy and post-trial follow up of participants of the
“Renoprotection in Early Diabetic Nephropathy in Pima Indians” trial analyzed in this study.
Figure 2: Baseline and last measured GFR in 32 progressors and 60 non-progressors. The boxes
represent median and interquartile range and bars represent 1.5-fold×the interquartile range below
the 25th percentile and above the 75th percentile. Outliers outside the mean + 2 SD are shown with
dots. GFR, glomerular filtration rate.
Figure 3: Differences in carbon chain length and number of double bonds in complex lipids
and acylcarnitines between progressors and non-progressors (total N=92 in all panels).
Abundance of TAGs and ACs were measured at the baseline visit of this study and compared in
progressors and non-progressors. A. In serum from progressors (N=32), there was a greater
relative abundance of longer TAGs with more double bonds. An opposite trend was observed in
non-progressors (N=60). B. A similar pattern was found when all participants (progressors +
non-progressors) were grouped based on whether or not they achieved a sustained GFR<90
(N=33), <60 (N=13), and <30 mL/min (N=6). Bonferroni threshold for multiple comparisons
was set to 0.0063 (0.05 divided by 8 panels per class). C. In progressors (N=32), there was a
lower relative abundance of longer ACs with more double bonds. An opposite trend was
observed in non-progressors (N=60). D. A similar trend was noted in abundance of ACs by
carbon number, when all participants were grouped based on whether or not they achieved a
sustained GFR<90 (N=33), <60 (N=13), or <30 mL/min (N=6). Bonferroni threshold for
multiple comparisons was set to 0.0063 (0.05 divided by 8 panels per class). P values are
products of testing abundance of lipid by “carbon number × double bond” interaction term in
40
progressors versus non-progressors using mixed-linear models. GFR, glomerular filtration rate;
AC, acylcarnitine; TAG, triacylglycerol.
Figure 4: Adjusted correlation of long (C16-20) to intermediate chain (C6-14) acylcarnitine
ratio with complex lipid of various chain length and double bonds. Long-to-intermediate AC
ratio is directly correlated with shorter complex lipids with fewer double bonds, but is inversely
correlated with longer complex lipids with more double bonds in CE class. P values are product
of testing partial correlation coefficients in multiple linear regression models adjusting for sex
and ACR. AC, acylcarnitine; CE, cholesteryl ester; DAG, diacylglycerol; PE,
phosphatidylethanolamine; pPE, plasmenyl-PE; TAG, triacylglycerol.
Figure 5: AC alterations by categories of baseline ACR in progressors and non-
progressors. ACs of various chain length and double bonds were quantified in serum at the
baseline visit of progressors and non-progressors. Distribution of various ACs by ACR category
revealed lower levels of C16-C20 ACs from non-progressors with normoalbuminuria (upper left)
to progressors with ACR>300 mg/g (lower right). Within each ACR category, long chain AC
abundance (C16-20) increased in non-progressors with ACR 30-299 mg/g (p=0.006) and
decreased in progressors with ACR>300 mg/g (p<0.0001). Sample size 43 in ACR<30, 33 in
ACR 30-299, and 16 in ACR≥300 mg/g. Bonferroni threshold for multiple comparisons was set
to 0.0083 (0.05 divided by 6 panels). P values are products of testing abundance of lipid by
“carbon number × double bond” interaction term in progressors versus non-progressors using
mixed-linear models. ACR, albumin-creatinine ratio; AC, acylcarnitines.
Figure 6: Predicting DKD progression with probabilistic risk scores. Probabilistic risk score
derived from odds of progression by three different models were compared. Model 1 incorporated
baseline ACR and GFR (ACR+GFR), Model 2 incorporated independent lipid factors predicting
41
progression (Lipids), and Model 3 consisted of the lipids plus baseline ACR and GFR
(ACR+GFR+Lipids). Progressors (N=32) had a higher probabilistic risk scores compared with
non-progressors (N=60) in all models, and the largest score was noted in Model 3, when lipids
were included with baseline ACR and GFR. Bar graphs are mean and error bars are 1 SD above
and below the mean.
Figure 7: Differential network Analysis. To identify inter- and intra-class lipid correlates, we
obtained the sparse partial correlation networks that captured the interdependencies between lipids.
We utilized lipid grouping structure, obtained the superset of the network skeleton, and finally
obtained the final stable network structures, the latter based on a bootstrapping method.
Differential network analysis revealed differential loss of edges between various lipid classes in
progressors characterized by 547 significant edges versus 1028 in non-progressors (p<0.0001) out
of 55,460 possible permutations of bivariate correlations. The lines represent significant edges that
were exclusively observed in non-progressors (blue) or progressors (red). Common edges are
shown in gray. The node size is proportional to the number of connectivity levels within and across
lipid subclasses, and node colors represent number of cross-class connections (white=low,
yellow=middle, red=high). Nodes are categorized by chain length (bottom, middle, top), and
double bonds (low, high) with details shown in Supplement Table 3.
Figure 8: Integrative transcriptomic-lipidomic analysis identifies G-protein coupled
signaling pathways and nuclear hormone-activating receptors in regulation of fatty acid
synthesis and β-oxidation. Ingenuity Pathway Analysis reveals enrichment of G-Protein
signaling pathways involved in regulation of NF-kB, CREB, and STAT3 in glomerular (A) and
tubulointerstitial compartments (B). CREB is transcriptional regulator of de novo lipogenesis.
Genes regulating the intermediaries highlighted in purple in panels A and B are significantly
42
correlated with the corresponding serum lipids. The genes downstream of nuclear hormone-
activating receptor PPARG known to regulate fatty acid metabolism and their β-oxidation in
both glomerular (C) and tubulointerstitial compartments (D) are significantly correlated with
serum lipids identified via the lipidomic analysis. NF-kB, nuclear Factor kappa-light-chain-
enhancer of activated B cells); CREB, cAMP response element-binding protein; NF-kB, nuclear
Factor kappa-light-chain-enhancer of activated B cells; PPARG, peroxisome proliferator-
activated receptor gamma; STAT3, signal transducer and activator of transcription 3.
Figure 9: Proposed mechanisms underlying lipid abnormalities that predict early renal function
decline in DKD. Upregulation of ACC, mediated by insulin resistance, enhances de novo
lipogenesis characterized by increased abundance of palmitate, a C16 fatty acid. With elongation
and desaturation, palmitate is converted into longer unsaturated fatty acids, which are incorporated
into complex lipids (e.g., glycerolipids). In concert, upregulation of ACC also inhibits CPT1,
which in turn decreases the conversion of L-carnitine to C16-20 acylcarnitines. C16-20
acylcarnitines are efficient β-oxidation substrates and, therefore, their diminished mitochondrial
transfer downregulates β-oxidation. The net effect of upregulated de novo lipogenesis is
characterized by higher abundance of longer chain polyunsaturated glycerolipids and lower
abundance of C16-20 acylcarnitines and shorter low-double-bond glycerolipids. ACACA, acetyl
Co-A carboxylase alpha; ACLY, ATP citrate lyase; ACS, acetyl Co-A synthetase; CPT, carnitine
palmitoyltransferase; DEGS, delta 4-desaturase; ELOVL, elongation of very long chain fatty acids;
FASN, fatty acid synthase; FADS, fatty acid desaturase; SCD, stearoyl-Coenzyme A desaturase;
PE, phosphatidylethanolamine; FFA, free fatty acid; SLDB TAG, short low double bond
triacylglycerol.
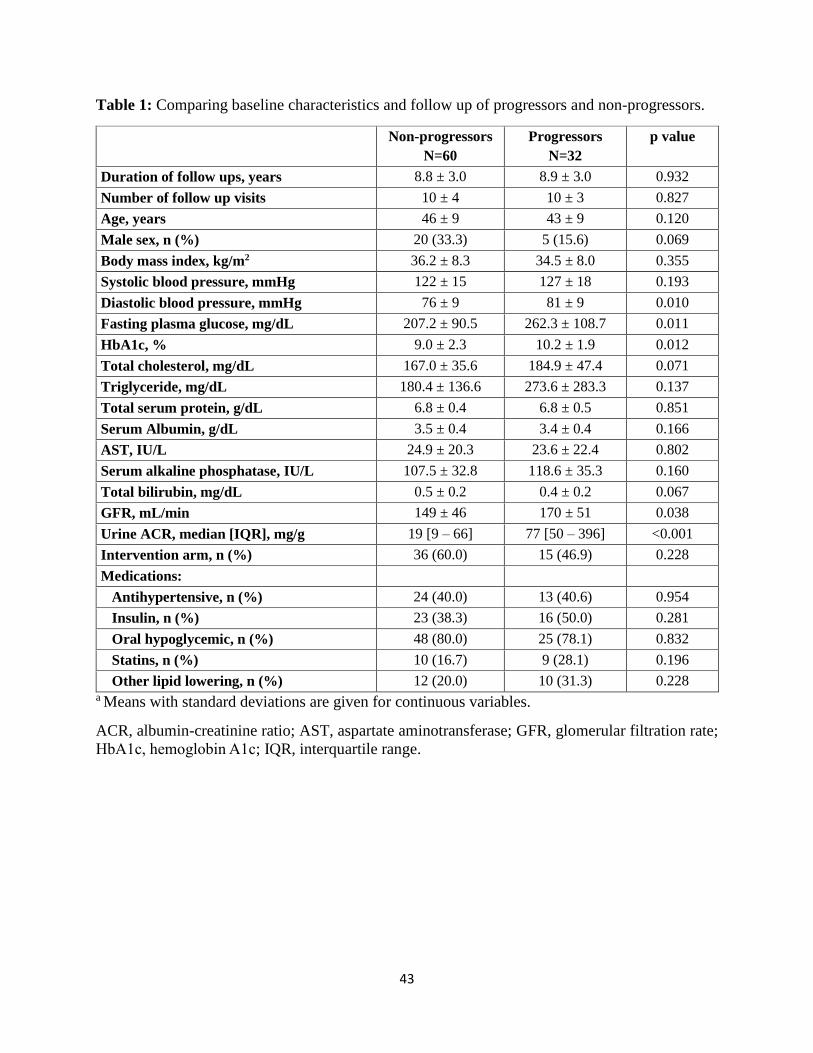
43
Table 1: Comparing baseline characteristics and follow up of progressors and non-progressors.
Non-progressors
N=60
Progressors
N=32
p value
Duration of follow ups, years 8.8 ± 3.0 8.9 ± 3.0 0.932
Number of follow up visits 10 ± 4 10 ± 3 0.827
Age, years 46 ± 9 43 ± 9 0.120
Male sex, n (%) 20 (33.3) 5 (15.6) 0.069
Body mass index, kg/m2 36.2 ± 8.3 34.5 ± 8.0 0.355
Systolic blood pressure, mmHg 122 ± 15 127 ± 18 0.193
Diastolic blood pressure, mmHg 76 ± 9 81 ± 9 0.010
Fasting plasma glucose, mg/dL 207.2 ± 90.5 262.3 ± 108.7 0.011
HbA1c, % 9.0 ± 2.3 10.2 ± 1.9 0.012
Total cholesterol, mg/dL 167.0 ± 35.6 184.9 ± 47.4 0.071
Triglyceride, mg/dL 180.4 ± 136.6 273.6 ± 283.3 0.137
Total serum protein, g/dL 6.8 ± 0.4 6.8 ± 0.5 0.851
Serum Albumin, g/dL 3.5 ± 0.4 3.4 ± 0.4 0.166
AST, IU/L 24.9 ± 20.3 23.6 ± 22.4 0.802
Serum alkaline phosphatase, IU/L 107.5 ± 32.8 118.6 ± 35.3 0.160
Total bilirubin, mg/dL 0.5 ± 0.2 0.4 ± 0.2 0.067
GFR, mL/min 149 ± 46 170 ± 51 0.038
Urine ACR, median [IQR], mg/g 19 [9 – 66] 77 [50 – 396] <0.001
Intervention arm, n (%) 36 (60.0) 15 (46.9) 0.228
Medications:
Antihypertensive, n (%) 24 (40.0) 13 (40.6) 0.954
Insulin, n (%) 23 (38.3) 16 (50.0) 0.281
Oral hypoglycemic, n (%) 48 (80.0) 25 (78.1) 0.832
Statins, n (%) 10 (16.7) 9 (28.1) 0.196
Other lipid lowering, n (%) 12 (20.0) 10 (31.3) 0.228 a Means with standard deviations are given for continuous variables.
ACR, albumin-creatinine ratio; AST, aspartate aminotransferase; GFR, glomerular filtration rate;
HbA1c, hemoglobin A1c; IQR, interquartile range.
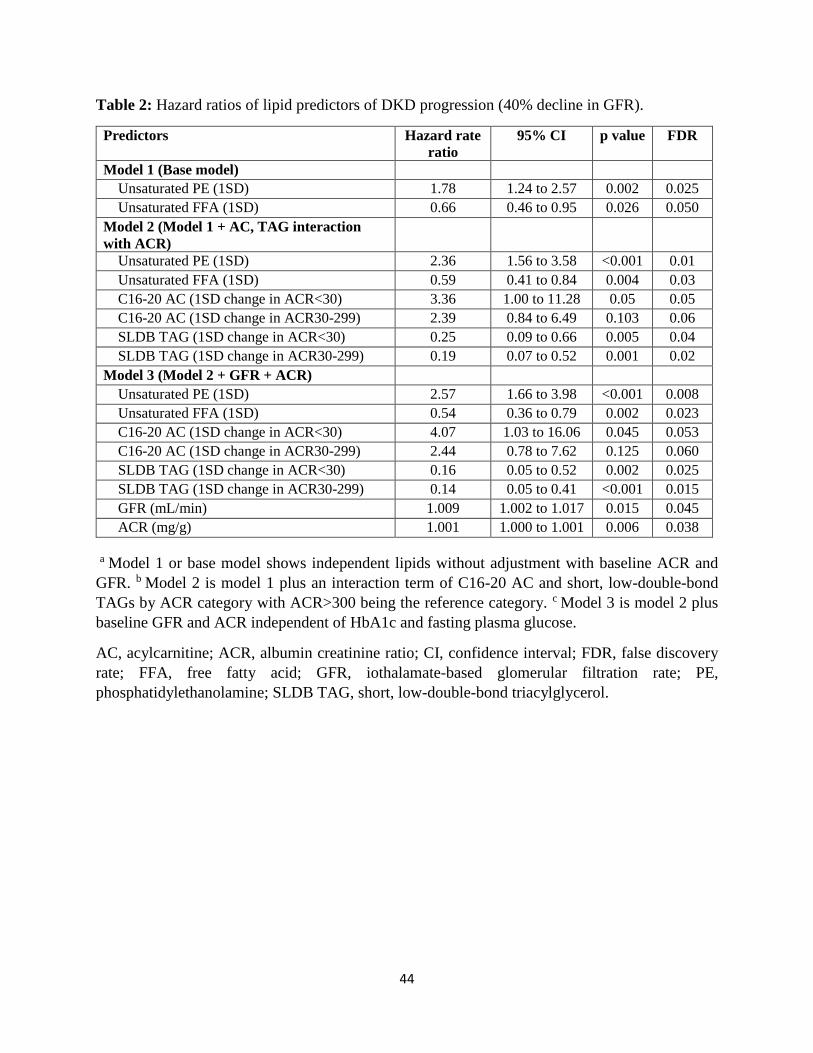
44
Table 2: Hazard ratios of lipid predictors of DKD progression (40% decline in GFR).
Predictors Hazard rate
ratio
95% CI p value FDR
Model 1 (Base model)
Unsaturated PE (1SD) 1.78 1.24 to 2.57 0.002 0.025
Unsaturated FFA (1SD) 0.66 0.46 to 0.95 0.026 0.050
Model 2 (Model 1 + AC, TAG interaction
with ACR)
Unsaturated PE (1SD) 2.36 1.56 to 3.58 <0.001 0.01
Unsaturated FFA (1SD) 0.59 0.41 to 0.84 0.004 0.03
C16-20 AC (1SD change in ACR<30) 3.36 1.00 to 11.28 0.05 0.05
C16-20 AC (1SD change in ACR30-299) 2.39 0.84 to 6.49 0.103 0.06
SLDB TAG (1SD change in ACR<30) 0.25 0.09 to 0.66 0.005 0.04
SLDB TAG (1SD change in ACR30-299) 0.19 0.07 to 0.52 0.001 0.02
Model 3 (Model 2 + GFR + ACR)
Unsaturated PE (1SD) 2.57 1.66 to 3.98 <0.001 0.008
Unsaturated FFA (1SD) 0.54 0.36 to 0.79 0.002 0.023
C16-20 AC (1SD change in ACR<30) 4.07 1.03 to 16.06 0.045 0.053
C16-20 AC (1SD change in ACR30-299) 2.44 0.78 to 7.62 0.125 0.060
SLDB TAG (1SD change in ACR<30) 0.16 0.05 to 0.52 0.002 0.025
SLDB TAG (1SD change in ACR30-299) 0.14 0.05 to 0.41 <0.001 0.015
GFR (mL/min) 1.009 1.002 to 1.017 0.015 0.045
ACR (mg/g) 1.001 1.000 to 1.001 0.006 0.038
a Model 1 or base model shows independent lipids without adjustment with baseline ACR and
GFR. b Model 2 is model 1 plus an interaction term of C16-20 AC and short, low-double-bond
TAGs by ACR category with ACR>300 being the reference category. c Model 3 is model 2 plus
baseline GFR and ACR independent of HbA1c and fasting plasma glucose.
AC, acylcarnitine; ACR, albumin creatinine ratio; CI, confidence interval; FDR, false discovery
rate; FFA, free fatty acid; GFR, iothalamate-based glomerular filtration rate; PE,
phosphatidylethanolamine; SLDB TAG, short, low-double-bond triacylglycerol.

45
Table 3: Proportion of progressors by quartiles of the probabilistic risk scores calculated by
various models
Quartile 1
N=23
Quartile 2
N=23
Quartile 3
N=23
Quartile 4
N=23
p value
(trend)
Model 1 (ACR+GFR) 13.04 (7.18) 21.74 (8.794) 52.17 (10.65) 52.17 (10.65) 0.001
Model 2 (Lipids) 17.39 (8.081) 17.39 (8.081) 43.48 (10.569) 60.87 (10.405) 0.0005
Model 3
(ACR+GFR+Lipids)
4.35 (4.348) 8.7 (6.007) 47.83 (10.65) 78.26 (8.794) <0.0001
Note: The third and fourth quartiles of the risk score Model 1 (ACR+GFR) and the first and the
second quartiles of Model 2 (Lipids) were not discriminatory. However, the most discrimination
was obtained in Model 3 when lipids were combined with baseline ACR and GFR. Values are
percentage of progressors and standard error. N in each quartile is 23. ACR, albumin-creatinine
ratio; GFR, glomerular filtration rate

46
Figure 1: Flow diagram of analytical strategy and post-trial follow up of participants of the
“Renoprotection in Early Diabetic Nephropathy in Pima Indians” trial analyzed in this study.
Baseline visit of the post-trial follow up. Kidney biopsy and serum samples collected. N=92
Renoprotection in Early Diabetic Nephropathy in Pima Indians trial. Recruited 1996 to 2001, N=169
Followed for 6 years for trial outcome
Excluded for no kidney biopsy: N=58 Excluded for GFR<90 mL/min: N=19
Followed for a median of 9.6 years for GFR decline ≥40% of post-trial baseline visit
Progressors, N=32
Non-Progressors, N=60

47
Figure 2: Baseline and last measured GFR in 32 progressors and 60 non-progressors. The boxes
represent median and interquartile range and bars represent 1.5-fold×the interquartile range below
the 25th percentile and above the 75th percentile. Outliers outside the mean + 2 SD are shown with
dots. GFR, glomerular filtration rate.
N=60 N=32
P<0.0001
P=0.796
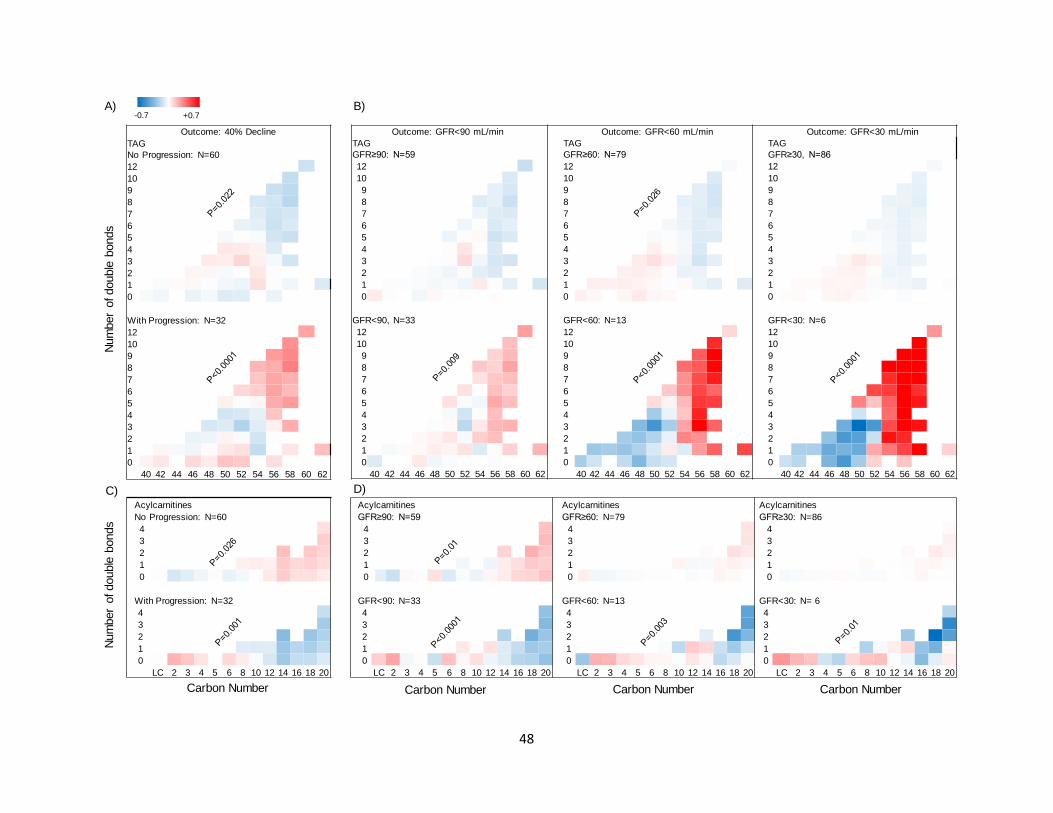
48
Outcome: GFR<90 mL/min Outcome: GFR<60 mL/min Outcome: GFR<30 mL/min
TAG
GFR≥90: N=59
TAG
GFR≥60: N=79
TAG
GFR≥30, N=86
12 12 12
10 10 10
9 9 9
8 8 8
7 7 7
6 6 6
5 5 5
4 4 4
3 3 3
2 2 2
1 1 1
0 0 0
GFR<90, N=33 GFR<60: N=13 GFR<30: N=6
12 12 12
10 10 10
9 9 9
8 8 8
7 7 7
6 6 6
5 5 5
4 4 4
3 3 3
2 2 2
1 1 1
0 0 0
40 42 44 46 48 50 52 54 56 58 60 62 40 42 44 46 48 50 52 54 56 58 60 62 40 42 44 46 48 50 52 54 56 58 60 62
Outcome: 40% Decline
TAG
No Progression: N=60
12
10
9
8
7
6
5
4
3
2
1
0
With Progression: N=32
12
10
9
8
7
6
5
4
3
2
1
0
40 42 44 46 48 50 52 54 56 58 60 62
Num
ber
of double
bonds
-0.7 +0.7A) B)
Acylcarnitines
No Progression: N=60
4
3
2
1
0
With Progression: N=32
4
3
2
1
0
LC 2 3 4 5 6 8 10 12 14 16 18 20
Num
ber
of double
bonds
C)Acylcarnitines Acylcarnitines Acylcarnitines
GFR≥90: N=59 GFR≥60: N=79 GFR≥30: N=86
4 4 4
3 3 3
2 2 2
1 1 1
0 0 0
GFR<90: N=33 GFR<60: N=13 GFR<30: N= 6
4 4 4
3 3 3
2 2 2
1 1 1
0 0 0
LC 2 3 4 5 6 8 10 12 14 16 18 20 LC 2 3 4 5 6 8 10 12 14 16 18 20 LC 2 3 4 5 6 8 10 12 14 16 18 20
D)
Carbon Number Carbon NumberCarbon NumberCarbon Number
49
Figure 3: Differences in carbon chain length and number of double bonds in complex lipids and acylcarnitines between
progressors and non-progressors (total N=92 in all panels). Abundance of TAGs and ACs were measured at the baseline visit of this
study and compared in progressors and non-progressors. A. In serum from progressors (N=32), there was a greater relative abundance
of longer TAGs with more double bonds. An opposite trend was observed in non-progressors (N=60). B. A similar pattern was found
when all participants (progressors + non-progressors) were grouped based on whether or not they achieved a sustained GFR<90 (N=33),
<60 (N=13), and <30 mL/min (N=6). Bonferroni threshold for multiple comparisons was set to 0.0063 (0.05 divided by 8 panels per
class). C. In progressors (N=32), there was a lower relative abundance of longer ACs with more double bonds. An opposite trend was
observed in non-progressors (N=60). D. A similar trend was noted in abundance of ACs by carbon number, when all participants were
grouped based on whether or not they achieved a sustained GFR<90 (N=33), <60 (N=13), or <30 mL/min (N=6). Bonferroni threshold
for multiple comparisons was set to 0.0063 (0.05 divided by 8 panels per class). P values are products of testing abundance of lipid by
“carbon number × double bond” interaction term in progressors versus non-progressors using mixed-linear models. GFR, glomerular
filtration rate; AC, acylcarnitine; TAG, triacylglycerol.

50
Figure 4: Adjusted correlation of long (C16-20) to intermediate chain (C6-14) acylcarnitine
ratio with complex lipid of various chain length and double bonds. Long-to-intermediate AC
ratio is directly correlated with shorter complex lipids with fewer double bonds, but is inversely
correlated with longer complex lipids with more double bonds in CE class. P values are product
of testing partial correlation coefficients in multiple linear regression models adjusting for sex and
ACR. AC, acylcarnitine; CE, cholesteryl ester; DAG, diacylglycerol; PE,
phosphatidylethanolamine; pPE, plasmenyl-PE; TAG, triacylglycerol.
CEsr = -0.298, p=0.004
PEsr=0.205, p=0.050
pPEsr=0.239, p=0.022
High-double bond longer lipids:Low-double bond shorter lipids:
AC complex
C16-C20
C6-C14
H
H
DAGsr=0.340, p=0.001
TAGsr=0.327, p=0.001
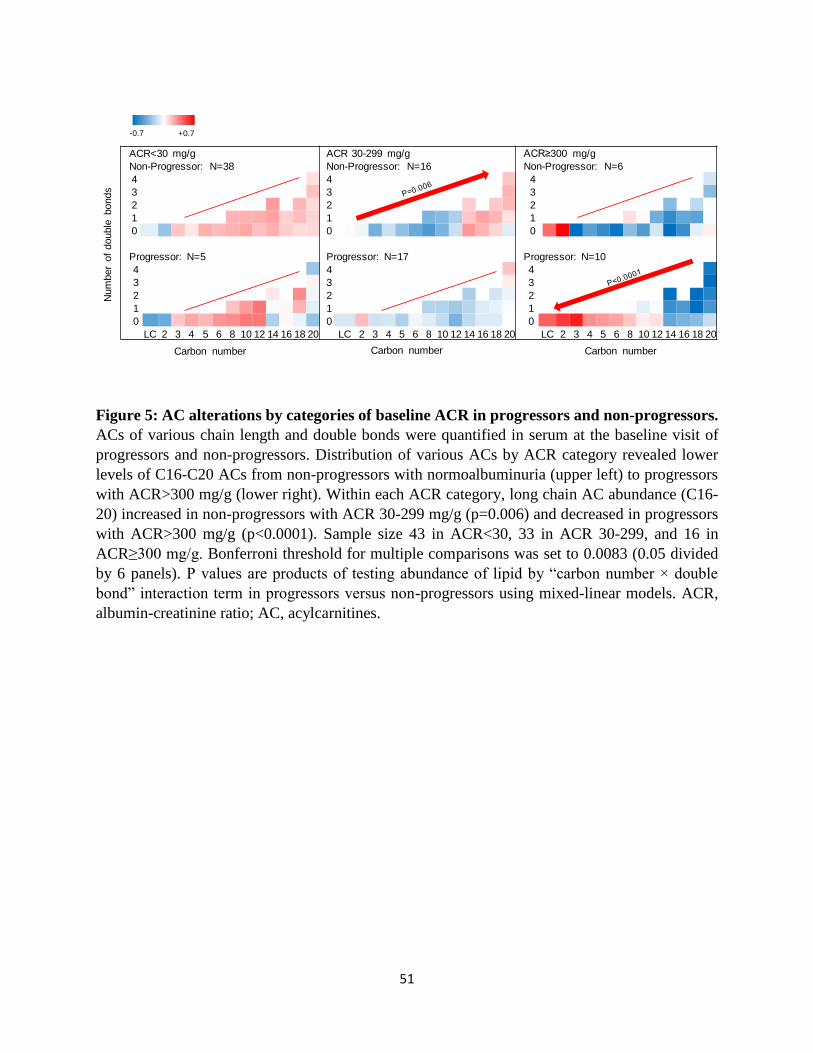
51
Figure 5: AC alterations by categories of baseline ACR in progressors and non-progressors.
ACs of various chain length and double bonds were quantified in serum at the baseline visit of
progressors and non-progressors. Distribution of various ACs by ACR category revealed lower
levels of C16-C20 ACs from non-progressors with normoalbuminuria (upper left) to progressors
with ACR>300 mg/g (lower right). Within each ACR category, long chain AC abundance (C16-
20) increased in non-progressors with ACR 30-299 mg/g (p=0.006) and decreased in progressors
with ACR>300 mg/g (p<0.0001). Sample size 43 in ACR<30, 33 in ACR 30-299, and 16 in
ACR≥300 mg/g. Bonferroni threshold for multiple comparisons was set to 0.0083 (0.05 divided
by 6 panels). P values are products of testing abundance of lipid by “carbon number × double
bond” interaction term in progressors versus non-progressors using mixed-linear models. ACR,
albumin-creatinine ratio; AC, acylcarnitines.
ACR<30 mg/g ACR 30-299 mg/g ACR≥300 mg/g
Non-Progressor: N=38 Non-Progressor: N=16 Non-Progressor: N=6
4 4 4
3 3 3
2 2 2
1 1 1
0 0 0
Progressor: N=5 Progressor: N=17 Progressor: N=10
4 4 4
3 3 3
2 2 2
1 1 1
0 0 0
LC 2 3 4 5 6 8 10 12 14 16 18 20 LC 2 3 4 5 6 8 10 12 14 16 18 20 LC 2 3 4 5 6 8 10 12 14 16 18 20
Num
ber
of
double
bonds
Carbon number
-0.7 +0.7
Carbon number Carbon number
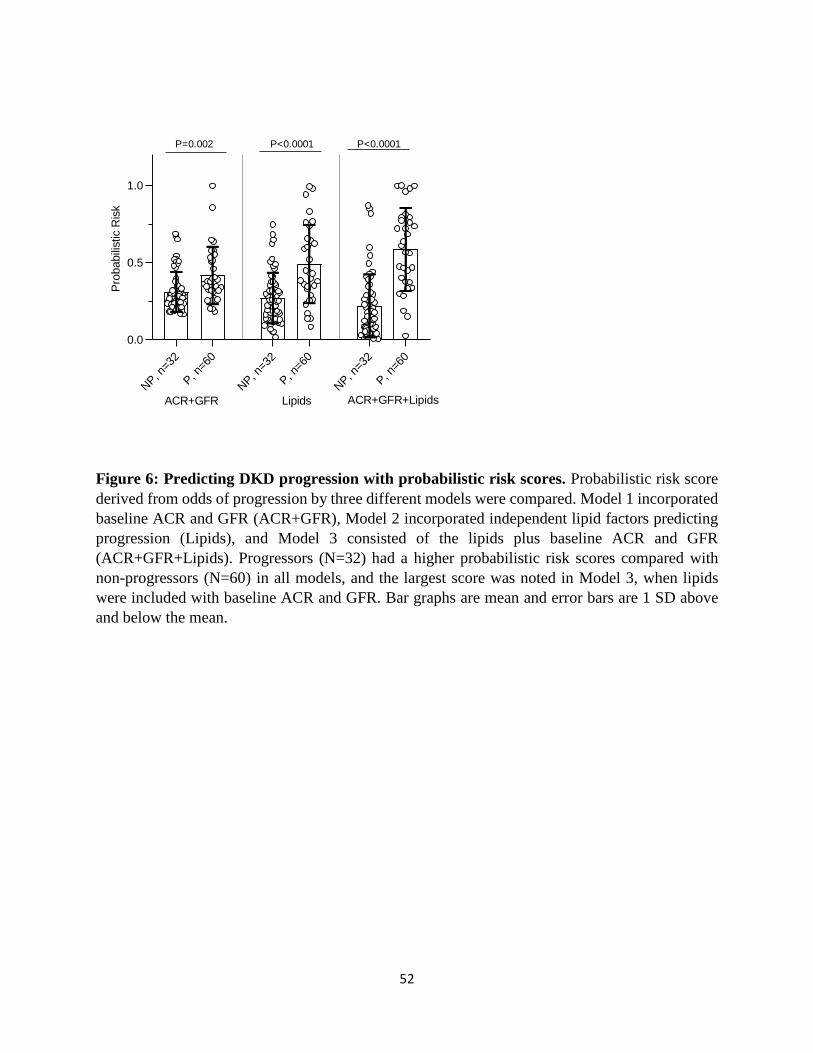
52
Figure 6: Predicting DKD progression with probabilistic risk scores. Probabilistic risk score
derived from odds of progression by three different models were compared. Model 1 incorporated
baseline ACR and GFR (ACR+GFR), Model 2 incorporated independent lipid factors predicting
progression (Lipids), and Model 3 consisted of the lipids plus baseline ACR and GFR
(ACR+GFR+Lipids). Progressors (N=32) had a higher probabilistic risk scores compared with
non-progressors (N=60) in all models, and the largest score was noted in Model 3, when lipids
were included with baseline ACR and GFR. Bar graphs are mean and error bars are 1 SD above
and below the mean.
0.13
0.22
0.52 0.52
0.17 0.17
0.43
0.61
0.040.09
0.48
0.78
0.00
0.25
0.50
0.75
1.00
1 2 3 4 1 2 3 4 1 2 3 4
Perc
enta
ge w
ith p
rogre
ssio
n (
100)
Quartiles of the risk scores, n=23 per quartile
P trend=0.001 P trend=0.0005 P trend<0.0001
ACR+GFR Lipids ACR+GFR+Lipids
P=0.002 P<0.0001 P<0.0001
A) B)
NP, n
=32
P, n
=60
NP, n
=32
P, n
=60
NP, n
=32
P, n
=60
0.0
0.5
1.0
Pro
babili
stic R
isk
ACR+GFR Lipids ACR+GFR+Lipids

53
Figure 7: Differential network Analysis. To identify inter- and intra-class lipid correlates, we
obtained the sparse partial correlation networks that captured the interdependencies between lipids.
We utilized lipid grouping structure, obtained the superset of the network skeleton, and finally
obtained the final stable network structures, the latter based on a bootstrapping method.
Differential network analysis revealed differential loss of edges between various lipid classes in
progressors characterized by 547 significant edges versus 1028 in non-progressors (p<0.0001) out
of 55,460 possible permutations of bivariate correlations. The lines represent significant edges that
were exclusively observed in non-progressors (blue) or progressors (red). Common edges are
shown in gray. The node size is proportional to the number of connectivity levels within and across
lipid subclasses, and node colors represent number of cross-class connections (white=low,
yellow=middle, red=high). Nodes are categorized by chain length (bottom, middle, top), and
double bonds (low, high) with details shown in Supplement Table 3.
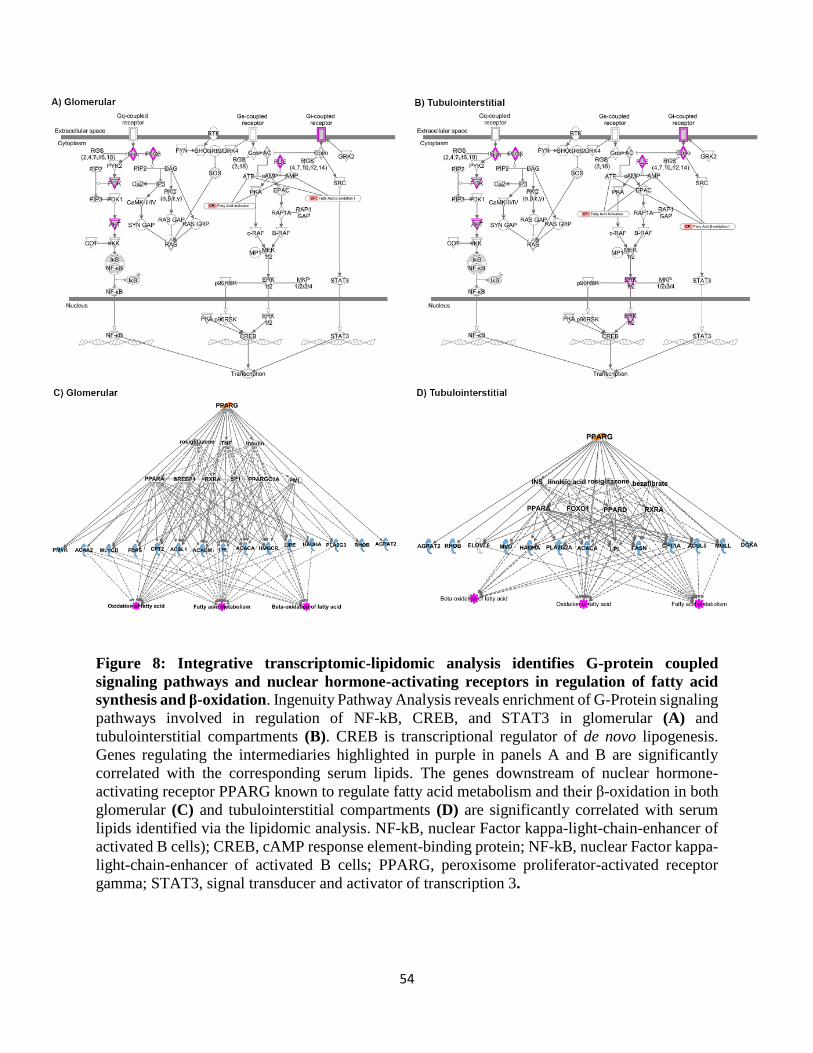
54
Figure 8: Integrative transcriptomic-lipidomic analysis identifies G-protein coupled
signaling pathways and nuclear hormone-activating receptors in regulation of fatty acid
synthesis and β-oxidation. Ingenuity Pathway Analysis reveals enrichment of G-Protein signaling
pathways involved in regulation of NF-kB, CREB, and STAT3 in glomerular (A) and
tubulointerstitial compartments (B). CREB is transcriptional regulator of de novo lipogenesis.
Genes regulating the intermediaries highlighted in purple in panels A and B are significantly
correlated with the corresponding serum lipids. The genes downstream of nuclear hormone-
activating receptor PPARG known to regulate fatty acid metabolism and their β-oxidation in both
glomerular (C) and tubulointerstitial compartments (D) are significantly correlated with serum
lipids identified via the lipidomic analysis. NF-kB, nuclear Factor kappa-light-chain-enhancer of
activated B cells); CREB, cAMP response element-binding protein; NF-kB, nuclear Factor kappa-
light-chain-enhancer of activated B cells; PPARG, peroxisome proliferator-activated receptor
gamma; STAT3, signal transducer and activator of transcription 3.

55
Figure 9: Proposed mechanisms underlying lipid abnormalities that predict early renal function decline in DKD. Upregulation of ACC,
mediated by insulin resistance, enhances de novo lipogenesis characterized by increased abundance of palmitate, a C16 fatty acid. With
elongation and desaturation, palmitate is converted into longer unsaturated fatty acids, which are incorporated into complex lipids (e.g.,
glycerolipids). In concert, upregulation of ACC also inhibits CPT1, which in turn decreases the conversion of L-carnitine to C16-20
acylcarnitines. C16-20 acylcarnitines are efficient β-oxidation substrates and, therefore, their diminished mitochondrial transfer
downregulates β-oxidation. The net effect of upregulated de novo lipogenesis is characterized by higher abundance of longer chain
polyunsaturated glycerolipids and lower abundance of C16-20 acylcarnitines and shorter low-double-bond glycerolipids. ACACA, acetyl
Co-A carboxylase alpha; ACLY, ATP citrate lyase; ACS, acetyl Co-A synthetase; CPT, carnitine palmitoyltransferase; DEGS, delta 4-
desaturase; ELOVL, elongation of very long chain fatty acids; FASN, fatty acid synthase; FADS, fatty acid desaturase; SCD, stearoyl-
Coenzyme A desaturase; PE, phosphatidylethanolamine; FFA, free fatty acid; SLDB TAG, short low double bond triacylglycerol.
Differential levels of:Unsaturated PEUnsaturated FFAC16-20 ACSLDB TAG Progressors
Non-Progressors
Out
com
e
Time
C16-20 Acylcarnitine
C16-20 Acylcarnitine
β-oxidation
Acetyl-CoA
Citric Acid
Citric Acid
Acetyl-CoA
Malonyl-CoA
CPT-1
C16-20 Fatty Acids
Acyl-CoAL-Carnitine
...
C16: Palmitate
Polyunsaturated Glycero-,phospholipids
ACLY
ACACA
FASN
ACS
DEGS, FADS, SCD, ELOVL
Insulin resistance
Glucose
Pyruvate
...
Elongation, Desaturation
Copyright © 2022 FDOKUMEN