construction of an intelligence test for visually impaired ...
126
CONSTRUCTION OF AN INTELLIGENCE TEST FOR VISUALLY IMPAIRED STUDENTS AND REVIEW OF RELATED LITERATURE DISSERTATION SUBMITTED IN PARTIAL FULFILMENT OF THE REQUIREMENTS FOR THE AWARD OF THE DEGREE OF iWagter of ^()iio£(opl&p IN EDUCA TION BY MISS SARITA Enrollment No. S-88S5 Under the supervision of Dr. SUNITA SHARMA DEPARTMENT OF EDUCATION ALIGARH MUSLIM UNIVERSITY ALIGARH (INDIA) 1994
-
Upload
khangminh22 -
Category
Documents
-
view
1 -
download
0
Transcript of construction of an intelligence test for visually impaired ...

CONSTRUCTION OF AN INTELLIGENCE TEST FOR VISUALLY IMPAIRED STUDENTS AND
REVIEW OF RELATED LITERATURE
DISSERTATION
SUBMITTED IN PARTIAL FULFILMENT OF THE REQUIREMENTS
FOR THE AWARD OF THE DEGREE OF
iWagter of ^()iio£(opl&p IN
EDUCA TION
BY
MISS SARITA Enrollment No. S-88S5
Under the supervision of
Dr. SUNITA SHARMA
DEPARTMENT OF EDUCATION
ALIGARH MUSLIM UNIVERSITY
ALIGARH (INDIA)
1994

DS2591
mm^^'"^'

DEPARTMENT OF EDUCATION ALIGARH MUSLIM UNIVERSITY
ALIGARH-202002, UP.
Dr. Sunita Sharma Lecturer, Deptt. of Ed., A.M.U., ALIGARH
21.9.1994
C E R T I F I C A T E
It is hereby certified that the research work
conducted by Ms. Saritat entitled "Construction of an
Intelligence Test for Visually Impaired Students and
Review of Related Literature", being submitted in partial
fulfilment of the requirement for the degree of M.Phil.
has been conducted under my supervision and embodies her
own work.
(Dr. gUNITA SHARMA)

ACKNOWLEGEHENTS!
I offer my sincere thank and gratitude to my
supervisor. Dr. Sunita Sharma, Lecturer, Department of
Education, A.M.U., whose constant supervision and able
guidance has enabled me to complete this dissertation.
I am also grateful to Dr. R,C. Deva, former
Chairman, Deptt. of Education, A.M.U. for providing me
all available facilities during course of this study.
I also wish to express my sincere thank to Mr.
Chauhan, Reader, Deptt. of Education, A.M.U., who gave me
some valuable suggestions regarding the statistical
analysis.
I wish to express my thanks to library and office
staff from core of my heart for providing me all
available facilities.
I would like to remember all my friends for their
active cooperation and helping hands.
I would be failing in my duty if I don't express my
sense of gratitude to my family members especially my
both the brothers, who rendered all the help and whole
hearted cooperation. They have been a continious source
of inspirastion to me through out the course of this
study.
It would also be worthwhile to thank all those
students who formed a part of this study for their
cooperation in gathering information regarding the test
construction.
^
^
(S^OTlTA)

C O N T E N T S
CHAPTER PftGE t<0.
1, INTRODUCTION
i. Definitions and Theories of Intelligence 1
ii. A Brief History of Intelligence Testing 7
iii. Efforts Made in the Field of Measuring 9 Intelligence
iv. Types of Intelligence Test Scores 13
2- REVIEW OF RELATED LITERATURE
i. Mental Abilities of Special Needs Children 16 in Teirms of Vision
ii. Memory, Attention, Reasoning and Abstract 19 Thinking of Visually Impaired
iii. Concept Formation 22
iv. Verbalism 27
V. Creative Potential 30
vi. Training Programme to Facilitate 33 Cognitive Development
3. THE PROBLEM
i. Assessment and Testing 36
ii. Rationale of the Study 37
iii. Definitions of Terms Used in the Study 44
iv. Objectives of the Study 46
V. Delimitations of the Study 46
4. RESEARCH DESIGN
i. Planning of the Test 47
ii. Item Writing 48
iii. Experimental Tryout 48
iv. Sample of the Experimental Tryout 50

V. Administration Procedure 50
vi. Item Analysis 52
vii. Final Tryout and Preparation of Norms 52
5. ITEM ANALYSIS
i. Frequency of Responses 55
ii. Difficulty Value 56
iii. Descrimination Index 59
iv. Creteria of Selection of Items for 62 Final Format of the Test
V. Reliability 66
vi. Validity Index 70
6. DEVELOPMENT OF NORMS, ANALYSIS AND INTERPRETATION
OF DATA
i. Development of Norms 73
ii. Age Norms 76
iii. Grade Norms 76
iv. Standard Score Norms 80
V. Reliability of the Test 82
vi. Validity of the Test 84
vii. Results 86
viii. Implications of Study Findings in the Field of Education of Visually Impaired 88
ix. Suggestions for Further Researches 90
REFERENCES 92
APPENDIX A (Test Booklet)
B (Ansv;er Sheet)
C (Scoring key)

LIST OF TABLES
Table No. Content of Table Page No.
Level of Research of (Visually Impaired) 39
4.1 No. of Selected Items in Different 49 Subtests
4.2 Details of Sample for Final Tryout 53
5.1 Frequency of Responses 56
5.2 Difficulty Values and Discrimination 63 Index of Selected Items
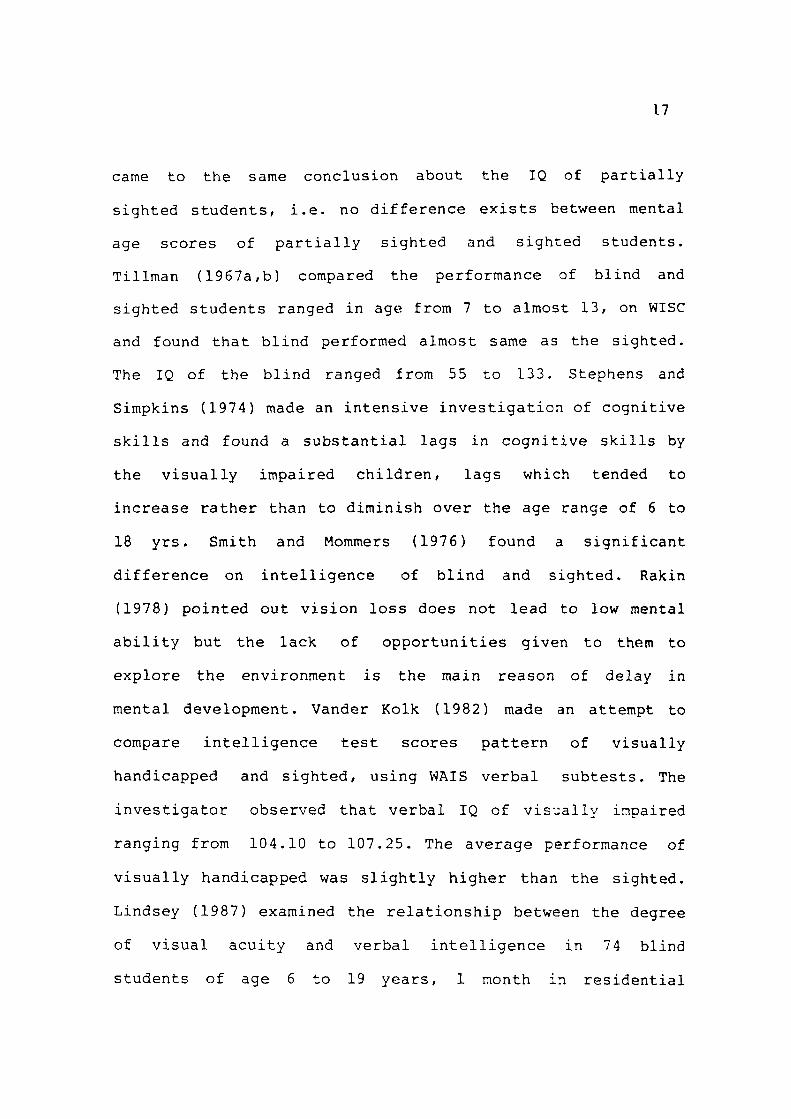
5.3 Distribution of Difficulty Values 64 of Selected items
5.4 Basic Stastistics of Distribution 66
5.5 Values of Pq of Selected Items 69
6.1 Means and Standard Deviations 77 of Different age Groups
6.2 Means and Standard Deviations of 78 Different Grades
6.3 Age V-Jise T.Scores 81
LIST OF FIGURES
Fig. No. Contents of Illustration Page No.
Revised Structure of Guildord's 5 SOI Model
Distribution of Difficulty Values of 65 Selected Items
6.1 Relationship between Intelligence and 75 age of Visually Impaired
6.2 Relationship between Grade and Intelligence 79 of Visually Impaired

I N T R O D U C T I O N

INTRODUCTION
DEFINITIONS AND THEORIES OF INTELLIGENCE:
It is a well established fact that intellectual
ability of an individual plays the most prominent role in
all spheres of his/her life. It is this ability which is
reflected in one's behaviour, activities, thinking,
adjustment and personality traits. Researchers have been
curious to know the effect of this factor on all personal
and non personal factors and they have found that this
ability affects the school performance to a great extent,
which is clear by the studies of Kulshretha (1956);
Stephens (1960); Ainsworth (1967); McCandles, Robert and
Stern (1972); Bhushan, Sharma and Mathew (1976); Roberg
and Flexer (1981) and Sharma (1982). Intelligence is
highly related with occupational aspiration, success in
different courses and creative potentialities etc. (Bedi
(1982); Utchat (1981); Frayer (1922); Johnson (1948);
Mathew (1967); Jhag (1979); Qureshi (1980) etc).
Though intelligence has been a comprehensively
researched area, still it is not very clear that what
intelligence really means. No doubt that psychologists
fron time to time have tried to define this term in their
own \7ay. Sore defined it as ability to adjust in the
environment. Some said, it is the ability to learn while

some psychologists like Teman remarked that intelligence
is the ability to carry on abstract thinking. Wechsler has
given a widely accepted viev/ in this regard. He considered
"Intelligence is the aggregate or global capacity of the
individual to act purposefully, to think rationally and to
deal effectively with his environment". One of the salient
features of this definition is that intelligence is
displayed by the behaviour of the individual as a whole.
The author's statement in the definition, 'to act
purposefully' and 'to deal effectively' requires the
involvement of 'drive' and 'incentives' has been
criticised by many experts who are of the view that drive
and incentives are non intellectual traits. Simon (1968)
has remarked that to formulate a single psychological
approach to intelligence is difficult. Guilford (1967) has
also observed that definitions of intelligence are far
from satisfactory. He is of the view that intelligence
comprises of 120 elementary mental abilities each of which
involves the action of some operation upon some content to
produce some product. Since, all the psychologists have
not been one on the meaning of the term intelligence, they
advocated different types of theories of intelligence
based on different types of its meanings. Some
psychologists developed the monarchic theory i.e.
intelligence is only one factor. In 18th and 19th century

a new theory flourished which was given the name of
faculty theory. The advocates of this theory v/ere of the
view that there are many faculties in mind like memory,
imagination, reasoning, discrimination and so on.All these
faculties are independent in nature. But some of the
psychologists did not agree with the view that all the
faculties are independent in the mind, therefore, this
theory was discarded. In 1904 Charles Spearman presented
a new view regarding the theory of intelligence. He
said that intelligence is the combination of two factors
i.e. general ability or 'g' factor and specific ability or
'S' factor. Spearman said that 'g' factor is universal and
innate ability. The amount of 'g' may differ from
individual to individual but 'S' factor is learned and
acquired in the environment. Individual may have different
types and amount of 'S' ability. Binet (1916) too
emphasized on general mental ability. He said.
Intelligence is a general intellectual capacity which
consists of the abilities: (1) to reason well with
abstract material; (2) to coprehend well; (3) to have a
clear direction of thought; (4) to relate thinking with
the attainment of a desirable end; and (5) to be self
critical". The author conceptualized intelligence as a
single but a complex integrated mental processes.
Thorndike has an entirely different view that intelligence

does not include general ability. He explained that
intelligence consisted of four attributes i.e. level,
range, area and speed. On the other hand L.L. Thurstone
(1938) rejected all the theories. After factor analysis,
he concluded that intelligence is the combination of seven
primary mental abilities (PMAs) i.e. Reasoning (R), Word
fluency (W), Number (N), Space relation (S), Associative
memory (M), Perceptual speed (?) and Verbal comprehension
(V). Guilford (1967) proposed a three dimentional box like
model, in order to simplify the picture of intellectual
trait's relationship. The model is popular as 'Structure
of Intellect' (SOI). In SOI content, operation and product
are placed separately along three dimentions of the block.
Content refers to the realm or area to which items belong
on the basis of which the operations are done. When
letters and numbers are the content, the content is to be
symbolic (S). Similarly, there are three more contens
along with this dimention i.e. figural (through figure),
semantic (in words) and behavioural (involving need,
attitude and drive of a person) are labelled as F, M and B
respectively. Operation implies the nature of the task to
be performed by examinees. In SOI model, there are five
kinds of tasks (mental operations) to be done with
various contents. The tasks are cognition, memory,
divergent production, convergent production and

evaluation, which are labelled as C, M, D, N and E
respectively, Product implies the kind of outcomes after
the operation is performed by the examinee. Guilford
identified six products i.e. Unit of information (U),
Classes of Units (C), Relations between units (R), Systems
of information (S), Transformation (T), and Implications
(I). There are 120 (4x5x6) discrete intellectual traits or
mental abilities. Though he has explained the term
'Intelligence' in a comprehensive manner but inspite of
that fact, he was not very much satisfied with his own
SOI. He thought of making some more modifications in it.
In his last article titled, "Some changes in the structure
of intellect model", published in 1988 after his death, he
has presented a revised model of SOI. The revised model
has two significant changes shown in the figure on page
No. 5.
The first change involves the seperation of
figural content column into visual and auditory
categories. The two categories were previously combined
because of very limted number of auditory factorial
abilities that had been reported. Since that time more
auditory abilities have been reported by Feldman (1969)
and Horn (1973), these abilities could be fitted into the
model. The second change that occured in revised SOI is a
new column i.e. memory retention and former memory column
has been renamed as 'memory recording' in the model. The

'memory recording' column involves short term memory. This
change had also been called for by the finding of parallel
set of six memory retention abilities by Kamstra (1971).
A BRIEF HISTORY OF INTELLIGENCE TESTING:
The earliest intelligence test was developed by
Alfred Binet and his coworker Simon in the year 1905. In
1904 Binet was asked by authorities of 'Paris Public
School' to develop a means for diagnosis of slow learners
and mentally retardeds, so that, proper education may be
imparted to them. This Binet-Simon test consisted of a
series of brief, varied cognitive tasks arranged in order
of difficulty. The tasks were: defining words, repeating
strings of digits or words after one hearing, reasoning
problems, repeating the thoughts of passage, reproducing
designs from memory etc. In 1908 Binet revised his own
scale in order to remove some of its defects. In 1911 he
further revised the scale. In this revised scale he
extended the age range from three years to adult level.
That was the last revision of the scale in his life time.
Though Binet - Simon scale was suffering from some
statistical limitations but it became a sound base for the
origin of all modern intelligence tests. Later on a number
of adaptations and translations of this scale were made by
many researchers as the per the need of the study. In 1916,
L.M. Terman revised the Binet-Simon Scale at Stanford

University and named it as "Stanford-Binet Scale of
Intelligence". In this cale more precise instructions of
administration and scoring were there to make it more
convenient and applicable. Terman's major innovation was
introduction of the term Intelligence Quotient (IQ) . The
mental age does not indicate how bright a child is, unless
one takes into simultaneous account of his chronological
age (CA). A German Psychologist W. Stern (1912) suggested
that dividing mental age (MA) by chronological age (CA)
could lead an absolute index of brightness. Terman adopted
the suggestion, although his allocation of the test items
to age level was primarily be MA. The use ofquotient is
applicable if scale has a zero point and equal intervals.
In 1939 Davis Wecheler published the first carefully
constructed test especially for adults. The scale is known
as Wechsler-Bellvue scale which can be used for children
above ten years and adults. The test consisted of two
equivalent forms i.e. Format I and Format II. F ach form
consisted of ten subtests in v hich five were verbal and
remaining five were nonverbal tasks. In 1955 this scale
was revised and renamed as Wechsler Adult Intelligence
Scale (WAIS) which consisted of eleven subtests out of
which six were verbal and five were non verbal/performance
tasks. The age range for the scale was sixteen and above
upto sixty four. In 1949 he also developed an intelligence

test for the children (WISC). In addition to this, a
separate test for children of age range of 4 to 6k was
also developed. It is known as VJechsler Pre-school and
Primary Scale of Intelligence (WPPSI) which was published
in 1967. Since then, a number of intelligence tests have
been developed, not only abroad but also in India. A
number of verbal and nonverbal/performance tests for
sighted population are available.
EFFORTS MADE IN THE FIELD OF MEASURING INTELLIGENCE OF
VISUALLY IMPAIRED:
Measurement of Intelligence of Visually impaired
is as old as the intelligence testing movement. So far as
investigator's knowledge is concerned, most of the tests
are the adaptation of Binet or VJechsler's scale of
intelligence such as Hains (1919) developed a point scale
for visually impaired which is based on Binet-Simon Scale.
In this scale new norms were developed by adding up new
cases in the sample. More accuracy of the test can be
claimed when used with feeble minded persons.
Hayes (1918-1943) did a systematic and pioneeJ
work in the area of intelligence testing of the visually
impaired. He has been putting his efforts continuously in
order to make the test more suitable. Through adequate
followups and revisions, he developed a test in 1942,

10
v/hich is known as Hayes-Binet Intelligence Scale. The test
was standardised on 2373 blind children.
Davis (1980) developed another intelligence test
for 2 to 20 yrs. old blinds. The test is called Perkins-
Binet Intelligence Scale. It has two forms i.e. N-Form and
U-Form. N-Forn for those having Non Usable Vision and
U-Form for those having Usable Vision.Approximately 25 to
30% items are of performance type. The test yields both
Mental Age (MA) and Intelligence Quotient (IQ). The test
was standardised on 2153 blind and partially sighted
students from day and residential programmes.
Some of the investigators (Smits & Mommer, 1976;
Suin, Deuterman & Shapiro, 1967; Tillman & Bashaw, 1968;
and Singh, 1985) have used verbal part of Wechler scale as
it is for measuring the intelligence of visually
impaired. It is not justified for this population.
However, some of the professionals have attempted
to construct their Q\-m tests to measure the intelligence
of visually impaired. Slosson (1963) constructed a test
for children and adults called "Slosson Intelligen Test
(SIT). The test was standardised on a limited sample,
having limited reliability and it is applicable for a
wider age range from birth to 27 years. The test can Be
administered individually which yields ratio IQ. The SIT
given a quick estimate of person's intelligence. The
majority of items are highly verbal, and the scores tend

11
to overestimate a person's IQ as determined from more
comprehensive measure. The SIT should be used for
screening only. It can help to identify students for whom
intelligence testing in more depth night be necessary.
Shurrager and Shurrager (1964) constructed a "Haptic
Intelligence Scale for adults". The test consists of 6
subtests which require to solve problems using tactile
input. The subtests are digit, symbol, object assembly,
block design, object completion, pattern board and based
arithmatic. The subtests are somev/hat similar to those
found in Wechsler's scale. Standardisation was done on
approximately 700 blind adults. The test has acceptable
reliability and limited validity. Newland (1969) developed
a blind Learning Aptitude Test (BLAT) for 6 to 20 years
old blind and partially sighted students. But the author
recommends it for 6 to 12 years students. The test was
standardised on 961 blind students. The BLAT yields a
learning aptitude test age as well as learning apptitude
quotient. The test measures abilities such as discrimina
tion, generalization and sequencing using tactile stimulus
items.
In India, the efforts in the field of construc
tion or adaptation of intelligence tests for blind are
very passimistic. The v/ork done in this area is far from
satisfactory. In the knov/ledge of the investigator only

12
three tests for assessing the intelligence of visually
impaired have been developed so far. Blind Relief
Association, New Delhi, has prepared a test of
Intelligence for blind children in 1979. The test was
standardised on 250 Hindi speaking blind children. This
test can be used for sighted also as 145 sighted children
were also covered for test construction.
Another test published by NAB Luis Braille
Memorial Research Centre, New Delhi, in 1978 is "Vithobha
Packnikar Performance Test for the blind". The test was
constructed to measure intelligence of visually impaired
falling in the age of 8 to 22 years.
One more test has been developed by Singh (1986).
The test is especially prepared for assessing intelligence
of adult blinds falling in the age range of 16 and above.
The test consists of 5 subtests viz. information, digit
span, arithraatic, similarities and ccinprehension. The
standardisation was done on 364 adult blinds from six
institutions of North India. The reliability of the test
was assessed by test-retest and split half methods.
Coefficient of correlation obtained by the above methods
were found to be satisfactory at .01 and .05 level of
confidence respectively. Mohsin's verbal test for general
intelligence (1964) was used to validate the scores
obtained on Hindi WAIS-R by 40 visually handicapped

13
students for concurrent validity assessment. Index of
brightness scores (Mohsin's test) corelated highly v;ith
WAIS-R scores. Coefficient of corelation for above tv;o
test scores v;as found to be 0.887. Intercorelation matrix
among subtests was found to be satisfactory.
TYPES OF INTELLIGENCE TEST SCORES;
The prevailing 'Intelligence Tests' convey the
mental abilities in the following test scores.
MENTAL AGE SCORE;
The term mental age (MA) was introduced by Binet
in 1908, in the first revision of his intelligence test.
Tuckman (1975) has opined about the mental age score as "A
score that is determined by comparing a child's score with
the scores obtained by younger and older children in the
norming group". Thus mental age score is obtained by
comparing a child's score with average score (age norm) of
his age level. For example, suppose age norm score for 10
year is 60. If an examinee obtains the score of 60 it means
his/her mental age is 10 yrs. irrespective of his/her
chronological age.
INTELLIGENCE QUOTIENT (IQ) AND DEVIATION INTELLIGENCE
QUOTIENT (DIQ);
As mentioned earlier in this chapter, the term
'Intelligence Quotient' (IQ) was introduced by Terman in

14
1916. The IQ is defined as the ratio of mental age (M.A.)
and chronological (CA) multiplied by 100 in order to avoid
decimal fractions.
IQ = J^h- X 100 CA
An examinee is said to be average on mental ability if
his/her mental age is equal to the chronological age i.e.
IQ will be 100. If mental age of another examinee is
greater than his/her chronological age, the IQ of that
examinee will be more than 100 and he/she will be
considered above average on mental age and vice versa.
Although, this term has been very popular in
measuring intelligence, however, it has some shortcomings
also, which are as follows:
1. It has been observed that growth of mental age is not
continuous and steady. It varies in different stages
of life and also the trend is not identical in all
the persons. It is a general observation that mental
growth is fast in early age, slow in middle age and
almost static in old age while chronological age
increases gradually and constantly. Thus IQ ratio
decreases with the increase in chronological age.
2. The IQ scores for different tests are not comparable.

15
3. Variability of IQ score for different age levels on
the same test is not identical. Thus the same IQ
score for different age levels convey different
meanings which seems to be misleading.
In order to remove above mentioned shortcomings,
some psychologists replaced the term IQ with Deviation
Intelligence Quotient (DIQ), IQ ratio can easily be
converted into a normalised standard scores with a fixed
mean of 100 and SD of 15, such converted IQ scores are
known as deviation IQ scores.

REVia* CF REIATED LTTERMURE
REVIEW OF RELATED LITERATURE
In technical terms, the collection of researches or
work done in any area is called the related literature. The
review of related literature helps the investigator, in the
sense that it enables him/her to find out the factors/
variables to be researched, avoid repetition of work done
earlier, synthesize the previously done work or find the
relationship between or among different variables. In the
present chapter the investigator has made an attempt to
present a review of the literature related to the cognitive/
mental abilities of visually impaired.
MENTAL ABILITIES OF SPECIAL NEEDS CHILDREN IN TERMS OF
VISION :
Hayes (1941) did a pioneer work in the area of
'Intelligence' testing of the blind. The investigator
modified the Standford-Binet test. The sample consisted of
2372 blind children. The IQ was found 98.8 (slightly below
average). Eisenson and Stanton (1941) found intelligence
scores of partially sighted students in the normal range. Lowenfeld
(1945), Nolan and Asheroft (1969) found that both partially
sighted and blind children were behind their sighted peers
when equated on mental age. Livingston (1958) found that
average I.Q. of partially seeing children to be 98.6.
Bateman (1963); Birch, Tisdall, Peabody and Sterrett (1966)
17
came to the same conclusion about the IQ of partially
sighted students, i.e. no difference exists between mental
age scores of partially sighted and sighted students.
Tillman (1967a,b) compared the performance of blind and
sighted students ranged in age from 7 to almost 13, on WISC
and found that blind performed almost same as the sighted.
The IQ of the blind ranged from 55 to 133. Stephens and
Simpkins (1974) made an intensive investigation of cognitive
skills and found a substantial lags in cognitive skills by
the visually impaired children, lags which tended to
increase rather than to diminish over the age range of 6 to
18 yrs. Smith and Mommers (1976) found a significant
difference on intelligence of blind and sighted. Rakin
(1978) pointed out vision loss does not lead to low mental
ability but the lack of opportunities given to them to
explore the environment is the main reason of delay in
mental development. Vander Kolk (1982) made an attempt to
compare intelligence test scores pattern of visually
handicapped and sighted, using WAIS verbal subtests. The
investigator observed that verbal IQ of visually impaired
ranging from 104.10 to 107.25. The average performance of
visually handicapped was slightly higher than the sighted.
Lindsey (1987) examined the relationship between the degree
of visual acuity and verbal intelligence in 74 blind
students of age 6 to 19 years, 1 month in residential

18
school. ANOVA was applied for analysis. It was found that
there exists no relationship between degree of visual acuity
and IQ. Ittyerah and Samarapungavan (1989) studied the
performance of 48 congenitally blind and 48 sighted children
of age range 4-11 years on cognitive development tasks. The
investigator found that cognitive development in the blind
is not identical to that in the sighted group. Performance
deficits are the result of both, long term absence of
experiences and absence of direct or immediate visual
information about the stimulus at hand. Sharma (1993)
compared 45 congenitally blind and 42 adventitiously blind
on Intelligence test scores (Mixed Type Group Intelligence
by Mehrotra, 1975). The 't' test was applied to see the
difference. She found that the two groups do not differ
significantly on intelligence test scores.
A perusal of above mentioned studies reveals that
researches conducted in the area of intelligence testing
should be viewed from a different angles also. The reason of
low intelligence of the blind may be due to (a) differences
in the samples i.e. students placed in segregated or
inclusive school settings, (b) use of intelligence test
meant for sighted population, and (c) the scores of an
Intelligence test does not only reflect the child's
intellectual potential, rather, it also depends on the
opportunities provided to the child for using his/her
intellectual potential.

19
MEMORY, ATTENTION, REASONING AND ABSTRACT THINKING OF VISDALLY
IMPAIRED :
Levingston (1958) administered Standford-Binet test
to 60 partially sighted children aging from 8-9 years. The
result revealed that partially sighted performed like
normal on reasoning, language development and abstract
generalisation. Bateman (1963) concluded that the children's
performance in abilities, measured through the auditory
channel were average but they performed below average in
visual perception, visual association and visual memory.
Tillman (1967a,b) studied the performance of blind and
sighted children on Wechsler Intelligence Scale for Children
(Wise). The sample consisted of 100 students in each group
ranging from 7 to almost 13 years. Performance was
evaluated in terms of item difficulty curves, t-test of
subtest's mean, and subtest's reliabilities. Results
indicted that the blind scored about the same as the sighted
on arithmatic, information and vocabulary, however, they did
significantly less well on comprehension and similarities.
Inclusion of 'digit-span' resulted in higher mean IQ for the
blind. Results of factor analysis showed fewer factor
loadings and weaker communalities for the blind on all
subtests except arithmatic, suggesting a greater specificity
in the organization of abilities sampled by these tests.
Zweibelson and Brag (1967) asked the eight matched blind and
sighted subjects to attempt VJISC. The responses were thon
categorised as concrete, functional or abstract concepts. A

20
significant difference was found between two groups. The
blind subjects did not use abstract concepts to the extent
that the sighted children did, but rather were found to
think primarily on a concrete and functional conceptual
level. Tillman & Osborne (1969) observed that blind children
v/ere superior to the sighted children on repetition of
series of numbers indicating short term memory and
attention. Higgins (1973) found that children who had been
severely visually impaired since birth, scored considerably
worse on concept involving concrete content. There was no
corresponding difference for the sighted children. Miller
(1977) attempted to explore abilities structure of
congenitally blind persons. The investigator included 100
congenitally blinds in the age range of 16 to 35 yrs., using
verbal subtests. The verbal memory was assessed by four
subtest viz, information , vocabulary similarities and
comprehension. The findings indicate, that verbal memory has
a great significance in learning potential of the subjects.
Vander Kolk (1977) administered Wechsler's Adult
Intelligence Scale (Verbal) on 597 visually handicapped
subjects. The figures demonstrated that, on variables like
sex, degree of vision and different diagnostic groups
(Adventitious vs congenital blindness) did not differ
significantly but verbal intelligence scores were found to
be related with age and education. It was found that in

21
order to compensate for visual loss there was more reliance
on verbalization among the blind cases which produces a
global and highly developed attention concentration factor
in the intellectual function of a blind. This was manifested
in the fairly consistent higher digit span scores of blind.
The study further suggested that visually handicapped
subjects seemed be less conceptual in cognitive processes,
scoring less on comprehension, similarities and vocabulary
subtests. Vander Kolk (1982) found that adventitiously blind
persons scored higher th^n the sighted norms on arithmetic
and similarities subtests, whereas blind persons were very
similar to the sighted norm groups. Totally blind subjects
were found to be different from the sighted on three
subtests.They performed better on similarities and digit
span but poor on arithmatic. In their performance partially
sighted were found to be parallel to the sighted norms on all
subtests except similarities. Regarding difference in sex it
was concluded that female had greater difficulty on the
arithmatic subtest but they were found to be better on
vocabulary and similarities in certain age groups. On
contrary male showed three times better performance on
information and arithmatic subtest. Singh (1985) studied
intelligence test score patterns of various subgroups of
148 visually handicapped nale subjects like adventitious &
congenital blind, partial vision, total loss of vision and

22
different age groups, using VJAIS-R (Verbal Hindi) scale by
Verma et. al. 1981. Results indicated that congenitally
blinds scored better than adventitious blind subjects on
digit span test. Statistically a significant difference was
found between both the groups on this subject. Age wise
trends of scores on various subtests showed an increase in
the mean scores as the age progresses. More consistant
pattern of this was observed on information and
comprehension subtests.
CONCEPT-FORMATION :
Foulke (1962) noted that the nature of the concept
that an individual acquires, depends on the nature of his
experiences, and that it may thus be expected that the
concepts of the visually impaired child are in someways more
restricted than those of the sighted child. Investigator
also noted that visually impaired are more dependent on
verbal descriptions of objects and events made by other
people, and consequently the visually impaired child's
adequacy of language development is more critical. The
degree of visual impairement is undoubtedly a very important
factor. Even a limited amount of visual function may change
substantially the nature of the information available to
the child's cognitive growth, and the importance of
encouraging the use of visual capability that can not be

23
over emphasized. Tillman (1967a,b) observed that the blind
tends to approach abstract conceptualization problems from a
concrete and functional level and consequently lag behind
the sighted children. Fraiberg (1968) noted that achievement
of mature object concept is delayed in totally blind
infants until 3 to 5 yrs. of age, in contrast to 2 years for
the sighted child.
Tobin (197 2) and Gottesman (1973) observed
developmental lag in the acquisition of mature conservation
concept of substance among severely visually impaired viz,
conservation of liquid volume, conservation of weight and
length, as well as other properties. Brelcke, William and Tait
(1974) compared the large print readers with braille readers
on weight conservation task and found that large print
readers v/ere earlier conserver than braille readers.
Hartlage (1967) observed negative effects of visual
handicaps on development of spatial concepts. He paired
children, blind from birth with sighted children for age,
sex and academic achievement. 200 children from grades 2, 3,
5, 7 and 12 were asked to respond to a test containing 16
items of a spatial nature and 16 items of non-spatial
nature. Eight questions of each type contained a self
referent and eight did not. Blind subject's performance on
spatial questions was inferior to that of the sighted

24
subjects at all grade levels. Also the blind performed less
well on spatial questions as compared to non-spatial questions
at all grade levels. The blind and sighted performed equally
\;ell on non-spatial questions. All the subjects performed
better on questions containing self repferent than on
questions without self referent. Birns (1983) compared
congenitally and adventitiously blind children on piagetian
spatial task to determine the effect of age at which they had
lost their vision on the acquisition of space concepts. The
result indicted that blind children acquire topological space
concepts, but only about half are able to make the transition
to the conceptualization of projective space. However, no
relationship was found between the age at which the children
became blind and their performance on the tasks. A typical
pattern in blind children in developing concepts of left and
right was observed. Sighted children first deve3»op the concept
of absolute left and right, then the concept of mirror image
and finally the concept of relative position of left and right
In contrast, one third of youngsters in this study
consistently reversed the position of left and right in a
mirror image orientation despite having mastered the concept
of both absolute the relative left and right. In addition, it
was noted, unlike sighted children, there was no systematic
progression by age in achievement of stages of space
development. MacWilliam (1984) studied the relationship
among typical measures of survey level mental

25
representation of space in blinds. Five measures of survey
level mental representation of space v/ere each administered
to 40 blind adults (half were congenitially and remaining
half were adventitiously blind). Factor analysis revealed a
great deal of commonality among three of the five measures
and part of the fourth measure. This common variance was
explained by the heavy influnece of single underlying
factor. It was proposed that this factor pertained to the
mixed spatial information processing strategies for spatial
and linguistic solution. Chin Donna Lisa (1984) investigated
the effects of dance movement instructions on the spatial
awareness of elementary visually impaired students and on
the self concept of secondary visually impaired students.
Twenty four visually impaired Mexican, American, Indian and
Anglo secondary students were randomly assigned to three
groups. The first group received 20 hours of dance movement
instructions. Second group received 20 hours physical
exercise instructions and third group received no treatment
during the 10 weeks study period in addition to their
regular physical education activities. The result of initial
part of the study indicated that a physical education
programmes supplemented with dance mopvement instructiopns
may enhance the development of spatial awareness in
elementary visual impaired students. The findings of second
part of the study did not indicate that dance movement

26
iiu tructions would be effective in enhancing the self
concept of secondary visually impaired students. Menakar
(1966) made an attempt to investigate the effects of
prolonged deficit in the vision sense on developnent of
perception in the Tactile Kinesthetic Sense. Tasks involving
the kinesthetic after effect and the size-weight illusion
were admiaistered to matched group of blind and sighted
children who ranged in age from 5 to 15 years. Results
showed a systematic change with age for the size-weight
illusion, with the rate of change being slower for the
blind. Piaget & Inhelder (1969) observed that the
congenitally blind infants lack of vision interferes with
the development of sensory-motor schemas. Stephens (1972)
noted a number of areas where the restricted experiences of
the visually impaired infants might well have retarding
effects. It seems quite reasonable to expect sensory motor
delays to carry over into later aspects of cognitive
development. Gottesman (1976) suggested that the observed
delays in cognitive development in early school age of
visually impaired children are partly the result of the
child's reliance on "less sophisticated sensory
discrimination abilities". To the extent that vision is
needed to provide an effective integration of the
information received by the other sensory modalities, the
perceptual information available to the visually inpaired

27
child may indeed be less sophisticated and thus may serve
cognitive skills less well than in the sighted child. The
investigator has found a significant lag in the acquisition
of various conservation abilities, but he has found that
these lags tend to decrease with increasing age, with many
visually impaired children in the age range of 8 to 11 yrs.
showing appropriate conservation of weight and substance-
The author suggested that although the lag occures initially,
visually impaired children gradually become able to perform
conservation tasks because of their "increasod relianro on
integrative processes of cognitive functioning, rather than
a reliance on the less sophisticated sensory discrimination
abi]i ti es".
VERBALISM :
Cutsforth (1932) demonstrated the tendency of
visually impaired children to use "visual" vocabulary. The
invostigator called such usage 'verbalism', and he roasonocl
that since visually impaired children could not have a first
hand sensory base for use of such vocabulary, the use fiT
verbalism must lead to "incoherent and loose thinking",
since the words used by visually impaired child are further
removed from direct sensory referents than those of the
sighted child. Cutsforth urged that the visually impaired
child be discouraged from the use of verbalism in his

child may indeed be less sophisticated and thus may serve
cognitive skills less well than in the sighted child. The
investigator has found a significant lag in the acquisition
of various conservation abilities, but he has found that
these lags tend to decrease with increasing age, with many
visually impaired children in the age range of 8 to 11 yrs.
showing appropriate conservation of weight and substance.
The author suggested that although the lag occures initially,
visually impaired children gradually become able to perfom
conservation tasks because of their "increased reliance on
integrative processes of cognitive functioning, rather than
a reliance on the less sophisticated sensory discrimination
abilities".
VERBALISM :
Cutsforth (1932) demonstrated the tendency of
visually impaired children to use "visual" vocabulary. The
investigator called such usage 'verbalism', and he reasoned
that since visually impaired children could not have a first
hand sensory base for use of such vocabulary, the use of
verbalism must lead to "incoherent and loose thinking",
since the words used by visually impaired child are further
removed from direct sensory referents than those of the
sighted child. Cutsforth urged that the visually impaired
child be discouraged from the use of verbalism in his

language. Harley (1963) found higher incidence of verbalism
(A verbalism occurs when one can define a word verbally but
can not identify the corresponding object) among younger
children, among low IQ children and among with less reported
experience with the objects used for experimental stimuli
It was suggested that "the key to reduction of •-3'balisn
among blind children is the increasing of interaction with
their environment". Kenmore (1965) administered seven paired
associate learning task requiring use of different sense
modalities on thirty matched pairs of blind and sighted
children. The task included verbal learning of meaningful
and meaning less materials through reading and listening.
Blind subjects handled familiar objects, random shapes, and
tactually distorted objects while sighted subjects looked at
colour pictures of these items. For learning task involving
familiar things, there were few differences among the group
regardless of the sense modality involved. For unfamiliar
materials, however, the blind sixth grade excelled on the
verbal material but were inferior to all other groups in
dealing with random shapes and distorted objects. Blind
third graders exceeded blind sixth graders in tactual
learning for these tasks. Singer and Streiner (1966) also
illuminated the verbalism area. They compared the richness
and complexity on content of imaginative productions for

29
matched group of 20 blind and 20 sighted children. Sighted
children were significantly higher for imaginativeness of
play, spontaneous fantasy, and dreams. Blind children showed
a greater concreteness and lack of flexibility or
associational variety. Fantasy themes were more
preserverative. The authors concluded the complexity and
variety of stimulation available through sight was essential
for fully developed imaginative skill. Dokecki (1966)
pointed out that associative and word thing meanings are
fundamentally different for the blind or for any other
group. The author suggested that the use of visually
related vocabulary by visually impaired children should not
be discouraged. Rather, they should be fully exposed to
those words and concepts and special attempts should be made
to enhance their meanings. De Mott (1972) inquired whether
or not verbalisms have meaning, and whether or not their
meanings are consistent among individuals who have had the
same type of sensory experiences. The investigator found
that there were not significant differences in affective
meanings of 15 stimulus words between group of visually
impaired children with less than light perception, visually
impaired children whose vision ranged from movement
perception to 20/200, and a sighted control group. The
finding supports the Dokecki (1966) suggestions.

30
CREATIVE POTENTIAL :
Tisdall and Hurst (1971) compared blind children
with their sighted peers. Each group consisted of 76
subjects. Results indicated that blind children exhibited
more verbal fluency than seeing children. The blind subjects
did not differ significantly in ability to think divergently
with sighted. Day school blind males tend to be more
divergent than the females. Kamila (1984) studied the
distribution of creative thinking ability scores among
blind normal and total sample. The sample consisted of 50
blind children studying in VIII to X classess and falling in
the age range of 13 to 19 yrs. The blind subjects were
randomly selected from three schools of Bhubaneshwar,
Berhampur and Burla locality (Orrisa). Similarily 150 normal
students of same age range and grades from six general
schools of same locality. AAcharyulu's Think Creative Test
Battery was used to get the creati ve score. Percentasge of
school marks in the Annual Examination were treated as
achievement scores of the sample. Chi-square were computed
to find out difference between creative ability of visually
handicaped and sighted students- Findings revealed that (1)
fluency and flexibility scores pooled over the ATC test
battery are normally distributed with sample of the blind
children but it is not true in case of originality scores.
The creativity scores are not normally distributed among the

31
njimal and blind children, (2) the normal children tend to
out the score significantly than the blind children on all
three creative abilities viz, fluency, flexibility and
originality and (3) the correlations between the creativity
measures and scholastic achievement of blind children are
low and positive. Korkhao (1984) has presented a case
history of a successful blind child, who achieved a
communication skills and other daily living activities after
training. This case learned to write creative stories and
other creative works. Brayant (1984) studied the strategies
used for composing by two individuals, blind from birth and
two persons, blinded later in the life. Results of the study
indicated that blind writers use the same basic process of
writing as represented for sighted writers. Blind writers in
this did not make written plan prior to writing and spent
between one and four minutes in prewritings. Planning was an
on-going features of the composing process. The writers in
this study demonstrated the recursive feature of
compositing, rescanning was a continual part of their
composing session. Three of the subjects reported using
rescanning for planning and editing. One individual reported
using rescanning for editing only. Writers, blind from birth
demonstrated a difference in ability to organise an essay
in the extensive mode. These composers made no global plans,
rather they allowed the writing to unfold as they wrote.

32
This research would indicate that sight nay have a role in
composing. Siddiqui (1989) studied the creative potential
of visually impaired children in relation to their
Socio-Economic Status (SES). The investigator found that
there exists a significant difference in creative potential
of visually handicapped children in relation to their SES
among boys and girls and children from rural and urban
areas. Sharma (1993) compared two groups, i.e. congenitally
and adventitiously visually impaired on creative potential
after eliminating the effect of SES and Intelligence factor.
The sample consisted of 45 congenitally blind and 42
adventitiously blind belonging to three schools of North
India. Measuring tools used in the study were, (a) Verbal
test of creative thinking by Baqur Mehdi (1985), (b)
Socio-Economic Status Scale by Bhardwaj, Gupta and Chauhan
(1989), (c) Mixed type group intelligence by Mehrotra
(1975). The data was analysed with the help of t-test and
partial correlation. The investigator found that both the g-
roups under study were not significantly different with each
other in creative potentiality. Frustration and creativity
of congenitally and adventitious blinds have quite low
partial correlation. The investigator also concluded that as
far as creativity and school performance of congenitally
blind is concerned, creativity has no contribution in school
attainment. But in case of adventitiously blind students,
creativity has been found to help in school attainment.

33
TRAINING PROGRAMMES TO FACILITATE COGNITIVE DEVELOPMENT :
Barraga (1964) laid an emphasis on the proper use
of residual vision, which play a potentially positive role
in cognitive development. The investigator developed a
training programme for the use of residual vision. Later on
this training programme v/as refined by Barraga and Collins
(1979), that programme showed clearly that with appropriate
strategies, low vision children can be assisted in learning
to utilize their visual capabilities to a greater degree
than they might spontaneously even though their visual
acuity is not affected by the training programme. Friedman
and Pasnalc (1973) examined the feasibility of training for
accelerating the acquisition of classification skills in
visually impaired children. Various types of classification
tasks were used in the training, including verbal and
tactual discovery of class problems, and form, orientation,
texture and size classification problems.
Each child's progress through the programme was
self-placed, pre and post test were administered using
classification problems that were not used in the training
programme. The classification training group shov/ed a
significant improvement from pre to post test, while the
control group did not. Furthermore, the mean of post-test
performance for the classification training group was not
different from the performance of the group of sighted

34
subtests of similar ages. Stephens, Grube and Fitzgerald
(1977) studied the effect of long term training progranne
for the development of Piaget-type cognitive skills in
visually impaired children. The study covered the sample of
the age range of 6 to 18 years visually impaired (light
perception at most) from the birth or within the first four
years of life, belonging to the 90 to 110 IQ range. Result
revealed that the (a) training group showed a significantly
greater gain over the 17 months period of the training
programme; (b) the training group showed post-training
scores that were quite similar to those of a sighted control
group in conservation tasks, in classification tasks; and in
formal operation tasks, while the non training visually
impaired group showed significant lags as compared v;ith
both, the training group and the sighted control group;
both, at the outset of the programme and at the end; and on
mental imagery and spatial relation tasks, however, the
training group did not show such impressive gains. Bonafanti
(1977) investigated the verbal and non-verbal traits of
blind adults and the effect of multistep training progranne
on verbal and non-verbal deviancies of blinds. Results
revealed the non-verbal and verbal traits of adventitiously
blinded adults more closely resemble with congenitally blind
on communication pattern after receiving the training

35
programme. The training programme also affects the
performance of congenitally blind in his social setting.
Cima (1983) assessed the effectiveness of four instructional
modalities for bringing about cognitive learning.
The four modalities v/ere (a) a sighted presenter
carried film discussion, (b) lecture demonstration by
sighted presenter, (cj lecture demonstration by a blind
presenter, and (d) laboratory stimulation of blindness.
Findings indicated that all the four modalities proved
equally effective in cognitive learning.

THE PROBLEM

THE PROBLEM
ASSESSMENT AND TESTING:
Assessment refers to the collection of information
v/hich help the individual in taking decisions in the field
of education and psychology. it takes the individual
tov/ards his/her goals, airas or objectives, nodif ications
in teaching behaviours etc. In the field of special needs
education, assessment involves special needs education
teacher, regular education teacher, guidance workers,
counsellors, different types of therapists, psychologists
and so on. In fact, assessment of special needs children
is an ongoing process as these children are somewhat
unique in their educational needs, psychological and non
psychological parameters.
Unfortunately, assessment is sometimes considered
as synonymous of testing. Testing simply includes the
administration of any measuring tool or instrument,
scoring of answer sheets and reporting the scores. But on
the other hand assessment is different from testing in the
sense, that it includes the analysis of information
gathered on the basis of different measuring tools or
instruments. Apart from this, it includes decisions
regarding various characteristics of the individual.
The dictionary meaning of the word 'test' is a
series of questions on the basis of which some information

37
is sought. Beans (1953) has defined the test as "an
organised succession of stimuli designed to measure
quantitatively or to evaluate qualitatively some mental
processes, traits cr characteristics". Singh, A.K. (1986)
opined that psychological test is a standardised procedure
to measure quantitatively or qualitatively one or more
than one aspects of trait by means of a sample of verbal
and nonverbal behaviors. It serves two purposes as it
helps comparing two or more than two persons on one trait
and also one person can be compared on two or more than
two traits. Tuckman (1975) has very rightly observed that
"the modern history of testing for intelligence or mental
ability". Though, it is a different matter that the
problem of meaning of the term intelligence has not been
solved so far. The complex nature of this term has
directly affected the psychologist in its testing.
RATIONALE OF THE STUDY
Intelligence testing of special needs children in
terms of vision sense has been one of the most debated
issues and unfortunately, this debate is for fic m over.
One of the most inportant reason is inapprepriate and
v;rong decision taken on the? basis of intelligence tests.
The problem does not lie in the test itself rather experts
and professionals of the fields are rcjre responsible for
this, in the sense that how they use these test v/ith
special needs children.

38
A perusal of related literature reveals that some of
the important intelligence tests meant for •- sighted
population have been employed as a measuring tool for mental
abilities of special needs children (blind). Such tests are
V7echsler Intelligence Scale for Children (WISC), Harris
Drawing test, The Kaufman Assessment Battery, The McCarthy
Scales of Children's abilities, standford-Binet Intelligence
scale etc. The most unfortunate part of using these test
is that either they have been employed as they are or they
have been adopted with some serious limitations. Thai- is
why, one can't rely on the findings in the field of
intelligence of visually impaired unless the test has been
employed which is meant for visually impaired.
Needless to say thast mental abilities play a key
role in predicting school performance, behaviour in school
surroundings and outside the field of education. In simple
words it affects the whole personality of a visually
impaired child. Unfortunately special needs children (in
terms of vision sense) have not been studied and researched
well in a desired manner. Preciously neglegible efforts have
been made to research this population. In fact the research
in the field of this hapless population is still in
embryonic stage in our country. A very few efforts seem to
have been made to study the visually impaired children which
is quite clear from the following table

39
LEVEL OF RESEARCH (Visually impaired)
A- ency Diploma Master's/M.Phil Ph.D. Misc.
1. Blind Relief 2
2. NABMRC 3
3. Shri Ram Krishna 21(Ed) Mission Vidyalaya
4. M.S. Univ. of 2(Social work) Baroda
5. Patna univ. 1(Ed)
6. Utkal Univ. l(Psy)
7. Meerut Univ. 1{Ed)
8. Madras Univ. 4(Psy)
9. Gujrat Univ. l(Psy)
10. Misc. 5
The table dipicts the poor and gruesome state of
research in this field. Till 1986 only two researches have
been conducted in education at Ph.D. level. Only twenty one
studies in the field of education, two in social work, and
five researches m the field of Psychology at
Master's/M.Phil, level have been reported. Only one study at
diploma level in the field of Psychology has been
conducted. Ten studies have been reported at different levels
* Jangira, N.K. & Mu^hopadyay, s. : Research in special Education : Search for New Directions. Report of National Workshop on Promotion of Research in Special Education, Deptt. of teacher ed., Special ed. and Extension services (NCERT), New Delhi, Jan 8-11, 1986, 14 pp.

40
which is not clear in the table. Out of these 41
researches, only one research has been reported in the
field of construction of an intelligence test by B.R.A.,
New Delhi.
The table above mentioned and review of previous
researches (Chapter I) regarding the tool construction
reveal that there is a dearth of psychological tools for
special needs children in terms of vision sense. A very
few attempts seem to have been made so far to meet the
psychological as well as educational needs of this
popultion. In India the condition is not satisfactory so
far as the construction of intelligence test is concerned,
only three attempts seem to have been made so far. (Test
of Intelligence (1979) by B.R.A.; Vithoba Parnikar
Performance Test for the Blind (1978) by Vithoba Parnikar;
and A Short Scale IQ Measure for the Visually Handicapped
(1986) by T.B. Singh, NIVH, Dehradun).
A number of factors may be responsible for this
poor state of r3search in the field. But in the opinion
of the investigator, lack of awareness toward this hapless
section on the society is the key factor which is
responsible for this state of research. The slogan of
special needs education is that no child should remain

41
uneducated and uncared. Similarly the loudable goal of our
government and the slogan of NPE, 1986 - "Education for All"
and universalization of education can never be acheived
unless all the segments of a society of community are
studied, researched and cared in a desired manner Education
of special needs children in terms of vision is directly
related with their special needs i.e. psychological
(including intelligence level, personality, attitude,
aptitude, desires, anxities etc.) and ncn-psychological
(which nay include their family background , Socio-Sconomic
Status (SES), School Climate, facilities provided, nature of
administration in school surrounding etc.). This population
can not be educated properly unless it is studied in
comprehensive manner. Studying any population is possible
only with the help of measuring tools in different areas.
But unfortunately, as mentioned earlier in this chapter, we
do not have appropriate, suitable and applicable measuring
tools especially in the field of intelligence on the basis of
v/hich we can take right dicision about the intellectual
characteristics of visually impaired.
At present, tools for measuring mental
characteristics, suffer from many limitations. Some of the
investigator have employed the tools meant for sighted

42
population, some have adapted them for this popultion and a
few intelligence tests have been constructed in India, which
also suffer from some serious limitations. This is the
reason, the visually impaired population is described and
interpreted in a wrong manner. In fact, the lack of vision
sense does not mean the low level of mental abilities in
visually impaired. The nost prominent reason of false
findings in this field is the usage of inappropriate tests
and non availability of suitable intelligence tests.
The tests are inappropriate in many terms, for
example, some of the tests have not been standardised on non
sighted population. Tillman (1973) supports this view. Some
of the intelligence tests used for visually impaired
population have doubtful validity as Warren (1976) has very
sightly obseved that the validity of Intelligence scale (mant
for sighted population) is doubtful, when such tests are used
for blind population. In his opinion the usefulness of
standardised test for any population should be determined
with reference to that population. Further, Teare and
Thompson (1982) also assessed the concurrent validity of the
Perkins-Binet Test of Intelligence for the blind, using
Wechsler's Scale. Although, high correlation was observed
between the scores of two tests but substantial differences
were found in standard deviations for two tests scores. Thus,
Teare and Thompson have recommended for further evoluation of

43
Perkins-Binet test which has been used by researchers.
Keeping in view all these problems and difficulties
with Intelligence Tests for visually impaired population,
the investigator has made an attempt to construct an
intelligence test (verbal) for measuring some of the
important aspects of intellectual abilities of visually
impaired children, belonging to the age range of 11-20 and
studying in VI to X grade.
Further, the investigator needed an Intelligence test
meant for visually impaired for her doctoral work in which
Intelligence will play a role of control variable while
comparing the personality factors of visually impaired
students placed in segregated and integrated/inclusive school
climates. Therefore, the investigator felt a necessity of
constructing an Intelligence Test (verbal) which can give
true results.
Intelligence tests are of two categories i.e.
non-verbal/performance test and verbal tests. Non-verbal test
meant for visually impaired have certain limitations like -
difficult to construct,
more tine consuming and expensive,
require highly skilled person for administration and
scoring purposes etc.

44
Therefore, the investigator thought of constructing .only
verbal part of the intelligence test because it has certain
advantages like -
easy to construct,
easy to adminsiter,
easy to score,
less time consuming, and
more economical and feasible.
The present investigation is an humble attempt in this
field.
DEFINITIONS OF THE TERMS USED IN THE STUDY INTELLIGENCE :
The meaning of intelligence have been discussed
briefly in chapter-I. Though, it is a very old concept, but
still psychologists do not have the similar views abcut the
meaning of this term. According to the "Penguin Dictionary
of Psychology revised by Harvey V7all- erstein in 1981,
Intelligence has been defined like- "The relating activity
of mind; insight as understood by the Gestalt psycholcgists;
in its lowest terms intelligence is present where the
individual, animal, or human being is aware, however, dimly,
of the relevence of his behaviour to an objective; many
definitions of what is really indefinable have been
attempted by psychologists, of which the least unsatisfactory
are : (1) The capacity to meet novel situations, or to learn
to do so, by new adaptive responses, and (2) the ability to

45
perform tests or tasks, involving the grasping of
relationships, the degree of intelligence being
proportional to the complexity, or the abstractness, or
both the relationships'*.
INTELLIGENCE TEST :
The dictionary meaning of this term is task or
problem of some kind, as an item in a scale or alone, by
means of which an individual's stage mental development can
be estimated or measured.
VISUALLY IMPAIRED :
Visual impairement can be defined in different ways
like congenital visual impairement, adventitious visual
impairement, partial visual impairment, and total visual
impairement. In the present investigation, visually
impaired children are those whose vision is impaired to
such an extent that they depend on tactile or embossed or
raised material for reading and writing purposes. Though
they may have some residual vision but that vision is not
for functional purposes. In other words, it can be said
that these children are educationally blind and thev use
braille script and others materials for meeting the needs
of their education.

46
OBJECTIVES OF THE STUDY :
1, To construct a verbal intelligence test for Hindi
speaking special needs children in terms of vision sense,
belonging to age range of 11 to 20 yrs. and studying in
VI to X standard.
2, To prepare age, grade and standard score norms.
3, To make a classification of intelligence scores.
DELIMITATIONSOF THE STUDY :
The present study suffers from certain delimitations
such as -
1. A large sample could not be taken due to paucity of time.
Therefore, data from other regions of the state could
not be collected.
2. The test can be applied only on Urban, Hindi speaking
visually impaired children belonging to 11 to 20 yrs. of
age range and studying in VI to X grade.
3. The test is able to measure only the verbal part of
intelligence of the population under study.
4. More analysis of data could have been done but because of
paucity of time and limited resources it was not possible
to do so.
5. Some more aspects of intelligence could also have been
included like divergent thinking ability and others. But
because of limited tine it could not be done.
6. The norms could not be developed on a larger sample as it
was not feasible at M.Phil, level of study.

RESEARCH DESIGN

RESEARCH DESIGN
The test construction is an art. Before starting this task,
certain steps are to be followed by the investigator. These
steps have far reaching consequences. The test constructor
has to decide about the following points.
1. Planning of the test
2. Item writing
3. Preliminary tryout (Experimental try-out)
4. Item analysis
5. Final try out
6. preparation of norms
PLANNING OF THE TEST :
Test planning includes the steps of deciding about
the objectives of the test followed by the nature of items,
types of instructions, size of the sample and experimental
try out respetively.
The investigator has been quite careful in following all the
steps included in the planning of a test. After reviewing
the relevant literature and thorough study of available
intelligence tests, it was found tht tasks involving
vocabulary, Classification, Analogies, best-answer. Number
series and resoning are the key aspects of intelligence.
All the items had multiple choice type answer and number of
items in each subtest was also decided at this stage.

48
ITEM WRITING :
Item writing needs creative potentiality of the test
constructor. In fact, it is an art. The test constructor is
not bound to follow certain rules and regulations while
writing items, rather much depends on the nature of the
test, investigator's imagination, insight and experiences
etc. But it is necessary that the test constructor should
have the knowledge of the subject matter and population for
which the test is being constructed. Moreover, he/she should
have the knowledge of the advantages and disadvantages of
different types of items. Apart from this,, constructor should
have command on language.
The investigator has been very careful about the art
of writting items and has tried to vnrite items accordingly.
One hundred ten items were selected for six aspects of
intelligence including Vocabulary, Classification,
Analogies, best answer. Number series, and Reasoning. After
writing down all the items, they were combined in the form
of booklet. The duplicate copies of booklet were
distributed among experts of the field including supervisor
for scrutiny or review of the items. The investigator
herself studies all those items for experimental tryout.
EXPERIMENTAL TRYOUT :
Experimental or preliminary tryout leads the
constructor to know about the ambiguity, weakness, omissions

49
and inadequacies of items. It further leads the test
constructor to determine the difficulty level and
discrimination power of each item, to determine the time
limit to be given to the examinees, to determine the
length of the test, to calculate intercorrelations of the
items and finally to know about the vagueness of
instructions of the test.
After review of all the items by a pannel of experts and the
investigator herself, certain number of items in different
subtests were selected for experimental tryout. The details
of the subtests and number of items in each subtest are
presented in the following table -
Table 4.1
S.No. Subtests No. of items
1.
2.
3.
4.
5.
6.
Total 97
Vocabulary
Classification
Analogies
Best answer
Number series
Reasoning
20
15
15
15
20
12

50
SAMPLE OF EXPERIMENTAL TRYOUT :
It is in empirical research, a large sample gives more
reliable results. In the case of visually impaired population
it was not possible to take a large sample like 400-500
subjects. The main reason of this is that the population
under study is in minority (though it is a good sign and one
should not hope for a large number of visually impaired
population). Another reason is that this population is in a
scattered form. Due to these reasons quite a large sample
could not be taken for preliminary tryout. The selected items
administered on 110 special needs children in terms of
vision.
ADMINISTRATION PROCEDDRE :
The mode of administration of the test in the present
investigation is interview technique has been found more easy,
convenient and suitable to the visually impaired by the
investigator. Conversion of a large no. of items into braille
script is not an easy task rather it is a very time and labour
consuming and thus not feasible. It was found very difficult
by the visually impaired children to read a large number of
items written in braille and answer them. Moreover, speed of
reading and writing in braille differs from individual to
individual vi/hich affects the average time taken by each
examinee to complete the test. Keeping all those problem in
view the investigator preferred to use interview technique.

51
Parker (1969) has remarked that braille version can not be
used in tests because all blind children are not equally
proficient in braille.
First of all the instructions were read out before the
subjects. They were explained v;hat and how they have tc do the
task. The subjects were explained that they should complete
the task in a minimum time limit. The examples of all the
subjects were also made clear in order to make them understand
that what they have to do. The test was administered on a
group of ten subjects at a time. Each subject was provided
with a braille paper (having the item numbers only) alongwith
a slate and stylus for noting down the answer of each item.
Then the investigator read out each item before the students.
Each item was read out second time also after a little gap of
time (5 second) to make the examinees the item more clear.
After listening each item carefully, the examinees/subjects
noted down the answers on the answer sheets according to mode
of answering explained earlier.
The investigator was careful about the time taken by
the subject for completing the test and it was found that on
an average the subejects took one minute and fifteen seconds
for each item. The answers written in braille were explained
by braille reader to the investigator for scoring purpose.
Since, all the items were of multiple choice type, it was easy

52
to score them. For a right ansv/er score of one and for a wrong
answer score of zero was av/arded. Thus a higher score means
higher intelligence.
ITEM ANALYSIS :
Item analysis means to know whether an item is good or
bad. It is a technique which helps the test constructor in
knowing that which items are to be rejected or removed. In
other words, analysis of each item gives the indices of the
validity or real power of discrimination of any item. Item are
analysed so that more appropriate, suitable, purposeful, valid
and discriminating items can be included to get the reliable
results from the test. It enables the test constructor to know
the difficulty level of each item i.e. whether the item is
too easy or too difficult or moderately difficult. Moreover,
it tells about the discrimination power of the item i.e.
whether the item is able to differentiate between superiors
and inferiors. After analysing all the items, the reliability
and validity indices of finally selected items were also
determined. The details of item analysis are presented in the
next chapter.
FIttAL TRYOUT AND PREPARATION OF ttORMS :
Finally selected items were again administered on the
sample following the interview technique. The details of the
sample are given in the following table -

53
Table 4.2
S.No.
1.
2.
3.
Name of Institution
Rajkiya Andha Vidyalaya, Lucknow
Ajrananand Andha Vidyalaya, Haridv/ar
National Institute of Handicapped, Dehradun
Sex
Boys
20
22
38
Girls
-
-
11
Total No. j of Subjects'
1
20
22
49
Total 91
The main purpose of the final tryout was to prepare
the norms. Norms are prepared for meaningful inferences and
interpretation of the scores obtained on the test. In the
present study, the investigator is aware of the importance and
utility of norms. Therefore, age, grade and standard score
norms have been prepared to make the intelligence test more
appropriate, purposeful and meaningful.

ITEM ANALYSIS

ITEM ANALYSI
Item analysis includes item difficulty value and item
discrimination index. After the administration of the test,
scoriny \/as done. Subjects were awarded a score of one for
the right ansv;er and a score of zero for the wrong ansv/er or
omitted item. Total -score obtained by an individual indicates
his/her intelligence score. All the scores of the examinees
were arranged in descending order. The \/hole sample was
devided into three groups i.e. high ability, low ability and
average ability groups. The high ability and lov/ ability
group belonged to the top and the bottom 27% cases
respectively and average ability group belonged to the middle
46% cases of the whole sample. The sample of the first try
out (experimental) consisted of 110 subjects, out of which
30 subjects were included in each extreme group respectively
and remaining 50 subjects were designated as average ability
group. After that, each item was analysed in terms of
frequency responses, difficulty value and discrimination
power.
It is worth mentioning here that after the scoring,
in some of the tests, scores of examinees need to be
corrected in order to remove the contribution of guessing
tendency. The investigator did not need to correct the
scores because of the following two reasons.

55
1. In the present test, all the items are of multiple
choice type having four resonse categories in each
item. The guessing tendency in such responses is
automatically minimised.
2. Secondly, after using the correction formula there
will be no change in the ranks of the examinees, v/hich
is clear by the following formula.
W K ^ N S = R - _ or S = ( _i)R - K-1
K-1
Where, S = corrected scores,
R = no. of correct responses,
W'*= no. of incorrect respones,
K = no. of choices used in the item,
and N = no. of subjects in the sample
FREQUENCY OF RESPONSES :
Frequencies of different responses choosen by the
examinees of all the three groups were counted, in order to
know the effectiveness of all the distractors and also to
know the number of subjects in all the three groups who
answered correctly. The frequencies of responses cf item 2
is being given below to make it more clear.

56
Category of Alternative responses O Group
A B C D
High Ability
Low Ability
Average
Total
2
5
4
11
1
3
5
9
28
13
34
75
—
5
8
13
In above example, the response categories of A, B, D
are distractor, while the C category is the correct answer
and 0 stands for omitted items.
DIFFICULTY VALUES :
After analysing each item in terms of frequencies of
responses, the second step of item analysis is to determine
the difficulty value of each item. Difficulty value indicates
the percentage of examinees who have selected right responses
among all the proposed alternatives. For example, if 85%
examinees respond correctly for an item, it means it is too
easy because a large no. of examinees are able to solve it
correctly. Cn the other hand if only 10% examinees
respond correctly for an item, this indicates that the item
is too difficult to solve, as only 10 out of 100 subjects are
able to solve rhat item. Both types should not be considered
good as they have no dif erentiating significance. While
selecting the items for final format of the test . The

57
investigator was aware of the normality of the distribution
of difficulty values of itens. There are some important
methods for calculating the difficulty values of itens.
In one method difficulty value is calculated with the
help of total no. of correct responses in the whole sample
for a particular item. The follov/ing formula is applied to
serve the purpose.
R P = N
Where, P= difficulty value of the item,
R= no. of examinees who answered correctly,
and N= total no. of examinees in the sample. V
According to this formula difficulty value of the item no. 2
\/ill be
75 o — — .68 P - 110
Another formula for calculating difficulty value of item is
based on the number of correct responses given by two extreme
groups i.e. 27% from top and 27% from bottom. The formula is
being given below.
\ •" ^1
Where, R^ = no. of examinees of upper group who answered correctly.

58
RT = No. of examinees of lower group who answered correctly,
N = total no. of examinees in upper croup,
and Ml = total no. of examinees in lower croup.
It is clear that no. of examinees in both the group is equal
i.e. N = N,. u 1
The above formula can be written like this -
^u - ^1
P = iT^— ° R + R. u
Nu
OR
. Pu - Pi P = ^
The difficulty value of item 2 will be like this -
28
Pu = 30 .93
Pi 30
.93 + .43 p = = .68 ^ 2
By both the methods the same value of difficulty index has
been found. The second method seems to be more easy,
therefore, the invetigator has applied the second formula for
estimating difficulty value of each item of the test.

59
DISCRIMINATION INDEX :
Discrimination index of an item indicates whether the
item is able to distinguish betv/een superiors and inferiors.
According to Marshall and Hales (1972), "The discriminatory
power or validity (V) of the item may be defined as the
extent to whicn success and failure on that item indicates
possession of the trait or achievement being measured".
Mainly there are two methods of determining. The
discrimination index of an item.
In correlational techniques, each iten is validated
against the internal criterion of the total score (Singh,
A.K., 1986). Some of the experts consider this technique as
the best technique for determining descrinination index.
Different techniques of relationship like Pearson Product
Moment coefficient of correlation, tetrachoric - r, phi
coefficient biserial - r, point - biserial - r may be
employed to serve the purpose.
Another important method for estimating the
discrimination power of an item is a test of significance of
difference between two percentages. On the basis of the total
scores all the examinees are devided into twc equal groups,
then the significance of difference between two percentages
is calculated. But Kelly (1939) is of the view that v/hen the

60
extreme group consisted of 27% from bottom and 27% from top
in a normal distribution, the ratio of difference betv/een the
means of two groups over the standard error of the difference
between these two means (the critical ratio) is at maximum.
Cureton (1957), in his article "the upper and lower 27% rule'
has mentioned Kelly's recommendation for item analysis that N
should be 370 so that in upper 27% and lower 27% will be
100, 100 examinees respectively. When the distribution is
normal,the optimum percentage of extreme group is slightly
higher than 27% and reaches approximately 33%. This
calulation procedure has been liked by many stati cians and
it is used for determining difficulty value of an item.
Chi square test is also used to serve the purpose of
determining the discrimination power of an item. Guildford
(1954) has given the reduced formula of chi square like -
2 N(p^-p^)2
4pq
Where, N = no.of total examinees,
p = proportion of examinees passing in upper group,
p-] = proportion of examinees passing in lower group,
q = proportion of incorrect responses i.e. (1-p),
and p = arithmatic mean of p^ and p-|.
But this method suffers from some limitations like, it can be
used ony on larger samples and with items falling in the
middle range of attractiveness for the examinees. Apart from

61
this, one can know only whether the item is discriminting and
it gives no idea that in what amount the item is able to
discriminate between superior and inferior.
Further, Marshell and Hales (1972) have presented a
simplified and easier formula for calculating the
discrimination power of an item which is called as "Net D
index of discrimination". They have defined Net D as "an
unbiased index" of absolute difference in the number of
discriminations made between the upper group and lower group
-it is proportional to the net discriminations made by the
item between the two groups". This formula is also based on
two extreme group of examinees in which difference between
percentage of right responses of both the groups is found
out. The formula is like this -
V = Nu Nl
OR
V = Pu - Pi
Where, V = Net D.
In the present investigation the invetigator has
adopted the abaove method for determining the
discrimination index of each item because of certain
advantages. It is easy to calculate as the investigator

62
already is having the values of p and p, and it is less
time and labour consuming process also.
The investigator is quite aware about the values of
discrimination power. Its negative value of an item indicates
that item is not includable in the final format of the test
because it has no real power to differentiate between
superiors and inferiors due to some defects and items having
poor discrimination power are also to be excluded from the
final test. The items falling in the range of the
discrimination value of .30 to .85 have been included in the
final test.
CRITERIA OF SELECTION OF ITEMS FOR THE FINAL FORMAT OF THE
TEST :
All the previous calculations i.e. scoring, frequency
of responses, difficulty value and discrimination power of
each item led the investigator to decide that which item
should be included or excluded while preparing the final
format of the test. The vlaues of difficulty and
discrimination index of each item selected for the final test
have been presented in table 5.2. The investigator was
careful that distractors of an item should also have almost
equal attracting power, so that chances of guessing could be
minimised. After this the item which were falling in the
range of .25 to .75 of difficulty values and in the range of

63
S.No.
1.
2.
3.
4 .
5.
6.
7.
8.
9.
10.
11.
12.
13.
14.
15.
16.
17.
18.
Subtest
V
0
C
A
B
U
L
A
RY
C L A S S I F I
CATION
A N A L 0 G I E S
Pu
.63
.87
.97
.33
.87
.87
.93
.87
.66
.93
.87
.67
.93
. 63
.70
.73
.E7
.80
Pi
.20
.27
.30
.43
.30
.20
.27
.57
.33
.43
.23
.23
.40
.27
.37
.20
.23
.23
1
P
.42
.57
.64
.63
.59
.54
.60
.72
.50
.68
.55
.45
.67
.45
.54
.47
. 55
.50
Table
D
.43
.60
.67
.40
.52
.67
.66
.30
.33
.50
.64
.44
.53
.36
.33
.53
.64
.57
; 5.2
S.No.
19.
20.
21.
22.
23.
24.
25.
26.
27.
28.
29.
30.
31.
32.
33.
34.
35.
36.
Subtest
B E
S T A N S W E R
N U M B E R
SERIES
R E S O N I N G
Pu
.77
.83
.80
.63
.73
.77
.80
.73
.63
.63
.67
.60
.80
.47
.60
.47
.80
.57
Pi
.23
.43
.27
.27
.27
.20
.17
.13
.23
.07
.20
.13
.23
.13
.17
.03
.13
.23
p = 18
D = 17
P
.50
.63
.54
.45
.50
.49
.49
.43
.43
.35
.44
.37
.52
.30
.39
.25
.47
.40
:.04
.95
D
.54
.40
.53
.36
.46
.57
.63
.40
,40
.56
.47
.47
.57
.34
.43
.44
.67
.34

64
.30 to .85 of discrimination values were considered as
includable items. Therefore, such items were selected for the
final test of intelligence, keeping in mind the normality of
the distribution of difficulty values of selected items. This
also helped the investigator remove surplus items v/hich could
also be included since they were found also suitable. But
those items might have created the problem of making the test
too easy for more intelligent children and too difficult for
less intelligent children. The distribution and its
statistics are presented in table 5.2 and 5.3 respectively.
Class interval
.7 -
.65 -
.60 -
.55 -
.50 -
.45 -
.40 -
.35 -
.30 -
.25 -
- .76
• .69
- .64
- .59
- .54
- .49
• .44
- .39
• .29
• .29
Table 5. .3
Frequency
1
2
4
4
8
7
5
2
1
1
Cumulative
36
35
33
29
25
17
10
5
3
1

€6-
DISTRIBUTION OF DIFFICULTY VALUES OF SELECTED ITEMS
•245 -296 -395 -445 '495 -545 -595 -545 -695 -745 -795 DIFFICULTY VAUUES OF ITEMS
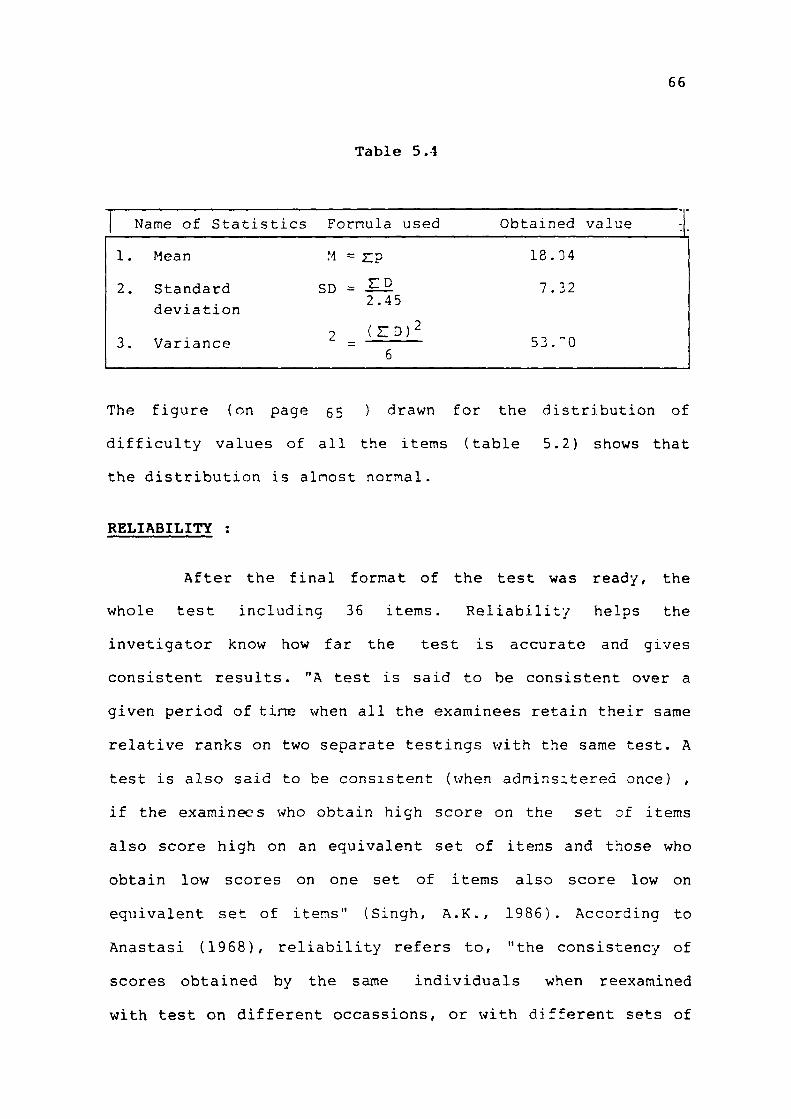
66
Table 5.4
Name of Statistics Fornula used Obtained value
1. Mean M = z? 18.3 4
2. Standard SD = ^-£ 7.32 2.45 deviation
Variance (Z:D)2
The figure (on page 55 ) drawn for the distribution of
difficulty values of all the items (table 5.2) shows that
the distribution is almost normal.
RELIABILITY :
After the final format of the test was ready, the
whole test including 36 items. Reliability helps the
invetigator know how far the test is accurate and gives
consistent results. "A test is said to be consistent over a
given period of tine v/hen all the examinees retain their same
relative ranks on two separate testings v/ith the same test. A
test is also said to be consistent (when adminsitered once) ,
if the examinees who obtain high score on the set of items
also score high on an equivalent set of items and those who
obtain low scores on one set of items also score low on
equivalent set of items" (Singh, A.K., 1986). According to
Anastasi (1968), reliability refers to, "the consistency of
scores obtained by the same individuals when reexamined
with test on different occassions, or with different sets of

67
equivalent items, or under other variable examining
conditions". In simple words, if the same test or t\;o similar
tests are given to a set of examinees and if they obtain the
same scores or ranks on that tests , the test is considered
as reliable. Different methods are employed for determining
the reliability coefficients. Commonly used methods are test
retest method, split half method, Kuder Richardson method and
others. In the present investigation the investigator could
not use test retest method for estimating reliability as it
is more time consuming method. The requirement of this method
is that the examinees physical and psychological state
should remain unchanged when the examinees reappear in the
same test. But practically it is never possible. Some
invironmental factors affect the performance of the examinees
definitely.
In split half method the test is devided into two
equal or almost equal sets. This method was not found
applicable in the present investigation as applicability of
this method in a speed test like the present one is
absolutely doubtful.
The investigator has used Kuder Richardson formula
for establishing reliability coefficient of the present test.
Kuder-Richardson (1937) tried to improve the limitations of
split half method of reliability and developed a new formula

68
for estimating the reliability coefficient of a test. The
formula is called as K -R 20, v/hich is well known and -./idel/
used. There are some assumptions of K-R 20 formula such as
(i) correct and incorrect answers should be given the score
of one and zero respectively, (ii) high inter-item
correlations in the test should be there, and (iii) range of
difficulty values of items should not be too large. The
investigator preferred to use this formula because all the
above mentioned requirements are fulfilled by the present
study. Moreover, calculation procedure of this formula
requires the values of p and D, the invetigator had already
calculated these values before selecting the items for final
test . The formula K-R 20 is as follows -
2 <^t" - E p q
( ^ ) ( •tt ^ n - 1 ' ' o
.)
where, r ^ = reliability coefficient of the test,
n = total no. of items in the test,
__2 cr = variance of scores on the test,
p = proportion of correct answers to each item
and, q = proportion of incorrect answers to each item.
The calcualted values to be used in the formula have
presented in the table 5.4 and 5.5.

T a b l e 5 .5
69
S.No. pq S.No. pq
1.
2.
3.
4.
5.
6.
7.
8.
9.
10.
11.
12.
13.
14.
15.
16.
17.
18.
.42
.57
.64
.63
.59
.54
.60
.72
.50
.68
.55
.45
.67
.45
.54
.47
.55
.52
.58
.43
.36
.37
.41
.46
.40
.28
.50
.32
.45
.55
.33
.55
.46
.53
.45
.48
.2436
.2451
.2304
.2331
.2419
.2484
.2400
.2016
.2500
.2176
.2475
.2475
.2211
.2475
.2484
.2491
.2475
.2496
19.
20.
21.
22.
23.
24.
25.
26.
27.
28.
29.
30.
31.
32.
33.
34.
35.
36.
.50
.63
.54
.45
.50
.49
.49
.43
.43
.35
.44
.37
.52
.30
.39
.25
.47
.40
.50
.37
.46
.55
.50
.51
.51
.57
.57
.65
.56
.63
.48
.70
.61
.75
.53
.60
pq =
.2500
.2331
.2484
.2475
.2500
.2499
.2499
.2451
.2451
.2275
.2464
.2331
.2496
.2100
.2373
.1875
.2491
.2400
8.6094

70
36 5 3 . 7 0 - 8 . 6 0 9 4 i^ t t ~ ^ 6 - 1 ) ( 5 3 . 7 0 '
^ t t ^ . 3 6 3 6 o r . 8 6
The reliability coefficient of .86 indicates high internal
consistency in scores and the test can be used for individual
diagnosis.
VALIDITY INDEX ;
A test or measuring instrument can not be used only
on the basis of high reliability value rather it should be
valid also. Validity means the test should serve the purpose
for which it has been constructed. Lindquist (1951) has
defined the term validity as "the accuracy with which it
measures that which is intended to measure or as the degree
to which it approaches infallibility in measuring what it
purports to measure". It means the test should measure the
same trait or characteristic for which it has been
constructed. For example, an achievement test in history
should measure only the knowledge of history subject,
knowledge related to other subjects or language should have
no place in that test. Thst is why, generalisation are made
only when the trait is measured through valid test. There are
many methods of establishing validity. Some commonly used
methods are predictive validity, concurrent validity, content
validity etc. At this stage (v;hen only first tryout has been

71
done) the investigator was not in a position to detemine the
predictive validity of the test because, she had to '..-ait for
one year to get the school achievement scores (Annual
Examination Marks) of all the examinees under study.
Similarly concurrent validity could not be determined
as no parallel test of intelligence for visually impaired is
available at present. Therefore , in such situations, the
investigator was bound to determine the content validity of
the test. Content validity measures the relevance of the
content or items included in the test. Each item of the test
is supposed to measure the same trait for which it has been
constructed. Anastasi (1968) remarked that content validity,
"involves essentially the systematic examination of the test
content to determine whether it covers a representative
sample of the behaviour domain to be measured".
In the present investigator the booklets including 36
items of six subtests were distributed among the experts of
the field for their judgement on content. The experts ludged
all the items of the test to decide whether items really
measures the intelligence. Here, the experts were also made
aware of the fact that the test is meant for visually
impaired. Therefore, any item based on visual experience
should not be included. After judging items thoroughly the
experts submitted their views individually , which helped the

72
investigator in establishing the content validity.
Fortunately, no item was removed fron the final
test. The main reason of this may be that itens included in
the final ,try out nad already been shown to a pannel of
experts. Therefore, at this stage, no item was found in
appropriate and the test was found highly valid for visually
impaired, Urban, Hidni speaking students belonging to age
range of 11-20 yrs. and studying in VI to X grades.

DEVELOPMENT OF NORMS, ANALYSIS AND INTERPRETATION
OF DATA

DEVELOPMENT OF NORMS, ANALYSIS AND INTERPRETATION
OF DATA
After item analysis, the final test was ready
including 36 items of six subtest, i.e. vocabulary,
Classification, Analogies, Best ans\/er. Number series and
Resoning. Nov/ the question before the investigator v/as the
developement of norms to make the test more meaningful,
purposeful and useful. For this purpose the final test was
once again adminsitered on 91 visually impaired students of
the same age range and grade. The investigator v/as quite
aware of the time taken by each subjects in completing the
test. The time taken by each subject was noted down, it was
found that average time taken by each student was one minute
fifteen seconr's for each item. Thus, for answering all the
36 items the average time limit was 45 minutes. Thus it was
decided that visually impaired children will be given only 45
minutes to complete test. After the administration was over,
the test for each subject was scored individually. No\/ these
test were used for the preparation of norms and estimation of
Reliability a validity.
DEVELOPMENT OF NORMS
One of the characteristics of a good test is norms.
Norm refer to the average scores or performance of
representative sample of a given test. They help the
researcher in interpreting the score meaningfully and

74
purposefully. The raw score obtained by an individual on any
test can't say anything about the trait which is being
measured by a test- In other v;ords, the scores do not give a
clear picture of any trait or characteristics unless that
trait is explained on the basis of norms. Thus, the purpose
of developing norm is to make the test more meaningful,
purposeful, useful and interpretable.
There are different types of norms like age norms,
grade norms, percentile norms and standard score norms. Age
norm means the average score of the representative sample of
a particular age level on the measure of many characteristics
of trait. Age norms are developed especially for cognitive
and physical ability which increase with the increase in
age. For example, we can't compare the intelligence level of
five to seven years old children with the intelligence level
of thirteen to fifteen years old children because younger
children have lesser intelligence than the elder one.
Grade norms mean the average score or performance of
the representative sample of a certain grade or standard.
They tell us about the average score of the students
belonging of any particular grade or standard.
Percentile norms indicate the average point below
which certain percentage of cases lies.
Standard score norms as the name indicates.are based
on standard scores with a fixed mean and standard deviation.

/ D
25 J
FIQVRE - 6-1
AGE NORMS
N!20 A N
S
I80«
1550
10
I5i4
ao-7a
i 21-25
^ I
J.
e
I I ^ i
"^2 I3i4 15-16 I74» AGE 6R0UPS(YEAftS)
19-20

76
Many types of standard scors are there, such as Z or sigma
score, T score, stanine scores etc. In the present
invetigation normalized standard scores or T scores have
been calculated to knov/ the level of intelligence of children
i.e. whether a child in average intelligent or below or above
averge intelligent.
AGE NORMS :
For developing age norms, the whole sample was
divided into five groups. Each group consisted of two years
of age like 11-12, 13-14, 15-16, 17-18 and 19-20 years.
Means and standard deviation were calculated seperately for
all the five groups. Which are shown in the table 6.1. The
table dipicts that for all the five age groups, the mean
scores are 13.14, 15.50, 18.00, 20.72 and 21.25 respectively,
which indicate that with the increase of age intelligence
also increases. The relationship between age and intelligence
is by figure 6.1.
GRADE NORMS :
For preparing grade norms, the whole sample was
categorised into five categories according to the grade of
students, i.e. VI, VII, VIII, IX and X. The basic statistics
i.e. Means and Standard deviations were calculated for all
the five groups separately to serve the purpose. The average

77
Table 6.1
Age Wise Groups
11-12 13-14 15-16 17-18 19-20 Total
Subtest N=22 N=18 N=17 N=18 M=16 N=91
M 2.95 M 3.2 2 M 3.5 3 M 3.7 2 M 4.19 M 3.48 Vocabulary
SD 1.40 SD 1.36 SD 1.46 SD 1.28 SD 1.23 SD 1.42
M 2.86 M 3.22 H 3.65 M 3.89 M 4.00 fl 3.47 Classification SD 1.46 SD 1.27 SD 1.08 SD 1.24 SD 1.00 SD 1.32
M 2.41 M 3.17 M 3.12 M 3.72 M 3.81 M 3.22
SD 1.23 SD 1.38 SD 1.28 SD 1.28 SD 1.38 SD 1.38
M 2.55 M 2.72 M 3.18 M 3.44 M 3.81 M 3.11
SD 1.30 SD .89 SD 1.25 SD 1.30 SD 1.37 SD 1.31
M 1.23 M 1.67 M 2.41 M 2.89 ri 2.69 M 2.30 Number
Series g^ x_20 SD 1.25 SD 1.24 SD 1.29 SD 1.68 SD 1.59
A n a l o g i e s
Bes t Ansv>7er
Reson ing M 1 .18 H 1 . 5 0 M 2 . 1 2 M 3 . 0 0 M 3 . 0 6 M 2 . 1 1
SD 1 . 1 5 SD 0 . 6 9 SD 1 . 3 2 Sd 1 .67 SD 1 . 7 5 SD 1.56
T o t a l M 1 3 . 1 4 5 1 5 . 5 C M 1 8 . 0 0 M 2 0 . 7 2 M 2 1 . 2 5 M 1 7 . 6 7
SD 5 . 9 5 SD 5 . 4 6 SD 6 . 2 1 SD 6 . 7 8 SD 6 . 6 7 SD 7 . 1 5

78
Table 6.2
Grade Wise Groups
Subtest
VI VII VIII IX X TOTAL
N=21 N=19 N=18 N=18 N=15 N=19
M 2.62 M 3.05 M 3.38 M 4.16 M 4.40 M 3.48 Vocabulary
SD 1.21 SD 1.15 SD 1.38 SD 1.26 SD 1.08 SD 1.42
M 2.67 M 2.89 M 3.78 M 4.05 M 4.27 M 3.47 Classification SD 1.36 SD 1.07 SD 1.08 SD 1.31 SD 0.78 SD 1.32
M 2.24 M 2.58 M 3.50 M 4.00 M 4.00 M 3.22
SD 0.92 SD 1.18 SD 1.42 SD 1.10 SD 1.32 SD 1.38
M 2.3 3 M 2.79 M 2.83 M 3.89 M 3.93 M 3.11
SD 1.17 SD 0.89 SD 1.12 SD 1.15 SD 1.44 SD 1.31
M 1.24 M 1.53 M 2.11 M 3.28 M 4.00 M 2.30 Number
Series gD 1.27 SD 0.94 SD 1.12 SD 1.04 SD 1.62 SD 1.59
Analogies
Best Answer
Resoning
Total
M 1.24 H 1.26 M 1.94 M 2.94 M 3.60 M 2.11
SD 1.19 SD 0.55 SD 1.02 SD 1.54 SD 1.78 SD 1.56
M 12.33 M 13.95 M 17.61 M 22.33 M 24.33 M 17.67
SD 5.36 3D 3.53 SD 5.83 SD 6.05 SD 6.48 SD 7.15

80
score of all these five groups were obtained 12.33, 12.95,
17.61, 22.33 and 24.33 respectively. The details of the
statistics are presented in the table 6.2.
The figure 6.2 drawn on the basis of the nean
scores shows that the intelligence is increasing v/ith
increase in grades of students.
STANDARD SCORE NORMS :
For the preparation of standard score ncrms,
students' raw scores were covered into T-scores for all the
five age groups, with the help of their respective Means and
SDs. Since, T-scores are based on Z scores, therefore, first
raw scores of subjects on intelligence test were converted
into Z scores with the help of the following formu'la-
X - M Z =
Where, X = Raw score,
M = Mean of the distribution,
and CJ~ = Standard deviation of the distribution.
Now these Z scores v ere converted into T scores with the help
of following formula.
T = Z(10) + 50
The T scores are presented in the table 6.3. The table dipits
that mean scores for the age range of 11-12, 13-14, 15-16,

81
RAW
SCORES
32
31
30
29
28
27
26
25
24
23
22
21
20
19
18
17
16
15
14
13
12
11
10
9
8
7
6
11-12
.
-
-
-
74.97
-
-
-
68.25
66.57
-
-
-
-
-
-
-
53.13
-
49.76
48.08
46.40
-
43.04
41.36
-
38.00
Tabl. e 6.3
T - SCORES
13-14
—
-
-
-
-
71.06
-
-
65.57
63.70
-
-
-
-
-
52.75
50.92
49.08
-
-
-
41.76
39.93
38.10
-
-
-
AGE WISE
15-16
-
69.32
-
-
64.49
62.88
-
59.66
-
56.44
-
-
51.61
15.00
48.39
-
-
-
-
-
-
37.12
35.51
33.90
-
-
GROUPS
17-18
66.64
65-16
63.69
62.21
-
-
-
-
54.84
-
-
50.41
48.94
47.46
45.99
-
-
-
-
-
-
-
34.19
32.72
-
-
-
15-20
66.12
64.62
63.12
61.62
6C.12
-
-
-
-
-
51.12
4 5.63
48.13
-
45.13
42.63
-
-
-
-
-
-
33.13
3C .13
-
-
-

82
17-18 and 19-20 yrs. are 13, 15, 18, 21 and 21 respectively.
It corroborates the view that intelligence increases v/ith
the increase in age. This increase is nore rapid in snail
children in comparision to older children. The table also
makes clear that in the sample, 63.73% cases are average,
12.09% cases are below average, and 24.18% cases are above
average intelligent. It is by chance that cor.paratively a
large no. of more intelligent children are there in the
sample of the study. The gaps in the columns indicate that
these scores were not obtained by any one in that particular
age group. In the opinion of the investigator, this may be
due to the small size of the sample. The classification of
intelligence on the basis of T-scores is given below.
Table 6.4
CLASSIFICATION OF INTELLIGENCE
T-Scores Classificatiion
80 - and above Very Superior
70 - 79 Superior
6 0 - 6 9 Above Average
40 - 59 Average
30 - 39 Below Average
20 - 29 Inferior
19 and below Very Inferior
RELIABILITY OF THE TEST:
To know the reliability coefficient of the test
(after developing norms), the formula K-R 21 was employed.

83
Earlier K-R 20 was used to assess the internal consistency
of the selected items. The value of reliability coefficient
was found as .86, which is very satisfactory, showing that
if a group of examinees appear in the test twice or in
another test similar to the present one, they will get the
same scores or ranks. K-R 21 has been applied to know the
reliability coefficient in the final test. This formula is a
modified form of K-R 20. The basic requirement of this
formula is same as for K-R 20. Basic statistics calculated
for the whole sample is Mean = 17.67, Standard Deviaion =
7.15 and Variance = 51.12. The fornula K-R 20 is given
below.
nO~t^ - M(n-M+.) •tt = 1-
2 <rt (n-l)
where r^^ = reliability coefficient of the test,
n = number of items in the test,
2 <f- = variance of scores on the test.
and M. = Mean of total score.
36(7.15)2- 17.67(36-17.67) rtt =
(7.15)2 (36-1)
= .8476 or .85
The reliability coefficient by the formula has been found
.85, which is very satisfactory. Earlier the reliability

84
coefficient by K-R 20 was found .86 both the values differ
from each other but, this is a very slight and neglegible
difference.
VALIDITY OF THE TEST :
Earlier the investigator has determined the content
validity of the test which was satisfactory. Further, the
predictive validity and intercorrelation matrix among
subtest were also calculated.
For predictive validity, correlation between a test
and a criterion which is available in future is found out.
In this method, after administering the test, a gap of time
is given for a criterion test. The criterion test is scored
and the correlation between test and criterion test score is
established. In the present study the invetigator has
considered the annual examination marks of examinees as
criterion test scores. The Peason Product Moment Correlation
Coefficient (r) has been calculated to know the relationship
between the test scores and criterion test scores. The
formula is
r =
J [NJX^ - (£X)2] [NlY -(lY)2]
where, N = No. of subjects,
X = Scores of X variable (school achievement)

85
Y = Scores of Y variable (Intelligence)
91(87785) - 4595 x 1609 r =
J [91 X 245234 - (4595)^][91 x 33181-(1609)^]
= .8239 or .82
The value of coefficient of correlation is satisfactory high
and positive. It is significant at .01 level of confidence.
This indicates that the tet has the power of predicting the
total academic achievement of visually impaired students of
grades VI to X. This increases the usability of the test in
the sence that it can be applied for prognosis purpose also.
Intercorrelation matrix among subtests was also
calculated. This indicates that how far each subtest is
related with all other subtests. In the present investiga
tion there are six subtest and thus 15 values of correlations
have been found which are shown in the table 6.4.
Table 6.4
Subtests 2 3 4 5 6
Vocabulary(I) .78
Classification(2)
Analogies (3)
Best answer(4)
Number Series(5)
Resoning(6)
91
68
-
-
_
.79
.64
.56
-
—
.65
.88
.72
.62
_
.57
.56
.57
.57
.68

86
A perusal of above table reveals that
all the values of correlations are positive high and
significant at .01 level of confidence indicating that all
the subtests are related with each other satisfactorily.
This leads the investigator to conclude and generalize that
there is something is common which is relating one subtest
with the other subtests. In the opinion of the investigator
this may be the 'g' factor which is playing a significant
role here. This is the reason that all the values have been
found significant.
RESULTS :
The results of the present study are being presented
belo\/ -
1. Originally 110 items were prepared for the first
draft of the test. These items were submitted to a
pannel of experts. 13 items were rejected as they
were not found appropriate to be included in the
test. The remaining 97 items were administered on
110 subjects. After that they were analysed
individually to determine their difficulty values
and discrimination index. Only 36 items of six
subtests were found suitable, appropriate and
includable.

87
2. The items falling in the range of .25 to .75 of
difficulty values and .30 - .85 of discrimination
power were selected for the final test.
3. The reliability coefficient of the first draft of
the test has been found .86 by applying K-R 20
formula.
4. Validity of first draft was determined by content
validity which was found quite satisfactory.
5. The reliability coefficient of the final test by K-R
21 formula (modified form of K-R 20) was .85.
6. Further, to determine the validity of the final test
Pearson's was applied to know the predictive
validity of the test and to estimate
inter-correlations among subtests. All the
intercorrelations are found positive, high and
significant at .01 level of confidence, indicating
that the test is satisfactorily valid.
7. The test is usable for purpose of prediction of
academic achievement of visually impaired students
studying in class VI to X.
8. The correlation matrix indicates that this test
measures general mental ability i.e. 'g' factor.
9. Since test is administered through interview

88
technique it has been found that average time taken
by visually impaired to complete the test is 45
minutes.
10. To make the test more meaningful, useful and
interpretable age, grade and standard score norms
have been developed. These norms are given in the
table 6.1, 6.2 and 6.3 in the sane chapter. It has
been found that intelligence increases with the
increase in Age and grade of students.
11. It has been found that a large no. (63.73%)
visually impaired have averge intelligence.
IMPLICATIONS OF THE PRESENT STUDY FINDINGS IN THE FIELD OF
EDUCATION OF VISUALLY IMPAIRED :
Initially the investigator has consturcted 110 items
but only 36 items were found suitable which could be
included in the final test. This indicates that most
relevant, appropriate and suitable items should be included
in the intelligence test used for visually impaired children,
otherwise the intelligence must not give a real picture of
mental ability of these children.
The findings of the present study can guide
educationist and curriculum planners for planning the
educational system and standard of curriculum according to
the level of intelligence of visually impaired.

89
SuTularly, it also helps in deciding about teaching strategies
to be used for these students.
The intelligence tests, only meant for visually
impaired should be used for measuring their intelligence
level as they lack visual experiences.
The test may nelps the researchers m the field of
special needs education, who want to investigate the effect
of intelligence while studying some other factors.
In fact, the present investigator needed an
intelligence test neant for visually impaired for her
doctoral work m which comparision will be made on certain
personality factors of visually impaired children placed in
sagregated and inclusive school settings, (after eliminating
the effect of intelligence), so it helps the investigator m
this regard.
Intelligence and school perfomance are positively
and highly related with each other. The findings of the
present study nelp the researchers m predicting the school
performance on the basis of intelligence scores.
The present intelligence test can be used for
screening of visually impaired for admission purpose in
sagregated as well as inclusive school settings.

90
SUGGESTIONS FOR FURTHER RESEARCHES :
In future, the researches in the field of test
construction for visually impaired may be conducted on a
large sample including other regions of the state or
different states.
Intelligence test may be constructed for visually
impaired children and children of different age levels.
Performance or non verbal test are suggested, also
to be consturcted to measure the non verbal intelligence of
visually impaired.
Similarly Intelligence Test having verbal as well as non
verbal part may also be constructed in order to make it
more comprehensive.
Some more aspects of intelligence like divergent
thinking may also be included in further researches.
Percentile norms may also be prepared for making the
intelligence test more interpretable.
A large size of sample may be taken for the
development of norms and standardisation of the test.
Researches like correlates of intelligence may also
be conducted to know the relationship of intelligence with
personal and non personal factors.

91
The present investigator has tried to touch a
fringe of study in this field and she is aware of the
limitations- But it was not possible for her to make it
perfect study at M.Phil, level-

REFERENCES

R E F E R E N C E S
1. Ainsworth, M.E. (1967). The relationship between
Motivation, Intelligence and School Attainnent in
Secondary Modern School. British Journal of
Educational Psychology, 37, 135.
2. Anastasi, A. (1968). Psychological Testing, London,
MacMillan Company.
3. Barraga, N. (1964). Increased Visual Behaviour in Low
Vision Children. Research Series, American
Foundation for the Blind, No. 13.
4. Barraga, N. & Collins, M.E. (1979). Development of
Efficiency in Visual Functioning : Rationale for a
Comprehensive Program. Journal of Visual Impairement
and Blindness, 1979, 73, 121-126.
5. Bateman, B.D. (1963). Reading and Psychological Process
of Partially Seeing Children. Reston Vax Council of
Exceptional Children.
6. Bateman, 3.D. (1964). The Modiflability of Sighted Adult's
Perception of Blind Children's Abilities, New
Outlook of the Blind, 58, 133-135.
7. Bean, K.L. (1953). Construction of Educational and Perso
nnel Tests, New York, McGraw Hill Book Co.
8. Beck, F. & Lindsey, J.D.(1986). Visual Impaired Students:
Degree of Visual acuity and their verbal quotient.

93
Educational and Psychological Research, Vol. 6(1),
49-53.
9. Bedi, H.H. (1982). Aspiration of Adolescent as Related
to Socio-Economic Status, Intelligence and Sex.
Ph.D.(Education), III Survey of 3uch, M.B., 329 pp.
10. Bhushan, A. & Sharma, R.D. (1976). Effect of three
Instructional Strategies on the Performance of B.Ed.
Students, teachers of different intelligence level.
Indian Educational Review, 10, 2, 24-29.
11. Binet, A. (1916). The Development of Intelligence in
Children (translated by E.S. Kite). Baltimore, Warmick
and York.
12. Birch, J.VJ, et. al. (1966). School Achievement and Effect
of Type Size on Reading in Visually Handicapped
Children. Cooperative Research Project, No. 1766,
Contract No. OEC-4-10-028, Pittsburgh, Univ. of
Pittsburgh, 166 pp.
13. Birns, S.L. (1983). Effect of the Age at Onset of
Blindness on the Developement of Space Concepts. Ph.D.
Univ. of Southern Californea, (In D.A.I., March 1983,
Vol. 43, No. 9, 2957 pp.
14. Bonafanti, B.H. (1977). The Evaluation of Non Verbal and
Verbal Traits and Behaviour cf Blind Adults and
Effect of Training upon these Behaviours. D.A.I.
July, Vol. 38, No. 1, 23 pp.

94
15. Brekke, B., Williams, J.D. & Tait, P. (1974). The Acqui
sition of Conservation of VJeight by Visually
Impaired Children. Journal of Genetic Psychology,
125, 89-97.
16. Bryant, D.G. (1984). The Composing Process of Blind
VJriters. Ph.D., North Texas State Univ. 222 pp. In
D.A.I., May 1985, Vol. 45, No. 11, 3296 pp.
17. B.R.A.(1979) . Test of Intelligence conducted by Blind
Relief Association (B.R.A.), New Delhi.
18. Chauhan, S.S. (1992). Advanced Educational Psychology.
Vikas Publishing House Pvt. Ltd. Copy right (c)
S.S. Chauhan, 1978. Reprint 1992, 281-292.
19. Chin, D.L. (1985). The Effect of Dance Movement Inst
ruction of Spatial Awareness in Elementary Visually
Impaired Students and Self Concept in Secondary
Visually Impaired, Ed. D., Univ. of Northern
Colorado, 176 pp. In D.A.I. , April 1985, Vol 45,
No. 10, 3111 pp.
20. Cina, K.A. (1983). Four Instructional Modalities for
Learning Instructions with Blind Client, D.A.I.
Dec, Vol 44, No. 6, 703 pp.
21. Cutsforth, T.D. (1932). The Uncertanity of Words to
Blind. Teacher Forum, 4, 86-89.

95
22. Cureton, E.E. (1957). The Upper and Lower Twenty Seven
Percent Rule. Psychometrika, 22, 293-96.
23. Davis, C.J. (1980). Perkins-Binet Test of Intelligence
for the Blind. Massachuselts, Perkins School for the
Blind.
24. Dauterman, W.L., Shapiro, B. & Suin, R.M. (1967). Per
formance Test of Intelligence for the Blind
Reviewed. International Journal for the Education of
rhe Blind, 17, 8-16, October.
25. DeMott, R.M.(1972). Verbalism and Affective Meaning for
Blind Severely Visually Impaired and Normally
Sighted Blind. New Outlook for the Blind, 66, 1-8.
26. Dokecki, P.C. (1966). Verbalism and the Blind: A
Critical Review of the Concept and Literature
Exceptional Children, 32, 525-530.
27. Foulke, E. (1962). The Role of Experience in the For-
nation of Concept. International Journal for the
Education of the Blind. 12, 1-6.
28. Fraiberg, S.P. (1968). Parallel and Divergent Pattern
in Blind and Sighted Infants : Psychoanalytical
Study of the Child, 23, 264-300.
29. Friedman, J. & Pasnak, R. (1973). Accelerated
Acquisition of Classification skill by Blind Chil
dren. Development Psychology, 9, 333-337.

96
30. Frayer, D. (1922). Occupational Intelligence Standards
School and Society. 16, 212-211.
31. Gottesman, M. (1971). A Comparative Study of Piaget's
Developmental Schema of Sighted Children with that
of a Group of Blind Children. Child development, 42,
573-580.
32. Gottesman, M. (1973). Conservation Development in Blind
Children. Child Development, 44, 824-827.
33. Gottesman, M. (1976). Stage Development of Blind
Children : A Piagetian View. New Outlook for the
Blind, 70, 194-200. (In "Visual-Impairement". Hand
Boole of Special Education, Edited by Jame, M.
Kauffman, (c) 1982 by Prenticenal, Inc, Engle Wood
Cleffs, New Jersy 07632.
34. Guildford, J.P. (1967). The Nature of Human Intelligence
New York, McGraw Hill.
35. Guildford, J.P. (1988). Some Changes in the Structure
of Intellect Model. Edn. and Psychological Measure
ment , 48, 1-4.
36. Hains, T.H. (1919). Report of New Cases and More
Reliable Age Normss of Inteligence by the Point
Scale for the Blind. Journal of Educational
Psychology, 10, 165-167.

97
37. Harris, D. (1963). Children's ' Drawing as Measures of
Intellectual Maturily, New York, Harcoust Brace
Jovanovich.
38. Harley, R.K. (1963). Jr. Verbalism Among Blinr
Children. Research Series, American Foundation for
the Blind, No. 10.
39. Hartlage, L.C. (1967). The Role of Vision in the
Development of Spatial Ability. Univ. of Louis Ville,
61 pp.
40. Hayes, S.P. (1918). Standard Test in the Elementary Sub
jects for the Blind : Proceeding. American
Association of instruction of the Blind.
41. Hayes, S.P. (1941). Mental Measurement of the Blind :
History, Inventory, Criticusm and Teacher's Forum
for Instruction of Blind Children. 13, 42-50.
42. Higgins, L.C. (1973). Classification in Congenilally
Blind Children. Research Series, American Foundation
for the Blind , No. 25.
43. Hill, E.W. (1970). The Formation of Concept Involved in
Body Position in Space. Education of Visually Handi
capped, 2, 112-115, 1971, 3, 21-25.
44. Ittyerah, M. & Mitra, D. (1988). Synthetic Perception
in sensorily deprived. Psychological studies, Vol.
33(2), July, 110-115. In Psy. Abstract, Vol. 76, No.
7. July 1989, 2191.

98
^5. Jhag, D.S. (1979). A Study of Personality Correlates of
Creative Child. 15 plus studying science subjects,
Ph.D. (Edu.), Bhopal Univ.
46. Kamila, B.B.(1984). Creative Thinking Abilities of
Blind School Children. Journal of Education and
Psychology, Jan., Vol. XXXXI, No. 4. 198 pp.
47. Kaufman, A. & Kaufman N. (1583). The Kaufnan Assessment
Battery for Children. Circle Press, Minn., American Gui
dance Service.
48. Kelley, T.L.(1939). The Selection of Upper and Lower
Group for the Validation of Test Items. Journal of
Educational Psychology, 30 : 17-24.
49. Kenmore, J.R. (1965). Associative Learning by Blind
Versus Sighted Children with Words and Objectives
Differing in Meaningless and Identifiable Without
Vision. Doctor's thesis, Minncapotis, Univ. of
Minnesola, In Dissertation Abstract 27, No. 4, 1966,
959 A.
50. Kirk, S.A. & Gallaghar, J.J. (1968). Educating Excep
tional Children; Haughton Miltein Sight Saving Review,
28, Spring.
51. Korchao, J.M. (1984). Anidya-Deaf Blind Boy at Perkins
Blind Welfare, 26-3, 16-21 pp.

99
52. Kuder, G.F. & Richardson, M.W. (1937). The Theory of
Estination of Test Reliability. Psychometrica, 2,
151-60.
53. Kulsh res tha , S.K. (1956) . A Study of I n t e l l i g e n c e and
S c h o l a s t i c Attainment of X and XI Class Students in
' J . ? . Doctoral t h e s i s (Phi losophy) Allahabad Univ.
54. L iv ings ton , J . S . (1968) . Eva lua t ion of Enlarged Test
Form Used with P a r t i a l l y See ing . Sight Saving Review,
28, Spr ing .
55. Lowenfeld, B. (1945) . B r a i l l e and Talking Books. A Com
p a r a t i v e Study. New York, American Foundation for the
Bl ind .
56. Lindquist, E.F. (1951). Educational Measurement Washing
ton, American Council of Education.
57. MacWilliam & Hudson, L.J. (1984). Relationships Among
Five Measures of Survey Level Mental Presentation of
Space in the Visually Inpaired. Ph.D. Boston College,
230 pp. In D.A.I. October, 1984, Vol. 45, No. 4, 1095
pp.
58. MacCarthy, D. :1972). Manual for the McCarthy Scales of
Children's Abilities, New York, Psychological
Corporation.

100
59. Marshall, J.C. and Hales, L.W. (1972). Essentials of
Testing. California, Addison Wesley.
60. Menakar, S.L. (1966). Perceptual Development in Blind
Children. Doctor's thesis, Boston Univ., 190 pp. In
Dissertation Abstracts, 27, No. 5, 1966, 1625-26B.
61. Miller, L.R. (1977). Abilities Structures of Congenitally
Blind Persons : A Factor Analysis. Journal of Visual
Impairement and Blindness, 71, 4, 145-153.
62. Newland, T.E. (1969). Manual for the Blind Learning
Aptitude Test : Experimental Edition, Urbana, III, T,
Earnest New Land.
63. Nolan, C.Y. & Ascroft, S.C. (1969). The Visually Handi
capped. Review of Educational Research, 39.
64. Pernikar, V. (1978). Vithoba Parnikar Performance Test
for the Blind, Bombay, NAB, Louis Braile Memorial
Research Centre.
55. Piaget, J. & Inhelder, B. (1969). The Psychology of the
Child, New York. Basic Books.
66. Pring, L. (1987). Picture Processing by the Blind.
British Journal of Educational Psychology, Vol. 51
Feb. 1987, 38-44.
67. Qureshi, A.N. (1980). A Study of Creativity in Relarion
to Intelligence, Manifest Anxiety and Level of Asoi-
ration of High School Girls, Ph.D., psychology, Agra
Univ., Ilird Survey of Buch, M.B. 397 pp.

101
68. Roberge, J.J. & Flexer, B.B. (1981). Re-exanination of
Co. Variance of Field Independence, Intelligence and
Achievement, British Journal of Educational
Psychology, 5, 235-236.
69. Sharna, S. (1982). A Study of Intellectual Factors and
/-.cadenic Achievement in Arts, Science and Commerce at
Higher Secondary Stage, Doctoral thesis. Ed. A.M.U.
70. Sharma, A. (1993). A study of Frustration, Creativily and
School Performance of Congenitally Blind and
Adventitiously Visually Impaired. M.Phil.(Edn.) A.M.U.
(Unpublished Research).
71. Shurrager, H.C. & Shurragar, P.C. (1974). Mannual for the
Haptic Intelligence Scale for the Blind . Chicago,
Psychology Research Technology Centre, Illinosis
Institute of Technology.
•'':. Siddiqui, M.J. (1989). Study of Creative Potential of
Visually Impaired Children in Relation to their
Socio-Economic Status. M.Ed. Dissertation, A.M.U.
73. Simon, H.A.(1981). Studying Human Intelligence by
Creating Artificial Intelligence, American Scientist,
69, 300-309.
74. Singer, J.L. & Streiner, B.F. (1966), Imaginative Content
in the Dreams and Fantasy Play of Blind and sighted
Children, Preception and Motor Skills, 22, April,
475-82.

102
75. Singh, T.B. & Sharma, P. (1984). A Short Scale Measure IQ
Measure for the Visually Handicapped, Paper Presented
at 5th Annual Conference of India. Association
Clinical Psychologist, Dec. 28-30th, Dehradun.
76. Singh, T.B. (1985). Intelligence Score Pattern of Visually
Handicapped Subgroups, International Journal of
Educational Sciences, 11, 11-19.
77. Singh, T.B. (1986). A Short Scale IQ Measure forthe Visually
Handicapped. Sponsored Research Project of N.I.V.H.,
Dehradun.
78. Slosson, R.L. (1963). Slosson Intelligence Test (S.I.T.)
for Children and Adults. East Aurona, New York,
Slosson Educational Publication.
79. Smith, B.'W. & Mommer, M.J. (1976). Difference Between
Blind and Sighted Children on WISC-Verbal Subtest, New
Outlook for the Blind, 70, 240-246.
80. Spearman, C. (1904). General Intelligence Objectivity
Determined and Measured, American Journal of
Psychology. 15, 201-293.
81. Stephens, B. (1972). Cognitive Process in Visually
Impaired, Education of the Visually Handicapped. 4,
106-111.

103
82. Stephens, B. & Simpkins, K. (1974). The Reasoning Moral
Judgement and Moral Conduct of the Congenitally Blind.
Final Project Report. H23-3197, Office of Ed., Bureau
of Education for Handicapped.
83. Stephens, B. Grube, C. & Fitzgerald, J. (1977). Cognitive
Remediation of Blind Students. Final Project Report.
Project No. 443 CH 50410, Grant. No. GOO-74-07445.
84. Suin, R., Dauterman, W. & Shapiro, B. (1967). The WAIS as
predictor of educational and occupational achievement
in the adult blind. New Outlook for the Blind, 61, 2,
41.
85. Teare, J.F. & Thompson, R.W. (1982). Concurrent Validity
of the Perkins Binet Test of Intelligence for the
Blind, Journal of Visual Impairment, 76, 279-80.
86. Thurstone, L.L. (1938). Primary Mental Abilities,
Chicago, Univ. of Chicago Press.
87. Tillman, M.H. (1967). The Performance of Blind and
Sighted Children on the Wechsler Intelligence Scale
for Children, Study I, International Journal for the
Education of the Blind 16, 65-74, March, 1967(a).
88. Tillman, M.H. (1967). The Performance of Blind and
Sighted Children on the Wechsler Intelligence Scale
for Children, Study II, International Journal for the
Education of the Blind. 16, 106-12, May, 1967(b).

104
89. Tillnan, M.H. & Bashaw, W.L. (1968). Multivariate
Analysis of the WISC Scales for Blind and Sighted
Children. Psycholgoical Report, 23, 523-526.
90. Tillnan, M.H. and Osborne, R.T. (1969). The Performance
of Blind and Sighted Children on the Wechsler
Intelligence for Children : Interacticr. effects, Ed.
Visually Handicapped, 1, 1-4.
91. Tillman, M.H. (1973). Intelligence Scales for Visually Impaired
Persons. Journal of Visual Impairment and Blindness,
71, 4, 158-163.
92. Tobin, M.J. (1972). Conservation of Substence in the
Blind and Partially Sighted. Britisn Journal of
Educational Psychology, 42, 192-197.
93. Tuddenham, R.D. (1982). Intelligence. Encyclopedia of
Educational Research, Harold, E. Mitzel (Editor).
Fifth Ed., Sponsored by A.E.R.A., A Division of
MacMillan Publishing Co., Inc., New Yorl . Collier
MacMillan Publishers, London.
94. Tucknan, B.W. (1975). Measuring Educational Outcomes;
Fundamentals of Testing, New York, Harcourt, Brace
Jovanovich, Inc.
95. Uchat, D.A. (1981). Study of Relationship between
Intelligence Level of Standard X Sts. of Rajkot City
to Their Vocational Aspiration and Their Father's
Education and Occupation. Deptt. of Edn., Sau. Univ.

105
96. Vander Kolk, C.J. (1977)a. Intelligence Testing for
Visually Impaired Persons. Journal of Visual
Impairment and Blindness, 71, 4, 158-163.
97. Vander Kolk, C.J. (1977)b. Demographic Etiological and
Functional Variable Related to Intelligence in the
Visually Impaired. Journal of Clinical Psycholcgy, 33,
3, 782-736.
98. Vander Kolk, C.J, (1982). A Comparision of Intelligence
Test Score Pattern between Visually Impaired Subgroups
and Sighted, Rehabilitation Psychology, 27, 2,
115-120.
99. Warren, D.H. (1977). Blindness and Early-Childhood
Development. New York, American Foundation for the
Blind, 123-148.
100. Zweibelson, I. & Brag, C.F. (1967). Concept Development
of Blind Children, New Outlook for the Blind. 61,
September, 218-22.
*****

APPENDIX
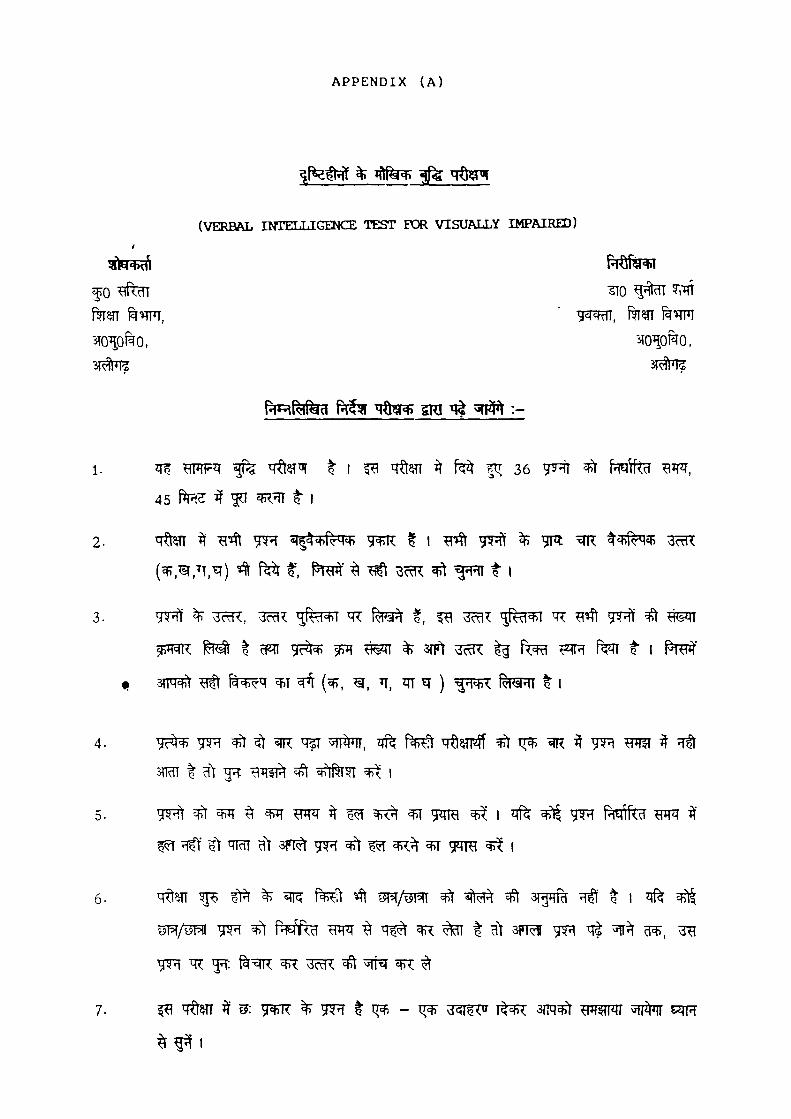
APPENDIX (A)
(VERBAL INTELLIGENCE TEST FOR VISUALLY IMPAIRED)
t^Hl^fed Plf^r Mftsa* SRI ^ ^^1^ : -
45 f^^ # ^ ^ ^ t I
5- w^ ^ ^w tf w ^^^ 1^ ^ ^ g rra ^ I ^ ^ g ^ Pi lRd ^m "

>i<il <"l
l/3f
1/31
3ctR :
2-
3CTR :
3.
viai< :
3.
viai< :
5.
z —
^n ^
^
TT
^
^ia^<
^
^
1
^
- 1 / ^ -
^ -
2 - ^
^
^
^
^
^
^
- sl-^KrM^ vJCTl<
- ^r^
~ TGT?
^^H
- f ^ I ^ ^ cTfi f : - 1/3T - 3
^ RidJil t
'=hM4> 3CTR
- tjfer
- «III
- ^T^^.
- TRT
- ^
cficn, •'a - ^?l3n, i - M^i^, M 41^ " i. - ^b^^Kj s?^ w^ ^ ^
: ?:H^U1 :: ^^^HH :
- ^+i M':f7 ^RTH:
- ^ + M + 3CTR
- ^^^ T^\^
- ^m - ^
- 3 - ^
^
=F
^
T
^
4 _7T
-- ' + I =f7 ^ ^ ^
- W HlRj^i 1 ^ t 1 - ^ ^ Firat t
- ? ^ f^ ^ [ 9lcil t
- ^^^ if^\^^^ c?i<H di t
H H W K d d tte^l^HI =•) 5b*H =bl W 4 M *I <.<a=b< K=W *^11 »1KM : -
35,30,25,20,15,

^A ^
^
n ^
J
- •5+l q4> irdi
- 15
- 10
- 2 0
- 25
3CTR : 5 - 3
6. ^ 7R ^ t ^ t ^ 3?R T ^ ^ tJt I Q ^ T ^ % ^ ^ : -
^ - ^
^ - f15 ^ ^^ ^ rafKTT
3rfR : 5 - »?
JTO 2 ' ^ {^f ^P^^ { ^ f rara }^j ?RT j l } ^ ^ - • ^ 515 ^f¥?
70 5 Fst?: ^ k ^ Q - {^ j ^ j|^{ ^ ; ^ i i ^ j ^ j | -mn^
go 7 m ^ pi\ f ^ {^} il^Wtt \^\ WT J f ^fR^ - - ^ ?TS " ^ 1
go 9 ^?R ^ 3?! t j|^{ ^ j ^ j ^ ^ f^l ^ R t q ^ l^ji 3P T
^ 10 l^j ^ ^ f ^ j ^ ^ %^ m f ^ Tim l^jj TR |^( t ^ - • ^ ?T5? ^^f^
^ 11 ^^ : cT=r :: f ^ : - ^ i^ p(\ ^ jn|j ^ J f 5R
^ 12 Wmt ^ ^ ^ t I^J ^^ \ia\ WTT I H qlrdi^+ jj f ^T^
^ 13 [^f^MNi : - "^m^ :: T^ [^T^ : j^ j j ^^\^ ^ r | ^ j^jj T T C I ^ ^ ^ ^ |7TJj

4
^) " ^ ^ ^ ^ ^ ^ ®* >iTr.7r?Tr'^ \
go 15 ^M : njol :: ^ {FJj t?l \'^\ ^ JTJj ^ j^j ^T^^
jj jj ^ ^ '
7D 17 {^{ 7 ^ j^ j ^ flf ^Ff^ jqf ^ r m ^TW^ : -
^ [ ^ Tl^ "^^ I
^ 1 8 OT§ % ^ l ^ ^ m^ W^ ^ ^ •• -
m ^ J H ^ f^ Q" I \^\ ^ 'aHT ^ n f ^ 5ficn t I
\^\ "^ eft ^ - ^ t ^R^ ^3^ci ^ ^ f^j " ^ ^m i e ch m %
f ^ jfTTH ^ t JTJ ^cR^ m^ ^ FHT t 3fcl ^^^r^ ^ 3 1 ^ ^ ' lien
Q" m ^ ^ ^ ifr ^K ^' ^ ^ ^ ^ 3 ^ WT +Nd FKit I
?D 20 ^TT^ ^ ^ 33T itHT Q ^F#HF : - j ^ j ^TI ftf^d ^ «l^ l1^ Q I
T ^ t 1
W) 21 1,8,15,22,29 \ft^ FTH «Tf { jj 35 ^ 30 M 36 {^|40
^ 22 t l ^ : TT :: 3^1^ :^^| ^fe^t ij jj ' M JT} ^?H J^} ? t R : - ^ ?T5? fj tf
?D 23 ^ ^ W^ ^ ^??^ ^ J ^ 3?T ^ ?TT | | l^j ^ m q i ^ JTJ ?TcM
9D 25 ^ : 15RTT :: ^ jj^f 31^1 \^\ ^ jJTJl ^ f^ f ^
^ 2 6 ^ ^Plt 1^ # ^^ ^ ^ ^ t ^ ^ : - m ^P^ % ^ ?q^ -

5
90 27 4,5,8,9,12, ferT r=^ ^IT^
m 10, \m\ 11 JT{ 12 { j 13
?0 28 4.8,40,15,30 f^ PTFT ?Tft
j ^ l 100, 1^1 90, j^{, 150 H 50
90 29 4,16,8,32, 16 i w FTFT ^ ^ f^{ 64 ^ 30 }^| 36 j^{l8
90 30 3ii wR ^ 3^ t" i^f TfTi j?5{ ^^^m m T^ m ^
j j^j "TPTT ji^ji ^ ^ Ij^il w n jj^j ^
^ ^ Tot^ ^ 5 cTT: ?cRR t ^20c fT . ^ ^ ^ f ^ # l T I
9033 88,44,40,20,16, fm V^^ ^ft^ j ^ f 10 {^j 8 ^ 14 jj^j 12
9D 34 1/2, 3/4, 1,V4 , 1V2, ftw ^ TH tf^
ij^j 11/6 M ^'^ Y\ 1^/^ 5"^ -o
^ - ^ ^ , ^ - ^?ft^ 3fR: TfTj ^ 7
^ ^ eft ^ ^ ^ ^ t j ^ f f ^ J^jj Tm Jnjl^tff^ {^j j Tfn

APPENDIX (B)
r ^ ^ ^ ^ : < **SWER SHEET)
f ^ :
f ^ r a r ^ T57 ^ :
1.
2-
3.
4.
5.
6.
7.
8-
9.
10
11-
12.
13.
14.
15.
16.
17.
18.
19.
20.
21
22.
23.
24.
25.
26.
27.
28.
29
30.
31.
0 0 -
34.
35.
36.

APPENDIX (C)
go "^^
1
2
3-
4.
5.
6.
'y
I •
8.
9.
10.
11-
12.
13.
14.
15.
16.
17.
18.
* ^ i + H
(SCORING KEY)
vioK
^
^
^
1
7T
^
^
^
^
^
T
n
^
TJ
^
^
^
^
f
^ ^sqi
19.
20.
21.
22.
23.
24.
25.
26.
27.
28.
29.
30.
31.
32.
33.
34.
35.
36.