A hybrid computational model for an automated image descriptor for visually impaired users
Upload
independentCategory
view
1download
0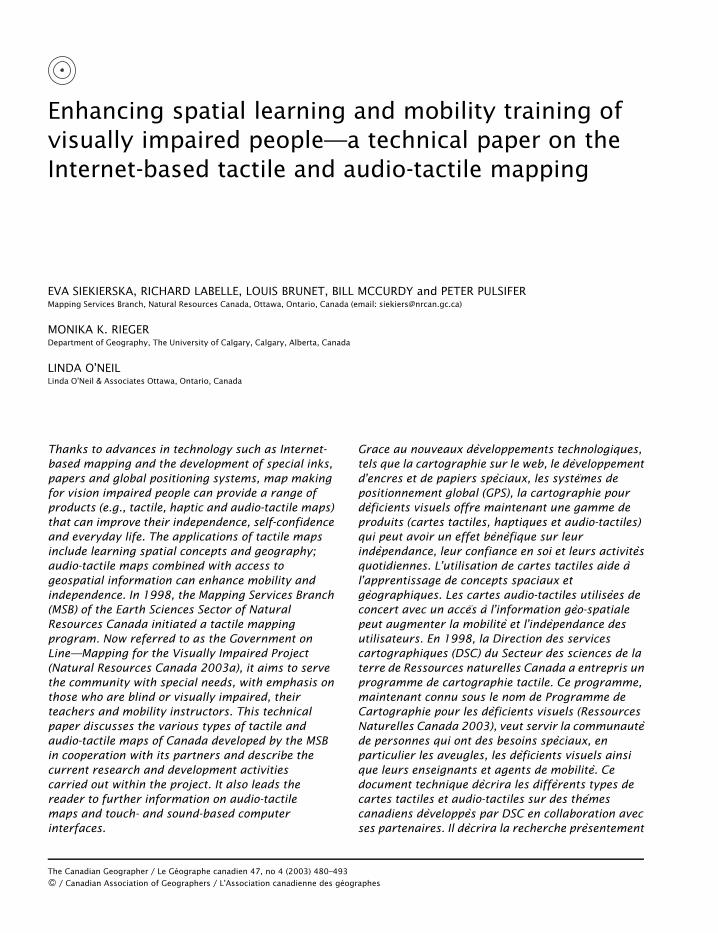
Enhancing spatial learning and mobility training of
visually impaired people—a technical paper on the
Internet-based tactile and audio-tactile mapping
EVA SIEKIERSKA, RICHARD LABELLE, LOUIS BRUNET, BILL MCCURDY and PETER PULSIFERMapping Services Branch, Natural Resources Canada, Ottawa, Ontario, Canada (email: [email protected])
MONIKA K. RIEGERDepartment of Geography, The University of Calgary, Calgary, Alberta, Canada
LINDA O’NEILLinda O’Neil & Associates Ottawa, Ontario, Canada
Thanks to advances in technology such as Internet-
based mapping and the development of special inks,
papers and global positioning systems, map making
for vision impaired people can provide a range of
products (e.g., tactile, haptic and audio-tactile maps)
that can improve their independence, self-confidence
and everyday life. The applications of tactile maps
include learning spatial concepts and geography;
audio-tactile maps combined with access to
geospatial information can enhance mobility and
independence. In 1998, the Mapping Services Branch
(MSB) of the Earth Sciences Sector of Natural
Resources Canada initiated a tactile mapping
program. Now referred to as the Government on
Line—Mapping for the Visually Impaired Project
(Natural Resources Canada 2003a), it aims to serve
the community with special needs, with emphasis on
those who are blind or visually impaired, their
teachers and mobility instructors. This technical
paper discusses the various types of tactile and
audio-tactile maps of Canada developed by the MSB
in cooperation with its partners and describe the
current research and development activities
carried out within the project. It also leads the
reader to further information on audio-tactile
maps and touch- and sound-based computer
interfaces.
Grace au nouveaux developpements technologiques,
tels que la cartographie sur le web, le developpement
d’encres et de papiers speciaux, les systemes de
positionnement global (GPS), la cartographie pour
deficients visuels offre maintenant une gamme de
produits (cartes tactiles, haptiques et audio-tactiles)
qui peut avoir un effet benefique sur leur
independance, leur confiance en soi et leurs activites
quotidiennes. L’utilisation de cartes tactiles aide a
l’apprentissage de concepts spaciaux et
geographiques. Les cartes audio-tactiles utilisees de
concert avec un acces a l’information geo-spatiale
peut augmenter la mobilite et l’independance des
utilisateurs. En 1998, la Direction des services
cartographiques (DSC) du Secteur des sciences de la
terre de Ressources naturelles Canada a entrepris un
programme de cartographie tactile. Ce programme,
maintenant connu sous le nom de Programme de
Cartographie pour les deficients visuels (Ressources
Naturelles Canada 2003), veut servir la communaute
de personnes qui ont des besoins speciaux, en
particulier les aveugles, les deficients visuels ainsi
que leurs enseignants et agents de mobilite. Ce
document technique decrira les differents types de
cartes tactiles et audio-tactiles sur des themes
canadiens developpes par DSC en collaboration avec
ses partenaires. Il decrira la recherche presentement
The Canadian Geographer / Le Geographe canadien 47, no 4 (2003) 480–493
� / Canadian Association of Geographers / L’Association canadienne des geographes

en cours ainsi que les activites de developpement
qui font parti du projet. Il inclue egalement de
l’information supplementaire au sujet des cartes
audio-tactiles et des interfaces ayant une
composante tactile ou sonore.
Introduction
While we do not know a great deal about how the
blind perceive space, we do know that blind people
know less about geospatial configuration and the
location of objects in space than do sighted
people, as this knowledge is generally acquired
by seeing. This makes everyday tasks extremely
challenging, a result of both the impairment itself
and the fact that most environments are designed
to ‘cue’ sighted people. It is difficult for a blind
person to navigate alone in unknown space, and
only limited efforts have been made to help them
navigate in the built environment. The addition of
multisensory information to maps has also been
limited until recently. In the case of blind and
visually impaired people, there is a growing aware-
ness of the environments that fail to accommodate
the needs of individuals as a result of the ways in
which society and space are organised and devel-
oped. Currently, the Government of Canada is
moving towards delivering programs and informa-
tion over the Internet, and to that end, the Govern-
ment-on-Line (GoL) program (Treasury Board
Canada 2003) was established in 1998 to ensure
that all Canadians can get timely, more affordable
and usable information such as maps, statistical
information, tax forms and health information, to
increase their chances of finding employment and
to facilitate their full participation in the emerging
knowledge-based economy. It has also promised to
‘increase support for the development of new tech-
nologies to assist Canadians with disabilities.’ In
this spirit, the Mapping Services Branch (MSB) of
Natural Resources Canada initiated a tactile map-
ping project in 1998, now known as the Government
on Line—Information and Services for Persons with
Disabilities Cluster—Mapping for the Visually
Impaired Project (Government of Canada 2003).
When the MSB investigated the situation in
Canada, it found that there were very few tactile
maps available for the blind and therefore began
further research in this area, focusing on tactile
maps for education, audio-tactile maps for naviga-
tion and the addition of technologies that will
enhance their delivery (Siekierska et al. 2001).
Since the project is working within the GoL frame-
work, the focus has been placed on the use of the
Internet as a means of map production and distri-
bution. We believe this research project to be
unique in Canada, as no other agency provides
online access to and distribution of tactile maps
on the Internet. While not specifically related to
the development of tactile and audio-tactile
maps, the issue of accessibility to the Internet by
blind and visually impaired users is an important
part of development efforts. As a step towards
ensuring that the services and information pro-
vided by the project are available to all users, a
partnership had been established with Industry
Canada, whose purpose is to leverage efforts cur-
rently being made by Industry Canada’s Commu-
nity Access Program (Industry Canada 2003a) and
Web-4-All initiative (Industry Canada 2003b). The
Community Access Program aims to provide Cana-
dians with affordable public access to the Internet
and the skills needed to use it effectively.
The main purpose of this technical paper is to
inform readers about the initiation of the inter-
departmental tactile mapping project (carried out
within the Government on Line, Information and
Services for People with Disabilities Program), to
share the results obtained thus far and to obtain
feedback from others working in similar fields.
It is hoped that cooperation established through
knowledge sharing may lead, in the long term, to a
more systematic and theoretically sound approach
in the development of tactile and audio-tactile
maps, as well as the user interfaces needed to
read such maps in the Internet environment.
Cartography and Visually ImpairedMap Users
Geographic/cartographic perspectives
As a discipline, geography has paid relatively
little attention to disabled people with regards
The Canadian Geographer / Le Geographe canadien 47, no 4 (2003)
Enhancing spatial learning and mobility training 481

to the nature of the environments they occupy
(Golledge 1993). Social geographers have focused
attention on the poor, ethnic groups, those living
with various illnesses and the homeless, but they
have not, until recently, been much concerned
about the disabled. There are a number of
perspectives now used by social geographers
(Gleeson 1996, 1999; Golledge 1996; Imrie 1996;
Dear et al. 1997; Parr and Butler 1999) to under-
stand impairment (defined as a functional limita-
tion, e.g., missing a limb) and disability (the
inability of the impaired person to perform the
activities usually performed by a nonimpaired
person). Disagreement arises as to the cause of
the disablement—the impairment itself or the
society (its attitudes, environment, economic
structure, etc.) in which the person lives. If the
impairment were the only disabling factor, then a
medical or technological solution that ‘fixes’ the
person would be in order. If the society disables,
then it must do the changing since technological
and medical solutions alone will not improve the
person’s lot.
Some researchers of the sociospatial perspective
do admit that not all disablement is caused by
society (Dear et al. 1997) and that technology has
‘some value’ in improving aspects of daily life (Parr
and Butler 1999). The authors believe that, while
there are many societal factors that cause disable-
ment, impairment itself can also disable and that
technology can alleviate disabilities by solving
some of the access to spatial information problems
(in the areas of education and mobility) of the
visually impaired, thereby improving some
aspects of their daily lives. We do not presume
that this research, or its products, will change
societal barriers (in terms of prejudices, economic
barriers or similar realities) that may be disabling
these persons. The primary focus in tactile map-
ping has tended to be on production methods and
materials and less on providing instruction on the
use of tactile maps, making the user population
aware of the products, or evaluating the products
(Golledge 1993). This applied research project,
while focusing on the production of maps in
the Internet environment, is also concerned
with the latter components of tactile mapping
research. We hope this results in more researchers
working on tactile mapping and more users who
are aware of and have access to tactile maps of all
types. If some societal barriers do change as
a result, it will be an unintended, but very welcome,
benefit.
Research on tactile graphics
A number of cartographers have, for many dec-
ades, been involved in improving the lifestyle and
the quality of life of disabled persons through
research into and development of tactile maps
and graphics for blind and visually impaired
users (Coulson 1991; Tatham 1991; Vasconcellos
1996). They have made use of the research under-
taken by psychologists, cognitive scientists and
geographers (over almost 40 years) which investi-
gated the cognitive and perceptual abilities of
adventitiously and congenitally blind subjects using
tactile diagrams, graphics and maps (Lederman
1979; Dodds 1989; Hampson and Daly 1989;
Passini et al. 1990; Ungar et al. 1997; Blades et al.
1999; Golledge et al. 1999). A number of theories
have been proposed regarding the spatial under-
standing of blind and visually impaired people
(Kitchin et al. 1997). Some current thoughts sug-
gest that such people ‘possess the same abilities to
process and understand spatial concepts’ as
sighted people (Kitchin et al. 1997).
For some time, maps have been created using
found materials—string, beads, sandpaper, wire
and similar items. Recently, other materials have
been developed, including thermoformed plas-
tics, foaming ink, multitextural materials and
microcapsule paper (Andrews 1985; Turner and
Sherman 1986; Dacen 1987; Gardner 1996). Tactile
maps are sometimes used along with a speech
synthesiser and touch pad (see the Nomad system
described in Parkes 1988; the new version of this
system is marketed as Tactile Graphics Designer
[TGD]; also Coulson et al. 1991; Jacobson and
Kitchin 1997; Jacobson 1998) that allow for the
addition of auditory information. The auditory
information provides the user with more informa-
tion than can possibly be annotated (using Braille
or large text) on the tactile map itself. Another
example of this technology is the BATS (blind
audio tactile mapping system) project, in which
researchers added auditory icons and speech
‘call-outs’ in three dimensions as well as haptic
feedback devices (these combine tactile percep-
tion with kinesthetic sensing) to provide addi-
tional map information (Parente and Bishop
2003). These systems use digital geographic data;
The Canadian Geographer / Le Geographe canadien 47, no 4 (2003)
482 Eva Siekierska et al.

however, there is still another type of digital geo-
graphic data, namely maps available on the Inter-
net, that blind and visually impaired persons
cannot access. Research is ongoing regarding
the potential of new graphics languages such as
VRML (virtual reality modeling language) and SVG
(scalable vector graphics) to make graphical infor-
mation accessible (Bulatov and Gardner 1998,
1999; Gardner and Bulatov 2001). Such advances
may finally allow blind and visually impaired
persons to access the vast amount of real-time
data that are available to sighted persons with
Internet access.
A number of research centres have been generat-
ing interest in the topic of way-finding needs and
abilities of the visually impaired population, which
has led to work on Personal Guidance Systems
(PGS). While these are not normally thought of as
tactile maps, they do aid the mobility needs of this
population. PGSs combine a Geographic Informa-
tion Systems (GIS) for the database component and
global positioning system (GPS) technology for the
location requirements, and together, these tech-
nologies enable a blind user to move through an
unknown environment. The Research Unit on Spa-
tial Cognition and Choice (RUSCC) at the University
of California Santa Barbara has done a great deal of
work on this topic (Golledge et al. 1991, 1998;
Loomis et al. 1998). Research has also been
conducted at the University of Wales, Swansea
(Jacobson 1994) and through the (now completed)
MoBIC Project (Douglas et al. 1997). The Sendero
Group has developed GPS Talk and Atlas Graphics,
and VisuAide of Canada has recently published
PGS called Victor Trekker.
Research is needed to solve the many remaining
technical issues pertaining to the accessibility of
Internet-based geospatial data and the production
and use of tactile and audio-tactile maps (regard-
less of the source of the data). Also needed is
research on how to effectively and efficiently
(from a cognitive perspective) convey geospatial
information to blind and visually impaired per-
sons and how they understand and make use of
this information. Research on these topics is
ongoing at multiple sites such as the University
of Minnesota (Minnesota Laboratory for Low
Vision), the University of California Santa Barbara
(RUSCC and a link to the Haptic Soundscapes site),
Sheffield University (the Psychology Department’s
Research on Tactile Maps), Western Michigan
University (Department of Blindness and Low
Vision Studies), the University of Maryland, the
University of Hertfordshire (Sensory Disabilities
Research Unit and a link to the National Centre
for Tactile Diagrams), Oregon State University
(The Science Access Project) and the University of
Toronto (Adaptive Technology Resource Centre).
Types of cartographic products needed
Tactile maps and graphics are an important
resource as they can enable blind persons to
obtain images of the world and to become
acquainted with its changing (geographic and spa-
tial) realities. Ideally, all of the types of maps avail-
able to sighted users should also become available
in the tactile format, including thematic, reference
and mobility maps. Reference and thematic maps
are required for educational purposes (primarily
for children but also for adults). Tactile maps can
significantly help blind and visually impaired
users, as such persons would otherwise not have
access to standard educational aids, including
maps and atlases, to learn subjects such as geogra-
phy and earth sciences.
In addition to learning about distant environ-
ments, tactile maps can also provide blind and
visually impaired users with developing an under-
standing of their immediate surroundings
(Morsley and Spencer 1988). Mobility maps, for
example, can help users navigate both interior
and exterior environments by depicting the space
in a simplified, readable format that includes the
necessary location cues. Thus, the use of geospa-
tial technology can help blind and visually
impaired users become aware of their immediate
environments and live more independently by
allowing them to negotiate these environments
without assistance (Jacobson 1994). These environ-
ments need not only be those pertaining to a user’s
residence or place of work. Visually impaired
tourists, for example, would also benefit from
tactile maps of their destinations. Tatham (1990)
reported on the production of a tactile map of the
London Underground which was designed to
increase the accessibility of this transit option to
visually impaired tourists. Studies of mobility
maps (Ungar et al. 1997; Blades et al. 1999) have
shown that visually impaired map users can effect-
ively learn routes through an unfamiliar area with
the use of tactile maps.
The Canadian Geographer / Le Geographe canadien 47, no 4 (2003)
Enhancing spatial learning and mobility training 483

Recent advances in geospatial technologies (e.g.,
the transfer of analog maps to digital format, GIS
and Internet maps) have led to new, innovative
cartographic methods being developed for maps
of all types (Jacobson 1998). It has often been
pointed out that while some of these develop-
ments, e.g., voice-based interfaces (those not
requiring reading/writing as input/output meth-
ods), can be of benefit to the entire population,
the impact of these new technologies on the blind
and visually impaired community can be even
more significant. Such benefit can be illustrated
by the audio-tactile map-reading system which
uses tactile maps combined with speech to label
the features to overcome the print barrier (Bulatov
and Gardner 1998).
Maps Developed and Produced at theMapping Services Branch
Techniques used for the production of prototypes
Recent advances in technology, specifically Inter-
net-based mapping and new types of papers and
inks, have resulted in tactile map production
methods that are simpler and more cost-effective
than old methods using found materials or ther-
moformed plastics. The use of microcapsule paper
is increasing because it is a quick, effective
method of creating ‘one-off’ images. Microcapsule
(also called ‘swell’) paper has a layer of plastic on
top that contains tiny alcohol bubbles. A black and
white image is copied onto the microcapsule paper
that is then passed through a thermal enhancer (an
infrared heating device) that creates a raised
image. The heat causes the alcohol bubbles to
expand under those parts of the image covered in
black.
Tactile Vision Inc., a Canadian company, recently
developed an ‘ink’ (a polymer) that rises when
heated and hardens to produce very detailed line-
work. One advantage of this technique is that maps
can be printed on ordinary paper. It produces
sharp and durable images that are easy to read by
touch technology, and the process is about 50 per-
cent more cost-effective than microcapsule paper.
User tests were conducted with blind students and
teachers at several schools including the W. Ross
Macdonald School, located in Brantford, Ontario,
which is the largest residential school for the
blind in Canada; Ottawa-Carleton district schools
that have special education programs for the blind
and visually impaired; Centre Jules-Leger, a small
school for the blind in Ottawa, Ontario; and the
Jacques Ouellette School for the Blind, Longueuil,
Quebec. This user testing was conducted using
structured interviews that investigated prototype
maps and solicited opinions of teachers and
students. Approximately 25 teachers and more
than 100 students were interviewed at these
schools before the final decisions on map
content and map symbology were made. Records
of these interviews are included in Appendix E of
Project Report—Tactile and Audio-Tactile Mapping
(Siekierska and Labelle 2001). When asked to eval-
uate the tactile atlas of Canada, the students and
teachers interviewed showed a preference for the
raised ink maps over the microcapsule maps
because of the ‘sharp feel’ of the raised ink. The
major drawback is that the printing must be done
at a printing facility because it requires a printing
press which, at the present time, is not portable.
Tactile atlas of Canada
The tactile atlas of Canada was the first tactile map
publication developed at the MSB. This atlas
includes a map of the entire country (showing
only political boundaries) as well as a map of
each province and territory. The latter maps are
more detailed, showing international, national,
provincial and territorial boundaries as well as
major lakes, rivers and main cities. A sample map
of the province of Ontario is shown in Figure1. The
target audiences for the tactile atlas of Canada
were primary and lower secondary (middle) school
students. Such maps were not previously avail-
able, and the W. Ross Macdonald School preor-
dered several copies of the atlas before it was
produced. Blind and low-vision adults who would
like to become familiar with basic geography of
Canada would also find this atlas a useful learning
tool.
The atlas was developed in cooperation with
Tactile Vision Inc., which provided the production
methodology as well as design advice. The general
selection of information and basic graphical repre-
sentation used in the atlas is similar to the maps
previously developed by Tactile Vision Inc. (e.g.,
a tactile atlas of the United States for the Library
of Congress). However, the atlas introduced
several modifications recommended by CNIB (The
The Canadian Geographer / Le Geographe canadien 47, no 4 (2003)
484 Eva Siekierska et al.
Canadian National Institute for the Blind) Toronto
and by tactile mapping specialists from the Inter-
national Cartographic Association Commission for
Maps and Graphics for Blind and Visually Impaired
Users and the Pan-American Institute of Geography
and History. The final map symbols used in the
atlas were determined by consultations with Tac-
tile Vision Inc. and through the interviews with
both teachers and students at several schools dis-
cussed previously. The overall density of informa-
tion is very low because the atlas was intended for
use by both blind and visually impaired users. All
features have both Braille and large print text
annotations, again because of the dual audiences.
In the atlas’s second edition, the visually low maps
have been separated from the tactile maps, which
facilitates the map printing process and could
potentially reduce the cost of publication.
Students and teachers at the W. Ross Macdonald
School gave the atlas a very positive review; they
particularly liked the size and content of the maps
and the reproduction method. The school
expressed interest in further collaborating with
the MSB to develop a series of Tactile Thematic
Atlases to teach geography within the secondary
school curriculum. At the present time, the MSB is
developing a Canada Geo-Science volume in coop-
eration with Geological Survey of Canada that will
provide the opportunity to work on a set of carto-
graphic symbols for the thematic tactile maps. The
research component of the project includes experi-
mentation with the use of voice annotations to
augment the amount of information conveyed on
the tactile maps.
The tactile atlas of Canada has also been well
received by the professional cartographic commu-
nity. The CNIB was presented with copies of the
atlas for each of its centres in Canada in the spring
of 2003. Through the auspices of the Government
Publications Depository Program, copies of the
Ontario
Thunder BayL Superior
L Huron
Ottawa
L ErieWindsor
L Michigan
USAQC
LO
MB
Hudson Bay
James Bay
200 km
TO
Figure1
The tactile atlas of Canada, province of Ontario
The Canadian Geographer / Le Geographe canadien 47, no 4 (2003)
Enhancing spatial learning and mobility training 485

atlas will be sent to the main map libraries across
Canada. Copies can also be obtained from the
Canadian Association of Education Resources
(CAER), which specialises in providing educational
material to people with disabilities. Users can also
download the files of the atlas from the Mapping
for Visually Impaired Project web site (Natural
Resources Canada 2003b).
The tactile atlas provincial and territorial maps
were produced by tracing selected features from
the 1 : 6,000,000 digital map of Canada, using the
Corel Draw illustration program. The map of
Canada was produced using the 1 :30,000,000
map file. The selection of Corel Draw was influ-
enced by the popularity of this program at CNIB
centres, as well as by its use by Tactile Vision Inc.,
the company that printed the atlas for hardcopy
publication. The atlas files were sent to Tactile
Vision Inc. via e-mail. The digital files available
for downloading from the MVI project web site
are published in multiple formats—each tactile
map is available in three versions: (1) in text, (2) in
Braille and (3) in Braille combined with text, and
in three computer formats: (a) in GIF (Graphics
Interchange Format) used for previews, (b) in
Corel Draw (CDR format) for downloading and edit-
ing and (c) in PDF (Portable Document Format) for
downloading and printing.
Topographic city area maps for mobility training
Topographic city area maps were produced to
demonstrate how such maps could be used to
enhance mobility by providing users with general
knowledge of the surroundings in which they live
or work. The production of city area maps was
based on the 1 :50,000 topographic map series
produced by the MSB. However, the information
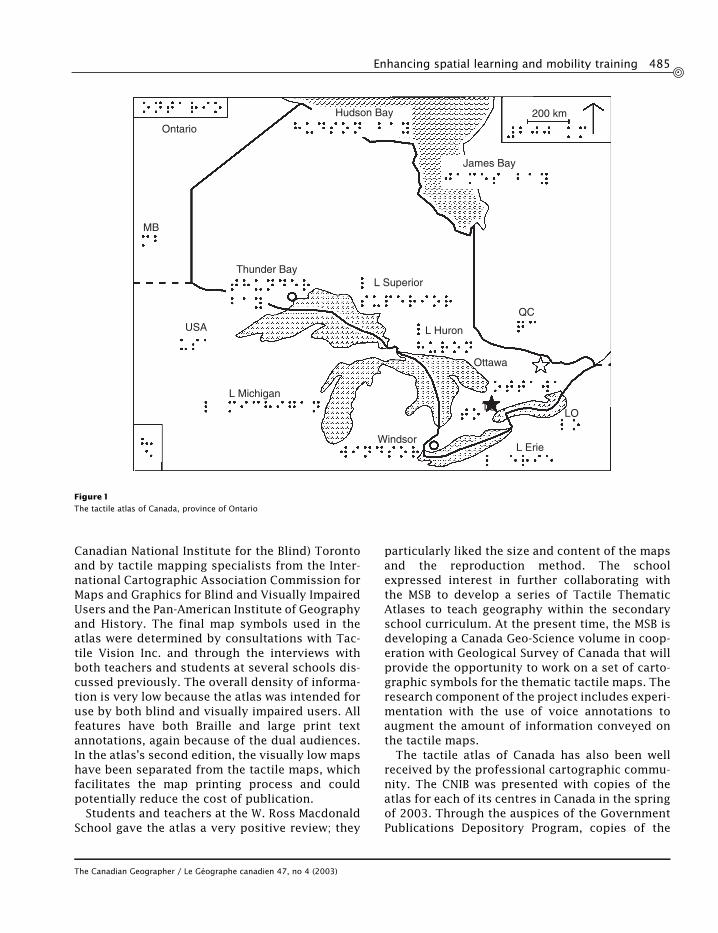
selected for this tactile map (Figure2) was limited
to major features such as main and secondary
streets (represented by continuous lines of varying
thickness) and the main topographic landmarks
such as railways (represented by dashed lines).
Features important for mobility training, such as
the location of buildings, were then added. Only
main streets were annotated in Braille because of
the limited space on this type of tactile map. When
producing these maps, especially in choosing the
amount of information to be included, MSB
researchers collaborated closely with the mobility
training instructors at the CNIB. The recent addi-
tion of audio-tactile and haptic elements to these
maps promises to extend their educational value.
These maps, used online in conjunction with a
digital tablet, make it easier for the user to learn
spatial information by allowing interaction with
the maps.
This map was produced specifically for ‘Angelo’
(a CNIB liaison to the federal government programs
and a congenitally blind man), who has lived in
Ottawa for the past three years. His house is symbo-
lised by a solid square with the address annotated.
After reading the map, Angelo was shocked to
learn that the main street along which he had
been taking the bus on a regular basis actually
turned south before his home. He was also sur-
prised at the amount of open space in his neigh-
borhood and now understood why he could never
walk to the area east of his home—there were no
connecting streets. After viewing a map of down-
town Ottawa he expressed surprise at howwide the
Ottawa River is. His final comment: ‘I have learned
more about Ottawa in the last half hour than I have
in the last three years of living here!’
Most of the mobility training maps were pro-
duced using Corel Draw, a program which is used
in some mobility training centres in Ontario, Nova-
Scotia and Quebec (the provinces with which we
have already established cooperation). Any digital
files can be used as base maps. We used digital
topographic map data available at the MSB, the
Internet map files, as well as digital city map files
from MapArt. The procedure used for the creation
of these maps has been published on the MVI pro-
ject web site (Natural Resources Canada 2003c). A
user manual has been prepared for use by the Web-
4-All and Community Access Programs of Industry
Canada (User Kit 2002). To produce high-quality
tactile maps, the user needs to have a thermal
image enhancer; otherwise, a regular Braille print-
er that has a graphic mode can be used.
Audio-tactile and haptic, multimedia interactivemaps
The Internet environment facilitates the creation
and use of multimedia interactive tactile maps.
These online maps add audio and voice annotation
(text tags read by a screen reader) and haptic fea-
tures, extending the usability and content richness
of their raised ink counterpart. The most useful
characteristic of multimedia maps is the capability
The Canadian Geographer / Le Geographe canadien 47, no 4 (2003)
486 Eva Siekierska et al.

to add voice annotation to selected map features.
Audio feedback is initiated when the user moves
the cursor (or the finger on a touch tablet) over a
map feature. For example, moving over a water
element causes a splashing sound to be played.
Crossing a provincial boundary initiates a clicking
sound. Haptic effects are added to provide addi-
tional clues for finding and distinguishing various
map features. When a haptic mouse crosses var-
ious map features, the user feels different vibra-
tions. The presence of a sound or a vibration
prompts the user to click on the feature at which
time its name is read by the screen reader. The
ability to add additional information about various
map elements overcomes one of the main draw-
backs of tactile maps—namely the low density of
information on these maps. The use of audio ele-
ments has made it possible to put a large amount
of information into the map without adding to its
visual clutter.
The interactive maps on the MVI web site were
created using the new SVG format that is becoming
a recognised standard for the creation of inter-
activemaps on theWeb. An example of an interactive
map is a map of the city of Iqaluit (Figure3) that
was produced using a map-drawing package
500 Metres NorthHuntclub Park
Walkley Rd
CN Railway
Haw
thor
n R
d
Celini Cr
Johnson Rd
Con
roy
Rd
Huntclub Rd
Blohm Dr
Figure2
Topographic city area map for mobility training
The Canadian Geographer / Le Geographe canadien 47, no 4 (2003)
Enhancing spatial learning and mobility training 487
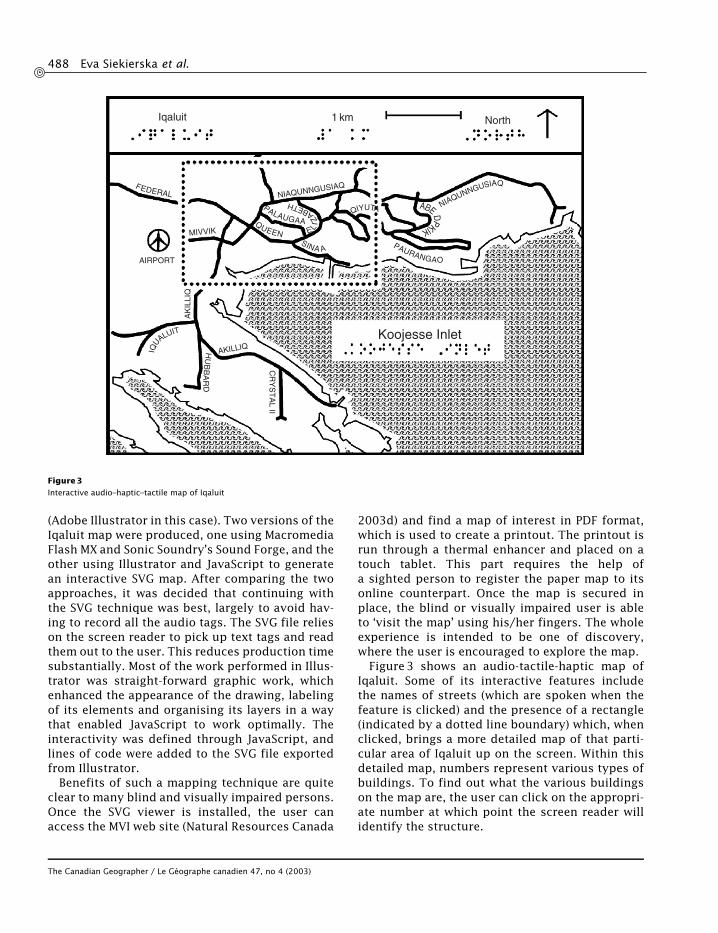
(Adobe Illustrator in this case). Two versions of the
Iqaluit map were produced, one using Macromedia
Flash MX and Sonic Soundry’s Sound Forge, and the
other using Illustrator and JavaScript to generate
an interactive SVG map. After comparing the two
approaches, it was decided that continuing with
the SVG technique was best, largely to avoid hav-
ing to record all the audio tags. The SVG file relies
on the screen reader to pick up text tags and read
them out to the user. This reduces production time
substantially. Most of the work performed in Illus-
trator was straight-forward graphic work, which
enhanced the appearance of the drawing, labeling
of its elements and organising its layers in a way
that enabled JavaScript to work optimally. The
interactivity was defined through JavaScript, and
lines of code were added to the SVG file exported
from Illustrator.
Benefits of such a mapping technique are quite
clear to many blind and visually impaired persons.
Once the SVG viewer is installed, the user can
access the MVI web site (Natural Resources Canada
2003d) and find a map of interest in PDF format,
which is used to create a printout. The printout is
run through a thermal enhancer and placed on a
touch tablet. This part requires the help of
a sighted person to register the paper map to its
online counterpart. Once the map is secured in
place, the blind or visually impaired user is able
to ‘visit the map’ using his/her fingers. The whole
experience is intended to be one of discovery,
where the user is encouraged to explore the map.
Figure3 shows an audio-tactile-haptic map of
Iqaluit. Some of its interactive features include
the names of streets (which are spoken when the
feature is clicked) and the presence of a rectangle
(indicated by a dotted line boundary) which, when
clicked, brings a more detailed map of that parti-
cular area of Iqaluit up on the screen. Within this
detailed map, numbers represent various types of
buildings. To find out what the various buildings
on the map are, the user can click on the appropri-
ate number at which point the screen reader will
identify the structure.
Iqaluit 1 km North
AIRPORT
MIVVIK
AKILLIQ
AK
ILLI
Q
CR
YS
TA
L II
NIAQUNNGUSIAQ
Koojesse Inlet
QIYUTA
E LI
Z
ABETH
QUEENSINA A
ABE DPKIK
NIAQUNNGUSIAQ
PALAUGAA
FEDERAL
PAURANGAO
HU
BB
AR
D
IQUALUIT
Figure3
Interactive audio–haptic–tactile map of Iqaluit
The Canadian Geographer / Le Geographe canadien 47, no 4 (2003)
488 Eva Siekierska et al.
At the present time, the SVG viewer is not
included in the commonly used Web browsers;
however, one can download an SVG browser free
of charge (at the MSB, we use Adobe’s SVG viewer).
Moreover, Microsoft and Netscape plan to include
SVG functionality in future releases of their brow-
sers. All the maps—city approach maps and city
core maps—produced for the Web-4-All project
component (developed in cooperation with Indus-
try Canada) and maps for transportation and tour-
ism (developed in cooperation with Transport
Canada) are available in SVG format (Brunet and
McCurdy 2003). An interactive map of Canada, in
SVG format, is also available on the MVI project
web site (Research and Development, Maps for
Transportation and Tourism, Maps for Web-4-All
sections). These maps highlight some of the
advantages of the SVG format.
Plans for the Future
The Mapping for the Visually Impaired Project web
site has five main components: maps for educa-
tion, maps for mobility, maps for transportation
and tourism, maps for Web-4-All and research
and development. This section of the paper out-
lines the work being planned in each of these
areas.
Maps for education
The project team strongly believes that blind and
visually impaired Canadian children should have
improved access to maps for learning geography,
history or any subject with a spatial component.
The goals include providing every blind and
visually impaired student with access to the tactile
atlas of Canada, as well as to a voice-annotated and
Internet-enabled version. Partnerships with the
educational community and government programs
such as SchoolNet (Industry Canada 2003c) are
being developed to help achieve this goal, particu-
larly the incorporation of tactile maps into school
curricula and making them an integral part of the
SchoolNet program. The MSB also plans to produce
thematic, issue-oriented, tactile and audio-tactile
atlases that may include themes such as popula-
tion, the environment and land use (Fortin 2003).
Other groups within Natural Resources Canada
(NRCan) are interested in developing maps acces-
sible to blind and visually impaired users. The
Geological Survey of Canada, for example, has
expressed interest in developing tactile geological
maps of the country. GeoAccess, a division within
NRCan, is interested in cooperating in the develop-
ment of the Tactile Thematic Atlas of Canada,
linked to its national electronic atlas program. Suc-
cessful completion of these initiatives can move
Canada towards a systematic program to produce
maps for blind and visually impaired students
throughout the country.
Maps for mobility
Staff members of the Mapping for the Visually
Impaired Project have trained CNIB mobility
instructors in Ottawa to produce topographic city
area maps using computer-based methods in the
Internet environment. These instructors have
found that maps greatly assist in mobility training
and have recommended that similar programs be
adopted in other CNIB offices across Canada. The
possibilities of establishing a more widespread
program will depend on further evaluation of the
methods and their adoption by the organisation’s
executive. The MSB is also working to promote the
creation of mobility maps for schools and univer-
sity campuses. At least one Canadian university—
York University in Toronto—has special funds
available for such products. The MSB intends to
approach other universities to identify similar pro-
grams and promote their creation where none
exist.
Technology such as the GPS-based voice guiding
systems may improve the mobility of the blind.
These systems can help blind users locate their
position and use voice-synthesising systems to
reach their destination (examples are systems
developed by the Sendero Group and the Victor
Trekker developed by VisuAide). The appearance
of powerful, wireless, hand-held computing
devices combined with a GPS also provides
the potential for small, consumer-grade mobility
systems.
Both maps for education and maps for mobility
require data. Through private-sector initiatives,
technology-based ones using geospatial data, GPS
and voice-guided systems are available in most
major cities in the United States. Though the tactile
mapping project would like to encourage Canadian
industry to develop similar assistive technology
systems for Canada, the high cost of acquiring
The Canadian Geographer / Le Geographe canadien 47, no 4 (2003)
Enhancing spatial learning and mobility training 489

digital data has been a major impediment to
developing a marketable system. Canadian com-
panies that provide this type of way-finding tech-
nology are typically small and purchase of the
required data is beyond their means. At present,
the Government of Canada’s policy on the distribu-
tion of digital data is under review, with a view to
broadening dissemination as widely as possible.
If potential changes result in reducing the cost of
digital geospatial data for consumers, then the
development of GPS-based navigation systems
would likely advance.
Maps for transportation and tourism
This section of the Web site provides general inter-
est maps at various scales. Most of the maps in this
section are interactive maps based on the SVG
technology. At the present time, there are more
than 20 maps of various regions of Canada,
ranging from Bowen Island in British Columbia to
Iqaluit in Nunavut and St. John’s in Newfoundland
and Labrador. Further development of such maps
depends on the funding priority of the Govern-
ment on Line, Information and Services for Persons
with Disabilities cluster.
Maps for Web-4-All
The Web-4-All project of Industry Canada was
developed to help meet the public Internet access
need of people with disabilities and literacy issues
(Industry Canada 2003b). Web-4-All combines
hardware and software components to quickly
configure public access computers to accommo-
date the special needs of a user through the use
of a ‘smart card’ that stores the user’s computer
set-up preferences. Web-4-All Community Access
Champion sites will include a thermal image
enhancer and a touch tablet to provide access to
maps posted on the MVI project web site. In
2003, this equipment will be available in six
communities: Cowichan Valley, British Columbia;
Winnipeg, Manitoba; Oxford County, Ontario;
Drummondville, Quebec; St. John’s, Newfoundland
and Labrador; and Iqaluit, Nunavut. Two types of
maps—a city approach map and a city core map—
have been produced for each of the locations.
A pilot study has been planned to evaluate the
effectiveness of providing tactile and audio-tactile
map-reading and production facilities at various
community access sites (Industry Canada 2003a).
If this approach is found to increase program out-
reach and to provide effective access to Natural
Resources Canada’s map data by blind and visually
impaired citizens, a wider implementation will be
considered. The potential exists to provide thou-
sands of publicly accessible tactile map-enabled
sites across Canada.
Research and development
The research and development component of
the project addresses further improvements in
communicating geographic information using
techniques such as computer-based tactile and
audio-tactile mapping and encompasses both
technology- and user-based objectives. In keeping
with the GoL project framework, a primary interest
of the project team is to enhance Internet-based
dissemination of tactile multimedia maps through
applied research, undertaking much of it in colla-
boration with other government departments, aca-
demic units, industry partners and user
communities.
One of the key challenges to providing an effect-
ive user interface in a network environment is the
delivery of real-time tactile data. Currently, tactile
maps can be distributed as a file over a network,
printed locally and then embossed to produce a
tactile map. However, the printing and embossing
stage delays user access to the map and adds cost
and complexity to the system. Finding a more effi-
cient method of delivering information indepen-
dent of hardcopy maps is the next logical step of
research that could be undertaken. The MSB’s goal
is, ultimately, an Internet-enabled system that will
allow content to be dynamically delivered to an
audio-tactile tablet that can electronically activate
tactile elements to produce a map. In this way, the
printing step can be eliminated, saving both time
and cost and reducing environmental impact. Such
a system could deliver up-to-date maps to the user
from the most recent source of information avail-
able through Canada’s National Geo-spatial Data
Infrastructure.
Another challenge, especially for mapping a
large country like Canada, is to enable the user to
navigate from map to map to map. How does the
user move seamlessly from maps of British Colum-
bia to maps of Newfoundland and Labrador? How
does the user move easily and seamlessly from an
The Canadian Geographer / Le Geographe canadien 47, no 4 (2003)
490 Eva Siekierska et al.
Ontario map to a downtown Ottawa map? This is
already possible for the sighted user, and now the
challenge is to make it possible for the blind and
visually impaired user.
Automating map production from existing data
sets is a third area that could benefit from further
research. An automated system could deliver up-
to-date maps to the user from the most recent
sources of information available through Canada’s
National Geo-spatial Data Infrastructure. In addi-
tion to the cost considerations previously men-
tioned, there are also technical challenges in
accessing the geospatial data required to create
tactile maps. The project will evaluate different
methods of acquiring digital base map data, jud-
ging each on accessibility, cost and user-friend-
liness. The feasibility of decreasing production
costs and increasing production speed will also
be investigated.
The use of audio information, with or without
voice, adds another dimension to the map-reading
or map-making experience for blind and visually
impaired persons. Tactile maps are, by nature,
very generalised and include only the most basic
information. The use of voice provides a method
for representing additional information about fea-
tures such as, for example, user-inputted persona-
lised commentaries (‘this is my house’). The ability
to add audio is presently available at the MSB.
Furthermore, the ability to add commentaries by
users will result in the creation of customised
maps that will meet individual user requirements
and may help in the updating of tactile maps.
The project will also strive to expand knowledge
in areas such as cognition, map-reading and spa-
tial learning abilities through user-based research
aimed at developing guidelines and systematic
methodologies for producing tactile multimedia
maps that can be distributed over the Internet.
Conclusion
At the present time, blind and visually impaired
Canadian citizens have limited access to maps and
geospatial information. New Internet-based tech-
nologies, however, can enable the cost-effective
production of tactile and audio-tactile maps. As
well, the development of touch- and voice-based
interfaces will make maps and geospatial data on
the Internet widely available. Natural Resources
Canada is the country’s largest producer of maps
and geospatial information; the goal of the Mapping
for Visually Impaired project, carried out within the
Earth Sciences Sector, is to make this information
available for further education and to facilitate
mobility training.
Further research is now needed to solve the many
remaining technical issues pertaining to the access-
ibility of Internet-based geospatial data and the
production and use of tactile and audio-tactile
maps regardless of the source of the data. Research
on how to effectively and efficiently (from a cogni-
tive perspective) convey Internet-based geospatial
information to blind and visually impaired persons
and how they understand and make use of this
information is also needed. While the field of
tactile mapping is not new, research within the
MSB has been only recently initiated, and feed-
back obtained from user communities, including
interviews conducted with visually impaired and
blind students and teachers, and the professional
cartographic community has been encouraging.
The partnerships established with the academic,
industrial research and user communities promise
to facilitate a systematic approach and ensure that
the research, results and outcomes benefit the
widest possible audience.
References
ANDREWS, S.K. 1985 ‘The use of capsule paper in producing tactile
maps’ Journal of Visual Impairment & Blindness 79, 396–399
BLADES, M., UNGAR, S. and SPENCER, C. 1999 ‘Map use by adults with visual
impairments’ Professional Geographer 51, 539–553
BRUNET, L., and MCCURDY, B. 2003 ‘Mapping for the blind and vision
impaired’ Internal Project Report, Mapping Services Branch,
Earth Sciences Sector, Natural Resources Canada, 31 March
2003
BULATOV, V., and GARDNER, J. 1998 ‘Visualization by people without
vision’ Proceedings, Content Visualization and Intermedia
Representations (CVIR), University of Montreal, 15 August 1998
—.1999 ‘Accessing object-oriented Web graphics’ Proceedings,
CSUN International Conference on Technology and Persons
with Disabilities (Los Angeles, CA) 17–20 March 1999
COULSON, M.R.C. 1991 ‘Tactile-map output from geographical informa-
tion systems: the challenge and its importance’ International
Journal of Geographical Information Systems 5, 353–360
COULSON, M.R.C., RIEGER, M. and WHEATE, R. 1991 ‘Progress in creating
tactile maps from Geographic Information Systems (GIS) output’
Proceedings, ICA 15th Conference on ‘Mapping the Nations’,
Vol. 1, ed K. Rybaczuk and M. Blakemore, 167–174
DACEN, D.L. 1987 ‘Tactual mobility mapping for the visually handi-
capped’ Master of Science Thesis, The University of Calgary.
Canadian Theses on Microfiche (Ottawa: National Library of
Canada)
The Canadian Geographer / Le Geographe canadien 47, no 4 (2003)
Enhancing spatial learning and mobility training 491
DEAR, M., WILTON, R., GABER, S.L. and TAKAHASHI, L. 1997 ‘Seeing people
differently: the sociospatial construction of disability’ Environ-
ment and Planning D: Society and Space 15, 455–480
DODDS, A.G. 1989 ‘Tactile maps: a psychologist’s perspective’ Carto-
graphic Journal 26, 3–6
DOUGLAS, G., TOBIN, M., BOZIC, N. and HILL, E. 1997 ‘MoBIC. A system
for facilitating independent mobility and navigation for blind
people’ Proceedings, ICEVI’s 10th World Conference, Sao Paulo,
Brazil, 3–8 August 1997
FORTIN, A. 2003 ‘Mapping for a visually impaired audience: A case
study on the legibility and cognition of tactile maps for educa-
tion’ Master of Arts Thesis, Carleton University
GARDNER, J.A. 1996 Tactile Graphics, an Overview and Resource Guide
http://dots.physics.orst.edu/tactile/tactile.html (dated May
1996, accessed April 2003)
GARDNER, J.A., and BULATOV, V.B. 2001 ‘Smart figures, SVG, and accessi-
ble web graphics’ Proceedings, 2001 CSUN International Confer-
ence on Technology and Persons with Disabilities (Los Angeles,
CA) 21–24 March 2001
GLEESON, B.J. 1996 ‘A geography for disabled people?’ Transactions of
the Institute of British Geographers NS 21, 387–396
—. 1999 ‘Can technology overcome the disabling city?’ inMind and
Body Spaces: Geographies of Illness, Impairment and Disability
ed R. Butler and H. Parr (New York: Routledge) 98–118
GOLLEDGE, R.G. 1993 ‘Geography and the disabled: a survey with spe-
cial reference to visually impaired and blind populations’ Trans-
actions of the Institute of British Geographers NS 18, 63–85
—. 1996 ‘A response to Gleeson and Imrie’ Transactions of the
Institute of British Geographers NS 21, 404–411
GOLLEDGE, R.G., BLADES, M., KITCHIN, R.M. and JACOBSON, R.D. 1999 ‘Under-
standing geographic space without the use of vision’ National
Science Foundation, Final Report SBR 95-14907, January 1999
GOLLEDGE, R.G., KLATZKY, R.L., LOOMIS, J.M., SPEIGLE, J. and TIETZ, J. 1998 ‘A
geographical information system for a GPS-personal guidance
system’ International Journal of Geographical Information Sys-
tems 12, 727–749
GOLLEDGE, R.G., LOOMIS, J.M., KLATZKY, R.L., FLURY, A. and YANG, X.L. 1991
‘Designing a personal guidance system to aid navigation with-
out sight: progress on the GIS component’ International Journal
of Geographical Information Systems 5 (4), 373–395
GOVERNMENT OF CANADA. 2003 Persons with Disabilities Online Portal
http://www.pwd-online.ca/en/home.jsp (updated 3 April 2003,
accessed 8 April 2003)
HAMPSON, P.J., and DALY, C.M. 1989 ‘Individual variation in tactile map
reading skills: some guidelines for research’ Journal of Visual
Impairment and Blindness 83, 505–509
IMRIE, R. 1996 ‘Ableist geographies, disablist spaces: towards a
reconstruction of Golledge’s ‘ ‘‘Geography and the disabled’’ ’
Transactions of the Institute of British Geographers NS 21,
397–403
INDUSTRY CANADA. 2003a Community Access Program of Industry
Canada http://cap.ic.gc.ca/english/hub.shtml (updated 18
December 2002, accessed 8 April 2003)
—. 2003b. Web Accessibility Office of Industry Canada http://
www.web4all.ca/w4asite/english/home_e.htm (updated 4
April 2003, accessed 8 April 2003)
—. 2003c Canada’s SchoolNet http://schoolnet.ca (updated 3 April
2003, accessed 8 April 2003)
JACOBSON, R.D. 1994 ‘Navigation for the visually handicapped: Going
beyond tactile cartography’ Swansea Geographer 31, 53–59
—. 1998 ‘Navigating maps with little or no sight. An audio-tactile
approach’ Proceedings, Content Visualization and Intermedia
Representations (CVIR), University of Montreal, Montreal, 15
August 1998
JACOBSON, R.D., and KITCHIN, R. 1997 ‘GIS and people with visual
impairments or blindness. Exploring the potential for
education, orientation and navigation’ Transactions in GIS 2,
315–332
KITCHIN, R.M., BLADES, M. and GOLLEDGE, R.G. 1997 ‘Understanding spatial
concepts at the geographic scale without the use of vision’
Progress in Human Geography 21, 225–242
LEDERMAN, S.J. 1979 ‘Tactual mapping from a psychologist’s pers-
pective’ Association of Canadian Map Libraries, Bulletin 32,
21–25
LOOMIS, J., GOLLEDGE, R.G., KLATZKY, R.L. 1998 ‘Navigation system for
the blind: auditory display modes and guidance’ Presence 7,
193–203
MORSLEY, D.K., and SPENCER, C.P. 1988 ‘The use of maps and models by
visually impaired children between the ages of 5 and 11: how
useful are they?’ Proceedings, ed A.F. Tatham and A.G. Dodds
(2nd International Symposium on Maps and Graphics for
Visually Handicapped People) 54–64
NATURAL RESOURCES CANADA. 2003a Mapping for the Visually Impaired
http://tactile.nrcan.gc.ca/ (updated 31 March 2003, accessed 8
April 2003)
—. 2003b Mapping for Visually Impaired, Maps for Education, the
Tactile Atlas of Canada http://tactile.nrcan.gc.ca/page.cgi?url
=education/index_e.html (updated 31 March 2003, accessed 8
April 2003)
—. 2003c Mapping for Visually Impaired, Maps for Mobility http://
tactile.nrcan.gc.ca/page.cgi?url=mobilite_mobility/index_e.html
(updated 31 March 2003, accessed 8 April 2003)
—. 2003d Mapping for Visually Impaired, Maps for Transportation
and Tourism http://tactile.nrcan.gc.ca/page.cgi?url=transports
_transportation/index_e.html (updated 31 March 2003,
accessed 8 April 2003) and Web-4-All Maps http://tactile.
nrcan.gc.ca/page.cgi?url=webpourtous_w4a/index_e.html
(updated 28 February 2003, accessed 8 April 2003)
PARENTE, P., and BISHOP, G. 2003 ‘BATS: The blind audio tactile mapping
system’ ACMSE (Savannah, GA) March 2003
PARKES, D. 1988 ‘ ‘‘Nomad’’ ’: an audio-tactile tool for the acquisition,
use and management of spatially distributed information by
partially sighted and blind persons’ Proceedings, ed A.F. Tatham
and A.G. Dodds (2nd International Symposium on Maps and
Graphics for Visually Handicapped People) 54–64
PARR, H., and BUTLER, R. 1999 ‘New geographies of illness, impairment
and disability’ in Mind and Body Spaces: Geographies of Illness,
Impairment and Disability ed R. Butler and H. Parr (New York:
Routledge) 1–24
PASSINI, R., PROULX, G. and RAINVILLE, C. 1990 ‘The spatio-cognitive
abilities of the visually impaired population’ Environment and
Behaviour 22, 91–118
RESSOURCES NATURELLES CANADA. 2003 Le portail de la Cartographie
pour les personnes ayant une deficience visuelle http://
tactile .nrcan.gc.ca/page.cgi?url=index_f.html (mise a jour le
1 avril 2003, consultee le 9 avril 2003)
SIEKIERSKA, E.M., and LABELLE, R. 2001 Project Report – Tactile and Audio-
Tactile Mapping Internal Report, Mapping Services Branch,
Natural Resources CanadaSIEKIERSKA, E.M., LABELLE, R. and O’NEIL, L. 2001 ‘Tactile Mapping Project at
Canadian Federal Mapping Agency – Mapping Services Branch’
Proceedings of the 20th International Cartographic Conference,
Mapping the 21 Century, ICC 2001 (Beijing, China) 6–10 August
2001, 2932–2942
The Canadian Geographer / Le Geographe canadien 47, no 4 (2003)
492 Eva Siekierska et al.
TATHAM, A.F. 1990 ‘Opening the London underground to visually
handicapped tourists’ Cartographic Journal 27, 143–145
—.1991 ‘The design of tactile maps: theoretical and practical
considerations’ Proceedings, ed K. Rybaczuk and M. Blakemore
(ICA 15th Conference ‘Mapping the Nations’) 157–166
TREASURY BOARD CANADA. 2003 Government On Line Intranet Site
http://publiservice.cio-dpi.gc.ca/gol-ged/index_e.asp (created 14
November 2000, updated 5 October 2001, accessed 8 April 2003)
TURNER, E., and SHERMAN, J.C. 1986 ‘The construction of tactual maps’
American Cartographer 13, 199–218
UNGAR, S., BAYALA, E., BLADES, M., OCHAITA, E. and SPENCER, C. 1997 ‘Use of
tactile maps by blind and visually impaired people’ Cartographic
Perspectives 28, 4–11
USERKIT. 2003Web-4-All, Mapping for the Blind and Visually Impaired
Internal Report, Mapping Services Branch, Natural Resources
Canada
VASCONCELLOS, R. 1996 ‘Tactile mapping design and the visually-
handicappeduser’ inCartographicDesign: Theoretical andPractical
Perspectives ed C.H. Wood, C.P. Keller and C.P. Chichester (UK:
Wiley and Sons) 91–102
The Canadian Geographer / Le Geographe canadien 47, no 4 (2003)
Enhancing spatial learning and mobility training 493
Copyright © 2022 FDOKUMEN