Steel sheet surfaces with enhanced tactile feel
133
Steel sheet surfaces with enhanced tactile feel (STEELTAC) Research and Innovation EUR 27779 EN ISSN 1831-9424 (PDF) ISSN 1018-5593 (Printed)
-
Upload
khangminh22 -
Category
Documents
-
view
0 -
download
0
Transcript of Steel sheet surfaces with enhanced tactile feel

Steel sheet surfaces with enhanced tactile feel
(STEELTAC)
Research and Innovation EUR 27779 EN
ISSN 1831-9424 (PDF)ISSN 1018-5593 (Printed)
EUR 27779
Steel sheet surfaces with enhanced tactile feel (STEELTAC)
EU

Interested in European research?
RTD info is our quarterly magazine keeping you in touch with main developments (results, programmes, events, etc.). It is available in English, French and German. A free sample copy or free subscription can be obtained from:
Directorate-General for Research and Innovation Information and Communication Unit European Commission 1049 Bruxelles/Brussel BELGIQUE/BELGIË Fax +32 229-58220 E-mail: [email protected] Internet: http://ec.europa.eu/research/rtdinfo.html
EUROPEAN COMMISSION Directorate-General for Research and Innovation Directorate D — Key Enabling Technologies Unit D.4 — Coal and Steel
E-mail: [email protected] [email protected]
Contact: RFCS Publications
European Commission B-1049 Brussels

European Commission
Research Fund for Coal and SteelSteel sheet surfaces with enhanced
tactile feel (STEELTAC)
E. van der HeideUniversity of Twente
Drienerlolaan 5, 7522 NB Enschede, The Netherlands
+
V. Sáenz de Viteri, MSc , Dr. A. Igartua, Dr. E. Rodriguez-Vidal, F. PaganoIK4-Tekniker
Calle Iñaki Goenaga, 5, 20600 Eibar, Gipuzkoa, Spain
Dr. B. Wadman & Dr. D. WiklundSwerea IVF
Argongatan 30, 431 53 Mölndal, Sweden
Dr. D.T.A. MatthewsTATA STEEL NEDERLAND TECHNOLOGY B.V.
Wenckebachstraat 1, 1951 JZ Velsen-Noord, The Netherlands
J. Contreras Fortes, MSc Acerinox Europa SAU
Polígono Industrial de Palmones, 11379 Los Barrios (Cádiz), Spain
S. Zhang MScUniversity of Twente
Drienerlolaan 5, 7522 NB Enschede, The Netherlands
Grant Agreement RFSR-CT-2011-00022 01/07/2011 – 31/10/2014
Final reportDirectorate-General for Research and Innovation
2014 EUR 27779 EN

LEGAL NOTICE
Neither the European Commission nor any person acting on behalf of the Commission is responsible for the use which might be made of the following information.
The views expressed in this publication are the sole responsibility of the authors and do not necessarily reflect the views of the European Commission.
More information on the European Union is available on the Internet (http://europa.eu). Cataloguing data can be found at the end of this publication. Luxembourg: Publications Office of the European Union, 2016
Print ISBN 978-92-79-57125-1 ISSN 1018-5593 doi:10.2777/63036 KI-NA-277-79-EN-CPDF ISBN 978-92-79-57124-4 ISSN 1831-9424 doi:10.2777/76205 KI-NA-277-79-EN-N
© European Union, 2014 Reproduction is authorised provided the source is acknowledged. Printed in Luxembourg Printed on white chlorine-free paper
Europe Direct is a service to help you find answers to your questions about the European Union
Freephone number (*):00 800 6 7 8 9 10 11
(*) Certain mobile telephone operators do not allow access to 00 800 numbers or these calls may be billed.

Table of contents
FINAL SUMMARY ................................................................................................ 5
SCIENTIFIC AND TECHNICAL DESCRIPTION OF THE RESULTS .......................... 15 1 OBJECTIVES OF THE PROJECT .................................................................. 15 2 DESCRIPTION OF ACTIVITIES AND DISCUSSION (PER TASK) ............................... 17 Task 1.1 Selection of materials ............................................................ 17
Task 1.2 Production of materials .......................................................... 26
Task 1.3 Determination of selected material properties ........................... 28
Task 1.4 Manufacturing of the test samples ........................................... 41
Task 2.1 State of the Art ..................................................................... 54
Task 2.2 Steel Sheet Textures for functionality ...................................... 56
Task 2.3 Production methods for textured steel sheet ............................. 64
Task 3.1 Tactility ............................................................................... 66
Task 3.2 Wetting behaviour ................................................................. 75
Task 3.3 Formability ........................................................................... 78
Task 3.4 Paint appearance and uni-directional finish ............................... 92
Task 4.1 Project co-ordination ........................................................... 107
Task 4.2 Dissemination of the results ................................................. 107
Task 4.3 Development of guidelines ................................................... 107
Task 4.4 Workshop at End User Location ............................................. 112
3 CONCLUSIONS, INDICATING THE ACHIEVEMENTS MADE .................................. 113 4 EXPLOITATION AND IMPACT OF THE RESEARCH RESULTS ................................. 115
LIST OF FIGURES ............................................................................................ 117
LIST OF TABLES .............................................................................................. 123
LIST OF ACRONYMS AND ABBREVIATIONS ..................................................... 125
ANNEX 1 TEXTURE DESIGNS ........................................................................... 126
ANNEX 2 WORKSHOP ...................................................................................... 129
3

4

Final summary
The technological and scientific objectives of the research conducted within the framework of the STEELTAC project all contributed to the technological goal of the project: producing steel sheet with pre-defined human perception of the surface roughness in an economic, clean and safe way. For that, two technological achievements were formulated in the project plan a) Development of a production method based on surface textured rolling mills and b) Design and development of sheet roughness with pre-defined functionality.
Development of a production method based on surface textured rolling mills
A comprehensive study on present and future materials used for cold rolling and sheet metal forming of stainless steel and of carbon steel resulted in a matrix of materials and surfaces that fit in the current needs of these mass production processes. An overview of the selected sheet materials divided into zinc-coated sheet and stainless steel sheet are given in Table I and II, respectively. A large set of mechanical and chemical properties was measured for the set of sheet materials. Analysis included detailed microstructure and roughness measurements. A stepwise, science-based approach to developing optimised surfaces is adopted in this work. It started with a modelling phase where optimised surfaces are designed. This is conducted within the process bounds of the pulsed laser texturing process and restricted to the functionalities tactility and paint appearance. The proposed validation route consisted of
1. direct pulsed laser texturing, 2. imprinting with pulsed laser textured tools and finally, 3. (pilot mill) rolling trials with pulse laser textured rolls.
The final status of the three manufacturing processes is given below.
Direct LST of sheet material. At the start of the project, different patterns of texturing were applied on flat samples of steel sheets. In this part, the “positive” of the texturing was applied by IK4-Tekniker. These samples were used in the first experiments of WP 3. The most promising texturing patterns were applied to press forming dies used in WP 3. A case which clearly illustrates the status of LST was the reproduction of the 2M and 2G finishes in 2B, 2R without skin pass and 2R with skin pass pre-finishes. With EN-1.4509 the objective was to achieve the surface geometry of the 2G finish by pico-second laser treatment in 2D, 2B and 2R with skin pass pre-finishes. All surfaces were characterised measuring the roughness and analysing the surface by confocal microscopy. The conclusion of this study was that a 2G geometry can be approached when starting with a surface with lower roughness than the objective, i.e. 2G; the results were then much more promising when starting with skin pass prefinished.
Table I Zinc-coated sheet materials produced for the project (Finish Key: GI = Galvanised, NTR = Non-temper-rolled; TR = Temper-rolled)
Code Finish Supplier Sheet thickness
DX 54/56 D
(‘DX54’ or ‘DX56’)
GI-NTR Tata 0.7-0.8 mm
GI-TR Tata 0.7-0.8 mm
HX220YD
(‘YD220’)
MagiZinc NTR Tata 0.7-0.8 mm
GI-NTR Tata 0.7-0.8 mm
GI-TR Tata 0.7-0.8 mm
DP600 GI-NTR Tata ~1 mm
HX180BD GI-NTR Tata 0.7-0.8 mm
5
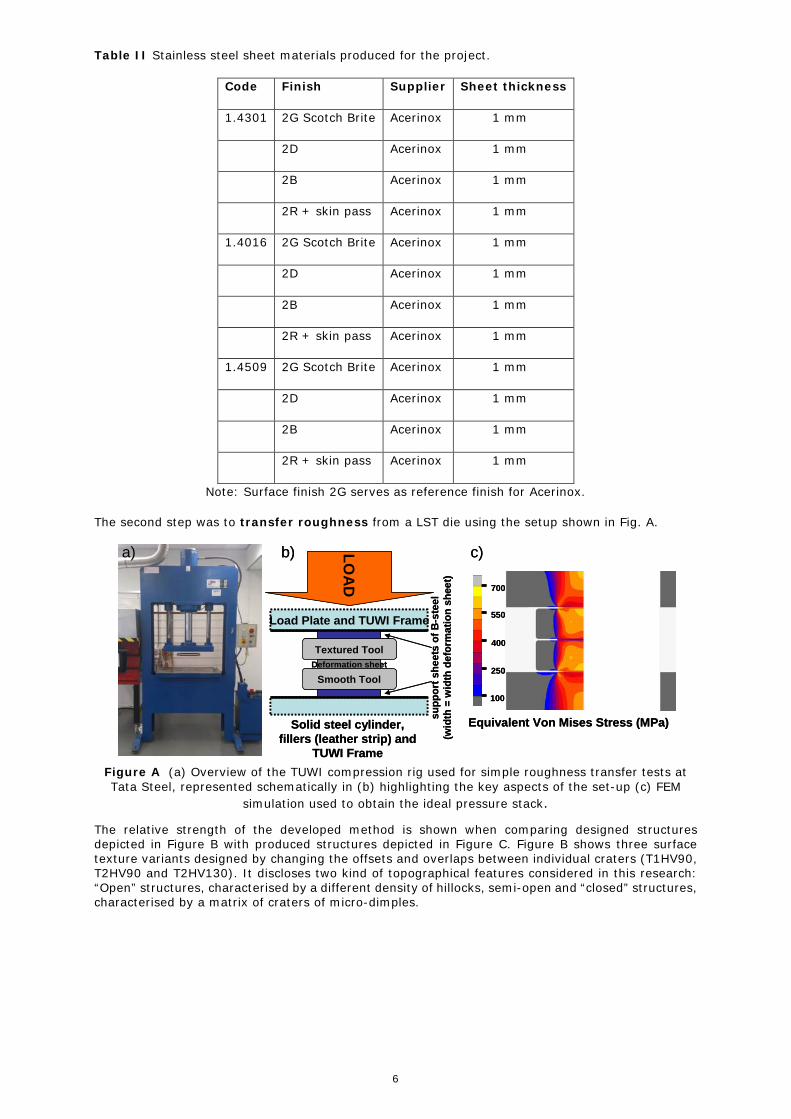
Table II Stainless steel sheet materials produced for the project.
Code Finish Supplier Sheet thickness
1.4301 2G Scotch Brite Acerinox 1 mm
2D Acerinox 1 mm
2B Acerinox 1 mm
2R + skin pass Acerinox 1 mm
1.4016 2G Scotch Brite Acerinox 1 mm
2D Acerinox 1 mm
2B Acerinox 1 mm
2R + skin pass Acerinox 1 mm
1.4509 2G Scotch Brite Acerinox 1 mm
2D Acerinox 1 mm
2B Acerinox 1 mm
2R + skin pass Acerinox 1 mm
Note: Surface finish 2G serves as reference finish for Acerinox.
The second step was to transfer roughness from a LST die using the setup shown in Fig. A.
Figure A (a) Overview of the TUWI compression rig used for simple roughness transfer tests at Tata Steel, represented schematically in (b) highlighting the key aspects of the set-up (c) FEM
simulation used to obtain the ideal pressure stack.
The relative strength of the developed method is shown when comparing designed structures depicted in Figure B with produced structures depicted in Figure C. Figure B shows three surface texture variants designed by changing the offsets and overlaps between individual craters (T1HV90, T2HV90 and T2HV130). It discloses two kind of topographical features considered in this research: “Open” structures, characterised by a different density of hillocks, semi-open and “closed” structures, characterised by a matrix of craters of micro-dimples.
Textured ToolDeformation sheet
Smooth Tool
supp
ort s
heet
s of
B-s
teel
(w
idth
= w
idth
def
orm
atio
n sh
eet)
Load Plate and TUWI Frame
LOAD
Solid steel cylinder, fillers (leather strip) and
TUWI Frame
Equivalent Von Mises Stress (MPa)
100
400
700
250
550
a) b) c)
Textured ToolDeformation sheet
Smooth Tool
supp
ort s
heet
s of
B-s
teel
(w
idth
= w
idth
def
orm
atio
n sh
eet)
Load Plate and TUWI Frame
LOAD
Solid steel cylinder, fillers (leather strip) and
TUWI Frame
Equivalent Von Mises Stress (MPa)
100
400
700
250
550
a) b) c)
6

Figure B Surface texturing designs: “Open” structures (left) , semi-open structures (middle) and “closed” structures (right).
Figure C illustrates the corresponding experimental topographies and heights of craters produced in Uddeholm Rigor by selecting these process parameters.
Figure C Confocal microscopy derived surfaces after laser texturing with patterns a) T2H90V90 b) T1H90V90 c) T2H130V130. The images have been edited in CorelDRAW X6 to form a photorealistic image overlay with a height map of graded transparency across the image diagonals.
In order to gauge the true applicability of the laser texturing process to industrial sized rolls, full upscaling of the process requires the use of additional equipment. Concerning the laser texturing process, a 6-axis robot was used along with a rotary axis. These rolls were utilised in rolling trials conducted on 2 rolling mills. Primarily, rolling trials were performed in the Tata Steel Pilot Mill (named the MultiMill) in 4-high mode, whereby the textured work rolls were driven and supported by back-up rolls. In industrial rolling terms, this set-up is often referred to as “Quattro”. However, due to problems in the mill as will be described, a second series of rolling trials was undertaken to mitigate the need for mill calibrations and to remove influences of back-up roll wear and reduce zinc pick-up on a simple 2-high mill. In both cases, the strip was hand-fed in 150 mm-wide strips of 500 mm to 1000 mm in length. The rolls replicate the expected modelled and lab-scale surfaces.
7

Unfortunately, the calibration procedure of the mill and/or the back-up roll contact is detrimental to the wear of the surfaces and severe work roll fouling occurred due to excessive zinc pick-up. Rolling without Cr-plating only serves to expedite the above problems and indicates a roll coating should be used.
Figure D Confocal microscopy analysis of Surface profiles of the T2H130V130 work roll surface
(left) as textured, (middle) after rolling and (right) after pickling with 10% HCl solution.
After roll cleaning, the rolls were used to roll ONLY stainless steel sheet material so as to avoid the influence of Zn pick-up and the results were rather positive. Figure E shows from surfaces achieved in 1.4301 stainless steel with T2H90V90 and T2H130V130 work rolls at 2% and 5% elongations. The difference in feature density between the two surfaces is clearly distinguishable, and a higher roughness level is recorded for the T2H90V90 surfaces.
8

2% E
long
atio
n
T2H
90V90
Sa
= 0
.394
T2H
130V
130
Sa
= 0
.313
5% E
long
atio
n
T2H
90V90
Sa
= 0
.953
T2H
130V
130
Sa
= 0
.576
Figure E Confocal images of stainless steel 1.4301 as rolled with T2H90V90 and T2H130V130 work rolls in the Tata Steel pilot mill.
The cycle time for the roll texturing process of a pilot roll depends directly on the dimensions of the roll and the kind of target texture patterns. In the case of the rolls and the texture pattern considered in the STEELTAC Project, the cycle time was about 5 hours per roll using the laser system described above. If the upscaling of mill roll laser texturing process were to be used, the cycle time could reduce to more than half. It could be attained by selecting the more suitable laser system for the application. Furthermore, the design and development of a texturing machine that includes key aspects concerning the synchronisation among the different equipment involved in the laser texturing process (rotary axis, lineal axis, laser head (scanner) and laser pulses) must be considered as the next step for the STEELTAC Project.
µm
00.20.40.60.811.21.41.61.822.22.42.62.8
0 200 400 600 800 µm
µm
0
100
200
300
400
500
600
700
800
900
µm
0
0.2
0.4
0.6
0.8
1
1.2
1.4
1.6
1.8
2
0 200 400 600 800 µm
µm
0
100
200
300
400
500
600
700
800
900
µm
0
0.5
1
1.5
2
2.5
3
3.5
4
4.5
50 200 400 600 800 1000 µm
µm
0
100
200
300
400
500
600
700
800
900
µm
0
0.5
1
1.5
2
2.5
3
3.5
4
0 200 400 600 800 1000 µm
µm
0
100
200
300
400
500
600
700
800
900
9

Design and development of sheet roughness with pre-defined functionality
Tactility and wettability
From the presented theory on tactile friction, a strategy was extracted for optimising surfaces with respect to tactility. The key element is minimising the adhesion term of friction by minimising the true area of contact. The strategy is to design a surface with a minimal true contact area in sliding with a human finger pad, while avoiding deformation terms in sliding contact due to indentation by sharp summits, because this will increase friction again. The starting point in texture designs was therefore to reduce friction in sliding contact by reducing the true area of contact, which for compliant contact is controlled largely by the nominal area of contact. The results showed that:
• Laser texturing technology proved to be a precise, reproducible approach for creating tailored structures needed to decrease the true area of contact;
• Reduction was achieved by pillar based structures, grooved channel based structures and a peano curve based structure;
• Scale-up of the technology using a nano-second laser device has been performed successfully, and it seems a promising technology for the future.
Tribological tests were performed at IK4-Tekniker and at the University of Twente in order to study experimentally the effect of designed surface geometries on friction both with a mechanical skin equivalent Lorica and with in-vivo skin. Dynamic touch was assessed by testing panel combined with touch-related questionnaires. All tests were aimed at selecting textures for stainless steel sheet material. A protocol has been developed to screen surfaces according to the previous requirements taking into account roughness properties, contact angle and friction properties, both at the laboratory level and based on cold rolling samples. Secondly, a protocol has been set up for in vivo analysis of the friction properties of the surface assessing the level of comfort, the stickiness tendency, the perceived roughness and the friction coefficient. The results show:
• By means of picosecond laser texturing it has been confirmed that adhesive friction is the dominant mechanism in the friction tests performed, since friction decreased with asperity density, and with the decrease of the apparent / real contact area confirming the model theory predicted by the University of Twente.
• The grids PS3 surface obtained by picosecond laser texturing gives the lower frictional response. This behaviour can be related to their lower apparent / real contact area that reduces the adhesion term of the friction coefficient. This surface geometry shows no directionality (0, 45, 90º) probably due to the circumferential geometrical shape selected for the study.
• High levels of hydrophobicity could be reached with the pillar based surfaces selected for tactility.
• Comparative relative levels of friction can be achieved in laboratory tests with Lorica soft and real fingers when the roughness of the steel surface is low but there is no correlation when roughness is high. This probably due to the fact that the real roughness of the fingers during in vivo testing is greater than the Lorica soft (11-18µm Ra). Level of hydration could be also a factor that influences the lower friction obtained in in vivo tests. The level of hydration varies with the test person. In the future, it is recommended to try to find a counter material with roughness closer to that of the finger and to carry out the laboratory tests under higher and controlled humidity levels in order to work at the laboratory in closed conditions to in vivo tests.
The main results of in vivo tests were as follows:
- The greater level of comfort is achieved with lower friction coefficient. - The greater comfort is related to lower stickiness of the counter surface during touching and
sliding. - The lower the roughness perception, the lower the real roughness was, but their effect was
less pronounced in comparison with the stickiness. - The greater the roughness (until 6-7µm Ra), the lower the friction coefficient was. - The PS3 (7.8 µm Ra) obtained by picosecond laser with low density (width 75 µm) and high
depth (30µm), gives the best level of comfort followed by the one produced by nanosecond laser LDG3 (Depth 30µm, width 100 µm).
- Results indicate that in vivo tests have also been carried out in a regime where adhesive friction was the dominant mechanism since friction decreased with the decrease of the apparent / real contact area achieved with higher roughness levels.
10

- Figure F Surfaces selected with best tactile properties produced by laser ablation with a a) picosecond laser and b) nanosecond laser.
Paint appearance
From the presented theory, a strategy was extracted for optimising surfaces with respect to paint appearance. The key elements were to increase peak counts and reduce waviness, while maintaining sufficient roughness to comply with current customer needs. This approach was taken based on previous RFCS research and empirical rules for EDT textured surfaces, which indicated that the work roll in temper rolling had a major influence on the final strip appearance after painting. It was considered that by increasing peak count values and essentially utilising a non-stochastic texturing method, it would be possible to decouple roughness and waviness, in turn translating into reduced strip waviness and improved paint appearance/forming behaviour. The STEELTAC project has in this sense achieved its goal in proving that high peak count values are attainable for a range of roll roughnesses. However, the project also highlights the intricate interplay between surface design and surface functionality. A robust simulation of the temper rolling process is required to exploit surface design effectively and categorically.
The main conclusions of the work presented are:
• Laser texturing is a promising technique to texture rolls for skin pass mills offering high peak count values at high roughness values, high precision and excellent reproducibility
• A simple roughness transfer setup has been developed which enables roughness transfer characteristics to be assessed and new textures reproduced
• The surface designs in this study are a first step in design optimisation. However, due to the complex nature of the texturing process and temper rolling process, incorporating roll wear, roll fouling and the roughness transfer process, a refined model is not yet achieved.
• The rate of peak count transfer is greater in “closed” systems, most likely due to confined deformation and junction growth.
• The metrology of fully deterministic surfaces is time-consuming and can be ambiguous. A robust method should be considered.
• A wide array of strip roughnesses have been produced and tested with respect to paint (ecoat) appearance.
• Despite the deterministic nature of the picosecond laser texturing (p-LT) process, no problematic Moiré patterns have been recorded on either roll, strip or in the painted samples.
• E-coat paint trials indicate that laser textured surfaces can offer the same paint appearance with higher surface roughness values in comparison with EDT, while it is also positive to achieve STEELTAC goals on tactility and hydrophobicity.
• The influence of the e-coat/paint layer itself plays a significant role in the final paint appearance – perhaps outweighing the role of the substrate texture.
• While the principal conclusion of the RFCS CARSTEEL project [1] and the simplistic starting point are true (waviness of Hot Dip Galvanising (HDG) surfaces can be influenced by the skin-pass process), the entire system of strip + paint layers should be engineered together for optimised paint appearance.
• In order to protect and offer longevity to designed roll surfaces, suitable coating for rolls is required which can replace Cr-plating in “following” a designed surface texture/roughness profile.
• Laser textured surfaces exhibit improved frictional behaviour with (sheet) friction testing trials indicating that a shallow open network is advantageous in reducing forming-related friction, although the generation of a full Stribeck curve should be developed in the future.
11

• Industrial upscaling of the laser texturing process is surely on the horizon; however, despite the promising technique, there are limited suppliers of the technology.
• An industrial trial of laser textured rolls is strongly recommended, incorporating full substrate analysis up to painted parts.
• Limitations in upscaling of p-LT include laser placement for replication of texture design, specifically in relation to circumferential processing.
• The generation of non-deterministic or quasi-deterministic textures may circumvent this drawback or expedite the use of laser texturing and would exploit the precise control of the laser beam/laser head positioning in repetitive crater formation.
• Laser processing is developing at a rapid rate and the European steel industry should be ready to exploit its clear benefits for improved roll roughness control and improved product quality at the customers.
Formability
All the studied stainless steels with as delivered surface condition meet the typical values of formability: anisotropy, work-hardening exponent, Erichsen, Hole Expansion and LDR. The best results of anisotropy, Hole Expansion and LDR were obtained with the ferritic EN-1.4509 and of Erichsen with the austenitic EN-1.4301. With regard to the influence of the laser textured in formability, it showed that in comparison the formability of simulated 2G laser textures (E13) and design (1H90/1H130), the E13 has greater hole expansion than paint (1H90/1H130). Greater elongation on laser textured samples give greater hole expansion and lower Erichsen values. In general, with respect to the surface finish influence on the formability behaviour of the selected stainless steel, the best results of Erichsen, Hole Expansion and LDR have been found for tactility design textures, simulating 2G (E13), followed by the paint ability ones (1H90/1H130).
Concerning the effect of the lubricant, the main results show that Rhenus (one of the alternative lubricants proposed in STEELTAC) gives better Erichsen than Vaseline, which also has one of the highest efficiencies. By tapping torque tests, although Houghto-Draw presented the best results, the presence of chlorine means that it has to be discarded as the best alternative. Therefore Rhenus LA 722083 was considered the best option since it was also effective at rates of 5%. Comparing the effect of texturing in lubricant efficiency, the textured EN 1.4509 steel sheets had better lubrication efficiency when they were rolled with rolls textured by laser. This effect was seen in the transferred pattern 01H90V90 which had a lubrication efficiency greater than the surface finishing used as references E13 and 2G. In the case of IF qualities from TATA, texturing reduces the efficiency with the tested lubricants.
The completed attempts did not show any tendencies to increase the susceptibility of galling. In the forthcoming development of tactile textures the roughness and peak counts could therefore be useful guidance in order to maintain or enhance the wear performance of the textures. For a good paintability, the texture should be rougher (Ra-value > 0.7 µm). Increased roughness could be favourable for the galling resistance but adversely affects the process window: for example, the 2D surface reduced the formability index by 33%. The tactile texture did show a minor influence: a reduction of 12 %. Consequently, a roughness of the same order as or less than the tactile texture (Ra-value < 0.6 µm, 2%- elongation) would still exhibit acceptable formability. Again, the roughness could be used as a guiding value but it should be remembered that other properties could also influence the frictional response, e.g. skewness and anisotropy. Further, the maximum drawing depth of the tactile texture was not much influenced: a reduction of just 1% was achieved.
On the tactile surface a substantial orange peel effect was developed during the forming operation. The orange peel effect was more apparent on the tactile texture than the original smooth texture it was superimposed on. The tactile surface is rougher than the original (2R+SKP) texture and could easier release orange peel effects. Therefore a more fine grain structure (> 4.7) should therefore be considered if the appearance is to be acceptable after forming operations.
12

Table III Forming efficiency (%) of textured surfaces, with different lubricants in relation to reference 2G, using the tapping torque machine.
Material ε=2% Thickness Quaker lubricant
Fuchs Rhenus LA
TATA STEEL
IF non rolled 0.65 100 100
IF 01 H90V90 0.7 82 80
IF 00 H90V90 0.7 79 77
IF E13 0.7 80 87
ACERINOX
EN 2G 1 100 100 100
EN E13 1 89.96 84.35 101
EN 01 H90V90 1 136.83 149.27
EN 00 H90V90 1 99.27 121
13

14

Scientific and technical description of the results
1 Objectives of the project
The technological and scientific objectives of the research conducted within the framework of the STEELTAC project all contribute to the technological goal of the project: producing steel sheet with pre-defined human perception of the surface roughness in an economic, clean and safe way. To achieve this, two technological achievements were formulated in the project plan, namely: a) Design and development of sheet roughness with pre-defined functionality and b) Development of a production method based on surface textured rolling mills.
The following scientific and technological objectives for the full project period were identified in the project plan, with a view to:
1. Establishing a relation between surface geometrical features and human touch for steel sheet material. This relation served as a basis for the design module that resulted in surface finish with a pre-defined touch. The effect of the texture on the wetting behaviour is part of this objective.
2. Establishing a process window for texturing of rolling mills to ensure an economic, clean and safe production process.
3. Establishing a process window for formability and paint appearance related to initial surface roughness. New textures will be feasible from an end user point of view only when they have a neutral or, preferably, positive influence on the formability of the sheet material and paint appearance of the final product.
A conventional method to develop surfaces with new functionality is to set up a large trial-and-error based testing matrix. In general this means that an industrial rolling mill must be acquired or drawn from the production line. In order to assess the tactility properties, the wetting characteristics, the paint appearance and the formability of a new texture, it is necessary to produce many textured test rolls, which is very costly. Costs of the rolling process and costs that arise for unavailability of the line for longer periods must be added to this. Although a statistical test set-up can reduce the number of tests, the cost will nevertheless remain enormous.
A more cost-effective and rational way to achieve technological advances related to surface texturing is to pre-select textures based on modelling and based on experimental work related to touch, wettability, formability and paint appearance using state-of-the art laboratory techniques available within the consortium. This pre-selection is conducted in the STEELTAC project with direct laser surface texturing (LST) of sheet material and on textured sheet material made by pressing with LST dies. Texturing was to be performed by means of femto, pico or nanosecond lasers, or a combination of methods.
The final project research phase uses a pilot rolling mill. This step was essential in reaching a stage where exploitation of the results is possible in practice. Furthermore, forming trials validated the experimental work and provides a convincing case for dissemination and implementation of the results.
15

16

2 Description of activities and discussion (per task)
Work package 1 Requirements and materials specifications.
Objectives:
- Selection of materials i.e.: sheet, rolling and forming tool material, lubricants
- Supply of materials to the partners
- Production of all test samples
- Characterisation of basic properties and features related to the intended product
TASK 1.1 SELECTION OF MATERIALS
A comprehensive study on present and future materials used for cold rolling and sheet metal forming of stainless steel and of carbon steel was made in the first year of the project. The effect of texturing of tool materials, textured sheet materials and lubrication strategy was evaluated taking into account the specific needs of mass production applications, including costs and impact on the environment. A brief summary with respect to roll materials and surface finish, paint appearance, waviness and roughness, tactility and hydrophobicity, and formability is given below.
Roll materials and surface finish. The surface topography of steel sheet is generated during the rolling process in the very last stage of the sheet production. The sheet is usually skin passed in the temper mill. The steel strip topography is in fact an imprint of the texture applied to the mill rolls. According to Schmid and Wilson [1], cold rolling is typically conducted with cast or forged steels. This is confirmed by Li et al [2], stressing the need for a homogenous hardened layer at the surface of the roll to create a wear resistant layer that can withstand the high pressure and fatigue load during cold rolling. Carbon is seen as an effective element to increase hardness. An increase in the amount of carbides is generally seen as a way to increase wear resistance especially when there is an abrasive component involved. Chromium could be a carbide forming element. Molybdenum, manganese and nickel are often added to improve the quench hardening ability and wear resistance [2]. Titanium is added for its strong affinity with carbon and nitrogen. Fine carbon nitrides are expected to precipitate, being considered to decrease the wear rate of roll roughness [2].
It is stated that chrome plating [1][3][4] or super hard coatings [5] and modified surfaces [3] could reduce roll wear and material transfer from the metal to the roll. Hard chromium layers typically have a hardness between 800 – 1000 HV and are 4 – 15 µm thick.
Typically surfaces are made by blasting, electron beam texturing (EBT) or electro discharge texturing (EDT) of the rolling mills. Furthermore, hard chromium plating is often applied to the temper mill work rolls, which are used to enable high quality surface finishes for painting and pressing [6][7][8a]. Additionally, modifications in the Cr-plating process can itself create surface textures, commercially known as Pretex or Topocrom, for example, whereby no preliminary roll texturing is required. The use of chrome and the uncertainty surrounding legislation regarding its usage deters many steel producers from following this route. Images of hard chromium plated EDT surfaces are shown in Figure 1. Alternative PVD coatings maybe used for protecting rolls from wear, for example ZrCN patent from IK4-TEKNIKER for rolling sliding friction contacts [8b]. TiBN PVD coating could be other alternative [8c]. However, the PVD processing still needs to scale up. To this end, an online PVD Unit has been developed by IK4-TEKNIKER to coat solar absorber tubes within the framework of the finished EU Project HITECO, but upscaling solutions are still needed to coat roll mills.
Figure 1 Hard chromium-plated EDT roll surfaces. a) Ra = 1.02 µm; b) Ra = 10.23 µm [4].
Laser surface texturing (LST) is a more recent possibility. Laser Surface Technique (LST) provides a unique method for applying custom textures to metals, ceramics and polymers. This process involves
17
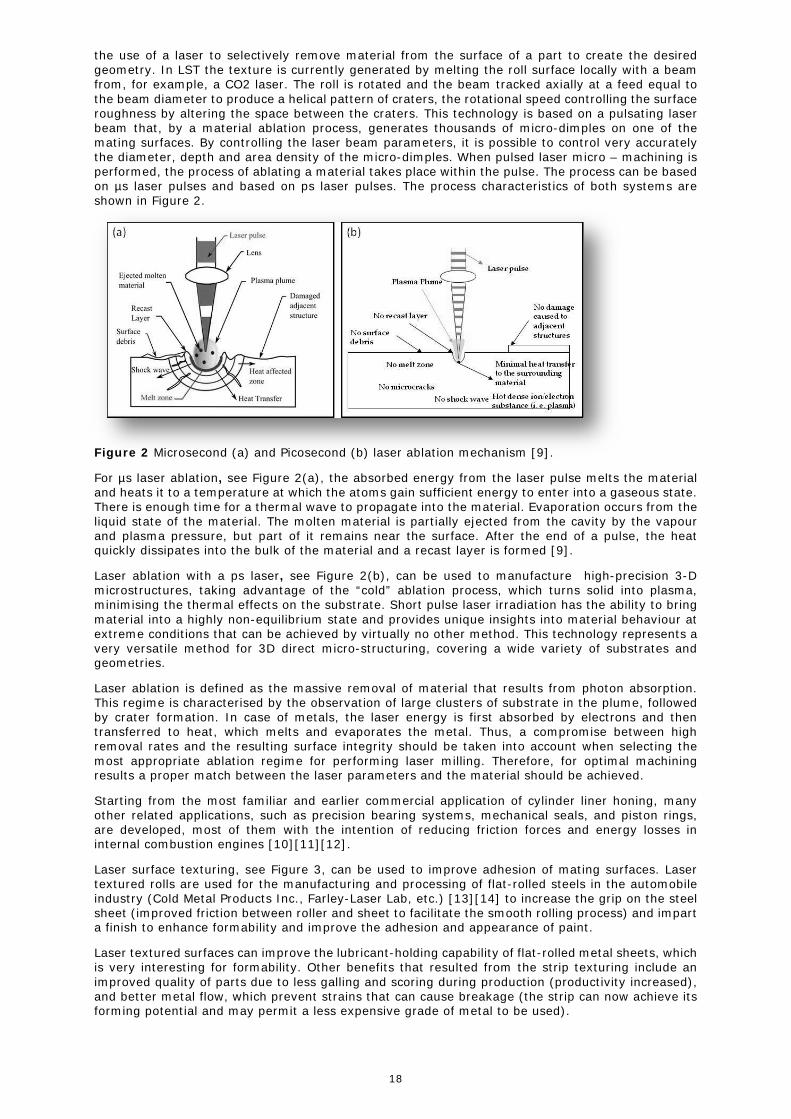
the use of a laser to selectively remove material from the surface of a part to create the desired geometry. In LST the texture is currently generated by melting the roll surface locally with a beam from, for example, a CO2 laser. The roll is rotated and the beam tracked axially at a feed equal to the beam diameter to produce a helical pattern of craters, the rotational speed controlling the surface roughness by altering the space between the craters. This technology is based on a pulsating laser beam that, by a material ablation process, generates thousands of micro-dimples on one of the mating surfaces. By controlling the laser beam parameters, it is possible to control very accurately the diameter, depth and area density of the micro-dimples. When pulsed laser micro – machining is performed, the process of ablating a material takes place within the pulse. The process can be based on µs laser pulses and based on ps laser pulses. The process characteristics of both systems are shown in Figure 2.
Figure 2 Microsecond (a) and Picosecond (b) laser ablation mechanism [9].
For µs laser ablation, see Figure 2(a), the absorbed energy from the laser pulse melts the material and heats it to a temperature at which the atoms gain sufficient energy to enter into a gaseous state. There is enough time for a thermal wave to propagate into the material. Evaporation occurs from the liquid state of the material. The molten material is partially ejected from the cavity by the vapour and plasma pressure, but part of it remains near the surface. After the end of a pulse, the heat quickly dissipates into the bulk of the material and a recast layer is formed [9].
Laser ablation with a ps laser, see Figure 2(b), can be used to manufacture high-precision 3-D microstructures, taking advantage of the “cold” ablation process, which turns solid into plasma, minimising the thermal effects on the substrate. Short pulse laser irradiation has the ability to bring material into a highly non-equilibrium state and provides unique insights into material behaviour at extreme conditions that can be achieved by virtually no other method. This technology represents a very versatile method for 3D direct micro-structuring, covering a wide variety of substrates and geometries.
Laser ablation is defined as the massive removal of material that results from photon absorption. This regime is characterised by the observation of large clusters of substrate in the plume, followed by crater formation. In case of metals, the laser energy is first absorbed by electrons and then transferred to heat, which melts and evaporates the metal. Thus, a compromise between high removal rates and the resulting surface integrity should be taken into account when selecting the most appropriate ablation regime for performing laser milling. Therefore, for optimal machining results a proper match between the laser parameters and the material should be achieved.
Starting from the most familiar and earlier commercial application of cylinder liner honing, many other related applications, such as precision bearing systems, mechanical seals, and piston rings, are developed, most of them with the intention of reducing friction forces and energy losses in internal combustion engines [10][11][12].
Laser surface texturing, see Figure 3, can be used to improve adhesion of mating surfaces. Laser textured rolls are used for the manufacturing and processing of flat-rolled steels in the automobile industry (Cold Metal Products Inc., Farley-Laser Lab, etc.) [13][14] to increase the grip on the steel sheet (improved friction between roller and sheet to facilitate the smooth rolling process) and impart a finish to enhance formability and improve the adhesion and appearance of paint.
Laser textured surfaces can improve the lubricant-holding capability of flat-rolled metal sheets, which is very interesting for formability. Other benefits that resulted from the strip texturing include an improved quality of parts due to less galling and scoring during production (productivity increased), and better metal flow, which prevent strains that can cause breakage (the strip can now achieve its forming potential and may permit a less expensive grade of metal to be used).
18

Figure 3 Sketch of laser texturing and textured craters on a roll.
The different work roll texturing techniques that are currently available are compared schematically in Figure 4.
Figure 4 Schematic description of the different texturing techniques [15].
The texturing techniques shown in Figure 4 are compared in Table 1 with respect to cost to texture per roll, ability to control the centre line average roughness Ra, the peak count number RPc, the waviness, the visual defect after painting Moiré patterns, roll life and environmental considerations in terms of the use of chrome.
Table 1 Qualitative comparison between existing roll texturing techniques.
Technique Cost Ra RPc Waviness Moiré Roll life
Environment*
SBT + - - - + 0 0
LST - + + + 0 0 0
EDT 0 + 0 0 + 0 0
Superfinish - + 0 0 + + 0
EBT -- ++ ++ ++ - + 0
ECT - ++ ++ ++ 0 ++ --
* Assumes that Cr3+ chrome plating is required
Paint appearance, waviness and roughness. An in-depth appreciation of current painting processes and paint appearance was outside the scope of the project. Key point, however, is that
19

topographic parameters with a major influence on the paint appearance of a pressed surface are currently considered to be amplitude (roughness, waviness) and spacing (peak counts) of topographical features. It is generally known that the lower the roughness the better the appearance since the roughness will be levelled out by the paint system, but due to the finite curing time and the viscosity of the paint not all morphological structures of the substrate will be smoothened by the paint [16]. However, if the roughness is too low, it can lead to slippage during handling, and press surface defects and difficulties such as galling [17]. The peak count is of prime importance and a high peak count is required. One of the disadvantages of EDT is the uncontrollable peak counts (and open voids), which are detrimental for pressability and paintability. For steel, good forming behaviour is achieved only if it is lubricated. A certain amount of roughness is applied in order to keep the lubrication on the sheet during forming. However, the roughness needs to be limited to prevent orange peel occurring after painting [18]. Thus, a strip roughness at the low end (smooth) of the required Ra range, combined with high peak count, will contribute to acceptable final paint appearance [19, 20, 21]. Roughness parameters are always considered in order to correlate the surface texture on the paint appearance, but the waviness is often neglected until the beginning of the nineties [19]. It is shown that the traditional characterisation of the surface topography by average arithmetic roughness and peak count is not sufficient and that the longer wavelength irregularities of the surfaces need to be included as well [20]. This is supported by image clarity measurements showing an increase of DOI for lower Wca. It is then shown that the appearance after painting depends more on waviness than on short wavelength irregularities. As a matter of fact, short wavelength components of the profile signal are proven to be suppressed after painting while longer wavelength components would dominate [16, 17 and 18]. This fact is also supported by power spectrum analysis [7]. It thus appears that waviness is the best approach to predicting paint appearance, independently of the texturing process, while envelope parameters like the motif W or Macro Ra are found to depend largely on the roll texturing technique and have a limited ability to predict appearance [7]. In some of the first reports combining the surface with the painting process, it is shown that the waviness should be kept low in accordance to the levelling time and viscosity of the paint, and that the waviness should remain below 0.8 μm. Recent reports, and more particularly the CARSTEEL project [6], show that the waviness of the substrate should be less than 0.3 μm for an acceptable painted appearance. This value is valid for band pass filters of λc = 0.8 mm and λf = 2.5 mm. One should adapt this value when other band pass filters are used or other determination of waviness parameter. While the roughness and waviness of the steel substrate play an importance in the final painted appearance, the paint system remains the greatest influence on painted appearance and therefore the determination of acceptable values of roughness, peak count, waviness of the steel substrate, if they are a prerequisite, do not guarantee an excellent painted appearance. However, it is envisaged that the influence of the substrate, and thus roll texture, will become ever more influential as the focus switches to cost consciousness, performance and environmental legislations.
Tactility and hydrophobicity. Current knowledge on the relation between contact mechanics, tribology and human touch and feel is relatively limited. The majority of published work has a dermatological, pharmaceutical and/or cosmetics background, see for instance [22]–[27]. As a result, those studies focus on the phenomenological description of observations, often based on statistical analyses, without in-depth attention to the basic mechanisms. Psychophysical studies often focus on the macro-geometry of surfaces, such as bumps and ridges, with typical applications including haptic systems and information systems for the visually impaired. Tactile perception is a very important part of the product experience and should be fully explored during the design process [28]. Although extensive research has been conducted on subtopics and in related fields, key issues related to the contact and friction of human skin in interaction with products, such as a full understanding of the mechanical behaviour of human skin, have not yet been solved.
During touch, surface features in contact with the skin cause a load distribution at the skin surface and thereby a stress and strain distribution within the skin. The load distribution at the skin surface is altered by the frictional behaviour when sliding between the skin and the product surface occurs. Stresses and strains at mechanoreceptor locations within the skin evoke responses of the receptors, which are sent to the brain through the nerves. The activity of the central nervous system then produces a sensation, which can be quantified in terms of perceived magnitude: the descriptive level. Finally, a value judgement of the sensation, a perceived quality of feel can be made: the emotional level. Optimisation of product surface tactile properties is frequently achieved through trial and error. The development of guidelines, which will enable industry to predict and optimise the emotional qualities and expectations associated with specific surface finishes, has only recently become the subject of tribological research, see [29], [30] and [31]. The main obstacle to calculate the ‘feel’ of a product from the surface properties and geometry is the ill-defined surface topography that is encountered after most surface finishing processes such as grinding or blasting. The complicated scale dependence of roughness makes it difficult to pinpoint the feel to a certain geometrical parameter [29]. This obstacle can be avoided by producing well-defined surface topographies [30]. Recently, interest in the subject of human touch and feel has increased among designers and engineers, and several well-known technological institutes have initiated research projects on the subject. Examples are Leeds University [29] and the National Physical Laboratory [32], [33]. Limited empirical understanding of the frictional behaviour of human skin is reported by e.g. by the Ecole
20

Central de Lyon and L’Oreal [8], the University of Birmingham and Unilever [34], EMPA and ETH [35] and the California-based company CETR [36]. Nature has inspired researchers to design surfaces with self-cleaning characteristics based on the Lotus effect, which has motivated many investigations [37] – [40]. Laser surface texturing is well suited for production of Lotus-like surfaces, see e.g. Figure 5
Figure 5 Lotus effect visualised by www.thegreenstylist.com compared to a surface created by LST.
Formability. The formability of sheet material is influenced by the surface texture of the sheet that alters the friction during forming. Friction indirectly has a large effect on the draw-in of sheet material, final sheet thickness distribution, strain paths, wrinkling, etc. [41]. The forming tool surfaces are also influenced by friction during forming, and optimised sheet surfaces can decrease tool wear. Industrial use of textured sheet is often motivated by improved paintability combined with a more robust forming process.
In sheet metal forming, the tribological conditions are boundary or mixed lubricated regime. The effect of surface roughness is mostly pronounced in mixed lubricated regime.
The varying friction conditions are often represented by a Stribeck curve, i.e. friction is plotted as a function of the Hersey parameter (H). The Hersey parameter is defined as the product of the dynamic viscosity of the lubricant and the sliding speed, divided by the apparent pressure. The Stribeck curve consists of three regimes. Boundary lubrication implies that the load is carried by the asperities in contacting surfaces. In the mixed lubricated regime the load is carried partially by the asperities and partially by the lubricant. Finally, in the hydrodynamic lubricated regime, the full load is carried by the lubricant. Another situation appears when the tribological system breaks down. Then friction is increasing due to solid-state welding, known as galling, between surfaces, causing localised damage [42][43][44].
Both simulations and experiments have been used to assess the influence of different sheet texture on formability during deep drawing. Various explanations are given as to why certain textures are positive for formability, but are not consistent in literature. Positive effects from increased surface roughness are reported, and are explained and discussed in [45-48].
Payen [49] tested surface changes on zinc-coated steel. A stick-slip phenomenon occurs when a zinc transfer layer adheres to the tool and when a certain pressure is reached, a pressure that seems to depend both on topography and chemistry. This phenomenon led to high roughness of the rubbed surfaces. The method of applying an anti-adhesive coating reduced local friction shear stress at boundary contacts and therefore changed the load applied on plateaus, and lower roughness.
Forming without any type of lubrication is still not widely used in production In the more normal case, where either a prelube or a lubricant added during forming is used, the topography of the sheet material should interact with the tool surface to allow the lubricant to be active as long as possible during the forming sequence. This occurs either by providing a hydrodynamic effect [44],[50] or by a topography promoting the dragging of lubricant onto the contact areas [51].
Sandblasting of the sheets was used by Ngaile [52] to lower the friction and improve the formability in tube hydroforming. Groche and Elsen [53] compared an unstructured (mill finished) surface with surfaces structured by skinpass rolling of rolls textured by EDT and ElectroChromium Deposition (ECD) and found substantial improvements for tube hydroforming using ECD structuring, lowering the coefficient of friction by 50%.
A pattern perpendicular to the sliding direction has been shown to be more efficient for lubrication, both on sheet and on tool surfaces. One example is shown below (Figure 6) [54], from strip drawing tests of a sheet surface with a high topographic anisotropy, as a result of descaling by brushing after hot rolling. If the sheet surface lay is transverse to the tool sliding direction, no galling occurs. If, on the other hand, the tool is sliding along the brushed sheet surface, the lubricant can escape from the tool-sheet surface, leading to a higher tool temperature and some galling, identified as peaks on the temperature curve.
21

Figure 6 Effect of sheet lay direction to sliding for stainless lean duplex steel. Sliding perpendicular (2E-T) to the lay produced lower resistance to galling for the LDX steel, compared to sliding parallel to the lay (2E-L), compared to finish 2B [54].
Industrial texture solutions are also reported in literature:
AISI 316 stainless steel sheet structured by electro-chemical etching was tested in formability tests [55] and showed significant improvements in lubrication performance.
For Zn-coated sheets alternative surface treatments to EDT have been tested with respect to their effect on formability; one example is TopoCrom Texturing that was beneficial if the pockets were closed [56]. Experiments with direct etching or laser texturing on the sheet material showed that sheet with a uniform dispersion of micro-pits exhibited good forming performance [57].
Textured sheet materials are also used for biomedical purposes or other sectors, and the influence on formability on Ti alloys and aluminium are reported in [58] and [59].
The surface topography can, however, also cause galling or increased tool wear [47],[60-63]. A breakdown of the lubricant film could lead to localised surface damage due to solid-state welding between sliding surfaces. The corresponding terms for the wear mechanism are scuffing or galling; however, galling represents a more severe form of damage. Galling can even be followed by seizure of the surfaces and consequent gross failure of the sliding system.
There are several mechanical effects which affect the susceptibility of galling in the boundary lubrication regime. It is mainly controlled by tool material and roughness, the lubricant viscosity and its dependence on temperature and pressure, and sheet coatings.
Experimental validation methods with high sensitivity to Friction changes, combined with numerical modelling with relevant friction models are needed to perform a trustworthy formability assessment [64-66].
Results 30 % Strip Reduction Lubricant Rform 150
2E-L
2E-T
22

References
[1] S.R. Schmid and W.R.D. Wilson, Tribology in manufacturing, Chapter 37, in: Modern Tribology, (ed. B. Bushan), CRC Press LLC, 2001
[2] H.C. Li, Z.Y. Jiang, A.K. Tieu, W.H. Sun, D.B. Wei, Experimental study on wear and friction of work roll material with 4% Cr and added Ti in cold rolling, Wear 271 (2011) 2500 – 2511
[3] J. Simao, D. Aspinwall, F. El-Menshawy, K. Meadows, Surface alloying using PM composite electrode materials when electrical discharge texturing hardened AISI D2., Journal of Materials Processing Technology 127 (2002) 211-216
[4] J. Simao and D.K. Aspinwall, Hard chromium plating of EDT mill work rolls, Journal of materials processing technology 92-93 (1999) 281 – 287
[5] D.P. Wan, B.K. Chen, Y.M. Shao, S.L. Wang and D.J. Hu, Microstructure and mechanical characteristics of laser coating – texturing alloying dimples, Applied Surface Science 255 (2008) 3251-3256
[6] O. Deutscher, D. Paesold, K. Körner, H.-G. Weyen, S.P. Jupp, Characterising the surface waviness of hot dip galvanised steel sheets for optical high-quality paintability (CARSTEEL) Final Report EUR 23854 EN (2009)
[7] J. Scheers et al, Assessment of steel surface roughness and waviness in relation with paint appearance, Int J of Machining Tools Manufacturing 38 5-6 (1998) 647-656
[8a] P. Groche and T. Callies, Tribology in Sheet Metal Forming with Regard to Challenges in Lightweight Construction, Advanced Metals Research 6-8 (2005) 93-100
[8b]. Ch. A. Manier, H. Ziegele, J. Barriga, J. Goikoetxea, M. Woydt, Zirconium-based coatings in highly stressed rolling contacts as alternative solution to DLC and ta-C coatings, Wear 269 (2010) 770–781
[8c] Ch. Ould, X. Badiche, P. Montmitonnet, Y. Gachon. “Feasibility of TiBN PVD Coating for Mill Rolls - Laboratory Testing of Anti-adhesive and Fatigue Resistance Properties, Edited by Gerhard Hirt and A. Erman Tekkaya. 10th International Conference on Technology of Plasticity, ICTP 2011, Sep 2011, Aachen, Germany. Wiley-VCH, p. 9-14.
[9] P. V. Petkov, S. S. Dimov, R. M. Minev, D. T. Pham., Proceedings of the institution of mechanical engineers part B – Journal of engineering manufacture. 222 (2008) 35-45.
[10] I Etsion, State of the Art in Laser Surface Texturing J. of Tribol. 127 1 (2005)
[11] B. Antoszewski Formation of sliding surface with texture by lasermicromachining”. PRZEGLĄD ELEKTROTECHNICZNY Electrical Review R. 87 (2011)
[12] S. Valeri et al, Impact of surface patterning on the tribological properties of nitride steel for automotive applications, Proc of the Int Conf on Trib 20-22 September 2006, Parma, Italy
[13] “Laser textured Rolls brighten outlook at CMP”. Tech Application/TA-107730. of CMP.
[14] lasertexturing.com/en/about.asp, farleylaserlab.cn/, en.hglaser.com/article_1545.html
[15] J. Staeves, Beurteilung der Topografie von Blechen in Hinblick auf die Reiburg bei der Umformung, PhD Thesis, Universität Darmstadt, 1998
[16] C. Lahaye, An empirical method to predict paint appearance starting with substrate roughness data. Proceedings IBEC 1996, automotive body painting,1996.
[17] B.C. De Cooman, C. DeMare, K. Meseure, On the visual appearance of painted galvannealed panels. In Zinc-Based Steel Coating Systems: Production and Performance; San Antonio; TX; USA; 16-19 Feb. 1998
[18] C. Lahaye, W.C. Emmens, J. Bottema, F. Schoepen, G. Verhoeven, G. Influence of substrate texture on forming and paint appearance of aluminium sheet material. 107-114, 1997
[19] C. Marique, J. Crahay, A. Bragard, Surface Roughness and User Properties of Cold Rolled Steel Sheets. Developments in the Drawing of Metals, 242-248 (1983)
[20] S. Olijar, G.A. Themelis, Development of improved surface texture for automotive product. 34th Mechanical Working and Steel Processing Conference Proceedings 93-100, 1992
[21] F. Clarysse, Characterizing the surface waviness of steel sheet: reducing the assessment length by robust filtering, Wear 257 12 (2004) 1219-1225
[22] K.-P. Wilhelm P. Elser, E. Berardesca and H.I. Maibach (ed), "Bioengineering of the skin: skin surface imaging and analysis", CRC Press, Boca Raton, ISBN 0 8493 8375 7
[23] P. Elser, E. Berardesca, K.-P. Wilhelm and H.I. Maibach (ed), "Bioengineering of the skin: skin biomechanics", CRC Press, Boca Raton, ISBN 0 8493 7521 5
23

[24] D. Dowson, "Tribology and the skin surface" In: K.-P. Wilhelm et al. (ed), "Bioengineering of the skin: Skin surface imaging and analysis", CRC Press, Boca Raton, ISBN 0 8493 8375 7
[25] H. Zahouani et al, 2002, "Mechanical properties of the skin during friction assessment" In: P. Elser et al. (ed), "Bioengineering of the skin: skin biomechanics", ISBN 0 8493 7521 5
[26] J. Asserin et al, Measurement of the friction coefficient of the human skin in vivo, quantification of the cutaneous smoothness, Colloids and Surf B: Biointerfaces 19 (2000) 1-12
7] R.K. Sivamani et al, Coefficient of friction: tribological studies in man - an overview, Skin Research and Tech 9 3 (2003) 227-234
[28] M.H. Sonneveld, Dreamy hands: exploring tactile aesthetics in design, in D. McDonagh, P. Hekkert, J. van Erp and & D. Gyi, (Eds.), Design and emotion: the experience of everyday things, pp. 228–232, London: Taylor & Francis, 2004
[29] C. J. Barnes, T. H. C. Childs, B. Henson and C. H. Southee, Surface finish and touch – a case study in a new human factors tribology" Wear 257 7-8 (2004) 740-750
[30] T.H.C. Childs, B. Henson, Human tactile perception of screen-printed surfaces: self-report and contact mechanics experiments, Proc IMechE Part J: J Eng Tribol 221 (2007)427–441
[31] X. Liu, Z. Yue, Z. Cai, D.G. Chetwynd, S.T. Smith, Quantifying touch-feel perception: tribological aspects Meas Sci Technol 19 (2008)08007-1–08007-9
[32] P. Tomlins et al, Predicting and measuring the 'feel' of soft-touch thermoplastic elastomers, NPL, National Measurement Good Practice Guide No. 86, ISSN 1368–6550, 2005
[33] M.G. Gee, P. Tomlins, A. Calver, R.H. Darling, M. Rides,, A new friction measurement system for the frictional component of touch, Wear 259 (2005) 1437-1442
[34] M.J. Adams, B.J. Briscoe, S.A. Johnson, Friction and lubrication of the human skin, Tribology Letters, 26 3 (2007) 239-253
[35] S. Derler et al., Friction of human skin against smooth and rough glass as a function of the contact pressure, Tribology International 42 11-12 (2009) 1565-1574 [36] N. Gitis and R. Sivamani, Tribometrology of Skin, Tribology Transactions 47 (2004) 1-9
[37] T. Onda, S. Shibuichi, N. Satoh, K. Tsujii, Super-Water-Repellent Fractal Surfaces, Langmuir 12 (1996) 2125 –2127
[38] Y.T. Cheng, D.E. Rodak, A. Angelopoulos, T. Gacek, Microscopic observations of condensation of water on lotus leaves, Appl. Phys. Lett. 87 (2005) 194112
[39] M. Nosonovsky, B. Bhushan, Hierarchical roughness optimization for biomimetic, superhydrophobic surfaces, Ultramicroscopy 107 (2007) 969–979
[40] W. Li, A. Amirfazli, A thermodynamic approach for determining the contact angle hysteresis for superhydrophobic surfaces, J. Colloid Interface Sci. 292 (2006) 195
[41] ASM Handbook Volume 14B: Metalworking: Sheet Forming, ISBN: 9780871707109, ASM International, 2006, Section 4
[42] L. Blunt, ed. The Development of a Basis for 3D Surface Roughness Standards. 2003, Kogan Page Limited: London.
[43] E. van der Heide, D.J. Schipper, Galling initiation due to frictional heating. Wear 254 11-12 (2003) 1127-1133.
[44] W.C. Emmens, Tribology of flat contacts and its application in deep drawing. 1997, University of Twente: Twente.
[45] J. van Kuilenburg, M.A. Masen, M.N.W. Groenendijk, V. Bana, E. van der Heide, Towards the development of product surfaces with enhanced tactile properties, Tribology International 48 (2012) 15-21
[46] N. Bay et al, Environmentally benign tribo-systems for metal forming, CIRP Annals - Manufacturing Technology 59 (2010) 760–780
[47] M.S. Nilsson et al, Int J of Surface Science and Engineering 4 1 (2010) 68–79
[48] J. Scheers, C. De Maré. Study of frictional behaviour of steel sheet surfaces during deep drawing by use of Design of Experiments. in IDDRG'98. 1998 Genval
[49] G.R. Payen, E. Felder, M. Repoux, J.M. Mataigne, Influence of contact pressure and boundary films on the frictional behaviour and on the roughness changes of galvanized steel sheets, Wear 276– 277 (2012) 48– 52
[50] J. Bech, N. Bay, M. Eriksen, Entrapment and escape of liquid lubricant in metal forming, Wear 232 2 (1999) 134-139
24

[51] F. Sacerdotti, AUTOSURF - Surface Topography Optimisation for the Automotive Industry. 2001, Brite - Euram project no. BE-97-4140: European Commission
[52] G. Ngaile, M. Gariety, T. Altan, Enhancing tribological conditions in tube hydroforming by using textured tubes, Journal of Tribology 128 (2006) 674-676
[53] P.Groche, A. Elsen, Werkstatttechnik online 97/10 (2007) 821-817
[54] B. Wadman, J. Eriksson, M. Olsson, E. Schedin, E. Madsen, N. Bay, Influence of Surface Texture on the Galling Characteristics of Lean Duplex and Austenitic Stainless Steels. Proceedings Duplex World 2010 Conference, Beaune, France, 2010.
[55] E. van der Heide, E.D. Stam, H. Giraud, G. Lovato, N. Akdut, F. Clarysse, P. Caenen and I. Heikillä, , 2006, Wear of aluminium bronze in sliding contact with lubricated stainless steel sheet material, WEAR 261 (2006) 68-73
[56] M.H. Hong, H.J. Tark, J.S. Park, D.J. Paik, Improvement of surface texture on the hot dip galvanized and galvannealed steel sheet, Metallurgi ItalianaVolume 104 6 (2012) 9-13
[57] J. Tang, Effects of Surface Roughness Microtopography on Formability in Cold Rolled Steel Sheet, Advanced Materials Research 690-693 (2013) 2232-2235
[58] B. Valoppi, S. Bruschi, A. Ghiotti, Formability characteristics of hot stamped ti6al4v sheets electro-chemically modified on surface for biomedical applications” 16th International Conference on Sheet Metal, SheMet 2015; Erlangen-Nurnberg; Germany; 639 (2015) 301-308
[59] G. Batalha, U. Engel, T. Neudecker, Roughness Texturing and its Influences on the Tribological Behaviour in Forming Processes SAE Technical Paper 1999-01-3071, 1999.
[60] B. Wadman, P. Soe-Nielsen, D. Wiklund, N. Bay, E. Madsen, E Schedin, Tool degradation during sheet metal forming of three stainless steel alloys, IDDRG 2010 International conference, Graz, Austria (2010) 265-274
[61] D. Wiklund, B.-G. Rosén, L. Gunnarsson; Frictional Mechanisms in Mixed lubricated regime in sheet metal forming, Wear, 264 5-6 (2008) 474-479
[62] M. Jonasson, A. Wihlborg, L. Gunnarsson, Analysis of Surface Topography Changes in Steel Sheet Strips during Bending under Tension Friction Test, Int J Mach Tools Manufact 38 5-6 (1998) 459-467
[63] S. Zhang. et al.. A finite element simulation of micro-mechanical frictional behavior in metal forming, Journal of Materials Processing Technology, 134 (2003) 81-91
[64] T. Meinders. et al. Recent developments in finite element simulations of the deep drawing process, in 5th International Conference on Sheet Metal. 1997. Ulster
[65] B.H Lee. Y.T Keum, R.H Wagoner, Modeling of the friction caused by lubrication and surface roughness in sheet metal forming, Journal of Materials Processing Technology 130-131 (2002) 60 63
[66] M. Ramezani. Z.M. Ripin, Effect of friction models on stress distribution of sheet materials during V-bending process, World Academy of Science Engineering and Technology 56 (2009)
25

TASK 1.2 PRODUCTION OF MATERIALS
Based on the work conducted within Task 1.1, the materials that are used in the project were selected. An overview of the selected sheet materials is given in Table 2 - Table 6.
Table 2 Zinc-coated sheet materials produced for the project
(Finish Key: GI = Galvanised, NTR = Non-temper-rolled; TR = Temper-rolled)
Code Finish Supplier Sheet thickness
DX 54/56 D
(‘DX54’ or ‘DX56’)
GI-NTR Tata 0.7-0.8 mm
GI-TR Tata 0.7-0.8 mm
HX220YD
(‘YD220’)
MagiZinc NTR Tata 0.7-0.8 mm
GI-NTR Tata 0.7-0.8 mm
GI-TR Tata 0.7-0.8 mm
DP600 GI-NTR Tata ~1 mm
HX180BD GI-NTR Tata 0.7-0.8 mm
Table 3 Stainless steel sheet materials produced for the project.
Code Finish Supplier Sheet thickness
1.4301 2G Scotch Brite Acerinox 1 mm
2D Acerinox 1 mm
2B Acerinox 1 mm
2R + skin pass Acerinox 1 mm
1.4016 2G Scotch Brite Acerinox 1 mm
2D Acerinox 1 mm
2B Acerinox 1 mm
2R + skin pass Acerinox 1 mm
1.4509 2G Scotch Brite Acerinox 1 mm
2D Acerinox 1 mm
2B Acerinox 1 mm
2R + skin pass Acerinox 1 mm
Surface finish 2G served as reference finish for Acerinox.
26

Table 4 Tool materials selected for the project
Description Tool material Remarks Supplier
Tactility – direct laser surface treated samples
PM steel type Vanadis 4E
Mirror finish, 60-62 HRC Uddeholm
Tactility and Paint appearance – coining / press forming dies, laser surface treated
Tool Steel RIGOR 20 disks 70 mm diameter
through hardened > 63HRc
Uddeholm
Pilot mill roll, direct laser surface treated
3% Cr Forged Steel 140 mm diameter rolls - 830 mm length (2 per experiment, vertically segmented
Tata steel
Non textured forming tools for task 3.3
100MnCrW4 for Acerinox
Vanadis 4E for Swerea forming experiments
Vanadis: 62-64 HRC, surface roughness max 0.06 um Ra, 0.6 um Rz, maybe coated with Oerlicon Balzer Lumena
Acerinox / Swerea – Uddeholm
Table 5 Lubricants selected for the project
Sheet material Rolling Press forming Deep drawing / forming
Stainless steel ECO-COOL RF3 standard rolling lubricant with concentration between 3-5% for skin pass
ECO-COOL RF3
Bestpast - water based lubricant
TD51 Chlorine / vaseline
Bestril fluid (alternative for TD51)
Rhenus RForm
Zinc coated steel QUAKER QWERL 263W 1% in demi-water
QUAKER QWERL 263W
LUBRIX BAL 7 Z
pre lub Fuchs PL380/39S
Quaker E5009/N6130
Table 6 Selected skin equivalent materials for tribological evaluation
Skin Equivalent Supplier
PUR- coated PA-fleece Lorica Soft (leather-like)
Maag Technic
27

TASK 1.3 DETERMINATION OF SELECTED MATERIAL PROPERTIES
The material properties were assessed by the partner that produced or bought the materials. The composition, structure, hardness, roughness, texture and tensile strength were considered important properties with respect to the sheet material. The following parameters and properties were determined both on non-textured and textured stainless samples: chemistry, microstructure, bulk hardness, surface hardness (microhardness), strength and ductility from tensile tests, roughness, surface quality by AFM and high resolution SEM (crystallographic orientation (EBSD), topography and chemistry). The tool materials were analysed in terms of hardness, surface roughness (defined level) and microstructure. Viscosity and additive packages were considered important features of the selected lubricants. The results of the work conducted in this task were reported as deliverable D 1.3: ‘report with description of test procedures and results for the selected materials’.
Stainless steel
Chemical Composition. The chemical composition analysis for stainless steels was carried out by X-ray fluorescence spectrometers, spark source optical emission spectrometer and IR absorption automatic analysers. The used X-ray fluorescence spectrometers are Panalytical PW2600 and 2606, which have 28 channels in the spectrometry chamber distributed around the X-ray tube:
- PW2600 Fe, Si, Mn, Sn, Ni, Cu, Cr, P, Mo, Ti, Nb Co.
- PW2606 F, Na, Mg, Al, S, K, Ca, V, W, As.
The X-ray tube is made of a Rhodium anode and a Beryllium window and it works with a potency of 50 kV and an intensity current value of 50 mA.
A Spectrolab M8 is used as optical emission spectrometer. It has a maximum of 128 channels distributed in three optics: two UV and one air. UV and air are used to measure respectively:
- Air optic Cu, Ni, W, Mn, Fe, Cr, Mo, Ca, Co, Nb.
- UV optics Fe, Ni, Co, C, Sn, Pb, As, B, S, P, N, Al, Ti, Cu, Nb, V, Mn, Si, Cr.
The analysis of C and S is made with a Leco analyser CS-200 or CS-600 model, while the content of N is analysed with a Leco TC-600 model. The main features of these analysers are summarised in Table 7:
Table 7 Main features of Leco analysers
Model Method Measure range (based on 1 gr)
Accuracy (ppm)
Analysis time (s)
CS-200 Infrared absorption
C 0.0002-3,5% 1 45
S 0.0004-0,4% 2
CS-600 Infrared absorption
C (high range) 0.0006-6%
0.3 40 C (low range) 0.00006-0,50%
S 0.00006-0.35%
TC-600 Thermal Conductivity TCD
N 0.05ppm-3% 0.025 80
The results of the measurements are summarised in Table 8
28

Table 8 Chemical composition of the selected stainless steels (wt.%)
C Si Mn Cr Ni N Ti Nb
EN-1.4509
2R+SKP 0.014 0.59 0.33 17.64 0.31 0.015 0.183 0.362
2B 0.016 0.49 0.34 17.60 0.27 0.018 0.157 0.441
2D 0.016 0.48 0.40 17.64 0.29 0.015 0.139 0.423
2G 0.019 0.55 0.28 17.52 0.25 0.018 0.185 0.378
EN-1.4301
2R+SKP 0.046 0.40 1.60 18.17 8.06 0.052 0.005 0.012
2B 0.043 0.31 1.68 17.69 8.01 0.045 0.008 0.007
EN-1.4016
2R+SKP 0.030 0.32 0.37 16.03 0.21 0.037 0.004 0.005
2B 0.048 0.36 0.34 16.12 0.38 0.031 0.001 0.005
2G 0.042 0.34 0.41 16.09 0.21 0.035 0.001 0.006
Microstructure. The microstructural study of the stainless steels was made by an optical microscope Olympus GX71 which comprises an optical system UIS (Universal Infinity System), an electric system, a focusing system featuring by five different optical zooms (50, 100, 200, 500 and 1000), an observation tube and a slide. The determination of the grain size is carried out by the Inclusion Inspector Analysis Software.
The metallographic preparation of the samples was achieved in two steps. Firstly, it was roughened and polished in a Struer automatic rougher Abraplan-10 and in a Struer automatic polishing Machine Abrapol-10, respectively. Afterwards, the austenitic samples were electrolytic etched with 17% NaOH, 3-15 s and 2,5 V and the ferritic ones were immersion etched in vilella reagent during 30-60 s. The results of the measurements are summarised in Table 9 and by Figure 7 -10.
Table 9 Results of grain size of the selected stainless steels
Stainless steel Surface Finish GS
EN-1.4509
2R+SKP 4.7
2B 7.1
2D 6.2
2G 7.5
EN-1.4301 2R+SKP 7.9
2B 10.2
EN-1.4016
2R+SKP 9.0
2B 10.0
2G 9.5
29

Figure 7 Microstructures of ferritic stainless steel EN-1.4509: 2R+SKP (first row left), 2B (first row right), 2D (second row left) and 2G (second row right).
Figure 8 Microstructures of the austenitic stainless steel EN-1.4301: 2R+SKP (left) and 2B (right).
Figure 9 Microstructures of the ferritic stainless steel EN-1.4016: 2R+SKP (left) and 2B (right).
30

Figure 10 Microstructures of the ferritic stainless steel EN-1.4016: 2G.
Tensile strength. Tensile tests were carried out in a Universal Testing Machine for Tensile, Compression and Bending Roell+Korthaus RKM-100. The test samples were machined according to the ASTM E8M standard. Hardness measurements were conducted with a Vickers Hardness Tester Akashi AVK-A. An overview of the measured mechanical properties is given in Table 10.
Table 10 Results of mechanical properties of the selected stainless steels.
Finish Rp0.2 (MPa) Rm (MPa) A (%) HV10
EN-1.4509
2R+SKP 384 475 28.67 166
2B 366 480 31.83 167
2D 335 465 32.46 159
2G 437 518 25.78 177
EN-1.4301
2R+SKP 298 640 59.12 164
2B 302 676 59.13 172
EN-1.4016
2R+SKP 359 502 26.80 157
2B 356 529 29.20 162
2G 426 500 26.66 170
Roughness. The roughness was measured by an Advance Unit Mahr model – Perthometer PRK. The Mahr Perthometer M2 is used to measure the roughness with a maximum measuring range of 150 µm. The method can measure according to ISO, JIS and CNOMO standards. The parameters selected by the partners to be measured within the frame of the STEELTAC project are: Ra (µm), Rt (µm), Rz (µm), RPc (1/cm), Wa (µm) and Rsk.
Commonly used parameters that can be measured with this equipment are described in Table 11.
31

Table11 Commonly used roughness parameters
Parameter Description Standards
Ra
Ra is the arithmetic average of the absolute values of the roughness profile. The average roughness is the area between the roughness profile and its mean line, or the integral of the absolute value of the roughness profile height over the evaluation length
DIN EN ISO 4287:1998
ISO 4287:1997
JIS B 0601:1994
Rt Maximum Height of the Profile DIN EN ISO 4287:1998
ISO 4287:1997
Rz
Average Maximum Height of the Profile. Rz is the arithmetic mean value of the single roughness depths of consecutive sampling lengths. Z is the sum of the height of the highest peaks and the lowest valley depth within a sampling length.
DIN EN ISO 4287:1998
ISO 4287:1997
JIS B 0601:1994
Wa Average depth of waviness height ISO 12085:1996
Pc Peak Count (Peak Density) SEP 1940:1992
ANSI/ASME B46.1:1985
Rpk Reduced peak height DIN EN ISO 13565-2:1997
When measuring roughness, one parameter to be taken into account is the selection of cut-off length. The cut-off length of a profile filter determines which wavelengths belong to roughness and which ones to waviness. The Table 12 shows the standardised values for the cut-off λc and roughness evaluation length according to DIN EN ISO 4288.
Table 12 Selection of cut-off lengths
Profile
Ra (µm)
Cut-off
λc (mm)*n
Roughness evaluation length
ln (mm)
0.006 – 0.02 0.08*5 0.40
0.02 – 0.1 0.25*5 1.25
0.10 – 2.0 0.80*5 4.00
The roughness measurements presented in Table 13 were conducted by Acerinox:
32

Table 13 Roughness of the selected stainless steels
Finish Ra (µm) Rt (µm) Rz max (µm) Rz (µm)
EN-1.4509
2R+SKP 0.032 0.295 0.280 0.214
2B 0.294 2.102 1.997 1.731
2D 1.064 5.846 5.630 5.004
2G 0.152 1.952 1.952 1.542
EN-1.4301
2R+SKP 0.045 0.465 0.440 0.327
2B 0.123 1.350 0.766 1.061
EN-1.4016
2R+SKP 0.021 0.225 0.207 0.164
2B 0.177 1.690 1.565 1.424
2G 0.127 1.810 1.810 1.428
The surfaces were also analysed using confocal scanning optical microscopy, resulting in detailed information about the topographic properties.
Confocal microscopy has advantages over conventional optical microscopy, including a small but significant improvement in lateral resolution. It rejects stray light from the out-of-focus specimen planes as well as light scattered into the optical instrument, resulting in increased contrast and signal to noise ratio in the final image. Confocal microscopy is also compatible with computer image storage techniques, allowing generation of high resolution digitized data sets of the 3D topography of a surface, suitable for subsequent data analysis.
The topographic characterisation was realised by means of a PLµ high-resolution scandisk confocal microscopy (SDCM), see Figure 11. This is an optical imaging technique used to increase micrograph contrast and/or to reconstruct three-dimensional images by using a structured pattern consisting of a set of parallel slits and a photo-detector measuring the light intensity passing through the confocal aperture by a CCD. Instead of looking for the confocal information point by point, the PLµ looks for the confocal information in all the points contained in every line. This is done by using the digitised information in each pixel of the CCD, which is working as a pinhole and a photo-diode at the same time. With this arrangement the PLµ is able to obtain confocal information of several thousands of points per second. Moreover, the PLµ uses a novel “high-contrast” algorithm, which allows achieving sharper confocal images.
33

Figure 11 a) High-resolution scandisk confocal microscopy (SDCM). b) 3D wear scar image.
This method allows a fast 3D measurement of topography, structure and roughness with excellent height resolution and depth of field. In this study, a PLμ Confocal Imaging Profiler (Nikon Eclipse ME600) device was used. The 2D profilometry has been recorded in perpendicular direction to main tracks. Representative images of the stainless steel surfaces can be found in Figure 12 - 18.
Figure 12 Surface topography of the ferritic stainless steel EN-1.4016: 2R+SKP. 3D topography scale is between -3 µm and 3 µm. Profilometry scale is between -4 µm and 2 µm.
Figure 13 Surface topography of the ferritic stainless steel EN-1.4016: 2B. 3D topography scale is between -3 µm and 3 µm. Profilometry scale is between -4 µm and 2 µm.
Figure 14 Surface topography of the ferritic stainless steel EN-1.4016: 2G. 3D topography scale is between -5 µm and 5 µm. Profilometry scale is between -4 µm and 2 µm.
34

Figure 15 Surface topography of the ferritic stainless steel EN-1.4509: 2R+SKP. 3D topography scale is between -3 µm and 2.91 µm. Profilometry scale is between -3 µm and 2.91 µm.
Figure 16 Surface topography of the ferritic stainless steel EN-1.4509: 2B. 3D topography scale is between -3 µm and 3 µm. Profilometry scale is between -3 µm and 3 µm.
Figure 17 Surface topography of the ferritic stainless steel EN-1.4509: 2D. 3D topography scale is between -3 µm and 3 µm. Profilometry scale is between -3 µm and 3 µm.
Figure 18 Surface topography of the ferritic stainless steel EN-1.4509: 2G. 3D topography scale is between -3 µm and 3 µm. Profilometry scale is between -3 µm and 3 µm.
35

Tekniker has also measured the surface roughness values Ra, Rt, Rz, RPc of the ferritic stainless steel EN-1.4509. Table 14 summarises these results. If we compare this with the previous roughness measurements, there are differences mainly in the values measured for the 2R+SKP. The reason for the variability of roughness is that the surface quality of the sheets depends on the part of the sheet that has been measured and the roller finishing status when rolling. The samples measured by TEKNIKER differed by the ones measured by Acerinox. This variability is one of the interests of the STEELTAC Project for Acerinox: to develop a texturing process that can reduce the variability to reach the desired surface geometry.
Table 14 Results of roughness of the ferritic EN-1.4509 by Tekniker.
Finish Ra+SD (µm) Rt+SD (µm) Rz+SD (µm) RPc+SD [cm-
1]
2R+SKP 0.06±0.02 1.67±0.52 0.67±0.16 -
2B 0.33±0.01 2.61±0.35 2.08±0.18 21±2
2D 0.86±0.03 5.17±0.29 4.45±0.20 76±2
2G 0.13±0.01 2.53±0.62 1.65±0.23 -
All studied stainless steels meet the typical values of chemical composition, microstructure, mechanical properties and roughness. This study is the reference for comparing these results with the obtained ones from the textured material and to know how the texturing process affects the material properties.
Galvanised Carbon Steels
Tata Steel has manufactured and characterised several materials for the STEELTAC project. The substrate materials are interstitial free forming steel (DX54/DX56) Rephos-IF and DP600. The coating variants chosen are galvanised and MagiZinc®.
Characterisations undertaken included:
• Tensile testing (3-directions)
• Roughness/surface topology evaluations (stylus and optical)
• Microstructure evaluations
• Zinc layer characterisations
• Material hardness measurements
Chemical composition. Guideline chemical compositions of the steel substrates of the galvanised material provided for the STEELTAC project are given in Table 15.
Table 15 Guideline Compositions of Substrate Materials Relating to the Carbon Steel Galvanised Steel Strips Under Investigation in STEELTAC (balance Fe, all values in m%)
Steel Grade
C Mn P S Si N Al Nb B Ti V Cu Cr Mo
Ni Sn
DX54/56
<3 <200
<15
<10
<10
<40
<70
<15
<60
<5 <40
<40
<10
<40
<10
YD220
<5 <510
<50
<20
<30
<30
<60
<10
<15
<15
<10
<40
<40
<10
<40
<10
DP600 <105
<2000
<20
<10
<70
<60
<60
<10
<10
<10
<60
<630
<15
<60
<25
Structure. Optical micrographs revealing typical microstructures in the annealed condition for the titanium-stabilised ultra-low carbon (TiSULC) interstitial free, rephosphorated interstitial free, and dual phase steels supplied by Tata Steel for the STEELTAC project are given in Figure 19.
36

Figure 19 Optical micrographs revealing the microstructures of the substrate material of the hot-dip galvanised materials supplied by Tata Steel.
Tensile strength and hardness. Tensile tests in three dimensions, as given in Figure 20 below, have been undertaken on all galvanised samples by Tata Steel. The samples were non-temper rolled and a summary of the results is given in Table 16.
Figure 20 Schematic overview of the sample directions in the three-dimensional tensile tests.
0o 45o 90o
Rol
ling
Dire
ctio
n
0o 45o 90o
Rol
ling
Dire
ctio
n
37
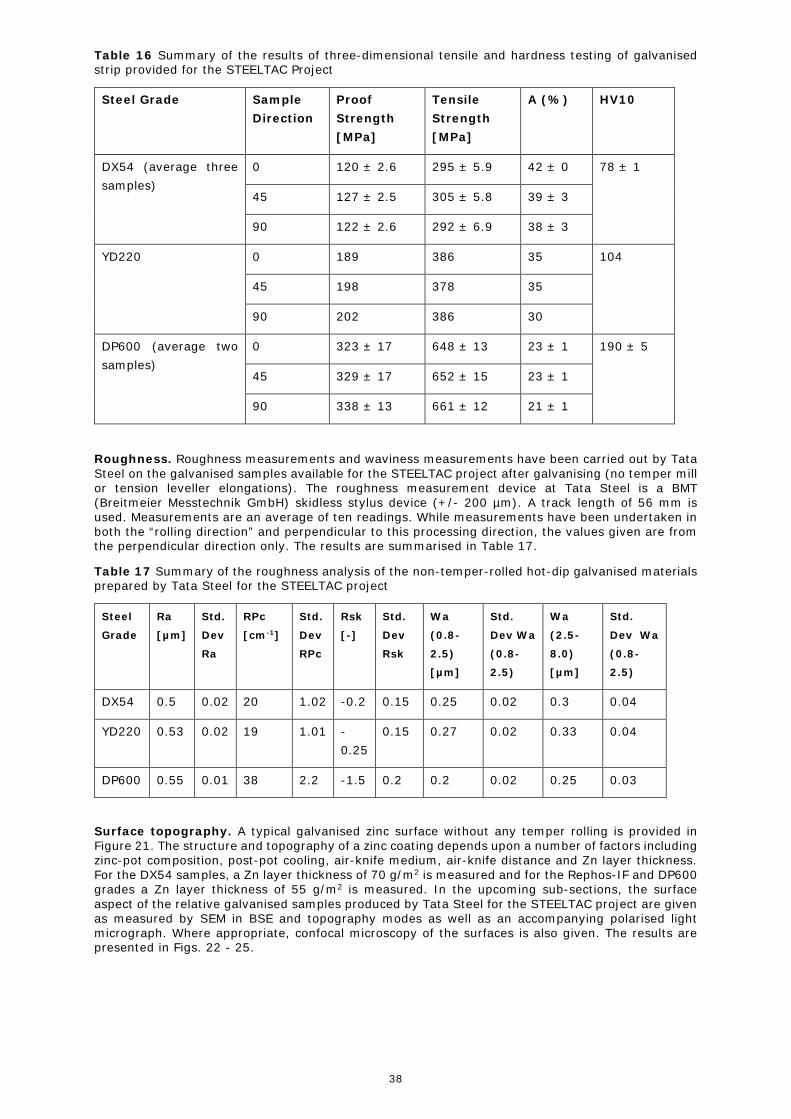
Table 16 Summary of the results of three-dimensional tensile and hardness testing of galvanised strip provided for the STEELTAC Project
Steel Grade Sample Direction
Proof Strength [MPa]
Tensile Strength [MPa]
A (%) HV10
DX54 (average three samples)
0 120 ± 2.6 295 ± 5.9 42 ± 0 78 ± 1
45 127 ± 2.5 305 ± 5.8 39 ± 3
90 122 ± 2.6 292 ± 6.9 38 ± 3
YD220 0 189 386 35 104
45 198 378 35
90 202 386 30
DP600 (average two samples)
0 323 ± 17 648 ± 13 23 ± 1 190 ± 5
45 329 ± 17 652 ± 15 23 ± 1
90 338 ± 13 661 ± 12 21 ± 1
Roughness. Roughness measurements and waviness measurements have been carried out by Tata Steel on the galvanised samples available for the STEELTAC project after galvanising (no temper mill or tension leveller elongations). The roughness measurement device at Tata Steel is a BMT (Breitmeier Messtechnik GmbH) skidless stylus device (+/- 200 µm). A track length of 56 mm is used. Measurements are an average of ten readings. While measurements have been undertaken in both the “rolling direction” and perpendicular to this processing direction, the values given are from the perpendicular direction only. The results are summarised in Table 17.
Table 17 Summary of the roughness analysis of the non-temper-rolled hot-dip galvanised materials prepared by Tata Steel for the STEELTAC project
Steel
Grade
Ra
[µm]
Std.
Dev
Ra
RPc
[cm-1]
Std.
Dev
RPc
Rsk
[-]
Std.
Dev
Rsk
Wa
(0.8-
2.5)
[µm]
Std.
Dev Wa
(0.8-
2.5)
Wa
(2.5-
8.0)
[µm]
Std.
Dev Wa
(0.8-
2.5)
DX54 0.5 0.02 20 1.02 -0.2 0.15 0.25 0.02 0.3 0.04
YD220 0.53 0.02 19 1.01 -0.25
0.15 0.27 0.02 0.33 0.04
DP600 0.55 0.01 38 2.2 -1.5 0.2 0.2 0.02 0.25 0.03
Surface topography. A typical galvanised zinc surface without any temper rolling is provided in Figure 21. The structure and topography of a zinc coating depends upon a number of factors including zinc-pot composition, post-pot cooling, air-knife medium, air-knife distance and Zn layer thickness. For the DX54 samples, a Zn layer thickness of 70 g/m2 is measured and for the Rephos-IF and DP600 grades a Zn layer thickness of 55 g/m2 is measured. In the upcoming sub-sections, the surface aspect of the relative galvanised samples produced by Tata Steel for the STEELTAC project are given as measured by SEM in BSE and topography modes as well as an accompanying polarised light micrograph. Where appropriate, confocal microscopy of the surfaces is also given. The results are presented in Figs. 22 - 25.
38

Figure 21 Surface topography of the carbon steel DX54. 3D topography scale is between -2.5 µm and 2 µm. Profilometry scale is between -10 µm and 10 µm.
Non-temper-rolled Hot Dip Galvanised IF
Figure 22 (left) SEM Images in BSE mode, (middle) SEM revealing surface topography and (right) polarised light microscopy images of the surface of galvanised carbon steel DX54.
Non-temper-rolled Hot Dip Galvanised Rephos-IF
Figure 23 (left) SEM Images in BSE mode, (middle) SEM revealing surface topography and (right) polarised light microscopy images of the surface of galvanised carbon steel YD220.
Non-temper-rolled Hot Dip Galvanised DP600
Figure 24 (left) SEM Images in BSE mode, (middle) SEM revealing surface topography and (right) polarised light microscopy images of the surface of galvanised carbon steel DP600.
39

Temper-rolled Hot Dip Galvanised Reference Sample
Figure 25 (Left and middle) confocal microscopy of a typical galvanised surface processed in the temper mill with EDT textured work rolls and (right) a polarised light optical microscopy image of the same surface.
Lubricants
Houghto-Draw TD51 is a modern non-sulphurised lubricant from Houghton for general deep drawing and difficult forming applications, including stainless steel. It is a high EP medium viscosity, neat forming oil that contains chlorine and it is sulphur-free. The kinematic viscosity is 132 mm2/s at 40 ºC by ISO 3104/3105. The boiling point is >250 ºC and the flash point is 225 ºC. The density is 1.08 g/cm3 at 15.5 ºC.
BESTRIL FLUID CFSS 42: water-based fluid, chlorine free, with medium and extreme pressure additives for forming processes of steel and stainless steel. It is an opalescent liquid with a pH value of around 9.3. The boiling and flash point are >100 ºC. The density value (20 ºC) is 1.0 g/cm3. It is biodegradable and non-toxic.
BESPAST FRK: water-soluble paste. It is a paste with especial additives for press forming of stainless steel, aluminium and alloyed steels. Its EP additives are chlorine free. This forming fluid has medium pressure and anti-wear additives leading to excellent results under severe working conditions. This creamy paste has a value of normal penetration of 25-315 mm/10. In emulsion (10% of distilled water) the pH is around 9.6. The boiling point is 100 ºC and the flash point is >100 ºC. The density value (20 ºC) is 1.09 g/cm3.
RHENUS LA 722083: this is a mineral-based oil with additives and free of halogens (chlorine-free). It has brown colour with a flash point of 164 ºC, a density (20 ºC) of 1.031 g/cm3 (DIN 51757) and a viscosity kinematic (40 ºC) value of 300 mm2/s (DIN 51562). It is toxic and harmful to aquatic organisms with lasting effects.
Additional lubricant efficiency test were conducted with:
QUAKER FERROCOTE N6130 is an oil-based rust preventive which provides in-process or final protection for medium to long-term indoor storage of metal surfaces, both ferrous and non-ferrous. It is specified and used by steel mills and automotive manufacturers. The flashpoint is 218ºC.
FUCHS ANTICORRIT is a brown, thixotropic and barium-free corrosion preventive fluid. It provides corrosion protection together with metal drawing properties in one product thus presenting process simplification and rationalisation potential. This fluid is used for protection, drawing and forming. The density at 15ºC is 0,915 g/ml. The viscosity at 40ºC is 60mm2/s. The flashpoint is 196ºC.
ECOCOOL RF3 is a yellow water-miscible fluid from Fuchs. It is an eco-friendly alternative mineral oil, exempted from chlorine, boron and secondary amines. The density at 20 ºC is 1,038 g/cm3. The value of pH is 9.5 at a concentration of 50 g/l and 20 ºC. It is usually used in a concentration between 3% and 5%.
QUAKER QWERL 263WW2 is a yellow fluid. The boiling point is 100ºC. The relative density is 1.043 g/cm3 at 25ºC. The kinematic viscosity is 2.5 mm2/s at 40ºC. The pH is 8.6 at a concentration of 100% and 8.5 at a concentration of 5%. The flashpoint is >100ºC.
QUAKER QWERL 263LF is a rolling oil. The melting point is <0ºC. The boiling point is 100ºC. The relative density is 1.021 g/cm3. It is completely soluble in water. The pH is 10.3 at a concentration of 100%. The flashpoint is >100ºC.
LUBRIX BAL 7 Z is a metalworking fluid with a density of 1,020 kg/m3.
200 µm200 µm200 µm200 µm200 µm200 µm
40
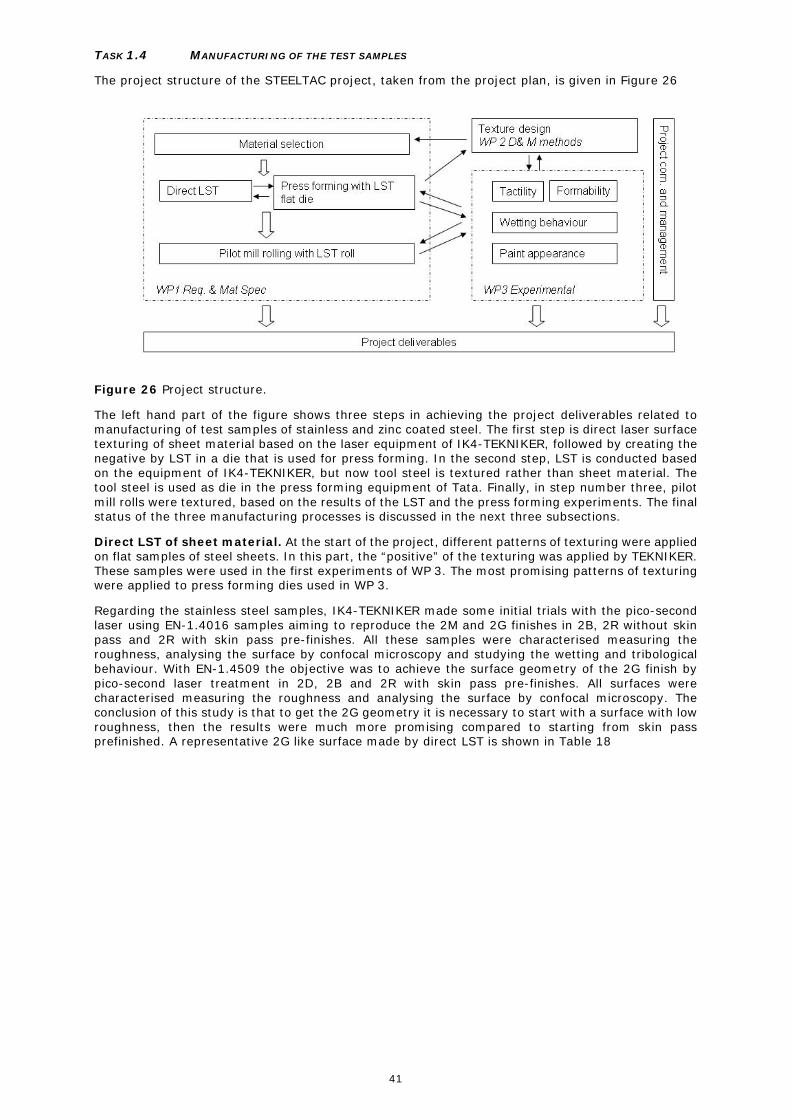
TASK 1.4 MANUFACTURING OF THE TEST SAMPLES
The project structure of the STEELTAC project, taken from the project plan, is given in Figure 26
Figure 26 Project structure.
The left hand part of the figure shows three steps in achieving the project deliverables related to manufacturing of test samples of stainless and zinc coated steel. The first step is direct laser surface texturing of sheet material based on the laser equipment of IK4-TEKNIKER, followed by creating the negative by LST in a die that is used for press forming. In the second step, LST is conducted based on the equipment of IK4-TEKNIKER, but now tool steel is textured rather than sheet material. The tool steel is used as die in the press forming equipment of Tata. Finally, in step number three, pilot mill rolls were textured, based on the results of the LST and the press forming experiments. The final status of the three manufacturing processes is discussed in the next three subsections.
Direct LST of sheet material. At the start of the project, different patterns of texturing were applied on flat samples of steel sheets. In this part, the “positive” of the texturing was applied by TEKNIKER. These samples were used in the first experiments of WP 3. The most promising patterns of texturing were applied to press forming dies used in WP 3.
Regarding the stainless steel samples, IK4-TEKNIKER made some initial trials with the pico-second laser using EN-1.4016 samples aiming to reproduce the 2M and 2G finishes in 2B, 2R without skin pass and 2R with skin pass pre-finishes. All these samples were characterised measuring the roughness, analysing the surface by confocal microscopy and studying the wetting and tribological behaviour. With EN-1.4509 the objective was to achieve the surface geometry of the 2G finish by pico-second laser treatment in 2D, 2B and 2R with skin pass pre-finishes. All surfaces were characterised measuring the roughness and analysing the surface by confocal microscopy. The conclusion of this study is that to get the 2G geometry it is necessary to start with a surface with low roughness, then the results were much more promising compared to starting from skin pass prefinished. A representative 2G like surface made by direct LST is shown in Table 18
41

Table 18 Direct Laser Surface Texturing
Surface texture Remarks
Initial finish
2R (BA+SKP)
Image with scale for Z between -3 µm and 2 µm
LST
Texturing parameters for Picosecond laser:
•λ: 355nm
•Frequency:250kHz
•Velocity:750mm/s
• Power: 0.151W
•Distance between lines: 5 μm, to get a average width of 250 μm
•20 Tracks in depth.
Image with scale for Z between -3 µm and 2 µm
Reference finish
2G
Image with scale for Z between -3 µm and 3 µm
In conclusion, direct LST is operational and available to the consortium.
Press forming of sheet material.
The tools employed in this work as imprinting surfaces were fabricated from a commercially available medium-alloyed cold work tool steel called Uddeholm Rigor®. This steel has an excellent combination of wear and chipping resistance as well as “hardenability”, being well suited for modern heat treatment processing. Most importantly, its composition relates favourably to that of work rolls used in steel rolling. In this case the “negative” of the texturing was created. The results of WP 3 were used as feedback to generate a second set of textures for the press forming surfaces, optimised with the gained knowledge. The production of the first sheet with texture at laboratory scale by press forming was the second milestone (M 1.2) of the project, see Table 19. Figure 27 discloses a graphical abstract about the process followed in the STEELTAC project to achieve a proper process window for the Laser Texturing Process. Firstly, based on previous studies and simulations, a set of requirements on the texture patterns was fixed for the two target functionalities. Afterwards, the effect of isolated craters on the tools material was studied in order to
42

obtain a better knowledge about the distribution of the recast material, the depth and width of the crater for different laser parameters. This study was conducted for two pulse regimens: picosecond and nanosecond pulses. Based on these experimental results and taking into account the requirements of the first step, a comprehensive process window was analysed for both pulse regimes. As a result, a set of laser parameters in the regimen of nanosecond pulses were selected for the Laser Texturing process of the rolls. Apart from the suitable results in terms of paint appearance and tactility properties, the nanosecond laser system provides acceptable laser ablation rates and allows the upscaling process of the laser texturing process.
Table 19 Roughness transfer by coining, milestone M1.2
Strip Disk Strip after Transfer
Roughness transfer experimentation was initially undertaken on an Erichsen press, modified specially for the press-coining experimentation. While many transfer experiments have taken place to gauge transfer percentages at differing loads for different textures, the loads attainable and resultant transfer was deemed insufficient since the unevenness of the Zn coated strip prior to coining was seen back in the strip after pressing (milestone M1.2) – a phenomenon seldom seen in true skin pass rolling.
Due to the drawbacks in the surfaces processing by ps and µs lasers unearthed in the initial texturing and transfer experiments, the decision was made to fabricate the ensuing surfaces by nanosecond laser. The laser beam is guided by a 2D scanner and the assembly is integrated into a micromachining workstation. Sample position can be selected with lateral and depth resolution in µm-range through a machining table with X/Y axes and Z positioning system. Based on a single laser crater, it is possible to establish geometric surfaces for comparative purposes. For single crater events, the crater geometry can be described as a crater surrounded by a rim of re-deposited material. A base geometry could thus be defined by the following dimensions: inner diameter φ ≈ 65 µm, peak-to-valley height HP-V ≈ 12 µm and width of the recast material l ≈ 10 µm.
43

Figure 27 Layout and process window with picosecond and nanosecond laser for coining tests.
Based on this profile, the effect of different laser parameters was evaluated in order to obtain the desired profile. Figure 28 shows the confocal image of a trench of craters on the imprinting disk by considering the optimum laser process parameters: pulse length τ=170 ns, repetition rate f=41 KHz, marking speed v =3.28 m/s and laser power P=19 W. Four-time repetitions of laser shots over the same area were considered. It can be noticed that the ejected material around two subsequent dimples overlaps (with each other) although the dimples themselves do not.
44

Figure 28 a) 2D Confocal image b) Cross section corresponding to a trench of craters using the optimal laser parameters for the texturing trials.
Afterwards, different texture motifs were designed based on the seed pattern described above. Related to the offset between craters, two different texturing motifs were considered: rectangular (T1) and hexagonal (T2) (Figure a)). Concerning overlapping between single dimples, several values were considered in both directions (H and V) for each texturing motifs (T1 and T2). Table 20 summarises the considered distances between centres of single dimples as percentage of the experimental inner diameter φexp=67µm obtained for a single dimple at level power P=24W, frequency rate f=41kHz and pulse length τ=170 ns. Additionally, the influence of offset on the "3D Ra" values (Sa) derived from the surfaces is presented for the twelve different texturing configurations considered.
Table 20 Overlap parameters of two different texture motifs and corresponding expected Sa values.
Pattern Overlap Properties H [%] 60 70 80 85 90 130 V [%] 80 80 80 80 90 130 Sa, T1 (µm) 3.45 3.05 3.45 3.57 3.47 3.57 Sa, T2 (µm) 3.8 1.07 2.65 2.86 3.83 3.57
Figure 29 shows three of the twelve surface texture variants designed by changing the offsets and overlaps between individual craters (T1HV90, T2HV90 and T2HV130). It discloses two kind of topographical features considered in this research: “Open” structures, characterised by a different density of hillocks, semi-open and “closed” structures, characterised by a matrix of craters of micro-dimples.
Figure 29 Surface texturing designs: “Open” structures (left) , semi-open structures (middle) and “closed” structures (right).
Figure 30 illustrates the corresponding experimental topographies and heights of craters produced in Uddeholm Rigor by selecting these process parameters.
45

Figure 30 Confocal microscopy derived surfaces after laser texturing with patterns a) T2H90V90 b) T1H90V90 c) T2H130V130. The images have been edited in CorelDRAW X6 to form a photorealistic
image overlain with a height map of graded transparency across the image diagonals.
Table 21 shows an average measurement of topographic parameters of the texture patterns given in Figure 30. It is worth noting that, as consequence of the random behaviour of the ablated material from the inner crater, the measured topographic parameters are an estimate. Table 22 relays the roughness parameters of the negatives as measured by stylus profilometry.
Table 21 Resultant crater parameters of selected texture patterns
Pattern H V
HP-V (µm) φ(µm) HP-V (µm) φ(µm)
T1H90V90 8 40 5 30
T2H90V90 8 40 14 50
T2H130V130 13 65 13 65
Table 22 Roughness values [μm] of the surfaces generated by laser texturing for imprint
negatives
Ra Rz Rp Rt RPc RSk OHV90 3.13 19.51 13.03 20.43 158 1.11 1HV90 2.82 15.18 8.94 16.22 184 0.32 1HV130 3.64 15.16 8.36 16.12 150 -0.03
A typical fully textured disk as manufactured by laser texturing is depicted in Fig 31. Note that the texture on the disk is deterministic, however no large-scale surface patterning/interference (Moiré) was seen.
46

Figure 31 right: Fully laser textured disk Produced by laser texturing with an ns laser at 2.4m/s
processing speed (Ra ~5.5µm; RPc = 125 cm-1).
All produced surfaces have been characterised by light microscopy, confocal microscopy, scanning electron microscopy and stylus roughness measurements. These disks were used for imprinting tests in galvanised steel sheet and stainless steel sheet. Typical results for galvanised steel sheet were published and presented at KES 2013, while a second article “Surface design and texturing using nanosecond pulsed lasers for simulated roughness transfer and improved paint appearance of Strip Steel” is in preparation for the Journal of Material Processing and Technology.
Imprinting tests were conducted in a TUWI compression rig (Figure 32a) with a load capability of 100 tonnes. During the experiments, the contact pressure was tuneable by varying the load and/or sample size. The material (see Table 23 for initial surface properties) used for press tests was low-strength high-formability galvanised steel sheet (DX54 or DX56), and DP600 (for gauging the influence of the substrate in roughness transfer experiments).
Table 23 Galvanised sheet materials used for the imprinting trials. Selected initial surface properties taken from Table 17.
Grade Ra [μm] RPc [cm-1] Interstitial free (IF) DX 54 0.50 ±0.02 20 ± 1.0 Rephos-IF YD220 0.53 ± 0.02 19 ± 1.0 Dual Phase DP600 0.55 ± 0.02 38 ± 2.2
The specific test configuration (shown schematically in Figure 32 b permits a simple and fast assessment of the effect of the surface texture and material on roughness transfer capability, within a given pressure range. All tests were performed without lubrication. Figure 32 c shows the FEM simulation of von Mises stress conducted to guarantee an even distribution of stress along the textured tool and sheet.
Figure 32 (a) Overview of the TUWI compression rig used for simple roughness transfer tests at
Tata Steel, represented schematically in (b) highlighting the key aspects of the set-up (c) FEM simulation used to obtain the ideal pressure stack.
In order to gauge the true applicability of the laser texturing process to industrial sized rolls, full upscaling of the process requires the use of additional equipment. Concerning the laser texturing process, a 6-axis robot was used along with a rotary axis. These rolls have been utilised in rolling trials conducted on two rolling mills. Primarily, rolling trials have been performed on the Tata Steel Pilot Mill (named the MultiMill) (Figure 33) in four-high mode. In other words, the textured work rolls were driven and
40W Pulse Fiber Laser (SPI lasers, UK)
Wavelength [nm] 1070 Average Maximum Power [W] 40
Beam Quality [M2] 2.7 Maximum Peak Power [kW] 18 @ 9 ns
Maximum pulsed energy (mJ) 1.3 @ 250 kHz Pulse repetition rate [kHz] 30 - 250
Pulse duration [ns] 9 - 250 Power stability [%] 2
Textured ToolDeformation sheet
Smooth Tool
supp
ort s
heet
s of
B-s
teel
(w
idth
= w
idth
def
orm
atio
n sh
eet)
Load Plate and TUWI Frame
LOAD
Solid steel cylinder, fillers (leather strip) and
TUWI Frame
Equivalent Von Mises Stress (MPa)
100
400
700
250
550
a) b) c)
Textured ToolDeformation sheet
Smooth Tool
supp
ort s
heet
s of
B-s
teel
(w
idth
= w
idth
def
orm
atio
n sh
eet)
Load Plate and TUWI Frame
LOAD
Solid steel cylinder, fillers (leather strip) and
TUWI Frame
Equivalent Von Mises Stress (MPa)
100
400
700
250
550
a) b) c)
47

supported by back-up rolls. In industrial rolling terms, this set-up is often referred to as “Quattro”. Furthermore, a second series of rolling trials was undertaken to mitigate the need for mill calibrations and to remove influences of back-up roll wear and reduce zinc pick-up on a simple two-high mill. In both cases, the strip was hand-fed in 150 mm-wide strips of 500 mm to 1000 mm in length.
Figure 33 Overview of the pilot rolling mills at Tata Steel, used for rolling trials in STEELTAC: (left)
four-high Multimill, (right) two-high “Bühler” mill.
The primary function of the rolling trials was to assess if the behaviour of the rolls during the rolling process permits the production of larger samples. Based on the results of the imprinting tests carried out on flat samples, the three texture patterns (T1H90V90, T2H90V90 and T2H130V130) presented earlier were selected to use on the prototype parts: rolls. Firstly, a first set of trials were conducted on a test roll in order to define the best rotation strategy to develop the different patterns. Additionally, some considerations about the alignment among the rotary axis, the 6-axis robot and the axis of the 2D-scanner were taking into account in this set-up phase. The diameter of the test roll was 70 mm and the length was 550 mm. The pattern selected for the set-up phase was T1H130V130 due to the fact that the dimples do not overlap. Thus, it is easier to realise the precision with which the textures can be generated based on the alignment considerations cited above. Once the rotation strategy was defined and the main factors related to the alignment were identified, the second set of trials was conducted on rolls. The texture patterns T2H90V90 and T2H130V130 were applied in two different rolls (top and bottom in the rolling mill) with diameters of 135.5mm. Figure 34 exhibits a general view of the textured rolls along with a top view of the detail of the texture motifs. The top views of the textured motifs were obtained by means of a contact microscope. The “patchwork” texturing approach is clearly evident, however the textured areas were homogenous and roll surfaces were well aligned over the roll circumference. The dimensions of the patches (rectangles) are different for each roller diameter: - Roller diameter φ = 136.5 mm → 8 2 x 2 0 . 2 m m - Roller diameter φ = 154.9 mm → 8 2 x 1 6 . 2 m m The requirement synchronisation among the different equipment involved in the laser texturing process (rotary axis, lineal axis, laser head (scanner) and laser pulses) is not available currently at IK4-TEKNIKER, but it is expected to be implemented in the future. Furthermore, the repetition of the texturing tracks was well administered, with no misalignment observed. Unlike standard roll texturing procedures, the rolls were not coated (Cr-plating) following processing as Cr-plating is outside the scope of the current project. None of the project partners in the consortium have the capability to Cr-plate the rollers and due to the impending (foreseen) REACH sunset date of September 2017 for the use of Cr6+, the consortium agreed to consider the use of the rolls without wear protection. Figure 35 discloses a comparison of the two selected patterns (T2HV90 and T2HV130) along different stages in the sheet production: model, lab-scale (trials with Rigor disks) and work roll surfaces. It proves that for each texture pattern, the same geometry has been applied from the lab-scale to the prototype parts. Figure 36 shows the work roll pair as installed in the MultiMill at Tata Steel. The T2H90V90 textured work roll was textured centrally and had the position of the Top Roll. The T2H130V130 textured work roll was textured across the barrel width and had the position of the bottom roll in the mill.
48

Figure 34 General view of the textured roll along with a detail of the texture pattern a) T2H90V90; b) T2H130V130.
N.B. Due to a major illness (heart attack) of the operator of the Multimill, no process-specific rolling trials could be conducted and thus only manually-fed strip material was produced.
Figure 35 Comparison between (left) modelled surfaces, (middle) lab-scale surfaces and (right) final work roll surfaces for (top) T2H90V90 and (bottom) T2H130V130 laser textured surfaces.
49

Figure 36 Overview of the rolls as positioned in the Tata Steel Multimill for rolling trials.
The rolls were used to roll several steel grades, including galvanised DX56, YD220, DP600 and various stainless steels. However the confocal microscopy images of Figure 34 and Figure 35 (T2H90V90) and (T2H130V130) and the profile series Figure 37 and Figure 38 reveal a major limitation of the chosen rolling experiments. Namely, after rolling trials, the peaks have been removed (green => red) and the craters are mostly “full”. There were two causes for these discrepancies:
a) Peaks removed due to wear of the fragile asperities (redeposited material) occurring either in the work roll/back-up roll contact or during mill calibration (rolls rotated against each other under high loads to remove stand “play”) b) Crater filling due to zinc pick-up
In order to test the crater filling, the rolls were pickling using a 10% HCl solution with retardant to avoid etching of the steel surface. It shows that the original crater depths are revealed which is clear evidence of extreme work roll fouling by zinc pick-up. The main conclusions of the rolling trials with respect to the work rolls are:
The rolls replicate the expected (modelled and lab-scale) surfaces Although the surfaces of roll 1HV90 and 1HV130 appear very different prior to rolling, the
worn surfaces vary only in crater density This is attributed to the wear of the peaks which may have occurred (in part)
during the calibration step The calibration procedure of the mill and/or the back-up roll contact is detrimental to the
wear of the surfaces Severe work roll fouling occurred due to excessive zinc pick-up. This may be a
consequence of the closed structures and warrants further investigation After removing the zinc pick-up the original crater forms were revealed again Zinc pick-up has severely hindered the rolling trials Rolling without Cr-plating only serves to expedite the above problems and indicates a roll
coating should be used
50

Figure 37 Confocal microscopy analysis of surface profiles of the T2H130V130 work roll surface
(left) as textured, (middle) after rolling and (right) after pickling with 10% HCl solution.
Figure 38 Surface profiles of the T2H130V130 work roll surface (green) as textured, (red) after
rolling and (orange) after pickling with 10% HCl solution.
After roll cleaning, the rolls were used to roll ONLY stainless steel sheet material so as to negate the influence of Zn pick-up and the results were rather positive. Figure 39 shows confocal images of surfaces achieved in 1.4301 stainless steel with T2H90V90 and T2H130V130 work rolls at 2% and 5% elongations. The difference in feature density between the two surfaces is clearly distinguishable, and a higher roughness level is recorded for the T2H90V90 surfaces.
-6
-3
0
3
6
9
12
0 100 200 300 400 500
Measurement Length ( µm)
Mea
sure
men
t Hei
ght (
µm)
Fresh Work Roll After Rolling After De-zincing
51

2% E
long
atio
n
T2H
90V90
Sa
= 0
.394
T2H
130V
130
Sa
= 0
.313
5% E
long
atio
n
T2H
90V90
Sa
= 0
.953
T2H
130V
130
Sa
= 0
.576
Figure 39 Confocal images of stainless steel 1.4301 as rolled with T2H90V90 and T2H130V130 work rolls in the Tata Steel pilot mill. Even though the first rolling trials indicate technical issues with both the textures and the rolling process, especially in the rolling of galvanised strip, the majority of the problems were attributed to the rolling mill and the lack of roll coating. Given the tight time restrictions, no solution was sought as regards roll coatings; however, a second rolling trial was deemed to be worthwhile and a second, simpler mill was chosen. Based on the previous results, the activity during the third stage focused on testing two of the tested patterns improving the configuration of the rolling trials.
µm
00.20.40.60.811.21.41.61.822.22.42.62.8
0 200 400 600 800 µm
µm
0
100
200
300
400
500
600
700
800
900
µm
0
0.2
0.4
0.6
0.8
1
1.2
1.4
1.6
1.8
2
0 200 400 600 800 µm
µm
0
100
200
300
400
500
600
700
800
900
µm
0
0.5
1
1.5
2
2.5
3
3.5
4
4.5
50 200 400 600 800 1000 µm
µm
0
100
200
300
400
500
600
700
800
900
µm
0
0.5
1
1.5
2
2.5
3
3.5
4
0 200 400 600 800 1000 µm
µm
0
100
200
300
400
500
600
700
800
900
52

Based on the experiments described above, there were several reasons for switching to the simpler mill:
• No roll-to-roll calibration necessary • No back-up roll contact • 3 textures on 2 rolls:
─ Tactility (top) ─ 2 x Paint & Forming (bottom)
The disadvantages of this simple mill: • No process record • No tension control • No mill cleaning • Max 1m length strip feed
The selected texture patterns (T1H90V90 and T2H90V90) were chosen based on the results achieved earlier in the investigations and to answer some of the open questions/concerns. Essentially, a replication of the first test was not sensible, given the fact that the T2H90V90 surfaces exhibited superior waviness and peak count values. Choosing a texture not already tested in the imprinting trials was not sensible and choosing a second closed negative texture would not lead to new insights. For this reason, it was decided to produce a work roll with two textures: T2H90V90 as a replication of the first test to generate open or semi-open surface textures in the strip and T1H90V90 to generate closed surface textures in the strip. It was considered that, in addition, the roll roughness should also be comparable following this approach, however since the origin of the wear in the Multimill trials was not fully understood, a decision was also made to slightly increase the work roll roughness. Figure 40 shows schematically the textured roller surface for each pattern, The length along the longitudinal direction was L= 160 mm as that is the minimum length required to conduct the formability tests on the sheets obtained after the rolling process. The strip rolled was 150 mm width. As this second rolling trial was added to the original test plan and generated significant additional work, a lean approach to testing was employed with the aim of extracting as much information from the surface textures as possible without completing a laborious test matrix. Several substrates (DX56, DP600 and YD220) have been rolled and a limited selection must be made to cover roughness, paint and forming analyses, as will be stated in the upcoming sections. In Table 24 it is seen that in contrast to the rolling trials conducted on the Multimill, the work roll surfaces when rolling without calibration and back-up roll contact suffered both negligible wear and Zn fouling as characterised by the consistent roughness values before and after the rolling trials on the Bühler mill.
Figure 40 Scheme of the textured roller surface for the two final patterns.
Table 24 Work roll roughness values before and after Bühler rolling experiments (measurements made perpendicular to rolling direction)
Work Roll Ra [μm] Rz [μm] Rp RPc [cm-1]
OHV90 Before 3.47 19.03 10.58 149
0HV90 After 3.52 17.87 9.87 155
1HV90 Before 3.36 18.95 9.77 156
1HV90 After 3.38 17.07 8.89 153
53

WP 2 Textured Sheet – Design and Manufacturing Methods
Objectives
- Selection of the design parameters based on models for functional surface texture
- Overview of manufacturing methods for textured sheets on laboratory and industrial scale, suited to perform the sample manufacturing in WP 1 as well as for the selected industrial application
- To select the most appropriate ablation regime for performing laser texturing
TASK 2.1 STATE OF THE ART
A comprehensive study of the latest developments and innovations on the relation of textures and surface geometry with friction, tactility, cleanability, appearance and formability was performed. Features of current industrial sheet, such as surface qualities and roughness, are described. Special attention is paid to recent and envisioned future developments. The 60 page review, deliverable D2.1, edited by Dr. D. Matthews, with contributions from all project partners, contains 134 references and is available to all partners of the consortium. The aim of the report is to provide a starting point for the design and manufacturing of textured sheet.
Starting windows for design of textured sheet. As a starting point for the initial surface design models in the STEELTAC project, Table 25 provides a semi-quantitative overview of the surface design requirements for each functional aspect of a surface specific to STEELTAC. In terms of appearance, this is of course relatively straightforward, since steel producers must deliver their products in accordance with the wishes of their customers. For outer body parts for the automotive industry, each end user (OEM) specifies their own requirements, which are generally optimised for their own pressing and painting lines. As always, this is considered a compromise, but the requirements imposed on the steel producer are clear – a high quality strip product must be delivered with a given Ra value and sometimes with a minimum peak count. For other functional properties, this is not so simple and, additionally, the STEELTAC project itself aims at identifying the key surface parameters for optimised functionality. Concerning the starting windows in the project, our objectives are to obtain textured surfaces for painting and for tactility without loss of formability for stainless and galvanised carbon steel strip products. Cleanability and formability will also be investigated, but the specific values of roughness, coefficient of friction or contact angle that are necessary to obtain the desired results for each functionality must be unearthed in future research. To this end, Table 25 provides an overview of currently known boundaries required for each functionality – for example, values as currently requested by customers or practical knowledge, but this should be considered a starting point for optimisation through the project duration.
To highlight this in terms of the cleanability function, it is known that a high contact angle involves a hydrophobic surface and therefore a surface with good cleanability properties, though this must be considered in conjunction with cleaner type and/or air pocket presence. In addition, characterisation shows that a high roughness is related to a hydrophobic surface, and normally, a high roughness involves high friction coefficients. It is therefore clear that the balance of topographic properties to satisfy multiple functionalities must be carefully deliberated. For paint appearance, for example, the final appearance is the key driver for topography limits, while formability is governed mainly by lubricant choice. For tactility, it is clear that friction during touch greatly affects the perception of roughness. Yet exact relations with conventional roughness parameters like Ra or Rt are not yet available. Recent research shows that the true area of contact during touch and the occurrence of unwanted vibrations, i.e. stick-slip, have an influence as well.
There are clearly many “white spots” in Table 25 and this understanding of the balance between a given functionality, the steel production route and subsequent handling will be addressed further.
54

Table 25 Starting design limits and considerations for first modelled surfaces
(Where appropriate work roll and strip values are given individually)
Specific conclusions of the review. Surface topography has been shown to be extremely important in the control and understanding of a wide range of functionalities. Current practices range from direct surface texturing to optimising surface texture transfer by roll-strip contact. It is quite clear that in all cases the characterisation of surfaces by simple Ra is also inadequate.
It is clear that the surface roughness, skewness and anisotropy influence the frictional response. The effect of the surface texture is most pronounced in the mixed lubrication regime.
During sheet metal forming, the friction decides the flow of material, and therefore influences the stress and strain distribution, spring back phenomena, and the risk of wrinkling and fracture.
On a surface level, the topography will also influence the surface deformation and the lubricating effect.
This will affect the resistance against cold-welding and galling.
Furthermore, it is clear from the review that friction during touch greatly affects the perception of roughness. Exact relations with conventional roughness parameters like Ra or Rt are not yet available, however. Recent research shows that the true area of contact during touch and the occurrence of unwanted vibrations, i.e. stick-slip, have an influence as well.
Intermediate roughness should be preferable for friction purposes, not very low – to avoid colder and stickier surfaces – and not very high, since this can cause high friction to occur. A lower friction coefficient can be found when increasing the ratio between spacing/tip radius. A rougher surface with lower peak count presents more rounded asperities. The lower the roughness of the finger, the rougher the feeling when touching a surface.
While the roughness and waviness of the steel substrate play an important role in the final appearance, the paint system continues to have a great influence as well. It is envisaged that the influence of the substrate will become more influential in the near future as the focus switches to cost consciousness, performance and environmental legislations.
Accumulations of dirt on stainless steel surfaces may lead to concentrations of corrosive substances that eventually break down the passive layer. Cleaning is necessary to keep the self-repair mechanism intact as it prevents the build-up of critical concentrations of contaminants like sulphur dioxide or chlorides and ferrous contamination. Stainless steel surfaces thrive on frequent cleaning because there is no surface coating to wear off. The frequency and cost of cleaning stainless steel is lower than for many other materials and this can outweigh higher acquisition costs.
Cleanability essentially depends on grade selection, choice of finish and geometry of the component. The effect of surface/pattern roughness, grain/pattern orientation, and designs that allow for maximum cleaning has to be considered.
Functional Property
Work Roll/Strip
Standard and/or
Texturing Method
Ra (µm) Rt (µm) Rz (µm) RPc (1/cm) Wa (µm) RskWetting Contact angle
Feature shape
Feature Distribution
Feature density (m-2)
Friction Strip N/ALow Ra = low µ; High Ra =
high µ- - - -
Negative = high bearing
area-
Closed voids can reduce
friction -
Many small better than few large
Tactility Strip N/A
humidity has a strong
inlfuence on friction
peak diameter
distance between
peaks
relation with true area of
contact
Work RollSteel
producer determined
2.0 or 2.8 (cutoff= 2.5
mm)- -
>100 (band-width = ± 0.5
µm)
<0.3µm (filter = 0.5-5mm)
negative for wear
-Gaussian (at
least no sharp edges)
"Random" >1.0 x 10 9
StripEnd-user
determined0.9-1.8 (cut-off= 2.5 mm)
- ->75
(bandwidth = ± 0.5 µm)
<0.3µm (filter = 0.5-5mm)
- - - Random -
Formability (Galvanised)
StripEnd-user
determined- -
Strip 2G 0.18 1.88 1.63 - - - - - - -
Work RollScotch-brite Abrasive belt
- - - - - - - - - -
Strip 2M 0.4 4.3 3.3 - - - - - -Work Roll - 2 - 10 - - - - - - -
Strip 2D 0.2 to 0.35 2.3 to 4 2.0 to 3.0 - - - - - - -
Work Roll - 1.2 - 9 - - - - - - -
Hyrdrophobicity/Cleanability
Strip ->150 o = Super-
hydrophobic- - -
Influence unknown. Low friction and deformation / vibrations during touch are favourable
Closed voids better to accommodate lubricant
Increasing roughness on a hydrophilic surface decreases the contact angle, whereas an increase on a hydrophobic surface increases contact angle. However, air pocket
formation can change a hydrophilic surface to a hydrophobic surface.
Formability (Stainless)
Appearance (Stainless Steel)
Appearance (Galvanised for
automotive)
Compliant with Ra for appearance - in automotive forming applications, lubricant choice is key
55

TASK 2.2 STEEL SHEET TEXTURES FOR FUNCTIONALITY
This task aims to establish the required sheet textures to be applied in order to obtain optimum performance. For that, models that can predict the interaction of the sheet during its use, with respect to manufacturing/formability, human touch, wettability and paint appearance are required. Detailed knowledge of contact and friction behaviour, wettability and the adhesion of foreign bodies such as grease and dirt to the surface, the tribology of metal forming operations and appearance after painting was developed with the aim of designing surface textures. The designs were developed starting from grooves and dimple structuring (at micro and nano-scale) by laser ablation, the selected surface technology by the STEELTAC project. The validation was conducted by experimental tests, which are summarised in Sections 3.1 – 3.3.
Tactility. Surface geometrical features have a large influence on the behaviour of a tribological system. One of the first studies on skin friction was carried out at the University of Leeds by Barnes et al [1]. The main conclusions from their investigation of the sliding contact of a fingertip over glass surfaces with different roughness is that desirable feelings are generated when the finger slides over a surface which is less rough than the fingertip, whereas negative feelings are generated when the finger slides over a surface which is rougher than the fingertip [1]. Recently, studies have been carried out trying to relate the frictional properties to the perceived surface properties such as coarseness [2] and grip [3]. The output of the tribological system of the human finger that is touching a steel surface is mainly friction. The analysis of the frictional response of skin/steel contacts helps to understand the complex mechanical interaction at the asperity level of the tribological contact. The variation of the observed friction can be assigned to differences in contacting area that can be caused by the orientation of the finger and by the pressing force. Furthermore, the mechanical response of the skin, which determines the real contact area, changes with the hydration level of the skin. As a material, skin behaves in a complex manner; its behaviour is viscoelastic, it presents anisotropy and there may or may not be an influence of underlying tissues and bones. Furthermore, the surface properties of the skin may vary with anatomical site, environmental conditions or even dietary habits. In handheld devices, touchscreens require low friction to enable the finger pad to slide comfortably and to allow precise operation. Not only functional performance, such as grip or sliding behaviour, but also the touch properties of the product surface are influenced by the frictional behaviour. Analysis of the tactile qualities described from a tribological point of view shows that in the sliding contact between the finger pad and rough surface, friction plays a role in the perception of warmth, roughness and slipperiness [4]. A wide range of friction coefficients are reported in literature as a function of different counter materials, surface roughness, applied normal load and skin conditions [5], suggesting that:
- the coefficient of friction increases considerably with the hydration level, due to softening of the top layer of the skin
- the coefficient of friction against the finger pad decreases with normal load which can be attributed to effects of normal adhesion and the deformation behaviour of the finger pad
- friction decreases with increasing Ra roughness, but it reaches a certain level beyond which the contribution of deformation causes an increase in the friction, and after that remains constant.
Modelling activities with respect to tactility therefore focused on understanding the relation between the friction force and the normal force in skin/object interactions. This relation could possibly be understood by analysing the frictional response with the two-term (non-interacting) model of friction [6-10]. The friction force in skin/object interactions is seen as the sum of the forces required to break the adhesive bonds between the two surfaces at the asperity level, Ff, adh, and the forces related to the deformation of the bodies in contact, Ff, def .This concept was recently applied to the contact of a regularly patterned surface in contact with in vivo skin by van Kuilenburg [6]. The regular pattern consisted of an array of summits of equal height with a common radius Rsummit at a distance λ in both x and y direction, made by direct laser texturing. The term related to adhesion in the contact between the summits and the skin is assumed to be proportional to the real area of contact for each summit individually, Areal, summit , see Eq. (1)
𝐹𝐹𝑓𝑓,𝑎𝑎𝑎𝑎ℎ = 𝜏𝜏𝐴𝐴𝑟𝑟𝑟𝑟𝑎𝑎𝑟𝑟,𝑠𝑠𝑠𝑠𝑠𝑠𝑠𝑠𝑠𝑠𝑠𝑠 (1)
The interfacial shear strength, τ, depends on subject specific or anatomical location specific ‘lubricating’ properties of the skin, such as the sebum content, hydration of the skin, the amount of sweat, any effects due to treatments of the skin, such as the use of creams and conditioners [11] and possibly the hair density [12]. The deformation related term is assumed to be determined by the indentation of an individual summit into the skin, see Eq. (2) [13]
𝐹𝐹𝑓𝑓,𝑎𝑎𝑟𝑟𝑓𝑓 = 316𝛽𝛽 𝑎𝑎𝑅𝑅𝐹𝐹𝑛𝑛 (2)
in which β is the viscoelastic loss fraction, a is the radius of the contact area and R is the radius of the individual summit present at the textured surface.
56

Expressions for the area of contact aH and the indentation depth δH in the Hertzian case for an individual summit/skin contact are depicted in Eq. (3) and (4) respectively.
𝑎𝑎𝐻𝐻 = �34𝑅𝑅𝐹𝐹𝑛𝑛𝐸𝐸∗�1/3
(3)
𝛿𝛿𝐻𝐻 = � 916
𝐹𝐹𝑛𝑛2
𝑅𝑅𝐸𝐸∗2�1/3
(4)
in which E* equals the reduced elastic modulus given by Eq. (5):
1𝐸𝐸∗
= 1−𝜐𝜐𝑠𝑠𝑠𝑠𝑠𝑠𝑛𝑛2
𝐸𝐸𝑠𝑠𝑠𝑠𝑠𝑠𝑛𝑛+ 1−𝜐𝜐𝑝𝑝𝑝𝑝𝑝𝑝𝑝𝑝𝑝𝑝𝑝𝑝𝑝𝑝2
𝐸𝐸𝑝𝑝𝑝𝑝𝑝𝑝𝑝𝑝𝑝𝑝𝑝𝑝𝑝𝑝 (5)
with Eskin and Eproduct and νskin and νproduct being the Young’s moduli and Poisson’s ratios of the skin and product surface respectively at the asperity level. As the elastic modulus of skin is not a material property but a system property – values depend on, for example, the indentation depth and the indentor’s radius, see [14] – it is necessary to use values that are measured with indenters that have equal or similar dimensions to the summits of interest. Values for Eskin and νskin could therefore be taken from representative experimental research such as that presented in [15]. It is possible to improve the quality of the model greatly by adding adhesion to the Hertzian contact model. As demonstrated by [6], the normal force acting on an individual summit must be corrected to an effective normal force, Feff, summit to correctly estimate the increased contact area for that specific summit-skin contact:
𝐹𝐹𝑟𝑟𝑓𝑓𝑓𝑓,𝑠𝑠𝑠𝑠𝑠𝑠𝑠𝑠𝑠𝑠𝑠𝑠 = 𝐹𝐹𝑛𝑛 + 2𝐹𝐹𝑎𝑎𝑎𝑎ℎ + 2�𝐹𝐹𝑎𝑎𝑎𝑎ℎ(𝐹𝐹𝑛𝑛 + 𝐹𝐹𝑎𝑎𝑎𝑎ℎ) (6)
with the adhesive force Fadh based on the JKR theory of adhesion, see [4]
𝐹𝐹𝑎𝑎𝑎𝑎ℎ = 32𝜋𝜋𝜋𝜋𝑊𝑊12 (7)
The work of adhesion at the asperity level, W12, gives the opportunity to fine tune the overall contact by tailoring individual summits to the presence of specific layers. The feasibility of this approach, however, is to be validated by future research. From Eq. (2)-(7) one can construct an expression for the real or true area of contact, as a function of the material properties of the skin and product, as a function of the two controlling roughness parameters and the nominal contact area A0, see Eq. (8):
𝐴𝐴𝑟𝑟𝑟𝑟𝑎𝑎𝑟𝑟 = 𝜋𝜋 � 34𝐸𝐸∗�23 �𝑅𝑅
𝜆𝜆�23 �𝐹𝐹𝑒𝑒𝑒𝑒𝑒𝑒
𝐴𝐴0�23 𝐴𝐴0 (8)
Similarly, an expression for the deformation related term of friction for an individual summit/skin contact with radius asummit-skin relative to the radius of that specific summit R can be constructed, see Eq. (9)
𝑎𝑎𝑠𝑠𝑝𝑝𝑠𝑠𝑠𝑠𝑠𝑠𝑝𝑝−𝑠𝑠𝑠𝑠𝑠𝑠𝑛𝑛
𝑅𝑅= � 3
4𝐸𝐸∗�13 �𝜆𝜆
𝑅𝑅�23 �𝐹𝐹𝑒𝑒𝑒𝑒𝑒𝑒
𝐴𝐴0�13 (9)
Expression (8) and (9) can be used as building blocks for predicting skin-friction, as shown in more detail in the work of Van Kuilenburg et al [6]. This approach, although developed for a specific texture, could possibly be extended to rough product surfaces in general, as it is based on the contact behaviour of individual summits.
From the presented theory, a strategy was extracted for optimising surfaces with respect to tactility. The key element is minimising the adhesion term of friction by minimising the true area of contact. The strategy is to design a surface with a minimal true contact area in sliding with a human finger pad, while avoiding deformation terms in sling contact due to indentation by sharp summits, because this will increase friction again. The starting point in texture designs was therefore to reduce friction in sliding contact by reducing the true area of contact, which for compliant contact is controlled largely by the nominal area of contact. The relation between the real area of contact and the frictional response was studied by analysing the relation between the true area of contact and the frictional response for a variant of the 2D Peano curve, a channel grooved texture [16] and a dense pillar based structure, see Figure 41, designed as a set of pillars of a certain height and with a certain radius.
57

Figure 41 Pillar Design for Tactility Enhancement, taken from [17].
Paint appearance. In the case of painted steel strip – for example, galvanised steel strip for automotive applications – a short review of current painting practise will aid the understanding of the focus on surface texture. It should be noted that topographic parameters of major influence on the paint appearance of a pressed part are currently considered to be amplitude (roughness and waviness) and spacing (peak counts) of topographical features. It is important to re-emphasise that the final paint appearance of a galvanised steel strip is the amalgamation of many previous processing (rolling, forming and painting) steps, with the desired surface roughness being produced from a work roll surface “negative”. Therefore, when discussing current developments and innovations in surface texture design and surface geometry for automotive parts, these steps should be considered together – after all, it is the complete final system (steel substrate, steel coating and the paint layer) that determines the ultimate appearance.
There is a clear trend to reducing costs at the automotive manufacturers that translates to thinner sheet metal, thinner coating layers whilst keeping same performance, and improved surface quality. For steel manufacturers this means that innovations must be made in substrate materials (stronger steels), corrosion protection (thinner Zn layers to achieve the same or better corrosion protection (e.g. magnesium-zinc coatings) and better surface texture control (improved work roll texturing).
It is generally known that the lower the roughness the better the appearance since the roughness will be levelled out by the paint system, but due to the finite curing time and the viscosity of the paint not all morphological structures of the substrate will be smoothened by the paint [18][19]. However, if the roughness is too low, it can lead to slippage during handling, and press surface defects and difficulties like galling [20]. The peak count is of prime importance and a high peak count is required. As mentioned previously, one of the disadvantages of Electro Discharge Texturing (EDT), is the uncontrollable peak counts with varying Ra values (and open voids), which is detrimental to pressability and paintability. For steel, a good forming behaviour is achieved only if the part being manufactured is lubricated. A certain amount of roughness is therefore applied in order to keep the lubrication on the sheet during forming. However, the roughness needs to be limited to prevent Orange Peel (OP) occurring after painting [21]. So a strip roughness at the low end (smooth) of the required Ra range, combined with high peak count, will contribute to acceptable final paint appearance [22-24].
Roughness parameters were always considered in order to correlate the surface texture on the paint appearance, but the waviness was often neglected until the beginning of the nineties [21]. It was soon shown that the traditional characterisation of the surface topography by average arithmetic roughness and peak count was not sufficient and that the longer wavelength irregularities of the surfaces needed to be included [23]. This was supported by image clarity measurements showing an increase of Distinctness of Image (DOI) for lower wavelengths (Wca). It was then shown that the appearance after painting depended more on waviness than short wavelength irregularities. As a matter of fact, short wavelength components of the profile signal were proven to be suppressed after painting while longer wavelength components would dominate [18][19][20][21][24]. This fact was also determined by power spectrum analysis [25]. It thus appeared that waviness was the best approach to predicting paint appearance independently of the texturing process, while envelope
58

parameters like the motif W or Macro Ra were found to depend largely on the roll texturing technique and have a limited ability to predict appearance [26].
In some of the first reports combining the surface with the painting process, it was shown that the waviness should be kept low in accordance with the levelling time and viscosity of the paint, and that the waviness should remain below 0.8 μm. Recent reports, and more particularly the CARSTEEL project1, show that the waviness of the substrate should be less than 0.3 μm for an acceptable painted appearance. This value is valid for band pass filters of λc = 0.8 mm and λf = 2.5 mm one should adapt this value when other band pass filters are used or other determination of waviness parameter.
The relationship between appearance and wavelength and the impact of observation distance is simply demonstrated by Gardco [27], a manufacturer of surface quality control instrumentation. In Figure 42, images are given that correspond to rough steel sheet and smooth steel sheet, examined at 40 cm distance. The influence of the steel sheet is clearly visible and the correlation with measurement wavelength is also apparent in the graph.
1 O. Deutscher, D. Paesold, K. Körner, H.-G. Weyen, S.P. Jupp, Characterising the surface waviness of hot dip galvanised steel sheets for optical high-quality paintability (CARSTEEL) Final Report EUR 23854 EN (2009
59

Ro
ug
h S
teel
Sm
oo
th S
teel
Figure 42 Influence of steel roughness and measurement wavelength on the appearance of steel at a 40 cm observation distance.
In Figure 43, the influence of an observation distance of three metres is seen. In this instance the longer wavelength dominates and the influence of a rougher steel is also shown to have a negative impact on the appearance.
Ro
ug
h S
teel
Sm
oo
th S
teel
Figure 43: Influence of steel roughness and measurement wavelength on the appearance of steel at a 3 m observation distance.
The rules of thumb are simple:
• Rough steel: high roughness high waviness poor paint appearance
• Smooth steel: low roughness low waviness better paint appearance
However, the control is difficult as it is desirable to decouple the relationships between Ra and Wa and control the increase in Wa. This is particularly difficult to achieve for the electro-discharge texturing technique. However, controlled laser texturing is considered to offer significant improvement opportunities in this area, see Figure 44.
< 0.1 1 - 3 3 - 10 10 - 300.3-10.1-0.3 mmdullness Wa Wb Wc Wd We
0
10
20
30
40
50
60
70
80
Topcoat
< 0.1< 0.1 1 1 -- 33 3 3 -- 1010 10 10 -- 30300.30.3--110.10.1--0.30.3 mmmmdullnessdullness WaWa WbWb WcWc WdWd WeWe
00
1010
2020
3030
4040
5050
Dominant Short Wave
< 0.1 1 - 3 3 - 10 10 - 300.3-10.1-0.3 mm< 0.1 1 - 3 3 - 10 10 - 300.3-10.1-0.3 mmdullness Wa Wb Wc Wd Wedullness Wa Wb Wc Wd We
0
10
20
30
40
50
60
70
80
0
10
20
30
40
50
60
70
80
Topcoat
< 0.1< 0.1 1 1 -- 33 3 3 -- 1010 10 10 -- 30300.30.3--110.10.1--0.30.3 mmmmdullnessdullness WaWa WbWb WcWc WdWd WeWe
00
1010
2020
3030
4040
5050
Dominant Short Waveon smooth steelon smooth steelon rough steelon rough steel
on smooth steelon smooth steelon rough steelon rough steel
< 0.1 1 - 3 3 - 10 10 - 300.3-10.1-0.3 mm< 0.1 1 - 3 3 - 10 10 - 300.3-10.1-0.3 mmdullness Wa Wb Wc Wd Wedullness Wa Wb Wc Wd We
0
10
20
30
40
50
60
70
80
0
10
20
30
40
50
60
70
80
Topcoat
< 0.1< 0.1 1 1 -- 33 3 3 -- 1010 10 10 -- 30300.30.3--110.10.1--0.30.3 mmmmdullnessdullness WaWa WbWb WcWc WdWd WeWe
00
1010
2020
3030
4040
5050
Dominant Long Wave
on smooth steelon smooth steelon rough steelon rough steel
on smooth steelon smooth steelon rough steelon rough steel
60

Figure 44: (left above) Relation between strip surface Peak Count (peaks per inch) PPI and its waviness Wa for various work roll Ra values (a) 2.4 µm (b) 2.6 µm (c) 3.2µm (d) 2.6-3.2µm work rolls a-c~200mm diameter; d=520 mm diameter [27] and (left below) schematic translation highlighting the target window for STEELTAC.
The first texture design based on this is depicted in the right-hand part of the figure [28]. As will be discussed in the following chapter, however, the realisation of a stochastic surface was deemed not possible, and as such the surface design for paint appearance was revisited.
From the presented theory, a strategy was extracted for optimising surfaces with respect to paint appearance. The key elements are to increase peak counts and reduce waviness, while maintaining sufficient roughness to comply with current customer needs. The relationship between strip waviness and strip peak counts for EDT surfaces is shown in Figure 44, namely that waviness decreases with increasing peak count values. The relationship holds true for different work roll diameters and roughnesses (the different symbols in the Figure) and this is a relationship that we know for EDT textured surfaces and thus the assumed starting point within STEELTAC, namely increasing peak counts and reducing waviness, while maintaining sufficient roughness to comply with current customer needs. Typically, OEMs in Europe request Ra values between 0.7 µm and 1.8 µm for automotive outer parts). This is generally a balance between low Ra, corresponding with low waviness for paint appearance and high Ra necessary for good forming operations. OEMs are also showing a trend towards RPc specifications, with high-end products demanding a peak count value of >75 cm-1 (RPc 0.5). It must be highlighted that the main importance for the customer is, however, not to increase peak counts, but to reduce waviness – i.e. the structures not covered (or indeed embellished) by the paint process. For EDT, there is an (empirical) correlation as highlighted by Figure 44. From experiments and data analysis at Tata Steel, the schematic figure was created outlining the target window in relation to EDT surfaces for reduced Wa and peak counts as requested by customers.
30 40 50 60 70 80 90 100Peak Count (Band width + /- 0.5 µm)
[1/cm]
0.4
0.3
0.2
0.1
Target Window
Wav
ines
s (0.
8-2.
5) [µ
m]
Ra = 1.0 µm
Ra = 0.7 µm
Ra = 1.5 µm
61

References
[1] C. J. Barnes, T.H.C. Childs, B. Henson, C. H. Southee, Surface finish and touch, a case study in a new human factors Tribology, Wear 30 7 (2009) 2778-2784
[2] L. Skedung, K. Danerlöv, U. Olofsson, C. M. Johannesson, M. Aikala, J. Kettle, M. Arvidsson, B. Berglund, M. W. Rutland, Tactile perception: Finger friction, surface roughness and perceived coarseness, Tribology International 44 5 (2011) 505-512
[3] S. Schreiner, M. Rechberger, J. Berling, Haptic perception of friction: correlating friction measurements of skin against polymer surfaces with subjective evaluations of the surface´s grip. Tribology International 63 (2013) 21-28
[4] J. van Kuilenburg, A mechanistic approach to tactile friction, PhD Thesis, Univ. Twente, October 2013, The Netherlands.
[5] J. van Kuilenburg, M. A. Masen, E. van der Heide, A review of fingerpad contact mechanics and friction and how this affects tactile perception, Proceedings of the IMechE Part J: Journal of Engineering Tribology 229 3 (2015) 243–258
[6] J. van Kuilenburg, M.A. Masen, E. van der Heide, The role of the skin microrelief in the contact behaviour of human skin: Contact between the human finger and regular surface textures, Tribology International 65 (2013) 81-90
[7] L. Wolfram, Friction of skin, Journal of the Society of Cosmetic Chemists 34 (1983) 465-476
[8] S.A. Johnson, D.M. Gorman, M.J. Adams, B.J. Briscoe, The friction and lubrication of human stratum corneum, in: C. T. D. Dowson (Ed.), Thin Films in Tribology, Proceedings of the 19th Leeds-Lyon Symposium on Tribology held at the Institute of Tribology, University of Leeds, volume 25, Amsterdam (The Netherlands): Elsevier, 663-672 (1993)
[9] M.J. Adams, B.J. Briscoe, S.A. Johnson, Friction and lubrication of human skin, Tribology Letters 26 (2007) 239-253
[10] S. Derler, L. Gerhardt, Tribology of skin: Review and analysis of experimental results for the friction coefficient of human skin, Tribology Letters 45 (2011) 1-27
[11] A. Ramalho, C.L. Silva, A.A.C.C. Pais, J.J.S. Sousa, In vivo friction study of human skin: influence of moisturizers on different anatomical sites. Wear 263 (2007) 1044-1049
[12] N.K. Veijgen N K. Skin Friction - A novel approach to measuring in vivo human skin, Enschede (The Netherlands): PhD Thesis University of Twente, 2013
[13] J.A. Greenwood, D. Tabor, The friction of hard sliders on lubricated rubber: the importance of deformation losses, Proceedings of the Physical Society 71 (1958) 989-1001
[14] J. van Kuilenburg, M.A. Masen, E. van der Heide, Contact modelling of human skin: What value to use for the modulus of elasticity? Proc. IMechE Part J: J Engineering Tribology 227 4 (2013) 349-36
[15] Y. Yuan, R. Verma, Measuring microelastic properties of stratum corneum, Colloids and Surfaces B: Biointerfaces 48 (2006) 6-12)
[16][17] Work in preparation by S. Zhang et al on contact modelling and surface texturing based on space filling
[18] C. Lahaye, An empirical method to predict paint appearance starting with substrate roughness data. Proceedings IBEC 1996, automotive body painting (1996).
[19] B.C. De Cooman, C. DeMare, K. Meseure, On the visual appearance of painted galvannealed panels. In Zinc-Based Steel Coating Systems: Production and Performance; San Antonio; TX; USA; 16-19 Feb. (1998)
[20] C. Lahaye, W.C. Emmens, J. Bottema, F. Schoepen, G. Verhoeven, Influence of substrate texture on forming and paint appearance of aluminium sheet material. pp 107-114. (1997)
[21] C. Marique, J. Crahay, A. Bragard, Surface Roughness and User Properties of Cold Rolled Steel Sheets, Developments in the Drawing of Metals (1983) 242-248
[22] O. Deutscher, D. Paesold, K. Körner, H-G. Weyen, S.P. Jupp, Characterising the surface waviness of hot dip galvanised steel sheets for optical high-quality paintability (CARSTEEL) Final Report EUR 23854 EN (2009)
[23] S. Olijar, G.A. Themelis, Development of improved surface texture for automotive product. 34th Mechanical Working and Steel Processing Conference Proceedings 93-100 (1992)
[24] F. Clarysse, Characterizing the surface waviness of steel sheet: reducing the assessment length by robust filtering, Wear 257 12 (2004) 1219-1225
62

[25] J. Scheers, Assessment of steel surface roughness and waviness in relation with paint appearance, International Journal of Machine Tools & Manufacture 38 5-6 (1998) 647-656
[26 ] http://www.gardco.com/pages/gloss/wavescan_dual.cfm
[27] Y. Kimura, M. Ueno and Y. Mihara, Printing Behavior of Roll Surface Texture to Hot-dip Galvanized Steel Sheet in Temper Rolling, Tetsu-to-Hagané 95 5 (2009)
[28] D. Matthews et al, work in preparation on texture design for paint appearance
63

TASK 2.3 PRODUCTION METHODS FOR TEXTURED STEEL SHEET
Thanks to its beneficial features (fast processing time, clean for the environment, no need of vacuum, control of the shape and size of the ablated micro-textures by tuning the characteristic of the laser spot), Laser Surface Texturing (LST) is probably the most advanced technique developed for surface texturing of mechanical components. As stressed above, textured rollers are commonly used for the manufacturing and processing of flat-rolled steels in the automobile industry to increase the grip on the steel sheet (improving friction between roller and sheet to facilitate the smooth rolling process) and create a surface finish to enhance formability and improve the adhesion and appearance of paint. Other benefits that result from the textured strip include the quality enhancement of parts due to less galling and scoring during production as well as elimination of metallic coatings such as Titanium Nitride (TiN) or copper plating, frequently used in these dynamic components.
During the LST process, the laser beam hits the workpiece in an ordered sequence of pulses characterised by the pulse length and repetition rate (frequency), see e.g. Figure 2. This allows the processing energy to be released in relatively short time intervals. Additionally, the laser radiation can be focused on a spot with very small dimensions, from sub micrometre to 50 µm, which results in a significant energy density (fluence) in the spot area. Therefore, an extremely high density can be achieved in the laser/material interaction zone which explains the capability of laser texturing to process materials that are difficult to machine. In addition, not only this high fluence but also high values of the scanning speed are imperative to identify laser texturing of engineering materials as a viable alternative to conventional machining processes and EBT. When pulsed laser texturing is performed, the process of ablating a material takes place within the pulse. The absorbed energy from the laser pulse melts the material and heats it to a temperature at which the atoms gain sufficient energy to enter into a gaseous state. There is enough time for a thermal wave to propagate into the material. Evaporation occurs from the liquid state of the material. The molten material is partially ejected from the cavity by the vapour and plasma pressure, but part of it remains near the surface. After the end of a pulse, the heat quickly dissipates into the bulk of the material and a recast layer is formed. Thus, a compromise between high removal rates and the resulting surface integrity and quality should be taken into account when selecting the most appropriate ablation regime for performing laser texturing. Consequently, for optimal machining results a proper match between the laser parameters and the material should be achieved. Once an industrialised laser system has been selected for the laser texturing process, the first step of the laser texturing procedure focuses on evaluating the roughness transfer capability during the press tests at different contact pressures. This is extremely important for the optimisation of surface design in roll-to-strip contact to understand which surface features are transferred and when, along with the role of the texture itself. During this first stage, an initial texture pattern must be considered and imprinting tests have to be carried out using the corresponding substrate materials. The aim of this first analysis is to understand the influence of the substrate on the roughness transfer capability depending on the contact pressure.
Afterwards, based on the suitable texture patterns to be produced in the sheets in terms of studied functionality (paint appearance, wettability, tactility, etc.) and taking into account the study of the roughness transfer conducted in the first stage, a modelling of the "negative texture" topographies to be textured on rolls was carried out. Based on the results of the modelling, different texture patterns were selected to be produced on flat plates. Consequently, imprinting tests were conducted in order to transfer the target topography to the metal sheets, following which, a certain number of studied patterns were selected for application to the realistic parts: rolls.
Firstly, a set of trials were conducted in a test roll in order to define the best rotation strategy to develop the selected patterns on roll in the appropriate way. Then a second set of laser texturing trials was conducted on rolls, considering the texture patterns selected in the second stage. Afterwards, the rolling process was carried out and the rolled strips were generated.
Table 26 Economic estimation of the laser machined required to upscale the mill roll laser texturing process:
Price [€] Description
Laser system 35,000 Pulsed laser system guided by optical fibre
Control aspects 45,000 Issues related to the synchronisation of the linear axis of the laser head's movement with the rotary axis
Mechanical aspects 30,000 Design and manufacturing of the machine
Total 110,000 Workstation for cold roll laser texturing
The cycle time for the roll texturing process of a skin pass mill work roll depends directly on the dimensions of the roll and the kind of target texture patterns. In the case of the rolls and the texture pattern considered in the STEELTAC Project, the cycle time is about 5 hours/roll (2200 mm barrel
64

length, 650 mm diameter) using a laser system is described in Task 3.4. Considering the upscaling of mill roll laser texturing process, the limitations are largely finance-based. For example, for a small, low throughput industry, the cycle time could be reduced to more than half at relatively low costs by increasing for example the power applied. Laser Texturing gives more possibilities for surface control, but indeed there are still major challenges to be able to texture a roll of a given diameter and crown (how to achieve seamless texturing of deterministic structures) and thus key aspects concerning the synchronization among the different equipment involved in the laser texturing process (rotary axis, lineal axis, laser head (scanner) and laser pulses) must be considered in developing an industrially implementable laser texturing system.
The next step for the industrial implementation of laser texture technology is the upscaling process and future commercialization of rolling mill rolls. Based on the results achieved in the STEELTAC project concerning the significance of generating precise texture patterns and the geometric characteristics of the milling rolls, the key aspects in the upscaling process should be related to the synchronization among the different equipment involved in the laser texturing process: rotary axis, lineal axis, laser head (scanner) and laser pulses. Moreover, it is also needed to consider an optimization process of the laser texturing process in order to reach a balance between the desired visual appearance properties and requirements in terms of different functionalities such as hardness, wear resistance and wettability. Additionally, hardening aspects of the roll surface need to be taken into account.
As described in the "Exploitation section" of this report, an estimation has been made that with the scaling up, the processing time can be reduced to less than 1 hour, reaching the level of the actual continuous laser technologies (Pomini), but with a pulsed laser. This new technology will offer the advantage of reducing the thermal impact of the texturing process and improve the environmental aspects and reduce maintenance too. With the new proposed laser texturing system, no filter systems, no electrodes, no hazardous dielectric oil, pumps etc will be needed (compared to EDT). When comparing with Electron Beam texturing (EBT), no vacuum is needed and no Chromium (VI) is used in comparison with Pretex, no noise pollution is produced if we compare with shot blasting and so on and above all, more freedom in surface design is achievable.
The next step for the implementation of project results will be the scale up of the texturing process. From a purely financial point of view, it is possible to say that current EDT machine are upwards of 2 million euros rising to even 4 million euros for high throughput systems (2000mm width, 400 mm diameter in <45 minutes). With this in mind, for the same capital investment, a laser texturing system having an equal or faster processing time as EDT will be attainable. Beyond the investment financial implications, the new laser texturing system will permit operational savings in consumables and improvements in health and safety since there will be no need for electrodes (typically high purity extruded copper), flammable dielectric oil nor the whole filter system etc... when compared with the current EDT technologies. The confidence in achieving this result is supported through the recently submitted RFCS LaProFAST Pilot and Demonstrator proposal.
65

WP 3 Experimental work – Tactility, Wetting Behaviour, Paint Appearance and Formability
- To establish a relation between surface geometrical features and human touch for stainless steel sheet material
- To evaluate the self-cleaning behaviour of the textured surfaces
- To evaluate the appearance after painting of textured carbon steel sheet material
- To evaluate the lubrication strategy for textured sheet in metal forming applications
- To establish a process window for formability of surface textured stainless steel sheet material
TASK 3.1 TACTILITY
Introduction
Tribological tests were performed at IK4-Tekniker and at the University of Twente in order to study experimentally the effect of surface geometries designed in Task 2.2 on friction. Dynamic touch was assessed by a testing panel combined with touch-related questionnaires. All tests were aimed at selection of textures for stainless steel sheet material.
Experimental methods
UMT-CETR tribometer (Figure 45a) from IK4-Tekniker was used to test mechanical skin equivalent samples. Testing conditions were: Load: 3 N, Time: 400 s (500 cycles), Stroke: 12 mm, Counterbody: Mechanical skin equivalent Lorica Soft®, see Figure 46
Figure 45 a) UMT-CETR tribometer, b) tactile friction measurement, and c) three-axis force/torque transducer (ATI Industrial Automation, Apex, NC, USA).
a
66

Figure 46. Lorica Soft®.
Lorica Soft® material (polyurethane coated polyamide fleece) was used as counterbody (Figure 46). This material has a surface topography and roughness similar to that of human skin [1].
Measurements at the University of Twente were performed using a load cell (ATI Gamma three-axis force/torque transducer, ATI Industrial Automation, Apex, NC, USA), see Fig. 45 b-c. The ATI force transducer uses six degrees of freedom to measure the forces (normal force in z-direction, tangential forces in xy-plane and torques around x, y and z axes). The force measurements have a resolution of 25 mN in normal direction and 12.5 mN in tangential direction, with a sampling rate of 100 Hz. The sliding velocity was calculated from the displacement of initial contact position and final position over time. Each sample was fixed to the top of the friction transducer using double-sided tape. The middle finger of the non-dominant (left) hand of a healthy male adult (31 years old) or female adult (25 years old) was used for all the experiments reported in this section. One experiment consisted of three repetitive single strokes of the finger, sliding towards the body. The stroke length was 45 mm. The normal load was controlled by placing a mass on the top of the sliding finger. Once the normal load was comfortably placed over the skin area tested, each stroke started with imminent movement of the fingertip against the surface tested. During each stroke, the sliding velocity was kept as constant as possible. The end of each stroke was determined when there was no longer any contact, or when the normal load was equal to zero. Coefficients of friction (COF) were calculated within a selected range with respect to the targeted normal load (0.5 N, 1 N and 2 N). An average velocity of 37 ± 8 mm/s was employed in all the experiments reported in this section. All measurements were carried out in an environmentally controlled laboratory at 20±1°C and 40±5% relative humidity. Before each experiment, the subject cleaned his/her finger with a tissue in combination with an amount of isopropanol to remove any sweat from the most of the upper surfaces of the ridges of the skin. The hydration level of the skin surface was monitored before the measurements using a Corneometer CM 825 (Courage+Khazaka GmbH, Germany). The average hydration level of the skin was 40 ± 3 AU. This level is typical for ‘dry’ conditions.
Main results
1. Measuring the effect of surface texturing on friction for skin equivalent Lorica
Two different applications were studied by IK4-Tekniker. The first one, in collaboration with the University of Twente, was to measure the effect of evenly distributed conical asperities on friction and the second one, in collaboration with Acerinox, measured the effect of finish 2G and textures with similar roughness.
Conical geometry with the presence of tailored microstructures and nanostructures were produced with the picosecond laser device from IK4-Tekniker. Four different patterns were designed based on a theoretical analysis carried out by University of Twente. Two cone widths and depths were selected: 30 µm and 75 µm, and 15 µm and 30µm respectively (see Figure 47). The texturing parameters used were conic structures generated at a power of 2.4 W (20% of 12 W) and 0.6m/s. All textures were analysed measuring the roughness, the wetting behaviour and the tribological response (Table 27). The results were compared with the initial substrate from Acerinox (2R)
67

Figure 47 Topographies of different patterns using a picosecond laser and summary of width and depth of cones (ρ: density of cones, h: depth of cones).
Table 27. Roughness, contact angle and friction coefficients
Samples Ra (µm) Contact angle (θ,⁰0)
Mean Friction Coefficient (TEK)
Mean Friction Coefficient (UoT)
2R 0.04 68 0.628 -
PS1 ( ↑ 1.25 83 0.622 0.279
PS2 ( ↑ 0.68 90 0.590 0.502
PS3 ( ↓ 3.99 94 0.457 0.340
PS4 ( ↓ 1.62 78 0.473 0.287
Texturing increased the roughness, particularly when increasing the depth. It is possible to keep roughness low when combining low peak density and low height, see Figure 47. The hydrophobicity increased with texturing, reaching a maximum with low density and high height, but the low density low height still increased the contact angle in relation to the reference. The friction coefficient was also reduced with texturing, particularly for low density geometries in combination with Lorica, not having a clear tendency in the case of in vivo skin. The PS3 geometry (ps ↓ρ ↑h) with low friction coefficient, high roughness and the highest hydrophobicity was selected for the in vivo tactile tests.
A map of patterns was designed by University of Twente to be textured with the nanosecond laser. Structures were made consisting of isolated craters and grids. Two types of matrices created by grids were texturised, namely low density grids and high density grids. Texturing parameters are summarised in Figure 48.
68

Figure 48 Textures and texturing conditions.
All textures were analysed measuring the roughness, the wetting behaviour and the tribological response (see Table 28). Those results were compared when possible to the initial substrate (2R).
Table 28. Roughness, contact angle and friction coefficients
Samples Ra (µm) Contact angle (θ,⁰)
Mean Friction Coefficient (TEK)
Mean Friction Coefficient (UoT)
2R 0.04 71 0.628
C1 3.35 87 0.656 0.439
C2 4.63 90 0.711 0.487
C3 5.75 100 0.831 0.569
LDG1 3.13 80 0.695 0.473
LDG2 5.06 88 0.928 0.414
LDG3 6.56 103 0.906 0.394
HDG1 4.02 75 0.774 0.445
HDG2 6.07 92 0.910 0.562
HDG3 7.47 109 1.089 0.454
Taking into account the results from IK4-Tekniker and Twente, the lower friction coefficient with a smooth roughness was achieved with the patterns with isolated craters, codified as C1 and low density grids, codified as LDG1. In any case both surfaces have greater roughness than the starting material.
Differences were observed in friction results in TEKNIKER (in laboratory tests with Lorica) and Univ. Twente (in vivo tests). Comparative relative levels of friction (such as lower friction in each case) can be achieved in laboratory tests with Lorica and with real fingerpads when the roughness of the steel surface is low, but there is no correlation at all when the counter roughness is high. This can be explained by three phenomena influencing the contact and the measurements.
• Hydration levels influence the lower friction obtained in-vivo tests. • The main conclusion from the Barnes investigation (1) in relation to the sliding contact of a
fingertip over a glass surface with different roughnesses was that desirable feelings are generated when the finger slides over a surface which is less rough than the fingertip,
69

whereas negative feelings are generated when the finger slides over a surface which is rougher than the fingertip. The extrapolation of these results in our case (steel surface) is that the real roughness of the fingertips during in vivo testing are possibly greater than the Lorica soft (11-18µm Ra), so it is normal to obtain higher friction coefficients in lab friction tests, as can be seen from Table 1 and Figure 4, Deliverable 3.1 (index finger was used which typically has Ra roughness between 19 and 33 µm).
• The pressure in the contact remains practically constant during the tests in laboratory friction tests, but the pressure is reduced during in real in vivo friction tests. This reduction of pressure also explains the lower friction coefficient obtained during in vivo tests. This result offers a vital recommendation for future testing and simulation of tactile contact, namely to try to find a counter material with roughness closer to that of the typical fingertip, probably to reproduce the finger texturing in the polymeric material in a similar way to that already done in the roller, inducing a greater elasticity and controlling humidity both in real in vivo tests and in the laboratory tests.
2. Measuring the effect of surface texturing on friction for in vivo skin touch conditions
Orientation effects were studied by researching the role of the sliding direction against a grooved channel texture and against grid type micro-textured surfaces on tactile friction.
An experimental approach is used based on measuring tactile friction for directional texture (grooved channel) with varying depths. For a reference surface, in this current case a polished surface from the same tool steel is compared. The experimental results are analysed to explain the observed skin friction behaviour as a function of surface texture parameters, sliding direction and applied normal load. Sliding parallel to the groove length shows greater values in COF than sliding perpendicular to the groove direction. Furthermore, parallel sliding reveals a higher dependency of COF on the depth of the grooved channel texture than perpendicular sliding. Application of the two-term friction model suggests that the adhesion component of friction has greater impact on parallel than perpendicular sliding direction. According to the observations, grooved channels are well suited to controlling skin friction in direction dependent sliding, for moderately loaded contact situations.
Removal of material clearly reduces the nominal area of contact and therefore potentially reduces the adhesive component of friction on sliding during touch. Laser ablation of grooves could also create direction independence of sliding by applying a pattern based on the Hilbert or Peano function. Peano proposed the very first space-filling curve in analytical form which demonstrated the quantities in ternary [2][3]. This space-filling curve uses unit fractions as the entries by matrix manipulation. Therefore, this peculiar geometric structure demonstrates the ability to contain the entire two-dimensional unit space indefinitely. When the stroke length is long enough, the overall encountered peaks and valleys are balanced from all directions, making it possible to minimise the effect of orientation. Another way of creating direction independence is by using a ‘grid-like’ structure which reduces the interacting steel surface to a set of discrete points that carry the load and interact with the skin, see Figure 49.
(a) (b) (c)
Figure 49 Textures examined by SEM at the same magnification (a) grooved channel (Z001); (b) Peano curve (Z002); (c) grid PS4 (Z003).
Figure 50 shows the average friction coefficient of all the samples at different loads and sliding directions. At a low normal load (FN = 0.2 N) as shown in Figure 50 (a), the grooved channel increased friction in perpendicular (90 degree) sliding compared to parallel. While the normal load increased to 1.0 N, the grooved channel showed greater influence of orientation effect. Relatively, the grooved texture with the Peano curve (Z002) was constant in resulting tactile friction for the different sliding directions. Similarly, in the grid PS4 texture, see Annex 1, (refer to Z003 in Fig. 50) the orientation effect is minimised under different loads. Based on these observations, the relationship between the COF and normal load is concluded to be orientation dependent for sample 2G (refer to Z000 in Fig. 50) and the groove channel Z001, and orientation independent for sample Z002 and PS4. The cause of orientation effect is thought to be connected to the change of contact conditions in relation to the characteristic of the surface textures.
70

(a) (b)
(c)
Figure 50. Average COFs for each sample at (a) FN = 0.2 N, (b) FN = 0.4 N, and (c) FN = 1.0 N.
3. Balancing comfort and tactile friction on stainless steel by surface texturing.
Tactile comfort, a concept with a mechanical and a psychological perspective, is of particular concern to industry. The hedonic attributes of tactile comfort are influential to our daily life like using haptic devices, personal care products, holding tool handles or in domestic appliances. In the case of clothing, the degree of comfort in tactile contact between the textile fabrics and body greatly affects the quality of our daily life. With the research of the tactile friction and perception of textile fabrics, the hedonic attributes of textile fabrics are studied and the comfort level of clothing is optimized. However, the study of tactile comfort and friction on stainless steel material is limited. Stainless steel is common material used for buildings or for domestic appliances. The enhancement of tactile comfort in daily interaction with stainless steel products might directly increase the customers’ satisfaction by the stimulation of somatosensory system in a positive way. A higher value could be created by understanding the stimulus parameters and pleasantness factors, validated by an experimental approach. The objective of this research line was to investigate the relationship between perception and tactile friction.
The perception experiments were carried out by using panel test method with 16 participants to identify the perceived roughness, perceived stickiness and comfort level from the subjects. Research suggests both vision and touch are able to contribute information to the perception of texture in an independent but complementary manner [4]. The exposure of the object to a visual stimulus can increase or decrease the preferability of the touch perception [5]. Therefore, all the participants were blindfolded to avoid vision interference on perception and focus on touch perception only. Four textured and one non-textured stainless steel samples were presented to the subjects in random order. The subjects were requested to use the middle finger of the non-dominant hand to touch and slide along the sample surface toward the body. The same sliding direction was performed in the friction measurements. During the perception tests, the subjective ratings from 0 to 10 were graded by each subject to describe the level of perceived roughness, perceived stickiness and comfort. The lower number in perceived roughness indicated the least touch perception of surface roughness, conversely the higher number indicated the greater roughness perception. The same ten-point scale was used for the perception of surface stickiness and comfort level. In addition, the subjects would allowed to touch and slide the samples more than one time before the grades were given. Accompanying the friction experiments, the three-axis force/torque transducer (ATI Industrial Automation, Apex, NC, USA) was used to measure skin friction in vivo. The same fingers from perception tests were used to perform sliding motion on the samples towards the body. Each friction measurement consisted of five repetitions of sliding motion. All participants were instructed to slide in a stable and natural touch with no external load. The range of load generated by the test person was from 0.12 to 0.63 N. The stroke length was 50 mm for both textured and non-textured stainless steel samples. During the tests, the sliding velocity was kept as constant as possible. In this manner, the data of the friction force was acquired - with a sampling rate of 100Hz - and the coefficient of friction (COF) was calculated with respect to the normal load without the possible interferences of variations in sliding velocity.
71

(a) (b)
Figure 51 (a) Perception experiment (blindfolded); (b) Friction measurement set-up.
Five stainless steel objects, four textured and one with finish 2G, were used in the tests (refer to Figure 51). All samples were using the same stainless steel material with different surface texture produced by various fabrication methods. Sample 1HV90 was fabricated by stamping method with crater pattern (refer to Figure 52 a) and the enhanced crater pattern was fabricated on sample PS3 by laser surface texturing (pico-second laser) (refer to Figure 52 c). The grid pattern on sample 1HV90-1% was produced by cold rolling (refer to Figure 52 b) and enhanced grid pattern on sample LDG3 was produced by laser surface texturing (nano-second laser) (refer to Figure 52. d). No texture was fabricated on sample 2G which was used as a reference specimen for comparison.
(a) (b)
(c) (d)
Figure 52 Confocal microscope images of sample (a) 1HV90 (stamping), (b) 1HV90-1% (cold rolling), and SEM images of sample (c) PS3 and (d) LDG3.
The human finger is able to perceive features of surface textures as small as submicrons in both wavelength and amplitude [6]. With this exquisitely sensitive perception, the roughness of the counter-surface can be deciphered by touch. Figure 53 (a) displays the perceived roughness versus surface roughness Ra for all the samples. The decreasing order of the perceived roughness is consistent with measured surface roughness Ra. This result shows that the participants can distinguish a set of stainless steel samples in terms of roughness. The relationship between perceived stickiness and surface roughness Ra is in a negative correlation (refer to Fig 53 b). With greater perceived roughness, the perception of stickiness is decreasing. The same phenomenon is observed in Figure 53 (e), a better linear fit in negative correlation is shown between perceived stickiness and perceived roughness. Figure 53 (c) reveals the negative correlation of perceived roughness with the values of COF from the friction measurements. However, a positive correlation of perceived stickiness with COF is shown in Figure 53 (d). The tactile friction decreases with the increase of perceived roughness, but increases with the increase of perceived stickiness.
72

(a) (b)
(c) (d)
(e)
Figure 53 Average values of perceived roughness versus (a) surface roughness Ra, and (c) COF; average values of perceived stickiness versus (b) surface roughness, and (d) COF; average values of perceived stickiness versus average values of perceived roughness.
An attempt was made to introduce the concept comfort to the perception of the samples. It showed that sample PS3 displayed the highest comfort level, followed by the LDG3 and other samples in decreasing order (refer to Table 29). Based on the perception tests, perceived stickiness has a negative influence on comfort perception (refer to Figure 53 b). Higher levels of comfort perception from participants are observed on the samples with low perceived stickiness.
The relationship between comfort level and COF is in negative correlation as well (refer to Figure 54 c). The comfort level increases when the tactile friction between the skin and counter-surface decreases. However, the relationship between comfort level and perceived roughness is lightly shifted to a positive correlation (refer to Figure 54 b). The degree of influence for perceived roughness connecting to comfort level is not as obvious as perceived stickiness and COF, see also Table 29.
73

Table 29. The average values of perceived stickiness, perceived roughness, comfort level of sixteen participants from perception experiments; the average values of COF from friction measurements.
Sample Name
Comfort Level
Perceived Stickiness
Perceived Roughness COF
PS3 6.9 3.4 4.2 1.24
LDG3- 6.0 3.4 5.5 0.94
1HV90-1%
5.9 4.3 4.3 2.03
2G 5.3 6.3 2.5 2.92
1HV90 4.9 5.9 3.5 3.28
(a) (b)
(c)
Figure 54 (a) Comfort level versus perceived roughness; (b) Comfort level versus perceived stickiness; (c) Comfort level versus COF.
References
[1] C.J. Barnes, T.H.C. Childs, B. Henson and C.H. Southee, Surface finish and touch, a case study in a new human factors Tribology, Wear 30 7 (2009) 2778-2784
[2] D. Hilbert, Ueber die stetige Abbildung einer Linie auf ein Flaechenstueck, Mathematische Annalen 38 (1891) 459-460.
[3] G. Peano, Sur une courbe, qui remplit toute une aire plaine, Mathematische Annalen 36 (1890) 157-160.
[4] T. Whitaker, C. Simoes-Franklin, N.F. Newell, Vision and touch: independent or integrated systems for the perception of Texture, Brain Research 1242 (2008) 1242
[5] M. Hilsenrat, M. Reiner, The impact of subliminal haptic perception on the preference discrimination of roughness and compliance, Brain Research Bulletin 85 (2011) 267-270
[6] L. Skedung, M. Arvidsson, J.Y. Chung, M.C. Stafford, B. Berglund, M. Rutland, Feeling small: exploring the tactile perception limits, Scientific Reports 3 (2013) 2617
74

TASK 3.2 WETTING BEHAVIOUR
Cleanability is defined as the ability to be cleaned, especially easily or without damage. The cleanability is often related to the wettability, so the a superhydrophobic surface acts as a self-cleaning system.
The wetting behaviour of all textured surfaces has been measured by TEKNIKER by means of contact angle analysis. These measurements are carried out on flat samples and rolls to investigate to influence on the lubrication performance during the rolling process and on the steel sheets to determine the self-cleaning behaviour achieved.
To investigate the wetting behaviour of the textured and non-textured samples and evaluate the grade of hydrophilia/hydrophobia of steel surfaces, IK4-TEKNIKER uses the SURFTENS universal goniometer (Figure 55 left).
Figure 55 Goniometer for hydrophilia/hydrophobia measurements (left) and contact angle of a drop of water on a steel surface (right).
This evaluation is based in the measurement of the static contact angle of a drop of water on the surface to be investigated (Figure 55 right). Before performing the tests, the samples are cleaned with acetone in an ultrasonic bath. The contact angle is measured by means of an optical system to measure the formed angle. The greater the contact angle, the greater the hydrophobia of the surface in contact with deionised water. The grade of hydrophobia is directly related to the self-cleaning properties of the surface, and it will be useful to evaluate the cleanability behaviour of the textured surfaces.
Wetting is characterized by the contact angle (CA), which is defined as the measurable angle, which a liquid makes with a solid. The CA depends on several factors, such as roughness and the manner of surface preparation, and its cleanliness. If the liquid wets the surface (referred to as wetting liquid or hydrophilic surface), the value of the CA is 0≤θ≤90º, whereas if the liquid does not wet the surface (referred to as non-wetting liquid or hydrophobic surface), the value of the CA is 90º≤θ≤180º. Surface with the CA between 150º and 180º are called super hydrophobic. According to the Wenzel equation for rough surfaces, the hydrophobicity of a hydrophobic microstructured surface can be increased by increasing the roughness. Taking θ0 the CA of the perfectly flat surface, the Wenzel equation is:
Cos θ = Rf cos θ0
Where Rf is given by the ratio between the real solid/liquid contact area and its projected area. Since Rf is always higher than 1, it means that controlling the surface topography we can create such a rough and hydrophobic surface that is not wetted by water. Nearly spherical water-drops roll off, and the surface remains completely dry even during rain (Figure 56).The higher peak height combined with the higher number of peaks Rpc (related to a high peak density) of a micro-structured surface gives a greater contact angle. Such a rough and hydrophobic surface is not wetted by water. Nearly spherical water-drops roll off, and the surface remains completely dry even during rain (Figure 56).
Dirt particles adhere more strongly to a completely smooth surface (left) than to the surface of the drop, and a running drop merely pushes the dirt particles a little to one side. However, if the surface is rough (right), the dirt particles adhere more strongly to the surface of the drop than to the solid substrate and thus roll away with the drop (Figure 57).
75

Figure 56 Principles of non-wetting behaviour for a hydrophobic smooth and nanostructured surface (a) Hydrophobic smooth surface, (b) Superhydrophobic nanostructured/microstructured surface.
Figure 57 Surface roughness and self-cleaning by rinsing with water.
In Figure 58, a real example of the texturing treatment effect on the surface wettability is observed. After texturing the water wets less given a drop with greater contact angle.
Figure 58 Example of the texturing treatment effect on the surface wettability.
The wetting behaviour of textured and non-textured EN-1.4016 material from ACERINOX and DX54 material from TATASTEEL was studied carrying out tests in the goniometer equipment, evaluating the evolution of the contact angle before and after texturing process. In the next graphic, it is possible to see the effect of the texturing increasing the contact angle, conferring hydrophobic characteristics to the surface. Normally a hydrophobic surface is easier to clean.
76

Figure 59 Wetting behaviour of selected steel surfaces.
In this graph, the contact angle of the reference materials is represented showing only a texturing sample which increases the contact angle significantly in relation to all commercial surface finishing.
77

TASK 3.3 FORMABILITY
Influence of the newly designed surface finish on the formability behaviour
Introduction
The work that has been carried out in this task was aimed at understanding the influence of the newly designed surface finish on the formability behaviour of the steel sheet and on the lubricant strategy. For that purpose, a selected set of austenitic and ferritic stainless steels with standardised finishes and with surface finishes developed within the STEELTAC project was studied, see Table 30
The as delivered and standardised surface finishes (2R+SKP, 2B, 2D and 2G) were used as the reference for this study. Material model parameters, such as the plastic strain ratio (anisotropy factor, r value) and the strain-hardening coefficient (work-hardening coefficient or exponent, n value), were calculated based on tensile tests measurements. The results are available for further finite element modelling, see Table 31 and Deliverable D3.3. The designed textures were applied to EN-1.4509 and EN-1.4301 steel with an initial 2R+SKP surface condition by (pilot mill) rolling. The pattern defined as E13 was selected as a texture that could possibly approach the 2G surface geometry (see deliverable D2.4 Report on laser surface texturing guidelines for more details). The patterns defined as 1HV90 and 1HV130 were designed by Tata with suggestions from IK4-TEKNIKER as textures for improved paintability (see deliverable D2.4 Report on laser surface texturing guidelines for more details). The influence of the lubrication on forming operations was studied based on the selected lubricants given in the section covering Task 1.3.
Table 30 Stainless steels under formability study
Stainless steel Surface Finish
EN-1.4509
As delivered
2R+SKP
2B
2D
2G
Laser textured 1HV90/ 1HV130
E13
EN-1.4301
As delivered
2R+SKP
2B
2G
Laser textured
1HV90/ 1HV130
E13
EN-1.4016 As delivered
2R+SKP
2B
2D
2G
78

Table 31. Anisotropy factors and work-hardening exponents
Finish RD R ∆r rm n nm
EN-1.4509
2R+SKP
0 1.155
0.276 1.327
0.156
0.148 45 1.189 0.147
90 1.776 0.144
2B
0 0.947
-0.086 1.001
0.184
0.176 45 1.053 0.174
90 0.986 0.171
2D
0 1.194
0.364 1.112
0.194
0.188 45 0.930 0.186
90 1.394 0.185
2G
0 1.042
0.075 1.087
0.152
0.139 45 1.049 0.134
90 1.206 0.137
EN-1.4301
2R+SKP
0 0.708
-0.173 0.801
0.415
0.406 45 0.887 0.402
90 0.720 0.406
2B
0 0.767
-0.438 0.935
0.425
0.418 45 1.154 0.416
90 0.664 0.415
2G
0 0.804
-0.459 0.994
0.380
0.371 45 1.223 0.367
90 0.725 0.369
EN-1.4016
2R+SKP
0 0.789
0.271 0.777
0.176
0.169 45 0.641 0.164
90 1.037 0.173
2B
0 0.492
0.126 0.529
0.203
0.197 45 0.466 0.196
90 0.692 0.194
2D
0 0.656
0.249 0.688
0.205
0.202 45 0.563 0.201
90 0.969 0.200
2G
0 0.570
0.459 0.647
0.136
0.129 45 0.418 0.127
90 1.184 0.128
79

Formability test procedures
Historically, ball punch tests, such as the Olsen cup test and Erichsen cup test, have been used to determine the properties of sheet metals in stretching. These tests stretch a specimen over a hardened steel ball and measure the height of the cup produced. The height of the cup at fracture is used as the measure of stretchability. The preferred criterion for determining this point is the maximum load. Many forming operations involve stretching an edge of a part or of a cut out (hole) in a part. For example, when a concavely countered edge is flanged, the metal is stretched. The ability of the material to undergo this type of forming operation can be measured by the Hole Expansion test. A flat sheet specimen with a circular hole in the centre was clamped between annular die plates and deformed by a punch, which expands and ultimately cracks the edge of the hole. Flat-bottomed, hemispherical or conical punches were used, and in some cases die plates were equipped with lock beads to prevent drawing-in of the flange. The hole diameter increases until the edge cracking occurred. The hole expansion is expressed as the percentage increase in the hole diameter.
Finally, the most commonly used tests for deep drawability is the Swift cup test, since this property expresses as the limiting draw ratio (LDR). In this test, circular blanks of various diameters are fixed in a die ring and deep drawn into cups by a flat-bottomed cylindrical punch. In this case, the drawability is expressed by the LDR (limiting draw ratio), which is the ratio of the diameter of the largest blank that can be drawn successfully and the punch diameter.
The tests were carried out on the selected stainless steels by Acerinox with a deep drawing machine Zwich/Roell BUP 600 to study the influence of the surface finish and the lubrication on the forming behaviour. The main test conditions were:
• Drawing force: 600KN • Maximum punching force: 600KN • High velocity: 750 mm/min • Disc diameter: 260 mm • Punch diameter: 100 mm
For more details, please see the Deliverable 3.3 Formability.
The lubricant efficiency of the lubricants was also evaluated using the Tapping Torque Machine provided by Falex, at IK4-Tekniker. The ratio of the average torque values of the reference oil to the experimental fluid tested, when using the same drill or tap, is expressed as the percent efficiency of the fluid. The materials used for carrying out the tapping tests were discs 1 mm thick and with a diameter of 25 mm and tools made of steel F-1500-SA with a cylindrical section (diameter 8 mm and length 50 mm).
Main results
All studied stainless steels with as delivered surface condition meet the typical values of formability: anisotropy, work-hardening exponent, Erichsen, Hole Expansion and LDR. The best results of anisotropy, Hole Expansion and LDR were obtained with the ferritic EN-1.4509 and of Erichsen with the austenitic EN-1.4301. With regard to the influence of the laser texturing, 2G simulated laser textures (E13) have greater hole expansion and Erichsen values than paint design (1H90/1H130). Greater elongation on laser textured samples give greater hole expansion and lower Erichsen values. The main results are summarised in Table 32 and 33, where the formability results of the reference surfaces are compared with the designed textures on STEELTAC (1H90/1H130 and E13), which have been produced by rolling with different elongation grades (0.8, 1.0, 1.5, 1.6, 2.0 and 4.0 %).
80

Table 32. Erichsen, Hole Expansion and LDR results for the reference materials
Finish Erichsen (mm) Hole Expansion (%) LDR
EN-1.4509
2R+SKP 10.10 112.64 2.36
2B 9.91 109.17 2.27
2D 10.51 99.86 2.21
2G 10.20 81.78 2.24
EN-1.4301
2R+SKP 13.06 41.67 2.06
2B 13.18 58.33 2.06
2G 12.03 65.84 2.12
EN-1.4016
2R+SKP 9.30 70.18 2.00
2B 9.72 57.90 2.00
2D 10.26 50.83 2.09
2G 9.66 40.42 2.09
Table 33 Effect of the surface condition. Erichsen, hole expansion and LDR results
EN-1.4509
Finish Erichsen (mm) Hole Expansion (%) LDR
2R+SKP 10.10 112.64 2.36
2G 9.44 81.67 2.24
1H90/1H130 – 2.0% Elongation 9.82 70.00 -
E13 – 1.0% Elongation 9.82 96.88 -
E13 – 2.0% Elongation 9.28 83.55 2.33
EN-1.4301
Finish Erichsen (mm) Hole Expansion (%) LDR
2R+SKP 13.06 41.67 2.06
2G 12.41 52.09 2.09
1H90/1H130 – 2.0% Elongation 12.59 38.13 2.09
1H90/1H130 – 4.0% Elongation 12.22 33.75 -
E13 – 0.8% Elongation 12.59 - -
E13 – 1.0% Elongation 12.50 41.04 -
E13 – 1.5% Elongation 12.43 - -
E13 – 1.6% Elongation 12.24 45.00 -
E13 – 2.0% Elongation 12.14 45.63 -
81

In relation to the lubricant strategy, depend on the formability test, different lubricants were tested:
Lubricant Forming test Supplier
Houghto-Draw TD51 KWI and LDR Acerinox’s reference
Brugarolas Bespast KWI and LDR Tekniker’s alternative
Brugarolas Bestril KWI and LDR Tekniker’s alternative
Vaseline Erichsen Acerinox’s reference
Rhenus LA 722083 Erichsen Swerea’s alternative
More details can be found in deliverable D 3.3.
Erichsen tests have a slight improvement with the Rhenus lubricant. In the case of the hole expansion, a general small deterioration of this property was measured with the used of the alternative lubricants Bestril and Bestpast. Finally, the LDR is slightly improved by Bestril and Bestpast lubricants in the case of the ferritic EN-1.4016 and is reduced in the case of the ferritic EN-1.4509. The results are summarised in Tables 34, 35 and 36
Table 34. Erichsen results as function of the lubrication, surface condition and steel grade
Grade Surface Condition ERICHSEN (mm)
Vaseline Rhenus
EN-1
.45
09
2R+SKP 10.10 10.16
2B 9.91 10.69
2G 9.44 10.17
1H90/1H130 – 2º Elongation 9.82 10.04
EN-1
.43
01
2R+SKP 13.06 13.38
2B 13.18 13.59
2G 12.41 12.88
1H90/1H130 – 2.0% Elongation
12.59 12.67
E13 – 2.0% Elongation 12.14 12.61
82

Table 35 Hole expansion results as function of the lubrication, surface condition and steel grade
Grade Surface Condition HOLE EXPANSION (%)
TD-51 Bestpast Bestril
EN-1
.45
09
2R+SKP 112.64 111.70 99.40
2B 109.17 106.40 107.60
2G 81.67 72.10 -
1H90/1H130 – 2.0% Elongation
70.00 72.75 -
EN-1
.43
01
2R+SKP 41.67 34.10 37.90
2B 58.33 44.70 47.90
2G 52.09 61.25 -
1H90/1H130 – 2.0% Elongation
38.13 41.46 -
E13 – 2.0% Elongation 45.63 47.71 -
Table 36 LDR results as function of the lubrication, surface condition and steel grade
Grade Surface Condition LDR
TD-51 Bestpast Bestril
1.4
50
9
2R+SKP 2.36 2.30 2.33
2B 2.27 2.21 2.24
1.4
30
1
2R+SKP 2.06 2.00 2.09
2B 2.06 2.06 2.00
All these results were taken from deliverable D 3.3 “Formability”.
The results of the tapping torque tests are shown in Figure 60. As explained before, higher percentages corresponded to more efficient lubricants. It was noticed that most of the lubricant analysed had similar behaviour, with lubricant efficiency similar to the reference. Instead outstanding results were obtained with the lubricants Bestpast FRK, Houghto-Draw and Rhenus LA 722083.
The tests were also performed on galvanised steel IF-DX56 and stainless steel EN 1.4509. The steel sheets were rolled with textured rolls in order to get the 2% of elongation, ε. The sheets made of steel IF-DX56 were rolled with rolls that had superficial finishing 01H90V90, 00H90V90, E13 (used in this case as reference). The specimens used were discs with 24 mm diameter and thickness of 0.7 mm. The results are shown in Figure 61. It showed that the effect of the roll’s texturing with IF-DX56 was almost nil with the QUAKER oil, yet there is some influence for the lubricant provided by FUCHS. The best results with EN 1.4509 were obtained with surfaces laminated with textured rolls. Using the Fuchs lubricant, the pattern 01H90V90 obtained a lubrication efficiency of 177% in comparison with the 100% of the reference.
83

Figure 60 Lubricant efficiency values of the selected lubricants and their emulsions in water. The star indicates the optimum.
Figure 61. Results of the Tapping Torque tests with steel IF-DX56 sheets (left) and with stainless steel EN 1.4509 (right).
Case study: the effect of surface texture on friction and wear during deep drawing
Introduction
The main issues in sheet metal forming operations are fracturing, buckling and wrinkling, loose metal (oil canning), shape distortions and surface defects. In this work the influence of surface texture on fracturing, wrinkling and surface defects is investigated. There are extensive studies investigating how the surface texture influences friction [e.g.1-5], wear [e.g.6-8] and forming operations [e.g.14-16], thereby establishing a clear correlation. However, the objective of this study was to determine if these specific new developed surface textures and functions have a significant influence on the formability in deep drawing operations. In other words, are these modifications of importance? In order to investigate the significance, a sensitivity FE-simulation study was performed: material, process and frictional response of different surface textures were varied. Finally, how the different textures influence formability, i.e. impact on process window, susceptibility of galling and orange peel effects were studied.
The objective was to study formability according to industrial best practice in tool materials, surfaces, coatings and lubrications
Experimental
The materials and coatings utilised are presented in Table 37. The limited access of materials with tactile textures restricted the set of possible physical attempts. Consequently, only one tribological system could be investigated. The non-chlorinated lubrication RHENUS LA 722083, is utilised in forming applications and strongly recommended by advanced industrial users, e.g. Grundfos. This lubricant also performed well in both the Erichsen performed by Acerinox and in tapping torque tests performed by IK4-Tekniker, and was therefore chosen in the simulative tests.
84

Table 37. Tool materials and coatings
Tool parts Materials and coatings
Blank holder
Die (rd = 5 mm Di = 56 mm)
Tool in the tribotest
Vanadis 4E, Uddeholm
63-64 HRC, 550 degree annealing temperature
Punch rp = 5 mm D = 54 mm Construction Steel
Blank holder surface
Die surface
Tool surface in the tribotest
BALINIT ALCRONA Pro Advanced (AlCrN coating incl. plasma nitriding), Oerlikon
The sheet material was ferritic stainless steel (1.4509) and the thickness of the sheet was 1 mm.
The tribological experiments are performed in a tribotester based on strip drawing [9]. The schematics of the tribotester can be seen in Figure 62. The forces are measured with a 3-axis Kistler piezo-electric transducer (9275B). A linear encoder measures the position of the strip synchronously with the force signals. The acquired encoder signal is then processed to obtain the actual velocity. The process parameter in this study simulates the deep drawing conditions of the cup drawing operation:
• Speed: 50 mm/s
• Pressure: 30 MPa
• Flat to flat contact: 10x10 mm
• Lubricant quantity: 1.1±0.2 g/m2
The galling tests were performed with the same tribotester and tools but the speed was reduced to 25 mm/s and the pressure increased to 80 MPa.
Figure 62. Tribotest.
The forming tests were performed by deep drawing of a cylindrical small cup in a hydraulic 2000 kN triple-action press.
The numerical simulations were carried out with the finite element program LS-Dyna and LS-Opt [10-11]. The 3-Parameter_Barlat was utilised as material model. Exponential hardening rule was utilised in the sensitivity study and load curves in three directions in the formability study (exponential Voce). A static friction model (Coulomb) was utilised. It was not possible to use directional dependent friction models in LS-Dyna since one edge of all elements on the sheet metal blank must be aligned initially.
Two response parameters of the simulations were “maximum principal strain in the wall” in rolling and transverse to rolling direction and “the drawn in material distance” in rolling and transverse rolling direction.
Main results
1. Friction
The frictional response of the different surface textures were measured in the tribotester, see Figures 63-64. The results clearly show a strong directional behaviour, especially for surface 2G, 2D and tactile. Friction is low when sliding transverse the lay and high when sliding along the lay, which is
85

consistent with previous observations and models [2][5]. However, the mean value shows only small differences, e.g. 0.09 by 2G in comparison to 0.11 by the 2D surface.
Figure 63 The frictional response transverse and along the rolling direction of commercially available surface textures. The variance of the average frictional response is a weighted sample variance.
Figure 64 The frictional response transverse and along the rolling direction of surface textures optimised for tactile feel. Two different elongations were applied in the rolling process: 2% and 1% respectively. Additionally, the frictional responses of surface textures optimised for paint ability are presented.
2 Sensitivity study
The first question to answer was whether the different surface topographies influence formability. Therefore, a global sensitivity analysis study (Sobol) was performed by FE-simulations to study the influence of different surface textures, i.e. the frictional response, in comparison with the variances of material and process parameters. The reference material (2G) was utilised and then material, process and frictional parameters were varied according to Table 38. The variables are denoted blank holder force (bhf), hardening exponent (n), strength coefficient (K), friction (my), and thickness of sheet (thk). The results show that the variance could be explained predominantly by the frictional response i.e. 57% when shifting between the reference 2G and the tactile texture, and 89% when shifting between the reference 2G and the 2D texture, see Figure 65.
0,00
0,02
0,04
0,06
0,08
0,10
0,12
0,14
0,16
2G 2D 2R+SKP 2B
Fric
tion
Transv. AAlong ATransv. BAlong BAverage
0,00
0,02
0,04
0,06
0,08
0,10
0,12
0,14
0,16
Tactile (2%) transv.
Tactile (2%) along
Tactile (1%) transv
Tactile (1%) along
Paint (2%) along
Paint (1%) along
Fric
tion
86

Table 38. Coefficient of variation of different parameters in the sensitivity study.
Parameter Coefficient of variation [%]
Source
Friction, discrete variables surface 2G and 2D (my)
1.5 Measured in the tribotester
Strength coefficient (K) 3 Provide by Acerinox,
ample value
Hardening exponent (n) 3 Provide by Acerinox,
ample value
Thickness of sheet (thk) 3 Provide by Acerinox,
ample value
Blank holder force (bhf) 2.3 Measured in the utilised press
Figure 65 The results of the global sensitivity analysis (Sobol). The variance could be explained predominantly by the frictional response i.e. 57% when shifting between the reference 2G and the tactile texture, and 89% when shifting between the reference 2G and the 2D texture.
The results show that changes in textures influence the forming operation significantly and therefore need to be considered when new textures are designed.
3 Deep drawing operation
The next question to answer was how the different topographies influence formability. For this purpose the process window, see Figure 66, was studied [12]. The maximum punch stroke was obtained by optimisation. The constraints for rupture were the Forming Limit Diagrams of the material. The constraints for wrinkling were a maximum acceptable lift of the blank holder, set to 120 µm, during the forming operation. The optimisation strategy was a meta model polynomial (quadratic) applying D-Optimal sampling. The optimisation algorithm was a leapfrog algorithm for constrained optimisation. The boundary of the wrinkling zone was obtained by reducing the punch stroke, a percentage of the maximum stroke, and then applying the optimisation algorithm. The boundary of the rupture was obtained by increasing the blank holding force, a percentage of maximum force, and then performing optimisation. Finally, the design and objective criterion for stopping optimisation was less than 0.001 and a sub-region size (absolute) less than 0.1.
The verification of simulations results are shown in Table 39-40. The total distance of drawn in flange material transverse rolling direction shows a good correlation, namely 33.9 mm in physical tests versus 34.0 mm in the FE-simulations (reference 2G). However, the results in the rolling directions show a clear difference, 32.4 mm in physical tests versus 35.0 mm, due to the lack of directionality in the frictional model.
87

Figure 66 The process window, i.e. the acceptable forming zone, is shown.
Table 39 Verification of simulation results. The scanning of cups was performed by GOM Triple Scan III. Sampling distance was 0.213 mm.
Boundary position of acceptable forming zone
Comments Physical results Scanning physical results
Thickness of material [mm]
Maximum punch stroke No wrinkles, ruptures or localisations.
Maximum punch stroke with a larger blank diameter, initially 107 mm instead of 105 mm.
Rupture
Depth of 80% of maximum punch stroke and a blank holding force of 16 kN.
No wrinkles on the flange (see also table 15).
Depth of 80% of maximum punch stroke and a blank holing force of 1 kN.
Wrinkles clearly visible on the flange (see also table 15)
Table 40 Amplitude parameters of Waviness [13]. The profile was extracted from the scanning results of cups (GOM Triple Scan III); the outermost part of the flange. The profile length was 100 mm and filtered by a polynomial of order 2 and a Robust Gaussian Filter (cut-of 25mm).
Blank holding force [kN] Wz [µm] Wa [µm] Wrinkling
16 47 7 No
8 176 30 Diffuse
1 236 39 Clearly
88

Finally the influence of surface texture could be studied by using the same material properties, the reference material (2G), but varying the frictional response (2G, 2D, Tactile). The frictional responses of the 2G surface are the measured response of A-side and B-side. However, the B-side of the sheet with the tactile texture was optimised for paint ability and was not a relevant combination for stainless materials in commercial applications. Instead the B-side of the 2G material is combined with the tactile texture (frictional response). The results are shown in Figure 67. A formability index was calculated by integrating the area between the force of maximum depth and the force of 80 % of maximum depth. The results show that the formability index could be reduced by 33% by changing the surface topography (2D, 2G). However, almost the same maximum depth could be drawn, 36 mm versus 35 mm. The formability index for the tactile texture was reduced by 12%. This implies that in real production the drawability could be affected, i.e. a robust production would be more difficult to obtain with the 2D texture since the margins are smaller, but the effect is of minor importance with this specific design of tactile texture.
Figure 67. Generated acceptable forming zone with different surface textures.
4 Surface defects; orange peel
The surface appearance was studied also after the deep drawing operation. On the tactile surface a substantial orange peel effect was visible, see Figure 68. The tactile feel was also very different of the side wall in comparison to the original unformed texture; a more rough and harsh feeling.
a)
b)
c)
Figure 68. The radius of the drawn cups are shown for the a) Tactile, b) 2R+SKP and c) 2D surfaces. On the tactile surface a substantial orange peel effect is visible on the radius.
The tactile feel is also very different of the side wall in comparison to the original unformed texture; a more rough and harsh feeling. The tactile texture was superimposed on the smooth 2R+SKP texture by the laser textured rolls. This smooth 2R+SKP texture did not show a strong orange peel after forming. However, the superimposed tactile texture amplifies this phenomenon. Inspection of the ASTM grain size number of the 2R+SKP indicates a coarse grain structure, size 4.7, which is more liable than smaller grain sizes to generate orange peel effects [17]. When stretching the material, a large grain size generates roughened surfaces which the human eye perceives as an orange peel effect. The original surface roughness is exceptionally low in the case of the 2R+SKP texture, e.g. in Table 14 the Ra-value is 0.06±0.02 µm, a factor that is favourable. The roughening effect from the deformed grains simply does not seem to be large enough to disrupt visually. In the case of the tactile surface, the orange peel is very pronounced. The superimposed roughness and the roughening due to stretching seem to mutually reinforce the orange peel effect. The grain size of the tactile texture was equally coarse because grain size is not affected in the texturing process.
0
20
40
60
80
100
120
0 5 10 15 20 25 30 35 40
Bla
nk H
olde
r For
ce [k
N]
Punch Stroke [mm]
2G2DTactile
89

Consequently, a finer grain structure, which normally is recommended, should be more emphasised for users of the tactile surfaces, in order to generate more favourable conditions.
The maximum sliding lengths until galling are shown in Figure 69. The most notable result was 2G sliding along the lay. The test was repeated 6 times and galling occurred during the first 250 mm sliding length each time. During less severe tribological conditions, sliding transverse the lay [2][8], the 2G texture was also able to reach full measured length, i.e. 900 mm. The galling test of textures optimised for tactility (2% and 1%) and painting was performed only once due to the limited access to material. The sliding length was set up in the range between 750 to 900 mm.
Figure 69 The maximum sliding lengths until galling.
It is clear that the susceptibility of galling does not increase with a tactile surface. It has been shown that increased roughness of the stainless steel sheet could improve the performance of the lubricant and postpones pick-up and galling [8][16]. The rougher tactile textures generate a more robust tribological system.
References
[1] W.C. Emmens, W.C., Tribology of flat contacts and its application in deep drawing. 1997, University of Twente: Twente.
[2] D. Wiklund, Tribology of Stamping: The Influence of Designed Steel Sheet Surface Topography on Friction (Ph.D. thesis), Dept. of Materials and Manufacturing Technology, Chalmers University of Technology, Göteborg, ISSN 0346-718x.
[3] J.D. Westeneng, Modelling of contact and friction in deep drawing processes, 2001, University of Twente: Twente.
[4] D. Wiklund, B.-G. Rosén and A. Wihlborg, A friction model evaluated with results from a bending-under-tension test, Tribology International 42 10 (2009) 1448-1452
[5] D. Wiklund, M. Larsson, A friction model for the boundary and mixed lubricated regimes in sheet metal forming. Proceedings of the 15th Nordic Symposium on Tribology, NORDTRIB 2012, 12-15 June, Trondheim
[6] M. Vermeulen, J. Scheers, Micro-hydrodynamic effects in EBT textured steel sheet, International Journal of Machine Tools and Manufacture 41 13-14 (2001) 1941-1951
[7] E. van der Heide, D.J. Schipper, Galling initiation due to frictional heating, Wear 254 11-12 (2003) 1127-1133
[8] B. Wadman, J. Eriksson, M. Olsson, E. Schedin, E. Madsen, N. Bay, Influence of Surface Texture on the Galling Characteristics of Lean Duplex and Austenitic Stainless Steels, Proceedings Duplex World 2010 Conference, Beaune, France, 2010
[9] L. Kirkhorn, K. Frogner, M. Andersson, J-E. Ståhl (2012) Improved tribotesting for sheet metal forming. 45th CIRP International Conference on Manufacturing Systems, Athens, Greece, 16–18 May 2012
[10] J. O. Hallquist LS-DYNA keyword user’s manual, Livermore Software Technology Corporation, 2014
[11] LS-opt User’s manual, Livermore Software Technology Corporation, 2014
[12] K.S. Oh, K.H. Oh, J.H Jang, D.J. Kim, K.S. Han, Design and analysis of new test method for evaluation of sheet metal formability, Journal of Materials Processing Technology, 211 (2011) 695–707
0
100
200
300
400
500
600
700
800
900
1000
2G along
2G transv
Tactile (2%) along
Tactile (1%) along
Paint (1%) along
Slid
ing
leng
th [m
m]
90

[13] ISO 4287:1997, Geometrical Product Specifications (GPS) – Surface texture: Profile method – Terms, definitions and surface texture parameters, International Organization for Standardization (1997)
[14] T.C. Hsu, T.S. Yang, The computer simulation of tribological influence on strain path and forming limit in punch stretching of sheet metal, International Journal of Advanced Manufacturing Technology 17 6 (2001) 393-399
[15] J. Hol, M.V. Cid Alfaro, M.B. de Rooij, V.T Meinders, Multiscale friction modelling for sheet metal forming. In: International Conference on Tribology in Manufacturing Processes, ICTMP 2010, June 13-15, 2010, Nice, France pp. 573 - 582
[16] G.R. Bayer, Mechanical wear fundamentals and testing. New York: Marcel Dekker, 2004
[17] H.E. Theis, Handbook of metalforming processes. New York: Marcel Dekker, 1999
91

TASK 3.4 PAINT APPEARANCE AND UNI-DIRECTIONAL FINISH
Introduction
STEELTAC aims at the next generation of roll surface texturing - laser textured surfaces. The stepwise approach to developing optimised surfaces (within the process bounds of the pulsed laser texturing process) is given in Figure 70.
Figure 70 Overview of the approach to designing and testing surfaces for improved surface appearance.
The focus of the research presented aims at assessing the possibilities for improving or influencing the (painted) appearance of galvanised steels for outer body parts of automobiles by laser texturing of the work rolls. For this reason, the materials chosen in the research are representative materials for these applications. Galvanised interstitial free (IF) steel (DX54 or DX56) or rephos-IF (YD220) are such materials and, together with DP600 (for gauging the influence of the substrate in roughness transfer experiments), are utilised in normal and rolling imprinting trials. Hereafter, for clarity and to lay the focus on the texture development, the processed substrates of DX54/DX56 qualities are assessed further with respect to friction and painting behaviour as well as being pressed to form cups as demonstrators. Additionally, Rephos-IF material with a Magizinc coating is included for the rolling trials and analysed by tactile roughness measurements, confocal measurements and painting measurements.
Materials and methods
The painting trials were conducted up to e-coat on a modular Gorkotte paint lab-scale paint line (Figure71) comprising the following operations: Degreasing > Activation > Phosphating > Passivation > and E-coating. The paint layers are dried in a Votsch drying chamber.
Paint and Friction Trials Flat & Cup Samples
Rolling TrialsMulti-mill (4-high)Buhler (2-high)
Paint Trials Flat Samples
Imprinting Assessment of
roughness transfer and surface
characteristics
Validation Laser Texturing
Modelling Surface geometry
Optimised
Surfaces
Paint and Friction Trials Flat & Cup Samples
Rolling TrialsMulti-mill (4-high)Buhler (2-high)
Paint Trials Flat Samples
Imprinting Assessment of
roughness transfer and surface
characteristics
Validation Laser Texturing
Modelling Surface geometry
Optimised
Surfaces
92

Figure 71 Overview of the modular Gorkotte paint lab-scale paint line at Tata Steel used in the e-coat trials.
After imprinting tests and the e-coat painting process, characterisation in terms of visual appearance were conducted. Waviness was measured/characterised using a Wave-Scan Dual from BYK-Gardner, see Figure 72. This device simulates visual perception by scanning the wavy light/dark pattern like human eyes. The measurement signal is divided into several ranges using mathematical filter functions which provides the form of structure spectrum ranging from W(a) to W(e). These scales are summarised in two waviness ranges: Short Wavelength (SW) and Long Wavelength (LW), Figure 73. It is important to note that the painting results presented within the report correlate to single bath paint trials within individual graphs, but the bath conditions and ecoat coatings can vary between graphs– as such the absolute values between graphs should not be compared. The absolute values within graphs can be compared.
Figure 72 Image of the BYK-Gardener Wavescan equipment as available at Tata Steel and a schematic overview of the influence of wavelength on surface appearance [1].
93

Figure 73 Schematic visualisation of waviness ranges after mathematical filter functions as characterised by the BYK Wave-scan equipment.
There is no ISO or European norm for paint appearance itself. However, the surface of a steel product for outer body parts of an automobile can be modern steel producer is measured under the norm EN10049, which describes the measurement of surface roughness and peak count [2]. Most recently, and signifying the importance of waviness to the OEM’s, the SEP1941 has been published [3]. The final strip products fabricated for paint appearance analysis developed within STEELTAC will be characterised to these standards where appropriate, but other surface parameters will also be considered. The primary focus in the research as regards paint appearance is given to the longwave characteristics as recorded by the Wavescan equipment; this has been previously utilised in RFCS funded research as a suitable means of addressing surface appearance “the wave scan (long) value was used to quantify the quality of paint appearance”. [4]. This is done since it is (a) common equipment at OEMs and (b) provides accounts for a more “3D” portion of the strip surface than simple profilometry. It should be noted that the standardisation of surface texture measurement is important to the industry as a whole, but should not preclude the importance of other surface characteristics, or wavelength features.
Main results
Main result no. 1. Imprinting tests
Following a control analysis of the roughness transfer across the contact diameter, which revealed homogeneous roughness transfer, imprinting test were conducted in a TUWI compression machine. Figure 74 (T1H90V90), Figure 75 (T2H90V90) and Figure 76 (T2H130V130) reveal SEM images of the imprinting disk (left columns) and the corresponding strip surfaces (right columns).
Figure 74 SEM images of (left) the laser textured disk (negative) and (right) the imprinted strip (positive) after normal imprinting at P=4.19sy(s) for the T1H90V90 surface texture.
94

Figure 75 SEM images of (left) the laser textured disk (negative) and (right) the imprinted strip (positive) after normal imprinting at P=4.19sy(s) for the T2H90V90 surface texture.
Figure 76 SEM images of (left) the laser textured disk (negative) and (right) the imprinted strip (positive) after normal imprinting at P=4.19sy(s) for the T2H130V130 surface texture.
The paint line is able to deposit initial e-coat (cataphoresis) paint layers. It is well known that the important surface structures for high quality paint appearance fall in to the “long wavelength” category [5]. In terms of the attenuation of various lengths scales, S. Mezghani et al [6] show that after the cataphoresis stage of paint application, the short wavelength aspects (roughness) are attenuated, while the longer wavelength aspects are not, see Figure 77.
95

Figure 77 Influence of e-coat on wavelet amplitude (dotted line) compared to the wavelet amplitude of the electro-discharge textured galvanised strip (dashed line) at various length scales. The attenuation ratio (1-(amplitude ecoat/amplitude substrate)) is given as the solid line.
Since it is not possible to gloss-finish the samples, a 55 μm layer of Nitto-Denko 318 Tape (Nitto tape) has been used to eradicate excessive surface dullness. The influence of this tape is shown in revealing 2 profiles (Figure 78a): the blue line is the “raw” profile after ecoat, while magenta line shows the same area with tape. Note that while every care was taken to achieve the measurements in the same location, and despite the seemingly excellent match between the profiles, they are not specifically taken in same exact location. Figure 78b is added to this report to provide additional information with respect to effect of the tape on waviness parameters. The e-coat clearly reduced the roughness and waviness, while the Nitto tape only fills the roughness, rather than the long-range waviness
Figure 78a) Influence of applying Nitto tape (magenta curve) to an e-coated surface (blue curve) and b) Comparison of surface aspect parameters with respect to waviness.
Samples produced under dry normal loading conditions have all been “painted” with an e-coat layer. This means that as regards paint appearance assessment, the samples are in a worst-case scenario. Note that in direct light, differences are very difficult to discern. By tilting the imprinted samples, as in, the imprinted area becomes easily identifiable, even after e-coating (Figure 79).
Virgin Imprinted
Figure 79 Visual appearance of a DX54 galvanised steel surface after imprinting (4.2*YS => Ra = 2.44µm; RPc = 111; Wsa/Ra = 0.12) and e-coat painting.
0
0.5
1
1.5
2
0 1 2 3 4
Wavelength [λ] (mm)
Wav
elet
Am
plitu
de (µ
m) o
r Atte
nuat
ion
Rat
io (-
)
EcoatSubstrateE/S Ratio
3.071
3.072
3.073
3.074
3.075
0 1 2 3 4 5Measurement Length (mm)
Mea
sure
men
t hei
ght (
mm
)
RawTape
96

Figure 80 and Figure 81 reveal the roughness transfer and peak count transfer. The M1H90V90 surface exhibits the highest transfer rate, which is perhaps not surprising as it is characterised by a negative skewness (highly local pressure).
Figure 80 Roughness transfer (%) vs. yield-strength normalised contact pressure (%).
Figure 81 Peak count transfer (%) vs. yield-strength normalised contact pressure (%).
Automotive manufacturers typically request surface roughness values around Ra = 1.3 µm (0.8 mm filter). Figure 82 and 83 reveal the waviness and painted Wavescan results for the surfaces described above respectively whose roughness meets this requirement and for reference, an EDT surface bearing the same roughness is included, see Table 41. The results show that the surfaces described above whose surface aspect is attained by laser texture imprinting offers a significant improvement on current EDT surfaces. This holds true for waviness over all common length scales (Figure 82 reveals Wa(0.8-2.5), Wa(2.5-8) and Wsa(1-5). Results using the Wavescan equipment from the dry-imprinted DX54 variants and reference EDT provided in Figure 83 show that (after application of a uniform layer of Nitto Tape has been used to eradicate excessive surface dullness as described previously), the laser textured imprinted samples all afford a significantly lower Longwave value relative to the standard EDT sample. The Shortwave characteristic of the three laser-texture imprinted samples is also marginally lower than the reference EDT strip.
20
25
30
35
40
45
50
100 150 200 250 300 350 400 450 500
Roug
hnes
s Tra
nsfe
r (%
)
Nominal Contact Pressure/Material Yield Stress (%)
M1H90V90 M2H90V90 M2H130V130
60
70
80
90
100
110
120
130
140
100 150 200 250 300 350 400 450 500
Peak
Cou
nt T
rans
fer (
%)
Nominal Contact Pressure/Material Yield Stress (%)
M1H90V90 M2H90V90 M2H130V130
97

Table 41 Strip roughness values after normal imprinting experimentation for Ra +/- 1.3 µm
Figure 82 Surface waviness values of three surfaces generated by imprinting of laser textured tools in DX56 galvanised steel and an EDT reference. All surfaces had an Ra of 1.3 µm to 1.4 µm.
Figure 83 Wavescan results for ecoat-painted surfaces of Ra ~1.3 µm for (purple) production EDT and normally imprinted laser texture surfaces () T2H90V90, (blue + diamond) T2H130V130 and (green + square) T1H90V90 structures.
Main result no. 2. Prototype parts
Based on the results of the imprinting tests carried out on flat samples, three texture patterns (T1H90V90, T2H90V90 and T2H130V130) were selected to use on the prototype parts: rolls. Despite the dramatic wear and fouling of the rolls, it was still possible to produce rolled strip in the Multimill Rolling trials. Figure 84 and Figure 85 show the macroscopic assessment of the strip produced in the
ImprintingPattern (Stamp)
Ra(Sheet)
RPc(Sheet)
Rsk(Sheet)
(T2) 1HV130 1.30 163 -0.74(T2) 1HV90 1.37 174 -1.01(T1) 0HV90 1.35 144 -1.65
ImprintingPattern (Stamp)
Ra(Sheet)
RPc(Sheet)
Rsk(Sheet)
(T2) 1HV130 1.30 163 -0.74(T2) 1HV90 1.37 174 -1.01(T1) 0HV90 1.35 144 -1.65
98

Multimill trials for the T2H90V90 and T2H130V130 rolls respectively. Due to the high roll wear and Zn fouling, the strip had to be produced with high reductions (e.g. 3%, 4%) to ensure sufficient rolling loads and roughness transfer, however the strip was homogeneously textured and there was no visible Moiré patterning – a phenomena often levied against deterministic structures. The strip was further assessed by confocal microscopy (Figure 86). The strip surfaces somewhat mirror the observations shown before – namely that the T2H90V90 textured roll effectively produced at denser structure relative to the T2H130V130 textured roll, but that the final patterning of the rolled strip was similar; in both cases, open textures were generated. There also appears to be no (excessive) slip in the contact, with the pillars remaining in the rolled surface replicating the negative of the work rolls surfaces. The resultant roughness (Ra) and peak count (RPc) as functions of the calculated rolling load are given in Figure 87. Due to the high wear of the rolls and significant surface fouling by Zn pick-up, rolling loads of 400 MPa were needed to attain a strip roughness of 1 µm for the T2H90V90 textured roll. For the T2H130V130, a strip Ra of 0.6 µm was maximally achieved. However, as the assessments focus predominantly on the surface texture rather than the bulk (mechanical) properties, the surfaces generated were deemed acceptable for the purposes of this investigation. Figure 88 reveals the relationship between Peak Count and roughness for the rolled surfaces. In agreement with the results attained during the normal imprinting experiments for closed negative structures, the peak count reaches a maximum before reducing as the roughness transfer is increased.
Figure 84 Macroscopic overview of surfaces rolled on the Multimill at Tata Steel with T2H90V90 textured work roll.
Figure 85 Macroscopic overview of surfaces rolled on the Multimill at Tata Steel with T2H130V130 textured work roll.
Original Surface
Surface at 3%Elongation
Surface at 4%Elongation
40 mm
Original S
urface
Surface at 3%Elongation
Surface at 4%Elongation
99

Figure 86 Confocal microscopy images of DX56 strip surfaces for (A) T2H90V90 and (B) T2H130V130 after rolling on the Multimill at Tata Steel.
Figure 87 Roughness (solid lines) and peak counts (dashed lines) as functions of the calculated applied rolling load for galvanised DX56 steel strip rolled on a pilot mill using (blue diamonds) T2H130V130 and (green squares) T2H90V90 textured work rolls.
Figure 88 Peak counts vs. roughness for galvanised DX56 steel strip rolled on a pilot mill using (blue diamonds) T2H130V130 and (green squares) T2H90V90 textured work rolls.
Extending the surface analysis to the waviness, Figure 89 shows the WaS, WaL and Wsa(1-5) values for the rolled surfaces. In each case, despite the lower roughness achieved with the T2H130V130 work rolls, the final waviness is lower for the finer (high RPc) T2H90V90 surface texture, except rather inexplicably for WaL at 4% elongation, which portrays an inverse relationship.
0
0.1
0.2
0.3
0.4
0.5
0.6
0.7
0.8
0.9
1
100 150 200 250 300 350 400 450 500
Calculated Rolling Load (MPa)
Rou
ghne
ss, R
a (µ
m)
0
20
40
60
80
100
120
140
Peak
Cou
nt, R
Pc (1
/cm
)
Ra T2H130V130 Ra T2H90V90RPc T2H130V130 RPc T2H90V90
0
20
40
60
80
100
120
140
0.3 0.4 0.5 0.6 0.7 0.8 0.9 1
Roughness, Ra (µm)
Peak
Cou
nt, R
Pc (1
/cm
)
T2H130V130 T2H90V90
100

Figure 89 Different waviness levels vs. mill elongation for galvanised DX56 steel strip rolled on a pilot mill using (blue) T2H130V130 and (green) T2H90V90 textured work rolls.
Main result no.3 High mill configuration (Buhler)
Figure 90 shows confocal microscopy images of DX56 rolled on the Buhler mill. The image serves to exhibit the range of texture structures that can be achieved on the rolled strip with two simple laser texture designs on the work roll. Bearing in mind the rolls have (more or less) equal roughness characteristics, the range of resultant surfaces is perhaps surprising. At low roughness transfer values (lo elongation), the T1H90V90 results in fully closed pockets, while the T2H90V90 surface results in a semi-closed surface. By increasing the roughness transfer of the open negative, the openness of the surface increases. For T1H90V90, deep pockets remain a characteristic of the surface, while the T2H90V90 surface essentially yields a 2-tier surface characterised by a deep channel network through a series of raised pillars. The influence of the closed vs. open structures was assessed with respect to paint appearance.
0.14
0.13
0.12 0.
20
0.13
0.11 0.
15 0.16
0
0.05
0.1
0.15
0.2
0.25
0.3
0.35
0.4
0.45
0.5
1% 2% 3% 4%
Strip Elongation
Wav
ines
s, W
aS (µ
m)
WaS 130WaS 90
0.21 0.23 0.26
0.140.
19
0.16 0.
24
0.39
0
0.05
0.1
0.15
0.2
0.25
0.3
0.35
0.4
0.45
0.5
1% 2% 3% 4%
Strip Elongation
Wav
ines
s, W
aL (µ
m)
WaL 130WaL 90
0.23
0.22
0.22 0.
27
0.20
0.15 0.
21 0.26
0
0.05
0.1
0.15
0.2
0.25
0.3
0.35
0.4
0.45
0.5
1% 2% 3% 4%
Strip Elongation
Wav
ines
s, W
sa(1
-5) (
µm)
Wsa(1-5) 130Wsa(1-5) 90
101

Elongation T1H90V90 T2H90V90
Incr
easi
ng d
egre
e of
ope
nnes
s in
sur
face
tex
ture
2%
3%
4%
Figure 90 Confocal microscopy images (1 mm x 1 mm) of (left) T1H90V90 and (right) T2H90V90 derived surfaces at various elongation levels on DX56 galvanised steel strip.
Figure 91 Strip peak count vs. Strip Ra for MagizincTM galvanised YD220 strip rolled with laser textured rolls of structure (blue diamonds) T2H90V90 and (red squares) T1H90V90.
µm
0
5
10
15
20
25
30µm
0
5
10
15
20
25
30
µm
0
5
10
15
20
25
30µm
0
5
10
15
20
25
30
µm
0
5
10
15
20
25
30µm
0
5
10
15
20
25
30
102

ɛ T1H90V90 T2H90V90
In
crea
sing
deg
ree
of o
penn
ess
in s
urfa
ce t
extu
re
1%
2%
3%
Figure 92 Confocal microscopy images (720 µm x 720 µm) of (left) T1H90V90 and (right) T2H90V90 derived surfaces at various elongation levels on YD220 MagizincTM galvanised steel strip.
An additional consideration is the type of coating. Recent advances in galvanised coatings have focused on the Mg-(Al)-Zn family offering enhanced corrosion resistance with thinner (lighter) layers. Tata Steel’s variant is called MagiZincTM, an innovative replacement for conventional galvanised steels. MagiZinc coated steel was also rolled and painted within the STEELTAC project. The results of the surface analysis reveal little or no influence of the coating type on roughness and peak count transfer values, with the trend in Figure 91 agreeing well and falling within the bounds of the results recorded for standard galvanised steel YD220. Likewise, the surface aspect after rolling is very similar to standard galvanised surface, as revealed in the confocal microscopy images presented in Figure 92.
Figures 93 and 94 reveal a remarkable observation. Utilising YD220 substrates produced during rolling trials, rather than the DX56 presented in Figure 90, the aim of the investigation to address the influence of the texture continues and comparable surfaces was achieved on YD220 for the elongation range 1.2-3.5 (Figure 91 as given in Figure 90 for DX56. In this assessment, the plain galvanised steel surface was assessed firstly by Wavescan after the rolling experiments, using a layer of Nitto tape (blue bars, Figure 93). It is noteworthy that the roughness of the 1.2% laser textured surfaces was around 1.3 µm, while the EDT reference sample was merely 0.7 µm to guarantee a low strip waviness and consequently provided an exceptional benchmark for the tests. After rolling, both the 1.2% laser textured samples and the EDT samples show comparable Wavescan results in the Longwave filter area. After ecoat painting, the surfaces all increase and the variation between the samples reduces dramatically. The implication here is that the ecoat process not only has a marked influence on the shortwave (roughness) aspect of the surface, but also generates Longwave structure (or equally suppresses it). The T1H90V90 surfaces show the same trend in Longwave before and after ecoat processing, however, most remarkably, the T2H90V90 surfaces all result in Longwave values very close to one another despite offering a wide roughness range prior to ecoat painting. This may offer significant improvements in strip for automotive applications, given that high roughness can be associated with reduced friction in forming operations.
µm
0
5
10
15
20
25
30µm
0
5
10
15
20
25
30
µm
0
5
10
15
20
25
30µm
0
5
10
15
20
25
30
µm
0
5
10
15
20
25
30µm
0
5
10
15
20
25
30
103

Figure 93 Wavescan derived longwave values for Textures T1H90V90 (in graph denoted as 0HV90) and T2H90V90 (in graph denoted as 1HV90) produced at several elongation levels on YD220 galvanised strip after rolling (blue) and after e-coat painting (green). Sample Ref 0 = regular production EDT surface.
For the MagizincTM coated surfaces, the observation is a little different, see Figure 94.
Figure 94 Wavescan derived longwave values for Textures T1H90V90 and T2H90V90 produced at several elongation levels on YD220 MagizincTM galvanised strip after rolling (blue) and after e-coat painting (green). Sample GI-EDT1 = regular production EDT surface.
Main result no. 4. Demonstrators
Some of the sheets produced where deformed to cups (biaxial strain ~ 5%) and painted with ecoat as demonstrators the macroscopic results for surfaces in Figure 95. No Moiré patterning was observed before or after forming, nor after painting, and no problems were encountered during press forming operation itself. Due to the sample size (100mm punch) it is unfortunately not possible to make Wavescan measurements on the pressed samples, though macroscopically, the surfaces look very good.
0
5
10
15
20
25
30
35
40
45
Ref 01HV90 3.5%1HV90 2.6%1HV90 1.2%0HV90 3.5%0HV90 2.6%0HV90 1.2%
Sample Texture and Elongation
Long
wav
e (-)
Longwave_Ecoat
Longwave_Rolled
104

Macroscopic photo of pressed cup Surface Texture Type, Production Method and Surface Texture prior to Painting
EDT Reference
(Standard Production)
Ra = 0.7 µm
RPc = 78 cm-1
Wsa (1-5)= 0.27µm
LT T1H90V90 (Buhler)
Ra = 0.89 µm
RPc = 118 cm1
Wsa (1-5)= 0.26µm
LT T2H90V90 (Buhler)
Ra = 1.04 µm
RPc = 123 cm-1
Wsa (1-5)= 0.26µm
LT T2H90V90
(Pilot Mill)
Ra = 0.94 µm
RPc = 98 cm-1
Wsa (1-5)= 0.4µm
Figure 95 E-coat painted cups for galvanised YD220 strip steel having low roughness (0.7 µm - 1.0 µm) rolled with EDT and laser-textured rolls. The values in the right column correspond to the surface before painting, but after press-cup forming.
105

References
[1] http://www.byk.com/fileadmin/BYK/downloads/support-downloads/instruments/theory/appearance/en/Intro_Orange-Peel.pdf
[2] EN 10049 Measurement of roughness average Ra and peak count RPc on metallic flat products, (2005)
[3] SEP 1941 Measurement of the waviness characteristic value Wsa(1-5) on cold rolled metallic flat products (2012)
[4] O. Deutscher, D. Paesold, K. Körner, H.-G. Weyen, S.P. Jupp, Characterising the surface waviness of hot dip galvanised steel sheets for optical high-quality paintability (CARSTEEL) Final Report EUR 23854 EN (2009)
[5] A. Bastawros, J.G. Speer, G. Zerafa, R. Krupitzer, Effects of Steel Surface Texture on Appearance after Painting, SAE Technical Paper Series (1993) 930032
[6] S. Mezghani, H. Zahouani and J-J. Piezanowski, Multiscale characterizations of painted surface appearance by continuous wavelet transform, Journal of Material Processing Technology 211 (2011) 205-211
106

WP 4 Communication and management
Objectives
- Management of the project;
- Communication between the partners and with the EC;
- Transfer of knowledge
Workshop organisation at end user location (IKEA, Sweden)
TASK 4.1 PROJECT CO-ORDINATION
• Management of the overall project
• Communication with the European Commission
• Development and management of a web site for the project
The design and implementation of the project website was done by the UoT at the project start and it was maintained and continuously updated during the project. The website is divided into a public and a private part. Furthermore, the annual report 2011 was compiled based on the input of all partners and presented at the annual meeting of TGS7, Ghent Belgium, June 2011. The Mid Term Report, covering all the research work carried out and achievements made during the first reporting period specified in the grant agreement, was presented at the 2013 TGS 7 Meeting, OVAKO, Hofors. An extensive action plan was needed to coordinate the corrective actions to catch up the project delays. The project third coordination meeting was extended to two full days to go through all the actions that are needed to accelerate the projects output. Additional video conferences calls were organised to synchronise the work of the partners. The first three meetings were a kick-off meeting on Nov 28/29 2011 in IJmuiden, the Netherlands, the second Project Coordination Meeting on May 22/23 2012 in Eibar, Spain and the third Project Coordination Meeting on December 17/18 2012 in Los Barrios, Cádiz, Spain. The fourth Project Coordination Meeting was held on May 14/15 2013 in Gothenburg, M ӧlndal, S w eden; the fifth meeting was on November 26/27 2013 in Enschede, the Netherlands and the sixth Project Coordination Meeting on March 25/26 2014 in Eibar, Gipuzkoa, Spain. The seventh and final meeting was organised the day before the workshop on October 21 2104 in M ӧlndal, S w eden. The project was closed on October 31 2014. The current report is the draft final report covering the entire project duration.
TASK 4.2 DISSEMINATION OF THE RESULTS
The results of the project are disseminated by the partners in the form of contributions to steel oriented conferences and presentations for groups of customers and production units. Part of the results has already been published in scientific journals. Additional peer reviewed papers describing the main results of the project have been submitted and are under review. The current list of papers is given in Section 2.5.
TASK 4.3 DEVELOPMENT OF GUIDELINES
Guidelines were developed based on the project results.
A stepwise, science-based approach to developing optimised surfaces is recommended. It starts with a modelling phase where optimised surfaces are designed. In the current version of the guidelines this is conducted within the process bounds of the pulsed laser texturing process and restricted to the functionalities tactility and paint appearance. The proposed validation route consists of direct pulsed laser texturing, imprinting with pulsed laser textured tools and finally, (pilot mill) rolling trials with pulse laser textured rolls. The effect on formability is preferably determined by a sensitivity FE-simulation and experimental methods. An overview of the approach is depicted in Figure 96.
107

Figure 96 Overview of the approach to designing and testing surfaces for improved surface appearance, tactility and formability.
The guidelines for optimising functionality of steel sheet surfaces are given for the functionalities tactility, wettability and paint appearance in Tables 42, 43 and 44 respectively. Table 45 summarises the guidelines with respect to Direct laser texturing, Imprinting and (Pilot Mill) Rolling.
Table 42 Guidelines with respect to tactility
Guidelines • The perceived stickiness is illustrated as the key subjective influence, which has a
negative correlation to the comfort perception. The effect of the perceived roughness is less influential than the perceived stickiness in the connection to the perception of comfort. Therefore the lower the friction coefficient in contact with skin, the greater the tactile and comfort properties.
• Texture designs can well be created by pulsed laser texturing and should be aimed at reducing the true area of contact in skin/sheet interaction as this will lower tactile friction levels.
• The 3D surface roughness Sa presented a negative correlation with the COF. More tactile friction was generated between the skin and the smoother surface, probably due to their greater true area of contact.
• Orientation effects create the opportunity to add tactile sensation effects based on the direction of sliding. Grooved channels, for example, are well suited to controlling skin friction in direction dependent sliding for moderately loaded contact situations.
• Rough surfaces give a greater level of comfort but the roughness of the surface should be lower than that of the finger.
• Laboratory friction tests can predict the tactile behaviour of the steel sheets, especially when the level of sheet roughness is not too great. This may be due to the fact that the real roughness of the fingers during in vivo testing is greater than the Lorica soft (11-18µm Ra) used for the laboratory tests.
FunctionalityAssessment
Friction, wetting and Paint Trials
Flat & Cup Samples
Rolling TrialsMulti-mill (4-high)Buhler (2-high)
FunctionalityAssessment
Friction, wetting and Paint Trials
Flat Samples ImprintingAssessment of
roughness transfer and surface
characteristics
ValidationLaser Texturing
ModellingSurface geometry
Optimised
Surfaces
FunctionalityAssessment
Friction & WettingDirect & Negative
Samples
DefinitionBoundary
surface conditionsFunctionalityAssessment
Friction, wetting and Paint Trials
Flat & Cup Samples
Rolling TrialsMulti-mill (4-high)Buhler (2-high)
FunctionalityAssessment
Friction, wetting and Paint Trials
Flat Samples ImprintingAssessment of
roughness transfer and surface
characteristics
ValidationLaser Texturing
ModellingSurface geometry
Optimised
Surfaces
FunctionalityAssessment
Friction & WettingDirect & Negative
Samples
DefinitionBoundary
surface conditions
108

Table 43 Guidelines with respect to wettability
• Texture designs can be created successfully by pulsed laser texturing and should be aimed at Pillar shaped textures with low peak density, and depending on the desirable roughness, with low or high heights.
• These textures generally result in hydrophobic stainless steel surfaces that can easily reach Contact Angle >90°.
Table 44 Guidelines with respect to paint appearance
• For automotive applications, paint appearance requirements (governed by “low” roughness/waviness) cannot be decoupled from forming requirements (“high” roughness) and are often customer (OEM) specific.
• Significant questions remain as regards the interaction between surface metrology and paint perception – particularly pertaining to waviness measurement of deterministic surfaces and the development of a robust measurement is advised.
• However, laser texturing as a means of achieving improved paint appearance (characterised by BYK Gardner Wavescan) without reducing forming behaviour has been proven a viable technology.
• Unlike EDT processing, pulsed laser texturing permits tailored deterministic texture designs offering high peak count values at high roughness values.
• The rate of peak count transfer is greater in “closed” systems, most likely due to confined deformation and junction growth.
• Despite the deterministic nature of the p-LT process, no problematic Moiré patterns were recorded on either roll, strip or in the painted samples (feature size and spacing < 100µm).
• E-coat paint trials indicate that laser textured surfaces can offer the same paint appearance with greater surface roughness values compared to EDT.
• The influence of the e-coat/paint layer itself plays a significant role in the final paint appearance (characterised by BYK Gardner Wavescan) – perhaps outweighing the role of the substrate texture.
109

Table 45 Guidelines for Direct laser texturing, Imprinting and (Pilot Mill) Rolling.
+ + very positive, +positive,+/- neutral, - negative, -- very negative
* due to roll texturing process; **1 due to pick-up (zinc coated steel) and roll wear (stainless steel).
110

New textures will influence the frictional response during forming significantly. The operational window needs to be updated for each texture design. Sheet metal forming processes could benefit from optimised forming lubricants to tailor friction during forming. Orange peel may occur after forming and their formation may depend on the lubricant and grain size of the sheet material.
Tooling solutions, see Figure 97, for deep drawing of stainless sheet must resist the most probable tool degradation mechanisms. For austenitic stainless steel with high deformation hardening, both adhesive and abrasive wear should be minimised, see figure below. For ferritic steels, the deformation hardening is lower, but some surface features may cause wear.
Figure 97 Tooling solutions.
For both alloys, a low friction tool surface is needed, with enough compressive strength to sustain the forming pressures. This can be obtained by a hardened powder steel, with small spacing between the hard particles, or by a forged tool steel, hardened to support a PVD coating. The surface should be polished Ra < 0.1 µm, with polishing direction perpendicular to the sheet drawing direction at the drawing radii.
When testing different sheet surfaces, it was found that laser textured rolls produced tactile and paintable surfaces that had equal or greater formability, and similar galling resistance to reference surface 2D. Therefore, the same tooling solutions are recommended as for 2D surfaces of stainless steel sheet.
Suggested tool surfaces for deep drawing of tested stainless sheet are summarised in Table 46.
Table 46 Suggested tool surfaces for deep drawing of stainless steel sheet
Tool steel trade name
Surface Comments
Vanadis 4E
63-64 HRC
AlCrN-coating including plasma nitriding
Duplex surface tested with good results
Caldie
58-60 HRC
AlCrN-coating including plasma nitriding
Duplex surface tested with good results
DeDer
Austeniticstainlessgrades
• Low frictionmaterial
•Small spacingbetweenhardphases
•Hard surfacecoating
Abrasive wearfrom gallingproducts
Cold-weldingand galling
Deformation hardening
Low proofstress
Sheetmaterial
Properties affecting tooling solution
Most probable tool defect
Tool material solution
111

TASK 4.4 WORKSHOP AT END USER LOCATION
The planned workshop at IKEA was discussed at the second project coordination meeting. The consortium had a preference for a workshop that was open to a larger audience. SWEREA explored the possibility of involving the Nordic Sheet Metal Association. In the end, the IKEA officials were indisposed and could not organise or attend the workshop; meetings were held at a later date between IKEA and Swerea IVF. Instead, the workshop was held at Swerea IVF on October 22, 2014. The selected theme was the strong trend towards developing and adding new surface textures for sheet metal products, see programme in Annex 2.
The workshop was greatly appreciated and very well attended. There were 28 persons present, a mix of end-user designers, production managers and researchers, representing 17 companies, universities and institutes, see Figure 98 for an impression. The market needs, product examples, design benefits, opportunities and constrains, cost etc. were demonstrated and discussed. During the workshop the participants also discussed and documented future needs and challenges – valuable input which has also generated new ideas and collaborations, see Table 47.
Figure 98 Highlights of the workshop at Swerea IVF.
Table 47 Prioritised areas of development, discussed at the workshop.
Area Objective
Paint appearance
Studies of size effects of phosphate and paint appearance
Correlation between measurements of substrate texture and longwave outcome Interrelation between visual parameters and physical parameters
Surface metrology Development of surface metrology, coupled to paint and texture
Coating methods Mirroring microstructure and texture through coating layer
Nano Technology Implement nano technology into industrial surfaces (self healing)
Tool surfaces Development of surface metrology, coupled to paint and texture
Coating methods Mirroring microstructure and texture through coating layer
Adhesion Design surfaces for improved adhesive joining and paint adherence
Tactile surfaces Improved understanding of the interrelation between tactility and material properties/surface texture
Transfer Transfer of micro texture by stamping
Tool surfaces Advanced lubrication and tool design for forming textured surfaces
Rolling surfaces Texture transference with and without lubricant
Robust tool surfaces Methods to preserve the laser textured tool surfaces
Tool deformation Control of the elastic deformation of the tools, with design? Or with texturing?
112

3 Conclusions, indicating the achievements made
Based on the project result it is concluded that a stepwise, science-based approach to developing optimised surfaces proved beneficial as the designed surfaces performed well with respect to the selected functionalities tactility, wettability and paint appearance. The proposed validation route consisted of direct pulsed laser texturing, imprinting with pulsed laser textured tools and finally, (pilot mill) rolling trials with pulse laser textured rolls. This route showed clear benefits especially with respect to the feasibility check for mass production forming and rolling. The effect on formability could well be checked by a sensitivity FE-simulation combined with experimental methods and is therefore recommended as well for future research.
The main conclusions with respect to manufacturing are
• Laser texturing is a promising technique to texture rolls for skin pass mills offering: high peak count values at high roughness values, high precision and excellent reproducibility. Laser processing is developing at a rapid rate and the European steel industry should be ready to exploit its clear benefits for improved roll roughness control and improved product quality at the customers.
• A simple roughness transfer set-up has been developed which enables roughness transfer characteristics to be assessed and new textures reproduced.
• The surface designs in this study are a first step in design optimisation. However, due to the complex nature of the texturing process and temper rolling process, incorporating roll wear, roll fouling and the roughness transfer process, a refined model is not yet achieved. In order to protect and offer longevity to designed roll surfaces, a suitable coating for rolls is required which can replace Cr-plating in “following” a designed surface texture/roughness profile.
• The rate of peak count transfer is greater in “closed” systems, most likely due to confined deformation and junction growth.
• The laser texturing procedure seems to offer reduced strip waviness at greater roughness levels, however the metrology of fully deterministic surfaces is time-consuming and can be ambiguous. A robust method should be considered.
• Limitations in upscaling of p-LT include laser placement for replication of texture design – specifically in relation to circumferential processing.
• The generation of non- deterministic or quasi-deterministic textures may circumvent this drawback/expedite the use of laser texturing and would exploit the precise control of the laser beam/laser head positioning in repetitive crater formation.
• An industrial trial of laser textured rolls is strongly recommended, incorporating full substrate analysis up to painted parts.
The main conclusions with respect to the selected functionalities tactility, wettability and paint appearance are
• A wide array of strip roughnesses have been produced and tested with respect to paint (ecoat) appearance.
• The influence of the e-coat/paint layer itself plays a significant role in the final paint appearance – perhaps outweighing the role of the substrate texture.
• Despite the deterministic nature of the p-LT process, no problematic Moiré patterns have been recorded on either roll, strip or in the painted samples.
• E-coat paint trials indicate that laser textured surfaces can offer the same paint appearance with higher surface roughness values compared to EDT.
• High levels of hydrophobicity could be reached with the pillar based surfaces selected for tactility.
• By means of picosecond laser texturing it has been confirmed that adhesive friction is the dominant mechanism in the friction tests performed, since friction decreased with asperity density, confirming the model theory predicted by the University of Twente.
• The grids PS4 surface obtained by picosecond laser texturing gives the lower frictional response. This behaviour can be related to their lower apparent / real contact area that reduces the adhesion term of the friction coefficient. This surface geometry shows no directionality (0, 45, 90º), probably due to the circumferential geometrical shape selected for the study.
113

• Comparative relative levels of friction can be achieved in laboratory tests with Lorica soft and real fingers when the roughness of the steel surface is low but there is no correlation when roughness is high.
• The higher level of comfort is achieved with lower friction coefficient. The greater comfort is related to lower stickiness of the counter surface during touching and sliding. The lower the roughness perception, the lower the real roughness was but the effect was less pronounced than the stickiness.
• The PS3 (7.8 µm Ra) obtained by picosecond laser with low density (width 75 µm) and high depth (30µm) resulted to the highest level of comfort followed by the one produced by nanosecond laser LDG3 (Depth 30µm, width 100 µm).
The main conclusions of the materials and formability study are:
• In general, with regard to the influence of the surface finish on the formability behaviour of the selected stainless steel, the best results of Erichsen, hole expansion and LDR have been found for tactility design textures (E13), followed by the paint ability ones (1H90/1H130).
• Concerning the effect of the lubricant, the main results show that Rhenus (one of the alternative lubricants proposed in STEELTAC) gives better Erichsen than Vaseline, which also has one of the highest efficiencies.
• By tapping torque tests, although Houghto-Draw presented the best results, the presence of chlorine means that it has to be discarded as the best alternative. Therefore, Rhenus LA 722083 was considered as the best option since it was also effective at rates of 5%.
• In the study of the lamination process effect in properties transfer, it was observed that the transfer was much better in the stainless steel EN 1.4509 than in the galvanised IF-DX56. However, it was observed that the material of the sheets used during lamination did not have a decisive role in the transfer of properties from rolls to sheets.
• The laminated EN 1.4509 steel sheets had better lubrication efficiency when they were rolled with rolls textured by LSD. This effect was seen in the transferred pattern 01H90V90 which had a lubrication efficiency much higher than the surface finishing used as references E13 and 2G.
• The completed attempts did not show any tendencies to increase the susceptibility of galling. In the forthcoming development of tactile textures, the roughness and peak counts could therefore be a useful guide to maintaining or increasing th wear performance of the textures. Specifically, the texture should be rougher (Ra-value > 0.7 µm).
• Increased roughness could be favourable for the galling resistance but adversely affects the process window, for example the 2D surface reduced the formability index by 33%. The tactile texture did show a minor influence: a reduction of 12%. Consequently, a roughness in the same order as or less than the tactile texture (Ra-value < 0.6 µm, 2%-elongation) would still exhibit acceptable formability. Furthermore, the maximum drawing depth of the tactile texture was not greatly influenced: a reduction of only 1%.
• On the tactile surface a substantial orange peel effect was developed during the forming operation. The orange peel effect was more apparent on the tactile texture than the original smooth texture it was superimposed on. The tactile surface is rougher than the original (2R+SKP) texture and could easier release orange peel effects. A more fine grain structure (> 4.7) should therefore be considered if the appearance is to be acceptable after forming operations.
114

4 Exploitation and impact of the research results
Texturing
The next step for the implementation of project results will be to scale up the texturing process. From a purely financial point of view, it is possible to say that current EDT machines cost upwards of 2 million euros rising to even 4 million euros for high throughput systems (2000mm width, 400 mm diameter in <45 minutes). With this in mind, for the same capital investment, a laser texturing system having a processing time equal to or faster than EDT will be attainable. Beyond the investment financial implications, the new laser texturing system will permit operational savings in consumables and improvements in health and safety since there will be no need for electrodes (typically high purity extruded copper), flammable dielectric oil or the whole filter system etc. when compared with the current EDT technologies. The confidence in achieving this result is supported through the recently submitted RFCS LaProFAST Pilot and Demonstrator proposal.
Tactility
To conclude, for future studies the sliding finger or Lorica Soft® material (polyurethane coated polyamide fleece) roughness (Table 1 and Figure 4, Deliverable 3.1) has to be larger than the roughness Ra + 2σ (deviation) of the contacting sheet surface. We think that this needs a further investigation testing window (roughness vs. contacting Surface roughness) to determine when simulation fails, and it is necessary to make an investigation in the future in order to reach good correlations, since nowadays this is limited to low roughness surfaces, but tactility will require a certain level of roughness (unless 6-7µm). The outcome of this project is that if the finger counter material has a greater roughness than the sheet material, the finger will have a sensitivity, but if it is lower, it will not. That it is why one challenging possibility will be to reproduce the Index Finger roughness, with texturing using one elastomeric materials (with inherent greater flexibility for deformation than the Lorica soft, to simulate better the fingerpad behaviour) in simulated tribological tests. This is a hypothesis, but should be proved with further research.
Formability tests
It has been proven that texturing on the sheet materials could increase or reduce the efficiency during forming, depending on the material and type of lubricant. But there are still some issues that will require further investigation, such as an alternative lubricant for forming Zn coated steels (IF), or the orange peel that may happen in tactile structure as a function of the grain size and roughness properties.
Paintability
Technical requirements of paintability have been achieved, but scalability is still an issue to deal with (already discussed in texturing). Further studies could consider also the effect of texturing on corrosion mechanism, corrosion resistance, and corrosion rate, before and after painting.
115

Dissemination
Several papers have been written to describe the main STEELTAC achievements:
Texturing process
Quintana et al. “Laser texturing of imprinting dies using nanosecond pulses. Applications for automotive industry". KES Transactions on Sustainable Design and Manufacturing Vol 1, Nº1 pp 961-972, 2014
Rodriguez-Vidal et al., Surface design and texturing using nanosecond pulsed lasers for simulated roughness transfer and improved paint appearance of Strip Steel (in preparation for Journal of Material Processing and Technology, 2015)
Tactility understanding
S. Zhang, A. C. Rodriguez Urribarri, M. Morales Hurtado, X. Zeng and E. van der Heide, The Role of the Sliding Direction against a Grooved Channel Texture on Tool Steel: An Experimental Study on Tactile Friction, International Journal of Solids and Structures, 56-57, pp 53-61, 2015
S. Zhang, E. van der Heide et al Orientation Effects of Micro-textured Surfaces: Tactile Friction, in preparation, 2015
S. Zhang, E. van der Heide et al., Balancing tactile comfort and friction on stainless steel by touch, in preparation, 2015
Formability
D. Wiklund, L. Kirkhorn, B. Wadman, Tactile and cleanable sheet metal surfaces and the influence on formability, submitted to IDDRG 2015
116

List of figures
Figure A (a) Overview of the TUWI compression rig used for simple roughness transfer tests at Tata Steel, represented schematically in (b) highlighting the key aspects of the set-up (c) FEM simulation used to obtain the ideal pressure stack.
Figure B Surface texturing designs: “Open” structures (left) , semi-open structures (middle) and “closed” structures (right).
Figure C Confocal microscopy derived surfaces after laser texturing with patterns a) T2H90V90 b) T1H90V90 c) T2H130V130. The images have been edited in CorelDRAW X6 to form a photorealistic image overlay with a height map of graded transparency across the image diagonals.
Figure D Confocal microscopy analysis of Surface profiles of the T2H130V130 work roll surface (left) as textured, (middle) after rolling and (right) after pickling with 10% HCl solution
Figure E Confocal images of stainless steel 1.4301 as rolled with T2H90V90 and T2H130V130 work rolls in the Tata Steel pilot mill.
Figure F Surfaces selected with best tactile properties produced by laser ablation with a a) picosecond laser and b) nanosecond laser.
Figure 1 Hard chromium plated EDT roll surfaces. a) Ra = 1.02 µm; b) Ra = 10.23 µm [4].
Figure 2 Microsecond (a) and Picosecond (b) laser ablation mechanism [9].
Figure 3 Sketch of laser texturing and textured craters on a roll.
Figure 4 Schematic description of the different texturing techniques [15].
Figure 5 Lotus effect visualised by www.thegreenstylist.com compared to a surface created by LST.
(right)
Figure 6 Effect of sheet lay direction to sliding for stainless lean duplex steel. Sliding perpendicular (2E-T) to the lay produced lower resistance to galling for the LDX steel, compared to sliding parallel to the lay (2E-L), compared to finish 2B [54].
Figure 7 Microstructures of ferritic stainless steel EN-1.4509: 2R+SKP (first row left), 2B (first row right), 2D (second row left) and 2G (second row right).
Figure 8 Microstructures of the austenitic stainless steel EN-1.4301: 2R+SKP (left) and 2B (right).
Figure 9 Microstructures of the ferritic stainless steel EN-1.4016: 2R+SKP (left) and 2B (right).
Figure 10 Microstructures of the ferritic stainless steel EN-1.4016: 2G.
Figure 11 a) High-resolution scandisk confocal microscopy (SDCM). b) 3D wear scar image.
Figure 12 Surface topography of the ferritic stainless steel EN-1.4016: 2R+SKP. 3D topography scale is between -3 µm and 3 µm. Profilometry scale is between -4 µm and 2 µm.
Figure 13 Surface topography of the ferritic stainless steel EN-1.4016: 2B. 3D topography scale is between -3 µm and 3 µm. Profilometry scale is between -4 µm and 2 µm.
Figure 14 Surface topography of the ferritic stainless steel EN-1.4016: 2G. 3D topography scale is between -5 µm and 5 µm. Profilometry scale is between -4 µm and 2 µm.
Figure 15 Surface topography of the ferritic stainless steel EN-1.4509: 2R+SKP. 3D topography scale is between -3 µm and 2.91 µm. Profilometry scale is between -3 µm and 2.91 µm.
117

Figure 16 Surface topography of the ferritic stainless steel EN-1.4509: 2B. 3D topography scale is between -3 µm and 3 µm. Profilometry scale is between -3 µm and 3 µm.
Figure 17 Surface topography of the ferritic stainless steel EN-1.4509: 2D. 3D topography scale is between -3 µm and 3 µm. Profilometry scale is between -3 µm and 3 µm.
Figure 18 Surface topography of the ferritic stainless steel EN-1.4509: 2G. 3D topography scale is between -3 µm and 3 µm. Profilometry scale is between -3 µm and 3 µm.
Figure 19 Optical Micrographs revealing the microstructures of the substrate material of the hot-dip galvanised materials supplied by Tata Steel.
Figure 20 Schematic overview of the sample directions in the three-dimensional tensile tests.
Figure 21 Surface topography of the carbon steel DX54. 3D topography scale is between -2.5 µm and 2 µm. Profilometry scale is between -10 µm and 10 µm.
Figure 22 (left) SEM Images in BSE mode, (middle) SEM revealing surface topography and (right) polarised light microscopy images of the surface of galvanised carbon steel YD220.
Figure 23 (left) SEM Images in BSE mode, (middle) SEM revealing surface topography and (right) polarised light microscopy images of the surface of galvanised carbon steel DX54.
Figure 24 (left) SEM Images in BSE mode, (middle) SEM revealing surface topography and (right) polarised light microscopy images of the surface of galvanised carbon steel DP600.
Figure 25 (Left and middle) confocal microscopy of a typical galvanised surface processed in the temper mill with EDT textured work rolls and (right) a polarised light optical microscopy image of the same surface.
Figure 26 Project structure.
Figure 27 Layout and process window with picosecond and nanosecond laser for coining tests.
Figure 28 a) 2D Confocal image b) Cross section corresponding to a trench of craters using the optimal laser parameters for the texturing trials.
Figure 29 Surface texturing designs: “Open” structures (left) , semi-open structures (middle) and “closed” structures (right).
Figure 30 Confocal microscopy derived surfaces after laser texturing with patterns a) T2H90V90 b) T1H90V90 c) T2H130V130. The images have been edited in CorelDRAW X6 to form a photorealistic image overlain with a height map of graded transparency across the image diagonals.
Figure 31 right: Fully Laser Textured Disk Produced by laser texturing with an ns laser at 2.4m/s processing speed (Ra ~5.5µm; RPc = 125 cm-1).
Figure 32 (a) Overview of the TUWI compression rig used for simple roughness transfer tests at Tata Steel, represented schematically in (b) highlighting the key aspects of the set-up (c) FEM simulation used to obtain the ideal pressure stack.
Figure 33 Overview of the pilot rolling mills at Tata Steel, used for rolling trials in STEELTAC: (left) four-high Multimill, (right) two-high “Bühler” mill.
Figure 34 General view of the textured roll along with a detail of the texture pattern a) T2H90V90; b) T2H130V130.
Figure 35 Comparison between (left) modelled surfaces, (middle) lab-scale surfaces and (right) final work roll surfaces for (top) T2H90V90 and (bottom) T2H130V130 laser textured surfaces.
Figure 36 Overview of the rolls as positioned in the Tata Steel Multimill for rolling trials.
118

Figure 37 Confocal microscopy analysis of Surface profiles of the T2H130V130 work roll.
surface (left) as textured, (middle) after rolling and (right) after pickling with 10% HCl
solution.
Figure 38 Surface profiles of the T2H130V130 work roll surface (green) as textured,
(red) after rolling and (orange) after pickling with 10% HCl solution.
Figure 39 Confocal images of stainless steel 1.4301 as rolled with T2H90V90 and T2H130V130 work rolls in the Tata Steel pilot mill. Figure 40 Scheme of the textured roller surface for the two final patterns.
Figure 41 Pillar Design for Tactility Enhancement, taken from [17].
Figure 42 Influence of steel roughness and measurement wavelength on the appearance of steel at a 40 cm observation distance.
Figure 43 Influence of steel roughness and measurement wavelength on the appearance of steel at a 3 m observation distance.
Figure 44 (left above) Relation between strip surface Peak Count (peaks per inch) PPI and its waviness Wa for various work roll Ra values (a) 2.4 µm (b) 2.6 µm (c) 3.2µm (d) 2.6-3.2µm [work rolls a-c~200mm diameter; d=520 mm diameter [28] and (left below) schematic translation highlighting the target window for STEELTAC. The first texture design based on this is depicted in the right-hand part of the figure [29]. As will be discussed in the following chapter however, the realisation of a stochastic surface was deemed not possible, and as such the surface design for paint appearance was revisited.
Figure 45 a) UMT-CETR tribometer, b) tactile friction measurement, and c) three-axis force/torque transducer (ATI Industrial Automation, Apex, NC, USA).
Figure 46 Lorica Soft®.
Figure 47 Topographies of different patterns using a picosecond laser and summary of width and depth of cones (ρ: density of cones, h: depth of cones).
Figure 48 Textures and texturing conditions.
Figure 49 Textures examined by SEM at the same magnification (a) grooved channel (Z001); (b) Peano curve (Z002); (c) grid PS4 (Z003).
Figure 50 Average COFs for each sample at (a) FN = 0.2 N, (b) FN = 0.4 N, and (c) FN = 1.0 N.
Figure 51 (a) Perception experiment (blindfolded); (b) Friction measurement set-up.
Figure 52 Confocal microscope images of sample (a) 1HV90 (stamping), (b) 1HV90-1% (cold rolling), and (e) 2G (non-textured); SEM images of sample (c) PS3 and (d) LDG3.
Figure 53 Average values of perceived roughness versus (a) surface roughness Ra, and (c) COF; average values of perceived stickiness versus (b) surface roughness, and (d) COF; average values of perceived stickiness versus average values of perceived roughness.
Figure 54 (a) Comfort level versus perceived roughness; (b) Comfort level versus perceived stickiness; (c) Comfort level versus COF.
Figure 55 Goniometer for hydrophilia/hydrophobia measurements (left) and contact angle of a drop of water on a steel surface (right).
Figure 56 Principles of non-wetting behaviour for a hydrophobic smooth and nanostructured surface (a) Hydrophobic smooth surface, (b) Superhydrophobic nanostructured/microstructured surface.
Figure 57 Surface roughness and self-cleaning by rinsing with water.
Figure 58 Example of the texturing treatment effect on the surface wettability.
119

Figure 59 Wetting behaviour of selected steel surfaces.
Figure 60 Lubricant efficiency values of the selected lubricants and their emulsions in water. The star indicates the optimum.
Figure 61 Results of the Tapping Torque tests with steel IF-DX56 sheets (left) and with stainless steel EN 1.4509 (right).
Figure 62 Tribotest.
Figure 63 The frictional response transverse and along the rolling direction of commercially available surface textures. The variance of the average frictional response is a weighted sample variance.
Figure 64 The frictional response transverse and along the rolling direction of surface textures optimised for tactile feel. Two different elongations were applied in the rolling process 2% respectively 1%. Additionally, the frictional responses of surface textures optimised for paint ability are presented.
Figure 65 The results of the global sensitivity analysis (Sobol). The variance could be explained predominantly by the frictional response i.e. 57% when shifting between the reference 2G and the tactile texture, and 89% when shifting between the reference 2G and the 2D texture.
Figure 66 The process window, i.e. the acceptable forming zone, is shown.
Figure 67. Generated acceptable forming zone with different surface textures.
Figure 68. The radius of the drawn cups are shown for the a) Tactile, b) 2R+SKP and c) 2D surfaces. On the Tactile surface a substantial orange peel effect is visible on the radius.
Figure 69 The maximum sliding lengths until galling.
Figure 70 Overview of the approach to designing and testing surfaces for improved surface appearance.
Figure 71 Overview of the modular Gorkotte paint lab-scale paint line at Tata Steel used in the e-coat trials.
Figure 72 Image of the BYK-Gardener Wavescan equipment as available at Tata Steel and a schematic overview of the influence of wavelength on surface appearance [1].
Figure 73 Schematic visualisation of waviness ranges after mathematical filter functions as characterised by the BYK Wave-scan equipment.
Figure 74 SEM images of (left) the laser textured disk (negative) and (right) the imprinted strip (positive) after normal imprinting at P=4.19sy(s) for the T1H90V90 surface texture.
Figure 75 SEM images of (left) the laser textured disk (negative) and (right) the imprinted strip (positive) after normal imprinting at P=4.19sy(s) for the T2H90V90 surface texture.
Figure 76 SEM images of (left) the laser textured disk (negative) and (right) the imprinted strip (positive) after normal imprinting at P=4.19sy(s) for the T2H130V130 surface texture.
Figure 77 Influence of e-coat on wavelet amplitude (dotted line) compared to the wavelet amplitude of the electro-discharge textured galvanised strip (dashed line) at various length scales. The attenuation ratio (1-(amplitude ecoat/amplitude substrate)) is given as the solid line.
Figure 78 a) Influence of applying Nitto tape (magenta curve) to an e-coated surface (blue curve) and b) Comparison of surface aspect parameters with respect to waviness.
Figure 79 Visual appearance of a DX54 galvanised steel surface after imprinting (4.2*YS => Ra = 2.44µm; RPc = 111; Wsa/Ra = 0.12) and e-coat painting.
Figure 80 Roughness transfer (%) vs. yield-strength normalised contact pressure (%).
Figure 81 Peak count transfer (%) vs. yield-strength normalised contact pressure (%).
120

Figure 82 Surface waviness values of three surfaces generated by imprinting of laser textured tools in DX56 galvanised steel and an EDT reference. All surfaces had an Ra of 1.3 µm to 1.4 µm.
Figure 83 Wavescan results for ecoat-painted surfaces of Ra ~1.3 µm for (purple) production EDT and normally imprinted laser texture surfaces () T2H90V90, (blue + diamond) T2H130V130 and (green + square) T1H90V90 structures.
Figure 84 Macroscopic overview of surfaces rolled on the Multimill at Tata Steel with T2H90V90 textured work roll.
Figure 85 Macroscopic overview of surfaces rolled on the Multimill at Tata Steel with T2H130V130 textured work roll.
Figure 86 Confocal microscopy images of DX56 strip surfaces for (A) T2H90V90 and (B) T2H130V130 after rolling on the Multimill at Tata Steel.
Figure 87 Roughness (solid lines) and peak counts (dashed lines) as functions of the calculated applied rolling load for galvanised DX56 steel strip rolled on a pilot mill using (blue diamonds) T2H130V130 and (green squares) T2H90V90 textured work rolls.
Figure 88 Peak counts vs. roughness for galvanised DX56 steel strip rolled on a pilot mill using (blue diamonds) T2H130V130 and (green squares) T2H90V90 textured work rolls.
Figure 89 Different waviness levels vs. mill elongation for galvanised DX56 steel strip rolled on a pilot mill using (blue) T2H130V130 and (green) T2H90V90 textured work rolls.
Figure 90 Confocal microscopy images (1 mm x 1 mm) of (left) T1H90V90 and (right) T2H90V90 derived surfaces at various elongation levels on DX56 galvanised steel strip.
Figure 91 Strip peak count vs. Strip Ra for MagizincTM galvanised YD220 strip rolled with laser textured rolls of structure (blue diamonds) T2H90V90 and (red squares) T1H90V90.
Figure 92 Confocal microscopy images (720 µm x 720 µm) of (left) T1H90V90 and (right) T2H90V90 derived surfaces at various elongation levels on YD220 MagizincTM galvanised steel strip.
Figure 93 Wavescan derived longwave values for Textures T1H90V90 (in graph denoted as 0HV90) and T2H90V90 (in graph denoted as 1HV90) produced at several elongation levels on YD220 galvanised strip after rolling (blue) and after e-coat painting (green). Sample Ref 0 = regular production EDT surface.
Figure 94 Wavescan derived longwave values for Textures T1H90V90 and T2H90V90 produced at several elongation levels on YD220 MagizincTM galvanised strip after rolling (blue) and after e-coat painting (green). Sample Ref 0 = regular production EDT surface.
Figure 95 E-coat painted cups for galvanised YD220 strip steel having low roughness (0.7 µm - 1.0 µm) rolled with EDT and laser-textured rolls. The values in the right column correspond to the surface before painting, but after press-cup forming.
Figure 96 Highlights of the workshop at Swerea IVF.
Figure 97 Tooling solutions.
Figure 98 Highlights of the workshop at Swerea IVF.
121

122

List of tables
Table I Zinc-coated sheet materials produced for the project.
Table II Stainless steel sheet materials produced for the project.
Table III Forming efficiency (%) of textured surfaces, with different lubricants in relation to reference 2G, using the tapping torque machine.
Table 1 Qualitative comparison between existing roll texturing techniques.
Table 2 Zinc-coated sheet materials produced for the project.
Table 3 Stainless steel sheet materials produced for the project.
Table 4 Tool materials selected for the project.
Table 5 Lubricants selected for the project.
Table 6 Selected skin equivalent materials for tribological evaluation.
Table 7 Main features of Leco analysers.
Table 8 Chemical composition of the selected stainless steels (wt.%).
Table 9 Results of grain size of the selected stainless steels.
Table 10 Results of mechanical properties of the selected stainless steels.
Table 11 Commonly used roughness parameters.
Table 12 Selection of cut-off lengths.
Table 13 Roughness of the selected stainless steels.
Table 14 Results of roughness of the ferritic EN-1.4509 by Tekniker.
Table 15 Guideline compositions of substrate materials relating to the carbon steel galvanised steel strips under investigation in STEELTAC (balance Fe, all values in m%).
Table 16 Summary of the results of three-dimensional tensile and hardness testing of galvanised strip provided for the STEELTAC Project.
Table 17 Summary of the roughness analysis of the non-temper-rolled hot-dip galvanised materials prepared by Tata Steel for the STEELTAC project.
Table 18 Direct Laser Surface Texturing.
Table 19 Roughness transfer by coining, milestone M1.2.
Table 20 Overlap parameters of two different texture motifs and corresponding expected Sa.
Table 21 Resultant crater parameters of selected texture patterns.
Table 22 Roughness values [μm] of the surfaces generated by laser texturing for imprint negatives.
Table 23 Initial surface properties of the galvanised materials used in imprinting trials.
Table 24 Work roll roughness values before and after Bühler rolling experiments (measurements made perpendicular to rolling direction).
Table 25 Starting design limits and considerations for first modelled surfaces.
Table 26 Economic estimation of the laser machined required to upscale the mill roll laser texturing process.
Table 27 Roughness, contact angle and friction coefficients.
Table 28 Roughness, contact angle and friction coefficients.
123

Table 29 The average values of perceived stickiness, perceived roughness, comfort level of sixteen participants from perception experiments; the average values of COF from friction measurements.
Table 30 Stainless steels under formability study.
Table 31 Anisotropy factors and work-hardening exponents.
Table 32 Erichsen, Hole Expansion and LDR results for the reference materials.
Table 33 Effect of the surface condition. Erichsen, hole expansion and LDR results.
Table 34 Erichsen results as function of the lubrication, surface condition and steel grade.
Table 35 Hole expansion results as function of the lubrication, surface condition and steel grade.
Table 36 LDR results as function of the lubrication, surface condition and steel grade.
Table 37 Tool materials and coatings.
Table 38 Coefficient of variation of different parameters in the sensitivity study.
Table 39 Verification of simulation results. The scanning of cups was performed by GOM Triple Scan III. Sampling distance was 0.213 mm.
Table 40 Amplitude parameters of Waviness [13]. The profile was extracted from the scanning results of cups (GOM Triple Scan III); the outermost part of the flange. The profile length was 100 mm and filtered by a polynomial of order 2 and a Robust Gaussian Filter (cut-of 25mm).
Table 41 Strip roughness values after normal imprinting experimentation for Ra +/- 1.3 µm.
Table 42 Guidelines with respect to tactility.
Table 43 Guidelines with respect to wettability.
Table 44 Guidelines with respect to paint appearance.
Table 45 Guidelines for Direct laser texturing, Imprinting and (Pilot Mill) Rolling.
Table 46 Suggested tool surfaces for deep drawing of stainless steel sheet.
Table 47 Prioritised areas of development, discussed at the workshop.
124

List of acronyms and abbreviations
STEELTAC Steel sheet surfaces with enhanced tactile feel
1H90/1H130 Surface designed for paint appearance, see Annex 1
2D Reference surface. Cold rolled, heat treated and pickled.
2B Reference surface. This is produced as 2D, but a with final light rolling step using highly polished rolls.
2R+SKP Reference surface. This is produced as 2D, but the heat treatment is bright annealing under Oxygen-free atmospheric conditions, followed by cold rolling using polished rolls.
2G Reference surface. Ground finish with a uniform uni-directional surface which has low reflectivity.
COF Coefficient of friction
E13 Surface designed to reproduce 2G surface geometry by laser texturing.
EBT Electron Beam Texturing
ECT Electro Chrome Texturing
EDT Electro Discharge Texturing
HDG Hot Dip Galvanising
IF Interstitial Free
LST Laser Surface Texturing
SBT Shot Blast Texturing
125

Annex 1 Texture designs
126

Additionally, two designs were tested for tactility only, i.e.: grooved channel (Z001) and a Peano curve (Z002), see Section 3.1
127

128

Annex 2 Workshop
Workshop: Functional surfaces for sheet metal
A workshop within the RFCS project STEELTAC
Time October 22, 10.00-16.00
Location Swerea IVF, Mölndal
Topic
Today there is a strong trend towards developing and adding new surface textures for sheet metal products. This means potentially new value adding features, affecting both appearance and functionality, for the products. This highly relevant topic will be highlighted in the seminary by participants from the RFCS-project STEELTAC (University of Twente, TATA Steel, Acerinox, IK4-Tekniker, Swerea IVF). The project has resulted in new texturing possibilities by utilisation of laser technology in the roll texturing process. New functionalities have been developed for tactility, paint appearance, and wettabillity. Besides, several academic and industrial partners to Swerea IVF, e.g. Halmstad University, Volvo Cars, Oerlikon Balzers, will present a wide view of the research going on and industrial trends, as well. The new intrinsic surface features must also be preserved in the forming processes. Therefore, state of art of tribological system technologies for advanced forming operations will also be presented and discussed during the day.
You will be most welcome!
Information and registration
Cost: Free of charge. Information material, coffee and lunch included
Registration: www.swerea.se/funtionellaytor The last day for registration is October 10. If you are unable to attend, cancellation must be made before 17 October, otherwise 500 SEK will be charged.
Contact: Ann-Charlotte Borggren, phone 031 - 706 60 94
Programme
10.00 Welcome
10.10 Tactile surfaces, their influence on comfort and design Lydia Zeng, University of Twente
10:45 Current status and future needs for exposed sheet material at VCC Richard Johansson, Volvo Cars
11:15 Developing Next Generation Galvanised Surfaces at Tata Steel David Matthews , TATA Steel
11:50-13:00 Lunch with focus groups Paintability/Tactility/Forming
13:00 New textures on stainless steel and their influence on formability, Daniel Wiklund, Swerea IVF, Rafael Sanchez, Acerinox,
13:15 How to implement environmental-friendly lubricants, Erik Madsen and Ermanno Cero, Grundfos A/S
13:50 Tailored surface modifications by means of texturing Amaya Igartua, IK4-Tekniker
14:20 Multifunctional sheet surfaces and automated finishing -manufacturing of perception and function,
Bengt-Göran Rosén, Halmstad and Chalmers University
14:40 Surface coatings that prolong life Susanna Lindgren, Oerlikon Balzers
1500-15.30 Coffee, discussion on future challenges
15.30 Tooling solutions for stainless forming, Boel Wadman, Swerea IVF
15:50 Voting on most important future challenges 16:00 End of seminar, (tour of workshop and dinner for those who wish)
129

HOW TO OBTAIN EU PUBLICATIONS
Free publications: • one copy:
via EU Bookshop (http://bookshop.europa.eu);
• more than one copy or posters/maps: from the European Union’s representations (http://ec.europa.eu/represent_en.htm); from the delegations in non-EU countries (http://eeas.europa.eu/delegations/index_en.htm); by contacting the Europe Direct service (http://europa.eu/europedirect/index_en.htm) or calling 00 800 6 7 8 9 10 11 (freephone number from anywhere in the EU) (*). (*) The information given is free, as are most calls (though some operators, phone boxes or hotels may charge you).
Priced publications: • via EU Bookshop (http://bookshop.europa.eu).

This work addresses the development of new and improved manufacturing technologies to create innovative steel sheet surfaces for automotive and domestic appliances. A combination of predictive simulations and experimental work was conducted by a well-equipped consortium (ACERINOX, TATA STEEL, SWEREA-IVF, IK4-TEKNIKER and the UNIVERSITY OF TWENTE) focused on the development of designed tactility, hydrophobicity and increased formability and paint appearance for steel sheet surfaces using laser textured cold rolling rolls. Innovative sheet finishes with laser texturing were designed based on a pillar structure integrating open, semi open and closed structures applied on stainless steel and zinc coated steel sheets based on laser surface texturing and cold rolling. The final pilot rolling trials showed clearly the feasibility of the approach, although obstacles related to roll surface wear were identified. Laser processing is developing at a rapid rate and, with the appropriate scale-up, the European steel industry should be ready to exploit its clear benefits for improved roll roughness control and improved product quality at the customers. The main advantage of this technology is the possibility to get tailored surfaces with optimised tactility, wettability and paint appearance.
Studies and reports
EUR 27779
Steel sheet surfaces with enhanced tactile feel (STEELTAC)
EU
ISBN 978-92-79-57124-4
doi:10.2777/76205
KI-NA-277-79-EN
-N