Molecular Genetics of Usher Syndrome Type 1C
279
Molecular Genetics of Usher Syndrome Type 1C Diana Claire Blaydon Institute of Child Health, University College London Thesis submitted to the University of London for the degree of Doctor of Philosophy July 2004
-
Upload
khangminh22 -
Category
Documents
-
view
2 -
download
0
Transcript of Molecular Genetics of Usher Syndrome Type 1C

Molecular Genetics of Usher Syndrome Type 1C
Diana Claire Blaydon Institute of Child Health, University College London
Thesis submitted to the University of London for the degree ofDoctor of Philosophy
July 2004

UMI Number: U602424
All rights reserved
INFORMATION TO ALL USERS The quality of this reproduction is dependent upon the quality of the copy submitted.
In the unlikely event that the author did not send a complete manuscript and there are missing pages, these will be noted. Also, if material had to be removed,
a note will indicate the deletion.
Dissertation Publishing
UMI U602424Published by ProQuest LLC 2014. Copyright in the Dissertation held by the Author.
Microform Edition © ProQuest LLC.All rights reserved. This work is protected against
unauthorized copying under Title 17, United States Code.
ProQuest LLC 789 East Eisenhower Parkway
P.O. Box 1346 Ann Arbor, Ml 48106-1346

Abstract
Usher syndrome type 1C is an autosomal recessive condition in which
profound, congenital sensorineural deafness is found in association with
vestibular hypofunction and childhood onset retinitis pigmentosa. The gene
responsible for Usher type 1C, USH1C, codes for a PDZ domain-containing
protein, harmonin, of unknown function. In addition, the locus for a form of non-
syndromic autosomal recessive deafness, DFNB18, overlaps with the USH1C
gene.
In this thesis the USH1C gene is studied in more detail, both at the molecular
level and at the protein level. Two cohorts of patients, individuals diagnosed
with Usher type 1, and a group of sibs with recessive non-syndromic deafness
concordant for markers flanking the DFNB18 locus, were screened for
mutations in USH1C. One Usher type 1 patient was homozygous for a
recurrent mutation, and the possibility of a founder effect was investigated by
analysing intragenic SNPs. Another Usher type 1 patient had two novel coding
mutations that were studied in more detail to establish whether they were likely
to be disease-causing or represent rare polymorphisms.
USH1C is an alternatively spliced gene with evidence for tissue-specific
isoforms of the protein. The repertoire of alternative isoforms and their tissue
distributions were studied in human foetal tissues using non-quantitative RT-
PCR. Particular attention was paid to a putative isoform thought to utilize an
alternative start site in the centre of the gene. This isoform may have

importance in other tissues when a mutation at the 5’ end of USH1C results in
a non-functional protein from the usual start site............... ..............
The sub-cellular localization of harmonin was investigated in individual human
epithelial cells using fluorescent immunocytochemistry, and fluorescent
immunohistochemistry was used to study the localization in mouse inner ear
sections. Finally, to understand more about the possible role of harmonin in the
ear and the eye, an in vitro GST pull-down assay was set up to investigate the
interaction of harmonin with another Usher type 1 protein, protocadherin 15.
2

Acknowledgements
I would like to take this opportunity to convey my deep gratitude towards the
following people, without whom the writing of this thesis and the research
described herein would have been a much more arduous task.
For her dedicated guidance and support, I would like to express my
appreciation to my supervisor Maria Bitner-Glindzicz. I am also very grateful to
my second supervisor, Christine Kinnon, for stepping in and offering a very
valuable alternate perspective on my work.
Special thanks goes to my parents for all their support over the years, but
particularly to my mum for agreeing to the unpleasant task of proof-reading this
thesis. I am also deeply grateful to Pascal for his infinite patience and
understanding.
Finally I would like to thank past and present members of the Molecular
Genetics lab for their invaluable help, guidance, advice and friendship over the
years.
3

Contents
Abstract................................................................... 1Acknowledgements................................................3List of Figures.......................................................12List of Tables........................................................15
List of Abbreviations............................................16Gene symbols....................... ............................................................. 19
1. Introduction........................... 201.1. Overview....................................................................................... 20
1.1.2. Hearing loss........................................................................................... 21
1.1.2.1. Non-syndromic deafness............................................................... 21
1.1.2.2. Syndromic deafness.......................................................................23
1.2. Structure and Function of the E a r.......................................... 241.2.1. The auditory pathway............................................................................ 24
1.2.2. Cell-cell adhesion in the inner e a r....................................................... 27
1.2.2.1. Cadherin-basedjunctions.............................................................. 28
1.2.2.2. Tight junctions.................................................................................. 28
1.2.3. Structure of the hair cell stereocilia...................................................... 29
1.2.4. Mouse models for studying the inner ear............................................ 32
1.2.4.1. Generation of mouse mutants........................................................33
1.2.4.2. Study of mutant mice inner ears ................................................... 34
1.3. Structure and Function of the Eye.......................................... 35
1.3.1. The retina................................................................................................ 36
1.3.2. Retinitis pigmentosa...............................................................................38
1.4. Usher Syndrome.........................................................................411.4.1. Prevalence and classification..............................................................41
1.4.1.1. Prevalence........................................................................................41
1.4.1.2. Classification.................................................................................... 42
4

1.4.2. Genes involved in Usher syndrome.....................................................44
1.4.2.1. Usher genes identified previously.................................................44
1.4.2.1.1. MY07A........................................... 451.4.2.1.2. Shaker-1, the Usher type 1B mouse model..................................471.4.2.1.3. USH2A.........................................................................................48
1.4.3. Usher syndrome type 1C...................................................................... 48
1.4.3.1. Cloning USH1C......................................................... 50
1.4.3.2. Expression o fU S H IC .....................................................................51
1.4.3.3. Mutations in USH1C.......................................................................53
1.4.3.4. USH1C codes for the protein harmonin.......................................54
1.5. Allelism......................................................................................... 551.5.1. Alternative splicing..................................................................................56
1.6. PDZ Domains............................................................................... 581.6.1. Structure and function........................................................................... 59
1.6.1.1. Structure of PDZ domains..............................................................59
1.6.1.2. Function of PDZ domain-containing proteins.............................. 60
1.6.2. Ligand specificity....................................................................................60
1.6.3. Classification of PDZ domains..............................................................62
1.7. Gene Characterisation and Elucidation of Function 621.7.1. Mutation detection..................................................................................63
1.7.2. Assignment of pathogenicity................................................................. 64
1.7.2.1. Missense changes.......................................................................... 65
1.7.2.2. Polymorphisms................................................................................66
1.7.3. Protein function....................................................................................... 67
1.7.3.1. Subcellular localization.................................................................. 68
1.7.3.2. Protein-protein interactions............................................................68
1.8. Aims of Thesis............................................................................. 70
2. Materials and Methods ..........................722.1. Materials......................................................................................72
2.1.1. Software.................................................................................................. 74
2.1.2. Solutions.................................. 75
2.1.2.1. Qiagen DNA preparation buffers................................................... 77
2.1.2.2. Media................................................................................................ 77
5

2.1.3. Gels.......................................................................................................... 78
2.1.4. Oligonucleotide primers......................................................................... 79
2.1.5. Patient cohorts.........................................................................................79
2.1.5.1. Usher syndrome type 1 patients................................................... 80
2.1.5.2. Sib pairs with non-syndromic deafness........................................ 80
2.1.6. Control D NA............................................................................................ 81
2.1.7. Human foetal tissues..............................................................................81
2.1.8. Mice.......................................................................................................... 81
2.1.9. Plasmid vectors and constructs............................................................ 82
2.1.10. Competent E. coli cells........................................................................ 82
2.1.11. Human epithelial cell lines...................................................................83
2.1.12. Antibodies.............................................................................................. 83
2.2. Methods....................................................................................... 842.2.1. Polymerase chain reaction (PC R )........................................................84
2.2.1.1. Touchdown PCR ..............................................................................84
2.2.1.2. Amplification of large DNA fragments...........................................84
2.2.1.3. Allele-specific P C R ....................................................................... 85
2.2.1.4. Nested PCR ......................................................................................86
2.2.2. RT-PCR analysis.................................................................................... 87
2.2.2.1. Isolation of RNA from cell lines, urine and foetal tissues.......... 87
2.2.2.2. First-strand synthesis (RT-PCR)....................................................88
2.2.2.3. 5’ Rapid amplification ofcDNA ends (5 ' RACE)..........................89
2.2.3. Hetero-duplex analysis by denaturing high performance liquid
chromatography (DHPLC).................................................................................90
2.2.3.1. Preparation of DNA fragments for DHPLC analysis................... 91
2.2.3.2. Optimisation of DHPLC running conditions..................................91
2.2.4. Automated DNA sequencing.................................................................94
2.2.4.1. Purification of PCR products.......................................................... 94
2.2.4.2. Cycle sequencing.............................................................................94
2.2.4.3. Ethanol precipitation of sequenced products.............................. 95
2.2.4.4. Polyacrylamide gel electrophoresis of sequencing products.... 95
2.2.5. Genotyping.............................................................................................. 96
2.2.5.1. Microsatellite markers flanking major USH1 loci....................... 96
6

2.2.5.2. Polyacrylamide gel electrophoresis of PCR products for
genotyping....................................................................... ..... 96
2.2.6. Haplotype analysis.................................................................................96
2.2.6.1. Restriction endonuclease digest tests....................................... 97
2.2.7. Cloning.................................................................................................... 98
2.2.7.1. Preparation of blunt-ended linear plasmid vectors..................... 98
2.2.7.2. Phenol/chloroform/isoamyl alcohol extraction of D N A ...............99
2.2.7.3. Preparation of blunt-ended DNA inserts......................................99
2.2.7.4. Gel purification of DNA fragments...............................................100
2.2.7.5. Blunt-end ligation reactions..........................................................101
2.2.7.6. Transformation of competent E. coli...........................................101
2.2.7.7. Identification of clones containing insert....................................102
2.2.7.8. Preparation of plasmid DNA.........................................................102
2.2.8. Immunohistochemistry......................................................................... 104
2.2.8.1. Dissecting mice cochleae............................................................. 104
2.2.8.2. Fixing cochleae..............................................................................104
2.2.8.3. Embedding cochleae....................................................................104
2.2.8.4. Sectioning cochleae...................................................................... 105
2.2.8.5. TESPA coating microscope slides..............................................105
2.2.8.6. Staining cochleae sections........................................................... 106
2.2.8.7. Fluorescent microscopy................................................................106
2.2.9. Immunocytochemistry.......................................................................... 107
2.2.9.1. Tissue culture................................................................................. 107
2.2.9.1.1. Splitting cells............................................................................... 1072.2.9.1.2. Freezing cells............... 1082.2.9.1.3. Thawing cells.............................................................................. 108
2.2.9.2. Fluorescent staining of human epithelial cell lines................... 108
2.2.9.3. Confocal microscopy.....................................................................109
2.2.10. Protein analysis..................................................................................110
2.2.10.1. Protein extraction from human cell lines..................................110
2.2.10.2. Protein assay...............................................................................110
2.2.10.3. SDS-Polyacrylamide gel electrophoresis (SDS-PAGE) of
proteins...................................................................... 111
2.2.10.4. Coomassie staining SDS-PAGE gels....................................... 111
7

2.2.10.5. Western transfer (Immunoblotting)............................................112
2.2.10.6. Colourimetric protein detection................................................. 112
2.2.10.7. Treatment of protein with calf intestinal alkaline phosphatase
(C IP )..............................................................................................................113
2.2.11. GST pull-down assay........................................................................113
2.2.11.1. In vitro transcription/translation of cDNA..................................113
2.2.11.2. Transcend™ non-radioactive translation detection system.. 114
2.2.11.3. Expression of GST-fusion protein.............................................115
2.2.11.4. Protein extraction from E. coli................................................... 115
2.2.11.5. Preparation of glutathione Sepharose beads..........................116
2.2.11.6. Purification of GST-fusion protein.............................................116
2.2.11.7. Protein-protein interaction assay...............................................117
3. USH1C Mutation Screen.................................1193.1. Introduction................................................................................119
3.2. Methods in Brief........................................................................ 120
3.3. Results.........................................................................................1213.3.1. Type 1 Usher patients.......................................................................... 121
3.3.1.1. Haplotype analysis.........................................................................126
3.3.1.2. Allele-specific P C R ....................................................................... 128
3.3.1.3. Analysis of 238-239insC mutation...............................................130
3.3.1.4. Summary.........................................................................................135
3.3.2. Patients with non-syndromic deafness..............................................136
3.3.2.1. Summary.........................................................................................136
3.3.3. Polymorphisms..................................................................................... 137
3.4. Discussion..................................................................................1383.4.1. Usher type 1 patients............................................................................138
3.4.2. USH1C alleles.......................................................................................138
3.4.2.1. Missense coding changes............................................................ 138
3.4.2.2. 238-239insC frameshift mutation................................................143
3.4.3. Non-syndromic deafness patients..................................................... 145
4. Alternative USH1C Isoforms..........................1484.1. Introduction.............................................................................. 148
8
4.2. Methods in Brief........................................................................1514.2.1. RNA extraction..................................................................................... 151
4.2.2. 5’ RACE................................................................................................. 154
4.2.3. RT-PCR...................................................................... 155
4.3. Results........................................................................................ 1554.3.1. 5’ RACE analysis.................................................................................. 155
4.3.2. RT-PCR analysis.................................................................................. 156
4.3.2.1. USH1C RT-PCR .......................................................... 156
4.3.2.2. COCH RT-PCR ..............................................................................162
4.3.2.3. PDZ-37 isoform..............................................................................163
4.3.3. Summary of results...............................................................................166
4.3.3.1. 5 ’ RACE .......................................................................................... 166
4.3.3.2. RT-PCR analysis...........................................................................166
4.3.3.2.1. Alternative exons A-F and G/G’................................................. 1664.3.3.2.2. PDZ-37....................................................................................... 167
4.4. Discussion..................................................................................1674.4.1. 5’ RACE analysis.................................................................................. 167
4.4.2. Alternative USH1C isoforms in human foetal tissues..................... 169
4.4.2.1. Alternative exons 15 and A-F .......................................................169
4.4.2.1.1. Ear-specific b isoforms................................................................1704.4.2.1.2. Novel alternative transcripts........................................................171
4.4.3. PDZ-37 isoform.................................................................................... 172
5. Immunolocalization........................ 1745.1. Introduction................................................................................174
5.2. Methods in Brief........................................................................ 1755.2.1. Immunohistochemistry......................................................................... 175
5.2.2. Immunocytochemistry.......................................................................... 175
5.2.2.1. RT-PCR..........................................................................................176
5.2.2.2. Immunoblotting..............................................................................176
5.2.2.3. Fluorescent staining...................................................................... 177
5.3. Results.........................................................................................1775.3.1. Immunohistochemistry of mouse inner-ear sections........................177
5.3.2. Immunocytochemistry of human gut epithelial cell lines................. 182
9

5.3.2.1. Detection of USH1C mRNA .........................................................182
5.3.2.2. Detection of harmonin protein....................... 183
5.3.2.3. Immunocytochemistry...................................................................185
5.3.3. Summary of results............................................................................. 186
5.4. Discussion.................................................................................1875.4.1. Harmonin localization in mouse inner-ear sections.........................187
5.4.2. Human gut epithelial cells....................................................................190
5.4.2.1. Expression of USH 1C ...................................................................190
5.4.2.2. Intra-ceilular localization of harmonin......................................... 191
5.4.2.3. Possible role for harmonin in gut epithelial cells.......................192
6. Harmonin Interactions....................................1966.1. Introduction................................................................................196
6.2. Methods in Brief........................................................................ 1996.2.1. In wYro-translation of USH1C .............................................................. 199
6.2.2. GST-fusion proteins............................................................................. 200
6.3. Results.........................................................................................2016.3.1. In vitro transcription and translation of USH1C................................ 201
6.3.1.1. De-phosphorylation of harmonin............................................... 202
6.3.2. Candidate protein expression.............................................................203
6.3.3. In vitro binding assay........................................................................... 210
6.4. Discussion.................................................................................. 2126.4.1. In vitro-translated harmonin................................................................ 212
6.4.2. Expression of GST-fusion proteins.................................................... 213
6.4.3. Interaction of Usher type 1 proteins...................................................213
7. Discussion...................................................... 2207.1. Mutations in USH1C ................................................................. 221
7.1.1. Usher type 1C alleles.......................................................................... 222
7.1.2. DFNB18 patients.................................................................................. 223
7.2. Alternative Isoforms of Harmonin......................................... 2247.2.1. Harmonin b isoforms and the eye...................................................... 225
7.2.2. Novel USH1C mRNA transcripts....................................................... 226
7.2.3. Harmonin in the gut and kidney (PDZ-37)........................................227
10

7.2.4. Mouse models for USH1C and DFNB18........................................ 229
7.2.4.1. USH1C mouse model and PDZ-37 ...........................................230
7.3. Functions of Harmonin............................................................2307.3.1. Interactions between Usher type 1 proteins......................................230
7.3.2. Harmonin in the ear........................................................................... 231
7.3.3. Harmonin in the e y e ............................................................................ 232
7.3.4. Harmonin in the gut............................................................................. 233
7.3.5. Other possible roles for harmonin...................................................... 234
7.4. Future Directions......................................................................235
7.5. Concluding Remarks...............................................................237
APPENDIX A: Oligonucleotide Primers.......................................239
APPENDIX B: Plasmid Vectors..................................................... 247B.1. pZErO™-2................................................................................................247
B.2. pGEX-4T-1...............................................................................................248
APPENDIX C: Accession Numbers.............................................. 249
APPENDIX D: Websites.................................................................. 250D.1. Genome resources.................................................................................250
D.2. Proteomics resources............................................................................ 250
D.3. Hearing loss resources..........................................................................250
D.4. Retinitis pigmentosa resources.............................................................251
APPENDIX E: Search Harmonin Sequence Against PROSITE. 252
References..........................................................255Publications........................................................272
11

IT
List of Figures
Figure 1.1. Diagram showing the outer, middle and inner ear........................ 26
Figure 1.2. Diagram of a cross-section through the cochlear duct................ 26
Figure 1.3. Three types of intercellular junctions between adjacent epithelial
cells..................................................................................................... 27
Figure 1.4. Stereocilia and their links..................................................................30
Figure 1.5. Schematic representation of the different cell types within the
neural retina....................................................................................... 37
Figure 1.6. Light micrographs comparing a retina with retinitis pigmentosa
with a normal retina...........................................................................38
Figure 1.7. Schematic illustrating the domains of myosin VIIA.......................46
Figure 1.8. Scanning electron micrographs of the surface of the organ of
Corti of shaker-1 homozygotes and littermate controls................47
Figure 1.9. The genomic structure of USH1C and ABCC8............................. 51
Figure 1.10. Alternative isoforms of USH1C identified to date.......................... 52
Figure 1.11. Schematic representation of the protein domains of harmonin
isoforms a and b................................................................................ 54
Figure 1.12. Patterns of alternative splicing.........................................................56
Figure 1.13. Diagram illustrasting the structure of a typical PDZ domain.... 60
Figure 3.1. DHPLC and sequencing data for U S H IC exon 3 changes.123
Figure 3.2. DHPLC and sequencing data for USH1C exon 5 changes.124
Figure 3.3. DHPLC and sequencing data for USH1C exon 18 changes.125
Figure 3.4. Data from genotyping sibs SM and YM for markers flanking the
major Usher type 1 loci....................................................................127
Figure 3.5. Schematic outlining the procedure used to determine the
inheritance pattern of two missense changes..............................128
Figure 3.6. Products amplified from nested, allele-specific PCRs................129
Figure 3.7. Alignment of PDZ domains............................................................ 140
Figure 4.1. Alternative isoforms of USH1C identified to date........................ 149
Figure 4.2. Schematic outlining the 5’ RACE procedure used..................... 154
Figure 4.3. 5’ RACE using cDNA from 8 week human foetal ear tissue 156
12

Figure 4.4. Amplification of exon 13 to exon 17 region of USH1C............... 158
Figure 4.5. Detailed view of some products from amplification of the exon 13
to exon 17 region of USH1C.......................................................... 158
Figure 4.6. USH1C gene-specific PCR using a forward primer in exon B with
a reverse primer in exon 17............................................................160
Figure 4.7. USH1C gene-specific PCR using a forward primer in exon F with
a reverse primer in exon 21........................................................... 161
Figure 4.8. USH1C gene-specific PCR using a forward primer in exon F with
a reverse primer in exon G............................................................. 161
Figure 4.9. COCH gene-specific PCR..............................................................163
Figure 4.10. PCR assay for the putative USH1C isoform, PDZ-37................ 164
Figure 4.11. PCR assay PDZ-37 in normal urine sample................................ 165
Figure 5.1. Phase contrast image of a P14 mouse cochlea section 179
Figure 5.2. Immunofluorescent images of frozen P14 CD1 mouse cochlea
sections..............................................................................................181
Figure 5.3. Amplification of USH1C from cDNA from HT29 and Caco-2
human gut epithelial cell lines....................................................... 182
Figure 5.4. Immunoblot of HT29 and Caco-2 protein extracts developed with
mouse monoclonal anti-harmonin antibody................................. 184
Figure 5.5. Immunblots of in w'fro-translated harmonin, HT29 and Caco-2
protein extracts developed with rabbit polyclonal anti-harmonin
antisera..............................................................................................185
Figure 5.6. Immunolocalization of harmonin in Caco-2, human gut epithelial
cells................................................................................................... 186
Figure 6.1. Schematic of a classical cadherin molecule and how it may link to
the actin cytoskeleton via catenins............................................... 198
Figure 6.2. Detection of in wfro-translated harmonin..................................... 202
Figure 6.3. Treatment of in vitro- translated harmonin with CIP...................203
Figure 6.4. Schematic illustration of protocadherin 15 domain structure... .203
Figure 6.5. SDS-PAGE gel of GST-MCC2 protein expression over 5 h 205
Figure 6.6. SDS-PAGE gel of GST-PCDH15 protein expression over 5 h..205
Figure 6.7. SDS-PAGE gel of GST protein expression over 4 h.................. 206
Figure 6.8. SDS-PAGE gel of GST-MCC2 protein expression at different
temperatures.................................................................................... 207
13

Figure 6.9. SDS-PAGE gel of GST-PCDH15 protein expression at different
temperatures.................................................................................... 207
Figure 6.10. SDS-PAGE gel of GST-MCC2 and GST-PCDH15 protein
expression at different IPTG concentrations............................... 208
Figure 6.11. Purification of GST-fusion proteins................................................210
Figure 6.12. GST pull-down assay of harmonin a1 isoform with the C-terminus
of protocadherin 15..........................................................................212
Figure 6.13. Schematic representation of the predicted interactions of three
Usher type 1 proteins in the inner ear..........................................215
Figure 7.1. Schematic of USH1C indicating the locations of mutations found
in Usher type 1C families to date..................................................221
14

List of Tables
Table 1.1. Genes identified for common forms of syndromic hearing
impairment......................................................................................... 24
Table 1.2. Summary of genes commonly mutated in non-syndromic retinitis
pigmentosa......................................................................................... 40
Table 1.3. The Usher syndrome loci and genes identified to date................. 44
Table 1.4. Genes allelic for syndromic and non-syndromic deafness 55
Table 2.1. Conditions used for performing DHPLC analysis on USH1C
exons...................................................................................................93
Table 2.2. Restriction digests used for genotyping USH1C intragenic
SNPs.................................... 97
Table 2.3. Summary of cloning approaches used............................................. 98
Table 3.1. Ethnic origins of Usher type 1C patients........................................119
Table 3.2. Summary of haplotype analysis of patients homozygous for 238-
239insC mutation.............................................................................131
Table 3.3. A 7 kb sub-section of the USH1C haplotype surrounding the 238-
239insC mutation found in 44 Greek Cypriot control DNA
samples............................................................................................ 133
Table 3.4. A 7 kb sub-section of the USH1C haplotype surrounding the 238-
239insC mutation found in 53 Pakistani control DNA
samples....................................................................................;.......134
Table 3.5. Frequencies of SNP alleles associated with 238-239insC
mutation in two control populations...............................................135
Table 3.6. Polymorphisms identified in the USH1C gene..............................137
Table 4.1. Human foetal tissue samples.......................................................... 153
Table 4.2. Oligonucleotides used to analyse USH1C expression in human
foetal tissues with expected product sizes...................................157
15

List of Abbreviations
AEBSF 4-(2-Aminoethyl)benzenesulphonyl fluoride (serine proteaseinhibitor)
AIE Autoimmune enteropathyAP Alkaline phosphataseAPS Ammonium persulphateASO Allele-specific oligonucleotideBAC Bacterial artificial chromosomebp Base pairBCIP/NBT 5-bromo-4-chloro-3-indolyl phosphate/p-nitroblue tetrazolium
chloride (alkaline phosphatase chromogen)BLAST Basic local alignment search toolBSA Bovine serum albumin
°C Degrees centigradecDNA complementary deoxyribonucleic acidCIP Calf intestinal alkaline phosphatasecM CentiMorgandATP 2’-Deoxyadenosine 5’-triphosphatedB DecibeldCTP 2’-Deoxycytidine 5’-triphosphateDEPC DiethylpyrocarbonateDFN Deafness locusDFNA Non-syndromic autosomal dominant deafness locusDFNB Non-syndromic autosomal recessive deafness locusDGGE denaturing gradient gel electrophoresisdGTP 2’-Deoxyguanosine 5’-triphosphatedH20 De-ionised waterDHPLC Denaturing high performance liquid chromatographyDMSO Dimethyl sulfoxideDMEM Dulbecco’s minimum essential mediumDNA Deoxyribonucleic aciddNTP 2’-Deoxynucleotide 5’-triphosphateds Double-stranded (DNA)DTT Dithiothreitol
16

dTTP 2’-Deoxythymidine 5’-triphosphateEDTA Ethylenediamine tetra-acetic acidEGF Epidermal growth factorENU N-ethyl-N-nitrosourea
ESE Exon splicing enhancerFAM 6-carboxyfluoresceinFCS Foetal calf serumFISH Fluorescence in situ hybridizationFITC Fluorescein isothiocyanateg Grammeg Gravitational forceGlcNAc N-acetylglucosamineGFP Green fluorescent proteinGST Glutathione S-transferaseh Hour(s)HCI Hydrochloric acidHEX 4,712’)4’15’,7,-hexachloro-6-carboxyrhodamineHHH Heriditary Hearing loss HomepageIPTG Isopropyl-thiogalactosidasekb KilobaseKCI Potassium chlorideKDa KiloDaltonI LitreLB Luria-Bertani mediumM Molarmg Milligram
MgCI2 Magnesium chlorideMilliQ Double de-ionised watermin. Minute(s)ml MillilitremM Millimolar
mmol Millimole
mol MoleMBP Maltose binding protein
mRNA Messenger ribonucleic acidN Newton
NaCI Sodium chloride

NaOH Sodium hydroxideng NanogramNH4CI Ammoniium chlorideOD Optical densityOMIM Online mendelian inheritance in manORF Open reading framePAGE Polyacrylamide gel electrophoresisPBS Phosphate buffered salinePBS-T Phosphate buffered saline + 0.1 % Tween 20PCR Polymerase chain reactionPDZ Protein-protein interaction domainpmol PicomolePEST Protein degradtion motifRACE Rapid amplification of cDNA endsRIPA Radioimmunoprecipitation BufferRNA Ribonucleic acidRNase RibonucleaseRP Retinitis pigmentosarpm Revolutions per minuteRT Reverse transcriptases Second(s)SAP Shrimp alkaline PhosphataseSDS Sodium dodecyl sulphateSH3 Src homology domainSNP Single nucleotide polymorphismSSCP Single-stranded conformation polymorphismTBE Tris-borate-EDTA bufferTE Tris-EDTA bufferTEAA Triethylammonium
TEMED (N.N.N’.N’HetremethylethylenediamineTET Tetrachlorofluorescein
TESPA 3-aminopropyltriethoxysilaneTGS Tris-glycine-SDS bufferTm Melting temperature
Tween 20 PolyoxyethylenesorbitanmonolaurateUTR Untranslated regionUV Ultraviolet
ng Microgram
iii Microlitre
jiM Micromolar
V VoltsVNTR Variable number of tandem repeats
Gene symbols
ABCC8 ATP-binding cassette, sub-family C, member 8CDH23 Cadherin 23COCH CochlinHPRT Hypoxantine phosphoribosyltransferaseGJB2 Connexin 26MCC2 Mutated in colon cancer 2MY07A Myosin VIIAPCDH15 Protocadherin 15SANS Sans

1. Introduction
1.1. Overview
Hearing loss is the most common sensory defect in humans. Approximately 1
in 1000 individuals is affected by severe or profound deafness at birth and a
further 1 in 1000 children is affected by less severe, progressive, hearing loss
that leads to deafness before adulthood. The prevalence of hearing impairment
further increases with age, with nearly half of the population experiencing a
hearing loss of greater than 26 dB by the age of 80 (reviewed by Morton,
1991). Although there are a number of environmental causes of hearing
impairment, including ototoxic drugs and infections, approximately 50% of
childhood deafness can be attributed to genetic causes. Of those with a genetic
form of hearing loss, around 30% have a syndromic form of hearing loss that
presents in addition to other clinical features. Over 400 syndromes, where
deafness is found associated with a wide array of other pathologies, have been
described (OMIM), a number of these syndromes also include eye defects.
Usher syndrome is the most common cause of deaf-blindness, accounting for
more than 50% of individuals who are both deaf and blind (Boughman, et al.,
1983).
Profound, congenital deafness has a dramatic effect on the acquisition of
communication skills and on the mode of education. Profoundly deaf children,
who do not have cochlear implants, will often use sign language to
communicate, a language which relies on vision. In the case of Usher
20

syndrome, individuals also lose their vision, a sense upon which their
communication is based. Hence, the early diagnosis of Usher syndrome is
vitally important so that a child does not become more socially isolated.
Diagnosis of Usher syndrome will be greatly aided by the identification of the
genes responsible.
1.1.2. Hearing loss
Hearing loss can be clinically classified in many different ways: according to the
type (sensorineural, conductive or mixed), progression, frequency (low to high),
severity (mild to profound), onset (congenital, early or late), vestibular
involvement and whether the cause is genetic or non-genetic. As mentioned
above, approximately 50% of the 1 in 1000 children that is affected by severe
(70 to 89 dB) or profound (>90 dB) deafness at birth are considered to be due
to genetic factors (Morton, 1991). The majority of the genetic causes 70% are
considered to be non-syndromic, that is, the deafness occurs in isolation and is
not associated with any other phenotype.
1.1.2.1. Non-syndromic deafness
The non-syndromic forms of prelingual deafness are almost exclusively
sensorineural. Sensorineural hearing loss occurs when the transmission of the
sound signal from the inner ear to the cortical auditory centres in the brain is
affected; this is normally due to inner ear defects. Non-syndromic deafness is
extremely genetically heterogeneous and is classified according to the mode of
inheritance. Several studies have shown that 70-75% of non-syndromic hearing
impairment is inherited recessively, 20-25% are autosomal dominant and the
remainder are X-linked or mitochondrial (Table 4 in Morton, 1991). There are
21
currently ninety loci reported on the Hereditary Hearing Loss homepage
(http://dnalab-www.uia.ac.be/ dnalab/hhh/L of which forty-eight are autosomal
dominant (DFNA), thirty-seven are autosomal recessive (DFNB) and five are X-
linked loci (DFN). In addition, mutations in two mitochondrial genes (12S rRNA
and tRNASer(UCN)) are also responsible for non-syndromic deafness.
This genetic heterogeneity, combined with the absence of a clinically distinct
phenotype for the different gene defects and the tendency of deaf people to
marry each other, at one time made the mapping of these forms of deafness
and the identification of the causative genes very difficult. These problems were
initially overcome largely by studying geographically isolated deaf families. The
first locus for an autosomal recessive form of deafness, DFNB1, was identified
by homozygosity mapping in a Tunisian family (Guilford, et al.t 1994). The gene
responsible for DFNB1, GJB2 (connexin 26), a gap junction protein involved in
recycling potassium ions back into the endolymph, now appears to account for
50% or more of the recessive deafness in some populations. Furthermore,
different populations appear to have common founder mutations and high
heterozygote carrier rates. For example, 35delG accounts for a high proportion
of the connexin 26 mutations in Caucasian populations and a recent pan-
European study detected a carrier frequency for 35delG of between 1 in 35 and
1 in 79 (Gasparini, et al., 2000).
Over the last ten years a variety of genes underlying non-syndromic forms of
deafness have been identified. A wide range of protein types, including
unconventional myosins, ion transporters and channels, gap junction proteins,
22

transcription factors and extracellular matrix components, have been shown to
cause hearing impairment when mutated.
1.1.2.2. Syndromic deafness
In contrast to non-syndromic deafness, syndromic deafness may be conductive
(i.e. due to middle and/or external ear defects), sensorineural, or a mixture of
the two. Syndromic deafness tends to be less genetically heterogeneous within
a phenotype and it is easier to group families with similar phenotypes for
linkage analysis. Hence, the genes mutated in many of the more common
forms of syndromic deafness were identified before those for non-syndromic
deafness (reviewed by Petit, et al.t 2001; Resendes, et al., 2001; Hereditary
Hearing Loss homepage) (Table 1.1).
Usher syndrome is the association of sensorineural deafness with the
progressive loss of vision in the form of retinitis pigmentosa and is the subject
of this thesis.
23

Table 1.1. Genes identified for common forms of syndromic hearing
impairment (as detailed on HHH).
Disorder Locus Location Gene
AlportXq22
2q36-q37
COL4A5
COL4A3/COL4A4
BOR 8q13.3 EYA1
Jervell + Lange- JLNS1 11p15.5 KCNQ1
Nielsen JLNS2 21q22.1-q22.2 KCNE1 (IsK)
Norrie ND Xp11.3 NDP
Pendred PDS 7q21-34 SLC26A4
STL1 12q13.11-q13.2 COL2A1
Stickler STL2 1p21 COL11A1
STL3 6p21.3 COL11A2
Treacher Collins TCOF1 5q32-q33.1 TCOF1
Usher*USH1B 11 q 13.5 MY07A
USH2A 1q41 USH2A
WS type I 2q35 PAX3
WS type II 3p14.1-p12.3
8q11
MITF
SLUG
Waardenburg WS type III 2q35 PAX3
WS type IV 13q22
20q13.2-q13.3
22q13
EDNRB
EDN3
SOX10
* at the start of this work only two Usher genes had been identified.
1.2. Structure and Function of the Ear
1.2.1. The auditory pathway
The mammalian ear is made up of three parts: the outer, middle and inner ear
(Fig. 1.1). The auricle of the outer ear is designed to gather high frequency
vibrations (sound waves) travelling through the air and conduct them inwards,
through the external auditory canal, to the tympanic membrane, or eardrum,
24

which separates the outer and middle ears. The middle ear consists of a chain
of three tiny bones: malleus, incus and stapes, which pick up the vibrations of
the tympanic membrane, amplify them and transmit them to the oval window of
the inner ear (Fig. 1.1). The inner ear is a bony cavity containing the snail
shaped cochlear duct, which processes auditory signals, and the vestibular
apparatus, responsible for balance. Both the cochlea and the vestibular
apparatus are endolymph-filled membraneous structures bathed in the
perilymph of the temporal bone.
The organ of Corti is the sensory epithelium of the cochlear duct and contains
the hair cells. The function of the hair cells is to convert sound waves
transmitted to the endolymph into electrical impulses, which are then carried by
nerve fibres to the auditory cortex of the brain. Hair cells are so called because
of the presence of distinct bundles of actin-filled stiff microvilli, called
stereocilia, on their apical surface. A gelatinous membrane, known as the
tectorial membrane, covers the organ of Corti and makes contact with the
stereocilia (Fig. 1.2). Sound waves entering the cochlear duct cause
displacement of the tectorial membrane relative to the organ of Corti and in the
process deflect the stereocilia of the hair cells. Deflection of the stereocilia
causes mechanotransduction channels located at their tips to open. The
ensuing influx of potassium ions, from the potassium-rich endolymph, alters the
membrane potential of the hair cell. Depolarization of the hair cell leads to
activation of voltage-gated calcium channels, which leads to an influx of
calcium into the hair cell that, in turn, triggers the release of neurotransmitters
that activate the acoustic nerve. The hair cells are re-polarized when the
potassium ions leave through potassium channels and enter the supporting

cells. The potassium ions then diffuse to the stria vascularis (Fig. 1.2), through
gap junctions formed between the cells, and are recycled back into the
endolymph, resetting the mechanoelectrical transduction system, (reviewed by
Forge and Wright, 2002; Willems, 2000).
Figure 1.1. Diagram showing the
outer, middle and inner ear.
(Willems, 2000).
The auricle and the external acoustic
duct constitute the outer ear. The
malleus, incus, stapes and the
tympanic membrane form the middle
ear and the cochlea and vestibular apparatus are the inner ear. The
vestibular apparatus comprises the sacculus, utriculus and three semi
circular canals set at 90° to each other.
Striavascularis
Scala media / with endolymph ' / <*rr
Potassium
Inner hair cell
Spirallimbus
Supportingcells
Outer hair cellsCochlear Scala tympani
with perilymph
Figure 1.2. Diagram of a cross-section through the cochlear duct (Willems, 2000). The organ of Corti comprises the tectorial membrane and the sensory inner and outer hair cells, located on supporting cells on the basilar membrane. Reissner’s membrane
encloses the organ of Corti in the potassium rich endolymph, keeping it separate from
the perilymph of the cochlea duct. Black arrows indicate the flow of potassium into the
hair cells, in response to sound waves, and then recycling back into the endolymph.
StapesIncus Acoustic
nerveMalleus
Auricle
Externalacoustic
duct CochleaTympanicmembrane
Semicircularcanal
Vestibule
Utriculus Sacculus Cochlea
26

1.2.2. Cell-cell adhesion in the inner ear
A fundamental property of any epithelium is the ability to separate different
compartments within an organism and to regulate the exchange of substances
between them, such that fluids with different molecular compositions can be
maintained. This is particularly important in the inner ear, where the perilymph
and endolymph must be completely compartmentalized (Fig. 1.2.). Leakage of
solutes through the paracellular pathway, between adjacent cells, must be
prevented in order to maintain the electrochemical gradient in the inner ear,
which is required for the process of hearing.
In general, three types of junctions mediate adhesion between adjacent
epithelial cells: tight junctions, adherens junctions and desmosomes (Fig. 1.3).
These complexes each contain transmembrane proteins, which mediate
binding at the extracellular surface, and associated cytoplasmic proteins that
structurally link the transmembrane proteins to the cytoskeleton.
T ig h t Junction
Junction
Desmosome
Figure 1.3. Three types of intercellular junctions bet
ween adjacent epithelial cells
(Perez-Moreno, etal., 2003).
(A) A schematic illustrating the three major types of intercellular junctions in epithelial cells. In the most apical junction, tight junctions, transmembrane proteins link to the actin cytoskeleton. Adherens jun
ctions and desmosomes are both cadherin-based junctions, also linked to the actin cytoskeleton. (B) Electron micrograph showing the ultrastructure of all three junctions between two epithelial cells.
27

1 2.2.1. Cadherin-based junctions
The adherens junctions, located near the apical surface of polarized epithelial
cells, are thought to form the initial cell-cell contacts between adjacent cells and
act as a prerequisite for the formation of other junctions (reviewed by Perez-
Moreno, et at., 2003). Adhesion at adherens junctions, as well as at the
desmosomes, is mediated by a superfamily of adhesion molecules known as
cadherins. Cadherins are single transmembrane-spanning glycoproteins. The
extracellular N-terminal portion of a cadherin molecule consists of a varying
number of ectodomains (designated EC) that are highly homologous to each
other. These ectodomains confer specific calcium-dependent homophilic
binding between parallel dimers of cadherin molecules on adjacent cells
(reviewed by Patel, et a/., 2003). The adhesive binding activity of the cadherin
ectodomain is then strengthened by the interactions of the cytoplasmic
C-terminal domain, usually via other ‘linker’ proteins, with the actin cytoskeleton
of the cell (reviewed by Ivanov, etal., 2001; Yap, etal., 1997).
1.2.2.2. Tight junctions
Tight junctions are the most apical of the cell-cell contacts and the only one of
the intercellular junctions that forms an actual barrier to the passage of ions
and molecules through the paracellular pathway between the cells. Tight
junctions also prevent the movement of lipids and proteins between the apical
and basolateral domains of the plasma membrane, thereby maintaining cell
polarity.
Integral proteins, such as the claudin family, constitute the backbone of tight
junction strands. Each claudin possesses four transmembrane domains and

cytoplasmic N- and C-termini. The two extracellular loops of each claudin show
enormous variability in both distribution and number of charged amino acid
residues. Thus, it is now generally accepted that the heterogeneous interaction
of different claudins between the tight junction strands of neighbouring cells is
responsible for the enormous variety in electrical resistance and paracellular
ionic selectivity displayed by various epithelia (reviewed by Tsukita, et a i ,
2001). Recently, expression of claudins 1-3, 8-10, 12, 14 and 18 in the cells
lining the scala media of the mouse cochlea (organ of Corti, stria vascularis,
Reissner’s membrane and spiral limbus) was demonstrated (Kitajiri, et al.,
2004). This indicates that the compartmentalization, required in the inner ear
for normal hearing, is regulated through tight junctions in a very complex
manner.
Besides the integral proteins that form the backbone of the tight junction
strands, there are also a number of cortical proteins associated with the tight
junctions. Several of these are PDZ domain-containing proteins that function as
scaffolds, bringing together cytoskeletal components and signalling proteins
with the integral proteins of the tight junctions (reviewed by Gonzalez-Mariscal,
etal., 2003).
1.2.3. Structure of the hair ceil stereocilia
The hair bundle that projects from the apical surface of the sensory hair cells in
the inner ear is formed from a cluster of stereocilia. Each stereocilium is a
highly specialized, plasma membrane-bound process that contains a parallel
bundle of actin filaments at its core (Tilney, et al., 1980). Rows of stereocilia on
the apical surface of outer hair cells are arranged in a V-shape and they
29

increase in height in one direction across the surface of the hair cell in a
‘staircase-like’ fashion (Fig. 1.4A).
The stereocilia are not true cilia, though, as they do not contain the ‘9+2’
structure of microtubules. However, each hair cell does possess one true
cilium, known as the kinocilium, which is present to one side of the stereocilia
bundle during development, but it recedes as the cochlea matures. The
function of the kinocilium is unknown, but it is thought that its position on the
apical surface of the hair cell defines the polarity of the asymmetric hair bundle.
Figure 1.4. Stereocilia and their links(A) Scanning electron microscopy showing the hair bundle of an outer hair cell (adapted from Petit, et al., 2001). (B) Diagrammatic representation of the various cross-links between adjacent stereocilia within a hair bundle (adapted from Forge and Wright, 2002).
Within the shaft of a stereocilium, adjacent actin filaments are extensively
cross-linked by fimbrin (Shepherd, et al., 1989) and espin (Zheng, etal., 2000).
Cross-linking has the effect of making the stereocilium much more rigid than
would be expected if the actin filaments were free to move with respect to one
top connectors
s h a ft co n n ecto rs
30
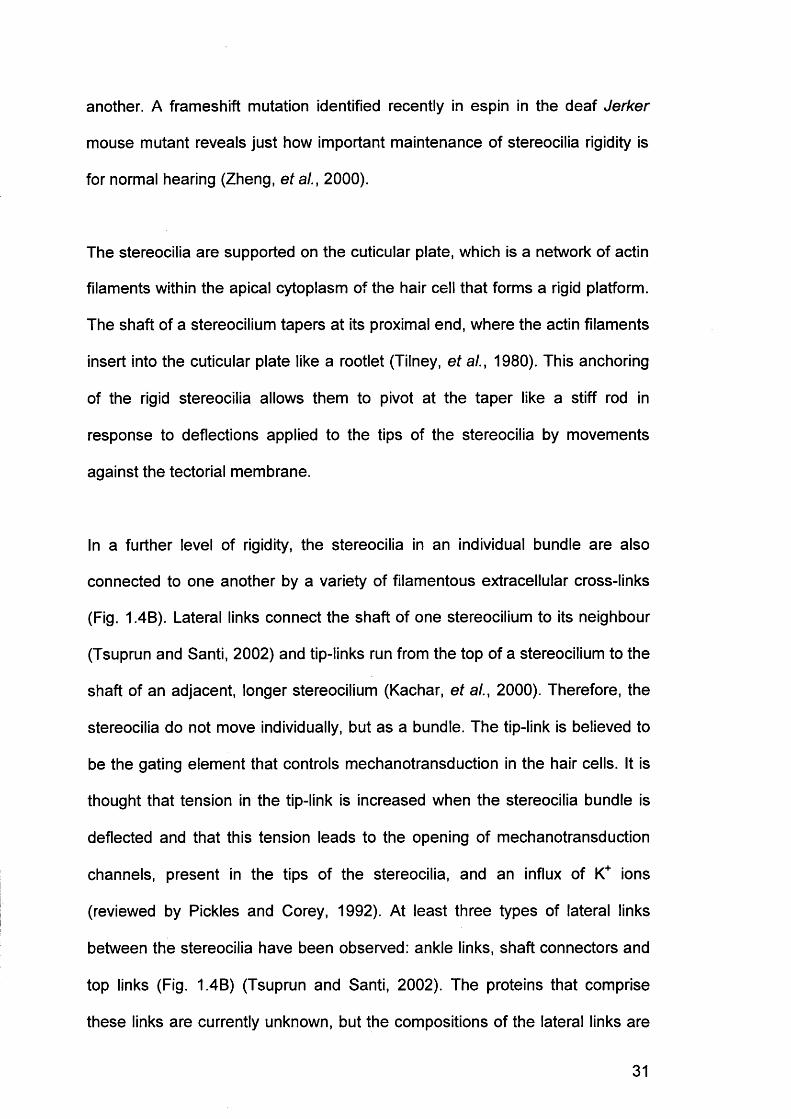
another. A frameshift mutation identified recently in espin in the deaf Jerker
mouse mutant reveals just how important maintenance of stereocilia rigidity is
for normal hearing (Zheng, et al., 2000).
The stereocilia are supported on the cuticular plate, which is a network of actin
filaments within the apical cytoplasm of the hair cell that forms a rigid platform.
The shaft of a stereocilium tapers at its proximal end, where the actin filaments
insert into the cuticular plate like a rootlet (Tilney, et al., 1980). This anchoring
of the rigid stereocilia allows them to pivot at the taper like a stiff rod in
response to deflections applied to the tips of the stereocilia by movements
against the tectorial membrane.
In a further level of rigidity, the stereocilia in an individual bundle are also
connected to one another by a variety of filamentous extracellular cross-links
(Fig. 1.4B). Lateral links connect the shaft of one stereocilium to its neighbour
(Tsuprun and Santi, 2002) and tip-links run from the top of a stereocilium to the
shaft of an adjacent, longer stereocilium (Kachar, et al., 2000). Therefore, the
stereocilia do not move individually, but as a bundle. The tip-link is believed to
be the gating element that controls mechanotransduction in the hair cells. It is
thought that tension in the tip-link is increased when the stereocilia bundle is
deflected and that this tension leads to the opening of mechanotransduction
channels, present in the tips of the stereocilia, and an influx of K+ ions
(reviewed by Pickles and Corey, 1992). At least three types of lateral links
between the stereocilia have been observed: ankle links, shaft connectors and
top links (Fig. 1.4B) (Tsuprun and Santi, 2002). The proteins that comprise
these links are currently unknown, but the compositions of the lateral links are
distinct from each other as well as from the tip-links (Tsuprun and Santi, 2002).
A number of unconventional myosin motor proteins also localize to the cuticular
plate and the stereocilia, and are believed to have a role in maintaining the
structure and function of the hair bundle (Hasson, et al., 1997).
1.2.4. Mouse models for studying the inner ear
As illustrated in the preceeding section, animal models are becoming
increasingly valuable tools for the study of human diseases and disorders,
particularly in a disorder such as deafness, in which studies on the human ear
can only be performed post-mortem (reviewed by Avraham, 2003; Probst and
Camper, 1999). The mouse is an excellent model for studying hearing
impairment for several reasons; being a mammal the mouse cochlea is similar
to that of humans, mice have a relatively short gestation period of three weeks
and the availability of inbred strains facilitates comparisons of mutants on the
same genetic background. Furthermore, the mouse genome sequence was
completed recently (Waterston, et al., 2002) and approximately 99% of mouse
genes have a homologue in the human genome. There are also now excellent
web resources available that deal with mouse models for deafness
(Appendix D).
Mouse mutants for deafness are easily recognizable since they often have
associated vestibular defects that lead to a ‘head bobbing’ or ‘circling’
phenotype. In addition, the absence of a Preyer reflex (ear flick) in response to
an intense auditory stimulus, produced by a click-box, is a good indication that
a mouse has severe or profound hearing impairment.
32
1.2.4.1. Generation of mouse mutants
Mouse mutants for deafness can aid in the identification of new deafness
genes in phenotype-driven screens, but they also have an important role to
play in the cloning of genes at known human deafness loci and in functional
studies. There are three main types of mouse mutants: spontaneous, radiation
or chemically induced, and engineered.
The shaker-1 mouse mutant is an example of a mutation that arose
spontaneously in 1929, but it wasn’t until 1995 that the gene responsible,
Myo7a, was identified via positional cloning (Gibson, etal., 1995). The shaker-2
mouse arose around the same time as the shaker-1, however, this mutant
arose in the progeny of an X-ray irradiated mouse. The gene mutated in
shaker-2 mice, Myo15a, was identified when a large BAC (bacterial artificial
chromosome) transgene was used to rescue the shaker-2 circling and deaf
phenotype (Probst, et al., 1998). Mouse spermatogenic cells are also
particularly susceptible to mutagenesis by chemicals such as N-ethyl-N-
nitrosourea (ENU) and recent large ENU-mutagenesis screens have increased
the number of mouse models for many human diseases, including deafness
mutants (Hardisty, etal., 1999; Justice, etal., 1999; Nolan, etal., 2000).
Finally, mouse mutants may be engineered by performing gene-targeted
mutagenesis or deletion of a gene in embryonic stem cells, which are then
selected for and injected into blastocysts that are implanted into mice. A
number of mouse mutants with inner ear defects have been produced in this
way (reviewed by Anagnostopoulos, 2002).
33
Sometimes simple knockout experiments are not very helpful. If the knockout
gene is vital to early development, the transgenic mouse will be embryonic
lethal. In this situation a conditional knockout mouse may be designed in which
expression of the target gene is inactivated in only selected, predetermined
cells of the animal. This approach was used to study the role of connexin 26 in
the inner ear (Cohen-Salmon, et al., 2002), since the connexin 26 knockout
mouse is embryonic lethal due to placental failure.
1.2.4.2. Study of mutant mice inner ears
Once a particular gene for deafness has been cloned in the mouse, there are a
number of ways in which it can be studied in order to gain more information
about its function. Inner ear material can be obtained from mice at all stages of
development, from embryo through to adult, which is difficult to achieve with
human tissue. Gene expression may be detected by extracting RNA from inner
ear tissue and performing reverse-transcription PCR (RT-PCR). Real-time PCR
allows a quantitative evaluation of mRNA levels in specific tissues at specific
time points in development. For example, an increase in expression levels of
the transmembrane cochlear-expressed gene 1 (Kurima, et al., 2002) in the
ears of postnatal mice, shown by real-time quantitative RT-PCR, was found to
correlate with the degeneration of inner and outer hair cells of the deafness
mouse mutant, Tmc1dn/dn (Kurima, et al., 2002). Specific areas of gene
expression, at the RNA level, may be revealed by in situ hybridization, where a
labelled DNA probe is hybridized to a whole embryo, cochlea or tissue section.
However, it is important to study expression at the protein level as well as at
the RNA level, since RNA experiments may give limited information. For
34

example, if the protein is exported from the cell, studying the RNA will not give
a real impression about the expression of the protein and, hence, its function.
Protein expression/localization may be studied using immunofluorescence. An
antibody, specific to the protein of interest, is applied to a dissected cochlea or
tissue section and then may be detected using a secondary antibody with a
fluorescent label. Another tool available in the mouse is transgenesis, utilized to
study endogenous gene expression. A gene of interest may be substituted with
a reporter gene, such as green fluorescent protein (Riesen, et al., 2002) or the
p-galactosidase gene. This approach was used to detect subtle expression
patterns of M athl, a transcription factor required for the genesis of inner ear
hair cells (Bermingham, et al., 1999). Transgenesis is a much more sensitive
technique than RNA in situ-hybridization or protein detection by
immunofluorescence.
1.3. Structure and Function of the Eye
Like the ear, the tissues of the eye are also highly adapted to the processing of
sensory information. The human eye functions much like a camera; a single
lens focuses light images on a sheet of light receptors (equivalent to the film),
and the image is then “developed” by neuron processing in the visual cortex of
the brain. The cornea is the transparent portion of the sphere at the front of the
eye through which light enters. The light then passes through the pupil, the
dark central opening of the iris, to the lens, which focuses the rays on the rear
surface of the eye, a light-sensing epithelial layer known as the neural retina.
35
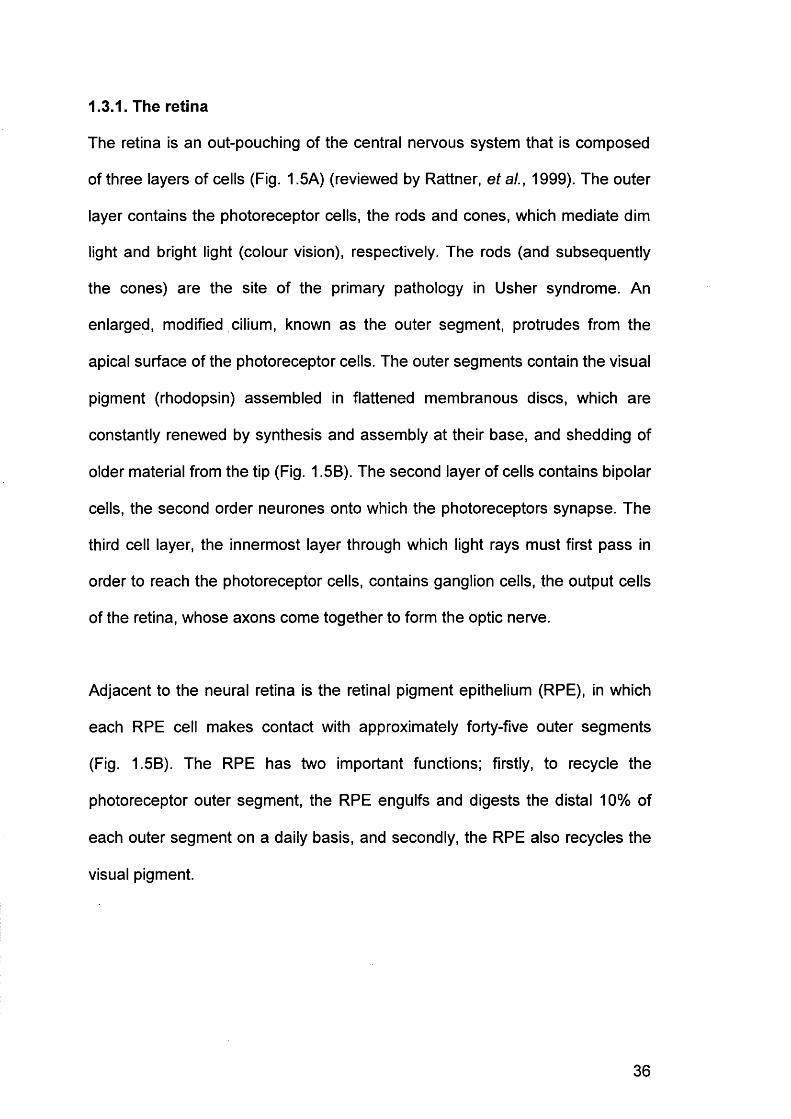
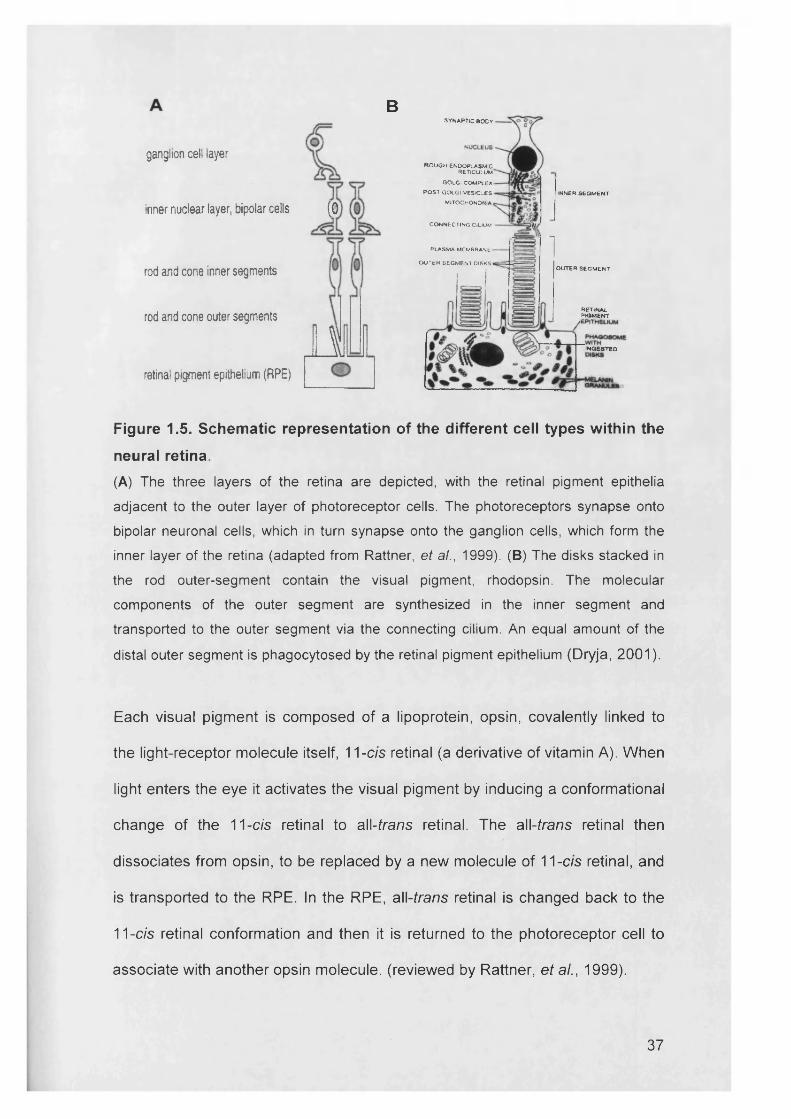
1.3.1. The retina
The retina is an out-pouching of the central nervous system that is composed
of three layers of cells (Fig. 1.5A) (reviewed by Rattner, et al., 1999). The outer
layer contains the photoreceptor cells, the rods and cones, which mediate dim
light and bright light (colour vision), respectively. The rods (and subsequently
the cones) are the site of the primary pathology in Usher syndrome. An
enlarged, modified cilium, known as the outer segment, protrudes from the
apical surface of the photoreceptor cells. The outer segments contain the visual
pigment (rhodopsin) assembled in flattened membranous discs, which are
constantly renewed by synthesis and assembly at their base, and shedding of
older material from the tip (Fig. 1.5B). The second layer of cells contains bipolar
cells, the second order neurones onto which the photoreceptors synapse. The
third cell layer, the innermost layer through which light rays must first pass in
order to reach the photoreceptor cells, contains ganglion cells, the output cells
of the retina, whose axons come together to form the optic nerve.
Adjacent to the neural retina is the retinal pigment epithelium (RPE), in which
each RPE cell makes contact with approximately forty-five outer segments
(Fig. 1.5B). The RPE has two important functions; firstly, to recycle the
photoreceptor outer segment, the RPE engulfs and digests the distal 10% of
each outer segment on a daily basis, and secondly, the RPE also recycles the
visual pigment.
36
B
ganglion cell layer
inner nuclear layer, bipolar cells (0
rod and cone inner segments
rod and cone outer segments
retinal pigment epithelium (RPE)
i
SYNAPTIC BODY
ROUGH ENDOPLASMIC RETICULUM
GOLGi COMPLEX
POST GCXGI VESICLES
MITOCHONDRIA
CONNECTING CiLIUM
INNER SEGM ENT
PLASMA MCMBRASL
OUTER SEGMENT DISKSOUTER SEGMENT
RETINALPIGMENT
INGESTED
Figure 1.5. Schematic representation of the different cell types within the
neural retina
(A) The three layers of the retina are depicted, with the retinal pigment epithelia adjacent to the outer layer of photoreceptor cells. The photoreceptors synapse onto bipolar neuronal cells, which in turn synapse onto the ganglion cells, which form the inner layer of the retina (adapted from Rattner, et al., 1999). (B) The disks stacked in the rod outer-segment contain the visual pigment, rhodopsin. The molecular components of the outer segment are synthesized in the inner segment and transported to the outer segment via the connecting cilium. An equal amount of the distal outer segment is phagocytosed by the retinal pigment epithelium (Dryja, 2001).
Each visual pigment is composed of a lipoprotein, opsin, covalently linked to
the light-receptor molecule itself, 11-c/s retinal (a derivative of vitamin A). When
light enters the eye it activates the visual pigment by inducing a conformational
change of the 11-c/s retinal to all-trans retinal. The all-trans retinal then
dissociates from opsin, to be replaced by a new molecule of 11-c/s retinal, and
is transported to the RPE. In the RPE, all-trans retinal is changed back to the
11 -cis retinal conformation and then it is returned to the photoreceptor cell to
associate with another opsin molecule, (reviewed by Rattner, et al., 1999).
37

1.3.2. Retinitis pigmentosa
Retinitis pigmentosa (RP) is a descriptive name applied to conditions in which
the retina degenerates. The rods are the predominantly affected photoreceptor
cell in RP and the disease manifests in the patient at a young age, as night
blindness. As the disease progresses the cone photoreceptor cells also
degenerate (Fig. 1.6) affecting day vision and central visual acuity. A blind-spot
develops in the mid-peripheral visual field, an area in normal retinas with a high
rod/cone ratio. This blind spot gradually enlarges, as more cone photoreceptors
die, and the visual field is reduced to an island of central vision (tunnel vision)
and scattered patches of far peripheral vision. Vision is usually lost altogether
during middle age.
and Mueller cells
Retinal p igm ent epithelium ]
NormalNerve fiber layer
(ganglion cel! axons)
Ganglion cell nuclei
Inner plexiforrn layer
Nuclei of bipolar, amacrine. horizontal
Outer plax.form layer
Photoreceptor nuclei
Photoreceptor outer segments
RetinitisPigmentosa
End-stageRetinitis
Pigmentosa
Choroid
Figure 1.6. Light micrographs comparing a retina with RP (centre) and a
retina with end-stage RP (right) with a normal retina (left) (Dryja, 2001). Light rays enter from the top of the Figure and must pass through all the nerve fibre layers (ganglion cells and bipolar cells) and the photoreceptor nuclear layer before reaching the photoreceptor outer segment to interact with rod or cone opsin and initiate vision. The centre panel shows histologic changes observed in eyes with early to moderately advanced RP. The photoreceptor outer segments are absent and the number of photoreceptor nuclei is reduced. In end-stage RP (right panel), there are no recognizable cell layers. The retina is reduced in thickness and cell number.
38

Retinitis pigmentosa is a hereditary disorder that, like deafness, is also very
genetically heterogeneous. To date, thirty genes have been cloned for isolated
retinitis pigmentosa as well as numerous other genes that can lead to RP as
part of a syndrome when mutated http://www.sph.uth.tmc.edu/retnet/.
(reviewed by Dryja, 2001).
The genes identified in patients with non-syndromic retinitis pigmentosa may be
classified into several functional groups (reviewed by Phelan and Bok, 2000).
The most commonly mutated genes in retinitis pigmentosa are those encoding
proteins of the visual cascade of the photoreceptor cell outer segment.
Mutations in the genes concerned with the series of biochemical steps involved
in the visual cycle, which both provides and recycles the chromophore of
rhodopsin, may also cause retinitis pigmentosa. Furthermore, genes encoding
the structural components of the photoreceptor cell, and certain photoreceptor
cell transcription factors, have also been found to cause non-syndromic retinitis
pigmentosa (Table 1.2).
39

Table 1.2. Summary of genes commonly mutated in non-syndromicretinitis pigmentosa.
Gene Function Reference
(0RHO Visual pigment, rhodopsin (Dryja, efa/., 1990)
3</>
casc
ade
PDE Phosphodiesterase (McLaughlin etal., 1993)>O(0c
CNGA1Cation channel in photoreceptor
membrane
(Dryja, etal., 1995)
<DoL_
Q_SAG
Binds rhodopsin and terminates
visual cycle
(Nakazawa, etal., 1998)
U) cRPE65
Isomerization of all-fra/7S-retinol to
11-c/s-retinol
(Morimura, etal., 1998)
c"o>»oo
(0CLo*3O
CralBPBinds 11-c/s-retinol and delivers
to dehydrogenase
(Maw, etal., 1997)
ABCRATP-binding cassette transporter (Martinez-Mir, etal.,
1998)
3+■»
COca>
RDS4 transmembrane domain protein
in rim of outer segment disks
(Farrar, etal., 1991)
O34-*< /)
4-*oa ROM1
4 transmembrane domain protein
in rim of outer segment disks
(Kajiwara, etal., 1994)
1-<D
CRX Transcription factor (Sohocki, etal., 1998)
£4~»o NRL Transcription factor (Bessant, etal., 1999)
The eye and the ear share certain features that may start to provide a
hypothesis as to how both can be affected by mutations in a single gene.
Firstly, both are ciliated: in photoreceptors, a connecting cilium connects the
inner segment to the outer segment (Fig. 1.5B); embryonic hair cells of the ear
have an apical cilium, the kinocilium. Secondly, both cell types possess
microvillus structures: the outer segments of photoreceptors contain
membraneous discs, where the phototransduction occurs; the stereocilia on the
apical surface of hair cells are microvillous projections. Finally, both the
40

photoreceptors and the sensory cells of the inner ear form specialized
synapses, known as ribbon synapses. Ribbon synapses are capable of
transmitting rapid and sustained action potentials, unlike conventional
synapses, which convey information as transient action potentials.
Therefore, the study of genes important for the functioning of both the eye and
the ear may lead to the identification of biological processes shared by both of
these organs. This, in turn, may lead to possible treatments for patients with
dual pathology.
1.4. Usher Syndrome
As mentioned previously, Usher syndrome, the association of sensorineural
deafness with retinitis pigmentosa, is the most common form of deaf blindness.
It is, however, both clinically and genetically heterogeneous, with different
genetic subtypes being more prevalent among certain ethnic groups.
1.4.1. Prevalence and classification
1.4.1.1. Prevalence
The prevalence of Usher syndrome has been estimated in several populations:
3.2/100,000 in Colombia (Tamayo, et al., 1991), 3.6/100,000 in Norway
(Grondahl, 1987), a conservative estimate of 4.4/100,000 in the United States
(Boughman, et al., 1983), 5/100,000 in the Danish population (Rosenberg, et
al., 1997) and 6.2/100,000 in the UK (Hope, et al., 1997). These figures may
not represent real differences between populations, but rather differences in
ascertainment.
41

Despite the fact that Usher syndrome is relatively rare, it is estimated to
account for more than 50% of the deaf-blind population (Boughman, et al.,
1983), approximately 3%-6% of all congential deafness cases (in a literature
survery by Vernon, 1969) and 5%-15% of patients with retinitis pigmentosa
(reviewed by Dryja, 2001).
1.4.1.2. Classification
Usher syndrome is an autosomal recessive disorder that is typically classified
into three clinical subtypes according to the degree of hearing loss and
vestibular function (Smith, et al., 1994). In Usher syndrome type 1, the most
severe form, an affected child is born profoundly deaf and with absent
vestibular function, which manifests itself in early childhood as a delay in motor
development. Usher syndrome type 2 is distinguished from Usher syndrome
type 1 by less severe hearing loss and the absence of any vestibular problems.
The hearing loss is moderate-to-severe, with patients often benefitting from
hearing aids, unlike Usher type 1 patients, who are seldom helped by hearing
aids. In type 3, the least severe form of Usher syndrome, the hearing loss is
post-lingual and progressive, with a varied age of onset, and there is a varying
degree of vestibular involvement.
Visual dysfunction is generally not used to classify Usher syndrome, since
there is considerable overlap between the subtypes in the age of onset of
retinitis pigmentosa. Perceived night blindness and the diagnosis of retinitis
pigmentosa tend to occur at an earlier age in Usher type 1 than in Usher type
2, although the difference between the two types is less dramatic than
42

previously thought. Furthermore, there is no significant difference in the
severity of retinitis pigmentosa and the associated ophthalmoscopic findings
between Usher types 1 and 2 (Tsilou, etal., 2002).
The most common form of Usher syndrome is type 2, accounting for 50% or
more of all Usher subjects in some populations (Hope, et al., 1997; Rosenberg,
et al., 1997). Usher syndrome type 3 was originally thought to be the most rare
form of Usher and was estimated to comprise 3% of all Usher syndrome cases
(Rosenberg, et al., 1997). However, a nationwide study in Finland suggested
that around 40% of Usher patients have Usher syndrome type 3 (Pakarinen, et
al., 1995) and this was confirmed by the finding of a founder mutation in the
Finnish population (Joensuu, etal., 2001).
It appears, though, that not all Usher patients are easily classified into one of
the three defined clinical subtypes, a mixed population, with atypical forms of
Usher phenotype, is also emerging. Patients with milder retinal phenotypes and
no obvious vestibular dysfunction have been reported with USH1D mutations
(Bolz, et al., 2001; Bork, et al., 2001) and patients with progressive hearing
loss, similar to that of Usher type 3, have been reported with USH1B mutations
(Liu, etal., 1998b) and USH2A mutations (Liu, etal., 1999). Furthermore, it has
also been suggested that Usher syndrome type 1 should be sub-divided into
those with profound hearing loss and absent vestibular function, and those with
profound hearing loss and normal vestibular function (Otterstedde, etal., 2001).
43

1.4.2. Genes involved in Usher syndrome
To date eleven loci for Usher syndrome have been mapped, seven for type 1
(1A-1G), three for type 2 (2A-2C) and one for type 3. Eight out of the eleven
genes have now been identified (Table 1.3 and Hereditary Hearing Loss
homepage).
Table 1.3. The Usher syndrome loci and genes identified to date.
LocusGenomic
locationGene Protein
USH1A 14q32 Unknown Unknown
USH1B 11 q13.5 MY07A Myosin VIIA
USH1C 11 p15.1 USH1C Harmonin
USH1D 10q CDH23 Cadherin 23
USH1E 21q Unknown Unknown
USH1F 10q21-22 PCDH15 Protocadherin 15
USH1G 17q24-25 SANS Sans
USH2A 1q41 USH2A Usherin
USH2B 3p23-24.2 Unknown Unknown
USH2C 5q14.3-q21.3 VLGR1 VLGR1
USH3 3q21-q25 USH3 Clarin-1
1.4.2.1. Usher genes identified previously
At the beginning of this study only two of the Usher syndrome genes had been
identified: MY07A, the gene responsible for Usher syndrome type 1B, and
USH2A, the gene encoding the protein defective in Usher syndrome type 2A,
Usherin.
44

1.4.2.1.1. MY07A
MY07A, encoding the motor protein myosin VIIA, was the first Usher syndrome
gene identified (Weil, et al., 1995). It accounts for approximately 50% of Usher
syndrome type 1 cases in a population of European extraction (Astuto, et al.,
2000).
Myosins are actin-based motor proteins that bind actin and hydrolyse
adenosine triphosphate (ATP) to produce force and movement. The highly
conserved N-terminal motor head domain possesses the actin- and ATP-
binding sites and is followed by an a-helical sequence and one or more IQ
(isoleucine-glutamine) motifs that may bind calmodulin. The unique C-terminal
tail may contain various putative protein-protein interacting domains that are
thought to confer specific properties on a class of myosin.
There are currently twelve classes in the myosin superfamily in humans, based
on the degree of sequence divergence of the motor domain and the tail domain
structure (reviewed by Berg, et al., 2001). The conventional myosins are those
in class II, familiar from studies of muscle contraction, whose tails contain an
extensive stretch of coiled-coil a-helix-forming sequences that allow the
molecules to dimerize and form a tail that can self-associate to form filaments.
All other classes of myosins are known as unconventional myosins and are not
known to have filament-forming abilities.
Myosin VIIA is one such unconventional myosin. It is a 254 kDa protein with the
typical motor head domain containing the ATP- and actin-binding motifs, a neck
45

region composed of five IQ motifs and a long tail that begins with a short coiled-
coil domain, followed by two large repeats each containing a MyTH4 (myosin
tail homology 4) domain of unknown function, and a domain homologous to the
membrane-binding domain of the proteins of the FERM (4.1, exrin, radixin,
moesin) superfamily, a family of proteins that mediate linkage of the
cytoskeleton to the plasma membrane. A poorly conserved SH3 domain, a type
of domain known to interact with proline-rich regions, separates the two repeats
(Chen, etal., 1996) (Fig. 1.7).
repeat I repeat I!coiled |------------ 1 |-------- ------------1
motor head
Figure 1.7. Schematic illustrating the domains of myosin VIIA (Kussel-
Andermann, et al., 2000).The conserved motor head domain is followed by five IQ calmodulin binding motifs, a short coiled-coil and two MyTH4 - FERM repeats separated by a poorly conserved SH3 domain.
Myosin VIIA is a common component of cilia and microvilli in mouse tissues
(Wolfrum, et al., 1998). In addition, myosin VIIA expression has also been
observed in the cochlear and vestibular neuroepithela of human embryos as
well as in the retinal pigment epithelium and photoreceptor cells (Weil, et al.,
1996).
46

1.4.2.1.2. Shaker-1, the Usher type 1B mouse model
As mentioned previously, Shaker-1, the mouse model for Usher type 1B, arose
spontaneously in 1929, but the gene responsible, Myo7a, was not identified
until 1995 (Gibson, et al., 1995). Shaker-1 homozygotes exhibit hyperactivity,
head-tossing and circling due to vestibular dysfunction, as well as deafness
caused by progressive disorganization of the stereocilia found on the hair cells
of the organ of Corti in the cochlea (Self, et al., 1998) (Fig. 1.8). Expression of
myosin Vila, the protein defective in Usher syndrome type 1B, has been
localized to the inner and outer hair cells of the mouse cochlea and vestibular
system and to the retinal pigment epithelial cell layer of the eye (El-Amraoui, et
al., 1996; Hasson, etal., 1995; Sahly, etal., 1997).
Figure 1.8. Scanning electron
micrographs of the surface of the
organ of Corti of shaker-1 homo
zygotes and littermate controls
(adapted from Self, et al., 1998)) Micrographs of littermate control (A) and shaker-1 homozygote (B) three days after birth. Higher magnification micrographs of littermate (C) control and shaker-1 homozygote (D) twenty days after birth. Mutants are showing widespread disorganization of the stereocilia bundles.
Of interest, the shaker-1 mouse mutant does not display any signs of retinal
degeneration. This was originally hypothesized to be due to the expression of
myosin Vila in both the pigment epithelium and the photoreceptor cells of
human eyes, compared with expression only in the pigment epithelium of
47

mouse eyes (El-Amraoui, et al., 1996). However, myosin Vila expression has
since been localized to the connecting cilium of the mouse photoreceptor cells
too (Liu, et al., 1997a). Therefore, the difference between the mouse and
human phenotypes could simply represent inherent differences between the
two species, or it could indicate that genetic background is an important
determinant in the extent of the pathology. Hence, although shaker-1 is a good
model for studying the function of the myosin Vila in the inner ear and why
mutations lead to deafness, it may not be a very good model for the retinal
pathology.
1.4.2.1.3. USH2A
The second Usher gene to be identified, USH2A, encodes a novel basement
membrane protein, usherin (Eudy, et al., 1998). Usherin is a 180 kDa protein
with an amino terminus domain with homology to the thromobospondin family
of extracellular matrix proteins, followed by an LN module and ten laminin-EGF-
like (LE) motifs and four fibronectin type III repeats at the C-terminus. The
globular LN domain is a common feature of laminins, which, along with the LE
motifs, are required for polymerization of laminins into the networks found in
basement membranes. Usherin localizes to all basement membranes in both
the eye and inner ear, as well as being widely expressed in the basement
membranes of the small intestine, colon and most of the reproductive organs
(Bhattacharya, etal., 2002).
1.4.3. Usher syndrome type 1C
Early epidemiological studies showed that the prevalence of Usher syndrome
was high in the French Acadian population of Louisiana. Acadians are
48

descendants of the French settlers of Nova Scotia in the early 17th century.
Upon being forced out by the British in 1755 they scattered around America
and Canada with a large number ending up in Louisiana. Presumably this was
a relatively small population with a few founder members and therefore a
certain degree of inbreeding. The Acadian subtype of Usher syndrome was
mapped in 1992 to 11 p15-p13 (Smith, et a/., 1992) and termed Usher type 1C.
Until identification of the gene in 2000 (Bitner-Glindzicz, et al., 2000; Verpy, et
ai, 2000), Usher type 1C was thought to be exclusive to the Acadians.
The gene underlying type 1C Usher syndrome was originally isolated, through
its protein product, in two groups of patients with gastro-intestinal pathology. In
a group of patients suffering from colon cancer, an antigen, designated
PDZ-73, was among forty-eight distinct antigens isolated in the patients’ sera,
which was used to screen cDNA expression libraries derived from the tumours
by a method known as SEREX (SERological Expression cloning) (Scanlan, et
al., 1999). Briefly, a cDNA library was constructed from RNA extracted from
colon cancer tumour samples and transferred to a nitrocellulose membrane.
The library was then screened using autologous sera, and positive clones were
detected using an alkaline phosphatase-conjugated goat anti-human IgG
antibody. In contrast, when sera from patients suffering from X-linked
autoimmune enteropathy (AIE) associated with tubulonephropathy was used to
screen a human duodenal cDNA expression library; the same protein was
identified and designated AIE-75 (Kobayashi, et al., 1999). Both of these
proteins, AIE-75 and PDZ-73, are encoded by the same gene, now termed
USH1C, whose protein product has been re-named harmonin.
49

1.4.3.1. Cloning USH1C
The role of this gene, encoding PDZ-73/AIE-75, in the pathogenesis of Usher
syndrome in humans came to light by two different approaches used to identify
the Usher type 1C gene. In one approach, USH1C was identified in a
subtracted mouse cDNA library derived from inner ear sensory areas (Verpy, et
al., 2000). cDNA generated from the five vestibular sensory patches was
subjected to three rounds of hybridization/subtraction against a mixture of
cDNA generated from mouse liver, dorsal root ganglia and the membraneous
and cartilaginous parts of the semicircular canals. cDNA specific to the inner
ear sensory areas would not hybridize to cDNA from the other tissues and
could then be identified by amplification. One of the ear-specific cDNA clones
mapped to the same region of chromosome 11 (11 p15) to which the genei
responsible for USH1C had been originally mapped (Smith, et al., 1992) and
was a good candidate, on the basis of the potential function of the protein.
In our group, a contiguous gene deletion found in patients suffering from severe
hyperinsulinism, profound congenital sensorineural deafness, enteropathy and
renal tubular dysfunction, which overlapped the USH1C locus, led to the
identification of the USH1C gene (Bitner-Glindzicz, et al., 2000). The deletion
identified in our family included all but the first two exons of USH1C and most
of the 5’ exons of the adjacent gene, ABCC8, a gene encoding a component of
ATP-sensitive K+ (KAtp) channels (Fig. 1.9), mutated in some patients with
hyperinsulinism (Thomas, etal., 1995).
50

USHfC (AIE- 75/PDZ-73) ABCC8 (SDR!)
Exon ^
t6kb
Figure 1.9. Genomic structure of USH1C and ABCC8 (Bitner-Glindzicz, et
al., 2000).Rectangles represent exons and the lines connecting them represent introns. As indicated, 16 kb separate the last exon of USH1C from the first exon of ABCC8. The unfilled exons are located within the 122 kb contiguous gene deletion.
1.4.3.2. Expression of US FI 1C
USH1C is located at 11 p15.1 and comprises twenty-eight exons, which span
approximately 51 kb of genomic DNA. Twenty of the exons are constitutive
(exons 1-14 and 16-21), whilst the remaining eight are alternatively spliced
(exons 15, A-F and G/G’) and account for the observation of various different
transcripts (Scanlan, et al., 1999; Verpy, et al., 2000) (Fig. 1.10).
51

a2
b1
1 ? 3 4 5 ( 7 8 9 11111 12 13 14n r-----1817 18 19 20 21
1 2 3 4 3 _ I ...7 8 _ 2 .l i l i 12. .13 14 L id id id 19 20 21
Isoforms with additional exons1 2 3 4 5 ( 7 8 9 1111 12 13 14 1tjl7 18 19 20 ____ 21
b2 I 1 I 2 1 3 I 4 I s Id 7 8 9 iq it 12 13 14 a | B I C
b3
PDZ-59
1817 18 19 20 21
I L L 4 S 8 9 llQ1t 12 113 I 14 I I
4 I 5 ]j 7 8 9 1(jl( 12 13 14 ■-] |i^ i7 18 19 20 21
Truncated IsoformsC1/PDZ-45
c2
c3
PDZ-54
PDZ-37
I I 2 | 3 1 4 1 5 7 8 9
1i l i . t 2. i i3 l 14 M l7 lie J 9J 20 _21_
1(11 12 13 14 M B C D________ l 1(17 11 19 20
1(11 12 13 14 1< 1718 19 20 21
1(11 12 13 14 17 18 19 20 21*
12 13 14 17 18 19 20 21
21
Figure 1.10. Alternative isoforms of USH1C identified to date.This figure is adapted from Verpy, et al., (2000) to include additional isoforms of USH1C identified by Scanlan, et al., (1999). Boxes represent exons, with the constitutive exons numbered in black and the alternatively spliced exons numbered in pink. Asterisks denote in-frame stop codons. Further explanation on the alternative isoforms is given in Chapter 4, Figure 4.1.
Although USH1C is fairly widely expressed in many tissues of the human body,
including the small intestine, colon, kidney, pancreas, testis, lung, liver, heart
and brain (Kobayashi, et al., 1999; Scanlan, et al., 1999), expression in the
mouse inner ear (Verpy, et al., 2000) and developing human eye (Bitner-
Glindzicz, et al., 2000) is restricted to the sensory areas. Initially, expression of
transcripts containing the alternative exons A-F and G/G’ (the harmonin b
isoforms) was detected in the mouse inner ear, but not in the eye (Verpy, et al.,
2000). Hence, it was hypothesized that mutations in the ‘ear-specific’ exons of
USH1C could cause deafness in the absence of retinal phenotype.
52

1.4.3.3. Mutations in USH1C
Upon identification of the USH1C gene, a 216G>A change was identified in the
cDNA extracted from cell lines from an Acadian family with Usher type 1C. This• t,
change does not change an amino acid, but was shown to create a new splice
site in exon 3 that lead to deletion of thirty-nine base pairs and a shortened
transcript postulated to be unstable (Bitner-Glindzicz, etal., 2000). However, an
expansion of a variable number of tandem repeats (VNTR) of a 45 bp
sequence in intron 5 to nine repeats (9VNTR), proposed to affect transcriptional
and/or post-transcriptional processes, was also found in the Acadian population
(Verpy, et al., 2000). This expansion has since been shown to be in complete
linkage disequilibrium with the 216G>A mutation (Savas, et al., 2002). It is
thought that the two events occurred at about the same time since neither
change has been found independent of the other. However, it has not yet been
confirmed that the 9VNTR allele contributes to the USH1C phenotype in the
Acadian patients.
Surprisingly, since it was thought that Usher type 1C was confined to the
Acadian population (Astuto, et al., 2000), further mutations have also been
identified in families from a variety of ethnic backgrounds. IVS5-2delA, a
mutation that affects the invariant A in the AG of the intron 5 acceptor splice
site, expected to lead to aberrant splicing, was found in two unrelated
Lebanese families (Verpy, et al., 2000). The insertion of a cytosine in a run of
six cytosines in exon 3, 238-239insC, predicted to cause a frame-shift in the
protein and a premature stop signal at codon 148 was identified in a Pakistani
family (Bitner-Glindzicz, et al., 2000; Verpy, et al., 2000) and four families of
European descent (Verpy, et al., 2000).
53

A number of single nucleotide polymorphisms (SNPs) have also been identified
in USH1C (Zwaenepoel, etal., 2001).
1.4.3.4. USH1C codes for the protein harmonin
The USH1C gene encodes a PDZ domain-containing protein (see section 1.6.),
known as harmonin (from the Greek harmonia, meaning “assembling”), of
which the main isoform has a molecular mass of approximately 73 kDa and
contains 3 PDZ domains and a coiled-coil domain. In the longer harmonin b
isoforms, the additional exons code for an extra coiled-coil domain and a
putative protein degradation motif (PEST) (Fig. 1.11). PDZ domains and coiled-
coils are both protein interaction motifs, whilst the PEST motif is a polypeptide
sequence enriched in proline (P), glutamic acid (E), serine (S) and
threonine (T) residues, which has been shown to target the protein containing it
for rapid degradation (Rogers, et al., 1986).
COOH
Figure 1.11. Schematic representation of the protein domains of harmonin
isoforms a and b.The shorter harmonin a isoform has three PDZ domains and one coiled-coil, while the longer harmonin b isoform has an extra coiled-coil and a PEST protein degradation motif, both indicated in pink.
54

1.5. Allelism
The study of both syndromic and non-syndromic deafness has given rise to a
number of examples of allelism, that is, different mutations in the same gene,
which give rise to both types of deafness (Table 1.4). In addition, mutations in
USH2A have been shown to cause non-syndromic retinitis pigmentosa (Rivolta,
et al., 2000), as well as Usher syndrome type 2A (Eudy, et al., 1998).
Table 1.4. Genes allelic for syndromic and non-syndromic deafness.
GeneSyndromic
Deafness
Non-syndromic
Deafness*
SLC26A4 (pendrin) Pendred
syndrome(Everette' a/' 1997)
DFNB4(F*rasad| a 1
GJB2 (connexin 26) Vohwinkel
syndrome(Maestriniefa/’ 1999)
DFNB1(KeIseI1,
DFNA3(Kelsel1, a 1 997
MY07A Usher type iB (we,lera/- iyaj5) DFNB2(LIU’ e a * ^ 7b)
DFNA11 Liu’et al" 1997c)
CDH23 Usher type 1D,BOIzera' uul) DFNB12(BorK’ a ’
PCDH15 Usher type DFNB23(Arimed’ a ’
* DFNB is autosomal recessive deafness, DFNA is autosomal dominant deafness.
The locus for non-syndromic, autosomal, recessive deafness, DFNB18,
overlaps with that for USH1C (Jain, et al., 1998). If USH1C mutations could be
identified in patients with autosomal non-syndromic recessive deafness (i.e. in
patients who are deaf in the absence of an eye phenotype), then this may aid
the understanding of the function of harmonin in both organs.
55

1.5.1. Alternative splicing
USH1C is an alternatively spliced gene and it has already been demonstrated
that harmonin exists as several alternatively spliced isoforms, some of which
are thought to be ear-specific (Scanlan, et al., 1999; Verpy, et al., 2000).
Therefore, it is possible that mutations in exons found only in the ear-specific
isoforms could lead to non-syndromic autosomal recessive deafness, DFNB18,
in the absence of an eye phenotype.
Alternative splicing is a means of producing multiple protein products from a
single gene. The splicing pattern of a typical multi-exon mRNA can be altered
in many ways (Fig. 1.12). The use of alternative exons or the lengthening or
shortening of exons by the use of alternative 5’ or 3’ splice sites can lead to the
introduction or removal of protein domains with novel functions. The use of
alternative 5’ untranslated regions (5’ UTR) allows alternative regulation of
gene expression in different tissues.
Figure 1.12. Patterns of
alternative splicing
(Black, 2003).Grey boxes represent constitutive sequences present in all final mRNAs. Hatched boxes represent alternative RNA segments that may or
may not be used. (A) Cassette exons maintain the reading-frame, whether or not they are included. (B) Exons may be mutually exclusive. (C, D) Alternative 5’ and 3’ splice sites allow the lengthening or shortening of a particular exon. (E, F) Alternative promoters and alternative poly(A) sites alter the beginning or end of a transcript. (G) Introns may be retained in the translated mRNA. (H) A single pre-mRNA can exhibit multiple sites of alternative splicing that are often used in different combinations to produce many different final mRNAs.
Poly (A)
“ • Poly(A) Poly (A)
R v v w v ,
56

It is postulated that alternative splicing has a major role in the production of
complexity in the human genome. Subsequent to completion of the human
genome sequencing project, the number of human genes is estimated to be
approximately 30,000-35,000 (Lander, et al., 2001; Venter, et al., 2001). This
figure is surprisingly low when compared to the genomes of much simpler
organisms, such as the fruit fly Drosophila melanogaster and the nematode
C. elegans, which contain around 14,000 and 19,000 genes, respectively (The
C. elegans sequencing consortium, 1998; Adams, et al., 2000).
Early estimates of the frequency of alternative splicing reported that between
35% and 59% of human genes show evidence of at least one alternative splice
form (Modrek and Lee, 2001). However, a more recent genome-wide survey of
alternative splicing, using exon-junction microarrays to monitor the exon-exon
connections of 10,000 multi-exon genes, estimates that as many as 74% of
human multi-exon genes may be alternatively spliced (Johnson, et al., 2003a).
Furthermore, it appears that alternative splicing tends to insert or delete
complete protein domains more frequently than expected by chance
(Kriventseva, et al., 2003), thus indicating that alternative splicing has a role in
increasing the functional diversity of the proteome.
Alternative USH1C transcripts involve the inclusion of additional exons between
exons 14 and 16 and between exon 20 and 21 that may or may not alter the
open reading frame (Fig. 1.10) (Scanlan, et al., 1999; Verpy, et al., 2000).
Furthermore, a putative short isoform of harmonin, PDZ-37, has also been
reported (Fig. 1.10) (Scanlan, et al., 1999). This isoform lacks the first two PDZ
57

domains and is thought to utilize an alternative transcription initiation site in
exon 12.
The physiological significance of these alternative isoforms is not yet known.
However, the additional exons, A to F, encode an extra coiled-coil domain and
the a putative protein degradation motif (PEST). Furthermore, a change in the
open reading frame can result in the loss of the third PDZ domain and/or the
presence of a novel C-terminus that may or may not possess a PDZ-binding
motif. Therefore, it can be hypothesized that not all of the isoforms of harmonin
will have the ability to form the same interactions. In addition, some isoforms do
appear to have tissue specific expression patterns (Scanlan, et al., 1999;
Verpy, et al., 2000). Therefore, the USH1C gene appears to have the ability to
produce several protein products, each with slightly different binding abilities.
1.6. PDZ Domains
Harmonin is a PDZ domain-containing protein. PDZ domains are one of the
most common modular protein interaction domains and are able to mediate
specific interactions that underlie the assembly of large protein complexes
involved in signalling or subcellular transport. Therefore, it is not surprising that
disruption of these interactions could play a role in disease. However, harmonin
was the first PDZ domain-containing protein to be linked to a human disease
(Bitner-Glindzicz, etal., 2000; Verpy, etal., 2000).
58

1.6.1. Structure and function
1.6.1.1. Structure of PDZ domains
PDZ domains are named after the first three proteins in which the 90 amino
acid repeat sequence was first recognized: the post-synaptic protein density
protein, PSD-95/SAP90, the Drosophila septate junction protein, Discs-large
(Dig), and the epithelial tight junction protein ZO-1 (zonula occludens-1). PDZ
domains are also sometimes known as Discs-large homology repeats, or GLGF
repeats after the highly conserved Gly-Leu-Gly-Phe amino acid sequence
found within the domains. The role of PDZ domains in protein-protein
interactions was established when it was discovered that the first and second
PDZ domains of PSD-95 could bind to the C-termini of either the Shaker K+
channel (Kim, et al., 1995) or the NMDA (N-methyl-D-aspartate) receptor
(Kornau, et al., 1995). Subsequently, the structure of various PDZ domains
have been determined crystallographically, PDZ3 of PSD-95 being the first
(Doyle, et al., 1996), allowing the mechanism of their protein interaction to be
deduced.
The basic structure of a PDZ domain is a compact globular fold in which six p-
strands (pA-pF) sandwich two a-helices (aA and aB). A peptide-binding groove
is located between the pB-strand and the aB-helix in which C-terminal peptides
bind as an antiparallel p-strand. The N- and C-termini of the domain are located
near each other on the opposite side of the domain from this peptide-binding
site (Fig. 1.13).
59

Figure 1.13. Diagram illustrasting the
structure of a typical PDZ domain (Hung and Sheng, 2002).A ribbon diagram of PDZ3 of PSD-95 illustrating the six (3-strands (turquoise) and two a-helices (red), with a peptide (yellow) binding as a |3-strand between the aB helix and (3B strand. The N- and C-termini are located near each other on the opposite side of the domain from the peptide-binding groove.
1.6.1.2. Function o f PDZ domain-containing proteins
An increasing number of roles have been identified for PDZ domain-containing
proteins in different cell types. PDZ-based scaffolds organize signal
transduction pathways such as phototransduction in Drosophila (reviewed by
Pawson and Scott, 1997) and the signalling machinery at synapses (reviewed
by Gomperts, 1996). PDZ proteins have also been implicated in the
establishment of cell polarity and the trafficking of proteins to particular
subcellular localizations (Bilder, 2001; and reviewed by Bredt, 1998). More
recently, studies on the cystic fibrosis transmembrane conductance regulator
channel (Pagani, et al., 2003) indicate that PDZ domains may be able to
modulate the function of their associated proteins, as well as the localization,
by having a direct effect on channel gating, possibly by linking monomeric
subunits of the channel (Raghuram, etal., 2001).
1.6.2. Ligand specificity
PDZ domains recognize specific C-terminal peptides, usually 4-5 amino acids
in length, in their protein ligands. This specificity is determined by the amino
60

acids present at the ligand-binding surface. The conserved GLGF motif, within
the PDZ domain, is important for hydrogen bond co-ordination of the C-terminal
carboxylate group of the ligand.
The carboxylated amino acid at the end of a peptide ligand, termed PO, is a
major determinant in the interaction of a PDZ domain with its ligand. In general,
PDZ domains require a hydrophobic residue at the end of its ligand, as the side
chain has to project into a hydrophobic pocket. However, PDZ-interacting
peptides ending with a negatively charged acidic amino acid residue
(asparagine or glutamine) (Vaccaro, et al., 2001), or with a polar cysteine
residue (Maximov, etal., 1999) have also been described. The next residue, P-
1, is thought to have a minor role in the specificity as its side-chain has been
observed to point away from the interaction surface (Doyle, et al., 1996).
However, the next residue along, P-2, determines the binding specificity of the
domain through its interaction with the first residue of aB helix (position aB1).
Hence, the nature of the side-chain of the amino acid residue at the -2 position
is believed to be a major determinant in PDZ-binding specificity. Nevertheless,
residues that are further away from the C-terminus of the ligand protein may
also be involved in the specification of peptide/PDZ binding (Songyang, et al.,
1997).
PDZ domains are, however, also able to bind to internal peptide sequences, as
long as they form a specific tertiary structure that conformationally mimics the
chain terminus. This has been observed for the interaction between the PDZ
domain of neuronal nitric oxide synthase (nNOS) and the syntrophin PDZ
domain (Hillier, et al., 1999). Therefore, it can be seen that PDZ domain-
61

containing proteins have the ability to form homo- and hetero-oligomers that
would be useful in assembling protein networks.
1.6.3. Classification of PDZ domains
Initial attempts to classify PDZ domains based on their ligand specificity lead to
the observation of two main classes of PDZ domains: class I -X-S/T-X-<|) and
class II -X-(j)-X-<|) (where <j> is hydrophobic and X is any amino acid) (Songyang
et al., 1997). However, a growing number of C-terminal ‘exceptions’ have been
identified (Maximov, et al., 1999; Vaccaro, et al., 2001) and a novel system to
classify PDZ domains was devised (Bezprozvanny and Maximov, 2001).
Essentially, the nature of the amino acid residues at two critical positions within
the binding cleft of the PDZ domain is examined. The first (Pos1) immediately
follows the (3B strand, while the second (Pos2) corresponds to the first position
in the second a-heilx (aB1). This classification allows all known PDZ domains
to be arranged into twenty-five groups and hence the ligand specificity of
‘orphan’ PDZ domains, with no known binding partners, may, to a certain
extent, be predicted. Nevertheless, the only way to be sure of the binding
specificity of a given PDZ domain is to investigate candidate peptide ligands in
functional assays (Songyang, etal., 1997; Vaccaro, etal., 2001).
1.7. Gene Characterisation and Elucidation of
Function
Once a gene has been cloned, there are a number of approaches that can be
used to characterise it further and determine the possible function(s) of the
62

protein that it encodes. Molecular methods can be used to identify mutations in
patient cohorts and to study alternative splicing and gene expression patterns.
In addition, antibodies may be raised to the protein and used to study its
subcellular and/or tissue localization. Furthermore, the function of a protein
may be infered through knowledge of the proteins with which it interacts, and
there are various methods available to identify and confirm protein-protein
interactions.
1.7.1. Mutation detection
There is a variety of methods for screening a gene for mutations. Sequencing
and hetero-duplex analysis methods are among those most frequently used.
Only sequencing will characterize fully a change in the DNA, but it is expensive,
can be labour intensive and it will miss medium/large deletions. Hence,
mutations are normally detected through other, higher throughput methods and
then confirmed by sequencing. Many of these methods exploit the formation of
hetero-duplexes to detect differences between two sequences. Many mutations
occur in the heterozygous form and naturally form hetero-duplexes. If a
mutation is homozygous, some wild type DNA may be added to the PCR
product and hetero-duplex formation can be forced by denaturing the DNA mix
and then allowing it to cool slowly.
In single-strand conformation polymorphism (SSCP) analysis, the fact that
hetero-duplexes often have abnormal mobility in non-denaturing
polyacrylamide gels is exploited. However, hetero-duplexes also have
abnormal denaturing profiles and will normally denature more easily than their
corresponding homoduplex. This feature is taken advantage of in denaturing
63

gradient gel electrophoresis (DGGE) and denaturing high performance liquid
chromatography (DHPLC). DHPLC requires more optimization for an individual
DNA fragment than does SSCP, but it appears to be a more sensitive method
of mutation detection, with detection rates of 92-100% reported (Dobson-Stone,
etal., 2000; Gross, etal., 1999; Liu, etal., 1998a; Prasad, etal., 2004; Rickard,
etal., 2001).
The majority of point mutations and small deletions and insertions can be
picked up using hetero-duplex analysis methods and sequencing. However, it
is not possible to identify larger deletions and duplications using these
methods. Southern blotting, fluorescent in situ hybridization (FISH) or
quantitative PCR are better methods to use for the detection of large deletions
or duplications.
1.7.2. Assignment of pathogenicity
Once changes in the DNA sequence have been detected, the next step is to
determine whether they are disease-causing or represent silent polymorphic
changes. An insertion or deletion, that causes a frame-shift in the open-reading
frame, or a nonsense mutation that changes a codon to a stop codon, can be
predicted to lead to a truncated protein product. However, it is more difficult to
predict the outcome of missense mutations.
Missense mutations may or may not lead to a change in amino acid residue
and, in most cases experimental verification that a change is disease-causing
is required. Regardless of whether or not a missense mutation affects the
protein sequence, it may have an unpredicted effect on splicing by creation of a
64

cryptic splice site or by disruption of an exon splicing enhancer (ESE) (Ars, et
al., 2000; Liu, et al., 2001; Teraoka, et al., 1999). Such effects are less easy to
predict and may be investigated by analysis of RNA, either from patients with
the mutation, or by exon-trapping experiments. Briefly, the DNA of interest is
sub-cloned into a plasmid expression vector that contains an artificial minigene,
which can be expressed in a suitable host cell. The minigene is transcribed and
the RNA spliced under control of the host cells RNA splicing machinery.
Splicing of the inserted DNA can then be analysed by isolating RNA from the
cells and making cDNA, which is then amplified and sequenced.
In addition, some nonsense mutations have been shown to induce exon-
skipping, resulting in the production of a functional, albeit smaller, protein
(Dietz, etal., 1993; Ginjaar, etal., 2000).
1.7.2.1. Missense changes
Upon identification of a novel missense nucleotide change, several factors
need to be considered to determine whether the change is likely to be disease-
causing. Firstly, does it segregate with the disease phenotype, i.e. is it carried
by all the affected individuals and not carried by the unaffected members of the
family? Secondly, does it occur commonly in an ethnically matched control
population? To address this, at least fifty control individuals (i.e. 100
chromosomes) must be screened for the change to confirm that it is carried by
less than 1% of the population. However, for this, the prevalence of the disease
must also be taken into consideration. For example, the 35delG mutation in
connexin 26 has a carrier rate as high as 1 in 35 in some populations
(Gasparini, et al., 2000), but it is still pathogenic. In addition, it is also possible
65

that the change could represent a very rare polymorphism.
The next step is then to look at the effect this nucleotide change would have on
the protein that it encodes. Is the change in amino acid a significant one such
that it could affect the tertiary structure of the folded protein? For example, the
conformation of the protein could be affected by a change in the size, charge or
bond-forming capabilities (e.g. disulphide bridges) of the amino acid side chain.
Then, is the amino acid found in a highly conserved region? Conservation of an
amnio acid through the species is normally an indication that it plays an
important role in the function of the protein. This can be determined by aligning
the protein sequence with its orthologous sequences from other species.
If an amino acid change is not found in a control population and it is predicted
to be significant enough to alter the protein function then this hypothesis needs
to be tested further. If, however, the change is not found in a control population
and it would not be predicted to have a significant effect on protein function, it is
still possible that the nucleotide change could affect splicing of the mRNA.
Furthermore, even if an alteration in the DNA sequence is not predicted to be
disease-causing, it could still prove useful in future studies.
1.7.2.2. Polymorphisms
SNPs represent two allele single nucleotide variations, distributed throughout
the human genome. SNPs are reported to have an average density of one SNP
every 1-2 kb of DNA (Sachidanandam, et al., 2001) and have a low rate of
recurrent mutation. This makes SNPs ideal for association studies. In contrast,
microsatellites, another type of sequence variation found within the human
66
genome, are more highly mutable than SNPs, but occur less frequently within
the genome. Microsatellites are di-, tri- and tetranucleotide repeats with allele
sizes of 200-400 bp in length, which, because they are more informative than
SNPs, are better suited to linkage studies.
Furthermore, the alleles of individual polymorphisms may be considered
together in haplotypes, and the non-random association of alleles within a
haplotype is known as linkage disequilibrium. As the distance between two
polymorphisms increases, linkage disequilibrium decreases since greater
distances provide more opportunity for recombination events to occur.
Therefore, SNPs are valuable tools for studying human evolution as well as the
gene variants that are associated with common diseases. Because of their
relatively low rate of mutation, SNPs can be very useful for determining the
origin of certain common mutations, i.e. whether they are likely to be recurrent
or due to a founder effect, according to the haplotypes on which they are found.
An excellent example is the 35delG mutation in connexin 26, commonly found
in Caucasian populations. 35delG, deletion of a single guanine in a run of six
guanines, was generally hypothesized to be a recurrent mutation, based on
studies using microsatellite markers over a 2 cM interval. However, a study of
the SNPs in a much smaller interval of 70 kb showed that the high frequency of
the 35delG mutation was the result of an ancient founder effect (Van Laer, et
al., 2001).
1.7.3. Protein function
Information about gene function may be gained by studying the protein it
encodes. The domains of a protein may be analysed using bioinformatics to
67

compare with similar domains found in other proteins, and expression of the
protein within cells and tissues may be studied.
1.7.3.1. Subcellular localization
Determination of sub-cellular localization of a protein can provide important
clues to its potential function. For example, it is only since sub-cellular
localization studies were performed that it has emerged that Bardet-Biedl might
be a disease of the cilia (Ansley, et al., 2003). Relevant cultured cells can be
fixed, permeabilized and then stained with an antibody raised against the
protein. Co-localization of a protein with a specific intracellular compartment
may be visualized by double-staining using antibodies raised against the
markers of various sub-cellular compartments.
1.7.3.2. Protein-protein interactions
Even after studying the structure and expression pattern of a novel gene, its
function may not be obvious. However, most proteins function by interacting
with other proteins in complex networks.
The most powerful way to screen for protein-protein associations is the yeast
two-hybrid system. This is a library-based method in which the bait gene (i.e.
the protein of interest) is coupled to the DNA-binding domain of a transcription
factor and a library of cDNA sequences are coupled to the transcription factor
activation domain. Yeast cells are then co-transfected with the bait gene
construct and the cDNA library constructs. The yeast cells are engineered to
carry a reporter gene, which is activated when the domains of the transcription
factor are brought together through the interaction of the proteins to which they
68

are bound. The clones in the positive cells must then be isolated and
sequenced to determine the identity of the interacting protein. Once a positive
protein-protein interaction has been identified, the yeast two-hybrid system may
also be used to determine specifically which domain of the protein is involved in
the interaction. Phage display is another library-based method, which can be
used to identify proteins that interact with a candidate protein.
Other approaches to study potential protein-protein interactions are co-
immunoprecipitation and GST pull-down assay. Both of these techniques
require an antibody to the protein of interest. Co-immunoprecipitation studies
protein interactions in vivo and employes an antibody to precipitate the protein,
with any bound proteins, from a cell lysate. Candidate binding proteins may
then be specifically sought. In the in vitro GST pull-down assay the protein of
interest is incubated with a candidate interacting protein fused to a GST moiety.
The GST-fusion protein is then recovered on glutathione Sepharose beads and
any bound protein is detected on immunoblot (western blot). Both of these
methods may be used to confirm results obtained from yeast two-hybrid
studies.
Hence, it can be seen that a combination of methods, at both the molecular and
protein level, are required to fully characterize a novel gene. This is
demonstrated in this thesis with the characterization of the recently identified
USH1C gene.
69

1.8. Aims of Thesis
When the gene for Usher syndrome type 1C, USH1C, was identified in 2000 it
encoded a PDZ domain-containing protein of unknown function. The aim of this
thesis is to characterize the USH1C gene further by mutation analysis and
gene expression studies, in an attempt to elucidate its role within the ear. Study
into the role of this gene within the eye is the subject of another PhD thesis.
The approaches used were:
1) To screen patients to find novel mutations in USH1C, which might yield
information about important functional domains. To do this, patients with
type 1 Usher syndrome were screened, as well as patients with non-
syndromic hearing loss, to establish whether mutations of USH1C also
cause autosomal, recessive, non-syndromic deafness, DFNB18.
2) To investigate alternative isoforms of USH1C using RACE and RT-PCR.
Tissue-specific expression patterns were studied in human foetal tissues
and novel isoforms were sought to explain the observation of
gastrointestinal symptoms in patients with deletion of the USH1C gene.
3) To gain insight into the function of harmonin by studying protein expression
in mouse cochlear sections and to establish the sub-cellular localization of
harmonin in a human epithelial cell line.
70

4) To further elucidate a role for harmonin by testing a candidate protein (the
product of another gene mutated in type 1 Usher) for interaction with
harmonin in an in vitro GST pull-down assay.
71

2. Materials and Methods
2.1. Materials
Company
AB gene
Amersham Pharmacia
Biotech
Amresco
Bioline
Bio-Rad
Citifluor Ltd
Fermentas
Invitrogen™
Product
PCR film
96-well plates
Hybond ECL nitrocellulose membrane
Glutathione Sepharose® 4B
GST vector pGEX-4T-1
19:1 Acrylamide/Bis-acrylamide
5x TBE
Urea
dNTPs,
Taq polymerase with 10x buffer and 50 mM
MgCh.
10xTGS buffer
Coomassie Brilliant Blue R-250 powder
Gel Doc™ 2000 imaging system
Precision plus protein™ standards
Protein assay dye
Glycerol/PBS mounting solution
Eel 13611 restriction endonuclease enzyme
100bp ladder
5’ RACE kit
Agarose
DMEM with L-Glutamate
Dnase I
Hind III DNA fragments
LB broth
Low-mass DNA ladder
72

Lab-Tek®
L.I.P equiptment and
services
Molecular Probes
MWG
National Diagnostics
New England Biolabs (NEB)
Novagen
Perkin Elmer (PE) Applied
Biosystems
Promega
Qiagen
One Shot® TOP10 competent cells
RPMI medium
S.O.C. medium
Superscript™ II Reverse transcriptase
T4 DNA Ligase
Trizol™
Vector pZErO™-2
Zero Background/Kan cloning kit
4-well glass Chamber Slide™
5-ml capacity plastic moulds
Rhodamine conjugated Phalloidin
Oligonucleotides
37.5:1 Acrylamide/Bis-acrylamide (Sequagel)
30% Acrylamide mix
Diluent, acrylamide gel concentrate and buffer
for genotyping gels
Restriction endonuclease enzymes (except Eel
13611)
DNA polymerase I, the large (Klenow) fragment
Calf intestinal alkaline phosphatase (CIP)
BugBuster® protein extration reagent
IPTG
ABI 377 DNA sequencer
BigDye™ cycle-sequencing kit
GS500 Tamra size standard
Loading dye
Streptavidin-AP conjugate
TNTr Quick Coupled Transcription/Translation
system
Transcend™ Biotin-Lysyl-tRNA
Western Blue™ stabilized substrate for alkaline
phosphatase
HotStarTaq™ DNA polymerase
73

QIAprep spin miniprep kit
QIAquick PCR purification kit
QIAquick gel extraction kit
Raymond A. Lamb Optimal Cutting Temperature compound (OCT)
Roche Expand™ long template PCR system
Santa Cruz Biotechnology, Anti-rabbit-FITC IgG conjugate
Inc.
Stratagene
Transgenomic
VWR™ International
Sigma
Biotinylated anti-mouse IgG
Biotinylated anti-rabbit IgG
Goat serum
Mouse monoclonal anti-GST antibody
Rabbit serum
BL21 competent E. coli cells
WAVE DNA analysis system
TEAA
Acetonitrile
All other chemicals
2.1.1. Software
Application
Primer design
Gel image capture
Determine of conditions for
hetero-duplex analysis
DNA sequence analysis
Genotype analysis
Capture of fluorescent
microscopy images
Capture of confocal
microscopy images
Product
Primer 3
Quantity One 4.4.0.
WaveMaker™
Sequence Navigator
Genescan version 2.0
and Genotyper
Openlab 3.1.1.
Leica confocal software
Company
MIT website (see
Appendix D)
Bio-Rad
Transgenomic™
PE Applied Biosystems
PE Applied Biosystems
Improvision
Leica microsystems
74

2.1.2. Solutions
Coomassie blue solution
11.1 mM EDTA, pH 7.3
DNA loading buffer
4% Paraformaldehyde
Phosphate buffered
saline (PBS)
Protease inhibitor mix
(Sigma)
10% Methanol
25% Acetic acid
0.05% (w/v) Coomassie Brilliant blue R-250 powder
4.13 g/100 ml EDTA
0.44 g/100 ml NaOH pellets
50% Glycerol
Orange G dye powder to desired colour
4 g paraformaldehyde per 100ml PBS
~4-5 drops concentrated NaOH to aid solubilization
137 mM NaCI
2.7 mM KCI
10 mM Na2HP04
1.8 mM KH2 PO4
pH adjusted to 7.4 with HCI
2 mM AEBSF
1 mM EDTA
130 jllM Bestatin
14 jaM E-64
1 pM Leupeptin
0.3 |aM Aprotinin
75

1x RACE PCR buffer
(Invitrogen)
RIPA buffer
6x SDS loading buffer
5x TBE buffer
20 mM Tris-HCI, pH 8.4
50 mM KCI
2.5 mM MgCh
10 mM DTT
400 pM each dATP, dCTP, dGTP, dTTP
150 mM NaCI
1% NP-40
0.5% sodium deoxycholate
0.1% SDS
50 mM Tris, pH 8.0
0.35 M Tris-HCI, pH 6.8
10.28% SDS
36% glycerol
5% p-mercaptoethanol
0.012% bromophenol blue
0.089 M Tris
0.089 M Boric acid
2 mM EDTA, pH 8.0
TE buffer 10 mM Tris
1 mM EDTA, pH adjusted to 8.0 with HCI

1x TGS buffer 25 mM Tris
192 mM Glycine
0.1% (w/v) SDS
pH 8.3
Western transfer buffer 48 mM Tris
39 mM Glycine
20% (v/v) methanol
pH 9.2
2.1.2.1. Qiagen DNA preparation buffers
Buffer P1 50 mM Tris-HCI
10 mM EDTA
100 pg/ml RnaseA
Buffer P2 0.2 M NaOH
1% SDS
Buffer EB 10 mM Tris-HCI, pH 8.5
2.1.2.2. Media
LB (Luria-Bertani) broth 10 g/l Bactotryptone
5 g/l Bacto-yeast extract
0.17 M NaCI
LB agar 15 g/l bacto-agar added to LB broth
SOC medium
2.1.3. Gels
0.5% Agarose gel
2% Agarose gel
Sequencing gel
Genotyping gel
20 g/l Bactotryptone
5 g/l Bacto-yeast extract
10 mM NaCI
2.5 mM KCI
20 mM Glucose
0.5 g agarose/100 ml TBE buffer
0.5 |ag/ml ethidium bromide
2 g agarose/100 ml TBE buffer
0.5 pg/ml ethidium bromide
6 M urea
10.4% acrylamide/bisacrylamide [19:1]
0.05% APS
0.07% TEMED
in 1x TBE buffer
74% diluent
16% acrylamide gel concentrate
10% buffer
0.08% APS
0.04% TEMED

12%SDS-PAGE 12% acrylamide mix
resolving gel 375 mM Tris-HCI, pH 8.8
0.1% SDS
0.1% ammonium persulphate (APS)
0.04% TEMED
SDS-PAGE stacking gel 4.95% acrylamide mix
125 mM Tris-HCI, pH 6.8
0.1% SDS
0.1% APS
0.1% TEMED
2.1.4. Oligonucleotide primers
All primers were designed using the Primer 3 programme on the
Massachusetts Institute of Technology website (http://www-
qenome.wi.mit.edu/cqi-bin/primer/primer3 www.cgi) and synthesised by MWG,
unless otherwise stated. All primer sequences and the corresponding PCR
conditions used are listed in Appendix A. PCR reactions were carried out using
either a touchdown protocol (see section 2.2.1.1.) or at the annealing
temperature indicated, with 1.5 mM MgCh, unless otherwise stated.
2.1.5. Patient cohorts
Two cohorts of patients were screened for mutations in USH1C.
79
2.1.5.1. Usher syndrome type 1 patients
To ascertain whether mutations in USH1C make a large contribution to the
incidence of Usher syndrome type 1 in the UK, fourteen British individuals of
mixed ethnic origins, diagnosed with Usher syndrome type 1, were obtained
from Prof. Shomi Bhattacharya at the Institute of Opthalmology in London.
2.1.5.2. Sib pairs with non-syndromic deafness
The locus for Usher syndrome type 1C overlaps with the locus for autosomal
recessive deafness DFNB18 (Jain, et al., 1998) and it was hypothesized that
these two forms of deafness could be allelic.
As part of a larger study funded by the National Lottery Charities Board, sib
pairs with non-syndromic recessive deafness, referred by audiologists and
geneticists, were collected throughout the UK by Bob Mueller, Tim Hutchin and
colleagues at the University of Leeds. Haplotype analysis of microsatellite
markers flanking all of the known DFNB loci, was performed on a total of 133
Caucasian sib pairs and fifty-five sib pairs of Pakistani and Middle Eastern
origin (Navarro-Coy, et al., 2001). The sib pairs had previously been screened
for mutations in GJB2. Mutations were found in 32% and these were removed
from further analysis.
From the original cohort of 133, sixteen Caucasian sib pairs and two small
consanguineous families showed concordance for polymorphic markers
flanking the DFNB18 locus and were donated to us for screening the USH1C
gene.
80

2.1.6. Control DNA
A number of phenotypically normal DNA samples from different ethnic groups
were made available to us.
A panel of ninety-six pan-ethnic DNA samples, that had been selected at
random and anonymized, were obtained from the Diagnostic Clinical Genetics
Unit at the Institute of Child Health.
Dr. Tim Hutchin and Prof. Bob Mueller at the University of Leeds donated a
panel of eighty anonymous Pakistani DNA samples to use as ethnically
matched control samples for screening for novel changes found in the USH1C
gene and for analysis of intragenic USH1C SNPs.
Dr. Mary Petrou in the Department of Haematology at UCL donated a panel of
fifty anonymous Greek Cypriot DNA samples to use for analysis of intragenic
USH1C SNPs.
2.1.7. Human foetal tissues
Human foetal tissues, ranging from fifty-four days to thirteen weeks of
development, were obtained from the MRC Human Embryo Resource at the
Institute of Child Health. This was approved by the local Ethical committee.
2.1.8. Mice
Cochleae were extracted from CD1 mice ranging in age from two days to
twelve days post-natal.
81

2.1.9. Plasmid vectors and constructs
The pZErO™-2 vector (see Appendix B) was used for cloning PCR products for
sequencing and for in w'fro-translation of cDNA sequences. The pGEX-4T-1
vector (see Appendix B) was used for the production of GST-fusion proteins for
analysis in GST pull-down assays.
Dr Matthew Scanlan (Scanlan, et al., 1999), at the Ludwig Institute for Cancer
Research in New York, donated a full-length copy of USH1C isoform a1 cDNA
cloned in the pBK-CMV vector.
The IMAGE clone 0363071 comprises the pT7T3D vector with an insert of
human cDNA sequence from the 3’ end of the MCC2 gene. A fragment of 3’
MCC2 sequence was subcloned into the pGEX-4T-1 vector for expression of a
GST-MCC2 fusion protein for use as a positive control in GST pull-down
assays.
2.1.10. Competent E. co//cells
One Shot® TOP10 competent cells were used for general propagation and
maintenance of plasmids and clones.
BL21 competent E. coli cells were used for the expression of GST-fusion
proteins. These cells are deficient in the Lon and OmpT proteases and hence,
provide high protein expression levels.
82

2.1.11. Human epithelial cell lines
The human gut cell lines Caco-2 and HT29 were used to study the expression
of alternative USH1C isoforms and for USH1C localization studies.
Caco-2 cells are human colon adenocarcinoma cells established from the
primary colon tumor of a 72-year-old Caucasian man in 1974.
HT29 cells are human colon adenocarcinoma cells established from the
primary tumor of a 44-year-old Caucasian woman with colon adenocarcinoma
in 1964.
HEK293 cells are human embryonal kidney cells established from a human
primary embryonal kidney transformed by adenovirus type 5.
2.1.12. Antibodies
Dr Ichiro Kobayashi at the Hokkaido University School of Medicine in Japan
donated a polyclonal rabbit anti-harmonin antibody (Kobayashi, et al., 1999)
and Dr Matthew Scanlan at the Ludwig Institute for Cancer Research in New
York donated a monoclonal mouse anti-harmonin antibody (Scanlan, et al.,
1999). Both antibodies were raised to the major harmonin isoform a1, which
lacks the alternative exons A-F and exon G/G’. However, no epitope mapping
has been carried out with either antibody, so it is not known which parts of the
protein they are able to recognise.
83

2.2. Methods
2.2.1. Polymerase chain reaction (PCR)
The polymerase chain reaction (PCR) mix consisted of 25-250 ng DNA,
25 pmol of each primer, 1x reaction buffer, containing Tris CI, KCI, (NH4)2S 0 4
and 1.5 mM MgCI2; pH 8.7, 200 dGTP, dCTP, dTTP, dATP and
1 unit HotStarTaq™ polymerase in a typical reaction volume of 25 jal. Reactions
were either carried out in 96-well plates sealed with PCR film, or in 0.5 ml tubes
using an Eppendorf Mastercycler thermal cycler with a hot-lid at 105°C and
applying a pressure of 150 N.
Conditions for thermal cycling started with an initial denaturing step of 15 min.
at 96°C to activate the HotStarTaq™ DNA polymerase, followed by 35 cycles of
96°C for 30 s, 15 s at an appropriate annealing temperature (Appendix A),
72°C for 30 s and a final extension step of 10 min. at 72°C.
2.2.1.1. Touchdown PCR
To amplify all fragments at the same time and obtain clean, specific products
(important for hetero-duplex analysis, see section 2.2.3.), a touchdown cycling
method was employed. The first annealing temperature was 70°C and this was
decreased by 1°C each cycle for the first fifteen cycles, then the annealing
temperature was held at 55°C for the remaining twenty cycles.
2.2.12. Amplification of large DNA fragments
Amplification of 26.5 kb of genomic DNA, for analysis of two novel missense
coding variants, was achieved using the Expand™ Long Template PCR
84

System. Two separate master mixes were prepared on ice. Master mix 1
contained 2.5 pi of each dNTP at a concentration of 10 mM (500 pM final
concentration), 300 nM of each primer, up to 500 ng of genomic DNA and
sterile dhhO to a total volume of 25 pi. Master mix 2 contained 5 pi 10x buffer 3,
with 22.5 mM MgC^ and detergents, between 0.5 pi and 1 pi of the supplied
enzyme mix (the thermostable Taq DNA polymerase and the proofreading Pwo
DNA polymerase) and sterile dh^O to a final volume of 25 pi. A 25 pi aliquot of
master mix 1 was pipetted into 25 pi of master mix 2 in a 0.2 ml thin-walled
tube on ice and mixed well by vortexing. The reaction mixture was overlayed
with 30 pi mineral oil and cycling on the Eppendorf Mastercycler thermal cycler
was started immediately.
The DNA was first denatured at 92°C for 2 min., followed by ten cycles of 92°C
for 10 s, an annealing temperature of 65°C for 30 s and 68°C for 19 min. This
cycling was repeated for a further twenty rounds with the elongation step
extended by 20 s each cycle for greater yield.
Products were visualized on a 0.5% agarose gel (see section 2.1.3.). A 10 pi
volume of PCR product was diluted with 10 pi loading buffer and
electrophoresed at ~30 V for 1-2 h. Products were sized by comparison to
Hind III DNA fragments.
2.2.1.3. Allele-specific PCR
Allele-specific PCR was used to determine if two coding variants in USH1C
occurred on the same allele or different alleles. Two forward oligonucleotide
85

and two reverse oligonucleotide primers were designed (Appendix A, Table
A.4), with the forward primers complimentary to the nucleotide changes found
at one variant and the reverse primers complimentary to the nucleotides found
at the other variant. The pairs of primers differed only in their 3’ nucleotide
depending on whether they were specific for the wild type or the variant
sequence. The primers were designed to have melting temperatures (Tm) as
close to each other as possible by adjusting the primer length. Allele-specific
oligonucleotides (ASO) were used in all possible combinations (four reactions)
to perform nested PCRs on the original 26.5 kb PCR product, as described in
section 2.2.1.2. At an annealing temperature of 59°C, the oligonucleotides with
3’ ends complimentary to the template amplified, while those with the mismatch
3’ ends did not.
2.2.1.4. Nested PCR
Nested PCRs were carried out with oligonucleotides, designed using the Primer
3 programme (Appendix D) and situated 10-20 base pairs inside the
oligonucleotides used in the primary PCR (Appendix A). The secondary PCR
was cycled in the same way as the primary PCR, using either 1 pi of the
primary PCR product or 1 pi of a 1 in 10 dilution of the primary product, and an
annealing temperature adjusted for the melting temperature (Tm) of the new
oligonucleotides.
All PCR products were diluted with an equal volume of loading buffer,
separated by 2% agarose gel electrophoresis (~120 V, for ~45 min. in
1x TBE buffer), stained with ethidium bromide and visualised under UV. The
gel image was captured on a Bio-Rad Gel Doc™ 2000 imaging system, using
86

Quantity One 4.4.0 software. Products were sized by comparison to 100 bp
ladder.
2.2.2. RT-PCR analysis
2.2.2.1. Isolation of RNA from cell lines, urine and foetal tissues
RNA was extracted from human foetal tissues, human cell lines and ceil pellets,
obtained from urine samples, using TRIZOL. Tissue samples were
homogenized in 1 ml TRIZOL reagent per 50-100 mg tissue using plastic
homogenizers that fit 1.5 ml tubes. Adherent cells were removed directly from
the flask bottom by the addition of 1-2 ml TRIZOL and gently mixed by
repeated aspirations with the pipette. Homogenized samples were incubated at
room temperature for 5 min. to permit complete dissociation of nucleoprotein
complexes. Chloroform was added at a ratio of 0.2 ml per 1 ml TRIZOL
reagent, the tubes sealed, shaken vigorously by hand for 15 s and incubated at
room temperature for 2-3 min. Next, samples were centrifuged at 12,000 g for
15 min. at 4°C.
Following centrifugation, the colourless upper aqueous phase containing the
RNA was transferred to a fresh 1.5 ml tube, the lower red, organic phase was
saved for DNA isolation. RNA was precipitated from the aqueous phase by
mixing with 0.5 ml isopropyl alcohol per 1 ml TRIZOL reagent used initially.
Samples were incubated at room temperature for 10 min. and centrifuged at
12,000 g for 10 min. at 4°C. The supernatant was removed and the RNA pellet
washed once with 75% ethanol, adding at least 1 ml ethanol per 1 ml TRIZOL
reagent. The sample was mixed by vortexing and centrifuged at 7,500 g for
5 min. at 4°C. The RNA pellet was briefly air-dried and re-suspended in
87

RNase-free water (DEPC-treated) by repeated aspirations and incubating for
10 min. at 55°C. RNA was stored at -80°C until required.
2.2.2.2. First-strand synthesis (RT-PCR)
Reverse transcription (RT) was carried out using Superscript™ II Reverse
Transcriptase with both oligo dT and random nonamer primers.
The RNA was first treated with DNase to ensure no genomic DNA
contamination, 12 pi RNA was mixed with 2 pi DNAse I enzyme, 2 pi 10x
buffer, made up to 20 pi with RNase-free water and incubated at room
temperature for 15 min. The DNase I was de-activated by adding 5 pi 25 mM
EDTA, pH 8 and incubating at 65°C for 10 min. Next, 1 pi oligo dT primer and
1 pi random nonamer primer were added to the Dnase treated RNA and
incubated at 70°C for 10 min. The mixture was then quick-chilled on ice and the
remaining components of the RT-PCR were added: 9 pi 5x first strand buffer,
4.5 pi 0.1 M DTT, 2 pi 10 mM dNTPs and 2.5 pi RNAse inhibitor. The mixture
was centrifuged and heated to 42°C for 2 min. before adding 1 pi Superscript™
11 Reverse Transcriptase enzyme and incubating for a further 50 min. at 42°C.
The enzyme was heat-inactivated at 70°C for 15 min.
The quality of the cDNA and the presence of any contaminating genomic DNA
were checked by amplification of the house-keeping gene HPRT using 1 pi of
each sample and oligonucleotide primers located in exons 7 and 9 of the HPRT
gene.
88

Primers around the alternatively spliced exons in the USH1C cDNA were
designed for gene-specific amplification in a variety of human foetal tissues,
cell lines and urine (Apendix A, Table A.3).
2.2.2.3. 5 ’ Rapid amplification of cDNA ends (5’ RACE)
Rapid amplification of cDNA ends (RACE) was performed on USH1C to identify
isoforms with novel 5’ ends.
A 14.5 pi aliquot of RNA isolated from the human foetal tissue of interest
(section 2.2.2.1.) was combined with 2.5 pmoles of gene-specific primer, GSP1
(Appendix A, Table A.2), in a 0.5 ml tube and incubated at 70°C for 10 min. The
tube was transferred immediately to ice and 8.5 pi 5’ RACE PCR buffer (section
2.1.1.) was added to give a final reaction volume of 24 pi. As for RT-PCR, the
reaction was incubated at 42°C for 1 min. before 1 pi Superscript™ II Reverse
Transcriptase was added and the reaction incubated for a further 50 min. at
42°C. The reaction was terminated by a 15 min. incubation at 70°C and any
remaining RNA was removed by incubating with 1 pi RNase mix at 37°C for 30
min. The cDNA product was purified using QIAquick PCR purification columns
(section 2.2.4.1.).
A homopolymeric tail was added to the 3’-end of the purified cDNA using
dCTP. Ten microlitres of purified cDNA was mixed with 6.5 pi dhfeO, 5 pi 5X
tailing buffer and 2.5 pi 2 mM dCTP in a 0.5 ml tube and incubated at 94°C for
3 min. The tube was chilled on ice for 1 min., then 1 pi TdT enzyme was added
and the reaction incubated at 37°C for 10 min. TdT was heat-inactivated at
89

65°C for 10 min. and the tube placed on ice. The tailed cDNA was amplified
using an abridged anchor primer, that anneals to the cytosine tail, and a nested
gene-specific primer, GSP2 (Appendix A, Table A.2), with extension steps of 2
min., to amplify cDNA >1 kb. To generate enough product to detect by ethidium
bromide staining, the PCR product was diluted 1 in 100 and re-amplified using
the abridged universal amplification primer and a second, nested, gene-specific
primer, GSP3 (Appendix A, Table A.2). The final amplified sample was
analysed using agarose gel electrophoresis, ethidium bromide staining and the
appropriate molecular size standard.
2.2.3. Hetero-duplex analysis by denaturing high performance liquid
chromatography (DHPLC).
DHPLC is a system for the automated detection of single base-pair
substitutions and small insertions or deletions. It relies on the fact that under
partial denaturing conditions, hetero-duplexes (fragments of double stranded
DNA containing a mismatch) are less stable than their corresponding
homoduplex and will be eluted earlier from a column containing a DNA
separation matrix. A double-stranded DNA molecule is retained on the matrix
via electrostatic interactions between the positive surface potential generated
by triethylammonium (TEAA) ions absorbed at the stationary phase and the
negative surface potential generated by the phosphodiester groups of the
sugar-phosphate backbone of DNA. The DNA separation matrix is held at a
temperature specific to the fragment being analysed, such that the DNA is 75%
double-stranded (ds). The interaction between the TEAA ions and the DNA
fragment is weakened by the addition of a hydrophilic counter-ion (acetonitrile)
90

in a gradient of increasing concentration until the DNA is eluted from the
column.
2.2.3.1. Preparation of DNA fragments for DHPLC analysis
All twenty-eight exons of USH1C were amplified using the primers listed in
Appendix A, Table A.1, and touchdown PCR with HotStar Taq Polymerase, as
described in section 2.2.1.1. Reactions were carried out on Eppendorf
Mastercycler thermal cyclers, in 25pl volumes in 96-well plates sealed with
PCR film and a hot-lid applying a pressure of 150 N. Equal volumes of patient
and wild type PCR products were then combined and hetero-duplexes were
forced to form (necessary for identification of homozygous changes) by heating
to 95°C for 5 min. and allowing the mixture to cool slowly, in 5°C increments for
2 min. at each temperature, until 25°C. Samples were injected onto the column
of the Transgenomic™ WAVE DNA analysis system, in both ‘spiked’ (i.e.
forced hetero-duplexes) and ‘unspiked’ (i.e. wild type patient DNA) forms, and
analysed according to the manufacturers’ instructions, using optimum
conditions pre-determined for each exon of the USH1C gene (Table 2.1).
2.2.3.2. Optimisation of DHPLC running conditions
WaveMaker™ software supplied by Transgenomic™ was used to estimate the
column temperature and acetonitrile buffer gradient required to observe the
separation of homo- and hetero-duplexes for a given fragment. WaveMaker™
uses the DNA sequence of the fragment of interest to predict an appropriate
acetonitrile buffer gradient to use. A wild type DNA fragment was then used for
seven or eight 12-minute runs at a range of appropriate temperatures. A
melting-curve was then constructed, by plotting the time at which the DNA was
91

eluted from the column against the temperature of the column for that run. The
time at which 75% double-stranded DNA would be eluted is calculated as
follows:
Time at 100%ds - time at 0%ds x 75 + time at 0%ds (1)100
Hence, the temperature at which the DNA is 75% double-stranded was read
from the melting-curve. This temperature was used with the specified
acetonitrile buffer gradient for 7-minute mutation detection runs of that
particular DNA fragment (Table 2.1) on the WAVE DNA analysis system. A wild
type of each DNA fragment was then run to confirm that the fragment is eluted
at approximately 3-4 min. during the mutation detection run, such that hetero
duplexes may be easily identified.
92

Table 2.1. Conditions used for performing DHPLC analysis on USH1C
exons
ExonColumnTemp.
(°C)
0.0min.(%A)
0.1min.(%A)
4.1min.(%A)
4.2min.(%A)
4.7min.(%A)
4.8min.(%A)
6.8min.(%A)
1 66 45 40 32 0 0 45 452 61 46 41 33 0 0 46 463 66 49 44 36 0 0 49 494 65 45 40 32 0 0 45 455 63 54 49 41 0 0 54 546 65 52 47 39 0 0 52 527 62 51 46 38 0 0 51 518 64 46 41 33 0 0 46 469 63 45 40 32 0 0 45 4510 62 49 44 36 0 0 49 4911 65 53 48 40 0 0 53 5312 65 45 40 32 0 0 45 4513 60 45 40 32 0 0 45 4514 61 52 47 39 0 0 52 5215 63 49 44 36 0 0 49 49A 60 45 40 32 0 0 45 45B 59 44 39 31 0 0 44 44C 60 45 40 32 0 0 45 45D 63 41 36 28 0 0 41 41E 62 44 39 31 0 0 44 44F 61 46 41 33 0 0 46 4616 61 48 43 35 0 0 48 4817 63 50 45 37 0 0 50 5018 63 51 46 38 0 0 51 5119 63 45 40 32 0 0 45 4520 63 54 49 41 0 0 54 54
G/G’ 62 47 42 34 0 0 47 4721 62 49 44 36 0 0 49 49
The column temperature corresponds to the temperature that the column was held at
for the entire run, while the times correspond to the different steps in the hetero-duplex
analysis run and the percentage of the buffer A that was in the buffer A and buffer B
mix being run over the column at that stage. 0.0 min. is the loading step, 0.1 min. is the start of the acetonitrile gradient, 4.1 min. is the end of the acetonitrile gradient, 4.2
min. is the start of the column clean, 4.7 min. is the end of the column clean, 4.8 mins
is the start of the column equilibration and 6.8 min. is the end of the column
equilibration. Buffer A is 5% TEAA and Buffer B is 5% TEAA and 25% Acetonitrile.
93
2.2.4. Automated DNA sequencing
2.2.4.1. Purification of PCR products
PCR products were purified using a QIAquick PCR purification kit and a
Haraeus Biofuge. PCR products were mixed with 5 volumes buffer PB and the
whole sample was applied to a QIAquick spin column. Spin columns were
placed in 2-ml collection tubes and centrifuged for 60 s at 10,000 g to bind the
DNA to the column. The flow-through was discarded, the column washed with
0.75 ml buffer PE and centrifuged again for 60 s at 10,000 g. The flow-through
was again discarded and the column centrifuged for an additional 60 s at
10,000 g to remove residual ethanol from the PE buffer. The spin column was
placed in a clean 1.5 ml tube and 15 pi EB buffer (10 mM Tris-CI, pH8.5) was
applied to the centre of the membrane. After standing for 60 s, DNA was eluted
from the column by centrifuging at 10,000 g for 60 s.
2.2.4.2. Cycle sequencing
Direct sequencing was performed on both strands of the DNA template using
ABI Prism BigDye Terminator cycle sequencing ready reaction kits. The
reaction consisted of 10-20 ng purified PCR product, 3.2 pmol primer, 4 pi
BigDye Terminator ready reaction mix, made up to a total volume of 10 pi with
sterile milliQ water. Cycle sequencing was performed on an Eppendorf
Mastercycler thermal cycler using a hot-lid. The cycling programme was 25
cycles of 96°C for 30 s, 50°C for 15 s and 60°C for 4 min.
94

2.2A .3. Ethanol precipitation of sequenced products
To precipitate products of sequencing reactions, 10 pi sterile milliQ water 50 pi
95% ethanol and 2 pi 3M sodium acetate were added to a 10 pi sequencing
reaction. Samples were mixed and incubated at room temperature for 30 min.
Samples were then centrifuged at 10,000 g for 20 min., the supernatant
removed and the DNA pellet washed with 250 pi 70% ethanol. Samples were
centrifuged again at 10,000 g for 5 min., supernatant removed and the pellet
allowed to air-dry.
2.2.4.4. Polyacrylamide gel electrophoresis of sequencing products
Direct automated sequencing analysis was performed on an ABI 377 DNA
sequencer. The gel mix was prepared according to section 2.1.3. Gels were
poured between two clean 36-cm Perkin Elmer plates clamped into a cassette
and separated by 0.2-mm spacers. Gels were allowed to set for a minimum of
2 h.
Prior to loading, pelleted sequencing products (see section 2.2.4.3.) were re
suspended in 4 pi loading dye (5:1; formamide:blue dextran), denatured at
96°C for 2 min. and immediately placed on ice. A 2-pl volume of each sample
was electrophoresed for 7 h at 50°C and 1.2 kV in 1x TBE buffer, using the
following parameters: mobility file - DT BDset-Any; Run module - Seq run 36E-
1200 and the appropriate gel matrix file. Sequencing runs were analysed using
Sequence Analysis and Sequence Navigator software.
95

2.2.5. Genotyping
2.2.5.1. Microsatellite markers flanking major USH1 loci
Microsatellite markers flanking the major Usher type 1 loci, USH1B, USH1C,
USH1D and USH1F, were identified using the ensembl genome browser
(http://www.ensembl.org/) and amplified, using fluorescently labelled
oligonucleotides (Appendix A, Table A.7.), in 25-pl reaction volumes as
described in section 2.2.1.
2.2.5.2. Polyacrylamide gel electrophoresis of PCR products for genotyping
Polyacrylamide gel electrophoresis of amplified microsatellite markers was
carried out on the ABI 377. Gels were made according to section 2.1.3 and
poured between clean gel plates clamped in a cassette with 0.2-pm spacers
and left to set for 1 h prior to running.
Markers were pooled, with FAM and TET labelled PCR products diluted
between 1 in 10 and 1 in 20 and with HEX-labelled products always present at
double the concentration of the other two. A 2-pl volume of each DNA pool was
added to 2 pi of size standard (ABI GS500 Tamra). Samples were denatured at
96°C for 3 min. and placed on ice prior to loading all 4 pi of each sample. The
gel was electrophoresed for 2 h and the data was collected and analysed using
Genescan version 2.0 and Genotyper software.
2.2.6. Haplotype analysis
To determine what genetic background the recurrent 238-239insC mutation is
found on, intragenic USH1C SNPs were analysed
96

2.2.6.1. Restriction endonuclease digest tests
Nine intragenic SNPs across the USH1C gene were genotyped using
restriction enzyme digests tests The appropriate exon fragment was amplified,
as described in section 2.2.1., and the PCR product digested with the relevant
restriction enzyme (Table 2.2.). One microlitre of the appropriate restriction
enzyme buffer (at 10x concentration), 10-20 units of restriction enzyme and 1 pi
10x BSA, if required, were added to the PCR product to give a total volume of
10 pi. Digests were incubated at the appropriate temperature for a minimum of
1 h (at 65°C) or overnight (at 37°C).
Digests were run out on either a 2.5% agarose or a 3% agarose/1 % nusieve
gel, depending on the degree of separation required, and the products were
visualised under a UV light with ethidium bromide.
Table 2.2. Restriction digests used for genotyping USH1C intragenic
SNPs
PolymorphismRestriction
Enzymeused*
Products if wild type (bp)
Products if variant (bp)
PCRPrimers
IVS1-45C>G -Mwol 122+42+172 122+214 Exon 2IVS2-16C>T -Neil 110+147+120 257+120 Exon 3381G>T +Bsal 345 248+97 Exon 4IVS7+61G>A -Sau96l 118+56+27 118+83 Exon 7IVS7-27G>A +Nlalll 84+148+104 84+13+135+104 Exon 8IVS13+21C>G +BsaJI 73+190+103 73+190+8+95 Exon 131188A>G -Bsrl 15+71+59+131 15+71+190 Exon 141557G>C +Hgal 347 179+168 Exon 191737T>C -Mbol 123+178+9+139 301+9+139 Exon 21* Plus (+) or minus (-) sign indicates whether enzyme site is gained or lost, respectively, in the variant.
97

2.2.7. Cloning
USH1C cDNA was sub-cloned into the pZErO™-2 vector from the Zero
Background/Kan cloning kit to allow in v/Yro-translation of harmonin from the
Sp6 promoter. The 3’ ends of PCDH15 and MCC2 cDNA were cloned into the
GST vector pGEX-4T-1 for the expression of GST-fusion proteins in E. coli.
See Table 2.3 for details of the cloning procedure used in each case.
Table 2.3. Summary of cloning approaches used
Insert for
cloningVector
Cloning
method
Method used to obtain
insert
Linearizing
vector
Full length USH1CcDNA
LLLlNQ. Blunt-ended
Digested from pBK-CMV vector using Spel and Xbal
Ecl136II Digest
3’ end of M CC2cDNA
pGEX-4T-1
Blunt-ended
Digested from IMAGE clone 0363071 using Notl and Sacl
SmalDigest
3’ end of PCDH15cDNA
pGEX-4T-1
Blunt-ended
Amplified from human foetal kidney cDNA
SmalDigest
2.2.7.1. Preparation of blunt-ended linear plasmid vectors
Circular DNA vectors were linearized using blunt cutting restriction digest
enzymes, i.e. Ecl136II for pZErO™-2 and Smal for pGEX-4T-1. Restriction
enzyme digests were performed as described in section 2.2.6.1. using
200-500 ng plasmid DNA in a total reaction volume of 10 pi. To prevent them
self-ligating, linearized vectors were treated with calf intestinal alkaline
phosphatase (CIP), to remove the free 5’ phosphate groups. Ten units of CIP
enzyme were added to the digested vector and the total volume made up to
20 pi, using the appropriate buffer and dH20. The reaction was incubated at
37°C for 60 min., and the digested vector DNA purified by
phenol/chloroform/isoamyl alcohol extraction (section 2.2.7.2.).
98

2.2.7.2. Phenol/chloroform/isoamyl alcohol extraction of DNA
To remove enzymes, DNA was purified by adding an equal volume of
phenol:chloroform:isoamyl alcohol mix, in the ratio 25:24:1, and vortexing. The
mixture was then centrifuged at 10,000 g for 5 min. after which the top aqueous
layer was removed to a fresh tube. The DNA was ethanol precipitated from the
aqueous layer as described in section 2.2.4.3. by adding a one-tenth volume of
3 M sodium acetate and two and a half volumes of cold 100% ethanol and
incubating at -80°C for 1 h. The DNA pellet was re-suspended in an appropriate
volume of TE buffer.
2.2.7.3. Preparation of blunt-endedDNA inserts
Full-length USH1C cDNA was obtained by digesting it out of the pBKCMV
vector using Spel and Xbal restriction digest enzymes. A fragment
corresponding to the 3’ end of MCC2 cDNA was digested from IMAGE clone
0363071, using enzymes Notl and Sacl (Table 2.3.). Double digests were
performed as described in section 2.2.6.1., except the total reaction volume
was increased to 20 pi, so the amount of glycerol present from the two
enzymes did not inhibit the reaction. After digestion, the DNA product was
obtained by gel purification (see section 2.2.7.4.).
A fragment corresponding to the 3’ end of PCDH15 cDNA was obtained by
amplifying from human foetal kidney cDNA using gene-specific primers
(Appendix A, Table A.5).
99

DNA inserts were blunt-ended using DNA polymerase I, the large (Klenow)
fragment which has 3 -5 ’ exonuclease activity and 5 -3 ’ polymerase activity. To
allow the exonuclease activity of the enzyme to remove 3’ extensions, 5 units of
Klenow DNA polymerase I, in the appropriate buffer, was added to the DNA
fragment and incubated at 37°C for 5 min. Then, to fill in 5’ extensions, 2 pi of a
2 mM dNTP mix was added and incubated at room temperature for 20 min. The
enzyme was heat-inactivated by incubating at 75°C for 20 min.
2.2.1 A. Gel purification of DNA fragments
DNA fragments were gel purified using a QIAquick gel extraction kit and a
Haraeus Biofuge. The DNA fragment was excised from an agarose gel using a
clean, sharp scalpel. The gel slice was weighed and three volumes of buffer
QG were added to one volume of gel (i.e. 100 mg = 100 pi) and incubated at
50°C for 10 min. or until the gel slice had completely dissolved. Then, one gel
volume of isopropanol was added to the sample and mixed. The sample was
applied to a QIAquick column in a 2-ml collection tube and centrifuged for 1
min. at 10,000 g to bind the DNA to the column. The flow-through was
discarded and 0.5 ml buffer QG was added to the QIAquick column and
washed through by centrifuging for 1 min. at 10,000 g. To wash the DNA,
0.75 ml buffer PE was added to the QIAquick column and centrifuged again for
1 min at 10,000 g. The flow-through was discarded and the QIAquick column
was centrifuged for an additional 1 min. at 10,000 g to remove residual PE
buffer. The QIAquick column was then placed in a clean 1.5-ml tube, 30 pi
buffer EB (10 mM Tris CI, pH 8.5) was added to the centre of the QIAquick
membrane and the column was left to stand for 1 min. before centrifuging at
100

10,000 gfor 1 min. to elute the DNA.
2.2.7.5. Blunt-end ligation reactions
The insert DNA fragment and the linearized vector, were electrophoresed on a
2% agarose gel with a low mass DNA ladder to estimate the concentration of
both. For blunt-end ligation reactions the molar ratio of insertvector needs to
be 10:1.
i.e. 10 x size of insert(bp) x no of linear vector = ng of insert (2)size of vector (bp)
Ligations reactions consisted of 10-15 ng linearized vector, enough blunt-
ended insert so that the molar ratio of insertvector was 10:1 (see equation 2),
1 (j.l 10x ligation buffer and 1 |il concentrated T4 DNA ligase made up to a final
volume of 10 plI with sterile dHaO. Ligation reactions were incubated at 25°C for
1 h or 16°C overnight and then the reactions were placed at -20°C until ready
to be used in transformations. In addition, a negative control reaction containing
10 ng vector only, in the absence of insert DNA, was set up for determination of
the background number of non-recombinants.
2.2.7.6. Transformation of competent E. coli
For each ligation reaction a 50- tl aliquot of One Shot® TOP10 competent
E. coli cells was thawed on ice. Four microlitres of ligation product (see section
2.2.7.5.) were added directly to the competent cells on ice and mixed gently.
Transformations were left on ice for 20 min. and the cells were then heat-
shocked by incubating at 42°C for 45 s and returned immediately to ice for
2 min. A 250-jlx I volume of pre-warmed SOC medium was added and the cells
101

were incubated at 37°C for 1 h with shaking. A 200-jil aliquot of each
transformation was then spread on separate LB-agar plates containing
30 pg/ml kanamycin (pZErO-2) or 50 pg/ml ampicillin (pGEX-4T-1), depending
on the antibiotic resistance gene carried by the vector. Plates were inverted
and incubated at 37°C overnight.
2.2.7.7. Identification of clones containing insert
Approximately twenty colonies were picked from the LB-agar plate using an
inoculating loop and dipped first into a PCR mix containing the appropriate
vector primers (Appendix A, Table A.6.1.) and then into 5 ml LB broth,
containing the appropriate antibiotic. The 5 ml culture was incubated at 37°C,
with shaking at 225 rpm, overnight. The PCR was cycled using touchdown, as
described in section 2.2.1.1., and the products analysed on agarose gel, as
described in section 2.2.1.5. Only the plasmid DNA from the 5 ml overnight
cultures, whose corresponding PCR product indicated the presence of an insert
of the expected size, were prepared using the Qiagen miniprep kit, as
described in section 2.2.7.8. The orientation of inserts was confirmed by
sequencing using vector primers (Appendix A, Table A.6.1.). The sequence of
the inserts in the clones used in subsequent experiments were confirmed using
additional insert primers where required (Appendix A, Table A.6.2.).
2.2.7.8. Preparation of plasmid DNA
Plasmid DNA was extracted from E. coli cells using the Qiagen miniprep kit.
A single bacterial colony grown on LB plates, with the appropriate antibiotic,
was used to inoculate 5 ml LB medium containing the appropriate antibiotic at
the correct final concentration (kanamycin, 30 pg/ml; ampicillin, 50 pg/ml).
102

Cultures were incubated at 37°C, with shaking, overnight. The following day,
glycerol stocks were prepared by adding 600-pl culture to 400 pi 30% glycerol
and stored at -80°C.
The plasmid DNA from the remainder of the 5-ml culture was extracted using
QIAprep miniprep kit and a Haraeus Biofuge. E. coli cells from the 5-ml
overnight culture were pelleted by centrifugation at 10,000 g for 1 min. The
pelleted cells were then re-suspended in 250 pi buffer P1 by vortexing. A
250-pl volume of buffer P2 was added and the tube inverted gently 4-6 times to
mix until the solution became viscous and slightly clear. Next, 350 pi buffer N3
was added and the tube inverted, another 4-6 times. The sample was
centrifuged at 10,000 g for 10 min., and the supernatant was placed in a
QIAprep spin column, which in turn was placed in a 2-ml collection tube. The
QIAprep spin column was centrifuged at 10,000 g for 60 s and the flow-through
discarded. The column was washed to remove trace nuclease activity by
adding 0.5 ml buffer PB and centrifuging at 10,000 g for 60 s The flow-through
was discarded and the column was washed again by adding 0.75 ml buffer PE
and centrifuging at 10,000 g for 60 s The flow-through was discarded and the
column centrifuged for an additional 1 min. at 10,000 g to remove residual
wash buffer. The QIAprep column was then placed in a clean 1.5-ml tube and
50 pi buffer EB (10 mM Tris-CI, pH 8.5) was added to the centre of the
membrane, left to stand for 1 min. and centrifuged at 10,000 g for 1 min. to
elute the DNA.
103

2.2.8. Immunohistochemistry
For localization of harmonin expression within the mouse cochlea, frozen
mouse cochleae sections were prepared and stained with fluorescently labelled
antibodies.
2.2.8.1. Dissecting mice cochleae
Mice were terminated by cervical dislocation; the heads were then removed
and dissected to access the inner ear. The cochlea was removed from the
bulla, the bony structure encasing it. Then, using a hyperdermic needle, a small
hole was pierced in the apex of the cochlea to aid the fixation process and the
cochlea was placed in fixing solution as quickly as possible, usually within
10 min. of culling.
2.2.8.2. Fixing cochleae
Cochleae were fixed in a solution of 4% paraformaldehyde in phosphate
buffered saline (PBS) for 24 h at 4°C. To de-calcifiy the cochleae, they were
washed once in PBS for 5 min. and placed in a 4.13% (11.1 mM) EDTA, pH 7.3
solution at 4°C for 3-4 days. Finally, the cochleae were washed once more in
PBS for 5 min. and left to equilibrate in 20% sucrose in PBS, a cryoprotection
solution, at 4°C overnight prior to embedding.
2.2.8.3. Embedding cochleae
Cochleae were frozen in an Optimal Cutting Temperature compound (OCT) on
dry ice. A 5-ml capacity plastic mould was half-filled with OCT and placed on
dry-ice and allowed to start solidifying before a single cochlea was placed in the
centre. The cochleae were orientated on their side with the apex of the cochlea
104
directed towards the side of the mould such that, upon sectioning, slices would
be cut through all turns of the cochlea at once. More OCT was then poured on
top and allowed to freeze completely before the embedded cochleae were
placed at -80°C for long-term storage.
2.2.8.4. Sectioning cochleae
Frozen cochleae were sectioned on the cryostat. The temperature of the
cryostat chamber was set at approximately -22°C, while the specimen platform
temperature was set around -1 8 to -20°C for optimal sectioning conditions.
Cochleae embedded in OCT were removed from the moulds and fixed onto the
sectioning platform using fresh OCT. Embedded cochleae were cut in ~10-pm
thick sections and three sections were collected on each TESPA- (3-
aminopropyltriethoxysilane) coated microscope slide (see section 2.2.8.5.).
2.2.8.5. TESPA coating microscope slides
Glass microscope slides were coated with TESPA to help the tissue sections
adhere to them. The glass microscope slides were immersed for a minimum of
30 s in a 10% Hydrochloric acid/70% ethanol solution, followed by DEPC-
treated water and then 95% ethanol. Slides were then placed in an oven at
65°C overnight to dry. The dried slides were immersed in a 2% TESPA-in-
acetone solution for only 30 s then in 100% acetone twice and once in DEPC-
treated water, before finally drying in an oven at 45°C overnight. Prepared
slides were stored at room temperature until required.
105

2.2.8.6. Staining cochleae sections
Slides containing cochlear sections for staining were removed from the -80°C
freezer and defrosted at room temperature for 20 min. Excess OCT-embedding
medium was carefully scraped from around the sections using a scapel and a
PAP pen was used to draw a wax border around each section to isolate it from
the others on the slide. Then, each section was blocked with 4% goat serum in
PBS with 0.1% Tween 20 (PBS-T) at room temperature for 2 h. Sections were
washed twice with PBS for 4 min. each and incubated overnight at 4°C with a 1
in 50 dilution of rabbit polyclonal anti-harmonin antibody (Kobayashi, et a/.,
1999) in PBS, or, for controls, with either PBS alone or a 1 in 50 dilution of
rabbit serum in PBS. The following day the sections were washed in PBS for 4
min., incubated with a 1 in 100 dilution of an anti-rabbit-FITC conjugate for 4 h
at room temperature and washed twice more with PBS for 4 min. each. For
actin and cell nuclei localization, sections were incubated in a combination of a
1 in 100 dilution of Phalloidin-Rhodamine conjugate and a 1 in 200 dilution of
Hoechst in PBS for 20 min. at room temperature. Finally, sections were washed
twice more with PBS for 4 min. each, left to air-dry and mounted with a cover
slip using a Glycerol/PBS mounting solution.
2.2.8.7. Fluorescent microscopy
Stained cochleae sections were visualised using a 40x oil objective lense on a
Zeiss Axiophot fluorescent microscope. Images were captured using Openlab
3.1.1 software.
106
2.2.9. Immunocytochemistry
To study harmonin localization at the cellular level, cell lines expressing
harmonin were cultured, fixed and stained with fluorescently labelled
antibodies.
2.2.9.1. Tissue culture
Caco-2 cells were grown in DMEM with L-Glutamine, supplemented with 10%
foetal calf serum (FCS) and 1% penicillin-streptomycin antibiotics at 37°C with
5% CO2 and were split approximately 1 in 4 every 3-4 days. HT-29 cells were
grown in RPMI medium supplemented with 2 mM L-Glutamate, 10% FCS and
1% penicillin-streptomycin antibiotic mix at 37°C with 5% CO2 and were split
approximately 1 in 6 every 2-3 days.
2.2.9.1.1. Splitting cells
Tryspin-EDTA solution, sterile PBS and fresh medium were pre-warmed to
37°C. Old medium was removed from confluent cells in a 75-cm2/250-ml tissue-
culture flask and ~5 ml sterile PBS was added to the flask to gently wash off
excess medium from the cells. The PBS was removed and ~2 ml trypsin-EDTA
was added to the flask and left to incubate with the cells at 37°C for ~5 min. or
until the cells detached from the bottom of the flask. The action of the trypsin
was blocked by the addition of ~10 ml fresh medium and cells were aspirated
with a pipette a few times to separate any clumps. Approximately 2-3 ml of
trypsinized cells were added to a new flask with ~10 ml of fresh medium and
placed back in the incubator at 37°C.
107

2.2.9.1.2. Freezing cells
Cells were trypsinized, as described in section 2.2.9.1.1. and the cells from one
flask were transferred to a 15-ml tube and pelleted by centrifuging at
~300-400 g for 5 min. The pellet was re-suspended in 2 ml fresh medium and
repeatedly aspirated with a pipette to remove any clumps. Next, 2 ml medium,
with 20% DMSO, was added to the re-suspended cells to give a final volume of
4 ml with 10% DMSO. Cells were quickly aliquoted into 1-ml screw top vials
and immediately placed at -80°C in a chamber bathed in isopropanol to ensure
slow freezing. After 24 h the vials of cells were placed in liquid nitrogen for
long-term storage.
2.2.9.1.3. Thawing cells
Vials of frozen cells were removed from liquid nitrogen, quickly thawed at 37°C
and immediately added to ~12 ml of the appropriate pre-warmed medium. Cells
were aspirated with a pipette a few times to avoid clumps forming.
2.2.9.2. Fluorescent staining of human epithelial cell lines
Cells for staining were trypsinized, pelleted and re-suspended in 3-4 ml fresh
medium. To ascertain the concentration of the re-suspended cells, 15 jil of cells
were placed on a disposable counting slide and the number of cells in the grid
were counted under the microscope. Cells were diluted to 1x10⁵/ml, and 0.5 ml
(i.e. 50,000 cells) of cells were placed in each well of a 4-well glass chamber
slide. Cells were left to incubated at 37°C in the chamber slide for
approximately 48 h until they reached around 50% confluency.
108

To aid the adherence of the cells, the chamber slides were pre-treated with
200 pi collagen solution per well and incubated at 37°C for a minimum 2 h. The
collagen solution was then removed and the wells were washed once with
sterile PBS and left to dry.
Medium was removed from the cells and they were washed for 5 min. with PBS
and fixed by incubating in 200 pi 4% paraformaldehyde solution per chamber at
room temperature for 20 min. Fixing solution was removed and the cells were
washed again with PBS for 5 min. To permeabilize the cells, 200 pi 1% Triton in
PBS was added to each chamber and left to incubate at room temperature for
5 min. The Triton solution was removed and cells were washed once more with
PBS for 5 min., then blocked in 5% goat serum in PBS for 2 h at room
temperature and washed again in PBS for 5 min.
The fixed, permeabilized and blocked cells were incubated overnight at 4°C in
a 1 in 50 dilution of rabbit polyclonal anti-harmonin antibody (Kobayashi. et al.,
1999), or a 1 in 50 dilution of rabbit serum, or PBS alone. The following day,
cells were washed three times in PBS for 5 min. and incubated in a 1 in 50
dilution of anti-rabbit-FITC IgG conjugate for 4 h at room temperature. Cells
were washed again three times in PBS for 5 min., air dried, the chambers
removed from the glass slide and the cells mounted with a glycerol/PBS
solution.
2.2.9.3. Confocal microscopy
Fluorescently immunolabelled cells were viewed under a Leica confocal
microscope using a 40x oil objective lense.
109

2.2.10. Protein analysis
2.2.10.1. Protein extraction from human cell lines
Medium was removed from a 75-cm2/250-ml tissue-culture flask of cells and the
cells washed once with 5-10 ml ice-cold PBS. Cells were scraped from the
bottom of the flask and collected using more ice-cold PBS to wash out the
flask. The cells were pelleted by centrifuging at ~250 g for 10 min. at 4°C. The
PBS was removed and the cell pellet was re-suspended in 100-200 pi RIPA
buffer with 2 -4 pi 50x solution of protease inhibitors. The cells were aspirated
with a pipette and then with a 21-gauge needle to break them open. The
solution of disrupted cells was left to incubate on a rotor at 4°C for 30 min.
followed by centrifugation at 4°C at ~18 000 g for 20 min. The supernatant,
containing the solublized protein extract of the cells, was transferred to a fresh
tube and stored at -80°C.
2.2.10.2. Protein assay
All cell protein extracts were assayed using the Bio-Rad Protein Assay dye, a
procedure based on the Bradford method, a dye-binding assay in which a
differential colour change of the dye occurs in response to various
concentrations of protein.
The dye reagent was first prepared by diluting one part dye reagent
concentrate with four parts distilled, dH20 . The diluted reagent was filtered
through Whatman #1 paper to remove particulates. Four dilutions (62.5, 125,
250 and 500 pg/ml) of bovine serum albumin (BSA) were prepared as a protein
110

standard as well as 2 -3 dilutions of the protein solution to be tested. A 50-pl
volume of each standard and diluted sample was mixed with 1 ml of diluted dye
reagent and incubated at room temperature for a minimum of 5 min.
Absorbance at 595 nm was measured using an Eppendorf BioPhotometer and
the concentration of the cell protein extracts was extrapolated from a standard
curve of BSA concentration vs A595nm.
2.2.10.3. SDS-Polyacrylamide gel electrophoresis (SDS-PAGE) of proteins
Proteins were separated by 12% SDS-PAGE (see section 2.1.3.). Gels were
assembled in a mini-PROTEAN 3 cell. Approximately 50 fig protein extract was
combined with 6x SDS loading buffer (section 2.1.1.), denatured at 96°C for
5 min. and electrophoresed at 200 V for approximately 1 h (or until the loading
dye reached the bottom of the gel) in 1x TGS buffer (section 2.1.1.). For size
comparison, 10 pi pre-stained Precision Plus Protein™ Standards were also
loaded.
2.2.10.4. Coomassie staining SDS-PAGE gels
After SDS-PAGE, the gel was removed and incubated in a solution of 25%
acetic acid and 10% methanol with 0.05% Coomassie brilliant blue dye powder
for 1 h at room temperature, with gentle shaking. The gel was then destained in
a fresh solution of 25% acetic acid and 10% methanol for 1 h at room
temperature, with gentle shaking. The gel was dried on filter paper on a gel
dryer at ~60°C for 1 h.
111

2.2.10.5. Western transfer (Immunoblotting)
The SDS-PAGE gel was placed on filter paper, which was sandwiched next to
a piece of nitrocellulose membrane. The proteins were transferred at 100 V for
1 h in transfer buffer cooled to 4°C.
2.2.10.6. Colourimetric protein detection
The nitrocellulose membrane was blocked overnight in 5% non-fat dried milk,
0.1% (v/v) Tween 20 in PBS at 4°C, with gentle rocking. The following day, the
membrane was washed in PBS with 0.1% Tween 20 (PBS-T) twice for 2 min.
and incubated with the appropriate primary antibody for 1 h at room
temperature, with gentle shaking. A mouse monoclonal anti-harmonin antibody
(Scanlan, et al., 1999) was used for harmonin detection, and a mouse
monoclonal anti-GST antibody was used for detection of GST-fusion proteins.
The membrane was rinsed briefly with two changes of PBS-T and washed with
fresh PBS-T for 15 min. on the shaker, followed by three washes of 5 min.
Next, the membrane was incubated with a biotinylated IgG, raised against the
relevant species (i.e. that which the primary antibody was raised), at room
temperature for 1 h, with gentle shaking (the required dilution factor of each
antibody was determined by titration). The membrane was washed again as
before, then incubated in Streptavidin-AP conjugate (diluted 1 in 2 500 in fresh
PBS-T) for 1 h at room temperature, with gentle shaking. The Streptavidin-AP
solution was removed and the membrane washed twice for 1 min. each in
PBS-T and then twice more for 1 min. with dh^O. The membrane was
developed using Western Blue™ stabilized substrate for alkaline phosphatase
for about 5-10 min., with gentle shaking, until the bands reached the desired
112

intensity. Washing the membrane in water for several minutes halted the
reaction and the membrane was air-dried.
2.2.10.7. Treatment of protein with calf intestinal alkaline phosphatase (CIP)
A 2-pl volume of in wfro-translated harmonin was added to 6 pi dh^O, 1 pi
10x buffer 3 and 1 pi CIP enzyme and incubated at 37°C for 1 h. The digest
was denatured at 96°C for 5 min. in 2 pi 6x SDS loading buffer, run on a 12%
SDS-PAGE gel and analysed on immunoblot.
2.2.11. GST pull-down assay
To identify proteins with which harmonin interacts, a candidate protein was
analysed in an in vitro GST pull-down system. Harmonin isoform a1 was
in vitro-translated from USH1C cDNA and the 3’ portion of a candidate
interacting protein was cloned in a GST vector (pGEX-4T-1) and expressed in
E. coli as a GST-fusion protein.
2.2.11.1. In vitro transcription/translation ofcDNA
The human USH1C cDNA of the main isoform, a1, was sub-cloned into the
pZErO™-2 vector. USH1C was translated in vitro using the TNTR Quick
Coupled Transcription/Translation system.
The Transcend™ Non-radioactive Translation Detection System was used to
confirm the presence of a protein product on immunoblot. An aliquot of the TNT
Quick master mix was removed from the -80°C freezer, rapidly thawed by
113

hand-warming and placed on ice. One microgramme of plasmid DNA template
was added to 40 pi TNT Quick master mix, 1 pi 1 mM methionine, 1 pi
Transcend™ Biotin-Lysyl-tRNA and made up to 50 pi final reaction volume with
nuclease-free water. The components were mixed gently by pipetting and the
reaction was incubated at 30°C for 90 min. and then stored at -20°C until
required.
Following confirmation of translation of a protein of the expected size, further
protein was translated in the absence of the Transcend™ Biotin-Lysyl-tRNA
and detected on immunoblot with harmonin-specific antibodies.
2.2.11.2. Transcend™ non-radioactive translation detection system
To confirm that the in wYro-translation system was working, 1 pi in vitro-
translated harmonin was run on a 12% SDS-PAGE gel, as described in section
2.2.10.3. The gel was blotted onto nitrocellulose membrane, as described in
section 2.2.10.5., and the membrane was blocked by incubating in PBS-T for
1 h at room temperature, with gentle shaking. The membrane was incubated
with a 1 in 2 500 dilution of Streptavidin-AP conjugate in fresh PBS-T for 1 h at
room temperature; with gentle shaking and then developed using Western
Blue™ stabilized substrate for alkaline phosphatase, as described in section
2.2.10.6.
114

2.2.11.3. Expression of GST-fusion protein
Competent BL21 E. coli cells transformed with pGEX-4T-1 constructs
containing the cDNA fragment of the protein of interest cloned downstream of a
GST tag, as described in section 2.2.7.6., were plated onto LB-amplicillin plates
and incubated overnight at 37°C.
Single colonies were picked from the LB-ampicillin plates, used to inoculate
5 ml of LB-ampicillin medium and incubated overnight at 37°C. The following
day, 600 pi of 5-ml overnight culture was used to inoculate 12 ml of pre
warmed, fresh LB-ampicillin medium in a 50-ml tube and the culture was
incubated at a pre-determined temperature for optimal protein expression (28,
30 or 37°C). The optical density (OD) of the 12-ml culture was measured at 600
nm every 15-30 min. until the OD6oo reading was between 0.5 and 0.7. A 1-ml
“pre-induction” sample was then removed from the 12-ml culture and 100 mM
IPTG (Isopropyl-thiogalactosidase) was added to the remaining 11 ml to a final
concentration of 0.1 mM (11 pi) and incubation at the appropriate temperature
was continued for 2 -3 h. Cells were then pelleted in 1.5-ml aliquots by
centrifuging at ~18 000 g for 3 min. and cell pellets were frozen at -80°C prior
to protein extraction.
2.2.11.4. Protein extraction from E. coli
GST-fusion proteins were extracted from E. coli cell pellets using Bug Buster®
Protein Extraction Reagent with Benzonase. The cell pellet from a 1.5-ml
aliquot of cultured cells was re-suspended in 300 pi BugBuster® with 6 pi 50x
115
protease inhibitors. The cell suspension was incubated at room temperature for
20 min., with rotation. Insoluble cell debris was removed by centrifugation at
4°C at 16 000 g for 20 min. The supernatant was transferred to a fresh 1.5-ml
tube and either used directly or stored at -80°C until required.
2.2.11.5. Preparation of glutathione Sepharose beads
Glutathione Sepharose™ 4B is supplied as a 75% slurry. The beads were re-
suspended by gently shaking the bottle and 133 pi of the 75% slurry was
removed and transferred to a 1.5-ml tube. The beads were pelleted by
centrifugation at 500 g for 5 min. and the supernatant was removed.
Glutathione Sepharose™ 4B beads were washed by mixing with 1 ml cold
(4°C) 1x PBS, to remove the 20% ethanol storage solution. The beads were
pelleted again by centrifuging at 500 g for 5 min. and the wash solution
removed. The beads were pre-blocked by adding 1 ml 1% BSA in PBS and
incubating at room temperature for 15 min., with rotation. The beads were
pelleted as before, the supernatant removed and the beads washed four more
times with 1 ml cold PBS, as described above. Finally, the bead pellet was re
suspended in 100 pi PBS to give a 50% slurry.
2.2.11.6. Purification of GST-fusion protein
The proteins extracted from a 1.5-ml aliquot of E. coli cells, as described in
section 2.2.11.4., were incubated with 20 pi pre-blocked 50% Glutathione
Sepharose slurry (i.e. a 10-pl gel bed volume) at room temperature for 30 min.,
with rotation. Beads were pelleted by centrifugation at 500 g for 5 min. and the
116

supernatant removed. The beads were washed three times with 100 jj.I 0.1%
Triton and 0.5 mM NaCI in PBS, followed by three washes with 100 pi 0.1%
Triton in PBS and a final wash with 100 pi PBS. The bead pellet was then re
suspended in 10 pi PBS and 2 pi 6x SDS loading buffer and denatured at 96°C
for 5 min. before running on a 15% SDS-PAGE gel, as described in section
2.2.10.3.
Purified GST-fusion proteins were visualised on Coomassie-stained SDS-
PAGE gels (see section 2.2.10.4.), or on immunoblots (see section 2.2.10.5.),
and compared with unpurified cell lysates.
2.2.11.7. Protein-protein interaction assay
The cell lysate extract from a 1.5-ml aliquot of E. coli cells containing the GST-
fusion protein of interest was incubated with 20 pi of a 50% slurry of
Glutathione Sepharose™ 4B for 30 min. at room temperature, with rotation.
The beads were washed three times with 100 pi 0.1% Triton in PBS and then
incubated with 3 pi in wfro-translated harmonin, diluted in 100 pi PBS, for 1 h at
room temperature, with rotation. Beads were washed three times with 100 pi
0.1% Triton and 0.5 mM NaCI in PBS, followed by three washes with 100 pi
0.1% Triton in PBS and a final wash with 100 pi PBS.
As a negative control, the above procedure was repeated with the GST protein
tag alone and a GST-MCC2 fusion protein, shown previously to interact with
harmonin (Ishikawa, et al., 2001), was used as a positive control. After the final
117

wash, 10 |al PBS and 2 pi 6x SDS loading buffer were added to the Glutathione
Sepharose™ 4B, incubated at 96°C for 5 min. and the supernatant was
electrophoresed on a 12% SDS-PAGE gel, as described in section 2.2.10.3.
Proteins were transferred from the SDS-PAGE gel onto nitrocellulose
membrane, which was then developed using the mouse monoclonal anti-
harmonin antibody, as described in section 2.2.10.6.
118

3. USH1C Mutation Screen
3.1. Introduction
Prior to gene identification, Usher type 1C was thought to be rare outside the
Acadian population of Louisiana. However, during the early part of this work,
other groups identified mutations in patients from Pakistan, India, Lebanon and
Europe (Table 3.1).
Table 3.1. Ethnic origins of Usher type 1C patients
Mutation Ethnic Origin Reference
238-239insC Pakistani
European
(Bitner-Glindzicz, etal., 2000;
Verpy, etal., 2000)
(Verpy, etal., 2000)
216G>A Acadian (Bitner-Glindzicz, etal., 2000)
IVS5-2delA Lebanese (Verpy, etal., 2000)
IVS1+1G>T European (Zwaenepoel, etal., 2001)
R31X European (Zwaenepoel, etal., 2001)
IVS5+1G>A European (Zwaenepoel, etal., 2001)
IVS8+2T>G Pakistani (Ahmed, etal., 2002)
769-770ins36 Indian (Ahmed, etal., 2002)
At the start of this work it was not known whether allelic mutations in USH1C
might also be responsible for DFNB18, a recessive, non-syndromic form of
deafness, for which the locus was shown, by linkage, to overlap with the
USH1C region (Jain, et al., 1998). As transcripts containing the alternative
exons A-F and G/G’ did not appear to be expressed in the eye (Verpy, et al.,
119

2000), we and others hypothesized that mutations in these exons could lead to
hearing defects without retinal degeneration and that DFNB18 and USH1C
could be allelic variants of the same gene.
Given the recent findings of USH1C mutations in individuals of diverse ethnic
backgrounds it was essential to know whether mutations in USH1C are a
common cause of Usher syndrome type 1 in the UK and whether mutations in
this gene contribute significantly to non-syndromic deafness in our population.
It was also hoped that the identification of novel mutations in USH1C might
yield information about important functional domains in the protein, harmonin.
To address this question, two cohorts of patients were screened for mutations
in the USH1C gene; 1) fourteen British individuals, of mixed ethnic origins, that
had been diagnosed with Usher type 1 by clinicians at Moorfields Eye Hospital,
and 2) sixteen Caucasian sib pairs and two small consanguineous families,
from the UK, with congenital/childhood onset non-syndromic deafness, who
showed concordance for polymorphic markers flanking the DFNB18 locus (see
section 2.1.5.2.).
3.2. Methods in Brief
All twenty-eight coding exons of the USH1C gene were amplified in each
patient of both cohorts using touchdown PCR, as described in section 2.2.1.1.
Hetero-duplex analysis was carried out on each exon fragment by DHLPC
using the Transgenomic™ WAVE DNA analysis system, as detailed in
2.2.3. Exons, in which hetero-duplexes were identified, were then sequenced
120
section
using the fluorescent dideoxy terminator method (section 2.2.4.) and analysed
on the automated ABI 377 gel electrophoresis system.
Intragenic SNPs associated with a recurring USH1C mutation were
investigated using restriction enzyme digests tests, as detailed in section 2.2.6.
The phase of two novel coding changes in another Usher type 1 patient was
determined by employing a strategy of long-range, nested, allele-specific PCR
(section 2.2.1.2.).
The genotypes of sibs affected with Usher type 1 were ascertained by
analysing markers flanking the four major USH1 loci (USH1B, USH1C, USH1D
and USH1F), as described in section 2.2.5.1.
3.3. Results
3.3.1. Type 1 Usher patients
In the cohort of fourteen British individuals, of mixed ethnic origins, who had
been diagnosed with Usher syndrome type 1, two of the patients were found to
have the 238-239insC mutation (Fig. 3.1) reported previously (Bitner-Glindzicz,
et al., 2000; Verpy, et al., 2000; Zwaenepoel, et al., 2001). A patient of Greek
Cypriot origin was homozygous for 238-239insC, while the other patient, a
British Caucasian, was found to be heterozygous for the mutation, but a second
mutation could not be identified.
A third patient, of mixed Zulu and Ghanaian parentage, was found to be
heterozygous for two, novel, coding changes. The first change was a G>A
121

transition at nucleotide 388 (numbered according to Kobayashi, et al., 1999)
(Fig. 3.2), resulting in a valine to isoleucine substitution at codon 130 (V130I)
within the first PDZ domain of the protein. The second change was a G>T
transition at nucleotide 1447 of the major isoform (Fig. 3.3), leading to an
alanine to serine substitution at codon 483 (A483S) within the third PDZ
domain. This patient was also heterozygous for two novel intronic changes,
IVS12-42C>T and IVS13-12G>A, which have not been reported previously. At
the time, ethnically matched controls could not be obtained to screen for these
changes, however, none of them were observed in any of the other pan-ethnic
patients (fourteen with Usher type 1 and eighteen with non-syndromic
deafness), or the ninety-six control DNA samples that were analysed.
122

Inte
nsity
(m
V)14
A) Wild typei*1 0
■
4
a
o<4■a l
B) 238-239insC Mutation
4 -
a
o
t >
C) IVS2-16C>T Polymorphism
A A^ vy-V .
N>W Retention Time (min)
C T 5 4 c c : C C C -0 B [ 6 C I c c
C T G A C C C C C C C G G C G C T
G 6 C A T T C C C G G C A T T T C C
Wildtype IVS2-16C>T
Figure 3.1. DHPLC and
sequencing data for
USH1C exon 3 changes.
Electropherograms from DHPLC analysis are shown on the left and the corresponding homozygous sequence data is shown on the right.A) Elution curve for wild type exon 3 fragments.B) The heteroduplex formed when a fragment containing the 238-239insC mutation is spiked with a wild type fragment is eluted earlier than the wild type.C) The heteroduplex formed when the same fragment of DNA contains the SNP IVS2-16C>T and is spiked with a wild type fragment, is eluted slightly later then the 238-239insC heteroduplex. Corresponding nucleotide changes are underlined on sequence chromatograms.

IA) Wild type
B) 388G>A Mutation
ii
\ I
1 I
v
j y ^ \i•
-4--- i
f ........t—..... ..................r— ... i— '-"T1... .( 1 1 } I 5 (
Retention Time (min)
Figure 3.2. DHPLC and
sequencing data for
USH1C exon 5 changes.
Electropherograms from
DHPLC analysis are shown
on the left. The corre
sponding sequence data
shown on the right is for the
reverse strand.
A) Elution curve for wild
type exon 5 fragments.
B) The heteroduplex formed
by the 388G>A mutation is
eluted slightly earlier than
the wild type. The corres
ponding nucleotide sub
stitution is underlined on the
sequence chromatogram.

Inte
nsity
(m
V)
Electropherograms from DHPLC analysis are shown on the left and the corresponding sequence data is shown on the right.A) Elution curve for wild type exon 18 fragments.B) The heteroduplex formed by the 1447G>T mutation is eluted earlier than the wild type.C) The heteroduplex formed by the SNP 1440O T is eluted just after the 1447G>T heteroduplex. The corresponding nucleotide substitutions are underlined on the sequence chromatograms.
A) Wild type
B) 1447G>T Mutation
Figure 3.3. DHPLC and
sequencing data for USH1C
exon 18 changes.
C) 1440O T Polymorphism
\ /V
Retention Time (min)MCJi
3.3.1.1. Haplotype analysis
Subsequent to identification of two novel coding missense changes in the
Usher type 1 patient of Zulu and Ghanaian parentage (SM), DNA from her
affected sib (YM) became available and it was confirmed that she was also
heterozygous for the V130I and A483S coding sequence changes. To ascertain
whether the sibs only show linkage to USH1C and to exclude linkage to the
other three major USH1 loci (USH1B, USH1D and USH1F), haplotype analysis
was carried out by genotyping the sibs for markers flanking each locus. Linkage
to USH1D and USH1F was excluded, but there was co-segregation of markers
flanking both USH1B and USH1C (Fig. 3.4). Therefore, these sequence
changes were investigated further to establish whether they might represent
disease-causing mutations or rare polymorphisms.
126

CQ
V)3
OX«03
XCO
CO3
D11S1321
D11S4179*
D11S4186*
D11S4166
D11S4160
D11S1981
D11S921
D11S902*
D11S4138*
D11S1888
D10S1685
D1 OS 1650*
D1 OS 1694*
D1 OS 1790
D1 OS 1643*
D1OS1124*
D1OS1788
DistancecM/kb
1.65/734
0.55/572
1.28/1479
0.0/41
0.0/198
0.0/204
0.0/267
0 .0/22
1.68/814
0.56/134
0 .0/66
1.07/1817
0.0/913
SM203 211
236 236
163 163
116 120
268 252
157 153
247 247
147 147
199 195
217 213
269 267
139 135
147 147
187 183
147 125
201 201
260 246
YM203 211
236 236
163 163
116 120
268 252
157 153
247 247
147 147
199 195
217 213
269 277
139 147
147 139
187 185
147 145
201 201
260 250
Figure 3.4. Data from genotyping sibs SM and YM for markers flanking the
major Usher type 1 loci.
Markers flanking each of the USH1 loci indicated on the left were genotyped in both sisters. The alleles identified in each sib for each marker are given in base pairs underneath the corresponding sister. Bars of the same colour indicate alleles shared by the sisters. Asterisks denote the markers closest to the gene in question (D10S1650 and D10S1694 both lie within the USH1D gene, CDH23). Genetic distance, in cM, (data obtained from htto://research. marshfieldclinic.org/qenetics/) and physical distance, in kb, (data obtained from http://www.ensembl.org/) between the markers at each locus, are also given.
127

3.3.1.2. Allele-specific PCR
To establish if the two novel missense coding changes, 388G>A and 1447G>T,
could be sufficient to cause Usher sydrome, a recessive disorder, it was first
necessary to determine whether or not these changes were inherited in trans or
cis. In the absence of parental DNA, or any material for RNA extraction, a
strategy of long-range PCR was employed, to amplify the 26.5 kb of genomic
DNA that encompasses both changes. This was followed by a series of nested,
allele-specific PCRs to determine whether these changes occur in cis or trans
in these sibs (Fig. 3.5).
Ex5 Variant (A) Ex5 Wild type (C
26.5 kb of genomic DNA Ex 18 WHd type (C)Ex18 Variant (A)
Nested, allele-specific PCRs
G' T
OR
Indicates that variants are in
C/SIndicates that variants are in
TRANS
1st roundPCRproduct
Possible 2nd round PCR products
Figure 3.5. Schematic outlining the procedure used to determine the
inheritance pattern of the missense changes, 388G>A and 1447G>T, in
the sisters SM and YM.
The first round of PCR amplifies the 26.5 kb of genomic DNA between exons 5 and 18, indicated as black lines. In a second round of nested, allele-specific PCRs only two out of the four sets of reactions will amplify a product, depending on whether the changes occur in cis or trans. The four PCRs are: 1) wild type forward + wild type reverse, 2) wild type forward + variant reverse, 3) variant forward + wild type reverse and 4) variant forward + variant reverse. If the changes are in cis PCRs 1 and 4 amplify, while if the changes are in trans then PCRs 2 and 3 amplify. Wild type alleles are indicated in green, while the variant alleles are indicated in red.
128

Amplification occurred when the variant exon 5 forward primer was used in
combination with the variant exon 18 reverse primer, and conversely when both
wild type primers were used (Fig. 3.6, lanes 1 and 4). Although there appears
to be a small amount of non-specific product amplified when the variant exon 5
primer and the wild type exon 18 primer were used (Fig. 3.6, lane 3), no
product was observed when the wild type exon 5 primer was used in
combination with the variant exon 18 primer (Fig. 3.6, lane 2). This, therefore, is
a strong indication that the missense changes, 388G>A and 1447G>T, occur in
cis in these sisters and thus reduces the likelihood that they are disease-
causing mutations. Hence, no functional analysis was performed on these
variants.
H2Q 1 2 3 4
23130
941665574361
23222027
Figure 3.6. Products amplified from nested, allele-specific PCRs on
patient SM.Each reaction was carried out using a different combination of forward (for the 388G>A change) and reverse (for the 1447G>T change) oligonucleotide primers: 1) wild type forward (G allele) + wild type reverse (G allele), 2) wild type forward + variant reverse (T allele), 3) variant forward (A allele) + wild type reverse, and 4) variant forward + variant reverse.
129
3.3.1.3. Analysis of 238-239insC mutation
The 238-239insC mutation, found here in a Greek-Cypriot patient and a
Caucasian, has been described on a number of occasions. As it occurs in a run
of six cytosines, it could represent a mutational hotspot in the USH1C gene.
However, using haplotype analysis with intragenic SNPs, Zwaenepoel, et al.
showed that this mutation occurred on the same 39 kb haplotype in a Muslim
family and individuals from Europe, and suggested that it was a founder
mutation (Zwaenepoel, etal., 2001).
To determine if the 238-239insC mutation in our Greek Cypriot patient, and in a
Pakistani patient reported previously (Bitner-Glindzicz, et al., 2000), also both
lie on the same haplotype, the same intragenic SNPs were analysed and
compared with the reported haplotype (Table 3.2).
The haplotype analysis carried out on our Greek Cypriot patient carrying the
238-239insC mutation (Table 3.2) revealed a different haplotype over the 39 kb
compared to that reported previously to be associated with the 238-239insC
mutation (Zwaenepoel, et al., 2001). However, the haplotpye was conserved in
the 7 kb of DNA immediately surrounding the 238-239insC mutation in our
patient. It is, therefore, possible that the mutation is due to an ancient founder
effect, and a cross-over event has since occurred in this Greek Cypriot patient
between the mutation and the first change in the haplotype observed at
IVS13+21C>G (Table 3.2).
130
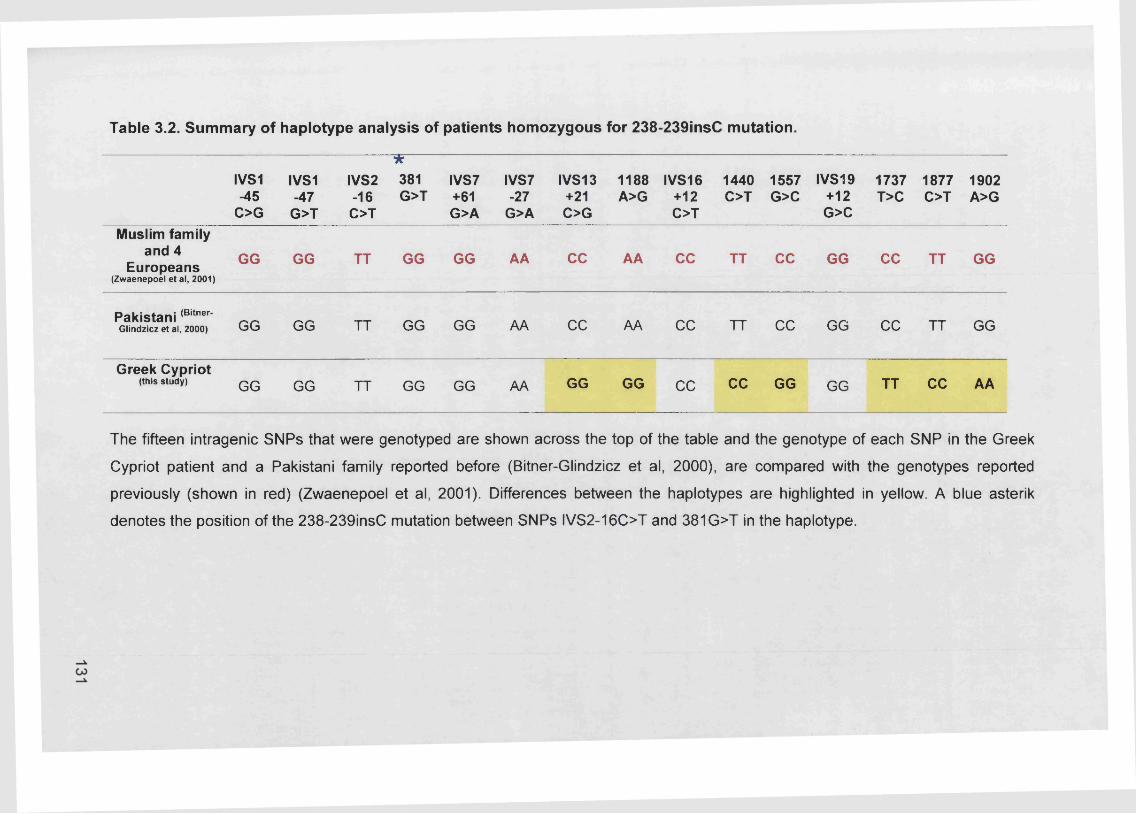
Table 3.2. Summary of haplotype analysis of patients homozygous for 238-239insC mutation. * -----------------------------------------------------------------------------------------
IVS1 IVS1 IVS2 381 IVS7 IVS7 IVS13 1188 IVS16 1440 1557 IVS19 1737 1877 1902-45 -47 -16 G>T +61 -27 +21 A>G +12 C>T G>C +12 T>C C>T A>G
C>G G>T C>T G>A G>A C>G C>T G>CMuslim family
and 4 Europeans
(Zwaenepoel et al, 2001)
GG GG TT GG GG AA CC AA CC TT CC GG CC TT GG
Pakistani(BitnerGlindzicz et al, 2000) GG GG TT GG GG AA cc AA CC TT cc GG CC TT GG
Greek Cypriot(this study) GG GG TT GG GG AA GG GG cc CC GG GG TT CC AA
The fifteen intragenic SNPs that were genotyped are shown across the top of the table and the genotype of each SNP in the Greek
Cypriot patient and a Pakistani family reported before (Bitner-Glindzicz et al, 2000), are compared with the genotypes reported
previously (shown in red) (Zwaenepoel et al, 2001). Differences between the haplotypes are highlighted in yellow. A blue asterik
denotes the position of the 238-239insC mutation between SNPs IVS2-16C>T and 381G>T in the haplotype.

Another possibility is that 238-239insC is a recurring mutation that has arisen
on a common haplotypic background. To investigate this, the haplotype in the
7 kb of DNA associated with the mutation (GTGGA) was examined in two
control populations, fifty-three Pakistani and forty-four Greek-Cypriot DNA
samples (Tables 3.3 and 3.4).
The 238-239insC mutation was, in general, found to be associated with the
more common of the two alleles for each SNP studied (Table 3.5). Five out of
forty-four Greek Cypriot samples and One out of fifty-three Pakistani samples
were found to be homozygous for the GTGGA haplotype (Tables 3.3 and 3.4).
Using the Hardy-Weinberg distribution, p2 + 2pq + q2 = 1, where p is the
haplotype GTGGA and q is any other haplotype, then 34% of the Greek Cypriot
control population (V5/44) and 14% of the Pakistani control population (Vi/53)
would be expected to carry the GTGGA haplotype. The genetic background
reported to be associated with the 238-239insC mutation is not particularly rare
in these two populations and it is therefore possible that this mutation could
have arisen on more than one occasion on the same background.
132

Table 3.3. A 7 kb sub-section of the USH1C haplotype surrounding the
238-239insC mutation found in forty-four Greek Cypriot control DNA
samples.
PolymorphismIVS145 IVS2-16 381 IVS7+61 IVS7 -27
C>G C>T G>T G>A G>A
10
11
V 12 Q.___EnsC/)
13
14
Q 15
16
17
18
19
20
21
22
23
24
Q.Ea</)
PolymorphismIVS145
O GIVS2-16
O T381G>T
IVS7+61G>A
IVS7 -27 G>A
25G T G G GG T G G G
26G T G G GC C G G G
27C c G - GG T G - G
28G C G - GC C G - G
29 G T G G AC C G G G
30 G T G G AG T G G A
31G T G G AC C G G G
32G T G A AG C G A G
33 G T G G GC C G A G
34 G T G G AG T G G A
36C C G G GC C G G G
37G T G - AG T G - A
38G C G - GC C G - G
39 G T G G AC C G G G
40 G T G - GC C G - G
41 G T G G GG C G A G
42 G C G G GC c G A G
43 G T G G GG c G A G
44 G c G G GC c G A G
48 G T G G AG T G G A
49 G T G G AG T T G A
50 G T G G AG T G G A
Possible regions of the haplotype matching those reported previously (Zwaenepoel, et
al., 2001) are highlighted in yellow and samples homozygous for the reported haplotype across the 7 kb region are numbered in red. N.B. the DNA samples are not numbered contiguously.
133

Table 3.4. A 7 kb sub-section of the USH1C haplotype surrounding the
238-239insC mutation found in fifty-three Pakistani control DNA samples.
Polymorphism PolymorphismIVS145 IVS2-16 381 IVS7+61 IVS7-27 IVS145 IVS2-16 381 IVS7+61 IVS7^7
C>G C>T G>T G>A G>A O G O T G>T G>A G>A
42 c o g g a______ c______ C_____ G____ G____ G
Possible regions of the haplotype matching those reported previously (Zwaenepoel, et
al., 2001) are highlighted in yellow and samples homozygous for the reported haplotype across the 7 kb region are numbered in red. N.B. the DNA samples are not numbered contiguously.
134
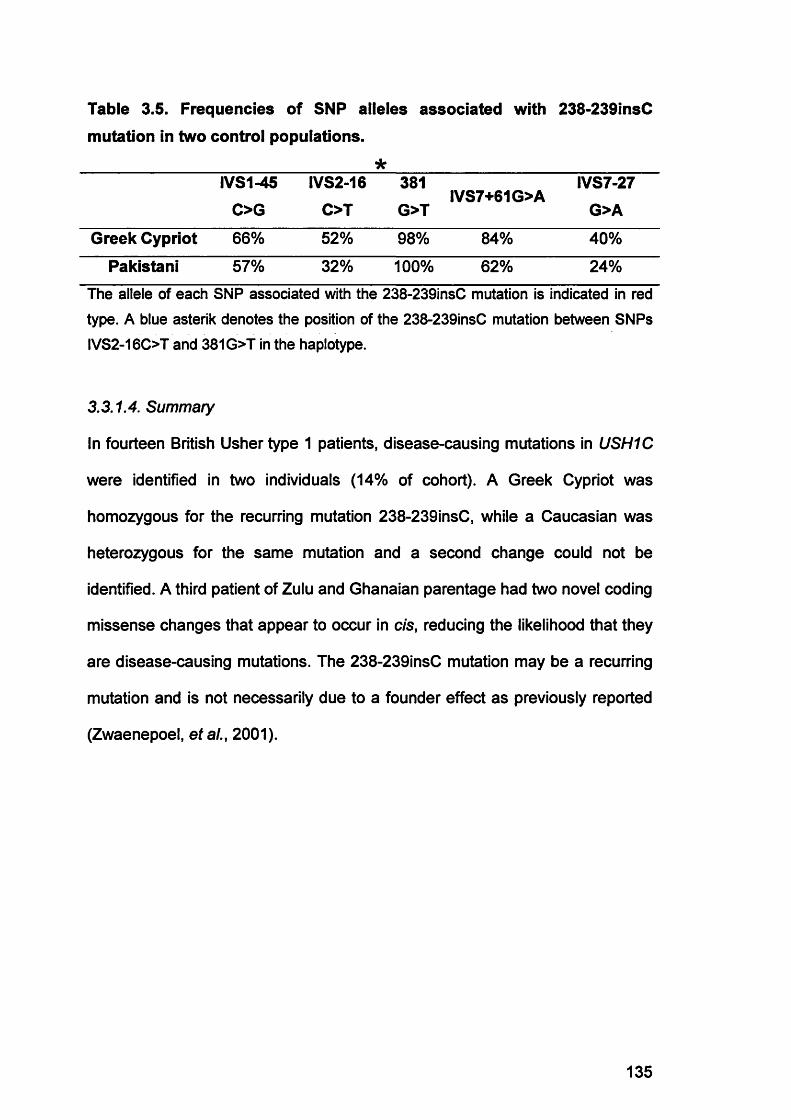
Table 3.5. Frequencies of SNP alleles associated with 238-239insC
mutation in two control populations.
*IVS1-45
C>G
IVS2-16
C>T
381
G>TIVS7+61G>A
IVS7-27
G>A
Greek Cypriot 66% 52% 98% 84% 40%
Pakistani 57% 32% 100% 62% 24%
The allele of each SNP associated with the 238-239insC mutation is indicated in red
type. A blue asterik denotes the position of the 238-239insC mutation between SNPsIVS2-16C>T and 381 G>T in the haplotype.
3.3.1.4. Summary
In fourteen British Usher type 1 patients, disease-causing mutations in USH1C
were identified in two individuals (14% of cohort). A Greek Cypriot was
homozygous for the recurring mutation 238-239insC, while a Caucasian was
heterozygous for the same mutation and a second change could not be
identified. A third patient of Zulu and Ghanaian parentage had two novel coding
missense changes that appear to occur in c/s, reducing the likelihood that they
are disease-causing mutations. The 238-239insC mutation may be a recurring
mutation and is not necessarily due to a founder effect as previously reported
(Zwaenepoel, et al., 2001).
135

3.3.2. Patients with non-syndromic deafness
At the start of this study Usher type 1C and the non-syndromic recessive
deafness, DFNB18, were hypothesized to be allelic disorders since the two loci
had already been shown to overlap (Jain, et al., 1998). To ascertain whether
mutations in USH1C were also responsible for DFNB18 a cohort of patients,
described in section 2.1.3.2., with non-syndromic recessive deafness was
screened.
From a larger cohort of 133 (Navarro-Coy, et al., 2001), a group of sixteen
Caucasian sib pairs with congenital/childhood onset non-syndromic deafness
from the UK and two small consanguineous families showed concordance for
polymorphic markers flanking the DFNB18 locus. All twenty-eight exons of
USH1C in this cohort were screened, but there was no evidence of mutations in
the coding region of USH1C in these patients with autosomal non-syndromic
recessive deafness.
3.3.2.1. Summary
No disease causing mutations were found in the USH1C gene in our cohort of
patients with non-syndromic autosomal recessive deafness.
136
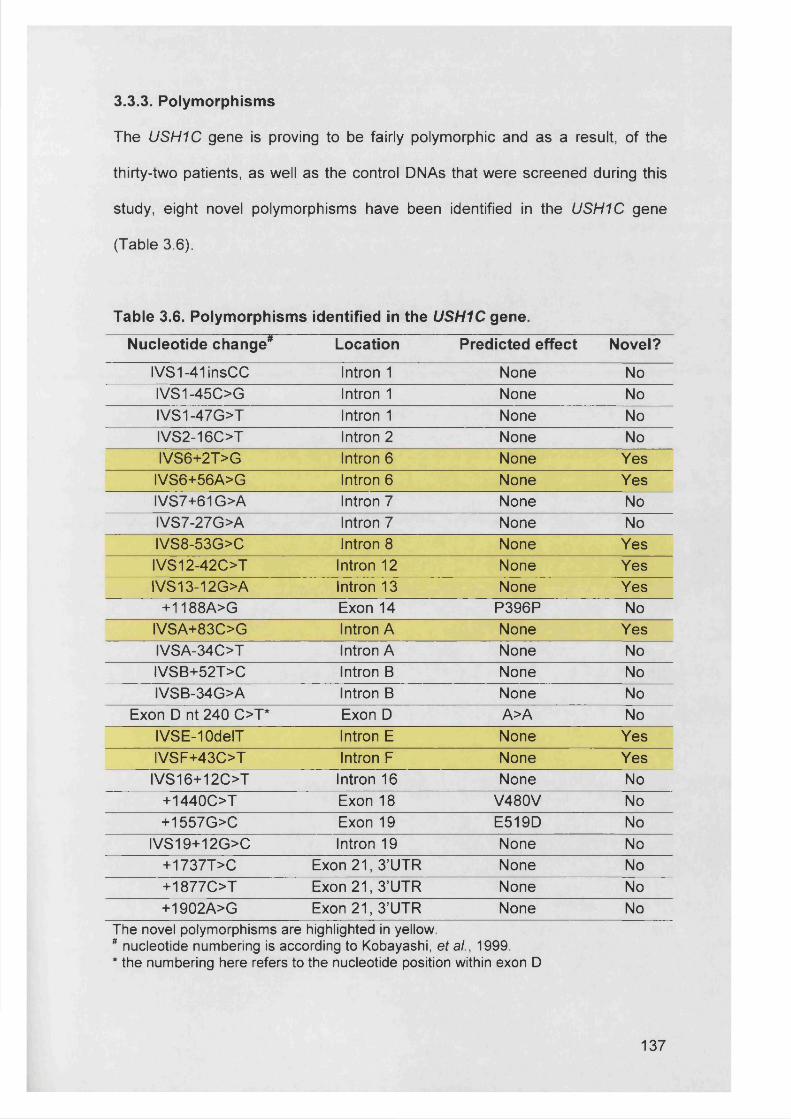
3.3.3. Polymorphisms
The USH1C gene is proving to be fairly polymorphic and as a result, of the
thirty-two patients, as well as the control DNAs that were screened during this
study, eight novel polymorphisms have been identified in the USH1C gene
(Table 3.6).
Table 3.6. Polymorphisms identified in the USH1C gene.
Nucleotide change* Location Predicted effect Novel?
IVS1-41insCC Intron 1 None NoIVS1-45C>G Intron 1 None NoIVS1-47G>T Intron 1 None NoIVS2-16C>T Intron 2 None NoIVS6+2T>G Intron 6 None Yes
IVS6+56A>G Intron 6 None YesIVS7+61G>A Intron 7 None NoIVS7-27G>A Intron 7 None NoIVS8-53G>C Intron 8 None YesIVS12-42C>T Intron 12 None YesIVS13-12G>A Intron 13 None Yes
+1188A>G Exon 14 P396P NoIVSA+83C>G Intron A None YesIVSA-34C>T Intron A None NoIVSB+52T>C Intron B None NoIVSB-34G>A Intron B None No
Exon D nt 240 C>T* Exon D A>A NoIVSE-10delT Intron E None YesIVSF+43C>T Intron F None YesIVS16+120T Intron 16 None No
+1440C>T Exon 18 V480V No+1557G>C Exon 19 E519D No
IVS19+12G>C Intron 19 None No+1737T>C Exon 21, 3’UTR None No+1877C>T Exon 21, 3’UTR None No+1902A>G Exon 21, 3’UTR None No
The novel polymorphisms are highlighted in yellow.# nucleotide numbering is according to Kobayashi, et al., 1999.* the numbering here refers to the nucleotide position within exon D
137

3.4. Discussion
3.4.1. Usher type 1 patients
Until recently, Usher syndrome type 1C was believed to be a disease exclusive
to the Acadian population of Louisiana (Astuto, et al., 2000). In a study of 151
families with type 1 Usher syndrome in the United States, only the two Acadian
families included as controls showed evidence of linkage to the USH1C region,
whilst linkage to this region was excluded in all other families. However, since
the USH1C gene has been identified, mutations have been reported in
individuals of diverse ethnic origins, including Pakistani families (Bitner-
Glindzicz, et al., 2000), Lebanese families (Verpy, et al., 2000), Caucasian
families from Germany,. Switzerland and Denmark (Zwaenepoel, et al., 2001),
an Indian family (Ahmed, et al., 2002) and here, in a Greek Cypriot family.
Thus, in Europe, mutations in the USH1C gene may account for a greater
proportion of Usher type 1 than originally thought. In our cohort of patients with
a firm diagnosis of Usher syndrome type 1, 14% (2/14) were found to be due to
mutations in USH1C.
3.4.2. USH1C alleles
3.4.2.1. Missense coding changes
To date, missense mutations in USH1C have not been identified in Usher type
1C patients, only splicing, frameshift and truncating mutations (see Table 3.1).
The possibility of missense mutations in USH1C is intriguing and has the
potential to yield more information about the function of this protein than is
currently known.

In this study two novel coding missense changes were identified in sisters of
Zulu and Ghanaian parentage. The nucleotide change 388G>A, is predicted to
translate to a V130I change in PDZ1 of the protein sequence, while 1447G>T is
thought to lead to a A483S change in PDZ3 of harmonin. Although these two
changes are predicted to result in fairly conservative amino acid changes, i.e.,
a hydrophobic valine to a hydrophobic isoleucine and a hydrophobic alanine to
an uncharged serine, both residues are conserved in the mouse harmonin
sequence and they lie within the first and third PDZ domains, respectively
(Fig. 3.7). Hence, it is possible that these changes have an important role to
play in the folding or ligand recognition of these PDZ domains.
When the amino acid sequences of the USH1C PDZ domains are compared
with PDZ domains found in other proteins (Fig. 3.7), it can be seen that an
isoleucine or serine residue does occur at these positions in other functional
PDZ domains. Furthermore, these changes do not affect the critical residues,
pB5 and aB1, thought to be involved in defining the ligand specificity of a PDZ
domain (Bezprozvanny and Maximov, 2001; Bezprozvanny and Maximov,
2002), and so it is likely that harmonin is able to function normally with these
changes.
139

140
|3AHa rmonin_HUMAN/PDZ1 Harmonin_HUMAN/PDZ2 Harmonin_HUMAN/PDZ3 Harmonin_MOUSE/PDZ1 Harmonin_MOUSE/PDZ2 Harmonin_MOUSE/PDZ3 AF6 _HUMAN/991-1076 APB1_HUMAN/656-741 APBl_HUMAN/7 47-823 APB2_HUMAN/568-653 APB2_HUMAN/659-735 APB3_HUMAN/394-479 APB3_HUMAN/485-561 APXL_HUMAN/2 6-10 8 CSKP_HUMAN/4 90-571 CSKP_HUMAN/490-571 DLG1_HUMAN/224-311 DLGl_HUMAN/319-406 DLGl_HUMAN/466-547 DLG3_HUMAN/131-218 DLG3_HUMAN/226-313 DLG3_HLJMAN/386-4 67 DLG4_HUMAN/108-195 DLG4 HUMAN/203-290
LHPEG. KVFI SI VGSRG.
IKKEGs E'/RL DP LHPEG.
VGSRG. DVRLLRIKKEGs
KKQNG. DVFIEKQKGEI. TVLIRRPDLRYq
HKGEI. PDLKYq
KVHLEKRRGEG. TAIIHRPHAREq
SGGAP...:. NTDEP.
LVQFQRNTDEP. EITLERGNSG-.
GPKG-. KWLHRGSTG-. EIVLERGNSG-. EVNLLKGPKG-.
GSTG-. EITLERGNSG-.
GPKG-.
PC <xA PD pE aB PFGLA HIIKGGQADSV-GLQVGDEIVRINGY 3ISSCTHEEVINLIR---------------GI FI 3:: KPGSLSAEV-GLEIGDQ.1YEVNGV DFSNLDHKEAVNVLKNS------------
A .YERGAAERHGGIVKGDE NGF IVTDYTLAEADAALQKA----------------------GLFISHLIKGGQADSV-GLQVGDEIVRINGYSISSCTHEEVINLIR---------------GIFVSHVKPGSLSAEV-GLETGDQIVEVNGI [ FTNLDHKEAVNVLKSS------------- . . YEGGAAERHGGWKGDEI MAINGK VTDYTLAEAEAALQKA------------GIYVKS VVKGGAADD-GRLAAGDCLLSVDGRSLVGLSQERAAELMTRTSSWTLEVAKQG T MHGGPAEKSGKLNIGD NGA LVGLPLSTCQSIIKGLEN, VR- I .cslmrggiaer-ggvrvghriieingq; watphekivhilsnavgeihmktmpaaTVI LANMMNGGPAARSGKLSIGDQIM3INGTSLVGLPLATCQGIIKGLKNQTQVKL11 VS
MRGGIAER-GGVRVG’ : NG, VVATAHEKIVQALSNSVG AAT - A LHGGPAERSGALSIGDr A INGT LVGLPLAACQAAVRETKSQT3 Y VH- IICSLLRGGIAER-GGIRVGHRIIEINGC SWATPHARIIELLTEAYGEVHIKTMPAA- EEGSKAAAVDKLLAGD ’ NDI -LSGFRQEAICLVKGSHK YAV'KRRS-ClVARIMHGGMIHRQGTLHVGDEIREINGISVANQTVEQLQKMLREMRGSITFKIVPSY- i VAR I MHGGM IHRQGT LHV GD F IR F ,! NG SVANQTVEQLQKMLREMRGS I TFK : SY
.LG GTDNPHIGddsS ITGGAAAQDGRLRVND Q NE VRDVTHSKAVEALKEAGS RK
.LG IA GVGNQHIPgdns V IEGGAAHKDGKLQIGD LLA rNN LEEVTHEEAVTALKNTSD APT
.LG GEDGE ...G LAGGPADLSGELRKGD NS LRAASHEQAAAALKNAGQ RP
.LG. . GIDNPHVPddpG IPGGAAAMDGRLGVND : . . NE VSEWHSRAVEALKEAGP 'RRRQ
.LG IAGGIGNQHIPgdnS IEGGAAQKDGRLQIGD NN LQDVRHEEAVAS LKNTS D PG
.LG GEDGE ...G LAGGPADLSGELRRGD NG LRNATHEQAAAALKRAGQ . RP
.LG GTDNPHIGddpS IPGGAAAQDGRLRVND A NE VREVTHSAAVEALKEAGS RK
.LGA GVGNQHIPgdnS IEGGAAHKDGRLQIGD NS LE DVMHE DAVAALKNTYD PS
PB.LGLSVRGGLEFGC— .LG GPIQKP—.LDLAL1' GVDSPIGK.LGLSVRGGLEFGC-- . LGC . GPIQKP—LD . GVDSPVGK .MG AKGAGQDKl.LG SGWGSILP.LGFSVQNG-------.LG SGWGSILP.LG• QNG-------.LG SGWGSLLP.LGFC 5DG-------.w g f t l k g g r e h g e p -.MG NELNH---.MG NELNH---
T (PB5) I' (a B l)Figure 3.7. Alignment of PDZ domains (adapted from the PROSITE entry #PS50106, http://ca.expasy.org/prosite/).
A selection of PDZ domains aligned in CLUSTAL format with the three human harmonin PDZ domains at the top (indicated in red text) and the three mouse harmonin PDZ domains below (indicated in green text). The residues involved in the six p-sheets (Pa-Pf) in the PDZ domain are denoted by blue text, while the residues involved in the two a-helices (aA-aB) are identified with pink text. The two amino acid residues, pB5 and aBi, denoted by appropriately coloured arrows at the bottom, are considered to be critical for determining the ligand binding specificity of a PDZ domain. The more highly conserved residues are highlighted in grey, while the PDZ1 and PDZ3 changes, V130I and A438S, respectively, are labelled in red. Amino acid residues that are identical to those changes found in the patient are highlighted in yellow.

In addition, the allele-specific PCRs (Fig. 3.6) indicate that the two coding
changes, 388G>A and 1447G>T, are present in cis in these sisters, since the
PCRs using either wild type primers or variant primers amplified products
(Fig. 3.6, lanes 1 and 4). Although there also appears to be some amplification
from the variant forward primer with the wild type reverse primer (Fig. 3.6, lane
3), the specificity of amplification from allele-specific primers depends on
various PCR conditions, including primer design, Taq polymerase
concentration and MgCk concentration, whilst the conditions for long-range
PCR are equally critical (Barnes, 1994; Zainuddin, et al., 2003). Modification of
the allele-specific primers, so that they have a mismatch base located at the
penultimate 3' position rather than at the 3’ end, may avoid this non-specific
amplification. The missense changes, 388G>A and 1447G>T, probably
represent rare polymorphisms in the USH1C gene, and the sisters are sharing
alleles by chance. By random segregation, sib pairs will share two parental
haplotypes 25% of the time.
The missense changes 388G>A and 1447G>T have not been observed
previously, but the patient has a Zulu father and a Ghanaian mother and
ethnically matched controls could not be easily obtained at the time. So
although these changes may not be present or may be extremely rare in other
populations, they may be more common in either the Zulu or Ghanaian
population. It is interesting that two novel intronic changes were also identified
in these sibs and, together with the additional novel coding changes, this may
reflect the greater genetic diversity observed in African populations (Tishkoff, et
al., 1996).
141

The sisters also showed co-segragation with markers flanking USH1B
(Fig. 3.4), therefore, the Usher type 1 phenotype observed in these sibs could
be due to mutations in the USH1B gene, MY07A. However, there is also the
possibility that this variant USH1C allele is acting as a modifier, since the
retinitis pigmentosa observed in these sibs is unusually severe, or there could
be digenic inheritance.
Digenic inheritance between two other Usher genes, USH1B and USH3, has
already been proposed. Two affected brothers in a family of Jewish Yemenite
origin were found to have different Usher phenotypes; one had a typical USH1
phenotype, while the other had a typical USH3 phenotype. Both showed
linkage to the USH3 locus. However, the brother with the USH1 phenotype had
also inherited a mutated MY07A allele from his mother. The mother and two
unaffected siblings, who were all double heterozygotes for the mutated MY07A
allele and for a single USH3 haplotype, showed no evidence of an Usher
phenotype or deafness. Hence, this recessive MY07A allele was only
phenotypically expressed on the background of two defective USH3 alleles,
indicating a possible interaction between the two gene products (Adato, et al.,
1999).
Myosin VIIA and harmonin have now been shown to interact at the protein level
and the harmonin b isoform is mislocalized in shaker-1 mice, the mouse model
for Usher type 1B (Boeda, et al., 2002). Hence, it is feasible that the single
USH1C allele identified here could modify the expression of a MY07A allele in
some way.
142

3A .2.2. 238-239insC frameshift mutation
The 238-239insC mutation identified here in the homozygous state in a Greek
Cypriot Usher type 1 patient and in the heterozygous state in a Caucasian
Usher type 1 patient, appears to be presenting as a common mutation in the
USH1C gene. Two-thirds of the non-Acadian Usher type 1C patients reported
to date have at least one 238-239insC allele (Ahmed, et al., 2002; Bitner-
Glindzicz, etal., 2000; Verpy, etal., 2000; Zwaenepoel, etal., 2001; this study).
This has important implications for a future diagnostic genetic testing strategy
of Usher type 1 patients.
Most Usher type 1 patients are phenotypically similar and, without a family
history, yield no clues as to the gene responsible. Although mutations in
MY07A (USH1B) are the most common cause of Usher syndrome type 1, with
42% of patients in an American study being positive for USH1B mutations
(Astuto, et al., 2000), this gene does not appear to have any common
mutations and comprises forty-nine exons. Furthermore, CDH23 (USH1D) and
PCDH15 (USH1F), together the second most common cause of Usher type 1
(Astuto, et al., 2000), are also large genes, sixty-nine and thirty-three exons,
respectively, and also do not appear to have common mutations. Mutations in
USH1C now appear to be more prevelant than originally thought and the 238-
239insC mutation is presenting as the first common mutation in an Usher type
1 gene. As a diagnostic strategy it would be sensible to screen new patients for
common mutations first, particularly when a disease, such as Usher syndrome
type 1, is genetically heterogenous and the genes involved are large.
143
What is the mechanism of this common mutation, an insertion of a cytosine in a
run of six? Slipped-strand mispairing is a mechanism by which nucleotides may
be inserted or deleted during DNA replication. A misalignment of base-pairs
may occur at the replication fork within a run of identical nucleotide bases, or a
short tandem repeat, such that a base (or tandem repeat) may be either
misincorporated or lost, depending on whether the newly synthesised strand
slips backwards or forwards with respect to the template strand (Kunkel, 1990).
Slipped-strand mispairing has been found to be a significant cause of deletion
and insertion ‘hotspots’ in human genes, whereby a mutation has occurred
several times independently, (Cooper and Krawczak, 1991; Darvasi and
Kerem, 1995) and it is reasonable to assume that the 238-239insC mutation
may also represent such a ‘hotspot’.
Analysis of USH1C intragenic SNPs (Zwaenepoel, etal., 2001), showed that in
a Muslim family and individuals from Europe the 238-239insC mutation occurs
on the same haplotype, and it was concluded that the prevalence of this
mutation was likely to be due to a founder effect (Zwaenepoel, et al., 2001). If a
mutation is very old, the region that is identical by descent surrounding the
mutation can be very small. When the same USH1C intragenic SNPs were
analysed in our Greek Cypriot patient carrying the 238-239insC mutation
(Table 3.2), the haplotype shared with other patients carrying this mutation was
reduced from 39 kb down to 7 kb. Therefore, if 238-239insC is due to a founder
effect then it can be assumed to be ancient.
However, when the haplotype, GTGGA, associated with the 238-239insC
mutation was studied in the general population, something not done previously,
144

it did not appear to be particularly rare in the Pakistani and Greek Cypriot
populations (Tables 3.3 and 3.4). This suggests that 238-239insC is not
necessarily due to a founder effect, but could have arisen on more than one
occasion on the same, relatively common, haplotypic background and hence,
represent a mutational ‘hotspot’ within the USH1C gene. This is in contrast to
the GJB2 gene where the SNP alleles associated with the common 35delG
mutation, a deletion of a guanine in a run of six guanines, were found to be
significantly very rare in the control population tested (Van Laer, et al., 2001).
The most informative SNP genotype associated with the 35delG mutation was
found in only 1.4% of the control population (Van Laer, et al., 2001). This
compares with the AA genotype of the most informative SNP associated with
238-239insC, IVS7-27G>A, being present in 5% of Pakistani and 16% of Greek
Cypriot controls (Tables 3.3 and 3.4).
3.4.3. Non-syndromic deafness patients
Although no mutations were identified in USH1C in our cohort of sib pairs with
non-syndromic deafness, mutations have since been identified in DFNB18
patients. In one study missense mutations were identified in the alternative
exons B and D expressed in the ear, but not the eye (Ouyang, et al., 2002). In
another study, a splice site mutation was found to lead to ‘leaky’ skipping of
exon 12 such that both the wild type transcript and a variant transcript, which
lacked exon 12, were generated in an in vitro exon-trapping assay (Ahmed, et
al., 2002).
There appears to be a preliminary genotype-phenotype correlation emerging
with the identification of USH1C mutations in patients with non-syndromic
145

deafness. It is becoming apparent that protein truncating mutations of USH1C
lead to the more severe Usher type 1 phenotype, whilst missense mutations in
the alternative exons, or a ‘leaky’ splice site mutation, that still allows the
production of some wild type transcript, result in a non-syndromic form of
deafness. The alternative exons (A-F and G/G’) are utilized in the production of
the longer harmonin b isoform, which was originally thought to be ‘ear-specific’
(Verpy, et a/., 2000) and, indeed, harmonin b has now been shown to be
important for the developing hair cell stereocilia in the mouse cochlea (Boeda,
et al., 2002). However, it also seems that the ear is more sensitive than the eye
to any loss in wild type harmonin protein since a ‘leaky’ splicing mutation
appears to affect the ear, but not the eye (Ahmed, et al., 2002).
Our failure to demonstrate that DFNB18 and USH1C are allelic is most likely
because the deafness in our cohort of families was not truly linked to the
DFNB18 locus. Only one family linked to DFNB18 was published in the
literature (Jain, et al., 1998), and an offer of collaboration was not accepted, so
we chose to screen sib pairs with autosomal, non-syndromic recessive
deafness. There is a 25% chance that any sib pair will be concordant for
markers at any given locus of the genome. Therefore, our sample of 16 sib
pairs concordant for markers flanking DFNB18, derived from the original cohort
of 133, is too small to have a >95% chance of having any truly linked families.
In this cohort, no other DFNB loci appeared to make a significant contribution to
autosomal recessive deafness, after GJB2 (connexin 26), (Navarro-Coy, et al.,
2001). With thirty-seven loci identified to date (HHH), non-syndromic autosomal
recessive deafness (DFNB) is extremely genetically heterogeneous. Since
146

there are no real phenotypic markers available to distinguish between the
different DFNB loci, the contribution made by each locus in a population
becomes an important question when attempting to identify the gene
responsible in a family with non-syndromic autosomal recessive deafness.
However, the absence of USH1C mutations in the cohort screened here, in
itself suggests that the contribution of DFNB18 to non-syndromic deafness as a
whole in the UK is likely to be very minor.
147

4. Alternative USH1C Isoforms
4.1. Introduction
The USH1C protein, harmonin, exists as several alternatively spliced isoforms
(Scanlan, eta!., 1999; Verpy, et al., 2000) (Fig. 4.1), although the physiological
significance of all of these is not yet known. Some isoforms of harmonin appear
to have tissue specific expression patterns. For example, the longer harmonin b
isoforms, with the additional exons spliced in between exons 14 and 16
(Fig. 4.1), were shown by Verpy, et al., to be expressed specifically in the ear
(Verpy, et al., 2000). Hence, it is possible that there are additional, alternative
isoforms of harmonin with tissue-specific patterns of expression.
Some putative harmonin isoforms lack one or two of the PDZ domains
(Fig. 4.1) and, therefore, are not able to form all of the same interactions as can
the longer isoforms. Furthermore, the C-terminus of harmonin itself contains a
PDZ-binding motif that can bind to PDZ1 of an adjacent harmonin molecule
(Siemens, et al., 2002). Hence, isoforms of harmonin with novel C-termini may
loose this interaction, but may also gain novel interactions, depending on
whether or not the new C-terminus forms a PDZ-binding motif. Consequently, it
can be seen how the USH1C gene has the ability to produce several protein
products, each with slightly different binding abilities and the possibility of
different functions in different tissues.
148

1 2 3 ! 4 5 I 7 8 9 1(1d 1? 13 14 1( 17 18 19 ?n 21+
1 2 3 4 5 ( 7 8 9 1Q11 1' 13 14 1iI 1? 18 19 20 _____ 2 1 . . . . .a2
Isoforms with additional exonsb l
b3
1 2 3 4 5 7 8 9 1C11 12 13 14 B | C D E F 18 19 20 21*
1 2 3 4 5 7 8 9 1( 11 12 13 14 B C D E F 1<17 18 19 20 21
1^17 18 19 20 _______ 211 I 2 I 3 I 4 I 5 Ifl 7 I 8 I 9 Ildl1 12 Il3 I 14 I I i t
PDZ-59 1 2 3 4 5 f 7 8 9 1(11 12 13 14 If 17 18 19 20 21
Truncated Isoformsd/PDZ-45
c3
PDZ-37
1 2 3 4 5 7 8 9 1011 12 13 181/t 18 19 20 21*
1 2 3 4 5 7 8 9 10 Y 12 13 14 C E |( 1(Jl7 1t 19 20 21*
1 2 3 4 5 7 8 9 10Y 12 13 14 11A i j lJ l8 I 19 20 21*
1 2 3 4 5 7 8 9 10Y 12 13 14 + 1f| 17 18 19i |20 21*
12 13 14 15 11(17 18 19 20 21
Figure 4.1. Alternative isoforms of USH1C identified to date (adapted from Verpy, et al., 2000).Alternatively spliced isoforms of USH1C reported by Verpy, et al., and Scanlan, et al. Exons are represented by boxes. Constitutive exons are numbered in black, whilst alternatively spliced exons are numbered in pink. In-frame stop codons are denoted by asterisks. Isoforms are grouped into three classes according to the structure of the putative protein isoforms they encode. Transcript a1 represents the major isoform of USH1C. The alternative exon 15 is replaced by exon A in the minor transcript a2 and by a 974 bp sequence encoded by exons A-F in the minor transcripts b1, b2 and b3, which differ by the presence or absence of exon G or G’. PDZ-59 is a minor transcript with exons E and F spliced onto exon 15. Transcripts containing a combination of exon15 and exons A-F (c2) or none of them (c1/PDZ-45), or exon 15 with exon A (c3) or exon F (PDZ-54), premature stop codons are present in exon B, at the exon 14/exon16 junction, in exon 18 and in exon 16, respectively. The putative transcript PDZ-37 lacks the N-terminus and protein translation is initiated from an alternative start codon in exon 12. Red font indicates transcripts described by Verpy, et al., (a1, a2, b1, b2, b3, c1, c2 and c3) and green font indicates those transcripts described by Scanlan, et
al., (PDZ-73, PDZ-45, PDZ-54, PDZ-59 and PDZ-37).
Intriguingly, the family that led to the identification of the USH1C gene, by our
group, presented with profound congenital sensorineural deafness in
149

association with severe hyperinsulinism, enteropathy and renal tubular
dysfunction (Bitner-Glindzicz, et al., 2000). A contiguous gene deletion that
included all but the first two exons of USH1C and twenty-one of thirty-nine
exons of the adjacent ABCC8 gene was found to account for the phenotype in
these patients (Bitner-Glindzicz, et al., 2000). ABCC8 encodes one of the two
components of ATP-sensitive K+ (Katp) channels found in pancreatic p-cells
and mutated in non-syndromic hyperinsulinism (Thomas, et al., 1995); hence,
partial deletion of this gene accounts for the severe hyperinsulinism observed
in the deletion patients. USH1C has since been shown to be the gene
underlying Usher syndrome type 1C and non-syndromic deafness, DFNB18.
Therefore, the deafness in these patients is explained by deletion of the
majority of the USH1C gene. However, how can the enteropathy and renal
tubular dysfunction observed in the deletion patients be explained?
The enteropathy suffered by the contiguous gene deletion patients included
symptoms such as severe diarrhoea and malabsorption, which are not found to
this degree in patients with hyperinsulinism. Furthermore, the enteropathy
observed in the patients resembled that of auto-immune enteropathy (Hussain,
et al., 2004 in press), with associated severe inflammation. Harmonin, the
protein encoded by USH1C, was previously identified as an auto-antigen in
patients suffering from a variant form of X-linked auto-immune enteropathy
associated with tubulonephropathy (Kobayashi, et al., 1999). Therefore, it
appears that deletion of USH1C may also account for the intestinal, and
possibly the renal, phenotype in these patients. However, it then becomes
difficult to explain why Usher type 1C patients with protein-truncating mutations,
such as R31X and 238-239insC (Bitner-Glindzicz, et al., 2000; Verpy, et al.,
150

2000; Zwaenepoel, et al., 2001), at the 5’ end of USH1C do not have an
observable gut phenotype.
It is possible, in the presence of a truncating mutation at the 5’ end of USH1C,
that an alternative isoform of harmonin is still expressed, which is sufficient for
the proper functioning of the gut and/or the kidney. The existence of such an
isoform, known as PDZ-37, was shown by Scanlan, et al. Northern blot analysis
of human brain tissue revealed a harmonin hybridization signal that
corresponded to a size of 1.2 kb, i.e. half the expected size for full length
harmonin. Furthermore, 5’ RACE products, obtained from human brain cDNA,
had 5’ ends equivalent to the sequence of exon 11 of USH1C (Scanlan, et al.,
1999). Hence, whilst the deletion patients lack the ability to make any protein,
patients with truncating mutations at the 5’ end of the gene may still be able to
produce short isoforms, such as PDZ-37, which could be sufficient for normal
gut and kidney function.
However, as PDZ-37 expression had only been detected in the brain, we
decided to investigate the distribution of alternative splice forms of USH1C
more fully. A combination of RACE and RT-PCR methods were used to identify
novel and existing isoforms of USH1C.
4.2. Methods in Brief
4.2.1. RNA extraction
Various tissues were collected from human foetuses ranging from just under
eight weeks (fifty-four days) up to thirteen weeks of development (Table 4.1).
151

Total RNA was extracted from each sample (see section 2.2.2.1.) and first
strand cDNA was synthesized using random nonamer oligonucleotides in
combination with a poly-dT oligonucleotide (see section 2.2.22.). The quality of
each cDNA sample was confirmed by amplification with gene-specific
oligonucleotides for the house-keeping gene hypoxantine phospho-
ribosyltransferase (HPRT). The HPRT amplification also confirmed that the
samples were not contaminated by genomic DNA, since the oligonucleotides
used were specific for different exons of HPRT. The cDNA samples were then
ready for gene-specific analysis.
152
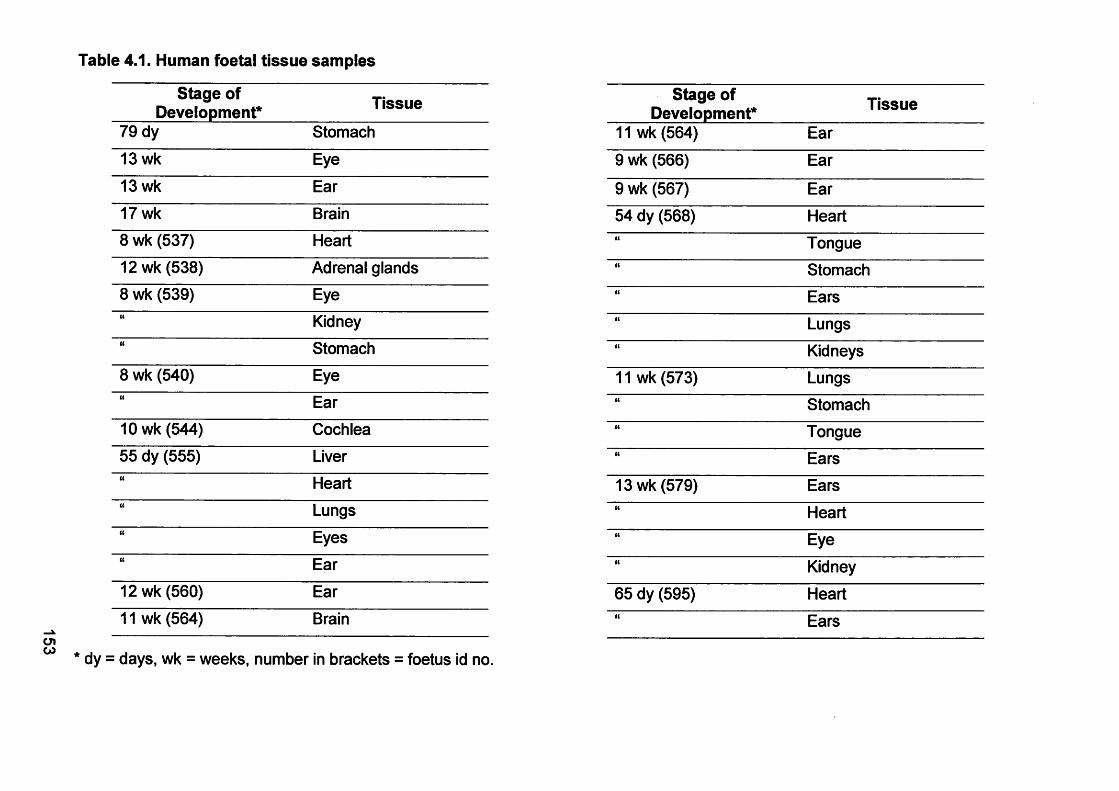
Table 4.1. Human foetal tissue samples
Stage of Development* Tissue Stage of
Development* Tissue
79 dy Stomach 11 wk (564) Ear
13 wk Eye 9 wk (566) Ear
13 wk Ear 9 wk (567) Ear17 wk Brain 54 dy (568) Heart8 wk (537) Heart it Tongue12 wk (538) Adrenal glands it Stomach8 wk (539) Eye it Earsu Kidney ii Lungsit Stomach it Kidneys8 wk (540) Eye 11 wk (573) Lungs<i Ear ii Stomach10 wk (544) Cochlea ii Tongue55 dy (555) Liver ii Earsit Heart 13 wk (579) Earsic Lungs ii Heartit Eyes ci Eyeic Ear ii Kidney12 wk (560) Ear 65 dy (595) Heart11 wk (564) Brain ii Ears
* dy = days, wk = weeks, number in brackets = foetus id no.

4.2.2. 5’ RACE
To investigate the possibility of additional alternative isoforms of USH1C,
5’ RACE was performed on total RNA extracted from eight-week human foetal
ear tissue. Briefly, first-strand cDNA was synthesised from total RNA extracted
from the human foetal ear tissue using a gene-specific oligonucleotide located
in exon 18 (5’GSP1) of USH1C. Next, a polycytosine tail was added to the 5!
end of the first-strand products. Finally, the dC-tailed first-strand products were
amplified using forward oligonucleotides specific to the dC-tail and reverse
gene-specific oligonucleotides, in a set of nested PCRs (Fig. 4.2).
m RNA
I (A)n
G S P 1
j \ 5 ’ -------------------------------------------(A)n' 3’ ♦—
ii)l
3’ 5 ’
Ij i i ) 3>CC::::CC------------------------------- ■ ■ 5’
A A P X
iv ) 3»CC::::CC 5 ’GSP2
V)
i5 '[Z Z D G I::::::IG ■ ■ 3’3*I IC C ::::C C --------------------------------- 5’
nestedGSP3
Figure 4.2. Schematic outlining the 5’ RACE procedure used (adapted from
Invitrogen manual).
i) The gene-specific first strand primer, GSP1, is annealed to the mRNA and the mRNA is copied into cDNA. ii) The RNA is degraded with RNAse and the cDNA is purified, iii) The purified cDNA is tailed with dCTP and, iv) a nested gene-specific primer, GSP2, is used with a primer complimentary to the dC-tail (AAP) to amplify the dC-tailed cDNA. v) The primary PCR product is then re-amplified using a second nested gene-specific primer (GSP3) and a primer complimentary to the 5’ end (AUAP).
154

4.2.3. RT-PCR
RT-PCR analysis of USH1C was performed to investigate the tissue-specific
distribution of previously reported alternative USH1C isoforms (Scanlan, et al.,
1999; Verpy, et al., 2000), as well as to look for novel isoforms of USH1C.
Gene-specific amplification was performed on various human foetal cDNA
samples using oligonucleotide primers designed to various exons of USH1C
(Appendix A, Table A.3).
4.3. Results
4.3.1. 5’ RACE analysis
5’ RACE was performed on total RNA extracted from eight-week-old human
foetal ear tissue and the products were amplified using a nested gene-specific
primer (GSP3) located in exon 13 of USH1C. A number of products were
amplified (Fig. 4.3). The largest product observed, at approximately 1.2 kb
(Fig. 4.3, arrow), could represent the major harmonin isoform a, where the
translation start site is located in exon 1. Just below the largest product there is
also evidence of at least one transcript of approximately 900 bp in size. This
could represent a transcript that either lacks one or more of the constitutive
exons 1-12, or that has an alternative 5’UTR. In addition, there are also smaller
products evident between 250 and 450 bp (Fig. 4.3, bracket). These may
represent transcripts with alternative 5’UTRs, in which alternative translation
initiation sites may be used. One of these smaller products may be the putative
short isoform, PDZ-37, in which protein translation starts from an alternative
site in exon 12 (Scanlan, et al., 1999). A product relating to the PDZ-37 isoform
155

would be expected to be approximately 250-450 bp in this experiment,
depending on the size of the 5’UTR.
1 2
1500 K -
Figure 4.3. 5’ RACE using cDNA
from eight-week human foetal ear
tissue.
100
600
}
Agarose gel showing 5’ RACE products: lane 1 is the blank, whilst lane 2 shows the products obtained after nested, gene-specific cDNA synthesis. Size in base pairs is indicated on the left.
The 5’ RACE indicated the possibility of alternative isoforms of harmonin in the
human foetal ear, other than those reported previously. However, it was not
possible to gel-purify any of these products and sequence them to confirm the
nature of the putative transcripts. These transcripts appeared to be present in
low abundance and it is not known if they are of any physiological relevance.
Subsequently, we decided to use RT-PCR for further analysis of alternative
isoforms of USH1C.
4.3.2. RT-PCR analysis
4.3.2.1. USH1C RT-PCR
The products of 5’ RACE were amplified using a nested primer (GSP3) located
in exon 13. Therefore, using this strategy, it was not possible to identify the
longer ear-specific isoforms that were subsequently reported (Verpy, et al.,
2000). Hence, once the alternative exons, A-F and G/G\ situated between
156

exons 14 and 16 were described and published (Verpy, et al., 2000) various
oligonucleotides were designed to investigate these exons further. It was
necessary to confirm the tissue-specific expression pattern of the alternative
exons and identify any further alternative splicing patterns (Table 4.2).
Table 4.2. Oligonucleotides used to analyse USH1C expression in human
foetal tissues with expected product sizes.
Location of
forward primer
Location of
reverse primer
Isoforms that might
be amplified*
Expected product
sizes (bp)
Exon 13 Exon 17a1, a2, b1,2,3, c1, c2,
c3,PDZ-54, PDZ-59
280, 255, 1175, 205,
1250, 330, 450,
Exon B Exon 17 b1, b2, b3 and c2 900
Exon F Exon 21 b1, b2, b3 and c2 400, 490 or 510
Exon F Exon G/G’ B2 and b3 350
Intron 11 Exon 14 PDZ-37 280
* isoforms identified previously (Scanlan, et al., 1999; Verpy, et al., 2000), shown in Fig. 4.1.
First, to investigate alternative splicing between exon 14 and exon 16 of
USH1C, a forward oligonucleotide in exon 13 was used in combination with a
reverse oligonucleotide in exon 17. Gene-specific amplification was performed
on all the cDNAs obtained from the human foetal tissue samples (Fig. 4.4).
Some of the samples appeared to have more than one product present and
some of these were re-run on a fresh agarose gel (Fig. 4.5) to see if the
alternative products could be isolated and sequenced. However, it was not
possible to isolate any potential alternative USH1C isoforms for sequencing,
since they were present in such small quantities. In addition, the major isoform,
type a1, was often the smallest PCR product and therefore, was amplified
preferentially.
157

100280 bp (major isoform, a1)
Figure 4.4. Amplification of the exon 13 to exon 17 region of USH1C.First strand cDNA samples, processed from human foetal tissues at various stages of development, were amplified using USH1C gene-specific oligonucleotides located in exons 13 and 17. The major product, indicated in red, at 280 bp represents the main USH1C isoform a1. There is also some evidence of both larger and smaller alternative isoforms (see Fig. 4.5), indicated by yellow arrows. Size in base pairs is indicated on the left, wk = week and dy = day.
ck-(O
■ECO k_
CD 2k.CO
LU <D■y LU OQ LU
f-L-
1 S % %co io * - T—
00 lO T_
■ECO0)I
<------ 400 bp<— 280 bp (isoform, a1) <----- 200 bp
Figure 4.5. Detailed view of some products from amplification of the exon
13 to exon 17 region of USH1C.Some of the products from the USH1C gene-specific amplification of human foetal cDNA samples shown in Figure 4.3 were re-loaded on agarose gel to better visualize possible alternative isoforms. The major isoform a1, indicated in red, gives a product of 280 bp. Alternative products at approximately 1300 bp, 1100 bp, 400 bp and 200 bp, which may represent either previously identified isoforms or novel ones, are indicated on the right. Size in base pairs is indicated on the left, wk = week and dy = day.

To make the PCR more specific for alternative isoforms, a forward
oligonucleotide in the alternative exon B was used in combination with the
reverse oligonucleotide in exon 17 (Table 4.2). This amplification was
performed on cDNA samples from human foetal ear tissue at various stages of
development and three distinct products of 150 bp, 250 bp and 900 bp in size
were obtained (Fig. 4.6). Each product was isolated and sequenced. The
largest product was found to contain the alternative exons B through to exon F
spliced onto exons 16 and 17. This confirms the finding of Verpy, et al., 2000,
of the alternative isoforms b1, b2, b3 or c2 (Fig. 4.1).
However, sequencing of the 250-bp product revealed a transcript with exons B
and C spliced onto 16 and 17, and the sequence of the smallest product
showed exon B alone spliced onto exons 16 and 17 (Fig. 4.6). These splice
products have not been described before and represent novel putative
isoforms. Both exons B and C represent cassette exons, which, if spliced in
together or separately in addition to either exon A or exon 15, maintain the
protein reading frame. Interestingly, exons B and C encode the second coiled-
coil domain. Hence, the protein represented by the 250 bp RT-PCR product
would be expected to contain all three PDZ domains and both the coiled-coil
domains, but not the putative protein degradation domain (PEST).
159

i n c N t - > ^ >r- o co t ol . O ' t - ' r - O O k O ' T - ' r - T - t D
900
250 150
Figure 4.6= USH1C gene-specific PCR using a forward primer in the
alternative exon B in combination with a reverse primer in exon 17.Amplification of first-strand cDNA prepared from human foetal-ear tissue at various stages of development, as indicated above each lane. The splice products confirmed by sequencing are indicated to the right. The 900-bp product could reflect the expression of any or all of the b1, b2, b3 or c2 isoform, while the 250-bp and 150-bp products reflect novel splicing patterns that have not been reported previously. Size in base pairs is indicated on the left, wk = week and dy = day.
To further investigate the expression of alternative USH1C isoforms, gene-
specific amplification was performed using a forward oligonucleotide in the
alternative exon F in combination with a reverse oligonucleotide in either exon
21 or the alternative exon G (Table 4.2). Tissues in which more than one
product is amplified with the exon F and exon 21 oligonucleotides could be
expressing any of the class b isoforms and/or the class c2 isoform (Verpy, et
a/., 2000) (Fig. 4.7). Only tissues that express isoforms b2 or b3 would be
expected to amplify with the exon F and exon G oligonucleotides (Fig. 4.8).
The results of these two amplifcation reactions (Figs 4.7 and 4.8) indicate that
the b isoforms of USH1C are not only expressed in the ear, as reported
previously (Verpy, et al., 2000), but also in human foetal heart, kidney and gut
tissue and, to a lesser extent, in the eye.
B I C h6 Il7 I Novel
B h 6 117l Novel
160
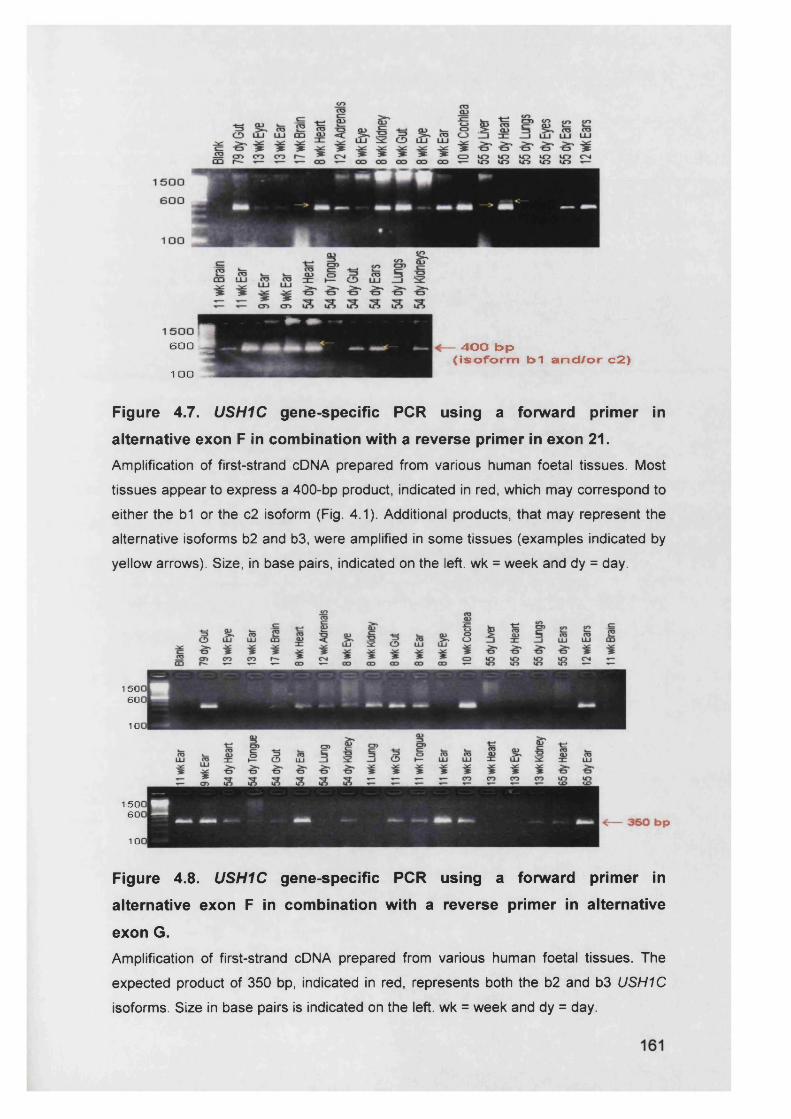
6 0 0 ^
1 0 0 ~
Figure 4.7. USH1C gene-specific PCR using a forward primer in
alternative exon F in combination with a reverse primer in exon 21.Amplification of first-strand cDNA prepared from various human foetal tissues. Most tissues appear to express a 400-bp product, indicated in red, which may correspond to either the b1 or the c2 isoform (Fig. 4.1). Additional products, that may represent the alternative isoforms b2 and b3, were amplified in some tissues (examples indicated by yellow arrows). Size, in base pairs, indicated on the left, wk = week and dy = day.
150 6 0
10
1 5 0 6 0
10
Figure 4.8. USH1C gene-specific PCR using a forward primer in
alternative exon F in combination with a reverse primer in alternative
exon G.Amplification of first-strand cDNA prepared from various human foetal tissues. The expected product of 350 bp, indicated in red, represents both the b2 and b3 USH1C
isoforms. Size in base pairs is indicated on the left, wk = week and dy = day.
400 bp (isoform b1 and/or c2)

4.32.2. COCH RT-PCR
Alternative USH1C isoforms, previously reported to be ear-specific (Verpy, et
al., 2000), were also present in some of the other foetal tissues tested here
(Figs 4.7 and 4.8). Therefore, the possibility of cross-contamination between
tissues during processing was examined. Oligonucleotides were designed to
amplify a gene that was thought to be ear-specific, COCH (cochlin), in all the
first strand cDNA samples processed from the various human foetal tissues. As
expected most of the tissues, apart from the ear samples, did not amplify for
COCH (Fig. 4.9). However, a product of the expected size (300 bp) was also
amplified in some of the eye and brain tissue samples. Low levels of COCH
expression have also previously been detected in human foetal-eye and -brain
tissue on Northern blot (Robertson, et al., 1994). Therefore, COCH expression
was detected only in the tissues that have previously demonstrated expression
of this gene, and not in the heart, kidney or gut, indicating that cross
contamination is unlikely to have occurred during the processing of these tissue
samples.
Since cross-contamination cannot be the reason for detecting expression of
alternative USH1C exons in the heart, kidney and gut, then these results are
probably true. Hence, the alternative USH1C b isoforms do not appear to be
ear-specific.
162

Figure 4.9. COCH gene-specific PCR.
Gene-specific amplification of COCH, a gene expressed abundantly in the ear, in all the human foetal cDNA samples obtained. The expected product size of 300 bp is
indicated in red. Size in base pairs is indicated on the left, wk = week and dy = day.
4.3.2.3. PDZ-3 7 isoform
From both the 5’ RACE results (Fig. 4.2) and the published work of Scanlan, et
al., we hypothesized that the presence of a short isoform, possibly PDZ-37, in
the gut might account for the different phenotypes observed between Usher
type 1C patients and the patients with a contiguous gene deletion. Patients with
5’ truncating mutations might still be able to express short protein isoforms,
which could explain the absence of an observable gut phenotype in these
patients.
To support this hypothesis, it was necessary to determine whether PDZ-37
expression could be detected in the gut. However, there are no coding
differences between the PDZ-37 isoform and the main harmonin isoform a1.
Therefore, a PDZ-37-specific amplification reaction was designed using a
163

forward oligonucleotide in intron 11 (putative 5’ UTR) in combination with a
reverse oligonucleotide in exon 14.
A product of the expected size (-280 bp) was amplified in a number of human
foetal tissues (Fig. 4.10). Interestingly, although originally described in adult
brain, PDZ-37 expression did not seem to be apparent in foetai brain tissue.
However, expression was detected in human foetal ear, heart, kidney and,
most importantly, the gut (Fig. 4.10). Furthermore, these results were
reinforced by the subsequent detection of PDZ-37 mRNA in two human gut
epithelial cell lines, HT29 and Caco-2, as will be shown in Chapter 5 (Fig. 5.3).
Figure 4.10. PCR assay for the putative USH1C isoform PDZ-37.
First-strand cDNA from human foetal tissues of various stages of development was amplified using a forward oligonucleotide in intron 11 in combination with a reverse oigonucleotide in exon 14 of USH1C. The expected product size of 280 bp is indicated in red. Size in base pairs is indicated on the left, wk = week and dy = day.
164
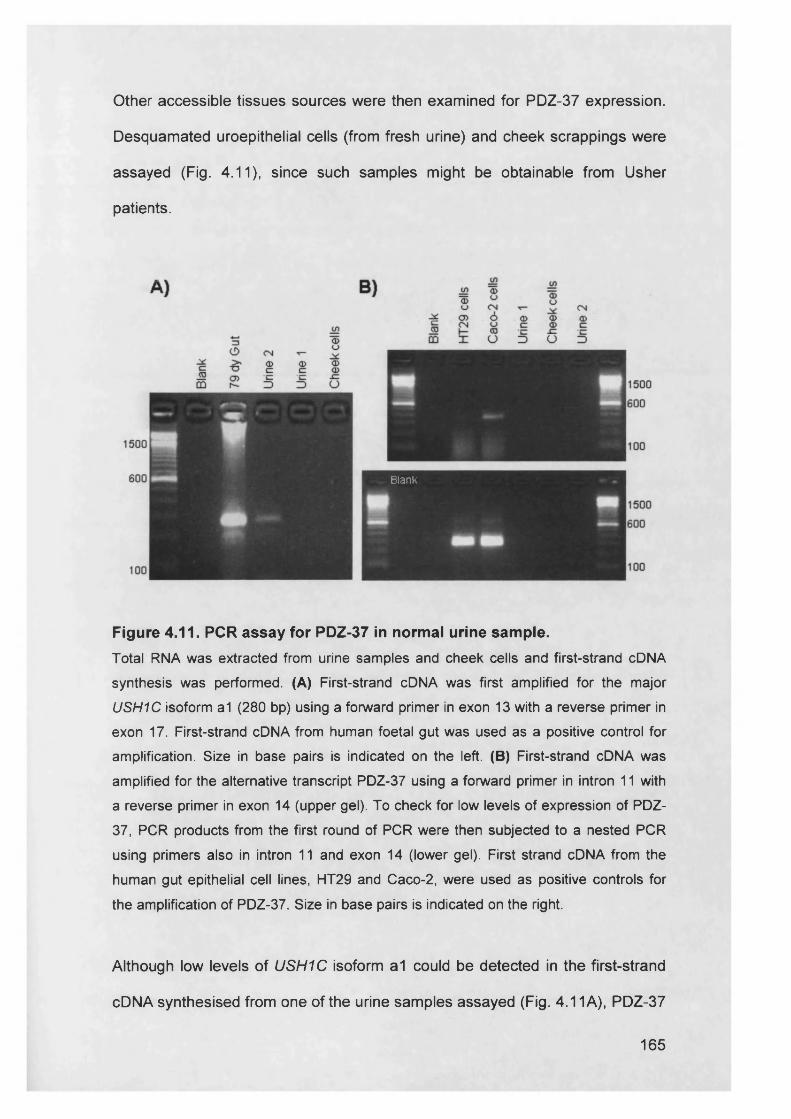
Other accessible tissues sources were then examined for PDZ-37 expression.
Desquamated uroepithelial cells (from fresh urine) and cheek scrappings were
assayed (Fig. 4.11), since such samples might be obtainable from Usher
patients.
Blank
Figure 4.11. PCR assay for PDZ-37 in normal urine sample.Total RNA was extracted from urine samples and cheek cells and first-strand cDNA synthesis was performed. (A) First-strand cDNA was first amplified for the major USH1C isoform a1 (280 bp) using a forward primer in exon 13 with a reverse primer in exon 17. First-strand cDNA from human foetal gut was used as a positive control for amplification. Size in base pairs is indicated on the left. (B) First-strand cDNA was amplified for the alternative transcript PDZ-37 using a forward primer in intron 11 with a reverse primer in exon 14 (upper gel). To check for low levels of expression of PDZ- 37, PCR products from the first round of PCR were then subjected to a nested PCR using primers also in intron 11 and exon 14 (lower gel). First strand cDNA from the human gut epithelial cell lines, HT29 and Caco-2, were used as positive controls for the amplification of PDZ-37. Size in base pairs is indicated on the right.
Although low levels of USH1C isoform a1 could be detected in the first-strand
cDNA synthesised from one of the urine samples assayed (Fig. 4.11 A), PDZ-37
165

expression could not be detected in this urine sample, even when nested RT-
PCR was performed (Fig. 4.11B). The other urine sample and the cheek
scrapping may not have contained any RNA, since these samples did not
amplify for the USH1C isoform a1 (Fig. 4.11 A)
To confirm our hypothesis, alternative RNA sources need to be obtained and
tested for expression of PDZ-37 in Usher type 1C patients.
4.3.3. Summary of results
4.3.3.1. 5’ RACE
A primer in exon 13 was used to amplify the 5’ RACE products. Therefore, it
was not possible to identify the ‘ear-specific’ b isoforms of USH1C using this
method of analysis. However, the 5’ RACE did show evidence of additional
novel USH1C transcripts (Fig. 4.2), although these could not be cloned and
sequenced.
4.3.3.2. RT-PCR analysis
4.3.3.2.1. Alternative exons A -F and G/G’
When the region between exons 14 and 16 of USH1C was amplified, faint
bands at the appropriate size (Fig. 4.4, ~1300 bp) indicated the presence of the
‘ear-specific’ b isoforms. Furthermore, products were amplified when
oligonucleotide primers situated in the alternative ‘ear-specific’ exons were
used, confirming that these isoforms do exist at low levels. However, the b
isoforms do not appear to be specific to the ear as described previously (Verpy,
et al., 2000) (Figs 4.6 and 4.7), but are also found in human foetal gut, kidney,
heart and eye tissues. It was demonstrated that the presence of the b isoforms
166

in these additional tissues is unlikely to be due to contamination by ear tissue
during processing (Fig. 4.8). I
Novel isoforms of USH1C were identified (Fig. 4.6), which include transcripts
containing exon B and exons B and C spliced onto exon 16.
4.3.3.2.2. PDZ-37
Expression of mRNA for a 5’ truncated isoform of harmonin, PDZ-37, wasi
demonstrated in gut, kidney, heart and ear human foetal tissues (Fig. 4.10). '
4.4. Discussion
4.4.1. 5’ RACE analysis
5’ RACE was used to investigate the possibility of additional, alternative
isoforms of USH1C in the human foetal ear. A number of products were
amplified using this method (Fig. 4.3), however, in the absence of any
sequence data for these products it can only be hypothesized what they may
represent. Unfortunately, when the oligonucleotide primers were designed for
the 5’ RACE experiment, the alternative splicing that leads to the expression of
longer, ‘ear-specific’ harmonin b isoforms (Verpy, et al., 2000) had not been
reported. Hence, the b isoforms were not identified in the 5’ RACE analysis,
since the nested oligonucleotide used for amplifying the 5’ RACE products was
located in exon 13 and the alternative exons are situated between exons 14
and 16.
167

Interestingly, the 5’ RACE procedure identified a group of products of
300-400 bp in size (Fig. 4.3, bracket), shorter than expected. These may
represent novel USH1C isoforms; either with alternative 5’ UTRs or that lack
one or more of the constitutive exons between 1 and 12. This was felt to be
particularly significant because expression of isoforms with alternative
translation start sites may still be possible in Usher patients with 5’ protein
truncating mutations, which would prevent expression of the major isoform of
USH1C. The 400-bp product, which has amplified in the greatest quantity,
might encode the previously reported putative 5’ truncated PDZ-37 isoform
(Scanlan, et al., 1999), thought to utilize an alternative translation start site in
exon 12.
There are a number of putative, in-frame, start codons located upstream of the
gene-specific oligonucleotide, in exon 13 (GSP3), used to amplify the 5’ RACE
products. However, only one of these start codons falls within a putative kozak
sequence, GCCA/GCCAUGG, the consensus sequence considered to be the
optimal sequence allowing the translation machinery to recognize the initiation
codon efficiently. Further studies would be required to identify which alternative
start codon(s) might be utilized. This may be achieved by cloning PDZ-37
cDNA for expression, and using site-directed mutagenesis to alter potential
translation start sites in turn.
168

4.4.2. Alternative USH1C isoforms in human foetal tissues
4.4.2.1. Alternative exons 15 and A-F
Since it was not possible to identify the USH1C mRNA isoforms observed using
5’ RACE, use of the. alternative exons in splicing was studied further using RT-
PCR analysis.
All the human foetal tissues collected, were shown to express the main
harmonin isoform a1 (with exon 15 spliced between exons 14 and 16) as
demonstrated by the 280-bp product amplified using oligonucleotides in exons
13 and 17 of USH1C (Fig. 4.4). These PCRs were not quantitative, so it is not
possible to comment on the level of expression of USH1C mRNA in the
different tissues, only whether or not expression could be detected.
Some of the tissues showed evidence of expression of more than one variant
of USH1C mRNA (Fig. 4.5). Unfortunately, the level of expression of these
alternative products was too low for them to be isolated for sequence analysis.
However, many alternative isoforms of USH1C have been reported (Scanlan,
et al., 1999; Verpy, et al., 2000) and it is possibe to hypothesize which ones
may be represented here.
The larger products seen in the ear and the heart (Fig. 4.5) may indicate the
presence of the class b transcripts, in which the alternative exons A -F are
spliced between exons 14 and 16 in place of exon 15, or the class c2 transcript
(Verpy, et al., 2000) (Fig. 4.1). This was the first evidence that the alternative
exons may not be ear-specific. There is also evidence of isoforms of USH1C
that are smaller than the a1 isoform, in particular in the ear, kidney, stomach,
169

brain and heart (Figs 4.4 and 4.5, smallest bands). One of these products could
represent the isoform c1 (~205 bp), also known as PDZ-45 (Scanlan, et al.,
1999), in which exon 14 is spliced onto exon 16 introducing a stop codon and
leading to a truncated protein product (Fig. 4.1). PDZ-45 expression has
previously been detected by RT-PCR in various adult human tissues including
the stomach, brain and kidney (Scanlan, et al., 1999). This would correlate with
the findings here, in addition to observation of expression in the human foetal
ear (Fig. 4.4).
Some of the samples also appeared to have products of approximately 400 bp
in size (Fig. 4.5) and these could relate to the isoforms PDZ-54 (~ 332 bp) and
PDZ-59 (-452 bp), whose mRNA have only been detected previously in the
kidney, brain and bladder by RT-PCR (Scanlan, et al., 1999), or they could
represent yet more alternative splice products. These alternative products,
though, are present in quite low abundance and it is not known if they are
physiologically relevant. They may represent transcripts produced by aberrant
splicing events, which would not be expected to code for functional proteins
and would be broken down via the nonsense-mediated decay pathway.
4.4.2.1.1. Ear-specific b isoforms
Not all of the tissues tested here showed evidence of expressing the longer
alternative isoforms b1, b2, b3 and c2 which include the exons A - F with or
without exon G/G’ spliced between exons 20 and 21 (Fig. 4.1). This was to be
expected since expression of the b isoforms was reported to be ear-specific
(Verpy, et al., 2000). However, human foetal eye, brain, gut, heart, kidney and
ear tissue all showed expression of the b1 USH1C transcript (or c2) (Fig. 4.7).
170

Most of these tissues also showed expression of the transcripts that include
exon G/G’, b2/b3 (Fig. 4.8). Therefore, the b isoforms of USH1C appear to
have a wider expression pattern than originally thought and hence, they may
also have a role in other tissues. This is of particular interest when considering
the allelism observed between Usher syndrome type 1C and non-syndromic
deafness, DFNB18. Given that there is now evidence that the b isoforms of
harmonin are also expressed in human foetal-eye tissue, mutations in the
alternative exons A -F and G/G’ would not necessarily be expected to lead to
deafness in the absence of an eye phenotype. Therefore, the ear maybe more
sensitive than the eye to mutations in the USH1C gene.
4.4.2.1.2. Novel alternative transcripts
When a forward primer in exon B was used in combination with the reverse
primer in exon 17 on the human foetal ear samples it was possible to isolate
USH1C mRNA transcripts that utilize the alternative exons. Two novel
products, of 150 bp and 250 bp, were obtained in addition to the expected
product of 900 bp (Fig. 4.6). Sequencing revealed these variants to consist of
exon B (150 bp) and both exons B and C (250 bp) spliced on to exon 16. These
transcripts have not been reported previously and both have the potential to
produce in-frame protein products if the alternative exons are spliced in
combination with either exon A or 15. Together, exons B and C encode the
second coiled-coil domain, although exon B encodes the majority of this
domain. The addition of exons B and C would not be expected to have an
effect the PDZ domains. However, an isoform of harmonin that includes exons
B and C in the absence of exons D - F would differ from the b isoforms by
including the second coiled-coil domain in the absence of the putative protein
171

degradtion motif (PEST) encoded by exons D and E. Therefore, it may be
envisaged that these novel isoforms could allow the additional protein-protein
interaction, afforded by the second coiled-coil domain, in a protein with a longer
half-life than the b isoforms.
r
4.4.3. PDZ-37 isoform
PDZ-37, a 5’ truncated isoform of harmonin that was previously only detected
in adult brain and spinal cord tissue by Northern blot analysis (Scanlan, et al.,
1999), has received little attention. Protein translation is hypothesized to start
from an alternative initiation site in exon 12 (Scanlan, et al., 1999) and the
putative protein product contains most of the first coiled-coil domain and the
third, most C-terminal, PDZ domain. However, the existence of PDZ-37 had not
been confirmed at either the molecular level or the protein level since Scanlan’s
report (Scanlan, et al., 1999). It has been shown here that it is possible to
amplify a transcript from intron 11 using RT-PCR (Fig. 4.10).
We are interested in investigating this isoform of harmonin further. If PDZ-37 is
a true variant of harmonin, and it is expressed in the gut, then it may explain
why a family with a contiguous gene deletion, that encompasses most of
USH1C, have the Usher phenotype combined with an enteropathy (Bitner-
Glindzicz, et al., 2000). This gut phenotype has not been observed in Usher
type 1C patients with null mutations, which occur at the 5’ end of the USH1C
gene. A PCR assay was designed on the assumption that the 5’UTR of this
isoform encompasses intron 11 of the gene. The results of this PCR were
particularly convincing since it is not usual to find intronic sequence present in
cDNA and secondly the PCR was designed across two further introns (introns
172

12 and 13), such that if the cDNA was contaminated with genomic DNA then
the PCR product would have been much larger than expected.
As expression of the putative PDZ-37 transcript has now been confirmed at the
RNA level in a variety of human foetal tissues (Fig. 4.10). It would be
interesting to show that Usher type 1C patients with 5’ truncating mutations,
238-239insC, for example, are still able to express the PDZ-37 isoform. This
might explain why they do not have a gut phenotype. However, an accessible
tissue is needed to test for PDZ-37 mRNA expression in Usher patients. PDZ-
37 mRNA expression was not detected in RNA extracted from a urine sample
(Fig. 4.11), and so alternative sources will need to be investigated if this
hypothesis is to be pursued. Furthermore, it is also important to show
expression of PDZ-37 at the protein level, see Chapter 5 (Fig. 5.5).
173

5. Immunolocalization
5.1. Introduction
PDZ domain-containing proteins have been implicated in a number of different
functions within different cell types, including the clustering, targetting and
routing of associated proteins (reviewed by van Ham and Hendriks, 2003). In
most of these roles, PDZ proteins tend to localize to the cell membrane where
they may interact, either directly, or via other proteins as part of a
macromolecular complex, with integral membrane proteins and/or the
cytoskeleton of the cell. However, some PDZ-domain proteins have been
shown to shuttle between the cytoplasm and the nucleus (Islas, et a/., 2002)
and, hence, also appear to have a role in cell signalling. To understand more
about the role played by a novel PDZ protein it is important to establish its
intracellular localization.
To confirm the intracellular localization of harmonin, human gut epithelial cell
lines were studied using fluorescent immunocytochemistry. In addition, to get a
better understanding of the role played by harmonin in the inner ear,
localization studies, using fluorescent immunohistochemistry, were attempted
on mouse inner-ear sections.
Furthermore, having confirmed the existence of PDZ-37 mRNA in foetal
tissues, it was also necessary to assess whether it is expressed in human cell
lines and, particularly, whether it could be detected at the protein level. Finding
174

intact PDZ-37 protein in gut cell lines would be more supportive evidence as to
why patients with 5’ truncating point mutations have no gut phenotype. Initially,
expression of PDZ-37 in human gut cell lines was studied using RT-PCR,
before studying protein extracts on immunoblot for presence of the PDZ-37
protein.
5.2. Methods in Brief
5.2.1. Immunohistochemistry
For localization of harmonin within the cochlea, mouse cochleae were removed
as described in section 2.2.8.1. and fixed in 4% paraformaldehyde (section
2.2.8.2.). For cutting frozen sections, cochleae were then embedded in the
appropriate orientation within an Optimal Cutting Temperature compound
(OCT), frozen on dry ice (section 2.2.8.3.) and sectioned on a cryostat (section
2.2.8.4.). Frozen mouse cochlea sections were then stained as described in
section 2.2.8.6. Briefly, sections were incubated with a 1 in 50 dilution of rabbit
polyclonal anti-harmonin antibody (Kobayashi et a/., 1999), followed by a 1 in
100 dilution of an anti-rabbit-FITC conjugate and then a 1 in 100 dilution of
Phalloidin-Rhodamine for F-actin staining and a 1 in 200 dilution of Hoechst
nuclear stain. The immunofluorescent sections were viewed under a
fluorescent microscope.
5.2.2. Immunocytochemistry
Intracellular localization of harmonin in gut epithelial cell lines, HT29 and Caco-
2, was studied using immunocytochemistry.
175

5.2.2.1. RT-PCR
Expression of USH1C in the cell lines was first checked. Total RNA was
extracted from the cell lines using TRIZOL™, as described in section 2.2.2.1.,
and first-strand cDNA synthesis was performed using Superscript™ II Reverse
Transcriptase (Section 2.2.2.2.). USH1C gene-specific amplification was
carried out using oligonucleotide primers specific for exons of USH1C
(Appendix A, Table A.3).
5.2.2.2. Immunoblotting
Once expression of USH1C mRNA had been confirmed, expression of
harmonin in the cell lines was also confirmed on immunoblot. Proteins were
extracted from cell lines using RIPA buffer as described in section 2.2.10.1.
The protein content of cell extracts was then assayed (section 2.2.10.2.) and
50-100 fig of total protein extract was run on an SDS-PAGE gel (section
2.2.10.3.) and the proteins were then transferred to nitrocellulose membrane
(section 2.2.10.4.).
Harmonin was detected using a colourimetric method to develop the
immunoblot. As described in section 2.2.10.5, the membrane was first
incubated with a 1 in 1000 dilution of mouse monoclonal anti-harmonin
antibody (Scanlan, et al., 1999), followed by a 1 in 1000 dilution of biotinylated
anti-mouse IgG and then a 1 in 2500 dilution of streptavidin-alkaline
phosphatase conjugate. Finally, the colour of the protein bands was developed
using Western Blue™ stabilized substrate for alkaline phosphatase. To study
expression of different isoforms of harmonin in the gut cell lines, immunoblots
were also developed using a 1 in 500 dilution of the rabbit polyclonal anti-
176

harmonin antibody (Kobayashi et al., 1999) with a 1 in 1000 dilution of
biotinylated anti-rabbit IgG.
5.2.2.3. Fluorescent staining
Once expression of harmonin in the gut cell lines had been confirmed,
immunocytochemistry was used, as detailed in section 2.2.9.2., to study the
intracellular localization of harmonin. Briefly, cultured cells were fixed using 4%
paraformaldehyde, permeabilized in 1% Triton, blocked with 5% goat serum
and then incubated with a 1 in 50 dilution of rabbit polyclonal anti-harmonin
antibody (Kobayashi, et al., 1999), followed by a 1 in 50 dilution of anti-rabbit-
FITC IgG. Stained cells were mounted on glass slides and viewed using
confocal microscopy.
5.3. Results
5.3.1. Immunohistochemistry of mouse inner-ear sections
Frozen mouse cochleae sectioned on the cryostat and viewed as phase
contrast images (Fig. 5.1) confirmed that sections were cut in the correct
orientation and that all the relevant structures, most importantly the organ of
Corti, were present.
Cochlear section stained with rabbit polyclonal anti-harmonin antisera (Fig.
5.2B), showed no obvious difference to the negative control, in which PBS was
used in place of the primary anti-harmonin antisera (Fig. 5.2E).
177

During the course of this work, Boeda, et al., reported their study on the
distribution of harmonin within the developing mouse inner-ear hair bundle
(Boeda, et al., 2002). Therefore, no further immunohistochemical experiments
were pursued in this study.
178

179
Reissner's membrane v s.
striavascularis
scala m edia
organ of C’orti
Reissner’s membrane
Scala vestibuli with perilymph
Stria vascularis Spiralligament
i
Scala media with endolymph
Tectorialmembrane
I
Inner Outer hair cell hair cells
I I '
Cochlea nerveOP
ernbrane
Figure 5.1. Phase contrast image of a section through the cochlea from a P14 mouse.

Figure 5.1. Phase contrast image of a P14 mouse cochlea section.(A+B) Schematic diagrams of a cross-section through a single turn of the cochlear ___ _spiral (Forge and Wright, 2002) provide a reference for the structural features of the
cochlea duct, (A), and the Organ of Corti, (B). IHC, inner hair cell; OHC, outer hair cell;Dc, Defiers’ cell; ip, inner pillar cell; op, outer pillar cell; He, Hensen’s cells; TM, tectorial membrane; BM, basilar membrane.(C) The mouse cochlea was sectioned in the correct orientation for viewing the
components of the Organ of Corti, the sensory epithelia of the cochlea duct. The
locations of the outer and inner hair cells of the Organ of Corti are indicated, as are
other structural features of the cochlea duct: including the basilar membrane, cochlea
nerve, stria vascularis, spiral ligament and outer pillar cell (OP). Furthermore, delicate
structures; such as Reissner’s membrane, which separates the endolymph of the
cochlea duct from the perilymph of the temporal bone, and the tectorial membrane, remain intact.
180

Figure 5.2. Immunofluorescent images of frozen P14 CD1 mouse cochlea
sections.(A-C) Double staining for F-actin and harmonin in the organ of corti. Rhodamine- phalloidin staining of stereocilia bundles on cochlear hair cells (A, red channel). Staining for harmonin in cochlea using rabbit polyclonal anti-USH1C antiserum (Kobayashi, et al., 1999) (B, green channel). Double staining for harmonin and F-actin overlayed with Hoerscht nuclei stain for orientation purposes (C). (D-F)Negative control showing a cochlea section double stained for F-actin and background FITC staining. Rhodamine-phalloidin staining of stereocilia bundles on cochlear hair cells (D, red channel). Background staining shown using PBS alone in place of the primary anti- USH1C antibody (E, green channel). F-actin staining overlayed with background FITC staining and the Hoerscht nuclei stain for orientation purposes (F).
181

5.3.2. Immunocytochemistry of human gut epithelial cell lines
To ascertain the intracellular localization of harmonin, two human colon
adenocarcinoma epithelial cell lines, Caco-2 and HT29, were studied.
Harmonin expression has already been detected in the postnatal small intestine
(Bitner-Glindzicz, et al., 2000; Scanlan, et al., 1999), but expression of USH1C
mRIMA in these cell lines was first established by RT-PCR. The presence of
harmonin protein was confirmed by immunoblotting and the intracellular
localization of harmonin was studied using immunocytochemistry.
5.3.2.1. Detection ofUSHIC mRNA
Fig. 5.3A shows that USH1C mRNA can be detected in HT29 and Caco-2 cell
lines using gene-specific oligonucleotides. The presence of PDZ-37 was also
confirmed using the isoform-specific oligonucleotides designed previously (as
described in section 4.3.2.3.) (Fig. 5.3B). Amplification of the house-keeping
gene, HPRT, is shown for comparison (Fig. 5.3C).
Figure 5.3. Amplification of
USH1C from cDNA extracted
from HT29 and Caco-2 human gut
epithelial cell lines.(A) USH1C gene-specific PCR using a forward primer in exon 13 with a reverse primer in exon 17 (Appendix A, Table A.3), (B) PDZ-37 isoform-specific PCR (Appendix A, Table A.3) and (C) HPRT PCR.
A) USH1C
B) PDZ-37
C) HPRT
182

5.3.2.2. Detection of harmonin protein
To confirm that harmonin is expressed at the protein level as well as at the
RNA level, protein extracts were prepared from both HT29 and Caco-2 cell
lines and analysed on immunoblots. Figure 5.4 shows that harmonin was
detected in both cell lines, when a mouse monoclonal anti-harmonin antibody
(Scanlan, et a!., 1999) was used to develop the immunoblot. The monoclonal
anti-harmonin antibody is specific for in v/fro-translated harmonin (see chapter
6, section 6.3.1.), which is included on the immunoblot as a positive control
(Fig. 5.4, lane 1). To detect alternative isoforms of harmonin that may be
expressed in these cells, a second immunoblot of both cell extracts was
developed using the rabbit polyclonal anti-harmonin antisera (Kobayashi, etal.,
1999) (Fig. 5.5B). The polyclonal anti-harmonin antiserum also specifically
identifies in wfro-translated harmonin (Fig. 5.5A).
The major harmonin isoform a1 was identified on both immunoblots. However,
there was also evidence of a larger isoform, at -130 kDa, in the protein
extracted from Caco-2 cells (Fig. 5.4, green arrow), which may represent the
longer b isoforms of harmonin. This would agree with the RT-PCR results,
which showed that the alternative exons are also expressed in human foetal-
gut tissue (Figs 4.7 and 4.8). Furthermore, when a blot was developed using
the polyclonal anti-harmonin antisera, a similiar band was evident at -130 kDa
(Fig. 5.5, green arrow), as well as a smaller band, at -4 0 kDa, which may
correspond to the 5’ truncated PDZ-37 isoform (Fig. 5.5, red arrow).
183

150
100
75
50
a>COczCO
IIC= JS
COo>2
CO
X j T3 CM ■G2 o> CO 6 CO
CSI1— 1 U
COc i n= c O £=
'q>"5 o
CD
2 ur>
g>o
Q_ CO Q_ CM Q_
37
Figure 5.4. Immunoblot of HT29 and Caco-2 protein extracts developed
with mouse monoclonal anti-harmonin antibody.
Protein extracts from the human embryonic kidney cell line, HEK293, and the human gut epithelial cell lines HT29 and Caco-2 were compared to in wfro-translated harmonin. Endogenous harmonin at -75 kDa is indicated by the red arrow. The green arrow indicates a possible larger isoform of harmonin. Size in kiloDaltons is indicated on the left.
184
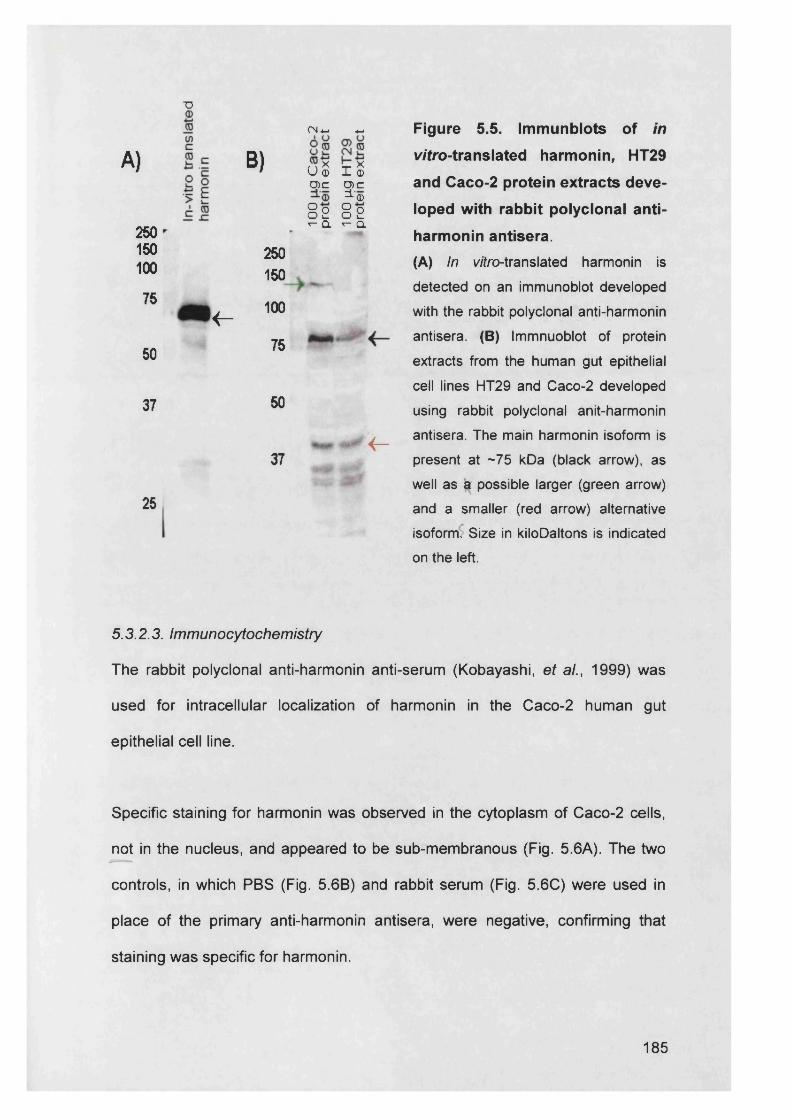
■OFigure 5.5. Immunblots of in
Wtro-translated harmonin, HT29
and Caco-2 protein extracts deve
loped with rabbit polyclonal anti-
harmonin antisera.(A) In wfro-translated harmonin is detected on an immunoblot developed
with the rabbit polyclonal anti-harmonin
antisera. (B) Immnuoblot of protein
extracts from the human gut epithelial cell lines HT29 and Caco-2 developed
using rabbit polyclonal anit-harmonin
antisera. The main harmonin isoform is
present at -75 kDa (black arrow), as
well as a possible larger (green arrow) and a smaller (red arrow) alternative
isoforrrT Size in kiloDaltons is indicated on the left.
5.3.2.3. Immunocytochemistry
The rabbit polyclonal anti-harmonin anti-serum (Kobayashi, et al.t 1999) was
used for intracellular localization of harmonin in the Caco-2 human gut
epithelial cell line.
Specific staining for harmonin was observed in the cytoplasm of Caco-2 cells,
not in the nucleus, and appeared to be sub-membranous (Fig. 5.6A). The two
controls, in which PBS (Fig. 5.6B) and rabbit serum (Fig. 5.6C) were used in
place of the primary anti-harmonin antisera, were negative, confirming that
staining was specific for harmonin.
A)
250150100
75
50
<r~
CM 4-< 4-1
B) n * U <D V x I ©OiC UiC
3-'©
§ e § 2r - Q. * - a
250150
100
75
37 50
37*0 <r~
25
185
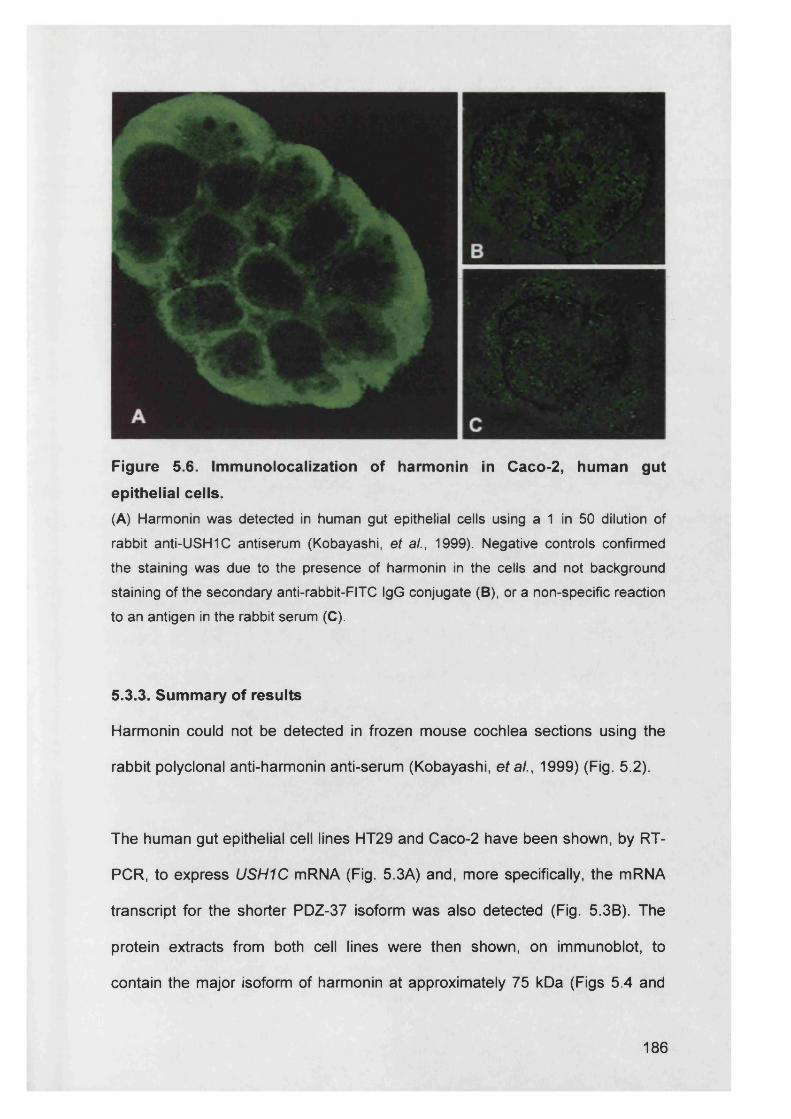
Figure 5.6. Immunolocalization of harmonin in Caco-2, human gut epithelial cells.(A) Harmonin was detected in human gut epithelial cells using a 1 in 50 dilution of rabbit anti-USH1C antiserum (Kobayashi, et al., 1999). Negative controls confirmed the staining was due to the presence of harmonin in the cells and not background staining of the secondary anti-rabbit-FITC IgG conjugate (B), or a non-specific reaction to an antigen in the rabbit serum (C).
5.3.3. Summary of results
Harmonin could not be detected in frozen mouse cochlea sections using the
rabbit polyclonal anti-harmonin anti-serum (Kobayashi, et al., 1999) (Fig. 5.2).
The human gut epithelial cell lines HT29 and Caco-2 have been shown, by RT-
PCR, to express USH1C mRNA (Fig. 5.3A) and, more specifically, the mRNA
transcript for the shorter PDZ-37 isoform was also detected (Fig. 5.3B). The
protein extracts from both cell lines were then shown, on immunoblot, to
contain the major isoform of harmonin at approximately 75 kDa (Figs 5.4 and
186

5.5B). Immunoblots of the protein extracts developed using the polyclonal anti-
harmonin anti-serum, showed evidence that these cell lines may also express
other isoforms of harmonin, in particular the shorter PDZ-37 isoform (Fig. 5.5B).
Immunocytochemistry on Caco-2 cells confirmed a cytoplasmic, sub-
membraneous, intracellular localization for harmonin.
5.4. Discussion
5.4.1. Harmonin localization in mouse inner-ear sections
The aim of this part of the study was to analyse the localization of harmonin
within mouse inner-ear sections, with the purpose of understanding when and
where harmonin is required for its function. However, in our hands, the
polyclonal anti-harmonin antibody (Kobayashi, et al., 1999) used was not very
effective at identifying harmonin in the mouse cochlear sections, even at a
dilution of 1 in 50 (Fig. 5.2) and there was not enough of the antibody available
to us to utilize it at a greater concentration. There are a number of explanations
for the inability of this antibody to identify harmonin in these inner ear sections:
1) the protein is not present, 2) the structures where the protein is localized
have not been adequately preserved during the processing of the sections or 3)
the epitopes required for recognition by the antibody are not available.
Phase-contrast imaging of mouse cochlear sections prior to staining (Fig. 5.1)
verified that the structure of the cochlea, in particular the organ of Corti, had
been sufficiently preserved during processing. The actin-rich stereocilia were
187

readily identified by a Rhodamine-Phalloidin conjugate in these sections (Fig.
5.2A and D), confirming that the hair cells were not lost during processing.
Other groups have successfully used the rabbit polyclonal anti-harmonin
antibody, used in this study, to identify harmonin on frozen tissue sections.
Kobayashi, et al., fixed the tissues in a periodate/lysine/paraformaldehyde
solution for 6-12 h (Kobayashi, et al., 1999) and Verpy, et al., and more
recently Boeda, et al., fixed mouse cochlear in 4% paraformaldehyde for only
2 -5 h (Boeda, et al., 2002; Verpy, et al., 2000). In this study, mouse cochleae
were fixed in 4% paraformaldehyde for 24 h. Therefore, it is possible that the
appropriate harmonin antigens required by the antibody have become masked
in the inner-ear sections used in this study during the extended fixation
process. Formalin fixation is known to induce such antigen masking due to the
cross-linking of protein amino acid residues..............................................................
There are a number of methods that may be employed to ‘unmask’ antigenic
sites, including the use of chemicals, enzymatic pre-digestion using proteolytic
enzymes or heat-mediated retrieval methods. Verpy, et al., incubated sections
with 50 mM NH4CI prior to staining, which may have aided in unmasking
harmonin antigens (Verpy, etal., 2000). However, this polyclonal anti-harmonin
antibody has also been successfully employed recently to localize harmonin in
unfixed rat and mice retina sections (Reiners, etal., 2003).
During the course of this study, a similar study, investigating the expression of
harmonin in mouse inner-ear sections, was published (Boeda, et al., 2002).
Using an antibody raised specifically to the b isoform, Boeda, et al. reported
188

that expression of harmonin b could be detected in the mouse cochlea as early
as embryonic day 15, where it is restricted to the stereocilia, but delineates its
entire length. At PO, however, harmonin b was found to be concentrated at the
apex of the maturing stereocilia, while from P30 onwards this isoform of
harmonin was found to be completely absent from the mouse cochlea. In
contrast, the rabbit polyclonal anti-harmonin antibody (Kobayashi, et al., 1999),
able to recognize all three harmonin isoform classes (a, b and c), showed
protein expression in both the cuticular plate and along the stereocilia during
embryonic and postnatal life of the mouse.
In this study, the same ‘pan-harmonin’ antibody, which was raised against the
major harmonin isoform a1 and will detect all harmonin isoforms
simultaneously, was used. Therefore, it would not have been possible to make
any distinctions between the fates of the different isoforms. In particular, it
would not have been possible to detect the disappearance of harmonin b, the
longer isoform that is thought to be ear-specific (Verpy, et al., 2000).
Boeda, et al., have also demonstrated that harmonin b is absent from the
stereocilia of the Myo7a4626SS shaker-1 mice, the mouse model for Usher type
1B (Boeda, et al., 2002). In these mice, harmonin b was located around the
periphery of the cuticular plate, while harmonin a and c were found to be
present in the stereocilia and distributed as in wild type mice. Consequently,
Boeda, et al. suggested that myosin VIIA is involved in the transport of
harmonin b up to the tip region of the stereocilia, and went on to show that
myosin VIIA interacts with harmonin (Boeda, etal., 2002).
189

In a study on the inner ears of waltzer mice, the mouse model for Usher type
1D, it was demonstrated that cadherin 23 is not required for the expression and
localization of myosin VIIA in PO hair cells (Holme and Steel, 2002). However, it
has been shown that harmonin and cadherin 23 interact directly (Boeda, et al.,
2002; Siemens, et al., 2002) and, hence, it may be hypothesized that the
expression and/or localization of harmonin might differ in the inner ears of
waltzer mice when compared to wild type mice.
5.4.2. Human gut epithelial cells
5.4.2.1. Expression of USH1C
Caco-2 and HT29 human gut epithelial cell lines both express USH1C mRNA
(Fig. 5.3) and the harmonin protein (Figs 5.4 and 5.5B). Furthermore, PDZ-37
mRNA was detected in both cell lines and a product that may represent the
truncated PDZ-37 protein was seen on immunoblot of both cell extracts
(Fig. 5.5B).
Intriguingly, the endogenous harmonin protein extracted from the cell lines,
appears to be of a slightly higher molecular weight when compared to the in
w'fro-translated USH 1C (Figs 5.4 and 5.5). The reasons for this are not clear,
but it may reflect a difference in processing of the native protein in vivo. For
example, harmonin may undergo some form of post-translation modification,
such as phosphorylation. When the prosite database of protein families and
domains was searched using the harmonin isoform a1 amino acid sequence
(http://ca.expasv.org/prosite/), fourteen potential phosphorylation sites were
predicted (Appendix E). Possible post-translational modifications may be
190

investigated by treating the protein with the appropriate enzymes prior to
immunoblotting.
When an immunoblot of the cell extract from HT29 and Caco-2 cells was
processed using the monoclonal anti-harmonin antibody, expression of the
major harmonin isoform a1 (Fig. 5.4) was detected, at around 75 kDa, in both
cell lines. However, when an immunoblot of HT29 and Caco-2 cell extracts was
processed using the polyclonal anti-harmonin antibody there appeared to be
additional bands present, which may indicate that these cell lines express
alternative isoforms of harmonin (Fig. 5.5B). In particular, there appeared to be
a larger product, at approximately 130 kDa in size, present in the Caco-2
lysate, which could represent the b isoforms of harmonin, with the additional
alternative exons A -F and G/G’ (Fig. 5.5B, green arrow). This would agree with
the RT-PCR data obtained in Chapter 4, where primers located in the
alternative exons found in the b isoforms showed amplification in human foetal-
gut tissues (Figs 4.6 and 4.7) and is more evidence that the b isoforms are not
‘ear-specific’. Of even greater interest, though, was the presence of a band just
above the 37 kDa mark, which could indicate expression of the PDZ-37 isoform
by both of these gut cell lines (Fig. 5.5, red arrow). This would correlate with the
detection of a mRNA transcript in these cell lines, thought to represent the
PDZ-37 isoform (Fig. 5.3B).
5.4.2.2. Intra-cellular localization of harmonin
The polyclonal anti-harmonin antibody was used on the Caco-2 human gut
epithelial cell line to demonstrate that, in these cells, harmonin is localized to
the cytoplasm of these cells and not the nucleus (Fig. 5.6). Furthermore,
191

harmonin appears to have a sub-membranous localization, as would be
hypothesized for a PDZ domain-containing protein. PDZ proteins frequently act
as scaffolding molecules, holding together components of multimolecular
complexes situated at the plasma membrane (reviewed by Fanning and
Anderson, 1999).
5.4.2.3. Possible role for harmonin in gut epithelial cells
Harmonin was originally described as a gut-associated protein and there is
strong positive staining for harmonin in normal post-natal human gut tissue
(Bitner-Glindzicz, et al., 2000; Kobayashi, et al., 1999). Furthermore,
immunohistochemistry of gut biopsy from children affected by the contiguous
gene deletion of USH1C confirmed the absence of harmonin expression, in
addition to an inflammatory enteropathy (Bitner-Glindzicz, et al., 2000). The
existence of the 5’ truncated PDZ-37 isoform of harmonin in Usher patients
might explain their lack of a similar gut phenotype.
It has been confirmed here that PDZ-37 exists as mRNA (Fig. 5.3B) and
preliminary evidence for its translation in gut cell lines has been provided
(Fig. 5.5B). It has also been shown here that harmonin does have a
cytoplasmic localization (Fig. 5.6A) close to the cell membrane, where most
PDZ proteins identified to date are found to carry out their functions. However,
the third PDZ domain of harmonin, the only one found in PDZ-37, currently has
no known protein ligands. Therefore, it is only possible at this stage to
speculate on the possible function of this isoform of harmonin in the gut, should
it turn out to be of any physiological relevance.
192

In Crohn’s disease, a distinct type of inflammatory enteropathy, there is
evidence to suggest that barrier dysfunction is an early event in mucosal
inflammation and that this may be a disorder of the tight junctions (Hollander,
1988). Here, the tight junctions in non-inflamed ileum have been reported to be
more reactive to a luminal stimulus, and this is thought to contribute to the
development of mucosal inflammation (Soderholm, et al., 2002). Could the
mechanism of inflammatory enteropathy be similar in the USH1C deletion
patients?
Tight junctions are the most apical of several lateral cell-cell contacts (see
section 1.2.2.). They form a circumferential seal around epithelial cells that
maintains cell polarity by separating the apical from the basolateral plasma
membrane. Furthermore, tight junctions are able to regulate the passage of
ions and molecules, between extracellular compartments, through the
paracellular pathway (reviewed by Tsukita, et al., 2001). The tight junction is
composed of at least three transmembrane proteins: occludin, junction-
adhesion molecule (JAM) and claudins (a family of -2 0 proteins) as well as
intracelluar tight junction-associated proteins, located at the submembranous
region of the junction. The intracellular proteins act as linkers between the
proteins of the tight junction strands and the actin-based cytoskeleton and
stabilize the cell-cell junction (the work of others has shown that isoforms of
harmonin can link directly and indirectly to the actin cytoskeleton (Boeda, etal.,
2002)).
Many of the tight junction-associated linker proteins that have been identified
are PDZ domain-containing proteins: ZO-1, ZO-2, ZO-3, PAR3, PAR6 and the
193

multi-PDZ domain protein MUPP1 (reviewed by Gonzalez-Mariscal, et al.,
2003). Thus it may be that PDZ-37 is also a component of tight junctions in the
gut, and when absent, the permeability of the mucosal barrier may be altered,
such that non-specific inflammatory responses occur.
A number of proteins were found to share a degree of homology with the third
PDZ domain of harmonin when a BLAST search was performed (URL:
http://www.ncbi.nih.gov/BLAST/). Some of these have been demonstrated to
have a role in tight junctions, for example, PATJ and MUPP1. PATJ (protein
associated to tight junctions) contains ten PDZ domains and has been shown
to localize to tight junctions in human epithelial cells (Lemmers, et al., 2002),
and MUPP1, a possible paralogue of PATJ, is exclusively concentrated at tight
junctions, where it has been shown to interact with claudins and JAM
(Hamazaki, et al., 2002)...............................................................................................
If the 5’ truncated isoform of harmonin, PDZ-37, is found to be an important
component of the tight junctions in gut epithelial cells then, only a deletion of
the entire gene, as seen in the contiguous gene deletion patients, or perhaps a
null mutation occuring 3’ of exon 12, in the constitutive exons, would be
expected to lead to an enteropathy phenotype. To date, no such mutations 3’ of
exon 12 in USH1C have been identified, while all the mutations found in Usher
type 1C patients occur 5’ of exon 12.
As a next step, it would be important to establish whether harmonin, particularly
PDZ-37, is localized to the tight junctions in the Caco-2 cell line by growing the
cells to confluence (such that tight junctions may be formed) and double
194

staining with an antibody against a tight junction marker, such as ZO-1.
Furthermore, co-immunoprecipitation experiments may be performed on the
lysate from these cells to investigate candidate tight junction-associated
proteins that might interact with harmonin.
195
6. Harmonin Interactions
6.1. Introduction
At the start of this study little was known about the function of harmonin, the
protein mutated in Usher syndrome type 1C. However, since it is a PDZ
domain-containing protein it may be hypothesized to have some sort of
scaffolding role upon which other proteins bind to perform a specific function
within both the hair cell of the inner ear and the photoreceptors of the eye.
Alternatively, harmonin may have a role targetting other proteins to their correct
localization within these two cell types, such that they are able to perform their
function. Identification of proteins that interact with harmonin will provide clues
to the role of harmonin in the inner ear and eye.
Obvious candidates for proteins that may bind to harmonin are the other Usher
type 1 proteins, including: myosin VIIA, cadherin 23, protocadherin 15 and
sans. Cadherin 23, protocadherin 15 and sans have been identified during the
course of this study (Ahmed, et al., 2001; Bolz, et al., 2001; Weil, et al., 2003).
Mutations in all five Usher type 1 proteins result in the same phenotype of
sensorineural hearing loss with retinitis pigmentosa, suggesting that they could
be involved in the same pathway, and all are expressed in the hair cells of the
cochlea. The respective mouse models are all phenotypically similar, and have
disorganized stereocilia bundles on the hair cells of the inner ear (Alagramam,
et al., 2001a; Di Palma, et al., 2001; Kikkawa, et al., 2003; Self, et al., 1998).
Therefore, it is possible that these proteins are all part of the same
196

macromolecular complex within the stereocilia, with an important role in
maintaining the structure and/or function of these hair cell projections.
Cadherin 23 and protocadherin 15 belong to a superfamily of adhesion
molecules that mediate Ca2+-dependent homophilic cell-cell adhesion (calcium-
dependent adherent protejn) in all solid tissues of the body (reviewed by Nollet,
et al., 2000). The majority of the cadherin superfamily are transmembrane
glycoproteins that pass the membrane only once, such that the N-terminal is
located outside the cell, while the C-terminal is located inside (Fig. 6.1).
The extracellular portion of the molecule consists of a varying number of
cadherin domains (designated EC, ectodomains) that are highly homologous to
each other. It is these ectodomains that confer specific calcium-dependent
homophilic binding between parallel dimers of cadherin molecules on adjacent
cells (reviewed by Patel, et al., 2003). Cadherin 23 and protocadherin 15
contain twenty-seven and eleven cadherin ectodomains, respectively.
Following the single transmembrane domain is the intracellular C-terminal
domain that, in classical cadherins, is usually found to associate with p-catenin,
which serves as a linker to a-catenin that, in turn, is thought to interact directly
with the actin cytoskeleton of the cell (Fig. 6.1). It has become clear that the
interactions mediated by the cytoplasmic tail of cadherin molecules are
important in strengthening the adhesive-binding activity of the cadherin
ectodomain (reviewed by Ivanov, et al., 2001; Yap, et al., 1997). Interestingly,
the cytoplasmic domain of cadherin-23 does not contain any known protein
motifs and in particular it does not have a p-catenin binding site (Di Palma, et
197

al., 2001), so it may represent a new class of cadherin-like proteins with novel
interacting protein partners.
The protocadherins represent the largest subfamily within the cadherin
superfamily (reviewed by Nollet, et al., 2000). Protocadherins can also mediate
homophilic adhesion, although it is weaker than that seen for the classical
cadherins. Furthermore, the cytoplasmic domains of the classical cadherins are
well conserved, but the cytoplasmic domains of protocadherins are highly
variable and many of the cytoplasmic interacting partners have yet to be
identified.
Sans, the protein product of the USH1G gene, SANS, represents the most
recently identified Usher type 1 protein (Kikkawa, et al., 2003; Weil, et al.,
2003). Sans is a scaffold protein containing three ankyrin repeats at its N-
cadherin^
Figure 6.1. Schematic of a
classical cadherin molecule and
how it may link to the actin
cytoskeleton via catenins. (Prom Yap, etal., 1997).
(5-catemrvu-catenin
actin
The extracellular N-terminal cadherin repeats (EC) confer calcium-dependent homophilic binding between parallel dimers of cadherin molecules on adjacent cells, while the intracellular C- terminus stabilizes this binding by linking the cadherin molecule to the actin cytoskeleton via the a- and p-
catenin proteins.
198

terminus and a C-terminal SAM (sterile alpha motif) domain. Ankyrin repeats
are tandem repeats of approximately thirty-three amino acid residues, that are
involved in protein-protein interactions with diverse, unrelated proteins. SAM
domains are modules of around seventy amino acids that have been shown to
mediate homo- and hetero-dimerization.
During the course of this study, the Usher type 1 proteins cadherin 23, myosin
VIIA and sans were all shown to interact with harmonin (Boeda, et al., 2002;
Siemens, et al., 2002; Weil, etal., 2003). As the C-terminus of protocadherin 15
possesses a PDZ-domain-binding interface (PBI) and it currently has no known
protein interacting partners, it is also a good candidate for interacting with
harmonin.
The possibility of an interaction between the C-terminus PBI of protocadherin
15 and harmonin was investigated using an in vitro GST pull-down assay. As a
positive control for this assay the C-terminus of a novel protein, MCC2, a
homologue of MCC tumour suppressor, which is mutated in colon cancer, was
used. MCC2 was recently identified as a harmonin interacting protein in a yeast
two-hybrid screen that used the full-length harmonin isoform a1 as bait
(Ishikawa, etai., 2001).
6.2. Methods in Brief
6.2.1. In wfro-translation of USH1C
A full-length clone of USH1C isoform a1 cDNA was donated by Dr Matthew
Scanlan at the Ludwig Institute for Cancer Research in New York. To translate
199

the USH1C cDNA into protein in vitro, USH1C cDNA was first subcloned into
the pZErO™-2 vector, as described in section 2.2.7. USH1C was then
trancribed and translated from the Sp6 promoter using the TNTR Quick
Coupled Transcription/Translation system as outlined in section 2.2.11.1.
Protein translation was confirmed using the Transcend™ Non-radioactive
Translation Detection System (section 2.2.11.2.) as well as a monoclonal anti-
harmonin antibody on immunoblot (section 2.2.10.5.).
To investigate possible post-translation modifications of in wfro-translated
harmonin, it was treated with a phosphatase enzyme, calf intestinal alkaline
phosphatase, CIP, (section 2.2.10.7.).
6.2.2. GST-fusion proteins
C-terminal cDNA fragments of protocadherin 15 (candidate harmonin
interacting protein) and MCC2 (positive control for GST pull-down assay) were
cloned in-frame of a GST moiety in the pGEX-4T-1 vector, as described in
section 2.2.7. GST-fusion proteins were then expressed in BL21 E. coli cells
under appropriate growth conditions using IPTG (Isopropyl-thiogalactosidase)
to induce expression, as detailed in section 2.2.11.3. GST-fusion proteins were
extracted from E. coli cell pellets (section 2.2.11.4.) and the cell lysates were
applied to pre-equilibrated glutathione Sepharose beads (section 2.2.11.5.).
The protein-protein interaction assay was then performed as outlined in section
2.2.11.7. After the final washes the bound proteins were eluted from the beads
by denaturing in SDS-loading buffer and subject to SDS-PAGE (section
2.2.10.3.). Proteins were transferred to nitrocellulose membrane (section
200

2.2.10.5.) and harmonin was detected using a monoclonal anti-harmonin
antibody (section 2.2.10.6.).
6.3. Results
6.3.1. In vitro transcription and translation of USH1C
Biotinylated in i/rtro-translated USH1C was detected on immunoblot using a
streptavidin-alkaline phosphatase (AP) conjugate (Fig. 6.2A, lane 1) and no
protein was detected when DNA was excluded from the in wfro-translation
reaction (Fig. 6.2A, lane 2).
A non-biotinylated protein product of ~75 kDa was also detected on
immunoblot, when a mouse monoclonal anti-harmonin antibody, raised to the
full-length human harmonin a1 isoform (Scanlan, et a/., 1999), was used
(Fig. 6.2B, lane 2), confirming that the translated protein was harmonin.
201

2
B )S : . *
5 2 . 3
1007 5
5 0
3 7
2 5
Figure 6.2. Detection of in wtro-translated harmonin.(A) Colorimetric detection of harmonin in vitro-translated with the incorporation of biotinogroups. A protein product of the expected size (~75 kDa) was detected on immunoblot when incubated with a streptavidin-AP conjugate and developed with a substrate for alkaline phosphatase (lane 1). No protein was detected when DNA was excluded from the in vitro-translation reaction (lane 2). (B) Immuno-detection of in wfro-translated harmonin. A protein of ~75 kDa was detectable on immunoblot developed using a mouse monoclonal anti-harmonin antibody (lane 2). No protein was detected when the DNA template was excluded from the in wfro-translation reaction (lane 1). Size in kiloDaltons is indicated on the left.
6.3.1.1. De-phosphorylation of harmonin
Harmonin was detected as three bands on immunoblots and not as a single
band. In w'fro-translated harmonin treated with calf intestinal alkaline
phosphatase (CIP) appeared more diffuse on immunoblot (Fig. 6.3, lane 2)
when compared to untreated protein (Fig. 6.3, lane 3). However, there was no
positive control for this experiment and it is not known if the enzyme was active.
The reaction was repeated three times, each with similar, inconclusive results.
Therefore, it is not known if the extra bands seen on immunoblot are due to
alternatively phosphorylated species of the in w'fro-translated harmonin.
202

1 2Figure 6.3. Treatment of in vitro•
J translated harmonin the phosph115
93atase, CIP.In vitro-translated harmonin treated with CIP (lane 2) was compared with untreated harmonin (lane 3). Lane 1 shows the negative control for the in
vitro-translation reaction. Size inkiloDaltons is indicated on the left.
49.8r
6.3.2. Candidate protein expression
The C-terminal 573 bp, including the PDZ-binding interface (PBI), of
protocadherin 15, (Fig. 6.4), was cloned in-frame with a Glutathione S-
transferase (GST) moiety in the pGEX-4T-1 vector and sequenced. Induction of
protein expression in E. coli cells, would then result in expression of the
protocadherin 15 fragment with a GST tag attached to its N-terminus. As a
positive control for the GST pull-down assay, the last 500 bp of cDNA coding
for the novel protein MCC2 was also cloned in-frame with GST in the pGEX-4T-
1 vector. The C-terminus of MCC2 contains a PBI shown previously to bind to
harmonin in a similar assay (Ishikawa, et al., 2001).
Figure 6.4. Schematic illustration of protocadherin 15 domain structure.Eleven extracellular cadherin ectodomains at the N-terminus and a C-terminal cytoplasmic domain. The fragment of PCDH15 cDNA cloned into the GST vector, pGEX-4T-1, is indicated in red. TM, transmembrane; PBI, PDZ-binding interface.
Cadherin ectodomains TTVI
NHCytoplasmic domain PBI
| COOH
C lo n e d for
G S T -fo s io n protein
203
Protein expression in E. coli was optimized by inducing at different
temperatures, with different concentrations of IPTG and for different periods of
time (Figs 6.5 to 6.10). As a negative control for the assay, the GST moiety was
expressed from the wild type vector (Fig. 6.7).
Initial experiments, inducing expression of GST-fusion proteins at 37°C with
1 mM IPTG for 5 h, revealed that GST-PCDH15 was a much less stable protein
than GST-MCC2. GST-MCC2 expression was optimal by 2 h post-induction
and stable up to 5 h post-induction (Fig. 6.5, arrow). GST-PCDH15 expression
was also optimal at 2 h post-induction, but the protein then appeared to rapidly
decay after this time point (Fig. 6.6, arrow).
Wild type GST was over-expressed using 1 mM IPTG at 37°C and the protein
remained stable up to 4 h post-induction (Fig. 6.7).
204
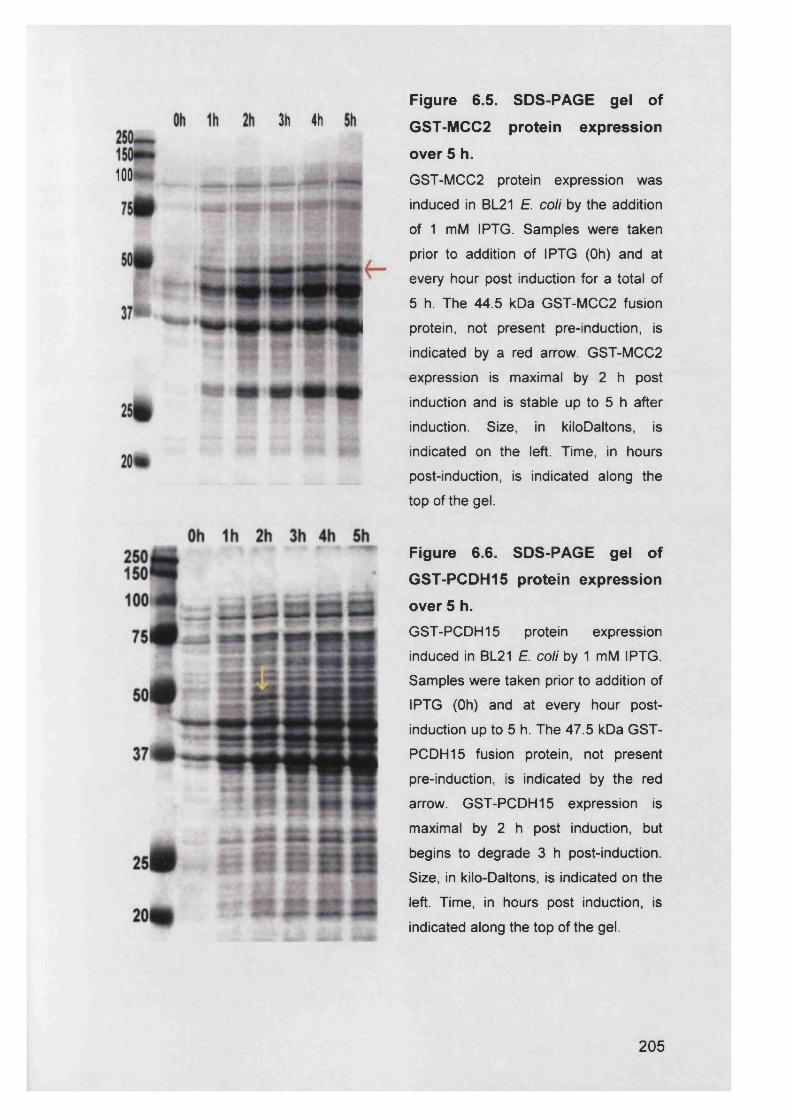
3h 4(1
100 *
Figure 6.5. SDS-PAGE gel of
GST-MCC2 protein expression
over 5 h.
GST-MCC2 protein expression was induced in BL21 E. coli by the addition of 1 mM IPTG. Samples were taken prior to addition of IPTG (Oh) and at every hour post induction for a total of 5 h. The 44.5 kDa GST-MCC2 fusion protein, not present pre-induction, is indicated by a red arrow. GST-MCC2 expression is maximal by 2 h post induction and is stable up to 5 h after induction. Size, in kiloDaltons, is indicated on the left. Time, in hours post-induction, is indicated along the top of the gel.
Figure 6.6. SDS-PAGE gel of
GST-PCDH15 protein expression
over 5 h.GST-PCDH15 protein expression induced in BL21 E. coli by 1 mM IPTG. Samples were taken prior to addition of IPTG (Oh) and at every hour postinduction up to 5 h. The 47.5 kDa GST- PCDH15 fusion protein, not present pre-induction, is indicated by the red arrow. GST-PCDH15 expression is maximal by 2 h post induction, but begins to degrade 3 h post-induction. Size, in kilo-Daltons, is indicated on the left. Time, in hours post induction, is indicated along the top of the gel.
205

Oh 1h 2h 3h 4h250150** *m 100 *
75i
50m §
mm mm
2 5 t »
2 0 ^
Figure 6.7. SDS-PAGE gel of GST
protein expression over 4 h.
Wild type GST protein expression induced from the pGEX-4T-1 vector in BL21 E. coli by 1 mM IPTG. Samples were taken prior to addition of IPTG (Oh) and at every hour post-induction up to 4 h. The -25 kDa protein, not present pre-induction, is indicated by the red arrow. GST protein is overexpressed by 1 h post-induction and expression is maximal by 2 h and stable up to 4 h after induction. Size, in kiloDaltons, is indicated on the left. Time, in hours post induction, is indicated along the top of the gel.
Expression of the GST-fusion proteins in E. coli incubated at different
temperatures revealed that greater quantities of GST-PCDH15 could be
obtained by incubating at 30°C for 3 h (Fig. 6.9, red asterisk). Expression of
GST-MCC2 was still maximal when incubated at 37°C for 2 h (Fig. 6.8, red
asterisk).
206
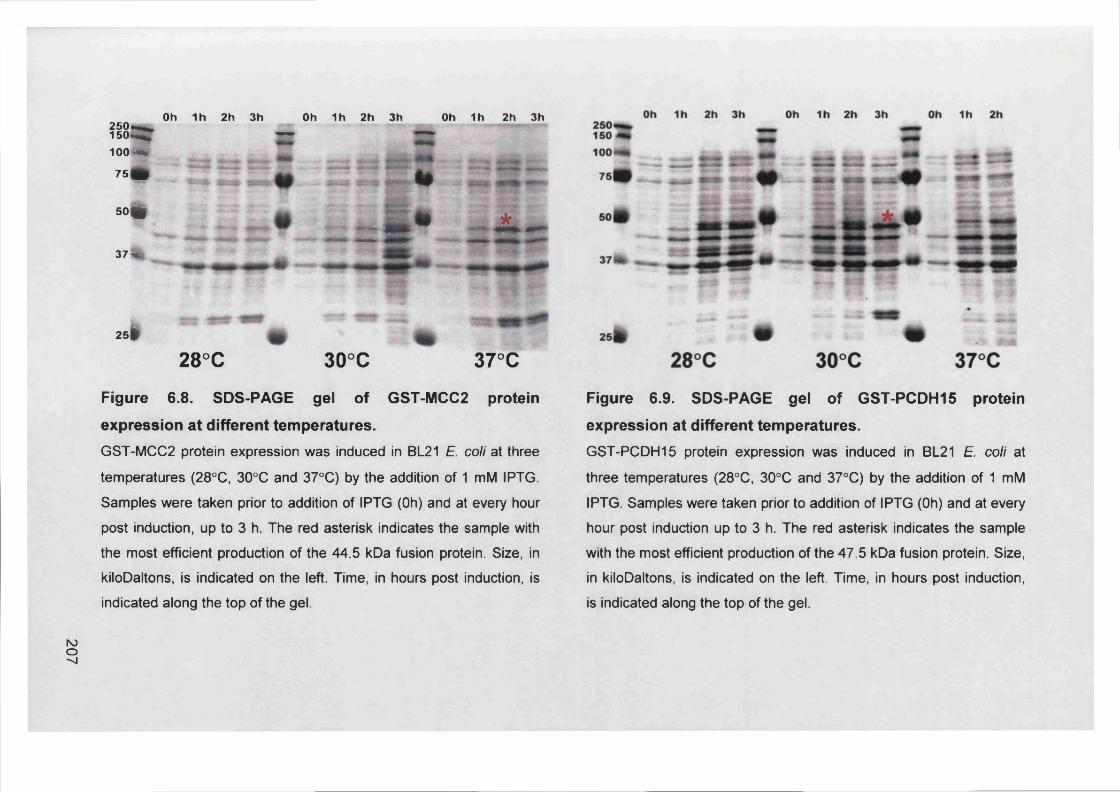
207
Oh 1h 2h 3h Oh 1h 2h 3h Oh 1h 2h 3h2 5 0 * * * ,is°=r = —100 *m
75m
50(|
37%
< •
t e * _ jf c -
25 f t
28°C 30°C 37°C
Figure 6.8. SDS-PAGE gel of GST-MCC2 protein
expression at different temperatures.
GST-MCC2 protein expression was induced in BL21 E. coli at three temperatures (28°C, 30°C and 37°C) by the addition of 1 mM IPTG. Samples were taken prior to addition of IPTG (Oh) and at every hour post induction, up to 3 h. The red asterisk indicates the sample with the most efficient production of the 44.5 kDa fusion protein. Size, in kiloDaltons, is indicated on the left. Time, in hours post induction, is indicated along the top of the gel.
Figure 6.9. SDS-PAGE gel of GST-PCDH15 protein
expression at different temperatures.
GST-PCDH15 protein expression was induced in BL21 E. coli at three temperatures (28°C, 30°C and 37°C) by the addition of 1 mM IPTG. Samples were taken prior to addition of IPTG (Oh) and at every hour post induction up to 3 h. The red asterisk indicates the sample with the most efficient production of the 47.5 kDa fusion protein. Size, in kiloDaltons, is indicated on the left. Time, in hours post induction, is indicated along the top of the gel.

When the total concentration of IPTG used for inducing protein expression was
reduced from 1 mM to 0.1 mM, a further increase in the expression of both
GST-fusion proteins was observed (Fig. 6.10, asterisks).
mM IPTG 1 0.1 1 0.1 1 0.1 1 0.1 1 0.1
20
Oh 1h 1h 2h 2h 3h 3h GST-PCDH15
Oh 1h 1h 2h 2h GST-MCC2
Figure 6.10. SDS-PAGE gel of GST-MCC2 and GST-PCDH15 protein
expression at different IPTG concentrations.GST-PCDH15 and GST-MCC2 protein expression were induced in BL21 E. coli, at 30°C and 37°C, respectively, by the addition of either 1 mM or 0.1 mM IPTG. Samples were taken prior to addition of IPTG (Oh) and at every hour post induction up to 2 or 3 h. The asterisk indicates the sample, in each case, with the most efficient production of fusion protein. The expression of both GST-MCC2 and GST-PCDH15 was induced more efficiently with 0.1 mM IPTG. Size, in kiloDaltons, is indicated on the left. Time, in hours post induction, is indicated along the bottom of the gel. The final concentration of IPTG used is indicated along the top of the gel.
This series of induction experiments revealed that the optimal conditions for
GST-PCDH15 fusion protein expression are 0.1 mM IPTG for 3 h at 30°C
(Fig. 6.10, yellow asterisk). Meanwhile, GST-MCC2 expression is optimal with
0.1 mM IPTG for 2 h at 37°C (Fig. 6.10, red asterisk).
208
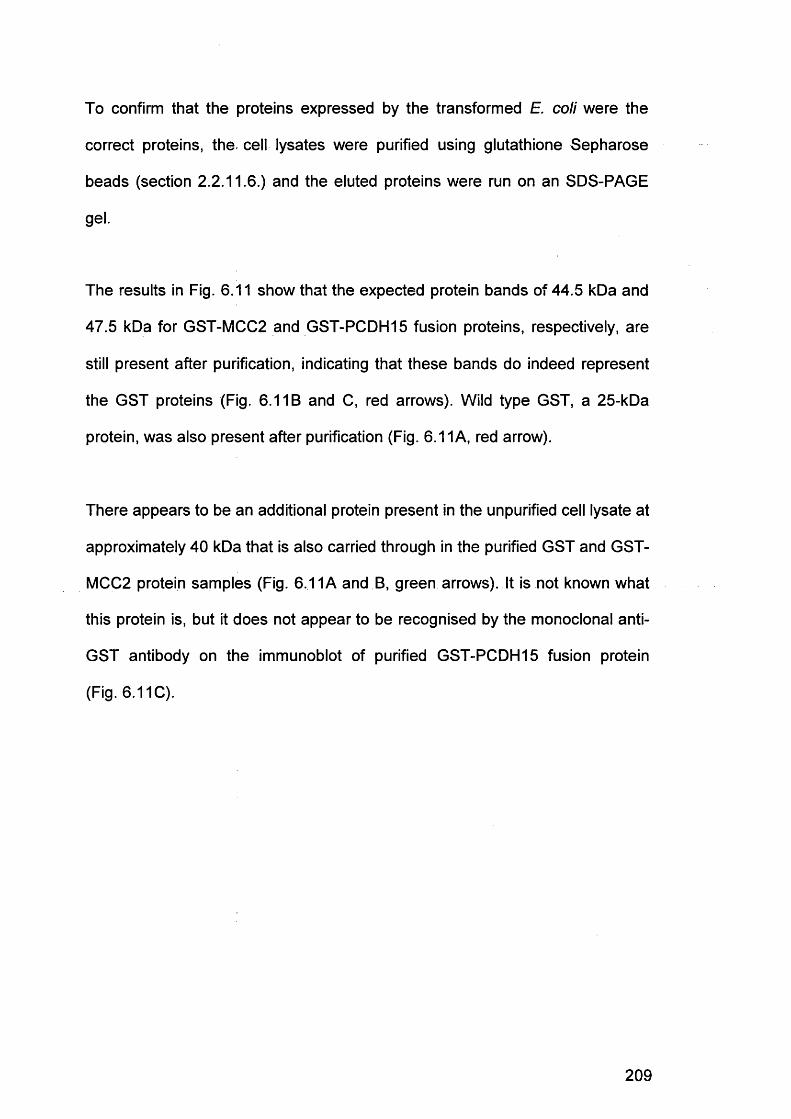
To confirm that the proteins expressed by the transformed E. coli were the
correct proteins, the, cell lysates were purified using glutathione Sepharose
beads (section 2.2.11.6.) and the eluted proteins were run on an SDS-PAGE
gel.
The results in Fig. 6.11 show that the expected protein bands of 44.5 kDa and
47.5 kDa for GST-MCC2 and GST-PCDH15 fusion proteins, respectively, are
still present after purification, indicating that these bands do indeed represent
the GST proteins (Fig. 6.11B and C, red arrows). Wild type GST, a 25-kDa
protein, was also present after purification (Fig. 6.11 A, red arrow).
There appears to be an additional protein present in the unpurified cell lysate at
approximately 40 kDa that is also carried through in the purified GST and GST-
MCC2 protein samples (Fig. 6.11 A and B, green arrows). It is not known what
this protein is, but it does not appear to be recognised by the monoclonal anti-
GST antibody on the immunoblot of purified GST-PCDH15 fusion protein
(Fig. 6.11C).
209
A) B ) C)1 2 3 4 5 6
20#GST-MCC2
100
25
37
75
50
mm mmGST-PCDH15
m u t m
GST
Figure 6.11. Purification of GST-fusion proteins.BL21 E. coli protein extracts were incubated with glutathione Sepharose beads, the beads were then washed and the proteins eluted and run on an SDS-PAGE gel. Purified wild type GST (A, lane 2) and GST-MCC2 fusion protein (B, lane 4) were visualised directly by staining the SDS-PAGE gel with Coomassie Brilliant blue dye and comparing with unpurified samples of cell lysate (lanes 1 and 3, respectively). Purified GST-PCDH15 fusion protein (C, lane 6) was visualized by transferring the proteins to nitrocellulose membrane, probing with a monoclonal anti-GST antibody and comparing to a sample of unpurified cell lysate (lane 5). A red arrow in each case indicates the purified protein products. Green arrows indicate an unidentified protein in purified samples. Size, in kiloDaltons, is indicated on the left of each panel.
6.3.3. In vitro binding assay
GST-PCDH15 fusion protein was bound to glutathione Sepharose beads and
the conjugated beads were then incubated with in wfro-translated harmonin.
After washing, any protein complexes that remained bound were eluted from
the beads and run on an immunoblot. Bound harmonin was detected using the
mouse monoclonal anti-harmonin antibody (Scanlan, etal., 1999). As a positive
210

control, GST-MCC2 was bound to the glutathione Sepharose beads in place of
GST-PCDH15, whilst, as a negative control, wild type GST was used.
This assay was repeated three times and each time harmonin showed binding
to the positive control, GST-MCC2, confirming that the assay was effective
(Fig. 6.12, lane 2). Harmonin did not show binding to the C-terminal 191 amino
acids of protocadherin 15 fused to GST, GST-PCDH15 (Fig. 6.12, lane 3).
When wild type GST protein was applied to the glutathione Sepharose beads, it
appeared to be able to pull-down a small amount of harmonin
(Fig. 6.12, lane 4). It is not known why this should occur, especially as it was
not seen previously (Ishikawa, et al., 2001). However, harmonin shows no
binding at all in the mock pull-down experiment, where harmonin was added to
the glutathione Sepharose beads in the absence of any other protein (Fig. 6.12,
lane 5). Therefore, it may be concluded that harmonin does not interact with the
C-terminal 191 amino acids of protocadherin 15.
211

250150
100
75
50
37
Figure 6.12. GST pull-down assay of harmonin a1 isoform with the
C-terminus of protocadherin 15.Monoclonal anti-harmonin antibody was used to detect harmonin, on immunoblot, in samples eluted from glutathione Sepharose beads after the GST pull-down assay was performed. In wfro-translated harmonin is shown in lane 1 as a reference. GST-MCC2, applied to the glutathione Sepharose beads as a positive control, was successful at pulling down in w'fro-translated harmonin (lane 2). However, the candidate protein, GST-PCDH15, was unable to pull down harmonin (lane 3). Lanes 4 and 5 are negative controls where either unmodified GST protein or buffer alone has been applied to the glutathione Sepharose beads, respectively, prior to the addition of in vitro-translated harmonin. Red arrow indicates harmonin. Size, in kiloDaltons, is indicated on the left.
6.4. Discussion
6.4.1. In wfro-translated harmonin
USH1C was in vitro-translated successfully. However, it is not known why the
in wfro-translated harmonin appears as three bands on immunoblot. When in
wfro-translated harmonin was treated with CIP (Fig. 6.3) to ascertain if
212

phosphorylation might be responsible for the extra bands, the results were
inconclusive.
When an immunoblot of extracts from human epithelial cell lines was
developed using the same monoclonal anti-harmonin antibody, endogenous
harmonin was not detected as three bands (Fig. 5.4), indicating that the
presence of three bands may be a consequence of the in vitro-translation
system.
6.4.2. Expression of GST-fusion proteins
To obtain the best possible yield of GST-fusion proteins for use in the pull-down
assay, protein expression was induced at different temperatures (28°C, 30°C
and 37 °C) (Figs 6.8 and 6.9), with two different concentrations of IPTG
(0.1 mM and 1.0 mM) (Fig. 6.10) and sampled hourly for up to 5 h.
Since it was found that GST-PCDH15 was quite an unstable protein (Fig. 6.6),
the GST pull-down assay was carried out the next day, immediately after
protein expression and extraction from E. coli cells had been performed.
Furthermore, both fusion proteins, GST-MCC2 and GST-PCDH15, were
purified following the GST pull-down assay and detected on a Coomaisse-
stained gel or immunoblot (Fig. 6.11B and C), confirming that they had not
degraded prior to use in the assay.
6.4.3. Interaction of Usher type 1 proteins
PDZ domains are globular protein-protein binding domains consisting of 6 p-
strands that sandwich two a-helices and are organized in such a way that a
213

peptide-binding groove is left exposed between the pB-strand and the aB-helix
(see Fig. 1.13). In general, PDZ domains interact with the last four to five amino
acids at the C-terminus of a protein ligand (Doyle, et al., 1996). Furthermore,
PDZ domains may be classified according to the peptide sequence of their
binding partners (Songyang, et al., 1997). Therefore, it is possible to
hypothesize that a candidate protein may bind to a PDZ domain based upon
the presence of a PDZ-binding consensus sequence at its C-terminus.
During the course of this work, interactions between harmonin and myosin
VIIA, cadherin 23 and sans were demonstrated by other groups (Fig. 6.13). The
first PDZ domain of harmonin has been shown to have an affinity for the C-
terminal MyTH4 + FERM repeat of myosin VIIA (Boeda, et al., 2002) as well as
for sans (Weil, et al., 2003). The second PDZ domain of harmonin has been
shown to bind to the C-terminus of cadherin 23 (Boeda, et al., 2002; Siemens,
et al., 2002).
214

Outside Inside
Cadherin 23
Myosin VIIASH3 MyTH4
t w * $ -
StereociliaMembrane
Ii cooh
I _________________nh’ - E
n I COOH.
F-Act in
tt
IQ Motor domain
Harmonin b
Figure 6.13. Schematic representation of the predicted interactions of three Usher type 1 proteins in the inner ear. (Adapted from Boeda, et al.,
2002).
The longer harmonin b isoform is thought to interact with the F-actin cytoskeleton via its C-terminal portion (Boeda, et al., 2002). The intracellular C-terminus of cadherin 23 contains a PDZ-binding interface that has been shown to interact with PDZ2 of harmonin in the stereocilia (Siemens, et al., 2002). Myosin VIIA is an actin-based motor protein that moves along the actin cytoskeleton towards the tip of the stereocilia (arrows). PDZ1 of harmonin has been shown to have affinity for the C-terminal MyTH4 + FERM repeat of myosin VIIA (Boeda, et al., 2002). EC = cadherin ectodomains, PDZ = PDZ domain, CC = coiled-coil domain, PEST = protein degradation domain, FERM = FERM domain, MyTH4 = myosin tail homology 4 domain, SH3 = SH3 domain, IQ = isoleucine-glutamine motifs.
Protocadherin 15, which like harmonin is expressed in the hair cells of the
mouse innner ear (Alagramam, et al., 2001b; Verpy, et al., 2000), has a very
similar consensus sequence at its C-terminus (Ser-Thr-Ser-Leu) to cadherin 23
215

(Ile-Thr-Glu-Leu). However, the GST pull-down experiment performed in this
study indicates that the C-terminus of protocadherin 15 does not interact with
harmonin a, the major isoform of harmonin. The in wfro-translated harmonin
did, however, interact with the C-terminus of MCC2 (Fig 6.12, lane 2),
indicating that the assay was effective.
There did appear to be some non-specific binding occuring between harmonin
and wild type GST (Fig. 6.12, lane 4), despite the use of stringent washes.
However, since harmonin showed no binding at all to GST-PCDH15 (Fig. 6.12,
lane 3), or in the mock binding experiment (Fig. 6.12, lane 5), the non-specific
binding to GST would not be expected to affect the results.
Although the C-terminus of protocadherin 15 does not appear to interact
directly with harmonin a, it cannot be ruled out that harmonin and protocadherin
15 are still part of the same macromolecular complex. Harmonin and
protocadherin 15 may interact indirectly, via one or more other proteins.
Furthermore, it is still possible that the ear-specific harmonin b isoform, which
includes an extra coiled-coil domain, may interact with protocadherin 15.
PDZ domains do not only interact with consensus sequences located at the C-
termini of their ligand proteins, some PDZ domains have been shown to bind to
internal PDZ binding sequences (Cuppen, et al., 1998; Hillier, et al., 1999).
These interactions are normally possible because the 3-D structure of the
internal protein sequence forms a p-hairpin “finger” that structurally mimicks the
classical carboxyl terminus ligand. The cytoplasmic domain of cadherin 23 has
216

been shown to bind to the PDZ1 domain of harmonin via an internal PDZ
binding motif (Siemens, et al., 2002).
Only the last 191 bp of the C-terminus of protocadherin 15 were cloned for use
in the GST pull-down assay. However, the cytoplasmic domain of
protocadherin 15 cohtains another 368 bp of DNA, which could contain an
internal PDZ-binding motif. There are no consensus sequences for internal
PDZ-binding motifs, but it might be possible to identify potential motifs by
looking for homology to known internal PDZ-binding motifs.
Interestingly, cadherin 23 and protocadherin 15 have exactly the same amino
acid residue in two out of the last four residues at their C-terminus (leucine and
threonine at positions 0 and -2 , respectively). Cadherin 23 interacts with PDZ2
of harmonin (Boeda, et al., 2002; Siemens, et al., 2002), whilst protocadherin
15 does not, illustrating just how specific are the ligand-binding properties of
PDZ domains. PDZ domains seem to lack specificity for recognition of their
peptide ligands at the -1 position, which, in the case of the peptide ligand for
PDZ3 of PSD-95, has been shown to point away from the PDZ domain
interaction surface (Doyle, et al., 1996). Therefore, in this situation, the binding
specificity of PDZ2 of harmonin may be determined by amino acid residues that
are more N-terminal in the binding protein, as demonstrated for other PDZ
domains (Songyang, etal., 1997).
It has been suggested that harmonin b bridges cadherin 23, a transmembrane
protein involved in cell-cell adhesion via homophilic interaction, to the actin
cytoskeleton in the developing stereocilium. This anchoring of cadherin 23 is
217

thought to strengthen cohesion between the individual stereocilia (Boeda, et al.,
2002). Furthermore, it has also been suggested that the F-actin bundling
property of harmonin b could stabilize the actin core of stereocilia and further
contribute to their stiffness (Boeda, et al., 2002).
Cadherin 23 has been observed along the length of the developing stereocilia
(Boeda, et al., 2002), but recent evidence shows that in mature hair cells
cadherin 23 is a component of the tip link that forms between adjacent
stereocilia (Siemens, et al., 2004; Sollner, et al., 2004). Protocadherin 15 is
also present along the entire length of the stereocilia as soon as they become
apparent and its presence persists in adult mice (Ahmed, et al., 2003).
Therefore, it is possible that protocadherin 15 may have a similar role to
cadherin 23 and forms part of another type of link found between the
stereocilia, for example, the shaft connectors or top links...............................
Currently, protocadherin 15 is an orphan protein with no known interacting
protein partners. The ames waltzer mouse has a similar phenotype to the other
Usher type 1 mouse models with disorganized, splayed stereocilia in the inner
ear. Hence, prospective binding partners for protocadherin 15 would be
expected to link the intracellular C-terminus of protocadherin 15 to the actin
cytoskeleton forming a complex that strengthens the cohesion between mature
stereocilia in a similar way to cadherin 23 in the developing stereocilia (Boeda,
et al., 2002). Since the PDZ-binding motif at the C-terminus of protocadherin 15
does not appear to bind to harmonin, this suggests that another PDZ protein
may be involved.
218

A yeast two-hybrid study, using the 191 bp of the C-terminus of protocadherin
15 as bait, attempted in our group was unsuccessful as the. protocadherin 15
fragment used was found to be toxic to the yeast cells. It would be interesting to
repeat the GST pull-down experiment with the whole of the cytoplasmic domain
of protocadherin 15, in case there are any internal PDZ binding motifs, or other
unidentified protein-interaction domains.
Potential candidate binding partners for protocadherin 15 could include the
proteins defective in mouse models with a similar phenotype to the Usher type
1 mouse models. For example, in the whirler mouse, the model for non-
syndromic deafness DFNB31, the defective protein, whirlin, is a novel PDZ
protein that also contains three PDZ domains (Mburu, et al., 2003).
Furthermore, the genes responsible for Usher type 1A and 1E have not been
cloned and are also potential binding partners for protocadherin 15....................
219

7. Discussion
Usher syndrome type 1C is a subtype of the deaf blindness condition that was
originally thought to be confined to the French Acadian population of
Louisianna. The gene underlying Usher syndrome in the Acadians was mapped
to chromosome 11 p15 in 1992 (Smith, et al., 1992), but the gene was not
identified until 2000 (Bitner-Glindzicz, et al., 2000; Verpy, et al., 2000).
However, since the discovery of the USH1C gene, and during the course of this
study, a number of mutations have been identified in Usher type 1 patients from
a variety of populations around the world (Ahmed, et al., 2002; Bitner-Glindzicz,
et al., 2000; Verpy, et al., 2000; Zwaenepoel, et al., 2001) (Fig. 7.1).
Furthermore, mutations in USH1C have also been shown to cause non-
syndromic deafness in the absence of a retinal phenotype (Ahmed, et al., 2002;
Ouyang, etal., 2002) (Fig. 7.1).
220

P608Re238-239insCabc P620Le216 6>A° R636C'
R31XC I 769-770ins36d S431V' Il l I 1 I
i f 4IVS1+16>T'
t “IVS8+2T>£d
45bp VNTRb IVS12+5a>CdIV55-2delAbIVS5+1 G>AC
Figure 7.1. Schematic of USH1C indicating the locations of mutations
found in Usher type 1C families to date.The constitutive exons are represented by black rectangles and the alternatively spliced exons are represented by pink rectangles, exons numbers are indicated below. Mutations found in Usher type 1C patients are indicated in blue type and mutations found in patients with non-syndromic deafness, DFNB18, are in green type. Intronic mutations are annotated below the gene and coding mutations are above, a, (Bitner- Glindzicz, et al., 2000); b, (Verpy, et al., 2000); c, (Zwaenepoel, et al., 2001); d, (Ahmed, et al., 2002); e, (Ouyang, etal., 2002).
7.1. Mutations in USH1C
Disappointingly, our mutation analysis did not uncover any new mutations in
our cohort of Usher type 1 patients, but it did reveal USH1C to be a more
important contributor to type 1 Usher syndrome than other studies had
indicated (Astuto, et al., 2000). All of the USH1C mutations identified in Usher
type 1 patients, to date, are frame-shift or splice-site mutations, which are
predicted to lead to a truncated protein product. Currently, no missense
mutations in the USH1C gene have been identified in Usher type 1 patients.
221

7.1.1. Usher type 1C alleles
Usher syndrome type 1C is still most prevalant in the Acadian population of
Louisianna, where a founder effect explains the relatively high frequency of
Usher syndrome type 1C in this population (Keats, et al., 1994). In other
populations, the 238-239insC mutation, also identified in this study in a Greek
Cypriot patient, appears to be presenting as a common mutation, and accounts
for 50% of the USH1C alleles identified to date (Ahmed, et al., 2002; Bitner-
Glindzicz, et al., 2000; Ouyang, etal., 2002; Verpy, et al., 2000).
It has been hypothesized that the 238-239insC mutation is also due to a
founder effect. Individuals from Pakistan and Europe were found to carry the
238-239insC mutation on the same genetic background (Zwaenepoel, et al.,
2001). However, the nature of the mutation, an insertion of a cytosine in a run
of six cytosines, is such that it could represent a mutation hotspot, occurring by
the mechanism of slipped-strand mispairing (Darvasi and Kerem, 1995). This
led us to investigate the genetic background associated with 238-239insC in
our Greek-Cypriot patient (Table 3.2).
The genetic background on which 238-239insC occurs in our Greek-Cypriot
patient differs from that reported previously, due to a recombination event that
has reduced the shared haplotype to only 7 kb (Table 3.2). Furthermore, we
found that the haplotype associated with the 238-239insC mutation is not
particularly rare in either the Greek Cypriot or Pakistani populations (Tables 3.3
and 3.4). Therefore, 238-239insC is not necessarily due to a founder effect, but
if it is, it must be quite ancient, since the region shared by all the patients found
222

to carry the mutation is now relatively small (7 kb). Interestingly, a recent
investigation into the ancestry of three populations from northern Pakistan has
demonstrated that in certain Pakistani populations there is a small Greek
contribution to the genetic pool. Similar admixture estimates were also obtained
when the populations were compared with a European population sample that
excluded the Greeks (Mansoor, et al., 2004). This indicates that there could be
an ancient genetic relationship between the three populations, Pakistani,
European and Greek, in which the 238-239insC mutation has been identified.
Regardless of the origin of the 238-239insC mutation, it is the first common
mutation identified in the five cloned USH1 genes, some of which are
composed of fifty or more exons. We have, therefore, proposed that a simple
screening strategy would be to screen Usher type 1 patients for this recurrent
mutation first.
7.1.2. DFNB18 patients
USH1C mutations in patients with non-syndromic autosomal recessive
deafness, DFNB18, have now been identified (Ahmed, et al., 2002; Ouyang, et
al., 2002). However, we have shown here that the DFNB18 locus is not a
significant contributor to non-syndromic sensorineural hearing loss. From an
original cohort of 133 Caucasian sib pairs with non-syndromic hearing loss
(Navarro-Coy, et al., 2001), only sixteen showed concordance for markers
flanking the DFNB18 locus. In our mutation screen of these sixteen sib pairs,
no coding or splice-site mutations were identified in USH1C.
It is not always obvious how different mutations within the same gene can give
223
rise to either syndromic or a non-syndromic form of hearing loss (Prasad, et a/.,
2004), but a pattern does seem to be emerging for USH1C mutations.
Mutations at the 5’ end of USH1C that affect splicing and/or introduce a
premature stop codon are found in patients with Usher syndrome. In contrast,
DFNB18 patients, with deafness in the absence of retinitis pigmentosa,
possess hypomorphic alleles of USH1C. The DFNB18 alleles identified, so far,
either have missense mutations in the alternative exons (Ouyang, et al., 2002),
or a splice-site mutation that leads to ‘leaky’ splicing, resulting in the production
of both wild type mRNA and an aberrant mRNA, in which the reading frame is
shifted (Ahmed, et al. 2002) (Fig. 7.1). This has turned out to be similar to the
situation found in CDH23 and PCDH15, the genes for Usher syndrome type 1D
and 1F, respectively. Missense mutations segregate in families with non-
syndromic forms of deafness, DFNB12 (Bork, et al., 2001) and DFNB23
(Ahmed, et al., 2002), respectively, whilst truncating nonsense and splice site
mutations are found in families with Usher type 1D and 1F (Ahmed, et al.,
2001; Alagramam, eta!., 2001b; Bork, et al., 2001).
7.2. Alternative Isoforms of Harmonin
USH1C is an alternatively spliced gene leading to the production of various
isoforms of harmonin, which can include: 1-3 PDZ domains, one or two coiled-
coil domains and the presence or absence of a putative protein degradation
motif (PEST). Both PDZ domains and coiled-coil domains are important
protein-protein interaction domains. A variety of harmonin isoforms have been
identified (Scanlan, et al., 1999; Verpy, et al., 2000) and are depicted in
Fig. 4.1. Essentially, the majority of the alternative splicing occurs between
224

exons 14 and 16 with the inclusion or exclusion of exons 15 and A -F
determining whether or not the second coiled-coil domain and the protein
degradation domain are present. Alternatively, the exclusion of exons 15 and
A -F and the splicing of exon 14 directly onto exon 16 introduces a premature
stop codon, which results in a truncated isoform of harmonin (c1/PDZ-45) that
lacks the third PDZ domain.
7.2.1. Harmonin b isoforms and the eye
It is already apparent that harmonin may have different roles within the ear and
the eye. Usher type 1C patients have profound congenital sensorineural
deafness, indicating that harmonin may be required for the development of the
sensory areas of the inner ear. In contrast, retinitis pigmentosa develops after
birth and the effects on eyesight only become apparent around puberty. Hence,
harmonin is probably not required for the correct formation of the photoreceptor
cells, but is more likely to have a role in the maintenance of the sensory cells of
the eye.
It was reported that the harmonin b isoforms are only expressed in the inner
ear (Verpy, et al., 2000) and we and others hypothesized that mutations in the
alternative exons would cause non-syndromic deafness and not affect the eye.
However, our RT-PCR analysis of the expression of the b isoforms in human
foetal tissues has revealed that harmonin b is not ear-specific. We also
identified harmonin b mRNA in foetal gut, heart and kidney tissue as well as£/
small traces in the eye (Figs 4.7 and 4.8). Expression of harmonin b in the
mammalian retina was recently confirmed. Immunolabelling of rat and mouse
retina sections, using an antibody raised against the PEST motif found in the b
225

isoforms, detected harmonin b expression in the light-sensitive outer segments
of the photoreceptor cells (Reiners, etal., 2003).
Since harmonin b now appears to be expressed in both organs, mutations in
the alternative exons could potentially also affect the eye as well as the ear.
However, it appears that the mechanism of action of mutations in the
alternative exons may be one of dosage, since the eye does not seem to be as
sensitive to the loss of harmonin b. This, in turn, may relate to the different
roles of this isoform in each organ.
7.2.2. Novel USH1C mRNA transcripts
In this study, novel USH1C transcripts were identified in human foetal ear
tissue (Fig. 4.6). These included exons B and C or exon B alone spliced onto
exon 16. It is not known how important these isoforms are, however, it is
interesting to note that they could code for in-frame protein products if spliced
onto exon 15 or exon A. Exon B and part of exon C encode the second coiled-
coil domain found in the harmonin b isoforms. These novel isoforms would lack
the putative protein degradation motif (PEST) encoded by exons D and E and,
therefore, could be predicted to be more stable than the harmonin b isoforms,
whilst retaining the ability to perform additional interactions through the second
coiled-coil domain.
The harmonin b isoforms, detected by an antibody specific for the PEST
domain, are present in the mouse developing stereocilia, but are no longer
detected in the cochlea from P30 onwards (Boeda, et al.} 2002). It would be
interesting to use an antibody directed to the second coiled-coil domain of
226
harmonin to investigate whether the novel transcripts identified in this study
have a role in the mature stereocilia, when the longer harmonin b transcripts
can no longer be detected.
7.2.3. Harmonin in the gut and kidney (PDZ-37)
As well as being important in the ear and the eye, harmonin may have a role in
the normal function of the gut and the kidney. Prior to its designation as the
protein that is mutated in Usher syndrome type 1C patients, harmonin was
originally identified as an auto-antigen in two cohorts of patients. In one cohort,
the patients had colon cancer (Scanlan, et al., 1999), while in the other cohort
the patients suffered from an X-linked autoimmune enteropathy (AIE)
associated with tubulonephropathy (Kobayashi, etal., 1999).
USH1C was cloned in our group when a family presenting with a phenotype of
enteropathy and renal tubular dysfunction in combination with severe
hyperinsulinism and profound congenital sensorinueral deafness, were found to
have a contiguous gene deletion (Bitner-Glindzicz, et al., 2000). The deletion
includes the majority of the USH1C gene and half of the adjacent ABCC8 gene,
a component of an ATP-sensitive K+ channel mutated in some patients with
hyperinsulinism (Thomas, et al., 1995). While it is clear that mutations in
USH1C cause Usher syndrome and non-syndromic sensorinureal hearing loss
(Ahmed, etal., 2002; Bitner-Glindzicz, etal., 2000; Ouyang, etal., 2002; Verpy,
et al., 2000; Zwaenepoel, et al., 2001), it is hypothesized in this thesis that
deletion of the USH1C gene in these patients may be the cause of both the gut
and renal phenotype as well.
227

We have proposed that expression of PDZ-37, a putative 5’ truncated isoform
of harmonin reported previously (Scanlan, et al., 1999), by USH1C patients,
with frame-shift and splice-site mutations at the 5’ end of USH1C, may be
sufficient for normal gut and kidney function in these patients. We have
successfully designed an RT-PCR assay for PDZ-37 and identified expression
of PDZ-37 mRNA in gut, kidney, heart and ear human foetal tissues (Fig. 4.10).
Previously, PDZ-37 was only identified, by northern blot, in post-natal human
brain tissue (Scanlan, et al., 1999). Furthermore, we identified PDZ-37 mRNA
in two human gut epithelial cell lines, HT29 and Caco-2 (Fig. 5.3B) and
observed a ~40 kDa product on an immunoblot of HT29 and Caco-2 cell
extracts that may represent the translated PDZ-37 protein (Fig. 5.5B, red
arrow).
Now that we have confirmed the expression of a 5’ truncated transcript, which
could be PDZ-37, it is important to show that Usher type 1C patients are still
able to express PDZ-37. RNA extraction from a fresh urine sample was
attempted to see if PDZ-37 expression could be detected in urothelial cells. It
was possible to amplify the major transcript of USH1C in one urine sample,
indicating that an RNA sample was obtained, but the PDZ-37 isoform, could not
be amplified, even when nested amplification was performed (Fig. 4.11b). RNA
extraction from other easily accessible samples, for example, blood and cheek
scrapings, could be attempted to test further for expression of PDZ-37. Should
it be confirmed that USH1C patients are still able to express PDZ-37, it would
be interesting to study the role of this isoform of harmonin within the gut and/or
kidney. This may also give insights into the pathogenesis of autoimmune
enteropathy.
228

7.2.4. Mouse models for USH1C and DFNB18
Recently, mouse models for both Usher syndrome type 1C and the non-
syndromic autosomal recessive deafness, DFNB18, were identified (Johnson,
et al., 2003b). These models appear to be compatible with our theory of
PDZ-37 expression being sufficient for the normal functioning of the gut, but
they do not provide any additional information.
Deaf circler (dfct), the model for Usher syndrome type 1C, has a 12.8 kb
intragenic deletion of Ushlc that includes the constitutive exons 12-14 and the
alternatively spliced exons 15 and A-D. This mutation would be predicted to
affect all known isoforms of harmonin, however, in-frame splicing of exon 11
onto either exon 16 or exon E was observed (Johnson, et al., 2003b). In the
model for non-syndromic deafness, DFNB18, Deaf circler 2 Jackson (dfcr-2J),
the mutation is a 1 bp deletion in the alternatively spliced exon C creating a
frame-shift and introducing a premature stop codon, which only affects the b
isoform transcripts.
It appears that the large intragenic deletion of the deaf circler mouse may not
be completely null. The in-frame splice products lack the coding information for
the coiled-coil domains and the PEST (proline, glutamic acid, serine, threonine-
rich) degradation domain found in harmonin b isoforms, but the codons for all
three PDZ domains are still present. Since the mouse is deaf, it appears that
the coiled-coil and PEST domains of harmonin are essential for the normal
functioning of the inner ear. Indeed, it has been shown that a C-terminal
fragment of harmonin b, that includes the second coiled-coil and the PEST
229

motif with the third PDZ domain, is involved in the interaction of harmonin b
with the actin cytoskeleton (Boeda, etal., 2002).
7.2.4.1. USH1C mouse model and PDZ-37
Does the deaf circler mouse model have a gut and/or kidney phenotype? If not
then it may be hypothesized that although the coiled-coil domains and/or the
PEST domain are important for the normal functioning of the ear, they are not
required for the correct functioning of the gut and/or the kidney. The intragenic
deletion found in Ushlc in the deaf circler mouse includes exon 12. Therefore,
this mouse model would not be expected to possess the alternative start site,
located in exon 12, for translation of the 5’ truncated isoform, PDZ-37.
Nevertheless, these mice are still able to produce in-frame splice forms of
harmonin that encode all three PDZ domains, which may be sufficient for a
normal gut and kidney phenotype...............................................................................
Taken together with the information available from the USH1 C-deleted family, it
may be hypothesized that the presence of the PDZ3 domain of harmonin is
sufficient for normal gut and kidney function. Whether the PDZ3 domain occurs
alone, in the form of the truncated isoform PDZ-37, or in association with the
other PDZ domains in longer isoforms of harmonin, may not be of importance.
7.3. Functions of Harmonin
7.3.1. Interactions between Usher type 1 proteins
Since the start of this study, three new Usher type 1 proteins have been
identified, cadherin 23 (USH1D), protocadherin 15 (USH1F) and sans
230

(USH1G). Recently, harmonin, myosin VIIA (USH1B), cadherin 23 and sans
were demonstrated to interact, forming a macromolecular complex believed to
be important for the correct functioning of the inner ear (Boeda, et al., 2002;
Siemens, et al., 2002; Weil, et al., 2003).
It was hypothesized here that protocadherin 15, which possesses a PDZ-
binding consensus sequence, similar to cadherin 23, at its C-terminus, might
also interact with harmonin and form part of the same macromolecular
complex. However, a GST pull-down assay, performed using a 191 bp
C-terminal fragment of protocadherin 15, showed that the C-terminus of
protocadherin 15 does not interact with harmonin. This means that
protocadherin 15 currently has no known binding partners. It is still possible
that protocadherin 15 forms part of the same Usher type 1 macromolecular
complex by binding to another protein. In particular, one of the unidentified
Usher type 1 proteins, USH1A or USH1E, may turn out to be a PDZ protein, or
another type of protein involved in protein-protein interactions.
7.3.2. Harmonin in the ear
It is now becoming clear how harmonin might function in the ear. Through its
interactions with other Usher type 1 proteins, it is hypothesized that harmonin
links integral membrane proteins (cadherin 23), involved in cell-cell ahesion, to
the actin cytoskeleton of the stereocilia. This will strengthen and stabilize the
connections between individual stereocilia and allow them to move together as
a bundle when deflected by sound-waves entering the inner ear. Furthermore,
harmonin b has been demonstrated, in vitro, to possess an actin-bundling
231

activity, which has been implicated in the development of the actin core of the
stereocilia on hair cells in the inner ear (Boeda, et al., 2002).
7.3.3. Harmonin in the eye '
The function of harmonin in the eye, however, is not so clear. Harmonin b
expression was recently demonstrated to be restricted to the outer segments of
the photoreceptor cells, while harmonin a expression was detected in both the
outer and inner segments of the photoreceptors, as well as in the synapses
(Reiners, et al., 2003). Furthermore, although harmonin b was shown to
interact with cadherin 23 and myosin VIIA within the stereocilia (Boeda, et al.,
2002), co-localization of cadherin 23 and myosin VIIA expression with
harmonin has only been observed in the synapses of the photoreceptors and
hence, these proteins do not appear to co-localize with the harmonin b isoform
(Reiners, et al., 2003). In light of these observations, harmonin b currently has
no known binding partners in the photoreceptors and may have a different
function to that hypothesised for it the inner ear.
To identify novel binding partners for harmonin and gain more insight into its
function within the eye, a yeast two-hybrid study using a retinal cDNA library, is
currently being carried out in our group.
The deaf circler mouse model for USH1C may also prove useful in elucidating
a role for harmonin in the eye. Until recently none of the Usher type 1 mouse
models appeared to have an eye phenotype (Gibson, et al., 1995; Alagramam,
et al., 2001; Di Palma, et al., 2001; Kikkawa, et al., 2003), something which
was attributed to some species-specific manifestation. However, more detailed
232

analyses of the retinas of mice with Myo7a mutations has revealed some
anomalies (Libby, et al., 2001; Gibbs, et al., 2003). Likewise, some histological
evidence of a slight peripheral degeneration in the deaf circler mouse has also
been detected (Johnson, et al., 2003). Since a transcript encoding all three
PDZ domains, in the absence of either of the coiled-coil domains or the PEST
motif, has been identified in the Usher type 1C mouse model, this also points to
an important role for the longer harmonin isoforms within the eye.
7.3.4. Harmonin in the gut
Apart from obviously being important for the correct functioning of the ear and
the eye, it is now becoming apparent that harmonin is also required for the
normal function of the gut, and possibly the kidney too. As discussed above, it
seems that the PDZ3 domain of harmonin and the interactions that it may form
could be important for its role in the gut. PDZ3 of harmonin currently has no
known binding partners. A yeast two-hybrid study, using the PDZ3 domain as
bait, may identify novel interacting proteins and point to a role for this domain
and to a possible function for the PDZ-37 isoform.
It has been speculated in this thesis that harmonin, or at least the PDZ-37
isoform, may have a role in the tight junctions of the epithelial cells of the gut.
As discussed in Chapter 5, it is possible that the inflammatory nature of the
enteropathy observed in the patients with the USH1C-ABCC8 contiguous gene
deletion could be due to a barrier dysfunction in the gut. PDZ domain-
containing proteins are known to be associated with tight junctions, functioning
as scaffolding molecules, linking integral proteins of the tight junction strands
233

with both the cell cytoskeleton and signalling proteins (reviewed by Gonzalez-
Mariscal, et al., 2003).
The possibility of harmonin localizing to tight junctions could be investigated in
human gut epithelial cell lines. The cells would first have to be cultured in a way
that allowed tight junctions to form between neighbouring cells. Then double-
staining for endogenous harmonin and a marker protein of the tight junctions,
such as the PDZ protein ZO-1, could be performed using fluorescently-labelled
antibodies. To study localization of the PDZ-37 isoform specifically it would
have to be tagged, for example with GFP, and the cells transfected with the
tagged protein prior to staining for a tight junction marker. If harmonin does
appear to localize to the tight junctions, it might be possible to perform
knockdown studies, using RNAi technology, to investigate the effect that
knocking out harmonin has on the cultured cells and their tight junctions.
7.3.5. Other possible roles for harmonin
Finally, it is also intriguing that auto-antibodies to harmonin should be raised in
patients with colon cancer (Scanlan, et al., 1999). The basis for the
immunogenicity of harmonin in cancer patients is not known. Nevertheless,
harmonin is not the only PDZ domain protein implicated in cancer. For
example, AlPC is a PDZ domain-containing protein that is activated in prostate
cancer and its accumulation is thought to be closely associated with the
initiation or early promotion of tumorigenesis (Chaib, et al., 2001). It is not
necessarily surprising to find PDZ proteins playing a role in cancer, since their
main functions tend to involve organizing proteins in signal transduction
cascades, or organizing cell junction complexes. Disruption of either of these
234

functions could lead to a breakdown in cellular communication and, hence,
tumorigenesis.
Some PDZ proteins have been shown to shuttle between the nucleus and the
cell membrane (Cuppen, et al., 1999; Islas, et al., 2002). ZO-1, a PDZ protein
associated with tight junctions, has been demonstrated to bind to a
transcription factor, indicating a role for this PDZ protein in the regulation of
gene expression (Baida and Matter, 2000). Interestingly, harmonin also
possesses a putative nuclear localization signal (Appendix E). Could harmonin,
or one of its isoforms, have a role in signalling to the nucleus that is somehow
disrupted in patients with colon cancer?
7.4. Future Directions
There are a number of avenues of research that could be pursued as a result of
the work presented in this thesis. The most interesting line of investigation
would be to study the PDZ-37 isoform of harmonin further. First, to confirm the
hypothesis that PDZ-37 is required for normal gut and kidney function, it is
important to establish whether Usher type 1C patients are still able to express
the PDZ-37 isoform. This may be achieved either by analysing RNA samples or
by staining the relevant biopsy samples from Usher type 1C patients, if they
can be obtained. A yeast two-hybrid study might identify novel binding partners
for PDZ-37. Association of PDZ-37 with the tight junctions could be
investigated, as discussed above, by double-staining human epithelial gut cells
for co-localization of harmonin and/or PDZ-37 with tight junction-associated
proteins. Interactions with candidate tight junction-associated proteins could be
235
tested in co-immunoprecipitation experiments. Similar studies may also be
performed on kidney cells to establish if the USH1C deletion is also responsible
for the renal tubular dysfunction observed in the deletion patients.
Now that a mouse model for Usher type 1C has been identified, it would be
interesting to study it further. In particular, does the USH1C mouse model deaf
circler have a gut or kidney phenotype? Histological examination of both the
kidney and intestines of the deaf circler mouse should be performed and
sections of both organs could be checked for expression of harmonin using
fluorescent immunohistochemistry.
However, since the deaf circler mouse allele is not predicted to be completely
null, it does not mimic the situation observed in either the USH1C patients
identified to date, or the contiguous USH1C-ABCC8 gene deletion patients.
Therefore, it may be more informative to create a knockout mouse that forms a
closer approximation to the situation found in the USH1C patients, and/or in the
deletion patients, to help confirm our hypothesis about PDZ-37.
It should also be possible to gain more information about the interactions of
harmonin and its role within the inner ear, and/or the eye, by studying the
localization of the other Usher type 1 proteins in the USH1C mouse model and
comparing to wild type mice.
It is intriguing that protocadherin 15 is the only Usher type 1 protein, of the five
that have been cloned, for which no binding partners have been identified. The
C-terminus of protocadherin 15 does not interact with harmonin. It should be
236
possible to identify potential interacting proteins for protocadherin 15 using
yeast two-hybrid. However, this has been attempted unsuccessfully in our
group because the fusion protein containing the C-terminal 191 bp of
protocadherin 15 was found to be toxic to the yeast cells. It may be that a yeast
two-hybrid study using a larger portion of the protocadherin 15 gene would be
more successful, although the classical system may have to be adapted since
protocadherin 15 is a transmembrane protein and is not thought to localize to
the nucleus.
7.5. Concluding Remarks
Identification of the USH1C gene has helped to further our understanding of
how the inner ear functions. In the absence of full-length harmonin, the
stereocilia in the inner ears of the deaf circler mouse are disorganized and
splayed (Johnson, et al., 2003b), indicating that harmonin has a crucial role to
play in the correct formation of the stereocilia. Harmonin interacts with other
Usher type 1 proteins, forming part of a network that is important for
maintaining stereocilia cohesion (Boeda, et al., 2002; Siemens, et al., 2002).
However, it has been shown in this work that harmonin does not form a direct
interaction with the C-terminus of the USH1F protein, protocadherin 15.
Our understanding of the function of harmonin in tissues other than the ear,
particularly the eye, but also in the gut and kidney is not so clear. It is apparent
that harmonin exists as several alternatively spliced isoforms (Scanlan, et al.,
1999; Verpy, et al., 2000), which may have different roles to play in different
tissues. Some isoforms of harmonin were thought to be ear-specific, but our
237

work and that of others (Reiners, et al., 2003) has shown that this is not
necessarily so. We have shown here that the harmonin b isoforms are
expressed by other human foetal tissues, including the eye.
Careful examination of mutations and correlation with the clinical features found
in the patients, has also suggested that alternatively spliced isoforms, for
example PDZ-37, may have a different role in different tissues. It has been
shown here that PDZ-37, previously identified only in brain tissue, is also
expressed in the gut and may account for the discrepancy in phenotype
between patients with point mutations and those with a large deletion.
Further investigations into the alternative isoforms of harmonin and their tissue-
specific functions will lead to a greater understanding of the role of harmonin
and may eventually lead to possible gene therapy for patients with Usher
syndrome type 1C.
238

239
APPENDIX A: Oligonucleotide primers
A.1. Primers for amplifying USH1C exons
Exon Forward Primer (5’-3’) Reverse Primer (5’-3’)Product
Size (bp)
Annealing Temperature
(°C)
1 CCCAACCAG AGCCAT CAG GACTCAGCACCTTCGACTCC - 351 54
2 TCCCT GAAGACAAAGGAACC CGGTACTCCTGTGGCCAC 336 62
3 TT CCT GCCACACAGGAGAG CAGGAGT GGT CTACTCCATTCC 377 65
4 T GACC AT GTT GTGCCACAC TCCAGGT GCAGAGGAAGC 345 66
5 ATGGAGTACTGCCCTGCTCT GGAGCAT CT GGTGGT GAGT C 354 65
6 TAGAGCCTCCAGCCTCCACT GAGCT GT CCTAACCCCT GT G 181 66
7 CTCTAGAGCAAGCCCTCCCT GTTCCT CAAACGT CT CTCGC 201 66
8 GACAGTCACACCCCTGGTG G ACGGAAT GAT GAT CT GGCT 306 66
9 GGTGGGTAGGGCTCCTACTC GGACACAG AGGCT GAAGAGG 346 67
10 CAGCAGTCCAGGCAGAGAG CCT GCAGAT GAGCGAGT GTA 232 66
11 T GT GT GGCAGAGAT CAAAGG CTCCACACCCCACTT CT CAT 246 66
12 GCT AGGT GGGGT CGT GT G TT CT GCCCAGCAAGAAGTTT 359 64
13 AGGGGAT GAGAGAACCAGGT AAACCACGCAAGAGCACAG 365 66
14 ACAGCCCAGAGCACCAAG GGGTT CT GACTCCAGTAACAGG 276 66

240
Exon Forward Primer (5’-3’) Reverse Primer (5’-3’)Product
Size (bp)
Annealing Temperature
(°C)
15 AAGCT GGGT GT CTGCACT G AACTCCT GAGAAGGTTCTCCG 241 61
A T GTT CT GCAACCAAGGCAAGG AACAGGCCAAGT C ACACCATT 350 67
B GGCCTT CCT GT CCTAAACCT G GCTCACTCCACCCTTGTATGC 441 68
C CCTTGAGGGCCAGTTGGAACA GCACT GT GAGGCTAGT GACG 391 67
D TGCTCGCTGTATT GT GAAGT G GAGGACATGGGAAACAGCAGT 625 59
E GCCGCT CAGTAGTTT CT GT G CT GC ATTTTT GTCCC ACCT C 445 67
F ACT GCTCGGGGAGGGACAT CAGGCAAT GGAGGACACAGC 330 67
16 TTT GG AAGGAAT CTTCGTGG TGCTGTGTTGCCCTAAAGC 248 64
17 TT GAGAGTAGAGGCAGGAGACC TTCCCCTTCCAGCCCTAC 212 61
18 CCCCGTCTAACCACTGTATCA AGGCTGCTGTCTGCTTGG 202 61
19 GGGGTATGGTGTCACCAAAG TT CT GCT GT CT GGCAAT GAC 347 66
20 AAGGAAGAAGAGGT CT CAGGC CATCCAACT GAGT GTGCCC 143 65
G/G’ GGAGCCCAGT GAAAGGAGAA GACGCCAGTCCAAAGAACCT 295 67
21 AATTAGAGCAGAGGGCAGAGG CTGTATCCACCTGGGCTGTT 449 65

A.2. Primers for 5’ RACE analysis of USH1C
Primer Sequence (5’-3’)* Location in
USH1C
MWG/
Invitrogen ™#
GSP1 TCATACACAGCAGAAACGACC Exon 18 MWG
GSP2 AT CCCT CCTT CTT GAT GCGTAGG Exon 17-18 m w g :
Nested GSP3 TTCC AT CTCCTT CCGGTAT CT Exon 13 MWG
Abridged Anchor Primer (AAP) GGCCACGCGTCGACTAGTACGGGIIGGGIIGGGIIG N/A Invitrogen
Abridged Universal Amplification Primer (AUAP)
GGCCACGCGTCGACTAGTAC N/A Invitrogen
* I = inosine# Primers were either designed and ordered from MWG, or were provided with the 5’ RACE System purchased from Invitrogen™

242
A.3. Primers for RT-PCR analysis of USH1C
Forward
PrimerSequence (5’-3’) Reverse Primer Sequence (5’-3’)
Annealing
Temperature (°C)*
Exon 13 TACCGGAAGGAGATGGAACA Exon 17 AT GAT CTGCTCTGGGGT GAA 58
Exon B GGAGTTT GAGCAAAAGCTTTACA 53
Exon F TGGTGGTTTAT C AG AC AGC ATT Exon 21 T CCTAACGCGT G AATTTGGT 56
Exon G/G’ ACCACAAGGTCGAT CCAGT C 56
Intron 11 GGCCT CTTTT CT CCCAT GAG Exon 14 TTT GAGCCCCAGT CTT CTT C TD
Intron 11 nff CCCCAGGGGT GT GT CAGG Exon 14n# GGGT GTACCT CAGCAGT GA TD
* TD = only touchdown PCR was used (see section 2.#.#)# primer pair located outside Intron 11 and Exon 14 primer pair and used as 1st round primers for nested amplification of PDZ-37 transcript

243
A.4. USH1C allele-specific oligonucleotides (ASO)
ASO Sequence (5’ - 3’)* Tm# (°C)
Exon 5 wildtype CCT CT CT CT GT GGT CAAGG 58.8
Exon 5 variant CCT CT CT CT GT GGT C AAG A 56.7
Exon 18 wildtype T CCCCGCT CATAC AC AGC 58.2
Exon 18 variant TCCCCGCT CATAC AC AG A 56.0
*the variant 3’ nucleotide for each ASO is indicated in bold.#an annealing temperature of 59°C was used to amplify DNA using all possible combinations of primers.
A.5. Other gene-specific primers
Gene Forward primer sequence (5’-3’) Reverse primer sequence (5y-3’) Product size (bp)*
Annealing Temperature (°C)
COCH ACCAGAGGCTT GGACAT CAG CCTGTGGCCTCCTGT GTACT 299/1287 62
HPRT CCACGAAAGTGTTGGATATAAGC GGCGATGTCAATAGGACTCCAGATG 205/1719 58
PCDH15 CGACC AACTT G ATGCCT GCC CCTT GTTTT GTT CAGAT GT G 691 58
*where two numbers are given the smaller one is the expected size of the cDNA product, whilst the larger size is that expected if the sample is contaminated with genomic DNA.

244
A.6. Primers used for cloning
A.6.1. Vector primers
Vector ForwardPrimer Sequence (5’-3’) Reverse _ /c,
Primer Sequence (5 -3 )Annealing Temp. (°C)
pZErO™-2 Sp6 GATTTAGGTGACACTATAG T7 GTAATACGACTCACTATAGGG 55
pGEX-4T-1 pGEX-F GGGCTGGCAAGCCACGTTTGGTG pGEX-R CCGGGAGCT GCAT GTGT CAGAGG 65
A.6.2. Gene-specific oligonucleotides for sequencing clones
Gene Primer * Sequence (5’-3’)
PCDH15 3’PCDH15-R2 CT GT GGAC AGAAAT GAAGCT G
USH1C Exon 1F AAGGAACGGGTCGTGCAACG
USH1C Exon 5F CCTCATTCGAACCAAGAAAAC
USH1C Exon 11F CCT GACCAT CT CCATT GTAGC
USH1C Exon 14F GGCT CAAAGGAACAGCTACT CTT GC• .......................- ............................
USH1C Exon 17F AAGGATGTCCGGCTCCTAC
USH1C Exon 21R TCCTAACGCGTGAATTTGGT
*R denotes a reverse primer, while F denotes a forward primer

245
A.7. Markers for haplotype analysis of the major USH1 loci
Locus Marker* Distance from previous marker cM/kb Primers# Size Range
(bp)Label1, Annealing
Temp. (°C)“D11S1321 N/A AGCT GAGATCGCACCAT
TTCACTGCCATTTGTTGAC197-215 Fam 58
m. T - .
D11S4179* 1.65/734 GGATGTAAGAGTAACTGGCTCCG GAAAAT GTT CT GCCT GAGGG
236-256 Hex 58
COD
D11S4186* 0.55/572 ATTCTCCCAATCTATCGCTC GGGCAGTAAT GAT GAT GT G
154-175 Hex 50
D11S4166 1.28/1479 GGAAGGCACCATGATACTTG GT GAAGT CT GGGATTT CAGC
110-130 Fam 58
D11S4160 N/A CTTTTGGCATAGGAGGCT 245-277 Fam 58CAGCGAGCTGATATGGCD11S1981 0.0/41 AATTCCTTTACTCC AGAAAGG
CAGATTT CTGCTTT CCCAGA161- Fam 58
OP“TD11S921 0.0/198 TGCATT CAACAAAT CAACA
CTT G G ACC ATTTAAT CTAAAGTAAT243-255 Tet 58
COID
D11S902* 0.0/204 CCCGGCTGTGAATATACTTAATGC CCCAACAGCAAT GGGAAGTT
145-163 Hex 58
D11S4138* 0.0/267 GT GCT GACCGCTCCAAGG CCAAAGGGGTTAATAGGGGTCCA
181-211 Tet 58
D11S1888 0.0/22 CCCCAGTACCCTGTATAGGCCACTTGTGTGTTTGTATCGAGTCA
225- Hex 58
D10S1685 N/A ACAT CAAATT GT CC ACT GAG AC 267-283 Fam TDQ CAAAGCAAGACCCTACCTCTAAT-T D10S1650* 1.68/814 GAAGCCT GTGGT CTAAT GAG 124-148 Fam 61CO TTCTGGCCT CTGCAGC3 D1OS1694* 0.56/134 CCT GT CT GGCCCAGGTA
AGTAGGGGTGCT GCTT GA141-161 Hex 54

246
Locus Marker* Distance from previous marker cM/kb Primers# Size Range
(bp)Label* Annealing
Temp. (0C)°°D10S1790 N/A AGTGAAATGGCTACAACCAA
GCCTGAGATACATAAGGTGCT191- Fam TD
Li.x
D1OS1643* 0.0/66 ACATAAGCCCAATTT CT GAT CTT CT CAGTGCCAAAAT CT
121-151 Tet 54
(0D D10S1124* 1.07/1817 CCAT GGAGCAT GT CTTATTT
CCACAGATT GT G AAAG AT G AC197-235 Hex TD
D10S1788 0.0/913 TGACAGGTAACAAAAGTGG AT CAAAT CAATGGT CAAAAC
246-258 Tet TD
* Markers are arranged in the order they are found on the chromosome, from centromere to telomere. An asterisk denotes the markers that lie closest to the gene at each locus, except for the USH1D locus where D10S1650 and D10S1694 both lie within the USH1D gene, CDH23.# forward oligonucleotides are shown on top in each case and reverse are below. f Only the forward oligonucleotides are labelled with a fluorescent dye.Fam = 6-carboxyfluorescein, Tet = tetrachlorofluorescein and Hex = 4,7,2’,4’,5’,7,-hexachloro-6-carboxyrhodamine.00 All PCRs were carried out with 1.5 mM MgCfe using HotStarTaq polymerase and at the annealing temperature indicated, or using a touchdown PCR protocol, TD, (section 2.2.1.1.).
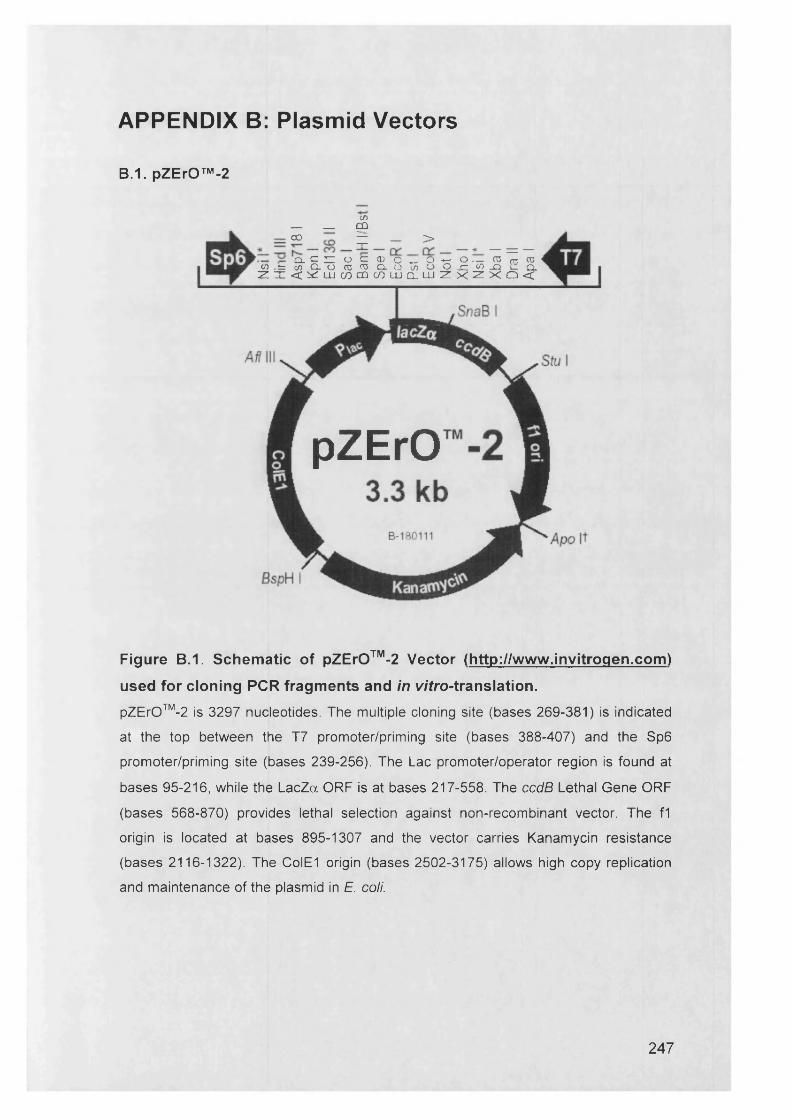
APPENDIX B: Plasmid Vectors
B.1. pZErO™-2
C/3— __ DQ
“ S ~ >CC — = —
CL C 2Z O £r 03 O + - O ■*— o — CO rn COCO .i= 03 CL o CO to C L O V) O O r ^ -Q »_ CL
Z K ^ l L i W C Q c O L U C I L i l Z X Z X Q C
pZErO
Figure B.1. Schematic of pZErO™-2 Vector (http://www.invitrogen.com)
used for cloning PCR fragments and in vitro-translation.
pZErO™-2 is 3297 nucleotides. The multiple cloning site (bases 269-381) is indicated at the top between the T7 promoter/priming site (bases 388-407) and the Sp6 promoter/priming site (bases 239-256). The Lac promoter/operator region is found at bases 95-216, while the LacZa ORF is at bases 217-558. The ccdB Lethal Gene ORF (bases 568-870) provides lethal selection against non-recombinant vector. The f1 origin is located at bases 895-1307 and the vector carries Kanamycin resistance (bases 2116-1322). The ColE1 origin (bases 2502-3175) allows high copy replication and maintenance of the plasmid in E. coli.
247

B.2. pGEX-4T-1
Glu Phe Pro Gly Arg Leu Gl .GAATTCCCG GGT CGA C,TC G£
EcoR 1 Sma I Sal 1 XhoT
pSj10ABam7Stop7
________Thrombin_______
I Leu Vai Pro Arg Gly Seri Pro Glu Phe Pro CTG GTT CCG CGTGGATCC
BamH I
Glu Arg Pro His Arg Asp GAp CGG CCG QAT CGT GAC TGA
Mot I Stop codons
T th111 I Aat II
BspM I
A lw N I
pBR322ori
Nar I
EcoR V
BssH II
Apa IBstE II
Figure B.2. Schematic of pGEX-4T-1 vector (Amersham Pharmacia
Biotech Inc) used for preparing GST-fusion proteins for analysis in GST
pull-down assays.
The multiple cloning site (bases 930-966) indicated at the top is preceeded by a coding region for thrombin cleavage (bases 918-935), which allows easy removal of the Glutathione S-transferase (GST) protein moiety, whose gene region, including the tac
promoter, is found at bases 183-918. The p-lactamase gene region (bases 1307-2235) confers ampicillin resistance.
248

APPENDIX C: Accession Numbers
Table C.1. mRNA and Protein accession numbers
Gene Isoform mRNA Protein
USH1C A1 NM_005709 AAH16057
USH1C B3 NM_153676 NP_710142
PCDH15 NM_033056 NP_149045
MCC2 NM_031941 NP_114147
249

APPENDIX D: Websites
D.1. Genome resources
Sequence similarity search
http://www.ncbi.nih.gov/BLAST/
Primer design
http://www-qenome.wi.mit.edu/cqi-bin/primer/primer3 www.cgi
Ensembl Genome browser
http://www.ensembl.org/
UK MRC Human Genome Mapping Project
http://www.hqmp.mrc.ac.uk/
Marshfield Centre for Medical Genetics - genetic map building resource
http://research.marshfieldclinic.org/genetics/Default.htm
Online Mendelian Inheritance in Man - database of human genetic disorders
http://www3.ncbi.nlm.nih.gov/entrez/querv.fcqi?db=OMIM
D.2. Proteomics resources
Expert Protein Analysis System
http://ca.expasv.org/
Database of protein families and domains
http://ca.expasv.org/prosite/
D.3. Hearing loss resources
Hereditary Hearing Loss Homepage
http://dnalab-www.uia.ac.be/dnalab/hhh/
250

Hereditary Hearing Impairment in Mice
http://www.iax.org/hmr/index.html
List of mouse inner ear mutants
http://www.ihr.mrc.ac.uk/hereditarv/MutantsTable.shtml
A compendium of mouse knockouts with inner ear defects
http://tbase.iax.org/docs/inner-ear-ko-compendium.html
D.4. Retinitis pigmentosa resources
Retinal information network
http://www.sph.uth.tmc.edu/retnet/
251

252
APPENDIX E: Search harmonin sequence against PROSITE
Harmonin isoform a1 sequence:
MDRKVAREFR HKVDFLIEND AEKDYLYDVL RMYHQTMDVA VLVGDLKLVI NEPSRLPLFDAIRPLIPLKH QVEYDQLTPR RSRKLKEVRL DRLHPEGLGL SVRGGLEFGC GLFISHLIKGGQADSVGLQV GDEIVRINGY SISSCTHEEV INLIRTKKTV SIKVRHIGLI PVKSSPDEPLTWQYVDQFVS ESGGVRGSLG SPGNRENKEK KVFISLVGSR GLGCSISSGP IQKPGIFISHVKPGSLSAEV GLEIGDQIVE VNGVDFSNLD HKEGRELFMT DRERLAEARQ RELQRQELLMQKRLAMESNK ILQEQQEMER QRRKEIAQKA AEENERYRKE MEQIVEEEEK FKKQWEEDWGSKEQLLLPKT ITAEVHPVPL RKPKYDQGVE PELEPADDLD GGTEEQGEQD FRKYEEGFDPYSMFTPEQIM GKDVRLLRIK KEGSLDLALE GGVDSPIGKV VVSAVYERGA AERHGGIVKGDEIMAINGKI VTDYTLAEAD AALQKAWNQG GDWIDLVVAV CPPKEYDDEL TFF
PROSITE Release 18.25, of 26-Apr-2004
>PDOCOOOQ3 PS00Q03 SULFATION Tyrosine sulfation site [rule] [Warning: rule with a high probability of occurrence].
18 - 32 endaekdYlydvlrm 519 - 533 avcppkeYddeltff
>PDOCOOOQ5 PS00005 PKC_PHOSPHO_SITE Protein kinase C phosphorylation site [pattern] [Warning: pattern with a high probability of occurrence].
7 8 - 8 0 TpR 82 - 84 SrK
101 - 103 SvR 156 - 158 TkK

253
161 - 163 SiK280 - 282 TdR308 - 310 SnK
>PDOCOOOO6 PS00006 CK2_PH0SPH0_SITE Casein kinase II phosphorylation site [pattern] [Warning: pattern with a high probability of occurrence].
146 - 149 TheE174 - 177 SspD175 - 178 SpdE267 - 270 SnlD280 - 283 TdrE495 - 498 TlaE
>PDOCOOOQ7 PS00007 TYR_PHOSPHO_SITE Tyrosine kinase phosphorylation site [pattern] [Warning: pattern with a high probability of occurrence].
329 - 337 KaaeEnerY
>PDOCOOOQ8 PS00008 MYRISTYL N-myristoylation site [pattern] [Warning: pattern with a highprobability of occurrei
97 - 102 GLglSV105 - 110 GLefGC111 - 116 GLfiSH121 - 126 GQadSV127 - 132 GLqvGD193 - 198 GGvrGS194 - 199 GVrgSL200 - 205 GSpgNR203 - 208 GNreNK

254
221 - 226 GLgcSI223 - 228 GCsiSS235 - 240 GIfiSH244 - 249 GSlsAE251 - 256 GLeiGD263 - 268 GVdfSN476 - 481 GivkGD
>PDQC00015 PSQ0015 NUCLEAR Bipartite nuclear targeting sequence [rule] [Warning: rule with a high probability of occurrence].
323 - 339 RKeiaqkaaeeneryrk 338 - 354 Rkemeqiveeeekfkkq
>PDQC50099 PS50313 GLU_RICH Glutamic acid-rich region [profile].The following hit is below threshold (may be spurious)
273 - 416 Egrelfmtdrerlaearqrelqrqellmqkrlamesnkilqeqqemerqrrkeiaqkaae eneryrkemeqiveeeekfkkqweedwgskeqlllpktitaevhpvplrkpkydqgvepe lepaddldggteeqgeqdfrkyeE
>PDQC50106 PS50106 PDZ PDZ domain [profile].
87 - 155 EVRLDRLHPEG.LGLSVRGGLEFGC--GLFISHLIKGGQADSV-GLQVGDEIVRINGYSISSCTHEEVINLIR--------------
211 - 278 KVFISLVGSRG.LGCSISSGPIQKP--GIFISHVKPGSLSAEV-GLEIGDQIVEVNGVDFSNLDHKEGRELF---------------
4 33 - 506 DVRLLRIKKEGsLDLALEGGVDSPIGK-VVVSAVYERGAAERHGGIVKGDEIMAINGKIV TDYTLAEADAALQKA------------

References
A
Adams,M.D., Celniker.S.E., Holt,R.A., Evans,C.A., etal. (2000) The genome sequence of Drosophila melanogaster. Science, 287, 2185-2195.
Adato, A., Kalinski, H., Weil, D., Chaib, H., et al. (1999) Possible interaction between USH1B and USH3 gene products as implied by apparent digenic deafness inheritance. Am. J. Hum. Genet., 65, 261-265.
Ahmed, Z.M., Riazuddin, S., Ahmad, J., Bernstein, S.L., et al. (2003) PCDH15 is expressed in the neurosensory epithelium of the eye and ear and mutant alleles are responsible for both USH1F and DFNB23. Hum. Mol. Genet., 12, 3215-3223.
Ahmed, Z.M., Riazuddin, S., Bernstein, S.L., Ahmed, Z., et al. (2001) Mutations of the protocadherin gene pcdh15 cause usher syndrome type 1f. Am. J. Hum. Genet., 69, 25-34.
Ahmed, Z.M., Smith, T.N., Riazuddin, S., Makishima, T., et al. (2002) Nonsyndromic recessive deafness DFNB18 and Usher syndrome type IC are allelic mutations of USHIC. Hum. Genet., 110, 527-531.
Alagramam, K.N., Murcia, C.L., Kwon, H.Y., Pawlowski, K.S., et al. (2001a) The mouse Ames waltzer hearing-loss mutant is caused by mutation of Pcdh15, a novel protocadherin gene. Nat. Genet., 27, 99-102.
Alagramam, K.N., Yuan, H., Kuehn, M.H., Murcia, C.L., et al. (2001b) Mutations in the novel protocadherin PCDH15 cause Usher syndrome type 1F. Hum. Mol. Genet., 10, 1709-1718.
Anagnostopoulos, A.V. (2002) A compendium of mouse knockouts with inner ear defects. Trends Genet, 18, s21-s38.
Ansley, S.J., Badano, J.L., Blacque, O.E., Hill, J., et al. (2003) Basal body dysfunction is a likely cause of pleiotropic Bardet-Biedl syndrome. Nature, 425, 628-633.
255

Ars, E., Serra, E., Garcia, J., Kruyer, H., et al. (2000) Mutations affecting mRNA splicing are the most common molecular defects in patients with neurofibromatosis type 1. Hum. Mol. Genet., 9, 237-247.
Astuto, L.M., Weston, M.D., Carney, C.A., Hoover, D.M., et al. (2000) Genetic heterogeneity of Usher syndrome: analysis of 151 families with Usher type I. Am. J.
Hum. Genet., 67, 1569-1574.
Avraham, K.B. (2003) Mouse models for deafness: lessons for the human inner ear and hearing loss. Ear Hear., 24, 332-341.
B
Baida, M.S. and Matter, K. (2000) The tight junction protein ZO-1 and an interacting transcription factor regulate ErbB-2 expression. EMBO J., 19, 2024-2033.
Barnes, W.M. (1994) PCR amplification of up to 35-kb DNA with high fidelity and high yield from lambda bacteriophage templates. PNAS., 91, 2216-2220.
Berg, J.S., Powell, B.C., and Cheney, R.E. (2001) A millennial myosin census. Mol.
Biol. Cell, 12, 780-794.
Bermingham, N.^., Hassan, B.A., Price, S.D., Vollrath, M.A., et al. (1999) Mathl: an essential gene for the generation of inner ear hair cells. Science, 284, 1837-1841.
Bessant, D.A., Payne, A.M., Mitton, K.P., Wang, Q.L., et al. (1999) A mutation in NRL is associated with autosomal dominant retinitis pigmentosa. Nat. Genet., 21, 355-356.
Bezprozvanny, I. and Maximov, A. (2001) Classification of PDZ domains. FEBS Lett.,
509, 457-462.
Bezprozvanny, I. and Maximov, A. (2002) PDZ domains: evolving classification. FEBS
Lett., 512, 347-349.
Bhattacharya, G., Miller, C., Kimberling, W.J., Jablonski, M.M., and Cosgrove, D. (2002) Localization and expression of usherin: a novel basement membrane protein defective in people with Usher's syndrome type lla. Hear Res., 163, 1-11.
Bilder, D. (2001) PDZ proteins and polarity: functions from the fly. Trends Genet., 17, 511-519.
256

Bitner-Glindzicz, M., Lindley, K.J., Rutland, P., Blaydon, D., et al. (2000) A recessive contiguous gene deletion causing infantile hyperinsulinism, enteropathy and deafness identifies the Usher type 1C gene. Nat. Genet., 26, 56-60.
Black, D.L. (2003) Mechanisms of alternative pre-messenger RNA splicing. Annu. Rev.
Biochem., 72, 291-336.
Boeda, B., El-Amraoui, A., Bahloul, A., Goodyear, R., et al. (2002) Myosin Vila, harmonin and cadherin 23, three Usher I gene products that cooperate to shape the sensory hair cell bundle. Embo J., 21, 6689-6699.
Bolz, H., von Brederlow, B., Ramirez, A., Bryda, E.C., et al. (2001) Mutation of CDH23, encoding a new member of the cadherin gene family, causes Usher syndrome type 1D. Nat. Genet., 27, 108-112.
Bork, J.M., Peters, L.M., Riazuddin, S., Bernstein, S.L., et al. (2001) Usher syndrome 1D and nonsyndromic autosomal recessive deafness DFNB12 are caused by allelic mutations of the novel cadherin-like gene CDH23. Am. J. Hum. Genet., 68, 26-37.
Boughman, J.A., Vernon, M., and Shaver, K.A. (1983) Usher syndrome: definition and estimate of prevalence from two high- risk populations. J. Chronic Dis., 36, 595-603.
Bredt, D.S. (1998) Sorting out genes that regulate epithelial and neuronal polarity. Cell,
94,691-694
c
Chaib, H., Rubin, M.A., Mucci, N.R., Li, L., et al. (2001) Activated in prostate cancer: a PDZ domain-containing protein highly expressed in human primary prostate tumors. Cancer Res., 61, 2390-2394.
Chen, Z.Y., Hasson, T., Kelley, P.M., Schwender, B.J., et al. (1996) Molecular cloning and domain structure of human myosin-Vlla, the gene product defective in Usher syndrome 1B. Genomics, 36, 440-448.
Cohen-Salmon, M., Ott, T., Michel, V., Hardelin, J.P., et al. (2002) Targeted ablation of connexin26 in the inner ear epithelial gap junction network causes hearing impairment and cell death. Curr. Biol.,12,1106-1111.
Cooper, D.N. and Krawczak, M. (1991) Mechanisms of insertional mutagenesis in human genes causing genetic disease. Hum. Genet., 87, 409-415.
257

Cuppen, E., Gerrits, H., Pepers, B., Wieringa, B., and Hendriks, W. (1998) PDZ motifs in PTP-BL and RIL bind to internal protein segments in the LIM domain protein RIL. Mol. Biol. Cell, 9, 671-683.
Cuppen, E., van Ham, M., Pepers, B., Wieringa, B., and Hendriks, W. (1999) Identification and molecular characterization of BP75, a novel bromodomain-containing protein. FEBS Lett., 459, 291-298.
D
Darvasi, A. and Kerem, B. (1995) Deletion and insertion mutations in short tandem repeats in the coding regions of human genes. Eur. J. Hum. Genet, 3, 14-20.
Di Palma, F., Holme, R.H., Bryda, E.C., Belyantseva, I.A., et al. (2001) Mutations in Cdh23, encoding a new type of cadherin, cause stereocilia disorganization in waltzer, the mouse model for Usher syndrome type 1D. Nat. Genet, 27, 103-107.
Dietz, H.C., Valle, D., Francomano, C.A., Kendzior, R.J., Jr., Pyeritz, R.E., and Cutting, G.R. (1993) The skipping of constitutive exons in vivo induced by nonsense mutations. Science, 259, 680-683.
Dobson-Stone, C., Cox, R.D., Lonie, L., Southam, L., et al. (2000) Comparison of fluorescent single-strand conformation polymorphism analysis and denaturing high- performance liquid chromatography for detection of EXT1 and EXT2 mutations in hereditary multiple exostoses. Eur. J. Hum. Genet., 8, 24-32.
Doyle, D.A., Lee, A., Lewis, J., Kim, E., Sheng, M., and MacKinnon, R. (1996) Crystal structures of a complexed and peptide-free membrane protein- binding domain: molecular basis of peptide recognition by PDZ. Cell, 85, 1067-1076.
Dryja, T.P. (2001) Retinitis Pigmentosa and Stationary Night Blindness. In "The Metabolic and Molecular Bases of Inherited Disease" Scriver, C.R., Beaudet, A.L., Sly, W.S., Valle, D. (Eds), McGraw-Hill, Montreal, p.5903-5933.
Dryja, T.P., Finn, J.T., Peng, Y.W., McGee, T.L., Berson, E.L., and Yau, K.W. (1995) Mutations in the gene encoding the alpha subunit of the rod cGMP-gated channel in autosomal recessive retinitis pigmentosa. PNAS, 92, 10177-10181.
Dryja, T.P., McGee, T.L., Reichel, E., Hahn, L.B., et al. (1990) A point mutation of the rhodopsin gene in one form of retinitis pigmentosa. Nature, 343, 364-366.
258
E
El-Amraoui, A., Sahly, I., Picaud, S., Sahel, J., Abitbol, M., and Petit, C. (1996) Human Usher 1B/mouse shaker-1: the retinal phenotype discrepancy explained by the presence/absence of myosin VIIA in the photoreceptor cells. Hum. Mol. Genet., 5, 1171-1178.
Eudy, J.D., Weston, M.D., Yao, S., Hoover, D.M., et al. (1998) Mutation of a gene encoding a protein with extracellular matrix motifs in Usher syndrome type I la. Science, 280, 1753-1757.
Everett, L.A., Glaser, B., Beck, J.C., Idol, J.R., et al. (1997) Pendred syndrome is caused by mutations in a putative sulphate transporter gene (PDS). Nat. Genet., 17, 411-422.
F
Fanning, A.S. and Anderson, J.M. (1999) Protein modules as organizers of membrane structure. Curr. Opin. Cell Biol., 11, 432-439.
Farrar, G.J., Kenna, P., Jordan, S.A., Kumar-Singh, R., et al. (1991) A three-base-pair deletion in the peripherin-RDS gene in one form of retinitis pigmentosa. Nature, 354, 478-480.
Forge, A. and Wright, T. (2002) The molecular architecture of the inner ear. Br. Med.
Bull., 63, 5-24.
G
Gasparini, P., Rabionet, R., Barbujani, G., Melchionda, S., et al. (2000) High carrier frequency of the 35delG deafness mutation in European populations. Genetic Analysis Consortium of GJB2 35delG. Eur. J. Hum. Genet., 8, 19-23.
Gibbs, D., Kitamoto, J. and Williams, D.S. (2003) Abnormal phagocytosis by retinal pigmented epithelium that lacks myosin Vila, the Usher syndrome 1B protein. PNAS,
100, 6481-6486.
Gibson, F., Walsh, J., Mburu, P., Varela, A., et al. (1995) A type VII myosin encoded by the mouse deafness gene shaker-1. Nature, 374, 62-64.
259

f ’
Ginjaar, I.B., Kneppers, A.L., Meulen, J.D., Anderson, L.V., et al. (2000) Dystrophin nonsense mutation induces different levels of exon 29 skipping and leads to variable phenotypes within one BMD family. Eur. J. Hum. Genet., 8, 793-796.
Gomperts, S.N. (1996) Clustering membrane proteins: It's all coming together with the PSD- 95/SAP90 protein family. Cell, 84, 659-662.
Gonzalez-Mariscal, L., Betanzos, A., Nava, P. and Jaramillo, B.E. (2003) Tight junction proteins. Prog. Biophys. Mol. Biol., 81, 1-44.
Grondahl, J. (1987) Estimation of prognosis and prevalence of retinitis pigmentosa and Usher syndrome in Norway. Clin. Genet., 31, 255-264.
Gross, E., Arnold, N., Goette, J., Schwarz-Boeger, U., and Kiechle, M. (1999) A comparison of BRCA1 mutation analysis by direct sequencing, SSCP and DHPLC. Hum. Genet., 105, 72-78.
Guilford, P., Ben Arab, S., Blanchard, S., Levilliers, J., Weissenbach, J., Belkahia, A., and Petit, C. (1994) A non-syndrome form of neurosensory, recessive deafness maps to the pericentromeric region of chromosome 13q. Nat. Genet., 6, 24-28.
H
Hamazaki, Y., Itoh, M., Sasaki, H., Furuse, M., and Tsukita, S. (2002) Multi-PDZ domain protein 1 (MUPP1) is concentrated at tight junctions through its possible interaction with claudin-1 and junctional adhesion molecule. J. Biol. Chem., 277, 455- 461.
Hardisty, R.E., Mburu, P., and Brown, S.D. (1999) ENU mutagenesis and the search for deafness genes. Br. J. Audiol., 33, 279-283.
Hasson, T., Heintzelman, M., Santos-Sacchi, J., Corey, D., and Mooseker, M. (1995) Expression in Cochlea and Retina of Myosin Vila, the Gene Product Defective in Usher Syndrome Type 1B. PNAS, 92, 9815-9819.
Hasson, T., Gillespie, P.G., Garcia, J.A., MacDonald, R.B., Zhao, Y., et al. (1997) Unconventional Myosins in Inner-Ear Sensory Epithelia. J. Cell Biol., 137, 1287-1307.
Hillier, B.J., Christopherson, K.S., Prehoda, K.E., Bredt, D.S., and Lim, W.A. (1999) Unexpected modes of PDZ domain scaffolding revealed by structure of nNOS- syntrophin complex. Science, 284, 812-815.
260

Hollander, D. (1988) Crohn's disease--a permeability disorder of the tight junction? Gut, 29, 1621-1624.
Holme, R.H. and Steel, K.P. (2002) Stereocilia defects in waltzer (Cdh23), shakerl (Myo7a) and double waltzer/shakerl mutant mice. Hear Res., 169, 13-23.
Hope, C.I., Bundey, S., Proops, D., and Fielder, A.R. (1997) Usher syndrome in the city of Birmingham-prevalence and clinical classification. Br. J. Ophthalmol., 81, 46- 53.
Hung, A.Y. and Sheng, M. (2002) PDZ domains: structural modules for protein complex assembly. J. Biol. Chem., 277, 5699-5702.
Hussain, K., Bitner-Glindzicz, M., Blaydon, D., Lindley, K.J., et al. (2004) Infantile Hyperinsulinism Associated With Enteropathy, Deafness, And Renal Tubulopathy: Clinical Manifestations of a Syndrome Caused By A Contiguous Gene Deletion Located On Chromosome 11 p. JPEM,
i
Ishikawa, S., Kobayashi, I., Hamada, J., Tada, M., et al. (2001) Interaction of MCC2, a novel homologue of MCC tumor suppressor, with PDZ-domain Protein AIE-75. Gene,
267, 101-110.
Islas, S., Vega, J., Ponce, L., and Gonzalez-Mariscal, L. (2002) Nuclear localization of the tight junction protein ZO-2 in epithelial cells. Exp. Cell. Res., 274, 138-148.
Ivanov, D.B., Philippova, M.P., and Tkachuk, V.A. (2001) Structure and functions of classical cadherins. Biochemistry (Mosc.), 66, 1174-1186.
j
Jain, P.K., Lalwani, A.K., Li, X.C., Singleton, T.L., et al. (1998) A gene for recessive nonsyndromic sensorineural deafness (DFNB18) maps to the chromosomal region 11 p14-p15.1 containing the Usher syndrome type 1C gene. Genomics, 50, 290-292.
Joensuu, T., Hamalainen, R., Yuan, B., Johnson, C., et al. (2001) Mutations in a novel gene with transmembrane domains underlie usher syndrome type 3. Am. J. Hum.
Genet., 69, 673-684.
261

Johnson, J.M., Castle, J., Garrett-Engele, P., Kan, Z., et al. (2003a) Genome-wide survey of human alternative pre-mRNA splicing with exon junction microarrays. Science, 302, 2141-2144.
Johnson, K.R., Gagnon, L.H., Webb, L.S., Peters, L.L., et al. (2003b) Mouse models of USH1C and DFNB18: phenotypic and molecular analyses of two new spontaneous mutations of the Ushlcgene. Hum. Mol. Genet., 12, 3075-3086.
Justice, M.J., Noveroske, J.K., Weber, J.S., Zheng, B., and Bradley, A. (1999) Mouse ENU mutagenesis. Hum. Mol. Genet., 8, 1955-1963.
K
Kachar, B., Parakkal, M., Kurc, M., Zhao, Y., and Gillespie, P.G. (2000) High- resolution structure of hair-cell tip links. PNAS, 97, 13336-13341.
Kajiwara, K., Berson, E.L., and Dryja, T.P. (1994) Digenic retinitis pigmentosa due to mutations at the unlinked peripherin/RDS and ROM1 loci. Science, 264, 1604-1608.
Keats, B.J., Nouri, N., Pelias, M.Z., Deininger, P.L., and Litt, M. (1994) Tightly linked flanking microsatellite markers for the Usher syndrome type I locus on the short arm of chromosome 11. Am. J. Hum. Genet., 54, 681-686.
Kelsell, D.P., Dunlop, J., Stevens, H.P., Lench, N.J., et al. (1997) Connexin 26 mutations in hereditary non-syndromic sensorineural deafness. Nature, 387, 80-83.
Kikkawa, Y., Shitara, H., Wakana, S., Kohara, Y., et al. (2003) Mutations in a new scaffold protein Sans cause'deafness in Jackson shaker mice. Hum. Mol. Genet., 12, 453-461.
Kim, E., Niethammer, M., Rothschild, A., Jan, Y.N., and Sheng, M. (1995) Clustering of Shaker-type K+ channels by interaction with a family of membrane-associated guanylate kinases. Nature, 378, 85-88.
Kitajiri, S., Furuse, M., Morita, K., Saishin-Kiuchi, Y., Kido, H., Ito, J., and Tsukita, S. (2004) Expression patterns of claudins, tight junction adhesion molecules, in the inner ear. Hear. Res., 187, 25-34.
Kobayashi, I., Imamura, K., Kubota, M., Ishikawa, S., et al. (1999) Identification of an Autoimmune Enteropathy-Related 75-Kilodalton Antigen. Gastroenterology, 117, 823- 830.
262
Kornau, H.C., Schenker, L.T., Kennedy, M.B., and Seeburg, P.H. (1995) Domain interaction between NMDA receptor subunits and the postsynaptic density protein PSD-95. Science, 269, 1737-1740.
Kriventseva, E.V., Koch, I., Apweiler, R., Vingron, M., Bork, P., Gelfand, M.S., and Sunyaev, S. (2003) Increase of functional diversity by alternative splicing. Trends
Genet., 19, 124-128.
Kunkel, T.A. (1990) Misalignment-mediated DNA synthesis errors. Biochemistry, 29, 8003-8011.
Kurima, K., Peters, L.M., Yang, Y., Riazuddin, S., et al. (2002) Dominant and recessive deafness caused by mutations of a novel gene, TMC1, required for cochlear hair-cell function. Nat. Genet., 19, 19-
Kussel-Andermann, P., El-Amraoui, A., Safieddine, S., Hardelin, J.P., et al. (2000) Unconventional myosin VIIA is a novel A-kinase-anchoring protein. J. Biol. Chem.,
275, 29654-29659.
L
Lander, E.S., Linton, L.M., Birren, B., Nusbaum, C., et. al. (2001) Initial sequencing and analysis of the human genome. Nature, 409, 860-921.
Lemmers, C., Medina, E., Delgrossi, M.H., Michel, D., Arsanto, J.P., and Le Bivic, A.(2002) hINADI/PATJ, a homolog of discs lost, interacts with crumbs and localizes to tight junctions in human epithelial cells. J. Biol. Chem., 277, 25408-25415.
Libby, R.T. and Steel, K.P. (2001) Electroretinographic anomalies in mice with mutations in Myo7a, the gene involved in human Usher syndrome type 1B. Invest.
Ophthalmol. Vis. Sci., 42, 770-778.
Liu, H.X., Cartegni, L., Zhang, M.Q., and Krainer, A.R. (2001) A mechanism for exon skipping caused by nonsense or missense mutations in BRCA1 and other genes. Nat.
Genet., 27, 55-58.
Liu, W., Smith, D.I., Rechtzigel, K.J., Thibodeau, S.N., and James, C.D. (1998a) Denaturing high performance liquid chromatography (DHPLC) used in the detection of germline and somatic mutations. Nucleic Acids Res., 26, 1396-1400.
263

Liu, X., Vansant, G., Udovichenko, I.P., Wolfrum, U., and Williams, D.S. (1997a) Myosin Vila, the product of the Usher 1B syndrome gene, is concentrated in the connecting cilia of photoreceptor cells. Cell Motil. Cytoskeleton, 37, 240-252.
Liu, X.Z., Hope, C., Liang, C.Y., Zou, J.M., et al. (1999) A mutation (2314delG) in the Usher syndrome type IIA gene: high prevalence and phenotypic variation. Am. J. Hum.
Genet., 64, 1221-1225.
Liu, X.Z., Hope, C., Walsh, J., Newton, V., et al. (1998b) Mutations in the myosin VIIA gene cause a wide phenotypic spectrum, including atypical Usher syndrome. Am. J.
Hum. Genet., 63, 909-912.
Liu, X.Z., Walsh, J., Mburu, P., Kendrick-Jones, J., et al. (1997b) Mutations in the myosin VIIA gene cause non-syndromic recessive deafness. Nat. Genet., 16, 188-190.
Liu, X.Z., Walsh, J., Tamagawa, Y., Kitamura, K., et al. (1997c) Autosomal dominant non-syndromic deafness caused by a mutation in the myosin VIIA gene. Nat. Genet.,
17, 268-269.
M
Maestrini, E., Korge, B.P., Ocana-Sierra, J., Calzolari, E., et al. (1999) A missense mutation in connexin26, D66H, causes mutilating keratoderma with sensorineural deafness (Vohwinkel's syndrome) in three unrelated families. Hum. Mol. Genet., 8, 1237-1243.
Mansoor, A., Mazhar, K., Khaliq, S., Hameed, A., et al. (2004) Investigation of the Greek ancestry of populations from northern Pakistan. Hum. Genet., 114, 484-490.
Martinez-Mir, A., Paloma, E., Allikmets, R., Ayuso, C., et al. (1998) Retinitis pigmentosa caused by a homozygous mutation in the Stargardt disease gene ABCR. Nat. Genet., 18, 11-12.
Maw, M.A., Kennedy, B., Knight, A., Bridges, R., et al. (1997) Mutation of the gene encoding cellular retinaldehyde-binding protein in autosomal recessive retinitis pigmentosa. Nat. Genet., 17, 198-200.
Maximov, A., Sudhof, T.C., and Bezprozvanny, I. (1999) Association of neuronal calcium channels with modular adaptor proteins. J. Biol. Chem., 274, 24453-24456.
264

Mburu, P., Mustapha, M., Varela, A., Weil, D., et al. (2003) Defects in whirlin, a PDZ domain molecule involved in stereocilia elongation, cause deafness in the whirler mouse and families with DFNB31. Nat. Genet., 34, 421-428.
McLaughlin, M.E., Sandberg, M.A., Berson, E.L., and Dryja, T.P. (1993) Recessive mutations in the gene encoding the beta-subunit of rod phosphodiesterase in patients with retinitis pigmentosa. Nat. Genet., 4, 130-134.
Modrek, B. and Lee, C. (2001) A genomic view of alternative splicing. Nat, Genet., 30, 13-19.
Morimura, H., Fishman, G.A., Grover, S.A., Fulton, A.B., Berson, E.L., and Dryja, T.P. (1998) Mutations in the RPE65 gene in patients with autosomal recessive retinitis pigmentosa or leber congenital amaurosis. PNAS, 95, 3088-3093.
Morton, N.E. (1991) Genetic epidemiology of hearing impairment. Ann. N. Y. Acad.
Sci., 630, 16-31.
N
Nakazawa, M., Wada, Y., and Tamai, M. (1998) Arrestin gene mutations in autosomal recessive retinitis pigmentosa. Arch. Ophthalmol., 116, 498-501.
Navarro-Coy, N., Hutchin, T.P., Conlon, H.E., Coghill, E.L., et al. (2001) The relative contribution of mutations in the DFNB loci to congenital/early childhood non-syndromal sensorineural hearing impairment/deafness. J. Med. Genet., 38 suppl. no. 1, S38-
Nolan, P.M., Peters, J., Strivens, M., Rogers, D., et al. (2000) A systematic, genome- wide, phenotype-driven mutagenesis programme for gene function studies in the mouse. Nat. Genet., 25, 440-443.
Nollet, F., Kools, P., and van Roy, F. (2000) Phylogenetic analysis of the cadherin superfamily allows identification of six major subfamilies besides several solitary members. J. Mol. Biol., 299, 551-572.
o
Otterstedde, C.R., Spandau, U., Blankenagel, A., Kimberling, W.J., and Reisser, C.(2001) A New Clinical Classification for Usher's Syndrome Based on a New Subtype of Usher's Syndrome Type I. Laryngoscope, 111, 84-86.
265

Ouyang, M., Xia, J., Verpy, E., Du, L., et al. (2002) Mutations in the alternatively spliced exons of USH1C cause non- syndromic recessive deafness. Hum. Genet.,
111, 26-30.
p
Pagani, F., Stuani, C., Tzetis, M., Kanavakis, E., et al. (2003) New type of diseasecausing mutations: the example of the composite exonic regulatory elements ofsplicing in CFTR exon 12. Hum. Mol. Genet., 12, 1111-1120.
Pakarinen, L., Karjalainen, S., Simola, K.O., Laippala, P., and Kaitalo, H. (1995) Usher's syndrome type 3 in Finland. Laryngoscope, 105, 613-617.
Patel, S.D., Chen, C.P., Bahna, F., Honig, B., and Shapiro, L. (2003) Cadherin- mediated cell-cell adhesion: sticking together as a family. Curr. Opin. Struct. Biol., 13, 690-698.
Pawson, T. and Scott, J.D. (1997) Signaling through scaffold, anchoring, and adaptor proteins. Science, 278, 2075-2080.
Perez-Moreno, M., Jamora, C., and Fuchs, E. (2003) Sticky business: orchestrating cellular signals at adherens junctions. Cell, 112, 535-548.
Petit, C., Levilliers, J., and Hardelin, J.P. (2001) Molecular genetics of hearing loss.Annu. Rev. Genet., 35, 589-645.
Phelan, J.K. and Bok, D. (2000) A brief review of retinitis pigmentosa and the identified retinitis pigmentosa genes. Mol. Vis., 6, 116-124.
Pickles, J.O. and Corey, D.P. (1992) Mechanoelectrical transduction by hair cells. Trends Neurosci., 15, 254-259.
Prasad, S., Kolln, K.A., Cucci, R.A., Trembath, R.C., Van Camp, G., and Smith, R.J. (2004) Pendred syndrome and DFNB4-mutation screening of SLC26A4 by denaturing high-performance liquid chromatography and the identification of eleven novel mutations. Am. J. Med. Genet., 124A, 1-9.
Probst, F.J. and Camper, S.A. (1999) The role of mouse mutants in the identification of human hereditary hearing loss genes. Hear Res., 130, 1-6.
266

Probst, F.J., Fridell, R.A., Raphael, Y., Saunders, T.L., et al. (1998) Correction of deafness in shaker-2 mice by an unconventional myosin in a BAC transgene. Science,
280, 1444-1447.
R
Raghuram, V., Mak, D.D., and Foskett, J.K. (2001) Regulation of cystic fibrosis transmembrane conductance regulator single-channel gating by bivalent PDZ-domain- mediated interaction. PNAS, 98, 1300-1305.
Rattner, A., Sun, H., and Nathans, J. (1999) Molecular genetics of human retinal disease. Annu. Rev. Genet., 33, 89-131.
Reiners, J., Reidel, B., El Amraoui, A., Boeda, B., Huber, I., Petit, C., and Wolfrum, U.(2003) Differential distribution of harmonin isoforms and their possible role in Usher-1 protein complexes in mammalian photoreceptor cells. Invest. Ophthalmol. Vis. Sci., 44, 5006-5015.
Resendes, B.L., Williamson, R.E. and Morton, C.C. (2001) At the speed of sound: gene discovery in the auditory system. Am. J. Hum. Genet., 69, 923-935.
Rickard, S., Kelsell, D.P., Sirimana, T., Rajput, K., MacArdle, B., and Bitner-Glindzicz, M. (2001) Recurrent mutations in the deafness gene GJB2 (connexin 26) in British Asian families. J. Med. Genet., 38, 530-533.
Riesen, F.K., Rothen-Rutishauser, B., and Wunderli-Allenspach, H. (2002) AZOI-GFP fusion protein to study the dynamics of tight junctions in living cells. Histochem. Cell
Biol., 117, 307-315.
Rivolta, C., Sweklo, E.A., Berson, E.L., and Dryja, T.P. (2000) Missense mutation in the USH2A gene: association with recessive retinitis pigmentosa without hearing loss. Am. J. Hum. Genet., 66, 1975-1978.
Robertson, N.G., Khetarpal, U., Gutierrez-Espeleta, G.A., Bieber, F.R., and Morton, C.C. (1994) Isolation of Novel and Known Genes from a Human Fetal Cochlear cDNA Library Using Subtractive Hybridization and Differential Screening. Genomics, 23, 42- 50.
Rogers, S., Wells, R., and Rechsteiner, M. (1986) Amino acid sequences common to rapidly degraded proteins: the PEST hypothesis. Science, 234, 364-368.
267

Rosenberg, T., Haim, M., Hauch, A.M., and Parving, A. (1997) The prevalence of Usher syndrome and other retinal dystrophy-hearing impairment associations. Clin.
Genet., 51, 314-321.
s
Sachidanandam, R., Weissman, D., Schmidt, S.C., Kakol, J.M., et al. (2001) A map of human genome sequence variation containing 1.42 million single nucleotide polymorphisms. Nature, 409, 928-933.
Sahly, I., El-Amraoui, A., Abitbol, M., Petit, C., and Dufier, J.L. (1997) Expression of myosin VIIA during mouse embryogenesis. Anat. Embryol. (Berl), 196, 159-170.
Savas, S., Frischhertz, B., Pelias, M.Z., Batzer, M.A., Deininger, P.L., and Keats, B.B.(2002) The USH1C 216G~>A mutation and the 9-repeat VNTR(t,t) allele are in complete linkage disequilibrium in the Acadian population. Hum. Genet., 110, 95-97.
Scanlan, M.J., Williamson, B., Jungbluth, A., Stocked, E., et al. (1999) Isoforms of the human PDZ-73 protein exhibit differential tissue expression. Biochimica et Biophysica
Acta, 1445, 39-52.
Self, T., Mahony, M., Fleming, J., Walsh, J., Brown, S.D., and Steel, K.P. (1998) Shaker-1 mutations reveal roles for myosin VIIA in both development and function of cochlear hair cells. Development, 125, 557-566.
Shepherd, G.M., Barres, B.A., and Corey, D.P. (1989) "Bundle blot" purification and initial protein characterization of hair cell stereocilia. PNAS, 86, 4973-4977.
i
Siemens, J., Kazmierczak, P., Reynolds, A., Sticker, M., Littlewood-Evans, A., and Muller, U. (2002) The Usher syndrome proteins cadherin 23 and harmonin form a complex by means of PDZ-domain interactions. PNAS, 99, 14946-14951.
Siemens, J., Lillo, C., Dumont, R.A., Reynolds, A., et al. (2004) Cadherin 23 is a component of the tip link in hair-cell stereocilia. Nature, 428, 950-955.
Smith, R.J., Berlin, C.I., Hejtmancik, J.F., Keats, B.J., et al. (1994) Clinical diagnosis of the Usher syndromes. Usher Syndrome Consortium. Am. J. Med. Genet., 50, 32-38.
Smith, R.J., Lee, E.C., Kimberling, W.J., Daiger, S.P., et al. (1992) Localization of two genes for Usher syndrome type I to chromosome 11. Genomics, 14, 995-1002.
268

Soderholm, J.D., Olaison, G., Peterson, K.H., Franzen, L.E., et al. (2002) Augmented increase in tight junction permeability by luminal stimuli in the non-inflamed ileum of Crohn's disease. Gut, 50, 307-313.
Sohocki, M.M., Sullivan, L.S., Mintz-Hittner, H.A., Birch, D., et al. (1998) A range of clinical phenotypes associated with mutations in CRX, a photoreceptor transcription- factorgene. Am. J. Hum. Genet., 63, 1307-1315.
Sollner, C., Rauch, G.J., Siemens, J., Geisler, R., et al. (2004) Mutations in cadherin 23 affect tip links in zebrafish sensory hair cells. Nature, 428, 955-959.
Songyang, Z., Fanning, A.S., Fu, C., Xu, J., et al. (1997) Recognition of unique carboxyl-terminal motifs by distinct PDZ domains. Science, 275, 73-77.
T
Tamayo, M.L., Bernal, J.E., Tamayo, G.E., Frias, J.L., et al. (1991) Usher syndrome: results of a screening program in Colombia. Clin. Genet., 40, 304-311.
Teraoka, S.N., Telatar, M., Becker-Catania, S., Liang, T., et al. (1999) Splicing defects in the ataxia-telangiectasia gene, ATM: underlying mutations and consequences. Am.
J. Hum. Genet., 64, 1617-1631.
The C. elegans Sequencing Consortium. (1998) Genome sequence of the nematode C. elegans: a platform for investigating biology. Science, 282, 2012-2018.
Thomas, P.M., Cote, G.J., Wohllk, N., Haddad, B., et al. (1995) Mutations in the sulfonylurea receptor gene in familial persistent hyperinsulinemic hypoglycemia of infancy. Science, 268, 426-429.
Tilney, L.G., DeRosier, D.J., and Mulroy, M.J. (1980) The organization of actin filaments in the stereocilia of cochlear hair cells. J. Cell Biol., 86, 244-259.
Tishkoff, S.A., Dietzsch, E., Speed, W., Pakstis, A.J., et al. (1996) Global patterns of linkage disequilibrium at the CD4 locus and modern human origins. Science, 271, 1380-1387.
Tsilou, E.T., Rubin, B.I., Caruso, R.C., Reed, G.F., et al. (2002) Usher syndrome clinical types I and II: could ocular symptoms and signs differentiate between the two types? Acta Ophthalmol. Scand., 80, 196-201.
269

Tsukita, S., Furuse, M., and Itoh, M. (2001) Multifunctional strands in tight junctions. Nat. Rev. Mol. Cell Biol., 2, 285-293.
Tsuprun, V. and Santi, P. (2002) Structure of outer hair cell stereocilia side and attachment links in the chinchilla cochlea. J. Histochem. Cytochem., 50, 493-502.
v
Vaccaro, P., Brannetti, B., Montecchi-Palazzi, L., Philipp, S., et al. (2001) Distinct binding specificity of the multiple PDZ domains of INADL, a human protein with homology to iNADfrom Drosophila melanogaster. J. Biol. Chem., 276, 42122-42130.
van Ham, M. and Hendriks, W. (2003) PDZ domains-glue and guide. Mol. Biol. Rep.,
30, 69-82.
Van Laer, L., Coucke, P., Mueller, R.F., Caethoven, G., et al. (2001) A common founder for the 35delG GJB2 gene mutation in connexin 26 hearing impairment. J.
Med. Genet., 38, 515-518.
Venter, J.C., Adams, M.D., Myers, E.W., Li, P.W., et. al. (2001) The sequence of the human genome. Science, 291, 1304-1351.
Vernon, M. (1969) Usher's syndrome-deafness and progressive blindness. Clinical cases, prevention, theory and literature survey. J. Chronic Dis., 22, 133-151
Verpy, E., Leibovici, M., Zwaenepoel, I., Liu, X.Z., et al. (2000) A defect in harmonin, a PDZ domain-containing protein expressed in the inner ear sensory hair cells, underlies Usher syndrome type 1C. Nat. Genet., 26, 51-55.
w
Waterston, R.H., Lindblad-Toh, K., Birney, E., Rogers, J., et. al. (2002) Initial sequencing and comparative analysis of the mouse genome. Nature, 420, 520-562.
Weil, D., Blanchard, S., Kaplan, J., Guilford, P., et al. (1995) Defective myosin VIIA gene responsible for Usher syndrome type 1B. Nature, 374, 60-61.
Weil, D., El-Amraoui, A., Masmoudi, S., Mustapha, M., et al. (2003) Usher syndrome type I G (USH1G) is caused by mutations in the gene encoding SANS, a protein that associates with the USH1C protein, harmonin. Hum. Mol. Genet., 12, 463-471.
270
Weil, D., Levy, G., Sahly, I., Levi-Acobas, F., et al. (1996) Human myosin VIIA responsible for the Usher 1B syndrome: A predicted membrane-associated motor protein expressed in developing sensory epithelia. PNAS, 93, 3232-3237.
Willems, P.J. (2000) Genetic causes of hearing loss. N. Engl. J. Med., 342, 1101-1109.
Wolfrum, U., Liu, X., Schmitt, A., Udovichenko, I.P., and Williams, D.S. (1998) Myosin Vila as a common component of cilia and microvilli. Cell Motil. Cytoskeleton, 40, 261- 271.
Y
Yap, A.S., Brieher, W.M., and Gumbiner, B.M. (1997) Molecular and functional analysis of cadherin-based adherens junctions. Annu. Rev. Cell Dev. Biol., 13, 119- 146.
z
Zainuddin, Z., Teh, L.K., Suhaimi, A.W., Salleh, M.Z., and Ismail, R. (2003) A simple method for the detection of CYP2C9 polymorphisms: nested allele-specific multiplex polymerase chain reaction. Clin. Chim. Acta, 336, 97-102.
Zheng, L., Sekerkova, G., Vranich, K., Tilney, L.G., Mugnaini, E., and Bartles, J.R. (2000) The deaf jerker mouse has a mutation in the gene encoding the espin actin- bundling proteins of hair cell stereocilia and lacks espins. Cell, 102, 377-385.
Zwaenepoel, I., Verpy, E., Blanchard, S., Meins, M., et al. (2001) Identification of three novel mutations in the USH1C gene and detection of thirty-one polymorphisms used for haplotype analysis. Hum. Mutat., 17, 34-41.
271

Publications

Clin Genet 2003: 63: 303-307 Copyright © Blackwell Munksgaard 2003Printed in Denmark. A ll rights reserved n Tisn r a i . f^FMFTTrs
0009-9163
Short Report
The contribution of USH1C mutations to syndromic and non-syndromic deafness in the UK
Blaydon DC, Mueller RF, Hutchin TP, Leroy BP, Bhattacharya SS, Bird AC, Malcolm S and Bitner-Glindzicz M. The contribution of USH1C mutations to syndromic and non-syndromic deafness in the U KClin Genet 2003: 63: 303-307. © Blackwell Munksgaard, 2003
Denaturing high-performance liquid chromatography (DHPLC) was used to screen 14 UK patients with Usher syndrome type 1, in order to assess the contribution of mutations in USH1C to type 1 Usher. In addition, 16 Caucasian sib pairs and two small consanguineous families with non-syndromic deafness, who were concordant for haplotypes around DFNB18, were also screened for mutations in the USH1C gene. Two Usher type 1 patients were found to have the 238-239insC mutation reported previously; one of Greek Cypriot origin was homozygous for the mutation and another Caucasian was heterozygous. This indicates that mutations in the USH1C gene make a greater contribution to Usher syndrome type 1 than originally thought, which has implications for the genetic testing of families with Usher syndrome in the UK. Analysis using intragenic single nucleotide polymorphisms (SNPs) revealed that the haplotypic background bearing this common mutation was not consistent across the gene in two families, and that there are either two haplotypes on which the mutation has arisen or that there has been a recombination on a single haplotype. We found no evidence of mutations in USH1C in the patients with non-syndromic deafness, suggesting that the gene is not a major contributor to autosomal-recessive non-syndromic deafness in the UK.
DC Blaydon8, RF Mueller11,TP Hutchinb, BP Leroycd SS Bhattacharya6, AC Birdd,S Malcolm8 and M Bitner-Glindzicz8Clinical and Molecular Genetics Unit, Institute of Child Health, London, UK, bMolecular Medicine Unit, University of Leeds, Leeds, UK, “Department of Ophthalmology and “Department of Clinical Ophthalmology, Institute of Ophthalmology, London, UK
Key words: deafness - DHPLC - haplotype - Usher syndrome
Corresponding author: Diana Blaydon, Clinical and Molecular Genetics Unit, Institute of Child Health, 30 Guilford Street, London WC1N 1EH, UK.Tel.: +44 2079052274; fax: +44 2078138141; e-mail: [email protected]
Received 16 August 2002, revised and accepted for publication 3 December 2002
Usher syndrome type 1 is an autosomal-recessive condition in which profound, congenital sensorineural deafness is found in association with vestibular hypofunction and childhood-onset retinitis pigmentosa. This condition is further subdivided, based on linkage analysis, into types 1A to 1G. Type 1C Usher was originally mapped to chromosome Ilpl5.2-pl4 in the Acadian population of Louisiana (1) but was always thought to be rare outside this population. The causative gene for Usher type 1C (USH1C) has recently been identified as a PDZ domain-containing gene located at l ip 15.1 (2,3). Mutations have since been found in patients from Pakistan, India, Lebanon and Europe. The gene comprises 28 exons, 20 of which are constitutive (exons 1-14 and 16-21) and eight that are alternatively spliced (15, A -F and G /G \ see Fig. lb) (3).
DFNB18 is a recessive, non-syndromic form of deafness for which the locus was shown, by linkage, to overlap with the USH1C region (4) (Fig. la). As transcripts containing the alternative exons A-F and G/G’ do not appear to be expressed in the eye (3) it was hypothesized that mutations in these exons could lead to hearing defects without retinal degeneration and that DFNB18 and USH1C are allelic variants of the same gene. Allelism has recently been confirmed by mutation analysis of the original DFNB18 family, in which a leaky splice-site mutation in a constitutive exon was shown to produce wild- type transcripts as well as transcripts lacking exon 12 (5).
Given the recent findings of USH1C mutations in individuals of diverse ethnic backgrounds, we wanted to know whether mutations in USH1C
303

Blaydon et al.
(a) DFNB18
11p cen, USH1C r 11 p telD11S2368 D11S189 ___ ''6il58Q2 D11S1307
(b)
I IIIIIIIIIHIiiiiiHlllllll1 4 11 15 A B C D E F 16 G 21
Fig.. 1. Scheme indicating how the loci for Usher syndrome type 1C and non-syndromic deafness (DFNB18) overlap andl illustrating the constitutive and alternatively spliced exo'ns o f the USH1C gene, (a) The markers used to map both loci are shown below, with D11S2368 and D l l SI 307 defiining the larger DFNB18 region (4) and D11S1890 and D1 1S902 defining the USH1C loci (15). The relative position of the USH1C gene is also indicated, (b) The comstitutive exons (1-14 and 16-21) are shown in black, whiilst the alternatively spliced exons (15, A -F and G /G ’) are shown in grey. Exons 15 and A -F are spliced between exons 14 and 16, whilst exon G /G ’, when present, occurs between exo>ns 20 and 21. Exon numbers are indicated below.
are a common cause of Usher syndrome type 1 in the UK and whether mutations in this gene contribute significantly to non-syndromic deafness in o u t population.
M a te r ia ls and m e th o d sPattients
Two cohorts of patients were studied. One consisted of 14 British individuals of mixed ethnic origin who had been diagnosed with Usher syndrome type 1. The other group included 16 Caiucasian sib pairs with non-syndromic deafness from the UK and two small consanguineous families that showed concordance for polymorphic markers flanking the DFNB18 locus. This group of patients, with congenital/childhood onset non-syndromic deafness, is part of a larger cohort of 133 Caucasian sib pairs and 55 sib pairs of Pakistani and Middle-Eastern origin, who have been systematically haplotyped using micro- sattellite markers flanking all of the known DFNB loci (6; Hutchin TP). The sibling pairs were diagnosed with non-syndromic deafness following evaluation by a clinical geneticist, experienced audiological physician or community paediatrician in audiology, and most have had a detailed ophthalmological review. The age range of the patients varied from « 5 to 40 years, with the majority being in their teenage years. Their deafness was mainly severe to profound (although in
some cases a sibling had a moderate hearing loss) and was of congenital or early-childhood onset. Given the young age of some of the children, it is theoretically possible that the cohort may include some siblings with Usher in whom the condition is not yet apparent, although the chances of this are small given the relative proportion of Usher to non-syndromic deafness (7). The sib pairs had already been screened for mutations in GJB2 and 32% had mutations confirmed by molecular analysis. These subjects were excluded from further investigation.
Screening USH1C exons
Denaturing high-performance liquid chromatography (DHPLC) was used to screen all 28 coding exons of the USH1C gene in these patients and any heteroduplexes observed were investigated by sequencing on an ABI 377 (Applied Biosystems) using the fluorescent dideoxy terminator method.
DNA from 96 controls of undetermined origin was also screened on the WAVE machine to confirm the identification of polymorphisms or disease-causing mutations found in the patients. Polymerase chain reaction (PCR) and WAVE machine conditions are available on request.
Haplotype analysis
The haplotype of the patient found to be homozygous for the 238-239insC mutation was determined by sequencing 16 intragenic single nucleotide polymorphisms (SNPs), reported previously (8).
R esu ltsType 1 Usher patients
The 238-239insC mutation reported previously (2) was found in the homozygous state in a patient of Greek Cypriot origin and in the heterozygous state in a Caucasian patient, in whom no other mutation was found. The haplotype of the Greek Cypriot patient was determined and compared with the haplotypes of other patients with the 238-239insC mutation (Table 1).
A third patient was found to be heterozygous for a change at the first nucleotide of exon 5, a G—>A transition at nucleotide 388 (numbered according to ref. 9), resulting in a valine to isoleucine substitution at codon 130 (VI301) within the first PDZ domain of the protein. No sequence change on the other allele was identified.
304
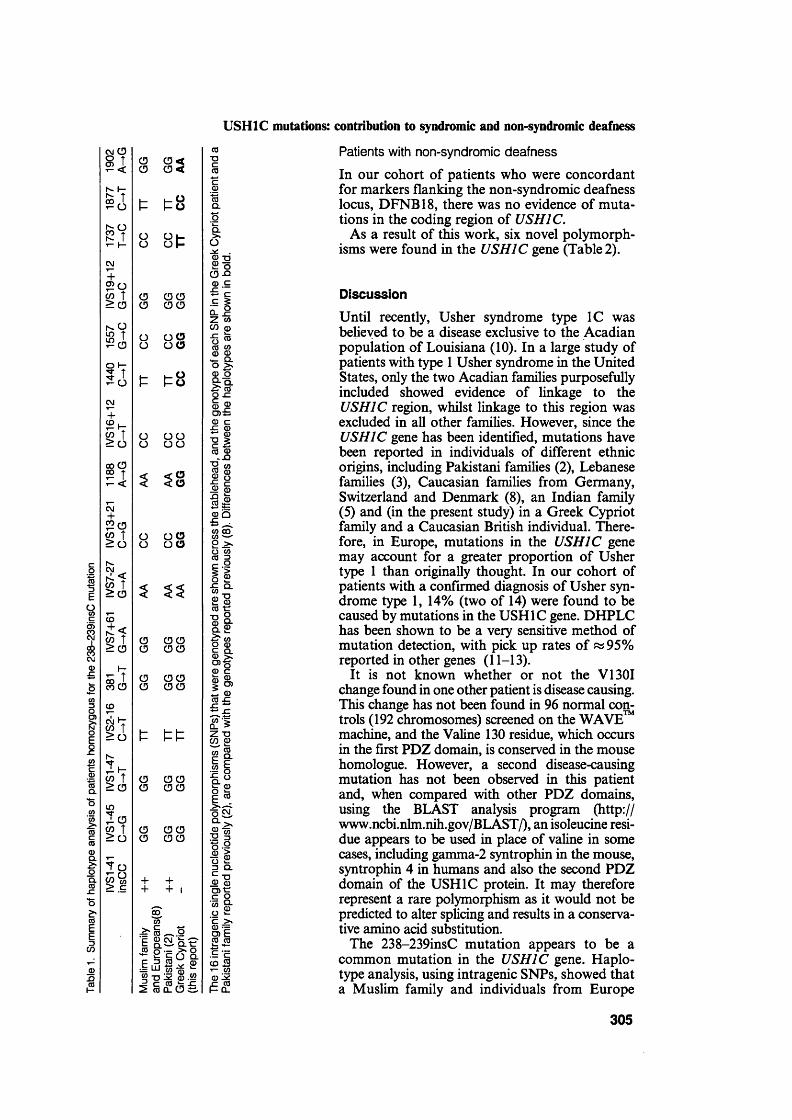
co<0sEOV)c05CO
CMQ)
SZ
cvi CD o tGG GG AA
N. t— t00 I " O i- i - °E Eo
00 th- T ■>- 1- O Oi-O OhCM+2 oW T > CD CD CD 0 CD CD CDr-O in t£ cd
O GO O OOO 1—5 T I- 1-°E EoCM+ £|- W T > o o o o o o o
1188
A->G
5 5 8
IVS1
3+21
C->G
O OOr--N- ^ CO r > 0 5 5 5
CD
r t < co T > 0
CD CD CD CD CD CD
I-So 0 0 0
0 0 0
CO
CM *7co T >o E EEr--t! h-w T > 0
0 00 0 00
in2 CD W T ^ O
0 00 0 00
IVS1-4
1in
sCC
+ ++ + i
§CO
£ g & a t
2? T3 15 CD .2?c to >= x: ^ co o. 0
coQ .
Q.>.O
USH1C mutations: contribution to syndromic and non-syndromic deafness
Patients w ith non-syndrom ic deafness
In our cohort of patients who were concordant for markers flanking the non-syndromic deafness locus, DFNB18, there was no evidence of mutations in the coding region of USH1C.
As a result of this work, six novel polymorphisms were found in the USH1C gene (Table 2).
a ) " a S> o CD -Q ©£ c C £
O y - CZ OT CO oO © cd co CD CD
S - Q .°2zCD O9; a.^ Cd o JZ
o ®o ) £CD C£ 05
CD
E ^cd a )
- jQ w m 0505 O XI ^O o
"rrt ©cd
CD Q
CO CO (/> '— O >, O CO
28o £
-C Q .coCD T3_ CD cd - e o
CL CD
T3 CDas-S' co0 CDC Q . © ^ a oCD C a3 ©1 °' CD© £ x: **a. > Z -a co a)? a.
o.° E *■ocm
3 1•S.9
* !3 Q .c ~oCD O CD’C£ SW ffl o c:c >NCD ~O) E
CD iST - COCD
x : cdi- a.
DiscussionUntil recently, Usher syndrome type 1C was believed to be a disease exclusive to the Acadian population of Louisiana (10). In a large study of patients with type 1 Usher syndrome in the United States, only the two Acadian families purposefully included showed evidence of linkage to the USH1C region, whilst linkage to this region was excluded in all other families. However, since the USH1C gene has been identified, mutations have been reported in individuals of different ethnic origins, including Pakistani families (2), Lebanese families (3), Caucasian families from Germany, Switzerland and Denmark (8), an Indian family (5) and (in the present study) in a Greek Cypriot family and a Caucasian British individual. Therefore, in Europe, mutations in the USH1C gene may account for a greater proportion of Usher type 1 than originally thought. In our cohort of patients with a confirmed diagnosis of Usher syndrome type 1, 14% (two of 14) were found to be caused by mutations in the USH1C gene. DHPLC has been shown to be a very sensitive method of mutation detection, with pick up rates of «95% reported in other genes (11-13).
It is not known whether or not the VI301 change found in one other patient is disease causing. This change has not been found in 96 normal com trols (192 chromosomes) screened on the WAVE machine, and the Valine 130 residue, which occurs in the first PDZ domain, is conserved in the mouse homologue. However, a second disease-causing mutation has not been observed in this patient and, when compared with other PDZ domains, using the BLAST analysis program (http:// www.ncbi.nlm.nih.gov/BLAST/), an isoleucine residue appears to be used in place of valine in some cases, including gamma-2 syntrophin in the mouse, syntrophin 4 in humans and also the second PDZ domain of the USH1C protein. It may therefore represent a rare polymorphism as it would not be predicted to alter splicing and results in a conservative amino acid substitution.
The 238-239insC mutation appears to be a common mutation in the USH1C gene. Haplotype analysis, using intragenic SNPs, showed that a Muslim family and individuals from Europe
305
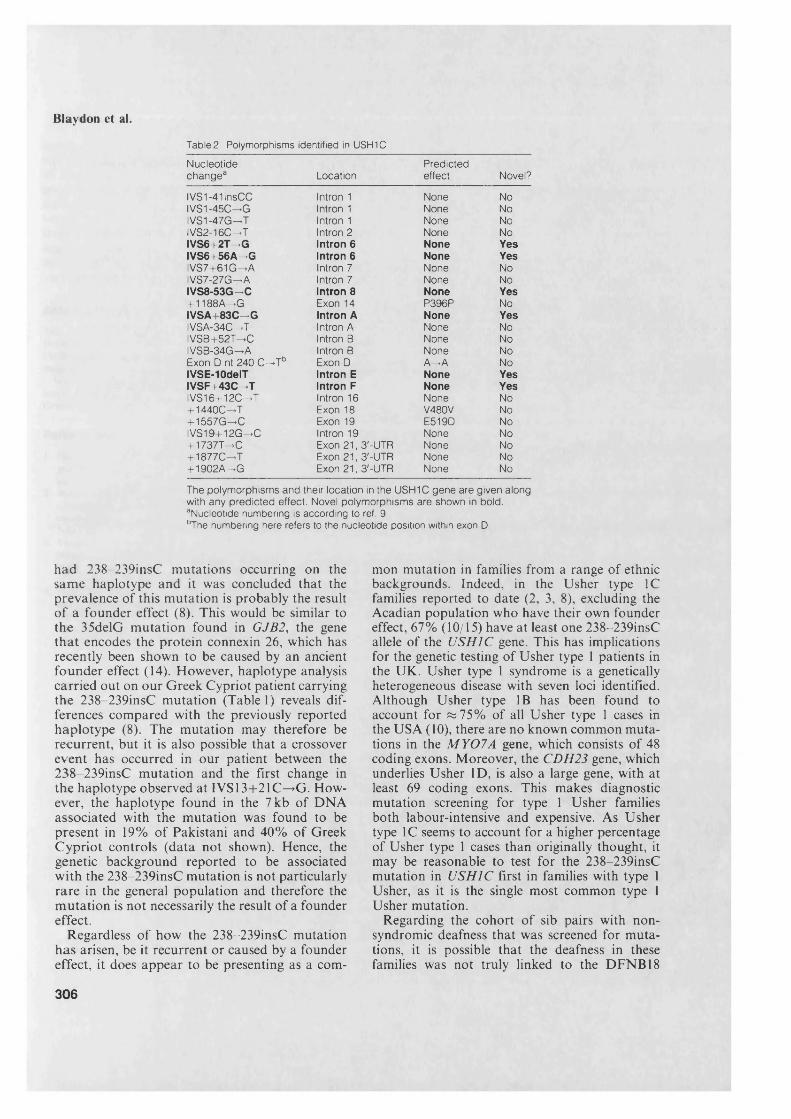
Blaydon et al.
Table 2. Polymorphisms identified in USH1C
Nucleotidechange8 Location
Predictedeffect Novel?
IVS1-41insCC Intron 1 None NoIVS1-45C—>G Intron 1 None NoIVS1-47G—»T Intron 1 None NoIVS2-16C—»T Intron 2 None NoIVS6+2T—»G Intron 6 None YesIVS6+56A—>G Intron 6 None YesIVS7+61G—>A Intron 7 None NoIVS7-27G—»A Intron 7 None NoIVS8-53G->C Intron 8 None Yes+1188A —>G Exon 14 P396P NoIV S A +83C -G Intron A None YesIVSA-34C—»T Intron A None NoIVSB+52T—>C Intron B None NoIVSB-34G—»A Intron B None NoExon D nt 240 C->Tb Exon D A—*A NoIVSE-10delT Intron E None YesIVSF+43C—+T Intron F None YesIVS16+12C—>T Intron 16 None No+1440C —»T Exon 18 V480V No+1557G —>C Exon 19 E519D NoIVS19+12G->C Intron 19 None No+1737T—*C Exon 21, 3'-UTR None No+1877C —>T Exon 21, 3'-UTR None No+1902A—»G Exon 21, 3'-UTR None No
The polymorphisms and their location in the USH1C gene are given along with any predicted effect. Novel polymorphisms are shown in bold. aNucleotide numbering is according to ref. 9. hThe numbering here refers to the nucleotide position within exon D.
had 238-239insC mutations occurring on the same haplotype and it was concluded that the prevalence of this mutation is probably the result of a founder effect (8). This would be similar to the 35delG mutation found in GJB2, the gene that encodes the protein connexin 26, which has recently been shown to be caused by an ancient founder effect (14). However, haplotype analysis carried out on our Greek Cypriot patient carrying the 238-239insC mutation (Table 1) reveals differences compared with the previously reported haplotype (8). The mutation may therefore be recurrent, but it is also possible that a crossover event has occurred in our patient between the 238-239insC mutation and the first change in the haplotype observed at IVS13+21C—>G. However, the haplotype found in the 7 kb of DNA associated with the mutation was found to be present in 19% of Pakistani and 40% of Greek Cypriot controls (data not shown). Hence, the genetic background reported to be associated with the 238-239insC mutation is not particularly rare in the general population and therefore the mutation is not necessarily the result of a founder effect.
Regardless of how the 238-239insC mutation has arisen, be it recurrent or caused by a founder effect, it does appear to be presenting as a com
mon mutation in families from a range of ethnic backgrounds. Indeed, in the Usher type 1C families reported to date (2, 3, 8), excluding the Acadian population who have their own founder effect, 67% (10/15) have at least one 238-239insC allele of the USH1C gene. This has implications for the genetic testing of Usher type 1 patients in the UK. Usher type 1 syndrome is a genetically heterogeneous disease with seven loci identified. Although Usher type IB has been found to account for «75% of all Usher type 1 cases in the USA (10), there are no known common mutations in the M Y07A gene, which consists of 48 coding exons. Moreover, the CDH23 gene, which underlies Usher ID, is also a large gene, with at least 69 coding exons. This makes diagnostic mutation screening for type 1 Usher families both labour-intensive and expensive. As Usher type 1C seems to account for a higher percentage of Usher type 1 cases than originally thought, it may be reasonable to test for the 238-239insC mutation in USH1C first in families with type 1 Usher, as it is the single most common type 1 Usher mutation.
Regarding the cohort of sib pairs with non- syndromic deafness that was screened for mutations, it is possible that the deafness in these families was not truly linked to the DFNB18
306
USH1C mutations: contribution to syndromic and non-syndromic deafness
locus, as there is a 25% chance that any sib pair will be concordant for markers at any given locus of the genome. Therefore, our sample of 16 sib pairs concordant for markers flanking DFNB18, derived from the original cohort of 133, is too small to have a >95% chance of having any truly linked families. However, in itself this suggests that the contribution of DFNB18 to non-syndromic deafness as a whole in the UK is very probably minor.
AcknowledgementsThis w ork was funded by the Medical Research Council and Defeating Deafness. D r Bart P. Leroy was supported by Belgian FRO grants and a BOF grant from the Ghent University, Belgium.
We would also like to thank Dr Mary Petrou from the department o f Haematology at UCL for her kind donation of 50 Greek Cypriot controls.
References1. Smith RJ, Lee EC, Kimberung WJ et al. Localization of two
genes for Usher syndrome type I to chromosome 11. Genomics 1992: 14: 995-1002.
2. Bitner-Glindzicz M, Lindley KJ, Rutland P et al. A recessive contiguous gene deletion causing infantile hyperinsulinism, enteropathy and deafness identifies the Usher type 1C gene. N al Genet 2000: 26: 56-60.
3. Verpy E, Leibovici M, Zwaenepoel I et al. A defect in har- monin, a PDZ domain-containing protein expressed in the inner ear sensory hair cells, underlies Usher syndrome type 1C. N at Genet 2000: 26: 51-55.
4. Jain PK, Lalwani AK, Li XC et al. A gene for recessive nonsyndromic sensorineural deafness (DFNB18) maps to the chromosomal region Ilp l4-pl5 .1 containing the Usher syndrome type 1C gene. Genomics 1998: 50: 290-292.
5. Ahmed ZM, Smith TN, Riazuddin S et al. Nonsyndromic recessive deafness DFNB18 and Usher syndrome type IC are allelic mutations of USHIC. Hum Genet 2002: 110: 527-531.
6. Navarro-Coy N, Hutchin TP, Conlon HE et al. The relative contribution of mutations in the DFNB loci to congenital/ early childhood non-syndromal sensorineural hearing impairment/deafness. J Med Genet 2001:1 (38 Suppl): S38.
7. Kimberling WJ, Smith RJH. Usher syndrome. In: Martini A, Read A, Stephens D, eds. Genetics and Hearing Impairment. London: Whurr Publishers Ltd, 1996: 141-145.
8. Zwaenepoel I, Verpy E, Blanchard S et al. Identification of three novel mutations in the USHIC gene and detection of thirty-one polymorphisms used for haplotype analysis. Hum M utat 2001: 17: 34-41.
9. Kobayashi I, Imamura K, Kubota M et al. Identification of an autoimmune enteropathy-related 75-kilodalton antigen. Gastroenterology 1999: 117: 823-830.
10. Astuto LM, Weston MD, Carney CA et al. Genetic heterogeneity of Usher syndrome: analysis of 151 families with Usher type I. Am J Hum Genet 2000: 67: 1569-1574.
11. Dobson-Stone C, Cox RD, Lonie L et al. Comparison of fluorescent single-strand conformation polymorphism analysis and denaturing high-performance liquid chromatography for detection of EXT1 and EXT2 mutations in hereditary multiple exostoses. Eur J Hum Genet 2000: 8: 24-32.
12. Gross E, Arnold N, Goette J et al. A comparison of BRCA1 mutation analysis by direct sequencing, SSCP and DHPLC. Hum Genet 1999: 105: 72-78.
13. Liu W, Smith DI, Rechtzigel KJ et al. Denaturing high performance liquid chromatography (DHPLC) used in the detection of germline and somatic mutations. Nucl Acids Res 1998: 26: 1396-1400.
14. Van Laer L, Coucke P, Mueller RF et al. A common founder for the 35delG GJB2 gene mutation in connexin 26 hearing impairment. J Med Genet 2001: 38: 515-518.
15. Higgins MJ, Day CD, Smilinich NJ et al. Contig maps and genomic sequencing identify candidate genes in the usher 1C locus. Genome Res 1998: 8: 57-68.
307