The genetics of plant metabolism
168
Genetical Genomics in Arabidopsis: from natural variation to regulatory networks Joost Keurentjes
Transcript of The genetics of plant metabolism

Genetical Genomics in Arabidopsis:from natural variation to regulatory networks
Joost Keurentjes

Promotoren: Prof. dr. ir. M. KoornneefPersoonlijk hoogleraar bij het Laboratorium voorErfelijkheidsleer, Wageningen Universiteit
Prof. dr. L.H.W. van der PlasHoogleraar in de Plantenfysiologie, WageningenUniversiteit
Copromotor: Dr. D. VreugdenhilUniversitair hoofddocent bij het Laboratorium voorPlantenfysiologie, Wageningen Universiteit
Promotiecommissie: Prof. dr. W.J. Stiekema, Wageningen UniversiteitProf. dr. R.G.F. Visser, Wageningen UniversiteitProf. dr. J.C.M. Smeekens, Universiteit UtrechtProf. dr. M. Stitt, Max Planck Instituut voorMoleculaire Plantenfysiologie, Golm, Duitsland
Dit onderzoek is uitgevoerd binnen de onderzoekschool voor ExperimentelePlantwetenschappen.

Joost Keurentjes
Genetical Genomics in Arabidopsis:from natural variation to regulatory networks
Proefschriftter verkrijging van de graad van doctor
op gezag van de rector magnificusvan Wageningen Universiteit,
Prof. dr. M.J. Kropff,in het openbaar te verdedigenop vrijdag 7 september 2007
des namiddags te 13:30 uur in de Aula

Joost J.B. Keurentjes
Genetical Genomics in Arabidopsis: from natural variation toregulatory networks (2007)
PhD thesis, Wageningen University, Wageningen, The Netherlands.With references – with summaries in English and Dutch.
ISBN 978 90 8504 704 9

CONTENTS
Chapter 1 General introduction 1
Chapter 2 Development of a Near Isogenic Line population of 17Arabidopsis thaliana and comparison of mapping powerwith a Recombinant Inbred Line population
Chapter 3 Regulatory network construction in Arabidopsis by using 47genome wide gene expression quantitative trait loci
Chapter 4 The genetics of plant metabolism 73
Chapter 5 Integrative analyses of genetic variation in enzyme 99activities of primary carbohydrate metabolism revealdistinct modes of regulation in Arabidopsis thaliana
Chapter 6 General discussion 133
Summary 143
Samenvatting 147
Publications 151
Curriculum vitae 155
Nawoord 156
Education Statement 159


1
Chapter 1
General introduction
Natural variation and quantitative traitsFor most organisms variation between individuals can be observed in nature.Plants are no exception to this and naturally occurring variation can be observedbetween and within species. Although part of the within species variationobserved in nature can be attributed to environmental influences, genetic variationcan be observed when plants of different origins are grown together in the sameenvironment (Nordborg et al., 2005). The contribution of genetic factors to thetotally observed variation between different genotypes is often expressed as theheritability of a trait.
Natural variation exhibited by genotypically different accessions can beclassified as qualitative or quantitative. Qualitative traits are characterized bydistinct phenotypic classes, e.g. presence or absence of a property, often a resultfrom genetic differences at single genes. Such traits can relatively easily bedissected genetically due to their clear segregation pattern in the progeny ofcrosses. Quantitative traits on the other hand, often display a more continuousvariation in phenotypes due to a multiplicity of genes involved and a relativelylarge effect of environmental factors on the expression of the trait. Becausedifferent genes can contribute positively or negatively to a quantifiable trait,recombination of genes results in a large number of phenotypic classes which cannot unambiguously be associated with genotypic classes (Kearsey et al., 2003;Weigel and Nordborg, 2005; Holland, 2007). The complexity of quantitative traits isfurther enhanced by the presence of epistatic interactions and interactions betweengenes and the environment (Carlborg and Haley, 2004; Kroymann and MitchellOlds, 2005).
Although much more difficult to dissect, quantitative variation is found formany agronomical important traits like biomass formation, plant height, floweringtime, reproductive yield and seed dormancy (Koornneef et al., 2004; Ross Ibarra,2005; Ashikari and Matsuoka, 2006; Semel et al., 2006; Zhao et al., 2006).Furthermore, quantitative natural variation controls adaptive strategies to copewith biotic and abiotic influences and its understanding can provide insight inecological mechanisms and the evolutionary history of plants (Tonsor et al., 2005;Mitchell Olds and Schmitt, 2006).

Chapter 1
2
Arabidopsis thaliana as a model plantThe study of quantitative traits is often contrasted with the analysis of qualitativetraits, which are mostly represented by single gene mutants or single gene naturalvariants. For the study of such single genes Arabidopsis thaliana has proven to be avery efficient model plant because of a number of biological properties that makegenetic analyses very efficient (Somerville and Koornneef, 2002). Although it isself fertilizing it can easily be out crossed and it combines short generation timeswith high reproductive yield. Moreover, it contains a fully sequenced smallgenome (120 Mbp) made up of only five chromosomes and approximately 30,000genes (The Arabidopsis Genome Initiative, 2000). The accumulation of knowledge,biological resources and available molecular tools adds up to the attractiveness ofArabidopsis as a model system (Alonso and Ecker, 2006).
These advantages also make Arabidopsis very suitable for the geneticanalysis of natural variation. The plant shows a broad global distributionthroughout the northern hemisphere at different continents, including America,Africa, Europe and Asia (Schmid et al., 2006). Moreover it is found at differentlatitudes and altitudes ranging from Scandinavian sea level to high up in the AsianHimalayas. At many locations, accessions or ecotypes, have been collecteddisplaying a broad spectrum of natural variation for numerous traits (AlonsoBlanco and Koornneef, 2000; Koornneef et al., 2004). Many of those accessions aredeposited to stock centers making them publicly available for genetic analyses.
Genetic analysis of quantitative traitsDespite the complexity in genetic regulation of quantitative traits much progresshas been made over the past decades in dissecting these traits by the use ofmolecular markers. The increasing ease by which molecular markers can begenerated (Borevitz and Chory, 2004) in combination with the application ofsophisticated mapping methods (Jansen, 1993) has led to a strong interest in theuse of natural variation for studying quantitative traits (Slate, 2005). Mutantscreens, often directed to a specific trait, and the subsequent mapping and cloningof the affected gene, have been a very effective strategy to analyze the function ofgenes in Arabidopsis (Meinke et al., 2003). However, specific advantages areassociated with the study of multiple natural perturbations in the same mappingpopulation. This allows for the analysis of an almost infinite number of traits(Doerge, 2002). For this type of study so called immortal mapping populations,consisting in most cases of homozygous genotypes that can be tested in replicatesand in different experiments, have proven very useful.
Although various types of such mapping populations have beendeveloped for a variety of species (Eshed and Zamir, 1995; Rae et al., 1999; Yoon et

General introduction
3
al., 2006), the relative ease of generating recombinant inbred lines (RILs) has led totheir favorable use for quantitative trait locus (QTL) analysis in Arabidopsis andmany other plants (Jansen, 2003b). RILs are produced by crossing two distinctgenotypes and using single seed descent propagation of the inbred lines obtainedby selfing a random set of F2 individuals. While the accuracy of QTL mappingdepends on statistical factors such as the size of the mapping population, it hasbeen shown to be quite accurate in many cases (Price, 2006). However, there isoften still a need for confirmation and further fine mapping (Paran and Zamir,2003; Weigel and Nordborg, 2005). For these aspects, which are the basis of thecloning of genes underlying QTLs, near isogenic lines (NILs) are often used toisolate a QTL. A set of NILs consists of lines with identical genetic background butdiffering in genotype at the position of a limited number of loci. NILs are generallyconstructed by introgressing a donor accession into the genetic background ofanother accession by crossing and repeated back crossing with the recurrentaccession. NILs allow studying the effect of Mendelized QTLs and can refine theposition of a QTL by varying position and size of introgressions.
Despite the fact that RIL populations have been developed for anincreasing number of different genotypes the development of NILs has laggedbehind. Upon the detection of a QTL, NILs are often not available for theconfirmation and finemapping of those QTLs. Valuable time is often lost indeveloping NILs before the necessary follow up experiments can be continued.The Landsberg erecta (Ler) x Cape Verde Islands (Cvi) RIL population (AlonsoBlanco et al., 1998b) is one of the most frequently used populations in quantitativegenetics and several NILs have been developed at distinct loci for these genotypes(Alonso Blanco et al., 1998a; Swarup et al., 1999; Alonso Blanco et al., 2003; Bentsinket al., 2003; Edwards et al., 2005; Juenger et al., 2005; Teng et al., 2005). However,most of these NILs were developed after the detection of QTLs in the RILpopulation and these studies could have benefited much from the directavailability of NILs. To increase the efficiency from the mapping of quantitativetraits to the actual cloning of the causal genes it would therefore be advantageousto have a NIL at every possible genomic location at one’s disposal. Moreover,collections of NILs with genome wide coverage can serve as mapping populations,which differ in effectiveness from RILs, mainly because the complexity of epistasisis strongly reduced (Eshed and Zamir, 1995).
Genetical genomics: variation in genome sequence and expressionIn Arabidopsis as well as in other species, genome wide analyses of genomicpolymorphisms in a large collection of accessions have revealed extensivesequence variation (Borevitz et al., 2003; Han and Xue, 2003; Schmid et al., 2003;

Chapter 1
4
Nordborg et al., 2005; Vigouroux et al., 2005). Polymorphisms, when converted tomolecular markers, are indispensable for (fine) mapping of quantitative traits inexperimental populations. When surveyed in natural populations at high density,polymorphisms even enable high resolution mapping through linkagedisequilibrium (Remington et al., 2001; Nordborg et al., 2002; Aranzana et al., 2005;Kim et al., 2006). The best marker, however, is the polymorphism causal for theobserved variation. By definition natural genetic variation is a result of genomicdifferences and therefore the extent of variation in quantitative traits is largelydependent on the level of DNA sequence variation. Although many of thepolymorphisms will be neutral, it leaves little doubt that the study of quantitativetraits can benefit enormously from genomic analyses (Borevitz and Nordborg,2003; Maloof, 2003; Gilad and Borevitz, 2006). Non synonymous polymorphisms incoding sequences of genes might alter protein function or stability, introducingphenotypic variation. Polymorphisms in regulatory sequences on the other handmight result in differences in transcriptional efficiency of genes. It is conceivablethat expression differences, or variation in mRNA stability caused by codingsequence polymorphisms, contribute heavily to natural variation in Arabidopsis(Chen et al., 2005). Given the extensive variation in phenotype and genomicsequence within Arabidopsis, it is therefore not surprising that for many genesexpression differences can be observed between accessions (Vuylsteke et al., 2005;Kliebenstein et al., 2006a; West et al., 2006).
The genetic regulation of natural variation in gene expression ispresumably not different from any other ‘classical’ quantitative trait. Therefore,gene expression can be treated like any other quantitative trait, on which allstatistical tools of quantitative genetics can be applied. However, the effect of thisvariation may be reflected at the phenotypic level, thereby explaining the geneticcomponent of natural phenotypic variation. This combination of linkage analysis(genetics) and expression profiling (genomics) was coined ‘genetical genomics’(Jansen and Nap, 2001) and experiments were first reported in yeast (Brem et al.,2002), soon followed by data of higher eukaryotes (Schadt et al., 2003). Because ofthe available high quality mapping populations and the commercially availablegenome wide microarrays, Arabidopsis is ideally suited for these kinds ofanalyses. However, upon publication of the first genetical genomics studies nogenome wide data for Arabidopsis were available yet and only recently a numberof studies in various RIL populations have indicated extensive genetic regulationof gene expression (DeCook et al., 2006; Vuylsteke et al., 2006; Keurentjes et al.,2007; West et al., 2007).
Genome wide expression analysis of fully sequenced genomes, likeArabidopsis, offers the unique possibility to compare genomic positions of genes

General introduction
5
with the map position(s) of their detected expression QTL(s) (eQTL). Suchcomparative analyses reveal either local or distant regulation of gene expression.Local regulatory variation is observed when genes and their respective eQTLs colocate and distant regulatory variation is observed when genes and their respectiveeQTLs are positionally separated on the genome (Rockman and Kruglyak, 2006).Local regulatory variation is often a result of polymorphisms within the gene forwhich the eQTL was observed. When such polymorphisms reside in cis actingregulatory elements this might affect transcriptional activity. Regulation in ciscould also act post transcriptionally by altering mRNA stability whenpolymorphisms reside in coding sequences of the gene. However, polymorphismswithin the gene itself might also act in trans by altering auto regulation andfeedback loops. Furthermore, occasionally local regulatory variation might act intrans due to polymorphisms in a tightly linked gene that regulates the gene forwhich the eQTL was detected. To determine whether local regulatory variationacts in cis or trans further experimentation, like allele specific expression analysis,is necessary (Ronald et al., 2005; Zhang et al., 2007). Distant regulatory variationmost likely acts in trans when polymorphisms in another gene (e.g. a transcriptionfactor) affect transcription of the gene for which the distant eQTL was detected.Nonetheless, other mechanisms of distant regulation, both in cis and trans, areimaginable (Rockman and Kruglyak, 2006).
Genetic regulation of plant metabolic contentThe impact of gene expression variation on quantitative traits is now widelyacknowledged and the use of high throughput genomic analyses has become animportant tool in genetic analyses of natural variation (Gibson and Weir, 2005).Transcription however, is only a first link in the chain from genotype to phenotypeand successive entities like proteins and metabolites (quality and quantity) areexpected as causal sources for natural phenotypic variation but have been largelyunder exploited. Yet, high throughput technologies, i.e. proteomics andmetabolomics, have shown that much variation is observed upon physiologicalperturbation and between genetic variants (Fiehn et al., 2000; Chevalier et al., 2004).Moreover, small scale targeted analyses and subsequent QTL analysis revealedstrong genetic regulation in a number of studies (Kliebenstein et al., 2001; Consoli etal., 2002).
Analogous to genetical genomics, the combination of high throughputproteomics and metabolomics and multifactorial genetic analyses would thereforeallow studying the functional consequences of natural genetic variation at a muchlarger scale (Jansen, 2003a). However, full scale analyses for proteins andmetabolites, equivalent to genome wide expression analysis, are not available yet.

Chapter 1
6
This is mainly because proteins and metabolites are much more diverse in theirproperties than nucleic acids, making it difficult to extract and analyze all differentclasses using a single protocol. Even based on a fully sequenced genome onecannot predict all protein variants and metabolites that a plant can contain.Moreover, the dynamic range of protein and metabolite abundance is far greaterthan for nucleic acids and no amplification techniques are available for theseentities, making sample volume and detection range (sensitivity vs. saturation)critical limitations. Nevertheless, several complementing high throughputtechnologies have been developed covering together a large part of the proteome(Peck, 2005) and metabolome (Ward et al., 2003; Lisec et al., 2006; De Vos et al.,2007).
The progress made in proteomics and metabolomics now also enables thelarge scale genetic analysis of these entities, which has only recently bedemonstrated for primary metabolites (Schauer et al., 2006). However, variation insecondary metabolism is probably more extensive and determines much of thephenotypic variation that can be observed. Plants are especially rich in the numberof secondary metabolites, possibly as a consequence of their sessile nature. Sinceplants are unable to move away from biotic and abiotic threats they have adaptedto cope with many environmental influences. In Arabidopsis alone alreadyhundreds of secondary metabolites representing numerous chemical classes havebeen discovered (D Auria and Gershenzon, 2005). Given the wide globaldistribution range of Arabidopsis and the diverge range of sites plants have beencollected, it is conceivable that metabolites play an important role in localadaptation strategies. It is therefore likely that the high level of natural variation inArabidopsis is also reflected in metabolite composition and content (Fiehn, 2002).
A large drawback of metabolomic analyses is the lack of compoundidentification. Unlike microarrays, where each signal can be reduced to a specificgene, most large scale metabolomic techniques are untargeted. The output of ametabolic sample analysis typically consists of a complex chromatogram of many,often anonymous peaks, where compounds can be represented by multiple peaksdepending on adduct formation, fragmentation and isotopes. For genetic analysisit is essential that chromatograms of different genotypes are qualitativelycomparable. This alignment problem can be solved by adding referencecompounds, standardization and proper alignment software (Lisec et al., 2006; DeVos et al., 2007). Although each peak represents a specific chemical compound, theorder, retention time and intensity of peaks can differ substantially depending onanalytical differences and sample properties. Such inconsistencies in data outputmake it difficult to compare analyses performed in different labs or experiments.Although some efforts have been made in constructing identification libraries

General introduction
7
(Schauer et al., 2005; Moco et al., 2006; Ward et al., 2007), such libraries do not coverentirely the still expanding number of detected compounds. Moreover, thedifferent methodologies applied in various labs make it difficult to implement suchlibraries. The scientific community would therefore benefit much from acommonly adopted standard for metabolomic analyses (Jenkins et al., 2004).
Regulatory network constructionTo functionally link the large data sets obtained in ‘omic’ experiments as an orderof events that ultimately result in a specific phenotype, network constructionprovides a useful tool. Biological networks describe relationships betweenindividual components of a biological process (Barabasi and Oltvai, 2004). Suchcomponents can either be genes, proteins, metabolites or a combination thereof.Depending on the data source, networks can be constructed in various ways but allof them serve to elucidate the, often complex, regulation of biological processes.
A special type of networks does not rely on experimental data but ratherpredicts in silico connections based on genome wide sequence information. Mostnotably are genome scale metabolic connectivity networks, where metabolites areconnected when the genome contains a gene encoding an enzyme able to catalyzethe conversion of one of the metabolites into the other (Jeong et al., 2000). However,genetic networks have also been predicted in silico by analyzing regulatoryelements of genes for binding sites of known transcription factors (Palaniswamy etal., 2006). Although powerful in hypothesis formation such studies requireempirical data for confirmation of predicted pathways and interactions. Therefore,many approaches for network construction are based on experimental data, whichalso allows the identification of relationships unable to be predicted from genomicinformation only. Protein protein interactions for instance, are difficult to deducefrom sequence information but require immuno precipitation or two hybridscreens. Similar analyses, like chromatine immuno precipitation (ChIP chip), canalso be used to identify and confirm transcriptional regulation of target genes bytranscription factors or other known regulators (Lee et al., 2002). In yeast, muchprogress in regulatory network construction has been made by expression andmetabolic profiling of deletion strains (Forster et al., 2002; Hu et al., 2007) andgenetic interaction analyses of double mutants (synthetic lethals) (Tong et al., 2004).However, for most higher eukaryotes such genome wide analyses are not realisticbecause of the much higher gene number, the presumably more complex geneticarchitecture, and aspects of sub cellular and tissue specific compartmentation.Many attempts in regulatory network construction therefore rely on more indirectapproaches of establishing associations between network components.

Chapter 1
8
A straightforward approach is correlation analysis over a large set of datacompiled from numerous perturbation experiments (de la Fuente et al., 2004).Exemplary are the widely applied gene co expression analyses, where correlationin gene expression patterns is surveyed under a large number of diverse conditions(Stuart et al., 2003; Gachon et al., 2005). The rationale for this kind of analysis is thatgenes participating in the same biological process are often co regulated and henceexhibit similar expression patterns. Following the same line of reasoning, metaboliccorrelation networks have been constructed (Steuer et al., 2003). However,correlation does not necessarily imply functional relatedness nor does it addresscausality issues. The reliability of, and information contained in constructednetworks would therefore gain much strength from integrated analyses ofinterdisciplinary approaches (Fiehn et al., 2001; Winnacker, 2003). Such integratedstudies can either combine experimental data with in silico analyses (Segal et al.,2003) or benefit from multi parallel analyses of diverse biological samples(Urbanczyk Wochniak et al., 2003; Hirai et al., 2005; Joosen et al., 2007).
Although demonstrably effective, correlation analyses depend on largecompendia of publicly available data or suffer from the limited number ofphysiological conditions that can be analyzed in dedicated experiments. However,sometimes co regulation is displayed only in particular conditions (Gachon et al.,2005) which may even remain undiscovered in large data sets due to dilutioneffects. The largest drawback of correlation analyses, however, is that noinformation can be retrieved about the nature of the underlying genetic regulation.Correlation may be a result from co regulation by a common regulator or due toindependent pathways that occur in parallel, possibly due to developmental orspatial control. A highly correlated cluster of biological elements, such as genes,proteins and metabolites, can also result from downstream effects of the regulationof a single member but no information about cause and consequence can beextracted from genetic correlations.
Mapping populations combine a high number of genetic perturbations bywhich numerous quantitative traits can segregate in a single experiment.Moreover, genetic analysis offers the unique possibility of identifying genomic locicausal for observed variation in, and possible correlation between traits. Whenapplied to genome wide expression analysis or other large scale ‘omic’ analysesthis therefore allows the identification of true gene to gene or gene to functionregulation. Unfortunately, mapping resolution is often not high enough to identifydirectly causal genes underlying detected QTLs and will require further analysissuch as fine mapping, the study of overexpressors and mutants of candidate genes,etc. However, cis regulated genes are obvious candidates and co regulated traitscan effectively be identified through co location of detected QTLs. Still, not all

General introduction
9
coinciding QTLs necessarily represent the same causal gene because effects ofclosely linked genes are difficult to distinguish from true pleiotropic effects of asingle gene. Without further experimentation genetic interactions can be predictedcomputationally by comparing QTL profiles and correlation analyses (Zhu et al.,2004; Bing and Hoeschele, 2005; Li et al., 2005; Lan et al., 2006; Fu et al., 2007).However, the accuracy of constructed networks can benefit tremendously from theintegration of additional information like gene ontology (Kliebenstein et al., 2006b;Keurentjes et al., 2007), sequence data (Hitzemann et al., 2003) and relatedquantitative trait data (Consoli et al., 2002; Hubner et al., 2005).
Although much progress has been made in the construction of regulatorynetworks, any information inferred from such networks should be interpreted withcaution. Where many studies have shown the identification of correct interactions,most approaches can not exclude the assignment of false positives. Predictedinteractions and regulatory steps should therefore be considered as hypothesisformation only and confirmation of such relationships should come fromadditional experimentation.

Chapter 1
10
Scope of the thesisIn Arabidopsis natural variation exists for many quantitative traits. The geneticregulation of quantitative traits can effectively be analyzed in mappingpopulations by way of quantitative trait locus (QTL) analyses. This thesis describesthe large scale genetic analysis of ‘omics’ data and their use in dissecting thegenetic regulation of quantitative traits.
Chapter two describes the development of a near isogenic line (NIL)population and its use in mapping and fine mapping of QTLs. NILs are widelyused in the confirmation of QTLs, detected in recombinant inbred line (RIL)populations. However, when a population of NILs with genome wide coverage isavailable, such a population can also be used for mapping purposes. A genomewide NIL population was generated by introgressing genomic regions of anaccession from the Cape Verde Islands (Cvi) into the genetic background of thecommonly used laboratory accession Landsberg erecta (Ler). Mapping power andresolution of this population was compared with the previously developed Ler xCvi RIL population.
Chapter three describes the genome wide expression analysis of the Ler xCvi RIL population. Similar to ‘classical’ quantitative traits, natural variation alsoexists for expression levels of many genes. QTL mapping of expression variationtherefore reveals genomic loci controlling the expression of genes. This informationcan then be used to construct genetic regulatory networks and help elucidating thegenetic control of many physiological traits.
Chapter four describes the large scale untargeted metabolomic analyses inthe Ler x Cvi RIL population. Subsequent mapping revealed substantial geneticcontrol for metabolite composition and content. Identification of anonymous masspeaks enabled the reconstruction of metabolic pathways and revealed novelbiosynthetic steps.
Chapter five describes the integrated analysis of gene expression, enzymeactivities and metabolite content in primary carbohydrate metabolism. QTL andcorrelation analyses identified different modes of control of primary carbohydratemetabolism, including regulation of structural gene expression and metaboliccontrol.
Finally, in chapter six, the work described in this thesis is summarized anddiscussed.

General introduction
11
REFERENCES
Alonso Blanco, C., El Assal, S.E., Coupland, G. and Koornneef, M. (1998a). Analysis of natural allelicvariation at flowering time loci in the Landsberg erecta and Cape Verde Islands ecotypes ofArabidopsis thaliana. Genetics 149, 749 764.
Alonso Blanco, C., Peeters, A.J., Koornneef, M., Lister, C., Dean, C., van den Bosch, N., Pot, J. andKuiper, M.T. (1998b). Development of an AFLP based linkage map of Ler, Col and CviArabidopsis thaliana ecotypes and construction of a Ler/Cvi recombinant inbred linepopulation. Plant J 14, 259 271.
Alonso Blanco, C. and Koornneef, M. (2000). Naturally occurring variation in Arabidopsis: anunderexploited resource for plant genetics. Trends Plant Sci 5, 22 29.
Alonso Blanco, C., Bentsink, L., Hanhart, C.J., Blankestijn de Vries, H. and Koornneef, M. (2003).Analysis of natural allelic variation at seed dormancy loci of Arabidopsis thaliana. Genetics 164,711 729.
Alonso, J.M. and Ecker, J.R. (2006). Moving forward in reverse: genetic technologies to enable genomewide phenomic screens in Arabidopsis. Nat Rev Genet 7, 524 536.
Aranzana, M.J., Kim, S., Zhao, K., Bakker, E., Horton, M., Jakob, K., Lister, C., Molitor, J., Shindo, C.,Tang, C. et al. (2005). Genome wide association mapping in Arabidopsis identifies previouslyknown flowering time and pathogen resistance genes. PLoS Genet 1, e60.
Ashikari, M. and Matsuoka, M. (2006). Identification, isolation and pyramiding of quantitative trait locifor rice breeding. Trends Plant Sci 11, 344 350.
Barabasi, A.L. and Oltvai, Z.N. (2004). Network biology: understanding the cell s functionalorganization. Nat Rev Genet 5, 101 113.
Bentsink, L., Yuan, K., Koornneef, M. and Vreugdenhil, D. (2003). The genetics of phytate andphosphate accumulation in seeds and leaves of Arabidopsis thaliana, using natural variation.Theor Appl Genet 106, 1234 1243.
Bing, N. and Hoeschele, I. (2005). Genetical genomics analysis of a yeast segregant population fortranscription network inference. Genetics 170, 533 542.
Borevitz, J.O., Liang, D., Plouffe, D., Chang, H.S., Zhu, T., Weigel, D., Berry, C.C., Winzeler, E. andChory, J. (2003). Large scale identification of single feature polymorphisms in complexgenomes. Genome Res 13, 513 523.
Borevitz, J.O. and Nordborg, M. (2003). The impact of genomics on the study of natural variation inArabidopsis. Plant Physiol 132, 718 725.
Borevitz, J.O. and Chory, J. (2004). Genomics tools for QTL analysis and gene discovery. Curr OpinPlant Biol 7, 132 136.
Brem, R.B., Yvert, G., Clinton, R. and Kruglyak, L. (2002). Genetic dissection of transcriptionalregulation in budding yeast. Science 296, 752 755.
Carlborg, O. and Haley, C.S. (2004). Epistasis: too often neglected in complex trait studies? Nat RevGenet 5, 618 625.
Chen, W.J., Chang, S.H., Hudson, M.E., Kwan, W.K., Li, J., Estes, B., Knoll, D., Shi, L. and Zhu, T.(2005). Contribution of transcriptional regulation to natural variations in Arabidopsis. GenomeBiol 6, R32.
Chevalier, F., Martin, O., Rofidal, V., Devauchelle, A.D., Barteau, S., Sommerer, N. and Rossignol, M.(2004). Proteomic investigation of natural variation between Arabidopsis ecotypes. Proteomics4, 1372 1381.
Consoli, L., Lefevre, A., Zivy, M., de Vienne, D. and Damerval, C. (2002). QTL analysis of proteomeand transcriptome variations for dissecting the genetic architecture of complex traits in maize.Plant Mol Biol 48, 575 581.

Chapter 1
12
DAuria, J.C. and Gershenzon, J. (2005). The secondary metabolism of Arabidopsis thaliana: growing likea weed. Curr Opin Plant Biol 8, 308 316.
de la Fuente, A., Bing, N., Hoeschele, I. and Mendes, P. (2004). Discovery of meaningful associations ingenomic data using partial correlation coefficients. Bioinformatics 20, 3565 3574.
De Vos, R.C., Moco, S., Lommen, A., Keurentjes, J.J.B., Bino, R.J. and Hall, R.D. (2007). Untargetedlarge scale plant metabolomics using liquid chromatography coupled to mass spectrometry.Nat Protoc 2, 778 791.
DeCook, R., Lall, S., Nettleton, D. and Howell, S.H. (2006). Genetic regulation of gene expressionduring shoot development in Arabidopsis. Genetics 172, 1155 1164.
Doerge, R.W. (2002). Mapping and analysis of quantitative trait loci in experimental populations. NatRev Genet 3, 43 52.
Edwards, K.D., Lynn, J.R., Gyula, P., Nagy, F. and Millar, A.J. (2005). Natural allelic variation in thetemperature compensation mechanisms of the Arabidopsis thaliana circadian clock. Genetics170, 387 400.
Eshed, Y. and Zamir, D. (1995). An introgression line population of Lycopersicon pennellii in thecultivated tomato enables the identification and fine mapping of yield associated QTL.Genetics 141, 1147 1162.
Fiehn, O., Kopka, J., Dormann, P., Altmann, T., Trethewey, R.N. and Willmitzer, L. (2000). Metaboliteprofiling for plant functional genomics. Nat Biotechnol 18, 1157 1161.
Fiehn, O., Kloska, S. and Altmann, T. (2001). Integrated studies on plant biology using multiparalleltechniques. Curr Opin Biotechnol 12, 82 86.
Fiehn, O. (2002). Metabolomics the link between genotypes and phenotypes. Plant Mol Biol 48, 155 171.Forster, J., Gombert, A.K. and Nielsen, J. (2002). A functional genomics approach using metabolomics
and in silico pathway analysis. Biotechnol Bioeng 79, 703 712.Fu, J., Swertz, M.A., Keurentjes, J.J.B. and Jansen, R.C. (2007). MetaNetwork: a computational protocol
for the genetic study of metabolic networks. Nat Protoc 2, 685 694.Gachon, C.M., Langlois Meurinne, M., Henry, Y. and Saindrenan, P. (2005). Transcriptional co
regulation of secondary metabolism enzymes in Arabidopsis: functional and evolutionaryimplications. Plant Mol Biol 58, 229 245.
Gibson, G. and Weir, B. (2005). The quantitative genetics of transcription. Trends Genet 21, 616 623.Gilad, Y. and Borevitz, J. (2006). Using DNA microarrays to study natural variation. Curr Opin Genet
Dev 16, 553 558.Han, B. and Xue, Y. (2003). Genome wide intraspecific DNA sequence variations in rice. Curr Opin
Plant Biol 6, 134 138.Hirai, M.Y., Klein, M., Fujikawa, Y., Yano, M., Goodenowe, D.B., Yamazaki, Y., Kanaya, S.,
Nakamura, Y., Kitayama, M., Suzuki, H. et al. (2005). Elucidation of gene to gene andmetabolite to gene networks in Arabidopsis by integration of metabolomics andtranscriptomics. J Biol Chem 280, 25590 25595.
Hitzemann, R., Malmanger, B., Reed, C., Lawler, M., Hitzemann, B., Coulombe, S., Buck, K.,Rademacher, B., Walter, N., Polyakov, Y. et al. (2003). A strategy for the integration of QTL,gene expression, and sequence analyses.Mamm Genome 14, 733 747.
Holland, J.B. (2007). Genetic architecture of complex traits in plants. Curr Opin Plant Biol 10, 156 161.Hu, Z., Killion, P.J. and Iyer, V.R. (2007). Genetic reconstruction of a functional transcriptional
regulatory network. Nat Genet 39, 683 687.Hubner, N., Wallace, C.A., Zimdahl, H., Petretto, E., Schulz, H., Maciver, F., Mueller, M., Hummel,
O., Monti, J., Zidek, V. et al. (2005). Integrated transcriptional profiling and linkage analysisfor identification of genes underlying disease. Nat Genet 37, 243 253.
Jansen, R.C. (1993). Interval mapping of multiple quantitative trait loci. Genetics 135, 205 211.

General introduction
13
Jansen, R.C. and Nap, J.P. (2001). Genetical genomics: the added value from segregation. Trends Genet17, 388 391.
Jansen, R.C. (2003a). Studying complex biological systems using multifactorial perturbation. Nat RevGenet 4, 145 151.
Jansen, R.C. (2003b). Quantitative trait loci in inbred lines. In Handbook of Statistical Genetics, D.J.Balding, M. Bishop and C. Cannings, eds (Chichester, UK: John Wiley & Sons), pp. 445 476.
Jenkins, H., Hardy, N., Beckmann, M., Draper, J., Smith, A.R., Taylor, J., Fiehn, O., Goodacre, R.,Bino, R.J., Hall, R. et al. (2004). A proposed framework for the description of plantmetabolomics experiments and their results. Nat Biotechnol 22, 1601 1606.
Jeong, H., Tombor, B., Albert, R., Oltvai, Z.N. and Barabasi, A.L. (2000). The large scale organizationof metabolic networks. Nature 407, 651 654.
Joosen, R., Cordewener, J., Supena, E.D., Vorst, O., Lammers, M., Maliepaard, C., Zeilmaker, T.,Miki, B., America, T., Custers, J. et al. (2007). Combined transcriptome and proteomeanalysis identifies pathways and markers associated with the establishment of Brassica napusmicrospore derived embryo development. Plant Physiol 144, 155 172.
Juenger, T.E., McKay, J.K., Hausmann, N., Keurentjes, J.J.B., Sen, S., Stowe, K.A., Dawson, T.E.,Simms, E.L. and Richards, J.H. (2005). Identification and characterization of QTL underlyingwhole plant physiology in Arabidopsis thaliana: delta13C, stomatal conductance andtranspiration efficiency. Plant Cell Environ 28, 697 708.
Kearsey, M.J., Pooni, H.S. and Syed, N.H. (2003). Genetics of quantitative traits in Arabidopsis thaliana.Heredity 91, 456 464.
Keurentjes, J.J.B., Fu, J., Terpstra, I.R., Garcia, J.M., van den Ackerveken, G., Snoek, L.B., Peeters,A.J., Vreugdenhil, D., Koornneef, M. and Jansen, R.C. (2007). Regulatory networkconstruction in Arabidopsis by using genome wide gene expression quantitative trait loci.Proc Natl Acad Sci U S A 104, 1708 1713.
Kim, S., Zhao, K., Jiang, R., Molitor, J., Borevitz, J.O., Nordborg, M. and Marjoram, P. (2006).Association mapping with single feature polymorphisms. Genetics 173, 1125 1133.
Kliebenstein, D.J., Kroymann, J., Brown, P., Figuth, A., Pedersen, D., Gershenzon, J. and MitchellOlds, T. (2001). Genetic control of natural variation in Arabidopsis glucosinolateaccumulation. Plant Physiol 126, 811 825.
Kliebenstein, D.J., West, M.A., van Leeuwen, H., Kim, K., Doerge, R.W., Michelmore, R.W. and StClair, D.A. (2006a). Genomic survey of gene expression diversity in Arabidopsis thaliana.Genetics 172, 1179 1189.
Kliebenstein, D.J., West, M.A., van Leeuwen, H., Loudet, O., Doerge, R.W. and St Clair, D.A. (2006b).Identification of QTLs controlling gene expression networks defined a priori. BMCBioinformatics 7, 308.
Koornneef, M., Alonso Blanco, C. and Vreugdenhil, D. (2004). Naturally occurring genetic variation inArabidopsis Thaliana. Annu Rev Plant Physiol Plant Mol Biol 55, 141 172.
Kroymann, J. and Mitchell Olds, T. (2005). Epistasis and balanced polymorphism influencing complextrait variation. Nature 435, 95 98.
Lan, H., Chen, M., Flowers, J.B., Yandell, B.S., Stapleton, D.S., Mata, C.M., Mui, E.T., Flowers, M.T.,Schueler, K.L., Manly, K.F. et al. (2006). Combined expression trait correlations andexpression quantitative trait locus mapping. PLoS Genet 2, e6.
Lee, T.I., Rinaldi, N.J., Robert, F., Odom, D.T., Bar Joseph, Z., Gerber, G.K., Hannett, N.M., Harbison,C.T., Thompson, C.M., Simon, I. et al. (2002). Transcriptional regulatory networks inSaccharomyces cerevisiae. Science 298, 799 804.

Chapter 1
14
Li, H., Lu, L., Manly, K.F., Chesler, E.J., Bao, L., Wang, J., Zhou, M., Williams, R.W. and Cui, Y. (2005).Inferring gene transcriptional modulatory relations: a genetical genomics approach. Hum MolGenet 14, 1119 1125.
Lisec, J., Schauer, N., Kopka, J., Willmitzer, L. and Fernie, A.R. (2006). Gas chromatography massspectrometry based metabolite profiling in plants. Nat Protoc 1, 387 396.
Maloof, J.N. (2003). Genomic approaches to analyzing natural variation in Arabidopsis thaliana. CurrOpin Genet Dev 13, 576 582.
Meinke, D.W., Meinke, L.K., Showalter, T.C., Schissel, A.M., Mueller, L.A. and Tzafrir, I. (2003). Asequence based map of Arabidopsis genes with mutant phenotypes. Plant Physiol 131, 409418.
Mitchell Olds, T. and Schmitt, J. (2006). Genetic mechanisms and evolutionary significance of naturalvariation in Arabidopsis. Nature 441, 947 952.
Moco, S., Bino, R.J., Vorst, O., Verhoeven, H.A., de Groot, J., van Beek, T.A., Vervoort, J. and de Vos,C.H. (2006). A liquid chromatography mass spectrometry based metabolome database fortomato. Plant Physiol 141, 1205 1218.
Nordborg, M., Borevitz, J.O., Bergelson, J., Berry, C.C., Chory, J., Hagenblad, J., Kreitman, M.,Maloof, J.N., Noyes, T., Oefner, P.J. et al. (2002). The extent of linkage disequilibrium inArabidopsis thaliana. Nat Genet 30, 190 193.
Nordborg, M., Hu, T.T., Ishino, Y., Jhaveri, J., Toomajian, C., Zheng, H., Bakker, E., Calabrese, P.,Gladstone, J., Goyal, R. et al. (2005). The pattern of polymorphism in Arabidopsis thaliana.PLoS Biol 3, e196.
Palaniswamy, S.K., James, S., Sun, H., Lamb, R.S., Davuluri, R.V. and Grotewold, E. (2006). AGRISand AtRegNet. a platform to link cis regulatory elements and transcription factors intoregulatory networks. Plant Physiol 140, 818 829.
Paran, I. and Zamir, D. (2003). Quantitative traits in plants: beyond the QTL. Trends Genet 19, 303 306.Peck, S.C. (2005). Update on proteomics in Arabidopsis. Where do we go from here? Plant Physiol 138,
591 599.Price, A.H. (2006). Believe it or not, QTLs are accurate! Trends Plant Sci 11, 213 216.Rae, A.M., Howell, E.C. and Kearsey, M.J. (1999). More QTL for flowering time revealed by
substitution lines in Brassica oleracea. Heredity 83 (Pt 5), 586 596.Remington, D.L., Thornsberry, J.M., Matsuoka, Y., Wilson, L.M., Whitt, S.R., Doebley, J., Kresovich,
S., Goodman, M.M. and Buckler, E.S.t. (2001). Structure of linkage disequilibrium andphenotypic associations in the maize genome. Proc Natl Acad Sci U S A 98, 11479 11484.
Rockman, M.V. and Kruglyak, L. (2006). Genetics of global gene expression. Nat Rev Genet 7, 862 872.Ronald, J., Brem, R.B., Whittle, J. and Kruglyak, L. (2005). Local regulatory variation in Saccharomyces
cerevisiae. PLoS Genet 1, e25.Ross Ibarra, J. (2005). Quantitative trait loci and the study of plant domestication. Genetica 123, 197 204.Schadt, E.E., Monks, S.A., Drake, T.A., Lusis, A.J., Che, N., Colinayo, V., Ruff, T.G., Milligan, S.B.,
Lamb, J.R., Cavet, G. et al. (2003). Genetics of gene expression surveyed in maize, mouse andman. Nature 422, 297 302.
Schauer, N., Steinhauser, D., Strelkov, S., Schomburg, D., Allison, G., Moritz, T., Lundgren, K.,Roessner Tunali, U., Forbes, M.G., Willmitzer, L. et al. (2005). GC MS libraries for the rapididentification of metabolites in complex biological samples. FEBS Lett 579, 1332 1337.
Schauer, N., Semel, Y., Roessner, U., Gur, A., Balbo, I., Carrari, F., Pleban, T., Perez Melis, A.,Bruedigam, C., Kopka, J. et al. (2006). Comprehensive metabolic profiling and phenotypingof interspecific introgression lines for tomato improvement. Nat Biotechnol 24, 447 454.

General introduction
15
Schmid, K.J., Sorensen, T.R., Stracke, R., Torjek, O., Altmann, T., Mitchell Olds, T. and Weisshaar, B.(2003). Large Scale identification and analysis of genome wide single nucleotidepolymorphisms for mapping in Arabidopsis thaliana. Genome Res 13, 1250 1257.
Schmid, K.J., Torjek, O., Meyer, R., Schmuths, H., Hoffmann, M.H. and Altmann, T. (2006). Evidencefor a large scale population structure of Arabidopsis thaliana from genome wide singlenucleotide polymorphism markers. Theor Appl Genet 112, 1104 1114.
Segal, E., Yelensky, R. and Koller, D. (2003). Genome wide discovery of transcriptional modules fromDNA sequence and gene expression. Bioinformatics 19 Suppl 1, i273 282.
Semel, Y., Nissenbaum, J., Menda, N., Zinder, M., Krieger, U., Issman, N., Pleban, T., Lippman, Z.,Gur, A. and Zamir, D. (2006). Overdominant quantitative trait loci for yield and fitness intomato. Proc Natl Acad Sci U S A 103, 12981 12986.
Slate, J. (2005). Quantitative trait locus mapping in natural populations: progress, caveats and futuredirections.Mol Ecol 14, 363 379.
Somerville, C. and Koornneef, M. (2002). Timeline: A fortunate choice: the history of Arabidopsis as amodel plant. Nat Rev Genet 3, 883 889.
Steuer, R., Kurths, J., Fiehn, O. and Weckwerth, W. (2003). Observing and interpreting correlations inmetabolomic networks. Bioinformatics 19, 1019 1026.
Stuart, J.M., Segal, E., Koller, D. and Kim, S.K. (2003). A gene coexpression network for globaldiscovery of conserved genetic modules. Science 302, 249 255.
Swarup, K., Alonso Blanco, C., Lynn, J.R., Michaels, S.D., Amasino, R.M., Koornneef, M. and Millar,A.J. (1999). Natural allelic variation identifies new genes in the Arabidopsis circadian system.Plant J 20, 67 77.
Teng, S., Keurentjes, J.J.B., Bentsink, L., Koornneef, M. and Smeekens, S. (2005). Sucrose specificinduction of anthocyanin biosynthesis in Arabidopsis requires the MYB75/PAP1 gene. PlantPhysiol 139, 1840 1852.
The Arabidopsis Genome Initiative (2000). Analysis of the genome sequence of the flowering plantArabidopsis thaliana. Nature 408, 796 815.
Tong, A.H., Lesage, G., Bader, G.D., Ding, H., Xu, H., Xin, X., Young, J., Berriz, G.F., Brost, R.L.,Chang, M. et al. (2004). Global mapping of the yeast genetic interaction network. Science 303,808 813.
Tonsor, S.J., Alonso Blanco, C. and Koornneef, M. (2005). Gene function beyond the single trait:natural variation, gene effects, and evolutionary ecology in Arabidopsis thaliana. Plant CellEnviron 28, 2 20.
Urbanczyk Wochniak, E., Luedemann, A., Kopka, J., Selbig, J., Roessner Tunali, U., Willmitzer, L.and Fernie, A.R. (2003). Parallel analysis of transcript and metabolic profiles: a new approachin systems biology. EMBO Rep 4, 989 993.
Vigouroux, Y., Mitchell, S., Matsuoka, Y., Hamblin, M., Kresovich, S., Smith, J.S., Jaqueth, J., Smith,O.S. and Doebley, J. (2005). An analysis of genetic diversity across the maize genome usingmicrosatellites. Genetics 169, 1617 1630.
Vuylsteke, M., van Eeuwijk, F., Van Hummelen, P., Kuiper, M. and Zabeau, M. (2005). Geneticanalysis of variation in gene expression in Arabidopsis thaliana. Genetics 171, 1267 1275.
Vuylsteke, M., Daele, H., Vercauteren, A., Zabeau, M. and Kuiper, M. (2006). Genetic dissection oftranscriptional regulation by cDNA AFLP. Plant J 45, 439 446.
Ward, J.L., Harris, C., Lewis, J. and Beale, M.H. (2003). Assessment of 1H NMR spectroscopy andmultivariate analysis as a technique for metabolite fingerprinting of Arabidopsis thaliana.Phytochemistry 62, 949 957.
Ward, J.L., Baker, J.M. and Beale, M.H. (2007). Recent applications of NMR spectroscopy in plantmetabolomics. Febs J 274, 1126 1131.

Chapter 1
16
Weigel, D. and Nordborg, M. (2005). Natural variation in Arabidopsis. How do we find the causalgenes? Plant Physiol 138, 567 568.
West, M.A., van Leeuwen, H., Kozik, A., Kliebenstein, D.J., Doerge, R.W., St Clair, D.A. andMichelmore, R.W. (2006). High density haplotyping with microarray based expression andsingle feature polymorphism markers in Arabidopsis. Genome Res 16, 787 795.
West, M.A., Kim, K., Kliebenstein, D.J., van Leeuwen, H., Michelmore, R.W., Doerge, R.W. and StClair, D.A. (2007). Global eQTL mapping reveals the complex genetic architecture oftranscript level variation in Arabidopsis. Genetics 175, 1441 1450.
Winnacker, E.L. (2003). Interdisciplinary sciences in the 21st century. Curr Opin Biotechnol 14, 328 331.Yoon, D.B., Kang, K.H., Kim, H.J., Ju, H.G., Kwon, S.J., Suh, J.P., Jeong, O.Y. and Ahn, S.N. (2006).
Mapping quantitative trait loci for yield components and morphological traits in an advancedbackcross population between Oryza grandiglumis and the O. sativa japonica cultivarHwaseongbyeo. Theor Appl Genet 112, 1052 1062.
Zhang, X., Richards, E.J. and Borevitz, J.O. (2007). Genetic and epigenetic dissection of cis regulatoryvariation. Curr Opin Plant Biol 10, 142 148.
Zhao, J., Becker, H.C., Zhang, D., Zhang, Y. and Ecke, W. (2006). Conditional QTL mapping of oilcontent in rapeseed with respect to protein content and traits related to plant developmentand grain yield. Theor Appl Genet 113, 33 38.
Zhu, J., Lum, P.Y., Lamb, J., GuhaThakurta, D., Edwards, S.W., Thieringer, R., Berger, J.P., Wu, M.S.,Thompson, J., Sachs, A.B. et al. (2004). An integrative genomics approach to thereconstruction of gene networks in segregating populations. Cytogenet Genome Res 105, 363374.

17
Chapter 2
Development of a Near Isogenic Line population ofArabidopsis thaliana and comparison of mapping power
with a Recombinant Inbred Line population
Joost J. B. Keurentjes, Leónie Bentsink, Carlos Alonso Blanco, Corrie J. Hanhart,Hetty Blankestijn De Vries, Sigi Effgen, Dick Vreugdenhil and Maarten Koornneef
Published in Genetics (2007) 175, 891 905.
ABSTRACT
In Arabidopsis Recombinant Inbred Line (RIL) populations are widely used forQuantitative Trait Locus (QTL) analyses. However, mapping analyses with thistype of populations can be limited because of masking effects of major QTLs andepistatic interactions of multiple QTLs. An alternative type of immortalexperimental population commonly used in plant species are sets of introgressionlines. Here we introduce the development of a genome wide coverage NearIsogenic Line (NIL) population of Arabidopsis thaliana, by introgressing genomicregions from the Cape Verde Islands (Cvi) accession into the Landsberg erecta (Ler)genetic background. We have empirically compared the QTL mapping power ofthis new population with an already existing RIL population derived from thesame parents. For that, we analyzed and mapped QTLs affecting sixdevelopmental traits with different heritability. Overall, in the NIL populationsmaller effect QTLs than in the RIL population could be detected although thelocalization resolution was lower. Furthermore, we estimated the effect ofpopulation size and of the number of replicates on the detection power of QTLsaffecting the developmental traits. In general, population size is more importantthan the number of replicates to increase the mapping power of RILs, whereas forNILs, several replicates are absolutely required. These analyses are expected tofacilitate experimental design for QTL mapping using these two common types ofsegregating populations.

Chapter 2
18
INTRODUCTION
Quantitative traits are characterized by continuous variation. The establishment ofthe genetic basis of quantitative traits is commonly referred to as Quantitative TraitLocus (QTL) mapping, and has been hampered due to their multigenic inheritanceand the often strong interaction with the environment. The principle of QTLmapping in segregating populations is based on the genotyping of progenyderived from a cross of distinct genotypes for the trait under study. Phenotypicvalues for the quantitative trait are then compared with the molecular markergenotypes of the progeny to search for particular genomic regions showingstatistical significant associations with the trait variation, which are then calledQTLs (Broman, 2001; Slate, 2005). Over the past few decades, the field hasbenefited enormously from the progress made in molecular marker technology.The ease by which such markers can be developed has enabled the generation ofdense genetic maps and the performance of QTL mapping studies of the mostcomplex traits (Borevitz and Nordborg, 2003).
QTL analyses make use of the natural variation present within species(Alonso Blanco and Koornneef, 2000; Maloof, 2003) and have been successfullyapplied to various types of segregating populations. In plants, the use of‘immortal’ mapping populations consisting of homozygous individuals ispreferred because it allows performing replications and multiple analyses of thesame population. Homozygous populations can be obtained by repeated selfing,like for Recombinant Inbred Lines (RILs), but also by induced chromosomaldoubling of haploids, such as for Doubled Haploids (DHs) (Han et al., 1997; Rae etal., 1999; von Korff et al., 2004). Depending on the species one can in principle alsoobtain immortality by vegetative propagation, although this is often morelaborious. RILs are advantageous over DHs because of their higher recombinationfrequency in the population, resulting from multiple meiotic events occurredduring repeated selfing (Jansen, 2003).
Another type of immortal population consists of Introgression Lines (ILs)(Eshed and Zamir, 1995), which are obtained through repeated backcrossing andextensive genotyping. These are also referred to as Near Isogenic Lines (NILs)(Monforte and Tanksley, 2000) or Backcross Inbred Lines (BILs) (Jeuken andLindhout, 2004; Blanco et al., 2006). Such populations consist of lines containing asingle or a small number of genomic introgression fragments from a donor parentinto an otherwise homogeneous genetic background. Although no essentialdifferences exist between these populations, we use the term Near Isogenic Linesfor the materials described here. A special case of ILs are Chromosomal

Development of a Near Isogenic Line population
19
Substitution Strains (CSSs) (Nadeau et al., 2000; Koumproglou et al., 2002), wherethe introgressions span complete chromosomes. All immortal populations exceptthose which can only be propagated vegetatively, share the advantage that theycan easily be maintained through seeds, which allows the analysis of differentenvironmental influences and the study of multiple, even invasive or destructive,traits. Statistical power of such analyses is increased because replicatemeasurements of genetically identical individuals can be done.
In plants, RILs and NILs are the most common types of experimentalpopulations used for the analysis of quantitative traits. In both cases the accuracyof QTL localization, referred to as mapping resolution, depends on population size.For RILs, recombination frequency within existing lines is fixed and can thereforeonly be increased within the population by adding more lines (i.e. moreindependent recombination events). Alternatively, recombination frequency can beincreased by intercrossing lines before fixation as homozygous lines by inbreeding(Zou et al., 2005). In NIL populations resolution can be improved by minimizingthe introgression size of each NIL. Consequently, to maintain genome widecoverage a larger number of lines are needed. Despite the similarities betweenthese two types of mapping populations, large differences exist in the geneticmakeup of the respective individuals and the resulting mapping approach. Ingeneral, recombination frequency in RIL populations is higher than in equallysized NIL populations, which allows the analysis of less individuals. Each RILcontains several introgression fragments and, on average, each genomic region isrepresented by an equal number of both parental genotypes in the population.Therefore, replication of individual lines is often not necessary because the effect ofeach genomic region on phenotypic traits is tested by comparing the two genotypicRIL classes (each comprising approximately half the number of lines in thepopulation). In addition, the multiple introgressions per RIL allow detection ofgenetic interactions between loci (epistasis). However, epistasis together withunequal recombination frequencies throughout the genome and segregationdistortions caused by lethality or reduced fitness of particular genotypes may biasthe power to detect QTLs. Furthermore, the wide variation of morphological anddevelopmental traits present in most RIL populations may hamper the analysis oftraits requiring the same growth and developmental stage of the individual lines.When many traits segregate simultaneously, this often affects the expression ofother traits due to genetic interactions. Moreover, large effect QTLs may mask thedetection of QTLs with a small additive effect.
In contrast to RILs, NILs preferably contain only a single introgression perline, which increases the power to detect small effect QTLs. However, the presenceof a single introgression segment does not allow testing for genetic interactions and
Chapter 2
20
thereby the detection of QTLs expressed in specific genetic backgrounds (epistasis).In addition, because most of the genetic background is identical for all lines, NILsshow more limited developmental and growth variation, increasing thehomogeneity of growth stage within experiments. Nevertheless, lethality andsterility might sometimes hinder the obtaining of specific single introgression lines.
The choice of one mapping population over another depends on the plantspecies and the specific parents of interest. In cases where different cultivars orwild accessions are studied preference is often given to RILs. However, whendifferent species or when wild and cultivated germplasm are combined NILs arepreferred (Eshed and Zamir, 1995; Jeuken and Lindhout, 2004; von Korff et al.,2004; Blair et al., 2006; Yoon et al., 2006). For instance, in tomato the high sterility inthe offspring of crosses between cultivated and wild species made the use of NILpopulations preferable because genome wide coverage cannot be obtained withRIL populations due to sterility etc. (Eshed and Zamir, 1995). Furthermore, theanalysis of agronomical important traits (such as fruit characters) cannot beperformed when many genes conferring reduced fertility segregate. InArabidopsis, the easiness to generate fertile RIL populations with completegenome coverage, due to its fast generation time, has led to their extensive use inmapping quantitative traits.
NILs have been developed in various studies using Arabidopsis to confirmand fine map QTLs previously identified in RILs (Alonso Blanco et al., 1998a, 2003;Swarup et al., 1999; Bentsink et al., 2003; Edwards et al., 2005; Juenger et al., 2005a;Teng et al., 2005) for which also Heterogeneous Inbred Families (HIFs) (Tuinstra etal., 1997) have been used (Loudet et al., 2005; Reymond et al., 2006). A set ofchromosomal substitutions of the Landsberg erecta (Ler) accession into Columbia(Col) has been developed to serve as starting material for making smallerintrogressions (Koumproglou et al., 2002). In mice CSSs are widely used formapping purposes and have proven to be a valuable complement to otherpopulation types (Stylianou et al., 2006). However, no genome wide set of NIls thatallows mapping to subparts of the chromosome has been described in Arabidopsisand, to our knowledge, no empirical comparative study has been performedbetween the two population types within a single species.
In this study we aim to compare a RIL population with a NIL populationin terms of QTL detection power and localization resolution. For that, wegenerated a new genome wide population of NILs using the same Ler and Cviparental accessions as used earlier to generate a RIL population (Alonso Blanco etal., 1998b). The two experimental populations were grown simultaneously in thesame experimental setup, including multiple replicates. QTL mapping analyses
Development of a Near Isogenic Line population
21
were performed on six different traits and the results of these analyses werecompared in both populations.
RESULTS
Construction of a genome wide Near Isogenic Line populationWe constructed a population of 92 introgression lines carrying between one andfour Cvi introgression fragments in a Ler genetic background. Lines weregenotyped using 349 AFLP and 95 PCR markers to determine the number, positionand size of the introgressions (see Materials and Methods). This set of lines wasselected to provide together an almost complete genome wide coverage (Figure 1).Forty lines contained a single introgression while 52 lines carried several Cvifragments. From those, 32, 19, and 1 line bore two, three and four introgressionsrespectively. The genetic length of the introgression fragments was estimated usingthe map positions of the introgressed markers in the genetic map constructed fromthe existing RIL population derived from the same Ler and Cvi parental accessions(Alonso Blanco et al., 1998b). The average genetic size of the main, second, third,and fourth introgression fragment was 31.7, 11.1, 6.7, and 5.2 cM respectively.Thus, lines with multiple Cvi fragments carried a main large introgression andseveral much smaller Cvi fragments. Additionally, we selected a core set of 25 linesthat together covered more then 90% of the genome (supplemental Table 1 athttp://www.genetics.org/supplemental/).
Genetic analyses of developmental traitsSix traits were measured and analyzed in the RIL and NIL populations (Table 1).Although plants were grown in four replicated blocks, block effects were negligibleand was therefore not used as a factor in subsequent analyses. In both populations,among genotype variance was highly significant (P < 0.0001) for all traits. In theRIL population, broad sense heritability estimates ranged from 0.34 (basal branchnumber) to 0.92 (total plant length) (Table 1). Statistical parameters of most traitswere similar to those described by Alonso Blanco et al. (1998a, 1999) and Juenger etal. (2005b). However, Ungerer et al. (2002) reported much lower average values forplant height and branch number although time to flower was similar. Moreover,among genotype variance estimates were lower and within genotype varianceestimates higher resulting in lower heritability values compared to our analyses.

Chapter 2
22

Development of a Near Isogenic Line population
23
Figure 1: Graphical genotype of the Ler x Cvi NIL population.Bars represent introgressions. Solid bars represent the genetic position of Cvi introgressions inindividual NILs. Shaded bars represent crossover regions between markers used for the genotyping ofthe lines. Numbers at the top indicate the five linkage groups.
Table 1: Descriptive statistics for six developmental traits analyzed in two mapping populations andtheir parents.Trait SDX [VG]a [VE]b [H2]c [CVG]d
ParentsFT (days) 24.30 (1.03)e 8.74 3.57 0.71 10.85
30.21 (2.47)f
SL (cm) 9.58 (0.98)e 3.27 3.14 0.51 15.8713.21 (2.30)f
TL (cm) 23.59 (1.92)e 26.81 10.53 0.72 17.9933.95 (4.17)f
IB 2.21 (0.46)e 0.02 0.33 0.05 5.532.49 (0.67)f
BB 1.54 (0.68)e 0.00 0.65 0.00 0.001.48 (0.91)f
TB 3.75 (0.77)e 0.01 0.82 0.01 1.883.97 (1.02)f
RIL populationFT (days) 26.06 (6.03) 32.59 3.82 0.90 21.91SL (cm) 9.89 (3.39) 9.70 1.80 0.83 31.49TL (cm) 26.13 (9.22) 78.53 6.52 0.92 33.91IB 2.34 (1.22) 0.99 0.50 0.67 42.66BB 1.43 (0.93) 0.30 0.57 0.34 37.98TB 3.77 (1.27) 0.78 0.84 0.48 23.36
NIL populationFT (days) 23.68 (3.60) 10.78 2.21 0.83 13.87SL (cm) 9.81 (2.18) 3.17 1.58 0.65 18.15TL (cm) 24.50 (5.95) 31.24 4.10 0.87 22.82IB 2.26 (0.88) 0.51 0.27 0.65 31.42BB 1.56 (0.84) 0.18 0.53 0.24 26.92TB 3.82 (1.06) 0.48 0.64 0.42 18.25FT, flowering time; SL, length at first silique; TL, total plant length; IB, main inflorescence branchnumber; BB, basal branch number; TB, total branch number. a Among genotype variance componentfrom ANOVA; tests whether genetic differences exist among genotypes for specified traits (P < 0.0001).b Residual variance component from ANOVA. c Measure of total phenotypic variance attributable togenetic differences among genotypes (broad sense heritability) calculated as VG/(VG+VE). d Coefficient of
genetic variation calculated as XVG100 . e Landsberg erecta parent. f Cape Verde Islands parent.

Chapter 2
24
For the NIL population, mean trait values were closer to those measuredfor Ler due to the genetic structure of the population, consisting of lines carryingonly small Cvi introgressions in a Ler background. Furthermore, variancecomponents from ANOVA were lower in the NIL population but heritabilityestimates differed only slightly compared to the RIL population (Table 1).
Strong and similar genetic correlations were observed between traits in thetwo Ler x Cvi populations indicating partial genetic co regulation (Table 2).Flowering time shows the highest correlation with the number of maininflorescence branches but is negatively correlated with basal branch number.Flowering time is also, but to a lesser degree, correlated with plant height.Correlations were also found between plant height and branching, with againpositive values with the number of main inflorescence branches and negativecorrelations with basal branch number. These results contrasted with those fromUngerer et al. (2002), who found negative correlations between flowering time,plant height and branching in all pair wise comparisons, which is probably due tothe different environmental set up in the two laboratories.
Table 2: Genetic correlations among developmental traits analyzed in two mapping populations.Trait FT SL TL IB BB TBFT 0.63* 0.38* 0.97* 0.49* 0.80*SL 0.39* 0.90* 0.52* 0.39* 0.35*
TL 0.21* 0.88* 0.18* 0.32* 0.00IB 0.91* 0.31* 0.09* 0.54* 0.95*
BB 0.26* 0.28* 0.26* 0.35* 0.12*
TB 0.77* 0.15* 0.07 0.85* 0.31*
The top right and the bottom left halves of the table represent values calculated for the RIL and the NILpopulations respectively. FT, flowering time; SL, length at first silique; TL, total plant length; IB, maininflorescence branch number; BB, basal branch number; TB, total branch number. * Significant at P <0.001.
Mapping quantitative traits in the Ler x Cvi RIL populationEach trait was subjected to QTL analysis and three to eight QTLs were detected foreach trait (Figure 2, Table 3). Major QTLs for flowering time, plant height andbranching were in concordance with previously reported studies (Alonso Blanco etal., 1998a, 1999; Ungerer et al., 2002, 2003; Juenger et al., 2005b), although slightdifferences for minor QTLs were also found. Total explained variance for each traitranged from 38.5% for basal branch number to 86.3% for total plant height. LODscores for the largest effect QTL ranged from 5.7 for basal branch number up to60.7 for total plant height with corresponding explained variances of 11.0 and64.0% respectively. The average genetic length of 2 LOD support intervals was 11.6cM, ranging from 2.3 (length at first silique) to 33.3 cM (total branch number).

Development of a Near Isogenic Line population
25
Table 3: QTLs detected in the RIL population.
Trait ChraLODscore
supportintervalb (cM)
ExplainedVariancec (%) Effectd
Total ExplainedVariancee (%)
Interactionf
(%)FT 1 11.9 1.5 9.8* 13.0 3.9 68.4 9.6
5 18.9 388.4 394.5* 22.2 5.75 11.9 408.2 413.7* 13.0 4.4
SL 1 9.3 0.0 9.3 6.3 1.7 79.5 15.01 4.8 103.1 126.0 3.1 1.32 39.7 173.2 175.5 43.2 4.53 2.9 234.2 253.6 1.9 1.03 5.0 281.5 287.8 3.2 1.25 15.7 387.9 392.4* 11.8 2.95 10.2 403.6 409.7* 7.2 2.0
TL 1 6.5 0.0 9.8* 2.8 3.1 86.3 11.51 5.0 73.9 84.6 2.1 2.71 3.3 116.3 126.0 1.2 2.32 60.7 173.2 176.0* 64.0 14.83 6.0 207.3 225.7* 2.6 3.04 5.2 287.8 307.5* 2.2 2.75 7.8 383.1 392.5* 3.6 4.15 5.1 403.6 411.7 2.2 3.0
IB 1 5.0 0.0 13.5* 5.3 0.4 65.0 20.52 2.7 154.9 171.0* 2.8 0.35 15.3 387.0 391.9* 19.7 0.95 10.4 398.8 411.7* 12.3 0.75 3.1 472.2 485.3 3.2 0.3
BB 1 5.7 72.4 91.0* 11.0 0.4 38.5 3.12 3.2 167.0 200.2* 6.2 0.34 4.6 360.7 373.5* 9.1 0.45 5.5 385.6 406.1* 11.3 0.5
TB 1 15.5 5.3 12.4* 16.1 0.8 71.1 16.21 4.9 81.7 93.8* 4.6 0.42 9.5 169.0 180.0* 9.1 0.65 9.7 386.5 392.4* 9.4 0.65 10.9 403.3 412.2* 10.8 0.75 5.2 472.2 485.3 4.7 0.4
FT, flowering time; SL, length at first silique; TL, total plant length; IB, main inflorescence branchnumber; BB, basal branch number; TB, total branch number. a Chromosome number. b 2 LOD supportinterval. c Percentage of total variation explained by individual QTLs. d Effect of QTLs calculated as B
A, where A and B are RILs carrying Ler and Cvi genotypes at the QTL positions, respectively. B andA were estimated by MapQTL®. Effects are given in days (flowering time), centimeters (length at first
silique and total length) or numbers (elongated axils, basal branch number and total branch number). ePercentage of total variance explained by genetic factors estimated by MapQTL®. f Percentage of totalvariation explained by interaction between individual QTLs. * QTLs showing significant epistaticinteractions (P < 0.05) and used to estimate the percentage of explained variance by genetic interactions.

Chapter 2
26

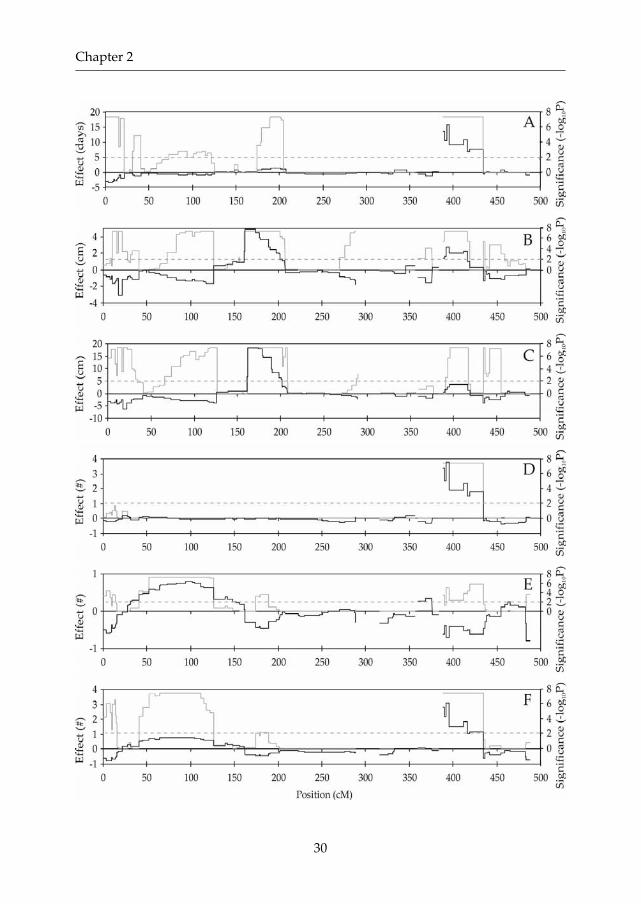
Development of a Near Isogenic Line population
27
Figure 2: Genome wide QTL profiles of traits analyzed in the RIL population.(A) Flowering time, (B) Length at first silique, (C) Total plant length, (D) Number of main inflorescencebranches, (E) Basal branch number and (F) Total branch number. Solid lines represent the QTL effectcalculated as described in Materials and Methods. Shaded lines represent LOD scores. Shaded dashedlines represent genome wide significance threshold levels for LOD scores determined by permutationtesting.
Opposing effect QTLs were found for all traits, explaining the observedtransgressive segregation within the population (data not shown). Geneticinteraction among the detected QTLs was also tested. The proportion of varianceexplained by epistatic interactions ranged from 3.1 (basal branch number) to 20.5%(number of main inflorescence branches) and involved two to five of the detectedQTLs (Table 3). Using a complete pairwise search of all markers (Chase et al., 1997),a number of additional interactions were detected between loci not co locatingwith major QTL positions (supplemental Figure 1 at http://www.genetics.org/supplemental/).
The smallest significant absolute effect detected was 4.4 days for floweringtime, 1.0 and 2.3 cm for length at first silique and total plant length, respectively,and 0.3, 0.3, and 0.4 for the number of main inflorescence branches, basal branchnumber and total branch number, respectively. Relative effects, expressed as thefold difference between genotypes, calculated as (| B A|+ A)/ A, then equaled1.15 , 1.09 , 1.09 , 1.13 , 1.59 , and 1.10 fold, respectively (Tables 3 and 5). Asexpected, the total explained variance of a trait correlated positively with thesmallest significantly detectable effect for that particular trait. In general, smallereffects could be detected with increasing total explained variance. When thechromosome wide threshold for significance was used instead of the genome widethreshold, one additional suggestive QTL was detected for main inflorescencebranch number and total branch number and two for length at first silique.
Mapping quantitative traits in the Ler x Cvi NIL populationTo search for QTLs in the NIL population, we divided the Arabidopsis genetic mapin adjacent genomic fragments that were individually tested. The complete genomewas subdivided into 97 regions, defined by the position of the recombinationevents of the main introgressions of the 92 NILs (supplemental Table 2 athttp://www.genetics.org/supplemental/). These regions are referred to as bins andeach NIL was then assigned to those adjacent bins spanned by its Cvi introgressionfragment. Thus, each bin contains a unique subset of lines with overlapping Cviintrogressions in that particular region, which were used to test the phenotypiceffects of that bin. The average genetic length of the bins was 5.0 cM, ranging from0.1 to 26.3 cM. The number of NILs per bin ranged from 0 to 13 with an average of

Chapter 2
28
5.1 NILs. Because NILs were only assigned to bins when the complete bin wascovered by the introgression, three bins remained empty [viz. bins 66 (26.3 cM), 73(3.3 cM) and 77 (5.4 cM)]. On average each NIL was assigned to 5.4 adjacent bins.One NIL (LCN4 2) was not assigned to any bin because its introgression includedonly a single marker. Two NILs corresponded to complete chromosomalsubstitutions: line LCN3 8 (chromosome 3) and line LCN1 8 (chromosome 1), thelatter carrying the largest introgression assigned to 27 adjacent bins.
To map QTLs in the NIL population, all bins were tested individually bycomparing the phenotypes of the NILs assigned to each bin with that of Ler. Asshown in Figure 3 and Table 4, one to nine QTLs were detected for each trait. Thetotal explained variance for each trait ranged from 26.7% for basal branch numberup to 87.7% for total plant height. Explained variances for the largest effect QTL foreach trait ranged from 19.3% for basal branch number to 91.9% for total plantheight as calculated from a restricted ANOVA using only lines from the mostsignificant bin and Ler. To show the relative effect of Mendelizing QTLs withrespect to the total population variance we calculated the explained variances alsowhen all lines of the population were subjected to ANOVA analysis using the mostsignificant bin as fixed factor (Table 4). Relative effects of QTLs were much lowerin this unrestricted analysis because all other QTLs in the population increaseresidual variation which is not corrected for, as is done in MQM mapping in theRIL population. Moreover, lines partly overlapping the QTL bin are not assignedto that bin but can still contain the QTL Cvi allele, further increasing the residualvariation in the population.
The smallest significant QTL effect detected was 0.7 days for floweringtime, 1.1 and 2.1 cm for length at first silique and total plant length, respectively,and 3.8, 0.5, and 0.4 for the number of main inflorescence branches, basal branchnumber and total branch number, respectively. Relative effects, expressed as thefold difference between genotypes, calculated as (| B A|+ A)/ A, then equaled1.03 , 1.11 , 1.09 , 2.71 , 1.30 , and 1.11 fold, respectively (Tables 4 and 5).
For a number of traits several QTLs were found that could not besignificantly detected in the RIL population. In total 12 of such small effect QTLswere detected for flowering time (3), length at first silique (5), total plant length (2),and basal branch number (2). None of those met the lower chromosome widesignificance threshold for suggestive QTLs in the RIL population. Although twowere close to this threshold, ten of them did not reach LOD scores >1.0 in the RILpopulation (supplemental Table 3 at http://www.genetics.org/supplemental/).

Development of a Near Isogenic Line population
29
Table 4: QTLs detected in the NIL population.Explained Variance (%)
Trait ChraSupportintervalb
Supportbin (cM)c Restrictedd Unrestrictede Effectf
Total ExplainedVarianceg (%)
FT 1 0.0 21.6 3.9 7.8 70.3 3.2 3.2 83.21 31.4 40.6 33.4 40.7 18.0 0.5 1.01 73.3 122.0 83.6 – 87.0 7.1 0.7 0.72 174.4 204.7 200.9 201.8 22.3 0.6 1.55 388.4 434.2 392.3 395.0 52.1 42.8 15.7
SL 1 10.8 27.4 17.3 21.7 64.0 4.8 3.1 66.11 31.4 40.6 33.4 40.7 17.1 0.6 1.11 73.3 125.9 122.1 126.0 34.9 2.8 1.72 160.8 207.2 162.0 174.5 73.4 5.3 4.93 270.1 288.4 287.1 288.4 37.1 1.6 1.74 359.5 375.7 368.2 375.7 32.2 1.7 1.65 388.3 418.9 392.3 – 395.0 32.2 0.7 2.75 434.2 436.0 434.3 436.1 29.6 3.8 1.45 441.4 459.3 454.3 459.4 28.2 1.1 1.1
TL 1 0.0 33.3 17.3 21.7 66.2 1.7 6.3 87.71 64.7 125.9 122.1 – 126.0 48.8 3.8 3.82 160.8 207.2 174.5 178.8 91.9 10.5 18.53 287.0 288.4 287.1 288.4 19.0 0.4 2.15 389.9 416.1 411.7 416.2 34.1 1.7 3.75 434.2 454.3 434.3 436.1 45.0 1.4 3.9
IB 5 388.3 434.2 392.3 – 395.0 46.3 37.7 3.8 66.1BB 1 0.0 15.1 3.9 7.8 17.7 1.8 0.6 26.7
1 40.6 125.9 94.5 101.6 17.9 9.0 0.82 174.4 189.1 179.7 189.2 11.4 2.4 0.55 388.3 434.2 392.3 – 395.0 14.4 1.7 0.75 483.2 487.8 483.2 487.8 19.3 1.1 0.8
TB 1 0.0 15.9 7.8 9.9 24.1 2.2 0.8 44.11 40.6 125.9 94.5 101.6 14.0 4.1 0.82 174.4 189.1 179.7 189.2 7.6 1.5 0.45 388.3 434.2 392.3 – 395.0 43.2 17.4 3.1
FT, flowering time; SL, length at first silique; TL, total plant length; IB, main inflorescence branchnumber; BB, basal branch number; TB, total branch number. a Chromosome number. b The regionspanned by consecutive bins, significantly (P < 0.001) differing from Ler and sharing the same directionof effect, was taken as support interval. c Position of the bin within the QTL support interval showingthe largest effect. d Within the QTL support interval, the bin showing the largest effect was compared toLer in an ANOVA analysis. The among genotype component of ANOVA was taken as an estimator ofexplained variance. e All lines in the population were subjected to ANOVA using the bin described infootnote d as fixed factor. The among genotype component of ANOVA was taken as an estimator ofexplained variance. f Effect of QTLs calculated as B A, where A is the mean value of all Ler lines andB is the mean value of all lines in the bin described in footnote d. Effects are given in days (flowering
time), centimeters (length at first silique and total length) or numbers (main inflorescence branchnumber, basal branch number and total branch number). g All bins together with Ler were analyzed byANOVA and the among genotype component was taken as a measure of totally explained variance.
Chapter 2
30

Development of a Near Isogenic Line population
31
Figure 3: QTL profiles of traits analyzed in the NIL population.(A) Flowering time, (B) Length at first silique, (C) Total plant length, (D) Number of main inflorescencebranches, (E) Basal branch number and (F) Total branch number. Solid lines represent the QTL effectcalculated as described in Materials and Methods. Shaded lines represent significance scores. Shadeddashed lines represent significance threshold levels applied in this study.
Table 5: Comparative summary of QTL mapping parameters in the Ler x Cvi RIL and NIL populations.
Trait Population.aQTLsb(no.)
Supportc(cM)
ExplainedVarianced (%)
Total explainedVariance (%) Effecte
Relativeeffectf
FT RIL 3 6.6 16.1 68.4 4.7 1.15NIL 5 35.5 (3.6) 34.0 83.2 4.4 1.03
SL RIL 7 10.1 11.0 79.5 2.1 1.09NIL 9 23.3 (5.2) 38.7 66.1 2.1 1.11
TL RIL 8 11.1 10.1 86.3 4.5 1.09NIL 6 31.4 (3.4) 50.8 87.7 6.4 1.09
IB RIL 5 12.1 8.7 65.0 0.5 1.13NIL 1 45.9 (2.7) 46.3 66.1 3.8 2.71
BB RIL 4 21.3 9.4 38.5 0.4 1.59NIL 5 33.1 (5.6) 16.1 26.7 0.7 1.30
TB RIL 6 9.7 9.1 71.1 0.6 1.10NIL 4 40.5 (5.4) 22.2 44.1 1.3 1.11
FT, flowering time; SL, length at first silique; TL, total plant length; IB, main inflorescence branchnumber; BB, basal branch number; TB, total branch number. a Population type. b Number of QTLsdetected. c Average length of support interval. In parentheses: average length of largest effect bin. d
Average explained variance for each QTL. e Average absolute effect for each QTL. Effects are given indays (flowering time), centimeters (length at first silique and total length) or numbers (elongated axils,basal branch number and total branch number). f Smallest relative effect significantly detected,expressed as fold difference compared to Ler, calculated as (| B A|+ A)/ A.
We defined the support interval in the NIL mapping population as theregion spanned by consecutive bins, significantly differing from Ler (P < 0.001) andsharing the same direction of effect. The length of support intervals estimated inthis way ranged from 1.4 (total plant length) to 85.3 cM (basal branch number) withan average of 30.9 cM. Alternatively, we also searched for QTLs in the NILpopulation by comparing the phenotype of each NIL individually against Ler(supplemental Figures 2 7 at http://www.genetics.org/supplemental/). In this case,support intervals can be estimated as the length of the overlapping regionsbetween the Cvi introgression fragments of NILs significantly differing from Ler ina particular genomic region. This second method increases the QTL localizationresolution, but reduces statistical power. For each bin on average 116 plants couldbe tested against Ler whereas only 24 plants were available for analysis ofindividual NILs. Moreover, individual lines may contain multiple opposing effectQTLs, resulting in nonsignificant differences compared to Ler. Therefore, lines

Chapter 2
32
spanning the bin support interval were occasionally not significantly differentfrom Ler. Likewise, lines bearing introgressions outside the bin support intervalssometimes differed significantly from Ler, probably due to multiple additive smalleffect QTLs. Together, the loss of power and the complexity of the traits understudy hindered a confident estimation of a NIL support interval. Nevertheless, allQTLs detected in the bin analysis could also be detected by analyzing individualNILs. As a compromise between the two methods of support interval estimationwe recorded the position of the largest effect bin within the bin support interval(Table 4). However, it must be noted that bin support intervals may containmultiple QTLs of similar direction. The average size of these largest effect bins was4.6 cM. Within those bins, at least one individual NIL significantly differing fromLer, was always found.
Power in RIL vs.NIL QTL mappingThe power to detect a QTL at a specific locus basically depends on the difference inmean trait values between A and B genotypes for that particular locus. Althoughother parameters like trait heritability, genetic interactions, and genetic mapquality should not be ignored. Because power increases when variance for meanvalues decreases, QTL analyses can benefit greatly from multiple measurements. Ina RIL population this can be achieved in two ways. First, because segregation ofboth alleles occurs randomly and each locus is represented equally by the A and Bgenotype, provided there is no segregation distortion (Doerge, 2002), increasingthe number of RILs to be analyzed will increase the number of observations of eachgenotype at a given genomic position. A further advantage of increasing the RILpopulation size is that the number of recombination events increases, which canimprove resolution. However, when the number of lines is fixed, more accuratetrait values of lines can be achieved by measuring replicate individuals of the sameline. In addition accurate trait values based on replicate measurements improve thepossibility of detecting smaller effect QTLs.
To test the effect of replicated measurements and population size on theQTL detection power of the two Ler x Cvi populations we analyzed the phenotypicdata obtained in these populations by varying both parameters. For the RILpopulation we performed QTL analyses on different numbers of RILs (populationsize) and used mean line values obtained with different number of replicates(replicate size). The total explained variance in the population, LOD score of thelargest effect QTL, and the number of detected QTLs were then recorded for eachtrait (Figure 4). When the population size was kept constant (161 lines), therecorded statistics increased when increasing the replicate number from one to

Development of a Near Isogenic Line population
33
four but this increase leveled off rapidly when measuring more replicates (Figure4, A C).
Figure 4: QTL detection power analysis of the Ler x Cvi RIL population.(A) Effect of replicate number on total explained variance. (B) Effect of replicate number on LOD scoreof the largest effect QTL. (C) Effect of replicate number on the number of detected QTLs. (D) Effect ofpopulation size on total explained variance. (E) Effect of population size on LOD score of the largesteffect QTL. (F) Effect of population size on the number of detected QTLs. , Flowering time; , Length atfirst silique; , Total plant length; x, Main inflorescence branch number; , Basal branch number; and +,Total branch number. Error bars represent SEM of ten independent analyses.
In contrast, when the number of replicates was kept constant (16 replicatedmeasurements per RIL) and population size was increased, the QTL detectionpower improved more drastically. However, the total explained variance remainedmore or less constant over all population sizes (Figure 4D). This phenomenon iscommonly known as the Beavis effect and is due to the fact that estimatedexplained variances of detected QTLs are sampled from a truncated distributionbecause QTLs are only taken into account when the test statistics reach apredetermined critical value (Xu, 2003). As a result, the expectations of detectedQTL effects are biased upward. A second effect of increasing population size is thenearly linear increase of LOD scores, observed for all analyzed QTLs (Figure 4E).Significance thresholds determined by permutation tests for each population size,

Chapter 2
34
were steady around 2.7 LOD for population sizes >30 RILs and increased slightlywith smaller population sizes (data not shown). The largest effect QTL could besignificantly detected at all population sizes for all traits except for basal branchnumber, whose largest effect QTL could not be significantly detected in populationsizes <80 RILs.
To evaluate the NIL population, we studied the effect of increasing thenumber of replicates per line by estimating the relative difference between linemean values that could still be significantly detected with different replicatenumbers (see Materials and Methods). As shown in Figure 5A the power to detectsignificant phenotypic differences greatly increases when increasing the number ofreplicate individuals of NILs measured. Furthermore, the lower the heritability ofthe trait the larger the increase of detection power achieved by increasing thenumber of replicates per NIL. When a bin analysis was carried out using increasingreplicate numbers a similar increase in the number of detected QTLs was observed(Figure 5B). Overall, the results presented in Figures 4 and 5 show that the numberof replicates used in our analyses (16 individuals for each RIL and 24 individualsfor each NIL) approximated the maximum QTL detection power of both Ler x Cvipopulations.
Figure 5: QTL detection power analysis of the Ler x Cvi NIL population.(A) Effect of replicate number on significantly detectable relative differences, expressed as folddifference between two lines. (B) Effect of replicate number on the number of detected QTLs. ,Flowering time; , Length at first silique; , Total plant length; x, Main inflorescence branch number; ,Basal branch number; and +, Total branch number. Error bars represent SEM of ten independentanalyses.

Development of a Near Isogenic Line population
35
DISCUSSION
Experimental mapping populations are a basic resource to elucidate the geneticbasis of quantitative multigenic traits. In this work, we have developed the firstgenome wide population of NILs of Arabidopsis thaliana consisting of 92 linescarrying genomic introgression fragments from the parental accession Cvi into thegenetic background of the common laboratory accession Landsberg erecta. Inaddition we have empirically compared the mapping power of this populationwith an existing population of recombinant inbred lines, derived from the sameparental accessions. RIL and NIL populations have been used extensively ingenetic studies (Eshed and Zamir, 1995; Rae et al., 1999; Monforte and Tanksley,2000; Koumproglou et al., 2002; Han et al., 2004; Koornneef et al., 2004; Singer et al.,2004; von Korff et al., 2004) due to the advantages derived from their homozygosityand immortality: they can be used indefinitely; various traits can be analyzed indifferent experiments and environmental settings; and replicates of the individuallines can be analyzed, enabling a more accurate estimate of the line’s phenotypicmean value. However, the main difference between the two populations lies in thenature of their genetic makeup. In a RIL population multiple genomic regionsdiffer between most pairs of RILs and several segregating QTLs contribute tophenotypic differences between pairs of lines, making it impossible to assign theobserved variation between pairs of lines to a specific genomic region. Therefore,to detect QTLs one must perform the simultaneous analysis of a large number oflines. In contrast, in a NIL population, the phenotypic variation observed betweenpairs of lines can be assigned directly to the distinct genomic regions introgressedin an otherwise similar genetic background. Depending on the desired resolutionone can minimize the number of lines by analyzing lines carrying largeintrogressions or even chromosome substitution strains (Nadeau et al., 2000).
A summary of the differences observed between the RIL and NILpopulations derived from Ler and Cvi is shown in Table 5 and in supplementalFigure 8 at http://www.genetics.org/supplemental/. The total number of QTLsdetected did not differ much between the two populations. However, different lociwere detected in both types of populations, showing their complementaryproperties. For both populations the detection of QTLs was highly dependent onthe trait under consideration and its genetic architecture (e.g. effect and position ofQTL, epistasis). The power of the new NIL population to detect the large effect lociwas close to that of the existing RIL population since most large effect loci weredetected in both populations. However, a few relatively large effect loci showingsignificant epistatic interactions could only be detected in the RIL population, but

Chapter 2
36
not in the NILs (supplemental Table 3 at http://www.genetics.org/supplemental/).Moreover, localization resolution was higher in the RIL population compared tothe bin analysis of the NIL population, allowing separation of linked QTLs. Thiswas best illustrated by the two major QTLs for flowering time detected in the RILpopulation on the top of chromosome five, which not only are linked but alsoshowed strong epistatic interaction. Consequently, these two QTLs could not beseparated in the NIL population. Nevertheless, the QTL resolution in the NILpopulation can be increased when analyzing individual lines, although this will beat the cost of mapping power. In total, 14 QTLs detected in the RIL populationcould not be detected in the NIL population, of which 10 showed significantepistatic interactions with other QTLs and all others were closely linked to anothersignificant QTL.
In contrast, the average explained variance of single QTLs was higher inthe NIL population, increasing the power to detect small effect QTLs. Thisdifference can be attributed to the level of transgression, which is stronger in theRIL population, thereby increasing total phenotypic variance. As a result, 13 smalleffect QTLs could be detected in the NIL population, which were not detected inthe RIL population. Nevertheless, some of the small effect QTLs detected in theNILs were close to the significance threshold in the RIL population when using thelower chromosomal LOD thresholds (supplemental Table 3 at http://www.genetics.org/supplemental/). Expectedly, the power to detect small effect QTLs inthe NIL population was higher for the more heritable traits (flowering time andplant height) than for those traits with low heritability (branching traits). Thedifferent power to detect small effect QTLs of the two populations is due to theeffect of the segregation of multiple QTLs in the RIL population, which increasesthe residual variance at each QTL under study.
The analyses of the RIL and NIL populations performed in this work wereprobably close to the maximum statistical power for the given population sizessince the number of detected QTLs leveled off at higher replication sizes (Figures 4and 5). The power analyses presented here could guide the decision making on thenumber of plants to be analyzed when experiments are costly, laborious, or timeconsuming and therefore may require the analysis of fewer plants. Overall, forRILs, the effect of population size on mapping power was larger than the effect ofreplicated measurements of individual lines. Therefore, to reduce the number ofplants to be analyzed, it is preferable to first reduce the number of replicates perline, and only thereafter, if required, the number of lines. In our analyses majoreffect QTLs for most traits could still be significantly detected when only 50 lineswere analyzed without replicates (data not shown). However, due to the Beaviseffect (Xu, 2003) the explained variances obtained with small population sizes were
Development of a Near Isogenic Line population
37
strongly overestimated. In the NIL population, the number of replicatedmeasurements has a larger impact on mapping power and at least five replicatedplants should be analyzed to obtain enough statistical power (Figure 5). However,fewer lines can be analyzed as long as genome wide coverage is maintained. In thisNIL population this can be achieved using a core set of 25 lines, althoughlocalization resolution was diminished. Nevertheless, most QTLs detected in thefull set could still be detected in the core set (supplemental Figure 9 athttp://www.genetics.org/supplemental/). Once a QTL has been identified in aparticular region, one can zoom in with a minimal set of lines carrying smallerintrogressions defined by crossovers in the support interval of the QTL of interest(Fridman et al., 2004).
The Ler x Cvi NIL population developed in this work provides a usefulresource that will facilitate the genetic dissection of quantitative traits inArabidopsis in various aspects. First, as shown here, it can be analyzed as analternative segregating population to perform genome wide QTL mapping, withthe particular advantage of detecting small effect QTLs. Second, this populationcan be used to confirm previously detected QTLs in the Ler x Cvi RIL population.Third, individual lines of this population can serve as starting point for the rapidMendelization of particular QTLs and for their fine mapping and cloning (Paranand Zamir, 2003). Finally, the single introgression lines of this population may alsostrongly facilitate the fine mapping of artificially induced mutant alleles in thecommon laboratory Ler genetic background (or transferred to this accession). Thefine mapping of mutant loci affecting quantitative adaptive traits is oftenhampered by the confounding effects of QTLs segregating in the mappingpopulations derived from crosses between the mutant and another Arabidopsiswild accession. Knowing the approximate genetic location of the mutant locuswithin a chromosomal arm, specific lines of this NIL population can be selected ascarrying a single introgression spanning the map position of the locus of interest.These lines can then be used to derive the required monogenic mappingpopulation, as has been illustrated with the flowering time locus FVE (Ausin et al.,2004). In conclusion, the elucidation of quantitative traits can benefit from theparallel analysis of both populations.

Chapter 2
38
MATERIALS ANDMETHODS
Mapping populationsTwo types of mapping populations were used to analyze six developmental traits.The first population consists of a set of 161 recombinant inbred lines (RILs) derivedfrom a cross between the accessions Cape Verde Islands (Cvi) and Landsberg erecta(Ler). The F10 generation has been extensively genotyped (Alonso Blanco et al.,1998b) and is available from the Arabidopsis Biological Resource Center. All lineswere advanced to the F13 generation and residual heterozygous regions, estimatedat 0.71% in the F10 generation, were genotyped again with molecular PCR markersto confirm that they were practically 100% homozygous.
The second population consists of a set of 92 near isogenic lines (NILs).NILs were generated by selecting appropriate Ler x Cvi RILs and repeatedbackcrossing with Ler as recurrent female parent. A number of these lines havebeen described previously (Alonso Blanco et al., 1998a, 2003; Swarup et al., 1999;Bentsink et al., 2003; Edwards et al., 2005; Juenger et al., 2005a; Teng et al., 2005). Theprogeny of backcrosses was genotyped with PCR markers and lines containing ahomozygous Cvi introgression into an otherwise Ler background were selected.The set of selected lines was then extensively genotyped by AFLP analysis usingthe same restriction enzymes and primer combinations as those used for thegenotyping of the RILs (Alonso Blanco et al., 1998b). The NILs will be madeavailable through the Arabidopsis stock centers.
In both populations each line is almost completely homozygous andtherefore individuals of the same line are genetically identical, which allows thepooling of replicated individuals and repeated measurements to obtain a moreprecise estimate of phenotypic values. For the RIL and NIL population 16 and 24genetically identical plants were grown per line, respectively. Additionally, 96replicates were grown for each parental accession Ler and Cvi. All plants weregrown in a single experiment with four completely randomized blocks containing4, 6, and 24 replicates per RIL, NIL, and parent, respectively.
Plant growing conditionsSeeds were sown in petri dishes on water soaked filter paper and incubated forfive days in a cold room at 4°C in the dark to promote uniform germination.Subsequently, petri dishes were transferred to a climate chamber (24°C, 16 hr lightper day) for two days before planting. Germinated seedlings were transferred toclay pots, placed in peat, containing a sandy soil mixture. A single plant per pot

Development of a Near Isogenic Line population
39
was grown under long day light conditions in an air conditioned green house fromJuly until October. Plants were fertilized every two weeks using a liquid fertilizer.
Quantitative traitsA total number of six developmental traits, which were known to vary within thepopulations for the number of QTLs and heritability, were measured on allindividuals. We quantified flowering time (FT); main inflorescence length at firstsilique (SL); total length of the main inflorescence (TL); basal branch number (BB),which is the number of side shoots growing out from the rosette; maininflorescence branch number (IB), which is the number of elongated axillary(secondary) inflorescences along the main inflorescence; and total number of sideshoots (TB; basal plus main inflorescence). Flowering time was recorded as thenumber of days from the date of planting until the opening of the first flower. Allother traits were measured at maturity.
Quantitative genetic analysesFor both populations and for each trait, total phenotypic variance was partitionedinto sources attributable to genotype (VG; i.e. the line effect) and error (VE) using arandom effects analysis of variance (ANOVA, SPSS version 11.0) according to themodel Y = + G + E. Variance components were used to estimate broad senseheritability according to the formula H2 = VG/(VG + VE), where VG is the amonggenotype variance component and VE is the residual (error) variance component.Genetic correlations (rG) were estimated as 212,1cov GGG VV/r , where cov1,2 isthe covariance of trait means and VG1 and VG2 are the among genotype variancecomponents for those traits. The coefficient of genetic variation (CVG) wasestimated for each trait as XVCV GG 100 , where VG is the among genotype
variance component and X is the trait mean of the genotypes.
QTL analyses in the RIL populationTo map QTLs using the RIL population, a set of 144 markers equally spaced overthe Arabidopsis genetic map was selected from the RIL Ler x Cvi map (AlonsoBlanco et al., 1998b). These markers spanned 485 cM, with an average distancebetween consecutive markers of 3.5 cM and the largest genetic distance being 11cM. The phenotypic values recorded, except basal branch number, weretransformed (log10(x+1)) to improve the normality of the distributions and thevalues of 16 plants per RIL were used to calculate the means of each line for alltraits. These means were used to perform the QTL analyses unless otherwisestated. The computer program MapQTL version 5.0 (Van Ooijen, 2004) was used to

Chapter 2
40
identify and locate QTLs linked to the molecular markers using both intervalmapping and multiple QTL mapping (MQM). In a first step, putative QTLs wereidentified using interval mapping. Thereafter, a marker closely linked to eachputative QTL was selected as a cofactor and the selected markers were used asgenetic background controls in the approximate MQM of MapQTL. LOD statisticswere calculated at 0.5 cM intervals. Tests of 1000 permutations were used to obtainan estimate of the number of type 1 errors (false positives). The genome wide LODscore, which 95% of the permutations did not exceed, ranged from 2.6 to 2.8 andchromosome wide LOD thresholds varied between 1.8 and 2.1 depending on traitand linkage group. The genome wide LOD score was then used as the significancethreshold to declare the presence of a QTL in MQM mapping, while thechromosome wide thresholds were used to detect putative small effect QTLs. Inthe final MQM model the genetic effect ( B A) and percentage of explainedvariance was estimated for each QTL and 2 LOD support intervals wereestablished as an ~95% confidence level (Van Ooijen, 1992), using restricted MQMmapping.
Epistatic interactions between QTLs were estimated using factorialanalysis of variance. For each trait, the mean phenotypic values were used asdependent variable and cofactors, corresponding to the detected QTLs, were usedas fixed factors. The general linear model module of the statistical package SPSSversion 11.0 was used to perform a full factorial analysis of variance or analysis ofmain effects only. Differences in R2 values, calculated from the Type III sum ofsquares, were assigned to epistatic interaction effects of detected QTLs.Additionally we performed a complete pairwise search (P < 0.001, determined byMonte Carlo simulations) for conditional and coadaptive epistatic interactions foreach trait using the computer program EPISTAT (Chase et al., 1997).
The effect of replication on statistical power was analyzed by performingMQM mapping on means of trait values from 1, 2, 4, 8, 12, and 16 replicate plants,respectively. Analyses were performed on ten independent, stochasticallysampled, data sets for each replication size and trait using automated cofactorselection (P < 0.02). Total explained variance, LOD score of the largest effect QTL,and number of significant QTLs were recorded for each analysis.
The effect of population size on statistical power was analyzed byperforming MQM mapping on increasing population sizes. Analyses wereperformed on ten independent, stochastically sampled, data sets for eachpopulation size. Subpopulations of increasing size, with a step size of 20 lines,were analyzed for each trait using automated cofactor selection (P < 0.02). Totalexplained variance, LOD score of the largest effect QTL, and number of significantQTLs were recorded for each analysis.

Development of a Near Isogenic Line population
41
Statistical analyses NILsDifferences in mean trait values of Ler and NILs were analyzed by univariateanalysis of variance, using the general linear model module of the statisticalpackage SPSS version 11.0. Dunnett’s pairwise multiple comparison t test wasused as a post hoc test to determine significant differences. For each analysis, traitvalues were used as dependent variable and NILs were used as fixed factor. Testswere performed 2 sided with a Bonferroni corrected significance threshold level of0.05 and Ler as control category. In order to increase statistical power, similaranalyses were conducted for bins (see results section). For this, trait values of allintrogression lines assigned to a certain bin were pooled and compared to valuesof the Ler parental line. Because each NIL can be a member of more than one binthe significance threshold was lowered to 0.001 to correct for multiple testing. Thegenetic effect of Cvi bins significantly differing from Ler was calculated as B A,where A and B are the mean trait values of Ler and the Cvi bin, respectively.Explained variance was estimated from the partial 2 of the univariate analysis ofvariance, where 2 is the proportion of total variance attributable to factors in theanalysis. The total percentage of explained variance was then estimated by usingtrait values as dependent variable and NILs as fixed factor, where all NILs whereincluded as subjects. The percentage of explained variance of individual QTLs wasestimated as a fraction of the total variation in the population (including all lines),using a single bin as fixed factor and as a fraction of the total variation in acomparison of a single bin with Ler only.
To determine the effect of replicated measurements we calculated thepower of detecting significant differences between Ler and NILs using variousreplicate numbers. For each trait we calculated the minimal relative difference inmean trait values that could still be significantly detected. Calculations wereperformed using a normal distribution two sample equal variance powercalculator from the UCLA department of statistics (http://calculators.stat.ucla.edu/). We first calculated for each trait the mean phenotypic value of 96 Lerreplicate plants ( A) and for each line the standard deviation of 24 replicate plants.The mean line standard deviation of each trait was taken as a measure of variation( ) in all subsequent calculations. The significance level, the probability of falselyrejecting the null hypothesis (H0: A= B) when it is true, was set to 0.05 and power,the probability of correctly rejecting the null hypothesis when the alternative(H1: A B) is true, was set to 0.95. The sample size of Ler (NA) was always identicalto the sample size of NILs (NB) and ranged from 2 to 24 individuals. For each traitand sample size the mean trait value ( B) for NILs was then calculated as theminimum value to meet the alternative hypothesis (H1: A B) in a two sided test.These minimum values were then converted in a fold difference value compared

Chapter 2
42
to the Ler value, calculated as (| B A|+ A)/ A, to obtain a relative estimateindependent of trait measurement units.
The effect of replication on statistical power was also analyzed byperforming bin mapping using 2, 4, 8, 12, and 16 replicate plants, respectively.Analyses were performed on ten independent, stochastically sampled, data sets foreach replication size and trait and the number of significant QTLs was recorded foreach analysis.
AcknowledgementsWe thank Kieron Edwards for sharing NILs, Johan van Ooijen for helpfulassistance in the QTL mapping, and Piet Stam for critical reading of themanuscript. This work was supported by a grant from The NetherlandsOrganization for Scientific Research, Program Genomics (050 10 029).

Development of a Near Isogenic Line population
43
REFERENCES
Alonso Blanco, C., El Assal, S.E., Coupland, G. and Koornneef, M. (1998a). Analysis of natural allelicvariation at flowering time loci in the Landsberg erecta and Cape Verde Islands ecotypes ofArabidopsis thaliana. Genetics 149, 749 764.
Alonso Blanco, C., Peeters, A.J., Koornneef, M., Lister, C., Dean, C., van den Bosch, N., Pot, J. andKuiper, M.T. (1998b). Development of an AFLP based linkage map of Ler, Col and CviArabidopsis thaliana ecotypes and construction of a Ler/Cvi recombinant inbred linepopulation. Plant J 14, 259 271.
Alonso Blanco, C., Blankestijn de Vries, H., Hanhart, C.J. and Koornneef, M. (1999). Natural allelicvariation at seed size loci in relation to other life history traits of Arabidopsis thaliana. Proc NatlAcad Sci U S A 96, 4710 4717.
Alonso Blanco, C. and Koornneef, M. (2000). Naturally occurring variation in Arabidopsis: anunderexploited resource for plant genetics. Trends Plant Sci 5, 22 29.
Alonso Blanco, C., Bentsink, L., Hanhart, C.J., Blankestijn de Vries, H. and Koornneef, M. (2003).Analysis of natural allelic variation at seed dormancy loci of Arabidopsis thaliana. Genetics 164,711 729.
Ausin, I., Alonso Blanco, C., Jarillo, J.A., Ruiz Garcia, L. and Martinez Zapater, J.M. (2004).Regulation of flowering time by FVE, a retinoblastoma associated protein. Nat Genet 36, 162166.
Bentsink, L., Yuan, K., Koornneef, M. and Vreugdenhil, D. (2003). The genetics of phytate andphosphate accumulation in seeds and leaves of Arabidopsis thaliana, using natural variation.Theor Appl Genet 106, 1234 1243.
Blair, M.W., Iriarte, G. and Beebe, S. (2006). QTL analysis of yield traits in an advanced backcrosspopulation derived from a cultivated Andean x wild common bean (Phaseolus vulgaris L.)cross. Theor Appl Genet 112, 1149 1163.
Blanco, A., Simeone, R. and Gadaleta, A. (2006). Detection of QTLs for grain protein content in durumwheat. Theor Appl Genet 112, 1195 1204.
Borevitz, J.O. and Nordborg, M. (2003). The impact of genomics on the study of natural variation inArabidopsis. Plant Physiol 132, 718 725.
Broman, K.W. (2001). Review of statistical methods for QTL mapping in experimental crosses. Lab Anim(NY) 30, 44 52.
Chase, K., Adler, F.R. and Lark, K.G. (1997). Epistat: a computer program for identifying and testinginteractions between pairs of quantitative trait loci. Theor Appl Genet 94, 724 730.
Doerge, R.W. (2002). Mapping and analysis of quantitative trait loci in experimental populations. NatRev Genet 3, 43 52.
Edwards, K.D., Lynn, J.R., Gyula, P., Nagy, F. and Millar, A.J. (2005). Natural allelic variation in thetemperature compensation mechanisms of the Arabidopsis thaliana circadian clock. Genetics170, 387 400.
Eshed, Y. and Zamir, D. (1995). An introgression line population of Lycopersicon pennellii in thecultivated tomato enables the identification and fine mapping of yield associated QTL.Genetics 141, 1147 1162.
Fridman, E., Carrari, F., Liu, Y.S., Fernie, A.R. and Zamir, D. (2004). Zooming in on a quantitative traitfor tomato yield using interspecific introgressions. Science 305, 1786 1789.
Han, F., Ullrich, S.E., Kleinhofs, A., Jones, B.L., Hayes, P.M. and Wesenberg, D.M. (1997). Finestructure mapping of the barley chromosome 1 centromere region containing malting qualityQTLs. Theor Appl Genet 95, 903 910.

Chapter 2
44
Han, F., Clancy, J.A., Jones, B.L., Wesenberg, D.M., Kleinhofs, A. and Ullrich, S.E. (2004). Dissectionof a malting quality QTL region on chromosome 1 (7H) of barley.Mol Breed 14, 339 347.
Jansen, R.C. (2003). Quantitative trait loci in inbred lines. In Handbook of Statistical Genetics, D.J.Balding, M. Bishop and C. Cannings, eds (Chichester, UK: John Wiley & Sons), pp. 445 476.
Jeuken, M.J. and Lindhout, P. (2004). The development of lettuce backcross inbred lines (BILs) forexploitation of the Lactuca saligna (wild lettuce) germplasm. Theor Appl Genet 109, 394 401.
Juenger, T.E., McKay, J.K., Hausmann, N., Keurentjes, J.J.B., Sen, S., Stowe, K.A., Dawson, T.E.,Simms, E.L. and Richards, J.H. (2005a). Identification and characterization of QTLunderlying whole plant physiology in Arabidopsis thaliana: delta13C, stomatal conductanceand transpiration efficiency. Plant Cell Environ 28, 697 708.
Juenger, T.E., Sen, S., Stowe, K.A. and Simms, E.L. (2005b). Epistasis and genotype environmentinteraction for quantitative trait loci affecting flowering time in Arabidopsis thaliana. Genetica123, 87 105.
Koornneef, M., Alonso Blanco, C. and Vreugdenhil, D. (2004). Naturally occurring genetic variation inArabidopsis Thaliana. Annu Rev Plant Physiol Plant Mol Biol 55, 141 172.
Koumproglou, R., Wilkes, T.M., Townson, P., Wang, X.Y., Beynon, J., Pooni, H.S., Newbury, H.J. andKearsey, M.J. (2002). STAIRS: a new genetic resource for functional genomic studies ofArabidopsis. Plant J 31, 355 364.
Loudet, O., Gaudon, V., Trubuil, A. and Daniel Vedele, F. (2005). Quantitative trait loci controllingroot growth and architecture in Arabidopsis thaliana confirmed by heterogeneous inbredfamily. Theor Appl Genet 110, 742 753.
Maloof, J.N. (2003). Genomic approaches to analyzing natural variation in Arabidopsis thaliana. CurrOpin Genet Dev 13, 576 582.
Monforte, A.J. and Tanksley, S.D. (2000). Development of a set of near isogenic and backcrossrecombinant inbred lines containing most of the Lycopersicon hirsutum genome in a L.esculentum genetic background: a tool for gene mapping and gene discovery. Genome 43, 803813.
Nadeau, J.H., Singer, J.B., Matin, A. and Lander, E.S. (2000). Analysing complex genetic traits withchromosome substitution strains. Nat Genet 24, 221 225.
Paran, I. and Zamir, D. (2003). Quantitative traits in plants: beyond the QTL. Trends Genet 19, 303 306.Rae, A.M., Howell, E.C. and Kearsey, M.J. (1999). More QTL for flowering time revealed by
substitution lines in brassica oleracea. Heredity 83 (Pt 5), 586 596.Reymond, M., Svistoonoff, S., Loudet, O., Nussaume, L. and Desnos, T. (2006). Identification of QTL
controlling root growth response to phosphate starvation in Arabidopsis thaliana. Plant CellEnviron 29, 115 125.
Singer, J.B., Hill, A.E., Burrage, L.C., Olszens, K.R., Song, J., Justice, M., O Brien, W.E., Conti, D.V.,Witte, J.S., Lander, E.S. et al. (2004). Genetic dissection of complex traits with chromosomesubstitution strains of mice. Science 304, 445 448.
Slate, J. (2005). Quantitative trait locus mapping in natural populations: progress, caveats and futuredirections.Mol Ecol 14, 363 379.
Stylianou, I.M., Tsaih, S.W., DiPetrillo, K., Ishimori, N., Li, R., Paigen, B. and Churchill, G. (2006).Complex genetic architecture revealed by analysis of high density lipoprotein cholesterol inchromosome substitution strains and F2 crosses. Genetics 174, 999 1007.
Swarup, K., Alonso Blanco, C., Lynn, J.R., Michaels, S.D., Amasino, R.M., Koornneef, M. and Millar,A.J. (1999). Natural allelic variation identifies new genes in the Arabidopsis circadian system.Plant J 20, 67 77.

Development of a Near Isogenic Line population
45
Teng, S., Keurentjes, J.J.B., Bentsink, L., Koornneef, M. and Smeekens, S. (2005). Sucrose specificinduction of anthocyanin biosynthesis in Arabidopsis requires the MYB75/PAP1 gene. PlantPhysiol 139, 1840 1852.
Tuinstra, M.R., Ejeta, G. and Goldsbrough, P.B. (1997). Heterogeneous inbred family (HIF) analysis: amethod for developing near isogenic lines that differ at quantitative trait loci. Theor ApplGenet 95, 1005 1011.
Ungerer, M.C., Halldorsdottir, S.S., Modliszewski, J.L., Mackay, T.F. and Purugganan, M.D. (2002).Quantitative trait loci for inflorescence development in Arabidopsis thaliana. Genetics 160, 11331151.
Ungerer, M.C., Halldorsdottir, S.S., Purugganan, M.D. and Mackay, T.F. (2003). Genotypeenvironment interactions at quantitative trait loci affecting inflorescence development inArabidopsis thaliana. Genetics 165, 353 365.
Van Ooijen, J.W. (1992). Accuracy of mapping quantitative trait loci in autogamous species. Theor ApplGenet 84, 803 811.
Van Ooijen, J.W. (2004). MapQTL 5, Software for the mapping of quantitative trait loci in experimentalpopulations (Wageningen, The Netherlands: Kyazma B.V.).
von Korff, M., Wang, H., Leon, J. and Pillen, K. (2004). Development of candidate introgression linesusing an exotic barley accession (Hordeum vulgare ssp. spontaneum) as donor. Theor Appl Genet109, 1736 1745.
Xu, S. (2003). Theoretical basis of the Beavis effect. Genetics 165, 2259 2268.Yoon, D.B., Kang, K.H., Kim, H.J., Ju, H.G., Kwon, S.J., Suh, J.P., Jeong, O.Y. and Ahn, S.N. (2006).
Mapping quantitative trait loci for yield components and morphological traits in an advancedbackcross population between Oryza grandiglumis and the O. sativa japonica cultivarHwaseongbyeo. Theor Appl Genet 112, 1052 1062.
Zou, F., Gelfond, J.A., Airey, D.C., Lu, L., Manly, K.F., Williams, R.W. and Threadgill, D.W. (2005).Quantitative trait locus analysis using recombinant inbred intercrosses: theoretical andempirical considerations. Genetics 170, 1299 1311.

46

47
Chapter 3
Regulatory network construction in Arabidopsis by usinggenome wide gene expression quantitative trait loci
Joost J. B. Keurentjes*, Jingyuan Fu*, Inez R. Terpstra*, Juan M. Garcia, Guido vanden Ackerveken, L. Basten Snoek, Anton J. M. Peeters, Dick Vreugdenhil, MaartenKoornneef and Ritsert C. Jansen
Published in Proceedings of the National Academy of Sciences USA (2007) 104,1708 1713.
* Equal contribution.
ABSTRACT
Accessions of a plant species can show considerable genetic differences that areeffectively analyzed using Recombinant Inbred Line (RIL) populations. Here wedescribe the results of genome wide expression variation analysis in an RILpopulation of Arabidopsis thaliana. For many genes, variation in expression could beexplained by expression Quantitative Trait Loci (eQTLs). The nature andconsequences of this variation are discussed based on additional geneticparameters, such as heritability and transgression and by examining the genomicposition of eQTLs versus gene position, polymorphism frequency, and geneontology. Furthermore, we developed a novel approach for genetic regulatorynetwork construction by combining eQTL mapping and regulator candidate geneselection. The power of our method was shown in a case study of genes associatedwith flowering time, a well studied regulatory network in Arabidopsis. Resultsthat revealed clusters of co regulated genes and their most likely regulators werein agreement with published data, and unknown relationships could be predicted.

Chapter 3
48
INTRODUCTION
Analogous to classical traits, quantitative genetic variation is often observed fortranscript levels of genes. Jansen and Nap (2001), therefore, introduced the conceptof genetical genomics, in which Quantitative Trait Locus (QTL) analysis is appliedto levels of transcript abundance and identifies genomic loci controlling theobserved variation in expression (eQTLs). One of the best studied organisms withregard to gene expression regulation nowadays is yeast (Brem et al., 2002, 2005;Yvert et al., 2003; Bing and Hoeschele, 2005; Brem and Kruglyak, 2005; Ronald et al.,2005; Storey et al., 2005). However, in recent years several studies havedemonstrated the feasibility of this approach in different organisms and diversetypes of populations (Brem et al., 2002; Schadt et al., 2003; Morley et al., 2004;Bystrykh et al., 2005; Hubner et al., 2005; DeCook et al., 2006).
A logical next step would be the construction of genetic regulatorynetworks (Kendziorski and Wang, 2006), which only a few studies have addressedup to now (Bing and Hoeschele, 2005; Kliebenstein et al., 2006). Although manystudies on higher eukaryotes suffered from small populations or only analyzed asubset of genes present on the genome of the organism under study, the mainreason holding back the identification of gene by gene regulation has been the lackof a reliable identification of candidate regulators. Although powerful in detectingloci controlling the observed variation for trait values, support intervals of QTLsare still of considerable width, often covering hundreds of genes. Consequently,the molecular dissection of quantitative trait regulation is still in its infancy andwould greatly benefit from approaches reducing the number of candidate genes ina QTL support interval.
Promising results have been obtained by combining QTL analyses ofphysiological and gene expression traits, based on co localization of (e)QTLs(Wayne and McIntyre, 2002; Hubner et al., 2005; DeCook et al., 2006). However,when expression differences in genes are caused by differences in expression oftheir regulator, it is likely that they show correlation in expression (Bing andHoeschele, 2005). Moreover, multiple functionally related genes with co incidingeQTLs, which might be members of a common pathway, are likely to have one andthe same regulator. We therefore developed a novel approach for the assignmentof maximum likelihood regulators by combining QTL analysis of gene expressionprofiling and iterative Group Analysis (iGA) (Breitling et al., 2004) of functionallyrelated genes with co inciding eQTLs.
To apply the concept of genetical genomics to higher plants we analyzedgenome wide gene expression variation in a large, well studied Recombinant

Regulatory network construction using genome wide gene expression QTLs
49
Inbred Line (RIL) population of Arabidopsis thaliana. We show that for many genesthe variation in transcript level can be explained by genetic factors. By integratingcurrent knowledge of the genetics of a specific trait, we demonstrate theconstruction of genetic regulatory networks, which can serve to form hypothesesabout as yet unknown regulatory steps.
RESULTS
Genetic control of gene expression in plants is highly complexTo determine the effect of genetic factors involved in the regulation of expression,we analyzed genome wide gene expression in the parents and an RIL populationof a cross between the distinct accessions Landsberg erecta (Ler) and Cape VerdeIslands (Cvi), consisting of 160 lines (Alonso Blanco et al., 1998b). Transcript levelsof 24,065 genes were analyzed by DNA microarrays, of which 922 showedsignificant differential expression between the parents [P < 2.5 x 10 3; falsediscovery rate (FDR) = 0.05]. Subsequent mapping resulted in 4,523 eQTLs detectedfor 4,066 genes (P < 5.29 x 10 5; FDR = 0.05, corresponding to a q value of 0.01)(Storey and Tibshirani, 2003).
Figure 1: Frequency distributions of heritability values of gene expression.(A) Data from a microarray comparison of the parents. (B) Data from a microarray analysis of the Ler xCvi RIL population. Solid and shaded bars represent the number of genes that could and could not bemapped, respectively. The solid line depicts the number of mapped genes as a proportion of the totalnumber of genes for a given heritability class.
Because the microarray probe set was designed on the sequenced accessionColumbia (Col), we performed hybridizations of genomic DNA of the parentallines and found relatively few hybridization differences (supplemental Table 1 atwww.pnas.org/cgi/content/full/0610429104/DC1). However, the low power to

Chapter 3
50
detect differences, due to the small number of replicates, might have led to anunder estimation, as indicated by other studies (Borevitz, 2006).
Figure 2: Effect of expression level and transgression on eQTL detection.(A) Frequency distribution of the mean expression level of analyzed genes in the RIL population. Solidand shaded bars represent the number of genes that could and could not be mapped, respectively. Thesolid line depicts the number of mapped genes as a proportion of the total number of genes for a givenclass. (B) Diagram of the number of genes showing linkage and transgression. Circles are proportionalto the number of genes. Increasing shading represents, respectively, the total number of genes analyzed(24,065), the number of genes whose expression showed significant linkage (4,066) and the number ofgenes whose expression showed transgressive segregation (10,849).
Heritability values calculated from the parental data and the RILpopulation reached a median value of 28.6 and 74.7%, respectively (Figure 1),which is in agreement with the discrepancy between the number of differentiallyexpressed and mapped genes (i.e. genes for which an eQTL was found). Althoughthe fraction of mapped genes increased with higher heritability values, for manygenes showing high heritability, no eQTL could be significantly detected. Thesefindings suggest that the regulation of expression of many genes is controlled bymultiple eQTLs, of which many might not have passed the significance testbecause of their small effect. Likewise, only 65.6% of the genes differentiallyexpressed between the parents could be mapped. However, for 15.0% of the genesfor which the parents did not show a significant difference in expression levels,eQTLs could be detected. These observations and the much lower heritabilitiescalculated from the parental data, compared with those from the RIL population,indicate that eQTLs for a given gene might exert opposite additive effects, leading

Regulatory network construction using genome wide gene expression QTLs
51
to a balanced expression in the parents but a transgressive expression patternamong the segregants of the population. To test this hypothesis, we tested eachgene for significant transgression and found significant transgression of expressionfor 10,849 genes (45.1%). No relationship was found between the number ofmapped genes and transgression (Figure 2B). These data indicate that theregulation of gene expression in plants is largely under genetic control but ishighly complex because of the involvement of multiple genes.
Distribution of eQTLs identifies regulatory hot spotsTo characterize in more detail the genes whose expression showed significantlinkage, we determined several features. We first analyzed the distribution ofeQTLs along the genome of Arabidopsis and found a number of genomic regionscontaining numbers of eQTLs significantly deviating from what can be expected bychance, as determined by permutation tests (Figure 3). These hot spots may reflectlocal gene dense regions, in contrast to cold spots, which may reflect low genedensity regions such as centromers. Alternatively, hot spots may contain masterregulators: genes controlling the expression of many other genes. The largenumber of genes mapping to the ERECTA gene, which was included as aphenotypic marker, illustrate this finding. An empirical threshold for assessing ahot spot, providing a 0.05 genome wide error rate was generated using apermutation procedure, which defined a hot spot as any marker associated with 43or more genes. Because 176 genes mapped to the ERECTA marker, this locus wasconsidered to be an eQTL hot spot. Polymorphisms in ERECTA, a receptor proteinkinase (Torii et al., 1996), are well known for their pleiotropic effect on many traits,including morphological differences (Koornneef et al., 2004).
Figure 3: Genomic distribution of eQTLs.Bars represent the number of distant (solid) and local (shaded) eQTLs detected at each marker position.Each eQTL was positioned at its best controlling marker. The dashed horizontal line represents thesignificance threshold value for defining a hot spot. Shaded vertical lines depict chromosomal borders.

Chapter 3
52
Distant gene expression regulation occurs more frequently but local regulationis strongerGenomic differences responsible for eQTLs either occur in regulatory genesaffecting the transcript level of other genes (trans regulation) or in the genesencoding the mRNA for which the eQTL was found (cis regulation) (Rockman andKruglyak, 2006). To compare the position of genes and their eQTLs, we anchoredthe genetic map to the physical map and found an almost linear genome widerelation of 4.1 cM per Mbp (supplemental Figure 8 at www.pnas.org/cgi/content/full/0610429104/DC1). When the position of each eQTL was plotted against theposition of the gene for which that eQTL was found, a strong enrichment along thediagonal of the graph was observed (Figure 4). This enrichment indicates thatmany genes, of which the majority is expected to be cis regulated (Ronald et al.,2005), map to their own physical position.
Figure 4: Distribution of mapped genes versusthe position of their accompanying eQTL.Positions of detected eQTLs are plotted againstthe position of the gene for which that eQTL wasfound. Chromosomal borders are depicted ashorizontal and vertical lines. Mbp, megabasepairs.
To quantify this result, we defined local/distant regulation in terms of thepositional coincidence of genes and their accompanying eQTL(s). Of 4,066 mappedgenes, 1,875 (46.1%) co located with the support interval of one of their eQTLs,corresponding to a region consistent with max{ Log10P} 1.5 (where P expressesthe significance of association (Keurentjes et al., 2006)), and were thereforeclassified as locally regulated. Genes outside such intervals (1,958; 48.1%) wereclassified as distantly regulated. A minor number of 198 genes (4.9%) with multipleeQTLs showed both local and distant regulation, whereas the physical position of35 genes (0.9%) was unknown (Table 1).

Regulatory network construction using genome wide gene expression QTLs
53
Table 1: The number of genes showing linkage, classified according to the position of eQTLs relative tothe gene. Shown are the number of genes with a single or multiple eQTL(s) for different significancethresholds (P) and eQTL support intervals (max{ Log10P} x, where x = 1.5 and 2.0 respectively).Position Single eQTL Multiple eQTLs
P < 5.29 x 10 5; max{ Log10P} 1.5Local 1875Distant 1752 206Local + distant 198Unknown 31 4
P < 6.50 x 10 4; max{ Log10P} 1.5Local 2167Distant 3671 916Local + distant 794Unknown 45 11
P < 5.29 x 10 5; max{ Log10P} 2.0Local 2007Distant 1676 156Local + distant 192Unknown 31 4
Because cis regulation is often much stronger than trans regulation (Bingand Hoeschele, 2005), as also indicated by the median –Log10P values of 7.1 and 5.3and the median explained variance of 30.3 and 22.6% for local and distant eQTLs,respectively, the ratio of detected local versus distant eQTLs depends on theapplied significance threshold (Schadt et al., 2003; Morley et al., 2004; Hubner et al.,2005). The stringent threshold applied here, corrected for multiple testing, mighttherefore have underestimated distant regulation. When the threshold wasdecreased from 5.29 x 10 5 to 6.5 x 10 4 (FDR = 0.25, q = 0.05), 7,604 transcriptsshowed at least one linkage, with 2,167 (28.5%) being locally regulated, 4,587(60.3%) being distantly regulated, and 794 (10.4%) being both locally and distantlyregulated. Based on their P value distributions (Storey and Tibshirani, 2003), theoverall proportion of locally and distantly regulated genes were estimated at 40.5and 15.3% respectively.
A second parameter affecting the assignment of locally versus distantlyregulated transcripts is the setting of the eQTL support interval. However, when awider interval of max{–Log10P} 2.0 was used at P < 5.29 x 10 5, results were similarwith 2,007 (49.4%), 1,832 (45.1%), and 192 (4.7%) genes classified as locally,distantly, and both locally and distantly regulated, respectively.

Chapter 3
54
Local regulation correlates with SNP frequency and is less frequent inregulatory genesTo determine whether a relationship exists between SNP or gene density and thenumber of mapped genes, we performed a sliding window regression analysis. Astrong correlation was observed between gene density and the number of locallyand distantly regulated genes (r2 = 0.88, P < 0.0001 and r2 = 0.91, P < 0.0001,respectively) (Figure 5A).
Figure 5: Relationship between gene and SNP frequency and the number of mapped genes.(A) Relationship between gene frequency (solid lines) and the number of mapped genes, divided inlocally (shaded lines) and distantly (dotted shaded lines) regulated genes. (B) Relationship betweenSNP frequency (solid lines) and the number of mapped genes, divided in locally (shaded lines) anddistantly (dotted shaded lines) regulated genes, corrected for gene density. Gaps representchromosomal borders. Mbp, megabase pairs.
A weaker but significant correlation was also found between gene and SNPfrequency (r2 = 0.34, P < 0.0001). Even when the number of mapped genes in awindow was corrected for gene density, a significant correlation was still foundbetween SNP frequency and the number of locally regulated genes (r2 = 0.32, P <

Regulatory network construction using genome wide gene expression QTLs
55
0.0001), although incidental differences in hybridization efficiency might havecontributed to an overestimation. Such a relationship was not found for distantlyregulated genes (r2 = 0.003, P = 0.89) (Figure 5B).
To assess whether there was a functional enrichment for genes whosevariation in expression could be genetically explained, we computed theproportion of these genes for each Gene Ontology biological process and molecularfunction category (The Arabidopsis Information Resource; www.arabidopsis.org)(Figure 6). Genes involved in regulatory processes showed significantly lessgenetically explainable variation in expression (Al Shahrour et al., 2004)(supplemental Table 3 at www.pnas.org/cgi/content/full/0610429104/DC1).However, small changes in expression level, which may be more frequent inregulatory genes, are more difficult to detect but can nevertheless be very relevantbiologically, because they may result in large changes in expression of target genes.Furthermore, many regulatory genes often display pleiotropic effects. A change inexpression of such key regulators can affect the expression of many more targetgenes, which may skew the distribution of differently expressed genes in favor ofclasses containing predominantly target genes.
Figure 6: Frequency distribution of the proportion of mapped genes versus function.(A) Proportion of genes that could be mapped in different Gene Ontology categories of biologicalprocesses. (B) Proportion of genes that could be mapped in different Gene Ontology categories ofmolecular functions. Solid, shaded, and white bars represent local, distant, and both local and distantregulation.

Chapter 3
56
Interestingly, when these analyses were performed separately for locallyand distantly regulated genes, regulatory categories showed a comparableproportion of distantly regulated genes with other classes but a much smallerproportion of locally regulated genes (Figure 6). Comparing locally to distantlyregulated genes (Al Shahrour et al., 2004) resulted in significant overrepresentationof distantly regulated genes in ten Gene Ontology biological process categories, allinvolved in regulation. Only one category was detected in which locally regulatedgenes were overrepresented (Table 2). This finding agrees with the generalassumption that regulatory genes are much more strongly conserved than othergenes because of their often pleiotropic effects.
Table 2: Gene ontology categories with significantly different proportions of locally versus distantlyregulated genes. The second and fourth column represent, for each category respectively, how manygenes of the test set were locally and distantly regulated. The third and fifth column represent, for eachcategory respectively, the proportion of the total number of annotated genes in the test set that werelocally and distantly regulated. The sixth column represents, for each category, the P value of observeddifferences between locally and distantly regulated genes. n.s., not significant.
Local DistantGene Ontology category Genes % Genes % P valueBiological processregulation of cellular process 69 7.6 135 14.4 1.68E 03regulation of cellular metabolism 58 7.2 120 14.2 1.68E 03regulation of nucleic acid metabolism 57 8.2 118 16.1 1.68E 03regulation of transcription 56 10.4 117 20.7 1.68E 03regulation of metabolism 59 7.0 121 13.4 2.02E 03regulation of cellular physiological process 69 8.2 135 15.0 2.02E 03transcription 63 9.1 123 16.8 2.52E 03regulation of physiological process 74 8.2 136 14.5 2.99E 03RNA processing 31 5.7 9 1.6 3.86E 02transcription, DNA dependent 29 5.4 65 11.5 3.86E 02regulation of transcription, DNA dependent 29 8.6 64 17.9 3.86E 02
Molecular functiontranscription factor activity 64 6.2 125 11.5 1.60E 02
Cellular componentn.s.
A dual approach for the construction of regulatory networks reveals novelregulatory steps for flowering timeGenetic regulatory networks consist of a collection of genes, which areinterconnected because one gene regulates the transcription of another directly or

Regulatory network construction using genome wide gene expression QTLs
57
indirectly. The analysis of gene expression in a mapping population can greatlyenhance the construction of such networks. If an eQTL results from differences inexpression of a regulator, this regulator is likely to show correlation in expressionlevels with the gene that mapped to its position (Bing and Hoeschele, 2005).Multiple genes involved in the same biological process mapping to the sameposition indicates that many of them might be under the control of the same gene.We reasoned that the best candidate within an eQTL interval is the gene whoseexpression best correlates with multiple genes mapping to the position of thatgene. We therefore combined expression trait profiling with eQTL mapping, geneannotation, and extended iterative Group Analysis (iGA) (Breitling et al., 2004) tosort candidate regulators based on their PC value (Possibility of Change), whichtells, for a given regulator, how likely it is to observe a strong correlation withmultiple members of a selected group of genes. This novel approach enabled us todrastically narrow down the number of candidate genes in an eQTL interval andselect the best candidate for the construction of genetic regulatory networks.
To verify our approach, we focused on one of the best studied and mostcomplete genetic regulatory networks available in plants: the regulation offlowering in Arabidopsis. Flowering time is highly variable between accessions ofArabidopsis (Koornneef et al., 2004). Variation in flowering time also existsbetween Ler and Cvi, and several studies have reported QTLs for this trait (AlonsoBlanco et al., 1998a; Ungerer et al., 2002; Juenger et al., 2005). Although floweringstarts much later, the expression of genes that indicate commitment to floweringare already apparent at very early stage and find their transcription peak in theseedling stage (Kobayashi et al., 1999; Zimmermann et al., 2004). We selected a setof 192 genes known to be involved in the control of flowering from recentliterature (see supplemental Table 5 at www.pnas.org/cgi/content/full/0610429104/DC1 for a full list) and keyword searching in The Arabidopsis InformationResource database; 175 of these genes were analyzed in our study. Analysis of theirexpression level in the parental accessions assigned eight of them as beingdifferentially expressed. However, 83 genes showed at least one eQTL at agenome wide threshold of 2.23 x 10 3. We calculated PC values for correlation inexpression profiles, using the group of 83 mapped flower genes and all candidategenes within their eQTL support intervals. We then selected the genes within theeQTL support interval of a given flower gene with significant PC values (FDR =0.05) as candidates for this eQTL (supplemental Table 5 at www.pnas.org/cgi/content/full/0610429104/DC1). Regulators were predicted for 51 genes, whereas for32 genes no significant PC value was obtained

Chapter 3
58
Figure 7: Regulatory network of genes involved in the transition to flowering. Flower genes are connected to their most likely regulator by directional edges. Arrows and bars represent stimulative and repressive regulation, respectively.
Figure 7 shows a network of flower genes and their most likely regulators.The most significant regulator detected was GIGANTEA (GI) with a PC value of1.01 x 10 12. Thirteen genes mapped to GI, including GI itself, and all of themcontributed to the lowest PC value. GI is the first member of an output pathway ofthe circadian clock that controls flowering time and has been shown to regulatecircadian rhythms in Arabidopsis (Mizoguchi et al., 2005). At the position of GI, aminor flowering time QTL (Alonso Blanco et al., 1998a) and a circadian periodlength QTL (Swarup et al., 1999; Michael et al., 2003) were identified, whichindicates the physiological consequences of this complex pattern of geneexpression variation. Indeed many of the genes, like CCA1 (see supplemental Table

Regulatory network construction using genome wide gene expression QTLs
59
5 at www.pnas.org/cgi/content/full/0610429104/DC1 for details), LHY1, ELF4, andTOC1, for which GI was identified as their most likely regulator, belong to the corecircadian oscillator (Boss et al., 2004). Others are involved in the regulation of thecircadian clock, such as PCL1, APRR9, and FKF1 (Michael et al., 2003; Onai andIshiura, 2005), or play a role in floral transition, such as ELF7 and the CONSTANSLIKE family COL1, COL2, and COL9 (Ledger et al., 2001; He et al., 2004; Cheng andWang, 2005). A second cluster of co regulated genes is involved in floral repressionand mapped to FLG, another major QTL for flowering time. Where the floralrepressors FLC,MAF1,MAF4,MAF5, and TOE1 (Boss et al., 2004) are up regulated,the floral promoter CRY2 (Boss et al., 2004) is down regulated by this locus, inagreement with findings that FLC expression negatively correlates with CRY2 (ElDin El Assal et al., 2003). In addition to FLG, CRY2 and FLC are major effect QTLsfor flowering time in the Ler x Cvi population, and significant epistasis has beenfound between CRY2 and FLC (El Din El Assal et al., 2003) and between the FLCregion and the FLG locus (Alonso Blanco et al., 1998a). Although HUA2 waspreviously suggested as a candidate for the FLG locus (Doyle et al., 2005), we didnot identify it as such and found a gene with unknown function (At5g23460) to bethe most likely candidate. Other clusters are predominantly involved in hormonalpathways (MYB33, ARF6, ARF8, RD29B, and SHI) (Mouradov et al., 2002; Nagpal etal., 2005) and the photoperiod pathway (PIE1, CAM1, PHYE, and ESD4) (Levy andDean, 1998; Boss et al., 2004) of flowering.
To identify other possible target genes of the most significant regulator(GI), we calculated the correlation coefficient between the genes of the GIregulatory cluster and all other genes. Strong correlation was observed for 280transcripts at an empirical correlation coefficient cutoff of 0.55, corresponding to aFDR of 9.5 x 10 5 (supplemental Table 6 at www.pnas.org/cgi/content/full/0610429104/DC1). Many of these genes showed no significant linkage at theposition of GI but several displayed a suggestive eQTL. Although correlation canbe a result of linked genetic effect, only 32 locally regulated genes were locatedwithin 2.5 Mbp of GI. The highest correlation coefficient (0.75) was found for aCONSTANS LIKE PROTEIN encoding gene (At1g07050). The long day integratorCONSTANS (CO) has been shown to be a direct target of GI (Mizoguchi et al.,2005), although it was not identified as such in our study. Two other genesassociated with circadian rhythms, APRR5 and WNK1, were detected, and bothshowed a suggestive eQTL at the position of GI. APRR genes are paralogs of TOC1and have been shown to be regulated by the protein kinase WNK1 (Nakamichi etal., 2002). These results suggest that the feedback regulation of the circadian clockby GI acts, at least partly, throughWNK1 and APRR5.

Chapter 3
60
DISCUSSION
Genetic variation in gene expression is abundant and complexWe determined differences in gene expression between two distinct accessions ofArabidopsis and within an RIL population derived from these accessions.
Our data suggest that variation in gene expression among geneticallydifferent plants of the same species is for a large part genetically controlled andhighly complex. Although eQTLs were detected for >4,000 genes, only 922 weredifferentially expressed between the parents, which suggests that the expression ofmany genes is controlled by multiple loci with opposing effects, avoiding largedifferences between natural accessions but generating strong transgression in asegregating population. This suggestion is supported by the differences inheritability, as calculated from the parental and population expression analyses.This difference between the two heritability estimates might have several reasons.First, statistical issues might bias the outcome of the analyses. False negativesmight bias the number of genes differentially expressed between the parentsdownwards, because statistical power was limited to ten replicate measurementsof each parent. On the other hand, false positives due to low signal to noise ratiosfor low expressed genes might bias the number of mapped genes upwards.However, most mapped genes had medium to high expression levels (Figure 2A).
A second and more likely reason why mapped genes were notsignificantly differently expressed between the parents, given the extent of thedifference in number, might be the complex genetic inheritance of gene expression.Illustrating this finding is that although the median heritability of mapped geneswas 82.4%, only a median 28.4% of the variation observed for mapped genes couldbe explained by significant eQTLs. Furthermore, although the proportion ofmapped genes increased with higher heritability values, many genes with a highheritability could not be mapped significantly. Together with the strongtransgression observed for many genes, these data imply that regulation ofexpression often occurs through the added effect of numerous small effect loci,each of which fail to pass the significance threshold.
Because two color arrays were used in this study, a dye effect can beexpected in subsequent analyses. In our experiment, dye effect was controlled andcorrected at two levels. At the level of the experimental design, we balanced thedye effect between two alleles by optimizing for the number of Ler/Cvi and Cvi/Lercomparisons at each marker position (Fu and Jansen, 2006). At the analysis levelwe included the gene specific differential effect between the two dyes in the QTLanalysis model (Dobbin et al., 2005).

Regulatory network construction using genome wide gene expression QTLs
61
Molecular background of expression variationMany factors, ranging from abiotic external influences to direct active control oftranscriptional activity, influence the level of transcript abundance of a given gene.Here, we focused on genetic factors contributing to whole genome transcriptlevels. Our data showed that genes whose transcript variation could be mappedare not equally distributed over the Arabidopsis genome. Although a strongcorrelation between the total number of genes per unit of chromosome and thosethat could be mapped was observed, other explanations, such as differences inchromatin structure or SNP frequency, cannot be excluded. Illustrative for this wasthe correlation observed between SNP frequency and the proportion of mappedgenes.
Anchoring of the genetic map enabled us to define local versus distantregulation. Although, in general, local regulation seems stronger, distantregulation occurs more frequently. These findings were demonstrated bydecreasing the significance threshold; only a minor number of additional locallyregulated genes were detected, whereas the number of distantly regulated genesincreased more than two fold. Because the vast majority of genes showing locallinkage are expected to be cis regulated (Ronald et al., 2005), this difference inincrease can be explained by the direct influence of cis polymorphisms onexpression, whereas trans polymorphisms exert their effect indirectly through achange in expression or coding sequence of a second gene. Taking together thestrong transgression observed for many genes and the number of distantly versuslocally regulated genes, it is conceivable that many cis regulated genes exertpleiotropic effects on the expression of other genes and are causal for many of theeQTLs acting in trans.
Regulatory networksFor many biological processes, the genes contributing to a certain phenotype areoften well known. However, in many cases, little is known about the regulationand interaction of these genes. We combined expression information with eQTLmapping, gene annotation, and iterative Group Analysis to identify likelyregulators. This approach enabled, for the first time, the construction of maximumlikelihood genetic regulatory networks from a genome wide genetical genomicsexperiment. A case study that used genes involved in the well known process oftransition from a vegetative state to a flowering state confirmed many of theinteractions identified previously. Moreover, numerous novel interactions that canserve to form hypothesis for future studies were predicted. It must be noted,however, that analyses were performed on data from a single time point. It is notunlikely that regulation occurs differently at other developmental stages or diurnal

Chapter 3
62
phase or even organ, specifically. Especially for pathways influenced by thecircadian clock, such as flowering time, expression differences at one time pointcan be caused by differences in circadian phase (Michael et al., 2003; Darrah et al.,2006). Accuracy and reliability would therefore benefit from gene expressionanalysis at multiple developmental stages and time points. Nevertheless,confidence in the followed approach was gained from the fact that manyfunctionally related genes grouped together, indicating common and simultaneousregulation. We assigned the gene with the lowest PC value as the most likelycandidate responsible for this regulation although other genes with significant PCvalues can not be ruled out a priori. Moreover, due to coincidental genetic linkageof regulators, independently regulated genes may show a high correlation inexpression. This potential source of false candidate assignment is especially proneto hot spots of locally regulated genes. Subsequent in depth analysis should beperformed to unambiguously identify genes underlying eQTLs, but the number ofcandidate genes decreased substantially with the described method.
Regulatory network construction using genome wide gene expression QTLs
63
MATERIALS ANDMETHODS
Plant material and tissue collectionAerial parts of seedlings from the accessions Ler and Cvi and a population of 160recombinant inbred lines derived from a cross between these parents (AlonsoBlanco et al., 1998b; Keurentjes et al., 2006) were grown and collected as describedpreviously (Keurentjes et al., 2006). In brief, seeds of lines were sown in petri disheson 1/2MS agar and placed in a cold room for seven days. Petri dishes were thentransferred to a climate chamber and seedlings were collected after seven days.Plant material was stored at 80°C until further processing.
Linkage map construction and anchoring to the physical mapThe genetic map was constructed from a subset of the markers available, athttp:/nasc.nott.ac.uk/, with a few new markers added. The computer programJoinMap 4 (van Ooijen, 2006) was used for the calculation of linkage groups andgenetic distances. In total, 144 markers were used, with an average spacing of 3.5cM. The largest distance between two markers was 10.8 cM.
To anchor the genetic map to the physical map of Arabidopsis, the total setof 291 available markers was analyzed. First, a genetic map that comprised all 291markers was constructed. Physical positions of molecular PCR markers wereobtained from The Arabidopsis Information Resource, release 6.0 (www.arabidopsis.org). Sequences of amplified fragment length polymorphism markerswere obtained by in silico amplification of Col markers that were polymorphicbetween Ler and Cvi (Peters et al., 2001) or by sequencing fragments polymorphicbetween Ler and Cvi but absent in Col. The retrieved marker sequences were thenblasted against the completely sequenced Col genome, and center positions ofpositive hits were taken as the physical position. Physical positions could beestablished for 179 markers; positions of remaining markers were inferred frominterpolation by using the closest nearby markers for which a physical positionwas known. The largest gap between two markers with confirmed physicalposition comprised 3.5 Mbp, which corresponded to a genetic distance ofapproximately 15 cM.
Sample preparationTotal RNA of each line was isolated from two biological replicates by usingphenol chloroform extraction (Jones et al., 1985). Extracts were then combined andpurified with RNeasy (Qiagen, Valencia, CA), amplified with the MessageAmpaRNA kit (Ambion, Austin, TX) incorporating 5 (3 aminoallyl) UTP, and labeled

Chapter 3
64
with Cy3 or Cy5 mono reactive dye (Amersham, Piscataway, NJ.). All RNAproducts were purified by using the Rneasy kit (Qiagen). Labeled RNA wasfragmented for 15 minutes before hybridization (fragmentation reagent obtainedfrom Ambion).
Microarray analysesArabidopsis DNA microarrays were provided by the Galbraith laboratory(University of Arizona, Tucson, AZ) and were produced from a set of 70 meroligonucleotides, representing 24,065 unique genes (Array Ready Oligo Set,version 1.0, Qiagen Operon).
DNA probe immobilization and hybridization was performed according toinstructions from the Galbraith laboratory. Arrays were scanned by using aScanArray Express HT (PerkinElmer, Wellesley, MA) and quantified by usingImagene 6.0 (BioDiscovery, El Segundo, CA).
Experimental designGenome wide gene expression analysis was carried out for Ler and Cvi and an RILpopulation derived from a cross between these two accessions. Ten replicates ofthe parental lines were compared in direct hybridizations by using a dye swapdesign. The 160 RILs were analyzed by direct hybridization of two geneticallydistant lines on each array, leading to a total of 80 slides. A novel distant pairdesign, which was proposed specifically for genetic studies on gene expression (Fuand Jansen, 2006) was used. An optimal design was obtained through simulatedannealing, in which pairs of genetically distant lines were hybridized to maximizethe direct comparisons between two different alleles at each marker. The numbersof Ler/Cvi and Cvi/Ler comparisons at each marker were optimized for equal ratioto balance dye effects, and their total number was optimized for minimal extravariation across other markers. The observed signal intensities on the arrays weresubjected to general normalization procedures (Yang et al., 2002; Smyth, 2004).Resulting log signal intensities and log ratios between co hybridized RILs wereused for further analyses.
Statistical analysesDifferential expression of genes between the two parents was tested forsignificance. For each gene, the P value of a t test and the corresponding q values(Storey and Tibshirani, 2003) were computed (Smyth, 2004). The P valuesignificance threshold was 2.5 x 10 3 at a q value cutoff of 0.05.
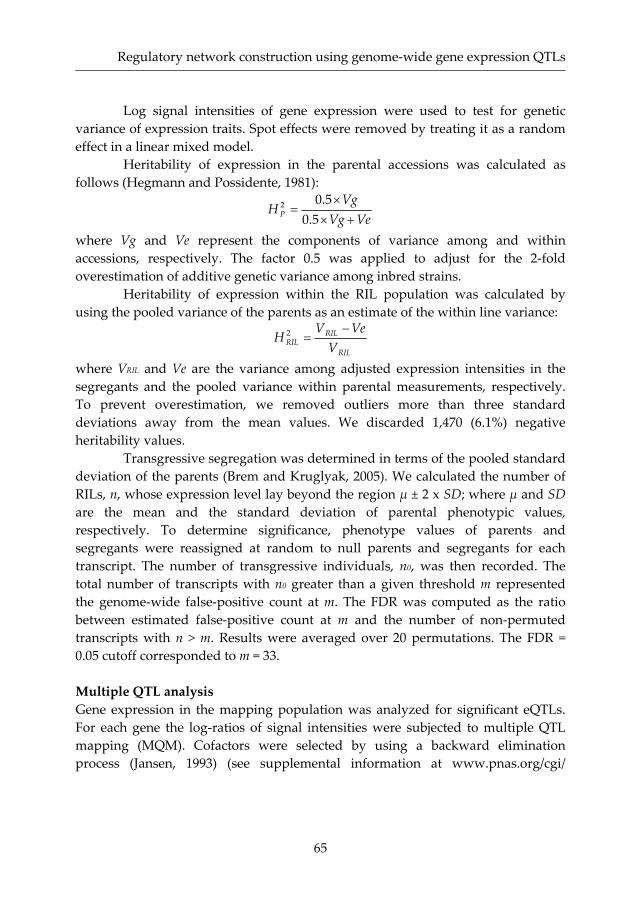
Regulatory network construction using genome wide gene expression QTLs
65
Log signal intensities of gene expression were used to test for geneticvariance of expression traits. Spot effects were removed by treating it as a randomeffect in a linear mixed model.
Heritability of expression in the parental accessions was calculated asfollows (Hegmann and Possidente, 1981):
VeVgVg
HP 5.05.02
where Vg and Ve represent the components of variance among and withinaccessions, respectively. The factor 0.5 was applied to adjust for the 2 foldoverestimation of additive genetic variance among inbred strains.
Heritability of expression within the RIL population was calculated byusing the pooled variance of the parents as an estimate of the within line variance:
RIL
RILRIL V
VeVH 2
where VRIL and Ve are the variance among adjusted expression intensities in thesegregants and the pooled variance within parental measurements, respectively.To prevent overestimation, we removed outliers more than three standarddeviations away from the mean values. We discarded 1,470 (6.1%) negativeheritability values.
Transgressive segregation was determined in terms of the pooled standarddeviation of the parents (Brem and Kruglyak, 2005). We calculated the number ofRILs, n, whose expression level lay beyond the region ± 2 x SD; where and SDare the mean and the standard deviation of parental phenotypic values,respectively. To determine significance, phenotype values of parents andsegregants were reassigned at random to null parents and segregants for eachtranscript. The number of transgressive individuals, n0, was then recorded. Thetotal number of transcripts with n0 greater than a given threshold m representedthe genome wide false positive count at m. The FDR was computed as the ratiobetween estimated false positive count at m and the number of non permutedtranscripts with n > m. Results were averaged over 20 permutations. The FDR =0.05 cutoff corresponded to m = 33.
Multiple QTL analysisGene expression in the mapping population was analyzed for significant eQTLs.For each gene the log ratios of signal intensities were subjected to multiple QTLmapping (MQM). Cofactors were selected by using a backward eliminationprocess (Jansen, 1993) (see supplemental information at www.pnas.org/cgi/

Chapter 3
66
content/full/0610429104/DC1). For every marker by gene combination, the MQMmodel can be given as:
km
iiikk xbxby
1
where y is the expression ratio of a transcript, is the gene specific differentialeffect between Cy3 and Cy5 dyes (characterized as consistent across samples)(Dobbin et al., 2005), x denotes the genotype comparison and takes the followingvalues: 1 for Ler/Cvi, 1 for Cvi/Ler and 0 for Ler/Ler and Cvi/Cvi; b is thesubstitution effect; k is the kth marker under study; and i denotes the cofactors from1 to mk, outside a 30 cM interval of the kth marker. The P value from a t test thattested the hypothesis that bk = 0 was used as a measure of significance of theassociation.
A genome wide P value threshold of 2.23 x 10 3 at = 0.05 for a single traitwas estimated by a 10,000 permutation test (Churchill and Doerge, 1994). But for astudy with 24,065 gene transcripts, we controlled the false discovery rate (FDR)based on the pool of P values for all markers and all transcripts. Because the Pvalues are correlated when markers are linked, the FDR increases depending onthe number of markers on a chromosome (Benjamini and Yekutieli, 2001). In ourexperiment, the maximum number of markers reached 35 (chromosome 5), and asimulation analysis (data not shown) that used Storey’s algorithm to control theFDR (Storey, 2002) at a desired level indeed showed a 4.4 fold increase of theactual FDR. To account for this increase, we corrected the FDR by a factor of 5 andcalculated the genome wide P value threshold at Storey’s FDR of 0.01 for all genemarker P values, to make sure that the real FDR rate is <0.05 (corrected FDR =0.05). The estimated P value threshold then corresponded to 5.29 x 10 5, and thisthreshold was used as a significance threshold for the detection of eQTLs.
Explained variance of detected eQTLs was estimated by fitting expressionratios of all detected eQTLs and their interactions in a linear model. We usedANOVA to estimate the fraction of variance explained by each eQTL and eQTLinteractions.
Local and distant regulationWe determined the physical position of each eQTL by anchoring the genetic mapof the Ler x Cvi population to the physical map of the sequenced accession Col.Support intervals were then calculated by setting left and right border positionsassociated with max{–Log10P} 1.5, where P represents the significance value forlinkage (Keurentjes et al., 2006).
The physical positions of genes (The Arabidopsis Information Resource,version 2005.12.8) showing significant linkage of expression values were then

Regulatory network construction using genome wide gene expression QTLs
67
compared with the positions of their respective eQTL(s); a gene was classified aslocally regulated when its position coincided with the support interval and asdistantly regulated when it did not.
Distribution of hot spotseQTL hot spots are shown by the frequency distribution of the number ofsignificant eQTLs detected. Each eQTL is presented by the marker showing themost significant linkage. The frequency distribution of eQTLs by chance wasempirically estimated by 250 permutations (de Koning and Haley, 2005). The 95thpercentile, corresponding to 43 eQTLs, was used as a confidence threshold for theoccurrence of a hot spot.
Sliding window analysesAll 24,065 genes analyzed were positioned on the Arabidopsis physical map, andthe ATG start codon was used as the start of each gene. Each gene was classified aslocally regulated, distantly regulated, or non regulated. The frequency of the totalnumber of genes and the number of locally and distantly regulated genes alongeach chromosome was determined in a 5 Mbp sliding window by using a 50 Kbpstep size.
Polymorphisms between Ler and Cvi in 875 sequenced loci (Nordborg etal., 2005) were downloaded from the MSQT website (http://msqt.weigelworld.org)and filtered for unique positions. INDELs were recorded as a single polymorphismby using the physical position of the first nucleotide difference. A total number of4,032 polymorphisms were subjected to further analysis. A sliding windowanalysis for SNP frequency was then carried out as described above.
Observed gene and SNP frequencies per window were standardized byusing the genome wide average and standard deviation, and resulting z scoreswere plotted at the physical position of the center of each window.
Genetic network constructionA group of 83 functionally related genes and their potential regulators were usedfor the construction of a genetic regulatory network. All of the genes that werephysically located in an eQTL interval were assigned as a regulator candidate forthe gene for which that eQTL was detected. The candidates were sorted by usingiterative Group Analysis (iGA) (Breitling et al., 2004). We postulated that, amongall possible regulators, the best candidates are those that correlate particularly wellto a large number of their potential target genes.
To test that postulation, we calculated all pair wise Spearman rankcorrelations on expression profiles (80 log ratios of co hybridized RILs) between

Chapter 3
68
each of the 83 functionally related genes and all potential regulators in their eQTLintervals. These values were then rank ordered so that the strongly correlatedgene candidate pairs were at the top of the list. For each given candidate, wedetermined the iGA possibility of change value (PC value, supplemental Table 5 atwww.pnas.org/cgi/content/full/0610429104/DC1). The PC value threshold wasBonferroni adjusted as 0.05/m, where m is the total number of candidate genes.Any candidate with a significant PC value is a putative regulator, and all genescontributing to this value are putative target genes. We defined the regulatoryrelation in terms of the sign of the correlation coefficient. If the correlationcoefficient is negative, regulation is repressive; otherwise it is stimulative.
Potential target genes outside the initial group of functionally relatedgenes were identified by using expression trait correlations (Lan et al., 2006), forwhich we used the regulators and target genes obtained from the iGA study asseed transcripts. We then split the log ratio gene expression profile matrix (a x b)into two parts: a1 x b and a2 x b, where a is the total number of gene transcripts (a =24,065 in our case); a1 is the number of seed transcripts; a2 is the number of othergenes (a1 + a2 = a) and b is the number of arrays (b = 80 in our case). We thencomputed the Spearman correlation coefficient and its corresponding P valuebetween each a1 seed gene and a2 transcript. A 95percentile empirical threshold (r =0.55) and its corresponding FDR (Storey and Tibshirani, 2003) (FDR = 9.5 x 10 5)were estimated by performing 1,000 permutations.
AcknowledgementsWe thank David Galbraith for providing microarrays and protocols, Janny Petersfor providing data of In silico AFLP analysis and Linus van der Plas for criticalreading of the manuscript. This work was supported by a grant from theNetherlands Organization for Scientific Research, Program Genomics (050 10 029).

Regulatory network construction using genome wide gene expression QTLs
69
REFERENCES
Al Shahrour, F., Diaz Uriarte, R. and Dopazo, J. (2004). FatiGO: a web tool for finding significantassociations of Gene Ontology terms with groups of genes. Bioinformatics 20, 578 580.
Alonso Blanco, C., El Assal, S.E., Coupland, G. and Koornneef, M. (1998a). Analysis of natural allelicvariation at flowering time loci in the Landsberg erecta and Cape Verde Islands ecotypes ofArabidopsis thaliana. Genetics 149, 749 764.
Alonso Blanco, C., Peeters, A.J., Koornneef, M., Lister, C., Dean, C., van den Bosch, N., Pot, J. andKuiper, M.T. (1998b). Development of an AFLP based linkage map of Ler, Col and CviArabidopsis thaliana ecotypes and construction of a Ler/Cvi recombinant inbred linepopulation. Plant J 14, 259 271.
Benjamini, Y. and Yekutieli, D. (2001). The control of the false discovery rate in multiple testing underdependency. Ann. Stat. 29, 1165 1188.
Bing, N. and Hoeschele, I. (2005). Genetical genomics analysis of a yeast segregant population fortranscription network inference. Genetics 170, 533 542.
Borevitz, J. (2006). Genotyping and mapping with high density oligonucleotide arrays.Methods Mol Biol323, 137 145.
Boss, P.K., Bastow, R.M., Mylne, J.S. and Dean, C. (2004). Multiple pathways in the decision to flower:enabling, promoting, and resetting. Plant Cell 16 Suppl, S18 31.
Breitling, R., Amtmann, A. and Herzyk, P. (2004). Iterative Group Analysis (iGA): a simple tool toenhance sensitivity and facilitate interpretation of microarray experiments. BMCBioinformatics 5, 34.
Brem, R.B., Yvert, G., Clinton, R. and Kruglyak, L. (2002). Genetic dissection of transcriptionalregulation in budding yeast. Science 296, 752 755.
Brem, R.B. and Kruglyak, L. (2005). The landscape of genetic complexity across 5,700 gene expressiontraits in yeast. Proc Natl Acad Sci U S A 102, 1572 1577.
Brem, R.B., Storey, J.D., Whittle, J. and Kruglyak, L. (2005). Genetic interactions betweenpolymorphisms that affect gene expression in yeast. Nature 436, 701 703.
Bystrykh, L., Weersing, E., Dontje, B., Sutton, S., Pletcher, M.T., Wiltshire, T., Su, A.I., Vellenga, E.,Wang, J., Manly, K.F. et al. (2005). Uncovering regulatory pathways that affect hematopoieticstem cell function using genetical genomics . Nat Genet 37, 225 232.
Cheng, X.F. and Wang, Z.Y. (2005). Overexpression of COL9, a CONSTANS LIKE gene, delaysflowering by reducing expression of CO and FT in Arabidopsis thaliana. Plant J 43, 758 768.
Churchill, G.A. and Doerge, R.W. (1994). Empirical threshold values for quantitative trait mapping.Genetics 138, 963 971.
Darrah, C., Taylor, B.L., Edwards, K.D., Brown, P.E., Hall, A. and McWatters, H.G. (2006). Analysis ofphase of LUCIFERASE expression reveals novel circadian quantitative trait loci inArabidopsis. Plant Physiol 140, 1464 1474.
de Koning, D.J. and Haley, C.S. (2005). Genetical genomics in humans and model organisms. TrendsGenet 21, 377 381.
DeCook, R., Lall, S., Nettleton, D. and Howell, S.H. (2006). Genetic regulation of gene expressionduring shoot development in Arabidopsis. Genetics 172, 1155 1164.
Dobbin, K.K., Kawasaki, E.S., Petersen, D.W. and Simon, R.M. (2005). Characterizing dye bias inmicroarray experiments. Bioinformatics 21, 2430 2437.
Doyle, M.R., Bizzell, C.M., Keller, M.R., Michaels, S.D., Song, J., Noh, Y.S. and Amasino, R.M. (2005).HUA2 is required for the expression of floral repressors in Arabidopsis thaliana. Plant J 41,376 385.
Chapter 3
70
El Din El Assal, S., Alonso Blanco, C., Peeters, A.J., Wagemaker, C., Weller, J.L. and Koornneef, M.(2003). The role of cryptochrome 2 in flowering in Arabidopsis. Plant Physiol 133, 1504 1516.
Fu, J. and Jansen, R.C. (2006). Optimal design and analysis of genetic studies on gene expression.Genetics 172, 1993 1999.
He, Y., Doyle, M.R. and Amasino, R.M. (2004). PAF1 complex mediated histone methylation ofFLOWERING LOCUS C chromatin is required for the vernalization responsive, winterannual habit in Arabidopsis. Genes Dev 18, 2774 2784.
Hegmann, J.P. and Possidente, B. (1981). Estimating genetic correlations from inbred strains. BehavGenet 11, 103 114.
Hubner, N., Wallace, C.A., Zimdahl, H., Petretto, E., Schulz, H., Maciver, F., Mueller, M., Hummel,O., Monti, J., Zidek, V. et al. (2005). Integrated transcriptional profiling and linkage analysisfor identification of genes underlying disease. Nat Genet 37, 243 253.
Jansen, R.C. (1993). Interval mapping of multiple quantitative trait loci. Genetics 135, 205 211.Jansen, R.C. and Nap, J.P. (2001). Genetical genomics: the added value from segregation. Trends Genet
17, 388 391.Jones, J.D., Dunsmuir, P. and Bedbrook, J. (1985). High level expression of introduced chimaeric genes
in regenerated transformed plants. Embo J 4, 2411 2418.Juenger, T.E., Sen, S., Stowe, K.A. and Simms, E.L. (2005). Epistasis and genotype environment
interaction for quantitative trait loci affecting flowering time in Arabidopsis thaliana. Genetica123, 87 105.
Kendziorski, C. and Wang, P. (2006). A review of statistical methods for expression quantitative traitloci mapping.Mamm Genome 17, 509 517.
Keurentjes, J.J.B., Fu, J., de Vos, C.H., Lommen, A., Hall, R.D., Bino, R.J., van der Plas, L.H., Jansen,R.C., Vreugdenhil, D. and Koornneef, M. (2006). The genetics of plant metabolism. Nat Genet38, 842 849.
Kliebenstein, D.J., West, M.A., van Leeuwen, H., Loudet, O., Doerge, R.W. and St Clair, D.A. (2006).Identification of QTLs controlling gene expression networks defined a priori. BMCBioinformatics 7, 308.
Kobayashi, Y., Kaya, H., Goto, K., Iwabuchi, M. and Araki, T. (1999). A pair of related genes withantagonistic roles in mediating flowering signals. Science 286, 1960 1962.
Koornneef, M., Alonso Blanco, C. and Vreugdenhil, D. (2004). Naturally occurring genetic variation inArabidopsis thaliana. Annu Rev Plant Biol 55, 141 172.
Lan, H., Chen, M., Flowers, J.B., Yandell, B.S., Stapleton, D.S., Mata, C.M., Mui, E.T., Flowers, M.T.,Schueler, K.L., Manly, K.F. et al. (2006). Combined expression trait correlations andexpression quantitative trait locus mapping. PLoS Genet 2, e6.
Ledger, S., Strayer, C., Ashton, F., Kay, S.A. and Putterill, J. (2001). Analysis of the function of twocircadian regulated CONSTANS LIKE genes. Plant J 26, 15 22.
Levy, Y.Y. and Dean, C. (1998). The transition to flowering. Plant Cell 10, 1973 1990.Michael, T.P., Salome, P.A., Yu, H.J., Spencer, T.R., Sharp, E.L., McPeek, M.A., Alonso, J.M., Ecker,
J.R. and McClung, C.R. (2003). Enhanced fitness conferred by naturally occurring variation inthe circadian clock. Science 302, 1049 1053.
Mizoguchi, T., Wright, L., Fujiwara, S., Cremer, F., Lee, K., Onouchi, H., Mouradov, A., Fowler, S.,Kamada, H., Putterill, J. et al. (2005). Distinct roles of GIGANTEA in promoting floweringand regulating circadian rhythms in Arabidopsis. Plant Cell 17, 2255 2270.
Morley, M., Molony, C.M., Weber, T.M., Devlin, J.L., Ewens, K.G., Spielman, R.S. and Cheung, V.G.(2004). Genetic analysis of genome wide variation in human gene expression. Nature 430, 743747.

Regulatory network construction using genome wide gene expression QTLs
71
Mouradov, A., Cremer, F. and Coupland, G. (2002). Control of flowering time: interacting pathways asa basis for diversity. Plant Cell 14 Suppl, S111 130.
Nagpal, P., Ellis, C.M., Weber, H., Ploense, S.E., Barkawi, L.S., Guilfoyle, T.J., Hagen, G., Alonso,J.M., Cohen, J.D., Farmer, E.E. et al. (2005). Auxin response factors ARF6 and ARF8 promotejasmonic acid production and flower maturation. Development 132, 4107 4118.
Nakamichi, N., Murakami Kojima, M., Sato, E., Kishi, Y., Yamashino, T. and Mizuno, T. (2002).Compilation and characterization of a novel WNK family of protein kinases in Arabiodpsisthaliana with reference to circadian rhythms. Biosci Biotechnol Biochem 66, 2429 2436.
Nordborg, M., Hu, T.T., Ishino, Y., Jhaveri, J., Toomajian, C., Zheng, H., Bakker, E., Calabrese, P.,Gladstone, J., Goyal, R. et al. (2005). The pattern of polymorphism in Arabidopsis thaliana.PLoS Biol 3, e196.
Onai, K. and Ishiura, M. (2005). PHYTOCLOCK 1 encoding a novel GARP protein essential for theArabidopsis circadian clock. Genes Cells 10, 963 972.
Peters, J.L., Constandt, H., Neyt, P., Cnops, G., Zethof, J., Zabeau, M. and Gerats, T. (2001). A physicalamplified fragment length polymorphism map of Arabidopsis. Plant Physiol 127, 1579 1589.
Rockman, M.V. and Kruglyak, L. (2006). Genetics of global gene expression. Nat Rev Genet 7, 862 872.Ronald, J., Brem, R.B., Whittle, J. and Kruglyak, L. (2005). Local regulatory variation in Saccharomyces
cerevisiae. PLoS Genet 1, e25.Schadt, E.E., Monks, S.A., Drake, T.A., Lusis, A.J., Che, N., Colinayo, V., Ruff, T.G., Milligan, S.B.,
Lamb, J.R., Cavet, G. et al. (2003). Genetics of gene expression surveyed in maize, mouse andman. Nature 422, 297 302.
Smyth, G.K. (2004). Linear models and empirical bayes methods for assessing differential expression inmicroarray experiments. Stat Appl Genet Mol Biol 3, Article3.
Storey, J.D. (2002). A direct approach to false discovery rates J. R. Statist. Soc. B 64, 479 498.Storey, J.D. and Tibshirani, R. (2003). Statistical significance for genomewide studies. Proc Natl Acad Sci
U S A 100, 9440 9445.Storey, J.D., Akey, J.M. and Kruglyak, L. (2005). Multiple locus linkage analysis of genomewide
expression in yeast. PLoS Biol 3, e267.Swarup, K., Alonso Blanco, C., Lynn, J.R., Michaels, S.D., Amasino, R.M., Koornneef, M. and Millar,
A.J. (1999). Natural allelic variation identifies new genes in the Arabidopsis circadian system.Plant J 20, 67 77.
Torii, K.U., Mitsukawa, N., Oosumi, T., Matsuura, Y., Yokoyama, R., Whittier, R.F. and Komeda, Y.(1996). The Arabidopsis ERECTA gene encodes a putative receptor protein kinase withextracellular leucine rich repeats. Plant Cell 8, 735 746.
Ungerer, M.C., Halldorsdottir, S.S., Modliszewski, J.L., Mackay, T.F. and Purugganan, M.D. (2002).Quantitative trait loci for inflorescence development in Arabidopsis thaliana. Genetics 160,1133 1151.
van Ooijen, J.W. (2006). Joinmap 4, Software for the calculation of genetic linkage maps in experimentalpopulations. In JoinMap (Wageningen, The Netherlands: Kyazma B.V.).
Wayne, M.L. and McIntyre, L.M. (2002). Combining mapping and arraying: An approach to candidategene identification. Proc Natl Acad Sci U S A 99, 14903 14906.
Yang, Y.H., Buckley, M.J., Dudoit, S. and Speed, T.P. (2002). Comparison of methods for imageanalysis on cDNA microarray data. J Comput Graph Stat 11, 108 136.
Yvert, G., Brem, R.B., Whittle, J., Akey, J.M., Foss, E., Smith, E.N., Mackelprang, R. and Kruglyak, L.(2003). Trans acting regulatory variation in Saccharomyces cerevisiae and the role oftranscription factors. Nat Genet 35, 57 64.
Zimmermann, P., Hirsch Hoffmann, M., Hennig, L. and Gruissem, W. (2004). GENEVESTIGATOR.Arabidopsis microarray database and analysis toolbox. Plant Physiol 136, 2621 263.

72

73
Chapter 4
The genetics of plant metabolism
Joost J. B. Keurentjes*, Jingyuan Fu*, C. H. Ric de Vos*, Arjen Lommen, Robert D.Hall, Raoul J. Bino, Linus H. W. van der Plas, Ritsert C. Jansen, Dick Vreugdenhiland Maarten Koornneef
Published in Nature Genetics (2006) 38, 842 849.
* Equal contribution.
ABSTRACT
Variation for metabolite composition and content is often observed in plants.However, it is poorly understood to what extent this variation has a genetic basis.Here, we describe the genetic analysis of natural variation in the metabolitecomposition in Arabidopsis thaliana. Instead of focusing on specific metabolites, wehave applied empirical untargeted metabolomics using Liquid Chromatography–Time of Flight Mass Spectrometry (LC QTOF MS). This uncovered manyqualitative and quantitative differences in metabolite accumulation between A.thaliana accessions. Only 13.4% of the mass peaks were detected in all 14 accessionsanalyzed. Quantitative Trait Locus (QTL) analysis of more than 2,000 mass peaks,detected in a Recombinant Inbred Line (RIL) population derived from the twomost divergent accessions, enabled the identification of QTLs for about 75% of themass signals. More than one third of the signals were not detected in either parent,indicating the large potential for modification of metabolic composition throughclassical breeding. Combining partial interpretation of mass signals and QTLprofiles allowed us to confirm biochemical pathways known from the literatureand also to elucidate novel biosynthesis steps. This can lead to the identification ofthe underlying genes and the construction of biochemical networks in relation toother phenotypic traits.

Chapter 4
74
INTRODUCTION
Metabolites are critical in biology, and plants are especially rich in diversebiochemical compounds. It has been estimated that over 100,000 metabolites can befound in plants, and each species may contain its own chemotypic expressionpattern (Wink, 1988). Moreover, substantial quantitative and qualitative variationin metabolite composition is often observed within plant species (Windsor et al.,2005).
Although knowledge on the regulation of metabolite formation isincreasing, for thousands of metabolites, their function in the plant, theirbiosynthetic pathway and the regulation thereof is still unknown. QTL analysis ofnatural variation present in segregating populations, which can also concernmetabolites (Jansen and Nap, 2001), can identify loci explaining the observedvariation (Jansen, 1993). In recent years, a few studies have focused on identifyingQTLs regulating a specific group of known metabolites using detection methodsdirected toward specific metabolite groups (Mita et al., 1997; Bentsink et al., 2000;Kliebenstein et al., 2001a; Loudet et al., 2003; Hobbs et al., 2004). However, recentadvances in mass spectrometry based metabolomics and data processingtechniques should now allow large scale QTL analyses of untargeted metabolicprofiles, which may uncover previously unknown regulatory functions of loci inmetabolic pathways. Using dedicated alignment software, it is now possible toperform an unbiased comparison of large numbers of metabolite derived massesdetectable in large numbers of samples, arising from inherently large sets ofgenotypes (which are required for accurate mapping of QTLs) in an RILpopulation (Tikunov et al., 2005; Vorst et al., 2005). QTL mapping will result in thelocalization of loci, and ultimately genes, causal for the observed variation and willallow the discovery of co regulated compounds. In this way, genome wide geneticcorrelative metabolic analysis now becomes feasible, as we demonstrate here.
Relationships between biological traits are often inferred from correlationanalysis within a given data set. However, many of these correlations need not tobe causal or a result from pleiotropic effects of a common set of regulators. Instudies focusing on a small number of traits this is usually not a problem becauseadditional experiments can easily address this. In large data sets, such as thosefrom gene expression analysis and metabolomics, more sophisticated approachesare needed to reduce the number of ‘false positive’ correlations (Kose et al., 2001;Stuart et al., 2003). Such methods are powerful in detecting relevant relationshipsand can be applied to any given data set even when data were acquired in differentexperiments. However, no information can be obtained about the underlying

The genetics of plant metabolism
75
genetic regulation responsible for the observed correlation. The use of a mappingpopulation to create comprehensive data sets, on the other hand, allows theidentification of common regulators causal for the observed correlation betweentraits. Yvert et al. (2003) combined both approaches by first clustering traits basedon segregation variation and subsequent mapping of the mean cluster values.Although this reduced multiple testing of traits and markers, noise may beintroduced when multiple QTLs segregate in the cluster therewith reducingmapping power. Moreover, to exclude chance correlation from true coordinateregulation, stringent thresholds need to be applied to define clusters, thusindividual outliers and less tightly linked genes are not included.
We chose to map each mass peak separately and determine relationshipsby correlation analysis of QTL profiles. This enables a pair wise genetic correlationanalysis of each individual mass peak identifying related masses on the basis of coregulation. Although this rules out experimental error and other non geneticalvariation, we can not exclude developmental control of metabolite formation as thecause for the observed correlation when developmental traits segregate in thepopulation.

Chapter 4
76
RESULTS
Metabolite variation is abundant and genetically controlledTo assess the natural variation in metabolite content present in Arabidopsis, weperformed HPLC QTOF MS based untargeted metabolic fingerprinting of acidifiedaqueous methanol extracts from seedlings of 14 different accessions originatingfrom various parts of the global distribution range of Arabidopsis (supplementalTable 1 at http://www.nature.com/naturegenetics).
Considerable quantitative and qualitative variation was observed in themass profiles of the different accessions. Although a metabolite may berepresented by one to several mass signals in these analyses, depending on itschemical structure and abundance, each mass signal was treated as a separateelement in subsequent analyses. On average, 964 mass peaks were detected peraccession, with a minimum of 826 (Col) and a maximum of 1,337 (Cvi). Wedetected a total of 2,475 different mass peaks; 706 were unique to single accessions,and only 331 were present in all 14 accessions (Figure 1A). On average, 50 masspeaks per accession were found to be unique, with a minimum of 14 (Bay 0) and amaximum of 235 (Cvi). Although there might be a slight bias toward anoverestimation of the number of accession specific mass peaks owing to lowabundance peaks detected around the threshold level, the observed frequencydistribution pattern was similar when the threshold level was increased from six toten times local noise. It can therefore be assumed that many of the differencesobserved between accessions are due to qualitative differences. For most masses, alarge part of the observed variation can be assigned to genetic factors, as concludedfrom their often high broad sense heritabilities (Figure 1B). This, together with thesubstantial variation in metabolite composition observed within a single plantspecies promises great opportunities for metabolic engineering by classicalbreeding (Dixon, 2005).

The genetics of plant metabolism
77
Figure 1:Natural variation in Arabidopsismetabolite accumulation.(A) Frequency distribution of the number of different accessions each mass peak was detected in. (B)Frequency distribution of broad sense heritability of each mass peak detected in the different accessions.Data are based on at least two biological replicates per accession.
Most of the metabolic variation can be mappedTo uncover loci controlling the observed variation in metabolic profiles, wesubsequently analyzed an RIL population derived from a cross between Landsbergerecta (Ler) and Cape Verde Islands (Cvi) (Alonso Blanco et al., 1998). These werethe two biochemically most distinct accessions for which such a mappingpopulation was available (Figure 2).
Strikingly, 853 of a total of 2,129 mass peaks identified in the RILpopulation were not detected in either parent (Figure 3). Although the number oflines analyzed in the RIL population (160 lines measured in duplicate) exceededthat of the number of parental lines (5 replicates of each parent measured induplicate), making the chance of detecting mass peak intensities around thethreshold level higher, the observed ratio did not differ much when the thresholdwas increased modestly (data not shown). This suggests that many metabolites notpresent in either parent are produced as a result of the recombination of thegenomes of the two parents.

Chapter 4
78
Figure 2: Hierarchical clustering of accessionsfor metabolite content.The dendrogram depicts euclidean distancebetween groups after transformation of thedata. Numbers represent confidencepercentages after bootstrap analysis. Clusteringon metabolite content for the differentaccessions shows the clear separation of Cvifrom Ler indicating large genetic differences formetabolite content.
For 1,592 mass signals (74.8%), at least one significant (P < 0.0001) QTL wasdetected using a two part parametric model (Broman, 2003). This P thresholdcorresponded to a q value of 0.0002 in Storey’s genome wide false discovery rate(FDR) method (Storey and Tibshirani, 2003). On average, we found nearly 2.0QTLs per analyzed mass, leading to a total of 4,213 QTLs (supplemental Figure 2 athttp://www.nature.com/naturegenetics). Thus, after crossing these two distinctgenotypes, variation in the presence and abundance of ~75% of the detectedmasses in their offspring could at least partly be explained by mappable geneticfactors (Figure 3), consistent with the relatively high heritabilities found for manymasses (supplemental Figure 3 at http://www.nature.com/naturegenetics). At morestringent P value thresholds of 5.0 x 10 5, 1 x 10 5, and 1 x 10 6, corresponding to qvalues of 1 x 10 4, 2.9 x 10 5, and 4.1 x 10 6, respectively, 1,500 (70.5%), 1,306 (61.3%),and 1,068 (50.2%) mass signals showed at least one significant linkage.

The genetics of plant metabolism
79
Figure 3: Number of masses detected in the RILpopulation and its parents.The triangle is subdivided into masses notdetected in either parent (upper part), detected inone parent only (left and right) and detected inboth parents (lower part). The number of massesfor which at least one significant (P < 0.0001) QTLwas detected is shown in parentheses. Datarepresent two biological replicates per RIL and 5biological replicates for each parent measured in2 replicate extractions.
Analysis of the genomic distribution of the detected QTLs shows that theseare not evenly distributed over the Arabidopsis genome. Instead, hot and coldspots for the regulation of metabolic content were observed (Figure 4). Thisunequal distribution of QTLs may occur for a number of reasons. Many of themetabolites detected by the approach chosen may be biochemically related andtherefore have similar genetic control. In addition, genetic factors such as degree ofgenetic differentiation and effects of differential recombination rates mightcontribute to this heterogeneity. Finally, hot spots may reflect false positive QTLsof traits highly correlated owing to technical or environmental factors (de Koningand Haley, 2005). We therefore computed empirical confidence levels bypermutation tests (supplemental methods at http://www.nature.com/naturegenetics) and found that in most cases, the frequency of QTLs occurring athot spots was much higher than was expected by chance (Figure 4).

Chapter 4
80
Figure 4: Frequency distribution of the number of significant QTLs detected at each marker position atfour significance levels.When, for a certain mass signal, consecutive markers showed significant linkage, only the mostsignificant marker was counted. Markers were evenly spaced over the genome with an average distanceof 5 cM between them. Chromosomal borders are indicated by vertical shaded lines. The dashedhorizontal lines represent the 95% genome wide frequency confidence thresholds for regulationhotspots obtained from 1,000 permutations. The corresponding values are 31, 23, 8, and 2 QTLs permarker expected by chance for significance levels of 10 4, 5 x 10 5, 10 5, and 10 6 in increasing intensity,respectively. Data represent two biological replicates per RIL.
Map positions can reveal metabolic pathwaysCo location of QTLs coincides with clusters of highly correlated mass peaks, whichare assumed to be enriched for masses regulated by the same genes. Co regulated

The genetics of plant metabolism
81
metabolites may indicate that a specific biological function controls differentcomponents or that a specific step in a biochemical pathway is affected (MitchellOlds and Pedersen, 1998). To demonstrate the latter possibility, we first focused onthe mass signals corresponding to glucosinolates, for which over 30 differentstructures have already been identified in Arabidopsis (Reichelt et al., 2002). Thelargest class comprises the aliphatic glucosinolates, which are all derived frommethionine (Figure 5).
Figure 5: Genetic regulation of aliphatic glucosinolate accumulation in Arabidopsis.Corresponding loci of enzymatic steps are shown in bold next to the arrows.
Previous studies, targeted towards this class of metabolites, have shownlarge quantitative and qualitative differences in accumulation of aliphaticglucosinolates between Arabidopsis accessions (Kliebenstein et al., 2001b). Inaddition, QTL analysis of these glucosinolates in the Ler x Cvi RIL populationuncovered two major loci explaining the observed variation for most aliphaticglucosinolates (Kliebenstein et al., 2001a). The MAM locus at the top ofchromosome 5 is responsible for the observed variation in chain length (Kroymannet al., 2001), whereas the AOP locus at the top of chromosome 4 is responsible forthe observed variation in side chain modification (Kliebenstein et al., 2001c).Moreover, both loci, which contain multiple copies of genes having differentbiochemical functions, seem to control the quantitative variation in glucosinolate

Chapter 4
82
accumulation, with substantial interaction between the two loci. The MAM locusharbors a family of methylthioalkylmalate synthase (MAM) genes. In addition to aMAM L (MAM like) gene, the locus may harbor two further genes, MAM1 andMAM2 (Figure 5). Synthesis of C4 glucosinolates is completely dependent on thepresence of a functional MAM1 gene. Without this gene, C3 glucosinolates aresynthesized. The occurrence of a MAM L gene is responsible for the formation ofglucosinolates with longer chain lengths. Both Ler and Cvi contain a functionalMAM L gene whereas Cvi contains two MAM1 genes arranged in tandem and Lercontains a functionalMAM2 gene in addition to a truncated, non functionalMAM1gene (Kroymann et al., 2001). The AOP locus is also a complex region containinggenes encoding 2 oxoglutarate dependent dioxygenases. At least three paralogshave been identified. The function of AOP1 is still unknown but AOP2 and AOP3functions have been described (Figure 5). All three AOP genes are present in bothLer and Cvi but where AOP1 is expressed at similar levels, AOP2 is only expressedin Cvi and AOP3 is only expressed in Ler (Kliebenstein et al., 2001c). Because thespecific genes of the two loci, which are phylogenetic paralogs, are physicallyplaced at the same genomic position, they segregate as alleles of each other.
By making use of the mass accuracy of the TOF MS, we were able toidentify most of the aliphatic glucosinolates reported for Arabidopsis. SubsequentQTL analysis showed that all masses corresponding to an aliphatic glucosinolateindeed mapped to the AOP and/or MAM loci (Figure 6), thus confirming previousfindings. Epistatic analysis of the two loci revealed strong interactions for many ofthe detected glucosinolates (supplemental methods and supplemental Table 2 athttp://www.nature.com/naturegenetics).
Figure 6: QTL likelihood profiles of aliphaticglucosinolates detected in the RIL population.The first QTL, at 303.3 cM, is at the AOP locus,the second, at 409.4 cM, is at theMAM locus. Thesign of the value is related to the additive effectat each marker position (+, Cvi; , Ler). Solid linesrepresent glucosinolates before side chainmodification and dotted lines glucosinolatesafter side chain modification. Chromosomalborders are indicated by vertical shaded lines.Colors represent different chain lengths (black,3C; shaded, >4C).

The genetics of plant metabolism
83
The fact that we did not detect all glucosinolate QTLs found in anotherstudy (Kliebenstein et al., 2001a) is most likely explained by the use of a differentstage of plant development and differences in growing conditions. This issupported by the fact that they found different QTLs in seeds versus leaves. Theobservation that our MAM QTL was much stronger than in their study providesanother example of such a genotype x environment or genotype x developmentalstage interaction, which can be expected also for metabolites. Furthermore, wemapped individual glucosinolates whereas Kliebenstein et al. (2001a) showed themapping of total aliphatic glucosinolate content.
Figure 7: Second order genetic correlations between aliphatic glucosinolates detected in the RILpopulation.The upper panel contains glucosinolates before side chain modification; the lower panel containsglucosinolates after side chain modification. All edges depicted are significant at = 0.05, as determinedby permutation. Corresponding correlation values are placed next to edges.
To assess the extent of genetic overlap between any two masses, wecomputed the correlation coefficients between QTL profiles (vectors of P valuesassociated with markers along the genome for each mass). Strong geneticcorrelations among aliphatic glucosinolates were observed due to the co location ofQTLs (data not shown). To extract the most relevant relationships betweendifferent glucosinolates, we also calculated second order correlations defined bycorrelation between two glucosinolates independent of co variance with any otherpair (de la Fuente et al., 2004). The significance threshold for the second ordercorrelations was empirically estimated by permutation (supplemental methods athttp://www.nature.com/naturegenetics). Significant coefficients are shown in

Chapter 4
84
Figure 7 as edges between metabolites; 0.1 false positive edges are expected bychance. The resulting network is essentially a reconstruction of a known pathwayfor glucosinolate formation (Figure 5) and groups glucosinolates according to theirspecific biosynthesis steps. The fact that the reconstructed network has similaritiesto the known pathway validates our methods, and the dissimilarities suggestpossible previously unknown steps in the formation of glucosinolates.
Even if no prior information had been available, our mapping data alonesuggest that at least two loci contribute to the observed variation in aliphaticglucosinolate formation. The fact that most MAM regulated compounds do notshow a QTL at the AOP locus and all AOP regulated compounds also show a QTLat the MAM locus (Figure 6) suggests that AOP acts downstream of MAM.Furthermore, we observed high levels of side chain modified compounds inunexpected genotypic classes (Table 1). In contrast to previous findings(Kliebenstein et al., 2001c), this suggests, that both AOP2 and AOP3 are expressedin seedlings, indicating that regulation of glucosinolate formation is dependent ondevelopmental stage. The reverse additive effect of the AOP locus for 4hydroxybutyl, 2 propenyl and 4 benzoyloxybutyl formation shows that regulationcan be completely different for different growth stages, although Kliebenstein et al.(2001c) also suggested alternative loci for 4 hydroxybutyl formation. These resultsvalidate our combined genetic and metabolomic approach to identify co regulatedmasses and provide an independent line of evidence to validate or modify currentknowledge. An untargeted approach should therefore facilitate the annotation ofmetabolites to existing or even to as yet unknown pathways.

The genetics of plant metabolism
85
BB(n=38)
Mean±SD
(MC)
128(757)
15984(11843)
35(28)
31(45)
17973(7671)
52(184)
2484
(2043)
73(51)
547(249)
8751
(3621)
413(506)
179(129)
9(4)
11212(8989)
26046(5156)
2332
(2055)
437(317)
110(88)
BA(n=27)
Mean±SD
(MC)
137(584)
29646(9469)
157(106)
83(97)
16202(7728)
109(223)
9183
(5125)
258(131)
792(313)
8396
(5699)
1246
(2520)
84(65)
11(4)
11(18)
29793(2620)
701(536)
98(65)
4(1)
AB(n=49)
Mean±SD
(MC)
1255
(3748)
1076
(5309)
9(9)
4(2)
7712
(5761)
447(392)
200(692)
21(16)
188(114)
3682
(2326)
2969
(1670)
26(52)
17(4)
313(1160)
32690(1528)
245(1000)
56(154)
21(28)
Genotyp
eRILsa
AA(n=43)
Mean±SD
(MC)
296(1162)
856(4981)
49(187)
6(7)
8327
(6517)
264(305)
348(1124)
63(80)
267(141)
3851
(2647)
11458(5414)
6(4)
20(6)
8(12)
32659(4549)
24(54)
12(37)
4(3)
Cvi
(n=5)
Mean±SD
(MC)
4(0)
22435(9432)
38(40)
776(995)
29816(4470)
15(6)
801(309)
223(68)
1362
(499)
7843
(4787)
261(159)
104(5)
10(3)
17707(7053)
31101(1989)
2654
(1269)
1445
(460)
470(304)
Parents
Ler(n=
5)
Mean±SD
(MC)
555(471)
269(125)
7(4)
12(10)
18937(3514)
663(418)
42(32)
125(23)
422(132)
1116
(194)
4371
(171)
4(0)
24(1)
13(12)
34807(62)
42(11)
16(10)
4(0)
Add
.(M
C)
1086
2419 69 48 610 77
2607 96 136
250
5568 54 3
5242
1696 864
156 57
AOP
Sign
.(logP
)
1.2
5.3
7.7
2.2
0.2
0.8
4.4 8
2.3
0.1
11.1 4.5
2.3
12.4 1.7
3.7
10.8
24.5
Add
.(M
C)
418
20416 53 53
9238 291
4998 110
424
4842
6178 122 8
8150
5073
1512 255 92Lo
cus
MAM
Sign
.(logP
)
11.5
27.1 5.3
17.4
13.5 9.1
16.5
10.4
23.1 14
13.5
16.3
21.9
11.5
12.6
10.8
12.8 8.9
Table1:
Phenotyp
ican
dmap
ping
data
ofalipha
ticglucosinolates.Fo
reach
glucosinolate,
sign
ificance(log
10P)
andad
ditiv
eeffect
ofde
tected
QTL
saregivenfortheMAM
andAOPlocus,
andrelativ
eabun
dancein
thepa
rental
lines
andRILsis
givenas
masssign
alintensities
(MC,cou
ntsat
maxim
umpe
akheight).
Glucosino
late
3Methy
lthioprop
yl
4Methy
lthiobu
tyl
5Methy
lthiope
ntyl
6Methy
lthiohexy
l
7Methy
lthioheptyl
3Methy
lsulfin
ylprop
yl
4Methy
lsulfin
ylbu
tyl
5Methy
lsulfin
ylpe
ntyl
6Methy
lsulfin
ylhexy
l
7Methy
lsulfin
ylheptyl
3Hyd
roxy
prop
yl
4Hyd
roxy
butyl
2Prop
enyl
3Bu
teny
l
3Be
nzoy
loxy
prop
yl
4Be
nzoy
loxy
butyl
5Be
nzoy
loxy
pentyl
6Be
nzoy
loxy
hexy
la G
enotyp
eat
theMAM
andAOPlocus,respectiv
ely;A=Ler,B
=Cvi.

Chapter 4
86
Untargeted metabolomics uncovers new biosynthetic stepsTo demonstrate the power of our untargeted metabolomics approach inuncovering previously unknown potential regulatory relationships betweenmetabolites, we focused on a locus on chromosome 1 at 88.6 cM, where a numberof mass signals could be mapped with high significance. We first determined theextent of QTL overlap, expressed as the correlation coefficient, of the mass with themost significant QTL with all other masses. Next, masses showing significantcorrelation were identified by calculating their accurate mass, interpreting theirabsorbance spectra (Photo Diode Array (PDA) signals) and using MS/MSfragmentation techniques (supplemental Table 4 at http://www.nature.com/naturegenetics). Most of the mass signals sharing this single QTL on chromosome 1corresponded to different glycosylated flavonols (Figure 8A). The direction of theadditive effect, however, suggests that genotypic variation at this locus exertsopposite effects on the glycosylation pattern. Lines carrying the Ler allele(s) at thislocus accumulate flavonols containing dihexosyl glycosides, whereas lines carryingthe Cvi allele(s) at this position do not. Ler genotypes, however, are able tosynthesize all flavonols detected in Cvi genotypes (Table 2 and Figure 8, B and C).The present findings suggest that a specific not previously identified glycosyltransferase, catalyzing the production of flavonol dihexosides, is active in Ler butnot in Cvi, thus affecting total flavonol composition.
Table 2: Characteristics of putatively identified flavonols. Each flavonol is presented as its aglyconewith its distinguishing glycosylation pattern. Significance of the detected QTL on chromosome 1 at 88.6cM for each flavonol is shown as –Log10P values and additive effect and relative abundance of eachflavonol in the parental lines is given as mass signal intensities (MC, counts at maximum peak height).
Aglycone GlycosylationSign.
( Log10P)Effect(MC)
Ler(MC ± SE)
Cvi(MC ± SE)
Isorhamnetin Deoxyhexosyl hexoside 30.7 199 247 ± 54 212 ± 10Isorhamnetin Deoxyhexosyl dihexoside 24.0 123 258 ± 18 4 ± 0Kaempferol Dideoxyhexosyl hexoside 39.1 197 13 ± 2 329 ± 40Kaempferol Deoxyhexosyl dihexoside 29.5 1326 1334 ± 164 7 ± 0Quercetin Deoxyhexosyl hexoside 50.7 2659 1293 ± 291 4928 ± 517Quercetin Deoxyhexosyl dihexoside 24.3 1721 3031 ± 167 4 ± 0
Two genes putatively annotated as UDP glucose:glycosyltransferases(UGTs) based on consensus sequence homology with Family 1 UGTs coincide withthe support interval of the QTL (viz. UGT79B10 and UGT79B11) (Li et al., 2001).UGT79B10 has been expressed as recombinant protein in Escherichia coli, but itshowed no activity against quercetin glucosides in an in vitro analysis (Lim et al.,2004). However, the coding sequence was obtained from the Columbia accessionwhich might harbor allelic differences compared with Ler or Cvi. No information

The genetics of plant metabolism
87
about activity of UGT79B11 is currently available, but its sequence is highlyhomologous to UGT79B10, and the two genes probably arose from a duplicationevent. Therefore, both genes cannot be ruled out a priori as candidates for theobserved QTL. Another possibility might be the presence of a gene in Ler that isabsent in Cvi and Col and therefore is not annotated in the Col sequence. Finemapping of this locus should demonstrate whether the QTL represents anencoding structural gene or a regulator thereof.
Figure 8: Genetic variation in flavonol glycoside accumulation in Arabidopsis.(A) QTL likelihood profiles of putatively identified flavonol glycosides in the RIL population. The signof the value is related to the additive effect at each marker position (+, Cvi; , Ler). Dotted and solid linesrepresent flavonols with and without dihexosyl residues, respectively. Chromosomal borders areindicated by vertical shaded lines. (B) Typical example of relative levels of flavonol dihexoside versusflavonol monohexoside in the RIL population. Each symbol represents the average of twomeasurements per RIL. Squares and triangles represent lines carrying a Cvi or Ler genotype at the QTLposition, respectively. (C) Typical example of flavonol dihexoside and flavonol monohexosideaccumulation in the parental lines Ler (black) and Cvi (shaded). Data represent five biological replicatesfor each parent measured in two replicate extractions. In (B) and (C), values represent mass signalintensities (MC, counts at maximum peak height). Error bars represent s.e.m.
Thus, the untargeted detection and subsequent mapping of metabolitesenabled us to identify a number of putative flavonol glycosides not previouslyreported in Arabidopsis (D Auria and Gershenzon, 2005). Co location of QTLssuggests that variation in the accumulation of these flavonol species is attributableto a single locus affecting glycosylation of the basic flavonoid backbone.

Chapter 4
88
DISCUSSION
The framework proposed here involves the untargeted detection of hundreds topotentially thousands of metabolites in a mapping population, thus enabling themapping of QTLs for individual metabolites. This creates new opportunities forpathway elucidation and identification even when background knowledge ishighly limited. We show that the biochemical variation in Arabidopsis is extensivebut is nevertheless largely under genetic control, as concluded from theobservation that genomic loci could be assigned for 75% of the LC MS detectedmass peaks. The use of untargeted metabolomics is particularly useful in thiscontext, because it allows the detection of previously unidentified metabolites.When such metabolites are co regulated with known metabolites, this mayfacilitate the functional assignment of those unknown metabolites. Similarly,unexpected co occurrence of well known metabolites can also be discovered thatwould otherwise have been missed if detection was targeted to a specific subset ofcompounds. Genetic variation for metabolite composition might be important inadaptation to the specific environmental conditions in which the differentaccessions grow. In addition, they determine many aspects of the nutritional,sensory, and other aspects of crop plant quality.
Biological systems are often regulated at various molecular levels,including the influence of metabolites on plant development. A number of studieshave indicated the influence of metabolites on whole plant morphology duringearly stages of development (Alba et al., 2005; Lumba and McCourt, 2005). Thus,our understanding of biological function would benefit greatly from quantitativemeasurements of different classes of compounds (such as proteins and metabolites)and various processes (such as gene expression) carried out in parallel, preferablycombined with other classical phenotypic analyses (Oksman Caldentey and Saito,2005). The implementation of different technologies then enables associationanalyses based on similar genetic control, as shown by similar QTL positions. Inparticular, the use of a perpetual mapping population such as an RIL populationwill have added value because co locating QTLs can identify the genetic basis forthese associations even when different experiments have been performed (Lall etal., 2004; DeCook et al., 2006). Our study can therefore easily be extended by usingdifferent extraction and analysis methods or by examining contrasting plantdevelopmental stages. Moreover, the recent progress made in genetic analyses ofgene expression (Brem et al., 2002; Schadt et al., 2003) can also readily be exploited,and this will aid further the construction of genetic regulatory networks (Jansen,2003).

The genetics of plant metabolism
89
In the past, numerous studies have shown the usefulness of naturalbiodiversity for the elucidation of agronomically important traits, and pleiotropicloci have been identified controlling different traits simultaneously (Koornneef etal., 2004). The parallel genetic analysis of physiological, transcriptional, andbiochemical profiling can greatly enhance our understanding of metabolicregulatory circuitry and its relationship with phenotypic traits that segregate in thesame population. The definitive identification of the most interesting chemicalcompounds represented by the various mass peaks would require additionalchemical analysis. However, setting priorities for these analyses can now beperformed effectively on the identified map positions of QTLs controlling suchphenotypic traits.
Understanding the mechanisms that explain natural variation inmetabolite profiles and how this correlates with phenotype is a primary challengefor evolutionary research and research geared to defining natural biodiversity andmaximizing its use through directed plant breeding approaches. The strategydescribed here has universal application and can be used for any set of metabolitesanalyzed in mapping populations of any organism.

Chapter 4
90
MATERIALS ANDMETHODS
Arabidopsis accessions and mapping populationFourteen accessions of A. thaliana representing different regions of the globaldistribution of the species were analyzed for quantitative genetic variation inmetabolite content. A population of 160 recombinant inbred lines derived from across between the accessions Cape Verde Islands (Cvi) and Landsberg erecta (Ler)was used for QTL mapping of metabolite content. The F10 generation has beenextensively genotyped (Alonso Blanco et al., 1998) and is available from theArabidopsis Biological Resource Center. All lines were advanced to the F13
generation, and residual heterozygous regions, estimated to be 0.71% in the F10
generation, were genotyped again using molecular PCR markers. In addition, alllines were genotyped with a few extra markers to improve the quality of thegenetic map. Because each line is almost completely homozygous, individuals ofthe same line are genetically identical, which allows the pooling of replicateindividuals and repeated measurements to obtain a more precise estimate ofphenotype values and broad sense heritabilities.
Germination, growth conditions and harvestingSeeds of accessions and RILs were sown on 10 ml twice diluted Murashigi andSkoog medium containing 2% agar in 6 cm Petri dishes. For each line, five replicatedishes were sown on five consecutive days with a density of a few hundred seedsper Petri dish. Petri dishes were placed in a cold room at 4°C for 7 days in the darkto promote uniform germination. Subsequently, dishes were randomly placed infive blocks in a climate chamber where each block contained one replicate dish ofeach line. Growing conditions were 16 hr light (30 W.m 2) at 20°C, 8 hr dark at 15°Cand 75% relative humidity. After 6 days the lids of the Petri dishes were removedto ensure seedlings were free of condensed water on the day of harvesting. On day7, seedlings were harvested by submerging the complete Petri dish briefly in liquidnitrogen and scraping off the aerial parts with a razor blade. Harvesting started 7hours into the light period and all lines were harvested in random order within 2hours. Plant material was stored at 80°C until further processing.
Extract preparation and LC MS analysisFor each line, plant material from two dishes was harvested to make one replicatesample and material from the other three dishes was harvested for the secondsample. Samples were ground in liquid nitrogen, and 100 mg of each sample wasweighed in 2.2 ml Eppendorf tubes. Aqueous methanol extracts were prepared by

The genetics of plant metabolism
91
adding 400 l of ice cold 92% methanol acidified with 0.1% (vol/vol) formic acid tothe plant sample (final methanol concentration 75%, assuming 90% water intissues). After sonication for 15 min and centrifugation (20,000g) for 10 min, theextracts were transferred to 96 well protein filtration plates (Captiva 0.45 m,Ansys Technologies), vacuum filtrated and collected in 700 l glass inserts in 96well autosampler plates (Waters Corporation), using a Genesis Workstation (TecanSystems Inc.). Samples were automatically injected (5 l) and separated using anAlliance 2795 HT system (Waters Corporation) equipped with a Luna C18 reversedphase column (150 x 2.1 mm, 3 m; Phenomenex, CA). Separation was performedat 40°C by applying a 20 min gradient from 5 75% acetonitril in water, acidifiedwith 0.1% formic acid, at a flow rate of 0.2 ml/min. Compounds eluting from thecolumn were detected online, first by a Waters 996 photodiode array detector at200 600 nm and then by a Q TOF Ultima MS (Waters) with an Electron SprayIonization (ESI) source. Ions were detected in negative mode in the range of m/z100 to 1,500, using a scan time of 900 msec and an interscan delay of 100 msec.Desolvation temperature was 250°C with a nitrogen gas flow of 500 l/h, capillaryspray was 2.75 kV, source temperature 120°C, cone voltage was 35 V with 50 l/hnitrogen gas flow and collision energy was 10 eV. The mass spectrometer wascalibrated using 0.05% phosphoric acid in 50% acetonitrile and leucine enkaphalin(Sigma), detected online through a separate ESI interface every 10 sec, was used asa lock mass for exact mass measurements. MassLynx software version 4.0 (Waters)was used to control all instruments and for calculation of accurate masses.
Data pre processingThe dedicated software program METALIGN (http://www.metAlign.nl) was usedfor unbiased and unsupervised comparison of all LC MS datasets (Tikunov et al.,2005; Vorst et al., 2005). In short, the program performs automated peak centering,local noise calculation, baseline correction and extraction of all relevant masssignals (i.e. signal to noise ratio of 3 or higher) from all LC MS datasets, and itsubsequently uses landmark dependent alignment algorithms to correct for localchromatographic drifts and obtain an ordered data matrix ( aligned mass peaksversus samples). Mass peak signals generated are calculated as mass intensities(ion counts) at maximum peak height.
Quality improvement by reduction of the datasetFor each sample, the number of detected masses was reduced to improve thequality of the data set. Only masses that were detected in the optimized gradientphase (Vorst et al., 2005) (between 3 and 20 min retention time) and that had asignal intensity higher than six times local noise were selected for further data

Chapter 4
92
analysis. For the RIL population, masses that had a signal intensity higher than sixtimes local noise but that were detected in fewer than ten lines were discarded aswell.
Statistical analysesTotal phenotypic variance was partitioned into sources attributable to genotypeand error. Components of variance were used to estimate broad sense heritabilityaccording to the formula H2 = VG/(VG + Ve), where VG is the among genotypevariance component, and Ve is the residual (error) variance component of theanalysis of variance (ANOVA).
The distance between accessions, based on metabolic content, wascalculated by hierarchical clustering. Data were first transformed as (xij ui)/sdi,where xij is the peak intensity of the ith mass in the jth accession; ui is the meanintensity of the ith mass over all accessions, and sdi is the standard deviation of themean intensity of the ith mass over all accessions. Distance was then calculatedusing euclidean methods and clusters were constructed using average linkageclustering. To verify the clustering, we performed 1,000 bootstrap runs by usingapproximately unbiased multistep multiscale bootstrap resampling (Shimodaira,2004). The P values computed indicate how strongly each cluster was supportedby the data.
Linkage map constructionGenotype data for the Ler x Cvi population individuals are available athttp:/nasc.nott.ac.uk/. The genetic map was constructed from a subset of themarkers available with a few new markers added. The computer programJOINMAP 3.0 (Stam, 1993) (http://www.kyazma.com) was used for the calculationof linkage groups and genetic distances. Recombination frequencies wereconverted to centiMorgan distances using the Kosambi mapping function.
QTL analysisFor many masses, a spike in the phenotype distribution was observed, causing adeparture from the assumption of normal distribution. The spike was caused bythe absence of a mass peak in a considerable number of RILs, consequently leadingto signal intensities equal to the detection threshold value (four times local noise).Because distributions were normal if only RILs were taken into account whensignal intensities were above the detection threshold, we carried out a singlemarker analysis using a two part parametric model (Broman, 2003).
The first part describes a binominal model that tests for association ofmarkers with presence or absence of mass peaks. For each mass peak, let yi denote

The genetics of plant metabolism
93
the mass intensity for the ith RIL. Let zi = 0 if yi = 4, and zi =1 if yi > 4. We then testedeach marker for significant differences between the two genotypes for theprobability of presence of the mass peak: H0: P{z = 1|g = Ler} = P{z = 1| g = Cvi}versus the alternative hypothesis H1: P{z = 1|g = Ler} P{z = 1| g = Cvi}, where g isthe genotype (Ler or Cvi) of a marker under analysis.
The second part describes a parametric model that tests for association ofmarkers with intensity of the mass signal for those lines where yi > 4. Under theassumption of normal distribution, we tested each marker for significantdifferences in the mean values between two genotypes: H0: {g = Ler} = {g = Cvi}versus the alternative hypothesis H1: {g = Ler} {g = Cvi}. The P value of thetwo part model was then determined by the multiple of the P values from the twoseparate analyses (P1 and P2, respectively).
To calculate significance thresholds, we performed a simulation studyfollowing Broman (2003). Each individual had probability 40% (the medianproportion of null phenotypes observed in mass data) of having a null phenotypeand probability 60% of having a phenotype drawn from a normal distribution withmean 13 (the median value of mass phenotype data) and standard deviation 1. Foreach of 10,000 replicates, we simulated such data under the null hypothesis of noQTL, applied the two part model and stored the genome wide minimum P value.The 98th percentile of the P values corresponded to 0.0001. With the real data, the qvalues corresponding to P values were estimated using Storey’s genome wide falsediscovery rate (FDR) method (Storey and Tibshirani, 2003).
We next calculated the proportion of QTL significance explained by thebinominal part by logP1/(logP1 + logP2), where P1 and P2 are the P values fromthe two separate parts of the model respectively, (supplemental Figure 4 athttp://www.nature.com/naturegenetics). The variance explained by QTLs wascalculated for both parts separately (supplemental Figure 5 at http://www.nature.com/naturegenetics). In the quantitative model (part II), we used ANOVA toestimate the total sum of squares (SStotal) and the sum of squares between QTLgenotypes (SSQTL). The proportion of variance explained by the QTL was thencalculated as SSQTL/SStotal. For the binominal model (part I), we used the devianceinstead of the sum of squares. We fitted the binominal data into a generalizedlinear (probit) model to estimate the deviances (dev) (McCullagh and Nelder,1989). The proportion of variance explained by the QTL in the binominal modelwas then calculated as devQTL/devtotal.

Chapter 4
94
Calculation of genetic correlationsVarious methods have been developed and applied to uncover gene regulatorynetworks from expression profiles (de la Fuente et al., 2004; Bing and Hoeschele,2005; Schadt et al., 2005) or from QTL profiles (Zhu et al., 2004). We combined andmodified the methods of Bing and Hoeschele (2005) and Zhu et al. (2004) andcalculated the second order partial correlation on QTL profiles between any pair ofmasses to assess the strength of their genetic relationship.
The calculation took three steps: (i) for each QTL significant at P < 0.0001,the QTL support interval was determined by setting left and right border positionsassociated with max{–log10P} ± 1.5; that is, the 1.5 LOD drop off interval.Subsequently –log10P values for positions outside the support intervals were set tozero. (ii) Pair wise correlation coefficients between any two masses were thencalculated as:
n
ii
n
ii
n
iii
xyyx
yxr
1
2
1
2
12
where rxy is the correlation coefficient between mass x and y, and i (i = 1…n) is amarker. xi and yi represent –log10P values for marker i. (iii) Finally, second orderpartial correlations were calculated. The first order correlation between variable xand y conditional on a single variable z is given by:
22 11 yzxz
yzxzxyzxy
rr
rrrr
where rxy, rxz and ryz are correlation coefficients on mass expression profilesbetween x and y, x and z, and y and z, respectively. The second order partialcorrelation between x and y, conditional on a pair of variables z and k, is a functionof first order coefficients:
22 11 zykzxk
zykzxkzxyzkxy
rr
rrrr
For each pair x and y, the second order partial correlations were calculatedconditional on each pair z and k, and the minimal value was stored. Havingcalculated these minimal values for all pairs x and y for aliphatic glucosinolates,the empirical threshold was obtained by permutation (supplemental methods athttp://www.nature.com/naturegenetics). The second order partial correlationcoefficients between QTL profiles were computed in each of 20,000 permutationsand sorted to derive the threshold of 0.14 at = 0.05, Bonferroni adjusted for 17,the number of correlation tests for each glucosinolate. We did not correct the

The genetics of plant metabolism
95
level for the number of all pair wise analyses (17 x 18/2) to avoid over correction.At this threshold, on average 0.1 correlation coefficients are significant by chance.
AcknowledgementsThis work was supported by grants from the Netherlands Organization forScientific Research, Program Genomics (050 10 029) and the Centre for BiosystemsGenomics (CBSG, Netherlands Genomics Initiative).

Chapter 4
96
REFERENCES
Alba, R., Payton, P., Fei, Z., McQuinn, R., Debbie, P., Martin, G.B., Tanksley, S.D. and Giovannoni,J.J. (2005). Transcriptome and selected metabolite analyses reveal multiple points of ethylenecontrol during tomato fruit development. Plant Cell 17, 2954 2965.
Alonso Blanco, C., Peeters, A.J., Koornneef, M., Lister, C., Dean, C., van den Bosch, N., Pot, J. andKuiper, M.T. (1998). Development of an AFLP based linkage map of Ler, Col and CviArabidopsis thaliana ecotypes and construction of a Ler/Cvi recombinant inbred linepopulation. Plant J 14, 259 271.
Bentsink, L., Alonso Blanco, C., Vreugdenhil, D., Tesnier, K., Groot, S.P. and Koornneef, M. (2000).Genetic analysis of seed soluble oligosaccharides in relation to seed storability ofArabidopsis. Plant Physiol 124, 1595 1604.
Bing, N. and Hoeschele, I. (2005). Genetical genomics analysis of a yeast segregant population fortranscription network inference. Genetics 170, 533 542.
Brem, R.B., Yvert, G., Clinton, R. and Kruglyak, L. (2002). Genetic dissection of transcriptionalregulation in budding yeast. Science 296, 752 755.
Broman, K.W. (2003). Mapping quantitative trait loci in the case of a spike in the phenotypedistribution. Genetics 163, 1169 1175.
DAuria, J.C. and Gershenzon, J. (2005). The secondary metabolism of Arabidopsis thaliana: growing likea weed. Curr Opin Plant Biol 8, 308 316.
de Koning, D.J. and Haley, C.S. (2005). Genetical genomics in humans and model organisms. TrendsGenet 21, 377 381.
de la Fuente, A., Bing, N., Hoeschele, I. and Mendes, P. (2004). Discovery of meaningful associations ingenomic data using partial correlation coefficients. Bioinformatics 20, 3565 3574.
DeCook, R., Lall, S., Nettleton, D. and Howell, S.H. (2006). Genetic regulation of gene expressionduring shoot development in Arabidopsis. Genetics 172, 1155 1164.
Dixon, R.A. (2005). Engineering of plant natural product pathways. Curr Opin Plant Biol 8, 329 336.Hobbs, D.H., Flintham, J.E. and Hills, M.J. (2004). Genetic control of storage oil synthesis in seeds of
Arabidopsis. Plant Physiol 136, 3341 3349.Jansen, R.C. (1993). Interval mapping of multiple quantitative trait loci. Genetics 135, 205 211.Jansen, R.C. and Nap, J.P. (2001). Genetical genomics: the added value from segregation. Trends Genet
17, 388 391.Jansen, R.C. (2003). Studying complex biological systems using multifactorial perturbation. Nat Rev
Genet 4, 145 151.Kliebenstein, D.J., Gershenzon, J. and Mitchell Olds, T. (2001a). Comparative quantitative trait loci
mapping of aliphatic, indolic and benzylic glucosinolate production in Arabidopsis thalianaleaves and seeds. Genetics 159, 359 370.
Kliebenstein, D.J., Kroymann, J., Brown, P., Figuth, A., Pedersen, D., Gershenzon, J. and MitchellOlds, T. (2001b). Genetic control of natural variation in Arabidopsis glucosinolateaccumulation. Plant Physiol 126, 811 825.
Kliebenstein, D.J., Lambrix, V.M., Reichelt, M., Gershenzon, J. and Mitchell Olds, T. (2001c). Geneduplication in the diversification of secondary metabolism: tandem 2 oxoglutarate dependentdioxygenases control glucosinolate biosynthesis in Arabidopsis. Plant Cell 13, 681 693.
Koornneef, M., Alonso Blanco, C. and Vreugdenhil, D. (2004). Naturally occurring genetic variation inArabidopsis Thaliana. Annu Rev Plant Physiol Plant Mol Biol 55, 141 172.
Kose, F., Weckwerth, W., Linke, T. and Fiehn, O. (2001). Visualizing plant metabolomic correlationnetworks using clique metabolite matrices. Bioinformatics 17, 1198 1208.
The genetics of plant metabolism
97
Kroymann, J., Textor, S., Tokuhisa, J.G., Falk, K.L., Bartram, S., Gershenzon, J. and Mitchell Olds, T.(2001). A gene controlling variation in Arabidopsis glucosinolate composition is part of themethionine chain elongation pathway. Plant Physiol 127, 1077 1088.
Lall, S., Nettleton, D., DeCook, R., Che, P. and Howell, S.H. (2004). Quantitative trait loci associatedwith adventitious shoot formation in tissue culture and the program of shoot development inArabidopsis. Genetics 167, 1883 1892.
Li, Y., Baldauf, S., Lim, E.K. and Bowles, D.J. (2001). Phylogenetic analysis of the UDPglycosyltransferase multigene family of Arabidopsis thaliana. J Biol Chem 276, 4338 4343.
Lim, E.K., Ashford, D.A., Hou, B., Jackson, R.G. and Bowles, D.J. (2004). Arabidopsisglycosyltransferases as biocatalysts in fermentation for regioselective synthesis of diversequercetin glucosides. Biotechnol Bioeng 87, 623 631.
Loudet, O., Chaillou, S., Merigout, P., Talbotec, J. and Daniel Vedele, F. (2003). Quantitative trait locianalysis of nitrogen use efficiency in Arabidopsis. Plant Physiol 131, 345 358.
Lumba, S. and McCourt, P. (2005). Preventing leaf identity theft with hormones. Curr Opin Plant Biol 8,501 505.
McCullagh, P. and Nelder, J.A. (1989). Generalized Linear Models. (New York: Chapman & Hall).Mita, S., Murano, N., Akaike, M. and Nakamura, K. (1997). Mutants of Arabidopsis thaliana with
pleiotropic effects on the expression of the gene for beta amylase and on the accumulation ofanthocyanin that are inducible by sugars. Plant J 11, 841 851.
Mitchell Olds, T. and Pedersen, D. (1998). The molecular basis of quantitative genetic variation incentral and secondary metabolism in Arabidopsis. Genetics 149, 739 747.
Oksman Caldentey, K.M. and Saito, K. (2005). Integrating genomics and metabolomics for engineeringplant metabolic pathways. Curr Opin Biotechnol 16, 174 179.
Reichelt, M., Brown, P.D., Schneider, B., Oldham, N.J., Stauber, E., Tokuhisa, J., Kliebenstein, D.J.,Mitchell Olds, T. and Gershenzon, J. (2002). Benzoic acid glucosinolate esters and otherglucosinolates from Arabidopsis thaliana. Phytochemistry 59, 663 671.
Schadt, E.E., Monks, S.A., Drake, T.A., Lusis, A.J., Che, N., Colinayo, V., Ruff, T.G., Milligan, S.B.,Lamb, J.R., Cavet, G. et al. (2003). Genetics of gene expression surveyed in maize, mouse andman. Nature 422, 297 302.
Schadt, E.E., Lamb, J., Yang, X., Zhu, J., Edwards, S., Guhathakurta, D., Sieberts, S.K., Monks, S.,Reitman, M., Zhang, C. et al. (2005). An integrative genomics approach to infer causalassociations between gene expression and disease. Nat Genet 37, 710 717.
Shimodaira, H. (2004). Approximately unbiased tests of regions using multistep multiscale bootstrapresampling. Ann Statist 32, 2616 2641.
Stam, P. (1993). Construction of integrated genetic linkage maps by means of a new computer package:JoinMap. Plant J 3, 739 744.
Storey, J.D. and Tibshirani, R. (2003). Statistical significance for genomewide studies. Proc Natl Acad SciU S A 100, 9440 9445.
Stuart, J.M., Segal, E., Koller, D. and Kim, S.K. (2003). A gene coexpression network for globaldiscovery of conserved genetic modules. Science 302, 249 255.
Tikunov, Y., Lommen, A., de Vos, C.H., Verhoeven, H.A., Bino, R.J., Hall, R.D. and Bovy, A.G. (2005).A novel approach for nontargeted data analysis for metabolomics. Large scale profiling oftomato fruit volatiles. Plant Physiol 139, 1125 1137.
Vorst, O., de Vos, C.H.R., Lommen, A., Staps, R.V., Visser, R.G.F., Bino, R.J. and Hall, R.D. (2005). Anon directed approach to the differential analysis of multiple LC MS derived metabolicprofiles.Metabolomics 1, 169 180.

Chapter 4
98
Windsor, A.J., Reichelt, M., Figuth, A., Svatos, A., Kroymann, J., Kliebenstein, D.J., Gershenzon, J.and Mitchell Olds, T. (2005). Geographic and evolutionary diversification of glucosinolatesamong near relatives of Arabidopsis thaliana (Brassicaceae). Phytochemistry 66, 1321 1333.
Wink, M. (1988). Plant breeding: importance of plant secondary metabolites for protection againstpathogens and herbivores. Theor Appl Genet 75, 225 233.
Yvert, G., Brem, R.B., Whittle, J., Akey, J.M., Foss, E., Smith, E.N., Mackelprang, R. and Kruglyak, L.(2003). Trans acting regulatory variation in Saccharomyces cerevisiae and the role oftranscription factors. Nat Genet 35, 57 64.
Zhu, J., Lum, P.Y., Lamb, J., GuhaThakurta, D., Edwards, S.W., Thieringer, R., Berger, J.P., Wu, M.S.,Thompson, J., Sachs, A.B. et al. (2004). An integrative genomics approach to thereconstruction of gene networks in segregating populations. Cytogenet Genome Res 105, 363374.

99
Chapter 5
Integrative analyses of genetic variation in enzymeactivities of primary carbohydrate metabolism revealdistinct modes of regulation in Arabidopsis thaliana
Joost J. B. Keurentjes, Ronan Sulpice, Yves Gibon, Jingyuan Fu, MaartenKoornneef, Mark Stitt and Dick Vreugdenhil
ABSTRACT
Plant primary carbohydrate metabolism is complex and flexible, and is regulatedat many levels. Changes of transcript levels do not always lead to changes inenzyme activities, and these may not always affect metabolite levels and fluxes. Toanalyze interactions between these three levels of function, we have performedparallel genetic analyses of 15 enzymatic activities involved in primarycarbohydrate metabolism, the transcript levels for their encoding structural genes,and their substrate and product metabolites, as well as a number of other relatedmetabolites. Quantitative analyses of each trait were performed in the ArabidopsisLer x Cvi recombinant inbred line (RIL) population and subjected to correlationand quantitative trait locus (QTL) analysis. Specific regulation was oftenaccompanied with correlations between traits, possibly due to developmentalcontrol affecting several genes, enzymes, or metabolites. For a number of enzymes,activity QTLs co localized with expression QTLs (eQTLs) of their structural genes,or metabolite accumulation QTLs of their substrate and product. However,regulation often occurred through multiple loci, both due to posttranscriptionaland cis and trans acting transcriptional control of structural genes, as well asindependent of the structural genes. Although many of the regulatory processes inprimary carbohydrate metabolism remain to be resolved, it is clear that suchstudies will benefit from the integrative genetic analysis of gene transcription,enzyme activity, and metabolite content. The multiparallel QTL analyses of thevarious interconnected transducers of biological information flow, described herefor the first time, can assist in determining the cause and consequences of geneticregulation at different levels of complex biological systems.

Chapter 5
100
INTRODUCTION
Carbon is probably the most prevalent and important element in any life form.Unlike most other organisms, which are dependent on uptake of organic forms ofcarbon, plants fix inorganic carbon through photosynthesis. Upon fixation, most ofthe inorganic carbon is converted into sucrose, which then acts as the major sourceof organic carbon for further metabolism. Some of the fixed carbon is temporarilystored as starch, and remobilized at night to support respiration and continuedsynthesis and export to other tissues. To meet the various demands of a growingplant for specific purposes, carbohydrates need to be allocated within the plant,and converted into a plethora of compounds (Koch, 2004). Carbohydratemetabolism in plants is more complex than in most other organisms; for example,there are alternative routes for the mobilization and metabolization of diversecomponents (Carrari et al., 2003). Furthermore, depending on the tissue, part or allof the glycolytic pathway is present in the plastid as well as the cytosol (Lunn,2007). Moreover, most enzymes in plant central metabolism are encoded by smallgene families (The Arabidopsis Genome Initiative, 2000; Martienssen, 2000). As aresult, a given substrate may be converted into different products, and productscan be formed from different substrates. This versatility of enzymatic reactions incombination with substrate competition enables different metabolic routes andcreates a dense metabolic network with short pathway lengths. Perturbations insub parts of the network can therefore have strong consequences for other partsand even affect plant growth and development (Sturm and Tang, 1999; Roessner etal., 2001; Fernie et al., 2002). The complexity of the metabolic network may allowthe plant to compensate for disturbance in one route, by enhancing the fluxthrough an alternative route (Rontein et al., 2002). To ensure a balanced carbonallocation through a plant’s lifecycle, a strong and tight regulation is thereforeessential. At the same time, this complexity means that there may be considerableredundancy, at least under standardized growth conditions. There are severalreports where major changes in the expression of individual enzymes lead to littlechange in metabolism (e.g. (Neuhaus et al., 1989).
Given the huge diversity in plant species, with large differences in theirenergy metabolism, growth and storage of reserves, it can be expected that therewill be considerable variation in primary carbohydrate metabolism betweenspecies, and most likely also within species. For a thorough understanding of therole of natural variation in plant metabolism and development it is of pivotalimportance to identify the genetic basis of variation in metabolic pathways andprocesses within species. The identification of genes affecting metabolic processes

Integrative analyses of genetic variation in enzyme activity
101
might also increase our knowledge about the regulatory control of pathways ingeneral. The genetic control of primary carbohydrate metabolism is highlycomplex because many biochemical steps are involved, together withenvironmental and developmental factors. The finding, in Arabidopsis, that largedifferences in many enzyme activities and metabolite contents exist betweenaccessions (Mitchell Olds and Pedersen, 1998; Cross et al., 2006), growingconditions (Gibon et al., 2006; Morcuende et al., 2007; Osuna et al., 2007),developmental stages (Meyer et al., 2007), time of day (Gibon et al., 2004b), andtissues (Sergeeva et al., 2004, 2006) illustrates this complexity. Cross et al. (2006)analyzed 24 Arabidopsis accessions for biomass production, metabolite content,and enzyme activity. Positive correlations were observed between biomass,enzyme activities, and carbohydrates. Further evidence for developmental controlof plant metabolism is derived from a study by Meyer et al. (2007). The authorsused GC MS metabolic profiling of the Col x C24 RIL population in parallel withbiomass determinations. No strong correlations between individual metabolitesand biomass production could be observed but a strong canonical correlation wasobserved when all metabolites were taken into account. Among the metabolitescontributing most to the observed correlation were intermediates of the hexosephosphate pool: fructose 6 phosphate, glucose 6 phosphate, and glucose 1phosphate. Both positive and negative correlations between biomass andmetabolites were observed although the large majority of metabolites, includingsucrose, hexose phosphates and members of the TCA cycle, showed negativecorrelations. This, and the results of Cross et al. (2006), indicates that high rates ofbiomass production deplete pools of metabolites resulting in higher enzymeactivities, as was also concluded from the relationship between tomato fruit sizeand metabolite content (Schauer et al., 2006). Natural variation in, and spatial andtemporal control of primary carbohydrate metabolism, therefore, suggest a tightrelationship with plant development, although it is difficult to assess cause andconsequence and regulation is highly complex.
Natural variation can be effectively analyzed in mapping populations,offering the possibility of locating genetic factors causal for the observed variation(Koornneef et al., 2004). Although genetics has been successfully used to analyzequantitative variation in plant metabolism (Causse et al., 1995; Mitchell Olds andPedersen, 1998; Prioul et al., 1999; Hirel et al., 2001; Rauh et al., 2002; Loudet et al.,2003; Fridman et al., 2004; Harrison et al., 2004; Sergeeva et al., 2004, 2006; Calengeet al., 2006; Keurentjes et al., 2006; Schauer et al., 2006), most studies addressed onlya limited number of enzymes or metabolites, and did not integrate this withinformation about changes in transcript levels. Given the strong interdependencyof enzyme activities and metabolites, genetic studies can benefit enormously from

Chapter 5
102
multidisciplinary approaches (Fiehn et al., 2001; Winnacker, 2003). To gain insightinto connectivity in metabolic networks it is therefore recommendable to analyzeas many enzymes and metabolites involved in such a network as possible. Theparallel analysis of gene expression would further enhance our understanding ofgenetic regulation (Urbanczyk Wochniak et al., 2003; Gachon et al., 2005; Hirai et al.,2005; Gibon et al., 2006).
In the present study, we analyzed the activity of 15 different enzymesinvolved in primary carbohydrate metabolism as well as the transcript levels fortheir structural genes, in parallel with quantification of the most importantcarbohydrates and related metabolites in the Landsberg erecta (Ler) x Cape verdeislands (Cvi) recombinant inbred line (RIL) population of Arabidopsis thaliana(Alonso Blanco et al., 1998). RIL populations offer unique possibilities for suchintegrative studies because different types of experiments can be performed inreplicates on the same genotypes. Furthermore a large number of geneticperturbations segregate in populations derived from crosses of distinct accessions.A relatively large set of lines can then be analyzed for correlations between traits aswell as for quantitative trait loci (QTLs) controlling variation observed for thesetraits. The advantage of Arabidopsis is that the genome has been sequenced (TheArabidopsis Genome Initiative, 2000) and genes have been (putatively) annotatedfor nearly all enzymes in primary metabolism (The Arabidopsis InformationResource at http://www.arabidopsis.org/), allowing analysis of transcriptionalregulation of these genes.
We show that genetically controlled variation exists for the activity ofmany enzymes as well as for transcript levels of their structural genes and for themetabolites they interconvert. By comparing the localization and responses ofstructural genes encoding the enzymes, eQTLs for their transcript levels, and QTLsfor enzyme activities and metabolite contents, we demonstrate that geneticallycontrolled regulation occurs through different modes of action and at multiplelevels.

Integrative analyses of genetic variation in enzyme activity
103
RESULTS
Natural variation in primary carbohydrate metabolismTo determine the extent of natural variation in primary carbohydrate metabolismin Arabidopsis we analyzed a Recombinant Inbred Line (RIL) population of a crossbetween the two distinct accessions Landsberg erecta (Ler) and Cape Verde Islands(Cvi) (Alonso Blanco et al., 1998). Metabolic conversion rates attributable toenzyme activity were established for 15 specific enzymatic reactions in parallelwith determinations of pools of metabolic carbon sources (Table 1, Figure 1).
Figure 1: Enzymatic conversions in primary carbohydrate metabolism.Reactions are given in the biologically most relevant direction, although several enzymes can catalyzereversible reactions. Metabolites are depicted in solid typeface and converting enzymes are depicted inshaded typeface on the right side of arrows.

Chapter 5
104
Table 1: Summation of enzymes and metabolites analyzed and the abbreviations used. Reactions aregiven in the direction as they were assayed although several enzymes can also catalyze the reversiblereactions.Trait Full name ReactionInv Acid soluble invertase, vacuolar Sucrose + H2O
D glucose + fructoseAGP ADP glucose pyrophosphorylase ADP D glucose + PPi
D glucose 1 phosphate + ATPFBP Fructose 1,6 bisphosphate phosphatase,
cytosolic isoformFructose 1,6 bisphosphate + H2OD fructose 6 phosphate + Pi
G6PDH Glucose 6 phosphate 1 dehydrogenase D glucose 6 phosphate + NADP+D glucono lactone 6 phosphate + NADPH
PFK ATP dependent phosphofructokinase D fructose 6 phosphate + ATPfructose 1,6 bisphosphate + ADP
PFP Pyrophosphate: fructose 6 phosphate 1phosphotransferase
D fructose 6 phosphate + PPifructose 1,6 bisphosphate + Pi
PGM Phosphoglucomutase D glucose 1 phosphateD glucose 6 phosphate
PGI Phosphoglucose isomerase,cytosolic and plastidial isoforms
D fructose 6 phosphateD glucose 6 phosphate
SPS Sucrose phosphate synthase D fructose 6 phosphate + UDP D glucosesucrose 6 phosphate + UDP
SuSy Sucrose synthase Sucrose + UDPUDP D glucose + fructose
GK Glucokinase D glucose + ATPD glucose 6 phosphate + ADP
FK Fructokinase Fructose + ATPD fructose 6 phosphate + ADP
UGP UDP glucose pyrophosphorylase UDP D glucose + PPiD glucose 1 phosphate + UTP
Rubisco Ribulose bisphosphate carboxylase/oxygenase, initial and upon max activation
H2O + CO2 + D ribulose 1,5 bisphosphate2 3 phosphoglycerate + 2 H+
ChlA Chlorophyl AChlB Chlorophyl BAA Total Amino AcidsProtein Total Protein contentStarch StarchSuc SucroseGlu GlucoseFru FructoseG1P D glucose 1 phosphateG6P D glucose 6 phosphateUDPG UDP D glucose

Integrative analyses of genetic variation in enzyme activity
105
Considerable variation was observed within the population for most of theanalyzed traits, with coefficients of variation (CV) ranging from 13.7 (ChlA) to54.2% (GK) (Table 2). In general CV values were higher for enzyme activitymeasurements than for contents of metabolites. A substantial part of the observedvariation could be attributed to genetic factors, as concluded from QTL analyses.Significant QTLs were detected for ten of the enzyme activity traits and for ninemetabolite traits (Table 2, Figure 2). In a number of cases, multiple QTLs weredetected, sometimes with opposite effects, explaining the large variation andtransgression that was observed, although in general the overall effect of QTLs wasin concordance with the phenotypic differences observed between the parents.Very few co locating QTLs were detected for the different enzyme activities, whereco location is defined as an overlap in 2 Mbp support intervals, even thoughseveral of them are from the same or related pathways (Table 2, Figure 3). Colocation of QTLs was more often the case for metabolic content due to the highernumber of QTLs detected for the metabolic traits.
Despite this evidence for strong independent regulation, suggested by thedetection of trait specific QTLs, when the values are compared across all the RILs, apositive correlation was observed between activity levels of all the enzymesanalyzed (Figure 4). There was also a positive correlation between many enzymeactivities and the structural metabolites protein and chlorophyll. A weaker positivecorrelation was observed between many enzyme activities and sucrose, aminoacids, and starch, and a weak negative correlation with reducing sugars. Thisgroup of metabolites represents the end products of photosynthesis, and theprimary compounds resulting from nitrogen incorporation. They are exported tothe remainder of the plant or, in the case of starch, temporarily stored in the leafand remobilized for export in the night. Stronger negative correlations wereobserved with intermediates of metabolic pathways, such as glucose 1 phosphate,glucose 6 phosphate, and UDP glucose. These findings suggest that higherenzyme activities may allow higher fluxes, while lowering the levels of theintermediary substrates in the pathways.

Chapter 5
106
Table 2: Genetic analyses of analyzed traits. The second to eighth column represent, respectively, thecoefficient of variation for trait values within the RIL population, the chromosome number on which aQTL was detected, the position of the QTL on the chromosome in Mbp, the LOD score, percentageexplained variance and direction of effect (+, Ler > Cvi; , Ler < Cvi) of the QTL and the 2Log ratio of traitvalues for the parental accessions. PC1 8, principal components.Trait CV Chr. Mb LOD %Expl. Var Effect 2Log Ler/CviInv 29.1 1 4.1 5.3 13.7 0.13AGP 21.3 4 12.4 3.1 8.0 + 0.02FBP 34.7 5 14.0 3.5 9.6 1.00G6PDH 39.0 0.94PFK 32.2 0.38PFP 26.0 0.36PGM 37.8 1 26.9 16.0 17.5 + 0.37
5 20.9 36.4 56.3PGI(cyt) 22.8 1 16.8 3.1 6.8 + 0.35
2 11.2 5.4 12.7 +5 17.2 4.0 8.9 +
PGI(pla) 22.9 5 16.7 3.1 8.4 0.33PGI(tot) 15.5 1 14.9 3.2 8.8 + 0.34SPS 20.6 5 7.0 6.4 18.0 + 0.36SuSy 29.8 0.07GK 54.2 NDFK 47.8 5 16.6 3.6 9.4 NDUGP 21.8 3 0.8 17.1 37.8 0.12
5 5.2 5.1 9.3 +Rubisco(ini) 24.9 0.16Rubisco(max) 20.9 3 20.5 3.1 9.0 + 0.21Rubisco(ratio) 33.2 0.50ChlA 13.7 2 11.2 3.7 7.4 + 0.43
3 0.3 3.4 6.8 +4 10.6 3.4 6.7 +5 1.7 3.8 7.6 +
ChlB 14.0 0.32AA 15.0 2 8.5 5.3 8.9 0.53
2 16.2 3.9 6.23 0.3 4.7 7.5 +4 13.9 5.1 8.65 14.0 4.1 6.6
Protein 14.2 2 12.9 3.2 7.6 + 0.353 7.4 3.2 7.6 +
Starch 17.8 0.04Suc 15.2 3 15.6 3.4 8.5 0.39
3 23.3 5.8 15.1 +Glu 20.4 1 4.9 8.5 19.2 0.10
2 11.2 4.4 9.13 13.0 5.8 13.8

Integrative analyses of genetic variation in enzyme activity
107
Table 2: Continued.Trait CV Chr. Mb LOD %Expl. Var Effect 2Log Ler/CviFru 19.4 1 5.4 5.0 10.9 0.03
3 7.9 11.7 27.5 +3 13.0 6.2 15.3
G1P 32.7 3 0.3 4.5 12.1 0.565 7.2 3.3 8.8 +
G6P 35.8 3 1.3 4.0 13.0 0.38UDPG 24.7 3 0.8 35.9 64.9 0.71
PC1 2 11.2 4.7 11.6 +PC2 3 0.3 28.2 54.6PC3 1 4.4 4.7 13.0PC4PC5 5 8.6 4.1 11.9PC6 3 7.0 7.1 19.0 +PC7 5 18.2 10.8 28.5PC8 5 1.3 4.2 11.9 +

Chapter 5
108
Figure 2:Heatmap of QTL profiles of each analyzed trait.Shading intensities represent LOD scores. Positive effect loci are projected in decreasing intensity andnegative effect loci in increasing intensity. Chromosomal borders are indicated by vertical shaded linesand the position of structural genes for the enzyme by triangles. Transcriptional regulation of structuralgenes is indicated by shading intensity of the triangles; Solid, local eQTL; shaded, distant eQTL; open,no eQTLs detected or gene not analyzed.

Integrative analyses of genetic variation in enzyme activity
109
Figure 3: QTL co location network of analyzed genes, enzymes and metabolites.Edges between planes represent, respectively: between genes and enzymes: solid, position of structuralgene co locating with enzyme activity QTL; dashed, cis eQTL co locating with enzyme activity QTL;dotted, trans eQTL co locating with enzyme activity QTL; between enzymes and metabolites: solid,enzyme activity QTL co locating with metabolite content QTL; dashed, enzymes connected to theirsubstrate and/or product metabolites. Solid edges within planes connect traits with co locating QTLs.Co location was defined as an overlap in QTL support intervals.

Chapter 5
110
To determine whether we could identify a common factor explaining theobserved correlations we performed a principal component analysis (PCA) on alltraits analyzed. For most traits a large part of the variation could be extracted ineight principal components (PC), explaining together 68% of the observedvariation (Table 3). By far the best representative of all traits was PC1, whichexplained over 28% of the variance. Interestingly, in PC1 positive values wereobtained for the enzyme activity traits and some end products, while negativevalues were obtained for the hexose pools, which is in line with the observedcorrelations between these traits. When the corresponding PC values for theindividual RILs were subjected to QTL analysis a strong QTL for PC1 wasobserved at 11.2 Mbp on chromosome 2, which corresponds to the position ofERECTA (Table 2). This locus was also identified as a QTL for cytosolicphosphoglucose isomerase activity, chlorophyll A and glucose content. TheERECTA gene is polymorphic between the population’s parental accessions Lerand Cvi (Alonso Blanco et al., 1998) and causal for many of the morphological anddevelopmental differences observed between these accessions (Torii et al., 1996;Juenger et al., 2005; Masle et al., 2005). Moreover, ERECTA has been shown to exertpleiotropic effects on many growth related and metabolic traits (El Lithy et al.,2004; Keurentjes et al., 2006, 2007a). It is therefore conceivable that ERECTA isresponsible for a subtle simultaneous regulation of primary carbon metabolism, inparallel with its effects on development. It has been suggested earlier that theremay be such links, but without any specific suggestions as to which genes might beinvolved (Cross et al., 2006; Meyer et al., 2007). Other PCs merely explain variationin a specific subset of traits, e.g. PC2 best explains most of the variation observedfor UDP glucose pyrophosphorylase, glucose 1 phosphate, glucose 6 phosphateand UDP glucose. All of these traits show a QTL at the same position at the top ofchromosome three, where a QTL for PC2 was also detected (Table 2) (see below forfurther discussion).

Integrative analyses of genetic variation in enzyme activity
111
Table 3: Principal component analysis. Columns represent respectively the proportion of variance thatcould be explained by all components and by each component separately for the different traitsanalyzed. The last row represents the percentage of explained variance of all traits by all componentsand by each component separately.
Extraction PC1 PC2 PC3 PC4 PC5 PC6 PC7 PC8Inv 0.44 0.22 0.27 0.41 0.24 0.06 0.26 0.17 0.01AGP 0.64 0.78 0.06 0.10 0.05 0.09 0.01 0.03 0.05FBP 0.53 0.48 0.21 0.15 0.04 0.17 0.22 0.31 0.24G6PDH 0.59 0.70 0.11 0.09 0.06 0.23 0.09 0.14 0.10PFK 0.42 0.56 0.02 0.04 0.04 0.00 0.28 0.15 0.08PFP 0.82 0.83 0.21 0.06 0.11 0.03 0.05 0.13 0.21PGM 0.65 0.54 0.04 0.15 0.19 0.09 0.02 0.49 0.20PGI(cyt) 0.70 0.76 0.12 0.09 0.01 0.08 0.13 0.25 0.10PGI(pla) 0.84 0.33 0.11 0.30 0.54 0.19 0.54 0.06 0.01PGI(tot) 0.89 0.71 0.04 0.16 0.38 0.22 0.34 0.23 0.01SPS 0.58 0.65 0.30 0.11 0.07 0.15 0.13 0.04 0.06SuSy 0.35 0.45 0.14 0.01 0.12 0.01 0.15 0.05 0.30GK 0.51 0.60 0.02 0.02 0.31 0.04 0.17 0.11 0.06FK 0.54 0.49 0.23 0.06 0.28 0.15 0.17 0.31 0.13UGP 0.72 0.51 0.57 0.16 0.25 0.05 0.18 0.08 0.04Rubisco(ini) 0.91 0.51 0.20 0.10 0.33 0.53 0.41 0.16 0.13Rubisco(max) 0.73 0.54 0.01 0.07 0.40 0.29 0.37 0.10 0.21Rubisco(ratio) 0.93 0.09 0.24 0.05 0.02 0.91 0.10 0.10 0.03chlA 0.83 0.73 0.24 0.14 0.20 0.15 0.25 0.02 0.32chlB 0.78 0.68 0.19 0.17 0.11 0.05 0.36 0.06 0.33AA 0.70 0.13 0.52 0.01 0.13 0.08 0.25 0.51 0.26Protein 0.74 0.80 0.13 0.10 0.14 0.10 0.06 0.02 0.18Starch 0.59 0.55 0.25 0.02 0.31 0.18 0.10 0.15 0.25Suc 0.70 0.24 0.23 0.50 0.48 0.11 0.19 0.02 0.24Glu 0.86 0.39 0.30 0.78 0.01 0.11 0.06 0.03 0.00Fru 0.79 0.27 0.39 0.68 0.01 0.03 0.22 0.07 0.23G1P 0.69 0.14 0.57 0.13 0.01 0.04 0.00 0.39 0.43G6P 0.48 0.16 0.54 0.22 0.09 0.02 0.23 0.01 0.23UDPG 0.70 0.13 0.69 0.26 0.27 0.09 0.19 0.07 0.15
% of Variance 67.82 28.25 9.08 6.64 5.47 5.36 5.25 4.00 3.77
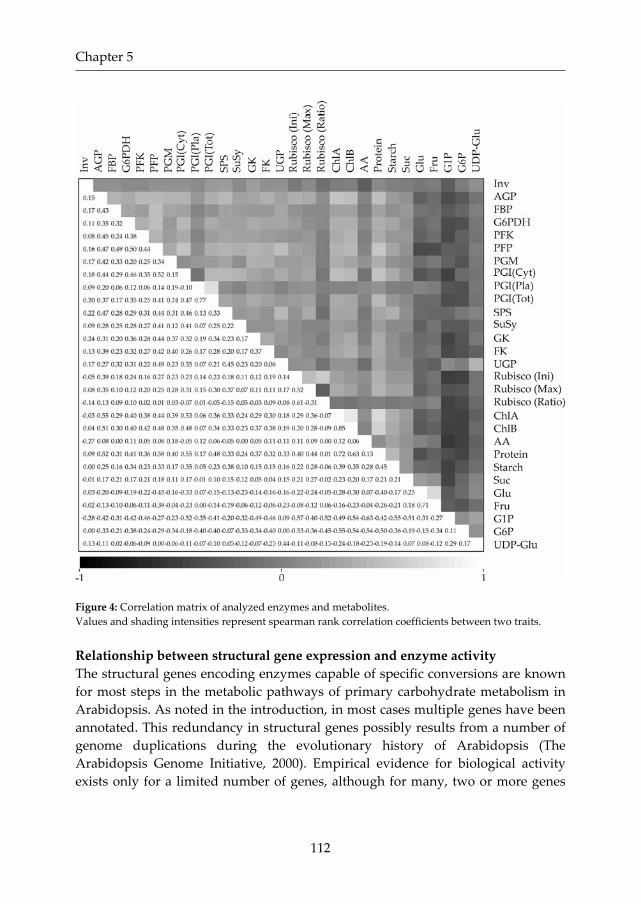
Chapter 5
112
Figure 4: Correlation matrix of analyzed enzymes and metabolites.Values and shading intensities represent spearman rank correlation coefficients between two traits.
Relationship between structural gene expression and enzyme activityThe structural genes encoding enzymes capable of specific conversions are knownfor most steps in the metabolic pathways of primary carbohydrate metabolism inArabidopsis. As noted in the introduction, in most cases multiple genes have beenannotated. This redundancy in structural genes possibly results from a number ofgenome duplications during the evolutionary history of Arabidopsis (TheArabidopsis Genome Initiative, 2000). Empirical evidence for biological activityexists only for a limited number of genes, although for many, two or more genes

Integrative analyses of genetic variation in enzyme activity
113
may be needed as a minimum to encode the enzymes in different tissues andsubcellular compartments. Many of the annotations are based on homology withgenes with known biological activity, but functional analyses have not beenperformed. Furthermore homologous and paralogous genes might have lost ormodified functions or their expression pattern might have changed.
Several cases were found where the position of structural genes co locateswith QTLs for activity of their encoded enzymes (Figure 2, Table 4), includinginvertase, phosphoglucomutase, phosphoglucose isomerase, sucrose phosphatesynthase, and UDP glucose pyrophosphorylase. In these cases, the variationobserved in enzyme activity is most likely to be due to polymorphisms in theencoding structural genes. Such polymorphisms may occur (i) in the coding regionof genes leading to an alteration of the specific activity or stability, or (ii) inpromoter regions that affect transcription efficiency and subsequently proteinlevels. In the former case the changes of activity should be independent of changesof the transcript levels, whereas in the latter case they will be accompanied byqualitatively similar changes of transcript levels. To distinguish between thesepossibilities, we analyzed transcript levels for all of the putative structural genes,in parallel with the aforementioned enzyme activity assays. Samples wereanalyzed on full genome arrays (Keurentjes et al., 2007b); signal intensities for eachRIL were used to calculate the correlation coefficient between individual transcriptlevels and enzyme activities, and signal ratios of pairs of RILs on the same slidewere used for QTL analyses.
Only a weak to medium correlation between enzyme activities and thetranscript levels of the putative structural genes was observed (Table 4); (see laterfor a discussion of possible reasons). However, in some cases significantcorrelations were found. The strongest correlations were observed for structuralgenes co locating with enzyme activity QTLs, indicating that part of the variationobserved in enzyme activity can be explained by differential expression ofstructural genes. This is further supported by the fact that nearly all correlations oftranscript levels of these genes with enzyme activities were positive. The onlyexception was a small non significant negative correlation of a phosphoglucosemutase gene (At1g70820). Negative correlations possibly result from phase shifts intranscription and translation; although other explanations are also possible (seediscussion).

Chapter 5
114
Table 4: Statistics of structural genes. Columns represent respectively the encoded enzymes, the AGIgene codes of structural genes, the position of the structural gene on the chromosome indicated in theAGI code, the spearman rank correlation coefficient between enzyme activity and gene transcript levels,the P value of the correlation coefficient, the chromosome number and, in parentheses, the position inMbp, the LOD score, and the direction of effect (+, Ler > Cvi; , Ler < Cvi) of detected eQTLs. Genes andeQTL positions in boldface co locate with QTLs detected for enzyme activity. When more then oneeQTL was detected, positions, LOD scores, and effects of the different eQTLs are separated by asemicolon. NA, Not Analyzed; NS, Not Significant.Enzyme Gene Mb R P eQTL LOD EffectInv at1g12240 4.15 0.19 1.8E 02 1(4.1) 6.4
at1g62660 23.20 0.06 4.8E 01 1(7.9); 3(20.0) 3.7; 3.3 ;
AGP at1g27680 9.63 0.08 3.2E 01 1(10.2) 3.0at1g05610 1.67 0.04 6.1E 01 1(28.8); 3(20.5) 4.0; 3.5 ; +at1g74910 28.14 0.24 3.2E 03 1(22.3); 1(26.4) 3.7; 4.0 +; +at2g04650 1.62 0.03 7.4E 01 NSat2g21590 9.25 0.02 8.5E 01 NSat3g03250 0.75 0.26 1.1E 03 1(12.5); 3(1.4); 3(20.5) 3.2; 15.1; 3.2 ; ;at4g39210 18.26 0.20 1.4E 02 3(18.6) 3.5at5g17310 5.70 0.23 3.9E 03 3(4.1) 9.6at5g19220 6.46 0.23 3.4E 03 5(8.1) 6.2 +at5g48300 19.59 0.15 6.2E 02 NS
FBP at1g43670 16.47 0.01 9.1E 01 1(12.2) 3.1at3g54050 20.03 0.15 7.2E 02 NSat5g64380 25.76 0.03 7.5E 01 5(22.4) 4.3
G6PDH at1g09420 3.04 0.06 4.5E 01 1(3.1) 4.8at1g24280 8.61 0.31 8.4E 05 2(6.9) 3.1 +at3g27300 10.08 0.17 3.7E 02 4(0.3) 3.5at5g13110 4.16 0.02 7.6E 01 NSat5g35790 13.97 0.12 1.3E 01 4(0.3); 4(13.9); 5(16.7) 3.1; 3.2; 4.7 ; ;at5g40760 16.33 0.06 4.9E 01 5(16.7) 8.9 +
PFK at1g43766 16.55 NAat1g59810 22.01 NAat2g22480 9.55 0.13 1.1E 01 1(18.0); 2(18.3); 5(2.5) 3.7; 4.9; 3.6 +; +;at4g26270 13.30 0.25 1.4E 03 2(10.0); 2(11.2) 3.1; 3.5 +; +at4g29220 14.40 0.08 3.4E 01 NSat5g03300 0.80 0.10 2.0E 01 5(0.8) 21.7 +at5g47810 19.37 0.04 6.4E 01 NSat5g56630 22.94 0.01 9.0E 01 NSat5g61580 24.78 0.09 2.8E 01 NS

Integrative analyses of genetic variation in enzyme activity
115
Table 4: Continued.Enzyme Gene Mb R P eQTL LOD EffectPFP at1g12000 4.05 0.01 9.3E 01 NS
at1g20950 7.30 0.01 9.3E 01 NSat1g76550 28.73 0.35 9.5E 06 NSat2g05150 1.86 NAat4g04040 1.94 0.15 6.3E 02 1(3.8) 3.5 +at4g08876 5.68 NAat4g32840 15.84 0.27 7.7E 04 NS
PGM at1g23190 8.22 0.11 1.7E 01 NSat1g70730 26.67 0.04 6.3E 01 NSat1g70820 26.71 0.13 1.1E 01 1(28.0) 5.6at5g17530 0.58 NAat5g51820 21.08 0.69 4.4E 23 5(1.7); 5(21.0) 7.4; 36.6 +;
PGI(Cyt) at1g30560 10.82 0.02 8.4E 01 4(6.6); 4(10.6) 3.4; 3.4 +; +at4g25220 12.92 0.32 4.6E 05 2(11.2) 3.1 +at5g42740 17.15 0.19 1.6E 02 NS
PGI(Pla) at4g24620 12.71 0.17 3.0E 02 NS
PGI(Tot) at1g30560 10.82 0.01 9.3E 01 4(6.6); 4(10.6) 3.4; 3.4 +; +at4g24620 12.71 0.23 3.5E 03 NSat4g25220 12.92 0.15 5.8E 02 2(11.2) 3.1 +at5g42740 17.15 0.17 3.1E 02 NS
SPS at1g04920 1.39 0.10 2.2E 01 NSat1g16570 5.67 0.12 1.3E 01 NSat4g10120 6.31 0.08 3.1E 01 4(6.2) 7.0 +at5g11110 3.54 0.13 1.2E 01 5(3.7) 4.5 +at5g20280 6.84 0.23 4.2E 03 5(7.2) 9.2 +
SuSy at1g73370 27.59 0.16 4.0E 02 5(14.0) 8.2at3g43190 15.19 0.07 4.0E 01 NSat4g02280 0.99 0.07 3.8E 01 NSat5g20830 7.05 0.10 2.1E 01 NSat5g37180 14.74 0.14 7.7E 02 NSat5g49190 19.96 0.27 5.5E 04 NS

Chapter 5
116
Table 4: Continued.Enzyme Gene Mb R P eQTL LOD EffectGK at1g30660 10.88 0.18 2.5E 02 NS
at1g47840 17.62 0.04 6.5E 01 1(16.8) 3.8at1g50460 18.70 0.02 7.9E 01 1(18.0) 17.0at2g19860 8.58 0.10 2.3E 01 NSat3g20040 6.99 0.22 6.3E 03 NSat4g29130 14.35 0.07 4.0E 01 NSat4g37840 17.79 0.19 2.0E 02 NS
FK at1g06020 1.82 0.09 2.7E 01 NSat1g06030 1.83 0.01 8.8E 01 NSat1g30660 10.88 0.17 3.1E 02 NSat1g47840 17.62 0.11 1.6E 01 1(16.8) 3.8at1g50390 18.67 NAat1g50460 18.70 0.09 2.9E 01 1(18.0) 17.0at1g66430 24.78 0.11 1.6E 01 1(28.8); 2(16.8) 3.4; 3.5 ;at1g69200 26.02 0.07 4.0E 01 NSat2g19860 8.58 0.03 7.2E 01 NSat2g31390 13.39 0.15 7.2E 02 2(12.5) 5.0at3g20040 6.99 0.22 5.3E 03 NSat3g54090 20.04 0.26 1.2E 03 3(11.0) 3.3 +at3g59480 21.99 0.05 5.6E 01 NSat4g10260 6.37 NAat4g29130 14.35 0.18 2.5E 02 NSat4g37840 17.79 0.19 1.7E 02 NSat5g51830 21.09 0.27 5.8E 04 5(21.0) 26.4
UGP at3g03250 0.75 0.41 1.3E 07 1(12.5); 3(1.4) 4.5; 43.9 ;at5g17310 5.70 0.42 7.1E 08 1(12.5); 3(1.9) 4.6; 30.3 ;
Rubisco at1g34630 12.69 0.19 1.9E 02 1(13.4) 3.0at1g67090 25.05 0.03 7.3E 01 NSat5g38410 15.39 0.02 8.4E 01 NSat5g38420 15.40 NAat5g38430 15.40 0.05 5.2E 01 NSat5g58240 23.58 0.20 1.3E 02 NS
We next subjected the observed transcript levels of the structural genes toQTL analyses. For each encoded enzyme; we found significant QTLs for at leastone of the encoding structural genes (eQTLs) (Table 4). Both local and distantregulation was observed, as judged from the position of genes and their respectiveeQTLs; locally observed eQTLs indicate that regulation occurs in cis whereasdistant eQTLs suggests regulation to occur in trans (Rockman and Kruglyak, 2006).
Integrative analyses of genetic variation in enzyme activity
117
Examples of strong local regulation include UDP glucose pyrophosphorylase(At3g03250), phosphoglucomutase (At5g51820), phosphofructokinase (At5g03300),and hexokinase (At1g50460). As noted above, enzyme activity correlated with thetranscript level for several of these genes. Moreover, strong local regulation ofstructural genes co locating with a QTL for activity of their encoded enzyme wasobserved [e.g. invertase (At1g12240), phosphoglucomutase (At1g70820 andAt5g51820), sucrose phosphate synthase (At5g20280), and UDP glucosepyrophosphorylase (At3g03250)]. The only exception was a structural gene forUDP glucose pyrophosphorylase (At5g17310), which showed strong distantregulation. These findings again suggest that cis regulatory variation in expressionof structural genes is at least partly responsible for observed variation in enzymeactivity.
In other cases, both locally and distantly acting significant eQTLs forstructural genes, that did not co locate with QTLs for enzyme activity, were found,even though significant correlation was sometimes observed between transcriptlevels of these genes and enzyme activity. In the case of cytosolic phosphoglucoseisomerase a trans acting eQTL for a structural gene (At4g25220) co locates with aQTL for enzyme activity (Table 4). Moreover, of all genes annotated as aphosphoglucose isomerase, the transcript levels of this gene showed the highestcorrelation with enzyme activity. This indicates that also trans acting regulatoryvariation in structural gene transcription can explain variation observed in enzymeactivity. For two structural genes, co locating with their encoding enzyme activityQTLs (viz. At1g70730, phosphoglucomutase and At5g42740, cytosolicphosphoglucose isomerase), no significant eQTL was observed.
Finally, both locally and distantly acting significant eQTLs for structuralgenes were detected without coinciding positions of genes and activity QTLs or colocating (e)QTLs and for which no significant correlation between transcript leveland enzyme activity was found. These findings suggest that not all annotatedgenes actually contribute to the observed activity of the putatively encodedenzyme and might serve other functions independently regulated from theircurrent annotation. However, our results do not exclude other explanations, suchas spatial and temporal control, post transcriptional and (post) translationalregulation, additive effects of multiple genes, and temporal shifts betweentranscription and translation (see also discussion).

Chapter 5
118
Different modes of action in the genetic control of enzymatic activityAlthough variation in activity was observed for many of the analyzed enzymes,the strongest genetically controlled variation was found for phosphoglucomutase(PGM) and UDP glucose pyrophosphorylase (UGP). For these two enzymes, wealso investigated substrate and product levels. When combined with the parallelanalysis of transcript levels of the structural genes, this offers the opportunity ofgaining deeper insight into the mechanisms of genetic regulation of these traits.
For PGM activity two highly significant QTLs were detected with oppositeeffects (Figure 5A). One strong activity QTL for PGM was detected at the lowerarm of chromosome five, with activity being strongly decreased in Ler genotypesfor this locus, compared to Cvi genotypes. This activity QTL co located with astructural gene for the plastidic PGM (At5g51820 (PGM1) (Kofler et al., 2000;Periappuram et al., 2000). QTL analysis of transcript levels of this gene revealed anequally significant eQTL at the identical position of this structural gene and theenzyme activity QTL. Since the direction of the additive effect of both QTLs is alsoidentical, this suggests that cis regulatory variation in the expression of a structuralgene is causal for the observed variation in enzyme activity. The second activityQTL for PGM is located on the lower arm of chromosome 1 and coincides with twoputatively annotated structural genes for cytosolic isoforms of PGM (At1g70730and At1g70820 (The Arabidopsis Information Resource). No eQTL could bedetected explaining variation in transcript levels of At1g70730, but a minor eQTLwas detected explaining transcript level variation of At1g70820. This minor eQTLwas located at a similar position as the QTL for PGM activity, although with anopposite additive effect. There are several alternative explanations why an eQTLand activity QTL have different signs. One is that a polymorphism in the structuralgene is leading to increased activity or protein stability, which results in changes ofmetabolites that weakly repress the transcription of the structural gene (negativefeedback). Another is that there are actually two cis polymorphisms, one affectingtranscription and one affecting protein function, which interact to regulate theeventual level of enzyme activity. The Ler allele, compared to the Cvi allele, thenleads to lower transcript levels but the encoded enzyme shows higher activity forthe conversion of G1P into G6P. For At1g70730, functional polymorphisms in thecoding sequence alone could explain the observed variation in enzyme activitysince no genetically regulated variation in transcript levels was observed for thisgene.

Integrative analyses of genetic variation in enzyme activity
119
Figure 5: QTL profiles and boxplots of PGM related traits.(A) LOD scores plotted against genomic position, the sign of the LOD score is determined by thedirection of effect (+, Ler > Cvi; , Ler < Cvi). Solid line, PGM activity; dotted line, G1P content; dashedline, G6P content; shaded solid line At1g70820 expression level; shaded dotted line, At5g51820expression level. Shaded triangles indicate positions of structural genes: 1, At1g70820; 5, At5g51820. (B)Boxplots for four genotypic classes. Each class represents genotypic identical individuals for the twoQTLs at chromosome one and five (from left to right: A1A5, A1B5, B1A5, B1B5; A = Ler, B = Cvi). Boxplotsshow the median, interquartile range, outliers (o) and extreme cases (*) of individual variables. All traitsare plotted in arbitrary units.
The levels of substrate and product of PGM were not affected by PGMactivity QTLs (Figure 5B). Although minor QTLs were detected for glucose 1phosphate (G1P) and glucose 6 phosphate (G6P) content, these did not co locatewith QTLs for PGM activity, suggesting that the size of the hexose phosphate poolis not determined by flux rates, as catalyzed by PGM, but regulated independently.Note that G1P and G6P are present in the plastid and the cytosol, with larger poolsin the cytosol. As the strong PGM activity QTL is likely to be caused by the

Chapter 5
120
plastidic PGM, then quite large changes in the pools of the plastid might not havebeen seen in the overall measurements.
In contrast, strong co regulation was observed for the activity of UGP andits metabolite substrate UDP glucose (UDPG) and to a lesser degree its productG1P. Two QTLs with opposite effect were detected for UGP activity, each of themco locating with a putatively annotated structural gene (Figure 6A). The UGPactivity QTL at the top of chromosome three co locates with the position of thestructural gene At3g03250, for which an eQTL with the same direction of effect wasdetected at the identical position. This suggests that variation in UGP activity canbe explained by cis regulated differences in transcript levels of At3g03250. Thesecond QTL for UGP activity maps to the upper arm of chromosome five, and colocates with the structural gene At5g17310. When the At5g17310 transcript levelswere subjected to QTL analysis, a highly significant trans acting eQTL wasdetected at the same position as the chromosome three UGP activity QTL and theAt3g03250 eQTL, and with the same direction of effect. This implies that the UGPactivity QTL at chromosome five cannot be explained by transcription differencesof At5g17310, but might result from cis polymorphisms in the coding sequence.Instead, transcript level differences of At5g17310 might contribute to thechromosome three UGP activity QTL. Although the encoded enzyme of the Cviallele of At5g17310, compared to the Ler allele, might have a lower specific activityit is much stronger transcribed in lines carrying the Cvi genotype at thechromosome three locus (figure 6B). Given the strong homology in sequence andfunction between At3g03250 and At5g17310, and the fact that for both genes ahighly significant eQTL was detected at an identical position, it is likely that theyare co regulated by the same genetic factor. This could imply that At3g03250 is notcis regulated, as suggested earlier, but, like At5g17310, is regulated in trans by atightly linked locus.
Interestingly, a QTL for both UDPG and G1P content was detected at thechromosome three locus (Figure 6A), each with the same direction of effect as the(e)QTLs for UGP activity and gene transcript levels. The direction of effect and theposition of the G1P QTL can be explained by product accumulation (G1P) uponhigher conversion rates of UGP. However, the direction of the highly significantQTL for the substrate UDPG is against expectations since increasing conversionrates are incompatible with accumulation of substrate (UDPG). It is thereforeunlikely that UDPG content is controlled by the activity level of UGP. Instead, wehypothesize that accumulation of UDPG triggers upregulation of the expression ofUGP encoding genes leading to higher enzyme activity and accumulation of G1P.

Integrative analyses of genetic variation in enzyme activity
121
Figure 6: QTL profiles and boxplots of UGP related traits.(A) LOD scores plotted against genomic position, the sign of the LOD score is determined by thedirection of effect (+, Ler > Cvi; , Ler < Cvi). Solid line, UGP activity; dotted line, UDPG content; dashedline, G1P content; shaded solid line At3g03250 expression level; shaded dotted line, At5g17310expression level. Shaded triangles indicate positions of structural genes: 3, At3g03250; 5, At5g17310. (B)Boxplots for four genotypic classes. Each class represents genotypic identical individuals for the twoQTLs at chromosome three and five (from left to right: A3A5, A3B5, B3A5, B3B5; A = Ler, B = Cvi). Boxplotsshow the median, interquartile range, outliers (o) and extreme cases (*) of individual variables. All traitsare plotted in arbitrary units.

Chapter 5
122
DISCUSSION
Natural variation in primary carbohydrate metabolismNatural diversity provides a rich source of genetic perturbations which has beeneffectively analyzed for carbohydrate metabolism by quantitative genetics in anumber of studies and a variety of plant species (Causse et al., 1995; Eshed andZamir, 1995; Mitchell Olds and Pedersen, 1998; Prioul et al., 1999; Chen et al., 2001;Fridman et al., 2004; Sergeeva et al., 2004, 2006; Li et al., 2005; Cross et al., 2006;Schauer et al., 2006). However, most of these studies did not incorporatetranscription analysis of relevant genes or even combined enzyme activity andmetabolite content measurements. Here we present, for the first time, acomprehensive genetic analysis of all intermediate entities of the path fromgenotype to phenotype, including gene transcription, enzyme activity, andmetabolite content. We have shown that natural variation in primary carbohydratemetabolism is extensive in Arabidopsis. A substantial part of this variation wasattributable to genetic regulation, resulting in many QTLs detected for theanalyzed traits; including 15 QTLs for the 15 enzyme activities and 23 QTLs for the11 metabolites analysed in this study. Many of those QTLs could be explained bygenetic variation in structural genes.
Several other studies in Arabidopsis have reported QTL analyses ofcarbohydrate metabolism traits in RIL populations. Mitchell Olds and Pedersen(1998) analyzed activities of ten enzymes among which phosphoglucose isomerase(PGI), phosphoglucomutase (PGM) and fructose 1,6 bisphosphate phosphatase(FBP) in the Col x Ler RIL population. No QTL was found for FBP, in contrast toour findings. For PGI two QTLs were found at other positions than the three lociidentified in our study. The single QTL for PGM on chromosome five however colocated with one of the QTLs identified in our study. PGM activity was alsoanalyzed in the Ler x Cvi population by Sergeeva et al. (2004) who reported at leastthree QTLs, of which two co located with the two QTLs found in our study. Inanother study by Sergeeva et al. (2006), soluble acid invertase (Inv) activity wasanalyzed in the Ler x Cvi population revealing several QTLs, among which the onethat was confirmed in our analyses.
With respect to metabolite QTLs, amino acid content was analyzed in theBay 0 x Sha population by Loudet et al. (2003). Similar to our results a high numberof QTLs were detected of which a few co located. However, no co location wasobserved between the most significant QTLs in both studies. The extracts used inthe study of Loudet et al. (2003) were also analyzed for starch, glucose, fructose,and sucrose content (Calenge et al., 2006). Multiple QTLs were detected for each

Integrative analyses of genetic variation in enzyme activity
123
analyzed trait under the two different environmental conditions that were tested.QTLs for starch content were not detected in our study, possibly due to differencesin sampling time point and growth stage. For glucose, fructose, and sucrosemultiple QTLs were also detected in our study. However, co location with QTLsdetected by Calenge et al. (2006) was only observed for the strongest QTL forglucose content on chromosome 1 and for a minor QTL for fructose content onchromosome 3. The evident dissimilarities between the different studies mightreflect genotypic differences between populations or differences in developmentalstage, timing of sampling, or environmental growth conditions. Loudet et al. (2003)and Calenge et al. (2006) showed large differences in regulation of carbohydratecontent when plants were grown under different nitrogen supply regimes.Moreover, Sergeeva et al. (2004, 2006) showed organ specific regulation of enzymeactivity. These results illustrate that genetic regulation of primary carbohydratemetabolism is under spatial and temporal control involving a multitude of loci,which can be revealed depending on genotype, environment, development stages,and their mutual interactions.
Nevertheless, residual fractions of variance could often not be explainedby detected QTLs due to minor environmental and developmental differencesbetween samples, and sampling and analytical variation. When high fractions ofunexplained residual variation are observed this might also reflect the complexregulation of primary carbohydrate metabolism due to the genetic regulation bymany QTLs, each with a relatively small effect. Such minor QTLs may fail to passthe QTL significance threshold. Segregation of these small effect QTLs, however, inaddition to possible epistatic interactions, may contribute to transgression and tothe large genetic variation that is observed. Another indication of the complexregulation of primary carbohydrate metabolism was the finding that specific QTLswere detected for most analyzed traits. When co location of QTLs for differenttraits was observed this might often be due to the direct inter dependence of thetraits. For instance, UDP glucose pyrophosphorylase converts UDP glucose intoglucose 1 phosphate and all three traits map to a similar position on the genome.
Despite the seemingly specific independent regulation of many traits,indicated by the position of the identified QTLs, there was a striking correlationpattern between many traits. Positive correlations were observed between differentenzyme activity levels and between enzyme activities and the structuralcomponents, such as chlorophyll and proteins, and weaker correlations with someend products, such as sucrose, starch, and amino acids. Negative correlations,however, were observed between enzyme activities and dynamic (phosphorylated)intermediates of carbohydrate metabolic pathways. These results suggest that inaddition to the often specific independent regulation of metabolic pathways a more

Chapter 5
124
general level of regulation is acting on carbohydrate metabolism in plants, whichcould be related to the growth and developmental status of the plant. Subsequentdata analysis suggested developmental differences to be causal for the observedcorrelations. The principal component best explaining the variation observed forall traits mapped to the position of ERECTA (AT2G26330), a gene well known forits involvement in developmental control of Arabidopsis. The entwinement ofplant growth with carbohydrate metabolism was also reported in other studies forenzyme activities (Cross et al., 2006) and metabolite content (Cross et al., 2006;Schauer et al., 2006; Meyer et al., 2007).
Relationship between structural gene expression and enzyme activityMany metabolic conversions in plants are catalyzed by enzymes and variation inenzymatic activity can have a high impact on metabolic fluxes and metabolitecontent. It is conceivable that natural variation in enzyme activity is inflicted bygenomic variation in the structural genes encoding these enzymes.
We found strong evidence that natural variation for enzyme activity levelsis at least partially regulated by variation in structural genes or regulatory locicontrolling the transcription of these genes. First, co location of structural genesand enzyme activity QTLs suggests natural variation for these genes to be causalfor the observed variation in enzyme activity. When cis acting eQTLs weredetected for these genes, regulation is likely to occur on the transcriptional level,otherwise regulation might act post transcriptionally, possibly due to alteredspecific activity or protein stability. Secondly, co location of trans acting eQTLs forstructural genes and enzyme activity QTLs suggests trans regulatory variation ofthese genes to be causal for the observed variation in enzyme activity. Suchregulation is likely to occur through transcriptional regulation of the structuralgene due to variation for a distant regulator. Both cis and trans actingtranscriptional as well as cis acting post transcriptional regulation of structuralgenes were identified as potential causes for observed variation in enzyme activity.However, for many enzymes, QTLs were also detected which did not co locatewith structural genes or their eQTLs, suggesting that regulation occurs at multiplelevels, partly independent of variation in (transcript levels of) structural genes.Likewise, for many structural genes eQTLs were detected which did not co locatewith QTLs for enzyme activity, which often explained the low correlation observedbetween transcript levels and activity. Apparently variation observed in thetranscript levels of these genes does not contribute to the variation observed inenzyme activity, suggesting that their encoded proteins might serve otherfunctions than their current annotation, or that variation at the transcriptional levelis ‘overruled’ by other regulating mechanisms or by temporal differences between

Integrative analyses of genetic variation in enzyme activity
125
gene expression and subsequent processes. Finally, for a number of structuralgenes no significant eQTL could be detected which can be the result of low(variation in) transcript levels that could not be detected in the microarrayexperiment
Often only a weak to medium correlation exists between levels of enzymeactivity and transcript levels of structural genes. This can be partly explained bythe redundancy in structural genes when different genes each contribute onlypartially to the eventual level of enzyme. However, different genes of a genefamily might have different specific activities for the metabolic conversions understudy, for which also natural variation might be present between accessions. In asegregating population this diversity of genetic variants and possible epistaticinteractions between them can severely complicate correlation analyses. On theother hand, correlations might be difficult to establish when relationships betweentranscript levels and protein levels are not linear. Deviations from perfectcorrelations and linearity can be caused due to delays in protein formation and/oractivation upon transcription. Moreover, regulation of enzyme activity can occurpost transcriptionally through mRNA and protein stability, protein folding,activation by or dependency on co factors, (de) phosphorylation, etc. Finally, lackof correlation can be simply a result of non functionality at the sampleddevelopmental stage or due to a dilution effect when genes are only transcribed inspecific cells or tissues. Negative correlations might be the result from negativefeedback due to high transcription levels of redundant genes, or phase shifts indiurnal rhythms of transcription and translation (Gibon et al., 2004b, 2006; Blasinget al., 2005).
Different modes of action in the genetic control of enzymatic activityFor many enzymes natural variation was observed in their level of activity. Inmany cases enzyme activity was related to metabolite content, among whichsubstrates and products of the analyzed enzymes. In several cases QTLs forenzyme activity co located with structural genes encoding these enzymes or eQTLsfor those genes. Differences in correlation pattern and QTL profiles between geneexpression, enzyme activity and metabolite content indicate, however, that geneticregulation causal for observed variation is not similar for all analyzed traits.Instead, various modes of genetic control, using different mechanisms, seem to actin the regulation of carbohydrate metabolism.
For phosphoglucomutase, one of the enzymes for which the highestvariation in activity was observed, it was shown that most of this variation couldbe explained by genetic factors. Parallel analysis of enzyme activity and structuralgene expression suggested cis regulatory variation in transcription of one of the

Chapter 5
126
structural genes (At5g51820) to be causal for the major PGM activity QTL.However, differences in the variation in transcription of structural genes andenzyme activity also indicated polymorphisms in coding regions of structuralgenes at a second locus to account for the observed variation in enzyme activity.Furthermore, although significant negative correlations were observed betweenPGM activity and its substrate and product G1P and G6P, these correlations arenot caused by any of the detected QTLs. This suggests that other levels ofregulation are also active for which no genomic variation could be detected withinthe analyzed population.
In contrast, the combined analysis of variation in the activity of UGP, itssubstrate and product and transcription of its encoding structural genes suggestedtrans regulated transcription differences to be the major cause for variation inenzyme activity. In this case the strong positive correlation between UDPG andUGP suggests UDPG levels to be the driving force for this trans acting regulation.This would mean that plants are able to sense and respond to changes in UDPGaccumulation, which has been suggested and shown also for other sugars (Rollandet al., 2002; Halford et al., 2003; Avonce et al., 2005; Gonzali et al., 2006). Although itremains speculative to assign which genetic factor(s) determine(s) the variationobserved in UDPG accumulation it is interesting to note that the inorganicphosphate status in Arabidopsis affects the transcription of UGP encoding genes(Ciereszko et al., 2001, 2005). Moreover, natural variation for phosphate andphytate, the major source of inorganic phosphate in plants, has been observed inthe Ler x Cvi population and a common QTL explaining most of the variation colocates with the QTL for UDPG content and UGP activity (Bentsink et al., 2003).Furthermore, a QTL for the accumulation of the phosphorylated hexoses G1P andG6P was detected at this position, which might indicate that high levels ofinorganic phosphate results in elevated levels of phosphorylated sugars. Inconclusion, variation in phosphorus levels would then regulate the accumulationof UDPG, which in turn triggers the expression of UGP encoding structural genes,leading to higher activity of UGP.

Integrative analyses of genetic variation in enzyme activity
127
MATERIALS ANDMETHODS
Plant material and tissue collectionAerial parts of seedlings from the accessions Ler and Cvi and a population of 160recombinant inbred lines derived from a cross between these parents (AlonsoBlanco et al., 1998; Keurentjes et al., 2006) were grown and collected as describedpreviously (Keurentjes et al., 2006). In brief, seeds of lines were sown in petri disheson 1/2MS agar and placed in a cold room for seven days. Petri dishes were thentransferred to a climate chamber and seedlings were collected after seven days.Plant material was stored at 80°C until further processing.
Linkage map construction and anchoring to the physical mapThe genetic map was constructed from a subset of the markers available, athttp:/nasc.nott.ac.uk/, as described in Keurentjes et al. (2007b). In total, 144 markerswere used, with an average spacing of 3.5 cM. The largest distance between twomarkers was 10.8 cM. The genetic map was anchored to the physical map asdescribed in Keurentjes et al. (2007b), with an almost linear genome wide relationof 4.1 cM per Mbp.
Metabolite and enzyme measurementsMetabolites were extracted and analyzed as described previously; ChlA, ChlB, AA,protein, sucrose, glucose, and fructose (Cross et al., 2006); starch, G1P, and G6P(Gibon et al., 2002); UDPG (Keurentjes et al., 2006). Enzymes were extracted asdescribed in Gibon et al. (2004a) and analyzed as described previously; Inv, AGP,FBP, G6PDH, PFK, PFP, SPS, SuSy, GK, FK, and UGP (Gibon et al., 2004a); PGI(Cross et al., 2006); PGM (Manjunath et al., 1998); Rubisco (Sulpice et al., 2007).Samples were randomized during extraction and analysis, and two biologicalreplicates were analyzed for each trait.
Microarray analysesTranscript levels of genes were analyzed on two color DNA microarrays asdescribed previously (Keurentjes et al., 2007b). Resulting 2log signal intensitieswere used for correlation analyses and 2log ratios between co hybridized RILswere used for QTL analyses.
Statistical analysesSpearman rank correlations were determined in Excel (Microsoft) for mean traitvalues as follows:

Chapter 5
128
kj
kjni ikij
jkTnnTnn
TTyynnR
112161
22
122
, j, k = 1,2,…,m;
where n is the number of observations, y is the rank of observations for variables jto m, and 12
jjj ttT , tj being the number of ties of a particular value of
variable j, and the summation being over all tied values of variable j (Siegel, 1956).QTL analyses for gene transcript levels were performed as described in
(Keurentjes et al., 2007b). For QTL analyses of metabolite and enzyme traits thecomputer program MapQTL version 5.0 (Van Ooijen, 2004) was used to identifyand locate QTLs linked to the molecular markers using multiple QTL mapping(MQM). LOD statistics were calculated at 0.5 cM intervals. Tests of 1000permutations were used to obtain an estimate of the number of type 1 errors (falsepositives). The genome wide LOD score, which 95% of the permutations did notexceed, ranged from 2.4 to 2.7. A LOD score of 3.0, to correct for multiple testing,was then used as the significance threshold to declare the presence of a QTL. In theMQM model the genetic effect ( B A) and percentage of explained variance wasestimated for each QTL, and 2 Mbp support intervals were established as an ~95%confidence level (Van Ooijen, 1992). Co location of (e)QTLs was defined as anoverlap in the 2Mbp support intervals.
Genomic positions of genes were inferred from the Arabidopsisinformation resource (The Arabidopsis Genome Initiative, 2000). When physicalpositions of genes fell in the 2 Mbp support interval of (e)QTLs this wasconsidered as co location.
Principal component and box plot analyses were performed in SPSS(version 12.0).
AcknowledgementsWe thank Linus van der Plas for critical reading of the manuscript. This work wassupported by grants from the Netherlands Organization for Scientific Research,Program Genomics (050 10 029), the Centre for Biosystems Genomics (CBSG,Netherlands Genomics Initiative) and a Genomics Fellowship from TheNetherlands Genomics Initiative (050 72 412).

Integrative analyses of genetic variation in enzyme activity
129
REFERENCES
Alonso Blanco, C., Peeters, A.J., Koornneef, M., Lister, C., Dean, C., van den Bosch, N., Pot, J. andKuiper, M.T. (1998). Development of an AFLP based linkage map of Ler, Col and CviArabidopsis thaliana ecotypes and construction of a Ler/Cvi recombinant inbred linepopulation. Plant J 14, 259 271.
Avonce, N., Leyman, B., Thevelein, J. and Iturriaga, G. (2005). Trehalose metabolism and glucosesensing in plants. Biochem Soc Trans 33, 276 279.
Bentsink, L., Yuan, K., Koornneef, M. and Vreugdenhil, D. (2003). The genetics of phytate andphosphate accumulation in seeds and leaves of Arabidopsis thaliana, using natural variation.Theor Appl Genet 106, 1234 1243.
Blasing, O.E., Gibon, Y., Gunther, M., Hohne, M., Morcuende, R., Osuna, D., Thimm, O., Usadel, B.,Scheible, W.R. and Stitt, M. (2005). Sugars and circadian regulation make majorcontributions to the global regulation of diurnal gene expression in Arabidopsis. Plant Cell 17,3257 3281.
Calenge, F., Saliba Colombani, V., Mahieu, S., Loudet, O., Daniel Vedele, F. and Krapp, A. (2006).Natural variation for carbohydrate content in Arabidopsis. Interaction with complex traitsdissected by quantitative genetics. Plant Physiol 141, 1630 1643.
Carrari, F., Urbanczyk Wochniak, E., Willmitzer, L. and Fernie, A.R. (2003). Engineering centralmetabolism in crop species: learning the system.Metab Eng 5, 191 200.
Causse, M., Rocher, J.P., Henry, A.M., Charcosset, A., Prioul, J.L. and De Vienne, D. (1995). Geneticdissection of the relationship between carbon metabolism and early growth in maize, withemphasis on key enzyme loci.Mol Breed 1, 259 272.
Chen, X., Salamini, F. and Gebhardt, C. (2001). A potato molecular function map for carbohydratemetabolism and transport. Theor Appl Genet 102, 284 295.
Ciereszko, I., Johansson, H., Hurry, V. and Kleczkowski, L.A. (2001). Phosphate status affects the geneexpression, protein content and enzymatic activity of UDP glucose pyrophosphorylase inwild type and pho mutants of Arabidopsis. Planta 212, 598 605.
Ciereszko, I., Johansson, H. and Kleczkowski, L.A. (2005). Interactive effects of phosphate deficiency,sucrose and light/dark conditions on gene expression of UDP glucose pyrophosphorylase inArabidopsis. J Plant Physiol 162, 343 353.
Cross, J.M., von Korff, M., Altmann, T., Bartzetko, L., Sulpice, R., Gibon, Y., Palacios, N. and Stitt, M.(2006). Variation of enzyme activities and metabolite levels in 24 Arabidopsis accessionsgrowing in carbon limited conditions. Plant Physiol 142, 1574 1588.
El Lithy, M.E., Clerkx, E.J., Ruys, G.J., Koornneef, M. and Vreugdenhil, D. (2004). Quantitative traitlocus analysis of growth related traits in a new Arabidopsis recombinant inbred population.Plant Physiol 135, 444 458.
Eshed, Y. and Zamir, D. (1995). An introgression line population of Lycopersicon pennellii in thecultivated tomato enables the identification and fine mapping of yield associated QTL.Genetics 141, 1147 1162.
Fernie, A.R., Tauberger, E., Lytovchenko, A., Roessner, U., Willmitzer, L. and Trethewey, R.N. (2002).Antisense repression of cytosolic phosphoglucomutase in potato (Solanum tuberosum) resultsin severe growth retardation, reduction in tuber number and altered carbon metabolism.Planta 214, 510 520.
Fiehn, O., Kloska, S. and Altmann, T. (2001). Integrated studies on plant biology using multiparalleltechniques. Curr Opin Biotechnol 12, 82 86.
Fridman, E., Carrari, F., Liu, Y.S., Fernie, A.R. and Zamir, D. (2004). Zooming in on a quantitative traitfor tomato yield using interspecific introgressions. Science 305, 1786 1789.

Chapter 5
130
Gachon, C.M., Langlois Meurinne, M., Henry, Y. and Saindrenan, P. (2005). Transcriptional coregulation of secondary metabolism enzymes in Arabidopsis: functional and evolutionaryimplications. Plant Mol Biol 58, 229 245.
Gibon, Y., Vigeolas, H., Tiessen, A., Geigenberger, P. and Stitt, M. (2002). Sensitive and highthroughput metabolite assays for inorganic pyrophosphate, ADPGlc, nucleotide phosphates,and glycolytic intermediates based on a novel enzymic cycling system. Plant J 30, 221 235.
Gibon, Y., Blaesing, O.E., Hannemann, J., Carillo, P., Hohne, M., Hendriks, J.H., Palacios, N., Cross,J., Selbig, J. and Stitt, M. (2004a). A Robot based platform to measure multiple enzymeactivities in Arabidopsis using a set of cycling assays: comparison of changes of enzymeactivities and transcript levels during diurnal cycles and in prolonged darkness. Plant Cell 16,3304 3325.
Gibon, Y., Blasing, O.E., Palacios Rojas, N., Pankovic, D., Hendriks, J.H., Fisahn, J., Hohne, M.,Gunther, M. and Stitt, M. (2004b). Adjustment of diurnal starch turnover to short days:depletion of sugar during the night leads to a temporary inhibition of carbohydrateutilization, accumulation of sugars and post translational activation of ADP glucosepyrophosphorylase in the following light period. Plant J 39, 847 862.
Gibon, Y., Usadel, B., Blaesing, O.E., Kamlage, B., Hoehne, M., Trethewey, R. and Stitt, M. (2006).Integration of metabolite with transcript and enzyme activity profiling during diurnal cyclesin Arabidopsis rosettes. Genome Biol 7, R76.
Gonzali, S., Loreti, E., Solfanelli, C., Novi, G., Alpi, A. and Perata, P. (2006). Identification of sugarmodulated genes and evidence for in vivo sugar sensing in Arabidopsis. J Plant Res 119, 115123.
Halford, N.G., Hey, S., Jhurreea, D., Laurie, S., McKibbin, R.S., Paul, M. and Zhang, Y. (2003).Metabolic signalling and carbon partitioning: role of Snf1 related (SnRK1) protein kinase. JExp Bot 54, 467 475.
Harrison, J., Hirel, B. and Limami, A.M. (2004). Variation in nitrate uptake and assimilation betweentwo ecotypes of Lotus japonicus and their recombinant inbred lines. Physiol Plant 120, 124 131.
Hirai, M.Y., Klein, M., Fujikawa, Y., Yano, M., Goodenowe, D.B., Yamazaki, Y., Kanaya, S.,Nakamura, Y., Kitayama, M., Suzuki, H. et al. (2005). Elucidation of gene to gene andmetabolite to gene networks in arabidopsis by integration of metabolomics andtranscriptomics. J Biol Chem 280, 25590 25595.
Hirel, B., Bertin, P., Quillere, I., Bourdoncle, W., Attagnant, C., Dellay, C., Gouy, A., Cadiou, S.,Retailliau, C., Falque, M. et al. (2001). Towards a better understanding of the genetic andphysiological basis for nitrogen use efficiency in maize. Plant Physiol 125, 1258 1270.
Juenger, T.E., McKay, J.K., Hausmann, N., Keurentjes, J.J.B., Sen, S., Stowe, K.A., Dawson, T.E.,Simms, E.L. and Richards, J.H. (2005). Identification and characterization of QTL underlyingwhole plant physiology in Arabidopsis thaliana: delta13C, stomatal conductance andtranspiration efficiency. Plant Cell Environ. 28, 697 708.
Keurentjes, J.J.B., Fu, J., de Vos, C.H., Lommen, A., Hall, R.D., Bino, R.J., van der Plas, L.H., Jansen,R.C., Vreugdenhil, D. and Koornneef, M. (2006). The genetics of plant metabolism. Nat Genet38, 842 849.
Keurentjes, J.J.B., Bentsink, L., Alonso Blanco, C., Hanhart, C.J., Blankestijn De Vries, H., Effgen, S.,Vreugdenhil, D. and Koornneef, M. (2007a). Development of a near isogenic line populationof Arabidopsis thaliana and comparison of mapping power with a recombinant inbred linepopulation. Genetics 175, 891 905.

Integrative analyses of genetic variation in enzyme activity
131
Keurentjes, J.J.B., Fu, J., Terpstra, I.R., Garcia, J.M., van den Ackerveken, G., Snoek, L.B., Peeters,A.J., Vreugdenhil, D., Koornneef, M. and Jansen, R.C. (2007b). Regulatory networkconstruction in Arabidopsis by using genome wide gene expression quantitative trait loci.Proc Natl Acad Sci U S A 104, 1708 1713.
Koch, K. (2004). Sucrose metabolism: regulatory mechanisms and pivotal roles in sugar sensing andplant development. Curr Opin Plant Biol 7, 235 246.
Kofler, H., Hausler, R.E., Schulz, B., Groner, F., Flugge, U.I. and Weber, A. (2000). Molecularcharacterisation of a new mutant allele of the plastid phosphoglucomutase in Arabidopsis,and complementation of the mutant with the wild type cDNA.Mol Gen Genet 263, 978 986.
Koornneef, M., Alonso Blanco, C. and Vreugdenhil, D. (2004). Naturally occurring genetic variation inArabidopsis Thaliana. Annu Rev Plant Physiol Plant Mol Biol 55, 141 172.
Li, L., Strahwald, J., Hofferbert, H.R., Lubeck, J., Tacke, E., Junghans, H., Wunder, J. and Gebhardt, C.(2005). DNA variation at the invertase locus invGE/GF is associated with tuber quality traitsin populations of potato breeding clones. Genetics 170, 813 821.
Loudet, O., Chaillou, S., Merigout, P., Talbotec, J. and Daniel Vedele, F. (2003). Quantitative trait locianalysis of nitrogen use efficiency in Arabidopsis. Plant Physiol 131, 345 358.
Lunn, J.E. (2007). Compartmentation in plant metabolism. J Exp Bot 58, 35 47.Manjunath, S., Lee, C.H., VanWinkle, P. and Bailey Serres, J. (1998). Molecular and biochemical
characterization of cytosolic phosphoglucomutase in maize. Expression during developmentand in response to oxygen deprivation. Plant Physiol 117, 997 1006.
Martienssen, R.A. (2000). Weeding out the genes: the Arabidopsis genome project. Funct IntegrGenomics 1, 2 11.
Masle, J., Gilmore, S.R. and Farquhar, G.D. (2005). The ERECTA gene regulates plant transpirationefficiency in Arabidopsis. Nature 436, 866 870.
Meyer, R.C., Steinfath, M., Lisec, J., Becher, M., Witucka Wall, H., Torjek, O., Fiehn, O., Eckardt, A.,Willmitzer, L., Selbig, J. et al. (2007). The metabolic signature related to high plant growthrate in Arabidopsis thaliana. Proc Natl Acad Sci U S A 104, 4759 4764.
Mitchell Olds, T. and Pedersen, D. (1998). The molecular basis of quantitative genetic variation incentral and secondary metabolism in Arabidopsis. Genetics 149, 739 747.
Morcuende, R., Bari, R., Gibon, Y., Zheng, W., Pant, B.D., Blasing, O., Usadel, B., Czechowski, T.,Udvardi, M.K., Stitt, M. et al. (2007). Genome wide reprogramming of metabolism andregulatory networks of Arabidopsis in response to phosphorus. Plant Cell Environ 30, 85 112.
Neuhaus, H.E., Kruckeberg, A.L., Feil, R., Gottlieb, L. and Stitt, M. (1989). Dosage mutants ofphosphoglucose isomerase in the cytosol and chloroplasts of Clarkia xantiana. II. Study of themechanisms which regulate photosynthate partitioning. Planta 178, 110 122.
Osuna, D., Usadel, B., Morcuende, R., Gibon, Y., Blasing, O.E., Hohne, M., Gunter, M., Kamlage, B.,Trethewey, R., Scheible, W.R. et al. (2007). Temporal responses of transcripts, enzymeactivities and metabolites after adding sucrose to carbon deprived Arabidopsis seedlings.Plant J 49, 463 491.
Periappuram, C., Steinhauer, L., Barton, D.L., Taylor, D.C., Chatson, B. and Zou, J. (2000). Theplastidic phosphoglucomutase from Arabidopsis. A reversible enzyme reaction with animportant role in metabolic control. Plant Physiol 122, 1193 1199.
Prioul, J.L., Pelleschi, S., Sene, M., Thevenot, C., Causse, M., de Vienne, D. and Leonardi, A. (1999).From QTLs for enzyme activity to candidate genes in maize. J Exp Bot 50, 1281 1288.
Rauh, L., Basten, C. and Buckler, S.t. (2002). Quantitative trait loci analysis of growth response tovarying nitrogen sources in Arabidopsis thaliana. Theor Appl Genet 104, 743 750.
Rockman, M.V. and Kruglyak, L. (2006). Genetics of global gene expression. Nat Rev Genet 7, 862 872.

Chapter 5
132
Roessner, U., Luedemann, A., Brust, D., Fiehn, O., Linke, T., Willmitzer, L. and Fernie, A. (2001).Metabolic profiling allows comprehensive phenotyping of genetically or environmentallymodified plant systems. Plant Cell 13, 11 29.
Rolland, F., Moore, B. and Sheen, J. (2002). Sugar sensing and signaling in plants. Plant Cell 14 Suppl,S185 205.
Rontein, D., Dieuaide Noubhani, M., Dufourc, E.J., Raymond, P. and Rolin, D. (2002). The metabolicarchitecture of plant cells. Stability of central metabolism and flexibility of anabolic pathwaysduring the growth cycle of tomato cells. J Biol Chem 277, 43948 43960.
Schauer, N., Semel, Y., Roessner, U., Gur, A., Balbo, I., Carrari, F., Pleban, T., Perez Melis, A.,Bruedigam, C., Kopka, J. et al. (2006). Comprehensive metabolic profiling and phenotypingof interspecific introgression lines for tomato improvement. Nat Biotechnol 24, 447 454.
Sergeeva, L.I., Vonk, J., Keurentjes, J.J.B., van der Plas, L.H., Koornneef, M. and Vreugdenhil, D.(2004). Histochemical analysis reveals organ specific quantitative trait loci for enzymeactivities in Arabidopsis. Plant Physiol 134, 237 245.
Sergeeva, L.I., Keurentjes, J.J.B., Bentsink, L., Vonk, J., van der Plas, L.H., Koornneef, M. andVreugdenhil, D. (2006). Vacuolar invertase regulates elongation of Arabidopsis thaliana rootsas revealed by QTL and mutant analysis. Proc Natl Acad Sci U S A 103, 2994 2999.
Siegel, S. (1956). Non parametric statistics for the behavioral sciences. (New York: McGraw Hill).Sturm, A. and Tang, G.Q. (1999). The sucrose cleaving enzymes of plants are crucial for development,
growth and carbon partitioning. Trends Plant Sci 4, 401 407.Sulpice, R., Tschoep, H., von Korff, M., Bussis, D., Usadel, B., Hoehne, M., Witucka Wall, H.,
Altmann, T., Stitt, M. and Gibon, Y. (2007). Description and applications of a rapid andsensitive non radioactive microplate based assay for maximum and initial activity ofribulose 1,5 bisphosphate carboxylase. Plant Cell Environ In press, doi: 10.1111/j.13653040.2007.01679.x.
The Arabidopsis Genome Initiative. (2000). Analysis of the genome sequence of the flowering plantArabidopsis thaliana. Nature 408, 796 815.
Torii, K.U., Mitsukawa, N., Oosumi, T., Matsuura, Y., Yokoyama, R., Whittier, R.F. and Komeda, Y.(1996). The Arabidopsis ERECTA gene encodes a putative receptor protein kinase withextracellular leucine rich repeats. Plant Cell 8, 735 746.
Urbanczyk Wochniak, E., Luedemann, A., Kopka, J., Selbig, J., Roessner Tunali, U., Willmitzer, L.and Fernie, A.R. (2003). Parallel analysis of transcript and metabolic profiles: a new approachin systems biology. EMBO Rep 4, 989 993.
Van Ooijen, J.W. (1992). Accuracy of mapping quantitative trait loci in autogamous species. Theor ApplGenet 84, 803 811.
Van Ooijen, J.W. (2004). MapQTL 5, Software for the mapping of quantitative trait loci in experimentalpopulations (Wageningen, The Netherlands: Kyazma B.V.).
Winnacker, E.L. (2003). Interdisciplinary sciences in the 21st century. Curr Opin Biotechnol 14, 328 331.

133
Chapter 6
General discussion
One of the intriguing observations in nature is the enormous diversity incharacteristic properties of various species. However, natural variation can also beobserved within species (Alonso Blanco and Koornneef, 2000), which is supposedto be one of the driving forces of species formation. Farmers and breeders haveused natural occurring genetic variation for centuries to improve crop species(Koornneef and Stam, 2001; Zamir, 2001). The identification of the genetic factorscontrolling natural variation would therefore improve our understanding ofgenetic regulatory processes and give insight into the evolutionary significance ofvariation (Mitchell Olds and Schmitt, 2006). For many traits quantitative variationis observed, suggesting that it is controlled by multiple genes. Possible interactionsbetween genes and between genes and the environment further add to thecomplexity of quantitative traits, making the genetic dissection of such traitsdifficult.
A classical first step in the genetic analysis of traits is the determination ofinheritance patterns in the progeny of a cross between distinct varieties.Quantitative traits do not segregate in distinct classes but instead display a morecontinuous variation in trait values as a result from the segregation of multipleindependent loci. To relate these quantitative trait loci (QTLs) to genomic positionsit is pivotal to be able to determine the genotype of segregants. The development ofmolecular markers greatly enhanced the ease in which mapping populations canbe genotyped. Molecular markers represent genomic polymorphisms betweengenotypically different lines. By crossing distinct accessions, numerouspolymorphisms will segregate in a progeny, enabling the construction of geneticmaps. Because quantitative traits may also segregate in the same offspringpopulation, QTLs for these traits can then be mapped by analyzing co segregationof trait values with molecular markers used for the construction of the genetic map(Broman, 2001; Doerge, 2002; Jansen, 2003).
Depending on the species and the ease by which mapping populations canbe generated several approaches have been applied. A relatively fast approach,requiring a minimal number of generations, is the generation of an F2 or back cross(BC) population. However, such populations still contain a high level ofheterozygosity which may compromise the construction of genetic maps,especially when dominant markers are being used. Moreover, such populations

Chapter 6
134
can not be propagated sexually without further segregation of the heterozygousregions, making additional genotyping in later generations necessary. Populationsconsisting of homozygous lines on the other hand, need several rounds of selfingor backcrossing to reach full homozygosity. Alternatively, homozygosity can beobtained by generating double haploids. When fully homozygous, lines can bepropagated without introducing further genotypic changes in their progeny. Atthis stage the population has become immortal and a single round of genotyping issufficient to generate a genetic map for any further experimentation. Homozygouslines offer the advantage of replicated measurements at genotypically identicalindividuals and also allow comparing different experiments in time andenvironment.
In Arabidopsis, recombinant inbred lines (RILs) have become the mappingpopulation of choice because of its selfing nature and short generation times(Somerville and Koornneef, 2002). In other species however, near isogenic lines(NILs) are sometimes favorable because of sterility problems and intolerancetowards inbreeding (Eshed and Zamir, 1995). Both types of population can be usedfor mapping purposes although they differ markedly in their genetic make up dueto differences in the crossing scheme. RILs are generated from an F1 withoutbackcrossing and therefore contain on average equal contributions of both parentalgenomes. NILs on the other hand, are generated from an F1 through repeatedbackcrossing with a recurrent parent and contain only a limited amount of thedonor genome. As a result RILs can contain multiple introgressions whereas NILspreferably contain only a single introgression into an otherwise isogenicbackground. Because of these differences, different mapping strategies arerequired for the two types of population.
Chapter two of this thesis described the development of the first genomewide coverage NIL population in Arabidopsis allowing the comparison ofmapping purposes with an already existing RIL population derived from the sameparental accessions (Alonso Blanco et al., 1998). These comparisons revealed ahigher mapping power for small effect loci but lower mapping resolution in theNIL population compared to the RIL population. However, results were greatlydepending on the genetic architecture of traits and population size and structure.For RIL populations both mapping power and resolution can be increased byincreasing population size, which would also diminish the need for replicatedmeasurements. For NIL populations resolution can also be improved by addingmore lines but, depending on the size of introgressions and the amount of overlap,power has to be increased by replicated measurements. Because of the muchhigher recombination frequency, RIL populations are often favorable over NILpopulations when mapping experiments are limited by the number of plants that

General discussion
135
can be analyzed. The segregation of multiple loci in RIL populations might masksmall effect QTLs, but allows the detection of genetic interactions, which is notpossible in NIL populations. Nils have been shown to be very useful for theconfirmation of QTLs and as starting material for the fine mapping of so calledMendelized QTL.
Although natural phenotypic variation can be observed for manyquantitative traits in Arabidopsis, which can be effectively analyzed in RILpopulations (Alonso Blanco and Koornneef, 2000; Koornneef et al., 2004), QTLanalysis often reveals only a limited number of steps in the complex regulatorypathways of quantitative traits. The path from genotype to phenotype ofteninvolves multiple intermediate steps and it is therefore difficult to determinewhether QTLs regulate traits directly or indirectly. Moreover, regulation can occurat different levels, ranging from variation in presence or expression of genes tovariation in protein function. Until the cloning of a QTL and the identification ofthe causal polymorphism(s) it therefore remains uncertain at which point in apathway traits are regulated. To fully understand the complex regulation ofquantitative traits it is therefore recommendable to genetically analyze differentlevels and intermediates at which genetic control might act (Fiehn et al., 2001;Winnacker, 2003).
The recent advance in analytical technologies (transcriptomics, proteomicsand metabolomics) now enables the large scale genetic analysis of different entitiesin the circuitry from gene to phenotype. The expression of genes often determinesthe onset of pathways resulting in a particular phenotype. Therefore, phenotypicvariation might be inflicted by variation in gene expression. At the other end of theinformation flow from DNA sequence to gene function, metabolites, as productsfrom the encoded proteins, stand closest to the eventual phenotype. It isconceivable that genetically controlled variation in metabolite composition andaccumulation determines, at least partly, the observed phenotypic variation. Inchapter three and four high throughput ‘omic’ technologies were used for theanalysis of natural variation in gene expression (transcriptomics) and metabolitecomposition and content (metabolomics).
Analogous to ‘classical’ quantitative phenotypic traits, natural variationcan also be observed for gene expression, when that expression is under geneticcontrol (Borevitz et al., 2003; Kliebenstein et al., 2006). Chapter three describes thegenetic analysis of genome wide gene expression variation in Arabidopsis(genetical genomics) (Jansen and Nap, 2001). These analyses revealed extensivegenetic control of gene expression, judged from the fact that for more than 4,000genes expression QTLs (eQTLs) could be detected. However, many more genesshowed high heritability values, even though no eQTL could be detected. This
Chapter 6
136
suggests that their expression is regulated by multiple eQTLs, of which manymight not have passed the stringent significance threshold due to their small effect.Both local and distant regulation (Rockman and Kruglyak, 2006) was observedalthough local regulation was often much stronger. Local regulation might be aresult from polymorphisms in cis regulatory elements which directly affects theexpression of the gene under study. Interestingly, local regulation correlated withpolymorphism frequency, further supporting the suggestion that expressionvariation can be a result from local sequence differences. Moreover, regulatorygenes showed much less local regulation, which can be explained by muchstronger conservation due to their pleiotropic effects.
Distant regulation on the other hand, is most likely a result frompolymorphisms in a regulator, affecting expression in trans, possibly throughmultiple intermediates. Since regulators may exert pleiotropic effects on numerousgenes, directly or indirectly, multiple eQTLs would map to the position of thisregulator. Indeed several eQTL hot spots were identified, possibly containing suchmaster regulators. The detection of distant eQTLs indicates that the expression ofthe gene under study is controlled by genetic factors in trans. When the causal geneunderpinning the trans eQTL can be identified this allows the possibility ofestablishing gene regulation networks (Jansen, 2003). However, QTL supportintervals often contain hundreds of genes, each of which can be a candidateregulator. Positive confirmation of a candidate can only be obtained upon cloningof the eQTL, which is practically difficult to achieve for genome wide expressionstudies. The assignment of candidate genes therefore relies on additionalinformation, such as co expression and gene ontology. The power of such acomputational approach was demonstrated by the reconstruction of a regulatorynetwork for genes involved in the regulation of flowering time. Nonetheless,variation in expression of genes can not always be explained by expressiondifferences of their regulator, especially when expression of the regulator is not cisregulated. When the causal polymorphism(s) reside(s) in the coding sequence ofthe regulator this might alter protein function or stability and the expression oftarget genes then depends on the allelic form of the regulator rather than on itsexpression level. The identification of such relationships from additionalinformation such as genome sequences, e.g. binding site data, andexperimentation, e.g. protein DNA interaction data, can further improve theassignment of candidate regulators and ultimately the construction of regulatorynetworks. The recognition of genetically controlled expression of genes and thereduction in the number of candidate regulators through QTL analysis shouldtherefore further guide the detailed analysis of gene by gene regulation.
General discussion
137
Unlike microarrays for the genome wide analysis of the transcriptome, nosingle platform exists for the simultaneous analysis of the complete metabolome.In contrast to mRNA, which has an identical chemical structure for all genes,metabolites represent a plethora of different chemical classes and no universalanalytical tools are available yet. However, advances in mass spectrometry havemade the detection and quantification of hundreds of compounds of specificchemical classes possible (Fiehn et al., 2000). Plants are especially rich in thenumber of secondary metabolites, which is possibly a consequence of their sessilenature. Since plants are unable to migrate they need to adapt to local environmentsfor their survival. The wide range of habitats makes it amenable that naturalvariation in secondary metabolite composition and accumulation plays animportant role in the diversification of plants (Fiehn, 2002).
Chapter four describes the genetic analysis of metabolite composition inArabidopsis using large scale untargeted liquid chromatography time of flightmass spectrometry (LC QTOF MS). Although untargeted, LC MS predominantlydetects semi polar secondary metabolites, which are amongst the most variablecompounds in nature. When applied to accessions originating from various partsof the global distribution range of A. thaliana, considerable quantitative andqualitative differences were observed. The majority of compounds could only bedetected in a limited number of accessions and each accession analyzed containedunique compounds not found in any other accession. However, a substantialnumber of compounds, presumably representing essential metabolites, could bedetected in all accessions analyzed. The extensive natural variation in metabolitecontent together with the often observed high heritabilities indicates thatmetabolite composition is largely under genetic control. Indeed, whenquantification in a RIL population was subjected to QTL analysis, for 75% of thedetected compounds significant QTL(s) could be assigned. The impact of geneticfactors on the dynamic range of metabolite content was further demonstrated bythe fact that a high number of compounds which were not found in either one ofthe parents could be detected in RILs. This suggests that metabolic pathways in theparents are blocked at different steps which can be overcome by complementationdue to recombination of their genomes. Natural variation therefore offers a largepotential for metabolic engineering of crop species through classical breeding.
Similar to the distribution of eQTLs along the genome, hot and cold spotscould be observed for metabolite accumulation QTLs. Interestingly, for bothanalyses a hotspot was observed at the position of the ERECTA gene, a receptorprotein kinase well known for its pleiotropic effects (Torii et al., 1996). The ERECTAgene is polymorphic for the parental accessions of the RIL population and causalfor many of the morphological differences observed between the parents. Co

Chapter 6
138
location of QTLs implies that accumulation of the metabolites mapping to the sameposition might be controlled by a common regulator. Although no information canbe inferred whether this control acts directly or indirectly through downstreameffects of a regulatory step, co regulated metabolites are likely to be part of acommon pathway or involved in the same biological process. When thosemetabolites can be identified, information can be obtained about the mechanism ofregulation, and the number and order of metabolites in a metabolic pathway.These features were demonstrated by the reconstruction of the aliphaticglucosinolate formation pathway and the discovery of variation in glycosyltransferase activity affecting flavonol composition. However, untargetedmetabolomic approaches detect anonymous compounds and the identification ofthese compounds is still in its infancy (Schauer et al., 2005; Moco et al., 2006). Theunraveling of metabolic pathways would therefore benefit much from thedevelopment of mass identification libraries.
The large scale genetic analyses of gene expression and metabolite contentclearly have shown their usefulness in constructing genetic regulatory networks.Yet, none of these approaches can fully explain the complex regulation ofphenotypic quantitative traits. Moreover, interactions and cross talk betweencomponents of the various regulatory levels are probably eminent and it is notalways possible to distinguish cause and consequence of natural variation withoutfurther experimentation. However most of the tools, including the genomesequence, are now available to study biological systems as a genetic system in itsentirety. The integration of data collected from multiparallel analyses of thevarious interconnected transducers of biological information flow will thereforethrive our understanding of complex biological systems.
Chapter five describes the integrative analysis of genetic variation inenzyme activities of primary carbohydrate metabolism. Carbohydrates areessential for many biological processes ranging from growth to energy metabolismand plants contain a multitude of enzymes for the allocation and conversion of thenecessary compounds. Perturbations affecting the functionality of these enzymescan therefore have large effects on plant growth. The activity of 15 enzymesinvolved in carbohydrate metabolism were analyzed in the Landsberg erecta xCape Verde Islands RIL population and subjected to QTL analyses. In addition, theexpression of the structural genes encoding those enzymes and a number ofcarbohydrate metabolites, as substrate and products of the enzymes, wereanalyzed in parallel.
The natural variation observed for a large number of enzymes andmetabolites could partly be explained by detected QTLs. Moreover, both positiveand negative correlations were observed between enzyme activities and metabolite
General discussion
139
contents, although only few co locating QTLs were detected. These findingssuggested that genetic control of primary carbohydrate metabolism acts atdifferent levels: a direct independent regulation of individual components and amore general simultaneous regulation of all components. Principal componentanalyses further suggested that such simultaneous regulation of carbohydratemetabolism might be under developmental control.
The parallel analysis of structural gene expression and enzyme activityalso revealed distinct modes of regulation. From the position of structural genes,their eQTLs and enzyme activity QTLs, together with correlation analyses of geneexpression and enzyme activity levels the involvement of structural gene variationcould be evaluated. In a number of cases cis regulated expression variation ofstructural genes was suggested to be causal for observed variation in enzymeactivity. However, trans regulated expression variation was also observed andmight have contributed to the observed variation in activity for some enzymes.Furthermore the lack of expression variation in some instances indicated alteredprotein function to affect specific activity of enzymes. Finally, the detection ofenzyme activity QTLs not co locating with structural genes encoding the enzymeunder study suggests other regulatory mechanisms, independent of structuralgenes, to be active (e.g. post translational control). The different regulatorymechanisms, including the role of metabolites, were demonstrated by the detailedanalysis of phosphoglucomutase and UDP glucose pyrophosphorylase activity,their structural genes and their respective substrates and products.
The work described in this thesis has shown the extensive variation inquantitative traits in Arabidopsis including variation in gene expression andmetabolite content. The use of natural variation in combination with geneticapproaches such as QTL analyses has further shown the power in elucidating theoften complex genetic regulation of traits. Moreover, the application of highthroughput ‘omic’ technologies enabled the construction of regulatory networkswhich were unlikely to be uncovered from targeted small scale approaches.However QTL analyses are limited by the amount of natural variation segregatingin the mapping population and the genetic make up of the employed RILpopulation only consists of two genotypes. The analysis of traits in multiplepopulations, generated from different accessions, is likely to reveal additionalregulatory steps. Alternatively, multiple distinct accessions could be intercrossedin a single mapping population, thereby increasing the amount of segregatingnatural variation. The ultimate mapping population however, consists of theworldwide collection of accessions and the recent advances in linkagedisequilibrium mapping have only just begun to make the exploration of thiscomprehensive reservoir of natural variation possible (Nordborg et al., 2002).

Chapter 6
140
Another impediment obstructing the comprehensive elucidation of geneticregulation is the often observed spatial and temporal control of quantitative traits.Due to cost and time considerations analyses are often limited in the number ofdevelopmental stages and tissues that can be sampled. However, to get a fullunderstanding of the complex regulatory mechanisms of traits it is recommendableto analyze traits in multiple developmental stages and tissues. Likewise, for manytraits genetic interactions with the environment are observed and analyzing traitsin different circumstances might therefore reveal specific regulatory steps.
Although powerful in mapping genomic regions, the resolution of QTLanalysis is often not high enough to identify the causal gene (QTG), and ultimatelythe causal changes at the nucleotide level (QTN), affecting the trait of interest. Dueto the often small effects of QTLs and the complex regulation of traits, it is notalways easy to obtain definitive proof for the identification of a QTG or QTN.Initial QTL mapping is usually followed by confirmation in NILs, which can alsobe used for fine mapping. Once a select set of candidate genes has been defined,several lines of experimentation can be followed to provide evidence for theidentification of a QTG or QTN. Such lines include natural variation surveyswithin and between species, comparative sequence analyses, gene expressionanalyses, functional (in vitro) gene analyses, knockout or mutational analyses, and(transgenic) complementation tests (Borevitz and Nordborg, 2003; Weigel andNordborg, 2005). Although some of these analyses will provide stronger evidencethan others, usually several tests are needed to demonstrate a causal link betweenallelic variation and a particular phenotype.
Finally, here Arabidopsis was chosen as a model plant for the geneticanalyses of quantitative variation. The availability of the complete genomesequence, commercially available genome wide microarrays and the publiclyavailable high quality mapping populations together with the numerous tools andtechniques developed for this species make Arabidopsis the perfect choice for thesekinds of analyses (Alonso and Ecker, 2006). However, due to the developments insequence technologies and comparative genomics many of the findings inArabidopsis can be readily ‘translated’ to other species (Gale and Devos, 1998; Hallet al., 2002). Moreover, the rapid progress in genomic technologies and theincreasing number of mapping populations for other (crop) species should nolonger restrict the analyses described in this thesis to model species. Many of thetools and techniques developed in Arabidopsis can readily be applied to otherspecies and now the time has come that applied sciences will benefit from thegroundbreaking work in model species such as Arabidopsis thaliana.

General discussion
141
REFERENCES
Alonso, J.M. and Ecker, J.R. (2006). Moving forward in reverse: genetic technologies to enable genomewide phenomic screens in Arabidopsis. Nat Rev Genet 7, 524 536.
Alonso Blanco, C., Peeters, A.J., Koornneef, M., Lister, C., Dean, C., van den Bosch, N., Pot, J. andKuiper, M.T. (1998). Development of an AFLP based linkage map of Ler, Col and CviArabidopsis thaliana ecotypes and construction of a Ler/Cvi recombinant inbred linepopulation. Plant J 14, 259 271.
Alonso Blanco, C. and Koornneef, M. (2000). Naturally occurring variation in Arabidopsis: anunderexploited resource for plant genetics. Trends Plant Sci 5, 22 29.
Borevitz, J.O., Liang, D., Plouffe, D., Chang, H.S., Zhu, T., Weigel, D., Berry, C.C., Winzeler, E. andChory, J. (2003). Large scale identification of single feature polymorphisms in complexgenomes. Genome Res 13, 513 523.
Borevitz, J.O. and Nordborg, M. (2003). The impact of genomics on the study of natural variation inArabidopsis. Plant Physiol 132, 718 725.
Broman, K.W. (2001). Review of statistical methods for QTL mapping in experimental crosses. Lab Anim(NY) 30, 44 52.
Doerge, R.W. (2002). Mapping and analysis of quantitative trait loci in experimental populations. NatRev Genet 3, 43 52.
Eshed, Y. and Zamir, D. (1995). An introgression line population of Lycopersicon pennellii in thecultivated tomato enables the identification and fine mapping of yield associated QTL.Genetics 141, 1147 1162.
Fiehn, O., Kopka, J., Dormann, P., Altmann, T., Trethewey, R.N. and Willmitzer, L. (2000). Metaboliteprofiling for plant functional genomics. Nat Biotechnol 18, 1157 1161.
Fiehn, O., Kloska, S. and Altmann, T. (2001). Integrated studies on plant biology using multiparalleltechniques. Curr Opin Biotechnol 12, 82 86.
Fiehn, O. (2002). Metabolomics the link between genotypes and phenotypes. Plant Mol Biol 48, 155 171.Gale, M.D. and Devos, K.M. (1998). Plant comparative genetics after 10 years. Science 282, 656 659.Hall, A.E., Fiebig, A. and Preuss, D. (2002). Beyond the Arabidopsis genome: opportunities for
comparative genomics. Plant Physiol 129, 1439 1447.Jansen, R.C. and Nap, J.P. (2001). Genetical genomics: the added value from segregation. Trends Genet
17, 388 391.Jansen, R.C. (2003). Studying complex biological systems using multifactorial perturbation. Nat Rev
Genet 4, 145 151.Kliebenstein, D.J., West, M.A., van Leeuwen, H., Kim, K., Doerge, R.W., Michelmore, R.W. and St
Clair, D.A. (2006). Genomic survey of gene expression diversity in Arabidopsis thaliana.Genetics 172, 1179 1189.
Koornneef, M. and Stam, P. (2001). Changing paradigms in plant breeding. Plant Physiol 125, 156 159.Koornneef, M., Alonso Blanco, C. and Vreugdenhil, D. (2004). Naturally occurring genetic variation in
Arabidopsis Thaliana. Annu Rev Plant Physiol Plant Mol Biol 55, 141 172.Mitchell Olds, T. and Schmitt, J. (2006). Genetic mechanisms and evolutionary significance of natural
variation in Arabidopsis. Nature 441, 947 952.Moco, S., Bino, R.J., Vorst, O., Verhoeven, H.A., de Groot, J., van Beek, T.A., Vervoort, J. and de Vos,
C.H. (2006). A liquid chromatography mass spectrometry based metabolome database fortomato. Plant Physiol 141, 1205 1218.
Nordborg, M., Borevitz, J.O., Bergelson, J., Berry, C.C., Chory, J., Hagenblad, J., Kreitman, M.,Maloof, J.N., Noyes, T., Oefner, P.J. et al. (2002). The extent of linkage disequilibrium inArabidopsis thaliana. Nat Genet 30, 190 193.

Chapter 6
142
Rockman, M.V. and Kruglyak, L. (2006). Genetics of global gene expression. Nat Rev Genet 7, 862 872.Schauer, N., Steinhauser, D., Strelkov, S., Schomburg, D., Allison, G., Moritz, T., Lundgren, K.,
Roessner Tunali, U., Forbes, M.G., Willmitzer, L. et al. (2005). GC MS libraries for the rapididentification of metabolites in complex biological samples. FEBS Lett 579, 1332 1337.
Somerville, C. and Koornneef, M. (2002). Timeline: A fortunate choice: the history of Arabidopsis as amodel plant. Nat Rev Genet 3, 883 889.
Torii, K.U., Mitsukawa, N., Oosumi, T., Matsuura, Y., Yokoyama, R., Whittier, R.F. and Komeda, Y.(1996). The Arabidopsis ERECTA gene encodes a putative receptor protein kinase withextracellular leucine rich repeats. Plant Cell 8, 735 746.
Weigel, D. and Nordborg, M. (2005). Natural variation in Arabidopsis. How do we find the causalgenes? Plant Physiol 138, 567 568.
Winnacker, E.L. (2003). Interdisciplinary sciences in the 21st century. Curr Opin Biotechnol 14, 328 331.Zamir, D. (2001). Improving plant breeding with exotic genetic libraries. Nat Rev Genet 2, 983 989.
143
Summary
Plants show considerable genetic differences between accessions of the samespecies, which are reflected in phenotypic variation. This natural variation is oftendisplayed as a continuous distribution of trait values and is therefore calledquantitative variation. Quantitative variation is the result of the interplay ofmultiple genes and environmental factors. Because the contribution of each gene tothe eventual phenotype can be quite small, sophisticated statistical methods areneeded to associate genomic regions with the trait of interest. Such an approach isknown as quantitative trait locus (QTL) analysis. In QTL analysis, the trait ofinterest is quantified in a genotyped mapping population, derived from a crossbetween distinct genotypes.
Arabidopsis thaliana is the leading model species in modern plant sciences.Its short generation time, small and fully sequenced genome, and wide globaldistribution range make Arabidopsis especially suited for the analysis ofquantitative traits. Because of its natural self pollination, recombinant inbred lines(RILs) have become the mapping population of choice in Arabidopsis. However, inother species near isogenic lines (NILs) are favorable due to intolerance towardinbreeding and fertility issues. NILs are also useful for the confirmation and finemapping of QTLs identified in RIL populations. Chapter two describes thedevelopment of a genome wide coverage NIL population from a cross between thedistinct accessions Landsberg erecta (Ler) and Cape Verde Islands (Cvi), for which aRIL population was developed previously. The genetic make up of these two typesof populations differs in the number of introgressions that segregate in thepopulation. RILs contain multiple introgressions, whereas NILs preferably containonly a single introgression per line. As a consequence, in contrast to NILpopulations, epistatic interactions between loci can be detected in RIL populations.Furthermore, owing to the higher recombination frequency, fewer replications perline need to be analyzed in RIL populations. However, the simultaneoussegregation of multiple QTLs diminishes the power to detect small effect QTLs inRIL populations compared to NIL populations.
The segregation of phenotypic variation can be observed for numeroustraits, including quantitative ones, in populations derived from crosses betweenArabidopis accessions. However, quantitative traits are often the resultant of manyintermediary steps from genotype to phenotype. To fully understand the complexregulatory circuitry of quantitative traits it is therefore recommendable to analyzegenetic regulation at different levels of the biological information flow. The recentadvances in ‘omic’ technologies now make the large scale analysis of gene

Summary
144
expression (transcriptomics), protein content (proteomics), and metabolite content(metabolomics) feasible.
The expression of genes often determines the onset of biological pathwaysand it is conceivable that variation in expression levels is reflected in phenotypicvariation. The genetic analysis of genome wide gene expression variation in the Lerx Cvi RIL population in chapter three revealed high heritabilities for many genes,indicating that their expression is under genetic control. Indeed for a substantialnumber of genes expression QTLs (eQTLs) could be detected. In depth analysisuncovered both cis regulated expression, resulting from polymorphisms in thegene itself, and trans regulated expression, resulting from genetic differences indistant regulators. Identifying trans regulators offers the possibility to determinegene to gene regulation and ultimately the construction of regulatory networks.For a number of genomic regions, unexpectedly high numbers of trans eQTLs weredetected. Such hot spots are possibly caused by pleiotropic effects of regulators(e.g. transcription factors). When multiple genes, involved in the same biologicalprocess, map to the same position this indicates that many of them might beregulated by the same gene. This information was successfully used todemonstrate the construction of a regulatory network for flowering time.
On the other end of the information chain, metabolites stand closest tophysiological phenotypes. It is therefore likely that genetic variation, leading tophysiological differences, is also causal for differences in metabolite content. Theuntargeted metabolic analyses described in chapter four uncovered extensivenatural variation in metabolite composition in 14 different accessions ofArabidopsis. QTL analysis of more than 2,000 high quality mass peaks, detected inthe Ler x Cvi RIL population, enabled the identification of QTLs for about 75% ofthe mass signals. The finding that more than one third of the mass signals, detectedin the RILs, were not detected in either parent suggests that many metabolites areformed due to the recombination of the parental genomes. The identification ofanonymous mass peaks, that appear to be co regulated as based on the positions ofQTLs, enabled the (re)construction of metabolic pathways and uncovered novelbiosynthetic steps and compounds in Arabidopsis. These results indicate the largepotential for modification of metabolic composition through classical breeding.
Although each of the different entities in the path from genotype tophenotype can be effectively analyzed, a thorough understanding of theinteraction between these different levels can only be obtained from the integratedstudy of multi parallel analyses. In chapter five, the complex regulation of primarycarbohydrate metabolism was analyzed in a case study. The activities of 15enzymes involved in carbohydrate metabolism, in parallel with the expression oftheir structural genes, and contents of their metabolic substrates and products,

Summary
145
were genetically analyzed in the Ler x Cvi RIL population. For many enzymesQTLs explaining variation observed in their activity were detected. A number ofthese QTLs co located with the position of structural genes, indicating that naturalvariation in structural genes can be causal for variation in enzyme activity. Fromthe expression analyses of these structural genes it was concluded that bothexpression variation and variation in protein function determine the differences inobserved enzyme activity. However, not all enzyme activity QTLs co located withstructural genes, suggesting that regulation occurs at multiple levels. To furthercomplicate the regulation of carbohydrate metabolism, significant correlationsbetween enzyme activities and metabolite contents were observed, although thiswas not always accompanied by co locating QTLs. Further analysis suggested arelationship between the regulation of carbohydrate metabolism and plantdevelopment.
The results of this thesis demonstrate the power of combining geneticapproaches with large scale high throughput technologies for the construction ofgenetic regulatory networks and metabolic pathways. The integration of multiparallel analyses will further enhance our understanding of the complex circuitryof genetic regulation of quantitative traits.

146

147
Samenvatting
Genetische verschillen tussen accessies van planten openbaren zich vaak alsfenotypische variatie. Deze natuurlijke variatie vertoont in veel gevallen eencontinue verdeling en wordt daarom ook wel kwantitatieve variatie genoemd.Kwantitatieve variatie is het gevolg van het samenspel van meerdere genen en deinvloed van omgevingsfactoren. Omdat de bijdrage van ieder gen aan hetuiteindelijke fenotype erg klein kan zijn, zijn geavanceerde statistische methodesnodig om een associatie van genomische regio’s met een bepaalde eigenschap aante tonen. Een dergelijke aanpak staat bekend als quantitative trait locus (QTL)analyse. In QTL analyses wordt de gewenste eigenschap gekwantificeerd in eengenetische kartering populatie, welke verkregen is door een kruising vanverschillende genotypes.
Arabidopsis thaliana (Zandraket) is de meest gebruikte modelplant inmoderne plantwetenschappen. Door de combinatie van een korte levenscyclus, eenklein en volledig opgehelderd genoom en een wijde verspreiding over de wereld isArabidopsis bij uitstek geschikt voor de genetische analyse van kwantitatieveeigenschappen. Omdat het een zelfbevruchter is, zijn recombinante inteelt lijnen(Recombinant Inbred Lines; RILs) het meest gangbaar als genetische karteringpopulatie in Arabidopsis. In andere soorten zijn bijna isogene lijnen (Near IsogenicLines; NILs) echter beter bruikbaar door inteelt en vruchtbaarheidsproblemen inRILs. NILs zijn ook erg nuttig voor het bevestigen en de precieze positionering vanQTLs die in RIL populaties gevonden zijn. Hoofdstuk twee beschrijft deontwikkeling van een volledig genoomdekkende NIL populatie verkregen uit eenkruising tussen de verschillende accessies Landsberg erecta (Ler) en Cape VerdeIslands (Cvi). Uit deze kruising was eerder al een RIL populatie ontwikkeld. Degenetische opmaak van deze twee types populatie verschilt in het aantalintrogressies. RILs bevatten meerdere introgressies terwijl NILs bij voorkeurslechts een enkele introgressie per lijn bevatten. Hierdoor kunnen in RILpopulaties, in tegenstelling tot NIL populaties, epistatische interacties aangetoondworden. Bovendien kunnen er minder herhalingen per lijn geanalyseerd worden inRIL populaties omdat de recombinatiefrequentie hoger is dan in NIL populaties.Echter, de kans op het detecteren van QTLs met een klein effect is kleiner in RILpopulaties, vergeleken met NIL populaties, omdat meerdere QTLs tegelijkertijduitsplitsen.
Voor vele eigenschappen, inclusief kwantitatieve, kan uitsplitsing vanfenotypische variatie worden waargenomen in populaties verkregen uit kruisingenmet verschillende Arabidopsis accessies. Kwantitatieve eigenschappen zijn echter

Samenvatting
148
vaak het gevolg van vele tussenliggende stappen op het traject van genotype naarfenotype. Om een volledig beeld te krijgen van de complexe reguleringscircuitsvan kwantitatieve eigenschappen is het daarom aan te bevelen om de genetischeregulatie op verschillende niveaus van de biologische informatiestroom teanalyseren. De recente voortgang in zogenaamde ‘omic’ technologieën maakt hetmomenteel mogelijk om de expressie van genen (transcription; transcriptomics) ende aanwezigheid van eiwitten (proteins; proteomics) en inhoudstoffen(metabolites; metabolomics) op grote schaal te analyseren.
De expressie van genen bepaalt vaak het begin van biologische routes enhet is aannemelijk dat variatie in expressie niveaus zijn weerslag heeft opfenotypische variatie. De genetische analyse van genexpressie variatie van hetcomplete genoom in de Ler x Cvi RIL populatie in hoofdstuk drie toonde aan datvoor vele genen de gevonden variatie erfelijk is. Dit wijst er op dat de expressievan deze genen genetisch gereguleerd is. Voor een groot aantal genen werdeninderdaad expressie QTLs (eQTLs) gevonden. Gedetailleerde analyses toondenzowel cis gereguleerde expressie, als gevolg van polymorfismen in het gen zelf, alsook trans gereguleerde expressie, als gevolg van genetische verschillen inregulatoren elders op het genoom, aan. De identificatie van trans regulatoren biedtde mogelijkheid om gen tot gen regulatie aan te tonen en uiteindelijk omregulatienetwerken te construeren. Voor een aantal genomische regio’s werdenonverwacht hoge aantallen trans eQTLs gevonden. Deze hot spots wordenmogelijk veroorzaakt door pleiotrope effecten van regulatoren (b.v. transcriptiefactoren). Als voor meerdere genen, die ieder bij hetzelfde biologische procesbetrokken zijn, op dezelfde positie een eQTL gevonden wordt dan wijst dit er opdat vele wellicht door hetzelfde gen gereguleerd worden. Deze informatie werdsuccesvol aangewend om de constructie van een regulatie netwerk voor bloeitijd tedemonstreren.
Aan het andere eind van de informatieketen staan metabolieten het dichtstbij het uiteindelijke fysiologische fenotype. Het is daarom waarschijnlijk datgenetische variatie, leidend tot fysiologische verschillen, ook de oorzaak is vanverschillen in metaboliet niveaus. De ongerichte metaboliet analyses zoalsbeschreven in hoofdstuk vier toonden de uitgebreide natuurlijke variatie inmetaboliet samenstelling in 14 verschillende accessies van Arabidopsis aan. QTLanalyses van meer dan 2.000 kwalitatief betrouwbare massapieken, gedetecteerd inde Ler x Cvi RIL populatie, resulteerde in de identificatie van QTLs voor ongeveer75% van de massapieken. Meer dan een derde van de massapieken die in de RILskonden worden gedetecteerd werden in geen van de ouders aangetroffen. Ditsuggereert dat vele metabolieten werden gevormd door de recombinatie van degenomen van de ouders. De identificatie van massapieken, die op basis van QTL

Samenvatting
149
posities identiek gereguleerd lijken te zijn, maakte het mogelijk om metaboleroutes te (re)construeren en om nieuwe biosynthetische stappen en metabolieten inArabidopsis aan te tonen. Deze resultaten geven de hoge potentie voor hetmodificeren van metaboliet samenstelling door klassieke veredeling weer.
Hoewel ieder van de verschillende stappen in het traject van genotype naarfenotype effectief geanalyseerd kan worden, kan een volledig begrip van deinteractie tussen verschillende niveaus alleen verkregen worden doorgeïntegreerde studies van multi parallelle analyses. In hoofdstuk vijf werd decomplexe regulatie van het primaire koolhydraatmetabolisme geanalyseerd in eenmodelstudie. De activiteiten van 15 enzymen die allen een rol spelen in ditmetabolisme werden parallel met de expressie van hun structurele genen enaccumulatie van hun metabole substraten en producten genetisch geanalyseerd inde Ler x Cvi RIL populatie. Voor veel enzymen konden QTLs worden gevondendie de variatie in activiteit verklaarden. Een deel van deze QTLs werd gevondenop posities van structurele genen. Dit wijst er op dat natuurlijke variatie instructurele genen de oorzaak kan zijn van de variatie in enzymactiviteit. Naexpressieanalyses van deze structurele genen kon geconcludeerd worden datzowel expressievariatie als variatie in enzymfunctie de verschillen inenzymactiviteit bepalen. Niet alle enzymactiviteit QTLs werden echter op positiesvan structurele genen gevonden, wat suggereert dat regulatie op meerdere niveausplaats vindt. De complexe regulatie van het hydraatmetabolisme werd verdergeïllustreerd door de significante correlaties tussen enzymactiviteiten enmetaboliet accumulaties zonder dat er sprake was van QTLs op identieke posities.Statistische analyses suggereerden een relatie tussen koolhydraatmetabolisme enplantontwikkeling als een mogelijke oorzaak van correlaties.
De resultaten van dit proefschrift tonen de kracht aan van het combinerenvan genetische analyses met grootschalige ‘omics` technologieën om genetischeregulatienetwerken en metabole routes te construeren. De integratie van multiparallelle analyses zal ons begrip van de complexe circuits van genetische regulatievan kwantitatieve eigenschappen verder vergroten.

150

151
Publications
Publications from this thesis
Keurentjes, J.J.B., J. Fu, I.R. Terpstra, J.M. Garcia, G. van den Ackerveken, L.B. Snoek, A.J.M. Peeters, D.Vreugdenhil, M. Koornneef and R.C. Jansen. Regulatory network construction in Arabidopsis usinggenome wide gene expression QTLs. Proc Natl Acad Sci U S A. 104: 1708 13. 2007.
Keurentjes, J.J.B., L. Bentsink, C. Alonso Blanco, C.J. Hanhart, H. Blankestijn De Vries, S. Effgen, D.Vreugdenhil and M. Koornneef. Development of a Near Isogenic Line population of Arabidopsisthaliana and comparison of mapping power with a Recombinant Inbred Line population. Genetics. 175:891 905. 2007.
Keurentjes, J.J.B., J. Fu, C.H. de Vos, A. Lommen, R.D. Hall, R.J. Bino, L.H.W. van der Plas, R.C. Jansen,D. Vreugdenhil and M. Koornneef. The genetics of plant metabolism. Nat Genet. 38: 842 9. 2006.
Fu, J., M.A. Swertz, J.J.B. Keurentjes and R.C. Jansen. MetaNetwork: a computational protocol for thegenetic study of metabolic networks. Nat protoc. 2: 685 94. 2007.
De Vos, C.H., S. Moco, A. Lommen, J.J.B. Keurentjes, R.J. Bino and R.D. Hall. Untargeted large scaleplant metabolomics using liquid chromatography coupled to mass spectrometry. Nat protoc. 2: 778 91.2007.
Keurentjes, J.J.B., M. Koornneef and D. Vreugdenhil. Genome studies and molecular genetics. Inpreparation for Curr Opin Plant Biol.
Keurentjes, J.J.B., R. Sulpice, Y. Gibon, J. Fu, M. Koornneef, M. Stitt and D. Vreugdenhil. Integrativeanalyses of genetic variation in enzyme activities of primary carbohydrate metabolism reveal distinctmodes of regulation in Arabidopsis thaliana. In preparation for Genome Biol.
Fu J., M. Dijkstra, J.J.B. Keurentjes, M. Koornneef, R. Breitling and R.C. Jansen. Systems biologythrough system genetics. In preparation.
Publications related to this thesis
Sergeeva, L.I., J.J.B. Keurentjes, L. Bentsink, J. Vonk, L.H.W. van der Plas, M. Koornneef and D.Vreugdenhil. Vacuolar invertase regulates elongation of Arabidopsis thaliana roots as revealed by QTLand mutant analysis. Proc Natl Acad Sci U S A. 103: 2994 9. 2006.
Teng, S., J.J.B. Keurentjes, L. Bentsink, M. Koornneef and S. Smeekens. Sucrose specific induction ofanthocyanin biosynthesis in Arabidopsis requires the MYB75/PAP1 gene. Plant Physiol. 139: 1840 52.2005.

152
Juenger, T.E., J.K. mcKay, N. Hausmann, J.J.B. Keurentjes, S. Sen, K.A. Stowe, T.E. Dawson, E.L. Simmsand J.H. Richards. Identification and characterization of QTL underlying whole plant physiology inArabidopsis thaliana: 13C, stomatal conductance and transpiration efficiency. Plant Cell Env. 28: 697702. 2005.
Sergeeva, L.I, J. Vonk, J.J.B. Keurentjes, L.H.W. van der Plas, M. Koornneef and D. Vreugdenhil.Histochemical analysis reveals organ specific quantitative trait loci for enzyme activities in Arabidopsis.Plant Physiol. 134: 237 45. 2004.
Sicard O., O. Loudet, J.J.B. Keurentjes, T. Candresse, O. Le Gall, F. Revers and V. Decroocq.Identification of QTLs controlling symptom development during viral infection in Arabidopsis thaliana.Submitted to Plant Physiol.
Tessadori F., M. van Zanten, P. Pavlova, B.L. Snoek, F.F. Millenaar, R.K. Schulkes, J.J.B. Keurentjes, R.van Driel, L.A.C.J. Voesenek, P. Fransz and A.J.M. Peeters. Natural variation in heterochromatin contentamong Arabidopsis accessions is controlled by light intensity. In preparation for Plant cell.
Other publications
Léon Kloosterziel, K.M., B.W.M. Verhagen, J.J.B. Keurentjes, J.A. Van Pelt, M. Rep, L.C. Van Loon andC.M.J. Pieterse. Colonization of the Arabidopsis rhizosphere by fluorescent Pseudomonas spp. activatesa root specific, ethylene responsive PR 5 gene in the vascular bundle. Plant Mol. Biol. 57: 731 48. 2005.
De Boer, M., P. Bom, F. Kindt, J.J.B. Keurentjes, I. Van der Sluis, L.C. Van Loon, and P.A.H.M. Bakker.Control of Fusarium wilt of radish by combining Pseudomonas putida strains that have differentdisease suppressive mechanisms. Phytopathology. 93: 626 32. 2003.
Léon Kloosterziel, K.M., B.W.M. Verhagen, J.J.B. Keurentjes, L.C. Van Loon and C.M.J. Pieterse.Identification of genes involved in rhizobacteria mediated induced systemic resistance in Arabidopsis.In: Induced Resistance in Plants Against Insects and Diseases (A. Schmitt and B. Mauch Mani, eds),IOBC/wprs Bulletin. 25: 71 4. 2002.
Pieterse, C.M.J., J.A. van Pelt, S.C.M. van Wees, J. Ton, K.M. Léon Kloosterziel, J.J.B. Keurentjes,B.W.M. Verhagen, M. Knoester, I. Van der Sluis, P.A.H.M. Bakker and L.C. van Loon. Rhizobacteriamediated induced systemic resistance: triggering, signalling, and expression. Eur. J. Plant Pathol. 107:51 61. 2001.
De Boer, M., I. van der Sluis, J.J.B. Keurentjes, L.C. van Loon and P.A.H.M. Bakker. Modes of action ofsuppression of fusarium wilt of radish by the combination of Pseudomonas putida RE8 and P.fluorescens RS111. In: Proceedings of the Fifth International Plant Growth Promoting RhizobacteriaWorkshop. Cordoba, Argentina. 2000.
De Boer, M., I. Van der Sluis, J.J.B. Keurentjes, L.C. van Loon and P.A.H.M. Bakker. Verbetering vanbiologische beheersing van Fusarium verwelkingsziekte in radijs door het gebruik van combinaties vanPseudomonas stammen. Gewasbescherming. 31: 56 7. 2000.

153
Pieterse, C.M.J., S.C.M. van Wees, J. Ton, K.M. Léon Kloosterziel, J.A. van Pelt, J.J.B. Keurentjes, M.Knoester and L.C. van Loon. Rhizobacteria mediated induced systemic resistance (ISR) in Arabidopsis:involvement of jasmonate and ethylene. In: Biology of Plant Microbe Interactions, Volume 2 (P.J.G.M.De Wit, T. Bisseling and W.J. Stiekema, eds), The International Society for Molecular Plant MicrobeInteractions, St. Paul, MN., 291 6, 1999.
De Boer, M., P. Bom, F. Kindt, I. Van der Sluis, J.J.B. Keurentjes, L.C. van Loon and P.A.H.M Bakker.Het gebruik van de combinatie van Pseudomonas putida stammen RE8 en WCS358 kan biologischebestrijding van Fusarium verwelkingsziekte in radijs verbeteren. Gewasbescherming. 30: 85 6. 1999.
Falque, M., J.J.B. Keurentjes, J.M.T. Bakx Schotman and P.J. van Dijk. Development andcharacterisation of microsatellite markers in the sexual apomictic complex Taraxacum officinale(dandelion). Theor. Appl. Genet. 97: 283 92. 1998.
Gorissen A., J.H. van Ginkel, J.J.B. Keurentjes and J.A. van Veen. Grass root decomposition is retardedwhen grass has been grown under elevated CO2. Soil Biol. Biochem. 27: 117 20. 1995.
Bonnier, F.J.M., J.J.B. Keurentjes and J.M. van Tuyl. Ion leakage as a criterion for viability of lily bulbscales after storage at 2°C for 0.5, 1.5 and 2.5 years. Hort Science. 29: 1332 4. 1994.
Honours, Awards and Fellowships
CBSG Special Achievement Award. 2005.
ZonMw, National Genomics Initiative. International research fellowship. 2006.

154

155
Curriculum vitae
Joost Keurentjes werd geboren op 25 december 1968 te Doetinchem. Na hetbehalen van het HAVO diploma aan het ISALA college te Silvolde in 1988voltooide hij het MLO te Arnhem in 1992. Aansluitend was hij twee jaar werkzaamals onderzoeksmedewerker aan het AB DLO alvorens in 1994 de studieplantenbiotechnologie aan de IAHL te Velp te beginnen. In 1997 werd deze studieafgerond en volgden er enkele dienstverbanden als onderzoeksmedewerker bij hetIPO DLO, de universiteit Utrecht (Fytopathologie) en als senior onderzoeker bijHercules b.v.. In 2002 begon hij aan het promotieonderzoek beschreven in ditproefschrift bij de leerstoelgroepen Erfelijkheidsleer en Plantenfysiologie aan deWageningen Universiteit. Met ingang van 1 mei 2007 is hij in dienst als post doconderzoeker bij voornoemde leerstoelgroepen.

156
Nawoord
Op het moment dat u dit leest hoop ik dat u ook de moeite heeft genomen, of nogzult nemen, om de voorgaande hoofdstukken door te nemen. De inhoud van ditproefschrift is namelijk met zorg en toewijding samengesteld en gelukkig nietalleen door mij. Het vermelden van een ieder die heeft bijgedragen aan detotstandkoming ervan zou slechts leiden tot een droge opsomming. Het staatechter buiten kijf dat dit boekje er heel anders uit had gezien zonder de hulp vanvelen. Hoewel de inbreng van de één misschien omvangrijker of zinvoller isgeweest dan van de ander wil ik toch geen onderscheid maken in waardering. Ikprijs mij gelukkig om deel uit te hebben mogen maken van een omvangrijknetwerk van specialisten van wier expertise ik dankbaar gebruik heb gemaakt. Ikheb geprobeerd de complexiteit van dit netwerk weer te geven in de figuur op devolgende pagina. Kenners zullen onmiddellijk opmerken dat het een topologischrobuust, modulair en schaalvrij hierarchisch netwerk is met een hoge graad vanconnectiviteit. In de praktijk staat dit synonym voor een kwalitatief hoogwaardigsamenwerkingsverband met korte lijnen tussen de deelnemers, het zogenaamde‘kleine wereld effect’ (iedereen kent wel iemand die iemand anders kent).
Toch wil ik er graag een aantal personen uitlichten die in de achterliggendejaren bijzonder veel voor mij betekend hebben. In de eerste plaats mijn promotorenMaarten en Linus en co promotor Dick. Deze synergistische drie eenheid heeft mijvrijwel probleemloos door mijn promotietraject geloodst. Een speciaal woord vandank ook aan mijn twee paranimfen. Jingyuan, zonder wier hulp en tomeloze inzeteen groot deel van dit proefschrift niet tot stand was gekomen. Judith, met wie, alsmede AIO en kamergenoot, ik meer dan vier jaar opgetrokken ben. We hebbenveel lief en leed gedeeld en gelukkig meer lief dan leed.
Rest mij nog te vermelden dat ik het allemaal met veel plezier volbrachtheb. Het in mij gestelde vertrouwen om er nog eens vier jaar aan vast te plakkenverheugt mij dan ook zeer.
Joost

157


Education Statement of the Graduate SchoolExperimental Plant Sciences
Issued to: Joost J. B. KeurentjesDate: 7 September 2007Group: Laboratories of Plant Physiology and Genetics,
Wageningen University
1) Start up phase dateFirst presentation of your projectUsing natural variation for dissecting pathways of plant performancetraits Apr 07, 2003Writing or rewriting a project proposalWriting a review or book chapterMSc coursesLaboratory use of isotopes
Subtotal Start up Phase 1.5 credits*2) Scientific Exposure date
EPS PhD student daysEPS PhD student day, Utrecht University Mar 27, 2003EPS PhD student day, Vrije Universiteit Amsterdam Jun 03, 2004EPS PhD student day, Radboud University Nijmegen Jun 02, 2005EPS PhD student day, Wageningen University Sep 19, 2006EPS theme symposiaEPS Theme 3 symposium Metabolism and Adaptation , Wageningenuniversity Mar 23, 2003EPS Theme 3 symposium Metabolism and Adaptation , Wageningenuniversity Oct 25, 2004EPS Theme 3 symposium Metabolism and Adaptation , Utrechtuniversity Nov 24, 2005NWO Lunteren days and other National PlatformsALW meeting Experimental Plant Sciences, Lunteren Apr 07 08, 2003ALW meeting Experimental Plant Sciences, Lunteren Apr 05 06, 2004ALW meeting Experimental Plant Sciences, Lunteren Apr 04 05, 2005ALW meeting Experimental Plant Sciences, Lunteren Apr 02 03, 2007Seminars (series), workshops and symposiaFrontiers in Plant Science, Wageningen university 2003Flying seminars, Wageningen university 2003 2007CBSG Cluster meeting Arabidopsis, Wageningen (3x) 2004 2005CBSG Summit, Wageningen (2x) 2005 & 200715th symposium ALW Discussion Group “Secondary Metabolism inPlant and Plant Cell”, Zeist May 20, 2005
16th symposium ALW Discussion Group “Secondary Metabolism inPlant and Plant Cell”, Leiden Oct 6, 2006Netherlands BioInformatics Centre Workshop Bioinformatics forMetabolomics, Wageningen Nov 29, 2006Seminar plusInternational symposia and congresses7th International Congress of Plant Molecular Biology (ISPMB),Barcelona, Spain Jun 23 28, 2003Keystone symposia, Biological discovery using diverse high throughputdata, Steamboat Springs, USA Mar 30 Apr 4, 200416th International Conference on Arabidopsis Research, Madison, USA Jun 15 19, 20054th Plant Genomics European Meetings, Amsterdam, The Netherlands Sep 20 23, 200515th Crucifer Genetics Workshop: Brassica 2006, Wageningen, TheNetherlands Sep 30–Oct 4, 20065th Plant Genomics European Meetings, Venice, Italy Oct 11 14, 200618th International Conference on Arabidopsis Research, Beijing, China Jun 20 23, 2007
Oral presentations7th International Congress of Plant Molecular Biology (ISPMB),Barcelona, Spain Jun 24, 2003Heidelberg Institute of Plant Science, Heidelberg University, Heidelberg,Germany Sep, 2003CBSG Cluster meeting Arabidopsis, Wageningen (3x) 2004 2005EPS Theme 3 symposiumMetabolism and Adaptation, Wageningenuniversity Oct 25, 2004Plant Research International, Bioscience, Plant Development Systems,Wageningen Nov, 2004Plant Research International, Bioscience, Metabolic Regulation,Wageningen Dec, 2004ALW meeting Experimental Plant Sciences, Lunteren Apr 5, 2005EPS/VLAG/CBSG Workshop Metabolomics, Wageningen University May 3, 200516th International Conference on Arabidopsis Research, Madison, USA Jun 17, 20054th Plant Genomics European Meetings, Amsterdam, The Netherlands Sep 23, 2005EPS Theme 3 symposiumMetabolism and Adaptation, Utrechtuniversity Nov 24, 2005Max Planck Institute of Molecular Plant Physiology, Golm, Germany May 5, 2006De Ruiter Seeds, Bergschenhoek Jul 25, 200615th Crucifer Genetics Workshop: Brassica 2006, Wageningen, TheNetherlands Oct 4, 200616th symposium ALW Discussion Group “Secondary Metabolism inPlant and Plant Cell”, Leiden Oct 6, 20065th Plant Genomics European Meetings, Venice, Italy Oct 14, 2006Netherlands BioInformatics Centre, Workshop Bioinformatics forMetabolomics, Wageningen Nov 29, 2006CBSG Summit, Wageningen Feb 6, 2007ALW meeting Experimental Plant Sciences, Lunteren Apr 2 3, 2007

Utrecht Genetic Seminar Series, Hubrecht laboratory, Utrecht Apr 12, 2007Institute of Vegetables and Flowers, Chinese Academy of AgriculturalSciences, Beijing, China Jun 20, 200718th International Conference on Arabidopsis Research, Beijing, China(2x) Jun 21, 2007PhD summerschool; Environmental signaling: Arabidopsis as a model,Utrecht University Aug 27, 2007
IAB interview May, 2005Excursions
Subtotal Scientific Exposure 37.2 credits*3) In Depth Studies date
EPS courses or other PhD coursesInternational Summerschool, The analysis of natural variation withincrop and model plants, Wageningen Apr 22 25, 2003EPS Summerschool, Functional Genomics: theory and hands on dataanalysis, Utrecht university Aug 25 28, 2003EPS/VLAG/CBSG Workshop Metabolomics, Wageningen University May 2 4, 2005ABIES/PE&RC/EPS/SdV Workshop Mathematics in Plant Biology, Paris,France Jun 30 Jul 1, 2005PhD summerschool; Environmental signaling: Arabidopsis as a model,Utrecht University Aug 27 29, 2007Journal clubmember of literature discussion group 2002 2003Individual research trainingNetherlands Genomics Initiative fellowship, MPI for Molecular PlantPhysiology, Golm Germany feb 1 may 5, 2006
Subtotal In Depth Studies 9.6 credits*
4) Personal development dateSkill training coursesOrganisation of PhD students day, course or conferenceWageningen International, Training programme on the conservation,management and use of plant genetic resources in agriculture;Biotechnology for genetic resources conservation and crop improvement May 9 Jul 1, 2005Membership of Board, Committee or PhD councilMember of PhD council 2003 2006
Subtotal Personal Development 2.9 credits*
TOTAL NUMBER OF CREDIT POINTS* 51.2
Herewith the Graduate School declares that the PhD candidate has complied with the educationalrequirements set by the Educational Committee of EPS which comprises a minimum total of 30 credits.
* A credit represents a normative study load of 28 hours of study

The research described in this thesis was performed in the project ‘QTL express:identification of plant performance traits in Arabidopsis by combining highthroughput mapping and expression profiling’, financially supported by a grantfrom the Netherlands Organization for Scientific Research, Program Genomics(050 10 029).
Printed by: Ponsen & Looijen BV, Wageningen, The Netherlands.