BMC Genetics
20
BioMed Central Page 1 of 20 (page number not for citation purposes) BMC Genetics Open Access Research article Prevalence of common disease-associated variants in Asian Indians Trevor J Pemberton 1 , Niyati U Mehta 1,3 , David Witonsky 5 , Anna Di Rienzo 5 , Hooman Allayee 1,2 , David V Conti 2 and Pragna I Patel* 1,3,4 Address: 1 Institute for Genetic Medicine, Keck School of Medicine, University of Southern California, Los Angeles, CA, USA, 2 Department: of Preventive Medicine, Keck School of Medicine, University of Southern California, Los Angeles, CA, USA, 3 Department of Biochemistry and Molecular Biology, University of Southern California, Los Angeles, CA, USA, 4 Center for Craniofacial Molecular Biology, Keck School of Medicine, University of Southern California, Los Angeles, CA, USA and 5 Department of Human Genetics, University of Chicago, Chicago, IL, USA Email: Trevor J Pemberton - [email protected]; Niyati U Mehta - [email protected]; David Witonsky - [email protected]; Anna Di Rienzo - [email protected]; Hooman Allayee - [email protected]; David V Conti - [email protected]; Pragna I Patel* - [email protected] * Corresponding author Abstract Background: Asian Indians display a high prevalence of diseases linked to changes in diet and environment that have arisen as their lifestyle has become more westernized. Using 1200 genome- wide polymorphisms in 432 individuals from 15 Indian language groups, we have recently shown that: (i) Indians constitute a distinct population-genetic cluster, and (ii) despite the geographic and linguistic diversity of the groups they exhibit a relatively low level of genetic heterogeneity. Results: We investigated the prevalence of common polymorphisms that have been associated with diseases, such as atherosclerosis (ALOX5), hypertension (CYP3A5, AGT, GNB3), diabetes (CAPN10, TCF7L2, PTPN22), prostate cancer (DG8S737, rs1447295), Hirschsprung disease (RET), and age-related macular degeneration (CFH, LOC387715). In addition, we examined polymorphisms associated with skin pigmentation (SLC24A5) and with the ability to taste phenylthiocarbamide (TAS2R38). All polymorphisms were studied in a cohort of 576 India-born Asian Indians sampled in the United States. This sample consisted of individuals whose mother tongue is one of 14 of the 22 "official" languages recognized in India as well as individuals whose mother tongue is Parsi, a cultural group that has resided in India for over 1000 years. Analysis of the data revealed that allele frequency differences between the different Indian language groups were small, and interestingly the variant alleles of ALOX5 g.8322G>A and g.50778G>A, and PTPN22 g.36677C>T were present only in a subset of the Indian language groups. Furthermore, a latitudinal cline was identified both for the allele frequencies of the SNPs associated with hypertension (CYP3A5, AGT, GNB3), as well as for those associated with the ability to taste phenylthiocarbamide (TAS2R38). Conclusion: Although caution is warranted due to the fact that this US-sampled Indian cohort may not represent a random sample from India, our results will hopefully assist in the design of future studies that investigate the genetic causes of these diseases in India. Our results also support the inclusion of the Indian population in disease-related genetic studies, as it exhibits unique genotype as well as phenotype characteristics that may yield new insights into the underlying causes of common diseases that are not available in other populations. Published: 4 February 2008 BMC Genetics 2008, 9:13 doi:10.1186/1471-2156-9-13 Received: 23 January 2007 Accepted: 4 February 2008 This article is available from: http://www.biomedcentral.com/1471-2156/9/13 © 2008 Pemberton et al; licensee BioMed Central Ltd. This is an Open Access article distributed under the terms of the Creative Commons Attribution License (http://creativecommons.org/licenses/by/2.0 ), which permits unrestricted use, distribution, and reproduction in any medium, provided the original work is properly cited.
-
Upload
khangminh22 -
Category
Documents
-
view
2 -
download
0
Transcript of BMC Genetics

BioMed CentralBMC Genetics
ss
Open AcceResearch articlePrevalence of common disease-associated variants in Asian IndiansTrevor J Pemberton1, Niyati U Mehta1,3, David Witonsky5, Anna Di Rienzo5, Hooman Allayee1,2, David V Conti2 and Pragna I Patel*1,3,4Address: 1Institute for Genetic Medicine, Keck School of Medicine, University of Southern California, Los Angeles, CA, USA, 2Department: of Preventive Medicine, Keck School of Medicine, University of Southern California, Los Angeles, CA, USA, 3Department of Biochemistry and Molecular Biology, University of Southern California, Los Angeles, CA, USA, 4Center for Craniofacial Molecular Biology, Keck School of Medicine, University of Southern California, Los Angeles, CA, USA and 5Department of Human Genetics, University of Chicago, Chicago, IL, USA
Email: Trevor J Pemberton - [email protected]; Niyati U Mehta - [email protected]; David Witonsky - [email protected]; Anna Di Rienzo - [email protected]; Hooman Allayee - [email protected]; David V Conti - [email protected]; Pragna I Patel* - [email protected]
* Corresponding author
AbstractBackground: Asian Indians display a high prevalence of diseases linked to changes in diet andenvironment that have arisen as their lifestyle has become more westernized. Using 1200 genome-wide polymorphisms in 432 individuals from 15 Indian language groups, we have recently shownthat: (i) Indians constitute a distinct population-genetic cluster, and (ii) despite the geographic andlinguistic diversity of the groups they exhibit a relatively low level of genetic heterogeneity.
Results: We investigated the prevalence of common polymorphisms that have been associatedwith diseases, such as atherosclerosis (ALOX5), hypertension (CYP3A5, AGT, GNB3), diabetes(CAPN10, TCF7L2, PTPN22), prostate cancer (DG8S737, rs1447295), Hirschsprung disease (RET),and age-related macular degeneration (CFH, LOC387715). In addition, we examined polymorphismsassociated with skin pigmentation (SLC24A5) and with the ability to taste phenylthiocarbamide(TAS2R38). All polymorphisms were studied in a cohort of 576 India-born Asian Indians sampled inthe United States. This sample consisted of individuals whose mother tongue is one of 14 of the 22"official" languages recognized in India as well as individuals whose mother tongue is Parsi, a culturalgroup that has resided in India for over 1000 years. Analysis of the data revealed that allelefrequency differences between the different Indian language groups were small, and interestinglythe variant alleles of ALOX5 g.8322G>A and g.50778G>A, and PTPN22 g.36677C>T were presentonly in a subset of the Indian language groups. Furthermore, a latitudinal cline was identified bothfor the allele frequencies of the SNPs associated with hypertension (CYP3A5, AGT, GNB3), as wellas for those associated with the ability to taste phenylthiocarbamide (TAS2R38).
Conclusion: Although caution is warranted due to the fact that this US-sampled Indian cohort maynot represent a random sample from India, our results will hopefully assist in the design of futurestudies that investigate the genetic causes of these diseases in India. Our results also support theinclusion of the Indian population in disease-related genetic studies, as it exhibits unique genotypeas well as phenotype characteristics that may yield new insights into the underlying causes ofcommon diseases that are not available in other populations.
Published: 4 February 2008
BMC Genetics 2008, 9:13 doi:10.1186/1471-2156-9-13
Received: 23 January 2007Accepted: 4 February 2008
This article is available from: http://www.biomedcentral.com/1471-2156/9/13
© 2008 Pemberton et al; licensee BioMed Central Ltd. This is an Open Access article distributed under the terms of the Creative Commons Attribution License (http://creativecommons.org/licenses/by/2.0), which permits unrestricted use, distribution, and reproduction in any medium, provided the original work is properly cited.
Page 1 of 20(page number not for citation purposes)
BackgroundIndia is currently the second most populous country inthe world after China with a population of 1,087 millionthat is predicted to expand to 1,628 million by the year2050 [1]. The high prevalence of endogamy and relativelylow admixture present in the population distinguishesAsian Indians (from the subcontinental region compris-ing India, Pakistan, Bangladesh and Sri Lanka) from mostother populations presently used in genetic studies [2]. Asthe country is becoming more westernized both in dietand lifestyle, the prevalence of diseases associated withthese lifestyle changes is increasing.
The languages of India belong to four major families:Indo-Aryan (a branch of the Indo-European family), Dra-vidian, Austroasiatic, and Sino-Tibetan, with the over-whelming majority of the population speaking languagesbelonging to the first two families [3]. The 1981 census –the last census to tabulate languages – reported 112mother tongues with more than 10,000 speakers andalmost 1 million people speaking other languages. TheIndian constitution recognizes 22 official Indian lan-guages. They are Assamese, Bengali, Bodo, Dogri,Gujarati, Hindi, Kannada, Kashmiri, Konkani, Maithili,Malayalam, Manipuri, Marathi, Nepali, Oriya, Punjabi,Sanskrit, Santhali, Sindhi, Tamil, Telugu, and Urdu. Ofthe official languages, about 43 percent of the populationspeaks Hindi as their mother tongue. Telugu, Bengali,Marathi, and Tamil rank next, each the mother tongue ofabout 4 to 5 percent; Urdu, Gujarati, Malayalam, Kan-nada, and Oriya are claimed by between 2 and 3 percent;Bhojpuri, Punjabi, and Assamese by 1 to 2 percent; and allother languages by less than 1 percent each. Pertinent tothis study, with the exception of Hindi, which is the pri-mary language spoken in several north Indian states, eachof the other languages is spoken by individuals with ori-gins from a distinct Indian state [3] and hence, each corre-sponds to a geographically defined region within India.
The Parsis are a member of the close-knit Zoroastriancommunity found primarily in the Indian state of Gujarat.Although the Parsis of India are descendents from PersianZoroastrians who emigrated to the Indian subcontinentfrom Persia over 1,000 years ago [4-6], they no longerhave social or familial ties to Persians, and do not sharelanguage or recent history with them. Mitochondrial andY-chromosome analyses suggest that since their arrival inIndia, the Parsis have integrated themselves into Indiansociety through a male-mediated migration of their ances-tors who admixed with local females [7,8]. However, theyhave simultaneously maintained their own ethnic iden-tity, making the Parsi community both Indian in terms ofnational affiliation, language and history, but not typi-cally Indian in terms of consanguinity or cultural, behav-ioral and religious practices.
Large inter-ethnic variation is known for anumber of common conditions, which maybe due, in part, to differences in risk allele frequencies thatare the result of either population structure, migration, orthe action of natural selection on the risk variants them-selves [9]. Because selective pressures may vary with geog-raphy and other environmental variables, detectablepatterns of geographic variation may sometimes beobserved in disease alleles. Recent population structureanalysis using 1200 genome-wide polymorphisms in 432individuals from 15 Indian language groups has shownthat Indians constitute a distinct population cluster andthat despite the geographic and linguistic diversity of thegroups, they exhibit a low level of genetic differentiation[10].
Metabolic disorders have been found to have a dispropor-tionately high prevalence in the Indian population, a phe-nomenon which is likely associated with the increasingwesternization of India. For example, many studies haveshown that the prevalence of coronary artery disease(CAD) in individuals of Indian origin is currently muchhigher than in other ethnic groups and is even increasing[11-17]. It is also currently estimated that 18% of theIndian population suffer from hypertension, one of themajor risk factors associated with CAD, and that the prev-alence of hypertension is also increasing within this pop-ulation [18]. However, this prevalence is comparable tothat in other worldwide populations (15.0–40.0%) [19].Type-2 diabetes is now reaching epidemic proportions inIndia, most prominently in urban Indians where there hasbeen a very steep increase in prevalence over the last dec-ade from 8.3% in 1992, 11.6% in 1997, to 15.5% in 2005[20-23]. Other diseases are also found at varying frequen-cies in the Indian population including Hirschsprung dis-ease [24,25], age-related macular degeneration (AMD)[26,27], prostate cancer [28,29], and type-1 diabetes[30,31]. However, despite the high prevalence of com-mon disorders and the large population within which tostudy them, most modern genetic studies have not incor-porated Indian populations.
In the present study, we have investigated the prevalenceof common polymorphisms that have recently beenreported to be risk factors for atherosclerosis, hyperten-sion, diabetes, prostate cancer, Hirschsprung disease, andage-related macular degeneration (Table 1) in a cohort of576 India-born Asian Indians sampled in the UnitedStates. This cohort consists of individuals whose mothertongue is one of 14 of the 22 "official" languages recog-nized in India, as well as individuals whose mothertongue is Parsi. We have also investigated variation in theTAS2R38 bitter taste receptor, associated with the abilityto taste phenylthiocarbamide (PTC), and in the SLC24A5gene, associated with variation in human skin pigmenta-
BMC Genetics 2008, 9:13 http://www.biomedcentral.com/1471-2156/9/13
tion (Table 1). The prevalence of these diseases/traits [32-43] and the risk-associated variant alleles of these poly-morphisms (see Additional file 1) have been reported tovary between populations/ethnicities, suggesting thattheir influence may also vary between populations. Theetiology of most cases of CAD [44], type-1 [45] and type-2 [46] diabetes, hypertension [47], prostate cancer [48],and AMD [49] are complex and are likely caused by thecombined effect of genes and environment. However, therelative contribution of genes versus environment to thediseases/traits and the degree of genetic heterogeneity arelikely very different for the different diseases/traits consid-ered in this paper. Whilst we have investigated the preva-lence of these minor alleles within this Indian cohort andcompared the frequencies to those of other populations,we have not addressed the potential impact of environ-mental factors that may differ between these populations.This study will hopefully aid in the design of futuregenetic studies investigating the underlying causes ofthese diseases in India.
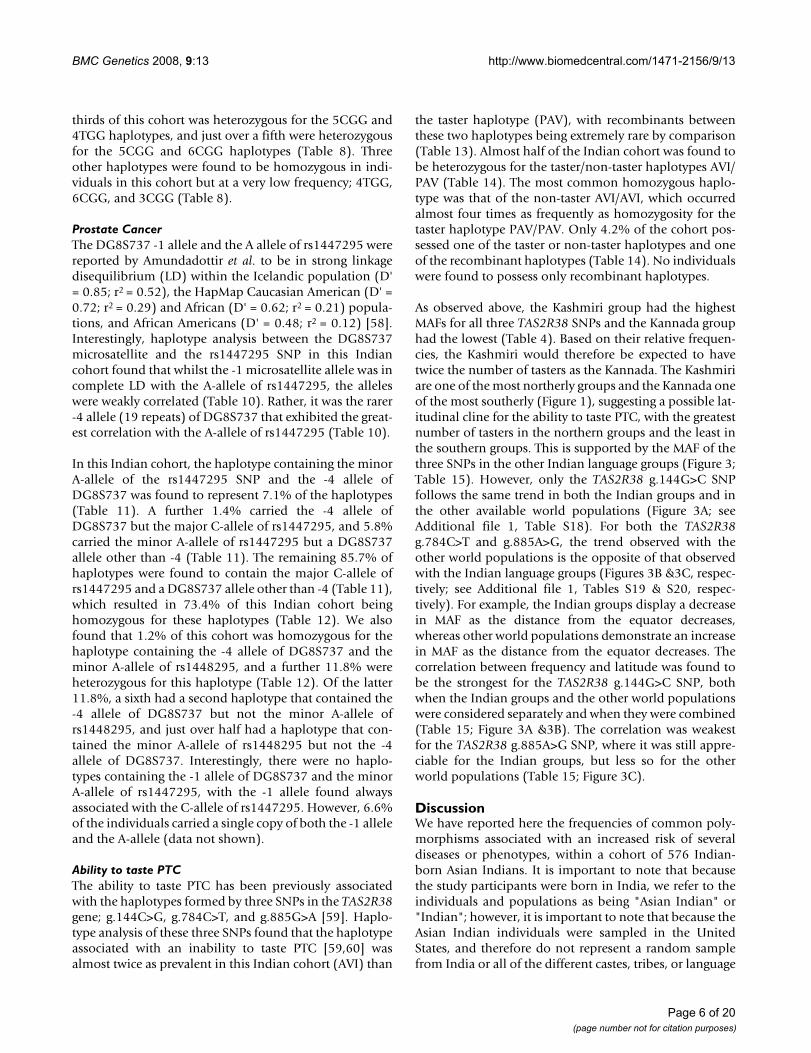
ResultsWe have examined the variation of 19 common polymor-phisms (Table 1) associated with diseases/traits in a col-lection of 576 individuals of Indian descent sampled inthe United States that represent 14 of the 22 official orscheduled Indian languages as well as one additional cul-tural group (Parsi; Figure 1). These individuals are part ofan expanded cohort that represents 15 groups defined bylanguage and that was used in a previous population-genetic study [10]. The allele frequencies of these 19 com-mon polymorphisms in the Indian cohort can be found inTables 2, 3, 4; for genotype frequencies see Additional file2, Tables S1–3.
Indian language groupsAll of the polymorphisms genotyped in our Indian cohortwere found to be in Hardy-Weinberg equilibrium (HWE;Tables 2, 3, &4), except for the ALOX5 g.20C>T polymor-phism which gave an HWE constant of 0.016 (p-value0.014). However, when corrected for multiple testingusing a Bonferroni correction, this deviation becomesinsignificant (corrected p-value 0.266).
Computations of FST suggested that there were no signifi-cant minor allele frequency (MAF) differences betweenthe language groups (Tables 2, 3, &4). This is in agreementwith a recent population structure analysis of this Indiancohort that found that the different language groupsexhibited a low level of genetic differentiation [10]. There-fore, when comparing the MAF of these polymorphismsin this Indian cohort with their frequency in other popu-lations, we grouped the MAFs of these polymorphisms inthe Indian language groups into a single comparativegroup. Of those polymorphisms with MAF data reported
in other populations (see Additional file 1, Tables S4–20),most had significant differences in frequency with ourIndian cohort (Tables 2, 3, &4).
Patterns in the variation of the MAF of several of the 19polymorphisms were visible between some of the lan-guage groups (Tables 2, 3, &4). Of note was the Kashmirigroup, which had significantly higher MAFs than theother groups for the CAPN10 g.4834T>C and TCF7L2g.98386G>T SNPs associated with type-2 diabetes risk(Table 2). Furthermore, considering the hypertension-associated SNPs, whilst the Kashmiri group had a signifi-cantly lower MAF for the CYP3A5 g.6980G>A SNP com-pared to the other groups, this language group also hadthe highest MAF for the AGT g.802C>T SNP and the sec-ond highest MAF for the GNB3g.4423C>T SNP (Table 2).Interestingly, whilst the Kashmiri group also had the high-est MAFs for all three TAS2R38 SNPs associated with theability to taste PTC (Table 4), the Kannada group had thelowest MAF for all three TAS2R38 SNPs. It was also note-worthy that the Oriya group had a significantly higherMAF of the rs1447295 SNP associated with prostate can-cer risk than the other groups (Table 3), but this higherprevalence was not reflected in the DG8S737 microsatel-lite allele frequencies that are also associated with prostatecancer risk.
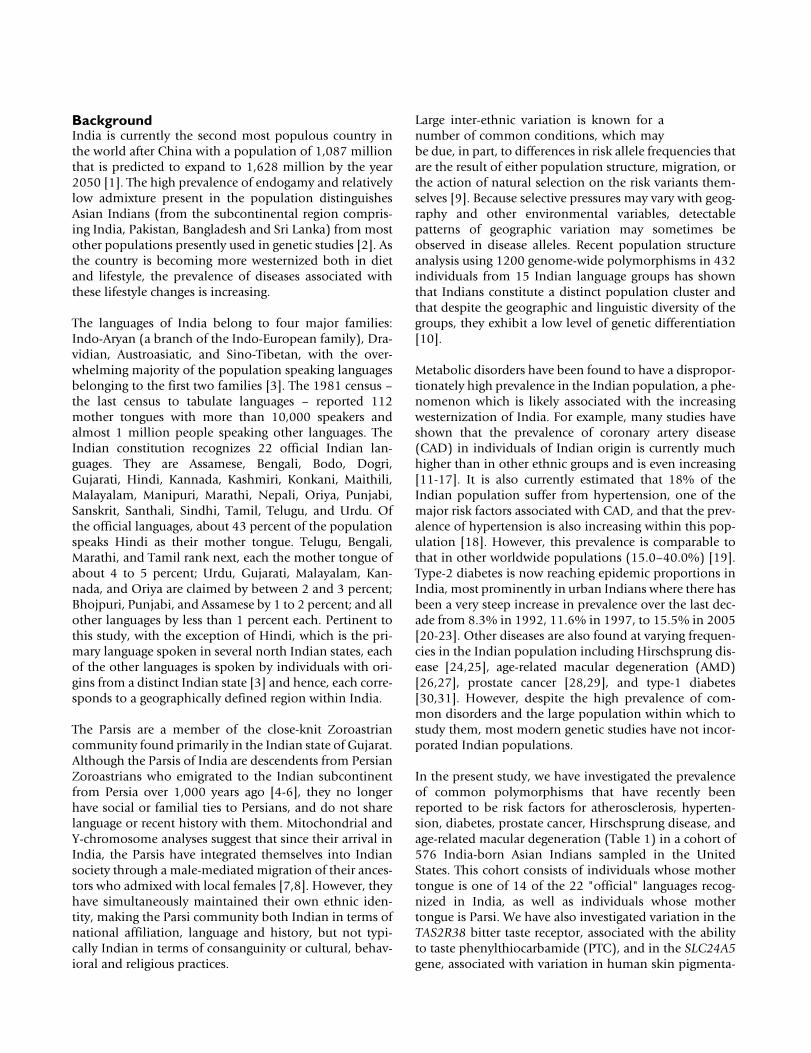
HypertensionThe frequency of the CYP3A5 g.6980G>A [50,51], AGTg.802C>T [50], and GNB3 g.825C>T [52-54] polymor-phisms have been reported to vary significantly betweendifferent populations/ethnicities in a cline that correlateswith the latitudinal variation of the populations[50,55,56]. To investigate how this Indian cohort and itslanguage groups fit into this correlation, the MAFs of theindividual groups were plotted against absolute latitudetogether with the MAFs of the other known populationspreviously investigated with regard to the latitudinal cline(Figure 2; see Additional file 1, Tables S4–6). The MAFs ofthe Indian language groups for the CYP3A5 g.6980G>ASNP were found to follow the pattern of the other popu-lations (Figure 2A). Accordingly, the correlation of allelefrequency with latitude, as measured by ρ and r2,remained similarly high whether or not the Indian datawere included (Table 5). A corresponding correlation wasnot found for the AGT g.802C>T SNP, for which the lan-guage groups were clustered largely below the other pop-ulations (Figure 2B). This resulted in an appreciablereduction in ρ and r2 with the inclusion of the Indian data(Table 5), but the correlation remained significant at the0.01 level. For the GNB3 g.825C>T SNP, the MAFs of thelanguage groups largely cluster slightly below those of theother populations (Figure 2C). However, there was a sub-stantial reduction of both ρ and r2 when the Indian data
Page 3 of 20(page number not for citation purposes)

BMC Genetics 2008, 9:13 http://www.biomedcentral.com/1471-2156/9/13
were included (Table 5), reducing the significance of thecorrelation to the 0.05 level.
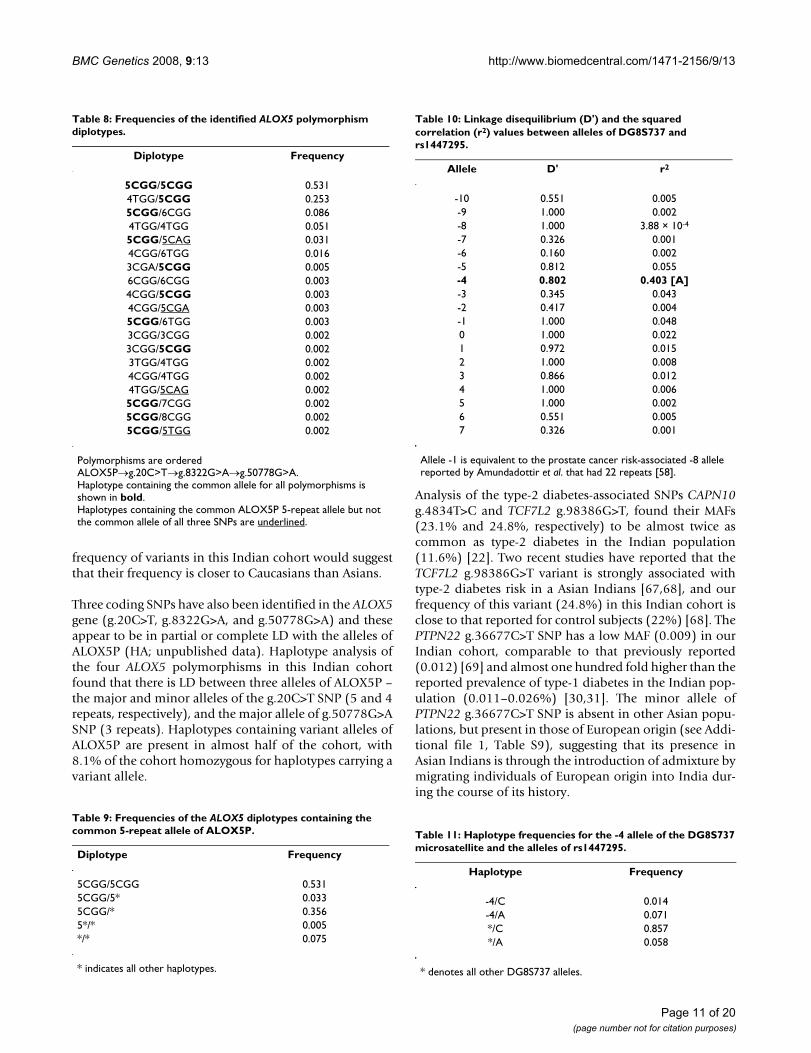
AtherosclerosisWhilst deviation away from the common 5-allele of theALOX5 promoter microsatellite (ALOX5P) has been pre-viously associated with an increased risk of atherosclerosis[57], allelic variation at the three ALOX5 coding SNPs(g.20C>T; g.8322G>A; g.50778G>A) has not. Haplotypeanalysis of ALOX5P and these three ALOX5 SNPs in thisIndian cohort found that they were in strong LD, with a D'close to 1 (data not shown). However, their squared cor-relation (r2) was found to vary (Table 6). The 4-repeatallele of ALOX5P was found to be strongly correlated withthe minor T-allele of the g.20C>T SNP, and the common5-repeat allele was strongly correlated with the major C-allele of the g.20C>T SNP. The 3-repeat allele of the pro-moter repeat polymorphism was also found to be in mod-erate correlation with the major G-allele of theg.50778G>A SNP. In agreement with this correlation andwith the allele frequencies, the most common haplotypeof the ALOX5P promoter variant and the coding ALOX5SNPs (g.20C>T; g.8322G>A; g.50778G>A) in the Indianpopulation was 5CGG. The frequency of this haplotypewas four times that of the second most common haplo-type, which combined the 4-repeat allele of ALOX5P withthe minor allele of the g.20C>T SNP and the major alleleof the g.8322G>A and g.50778G>A SNPs (Table 7). Overhalf of the Indian cohort was homozygous for the 5CGGhaplotype (Table 8) and a further third were hetero-zygous, of which 3.3% also possessed a second haplotypecontaining the 5-repeat allele of ALOX5P (Table 9). Two
Table 1: Investigated polymorphisms and their associated diseases.
Gene Name Nucleotide Change Protein Change NCBI Acc. # Phenotype Reference
AGT g.802C>T M235T rs699 Hypertension [100]CYP3A5 g.6980G>A IVS4 rs776746 Hypertension [101]GNB3 g.4423C>T S275S rs6489738 Hypertension [53]ALOX5 (5'-GGGCGG-3')3–8 promoter none Athersclerosis [57]ALOX5 g.20C>T T7T rs4987105 AthersclerosisALOX5 g.8322G>A T90T rs2228064 AthersclerosisALOX5 g.50778G>A E243K rs2228065 AthersclerosisCAPN10 g.4834T>C IVS3 rs2975760 Type-2 diabetes [102]TCF7L2 g.98386G>T IVS4 rs12255372 Type-2 diabetes [103]PTPN22 g.36677C>T R620W rs2476601 Type-1 diabetes [104]Intragenic (5'-AC-3')13–30 none DG8S737 Prostate Cancer [58]Intragenic C>A none rs1447295 Prostate Cancer [58]
CFH g.37989T>C Y402H rs1061170 Age-related macular degeneration [105-107]LOC387715 g.205G>T A69S rs10490924 Age-related macular degeneration [108]
RET g.9349G>A IVS1 rs2435357 Hirschsprung disease [109]TAS2R38 g.144G>C A49P rs713598 ability to taste PTC [59]TAS2R38 g.784C>T A262V rs1726866 ability to taste PTC [59]TAS2R38 g.885A>G I296V rs10246939 ability to taste PTC [59]SLC24A5 g.13233G>A A111T rs1426654 Skin pigmentation [110]
Sampled language groups, their sample sizes, and their geo-graphic origins within IndiaFigure 1Sampled language groups, their sample sizes, and their geo-graphic origins within India.
Page 4 of 20(page number not for citation purposes)
BM
C G
enet
ics
2008
, 9:1
3ht
tp://
ww
w.b
iom
edce
ntra
l.com
/147
1-21
56/9
/13
Page
5 o
f 20
(pag
e nu
mbe
r not
for c
itatio
n pu
rpos
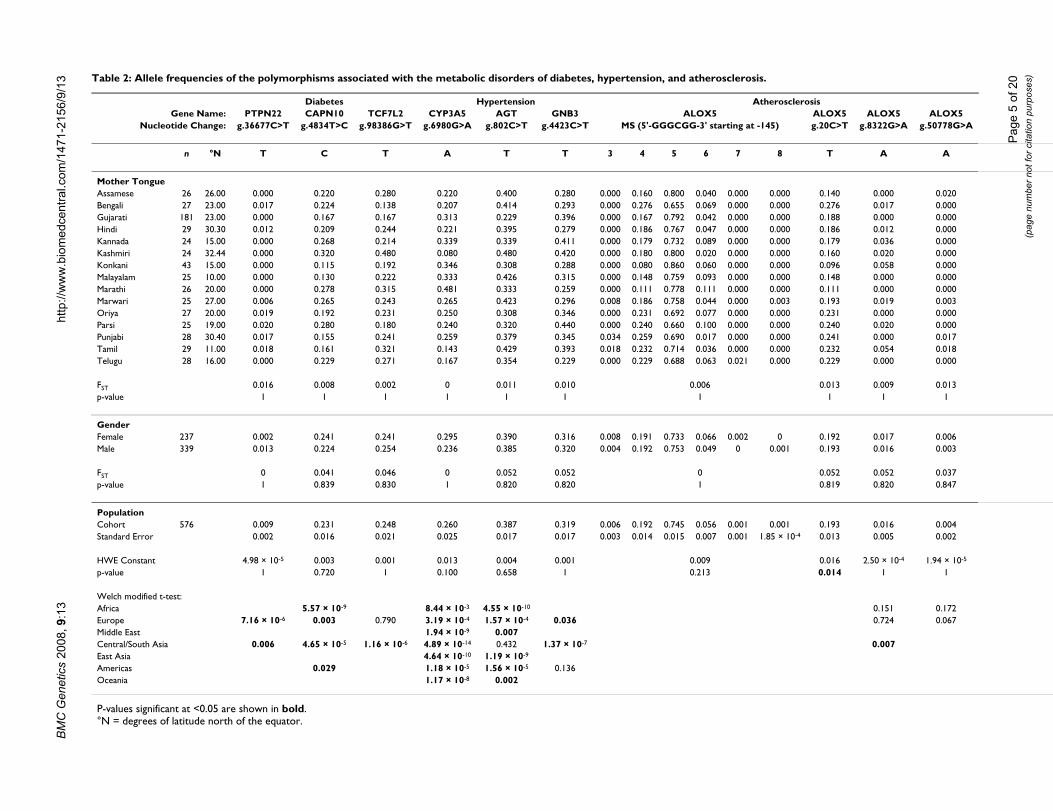
es)Table 2: Allele frequencies of the polymorphisms associated with the metabolic disorders of diabetes, hypertension, and atherosclerosis.
Diabetes Hypertension AtherosclerosisGene Name: PTPN22 CAPN10 TCF7L2 CYP3A5 AGT GNB3 ALOX5 ALOX5 ALOX5 ALOX5
Nucleotide Change: g.36677C>T g.4834T>C g.98386G>T g.6980G>A g.802C>T g.4423C>T MS (5'-GGGCGG-3' starting at -145) g.20C>T g.8322G>A g.50778G>A
n °N T C T A T T 3 4 5 6 7 8 T A A
Mother TongueAssamese 26 26.00 0.000 0.220 0.280 0.220 0.400 0.280 0.000 0.160 0.800 0.040 0.000 0.000 0.140 0.000 0.020Bengali 27 23.00 0.017 0.224 0.138 0.207 0.414 0.293 0.000 0.276 0.655 0.069 0.000 0.000 0.276 0.017 0.000Gujarati 181 23.00 0.000 0.167 0.167 0.313 0.229 0.396 0.000 0.167 0.792 0.042 0.000 0.000 0.188 0.000 0.000Hindi 29 30.30 0.012 0.209 0.244 0.221 0.395 0.279 0.000 0.186 0.767 0.047 0.000 0.000 0.186 0.012 0.000Kannada 24 15.00 0.000 0.268 0.214 0.339 0.339 0.411 0.000 0.179 0.732 0.089 0.000 0.000 0.179 0.036 0.000Kashmiri 24 32.44 0.000 0.320 0.480 0.080 0.480 0.420 0.000 0.180 0.800 0.020 0.000 0.000 0.160 0.020 0.000Konkani 43 15.00 0.000 0.115 0.192 0.346 0.308 0.288 0.000 0.080 0.860 0.060 0.000 0.000 0.096 0.058 0.000Malayalam 25 10.00 0.000 0.130 0.222 0.333 0.426 0.315 0.000 0.148 0.759 0.093 0.000 0.000 0.148 0.000 0.000Marathi 26 20.00 0.000 0.278 0.315 0.481 0.333 0.259 0.000 0.111 0.778 0.111 0.000 0.000 0.111 0.000 0.000Marwari 25 27.00 0.006 0.265 0.243 0.265 0.423 0.296 0.008 0.186 0.758 0.044 0.000 0.003 0.193 0.019 0.003Oriya 27 20.00 0.019 0.192 0.231 0.250 0.308 0.346 0.000 0.231 0.692 0.077 0.000 0.000 0.231 0.000 0.000Parsi 25 19.00 0.020 0.280 0.180 0.240 0.320 0.440 0.000 0.240 0.660 0.100 0.000 0.000 0.240 0.020 0.000Punjabi 28 30.40 0.017 0.155 0.241 0.259 0.379 0.345 0.034 0.259 0.690 0.017 0.000 0.000 0.241 0.000 0.017Tamil 29 11.00 0.018 0.161 0.321 0.143 0.429 0.393 0.018 0.232 0.714 0.036 0.000 0.000 0.232 0.054 0.018Telugu 28 16.00 0.000 0.229 0.271 0.167 0.354 0.229 0.000 0.229 0.688 0.063 0.021 0.000 0.229 0.000 0.000
FST 0.016 0.008 0.002 0 0.011 0.010 0.006 0.013 0.009 0.013p-value 1 1 1 1 1 1 1 1 1 1
GenderFemale 237 0.002 0.241 0.241 0.295 0.390 0.316 0.008 0.191 0.733 0.066 0.002 0 0.192 0.017 0.006Male 339 0.013 0.224 0.254 0.236 0.385 0.320 0.004 0.192 0.753 0.049 0 0.001 0.193 0.016 0.003
FST 0 0.041 0.046 0 0.052 0.052 0 0.052 0.052 0.037p-value 1 0.839 0.830 1 0.820 0.820 1 0.819 0.820 0.847
PopulationCohort 576 0.009 0.231 0.248 0.260 0.387 0.319 0.006 0.192 0.745 0.056 0.001 0.001 0.193 0.016 0.004Standard Error 0.002 0.016 0.021 0.025 0.017 0.017 0.003 0.014 0.015 0.007 0.001 1.85 × 10⁻⁴ 0.013 0.005 0.002
HWE Constant 4.98 × 10⁻⁵ 0.003 0.001 0.013 0.004 0.001 0.009 0.016 2.50 × 10⁻⁴ 1.94 × 10⁻⁵
p-value 1 0.720 1 0.100 0.658 1 0.213 0.014 1 1
Welch modified t-test:Africa 5.57 × 10⁻⁹ 8.44 × 10⁻³ 4.55 × 10⁻¹⁰ 0.151 0.172Europe 7.16 × 10⁻⁶ 0.003 0.790 3.19 × 10⁻⁴ 1.57 × 10⁻⁴ 0.036 0.724 0.067Middle East 1.94 × 10⁻⁹ 0.007Central/South Asia 0.006 4.65 × 10⁻⁵ 1.16 × 10⁻⁶ 4.89 × 10⁻¹⁴ 0.432 1.37 × 10⁻⁷ 0.007East Asia 4.64 × 10⁻¹⁰ 1.19 × 10⁻⁹
Americas 0.029 1.18 × 10⁻⁵ 1.56 × 10⁻⁵ 0.136Oceania 1.17 × 10⁻⁸ 0.002
P-values significant at <0.05 are shown in bold.°N = degrees of latitude north of the equator.
BMC Genetics 2008, 9:13 http://www.biomedcentral.com/1471-2156/9/13
thirds of this cohort was heterozygous for the 5CGG and4TGG haplotypes, and just over a fifth were heterozygousfor the 5CGG and 6CGG haplotypes (Table 8). Threeother haplotypes were found to be homozygous in indi-viduals in this cohort but at a very low frequency; 4TGG,6CGG, and 3CGG (Table 8).
Prostate CancerThe DG8S737 -1 allele and the A allele of rs1447295 werereported by Amundadottir et al. to be in strong linkagedisequilibrium (LD) within the Icelandic population (D'= 0.85; r2 = 0.52), the HapMap Caucasian American (D' =0.72; r2 = 0.29) and African (D' = 0.62; r2 = 0.21) popula-tions, and African Americans (D' = 0.48; r2 = 0.12) [58].Interestingly, haplotype analysis between the DG8S737microsatellite and the rs1447295 SNP in this Indiancohort found that whilst the -1 microsatellite allele was incomplete LD with the A-allele of rs1447295, the alleleswere weakly correlated (Table 10). Rather, it was the rarer-4 allele (19 repeats) of DG8S737 that exhibited the great-est correlation with the A-allele of rs1447295 (Table 10).
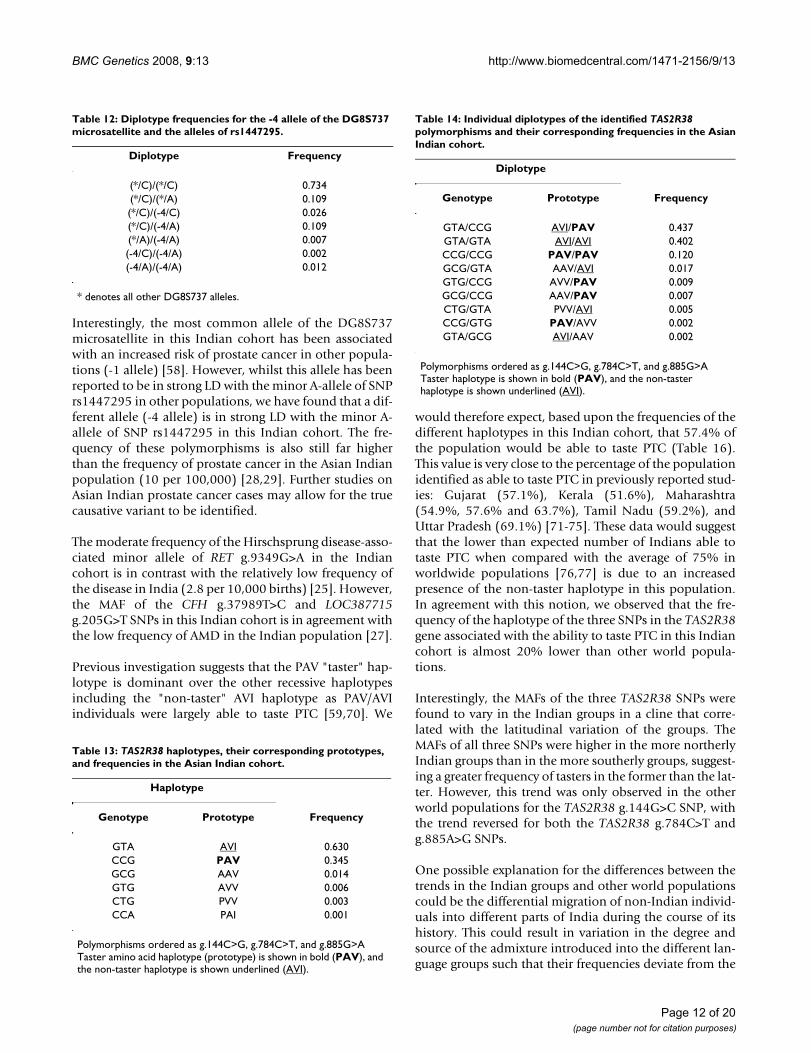
In this Indian cohort, the haplotype containing the minorA-allele of the rs1447295 SNP and the -4 allele ofDG8S737 was found to represent 7.1% of the haplotypes(Table 11). A further 1.4% carried the -4 allele ofDG8S737 but the major C-allele of rs1447295, and 5.8%carried the minor A-allele of rs1447295 but a DG8S737allele other than -4 (Table 11). The remaining 85.7% ofhaplotypes were found to contain the major C-allele ofrs1447295 and a DG8S737 allele other than -4 (Table 11),which resulted in 73.4% of this Indian cohort beinghomozygous for these haplotypes (Table 12). We alsofound that 1.2% of this cohort was homozygous for thehaplotype containing the -4 allele of DG8S737 and theminor A-allele of rs1448295, and a further 11.8% wereheterozygous for this haplotype (Table 12). Of the latter11.8%, a sixth had a second haplotype that contained the-4 allele of DG8S737 but not the minor A-allele ofrs1448295, and just over half had a haplotype that con-tained the minor A-allele of rs1448295 but not the -4allele of DG8S737. Interestingly, there were no haplo-types containing the -1 allele of DG8S737 and the minorA-allele of rs1447295, with the -1 allele found alwaysassociated with the C-allele of rs1447295. However, 6.6%of the individuals carried a single copy of both the -1 alleleand the A-allele (data not shown).
Ability to taste PTCThe ability to taste PTC has been previously associatedwith the haplotypes formed by three SNPs in the TAS2R38gene; g.144C>G, g.784C>T, and g.885G>A [59]. Haplo-type analysis of these three SNPs found that the haplotypeassociated with an inability to taste PTC [59,60] wasalmost twice as prevalent in this Indian cohort (AVI) than
the taster haplotype (PAV), with recombinants betweenthese two haplotypes being extremely rare by comparison(Table 13). Almost half of the Indian cohort was found tobe heterozygous for the taster/non-taster haplotypes AVI/PAV (Table 14). The most common homozygous haplo-type was that of the non-taster AVI/AVI, which occurredalmost four times as frequently as homozygosity for thetaster haplotype PAV/PAV. Only 4.2% of the cohort pos-sessed one of the taster or non-taster haplotypes and oneof the recombinant haplotypes (Table 14). No individualswere found to possess only recombinant haplotypes.
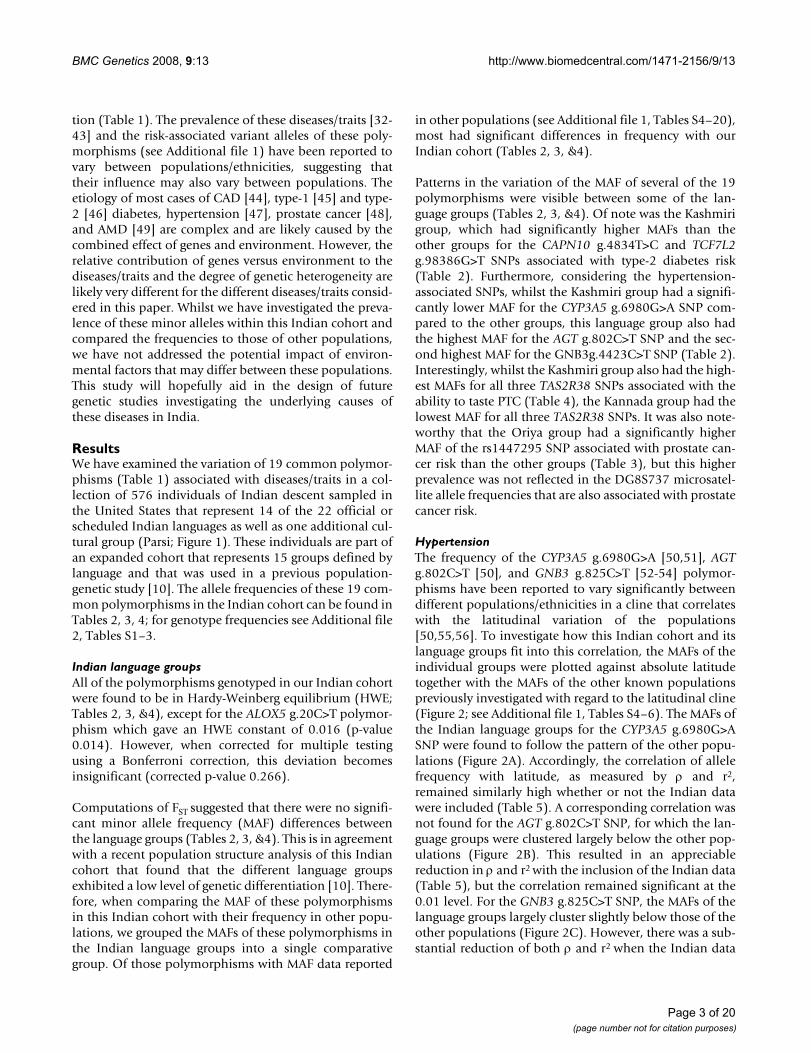
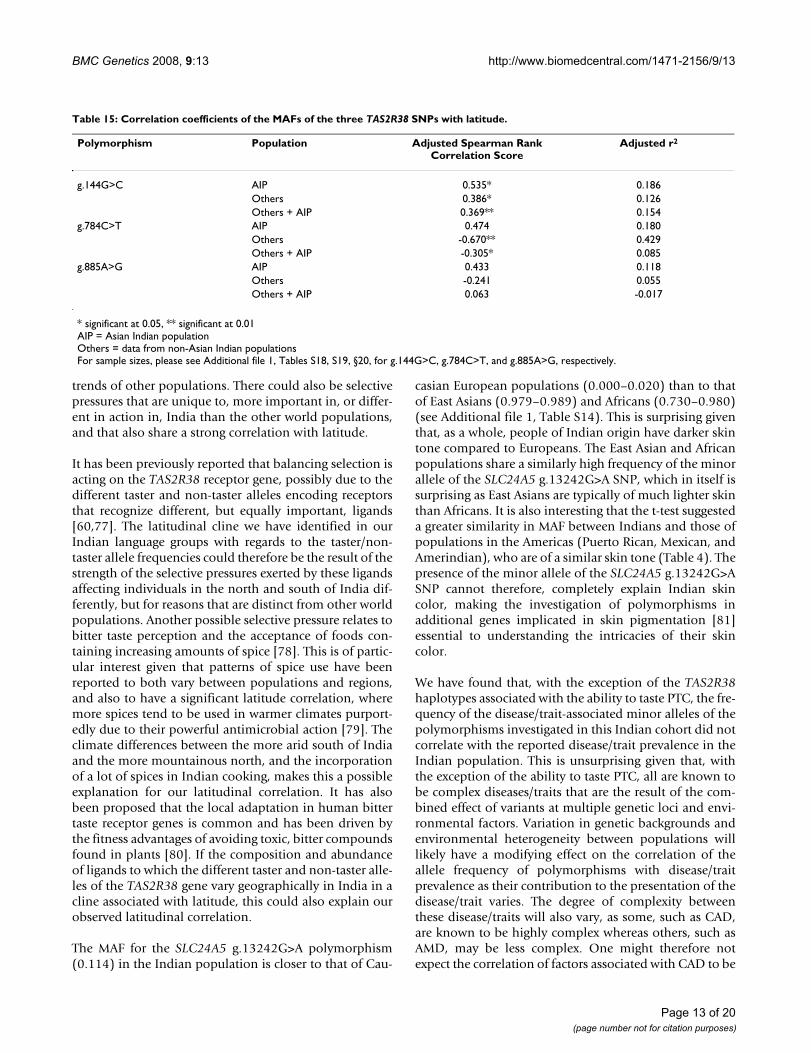
As observed above, the Kashmiri group had the highestMAFs for all three TAS2R38 SNPs and the Kannada grouphad the lowest (Table 4). Based on their relative frequen-cies, the Kashmiri would therefore be expected to havetwice the number of tasters as the Kannada. The Kashmiriare one of the most northerly groups and the Kannada oneof the most southerly (Figure 1), suggesting a possible lat-itudinal cline for the ability to taste PTC, with the greatestnumber of tasters in the northern groups and the least inthe southern groups. This is supported by the MAF of thethree SNPs in the other Indian language groups (Figure 3;Table 15). However, only the TAS2R38 g.144G>C SNPfollows the same trend in both the Indian groups and inthe other available world populations (Figure 3A; seeAdditional file 1, Table S18). For both the TAS2R38g.784C>T and g.885A>G, the trend observed with theother world populations is the opposite of that observedwith the Indian language groups (Figures 3B &3C, respec-tively; see Additional file 1, Tables S19 & S20, respec-tively). For example, the Indian groups display a decreasein MAF as the distance from the equator decreases,whereas other world populations demonstrate an increasein MAF as the distance from the equator decreases. Thecorrelation between frequency and latitude was found tobe the strongest for the TAS2R38 g.144G>C SNP, bothwhen the Indian groups and the other world populationswere considered separately and when they were combined(Table 15; Figure 3A &3B). The correlation was weakestfor the TAS2R38 g.885A>G SNP, where it was still appre-ciable for the Indian groups, but less so for the otherworld populations (Table 15; Figure 3C).
DiscussionWe have reported here the frequencies of common poly-morphisms associated with an increased risk of severaldiseases or phenotypes, within a cohort of 576 Indian-born Asian Indians. It is important to note that becausethe study participants were born in India, we refer to theindividuals and populations as being "Asian Indian" or"Indian"; however, it is important to note that because theAsian Indian individuals were sampled in the UnitedStates, and therefore do not represent a random samplefrom India or all of the different castes, tribes, or language
Page 6 of 20(page number not for citation purposes)

BM
C G
enet
ics
2008
, 9:1
3ht
tp://
ww
w.b
iom
edce
ntra
l.com
/147
1-21
56/9
/13
Page
7 o
f 20
(pag
e nu
mbe
r not
for c
itatio
n pu
rpos
es)
Table 3: Allele frequencies of the polymorphisms associated with prostate cancer.
Prostate CancerPolymorphism: DG8S737 rs1447295
Nucleotide Change: MS C>A
n -10 -9 -8 -7 -6 -5 -4 -3 -2 -1 0 +1 +2 +3 +4 +5 +6 +7 A
Mother TongueAssamese 26 0.000 0.040 0.000 0.000 0.000 0.020 0.120 0.020 0.060 0.180 0.220 0.100 0.060 0.080 0.080 0.020 0.000 0.000 0.120Bengali 27 0.017 0.000 0.000 0.000 0.000 0.000 0.034 0.121 0.155 0.190 0.103 0.155 0.052 0.121 0.052 0.000 0.000 0.000 0.121Gujarati 181 0.000 0.042 0.000 0.000 0.042 0.000 0.021 0.042 0.229 0.188 0.188 0.042 0.042 0.125 0.042 0.000 0.000 0.000 0.125Hindi 29 0.023 0.023 0.000 0.012 0.012 0.012 0.128 0.035 0.151 0.209 0.116 0.093 0.035 0.070 0.023 0.035 0.023 0.000 0.186Kannada 24 0.000 0.071 0.000 0.000 0.018 0.000 0.089 0.036 0.161 0.268 0.125 0.036 0.000 0.143 0.054 0.000 0.000 0.000 0.125Kashmiri 24 0.000 0.000 0.000 0.000 0.000 0.000 0.060 0.060 0.120 0.220 0.120 0.200 0.040 0.120 0.060 0.000 0.000 0.000 0.040Konkani 43 0.000 0.019 0.000 0.000 0.019 0.019 0.077 0.115 0.135 0.173 0.192 0.058 0.135 0.019 0.019 0.019 0.000 0.000 0.192Malayalam 25 0.000 0.000 0.000 0.000 0.000 0.000 0.093 0.037 0.167 0.204 0.111 0.185 0.019 0.148 0.000 0.019 0.000 0.019 0.074Marathi 26 0.000 0.000 0.000 0.000 0.037 0.000 0.074 0.037 0.093 0.278 0.111 0.130 0.056 0.093 0.056 0.037 0.000 0.000 0.111Marwari 25 0.000 0.008 0.003 0.000 0.008 0.022 0.110 0.028 0.116 0.293 0.122 0.077 0.058 0.105 0.041 0.006 0.003 0.000 0.141Oriya 27 0.000 0.000 0.019 0.019 0.058 0.038 0.058 0.135 0.077 0.173 0.173 0.096 0.038 0.077 0.019 0.019 0.000 0.000 0.308Parsi 25 0.000 0.000 0.020 0.000 0.040 0.000 0.020 0.020 0.380 0.220 0.100 0.140 0.020 0.020 0.020 0.000 0.000 0.000 0.040Punjabi 28 0.000 0.000 0.000 0.000 0.017 0.000 0.052 0.069 0.121 0.345 0.121 0.086 0.086 0.069 0.034 0.000 0.000 0.000 0.034Tamil 29 0.000 0.000 0.000 0.000 0.018 0.018 0.161 0.018 0.125 0.143 0.143 0.143 0.054 0.107 0.054 0.018 0.000 0.000 0.161Telugu 28 0.000 0.021 0.000 0.000 0.000 0.000 0.042 0.104 0.188 0.375 0.083 0.021 0.042 0.042 0.021 0.042 0.000 0.021 0.104
FST 0.007 0.020p-value 1 1
GenderFemale 237 0.002 0.021 0.004 0.002 0.019 0.011 0.078 0.044 0.146 0.251 0.129 0.099 0.057 0.078 0.049 0.011 0.000 0.000 0.120Male 339 0.003 0.009 0.001 0.001 0.013 0.013 0.091 0.052 0.140 0.242 0.133 0.094 0.049 0.105 0.032 0.013 0.004 0.003 0.136
FST 0 0p-value 1 1
PopulationCohort 576 0.003 0.014 0.003 0.002 0.016 0.012 0.085 0.050 0.142 0.245 0.130 0.098 0.052 0.094 0.039 0.012 0.003 0.002 0.129Standard Error
0.002 0.006 0.002 0.001 0.005 0.003 0.011 0.010 0.020 0.017 0.010 0.014 0.008 0.010 0.005 0.004 0.002 0.002 0.018
HWE Constant
0.003 0.002
p-value 0.433 0.580
Welch modified t-test:AfricaEurope 0.091Asia 0.486Americas
Alleles of DG8S737 were assigned based upon the change in the number of repeats away from that of the reference sequence in the NCBI database (23 AC dinucleotide repeats). Allele -1 is equivalent to the prostate cancer risk-associated -8 allele reported by Amundadottir et al. that had 22 repeats [58]. P-values significant at <0.05 are shown in bold.
BMC Genetics 2008, 9:13 http://www.biomedcentral.com/1471-2156/9/13
groups, some biases may be introduced when extrapolat-ing the results to India as a whole [10]. It is also importantto note that because Hindi is spoken by 43 percent of theIndian population, primarily in the states of NorthernIndia, heterogeneity will be present between its variousconstituent population groups. Our Hindi languagegroup is a sample of individuals who emigrated from arestricted region of India, and therefore biases may be
introduced when extrapolating their results to Hindispeakers as a whole.
All polymorphisms, with the exception of ALOX5g.20C>T, were found to be in HWE. The deviation awayfrom HWE for the ALOX5 g.20C>T SNP is most likely dueto chance, but given its low frequency we cannot excludethe possibility of genetic drift, differing selection betweenthe groups, or the small sample size of all but one
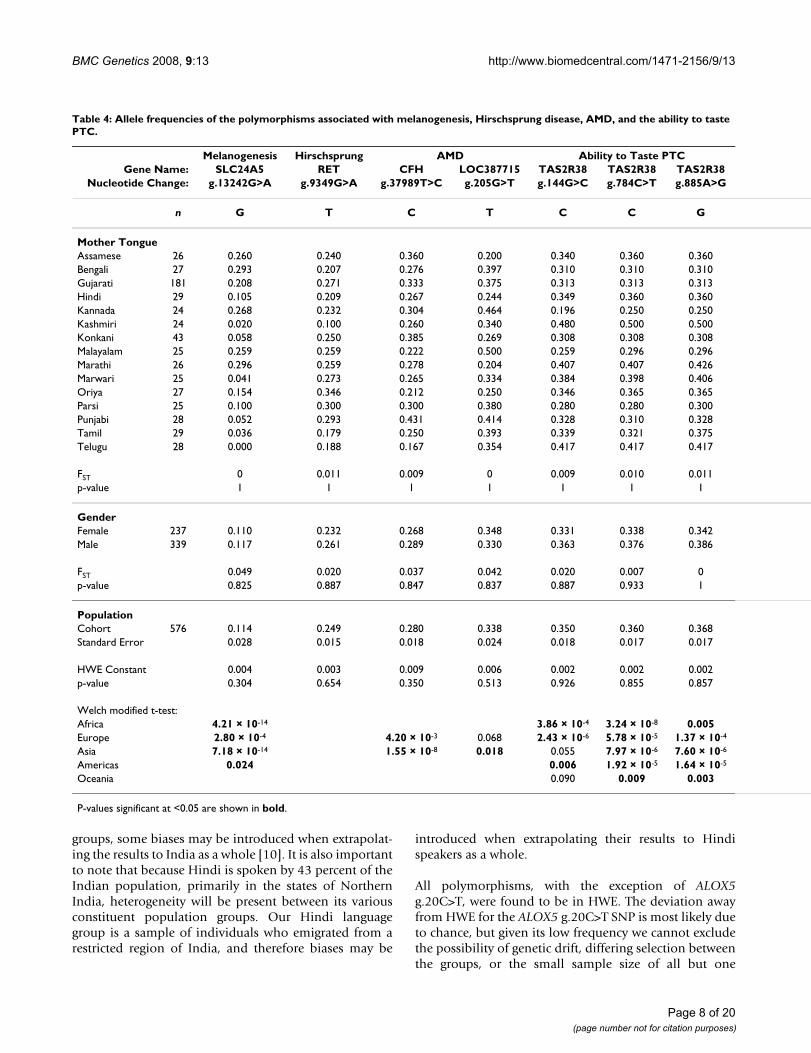
Table 4: Allele frequencies of the polymorphisms associated with melanogenesis, Hirschsprung disease, AMD, and the ability to taste PTC.
Melanogenesis Hirschsprung AMD Ability to Taste PTCGene Name: SLC24A5 RET CFH LOC387715 TAS2R38 TAS2R38 TAS2R38
Nucleotide Change: g.13242G>A g.9349G>A g.37989T>C g.205G>T g.144G>C g.784C>T g.885A>G
n G T C T C C G
Mother TongueAssamese 26 0.260 0.240 0.360 0.200 0.340 0.360 0.360Bengali 27 0.293 0.207 0.276 0.397 0.310 0.310 0.310Gujarati 181 0.208 0.271 0.333 0.375 0.313 0.313 0.313Hindi 29 0.105 0.209 0.267 0.244 0.349 0.360 0.360Kannada 24 0.268 0.232 0.304 0.464 0.196 0.250 0.250Kashmiri 24 0.020 0.100 0.260 0.340 0.480 0.500 0.500Konkani 43 0.058 0.250 0.385 0.269 0.308 0.308 0.308Malayalam 25 0.259 0.259 0.222 0.500 0.259 0.296 0.296Marathi 26 0.296 0.259 0.278 0.204 0.407 0.407 0.426Marwari 25 0.041 0.273 0.265 0.334 0.384 0.398 0.406Oriya 27 0.154 0.346 0.212 0.250 0.346 0.365 0.365Parsi 25 0.100 0.300 0.300 0.380 0.280 0.280 0.300Punjabi 28 0.052 0.293 0.431 0.414 0.328 0.310 0.328Tamil 29 0.036 0.179 0.250 0.393 0.339 0.321 0.375Telugu 28 0.000 0.188 0.167 0.354 0.417 0.417 0.417
FST 0 0.011 0.009 0 0.009 0.010 0.011p-value 1 1 1 1 1 1 1
GenderFemale 237 0.110 0.232 0.268 0.348 0.331 0.338 0.342Male 339 0.117 0.261 0.289 0.330 0.363 0.376 0.386
FST 0.049 0.020 0.037 0.042 0.020 0.007 0p-value 0.825 0.887 0.847 0.837 0.887 0.933 1
PopulationCohort 576 0.114 0.249 0.280 0.338 0.350 0.360 0.368Standard Error 0.028 0.015 0.018 0.024 0.018 0.017 0.017
HWE Constant 0.004 0.003 0.009 0.006 0.002 0.002 0.002p-value 0.304 0.654 0.350 0.513 0.926 0.855 0.857
Welch modified t-test:Africa 4.21 × 10⁻¹⁴ 3.86 × 10⁻⁴ 3.24 × 10⁻⁸ 0.005Europe 2.80 × 10⁻⁴ 4.20 × 10⁻³ 0.068 2.43 × 10⁻⁶ 5.78 × 10⁻⁵ 1.37 × 10⁻⁴
Asia 7.18 × 10⁻¹⁴ 1.55 × 10⁻⁸ 0.018 0.055 7.97 × 10⁻⁶ 7.60 × 10⁻⁶
Americas 0.024 0.006 1.92 × 10⁻⁵ 1.64 × 10⁻⁵
Oceania 0.090 0.009 0.003
P-values significant at <0.05 are shown in bold.
Page 8 of 20(page number not for citation purposes)

BMC Genetics 2008, 9:13 http://www.biomedcentral.com/1471-2156/9/13
(Gujarati) of our language groups. Genotyping errorcould be another possible explanation, but the extremelyhigh accuracy of the TaqMan genotyping assay [61] andthe 100% concordance of replicated genotypes makes thisexplanation unlikely.
No significant population subdivision was identified byFST between the different Indian language groups (Tables2, 3, &4). However, variation in the MAF of some of thepolymorphisms between the different language groupswas observed. Furthermore, the ALOX5 g.8322G>A andg.50778G>A SNPs, as well as the PTPN22 g.36677C>TSNP, were found to be present in some but not all of theIndian language groups investigated here. There was nodiscernible pattern to presence/absence of the minorallele of these SNPs with regard to the location of thesegroups within India (Figure 1), and it is possible that theirpresence or absence is the result of either the different ori-gins of the language groups during the peopling of Indiaand strengthened by their practice of endogamy [62,63],or admixture introduced by the differential migration ofnon-Indian populations into regions of India during thecourse of its history [64,65]. With the exception of theGujaratis, the small sample size of our individual lan-guage groups could also be responsible for this observa-tion as we may be under powered to detect the minorallele in these groups. However, the absence of the ALOX5g.8322G>A, ALOX5 g.50778G>A, and PTPN22g.36677C>T SNPs in the Gujarati language group, forwhich we have around seven times the number of individ-uals of the other groups, would suggest that their absencein the other groups may not necessarily be due to a lack ofa sufficient sample size for their detection. If this observedvariation in the MAF of some of the polymorphismsbetween the different language groups is confirmed, thenthis could impact the design of future case-control studiesin India as it would suggest that the inclusion of a dispro-portionate number of individuals from a particular lan-guage group in either the case or control groups could leadto missed or spurious associations.
Interestingly, the MAF of the atherosclerosis (ALOX5P,ALOX5 g.20C>T, g.8322G>A, and g.50778G>A), type-1and type-2 diabetes (CAPN10 g.4834T>C, TCF7L2g.98386G>T, and PTPN22 g.36677C>T), and Hirschs-prung disease (RET g.9349G>A) associated polymor-phisms were found to be similar to those of Europeanpopulations. Similarly, the frequencies of variants associ-ated with AMD (CFH g.37989T>C and LOC388715g.205G>T) and prostate cancer (DG8S737 and rs1447295were similar to those of African populations. However,none showed a high similarity to the populations of East-ern Asia. This could reflect a greater degree of non-Asiancompared to Asian gene flow into India during the courseof its history; however, if higher caste is correlated with a
The correlation between minor allele frequency and latitude of (A) CYP3A5 g.6980G>A, (B) AGT g.802C>T, and (C) GNB3 g.4423C>TFigure 2The correlation between minor allele frequency and latitude of (A) CYP3A5 g.6980G>A, (B) AGT g.802C>T, and (C) GNB3 g.4423C>T. Correlation coefficients for each graph can be found in Table 5.
Page 9 of 20(page number not for citation purposes)
BMC Genetics 2008, 9:13 http://www.biomedcentral.com/1471-2156/9/13
European or western Asian component of ancestry, thiscould be a reflection of our sampling of Asian Indianimmigrants in the United States that are likely biasedtowards the higher castes.
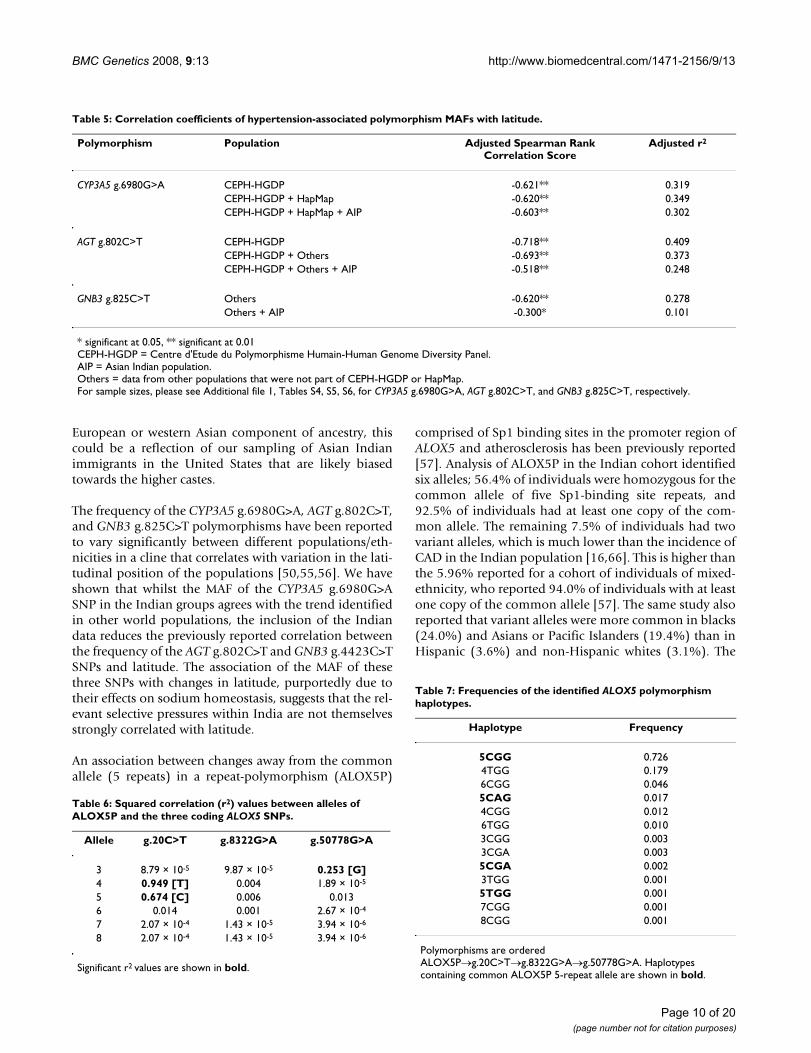
The frequency of the CYP3A5 g.6980G>A, AGT g.802C>T,and GNB3 g.825C>T polymorphisms have been reportedto vary significantly between different populations/eth-nicities in a cline that correlates with variation in the lati-tudinal position of the populations [50,55,56]. We haveshown that whilst the MAF of the CYP3A5 g.6980G>ASNP in the Indian groups agrees with the trend identifiedin other world populations, the inclusion of the Indiandata reduces the previously reported correlation betweenthe frequency of the AGT g.802C>T and GNB3 g.4423C>TSNPs and latitude. The association of the MAF of thesethree SNPs with changes in latitude, purportedly due totheir effects on sodium homeostasis, suggests that the rel-evant selective pressures within India are not themselvesstrongly correlated with latitude.
An association between changes away from the commonallele (5 repeats) in a repeat-polymorphism (ALOX5P)
comprised of Sp1 binding sites in the promoter region ofALOX5 and atherosclerosis has been previously reported[57]. Analysis of ALOX5P in the Indian cohort identifiedsix alleles; 56.4% of individuals were homozygous for thecommon allele of five Sp1-binding site repeats, and92.5% of individuals had at least one copy of the com-mon allele. The remaining 7.5% of individuals had twovariant alleles, which is much lower than the incidence ofCAD in the Indian population [16,66]. This is higher thanthe 5.96% reported for a cohort of individuals of mixed-ethnicity, who reported 94.0% of individuals with at leastone copy of the common allele [57]. The same study alsoreported that variant alleles were more common in blacks(24.0%) and Asians or Pacific Islanders (19.4%) than inHispanic (3.6%) and non-Hispanic whites (3.1%). The
Table 7: Frequencies of the identified ALOX5 polymorphism haplotypes.
Haplotype Frequency
5CGG 0.7264TGG 0.1796CGG 0.0465CAG 0.0174CGG 0.0126TGG 0.0103CGG 0.0033CGA 0.0035CGA 0.0023TGG 0.0015TGG 0.0017CGG 0.0018CGG 0.001
Polymorphisms are ordered ALOX5P→g.20C>T→g.8322G>A→g.50778G>A. Haplotypes containing common ALOX5P 5-repeat allele are shown in bold.
Table 6: Squared correlation (r2) values between alleles of ALOX5P and the three coding ALOX5 SNPs.
Allele g.20C>T g.8322G>A g.50778G>A
3 8.79 × 10⁻⁵ 9.87 × 10⁻⁵ 0.253 [G]4 0.949 [T] 0.004 1.89 × 10⁻⁵
5 0.674 [C] 0.006 0.0136 0.014 0.001 2.67 × 10⁻⁴
7 2.07 × 10⁻⁴ 1.43 × 10⁻⁵ 3.94 × 10⁻⁶
8 2.07 × 10⁻⁴ 1.43 × 10⁻⁵ 3.94 × 10⁻⁶
Significant r2 values are shown in bold.
Table 5: Correlation coefficients of hypertension-associated polymorphism MAFs with latitude.
Polymorphism Population Adjusted Spearman Rank Correlation Score
Adjusted r2
CYP3A5 g.6980G>A CEPH-HGDP -0.621** 0.319CEPH-HGDP + HapMap -0.620** 0.349CEPH-HGDP + HapMap + AIP -0.603** 0.302
AGT g.802C>T CEPH-HGDP -0.718** 0.409CEPH-HGDP + Others -0.693** 0.373CEPH-HGDP + Others + AIP -0.518** 0.248
GNB3 g.825C>T Others -0.620** 0.278Others + AIP -0.300* 0.101
* significant at 0.05, ** significant at 0.01CEPH-HGDP = Centre d'Etude du Polymorphisme Humain-Human Genome Diversity Panel.AIP = Asian Indian population.Others = data from other populations that were not part of CEPH-HGDP or HapMap.For sample sizes, please see Additional file 1, Tables S4, S5, S6, for CYP3A5 g.6980G>A, AGT g.802C>T, and GNB3 g.825C>T, respectively.
Page 10 of 20(page number not for citation purposes)
BMC Genetics 2008, 9:13 http://www.biomedcentral.com/1471-2156/9/13
frequency of variants in this Indian cohort would suggestthat their frequency is closer to Caucasians than Asians.
Three coding SNPs have also been identified in the ALOX5gene (g.20C>T, g.8322G>A, and g.50778G>A) and theseappear to be in partial or complete LD with the alleles ofALOX5P (HA; unpublished data). Haplotype analysis ofthe four ALOX5 polymorphisms in this Indian cohortfound that there is LD between three alleles of ALOX5P –the major and minor alleles of the g.20C>T SNP (5 and 4repeats, respectively), and the major allele of g.50778G>ASNP (3 repeats). Haplotypes containing variant alleles ofALOX5P are present in almost half of the cohort, with8.1% of the cohort homozygous for haplotypes carrying avariant allele.
Analysis of the type-2 diabetes-associated SNPs CAPN10g.4834T>C and TCF7L2 g.98386G>T, found their MAFs(23.1% and 24.8%, respectively) to be almost twice ascommon as type-2 diabetes in the Indian population(11.6%) [22]. Two recent studies have reported that theTCF7L2 g.98386G>T variant is strongly associated withtype-2 diabetes risk in a Asian Indians [67,68], and ourfrequency of this variant (24.8%) in this Indian cohort isclose to that reported for control subjects (22%) [68]. ThePTPN22 g.36677C>T SNP has a low MAF (0.009) in ourIndian cohort, comparable to that previously reported(0.012) [69] and almost one hundred fold higher than thereported prevalence of type-1 diabetes in the Indian pop-ulation (0.011–0.026%) [30,31]. The minor allele ofPTPN22 g.36677C>T SNP is absent in other Asian popu-lations, but present in those of European origin (see Addi-tional file 1, Table S9), suggesting that its presence inAsian Indians is through the introduction of admixture bymigrating individuals of European origin into India dur-ing the course of its history.
Table 11: Haplotype frequencies for the -4 allele of the DG8S737 microsatellite and the alleles of rs1447295.
Haplotype Frequency
-4/C 0.014-4/A 0.071*/C 0.857*/A 0.058
* denotes all other DG8S737 alleles.
Table 9: Frequencies of the ALOX5 diplotypes containing the common 5-repeat allele of ALOX5P.
Diplotype Frequency
5CGG/5CGG 0.5315CGG/5* 0.0335CGG/* 0.3565*/* 0.005*/* 0.075
* indicates all other haplotypes.
Table 8: Frequencies of the identified ALOX5 polymorphism diplotypes.
Diplotype Frequency
5CGG/5CGG 0.5314TGG/5CGG 0.2535CGG/6CGG 0.0864TGG/4TGG 0.0515CGG/5CAG 0.0314CGG/6TGG 0.0163CGA/5CGG 0.0056CGG/6CGG 0.0034CGG/5CGG 0.0034CGG/5CGA 0.0035CGG/6TGG 0.0033CGG/3CGG 0.0023CGG/5CGG 0.0023TGG/4TGG 0.0024CGG/4TGG 0.0024TGG/5CAG 0.0025CGG/7CGG 0.0025CGG/8CGG 0.0025CGG/5TGG 0.002
Polymorphisms are ordered ALOX5P→g.20C>T→g.8322G>A→g.50778G>A.Haplotype containing the common allele for all polymorphisms is shown in bold.Haplotypes containing the common ALOX5P 5-repeat allele but not the common allele of all three SNPs are underlined.
Table 10: Linkage disequilibrium (D') and the squared correlation (r2) values between alleles of DG8S737 and rs1447295.
Allele D' r2
-10 0.551 0.005-9 1.000 0.002-8 1.000 3.88 × 10⁻⁴
-7 0.326 0.001-6 0.160 0.002-5 0.812 0.055-4 0.802 0.403 [A]-3 0.345 0.043-2 0.417 0.004-1 1.000 0.0480 1.000 0.0221 0.972 0.0152 1.000 0.0083 0.866 0.0124 1.000 0.0065 1.000 0.0026 0.551 0.0057 0.326 0.001
Allele -1 is equivalent to the prostate cancer risk-associated -8 allele reported by Amundadottir et al. that had 22 repeats [58].
Page 11 of 20(page number not for citation purposes)
BMC Genetics 2008, 9:13 http://www.biomedcentral.com/1471-2156/9/13
Interestingly, the most common allele of the DG8S737microsatellite in this Indian cohort has been associatedwith an increased risk of prostate cancer in other popula-tions (-1 allele) [58]. However, whilst this allele has beenreported to be in strong LD with the minor A-allele of SNPrs1447295 in other populations, we have found that a dif-ferent allele (-4 allele) is in strong LD with the minor A-allele of SNP rs1447295 in this Indian cohort. The fre-quency of these polymorphisms is also still far higherthan the frequency of prostate cancer in the Asian Indianpopulation (10 per 100,000) [28,29]. Further studies onAsian Indian prostate cancer cases may allow for the truecausative variant to be identified.
The moderate frequency of the Hirschsprung disease-asso-ciated minor allele of RET g.9349G>A in the Indiancohort is in contrast with the relatively low frequency ofthe disease in India (2.8 per 10,000 births) [25]. However,the MAF of the CFH g.37989T>C and LOC387715g.205G>T SNPs in this Indian cohort is in agreement withthe low frequency of AMD in the Indian population [27].
Previous investigation suggests that the PAV "taster" hap-lotype is dominant over the other recessive haplotypesincluding the "non-taster" AVI haplotype as PAV/AVIindividuals were largely able to taste PTC [59,70]. We
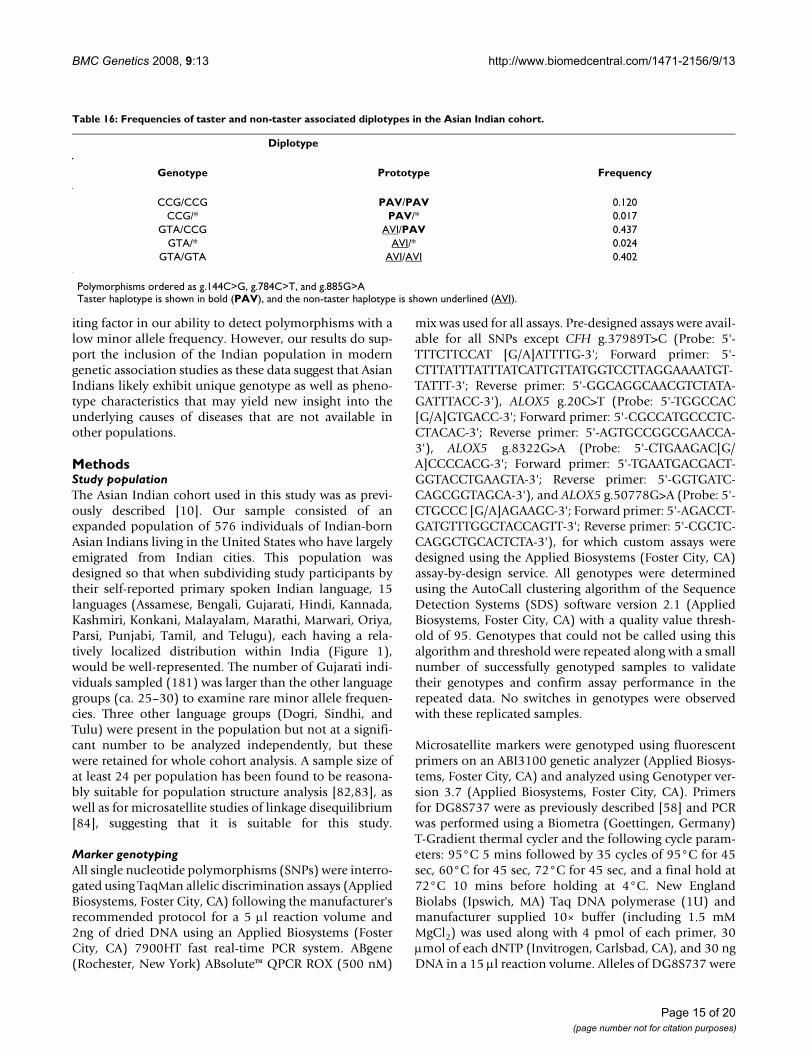
would therefore expect, based upon the frequencies of thedifferent haplotypes in this Indian cohort, that 57.4% ofthe population would be able to taste PTC (Table 16).This value is very close to the percentage of the populationidentified as able to taste PTC in previously reported stud-ies: Gujarat (57.1%), Kerala (51.6%), Maharashtra(54.9%, 57.6% and 63.7%), Tamil Nadu (59.2%), andUttar Pradesh (69.1%) [71-75]. These data would suggestthat the lower than expected number of Indians able totaste PTC when compared with the average of 75% inworldwide populations [76,77] is due to an increasedpresence of the non-taster haplotype in this population.In agreement with this notion, we observed that the fre-quency of the haplotype of the three SNPs in the TAS2R38gene associated with the ability to taste PTC in this Indiancohort is almost 20% lower than other world popula-tions.
Interestingly, the MAFs of the three TAS2R38 SNPs werefound to vary in the Indian groups in a cline that corre-lated with the latitudinal variation of the groups. TheMAFs of all three SNPs were higher in the more northerlyIndian groups than in the more southerly groups, suggest-ing a greater frequency of tasters in the former than the lat-ter. However, this trend was only observed in the otherworld populations for the TAS2R38 g.144G>C SNP, withthe trend reversed for both the TAS2R38 g.784C>T andg.885A>G SNPs.
One possible explanation for the differences between thetrends in the Indian groups and other world populationscould be the differential migration of non-Indian individ-uals into different parts of India during the course of itshistory. This could result in variation in the degree andsource of the admixture introduced into the different lan-guage groups such that their frequencies deviate from the
Table 14: Individual diplotypes of the identified TAS2R38 polymorphisms and their corresponding frequencies in the Asian Indian cohort.
Diplotype
Genotype Prototype Frequency
GTA/CCG AVI/PAV 0.437GTA/GTA AVI/AVI 0.402CCG/CCG PAV/PAV 0.120GCG/GTA AAV/AVI 0.017GTG/CCG AVV/PAV 0.009GCG/CCG AAV/PAV 0.007CTG/GTA PVV/AVI 0.005CCG/GTG PAV/AVV 0.002GTA/GCG AVI/AAV 0.002
Polymorphisms ordered as g.144C>G, g.784C>T, and g.885G>ATaster haplotype is shown in bold (PAV), and the non-taster haplotype is shown underlined (AVI).
Table 12: Diplotype frequencies for the -4 allele of the DG8S737 microsatellite and the alleles of rs1447295.
Diplotype Frequency
(*/C)/(*/C) 0.734(*/C)/(*/A) 0.109(*/C)/(-4/C) 0.026(*/C)/(-4/A) 0.109(*/A)/(-4/A) 0.007(-4/C)/(-4/A) 0.002(-4/A)/(-4/A) 0.012
* denotes all other DG8S737 alleles.
Table 13: TAS2R38 haplotypes, their corresponding prototypes, and frequencies in the Asian Indian cohort.
Haplotype
Genotype Prototype Frequency
GTA AVI 0.630CCG PAV 0.345GCG AAV 0.014GTG AVV 0.006CTG PVV 0.003CCA PAI 0.001
Polymorphisms ordered as g.144C>G, g.784C>T, and g.885G>ATaster amino acid haplotype (prototype) is shown in bold (PAV), and the non-taster haplotype is shown underlined (AVI).
Page 12 of 20(page number not for citation purposes)
BMC Genetics 2008, 9:13 http://www.biomedcentral.com/1471-2156/9/13
trends of other populations. There could also be selectivepressures that are unique to, more important in, or differ-ent in action in, India than the other world populations,and that also share a strong correlation with latitude.
It has been previously reported that balancing selection isacting on the TAS2R38 receptor gene, possibly due to thedifferent taster and non-taster alleles encoding receptorsthat recognize different, but equally important, ligands[60,77]. The latitudinal cline we have identified in ourIndian language groups with regards to the taster/non-taster allele frequencies could therefore be the result of thestrength of the selective pressures exerted by these ligandsaffecting individuals in the north and south of India dif-ferently, but for reasons that are distinct from other worldpopulations. Another possible selective pressure relates tobitter taste perception and the acceptance of foods con-taining increasing amounts of spice [78]. This is of partic-ular interest given that patterns of spice use have beenreported to both vary between populations and regions,and also to have a significant latitude correlation, wheremore spices tend to be used in warmer climates purport-edly due to their powerful antimicrobial action [79]. Theclimate differences between the more arid south of Indiaand the more mountainous north, and the incorporationof a lot of spices in Indian cooking, makes this a possibleexplanation for our latitudinal correlation. It has alsobeen proposed that the local adaptation in human bittertaste receptor genes is common and has been driven bythe fitness advantages of avoiding toxic, bitter compoundsfound in plants [80]. If the composition and abundanceof ligands to which the different taster and non-taster alle-les of the TAS2R38 gene vary geographically in India in acline associated with latitude, this could also explain ourobserved latitudinal correlation.
The MAF for the SLC24A5 g.13242G>A polymorphism(0.114) in the Indian population is closer to that of Cau-
casian European populations (0.000–0.020) than to thatof East Asians (0.979–0.989) and Africans (0.730–0.980)(see Additional file 1, Table S14). This is surprising giventhat, as a whole, people of Indian origin have darker skintone compared to Europeans. The East Asian and Africanpopulations share a similarly high frequency of the minorallele of the SLC24A5 g.13242G>A SNP, which in itself issurprising as East Asians are typically of much lighter skinthan Africans. It is also interesting that the t-test suggesteda greater similarity in MAF between Indians and those ofpopulations in the Americas (Puerto Rican, Mexican, andAmerindian), who are of a similar skin tone (Table 4). Thepresence of the minor allele of the SLC24A5 g.13242G>ASNP cannot therefore, completely explain Indian skincolor, making the investigation of polymorphisms inadditional genes implicated in skin pigmentation [81]essential to understanding the intricacies of their skincolor.
We have found that, with the exception of the TAS2R38haplotypes associated with the ability to taste PTC, the fre-quency of the disease/trait-associated minor alleles of thepolymorphisms investigated in this Indian cohort did notcorrelate with the reported disease/trait prevalence in theIndian population. This is unsurprising given that, withthe exception of the ability to taste PTC, all are known tobe complex diseases/traits that are the result of the com-bined effect of variants at multiple genetic loci and envi-ronmental factors. Variation in genetic backgrounds andenvironmental heterogeneity between populations willlikely have a modifying effect on the correlation of theallele frequency of polymorphisms with disease/traitprevalence as their contribution to the presentation of thedisease/trait varies. The degree of complexity betweenthese disease/traits will also vary, as some, such as CAD,are known to be highly complex whereas others, such asAMD, may be less complex. One might therefore notexpect the correlation of factors associated with CAD to be
Table 15: Correlation coefficients of the MAFs of the three TAS2R38 SNPs with latitude.
Polymorphism Population Adjusted Spearman Rank Correlation Score
Adjusted r2
g.144G>C AIP 0.535* 0.186Others 0.386* 0.126Others + AIP 0.369** 0.154
g.784C>T AIP 0.474 0.180Others -0.670** 0.429Others + AIP -0.305* 0.085
g.885A>G AIP 0.433 0.118Others -0.241 0.055Others + AIP 0.063 -0.017
* significant at 0.05, ** significant at 0.01AIP = Asian Indian populationOthers = data from non-Asian Indian populationsFor sample sizes, please see Additional file 1, Tables S18, S19, §20, for g.144G>C, g.784C>T, and g.885A>G, respectively.
Page 13 of 20(page number not for citation purposes)

BMC Genetics 2008, 9:13 http://www.biomedcentral.com/1471-2156/9/13
as strong as those associated with AMD, and therefore thelack of a strong correlation between many of these poly-morphisms and their respective complex disease/traitprevalence most likely indicates that the environmentaland/or other genetic factors make a stronger contributionto the presentation of the disease/trait in Indians than dothese variants alone. Interestingly, the two polymor-phisms associated with AMD (CFH g.37989T>C&LOC387715 g.205G>T), whilst not showing strong cor-relation between their disease-associated MAF andreported disease prevalence in the Indian population, didshow a frequency that correlated with the MAF of theseSNPs in other populations and the prevalence of AMD inthose populations, suggesting that they may share similarrisk factors.
ConclusionThe Asian Indian population represents a large popula-tion within which many complex-trait disorders are foundat a high frequency. The high prevalence of endogamy andrelatively low admixture present in this population distin-guishes it from most other populations presently used ingenetic studies as it represents a distinct genetic back-ground that is largely unaffected by outside admixture. Insome cases, such as coronary artery disease, Asian Indiansexhibit unique phenotypic characteristics that distinguishthem from the other populations, suggesting that uniquecausative factors underlie this and possibly other relateddiseases. Our results suggest that caution should be usedwhen treating the Asian Indian population as a singlepopulation in genetic studies using SNPs. The overall dif-ference in minor allele frequency of the polymorphismsinvestigated was small between the different languagegroups, but some inter-group variation was observed.However, caution is warranted in interpreting our resultsas whilst our Indian cohort is likely to be reasonably rep-resentative of first-generation individuals of Asian Indiandescent currently residing in the United States, individualsfrom relatively mobile populations and those of highercaste and socioeconomic status are likely overrepresentedwithin this cohort. Such individuals likely do not providea random sample of the source populations in India andtherefore if variables such as caste and socioeconomic sta-tus do have a significant effect on genotype frequency inIndia, this will not be reflected in these results. Addition-ally, if higher caste is correlated with a European or west-ern Asian component of ancestry, a sample in the UnitedStates may be biased towards finding a greater similarityof populations from India to those of the Europe/MiddleEast rather than to those of East Asia [10], as we have dis-covered for many of the polymorphisms reported here.We must also use caution when interpreting the variationat the PTPN22 g.1825C>T and ALOX5 g.50778G>A locibetween the 15 language groups, as the small sample sizefor each group, with the exception of the Gujarati, is a lim-
The correlation between latitude and minor allele frequency of the TAS2R38 SNPs (A) g.144G>C, (B) g.784C>T, and (C) g.885A>GFigure 3The correlation between latitude and minor allele frequency of the TAS2R38 SNPs (A) g.144G>C, (B) g.784C>T, and (C) g.885A>G. Correlation coefficients for each graph can be found in Table 15.
Page 14 of 20(page number not for citation purposes)
BMC Genetics 2008, 9:13 http://www.biomedcentral.com/1471-2156/9/13
iting factor in our ability to detect polymorphisms with alow minor allele frequency. However, our results do sup-port the inclusion of the Indian population in moderngenetic association studies as these data suggest that AsianIndians likely exhibit unique genotype as well as pheno-type characteristics that may yield new insight into theunderlying causes of diseases that are not available inother populations.
MethodsStudy populationThe Asian Indian cohort used in this study was as previ-ously described [10]. Our sample consisted of anexpanded population of 576 individuals of Indian-bornAsian Indians living in the United States who have largelyemigrated from Indian cities. This population wasdesigned so that when subdividing study participants bytheir self-reported primary spoken Indian language, 15languages (Assamese, Bengali, Gujarati, Hindi, Kannada,Kashmiri, Konkani, Malayalam, Marathi, Marwari, Oriya,Parsi, Punjabi, Tamil, and Telugu), each having a rela-tively localized distribution within India (Figure 1),would be well-represented. The number of Gujarati indi-viduals sampled (181) was larger than the other languagegroups (ca. 25–30) to examine rare minor allele frequen-cies. Three other language groups (Dogri, Sindhi, andTulu) were present in the population but not at a signifi-cant number to be analyzed independently, but thesewere retained for whole cohort analysis. A sample size ofat least 24 per population has been found to be reasona-bly suitable for population structure analysis [82,83], aswell as for microsatellite studies of linkage disequilibrium[84], suggesting that it is suitable for this study.
Marker genotypingAll single nucleotide polymorphisms (SNPs) were interro-gated using TaqMan allelic discrimination assays (AppliedBiosystems, Foster City, CA) following the manufacturer'srecommended protocol for a 5 µl reaction volume and2ng of dried DNA using an Applied Biosystems (FosterCity, CA) 7900HT fast real-time PCR system. ABgene(Rochester, New York) ABsolute™ QPCR ROX (500 nM)
mix was used for all assays. Pre-designed assays were avail-able for all SNPs except CFH g.37989T>C (Probe: 5'-TTTCTTCCAT [G/A]ATTTTG-3'; Forward primer: 5'-CTTTATTTATTTATCATTGTTATGGTCCTTAGGAAAATGT-TATTT-3'; Reverse primer: 5'-GGCAGGCAACGTCTATA-GATTTACC-3'), ALOX5 g.20C>T (Probe: 5'-TGGCCAC[G/A]GTGACC-3'; Forward primer: 5'-CGCCATGCCCTC-CTACAC-3'; Reverse primer: 5'-AGTGCCGGCGAACCA-3'), ALOX5 g.8322G>A (Probe: 5'-CTGAAGAC[G/A]CCCCACG-3'; Forward primer: 5'-TGAATGACGACT-GGTACCTGAAGTA-3'; Reverse primer: 5'-GGTGATC-CAGCGGTAGCA-3'), and ALOX5 g.50778G>A (Probe: 5'-CTGCCC [G/A]AGAAGC-3'; Forward primer: 5'-AGACCT-GATGTTTGGCTACCAGTT-3'; Reverse primer: 5'-CGCTC-CAGGCTGCACTCTA-3'), for which custom assays weredesigned using the Applied Biosystems (Foster City, CA)assay-by-design service. All genotypes were determinedusing the AutoCall clustering algorithm of the SequenceDetection Systems (SDS) software version 2.1 (AppliedBiosystems, Foster City, CA) with a quality value thresh-old of 95. Genotypes that could not be called using thisalgorithm and threshold were repeated along with a smallnumber of successfully genotyped samples to validatetheir genotypes and confirm assay performance in therepeated data. No switches in genotypes were observedwith these replicated samples.
Microsatellite markers were genotyped using fluorescentprimers on an ABI3100 genetic analyzer (Applied Biosys-tems, Foster City, CA) and analyzed using Genotyper ver-sion 3.7 (Applied Biosystems, Foster City, CA). Primersfor DG8S737 were as previously described [58] and PCRwas performed using a Biometra (Goettingen, Germany)T-Gradient thermal cycler and the following cycle param-eters: 95°C 5 mins followed by 35 cycles of 95°C for 45sec, 60°C for 45 sec, 72°C for 45 sec, and a final hold at72°C 10 mins before holding at 4°C. New EnglandBiolabs (Ipswich, MA) Taq DNA polymerase (1U) andmanufacturer supplied 10× buffer (including 1.5 mMMgCl2) was used along with 4 pmol of each primer, 30µmol of each dNTP (Invitrogen, Carlsbad, CA), and 30 ngDNA in a 15 µl reaction volume. Alleles of DG8S737 were
Table 16: Frequencies of taster and non-taster associated diplotypes in the Asian Indian cohort.
Diplotype
Genotype Prototype Frequency
CCG/CCG PAV/PAV 0.120CCG/* PAV/* 0.017
GTA/CCG AVI/PAV 0.437GTA/* AVI/* 0.024
GTA/GTA AVI/AVI 0.402
Polymorphisms ordered as g.144C>G, g.784C>T, and g.885G>ATaster haplotype is shown in bold (PAV), and the non-taster haplotype is shown underlined (AVI).
Page 15 of 20(page number not for citation purposes)
BMC Genetics 2008, 9:13 http://www.biomedcentral.com/1471-2156/9/13
assigned based upon the change in the number of repeatsaway from that of the reference sequence in the NCBIdatabase (23 AC dinucleotide repeats; Acc. #NT_008046.15: 148848–149016).
Primers for the ALOX5 promoter microsatellite (ALOX5P)were as previously described [85] but with the inclusion ofthe GTGTCTT pig-tail [86] and PCR was performed in anApplied Biosystems (Foster City, CA) GeneAmp 9700thermal cycler using the following cycle parameters: 95°C12 mins followed by 10 cycles of 94°C for 1 min, 68°Cfor 2 min, followed by 25 cycles of 94°C for 30 sec, 60°Cfor 30 sec, 72°C for 45 sec, and a final hold at 72°C 5mins before holding at 4°C. Applied Biosystems (FosterCity, CA) AmpliTaq Gold DNA polymerase (1.2U) andmanufacturer supplied 10× buffer was used along with 1.5mM MgCl2, 2% DMSO, 400 nmol of each primer, 30µmol of dATP, dUTP, and dCTP (Invitrogen, Carlsbad,CA), 62.5 µmol 7-deaza-dGTP (New England Biolabs, Ips-wich, MA), and 30 ng DNA in a 25 µl reaction volume.Labels for the alleles of ALOX5P were assigned basedupon the number of hexanucleotide Sp1-binding sitesthat were present.
Haplotype analysisHaplotype phase was estimated for the TAS2R38g.144G>C, g.784C>T, and g.885A>G SNPs using fast-PHASE version 1.1.4 [87] using the following settings; 50random starts of the EM algorithm, 50 iterations of theEM algorithm, 200 haplotypes sampled from the "poste-rior" distribution obtained from a particular random startof the EM algorithm, and haplotype frequencies estimatedby Monte Carlo methods by sampling from the observedgenotypes 10,000 times per diploid individual. As fast-PHASE is unable to analyze microsatellite data, PHASEversion 2.1 [88,89] was used to estimate haplotype phasefor the ALOX5P and the three coding SNPs (g.20C>T,g.8322G>A, and g.50778G>A) and also for DG8S737 andrs1447295 using the following settings; a burn-in of25,000 iterations followed by 10,000 main iterations witha thinning interval of 100 iterations. The final run used 10times this number of burn-in and main iterations. Haplo-types were constructed using the hybrid haplotype recon-struction model that uses a model that ignores the decayof LD with distance [88] for preliminary computations,and a different model that makes explicit allowance forthe decay of LD with distance [90] for the final computa-tions.
Statistical analysisAll statistics were calculated in R version 2.3.1 [91] unlessotherwise stated. To test that all SNPs are in equilibriumwithin the Asian Indian cohort, a Hardy-Weinberg equi-librium (HWE) constant was calculated for each polymor-phism using the HWE.test function in the genetics R-
package [92]. A Pearson's χ2 test with simulated p-value(based on 10000 iterations) was calculated for all HWEstatistics as this avoids the reliance on the assumptions ofthe underlying Chi-square approximation, which is par-ticularly important when some allele pairs have smallcounts [92]. An HWE score of 0 equates to the polymor-phism being in complete Hardy-Weinberg equilibrium,and a score of 1 equates to the polymorphism being incomplete Hardy-Weinberg disequilibrium. A standarderror (SE) for the estimated allele frequency for each SNPwas calculated by using the formula: SE = s/√n, where s isthe estimated standard deviation and n is the size of thesample.
Weir and Cockerham FST test statistics [93] were calculatedfor all SNP data as previously described [94] using R tomeasure the effect of population subdivision and theoverall genetic divergence among these groups, where anFST of 0 means no genetic divergence, and 1 meansextreme genetic divergence, between the groups, and anFST of up to 0.05 represents a relatively small level ofgenetic differentiation. Weir and Cockerham FST test statis-tics for the microsatellite data were calculated using FSTATversion 2.9.3.2 [95]. To estimate the significance of theseFST values, a probability value (p) was calculated for eachFST value from a χ2 distribution using the pchisq functionin the Stats R-package using 14 degrees of freedom(number of Indian language groups minus 1) [96]. As it ispossible for the unbiased estimate of FST used here toassume negative values, which does not have a biologicalinterpretation, we set negative values of FST to 0 [94].
As it was unrealistic to assume that the variance within theAsian Indian cohort is equal to that of other populations,a Welch modified two-sample t-test with unequal vari-ances was calculated between the minor allele frequencyin the Indian cohort and those previously reported forother populations. This was performed using the t.testfunction in the Stats R-package with a 95% confidenceinterval to test whether or not the minor allele frequencyin the Asian Indian cohort were significantly differentfrom those of other populations. To give as accurate a rep-resentation of the MAF in the Asian Indian cohort, theMAF of each group was included in this analysis. Data onother populations was obtained from prior publicationsand the National Center for Biotechnology Information's(NCBI) dbSNP database [97,98]. These populations weregrouped into the following geographical regions for com-parison: Africa, Asia (including Central, Southern, East-ern, and South-East Asian populations), Americas (nativepopulations of South and Central America, and nativepopulations of North America), Europe (including non-native European American populations, and Russia), Oce-ania (Australia, New Zealand, and the Pacific islands),except for the analysis of Cyp3A5 g.6980G>A and AGT
Page 16 of 20(page number not for citation purposes)
BMC Genetics 2008, 9:13 http://www.biomedcentral.com/1471-2156/9/13
g.802C>T where there were sufficient Asian populationsto allow Asia to be split into Central/South Asia and EastAsia (East and South-Eastern Asia), and there were alsosufficient populations to include a Middle East.
To test whether the polymorphisms associated withatherosclerosis (ALOX5P and the three ALOX5 coding-SNPs g.20C>T, g.8322G>A, and g.50778G>A), ability totaste PTC (the three TAS2R38 coding-SNPs g.144G>C,g.784C>T, and g.885A>G), and prostate cancer (theDG8S737 microsatellite and rs1447295 SNP), were inlinkage disequilibrium, the linkage disequilibrium meas-ure (D') and the squared correlation measure of linkagedisequilibrium (r2) were calculated between the respectivepolymorphisms using the java based linkage disequilib-rium plotter JLIN [99]. For the ALOX5P and DG8S737microsatellite markers, each allele was tested individuallywith all other alleles collapsed into a single "super-allele".
Adjusted Spearman's rank correlation coefficients andsquared correlation coefficients (r2) for the association ofthe CYP3A5 g.6980G>A, AGT g.802C>T, and GNB3g.825C>T SNPs, and the TAS2R38 g.144G>C, g.784C>T,and g.885A>G SNPs, with absolute latitude were calcu-lated using SPSS version 15 (SPSS Inc.; Chicago, IL).Graphs of their MAF against absolute latitude (Figures 2&3) were plotted using SigmaPlot version 9 (Systat Soft-ware, Inc.; San Jose, CA).
AbbreviationsAge-related macular degeneration (AMD); Coronaryartery disease (CAD); Hardy-Weinberg equilibrium(HWE); Linkage disequilibrium (LD); Minor allele fre-quency (MAF); Phenylthiocarbamide (PTC).
Competing interestsThe author(s) declare that they have no competing inter-ests.
Authors' contributionsTJP and PIP conceived the study. TJP and NM performedthe genotyping. TJP performed the data analysis withassistance from DVC AD and DW assisted with the analy-sis of the CYP3A5 and AGT polymorphisms, and HAassisted with the genotyping of the ALOX5 polymor-phisms. The paper was written primarily by TJP and PIP,with assistance from DVC, HA, and AD.
Additional material
AcknowledgementsThe authors would like to Dr Noah Rosenberg (University of Michigan) for his helpful comments in the preparation of this manuscript. This investiga-tion was supported by a pilot grant award from the Center of Excellence in Genomic Science, University of Southern California (to T.J.P.) and was con-ducted in a facility constructed with support from Research Facilities Improvement Program Grant Number C06 (RR10600-01, CA62528-01, RR14514-01) from the National Center for Research Resources, National Institutes of Health. A.D. and D.W. were partially supported by National Institute of Health grant GM61393 and H.A. was supported by National Institute of Health grant R01 HL079353.
References1. Population Reference Bureau [http://www.prb.org]2. Bittles AH: Endogamy, consanguinity and community disease
profiles. Community Genet 2005, 8(1):17-20.3. Mosely C, Asher RE: Atlas of the World's Languages. 2nd edi-
tion. London , Routledge; 2007. 4. Thapar R: A history of India: Volume I. London, UK , Penguin
Books.; 1990. 5. Taraporevala S: Zoroastrians of India. Parsis: A Photographic
Journey. Mumbai, India , Good Books; 2000. 6. Taraporevala S: Parsis: The Zoroastrians of India: A Photo-
graphic Journey. Mumbai, India , Good Books; 2004. 7. Qamar R, Ayub Q, Mohyuddin A, Helgason A, Mazhar K, Mansoor A,
Zerjal T, Tyler-Smith C, Mehdi SQ: Y-chromosomal DNA varia-tion in Pakistan. Am J Hum Genet 2002, 70(5):1107-1124.
8. Quintana-Murci L, Chaix R, Wells RS, Behar DM, Sayar H, Scozzari R,Rengo C, Al-Zahery N, Semino O, Santachiara-Benerecetti AS, CoppaA, Ayub Q, Mohyuddin A, Tyler-Smith C, Qasim Mehdi S, Torroni A,McElreavey K: Where west meets east: the complex mtDNAlandscape of the southwest and Central Asian corridor. Am JHum Genet 2004, 74(5):827-845.
9. Di Rienzo A, Hudson RR: An evolutionary framework for com-mon diseases: the ancestral-susceptibility model. Trends Genet2005, 21(11):596-601.
10. Rosenberg NA, Mahajan S, Gonzales-Quevedo C, Nino-Rosales L,Ninis V, Das P, Hedge M, Molinari L, Zapata G, Weber JL, BelmontJW, Patel PI: Low levels of genetic divergence across popula-tions of India. PLoS Genet 2006, 2(12):e215.
11. Wilson PW, Christiansen JC, Anderson KM, Kannel WB: Impact ofnational guidelines for cholesterol risk factor screening. TheFramingham Offspring Study. J Am Medical Assoc 1989,262(1):41-44.
12. Enas EA: Prevalence of coronary heart disease and its risk fac-tors in Asian Indian migrants to the United States. Proc IntSymp Atherosclerosis 1991:6-11.
Additional file 1Supplementary Tables 4–20. Allele frequencies of the 17 SNPs in other worldwide populations.Click here for file[http://www.biomedcentral.com/content/supplementary/1471-2156-9-13-S1.pdf]
Additional file 2Supplementary Tables 1–3. Genotype frequencies of the 17 SNPs (Table S1), and the ALOX5P (Table S2) and DG8S737 (Table S3) microsatel-lites.Click here for file[http://www.biomedcentral.com/content/supplementary/1471-2156-9-13-S2.pdf]
Page 17 of 20(page number not for citation purposes)
BMC Genetics 2008, 9:13 http://www.biomedcentral.com/1471-2156/9/13
13. Enas EA, Mehta J: Malignant coronary artery disease in youngAsian Indians: thoughts on pathogenesis, prevention, andtherapy. Coronary Artery Disease in Asian Indians (CADI)study. Clin Cardiol 1995, 18(3):131-135.
14. Enas EA, Garg A, Davidson MA, Nair VM, Huet BA, Yusuf S: Coro-nary heart disease and its risk factors in first-generationimmigrant Asian Indians to the United States of America.Indian Heart J 1996, 48(4):343-353.
15. Enas EA, Senthilkumar A: Coronary Artery Disease in AsianIndians: An Update and Review. The Internet Journal of Cardiology2001, 1(2):.
16. Gupta R, Prakash H, Majumdar S, Sharma S, Gupta VP: Prevalenceof coronary heart disease and coronary risk factors in anurban population of Rajasthan. Indian Heart J 1995,47(4):331-338.
17. Deepa M, Farooq S, Datta M, Deepa R, Mohan V: Prevalence ofmetabolic syndrome using WHO, ATPIII and IDF definitionsin Asian Indians: the Chennai Urban Rural EpidemiologyStudy (CURES-34). Diabetes Metab Res Rev 2007, 23(2):127-134.
18. Gupta R: Meta-analysis of prevalence of hypertension in India.Indian Heart J 1997, 49(1):43-48.
19. Kearney PM, Whelton M, Reynolds K, Whelton PK, He J: World-wide prevalence of hypertension: a systematic review. JHypertens 2004, 22(1):11-19.
20. Gupta R, Misra A: Type 2 Diabetes in India: Regional Dispari-ties. Br J Diabetes Vasc Dis 2007, 7(1):12-16.
21. Mohan V, Deepa M, Deepa R, Shanthirani CS, Farooq S, Ganesan A,Datta M: Secular trends in the prevalence of diabetes andimpaired glucose tolerance in urban South India--the Chen-nai Urban Rural Epidemiology Study (CURES-17). Diabetolo-gia 2006, 49(6):1175-1178.
22. Ramachandran A, Snehalatha C, Latha E, Vijay V, Viswanathan M: Ris-ing prevalence of NIDDM in an urban population in India.Diabetologia 1997, 40(2):232-237.
23. Ramachandran A, Snehalatha C, Kapur A, Vijay V, Mohan V, Das AK,Rao PV, Yajnik CS, Prasanna Kumar KM, Nair JD: High prevalenceof diabetes and impaired glucose tolerance in India: NationalUrban Diabetes Survey. Diabetologia 2001, 44(9):1094-1101.
24. Hirschsprung H: Stuhltragheit Neugeborener in Folge von Dil-atation und Hypertrophie des Colons. Jahrb Kinderheilk 1888,27:1-7.
25. Watanatittan S, Suwatanaviroj A, Niramis R, Limprutithum T: Hir-schsprung's disease : Diagnostic experience. Bulletin of theDepartment of Medical Services 1991, 16(1):9-20.
26. Streiff EB, Babel J: La senescence de la retine. Prog Ophthal 1963,13:1-75.
27. Krishnaiah S, Das T, Nirmalan PK, Nutheti R, Shamanna BR, Rao GN,Thomas R: Risk Factors for Age-Related Macular Degenera-tion: Findings from the Andhra Pradesh Eye Disease Study inSouth India. Invest Ophthalmol Vis Sci 2005, 46(12):4442-4449.
28. Hsing AW, Tsao L, Devesa SS: International trends and patternsof prostate cancer incidence and mortality. Int J Cancer 2000,85(1):60-67.
29. Quinn M, Babb P: Patterns and trends in prostate cancer inci-dence, survival, prevalence and mortality. Part I: interna-tional comparisons. BJU International 2002, 90(2):162-173.
30. Ramachandran A, Snehalatha C, Abdul Khader OM, Joseph TA,Viswanathan M: Prevalence of childhood diabetes in an urbanpopulation in south India. Diabetes Res Clin Pract 1992,17(3):227-231.
31. Ramachandran A, Snehalatha C, Krishnaswamy CV: Incidence ofIDDM in children in urban population in Southern India. Dia-betes Res Clin Pract 1996, 34(2):79-82.
32. Amos AF, McCarty DJ, Zimmet P: The rising global burden of dia-betes and its complications: estimates and projections to theyear 2010. Diabet Med 1997, 14 Suppl 5:S1-85.
33. Garcia-Barcelo MM, Sham MH, Lui VC, Chen BL, Song YQ, Lee WS,Yung SK, Romeo G, Tam PK: Chinese patients with sporadicHirschsprung's disease are predominantly represented by asingle RET haplotype. J Med Genet 2003, 40(11):e122.
34. Gronberg H: Prostate cancer epidemiology. Lancet 2003,361(9360):859-864.
35. Kim UK, Breslin PAS, Reed D, Drayna D: Genetics of HumanTaste Perception. J Dent Res 2004, 83(6):448-453.
36. Meza-Valencia BE, de Lorimier AJ, Person DA: Hirschsprung dis-ease in the U.S. associated Pacific Islands: more commonthan expected. Hawaii Med J 2005, 64(4):96-98.
37. Vinereanu D: Risk factors for atherosclerotic disease: presentand future. Herz 2006, 31 Suppl 3:5-24.
38. Young JH: Evolution of blood pressure regulation in humans.Curr Hypertens Rep 2007, 9(1):13-18.
39. Klein R: Overview of progress in the epidemiology of age-related macular degeneration. Ophthalmic Epidemiol 2007,14(4):184-187.
40. Asleh SA, Chowers I: Ethnic background as a risk factor foradvanced age-related macular degeneration in Israel. Isr MedAssoc J 2007, 9(9):656-658.
41. World Health Organization [http://www.who.int/]42. Procopiou M, Philippe J: The metabolic syndrome and type 2
diabetes: epidemiological figures and country specificities.Cerebrovasc Dis 2005, 20(Suppl 1):2-8.
43. Wild S, Sicree R, Roglic G, Green A, King H: Global Prevalence ofDiabetes - Estimates for the year 2000 and projections for2030. Diabetes Care 2004, 27(5):1047-1053.
44. Motulsky AG, Brunzell JD: Genetics of coronary atherosclerosis.In The genetic basis of common diseases Second edition edition. Editedby: King RA, Rotter JI, Motulsky AG. New York, NY , Oxford Univer-sity Press; 2002:105 -1126.
45. Gillespie KM: Type 1 diabetes: pathogenesis and prevention.Canadian Med Assoc J 2006, 175(2):165-170.
46. Wolford JK, Vozarova de Courten B: Genetic basis of type 2 dia-betes mellitus: implications for therapy. Treat Endocrinol 2004,3(4):257-267.
47. Staessen JA, Wang J, Bianchi G, Birkenhager WH: Essential hyper-tension. The Lancet 2003, 361(9369):1629-1641.
48. Bostwick DG, Burke HB, Djakiew D, Euling S, Ho S, Landolph J, Mor-rison H, Sonawane B, Shifflett T, Waters DJ, Timms B: Human pros-tate cancer risk factors. Cancer 2004, 101(S10):2371-2490.
49. Chamberlain M, Baird P, Dirani M, Guymer R: Unraveling A Com-plex Genetic Disease: Age-related Macular Degeneration.Surv Ophthalmol 2006, 51(6):576-586.
50. Thompson EE, Kuttab-Boulos H, Witonsky D, Yang L, Roe BA, DiRienzo A: CYP3A variation and the evolution of salt-sensitiv-ity variants. Am J Hum Genet 2004, 75(6):1059-1069.
51. Roy JN, Lajoie J, Zijenah LS, Barama A, Poirier C, Ward BJ, Roger M:CYP3A5 genetic polymorphims in different ethnic popula-tions. Drug Metab Dispos 2005, 33(7):884-887.
52. Siffert W, Forster P, Jockel KH, Mvere DA, Brinkmann B, Naber C,Crookes R, Heyns ADP, Epplen JT, Fridey JOY, Freedman BI, MullerN, Stolke D, Sharma AM, Moutaery KA, Grosse-Wilde H, BuerbaumB, Ehrlich T, Ahmad HR, Horsthemke B, Du Toit ED, Tiilikainen A,Ge J, Wang Y, Yang D, Husing J, Rosskopf D: Worldwide EthnicDistribution of the G Protein {beta}3 Subunit 825T Alleleand Its Association with Obesity in Caucasian, Chinese, andBlack African Individuals. J Am Soc Nephrol 1999,10(9):1921-1930.
53. Siffert W: G protein {beta}3 subunit 825T allele, hypertension,obesity, and diabetic nephropathy. Nephrol Dial Transplant 2000,15(9):1298-1306.
54. Rosskopf D, Manthey I, Siffert W: Identification and ethnic distri-bution of major haplotypes in the gene GNB3 encoding theG-protein beta3 subunit. Pharmacogenetics 2002, 12(3):209-220.
55. Beeks E, Kessels AG, Kroon AA, van der Klauw MM, de Leeuw PW:Genetic predisposition to salt-sensitivity: a systematicreview. J Hypertens 2004, 22(7):1243-1249.
56. Young JH, Chang YPC, Kim JDO, Chretien JP, Klag MJ, Levine MA,Ruff CB, Wang NY, Chakravarti A: Differential Susceptibility toHypertension Is Due to Selection during the Out-of-AfricaExpansion. PLoS Genetics 2005, 1(6):e82.
57. Dwyer JH, Allayee H, Dwyer KM, Fan J, Wu H, Mar R, Lusis AJ,Mehrabian M: Arachidonate 5-lipoxygenase promoter geno-type, dietary arachidonic acid, and atherosclerosis. New EnglJ Med 2004, 350(1):29-37.
58. Amundadottir LT, Sulem P, Gudmundsson J, Helgason A, Baker A,Agnarsson BA, Sigurdsson A, Benediktsdottir KR, Cazier JB, Sainz J,Jakobsdottir M, Kostic J, Magnusdottir DN, Ghosh S, Agnarsson K,Birgisdottir B, Le Roux L, Olafsdottir A, Blondal T, Andresdottir M,Gretarsdottir OS, Bergthorsson JT, Gudbjartsson D, Gylfason A,Thorleifsson G, Manolescu A, Kristjansson K, Geirsson G, Isaksson H,Douglas J, Johansson JE, Balter K, Wiklund F, Montie JE, Yu X, Suarez
Page 18 of 20(page number not for citation purposes)
http://www.ncbi.nlm.nih.gov/entrez/query.fcgi?cmd=Retrieve&db=PubMed&dopt=Abstract&list_uids=7743682
http://www.ncbi.nlm.nih.gov/entrez/query.fcgi?cmd=Retrieve&db=PubMed&dopt=Abstract&list_uids=7743682
http://www.ncbi.nlm.nih.gov/entrez/query.fcgi?cmd=Retrieve&db=PubMed&dopt=Abstract&list_uids=7743682
http://www.ncbi.nlm.nih.gov/entrez/query.fcgi?cmd=Retrieve&db=PubMed&dopt=Abstract&list_uids=8908818
http://www.ncbi.nlm.nih.gov/entrez/query.fcgi?cmd=Retrieve&db=PubMed&dopt=Abstract&list_uids=8908818
http://www.ncbi.nlm.nih.gov/entrez/query.fcgi?cmd=Retrieve&db=PubMed&dopt=Abstract&list_uids=8557274
http://www.ncbi.nlm.nih.gov/entrez/query.fcgi?cmd=Retrieve&db=PubMed&dopt=Abstract&list_uids=8557274
http://www.ncbi.nlm.nih.gov/entrez/query.fcgi?cmd=Retrieve&db=PubMed&dopt=Abstract&list_uids=8557274
http://www.ncbi.nlm.nih.gov/entrez/query.fcgi?cmd=Retrieve&db=PubMed&dopt=Abstract&list_uids=8557274
http://www.ncbi.nlm.nih.gov/entrez/query.fcgi?cmd=Retrieve&db=PubMed&dopt=Abstract&list_uids=9130424
http://www.ncbi.nlm.nih.gov/entrez/query.fcgi?cmd=Retrieve&db=PubMed&dopt=Abstract&list_uids=9049486
http://www.ncbi.nlm.nih.gov/entrez/query.fcgi?cmd=Retrieve&db=PubMed&dopt=Abstract&list_uids=9049486
http://www.ncbi.nlm.nih.gov/entrez/query.fcgi?cmd=Retrieve&db=PubMed&dopt=Abstract&list_uids=1425162
http://www.ncbi.nlm.nih.gov/entrez/query.fcgi?cmd=Retrieve&db=PubMed&dopt=Abstract&list_uids=1425162
http://www.ncbi.nlm.nih.gov/entrez/query.fcgi?cmd=Retrieve&db=PubMed&dopt=Abstract&list_uids=9031809
http://www.ncbi.nlm.nih.gov/entrez/query.fcgi?cmd=Retrieve&db=PubMed&dopt=Abstract&list_uids=9031809
http://www.ncbi.nlm.nih.gov/entrez/query.fcgi?cmd=Retrieve&db=PubMed&dopt=Abstract&list_uids=9450510
http://www.ncbi.nlm.nih.gov/entrez/query.fcgi?cmd=Retrieve&db=PubMed&dopt=Abstract&list_uids=9450510
BMC Genetics 2008, 9:13 http://www.biomedcentral.com/1471-2156/9/13
BK, Ober C, Cooney KA, Gronberg H, Catalona WJ, Einarsson GV,Barkardottir RB, Gulcher JR, Kong A, Thorsteinsdottir U, StefanssonK: A common variant associated with prostate cancer inEuropean and African populations. Nat Genet 2006,38(6):652-658.
59. Kim U, Jorgenson E, Coon H, Leppert M, Risch N, Drayna D: Posi-tional cloning of the human quantitative trait locus underly-ing taste sensitivity to phenylthiocarbamide. Science 2003,299(5610):1221-1225.
60. Wooding S, Kim UK, Bamshad MJ, Larsen J, Jorde LB, Drayna D: Nat-ural selection and molecular evolution in PTC, a bitter-tastereceptor gene. Am J Hum Genet 2004, 74(4):637-646.
61. Ranade K, Chang MS, Ting CT, Pei D, Hsiao CF, Olivier M, Pesich R,Hebert J, Chen YD, Dzau VJ, Curb D, Olshen R, Risch N, Cox DR,Botstein D: High-throughput genotyping with single nucle-otide polymorphisms. Genome Res 2001, 11(7):1262-1268.
62. Bamshad M, Kivisild T, Watkins WS, Dixon ME, Ricker CE, Rao BB,Naidu JM, Prasad BVR, Reddy PG, Rasanayagam A, Papiha SS, VillemsR, Redd AJ, Hammer MF, Nguyen SV, Carroll ML, Batzer MA, JordeLB: Genetic Evidence on the Origins of Indian Caste Popula-tions. Genome Res 2001, 11(6):994-1004.
63. Basu A, Mukherjee N, Roy S, Sengupta S, Banerjee S, Chakraborty M,Dey B, Roy M, Roy B, Bhattacharyya NP, Roychoudhury S, MajumderPP: Ethnic India: A Genomic View, With Special Reference toPeopling and Structure. Genome Res 2003, 13(10):2277-2290.
64. Partha PM: People of India: Biological diversity and affinities.Evolutionary Anthropology: Issues, News, and Reviews 1998,6(3):100-110.
65. Cann RL: Genetic Clues to Dispersal in Human Populations:Retracing the Past from the Present. Science 2001,291(5509):1742-1748.
66. Gupta R, Gupta VP, Sarna M, Bhatnagar S, Thanvi J, Sharma V, SinghAK, Gupta JB, Kaul V: Prevalence of coronary heart disease andrisk factors in an urban Indian population: Jaipur HeartWatch-2. Indian Heart J 2002, 54:59-66.
67. Bodhini D, Radha V, Dhar M, Narayani N, Mohan V: Thers12255372(G/T) and rs7903146(C/T) polymorphisms of theTCF7L2 gene are associated with type 2 diabetes mellitus inAsian Indians. Metabolism 2007, 56(9):1174-1178.
68. Chandak GR, Janipalli CS, Bhaskar S, Kulkarni SR, Mohankrishna P,Hattersley AT, Frayling TM, Yajnik CS: Common variants in theTCF7L2 gene are strongly associated with type 2 diabetesmellitus in the Indian population. Diabetologia 2007,50(1):63-67.
69. Ray D, Tomar N, Gupta N, Goswami R: Protein tyrosine phos-phatase non-receptor type 22 (PTPN22) gene R620W vari-ant and sporadic idiopathic hypoparathyroidism in AsianIndians. Int J Immunogenet 2006, 33(4):237-240.
70. Prodi DA, Drayna D, Forabosco P, Palmas MA, Maestrale GB, PirasD, Pirastu M, Angius A: Bitter Taste Study in a SardinianGenetic Isolate Supports the Association of Phenylthiocar-bamide Sensitivity to the TAS2R38 Bitter Receptor Gene.Chem Senses 2004, 29(8):697-702.
71. Ghoshi AK: ABO blood groups and PTC taste sensitivityamong the Kota of Nilgiri Hills. Hum Hered 1973, 23(1):78-82.
72. Hakim SM, Baxi AJ, Balakrishnan V, Kulkarni KV, Rao SS, Jhala HI:Blood groups, secretor status and ability to taste phenylthi-ocarbamide in some Muslim groups. Hum Hered 1973,23(1):72-77.
73. Kapoor AK, Seth PK: Taste sensitivity to PTC in the Rajputs ofNarendra Nagar (Uttar Pradesh, India). Hum Hered 1981,31(2):124-125.
74. Mathur VD, Mathur S, Bahadur B: Taste deficiency for phenylthi-ocarbamide in Mathur Kayasths community of Hyderabad,A.P. Indian J Physiol Pharmacol 1983, 27(2):92-100.
75. Bhatkar RS, Nallulwar SC, Katti VA: The study of tasters and non-tasters of phenyl-thio-carbamide (PTC) and its relation toblood groups. Indian J Physiol Pharmacol 1989, 33(3):168-170.
76. Kim UK, Drayna D: Genetics of individual differences in bittertaste perception: lessons from the PTC gene. Clin Genet 2005,67(4):275-280.
77. Wooding S, Bufe B, Grassi C, Howard MT, Stone AC, Vazquez M,Dunn DM, Meyerhof W, Weiss RB, Bamshad MJ: Independent evo-lution of bitter-taste sensitivity in humans and chimpanzees.Nature 2006, 440(7086):930-934.
78. Tepper BJ: 6-n-Propylthiouracil: a genetic marker for taste,with implications for food preference and dietary habits. AmJ Hum Genet 1998, 63(5):1271-1276.
79. Billing J, Sherman PW: Antimicrobial functions of spices: whysome like it hot. Q Rev Biol 1998, 73(1):3-49.
80. Kim U, Wooding S, Ricci D, Jorde LB, Drayna D: Worldwide hap-lotype diversity and coding sequence variation at human bit-ter taste receptor loci. Human Mutation 2005, 26(3):199-204.
81. Sturm RA: A golden age of human pigmentation genetics.Trends in Genetics 2006, 22(9):464-468.
82. Rosenberg NA, Burke T, Elo K, Feldman MW, Freidlin PJ, GroenenMAM, Hillel J, Maki-Tanila A, Tixier-Boichard M, Vignal A, WimmersK, Weigend S: Empirical Evaluation of Genetic ClusteringMethods Using Multilocus Genotypes From 20 ChickenBreeds. Genetics 2001, 159(2):699-713.
83. Ramachandran S, Rosenberg NA, Zhivotovsky LA, Feldman MW:Robustness of the inference of human population structure:a comparison of X-chromosomal and autosomal microsatel-lites. Hum Genomics 2004, 1(2):87-97.
84. Rosenberg NA, Calabrese PP: Polyploid and multilocus exten-sions of the Wahlund inequality. Theo Pop Biol 2004,66(4):381-391.
85. In KH, Asano K, Beier D, Grobholz J, Finn PW, Silverman EK, Silver-man ES, Collins T, Fischer AR, Keith TP, Serino K, Kim SW, De Sanc-tis GT, Yandava C, Pillari A, Rubin P, Kemp J, Israel E, Busse W,Ledford D, Murray JJ, Segal A, Tinkleman D, Drazen JM: NaturallyOccurring Mutations in the Human 5-Lipoxygenase GenePromoter That Modify Transcription Factor Binding andReporter Gene Transcription. J Clin Invest 1997,99(5):1130-1137.
86. Brownstein MJ, Carpten JD, Smith JR: Modulation of Non-Tem-plated Nucleotide Addition by Taq DNA Polymerase:Primer Modifications that Facilitate Genotyping. BioTech-niques 1996, 20(6):1004-1010.
87. Scheet P, Stephens M: A Fast and Flexible Statistical Model forLarge-Scale Population Genotype Data: Applications toInferring Missing Genotypes and Haplotypic Phase. Am J HumGenet 2006, 78(4):629-644.
88. Stephens M, Smith NJ, Donnelly P: A new statistical method forhaplotype reconstruction from population data. Am J HumGenet 2001, 68(4):978-989.
89. Stephens M, Scheet P: Accounting for Decay of Linkage Disequi-librium in Haplotype Inference and Missing-Data Imputa-tion. Am J Hum Genet 2005, 76(3):449-462.
90. Stephens M, Donnelly P: A comparison of bayesian methods forhaplotype reconstruction from population genotype data.Am J Hum Genet 2003, 73(5):1162-1169.
91. R Development Core Team: R: A language and environment forstatistical computing. 2006 [http://www.R-project.org]. Vienna,Austria , R Foundation for Statistical Computing
92. Warnes G, Leisch F: genetics: Population Genetics. R packageversion 1.2.0. 2005.
93. Weir BS, Cockerham CC: Estimating F-statitsics for the analy-sis of population-structure. Evolution 1984, 38(6):1358-1370.
94. Akey JM, Zhang G, Zhang K, Jin L, Shriver MD: Interrogating aHigh-Density SNP Map for Signatures of Natural Selection.Genome Res 2002, 12(12):1805-1814.
95. Goudet J: Fstat version 1.2: a computer program to calculateFstatistics. J Hered 1995, 86(6):485-486.
96. Weir BS: Genetic Data Analysis II. 2nd edition. Sunderland, MA ,Sinauer Associates; 1996.
97. Sherry ST, Ward MH, Kholodov M, Baker J, Phan L, Smigielski EM,Sirotkin K: dbSNP: the NCBI database of genetic variation.Nucl Acids Res 2001, 29(1):308-311.
98. Database of Single Nucleotide Polymorphisms (dbSNP).Bethesda (MD): National Center for Biotechnology Informa-tion, National Library of Medicine. (dbSNP Build ID: 126).[http://www.ncbi.nlm.nih.gov/SNP/]
99. Carter K, McCaskie P, Palmer L: JLIN: A java based linkage dise-quilibrium plotter. BMC Bioinformatics 2006, 7(1):60.
100. Jeunemaitre X, Charru A, Chatellier G, Dumont C, Sassano P, Sou-brier F, Menard J, Corvol P: M235T variant of the human angi-otensinogen gene in unselected hypertensive patients. JHypertens Suppl 1993, 11(5):S80-S81.
101. Givens RC, Lin YS, Dowling ALS, Thummel KE, Lamba JK, Schuetz EG,Stewart PW, Watkins PB: CYP3A5 genotype predicts renal
Page 19 of 20(page number not for citation purposes)
http://www.ncbi.nlm.nih.gov/entrez/query.fcgi?cmd=Retrieve&db=PubMed&dopt=Abstract&list_uids=4742043
http://www.ncbi.nlm.nih.gov/entrez/query.fcgi?cmd=Retrieve&db=PubMed&dopt=Abstract&list_uids=4742043
http://www.ncbi.nlm.nih.gov/entrez/query.fcgi?cmd=Retrieve&db=PubMed&dopt=Abstract&list_uids=4200438
http://www.ncbi.nlm.nih.gov/entrez/query.fcgi?cmd=Retrieve&db=PubMed&dopt=Abstract&list_uids=4200438
http://www.ncbi.nlm.nih.gov/entrez/query.fcgi?cmd=Retrieve&db=PubMed&dopt=Abstract&list_uids=4200438
http://www.ncbi.nlm.nih.gov/entrez/query.fcgi?cmd=Retrieve&db=PubMed&dopt=Abstract&list_uids=7228059
http://www.ncbi.nlm.nih.gov/entrez/query.fcgi?cmd=Retrieve&db=PubMed&dopt=Abstract&list_uids=7228059
http://www.ncbi.nlm.nih.gov/entrez/query.fcgi?cmd=Retrieve&db=PubMed&dopt=Abstract&list_uids=6885137
http://www.ncbi.nlm.nih.gov/entrez/query.fcgi?cmd=Retrieve&db=PubMed&dopt=Abstract&list_uids=6885137
http://www.ncbi.nlm.nih.gov/entrez/query.fcgi?cmd=Retrieve&db=PubMed&dopt=Abstract&list_uids=6885137
http://www.ncbi.nlm.nih.gov/entrez/query.fcgi?cmd=Retrieve&db=PubMed&dopt=Abstract&list_uids=2592042
http://www.ncbi.nlm.nih.gov/entrez/query.fcgi?cmd=Retrieve&db=PubMed&dopt=Abstract&list_uids=2592042
http://www.ncbi.nlm.nih.gov/entrez/query.fcgi?cmd=Retrieve&db=PubMed&dopt=Abstract&list_uids=2592042
http://www.ncbi.nlm.nih.gov/entrez/query.fcgi?cmd=Retrieve&db=PubMed&dopt=Abstract&list_uids=9792854
http://www.ncbi.nlm.nih.gov/entrez/query.fcgi?cmd=Retrieve&db=PubMed&dopt=Abstract&list_uids=9792854
http://www.ncbi.nlm.nih.gov/entrez/query.fcgi?cmd=Retrieve&db=PubMed&dopt=Abstract&list_uids=9586227
http://www.ncbi.nlm.nih.gov/entrez/query.fcgi?cmd=Retrieve&db=PubMed&dopt=Abstract&list_uids=9586227
http://www.ncbi.nlm.nih.gov/entrez/query.fcgi?cmd=Retrieve&db=PubMed&dopt=Abstract&list_uids=9062372
http://www.ncbi.nlm.nih.gov/entrez/query.fcgi?cmd=Retrieve&db=PubMed&dopt=Abstract&list_uids=9062372
http://www.ncbi.nlm.nih.gov/entrez/query.fcgi?cmd=Retrieve&db=PubMed&dopt=Abstract&list_uids=9062372
http://www.ncbi.nlm.nih.gov/entrez/query.fcgi?cmd=Retrieve&db=PubMed&dopt=Abstract&list_uids=8780871
http://www.ncbi.nlm.nih.gov/entrez/query.fcgi?cmd=Retrieve&db=PubMed&dopt=Abstract&list_uids=8780871
http://www.ncbi.nlm.nih.gov/entrez/query.fcgi?cmd=Retrieve&db=PubMed&dopt=Abstract&list_uids=8780871
http://www.ncbi.nlm.nih.gov/entrez/query.fcgi?cmd=Retrieve&db=PubMed&dopt=Abstract&list_uids=8158445
BMC Genetics 2008, 9:13 http://www.biomedcentral.com/1471-2156/9/13
Publish with BioMed Central and every scientist can read your work free of charge
"BioMed Central will be the most significant development for disseminating the results of biomedical research in our lifetime."
Sir Paul Nurse, Cancer Research UK
Your research papers will be:
available free of charge to the entire biomedical community
peer reviewed and published immediately upon acceptance
cited in PubMed and archived on PubMed Central
yours — you keep the copyright
Submit your manuscript here:http://www.biomedcentral.com/info/publishing_adv.asp
BioMedcentral
CYP3A activity and blood pressure in healthy adults. J ApplPhysiol 2003, 95(3):1297-1300.
102. Evans JC, Frayling TM, Cassell PG, Saker PJ, Hitman GA, Walker M,Levy JC, O'Rahilly S, Rao PV, Bennett AJ, Jones EC, Menzel S, Prest-wich P, Simecek N, Wishart M, Dhillon R, Fletcher C, Millward A,Demaine A, Wilkin T, Horikawa Y, Cox NJ, Bell GI, Ellard S, McCa-rthy MI, Hattersley AT: Studies of association between the genefor calpain-10 and type 2 diabetes mellitus in the UnitedKingdom. Am J Hum Genet 2001, 69(3):544-552.
103. Grant SFA, Thorleifsson G, Reynisdottir I, Benediktsson R, ManolescuA, Sainz J, Helgason A, Stefansson H, Emilsson V, Helgadottir A, Sty-rkarsdottir U, Magnusson KP, Walters GB, Palsdottir E, Jonsdottir T,Gudmundsdottir T, Gylfason A, Saemundsdottir J, Wilensky RL, ReillyMP, Rader DJ, Bagger Y, Christiansen C, Gudnason V, Sigurdsson G,Thorsteinsdottir U, Gulcher JR, Kong A, Stefansson K: Variant oftranscription factor 7-like 2 (TCF7L2) gene confers risk oftype 2 diabetes. Nat Genet 2006, 38(3):320-323.
104. Bottini N, Musumeci L, Alonso A, Rahmouni S, Nika K, RostamkhaniM, MacMurray J, Meloni GF, Lucarelli P, Pellecchia M, Eisenbarth GS,Comings D, Mustelin T: A functional variant of lymphoid tyro-sine phosphatase is associated with type I diabetes. Nat Genet2004, 36(4):337-338.
105. Haines JL, Hauser MA, Schmidt S, Scott WK, Olson LM, Gallins P,Spencer KL, Kwan SY, Noureddine M, Gilbert JR, Schnetz-Boutaud N,Agarwal A, Postel EA, Pericak-Vance MA: Complement Factor HVariant Increases the Risk of Age-Related Macular Degener-ation. Science 2005, 308(5720):419-421.
106. Edwards AO, Ritter R III, Abel KJ, Manning A, Panhuysen C, FarrerLA: Complement Factor H Polymorphism and Age-RelatedMacular Degeneration. Science 2005, 308(5720):421-424.
107. Klein RJ, Zeiss C, Chew EY, Tsai JY, Sackler RS, Haynes C, HenningAK, SanGiovanni JP, Mane SM, Mayne ST, Bracken MB, Ferris FL, OttJ, Barnstable C, Hoh J: Complement Factor H Polymorphism inAge-Related Macular Degeneration. Science 2005,308(5720):385-389.
108. Rivera A, Fisher SA, Fritsche LG, Keilhauer CN, Lichtner P, MeitingerT, Weber BHF: Hypothetical LOC387715 is a second majorsusceptibility gene for age-related macular degeneration,contributing independently of complement factor H to dis-ease risk. Hum Mol Genet 2005, 14(21):3227-3236.
109. Emison ES, McCallion AS, Kashuk CS, Bush RT, Grice E, Lin S, PortnoyME, Cutler DJ, Green ED, Chakravarti A: A common sex-depend-ent mutation in a RET enhancer underlies Hirschsprung dis-ease risk. Nature 2005, 434(7035):857-863.
110. Lamason RL, Mohideen MAPK, Mest JR, Wong AC, Norton HL, ArosMC, Jurynec MJ, Mao X, Humphreville VR, Humbert JE, Sinha S,Moore JL, Jagadeeswaran P, Zhao W, Ning G, Makalowska I, McK-eigue PM, O'Donnell D, Kittles R, Parra EJ, Mangini NJ, Grunwald DJ,Shriver MD, Canfield VA, Cheng KC: SLC24A5, a Putative CationExchanger, Affects Pigmentation in Zebrafish and Humans.Science 2005, 310(5755):1782-1786.
Page 20 of 20(page number not for citation purposes)