Stimulated Raman scattering in quantum dots and nanocomposites silicon based materials
Upload
khangminh22Category
view
0download
0
The Egyptian Journal of Hospital Medicine (Oct. 2015) Vol. 61, Page 389-405
389
Received:1/9/2015 Accepted:12/9/2015 DOI: 10.12816/0017692
IFN-Stimulated Genes Upregulation Pattern in Chronic Hepatitis C 1Saadia Farid,
2Amal Ahmed,
3Samya Sweilam and
4Laila Rashed
Departments of Tropical Medicine, Biochemistry and Medical Biochemistry
National Hepatology and Tropical Medicine Research Institute and
Faculty of Medicine, Cairo University
ABSTRACT
Background: The development of effective tools for the large-scale analysis of gene expression has
provided new insights into the involvement of gene networks and regular pathways in various disease
processes. The chemokine receptor CXCR3 is a G protein-coupled receptor found predominantly on T
cells that is activated by three ligands as follow: CXCL9 (Mig), CXCL10 (IP-10) and CXCL11 (I-
TAC), and play a key role in immune and inflammatory responses by promoting recruitment and
activation of different subpopulations of leukocytes. Aim of the work: The study is a logical
functional approach for the development of serum markers chemokines that bind to CXC chemokine
receptor 3 to determine whether they play a role in the future of immune system to clear HCV, these
chemokines: CXCL9, CXCL10 and CXCL11. Patients and methods: 131 male and female patients
with chronic hepatitis C virus (CHCV) infection, their age ranges between 22 and 55 years, selected
from the National Hepatology and Tropical Medicine Research Institute. The included patients were
divided to two groups, the first group: 80 patients were investigated for the predictive values of
CXCL9,10,11 and CXCR3 chemokines in peripheral blood mononuclear cells (PBMCs), the second
group were fifty one patients analyzed for the expression of surface markers on CD8+T cells. Twenty
healthy individuals were included to serve as controls for each group. All the patients and controls were
subjected to the following: history, clinical examination, abdominal ultrasonography and collection of
blood samples for routine laboratory investigation and serological assay. Results: Chemokine CXCL9,
CXCL10, CXCL11 and their receptor CXCR3 expression levels are induced in PBMCs during CHCV
infection, associated with increased the expression levels of CD8+T cells in CHCV patients.
Conclusion: The interaction between chemokines and their receptors is essential in recruiting HCV-
specific T cells to control the infection. Recommendations: The regulation of chemokines and their
receptors could be a future potential therapeutic target to decrease liver inflammation and to increase
specific T cell migration to the infected liver, the blocking of chemokines and chemokine receptor
engagement is a therapeutic strategy that should be explored in the near future for non-responders to
current anti-HCV therapy.
Key words: Chemokines CXCL 9, 10, 11, Chemokine receptor CXCR3, Hepatitis C virus infection,
immunoregulation pattern of genes.
INTRODUCTION
Hepatitis C is a major cause of chronic
liver disease worldwide. An important and
striking feature of hepatitis C is its tendency
toward chronicity. In > 70% of infected
individuals, hepatitis C virus (HCV)
establishes a persistent infection over decades
that may lead to cirrhosis and hepatocellular
carcinoma. (1)
The estimated worldwide
prevalence of HCV infection is 2% to 3%,
which translates to an
estimated 170 million infected individuals. (2)
Successful eradication of the virus is achieved
in only 15-20% of newly infected individuals,
while the remainder develops chronic
infection.
The ability of the virus to persist within a host
is astonishing, and is attributed to its efficient
ability to evade the adaptive and innate
components of the host immune System. (3)
Chemokines represent a target for modulation
by viruses including the HCV. HCV is known
to modulate chemokine expression in vitro and
may therefore enable its survival by
subverting the immune response in vivo
through altered leukocyte chemotaxis resulting

IFN-Stimulated Genes Upregulation…
390
in impaired viral clearance and the
establishment of chronic low-grade
inflammation. (4)
The selective CXC chemokine receptor
3 (CXCR3) agonists, monokine induced by
interferon-(IFN-)\VCXC chemokine ligand 9
(CXCL9), IFN-inducible protein 10\V CXCL
10, and IFN-inducible T cell chemoattractant
(I-TAC)\V CXCL11, attract CXCR3 cells
such as CD45RO T lymphocytes, B cells, and
natural killer cells. Further, all three
chemokines are potent, natural antagonists for
CXCR3 and feature defensin-like. (5)
Chemokines are small heparin-binding
proteins that direct the movement of
mononuclear cells through the body to
contribute to the development of an adaptive
immune response and to the pathogenesis of
inflammation. These proteins are 8-10 kDa in
size with 20%-70% amino acid sequence
homology and are secreted by resident cells at
the inflammatory site. (6)
The CXC family has
been subdivided into two groups depending on
the presence of the ELR motif (Glu-Leu-Arg). (7, 8)
Interactions between chemokines and
enzymes are vital in immunoregulatin.
Structural protein citrullination by
peptidylarginine deiminase (PAD) has been
associated with autoimmunity. (9)
CXCL10
binds CXCR3 receptor to induce chemotaxis,
apoptosis, cell growth and angiostasis.
Altrations in CXCL10 expression levels have
been associated with inflammatory diseases
including infectious diseases, immune
dysfunction and tumor development. CXCL10
is also recognized as a biomarker that predicts
severity of various diseases. (10)
Fibrosis is a
hallmark of chronic diseases, yet many aspects
of its mechanism remain to be defined.
Chemokines are ubiquitous chemotactic
molecules that mediate many acute and
chronic inflammatory conditions, and CXC
chemokine genes colocalize with a CXCL9
locus shown to include fibrogenic genes. (11)
PATIENTS AND METHODS
131 male and female patients with chronic
hepatitis C virus (CHCV) infection, their age
ranges between 22 and 55 years, selected from
the National Hepatology and Tropical
Medicine Research Institute. The included
patients were divided to two groups, the first
group: 80 patients were investigated for the
predictive values of CXCL9,10,11 and
CXCR3 chemokines in peripheral blood
mononuclear cells (PBMCs), the second group
were fifty one patients analyzed for the
expression of surface markers on CD8 + T
cells. Twenty healthy individuals were
included to serve as controls for each group.
All the patients and controls were subjected to
the following: history, clinical examination,
abdominal ultrasonography and collection of
blood samples for routine laboratory
investigation and serological assay.
Protocol: Purification of Total Cellular
RNA from Human Whole Blood:
Procedure
1. Mix 1 volume of human whole blood
with 5 volumes of Buffer EL in an
appropriately sized tube, add 5 ml of Buffer
EL to 1 ml of whole blood, and mix in a tube
which has a total volume of ≥ 8 ml. Note: Use
an appropriate amount of whole blood. Up to
1.5 ml of healthy blood (typically 4000–7000
leukocytes per microliter) can be processed.
Reduce amount appropriately if blood with
elevated numbers of leukocytes is used.
2. Incubate for 10–15 min on ice. Mix by
vortexing briefly 2 times during incubation.
The cloudy suspension becomes translucent
during incubation, indicating lysis of
erythrocytes. If necessary, incubation time can
be extended to 20 min.
3. Centrifuge at 400 x g for 10 min at 4°C, and
completely remove and discard supernatant.
Leukocytes will form a pellet after
centrifugation. Ensure supernatant is
completely removed. Trace amounts of
erythrocytes, which give the pellet a red tint,
will be eliminated in the following wash step.
4. Add Buffer EL (Erythrocyte lysis) to the
cell pellet (use 2 volumes of Buffer EL per
volume of whole blood used in step 1).
Resuspend cells by vortexing briefly. For
example, add 2 ml of Buffer EL per 1 ml of
whole blood used in step 1.
5. Centrifuge at 400 x g for 10 min at 4°C,
and completely remove and discard
supernatant. Note: Incomplete removal of the

Saadia Farid et al
391
supernatant will interfere with lysis and
subsequent binding of RNA to the QIAamp ®
RNA blood mini Kit (50) Cat. No.: 52304, Lot
No.: 148019701 spin column, resulting in
lower yield.
6. Add Buffer RLT to pelleted leukocytes
according to the table 1 below. Vortex or pipet
to mix.
When not using healthy blood, refer to number
of leukocytes to determine the volume of
Buffer RLT required. Buffer RLT disrupts the
cells. No cell clumps should be visible before
you proceed to the homogenization step.
Vortex or pipet further to remove any clumps.
7. Pipet lysate directly into a QIAshredder
spin column in a 2 ml collection tube
(provided) and centrifuge for 2 min at
maximum speed to homogenize. Discard
QIAshredder spin column and save
homogenized lysate. To avoid aerosol
formation, adjust pipet to ≥750 μl to ensure
that the lysate can be added to the
QIAshredder spin column in a single step. If
too many cells have been used, after
homogenization the lysate will be too viscous
to pipet.
8. Add 1 volume (350 μl or 600 μl) of 70%
ethanol to the homogenized lysate and mix by
pipetting. Do not centrifuge. A precipitate may
form after the addition of ethanol. This will
not affect the QIAamp procedure.
9. Carefully pipet sample, including any
precipitate which may have formed, into a
new QIAamp spin column in a 2 ml collection
tube (provided) without moistening the rim.
Centrifuge for 15 s at ≥ 8000 x g (≥ 10,000
rpm). Maximum loading volume is 700 μl. If
the volume of the sample exceeds 700 μl,
successively load aliquots onto the QIAamp
spin column and centrifuge as above. Discard
flow-through* and collection tube. Optional:
If performing optional on-column DNase
digestion.
10. Transfer the QIAamp spin column into a
new 2 ml collection tube (provided). Apply
700 μl Buffer RW1 to the QIAamp spin
column and centrifuge for 15 s at ≥8000 x g
(≥10,000 rpm) to wash. Discard flow-through*
and collection tube.
11. Place QIAamp spin column in a new 2 ml
collection tube (provided). Pipet 500 μl of
Buffer RPE into the QIAamp spin column and
centrifuge for 15 s at ≥8000 x g (≥10,000
rpm). Discard flow-through* and collection
tube. Note: Ensure ethanol is added to Buffer
RPE.
12. Carefully open the QIAamp spin column
and add 500 μl of Buffer RPE. Close the cap
and centrifuge at full speed (20,000 x g,
14,000 rpm) for 3 min. Note: Some centrifuge
rotors may distort slightly upon deceleration,
resulting in flow-through, containing Buffer
RPE, contacting the QIAamp spin column.
Removing the QIAamp spin column and
collection tube from the rotor may also cause
flow-through to come into contact with the
QIAamp spin column. * Flow-through
contains Buffer RW1 or RLT and is therefore
incompatible with bleach.
13. Recommended: Place the QIAamp spin
column in a new 2 ml collection tube (not
provided) and discard the old collection tube
with the filtrate. Centrifuge at full speed for 1
min. This step helps to eliminate the chance of
possible Buffer RPE carryover.
14. Transfer QIAamp spin column into a 1.5
ml microcentrifuge tube (provided) and pipet
30–50 μl of RNase-free water (provided)
directly onto the QIAamp membrane.
Centrifuge for 1 min at ≥ 8000 x g (≥10,000
rpm) to elute. Repeat if >0.5 ml whole blood
(or >2 x 10⁶ leukocytes) has been processed. (12)
cDNA Reaction Preparation The kit contains reagents that when combined,
form a 2X Reverse Transcription (RT) Master
Mix. An equal volume of RNA sample should
be added. To avoid RNase contamination,
RNase-free reagents and consumables must be
used.
To prepare the 2X RT Master Mix (per 20 μL
reaction):
1. Allow the kit components to thaw on ice.
2. Referring to the table 2 below, calculate the
volume of components needed to prepare the
required number of reactions. Note: Prepare
the RT master mix on ice.
Immunophenotyping analysis by flow
cytometry
PBMCs were isolated by Ficoll-Histopaque
(Sigma Chemical Co., St Louis, MO) density
centrifugation. Cells were stained by

IFN-Stimulated Genes Upregulation…
392
fluorescent antibodies per manufacturer's
instructions and analyzed with Flow Jo (Tree
Star Inc., San Carlos, CA) 17, PD-1 positivity
was determined by an isotype control-defined
cutoff (99.5%). (13)
Detection of PD-1 gene expression using
real time PCR (RT–PCR)
RNA extraction:
Total RNA was isolated from whole blood
using RNeasy Purification Reagent (Qiagen,
Valencia, CA) according to manufacturer’s
instruction. The RNA sample was dissolved in
RNase-free water and quantified
spectrophotometrically, concentrations of the
RNA were assessed using the OD 260/280
ratio. The integrity of the RNA was studied by
gel electrophoresis on a 1% agarose gel,
containing ethidium bromide.
cDNA synthesis:
First-strand cDNA synthesis was performed
with cDNA synthesis kit supplied by Qiagene.
Briefly, 2 μg total RNA was mixed with 0.5
μg of oligo (dT) 12-18 primer in a total
volume of 12 μL. After the mixture was
heated at 70°C for 10 min, a solution
containing 50 mmol/L Tris Hcl (PH 8.3), 75
mmol/L KCl, 3 mmol/L MgCl2, 10 mmol/L
DTT, 0.5 mmol/L dNTPs, 0.5 μL RNase
inhibitor, and 200 U Superscript Reverse
Transcriptase was added, resulting in a total
volume of 20.5 μL. This mixture was
incubated at 42°C for 1 h.
Real-time quantitative polymerase chain
reaction (PCR):
For real-time quantitative PCR, 5 μL of first-
strand cDNA was used in a total volume of 25
μL, containing 12.5 μL 2x SYBR Green PCR
Master Mix (Applied Biosystems, Foster City,
CA, USA) and 200 ng of each primer (shown
in table 1). PCR reactions consisting of 95°C
for 10 min (1 cycle), 94°C for 15 s, and 60°C
for 1 min (40 cycles), were performed on an
ABI Prism 7900 HT Fast Real Time PCR
system (Applied Biosystems). Data were
analyzed with the ABI Prism 7500 sequence
detection system software and quantified using
the v1·7 Sequence Detection Software from
PE Biosystems (Foster City, CA). Relative
expression of studied genes was calculated
using the comparative threshold cycle method.
All values were normalized to the beta actin
genes. (14)
Table (1):
Buffer RLT* (μl) Healthy whole blood
(ml)
No. of leukocytes
350 Up to 0.5 Up to 2 x 10⁶
600 0.5 to 1.5 2 x 10⁶ to 1 x 10⁷
* Ensure β-ME is added to Buffer RLT.
Table (2):
Component Volume (μL)/Reaction Kit
With RNase Inhibitor Kit Without RNase Inhibitor
10X RT Buffer 2.0 2.0
25X dNTP Mix (100 mM) 0.8 0.8
10X RT Random Primers 2.0 2.0
MultiScribe™ Reverse
Transcriptase
1.0 1.0
RNase Inhibitor 1.0 --
Nuclease-free H2O 3.2 4.2
Total per Reaction 10.0 10.0

Saadia Farid et al
393
Fig (1): Illustrates the CXCL 9, 10, 11 and CXCR3 genes, Real-time Amplification plots
quantitative PCR.
Fig (2): Illustrates the CXCL 9, 10, 11 and CXCR3 genes, Real-time Amplification plots
quantitative PCR.

IFN-Stimulated Genes Upregulation…
394
Fig (3): Illustrates the CXCL9, 10, 11 and CXCR3 genes, Real-time Amplification plots
quantitative PCR.
Fig (4): Illustrates the CXCL9, 10, 11 and CXCR3 genes, Real-time Amplification plots
quantitative PCR.

Saadia Farid et al
395
Fig (5): Illustrates the CXCL 9, 10, 11 and CXCR3 genes, Real-time Amplification plots
quantitative PCR.
Fig (6): Illustrates the CXCL 9, 10, 11 and CXCR3 genes, Real-time Amplification plots
quantitative PCR.
IFN-Stimulated Genes Upregulation…
396
Fig (7): Illustrates the CXCL 9, 10, 11 and CXCR3 genes, Real-time Amplification plots
quantitative PCR.
Fig (8): Illustrates the CXCL 9, 10, 11 and CXCR3 genes, Real-time Amplification plots
quantitative PCR.

Saadia Farid et al
397
Fig (9): Illustrates the CXCL 9, 10, 11 and CXCR3 genes, Real-time Amplification plots
quantitative PCR.
Fig (10): Illustrates the CXCL 9, 10, 11 and CXCR3 genes, Real-time Amplification plots
quantitative PCR.

IFN-Stimulated Genes Upregulation…
398
Fig (11): Amplification plots curve of quantitative real time-PCR illustrated increased
programmed death cell-1 (PD-1) expression in circulating HCV-specific CD8+T-cells from
patients with hepatitis C.
Ethical consideration: Informed consent was
obtained from each patient at the time of
drawing blood samples. The Research Ethical
committee of the central Organization for
Teaching Hospitals and Institutes approved the
study protocol.
Statistical analysis: Data were coded and
entered using the statistical package SPSS
(Statistical Package for the Social Science;
SPSS Inc., Chicago, IL, USA) version 21.
Data was summarized using mean and
standard deviation. Comparisons between
quantitative variables in cases were done using
one sample T test to compare against control
value 1. (15)
Unpaired t-test was used to
compare two groups as regard quantitative
variables. (16)
P-values less than 0.05 were
considered as statistically significant.
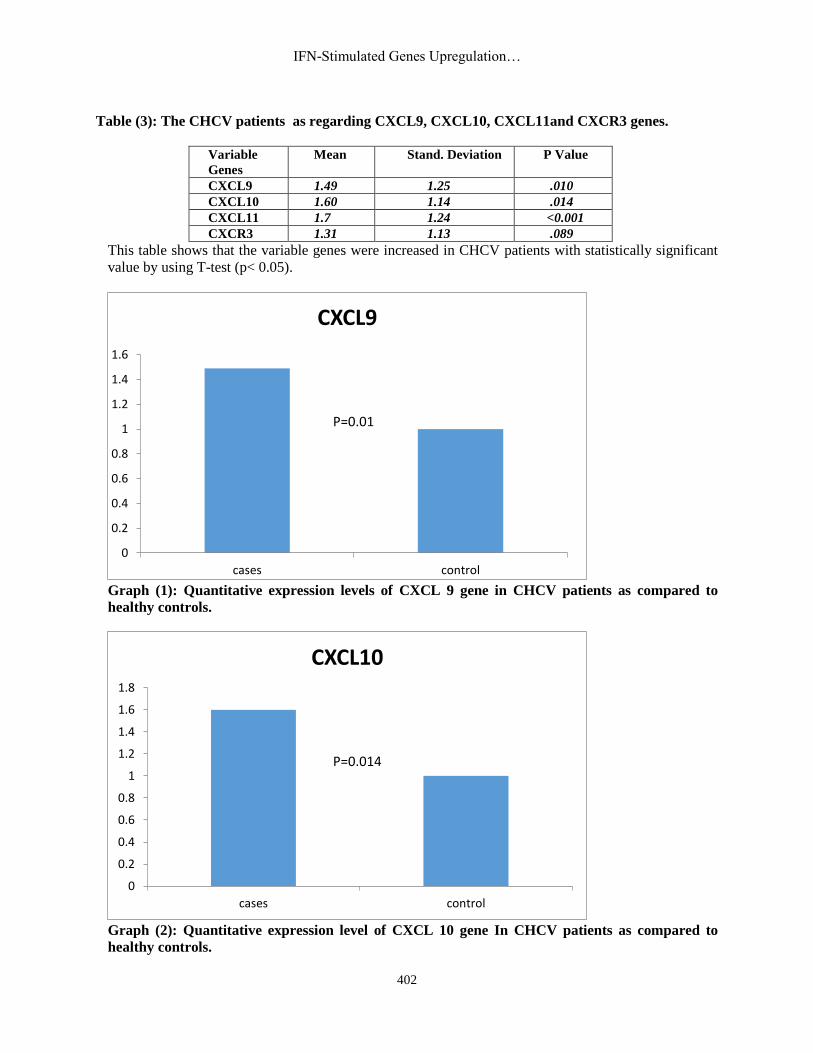
RESULTS
The quantitative expression levels of the Real
time-PCR activation by HCV chemokines
CXCL 9, 10, 11 and chemokine receptor
CXCR3 were increased with statistically
significant difference in CHCV infection
against control value (1) as shown by table (3)
using unpaired t-test, graph 1, 2, 3 and 4.
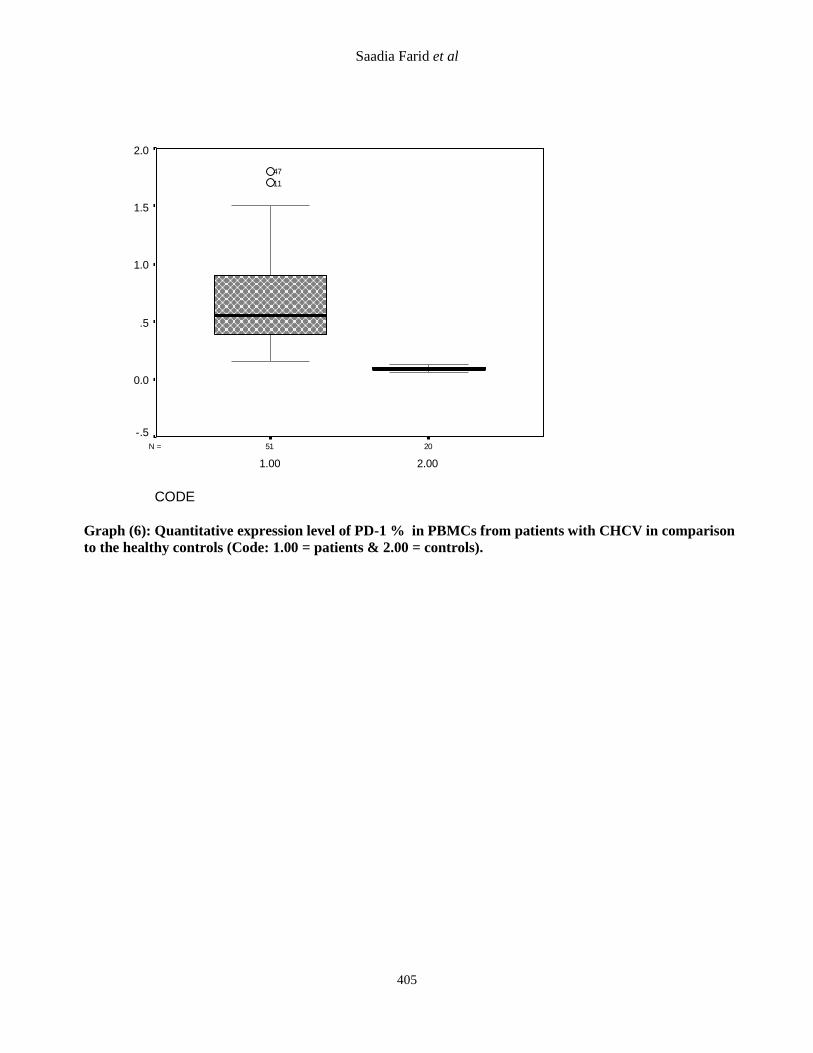
The Real time –PCR expression of activation
by HCV level of CD8+T cells in PBMCs of
CHCV patients was higher level as compared
to the healthy controls with statistically highly
significant difference (p < 0.001) by using
unpaired t-test table (4), figure (11), graph
(5,6).
Figure (1) to figure (10) illustrated the
Real time – Amplification plots for multiple
quantitative PCR genes CXCL 9, 10, 11 and
CXCR3 receptor.
DISCUSSION
The ligands for CXCR3 are interferon
(IFN)-ð inducible protein 10 (IP-10, CXCL
10), monokine induced by IFN-ð (Mig,
CXCL9), and IFN-inducible T-cell α
chemoattractant (1-TAC, CXCL 11). CXCR3
is expressed on activated T cells and natural
killer cells. (17)
The migration of lymphocytes
to the liver is a complex process involving
adhesion, rolling, triggering, and
transendothelial migration. Chemokines and
their receptors play an essential role in this
multistep pathway. (18, 19)
Therefore,
chemokines and their receptors are associated
with viral control but are also associated with
immune-mediated liver inflammation.
Saadia Farid et al
399
Moreover, in a hepatotropic viral infection in
humans, a huge intrahepatic non-specific
mononuclear infiltrate during viral persistence
was noticed, while this was not present in
subjects with control. (20)
The intrahepatic chemoattraction of
non-specific T cells perpetuated the liver
damage. Consequently, also in humans,
chemokines and their receptors develop an
important role in viral clearance and in the
development of chronic tissue inflammation.
Obviously, the modulation of these pathways
is important for generating an efficient
immune response, and for participating in the
inflammatory process during the chronic
infection phase, but pathway modulation could
also be a viral strategy used by HCV to escape
from immune control. (21)
Persistent HCV
infection is characterized by a non-specific
inflammatory infiltrate in the liver, mainly
composed of CD8+T cells (22, 23)
, and
responsible for liver damage. (24)
These cells
are attracted by the interaction between the
intrahepatic secreted chemokines and the
chemokine receptors expressed on T cells, a
correlation between liver inflammation and
liver infiltrating CXCR3 expressing T cells. (25,
26)
In the present work the quantitative
expression levels of the Real time-PCR
activation by HCV chemokines CXCL 9, 10,
11 and chemokine receptor CXCR3 were
increased with statistically significant
difference in CHCV infection. Larrubia et al. (27)
observed that intrahepatic and peripheral
blood levels CXCL 9, 10, 11 and chemokine
receptor CXCR3 are increased during chronic
hepatitis C. The interaction between
chemokines and their receptors is essential in
recruiting HCV-specific T cells to control the
infection. In chronic hepatitis C, the
expression of different chemokines in the liver
has been described. CXCL10 is increased in
the liver and peripheral blood during hepatitis
C. (28-30, 25)
This molecule is produced by
hepatocytes and sinusoidal endothelial cells. (29, 30)
CXCL9 and CXCL11 are also increased
in the serum and liver of subjects with chronic
hepatitis C. (29, 31)
CXCL9 is detected primarily
on sinusoidal endothelial cells, while CXCL11
is produced mainly by hepatocytes. (29, 26)
The
expression of all these chemokines in the liver
can be induced directly by HCV. High
hepatocyte synthesis of CXCL10, CXCL9
induced by some HCV proteins such as NSSA
and core. (32)
Although in vitro study suggests
that HCV proteins could also decrease the
expression of CXCL10. (33)
Intrahepatic
CXCL10 mRNA levels are associated with
intralobular inflammation. (34)
Similarly,
CXCL9 and CXCL11 correlate with the grade
of liver inflammation. (26, 35)
Zeremski et al. (36)
postulated that a study,
examining a large sample of chronic hepatitis
C patients showed a positive correlation
between CXCL9, CXCL10 and CXCL11
intrahepatic levels and the grade of fibrosis.
Indicating that persistent liver inflammation
produced by the mononuclear cells attracted
by these chemokines could finally induce the
activation of a liver fibrosis cascade. It is
possible to speculate that chemokines are
secreted in the infected liver to attract an
adaptive immune response able to clear the
virus. Unfortunatley, when the specific
response fails these chemokines also attract
non-specific T cells, when are not able to
remove the virus but produce liver
inflammation. Therefore, as chemokines are
nonspecific chemoattractants, the intrahepatic
inflammatory infiltrate produced during
chronic infection is mainly non-HCV-specific
and consequently unable to eliminate HCV. (37)
In the present study the Real time –
PCR expression of activation by HCV level of
CD8+T cells in PBMCs of CHCV patients
was higher level as compared to the healthy
controls with statistically highly significant
difference. Kastenmuller et al. (38)
discovered
that after an infection, the immune system
generates long-lived memory lymphocytes
whose increased frequency and altered state of
differentiation enhance host defense against
re-infection. Recently, the spatial distribution
of memory cells was found to contribute to
their protective function. Effector memory
CD8+T cells reside in peripheral tissue sites of
initial pathogen encounter, in apparent
anticipation of re-infection. The memory
CD8+ T cells were concentrated near
peripheral entry portals of lymph-borne
pathogens, promoting rapid engagement of
IFN-Stimulated Genes Upregulation…
400
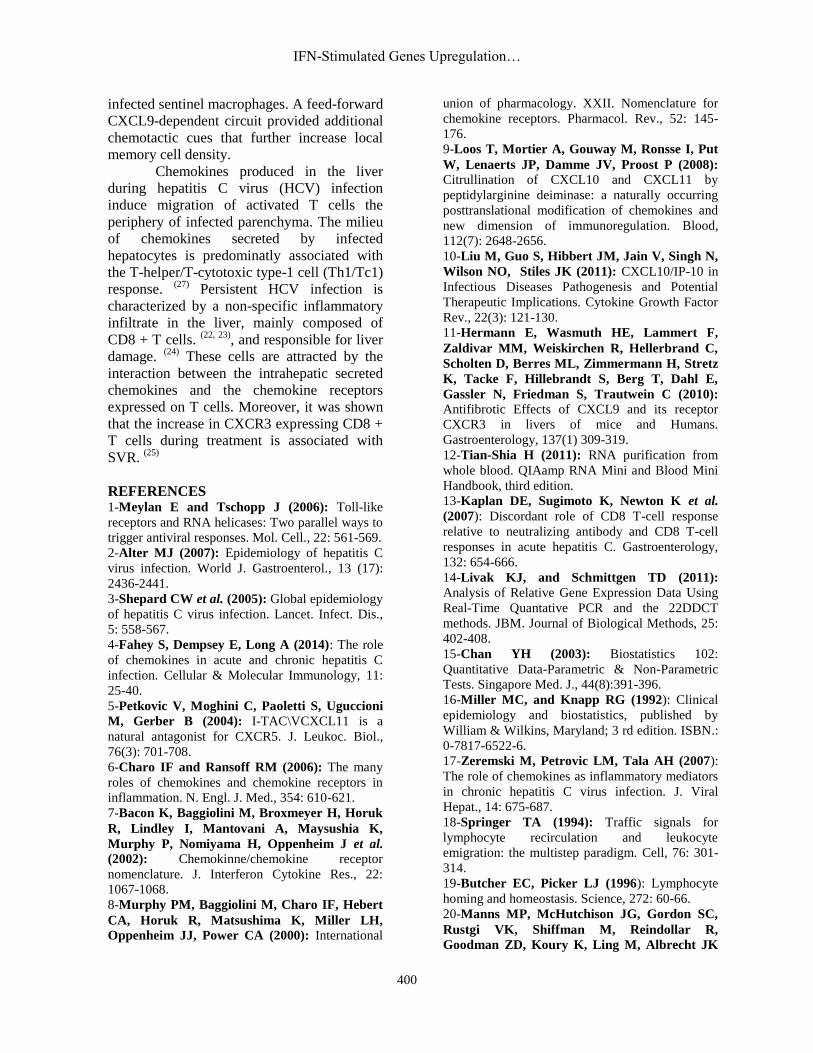
infected sentinel macrophages. A feed-forward
CXCL9-dependent circuit provided additional
chemotactic cues that further increase local
memory cell density.
Chemokines produced in the liver
during hepatitis C virus (HCV) infection
induce migration of activated T cells the
periphery of infected parenchyma. The milieu
of chemokines secreted by infected
hepatocytes is predominatly associated with
the T-helper/T-cytotoxic type-1 cell (Th1/Tc1)
response. (27)
Persistent HCV infection is
characterized by a non-specific inflammatory
infiltrate in the liver, mainly composed of
CD8 + T cells. (22, 23)
, and responsible for liver
damage. (24)
These cells are attracted by the
interaction between the intrahepatic secreted
chemokines and the chemokine receptors
expressed on T cells. Moreover, it was shown
that the increase in CXCR3 expressing CD8 +
T cells during treatment is associated with
SVR. (25)
REFERENCES 1-Meylan E and Tschopp J (2006): Toll-like
receptors and RNA helicases: Two parallel ways to
trigger antiviral responses. Mol. Cell., 22: 561-569.
2-Alter MJ (2007): Epidemiology of hepatitis C
virus infection. World J. Gastroenterol., 13 (17):
2436-2441.
3-Shepard CW et al. (2005): Global epidemiology
of hepatitis C virus infection. Lancet. Infect. Dis.,
5: 558-567.
4-Fahey S, Dempsey E, Long A (2014): The role
of chemokines in acute and chronic hepatitis C
infection. Cellular & Molecular Immunology, 11:
25-40.
5-Petkovic V, Moghini C, Paoletti S, Uguccioni
M, Gerber B (2004): I-TAC\VCXCL11 is a
natural antagonist for CXCR5. J. Leukoc. Biol.,
76(3): 701-708.
6-Charo IF and Ransoff RM (2006): The many
roles of chemokines and chemokine receptors in
inflammation. N. Engl. J. Med., 354: 610-621.
7-Bacon K, Baggiolini M, Broxmeyer H, Horuk
R, Lindley I, Mantovani A, Maysushia K,
Murphy P, Nomiyama H, Oppenheim J et al.
(2002): Chemokinne/chemokine receptor
nomenclature. J. Interferon Cytokine Res., 22:
1067-1068.
8-Murphy PM, Baggiolini M, Charo IF, Hebert
CA, Horuk R, Matsushima K, Miller LH,
Oppenheim JJ, Power CA (2000): International
union of pharmacology. XXII. Nomenclature for
chemokine receptors. Pharmacol. Rev., 52: 145-
176.
9-Loos T, Mortier A, Gouway M, Ronsse I, Put
W, Lenaerts JP, Damme JV, Proost P (2008): Citrullination of CXCL10 and CXCL11 by
peptidylarginine deiminase: a naturally occurring
posttranslational modification of chemokines and
new dimension of immunoregulation. Blood,
112(7): 2648-2656.
10-Liu M, Guo S, Hibbert JM, Jain V, Singh N,
Wilson NO, Stiles JK (2011): CXCL10/IP-10 in
Infectious Diseases Pathogenesis and Potential
Therapeutic Implications. Cytokine Growth Factor
Rev., 22(3): 121-130.
11-Hermann E, Wasmuth HE, Lammert F,
Zaldivar MM, Weiskirchen R, Hellerbrand C,
Scholten D, Berres ML, Zimmermann H, Stretz
K, Tacke F, Hillebrandt S, Berg T, Dahl E,
Gassler N, Friedman S, Trautwein C (2010): Antifibrotic Effects of CXCL9 and its receptor
CXCR3 in livers of mice and Humans.
Gastroenterology, 137(1) 309-319.
12-Tian-Shia H (2011): RNA purification from
whole blood. QIAamp RNA Mini and Blood Mini
Handbook, third edition.
13-Kaplan DE, Sugimoto K, Newton K et al.
(2007): Discordant role of CD8 T-cell response
relative to neutralizing antibody and CD8 T-cell
responses in acute hepatitis C. Gastroenterology,
132: 654-666.
14-Livak KJ, and Schmittgen TD (2011):
Analysis of Relative Gene Expression Data Using
Real-Time Quantative PCR and the 22DDCT
methods. JBM. Journal of Biological Methods, 25:
402-408.
15-Chan YH (2003): Biostatistics 102:
Quantitative Data-Parametric & Non-Parametric
Tests. Singapore Med. J., 44(8):391-396.
16-Miller MC, and Knapp RG (1992): Clinical
epidemiology and biostatistics, published by
William & Wilkins, Maryland; 3 rd edition. ISBN.:
0-7817-6522-6.
17-Zeremski M, Petrovic LM, Tala AH (2007):
The role of chemokines as inflammatory mediators
in chronic hepatitis C virus infection. J. Viral
Hepat., 14: 675-687.
18-Springer TA (1994): Traffic signals for
lymphocyte recirculation and leukocyte
emigration: the multistep paradigm. Cell, 76: 301-
314.
19-Butcher EC, Picker LJ (1996): Lymphocyte
homing and homeostasis. Science, 272: 60-66.
20-Manns MP, McHutchison JG, Gordon SC,
Rustgi VK, Shiffman M, Reindollar R,
Goodman ZD, Koury K, Ling M, Albrecht JK

Saadia Farid et al
401
(2001): Peginterferon alfa-2b plus ribavirin
compared with interferon alfa-2b plus ribavirin for
initial treatment of chronic hepatitis C: a
randomized trial. Lancet, 358: 958- 965.
21-Fried MW, Shiffman ML, Reddy KR, Smith
C, Marinos G,Goncales FL, Jr, Haussinger D,
Diago M, Carosi G, Dhumeaux D et al. (2002): Peginterferon alfa-a plus ribavirin for chronic
hepatitis C virus infection. N. Engl. J. Med., 347:
975-982.
22-Sprengers D, Van der Molen RG, Kusters
JG, Kwekkeboom J, Van der Laan LJ, Niesters
HG, Kuipers EJ, De Man RA, Schalm SW,
Janssen HL (2005): Flow cytometry of fine-
needle-aspiration biopsies: a new method to
monitor the intrahepatic immunological
environment in chronic viral hepatitis. J. Viral
Hepat., 12: 507-512.
23-Leroy V, Vigan I, Mosnier JF, Dufeu-
Duchesne T, Pernollet M, Zarski JP, Marche
PN, Jouvin-Marche E (2003): Phenotypic and
functional characterization of intrahepatic T
lymphocytes during chronic hepatitis C.
Hepatology, 38: 829-841.
24-Bertoletti A, Maini MK (2000): Protection or
damage: a dual role for the virus-specific cytotoxic
T lymphocyte response in hepatitis B and C
infection? Curr. Opin. Immunol., 12: 403-408.
25-Larrubia JR, Calvino M, Benito S, Sanz-de-
Villalobos E, Perna C, Perez-Hornedo J,
Gonzalez-MateosF, Garcia-Garzon S,
Bienvenido A, Parra T (2007): The role of
CCR5/CXCR3 expressing CD8+ cells in liver
damage and and viral control during persistent
hepatitis C virus infection. J. Hepatol., 47: 632-
641.
26-Apolinario A, Majano PL, Alvarez-Perez E,
Saez A, Lozano C, Vargas J, Garcia-Monzon C
(2002): Increased expression of T cell chemokines
and their receptors in chronic hepatitis C:
relationship with the histological activity of
chronic disease. Am. J. Gastroentrlo., 97: 2861-
2870.
27-Larrubia JR, Benito-Martinez S, Calvino M,
Sanz-de-Villalobos E, Parra-Cid T (2008): Role
of chemokines and their receptors in viral
persistence and liver damage during chronic
hepatitis C virus infection. World J. Gastroenterol.,
14(47) 7149-7159.
28-Patzwahl R, Meier V, Ramadori G, Mihm S
(2001): Enhanced expression of interferon-
regulated genes in the liver of patients with chronic
hepatitis C virus infection: detection by
suppression-subtractive hybridization. J. Virol., 75:
1332-1338.
29-Shields PL, Morland CM, Salmon M, Qin S,
Hubscher SG, Adamas DH (1999): Chemokine
and chemokine receptor interactions provide a
mechanism for selective T cell recruitment to
specific liver compartments within hepatitis C-
infected liver. J. Immunol., 163: 6236-6243.
30-Narumi S, Tominaga Y, Tamaru M, Shimai
S, Okumura H, Nishioji K, Itoh Y, Okanoue T
(1997): Expression of IFN-inducible protein-10 in
chronic hepatitis. J. Immunol., 158: 5536-5544.
31-Bieche I, Asselah T, Laurendeau I, Vidaud
D, Degot C, Paradis V, Bedossa P, Valla DC,
Marcellin P, Vidaud M (2005): Molecular
profiling of early stage liver fibrosis in patients
with chronic hepatitis C virus infection. Virology,
332: 130-144.
32-Apolinario A, Majano PL, Lorente R, Nunez
O, Clemente G, Garcia-Monzon C (2005): Gene
expression profile of T-cell-specific chemokines in
human hepatocyte-derived cells: evidence for a
synergistic inducer effect of cytokines and hepatitis
C virus proteins. J. Viral Hepat., 12: 27-37.
33-Sillanpaa M, Kaukinen P, Melen K,
Julkunen I (2008): Hepatitis C virus proteins
interfere with the activation of chemokine gene
promoters and downregulate chemokine gene
expression. J. Gene Virol., 89: 432-443.
34-Harvey CE, Post JJ, Palladinetti P, Freeman
AJ, Ffrench RA, Kumar RK, Marinos G, Lloyd
AR (2003): Expression of chemokine IP-10
(CXCL10) by hepatocytes in chronic hepatitis C
virus infection correlates with histological severity
and lobular inflammation. J. Leukoc. Biol., 74:
360-369.
35-Helbig KJ, Ruszkiewicz A, Semendric L,
Harley HA, McColl SR, Beard MR (2004): Expression of the CXCR3 ligand 1-TAC by
hepatocytes in chronic hepatitis C and its
correlation with hepatic inflammation. Hepatology,
39: 1220-1229.
36-Zeremski M, Petrovic LM, Chiriboga L,
Brown QB, Yee HT, Kinkhabwala M, Jacobson
IM, Dimova R, Markatou M, Tala AH (2008): Intrahepatic levels of CXCR3-associated
chemokines correlate with liver inflammation and
fibrosis in chronic hepatitis C. Hepatology, 48:
1440-1450.
37-Friedman SL (2003): Liver fibrosis-from
bench to bedside. J. Hepatol., 38 Suppl 1:S38-S53.
38-Kastenmuller W, BrandesM, Wang Z, Herz
J, Egen JG, Germain RN (2013): Peripheral pre-
positioning and local CXCL9 chemokine-mediated
guidance orchestrate rapid memory CD8+ T cell
responses in the lymph node. Immunity, 38(3):
502-513.
IFN-Stimulated Genes Upregulation…
402
Table (3): The CHCV patients as regarding CXCL9, CXCL10, CXCL11and CXCR3 genes.
Variable
Genes
Mean Stand. Deviation P Value
CXCL9 1.49 1.25 .010
CXCL10 1.60 1.14 .014
CXCL11 1.7 1.24 <0.001
CXCR3 1.31 1.13 .089
This table shows that the variable genes were increased in CHCV patients with statistically significant
value by using T-test (p< 0.05).
Graph (1): Quantitative expression levels of CXCL 9 gene in CHCV patients as compared to
healthy controls.
Graph (2): Quantitative expression level of CXCL 10 gene In CHCV patients as compared to
healthy controls.
0
0.2
0.4
0.6
0.8
1
1.2
1.4
1.6
cases control
CXCL9
P=0.01
0
0.2
0.4
0.6
0.8
1
1.2
1.4
1.6
1.8
cases control
CXCL10
P=0.014

Saadia Farid et al
403
Graph (3): Quantitative expression level of CXCL 11 gene In CHCV patients as compared to
healthy controls.
Graph (4): Quantitative expression level of CXCR3 gene In CHCV patients as compared to
healthy controls.
0
0.2
0.4
0.6
0.8
1
1.2
1.4
cases control
CXCR3
P=0.089

IFN-Stimulated Genes Upregulation…
404
Table (4): Comparison between CHCV patients and control group as regard lab data.
P T Controls
N=20
Cases
N=51 Variables
<0.001
HS 8 9+3.5 32.7+12 PD1% expression in CD8+T
<0.001
HS 6 0.09+0.02 0.65+0.3 PD1 gene
--- --- --- 9,101,35+179,566 Viral load
This table shows statistically significant difference between both groups as regard programmed death-1
(PD-1) gene and expression levels of CD8+T cells by using unpaired t-test.
Graph (5): Quantitative Expression level of CD8 + T cell in PBMCs from patients with CHCV in
comparison to the healthy controls (Code: 1.00 = patients & 2.00 = controls).
2051N =
CODE
2.001.00
CD
8
70
60
50
40
30
20
10
0
Saadia Farid et al
405
2051N =
CODE
2.001.00
PD
-1%
2.0
1.5
1.0
.5
0.0
-.5
11
47
Graph (6): Quantitative expression level of PD-1 % in PBMCs from patients with CHCV in comparison
to the healthy controls (Code: 1.00 = patients & 2.00 = controls).
Copyright © 2022 FDOKUMEN