A Type I and Type II microsatellite linkage map of Rainbow trout (Oncorhynchus mykiss) with...
13
BioMed Central Page 1 of 13 (page number not for citation purposes) BMC Genomics Open Access Research article A Type I and Type II microsatellite linkage map of Rainbow trout (Oncorhynchus mykiss) with presumptive coverage of all chromosome arms René Guyomard*, Stéphane Mauger, Kamila Tabet-Canale, Sylvain Martineau, Carine Genet, Francine Krieg and Edwige Quillet Address: Institut National de la Recherche Agronomique, Laboratoire de Génétique des Poissons, Domaine de Vilvert, Jouy-en-Josas, 78352, France Email: René Guyomard* - [email protected]; Stéphane Mauger - [email protected]; Kamila Tabet- Canale - [email protected]; Sylvain Martineau - [email protected]; Carine Genet - [email protected]; Francine Krieg - [email protected]; Edwige Quillet - [email protected] * Corresponding author Abstract Background: The development of large genomic resources has become a prerequisite to elucidate the wide-scale evolution of genomes and the molecular basis of complex traits. Linkage maps represent a first level of integration and utilization of such resources and the primary framework for molecular analyses of quantitative traits. Previously published linkage maps have already outlined the main peculiarities of the rainbow trout meiosis and a correspondance between linkage groups and chromosome arms has been recently established using fluorescent in situ hybridization. The number of chromosome arms which were covered by these maps remained unknown. Results: We report an updated linkage map based on segregation analysis of more than nine hundred microsatellite markers in two doubled haploid gynogenetic lines. These markers segregated into 31 linkage groups spanning an approximate total map length of 2750 cM. Centromeres were mapped for all the linkage groups using meiogenetic lines. For each of the 31 linkage groups, the meta or acrocentric structure infered from centromere mapping was identical with those recently found with fluorescent in situ hybridization results. The present map is therefore assumed to cover the 52 chromosome arms which constitute the rainbow trout karyotype. Our data confirm the occurrence of a high interference level in this species. Homeologous regions were identified in eleven linkage groups, reflecting the tetraploid nature of the salmonid genome. The data supported the assumption that gene orders are conserved between duplicated groups and that each group is located on a single chromosome arm. Overall, a high congruence with already published rainbow trout linkage maps was found for both gene syntenies and orders. Conclusion: This new map is likely to cover the whole set of chromosome arms and should provide a useful framework to integrate existing or forthcoming rainbow trout linkage maps and other genomic resources. Since very large numbers of EST containing microsatellite sequences are available in databases, it becomes feasible to construct high-density linkage maps localizing known genes. This will facilitate comparative mapping and, eventually, identification of candidate genes in QTL studies. Published: 30 November 2006 BMC Genomics 2006, 7:302 doi:10.1186/1471-2164-7-302 Received: 16 August 2006 Accepted: 30 November 2006 This article is available from: http://www.biomedcentral.com/1471-2164/7/302 © 2006 Guyomard et al; licensee BioMed Central Ltd. This is an Open Access article distributed under the terms of the Creative Commons Attribution License (http://creativecommons.org/licenses/by/2.0 ), which permits unrestricted use, distribution, and reproduction in any medium, provided the original work is properly cited.
-
Upload
independent -
Category
Documents
-
view
1 -
download
0
Transcript of A Type I and Type II microsatellite linkage map of Rainbow trout (Oncorhynchus mykiss) with...

BioMed CentralBMC Genomics
ss
Open AcceResearch articleA Type I and Type II microsatellite linkage map of Rainbow trout (Oncorhynchus mykiss) with presumptive coverage of all chromosome armsReneacute Guyomard Steacutephane Mauger Kamila Tabet-Canale Sylvain Martineau Carine Genet Francine Krieg and Edwige Quillet
Address Institut National de la Recherche Agronomique Laboratoire de Geacuteneacutetique des Poissons Domaine de Vilvert Jouy-en-Josas 78352 France
Email Reneacute Guyomard - ReneGuyomardjouyinrafr Steacutephane Mauger - StephaneMaugerjouyinrafr Kamila Tabet-Canale - KamilaTabetjouyinrafr Sylvain Martineau - SylvainMartineaujouyinrafr Carine Genet - CarineGenetjouyinrafr Francine Krieg - FrancineKriegjouyinrafr Edwige Quillet - EdwigeQuilletjouyinrafr
Corresponding author
AbstractBackground The development of large genomic resources has become a prerequisite to elucidate thewide-scale evolution of genomes and the molecular basis of complex traits Linkage maps represent a firstlevel of integration and utilization of such resources and the primary framework for molecular analyses ofquantitative traits Previously published linkage maps have already outlined the main peculiarities of therainbow trout meiosis and a correspondance between linkage groups and chromosome arms has beenrecently established using fluorescent in situ hybridization The number of chromosome arms which werecovered by these maps remained unknown
Results We report an updated linkage map based on segregation analysis of more than nine hundredmicrosatellite markers in two doubled haploid gynogenetic lines These markers segregated into 31 linkagegroups spanning an approximate total map length of 2750 cM Centromeres were mapped for all thelinkage groups using meiogenetic lines For each of the 31 linkage groups the meta or acrocentricstructure infered from centromere mapping was identical with those recently found with fluorescent insitu hybridization results The present map is therefore assumed to cover the 52 chromosome arms whichconstitute the rainbow trout karyotype Our data confirm the occurrence of a high interference level inthis species Homeologous regions were identified in eleven linkage groups reflecting the tetraploid natureof the salmonid genome The data supported the assumption that gene orders are conserved betweenduplicated groups and that each group is located on a single chromosome arm Overall a high congruencewith already published rainbow trout linkage maps was found for both gene syntenies and orders
Conclusion This new map is likely to cover the whole set of chromosome arms and should provide auseful framework to integrate existing or forthcoming rainbow trout linkage maps and other genomicresources Since very large numbers of EST containing microsatellite sequences are available in databasesit becomes feasible to construct high-density linkage maps localizing known genes This will facilitatecomparative mapping and eventually identification of candidate genes in QTL studies
Published 30 November 2006
BMC Genomics 2006 7302 doi1011861471-2164-7-302
Received 16 August 2006Accepted 30 November 2006
This article is available from httpwwwbiomedcentralcom1471-21647302
copy 2006 Guyomard et al licensee BioMed Central Ltd This is an Open Access article distributed under the terms of the Creative Commons Attribution License (httpcreativecommonsorglicensesby20) which permits unrestricted use distribution and reproduction in any medium provided the original work is properly cited
Page 1 of 13(page number not for citation purposes)
BMC Genomics 2006 7302 httpwwwbiomedcentralcom1471-21647302
BackgroundThe development of genomic resources is a key steptowards further investigation of wide-scale genome evolu-tion identification and study of gene or gene networksinvolved in complex characters Such efforts have natu-rally focussed on genetic model systems and species ofapplied biomedical or agronomical importance In thecase of rainbow trout genetic resources have been prima-rily developed in order to study the gene networks con-trolling the phenotype of traits that affect breedingperformances or fisheries sustainability and to identifymutations responsible for the genetic variation of thesetraits However the rainbow trout is also a suitable modelto investigate more academic scientific questions(reviewed in [1]) such as the evolution of duplicatedgenomes Two genome duplications seem to have takenplace during the early evolution of vertebrates Studiesbased on Hox clusters in several ray-finned fishes andrecent comparative analyses of Takifugu and Tetraodongenomes with the Human genome have supported theview that a third whole genome duplication occurred inthe ray-finned fish lineage approximately 350 My ago [2-4] The salmonid family has undergone an additionalfourth genome duplication [56] which occurred 25ndash100My ago Therefore the salmonids offer the opportunity tostudy evolution of duplicated genomes at much earlierstages after a polyploidisation event
The construction of linkage maps is a primary steptowards the description and understanding of the struc-ture and evolution of whole genomes In rainbow troutseveral linkage maps based on segregations at AFLP andmicrosatellite loci have been already published [7-11] andsuccessfully used to map QTL for growth disease suscep-tibility thermal tolerance early development [12-16] orto study the duplicated status and chromosomal localisa-tion of gene families playing critical roles in major func-tions [17-20]
These linkage maps have allowed to ascertain severalimportant features of the meiosis and genome structure inthe rainbow trout Briefly female maps are three to fourtimes longer than male ones on the average while telom-eric regions show higher average recombination rate inmale than in female [10] Several homeologous regionssharing homology due to the recent tetraploidisationevent were identified Some of these homeologousregions exhibited pseudolinkage [10] Pseudolinkagerefers to a non-random segregation of homeologousregions which results from preferential pairing and alter-nate disjunction of homeologous regions inherited fromthe same grand parent It occurs in males only [21]
The current consensus linkage map consists of 31 majorlinkage group [89] Since the diploid chromosome
number in the rainbow trout ranges from 58 to 64 chro-mosomes due to a wide range of Robertsonian polymor-phism [22] this number falls within the range of expectedlinkage group numbers More recently the rainbow troutgenetic linkage groups have been assigned to specificchromosomes using fluorescent in situ hybridisation ofBACs [23]
In this article we report a new rainbow trout map Themain objective was to cover all the chromosomes armsThis information is of importance in rainbow trout sincedue to Robertsonian polymorphism the number of chro-mosomes and therefore of independent linkage groupscan vary among families while the number of chromo-somes arms are the constant basic characteristic of therainbow trout karyotype The construction of the map wasbased on segregation analysis of nearly one thousand mic-rosatellite markers in two doubled haploid lines whichare currently used in our laboratory A particular effort wasmade to map the centromere of each linkage group usingmeiogynogenetic progeny in order to determine the acro-centric or metacentric structure of each linkage group
Finally since approximately one third of the mapped mic-rosatellites originated from ESTs sequences we attemptedto recover conserved syntenies between rainbow trout andzebrafish by comparing the map localisation of homolo-gous sequences in the two species
ResultsNumber of informative lociOut of 1321 microsatellite primer pairs tested 168 didnot give any amplification at two annealing temperatures(58 and 52degC) and 366 were monomorphic in the testsample and 796 were informative in one family at leastThree hundred and eighty-nine microsatellite primer pairswere designed from EST sequences Eighty primer pairsoriginated from USDA EST sequences of which eight havebeen already mapped [7] The annealing temperature was58degC for all the informative markers The 309 markersdeveloped from the SIGENAE-EST database were num-bered Omy1009INRA to Omy1513INRA All these mark-ers including sequence primer sequences and PCRconditions were submitted to the STS database in Gen-Bank and assigned accession numbers BV681317 throughBV681637 One hundred and five primer pairs amplifiedduplicated loci The two female founders of INRA1 andINRA2 were heterozygous for one SNP at BX087958 andonly the female parent of INRA1 at BX087759 A totalnumber of 903 loci including the two SNPs were inform-ative for the segregation analysis
Number of linkage groupsThe comprehensive composite map was obtained bymerging the data sets from the two DH families (see Fig-
Page 2 of 13(page number not for citation purposes)
BMC Genomics 2006 7302 httpwwwbiomedcentralcom1471-21647302
ures 1 2 3 4) This map consisted of 31 linkage groupsand one unassigned marker Correspondences with previ-ous linkage map [89] and with specific chromosomesbased on FISH results [23] are given (see Additional file1) RT28 identified in [8] was merged with RT8 here (twounduplicated loci in common) In this study linkagegroup RT2 consisted of two unlinked fragments RT2Aand RT2B Family specific maps consisted of 32 and 35linkage groups in INRA1 and INRA2 respectively Fourlinkage groups (RT6 RT8 RT15 and RT20) consisted oftwo unlinked fragments in family INRA1 and only one infamily INRA2 Similarly two unlinked fragments werefound in family INRA2 for linkage group RT7 instead ofone in INRA1 As expected no significant pseudolinkagewas found in female meiosis
Centromere mapping and arm numbers of linkage groupsTwo to 9 loci per linkage group were mapped in the meio-genetic line (see Figures 1 2 3 4) In all cases the markerorders obtained for a minimal number of recombinationevents were identical to the ones found in the two map-ping families For twenty linkage groups (RT3 RT5 toRT10 RT12 RT14 to RT16 RT19 to RT24 RT27 RT29 andRT31 see Figures 1 2 3 4) the loci showing less recom-bination were found within the linkage group and thesegroups were assumed to have a metacentric structureThese groups exhibited the highest numbers of doublecrossovers and almost all of the triple CO and quadrupleCO events found in INRA1 and INRA2 families (seeAdditional file 1) Double crossover numbers ranged from13 in RT24 to 38 in RT31 while the other linkage groupshad 3 double crossovers or less with the exception of link-age group RT17 (see below) Altogether these figures werein agreement with the hypothesis of high interference gen-erally assumed in salmonids and the occurrence of onechiasma per arm in most cases at meiosis I [2425] Underthis hypothesis metacentric chromosomes are expected toshow mostly zero one or two crossovers while acrocentricones mostly zero or one For each metacentric group thedistribution of the position of the recombination eventsacross all the individuals of INRA1 and INRA2 allowed todetermine the positions which minimized the number ofdouble recombinants on each arm These position delim-ited putative centromere intervals which were consistentwith those of the half-tetrad analysis performed in meio-genetics and sometimes suggested a more precise localisa-tion of centromeres (see Figures 1 2 3 4) These 20metacentric groups allowed to identify 40 chromosomearms out of 52 The segregation data in the meiogeneticprogeny resulted in the localisation of the centromere atone extremity for the remaining linkage groups and led tothe identification of only 11 arms instead of 12 SinceRT2A RT2B on one hand and RT4 and RT25 were tightlylinked and formed metacentric groups in the meiogeneticfamily these four linkage groups were likely to be acro-
centric in INRA1 and 2 RT1 which corresponds to thechromosome bearing the Sex determinant [89] is alsostated to be acrocentric or subtelocentric [22] Among thesix remaining linkage groups RT17 which showed a rela-tively large number of double crossovers in both INRA1and 2 families (see Additional file 1) and which was 87cM in length emerged as a possible metacentric group
Duplicated regionsThe 105 duplicated markers were distributed over a totalof 27 linkage groups (Table 1) Four linkage groups didnot show any duplicated loci and eleven linkage groupsshared homologies with two or more different linkagegroups (up to four) Twenty-two putative homologoussegments were found Ten of these segment homologieswere based on co-localisation of multiple duplicates Onelinkage group RT9 shared homologies with RT2B andRT24 while RT2A shared homology with RT29 The local-ization of the centromeres was compatible with theassumption that each duplicated region was located on asingle chromosome arm (see Figures 1 2 3 4) with theexception of RT3RT25 These two groups shared threeduplicated loci which encompassed the centromericregion of the metacentric RT3 linkage group Markerorders and orientation with respect to the centromerewere conserved between duplicated regions provided thatmodifications in the order of very few markers were intro-duced in the comprehensive map
Map length and genome coverageThe map length estimated by the sum of recombinationpercentage between adjacent markers was 2750 cM andwas slightly lower than the value obtained with theKosambi distance as mapping function (2773 cM) Thissmall difference probably reflected the fact that very fewmultiple crossovers per arm were detected despite therather large average number of markers per group (seeAdditional file 1) Assuming that the centromere posi-tions lied within the intervals proposed (see Figures 1 23 4) the total number of multiple CO events per armobserved in these two families was estimated to 79 onlyfor a total number of 2975 recombination events In themeiogenetic family all genotypes leading to doublerecombinants per arm were re-genotyped Only six casesof double crossovers per arm out of a total observednumber of 2041 crossovers were found Double crosso-vers per arm were not found in a majority of linkagegroups even over long map distances since up to 100 heterozygous progenies were found at distal loci Thesefinding also supported the hypothesis of high to near-complete interference
Comparative mapping with zebrafishThe comparison of 369 rainbow trout EST to the transcriptsequences of the zebrafish with BLASTn resulted in 49 hits
Page 3 of 13(page number not for citation purposes)
BMC Genomics 2006 7302 httpwwwbiomedcentralcom1471-21647302
Page 4 of 13(page number not for citation purposes)
Graphic representation of linkage groups RT1 to RT9Figure 1Graphic representation of linkage groups RT1 to RT9 Groups are numbered as in Nichols et al (2003) Map distances are given in centiMorgan using recombination percentage between loci Loci with names in blue italic type were used for centro-mere mapping in the meiogenetic line Recombination fraction for these loci are given Putative interval of centromere localisa-tions are materialized by black areas Loci in bold type are those of the framework map marker informative in INRA1 only marker informative in INRA2 only
Omy1339INRA(0)00
OMM166539OmyFGT191TUF71OMM111896Omi34TUF105
Omy1294INRAOMM1772196Ots517 NWFSC229Omy1200INRA(028)237
Ssa408UOS308
OMM1372419OMM5136472Omy1012UW506HMG-1 OMM52671L32859 Omy1282INRAOMM1000
515
Omy1367INRA Omy13962INRAOmy1326INRA Omy17INRAOts516 NWFSC(100)
523
OMM1026542Omy1165INRA599SSsp2215609
RT1OMM3006(022)00OMM1162 OMM180818
Omy1310INRABFRO 001(060)Omy11261INRA Ots-2
87
Ssa208 Ssa407UOS129
BX301679Omy11971INRA(089)Omy10461INRA OMM10641
239
Omy111INRA OMM51651(091)248OMM13301258Omy11301INRA Omy11451INRACocl-lav741 Cocl-lav721Omy11871INRA OMM13612
315
Omy10791INRA324Omy14761INRA360
RT2A
Omy12971INRA00Omy13771INRA21Omy1513INRA OMM5320(032)37Omy1415INRA54
OmyRGT40TUF204
OKi1315Ots521 NWFSC341OmyFGT181TUF OMM12001Omy14801INRAOKi271
391
Omy11921INRA OMM51851OMM12181
408
Omy14191INRA Oke11OMM12931 Omy13751INRA
416
Omy14391INRA424OMM1262(093) OMM12741OMM50191 OMM53191OMM12061
441
RT2B
Omy1097INRA(1) OMM517400
Omy1099INRA102
Omy1137INRA150
Ogo22(0)340Omy1400INRA348Omy1263INRA356OMM5264373
OMM1189 Omy1170INRA(0)465
OMM5199 OMM1312OMM5271 Omy1023INRAOmyUW11022 Ogo1
538
OMM1230677
Omy1018INRA703
Omy1443INRA(028)738
OMM1346826
Omy13331INRA Omy1347INRA973
Omi902TUF1058Omy1441INRA1076
RT3OMM1301 Ssa412UOS(0)
Omy1149INRA
OMM5137
OMM1193(02)
Oneu6(097)
Omy1351INRA
00
26
97
241
325
390
RT4
Omy1413INRA(023)00
Omy1296INRA(014)34
Omy1510INRA243OMM1728264
Omy1167INRA(013)360OtsG249One107(008)377
CA061336499
OMM1032610OMM1007629
Oke3689
OMM1104749
OMM1286(05)799OKi29816OMM1011 Omy1096INRA833
Omy1270INRA892OMM1365910
RT5
OMM52421 BX871195100Omy16INRA19
OmyRGT55TUF OMM1359126
OMM1776(075)160
Cocl-lav221270
OMM1082343
Omy1276INRA471
OMM1046544
OMM1454(0) OMM1804BHMS425
635
OMM1780727
Omy1185INRA948
OMM52942 Omy1143INRA(06)OMM1205 OMM5147
996
OMM11511102
OMM1081(088)1181Ssa2019NUIG1199
OMM1231(089)1235
Omy1354INRA1335
RT6
OMM173200Omy1207INRA17Ogo434
Omy1105INRA(098)OMM5160109
Omy207UoG267
Omy12831INRA434
Omy0003DIAS473OmyRGT17TUF490
OMM1832520
OMM1087(002)550
OMM1351651
Omy7INRA(001)732
OMM1764897
Oneu12Oneu11952
OMM11121008OMM1012 Omy1474INRA1022OMM11641 OMM10771050
OMM1376(0 37)1092
OMM119611120
Omy1352INRA Omy13271INRAOMM17691 OMM18001
1171
RT7
Omy1236INRA00OMM1009(086)18One112 OMM5213Omi134TUF Cocl-Lav41Omy1336INRA OMM5181Omy1268INRA OMM1716OMM1667 Omy1266INRAOmy11502INRA Omy18INRA
86
CA060381Omy1169INRA(0)237
OMM1793 OMM18251OMM1972
304
Omy1435INRA313OmyFGT12TUF351
OmyUW1198424
Omy1471INRA512
Omy1390INRA(059)604
OKi26Ogo3OMM5318 OMM5205
655
OMM1075699
RT8
OMM1362 OMM1023Omy14012INRA
00
Omi65TUF(098)09
Omy1016INRA230OMM5162 OMM1744245
Omi20TUF Omy1164INRACA040745
351
Omi126TUF(0)426Struta-11434
Omy1508INRA527
OmyUW1552 OMM1445597OMM5133 Omy1387INRA616
Omy1191INRA820Ssa420UOS(079)839
Omy1158INRA960
RT22
BMC Genomics 2006 7302 httpwwwbiomedcentralcom1471-21647302
Page 5 of 13(page number not for citation purposes)
Graphic representation of linkage groups RT10 to RT17Figure 2Graphic representation of linkage groups RT10 to RT17 Legends are the same as in Figure 1
OMM1179 OMM5306Omy1195INRA
00
Omy1322INRA19One10331
OMM5254(082)90
Omy1332INRA162Omy1160INRA Oneu10OMM5004 One111
170
Omy1394INRA263
Omy1477INRA Omy1288INRAOmy1141INRA
356
OmyRGT2TUF364OmyUW1225387
BHMS431465OKi23(0)483OMM1710 Omi44TUF500BHMS117B OMM1768508
OMM1753668
OMM1294 OMM1451703
Omy14272INRA733
OMM5186846
Omy38DU(058)908
OMM1718941
OMM12132991
OMM12021 Omy11631INRA1037
RT10
OMM5261(0)00Omy1469INRA(0)39Ots520 NWFSC(0)75OMM5178 OMM1310(0)92Omy1249INRA100OMM1172 Ocl1UWOMM1154
125
Omy7DIAS158Omy1496INRA171OMM1209182
Omy13DIASOMM1018276
Omy1179INRA(064)326
OMM5006392Omy1134INRAOMM1315401SSOSL322415
Ots515 NWFSCOmy1017INRA483Omy23INRAOMM1004503OMM1084511
RT11Omy12121INRA00Omy31INRA(100)24Ots100SSBI Omy10081UWSsa403UOS1
55
Ssa402UOS1 Omy13971INRAOmy10621INRA OMM17251
64
Omy10951INRA OMM1329(100)72OMM1127 Omy1216INRA89OmyOGT5TUF1 Omy15071INRAOmy14461INRA
122
OMM1158 Omy13961INRABX305657
139
OMM5233 OMM1478147OMM13451163
OMM51611297
OmyFGT4TUF325
OMM1066(042)OMM1030(044)409Omy1138INRA427
OMM1277481
OMM5328(0)590
OMM1006710OMM3054 OMM3061OMM3049 Omy1202INRA(023)OMM3059 OMM3050OMM3048
743
OMM1136768
Omy1487INRAOMM1809Omy16DIAS(06)
897
Omy1384INRA Omy1313INRA914OMM1381925
OMM1662983Omy1118INRA1000Omy1210INRA1010
Omy1430INRA1079Omy1440INRA1088OMM52101110OMM1740 OMM1239OMM1234 OMM1468
1132
RT12
Omy1039INRA(0)Ssa417UOS(0)00
OMM1216(0)61
OMM1762(0)95
BX8700522 OMM1388(0)146
OmyRGT46TUF333
OMM1020435Omy1479INRA(002)452
OmyRGT14TUF(045)492 Ocl4UW(025)516
OMM1783546Omy1194INRA561Omy1211INRA Omy1265INRAOmyRGT51TUF
576
Omy1013UW OmyRGT47TUFOmy1173INRA(1)Omy1307INRA
584
RT13
Ssa410UOS00Omy1305INRAOMM124117Omy19DIAS25Omy1127INRA41
OMM1279 Omy1113INRA103
OMM1374 OMM5327195
Omy1214INRA(071)237
OMM1086286
Omy1372INRA328
Omy1182INRA356
OmyRGT43TUF461
Omy1407INRA OMM5216493
SSa14DU(0)552
Omy1374INRA(02)753
OMM50172 OMM51682909OMM11342(032)933OMM16572950Omy1328INRA959Omy12422INRA OMM11742988Omy1202INRA Omy13912INRA1013Omy14862INRA1054OMM11242 Omy1016UW2OMM12272 OKi13Omy12322INRA(075)Ots5122 NWFSCOmyUW11772
1095
Omy42INRA1134
RT14
Omy1058INRA(1)00OMM1729 OmyRGT21TUF24
BX88756357OMM5266 Omy1383INRA(089)74
Omy1330INRAOMM5298143
Str11INRA Omy1248INRA(023)203Omy14INRA218
Omy1112INRA292
OMM1166 OMM1028(0)474
Ots-1516OMM1067547Omy1378INRA OMM1051558
OMM1745651
Omy1356INRA702OMM11642 OMM1036727
OMM1820 Omy1004INRA(077)803
OMM1455871
OMM11962 OMM18002OMM1444
913
OMM17692 Omy13272INRA963
RT15
OMM5269(086)00
OMM109051
OMM1139 OMM1076136
Omy1456INRA172
OtsG85(039)254
OKi6459OtsG422(007)477Omy1389INRA(003)495OMM1117 OMM1116512
Omy1151INRA573
Omy1376INRA(0)634
OMM5149 Omy14011INRAOMM5244727
OMM1360(0)801
OMM1775850BHMS322865Omy1108INRA(0)870
RT17
Omy14462INRA
Omy10952INRA
OMM135200OmyUW1211(100)Omi1022TUFOmy1499INRA
18
OMM110277OMM1101 Och1185
Omy1224INRA128Omy1045INRAOMM5002Omy13332INRA
154
Ots518 NWFSC222Omy1038INRA234
OmyRGT3TUF Omy1227INRA438
OMM1830 OMM1746523Omy1298INRA532Omy1110INRA541Omy8INRA(002)567OMM1713584OMM1088 OMM1013592
OMM1815685
OMM51612745
Omy1318INRA790
Omy77DU(069) OMM1156910OMM13452918OMM1714926CA345149930OmyOGT5TUF2934Omy1190INRA950Omy15072INRA1008OmyFGT192TUF1032OMM17171064OMM1226 OMM1403Omy13972INRA
1098
Omy10082UWSsa402UOS2 OMM17252Omy10622INRA
1115
Omy32INRA(100)1143Omy12122INRA1153
RT16
BMC Genomics 2006 7302 httpwwwbiomedcentralcom1471-21647302
Page 6 of 13(page number not for citation purposes)
Graphic representation of linkage groups RT18 to RT25Figure 3Graphic representation of linkage groups RT18 to RT25 Legends are the same as in Figure 1
Ocl8UW(032)00Omi127TUF OMM145818
Omi174TUF OMM1375(0)208
Omy1235INRA OMM5018OMM5307 Omy12832INRAOMM1035 OMM1025
407
Ots-209483
tcaa0002cb16A534
Omy1279INRA614
BX087958747Omy1363INRA Omy1286INRA773
Omy1362INRAOMM1008807
OmyUW1191(017) OMM5289841
OKi10899
OMM1333953Omy1155INRA963Omy103INRA971OmyUW1052 Omy1132INRA988Oneu3f1005
RT19
OMM110700OMM1120(098)42Omy1348INRA OMM1448OMM52672 Omy1289INRAOmi105TUF
67
Omy1020INRA92OMM1050(098)118
SSLEEN82(048)321
Omy1382INRA(019) Omy0008DIAS469OMM1544480Omy1412INRA Omy1254INRABX087759 Omy1002INRA512
Omy11501INRA594
OMM11741730
Omi1021TUF Omy17DIAS788
OMM50171 Omy1116INRAOMM11341(043) OMM51681861
OMM16571 Omy12421INRA879OMM11241 Omy1201INRAOmy13911INRA952
Omy14861INRA974Omy1016UW1
OMM12271Omy12321INRA(093)Ots5121 NWFSC
985
OmyUW117711001Omy41INRA1020
RT20
Omy325UoG00Omy10INRA OMM1060Omy1260INRA SSsp160525
Omy1359INRA62
OMM1491106
OMM5132(086) Ssa405UOS144OMM1367172
Omy301UoG232OmyFGT2TUF244
Omy1013INRA388
Omy1219INRA449OMM1145 OmyFGT27TUFOmy1093INRA484
Omy0002DIASOmyRGT26TUF492OMM1824509OKi8554OMM1736 Omy1035INRA(0)569
OMM5014731
OmyUW1090831
OMM1059895
OMM5179945OMM5197978Omy1403INRA(095) OMM5129Omy1512INRA1011
OMM10891078
Omy1252INRAOMM51261137OMM12711154
OMM14531198
RT21
OmyRGT12TUF(003)00
Omy14271INRA(024)115
OMM1384237
OMM1159(044)298
OMM1512426OmyRGT44TUF omDIAS1460Omy1001UW481OMM1311502
OMM12131544Omi187TUF(1)576
Omy11632INRAOMM12022608
Omy335UOG654
RT18
OMM1362 OMM1023Omy14012INRA00
Omi65TUF(098)09
Omy1016INRA230OMM5162 OMM1744245
Omi20TUF Omy1164INRACA040745351
Omi126TUF(0)426Struta-11434
Omy1508INRA527
OmyUW1552 OMM1445597OMM5133 Omy1387INRA616
Omy1191INRA820Ssa420UOS(079)839
Omy1158INRA960
RT22
Omy1306INRA00OMM132217
Omy0004DIASOMM1105(012)One108145
OMM1449162BX296674 Omy12871INRAOmy12311INRA Omy1233INRA212
OmyPuPuPyDU272Ssa85DU OMM1397(0)281
OMM1402347
OmyRGT36TUF Omy1342INRA429
OMM1211559
OMM1690603Omy1393INRA620OMM1045646OMM1727680Omy1335INRAOMM1194Omi58TUF731
OmyFGT16TUF (100)740
RT24
00
5572
84
115
OMM1097
BX307443OMM1459OMM1069 Ssa401UOSOmy1125INRA Omy1069INRASSLEET47
OMM1538192
Omy1502INRA360
Omy1475INRA(031)425
Omy27INRAOmy1501INRA489Omy1358INRA510OMM1109531
OmyRGT10TUF641Omy1124INRA655
OMM1719(0)719OMM1339 Omy1184INRA(0)728Ots-212(0)737OMM5003(002)754Ots506 NWFSC802
OMM5222838
OMM1190909Omy1368INRA918Omy1361INRA945
Omy1278INRA(049)1097
OMM5010 BX87005211293Omy1103INRA Ots522 NWFSC1302OmyRGT9TUF1306OMM5125 Omy1366INRANaK ATPaseα OMM1095OMM1276
1310
OMM1178 OmyFGT23TUF1343
RT23
Ogo21(0)00
OMM1389(0)70Omy1467INRA88
OmyUW11021156OMM1797175
OmyRGT7TUF261Omy1259INRA270Omy1014UW304
OMM1054(066)338
Omi901TUF457
RT25
BMC Genomics 2006 7302 httpwwwbiomedcentralcom1471-21647302
Page 7 of 13(page number not for citation purposes)
Graphic representation of linkage groups RT26 to RT31 (RT28 does not exist)Figure 4Graphic representation of linkage groups RT26 to RT31 (RT28 does not exist) Legends are the same as in Figure 1
Och1600OMM1607 OMM1033(098)Omy1293INRA Omy1025INRAOMM1751
09
OMM181236
OMM3062 OMM3063OMM3047 Ots108(065)OmyRGT19TUF
145
OtsG243279
Omy1271INRA344OMM1201 Omi111TUF357
OmyFGT3TUF(002)409
OMM1073476Omy1040INRAOMM1712OmyUW1223 Omy1468INRA
493
OMM1705 Omy1371INRA(000)553
OtsG43587
OMM1505690
Omy21INRA755
OMM1720 Omy11262INRA(070)OMM1743
854
OMM51652(091)OMM10642Omy11972INRAOMM13302OMM13611
994
Omy10462INRA1026Omy112INRA Cocl-lav742Omy14762INRA
1037
Omy10792INRA1045Omy11452INRA(090)Cocl-lav7221071Omy11302INRA Omy11872INRAOmy1247INRA
1113
RT29
Omy1380INRA(0)00BHMS247(045)18
OMM5011(029)87
Omy5DIAS(038)161OMM1395 OMM52422OmyRGT24TUF(044)
189
Omy1014INRA Omy108INRA(051)OMM1019 OmyRGT34TUF
240
Omy1049INRA258Omi84TUF278
OMM1238454
Omy1302INRA OMM1723(1)OMM1826 BX8711952
508
Omy1166INRA577
RT30
Ots526 NWFSC00Omi2102TUFOmy10602INRA17Omy14262INRA43OMM17782 OMM5000269CA349040103Oneu182(086) OMM1138OmyFGT82TUF OmyRGT132TUF
120
Omy2722UoG212Str42INRAOMM52462OmyUW1077
229
One102 Omy13002INRA237
Omy1308INRA321Omy13232INRA329
Omy1006UW403Omy1373INRA414OMM1765439Omy1027INRA447
OMM1058(002)506OMM1083515
BHMS129734OMM5146752
Omy1349INRA839OMM5164(051)859
OMM1053951
Omy1009INRA Omy1067INRA1047
Omy1136INRA1103
Omy1241INRA OMM50051160OMM1599 Omy1392INRA1168
RT31
Omy1398INRA Omy1321INRA(005)00Omy1420INRA(005)08Cocl-lav69(005)16
OMM1767321Omy1511INRA OmyRGT39TUF329OMM1734337OMM3000 Omy111DU(054)354
OMM1756489Omi66TUF534OMM1015(098)557OmyFGT24TUF565Omy1284INRAOmy1350INRAOMM1228
582
SSOSL321599
RT26
Omy1178INRABX86338000
Omy25INRA(07)59
OMM52941195Omy1264INRA209
Omy1148INRA303
OMM1039333
Oke4(0) Omy1015INRAOmy1423INRA
467
OMM1070 MST-15492Omy1428INRA533OMM1364587Omy13231INRA616Omy2721UoG630Ocl-2648OmyUW1119 Omy13001INRA(046)Ssa403UOS2
665
Omy1429INRA(05) BX313262686OMM52461 OMM1108707Str41INRA740Omi175TUF795Oneu181(066)840OmyFGT81TUF(081)858Omy1472INRA Omy1204INRAOMM5188 Omy21DIAS
876
OMM50001889OmyRGT131TUF OtsG423902OMM17781906Oke12 Omy14261INRAOMM1131
910
Omi2101TUF927Omy29INRA(092)963OMM5270 Omy10601INRA997
RT27
BMC Genomics 2006 7302 httpwwwbiomedcentralcom1471-21647302
with e-values lt 10-5 The assignment of the correspondingloci to the linkage groups of each species and the con-served syntenies are reported in Table 2 These loci cov-ered 21 linkage groups in zebrafish and ten of themhoused two or more loci In all cases zebrafish linkagegroups showed putative homologies with more than onerainbow trout linkage group irrespective of the duplica-tion in this species Six syntenies were conserved In bothspecies two of them involved two tightly linked lociBX296674Omy1233INRA and Omy1069INRAOmy1125INRA) while the four other ones emcompassedlarge gene distances It is noteworthy that RT9 and RT2Bappeared as a mosaic of non adjacent fragments of theZebrafish linkage group 3 and that in zebrafish linkagegroup 19 the synteny with RT3 was interrupted by a syn-teny with RT23 (Table 2) A tentative functional annota-tion of the EST-based microsatellites localised on the mapwas performed (see Additional file 2) Strong to weak sim-ilarities with identified genes were found for 126 of them
DiscussionNumber of chromosome arms and genome coverageThe primary objective of this work was to obtain a mapcovering all the chromosomes arms of the rainbow troutkaryotype The map reported here was based on more
than 900 markers and consisted of 31 linkage groupsAnalyses of segregation data in both and DH familiesallowed us to recognize 21 metacentric (with the inclu-sion of RT17) and ten acrocentric groups It is noteworthythat our classification was fully supported by a recent Flu-orescent In Situ Hybridization study [23] which reportedthe same acro or metacentric structure for each linkagegroup in rainbow trout (see Additional file 1) Thereforewith respect to our results and the conclusion of the FISHexperiments it can be reasonably assumed that our mapcovers the 52 chromosome arms which constitute therainbow trout karyotype
Our results both in the mapping families and in themeiogenetic line were highly consistent with the findingof high interference in salmonid meiosis ([2425]) Near-complete interference would be the more likely explana-tion for the absence of multiple recombinants per arm forsome linkage groups and the 100 heterozygous proge-nies for some loci in the meiogenetic family [2425] Ifcomplete interference is assumed the length of a linkagegroup can be estimated by the percentage of recom-binants In most cases linkage group lengths were close tothe expected ones under a complete interference modelie 50 cM for acrocentric groups and 100 cM for metacen-
Table 1 Oxford grid showing the homeologous relationships between linkage groups in rainbow trout Linkage group numbers are indicated on first line and row Number of markers shared between duplicated regions are given
1 2 3 4 5 6 7 8 9 10 11 12 13 14 15 16 17 18 19 20 21 22 23 24 25 26 27 29 30 311 1 1 12 19 153 1 3456 1 27 5 18 1 19 210 411 112 14 113 114 161516 117 118192021222324252627 13293031
Page 8 of 13(page number not for citation purposes)
BMC Genomics 2006 7302 httpwwwbiomedcentralcom1471-21647302
tric ones in one family at least Two groups namely RT2ART4 and one arm on RT8 RT17 and RT24 were substan-tially shorter than 50 cM The coverage of these groupscould be readily improved by integration of additionalmarkers from the microsatellite already published [89] orforthcoming linkage maps Overall the total map lengthreported here was rather close to the expected rainbowtrout genome length of 2600 cM under complete interfer-ence (52 arms times 50 cM) This suggests that the presentlinkage map provides a good coverage of the rainbowtrout genome
Four linkage groups in INRA1 (RT6 RT8 RT15 and RT20)and one in INRA2 (RT7) were composed of two unlinkedfragment This could reflect a Robertsonian polymor-phism or alternatively an insufficient local coverage ofthe linkage group in one family In the case of a Robertso-nian polymorphism the two unlinked fragments wouldreflect the independence of the two acrocentric armsWhen considering two independent acrocentric chromo-somes as a single metacentric one 18 of the progeny isexpected to exhibit triple crossovers under complete inter-ference one crossover on each acrocentric group and onerecombinant due to the co-segregation of centromeresfrom each grandparent Since we did not find any con-vincing case of triple crossover at these linkage groupsRobertsonian polymorphism is unlikely to explain theoccurrence of unlinked fragments in one of the familyNote also that only two triple crossovers were foundinstead of 15 (18 times 120 individuals) when RT2A andRT2B are grouped suggesting that these two fragmentscould be linked in our DH families as in [8923]
Assignment of each linkage group to a specific chromo-some[23] will allow to replace the current linkage groupnumbering by a nomenclature based on chromosome sizeas in other species The adoption of a definitive nomencla-ture will require a clear identification of all the chromo-some arm associations involved in the Robertsonianpolymorphism in rainbow trout
Alignment with other rainbow trout maps and zebrafish mapA total number of 214 microsatellite loci were common tothe female-specific maps published by [8] and this oneSyntenies were not conserved for eight loci which mappedto different linkage groups in each map None of theseinconsistencies could be explained by a misinterpretationof a homeology as a homology since the misassigned locidid not map to homeologous regions The 206 remainingmarkers were correctly assigned to a total number of 23linkage groups The conservation of gene orders waschecked for 21 linkage groups which shared more thantwo markers in the two maps In most cases inconsisten-cies in gene orders resulted from the unstable position of
Table 2 Linkage group (LG) assignations are given for both species In rainbow trout position on the linkage group are given starting from the presumably closest marker to the centromere
EST Rainbow trout Zebrafish
LG Position on LG LG Position on LG
Omy1017INRA 11 483 1 532Omy1212INRA 1216 409586 1 292Omy1242INRA 1420 436399 1 280Omy1219INRA 21 011 1 428OMM5188 27 409 1 471BX305657 12 270 2 357Omy1298INRA 16A 35 2 19CA345149 16B 363 2 176BX870052 23 565 2 343Omy1192INRA 9A2B 408481 3 28BX296674 249B 60 3 79Omy1233INRA 249B 60 3 86OMM5127 9A 34 3 86OMM5019 2B9A 441481 3 147OMM5000 27B31B 422437 3 215Omy1261INRA 9A 00 3 286Omy1389INRA 17 00 3 441Omy1474INRA 7 500 4 76Omy1202INRA 12B 334 5 410BX871195 630 635588 6 231Omy1160INRA 10A 313 8 360Omy1510INRA 5 134 9 267OMM5205 8 313 10 21Omy1002INRA 20 43 10 23Omy1512INRA 21 442 10 240Omy1321INRA 26 00 10 297Omy1271INRA 29 65 11 12BX887563 15 417 12 230OMM5244 17 172 12 209Omy1049INRA 30 258 12 316Omy1130INRA 2A29B 315 13 442Omy1358INRA 23 218 13 347OMM5264 3A 92 14 180Omy1300INRA 2731 198269 16 429BX307443 23 673 17 129OMM5137 4 97 18 393OMM5199 3B 73 19 08NaK ATPaseα 23B 582 19 18Omy1278INRA 23B 369 19 209Omy1441INRA 3B 611 19 624Omy1227INRA 16A 129 19 680Omy1112INRA 15 182 20 66Omy1069INRA 23A 644 20 340Omy1125INRA 23A 644 20 375OMM5006 11 392 23 521OMM5002 16A 413 23 521Omy1260INRA 21 544 23 312Omy1286INRA 19 565 25 109
Page 9 of 13(page number not for citation purposes)
BMC Genomics 2006 7302 httpwwwbiomedcentralcom1471-21647302
one marker only or involved markers separated by shortdistances Only RT15 and RT27 showed important dis-crepancies Despite the fact that four families were geno-typed (two in this study and two in [8]) in all casesdiscrepancies in gene orders were detected in only twofamilies the two others being uninformative with respectto the order of the problematic markers The correct orderin these groups remains to be validated The two mapswere also congruent for the localisation of the centro-meres All the linkage groups which showed a centromerein central position in the map of [8] were also stated asbeing metacentric in our map
One hundred and forteen microsatellite loci covering allthe linkage groups were common to the map of [9] andours Only nine markers were not assigned to the samegroup Two discrepancies resulted from comparison ofhomeologous loci [9] map was a male-specific linkagemap obtained by genotyping androgenetic doubled hap-loid progeny Therefore most of the microsatellite mark-ers clustered tightly in the centromeric regions as expectedin male and this map did not provide sufficient informa-tion on gene orders
Overall both syntenies and gene order appear to be con-served among the different linkage maps
The localisation of type I marker on this map has providedsome evidences of conservation of syntenies betweenzebrafish and rainbow trout though it is not the rule Ofparticular interest are the alignment of zebrafish linkagegroups 3 and 19 on the linkage map of rainbow trout andthe complex architecture of the syntenies found Even ifthe comparison of the zebrafish and rainbow troutgenome is still very preliminary and based on a crudeassessment of sequence homologies these findings sug-gest that chromosome rearrangements have been frequentbetween zebrafish and rainbow trout at least over longmap distances but that cases of conserved syntenies canbe found
Duplicated regionsExtensive gene duplication has been reported early in sal-monids and has been a crucial argument in favour of thehypothesis of tetraploidy in salmonids Our data confirmseveral homeology between linkage groups alreadyreported or hypothesized namely RT2ndashRT9 RT2ndashRT29RT3ndashRT25 RT7ndashRT15 RT10ndashRT18 RT12ndashRT16 RT14ndashRT20 and RT27ndashRT31 ([8-10]) With respect to these pre-vious studies two new homeologous regions were identi-fied here RT6ndash30 and RT9ndash24 Finally a new homeologywas suggested for RT17 and 22 which sharedOmy1401INRA in this study and OmyRGT6TUF in [8]Our finding that gene orders are conserved betweenhomeologous markers is congruent with segregation data
which indicate the occurrence of pseudolinkage betweenduplicated pairs belonging to homeologous regions Suchpseudolinkages result from pairing between homeolo-gous regions and alternate segregation [21] and it is likelythat rearrangement in gene orders would prevent orimpede such homeologous pairing Our results were alsocompatible with the assumption that each confirmedhomeologous region (ie defined by two or more sharedduplicated loci) mapped to a single chromosome armswith the exception of the RT3RT25 These two linkagegroups showed a meta and acrocentric structure respec-tively and the three shared duplicated loci were not foundon the same arm of RT3 This could eventually reflect apericentric inversion involving one marker on RT3 butthis exception remains to be validated When two homol-ogies per arm were found one of these homologiesinvolved one single pair of duplicated loci Thus theoccurrence of more than one homology per arm remainshypothetical for the moment Although the occurrence ofmore than one strongly conserved homeologous regionper arm cannot be excluded it is likely to lead to rathercomplex configurations of chromosome pairing and tounbalanced segregations at meiosis
No unique pattern of localisation of the homeologoussegment on chromosome emerged from this study Thehomeologous regions sharing the largest number ofduplicated loci namely RT2A29 RT2B9 RT1216RT14RT20 and RT2731 did not include the centromericregion This is in agreement with the models of tetravalentformation chromatide exchange and conservation ofhomology between homeologous distal region of chro-mosomes proposed by [21] and [5] In the other caseshomeology could concern whole arms or be restricted tothe region proximal to the centromere as for RT914More detailed description of the structure of homeolo-gous linkage groups with the addition of numerous addi-tional loci and sequencing of large BAC fragmentsmapping to these linkage groups both in duplicated andapparently not duplicated regions could be a useful steptowards the understanding of the evolution of a tetra-ploidized genome
ConclusionThe present work provides a linkage map which is likelyto cover most of the genome and to identify all the chro-mosome arms It should be very helpful to distinguishbetween unlinked fragments due to insufficient markerdensity Robertsonian polymorphism and pseudolinkagein future studies In turn this work should benefit fromthe other maps under construction specifically from theinformation derived from male meiosis In contrast withfemale specific maps which show rather uniform distribu-tion of recombination events along arms ([8] this study)male specific maps exhibit more recombination towards
Page 10 of 13(page number not for citation purposes)
BMC Genomics 2006 7302 httpwwwbiomedcentralcom1471-21647302
the telomeric ends and could be more resolutive for theseregions Finally approximately four hundred microsatel-lite markers developed from EST have been mapped inthis study which is only a very small fraction of this typeof markers available in public databases This provides ameans to generate high-density gene maps in rainbowtrout and makes feasible comparative mapping with phy-logenetically distant model species such as zebrafish (thisstudy [9]) or tetraodon [7] Our preliminary data suggestthat conservation of syntenies between rainbow trout andmodel species could occasionally facilitate fine-mappingof QTLs and eventually identification of candidate genes
MethodsMapping resource populationsThe linkage map was constructed using two unrelateddoubled haploid (DH) lines (60 individuals per line) Thesource population was an experimental INRA rainbowtrout strain A grand-parental population of allhomozygous doubled haploids was first establishedusing the mitotic gynogenesis [26] Briefly ova from indi-vidual females were fertilized with UV irradiated spermand diploidy was restored by blocking first embryoniccleavage with a heat shock Some of the DH progenieswere sex-reversed by early hormonal treatment in order toobtain functional males The next generation DH malesand DH females from different families were single-pairmated producing all female F1 hybrid progeny betweenhomozygous lines Two of those females were reproducedusing a second round of mitotic gynogenesis in order toproduce the two mapping DH families used in this work(INRA1 and INRA2)
Centromeres were mapped using a diploid meiogeneticfamily (60 individuals) To produce this meiogenetic fam-ily eggs from a single female were fertilized with UV irra-diated sperm and diploidy was restored by retention ofthe second polar body [27]
All the individuals (4 DH grand-parents 3 mothers andprogeny) were fin clipped and fin clips were stored in 95ethanol for subsequent analyses
Microsatellite and SNP genotypingA total number of 1321 primer pairs were tested Namereferences primer sequences of markers not submitted toGenBank are given (see Additional file 3) Five hundredand seven new primer pairs have been developed fromEST sequences containing microsatellite motives A SIGE-NAE ENSEMBL Rainbow Trout EST Contig version 30was extracted from the SIGENAE-EST database [28] Thisfile was screened for short tandem repeats (two to fivenucleotides) with a software developed by F Mougel(unpublished) The lower repeat numbers were fixed toeight for di and tri-nucleotide motives and to five for tetra
and penta-nucleotide repeats Primers were designed withPRIMER3 software [29] Eight hundred and fourteenalready published microsatellite markers were alsoselected in databases or in publications To discard redun-dant markers prior to PCR tests sequence homologieswere first checked by Blast at low stringency (Blastall com-mand in GCG package chosen E-value 10-3) then manu-ally validated New microsatellite markers were named inaccordance with the convention outlined by [30] For allmicrosatellite markers species abbreviations and micros-atellite source acronyms are given in [9] PCR tests weredone on a sample consisting of the two mothers and thefour grand-parents of DH progeny Duplicated loci werenamed according to the nomenclature described in [31]
Genomic DNA samples were prepared from ethanol pre-served fin tissues following simplified phenol extractionand ethanol precipitation procedures [32] The PCRamplifications separation and visualization of the PCRproducts were carried out according to [31] at the anneal-ing temperature of 58degC When PCR amplification wasunsuccessful the annealing temperature of 52degC wastested The Mg++ concentration was fixed to 2 mM
Two sequences BX087958 and BX087759 were mappedby SNP-based genotyping using sequencing and PCR-RFLP procedures Fragments of 550 and 650 base pairsrespectively were amplified by PCR Amplifications (30cycles 58degC annealing 1 mn elongation) were carried outin 20 microl reactions containing 40 ng of genomic DNA tem-plate 1X reaction buffer (Promega) 04 microM of eachprimer 250 microM of each dNTP 2 mM MgCl2 06 units Taqpolymerase (Promega) SNP polymorphism in femaleswas detected by sequencing PCR products were purifiedby treatment with 2 units of exonuclease 1 and one unitof shrimp alkaline phosphatase SNP polymorphism inthe mothers of DH progeny was detected by sequencingusing the ABI Big Dye terminator chemistry on an ABI 310sequencer Progeny were genotyped by PCR-RFLP meth-ods BX087958 and BX087579 PCR products were cutwith BsrB I and Taq I respectively following Biolabs proto-col and fragments were separated in 2 agarose
Linkage analysis and centromere mappingGenotypes were converted into a backcross format withlinkage phase deduced from the genotypes of the grand-parents each offspring being equivalent to one gameteSince linkage phase was known the two data filesobtained for each female were merged and analysed as asingle data set Linkage groups gene orders and map dis-tances were obtained with CARTHAGENE [33] Linkagegroups were generated with Group command for a LODthreshold of 3 For each linkage group a 10001 frame-work map (likelihood of the map at least 1000-foldhigher than the next highest likelihood using the same
Page 11 of 13(page number not for citation purposes)
BMC Genomics 2006 7302 httpwwwbiomedcentralcom1471-21647302
markers in alternate orders) was also built by using a step-wise locus adding strategy (BuilFW command) Whenpossible microsatellites from ESTs were preferred toanonymous microsatellites The provisional frameworkswere checked for alternative orders with higher likelihoodusing Flips Greedy and Annealing commands which testinversions and permutations of group of markers Finallya comprehensive map including all the markers was builtby adding all the remaining markers at the most likelylocation with Mapcomp command and optimized withFlip command (or details on commands see Carthageneuser guide at [34]
Though it was not expected in female meiosis the occur-rence of pseudo-linkage was checked using a genotype filewith inverted linkage phase
The linkage group numbers followed the current nomen-clature [89] Correspondences between maps were basedon the occurrence of several markers common to thesedifferent maps The map published by Nichols et al [9]also consisted of ten additional small group which werenot taken into account In addition linkage group OA-XXVIII was no longer considered in Nichols et al [9]
Graphic representations of linkage groups were generatedwith MAPCHART version 21 [35] The percentage ofrecombinants was used as the mapping function toaccount for the high levels of chiasma interference whichare usually reported for rainbow trout [102425]
Centromeres were mapped through genotyping of meio-genetic progeny for several loci per linkage group Foreach linkage group loci were ordered manually in such away that the number of recombination events was mini-mum This condition is expected under the hypothesis ofcomplete interference The most likely interval in whichthe centromere lies was deduced from the gene-centro-mere distances (estimated as half the proportion of heter-ozygotes in the meiogynogen progeny) avoiding as far aspossible double recombinants per arm (hypothesis ofnearly complete interference) Details of this half-tetradanalysis can be found in [36]
Comparative mapping with zebrafish Danio rerioThe EST sequences of rainbow trout were masked fromknown repeats and vector sequences and compared to allthe transcript sequences of the zebrafish using the IccareWeb server [37] with the Blastn option of the BLAST pro-gram Only the Highest Scoring Pairs (HSP) with anexpected value less than 10-5 were kept The output filedisplayed the BLAST results and the location of the rain-bow trout genes on the chromosomes of the zebrafish foreach query sequence showing significant homology
Authors contributionsRG conceived the project supervised data analyses andinterpretations and wrote the manuscript SMR contrib-uted to genotyping collection of segregation data datatreatments and map construction KTC produced the EST-based microsatellites from the EST-SIGENAE databasecontributed to genotyping segregation data collectionand analyses SMU contributed to the EST-SIGENAE data-base screening genotyping segregation data analyses CGcontributed to data analysis performed comparativemapping with zebrafish and tentative annotation of rain-bow trout sequences and contributed to manuscript draft-ing FK contributed to EST-SYGENAE database screeningand genotyping EQ contributed to project conceptionand manuscript drafting and produced the mapping DHfamilies All authors read and approved the final manu-script
Additional material
AcknowledgementsThis work is a part of the French AGENAE program and was supported by INRA (Institut Interprofessionnel des Produits de lAquaculture) French Ministry of Agriculture and Fisheries and EU (contract ndegA0248) We thank the staff of the UEP (INRA Uniteacute Expeacuterimentale Piscicole) experimental facilities and the staff of the INRA experimental farm of Gournay-sur-Aronde We thank Martine Andriamanga (Laboratoire de Geacuteneacutetique des Poissons) for laboratory help Karim Gharbi (University of Guelph Depart-ment of Integrative Biology Guelph) for providing primers and Florence
Additional file 1Correspondence of the map reported in this study with already published linkage maps and with chromosome identified by FISH Number of mark-ers and crossovers per linkage groupClick here for file[httpwwwbiomedcentralcomcontentsupplementary1471-2164-7-302-S1xls]
Additional file 2EST accession number or reference for microsatellite loci unavailable in GENBANKClick here for file[httpwwwbiomedcentralcomcontentsupplementary1471-2164-7-302-S2xls]
Additional file 3Functional Annotation of microsatellites markers associated to ESTs Ten-tative annotations from Oncorhynchus mykiss UniGene Build [38] or from rainbow trout gene index version 50 [39] were retrieved with the Rainbow Trout EST SigenaeEnsembl EST contig browser Markers are annotated with NCBI protein accession number [40] for Unigene anno-tation or from Uniprot accession number [41] for TIGR annotation Uni-gene contig name Unigene contig description TIGR contig and TIGR contig description are givenClick here for file[httpwwwbiomedcentralcomcontentsupplementary1471-2164-7-302-S3xls]
Page 12 of 13(page number not for citation purposes)
BMC Genomics 2006 7302 httpwwwbiomedcentralcom1471-21647302
Publish with BioMed Central and every scientist can read your work free of charge
BioMed Central will be the most significant development for disseminating the results of biomedical research in our lifetime
Sir Paul Nurse Cancer Research UK
Your research papers will be
available free of charge to the entire biomedical community
peer reviewed and published immediately upon acceptance
cited in PubMed and archived on PubMed Central
yours mdash you keep the copyright
Submit your manuscript herehttpwwwbiomedcentralcominfopublishing_advasp
BioMedcentral
Maugel (CNRS Laboratoire Evolution Geacutenomes et Speacuteciation Gif-sur-Yvette France) who provided the Software to screen the EST database
References1 Thorgaard GH Bailey GS Williams D Buhler DR Kaattari SL Ristow SS
Hansen JD Winton JR Bartholomew JL Nagler JJ Walsh PJ Vijayan MMDevlin RH Hardy RW Overturf KE Young WP Robison BD Rexroad CPalti Y Status and opportunities for genomics research with rain-bow trout Comp Biochem Physiol B Biochem Mol Biol 2002 133609-646
2 Amores A Force A Yan YL Joly L Amemiya C Fritz A Ho RK LangelandJ Prince V Wang YL Westerfield M Ekker M Postlethwait JH Zebrafishhox clusters and vertebrate genome evolution Science 19982821711-1714
3 Jaillon O Aury JM Brunet F Petit JL Stange-Thomann N Mauceli EBouneau L Fischer C Ozouf-Costaz C Bernot A Nicaud S Jaffe D FisherS Lutfalla G Dossat C Segurens B Dasilva C Salanoubat M Levy MBoudet N Castellano S Anthouard V Jubin C Castelli V Katinka M Vach-erie B Biemont C Skalli Z Cattolico L Poulain J De B V Cruaud CDuprat S Brottier P Coutanceau JP Gouzy J Parra G Lardier G ChappleC McKernan KJ McEwan P Bosak S Kellis M Volff JN Guigo R Zody MCMesirov J Lindblad-Toh K Birren B Nusbaum C Kahn D Robinson-Rechavi M Laudet V Schachter V Quetier F Saurin W Scarpelli CWincker P Lander ES Weissenbach J Roest CH Genome duplicationin the teleost fish Tetraodon nigroviridis reveals the early verte-brate proto-karyotype Nature 2004 431946-957
4 Meyer A Van de PY From 2R to 3R evidence for a fish-specificgenome duplication (FSGD) Bioessays 2005 27937-945
5 Allendorf FW Thorgaard GH Tetraploidy and the evolution of sal-monid fishes In The evolutionary Genetics of Fishes Edited by Turner BJNew-York Plenum Press 19841-53
6 Ohno S Wolf U Atkin NB Evolution from fish to mammals by geneduplication Hereditas 1968 59169-187
7 Rexroad CE III Rodriguez MF Coulibaly I Gharbi K Danzmann RGDekoning J Phillips R Palti Y Comparative mapping of expressedsequence tags containing microsatellites in rainbow trout(Oncorhynchus mykiss) BMC Genomics 2005 654
8 Danzmann RG Cairney M Davidson WS Ferguson MM Gharbi K Guyo-mard R Holm LE Leder E Okamoto N Ozaki A Rexroad CE IIISakamoto T Taggart JB Woram RA A comparative analysis of therainbow trout genome with 2 other species of fish (Arctic charrand Atlantic salmon) within the tetraploid derivative Salmoni-dae family (subfamily Salmoninae) Genome 2005 481037-1051
9 Nichols KM Young WP Danzmann RG Robison BD Rexroad C NoakesM Phillips RB Bentzen P Spies I Knudsen K Allendorf FW CunninghamBM Brunelli J Zhang H Ristow S Drew R Brown KH Wheeler PA Thor-gaard GH A consolidated linkage map for rainbow trout (Onco-rhynchus mykiss) Anim Genet 2003 34102-115
10 Sakamoto T Danzmann RG Gharbi K Howard P Ozaki A Khoo SKWoram RA Okamoto N Ferguson MM Holm LE Guyomard R HoyheimB A microsatellite linkage map of rainbow trout (Oncorhynchusmykiss) characterized by large sex-specific differences in recom-bination rates Genetics 2000 1551331-1345
11 Young WP Wheeler PA Coryell VH Keim P Thorgaard GH A detailedlinkage map of rainbow trout produced using doubled haploidsGenetics 1998 148839-850
12 Leder EH Danzmann RG Ferguson MM The candidate gene Clocklocalizes to a strong spawning time quantitative trait locusregion in rainbow trout J Hered 2006 9774-80
13 Martinez V Thorgaard G Robison B Sillanpaa MJ An application ofBayesian QTL mapping to early development in double haploidlines of rainbow trout including environmental effects Genet Res2005 86209-221
14 Ozaki A Sakamoto T Khoo S Nakamura K Coimbra MR Akutsu TOkamoto N Quantitative trait loci (QTLs) associated with resist-ancesusceptibility to infectious pancreatic necrosis virus (IPNV)in rainbow trout (Oncorhynchus mykiss) Mol Genet Genomics 200126523-31
15 Somorjai IM Danzmann RG Ferguson MM Distribution of tempera-ture tolerance quantitative trait loci in Arctic charr (Salvelinusalpinus) and inferred homologies in rainbow trout (Oncorhyn-chus mykiss) Genetics 2003 1651443-1456
16 Zimmerman AM Evenhuis JP Thorgaard GH Ristow SS A single majorchromosomal region controls natural killer cell-like activity inrainbow trout Immunogenetics 2004 55825-835
17 Brunelli JP Robison BD Thorgaard GH Ancient and recent duplica-tions of the rainbow trout Wilms tumor gene Genome 200144455-462
18 Gharbi K Ferguson MM Danzmann RG Characterization of Na K-ATPase genes in Atlantic salmon (Salmo salar) and comparativegenomic organization with rainbow trout (Oncorhynchusmykiss) Mol Genet Genomics 2005 273474-483
19 Moghadam HK Ferguson MM Danzmann RG Evidence for Hox geneduplication in rainbow trout (Oncorhynchus mykiss) a tetra-ploid model species J Mol Evol 2005 61804-818
20 Phillips RB Zimmerman A Noakes MA Palti Y Morasch MR Eiben LRistow SS Thorgaard GH Hansen JD Physical and genetic mappingof the rainbow trout major histocompatibility regions evidencefor duplication of the class I region Immunogenetics 200355561-569
21 Wright JE Jr Johnson K Hollister A May B Meiotic models to explainclassical linkage pseudolinkage and chromosome pairing intetraploid derivative salmonid genomes Isozymes Curr Top Biol MedRes 1983 10239-260
22 Thorgaard GH Chromosomal differences among rainbow troutpopulations Copeia 1983 3650-662
23 Phillips RB Nichols KM DeKoning JJ Morash MR Keatley KA RexroadCEIII Danzmann RG Drew RE Thorgaard GH Assignment of Rain-bow Trout Linkage Groups to Specific Chromosomes Genetics2006 in press
24 Guyomard R High level of residual heterozygosity in gynogeneticrainbow trout Salmo gairdneri Richardson Theoretical and AppliedGenetics 1984 67307-316
25 Thorgaard GH Allendorf FW Knudsen K Gene-centromere map-ping in rainbow trout high interference over long map distancesGenetics 1983 103771-783
26 Diter A Quillet E Chourrout D Suppression of first egg mitosisinduced by heat shocks in the rainbow trout Journal of Fish Biology1993 42777-786
27 Chourrout D Quillet E Induced gynogenesis in the rainbow trout sex and survival of progenies Production of all-triploid popula-tions Theoretical and Applied Genetics 1982 63201-205
28 SIGENAE [httpwwwsigenaeorg]29 Rozen S Skaletsky H Primer3 on the WWW for general users and
for biologist programmers In Bioinformatics Methods and ProtocolsMethods in Molecular Biology Edited by Krawetz S Misener and S Totowa NJ Humana Press 2000365-386
30 Jackson TR Ferguson MM Danzmann RG Fishback AG PE I M OC TJC Identification of two QTL influencing upper temperature tol-erance in three rainbow trout (Oncorhynchus mykiss) half-sibfamilies Heredity 1998 80143-151
31 Gharbi K Gautier A Danzmann RG Gharbi S Sakamoto T Hoyheim BTaggart JB Cairney M Powell R Krieg F Okamoto N Ferguson MMHolm LE Guyomard R A linkage map for brown trout (Salmotrutta) chromosome homeologies and comparative genomeorganization with other salmonid fish Genetics 20061722405-2419
32 Estoup A Presa P Krieg F Vaiman D Guyomard R (CT)n and (GT)nmicrosatellites a new class of genetic markers for Salmo truttaL (brown trout) Heredity 1993 71488-496
33 S G Bouchez M Chabrier P Milan D Schiex T CARTHAGENEmultipopulation integrated genetic and radiation hybrid map-ping Bioinformatics 2005 211703-1704
34 CarthaGene [httpwwwinrafrinternetDepartementsMIATCarthaGene]
35 Voorrips RE MapChart software for the graphical presentation oflinkage maps and QTLs J Hered 2002 9377-78
36 Danzmann RG Gharbi K Gene mapping in fishes a means to anend Genetica 2001 1113-23
37 Muller C Denis M Gentzbittel L Faraut T The Iccare web server anattempt to merge sequence and mapping information for plantand animal species Nucleic Acids Res 2004 32W429-W434
38 Oncorhynchus mykiss UniGene Build [httpwwwncbinlmnihgovUniGeneUGOrgcgiTAXID=8022]
39 Oncorhynchus mykiss Gene Index [httpwwwtigrorgtigr-scriptstgiT_indexcgispecies=r_trout]
40 NCBI Entrez Protein [httpwwwncbinlmnihgoventrezqueryfcgidb=Protein]
41 UniProt [httpwww piruniprotorgcgi-bintextSearch]
Page 13 of 13(page number not for citation purposes)
- Abstract
-
- Background
- Results
- Conclusion
-
- Background
- Results
-
- Number of informative loci
- Number of linkage groups
- Centromere mapping and arm numbers of linkage groups
- Duplicated regions
- Map length and genome coverage
- Comparative mapping with zebrafish
-
- Discussion
-
- Number of chromosome arms and genome coverage
- Alignment with other rainbow trout maps and zebrafish map
- Duplicated regions
-
- Conclusion
- Methods
-
- Mapping resource populations
- Microsatellite and SNP genotyping
- Linkage analysis and centromere mapping
- Comparative mapping with zebrafish Danio rerio
-
- Authors contributions
- Additional material
- Acknowledgements
- References
-

BMC Genomics 2006 7302 httpwwwbiomedcentralcom1471-21647302
BackgroundThe development of genomic resources is a key steptowards further investigation of wide-scale genome evolu-tion identification and study of gene or gene networksinvolved in complex characters Such efforts have natu-rally focussed on genetic model systems and species ofapplied biomedical or agronomical importance In thecase of rainbow trout genetic resources have been prima-rily developed in order to study the gene networks con-trolling the phenotype of traits that affect breedingperformances or fisheries sustainability and to identifymutations responsible for the genetic variation of thesetraits However the rainbow trout is also a suitable modelto investigate more academic scientific questions(reviewed in [1]) such as the evolution of duplicatedgenomes Two genome duplications seem to have takenplace during the early evolution of vertebrates Studiesbased on Hox clusters in several ray-finned fishes andrecent comparative analyses of Takifugu and Tetraodongenomes with the Human genome have supported theview that a third whole genome duplication occurred inthe ray-finned fish lineage approximately 350 My ago [2-4] The salmonid family has undergone an additionalfourth genome duplication [56] which occurred 25ndash100My ago Therefore the salmonids offer the opportunity tostudy evolution of duplicated genomes at much earlierstages after a polyploidisation event
The construction of linkage maps is a primary steptowards the description and understanding of the struc-ture and evolution of whole genomes In rainbow troutseveral linkage maps based on segregations at AFLP andmicrosatellite loci have been already published [7-11] andsuccessfully used to map QTL for growth disease suscep-tibility thermal tolerance early development [12-16] orto study the duplicated status and chromosomal localisa-tion of gene families playing critical roles in major func-tions [17-20]
These linkage maps have allowed to ascertain severalimportant features of the meiosis and genome structure inthe rainbow trout Briefly female maps are three to fourtimes longer than male ones on the average while telom-eric regions show higher average recombination rate inmale than in female [10] Several homeologous regionssharing homology due to the recent tetraploidisationevent were identified Some of these homeologousregions exhibited pseudolinkage [10] Pseudolinkagerefers to a non-random segregation of homeologousregions which results from preferential pairing and alter-nate disjunction of homeologous regions inherited fromthe same grand parent It occurs in males only [21]
The current consensus linkage map consists of 31 majorlinkage group [89] Since the diploid chromosome
number in the rainbow trout ranges from 58 to 64 chro-mosomes due to a wide range of Robertsonian polymor-phism [22] this number falls within the range of expectedlinkage group numbers More recently the rainbow troutgenetic linkage groups have been assigned to specificchromosomes using fluorescent in situ hybridisation ofBACs [23]
In this article we report a new rainbow trout map Themain objective was to cover all the chromosomes armsThis information is of importance in rainbow trout sincedue to Robertsonian polymorphism the number of chro-mosomes and therefore of independent linkage groupscan vary among families while the number of chromo-somes arms are the constant basic characteristic of therainbow trout karyotype The construction of the map wasbased on segregation analysis of nearly one thousand mic-rosatellite markers in two doubled haploid lines whichare currently used in our laboratory A particular effort wasmade to map the centromere of each linkage group usingmeiogynogenetic progeny in order to determine the acro-centric or metacentric structure of each linkage group
Finally since approximately one third of the mapped mic-rosatellites originated from ESTs sequences we attemptedto recover conserved syntenies between rainbow trout andzebrafish by comparing the map localisation of homolo-gous sequences in the two species
ResultsNumber of informative lociOut of 1321 microsatellite primer pairs tested 168 didnot give any amplification at two annealing temperatures(58 and 52degC) and 366 were monomorphic in the testsample and 796 were informative in one family at leastThree hundred and eighty-nine microsatellite primer pairswere designed from EST sequences Eighty primer pairsoriginated from USDA EST sequences of which eight havebeen already mapped [7] The annealing temperature was58degC for all the informative markers The 309 markersdeveloped from the SIGENAE-EST database were num-bered Omy1009INRA to Omy1513INRA All these mark-ers including sequence primer sequences and PCRconditions were submitted to the STS database in Gen-Bank and assigned accession numbers BV681317 throughBV681637 One hundred and five primer pairs amplifiedduplicated loci The two female founders of INRA1 andINRA2 were heterozygous for one SNP at BX087958 andonly the female parent of INRA1 at BX087759 A totalnumber of 903 loci including the two SNPs were inform-ative for the segregation analysis
Number of linkage groupsThe comprehensive composite map was obtained bymerging the data sets from the two DH families (see Fig-
Page 2 of 13(page number not for citation purposes)
BMC Genomics 2006 7302 httpwwwbiomedcentralcom1471-21647302
ures 1 2 3 4) This map consisted of 31 linkage groupsand one unassigned marker Correspondences with previ-ous linkage map [89] and with specific chromosomesbased on FISH results [23] are given (see Additional file1) RT28 identified in [8] was merged with RT8 here (twounduplicated loci in common) In this study linkagegroup RT2 consisted of two unlinked fragments RT2Aand RT2B Family specific maps consisted of 32 and 35linkage groups in INRA1 and INRA2 respectively Fourlinkage groups (RT6 RT8 RT15 and RT20) consisted oftwo unlinked fragments in family INRA1 and only one infamily INRA2 Similarly two unlinked fragments werefound in family INRA2 for linkage group RT7 instead ofone in INRA1 As expected no significant pseudolinkagewas found in female meiosis
Centromere mapping and arm numbers of linkage groupsTwo to 9 loci per linkage group were mapped in the meio-genetic line (see Figures 1 2 3 4) In all cases the markerorders obtained for a minimal number of recombinationevents were identical to the ones found in the two map-ping families For twenty linkage groups (RT3 RT5 toRT10 RT12 RT14 to RT16 RT19 to RT24 RT27 RT29 andRT31 see Figures 1 2 3 4) the loci showing less recom-bination were found within the linkage group and thesegroups were assumed to have a metacentric structureThese groups exhibited the highest numbers of doublecrossovers and almost all of the triple CO and quadrupleCO events found in INRA1 and INRA2 families (seeAdditional file 1) Double crossover numbers ranged from13 in RT24 to 38 in RT31 while the other linkage groupshad 3 double crossovers or less with the exception of link-age group RT17 (see below) Altogether these figures werein agreement with the hypothesis of high interference gen-erally assumed in salmonids and the occurrence of onechiasma per arm in most cases at meiosis I [2425] Underthis hypothesis metacentric chromosomes are expected toshow mostly zero one or two crossovers while acrocentricones mostly zero or one For each metacentric group thedistribution of the position of the recombination eventsacross all the individuals of INRA1 and INRA2 allowed todetermine the positions which minimized the number ofdouble recombinants on each arm These position delim-ited putative centromere intervals which were consistentwith those of the half-tetrad analysis performed in meio-genetics and sometimes suggested a more precise localisa-tion of centromeres (see Figures 1 2 3 4) These 20metacentric groups allowed to identify 40 chromosomearms out of 52 The segregation data in the meiogeneticprogeny resulted in the localisation of the centromere atone extremity for the remaining linkage groups and led tothe identification of only 11 arms instead of 12 SinceRT2A RT2B on one hand and RT4 and RT25 were tightlylinked and formed metacentric groups in the meiogeneticfamily these four linkage groups were likely to be acro-
centric in INRA1 and 2 RT1 which corresponds to thechromosome bearing the Sex determinant [89] is alsostated to be acrocentric or subtelocentric [22] Among thesix remaining linkage groups RT17 which showed a rela-tively large number of double crossovers in both INRA1and 2 families (see Additional file 1) and which was 87cM in length emerged as a possible metacentric group
Duplicated regionsThe 105 duplicated markers were distributed over a totalof 27 linkage groups (Table 1) Four linkage groups didnot show any duplicated loci and eleven linkage groupsshared homologies with two or more different linkagegroups (up to four) Twenty-two putative homologoussegments were found Ten of these segment homologieswere based on co-localisation of multiple duplicates Onelinkage group RT9 shared homologies with RT2B andRT24 while RT2A shared homology with RT29 The local-ization of the centromeres was compatible with theassumption that each duplicated region was located on asingle chromosome arm (see Figures 1 2 3 4) with theexception of RT3RT25 These two groups shared threeduplicated loci which encompassed the centromericregion of the metacentric RT3 linkage group Markerorders and orientation with respect to the centromerewere conserved between duplicated regions provided thatmodifications in the order of very few markers were intro-duced in the comprehensive map
Map length and genome coverageThe map length estimated by the sum of recombinationpercentage between adjacent markers was 2750 cM andwas slightly lower than the value obtained with theKosambi distance as mapping function (2773 cM) Thissmall difference probably reflected the fact that very fewmultiple crossovers per arm were detected despite therather large average number of markers per group (seeAdditional file 1) Assuming that the centromere posi-tions lied within the intervals proposed (see Figures 1 23 4) the total number of multiple CO events per armobserved in these two families was estimated to 79 onlyfor a total number of 2975 recombination events In themeiogenetic family all genotypes leading to doublerecombinants per arm were re-genotyped Only six casesof double crossovers per arm out of a total observednumber of 2041 crossovers were found Double crosso-vers per arm were not found in a majority of linkagegroups even over long map distances since up to 100 heterozygous progenies were found at distal loci Thesefinding also supported the hypothesis of high to near-complete interference
Comparative mapping with zebrafishThe comparison of 369 rainbow trout EST to the transcriptsequences of the zebrafish with BLASTn resulted in 49 hits
Page 3 of 13(page number not for citation purposes)
BMC Genomics 2006 7302 httpwwwbiomedcentralcom1471-21647302
Page 4 of 13(page number not for citation purposes)
Graphic representation of linkage groups RT1 to RT9Figure 1Graphic representation of linkage groups RT1 to RT9 Groups are numbered as in Nichols et al (2003) Map distances are given in centiMorgan using recombination percentage between loci Loci with names in blue italic type were used for centro-mere mapping in the meiogenetic line Recombination fraction for these loci are given Putative interval of centromere localisa-tions are materialized by black areas Loci in bold type are those of the framework map marker informative in INRA1 only marker informative in INRA2 only
Omy1339INRA(0)00
OMM166539OmyFGT191TUF71OMM111896Omi34TUF105
Omy1294INRAOMM1772196Ots517 NWFSC229Omy1200INRA(028)237
Ssa408UOS308
OMM1372419OMM5136472Omy1012UW506HMG-1 OMM52671L32859 Omy1282INRAOMM1000
515
Omy1367INRA Omy13962INRAOmy1326INRA Omy17INRAOts516 NWFSC(100)
523
OMM1026542Omy1165INRA599SSsp2215609
RT1OMM3006(022)00OMM1162 OMM180818
Omy1310INRABFRO 001(060)Omy11261INRA Ots-2
87
Ssa208 Ssa407UOS129
BX301679Omy11971INRA(089)Omy10461INRA OMM10641
239
Omy111INRA OMM51651(091)248OMM13301258Omy11301INRA Omy11451INRACocl-lav741 Cocl-lav721Omy11871INRA OMM13612
315
Omy10791INRA324Omy14761INRA360
RT2A
Omy12971INRA00Omy13771INRA21Omy1513INRA OMM5320(032)37Omy1415INRA54
OmyRGT40TUF204
OKi1315Ots521 NWFSC341OmyFGT181TUF OMM12001Omy14801INRAOKi271
391
Omy11921INRA OMM51851OMM12181
408
Omy14191INRA Oke11OMM12931 Omy13751INRA
416
Omy14391INRA424OMM1262(093) OMM12741OMM50191 OMM53191OMM12061
441
RT2B
Omy1097INRA(1) OMM517400
Omy1099INRA102
Omy1137INRA150
Ogo22(0)340Omy1400INRA348Omy1263INRA356OMM5264373
OMM1189 Omy1170INRA(0)465
OMM5199 OMM1312OMM5271 Omy1023INRAOmyUW11022 Ogo1
538
OMM1230677
Omy1018INRA703
Omy1443INRA(028)738
OMM1346826
Omy13331INRA Omy1347INRA973
Omi902TUF1058Omy1441INRA1076
RT3OMM1301 Ssa412UOS(0)
Omy1149INRA
OMM5137
OMM1193(02)
Oneu6(097)
Omy1351INRA
00
26
97
241
325
390
RT4
Omy1413INRA(023)00
Omy1296INRA(014)34
Omy1510INRA243OMM1728264
Omy1167INRA(013)360OtsG249One107(008)377
CA061336499
OMM1032610OMM1007629
Oke3689
OMM1104749
OMM1286(05)799OKi29816OMM1011 Omy1096INRA833
Omy1270INRA892OMM1365910
RT5
OMM52421 BX871195100Omy16INRA19
OmyRGT55TUF OMM1359126
OMM1776(075)160
Cocl-lav221270
OMM1082343
Omy1276INRA471
OMM1046544
OMM1454(0) OMM1804BHMS425
635
OMM1780727
Omy1185INRA948
OMM52942 Omy1143INRA(06)OMM1205 OMM5147
996
OMM11511102
OMM1081(088)1181Ssa2019NUIG1199
OMM1231(089)1235
Omy1354INRA1335
RT6
OMM173200Omy1207INRA17Ogo434
Omy1105INRA(098)OMM5160109
Omy207UoG267
Omy12831INRA434
Omy0003DIAS473OmyRGT17TUF490
OMM1832520
OMM1087(002)550
OMM1351651
Omy7INRA(001)732
OMM1764897
Oneu12Oneu11952
OMM11121008OMM1012 Omy1474INRA1022OMM11641 OMM10771050
OMM1376(0 37)1092
OMM119611120
Omy1352INRA Omy13271INRAOMM17691 OMM18001
1171
RT7
Omy1236INRA00OMM1009(086)18One112 OMM5213Omi134TUF Cocl-Lav41Omy1336INRA OMM5181Omy1268INRA OMM1716OMM1667 Omy1266INRAOmy11502INRA Omy18INRA
86
CA060381Omy1169INRA(0)237
OMM1793 OMM18251OMM1972
304
Omy1435INRA313OmyFGT12TUF351
OmyUW1198424
Omy1471INRA512
Omy1390INRA(059)604
OKi26Ogo3OMM5318 OMM5205
655
OMM1075699
RT8
OMM1362 OMM1023Omy14012INRA
00
Omi65TUF(098)09
Omy1016INRA230OMM5162 OMM1744245
Omi20TUF Omy1164INRACA040745
351
Omi126TUF(0)426Struta-11434
Omy1508INRA527
OmyUW1552 OMM1445597OMM5133 Omy1387INRA616
Omy1191INRA820Ssa420UOS(079)839
Omy1158INRA960
RT22
BMC Genomics 2006 7302 httpwwwbiomedcentralcom1471-21647302
Page 5 of 13(page number not for citation purposes)
Graphic representation of linkage groups RT10 to RT17Figure 2Graphic representation of linkage groups RT10 to RT17 Legends are the same as in Figure 1
OMM1179 OMM5306Omy1195INRA
00
Omy1322INRA19One10331
OMM5254(082)90
Omy1332INRA162Omy1160INRA Oneu10OMM5004 One111
170
Omy1394INRA263
Omy1477INRA Omy1288INRAOmy1141INRA
356
OmyRGT2TUF364OmyUW1225387
BHMS431465OKi23(0)483OMM1710 Omi44TUF500BHMS117B OMM1768508
OMM1753668
OMM1294 OMM1451703
Omy14272INRA733
OMM5186846
Omy38DU(058)908
OMM1718941
OMM12132991
OMM12021 Omy11631INRA1037
RT10
OMM5261(0)00Omy1469INRA(0)39Ots520 NWFSC(0)75OMM5178 OMM1310(0)92Omy1249INRA100OMM1172 Ocl1UWOMM1154
125
Omy7DIAS158Omy1496INRA171OMM1209182
Omy13DIASOMM1018276
Omy1179INRA(064)326
OMM5006392Omy1134INRAOMM1315401SSOSL322415
Ots515 NWFSCOmy1017INRA483Omy23INRAOMM1004503OMM1084511
RT11Omy12121INRA00Omy31INRA(100)24Ots100SSBI Omy10081UWSsa403UOS1
55
Ssa402UOS1 Omy13971INRAOmy10621INRA OMM17251
64
Omy10951INRA OMM1329(100)72OMM1127 Omy1216INRA89OmyOGT5TUF1 Omy15071INRAOmy14461INRA
122
OMM1158 Omy13961INRABX305657
139
OMM5233 OMM1478147OMM13451163
OMM51611297
OmyFGT4TUF325
OMM1066(042)OMM1030(044)409Omy1138INRA427
OMM1277481
OMM5328(0)590
OMM1006710OMM3054 OMM3061OMM3049 Omy1202INRA(023)OMM3059 OMM3050OMM3048
743
OMM1136768
Omy1487INRAOMM1809Omy16DIAS(06)
897
Omy1384INRA Omy1313INRA914OMM1381925
OMM1662983Omy1118INRA1000Omy1210INRA1010
Omy1430INRA1079Omy1440INRA1088OMM52101110OMM1740 OMM1239OMM1234 OMM1468
1132
RT12
Omy1039INRA(0)Ssa417UOS(0)00
OMM1216(0)61
OMM1762(0)95
BX8700522 OMM1388(0)146
OmyRGT46TUF333
OMM1020435Omy1479INRA(002)452
OmyRGT14TUF(045)492 Ocl4UW(025)516
OMM1783546Omy1194INRA561Omy1211INRA Omy1265INRAOmyRGT51TUF
576
Omy1013UW OmyRGT47TUFOmy1173INRA(1)Omy1307INRA
584
RT13
Ssa410UOS00Omy1305INRAOMM124117Omy19DIAS25Omy1127INRA41
OMM1279 Omy1113INRA103
OMM1374 OMM5327195
Omy1214INRA(071)237
OMM1086286
Omy1372INRA328
Omy1182INRA356
OmyRGT43TUF461
Omy1407INRA OMM5216493
SSa14DU(0)552
Omy1374INRA(02)753
OMM50172 OMM51682909OMM11342(032)933OMM16572950Omy1328INRA959Omy12422INRA OMM11742988Omy1202INRA Omy13912INRA1013Omy14862INRA1054OMM11242 Omy1016UW2OMM12272 OKi13Omy12322INRA(075)Ots5122 NWFSCOmyUW11772
1095
Omy42INRA1134
RT14
Omy1058INRA(1)00OMM1729 OmyRGT21TUF24
BX88756357OMM5266 Omy1383INRA(089)74
Omy1330INRAOMM5298143
Str11INRA Omy1248INRA(023)203Omy14INRA218
Omy1112INRA292
OMM1166 OMM1028(0)474
Ots-1516OMM1067547Omy1378INRA OMM1051558
OMM1745651
Omy1356INRA702OMM11642 OMM1036727
OMM1820 Omy1004INRA(077)803
OMM1455871
OMM11962 OMM18002OMM1444
913
OMM17692 Omy13272INRA963
RT15
OMM5269(086)00
OMM109051
OMM1139 OMM1076136
Omy1456INRA172
OtsG85(039)254
OKi6459OtsG422(007)477Omy1389INRA(003)495OMM1117 OMM1116512
Omy1151INRA573
Omy1376INRA(0)634
OMM5149 Omy14011INRAOMM5244727
OMM1360(0)801
OMM1775850BHMS322865Omy1108INRA(0)870
RT17
Omy14462INRA
Omy10952INRA
OMM135200OmyUW1211(100)Omi1022TUFOmy1499INRA
18
OMM110277OMM1101 Och1185
Omy1224INRA128Omy1045INRAOMM5002Omy13332INRA
154
Ots518 NWFSC222Omy1038INRA234
OmyRGT3TUF Omy1227INRA438
OMM1830 OMM1746523Omy1298INRA532Omy1110INRA541Omy8INRA(002)567OMM1713584OMM1088 OMM1013592
OMM1815685
OMM51612745
Omy1318INRA790
Omy77DU(069) OMM1156910OMM13452918OMM1714926CA345149930OmyOGT5TUF2934Omy1190INRA950Omy15072INRA1008OmyFGT192TUF1032OMM17171064OMM1226 OMM1403Omy13972INRA
1098
Omy10082UWSsa402UOS2 OMM17252Omy10622INRA
1115
Omy32INRA(100)1143Omy12122INRA1153
RT16
BMC Genomics 2006 7302 httpwwwbiomedcentralcom1471-21647302
Page 6 of 13(page number not for citation purposes)
Graphic representation of linkage groups RT18 to RT25Figure 3Graphic representation of linkage groups RT18 to RT25 Legends are the same as in Figure 1
Ocl8UW(032)00Omi127TUF OMM145818
Omi174TUF OMM1375(0)208
Omy1235INRA OMM5018OMM5307 Omy12832INRAOMM1035 OMM1025
407
Ots-209483
tcaa0002cb16A534
Omy1279INRA614
BX087958747Omy1363INRA Omy1286INRA773
Omy1362INRAOMM1008807
OmyUW1191(017) OMM5289841
OKi10899
OMM1333953Omy1155INRA963Omy103INRA971OmyUW1052 Omy1132INRA988Oneu3f1005
RT19
OMM110700OMM1120(098)42Omy1348INRA OMM1448OMM52672 Omy1289INRAOmi105TUF
67
Omy1020INRA92OMM1050(098)118
SSLEEN82(048)321
Omy1382INRA(019) Omy0008DIAS469OMM1544480Omy1412INRA Omy1254INRABX087759 Omy1002INRA512
Omy11501INRA594
OMM11741730
Omi1021TUF Omy17DIAS788
OMM50171 Omy1116INRAOMM11341(043) OMM51681861
OMM16571 Omy12421INRA879OMM11241 Omy1201INRAOmy13911INRA952
Omy14861INRA974Omy1016UW1
OMM12271Omy12321INRA(093)Ots5121 NWFSC
985
OmyUW117711001Omy41INRA1020
RT20
Omy325UoG00Omy10INRA OMM1060Omy1260INRA SSsp160525
Omy1359INRA62
OMM1491106
OMM5132(086) Ssa405UOS144OMM1367172
Omy301UoG232OmyFGT2TUF244
Omy1013INRA388
Omy1219INRA449OMM1145 OmyFGT27TUFOmy1093INRA484
Omy0002DIASOmyRGT26TUF492OMM1824509OKi8554OMM1736 Omy1035INRA(0)569
OMM5014731
OmyUW1090831
OMM1059895
OMM5179945OMM5197978Omy1403INRA(095) OMM5129Omy1512INRA1011
OMM10891078
Omy1252INRAOMM51261137OMM12711154
OMM14531198
RT21
OmyRGT12TUF(003)00
Omy14271INRA(024)115
OMM1384237
OMM1159(044)298
OMM1512426OmyRGT44TUF omDIAS1460Omy1001UW481OMM1311502
OMM12131544Omi187TUF(1)576
Omy11632INRAOMM12022608
Omy335UOG654
RT18
OMM1362 OMM1023Omy14012INRA00
Omi65TUF(098)09
Omy1016INRA230OMM5162 OMM1744245
Omi20TUF Omy1164INRACA040745351
Omi126TUF(0)426Struta-11434
Omy1508INRA527
OmyUW1552 OMM1445597OMM5133 Omy1387INRA616
Omy1191INRA820Ssa420UOS(079)839
Omy1158INRA960
RT22
Omy1306INRA00OMM132217
Omy0004DIASOMM1105(012)One108145
OMM1449162BX296674 Omy12871INRAOmy12311INRA Omy1233INRA212
OmyPuPuPyDU272Ssa85DU OMM1397(0)281
OMM1402347
OmyRGT36TUF Omy1342INRA429
OMM1211559
OMM1690603Omy1393INRA620OMM1045646OMM1727680Omy1335INRAOMM1194Omi58TUF731
OmyFGT16TUF (100)740
RT24
00
5572
84
115
OMM1097
BX307443OMM1459OMM1069 Ssa401UOSOmy1125INRA Omy1069INRASSLEET47
OMM1538192
Omy1502INRA360
Omy1475INRA(031)425
Omy27INRAOmy1501INRA489Omy1358INRA510OMM1109531
OmyRGT10TUF641Omy1124INRA655
OMM1719(0)719OMM1339 Omy1184INRA(0)728Ots-212(0)737OMM5003(002)754Ots506 NWFSC802
OMM5222838
OMM1190909Omy1368INRA918Omy1361INRA945
Omy1278INRA(049)1097
OMM5010 BX87005211293Omy1103INRA Ots522 NWFSC1302OmyRGT9TUF1306OMM5125 Omy1366INRANaK ATPaseα OMM1095OMM1276
1310
OMM1178 OmyFGT23TUF1343
RT23
Ogo21(0)00
OMM1389(0)70Omy1467INRA88
OmyUW11021156OMM1797175
OmyRGT7TUF261Omy1259INRA270Omy1014UW304
OMM1054(066)338
Omi901TUF457
RT25
BMC Genomics 2006 7302 httpwwwbiomedcentralcom1471-21647302
Page 7 of 13(page number not for citation purposes)
Graphic representation of linkage groups RT26 to RT31 (RT28 does not exist)Figure 4Graphic representation of linkage groups RT26 to RT31 (RT28 does not exist) Legends are the same as in Figure 1
Och1600OMM1607 OMM1033(098)Omy1293INRA Omy1025INRAOMM1751
09
OMM181236
OMM3062 OMM3063OMM3047 Ots108(065)OmyRGT19TUF
145
OtsG243279
Omy1271INRA344OMM1201 Omi111TUF357
OmyFGT3TUF(002)409
OMM1073476Omy1040INRAOMM1712OmyUW1223 Omy1468INRA
493
OMM1705 Omy1371INRA(000)553
OtsG43587
OMM1505690
Omy21INRA755
OMM1720 Omy11262INRA(070)OMM1743
854
OMM51652(091)OMM10642Omy11972INRAOMM13302OMM13611
994
Omy10462INRA1026Omy112INRA Cocl-lav742Omy14762INRA
1037
Omy10792INRA1045Omy11452INRA(090)Cocl-lav7221071Omy11302INRA Omy11872INRAOmy1247INRA
1113
RT29
Omy1380INRA(0)00BHMS247(045)18
OMM5011(029)87
Omy5DIAS(038)161OMM1395 OMM52422OmyRGT24TUF(044)
189
Omy1014INRA Omy108INRA(051)OMM1019 OmyRGT34TUF
240
Omy1049INRA258Omi84TUF278
OMM1238454
Omy1302INRA OMM1723(1)OMM1826 BX8711952
508
Omy1166INRA577
RT30
Ots526 NWFSC00Omi2102TUFOmy10602INRA17Omy14262INRA43OMM17782 OMM5000269CA349040103Oneu182(086) OMM1138OmyFGT82TUF OmyRGT132TUF
120
Omy2722UoG212Str42INRAOMM52462OmyUW1077
229
One102 Omy13002INRA237
Omy1308INRA321Omy13232INRA329
Omy1006UW403Omy1373INRA414OMM1765439Omy1027INRA447
OMM1058(002)506OMM1083515
BHMS129734OMM5146752
Omy1349INRA839OMM5164(051)859
OMM1053951
Omy1009INRA Omy1067INRA1047
Omy1136INRA1103
Omy1241INRA OMM50051160OMM1599 Omy1392INRA1168
RT31
Omy1398INRA Omy1321INRA(005)00Omy1420INRA(005)08Cocl-lav69(005)16
OMM1767321Omy1511INRA OmyRGT39TUF329OMM1734337OMM3000 Omy111DU(054)354
OMM1756489Omi66TUF534OMM1015(098)557OmyFGT24TUF565Omy1284INRAOmy1350INRAOMM1228
582
SSOSL321599
RT26
Omy1178INRABX86338000
Omy25INRA(07)59
OMM52941195Omy1264INRA209
Omy1148INRA303
OMM1039333
Oke4(0) Omy1015INRAOmy1423INRA
467
OMM1070 MST-15492Omy1428INRA533OMM1364587Omy13231INRA616Omy2721UoG630Ocl-2648OmyUW1119 Omy13001INRA(046)Ssa403UOS2
665
Omy1429INRA(05) BX313262686OMM52461 OMM1108707Str41INRA740Omi175TUF795Oneu181(066)840OmyFGT81TUF(081)858Omy1472INRA Omy1204INRAOMM5188 Omy21DIAS
876
OMM50001889OmyRGT131TUF OtsG423902OMM17781906Oke12 Omy14261INRAOMM1131
910
Omi2101TUF927Omy29INRA(092)963OMM5270 Omy10601INRA997
RT27
BMC Genomics 2006 7302 httpwwwbiomedcentralcom1471-21647302
with e-values lt 10-5 The assignment of the correspondingloci to the linkage groups of each species and the con-served syntenies are reported in Table 2 These loci cov-ered 21 linkage groups in zebrafish and ten of themhoused two or more loci In all cases zebrafish linkagegroups showed putative homologies with more than onerainbow trout linkage group irrespective of the duplica-tion in this species Six syntenies were conserved In bothspecies two of them involved two tightly linked lociBX296674Omy1233INRA and Omy1069INRAOmy1125INRA) while the four other ones emcompassedlarge gene distances It is noteworthy that RT9 and RT2Bappeared as a mosaic of non adjacent fragments of theZebrafish linkage group 3 and that in zebrafish linkagegroup 19 the synteny with RT3 was interrupted by a syn-teny with RT23 (Table 2) A tentative functional annota-tion of the EST-based microsatellites localised on the mapwas performed (see Additional file 2) Strong to weak sim-ilarities with identified genes were found for 126 of them
DiscussionNumber of chromosome arms and genome coverageThe primary objective of this work was to obtain a mapcovering all the chromosomes arms of the rainbow troutkaryotype The map reported here was based on more
than 900 markers and consisted of 31 linkage groupsAnalyses of segregation data in both and DH familiesallowed us to recognize 21 metacentric (with the inclu-sion of RT17) and ten acrocentric groups It is noteworthythat our classification was fully supported by a recent Flu-orescent In Situ Hybridization study [23] which reportedthe same acro or metacentric structure for each linkagegroup in rainbow trout (see Additional file 1) Thereforewith respect to our results and the conclusion of the FISHexperiments it can be reasonably assumed that our mapcovers the 52 chromosome arms which constitute therainbow trout karyotype
Our results both in the mapping families and in themeiogenetic line were highly consistent with the findingof high interference in salmonid meiosis ([2425]) Near-complete interference would be the more likely explana-tion for the absence of multiple recombinants per arm forsome linkage groups and the 100 heterozygous proge-nies for some loci in the meiogenetic family [2425] Ifcomplete interference is assumed the length of a linkagegroup can be estimated by the percentage of recom-binants In most cases linkage group lengths were close tothe expected ones under a complete interference modelie 50 cM for acrocentric groups and 100 cM for metacen-
Table 1 Oxford grid showing the homeologous relationships between linkage groups in rainbow trout Linkage group numbers are indicated on first line and row Number of markers shared between duplicated regions are given
1 2 3 4 5 6 7 8 9 10 11 12 13 14 15 16 17 18 19 20 21 22 23 24 25 26 27 29 30 311 1 1 12 19 153 1 3456 1 27 5 18 1 19 210 411 112 14 113 114 161516 117 118192021222324252627 13293031
Page 8 of 13(page number not for citation purposes)
BMC Genomics 2006 7302 httpwwwbiomedcentralcom1471-21647302
tric ones in one family at least Two groups namely RT2ART4 and one arm on RT8 RT17 and RT24 were substan-tially shorter than 50 cM The coverage of these groupscould be readily improved by integration of additionalmarkers from the microsatellite already published [89] orforthcoming linkage maps Overall the total map lengthreported here was rather close to the expected rainbowtrout genome length of 2600 cM under complete interfer-ence (52 arms times 50 cM) This suggests that the presentlinkage map provides a good coverage of the rainbowtrout genome
Four linkage groups in INRA1 (RT6 RT8 RT15 and RT20)and one in INRA2 (RT7) were composed of two unlinkedfragment This could reflect a Robertsonian polymor-phism or alternatively an insufficient local coverage ofthe linkage group in one family In the case of a Robertso-nian polymorphism the two unlinked fragments wouldreflect the independence of the two acrocentric armsWhen considering two independent acrocentric chromo-somes as a single metacentric one 18 of the progeny isexpected to exhibit triple crossovers under complete inter-ference one crossover on each acrocentric group and onerecombinant due to the co-segregation of centromeresfrom each grandparent Since we did not find any con-vincing case of triple crossover at these linkage groupsRobertsonian polymorphism is unlikely to explain theoccurrence of unlinked fragments in one of the familyNote also that only two triple crossovers were foundinstead of 15 (18 times 120 individuals) when RT2A andRT2B are grouped suggesting that these two fragmentscould be linked in our DH families as in [8923]
Assignment of each linkage group to a specific chromo-some[23] will allow to replace the current linkage groupnumbering by a nomenclature based on chromosome sizeas in other species The adoption of a definitive nomencla-ture will require a clear identification of all the chromo-some arm associations involved in the Robertsonianpolymorphism in rainbow trout
Alignment with other rainbow trout maps and zebrafish mapA total number of 214 microsatellite loci were common tothe female-specific maps published by [8] and this oneSyntenies were not conserved for eight loci which mappedto different linkage groups in each map None of theseinconsistencies could be explained by a misinterpretationof a homeology as a homology since the misassigned locidid not map to homeologous regions The 206 remainingmarkers were correctly assigned to a total number of 23linkage groups The conservation of gene orders waschecked for 21 linkage groups which shared more thantwo markers in the two maps In most cases inconsisten-cies in gene orders resulted from the unstable position of
Table 2 Linkage group (LG) assignations are given for both species In rainbow trout position on the linkage group are given starting from the presumably closest marker to the centromere
EST Rainbow trout Zebrafish
LG Position on LG LG Position on LG
Omy1017INRA 11 483 1 532Omy1212INRA 1216 409586 1 292Omy1242INRA 1420 436399 1 280Omy1219INRA 21 011 1 428OMM5188 27 409 1 471BX305657 12 270 2 357Omy1298INRA 16A 35 2 19CA345149 16B 363 2 176BX870052 23 565 2 343Omy1192INRA 9A2B 408481 3 28BX296674 249B 60 3 79Omy1233INRA 249B 60 3 86OMM5127 9A 34 3 86OMM5019 2B9A 441481 3 147OMM5000 27B31B 422437 3 215Omy1261INRA 9A 00 3 286Omy1389INRA 17 00 3 441Omy1474INRA 7 500 4 76Omy1202INRA 12B 334 5 410BX871195 630 635588 6 231Omy1160INRA 10A 313 8 360Omy1510INRA 5 134 9 267OMM5205 8 313 10 21Omy1002INRA 20 43 10 23Omy1512INRA 21 442 10 240Omy1321INRA 26 00 10 297Omy1271INRA 29 65 11 12BX887563 15 417 12 230OMM5244 17 172 12 209Omy1049INRA 30 258 12 316Omy1130INRA 2A29B 315 13 442Omy1358INRA 23 218 13 347OMM5264 3A 92 14 180Omy1300INRA 2731 198269 16 429BX307443 23 673 17 129OMM5137 4 97 18 393OMM5199 3B 73 19 08NaK ATPaseα 23B 582 19 18Omy1278INRA 23B 369 19 209Omy1441INRA 3B 611 19 624Omy1227INRA 16A 129 19 680Omy1112INRA 15 182 20 66Omy1069INRA 23A 644 20 340Omy1125INRA 23A 644 20 375OMM5006 11 392 23 521OMM5002 16A 413 23 521Omy1260INRA 21 544 23 312Omy1286INRA 19 565 25 109
Page 9 of 13(page number not for citation purposes)
BMC Genomics 2006 7302 httpwwwbiomedcentralcom1471-21647302
one marker only or involved markers separated by shortdistances Only RT15 and RT27 showed important dis-crepancies Despite the fact that four families were geno-typed (two in this study and two in [8]) in all casesdiscrepancies in gene orders were detected in only twofamilies the two others being uninformative with respectto the order of the problematic markers The correct orderin these groups remains to be validated The two mapswere also congruent for the localisation of the centro-meres All the linkage groups which showed a centromerein central position in the map of [8] were also stated asbeing metacentric in our map
One hundred and forteen microsatellite loci covering allthe linkage groups were common to the map of [9] andours Only nine markers were not assigned to the samegroup Two discrepancies resulted from comparison ofhomeologous loci [9] map was a male-specific linkagemap obtained by genotyping androgenetic doubled hap-loid progeny Therefore most of the microsatellite mark-ers clustered tightly in the centromeric regions as expectedin male and this map did not provide sufficient informa-tion on gene orders
Overall both syntenies and gene order appear to be con-served among the different linkage maps
The localisation of type I marker on this map has providedsome evidences of conservation of syntenies betweenzebrafish and rainbow trout though it is not the rule Ofparticular interest are the alignment of zebrafish linkagegroups 3 and 19 on the linkage map of rainbow trout andthe complex architecture of the syntenies found Even ifthe comparison of the zebrafish and rainbow troutgenome is still very preliminary and based on a crudeassessment of sequence homologies these findings sug-gest that chromosome rearrangements have been frequentbetween zebrafish and rainbow trout at least over longmap distances but that cases of conserved syntenies canbe found
Duplicated regionsExtensive gene duplication has been reported early in sal-monids and has been a crucial argument in favour of thehypothesis of tetraploidy in salmonids Our data confirmseveral homeology between linkage groups alreadyreported or hypothesized namely RT2ndashRT9 RT2ndashRT29RT3ndashRT25 RT7ndashRT15 RT10ndashRT18 RT12ndashRT16 RT14ndashRT20 and RT27ndashRT31 ([8-10]) With respect to these pre-vious studies two new homeologous regions were identi-fied here RT6ndash30 and RT9ndash24 Finally a new homeologywas suggested for RT17 and 22 which sharedOmy1401INRA in this study and OmyRGT6TUF in [8]Our finding that gene orders are conserved betweenhomeologous markers is congruent with segregation data
which indicate the occurrence of pseudolinkage betweenduplicated pairs belonging to homeologous regions Suchpseudolinkages result from pairing between homeolo-gous regions and alternate segregation [21] and it is likelythat rearrangement in gene orders would prevent orimpede such homeologous pairing Our results were alsocompatible with the assumption that each confirmedhomeologous region (ie defined by two or more sharedduplicated loci) mapped to a single chromosome armswith the exception of the RT3RT25 These two linkagegroups showed a meta and acrocentric structure respec-tively and the three shared duplicated loci were not foundon the same arm of RT3 This could eventually reflect apericentric inversion involving one marker on RT3 butthis exception remains to be validated When two homol-ogies per arm were found one of these homologiesinvolved one single pair of duplicated loci Thus theoccurrence of more than one homology per arm remainshypothetical for the moment Although the occurrence ofmore than one strongly conserved homeologous regionper arm cannot be excluded it is likely to lead to rathercomplex configurations of chromosome pairing and tounbalanced segregations at meiosis
No unique pattern of localisation of the homeologoussegment on chromosome emerged from this study Thehomeologous regions sharing the largest number ofduplicated loci namely RT2A29 RT2B9 RT1216RT14RT20 and RT2731 did not include the centromericregion This is in agreement with the models of tetravalentformation chromatide exchange and conservation ofhomology between homeologous distal region of chro-mosomes proposed by [21] and [5] In the other caseshomeology could concern whole arms or be restricted tothe region proximal to the centromere as for RT914More detailed description of the structure of homeolo-gous linkage groups with the addition of numerous addi-tional loci and sequencing of large BAC fragmentsmapping to these linkage groups both in duplicated andapparently not duplicated regions could be a useful steptowards the understanding of the evolution of a tetra-ploidized genome
ConclusionThe present work provides a linkage map which is likelyto cover most of the genome and to identify all the chro-mosome arms It should be very helpful to distinguishbetween unlinked fragments due to insufficient markerdensity Robertsonian polymorphism and pseudolinkagein future studies In turn this work should benefit fromthe other maps under construction specifically from theinformation derived from male meiosis In contrast withfemale specific maps which show rather uniform distribu-tion of recombination events along arms ([8] this study)male specific maps exhibit more recombination towards
Page 10 of 13(page number not for citation purposes)
BMC Genomics 2006 7302 httpwwwbiomedcentralcom1471-21647302
the telomeric ends and could be more resolutive for theseregions Finally approximately four hundred microsatel-lite markers developed from EST have been mapped inthis study which is only a very small fraction of this typeof markers available in public databases This provides ameans to generate high-density gene maps in rainbowtrout and makes feasible comparative mapping with phy-logenetically distant model species such as zebrafish (thisstudy [9]) or tetraodon [7] Our preliminary data suggestthat conservation of syntenies between rainbow trout andmodel species could occasionally facilitate fine-mappingof QTLs and eventually identification of candidate genes
MethodsMapping resource populationsThe linkage map was constructed using two unrelateddoubled haploid (DH) lines (60 individuals per line) Thesource population was an experimental INRA rainbowtrout strain A grand-parental population of allhomozygous doubled haploids was first establishedusing the mitotic gynogenesis [26] Briefly ova from indi-vidual females were fertilized with UV irradiated spermand diploidy was restored by blocking first embryoniccleavage with a heat shock Some of the DH progenieswere sex-reversed by early hormonal treatment in order toobtain functional males The next generation DH malesand DH females from different families were single-pairmated producing all female F1 hybrid progeny betweenhomozygous lines Two of those females were reproducedusing a second round of mitotic gynogenesis in order toproduce the two mapping DH families used in this work(INRA1 and INRA2)
Centromeres were mapped using a diploid meiogeneticfamily (60 individuals) To produce this meiogenetic fam-ily eggs from a single female were fertilized with UV irra-diated sperm and diploidy was restored by retention ofthe second polar body [27]
All the individuals (4 DH grand-parents 3 mothers andprogeny) were fin clipped and fin clips were stored in 95ethanol for subsequent analyses
Microsatellite and SNP genotypingA total number of 1321 primer pairs were tested Namereferences primer sequences of markers not submitted toGenBank are given (see Additional file 3) Five hundredand seven new primer pairs have been developed fromEST sequences containing microsatellite motives A SIGE-NAE ENSEMBL Rainbow Trout EST Contig version 30was extracted from the SIGENAE-EST database [28] Thisfile was screened for short tandem repeats (two to fivenucleotides) with a software developed by F Mougel(unpublished) The lower repeat numbers were fixed toeight for di and tri-nucleotide motives and to five for tetra
and penta-nucleotide repeats Primers were designed withPRIMER3 software [29] Eight hundred and fourteenalready published microsatellite markers were alsoselected in databases or in publications To discard redun-dant markers prior to PCR tests sequence homologieswere first checked by Blast at low stringency (Blastall com-mand in GCG package chosen E-value 10-3) then manu-ally validated New microsatellite markers were named inaccordance with the convention outlined by [30] For allmicrosatellite markers species abbreviations and micros-atellite source acronyms are given in [9] PCR tests weredone on a sample consisting of the two mothers and thefour grand-parents of DH progeny Duplicated loci werenamed according to the nomenclature described in [31]
Genomic DNA samples were prepared from ethanol pre-served fin tissues following simplified phenol extractionand ethanol precipitation procedures [32] The PCRamplifications separation and visualization of the PCRproducts were carried out according to [31] at the anneal-ing temperature of 58degC When PCR amplification wasunsuccessful the annealing temperature of 52degC wastested The Mg++ concentration was fixed to 2 mM
Two sequences BX087958 and BX087759 were mappedby SNP-based genotyping using sequencing and PCR-RFLP procedures Fragments of 550 and 650 base pairsrespectively were amplified by PCR Amplifications (30cycles 58degC annealing 1 mn elongation) were carried outin 20 microl reactions containing 40 ng of genomic DNA tem-plate 1X reaction buffer (Promega) 04 microM of eachprimer 250 microM of each dNTP 2 mM MgCl2 06 units Taqpolymerase (Promega) SNP polymorphism in femaleswas detected by sequencing PCR products were purifiedby treatment with 2 units of exonuclease 1 and one unitof shrimp alkaline phosphatase SNP polymorphism inthe mothers of DH progeny was detected by sequencingusing the ABI Big Dye terminator chemistry on an ABI 310sequencer Progeny were genotyped by PCR-RFLP meth-ods BX087958 and BX087579 PCR products were cutwith BsrB I and Taq I respectively following Biolabs proto-col and fragments were separated in 2 agarose
Linkage analysis and centromere mappingGenotypes were converted into a backcross format withlinkage phase deduced from the genotypes of the grand-parents each offspring being equivalent to one gameteSince linkage phase was known the two data filesobtained for each female were merged and analysed as asingle data set Linkage groups gene orders and map dis-tances were obtained with CARTHAGENE [33] Linkagegroups were generated with Group command for a LODthreshold of 3 For each linkage group a 10001 frame-work map (likelihood of the map at least 1000-foldhigher than the next highest likelihood using the same
Page 11 of 13(page number not for citation purposes)
BMC Genomics 2006 7302 httpwwwbiomedcentralcom1471-21647302
markers in alternate orders) was also built by using a step-wise locus adding strategy (BuilFW command) Whenpossible microsatellites from ESTs were preferred toanonymous microsatellites The provisional frameworkswere checked for alternative orders with higher likelihoodusing Flips Greedy and Annealing commands which testinversions and permutations of group of markers Finallya comprehensive map including all the markers was builtby adding all the remaining markers at the most likelylocation with Mapcomp command and optimized withFlip command (or details on commands see Carthageneuser guide at [34]
Though it was not expected in female meiosis the occur-rence of pseudo-linkage was checked using a genotype filewith inverted linkage phase
The linkage group numbers followed the current nomen-clature [89] Correspondences between maps were basedon the occurrence of several markers common to thesedifferent maps The map published by Nichols et al [9]also consisted of ten additional small group which werenot taken into account In addition linkage group OA-XXVIII was no longer considered in Nichols et al [9]
Graphic representations of linkage groups were generatedwith MAPCHART version 21 [35] The percentage ofrecombinants was used as the mapping function toaccount for the high levels of chiasma interference whichare usually reported for rainbow trout [102425]
Centromeres were mapped through genotyping of meio-genetic progeny for several loci per linkage group Foreach linkage group loci were ordered manually in such away that the number of recombination events was mini-mum This condition is expected under the hypothesis ofcomplete interference The most likely interval in whichthe centromere lies was deduced from the gene-centro-mere distances (estimated as half the proportion of heter-ozygotes in the meiogynogen progeny) avoiding as far aspossible double recombinants per arm (hypothesis ofnearly complete interference) Details of this half-tetradanalysis can be found in [36]
Comparative mapping with zebrafish Danio rerioThe EST sequences of rainbow trout were masked fromknown repeats and vector sequences and compared to allthe transcript sequences of the zebrafish using the IccareWeb server [37] with the Blastn option of the BLAST pro-gram Only the Highest Scoring Pairs (HSP) with anexpected value less than 10-5 were kept The output filedisplayed the BLAST results and the location of the rain-bow trout genes on the chromosomes of the zebrafish foreach query sequence showing significant homology
Authors contributionsRG conceived the project supervised data analyses andinterpretations and wrote the manuscript SMR contrib-uted to genotyping collection of segregation data datatreatments and map construction KTC produced the EST-based microsatellites from the EST-SIGENAE databasecontributed to genotyping segregation data collectionand analyses SMU contributed to the EST-SIGENAE data-base screening genotyping segregation data analyses CGcontributed to data analysis performed comparativemapping with zebrafish and tentative annotation of rain-bow trout sequences and contributed to manuscript draft-ing FK contributed to EST-SYGENAE database screeningand genotyping EQ contributed to project conceptionand manuscript drafting and produced the mapping DHfamilies All authors read and approved the final manu-script
Additional material
AcknowledgementsThis work is a part of the French AGENAE program and was supported by INRA (Institut Interprofessionnel des Produits de lAquaculture) French Ministry of Agriculture and Fisheries and EU (contract ndegA0248) We thank the staff of the UEP (INRA Uniteacute Expeacuterimentale Piscicole) experimental facilities and the staff of the INRA experimental farm of Gournay-sur-Aronde We thank Martine Andriamanga (Laboratoire de Geacuteneacutetique des Poissons) for laboratory help Karim Gharbi (University of Guelph Depart-ment of Integrative Biology Guelph) for providing primers and Florence
Additional file 1Correspondence of the map reported in this study with already published linkage maps and with chromosome identified by FISH Number of mark-ers and crossovers per linkage groupClick here for file[httpwwwbiomedcentralcomcontentsupplementary1471-2164-7-302-S1xls]
Additional file 2EST accession number or reference for microsatellite loci unavailable in GENBANKClick here for file[httpwwwbiomedcentralcomcontentsupplementary1471-2164-7-302-S2xls]
Additional file 3Functional Annotation of microsatellites markers associated to ESTs Ten-tative annotations from Oncorhynchus mykiss UniGene Build [38] or from rainbow trout gene index version 50 [39] were retrieved with the Rainbow Trout EST SigenaeEnsembl EST contig browser Markers are annotated with NCBI protein accession number [40] for Unigene anno-tation or from Uniprot accession number [41] for TIGR annotation Uni-gene contig name Unigene contig description TIGR contig and TIGR contig description are givenClick here for file[httpwwwbiomedcentralcomcontentsupplementary1471-2164-7-302-S3xls]
Page 12 of 13(page number not for citation purposes)
BMC Genomics 2006 7302 httpwwwbiomedcentralcom1471-21647302
Publish with BioMed Central and every scientist can read your work free of charge
BioMed Central will be the most significant development for disseminating the results of biomedical research in our lifetime
Sir Paul Nurse Cancer Research UK
Your research papers will be
available free of charge to the entire biomedical community
peer reviewed and published immediately upon acceptance
cited in PubMed and archived on PubMed Central
yours mdash you keep the copyright
Submit your manuscript herehttpwwwbiomedcentralcominfopublishing_advasp
BioMedcentral
Maugel (CNRS Laboratoire Evolution Geacutenomes et Speacuteciation Gif-sur-Yvette France) who provided the Software to screen the EST database
References1 Thorgaard GH Bailey GS Williams D Buhler DR Kaattari SL Ristow SS
Hansen JD Winton JR Bartholomew JL Nagler JJ Walsh PJ Vijayan MMDevlin RH Hardy RW Overturf KE Young WP Robison BD Rexroad CPalti Y Status and opportunities for genomics research with rain-bow trout Comp Biochem Physiol B Biochem Mol Biol 2002 133609-646
2 Amores A Force A Yan YL Joly L Amemiya C Fritz A Ho RK LangelandJ Prince V Wang YL Westerfield M Ekker M Postlethwait JH Zebrafishhox clusters and vertebrate genome evolution Science 19982821711-1714
3 Jaillon O Aury JM Brunet F Petit JL Stange-Thomann N Mauceli EBouneau L Fischer C Ozouf-Costaz C Bernot A Nicaud S Jaffe D FisherS Lutfalla G Dossat C Segurens B Dasilva C Salanoubat M Levy MBoudet N Castellano S Anthouard V Jubin C Castelli V Katinka M Vach-erie B Biemont C Skalli Z Cattolico L Poulain J De B V Cruaud CDuprat S Brottier P Coutanceau JP Gouzy J Parra G Lardier G ChappleC McKernan KJ McEwan P Bosak S Kellis M Volff JN Guigo R Zody MCMesirov J Lindblad-Toh K Birren B Nusbaum C Kahn D Robinson-Rechavi M Laudet V Schachter V Quetier F Saurin W Scarpelli CWincker P Lander ES Weissenbach J Roest CH Genome duplicationin the teleost fish Tetraodon nigroviridis reveals the early verte-brate proto-karyotype Nature 2004 431946-957
4 Meyer A Van de PY From 2R to 3R evidence for a fish-specificgenome duplication (FSGD) Bioessays 2005 27937-945
5 Allendorf FW Thorgaard GH Tetraploidy and the evolution of sal-monid fishes In The evolutionary Genetics of Fishes Edited by Turner BJNew-York Plenum Press 19841-53
6 Ohno S Wolf U Atkin NB Evolution from fish to mammals by geneduplication Hereditas 1968 59169-187
7 Rexroad CE III Rodriguez MF Coulibaly I Gharbi K Danzmann RGDekoning J Phillips R Palti Y Comparative mapping of expressedsequence tags containing microsatellites in rainbow trout(Oncorhynchus mykiss) BMC Genomics 2005 654
8 Danzmann RG Cairney M Davidson WS Ferguson MM Gharbi K Guyo-mard R Holm LE Leder E Okamoto N Ozaki A Rexroad CE IIISakamoto T Taggart JB Woram RA A comparative analysis of therainbow trout genome with 2 other species of fish (Arctic charrand Atlantic salmon) within the tetraploid derivative Salmoni-dae family (subfamily Salmoninae) Genome 2005 481037-1051
9 Nichols KM Young WP Danzmann RG Robison BD Rexroad C NoakesM Phillips RB Bentzen P Spies I Knudsen K Allendorf FW CunninghamBM Brunelli J Zhang H Ristow S Drew R Brown KH Wheeler PA Thor-gaard GH A consolidated linkage map for rainbow trout (Onco-rhynchus mykiss) Anim Genet 2003 34102-115
10 Sakamoto T Danzmann RG Gharbi K Howard P Ozaki A Khoo SKWoram RA Okamoto N Ferguson MM Holm LE Guyomard R HoyheimB A microsatellite linkage map of rainbow trout (Oncorhynchusmykiss) characterized by large sex-specific differences in recom-bination rates Genetics 2000 1551331-1345
11 Young WP Wheeler PA Coryell VH Keim P Thorgaard GH A detailedlinkage map of rainbow trout produced using doubled haploidsGenetics 1998 148839-850
12 Leder EH Danzmann RG Ferguson MM The candidate gene Clocklocalizes to a strong spawning time quantitative trait locusregion in rainbow trout J Hered 2006 9774-80
13 Martinez V Thorgaard G Robison B Sillanpaa MJ An application ofBayesian QTL mapping to early development in double haploidlines of rainbow trout including environmental effects Genet Res2005 86209-221
14 Ozaki A Sakamoto T Khoo S Nakamura K Coimbra MR Akutsu TOkamoto N Quantitative trait loci (QTLs) associated with resist-ancesusceptibility to infectious pancreatic necrosis virus (IPNV)in rainbow trout (Oncorhynchus mykiss) Mol Genet Genomics 200126523-31
15 Somorjai IM Danzmann RG Ferguson MM Distribution of tempera-ture tolerance quantitative trait loci in Arctic charr (Salvelinusalpinus) and inferred homologies in rainbow trout (Oncorhyn-chus mykiss) Genetics 2003 1651443-1456
16 Zimmerman AM Evenhuis JP Thorgaard GH Ristow SS A single majorchromosomal region controls natural killer cell-like activity inrainbow trout Immunogenetics 2004 55825-835
17 Brunelli JP Robison BD Thorgaard GH Ancient and recent duplica-tions of the rainbow trout Wilms tumor gene Genome 200144455-462
18 Gharbi K Ferguson MM Danzmann RG Characterization of Na K-ATPase genes in Atlantic salmon (Salmo salar) and comparativegenomic organization with rainbow trout (Oncorhynchusmykiss) Mol Genet Genomics 2005 273474-483
19 Moghadam HK Ferguson MM Danzmann RG Evidence for Hox geneduplication in rainbow trout (Oncorhynchus mykiss) a tetra-ploid model species J Mol Evol 2005 61804-818
20 Phillips RB Zimmerman A Noakes MA Palti Y Morasch MR Eiben LRistow SS Thorgaard GH Hansen JD Physical and genetic mappingof the rainbow trout major histocompatibility regions evidencefor duplication of the class I region Immunogenetics 200355561-569
21 Wright JE Jr Johnson K Hollister A May B Meiotic models to explainclassical linkage pseudolinkage and chromosome pairing intetraploid derivative salmonid genomes Isozymes Curr Top Biol MedRes 1983 10239-260
22 Thorgaard GH Chromosomal differences among rainbow troutpopulations Copeia 1983 3650-662
23 Phillips RB Nichols KM DeKoning JJ Morash MR Keatley KA RexroadCEIII Danzmann RG Drew RE Thorgaard GH Assignment of Rain-bow Trout Linkage Groups to Specific Chromosomes Genetics2006 in press
24 Guyomard R High level of residual heterozygosity in gynogeneticrainbow trout Salmo gairdneri Richardson Theoretical and AppliedGenetics 1984 67307-316
25 Thorgaard GH Allendorf FW Knudsen K Gene-centromere map-ping in rainbow trout high interference over long map distancesGenetics 1983 103771-783
26 Diter A Quillet E Chourrout D Suppression of first egg mitosisinduced by heat shocks in the rainbow trout Journal of Fish Biology1993 42777-786
27 Chourrout D Quillet E Induced gynogenesis in the rainbow trout sex and survival of progenies Production of all-triploid popula-tions Theoretical and Applied Genetics 1982 63201-205
28 SIGENAE [httpwwwsigenaeorg]29 Rozen S Skaletsky H Primer3 on the WWW for general users and
for biologist programmers In Bioinformatics Methods and ProtocolsMethods in Molecular Biology Edited by Krawetz S Misener and S Totowa NJ Humana Press 2000365-386
30 Jackson TR Ferguson MM Danzmann RG Fishback AG PE I M OC TJC Identification of two QTL influencing upper temperature tol-erance in three rainbow trout (Oncorhynchus mykiss) half-sibfamilies Heredity 1998 80143-151
31 Gharbi K Gautier A Danzmann RG Gharbi S Sakamoto T Hoyheim BTaggart JB Cairney M Powell R Krieg F Okamoto N Ferguson MMHolm LE Guyomard R A linkage map for brown trout (Salmotrutta) chromosome homeologies and comparative genomeorganization with other salmonid fish Genetics 20061722405-2419
32 Estoup A Presa P Krieg F Vaiman D Guyomard R (CT)n and (GT)nmicrosatellites a new class of genetic markers for Salmo truttaL (brown trout) Heredity 1993 71488-496
33 S G Bouchez M Chabrier P Milan D Schiex T CARTHAGENEmultipopulation integrated genetic and radiation hybrid map-ping Bioinformatics 2005 211703-1704
34 CarthaGene [httpwwwinrafrinternetDepartementsMIATCarthaGene]
35 Voorrips RE MapChart software for the graphical presentation oflinkage maps and QTLs J Hered 2002 9377-78
36 Danzmann RG Gharbi K Gene mapping in fishes a means to anend Genetica 2001 1113-23
37 Muller C Denis M Gentzbittel L Faraut T The Iccare web server anattempt to merge sequence and mapping information for plantand animal species Nucleic Acids Res 2004 32W429-W434
38 Oncorhynchus mykiss UniGene Build [httpwwwncbinlmnihgovUniGeneUGOrgcgiTAXID=8022]
39 Oncorhynchus mykiss Gene Index [httpwwwtigrorgtigr-scriptstgiT_indexcgispecies=r_trout]
40 NCBI Entrez Protein [httpwwwncbinlmnihgoventrezqueryfcgidb=Protein]
41 UniProt [httpwww piruniprotorgcgi-bintextSearch]
Page 13 of 13(page number not for citation purposes)
- Abstract
-
- Background
- Results
- Conclusion
-
- Background
- Results
-
- Number of informative loci
- Number of linkage groups
- Centromere mapping and arm numbers of linkage groups
- Duplicated regions
- Map length and genome coverage
- Comparative mapping with zebrafish
-
- Discussion
-
- Number of chromosome arms and genome coverage
- Alignment with other rainbow trout maps and zebrafish map
- Duplicated regions
-
- Conclusion
- Methods
-
- Mapping resource populations
- Microsatellite and SNP genotyping
- Linkage analysis and centromere mapping
- Comparative mapping with zebrafish Danio rerio
-
- Authors contributions
- Additional material
- Acknowledgements
- References
-
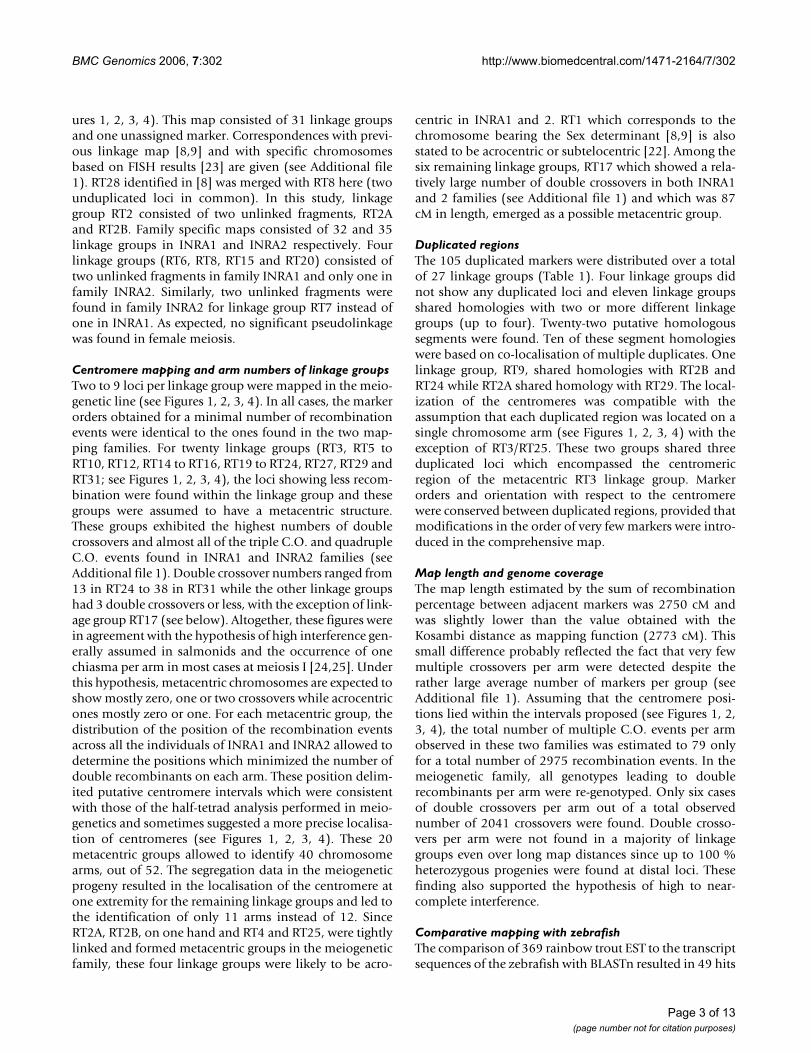
BMC Genomics 2006 7302 httpwwwbiomedcentralcom1471-21647302
Page 6 of 13(page number not for citation purposes)
Graphic representation of linkage groups RT18 to RT25Figure 3Graphic representation of linkage groups RT18 to RT25 Legends are the same as in Figure 1
Ocl8UW(032)00Omi127TUF OMM145818
Omi174TUF OMM1375(0)208
Omy1235INRA OMM5018OMM5307 Omy12832INRAOMM1035 OMM1025
407
Ots-209483
tcaa0002cb16A534
Omy1279INRA614
BX087958747Omy1363INRA Omy1286INRA773
Omy1362INRAOMM1008807
OmyUW1191(017) OMM5289841
OKi10899
OMM1333953Omy1155INRA963Omy103INRA971OmyUW1052 Omy1132INRA988Oneu3f1005
RT19
OMM110700OMM1120(098)42Omy1348INRA OMM1448OMM52672 Omy1289INRAOmi105TUF
67
Omy1020INRA92OMM1050(098)118
SSLEEN82(048)321
Omy1382INRA(019) Omy0008DIAS469OMM1544480Omy1412INRA Omy1254INRABX087759 Omy1002INRA512
Omy11501INRA594
OMM11741730
Omi1021TUF Omy17DIAS788
OMM50171 Omy1116INRAOMM11341(043) OMM51681861
OMM16571 Omy12421INRA879OMM11241 Omy1201INRAOmy13911INRA952
Omy14861INRA974Omy1016UW1
OMM12271Omy12321INRA(093)Ots5121 NWFSC
985
OmyUW117711001Omy41INRA1020
RT20
Omy325UoG00Omy10INRA OMM1060Omy1260INRA SSsp160525
Omy1359INRA62
OMM1491106
OMM5132(086) Ssa405UOS144OMM1367172
Omy301UoG232OmyFGT2TUF244
Omy1013INRA388
Omy1219INRA449OMM1145 OmyFGT27TUFOmy1093INRA484
Omy0002DIASOmyRGT26TUF492OMM1824509OKi8554OMM1736 Omy1035INRA(0)569
OMM5014731
OmyUW1090831
OMM1059895
OMM5179945OMM5197978Omy1403INRA(095) OMM5129Omy1512INRA1011
OMM10891078
Omy1252INRAOMM51261137OMM12711154
OMM14531198
RT21
OmyRGT12TUF(003)00
Omy14271INRA(024)115
OMM1384237
OMM1159(044)298
OMM1512426OmyRGT44TUF omDIAS1460Omy1001UW481OMM1311502
OMM12131544Omi187TUF(1)576
Omy11632INRAOMM12022608
Omy335UOG654
RT18
OMM1362 OMM1023Omy14012INRA00
Omi65TUF(098)09
Omy1016INRA230OMM5162 OMM1744245
Omi20TUF Omy1164INRACA040745351
Omi126TUF(0)426Struta-11434
Omy1508INRA527
OmyUW1552 OMM1445597OMM5133 Omy1387INRA616
Omy1191INRA820Ssa420UOS(079)839
Omy1158INRA960
RT22
Omy1306INRA00OMM132217
Omy0004DIASOMM1105(012)One108145
OMM1449162BX296674 Omy12871INRAOmy12311INRA Omy1233INRA212
OmyPuPuPyDU272Ssa85DU OMM1397(0)281
OMM1402347
OmyRGT36TUF Omy1342INRA429
OMM1211559
OMM1690603Omy1393INRA620OMM1045646OMM1727680Omy1335INRAOMM1194Omi58TUF731
OmyFGT16TUF (100)740
RT24
00
5572
84
115
OMM1097
BX307443OMM1459OMM1069 Ssa401UOSOmy1125INRA Omy1069INRASSLEET47
OMM1538192
Omy1502INRA360
Omy1475INRA(031)425
Omy27INRAOmy1501INRA489Omy1358INRA510OMM1109531
OmyRGT10TUF641Omy1124INRA655
OMM1719(0)719OMM1339 Omy1184INRA(0)728Ots-212(0)737OMM5003(002)754Ots506 NWFSC802
OMM5222838
OMM1190909Omy1368INRA918Omy1361INRA945
Omy1278INRA(049)1097
OMM5010 BX87005211293Omy1103INRA Ots522 NWFSC1302OmyRGT9TUF1306OMM5125 Omy1366INRANaK ATPaseα OMM1095OMM1276
1310
OMM1178 OmyFGT23TUF1343
RT23
Ogo21(0)00
OMM1389(0)70Omy1467INRA88
OmyUW11021156OMM1797175
OmyRGT7TUF261Omy1259INRA270Omy1014UW304
OMM1054(066)338
Omi901TUF457
RT25
BMC Genomics 2006 7302 httpwwwbiomedcentralcom1471-21647302
Page 7 of 13(page number not for citation purposes)
Graphic representation of linkage groups RT26 to RT31 (RT28 does not exist)Figure 4Graphic representation of linkage groups RT26 to RT31 (RT28 does not exist) Legends are the same as in Figure 1
Och1600OMM1607 OMM1033(098)Omy1293INRA Omy1025INRAOMM1751
09
OMM181236
OMM3062 OMM3063OMM3047 Ots108(065)OmyRGT19TUF
145
OtsG243279
Omy1271INRA344OMM1201 Omi111TUF357
OmyFGT3TUF(002)409
OMM1073476Omy1040INRAOMM1712OmyUW1223 Omy1468INRA
493
OMM1705 Omy1371INRA(000)553
OtsG43587
OMM1505690
Omy21INRA755
OMM1720 Omy11262INRA(070)OMM1743
854
OMM51652(091)OMM10642Omy11972INRAOMM13302OMM13611
994
Omy10462INRA1026Omy112INRA Cocl-lav742Omy14762INRA
1037
Omy10792INRA1045Omy11452INRA(090)Cocl-lav7221071Omy11302INRA Omy11872INRAOmy1247INRA
1113
RT29
Omy1380INRA(0)00BHMS247(045)18
OMM5011(029)87
Omy5DIAS(038)161OMM1395 OMM52422OmyRGT24TUF(044)
189
Omy1014INRA Omy108INRA(051)OMM1019 OmyRGT34TUF
240
Omy1049INRA258Omi84TUF278
OMM1238454
Omy1302INRA OMM1723(1)OMM1826 BX8711952
508
Omy1166INRA577
RT30
Ots526 NWFSC00Omi2102TUFOmy10602INRA17Omy14262INRA43OMM17782 OMM5000269CA349040103Oneu182(086) OMM1138OmyFGT82TUF OmyRGT132TUF
120
Omy2722UoG212Str42INRAOMM52462OmyUW1077
229
One102 Omy13002INRA237
Omy1308INRA321Omy13232INRA329
Omy1006UW403Omy1373INRA414OMM1765439Omy1027INRA447
OMM1058(002)506OMM1083515
BHMS129734OMM5146752
Omy1349INRA839OMM5164(051)859
OMM1053951
Omy1009INRA Omy1067INRA1047
Omy1136INRA1103
Omy1241INRA OMM50051160OMM1599 Omy1392INRA1168
RT31
Omy1398INRA Omy1321INRA(005)00Omy1420INRA(005)08Cocl-lav69(005)16
OMM1767321Omy1511INRA OmyRGT39TUF329OMM1734337OMM3000 Omy111DU(054)354
OMM1756489Omi66TUF534OMM1015(098)557OmyFGT24TUF565Omy1284INRAOmy1350INRAOMM1228
582
SSOSL321599
RT26
Omy1178INRABX86338000
Omy25INRA(07)59
OMM52941195Omy1264INRA209
Omy1148INRA303
OMM1039333
Oke4(0) Omy1015INRAOmy1423INRA
467
OMM1070 MST-15492Omy1428INRA533OMM1364587Omy13231INRA616Omy2721UoG630Ocl-2648OmyUW1119 Omy13001INRA(046)Ssa403UOS2
665
Omy1429INRA(05) BX313262686OMM52461 OMM1108707Str41INRA740Omi175TUF795Oneu181(066)840OmyFGT81TUF(081)858Omy1472INRA Omy1204INRAOMM5188 Omy21DIAS
876
OMM50001889OmyRGT131TUF OtsG423902OMM17781906Oke12 Omy14261INRAOMM1131
910
Omi2101TUF927Omy29INRA(092)963OMM5270 Omy10601INRA997
RT27
BMC Genomics 2006 7302 httpwwwbiomedcentralcom1471-21647302
with e-values lt 10-5 The assignment of the correspondingloci to the linkage groups of each species and the con-served syntenies are reported in Table 2 These loci cov-ered 21 linkage groups in zebrafish and ten of themhoused two or more loci In all cases zebrafish linkagegroups showed putative homologies with more than onerainbow trout linkage group irrespective of the duplica-tion in this species Six syntenies were conserved In bothspecies two of them involved two tightly linked lociBX296674Omy1233INRA and Omy1069INRAOmy1125INRA) while the four other ones emcompassedlarge gene distances It is noteworthy that RT9 and RT2Bappeared as a mosaic of non adjacent fragments of theZebrafish linkage group 3 and that in zebrafish linkagegroup 19 the synteny with RT3 was interrupted by a syn-teny with RT23 (Table 2) A tentative functional annota-tion of the EST-based microsatellites localised on the mapwas performed (see Additional file 2) Strong to weak sim-ilarities with identified genes were found for 126 of them
DiscussionNumber of chromosome arms and genome coverageThe primary objective of this work was to obtain a mapcovering all the chromosomes arms of the rainbow troutkaryotype The map reported here was based on more
than 900 markers and consisted of 31 linkage groupsAnalyses of segregation data in both and DH familiesallowed us to recognize 21 metacentric (with the inclu-sion of RT17) and ten acrocentric groups It is noteworthythat our classification was fully supported by a recent Flu-orescent In Situ Hybridization study [23] which reportedthe same acro or metacentric structure for each linkagegroup in rainbow trout (see Additional file 1) Thereforewith respect to our results and the conclusion of the FISHexperiments it can be reasonably assumed that our mapcovers the 52 chromosome arms which constitute therainbow trout karyotype
Our results both in the mapping families and in themeiogenetic line were highly consistent with the findingof high interference in salmonid meiosis ([2425]) Near-complete interference would be the more likely explana-tion for the absence of multiple recombinants per arm forsome linkage groups and the 100 heterozygous proge-nies for some loci in the meiogenetic family [2425] Ifcomplete interference is assumed the length of a linkagegroup can be estimated by the percentage of recom-binants In most cases linkage group lengths were close tothe expected ones under a complete interference modelie 50 cM for acrocentric groups and 100 cM for metacen-
Table 1 Oxford grid showing the homeologous relationships between linkage groups in rainbow trout Linkage group numbers are indicated on first line and row Number of markers shared between duplicated regions are given
1 2 3 4 5 6 7 8 9 10 11 12 13 14 15 16 17 18 19 20 21 22 23 24 25 26 27 29 30 311 1 1 12 19 153 1 3456 1 27 5 18 1 19 210 411 112 14 113 114 161516 117 118192021222324252627 13293031
Page 8 of 13(page number not for citation purposes)
BMC Genomics 2006 7302 httpwwwbiomedcentralcom1471-21647302
tric ones in one family at least Two groups namely RT2ART4 and one arm on RT8 RT17 and RT24 were substan-tially shorter than 50 cM The coverage of these groupscould be readily improved by integration of additionalmarkers from the microsatellite already published [89] orforthcoming linkage maps Overall the total map lengthreported here was rather close to the expected rainbowtrout genome length of 2600 cM under complete interfer-ence (52 arms times 50 cM) This suggests that the presentlinkage map provides a good coverage of the rainbowtrout genome
Four linkage groups in INRA1 (RT6 RT8 RT15 and RT20)and one in INRA2 (RT7) were composed of two unlinkedfragment This could reflect a Robertsonian polymor-phism or alternatively an insufficient local coverage ofthe linkage group in one family In the case of a Robertso-nian polymorphism the two unlinked fragments wouldreflect the independence of the two acrocentric armsWhen considering two independent acrocentric chromo-somes as a single metacentric one 18 of the progeny isexpected to exhibit triple crossovers under complete inter-ference one crossover on each acrocentric group and onerecombinant due to the co-segregation of centromeresfrom each grandparent Since we did not find any con-vincing case of triple crossover at these linkage groupsRobertsonian polymorphism is unlikely to explain theoccurrence of unlinked fragments in one of the familyNote also that only two triple crossovers were foundinstead of 15 (18 times 120 individuals) when RT2A andRT2B are grouped suggesting that these two fragmentscould be linked in our DH families as in [8923]
Assignment of each linkage group to a specific chromo-some[23] will allow to replace the current linkage groupnumbering by a nomenclature based on chromosome sizeas in other species The adoption of a definitive nomencla-ture will require a clear identification of all the chromo-some arm associations involved in the Robertsonianpolymorphism in rainbow trout
Alignment with other rainbow trout maps and zebrafish mapA total number of 214 microsatellite loci were common tothe female-specific maps published by [8] and this oneSyntenies were not conserved for eight loci which mappedto different linkage groups in each map None of theseinconsistencies could be explained by a misinterpretationof a homeology as a homology since the misassigned locidid not map to homeologous regions The 206 remainingmarkers were correctly assigned to a total number of 23linkage groups The conservation of gene orders waschecked for 21 linkage groups which shared more thantwo markers in the two maps In most cases inconsisten-cies in gene orders resulted from the unstable position of
Table 2 Linkage group (LG) assignations are given for both species In rainbow trout position on the linkage group are given starting from the presumably closest marker to the centromere
EST Rainbow trout Zebrafish
LG Position on LG LG Position on LG
Omy1017INRA 11 483 1 532Omy1212INRA 1216 409586 1 292Omy1242INRA 1420 436399 1 280Omy1219INRA 21 011 1 428OMM5188 27 409 1 471BX305657 12 270 2 357Omy1298INRA 16A 35 2 19CA345149 16B 363 2 176BX870052 23 565 2 343Omy1192INRA 9A2B 408481 3 28BX296674 249B 60 3 79Omy1233INRA 249B 60 3 86OMM5127 9A 34 3 86OMM5019 2B9A 441481 3 147OMM5000 27B31B 422437 3 215Omy1261INRA 9A 00 3 286Omy1389INRA 17 00 3 441Omy1474INRA 7 500 4 76Omy1202INRA 12B 334 5 410BX871195 630 635588 6 231Omy1160INRA 10A 313 8 360Omy1510INRA 5 134 9 267OMM5205 8 313 10 21Omy1002INRA 20 43 10 23Omy1512INRA 21 442 10 240Omy1321INRA 26 00 10 297Omy1271INRA 29 65 11 12BX887563 15 417 12 230OMM5244 17 172 12 209Omy1049INRA 30 258 12 316Omy1130INRA 2A29B 315 13 442Omy1358INRA 23 218 13 347OMM5264 3A 92 14 180Omy1300INRA 2731 198269 16 429BX307443 23 673 17 129OMM5137 4 97 18 393OMM5199 3B 73 19 08NaK ATPaseα 23B 582 19 18Omy1278INRA 23B 369 19 209Omy1441INRA 3B 611 19 624Omy1227INRA 16A 129 19 680Omy1112INRA 15 182 20 66Omy1069INRA 23A 644 20 340Omy1125INRA 23A 644 20 375OMM5006 11 392 23 521OMM5002 16A 413 23 521Omy1260INRA 21 544 23 312Omy1286INRA 19 565 25 109
Page 9 of 13(page number not for citation purposes)
BMC Genomics 2006 7302 httpwwwbiomedcentralcom1471-21647302
one marker only or involved markers separated by shortdistances Only RT15 and RT27 showed important dis-crepancies Despite the fact that four families were geno-typed (two in this study and two in [8]) in all casesdiscrepancies in gene orders were detected in only twofamilies the two others being uninformative with respectto the order of the problematic markers The correct orderin these groups remains to be validated The two mapswere also congruent for the localisation of the centro-meres All the linkage groups which showed a centromerein central position in the map of [8] were also stated asbeing metacentric in our map
One hundred and forteen microsatellite loci covering allthe linkage groups were common to the map of [9] andours Only nine markers were not assigned to the samegroup Two discrepancies resulted from comparison ofhomeologous loci [9] map was a male-specific linkagemap obtained by genotyping androgenetic doubled hap-loid progeny Therefore most of the microsatellite mark-ers clustered tightly in the centromeric regions as expectedin male and this map did not provide sufficient informa-tion on gene orders
Overall both syntenies and gene order appear to be con-served among the different linkage maps
The localisation of type I marker on this map has providedsome evidences of conservation of syntenies betweenzebrafish and rainbow trout though it is not the rule Ofparticular interest are the alignment of zebrafish linkagegroups 3 and 19 on the linkage map of rainbow trout andthe complex architecture of the syntenies found Even ifthe comparison of the zebrafish and rainbow troutgenome is still very preliminary and based on a crudeassessment of sequence homologies these findings sug-gest that chromosome rearrangements have been frequentbetween zebrafish and rainbow trout at least over longmap distances but that cases of conserved syntenies canbe found
Duplicated regionsExtensive gene duplication has been reported early in sal-monids and has been a crucial argument in favour of thehypothesis of tetraploidy in salmonids Our data confirmseveral homeology between linkage groups alreadyreported or hypothesized namely RT2ndashRT9 RT2ndashRT29RT3ndashRT25 RT7ndashRT15 RT10ndashRT18 RT12ndashRT16 RT14ndashRT20 and RT27ndashRT31 ([8-10]) With respect to these pre-vious studies two new homeologous regions were identi-fied here RT6ndash30 and RT9ndash24 Finally a new homeologywas suggested for RT17 and 22 which sharedOmy1401INRA in this study and OmyRGT6TUF in [8]Our finding that gene orders are conserved betweenhomeologous markers is congruent with segregation data
which indicate the occurrence of pseudolinkage betweenduplicated pairs belonging to homeologous regions Suchpseudolinkages result from pairing between homeolo-gous regions and alternate segregation [21] and it is likelythat rearrangement in gene orders would prevent orimpede such homeologous pairing Our results were alsocompatible with the assumption that each confirmedhomeologous region (ie defined by two or more sharedduplicated loci) mapped to a single chromosome armswith the exception of the RT3RT25 These two linkagegroups showed a meta and acrocentric structure respec-tively and the three shared duplicated loci were not foundon the same arm of RT3 This could eventually reflect apericentric inversion involving one marker on RT3 butthis exception remains to be validated When two homol-ogies per arm were found one of these homologiesinvolved one single pair of duplicated loci Thus theoccurrence of more than one homology per arm remainshypothetical for the moment Although the occurrence ofmore than one strongly conserved homeologous regionper arm cannot be excluded it is likely to lead to rathercomplex configurations of chromosome pairing and tounbalanced segregations at meiosis
No unique pattern of localisation of the homeologoussegment on chromosome emerged from this study Thehomeologous regions sharing the largest number ofduplicated loci namely RT2A29 RT2B9 RT1216RT14RT20 and RT2731 did not include the centromericregion This is in agreement with the models of tetravalentformation chromatide exchange and conservation ofhomology between homeologous distal region of chro-mosomes proposed by [21] and [5] In the other caseshomeology could concern whole arms or be restricted tothe region proximal to the centromere as for RT914More detailed description of the structure of homeolo-gous linkage groups with the addition of numerous addi-tional loci and sequencing of large BAC fragmentsmapping to these linkage groups both in duplicated andapparently not duplicated regions could be a useful steptowards the understanding of the evolution of a tetra-ploidized genome
ConclusionThe present work provides a linkage map which is likelyto cover most of the genome and to identify all the chro-mosome arms It should be very helpful to distinguishbetween unlinked fragments due to insufficient markerdensity Robertsonian polymorphism and pseudolinkagein future studies In turn this work should benefit fromthe other maps under construction specifically from theinformation derived from male meiosis In contrast withfemale specific maps which show rather uniform distribu-tion of recombination events along arms ([8] this study)male specific maps exhibit more recombination towards
Page 10 of 13(page number not for citation purposes)
BMC Genomics 2006 7302 httpwwwbiomedcentralcom1471-21647302
the telomeric ends and could be more resolutive for theseregions Finally approximately four hundred microsatel-lite markers developed from EST have been mapped inthis study which is only a very small fraction of this typeof markers available in public databases This provides ameans to generate high-density gene maps in rainbowtrout and makes feasible comparative mapping with phy-logenetically distant model species such as zebrafish (thisstudy [9]) or tetraodon [7] Our preliminary data suggestthat conservation of syntenies between rainbow trout andmodel species could occasionally facilitate fine-mappingof QTLs and eventually identification of candidate genes
MethodsMapping resource populationsThe linkage map was constructed using two unrelateddoubled haploid (DH) lines (60 individuals per line) Thesource population was an experimental INRA rainbowtrout strain A grand-parental population of allhomozygous doubled haploids was first establishedusing the mitotic gynogenesis [26] Briefly ova from indi-vidual females were fertilized with UV irradiated spermand diploidy was restored by blocking first embryoniccleavage with a heat shock Some of the DH progenieswere sex-reversed by early hormonal treatment in order toobtain functional males The next generation DH malesand DH females from different families were single-pairmated producing all female F1 hybrid progeny betweenhomozygous lines Two of those females were reproducedusing a second round of mitotic gynogenesis in order toproduce the two mapping DH families used in this work(INRA1 and INRA2)
Centromeres were mapped using a diploid meiogeneticfamily (60 individuals) To produce this meiogenetic fam-ily eggs from a single female were fertilized with UV irra-diated sperm and diploidy was restored by retention ofthe second polar body [27]
All the individuals (4 DH grand-parents 3 mothers andprogeny) were fin clipped and fin clips were stored in 95ethanol for subsequent analyses
Microsatellite and SNP genotypingA total number of 1321 primer pairs were tested Namereferences primer sequences of markers not submitted toGenBank are given (see Additional file 3) Five hundredand seven new primer pairs have been developed fromEST sequences containing microsatellite motives A SIGE-NAE ENSEMBL Rainbow Trout EST Contig version 30was extracted from the SIGENAE-EST database [28] Thisfile was screened for short tandem repeats (two to fivenucleotides) with a software developed by F Mougel(unpublished) The lower repeat numbers were fixed toeight for di and tri-nucleotide motives and to five for tetra
and penta-nucleotide repeats Primers were designed withPRIMER3 software [29] Eight hundred and fourteenalready published microsatellite markers were alsoselected in databases or in publications To discard redun-dant markers prior to PCR tests sequence homologieswere first checked by Blast at low stringency (Blastall com-mand in GCG package chosen E-value 10-3) then manu-ally validated New microsatellite markers were named inaccordance with the convention outlined by [30] For allmicrosatellite markers species abbreviations and micros-atellite source acronyms are given in [9] PCR tests weredone on a sample consisting of the two mothers and thefour grand-parents of DH progeny Duplicated loci werenamed according to the nomenclature described in [31]
Genomic DNA samples were prepared from ethanol pre-served fin tissues following simplified phenol extractionand ethanol precipitation procedures [32] The PCRamplifications separation and visualization of the PCRproducts were carried out according to [31] at the anneal-ing temperature of 58degC When PCR amplification wasunsuccessful the annealing temperature of 52degC wastested The Mg++ concentration was fixed to 2 mM
Two sequences BX087958 and BX087759 were mappedby SNP-based genotyping using sequencing and PCR-RFLP procedures Fragments of 550 and 650 base pairsrespectively were amplified by PCR Amplifications (30cycles 58degC annealing 1 mn elongation) were carried outin 20 microl reactions containing 40 ng of genomic DNA tem-plate 1X reaction buffer (Promega) 04 microM of eachprimer 250 microM of each dNTP 2 mM MgCl2 06 units Taqpolymerase (Promega) SNP polymorphism in femaleswas detected by sequencing PCR products were purifiedby treatment with 2 units of exonuclease 1 and one unitof shrimp alkaline phosphatase SNP polymorphism inthe mothers of DH progeny was detected by sequencingusing the ABI Big Dye terminator chemistry on an ABI 310sequencer Progeny were genotyped by PCR-RFLP meth-ods BX087958 and BX087579 PCR products were cutwith BsrB I and Taq I respectively following Biolabs proto-col and fragments were separated in 2 agarose
Linkage analysis and centromere mappingGenotypes were converted into a backcross format withlinkage phase deduced from the genotypes of the grand-parents each offspring being equivalent to one gameteSince linkage phase was known the two data filesobtained for each female were merged and analysed as asingle data set Linkage groups gene orders and map dis-tances were obtained with CARTHAGENE [33] Linkagegroups were generated with Group command for a LODthreshold of 3 For each linkage group a 10001 frame-work map (likelihood of the map at least 1000-foldhigher than the next highest likelihood using the same
Page 11 of 13(page number not for citation purposes)
BMC Genomics 2006 7302 httpwwwbiomedcentralcom1471-21647302
markers in alternate orders) was also built by using a step-wise locus adding strategy (BuilFW command) Whenpossible microsatellites from ESTs were preferred toanonymous microsatellites The provisional frameworkswere checked for alternative orders with higher likelihoodusing Flips Greedy and Annealing commands which testinversions and permutations of group of markers Finallya comprehensive map including all the markers was builtby adding all the remaining markers at the most likelylocation with Mapcomp command and optimized withFlip command (or details on commands see Carthageneuser guide at [34]
Though it was not expected in female meiosis the occur-rence of pseudo-linkage was checked using a genotype filewith inverted linkage phase
The linkage group numbers followed the current nomen-clature [89] Correspondences between maps were basedon the occurrence of several markers common to thesedifferent maps The map published by Nichols et al [9]also consisted of ten additional small group which werenot taken into account In addition linkage group OA-XXVIII was no longer considered in Nichols et al [9]
Graphic representations of linkage groups were generatedwith MAPCHART version 21 [35] The percentage ofrecombinants was used as the mapping function toaccount for the high levels of chiasma interference whichare usually reported for rainbow trout [102425]
Centromeres were mapped through genotyping of meio-genetic progeny for several loci per linkage group Foreach linkage group loci were ordered manually in such away that the number of recombination events was mini-mum This condition is expected under the hypothesis ofcomplete interference The most likely interval in whichthe centromere lies was deduced from the gene-centro-mere distances (estimated as half the proportion of heter-ozygotes in the meiogynogen progeny) avoiding as far aspossible double recombinants per arm (hypothesis ofnearly complete interference) Details of this half-tetradanalysis can be found in [36]
Comparative mapping with zebrafish Danio rerioThe EST sequences of rainbow trout were masked fromknown repeats and vector sequences and compared to allthe transcript sequences of the zebrafish using the IccareWeb server [37] with the Blastn option of the BLAST pro-gram Only the Highest Scoring Pairs (HSP) with anexpected value less than 10-5 were kept The output filedisplayed the BLAST results and the location of the rain-bow trout genes on the chromosomes of the zebrafish foreach query sequence showing significant homology
Authors contributionsRG conceived the project supervised data analyses andinterpretations and wrote the manuscript SMR contrib-uted to genotyping collection of segregation data datatreatments and map construction KTC produced the EST-based microsatellites from the EST-SIGENAE databasecontributed to genotyping segregation data collectionand analyses SMU contributed to the EST-SIGENAE data-base screening genotyping segregation data analyses CGcontributed to data analysis performed comparativemapping with zebrafish and tentative annotation of rain-bow trout sequences and contributed to manuscript draft-ing FK contributed to EST-SYGENAE database screeningand genotyping EQ contributed to project conceptionand manuscript drafting and produced the mapping DHfamilies All authors read and approved the final manu-script
Additional material
AcknowledgementsThis work is a part of the French AGENAE program and was supported by INRA (Institut Interprofessionnel des Produits de lAquaculture) French Ministry of Agriculture and Fisheries and EU (contract ndegA0248) We thank the staff of the UEP (INRA Uniteacute Expeacuterimentale Piscicole) experimental facilities and the staff of the INRA experimental farm of Gournay-sur-Aronde We thank Martine Andriamanga (Laboratoire de Geacuteneacutetique des Poissons) for laboratory help Karim Gharbi (University of Guelph Depart-ment of Integrative Biology Guelph) for providing primers and Florence
Additional file 1Correspondence of the map reported in this study with already published linkage maps and with chromosome identified by FISH Number of mark-ers and crossovers per linkage groupClick here for file[httpwwwbiomedcentralcomcontentsupplementary1471-2164-7-302-S1xls]
Additional file 2EST accession number or reference for microsatellite loci unavailable in GENBANKClick here for file[httpwwwbiomedcentralcomcontentsupplementary1471-2164-7-302-S2xls]
Additional file 3Functional Annotation of microsatellites markers associated to ESTs Ten-tative annotations from Oncorhynchus mykiss UniGene Build [38] or from rainbow trout gene index version 50 [39] were retrieved with the Rainbow Trout EST SigenaeEnsembl EST contig browser Markers are annotated with NCBI protein accession number [40] for Unigene anno-tation or from Uniprot accession number [41] for TIGR annotation Uni-gene contig name Unigene contig description TIGR contig and TIGR contig description are givenClick here for file[httpwwwbiomedcentralcomcontentsupplementary1471-2164-7-302-S3xls]
Page 12 of 13(page number not for citation purposes)
BMC Genomics 2006 7302 httpwwwbiomedcentralcom1471-21647302
Publish with BioMed Central and every scientist can read your work free of charge
BioMed Central will be the most significant development for disseminating the results of biomedical research in our lifetime
Sir Paul Nurse Cancer Research UK
Your research papers will be
available free of charge to the entire biomedical community
peer reviewed and published immediately upon acceptance
cited in PubMed and archived on PubMed Central
yours mdash you keep the copyright
Submit your manuscript herehttpwwwbiomedcentralcominfopublishing_advasp
BioMedcentral
Maugel (CNRS Laboratoire Evolution Geacutenomes et Speacuteciation Gif-sur-Yvette France) who provided the Software to screen the EST database
References1 Thorgaard GH Bailey GS Williams D Buhler DR Kaattari SL Ristow SS
Hansen JD Winton JR Bartholomew JL Nagler JJ Walsh PJ Vijayan MMDevlin RH Hardy RW Overturf KE Young WP Robison BD Rexroad CPalti Y Status and opportunities for genomics research with rain-bow trout Comp Biochem Physiol B Biochem Mol Biol 2002 133609-646
2 Amores A Force A Yan YL Joly L Amemiya C Fritz A Ho RK LangelandJ Prince V Wang YL Westerfield M Ekker M Postlethwait JH Zebrafishhox clusters and vertebrate genome evolution Science 19982821711-1714
3 Jaillon O Aury JM Brunet F Petit JL Stange-Thomann N Mauceli EBouneau L Fischer C Ozouf-Costaz C Bernot A Nicaud S Jaffe D FisherS Lutfalla G Dossat C Segurens B Dasilva C Salanoubat M Levy MBoudet N Castellano S Anthouard V Jubin C Castelli V Katinka M Vach-erie B Biemont C Skalli Z Cattolico L Poulain J De B V Cruaud CDuprat S Brottier P Coutanceau JP Gouzy J Parra G Lardier G ChappleC McKernan KJ McEwan P Bosak S Kellis M Volff JN Guigo R Zody MCMesirov J Lindblad-Toh K Birren B Nusbaum C Kahn D Robinson-Rechavi M Laudet V Schachter V Quetier F Saurin W Scarpelli CWincker P Lander ES Weissenbach J Roest CH Genome duplicationin the teleost fish Tetraodon nigroviridis reveals the early verte-brate proto-karyotype Nature 2004 431946-957
4 Meyer A Van de PY From 2R to 3R evidence for a fish-specificgenome duplication (FSGD) Bioessays 2005 27937-945
5 Allendorf FW Thorgaard GH Tetraploidy and the evolution of sal-monid fishes In The evolutionary Genetics of Fishes Edited by Turner BJNew-York Plenum Press 19841-53
6 Ohno S Wolf U Atkin NB Evolution from fish to mammals by geneduplication Hereditas 1968 59169-187
7 Rexroad CE III Rodriguez MF Coulibaly I Gharbi K Danzmann RGDekoning J Phillips R Palti Y Comparative mapping of expressedsequence tags containing microsatellites in rainbow trout(Oncorhynchus mykiss) BMC Genomics 2005 654
8 Danzmann RG Cairney M Davidson WS Ferguson MM Gharbi K Guyo-mard R Holm LE Leder E Okamoto N Ozaki A Rexroad CE IIISakamoto T Taggart JB Woram RA A comparative analysis of therainbow trout genome with 2 other species of fish (Arctic charrand Atlantic salmon) within the tetraploid derivative Salmoni-dae family (subfamily Salmoninae) Genome 2005 481037-1051
9 Nichols KM Young WP Danzmann RG Robison BD Rexroad C NoakesM Phillips RB Bentzen P Spies I Knudsen K Allendorf FW CunninghamBM Brunelli J Zhang H Ristow S Drew R Brown KH Wheeler PA Thor-gaard GH A consolidated linkage map for rainbow trout (Onco-rhynchus mykiss) Anim Genet 2003 34102-115
10 Sakamoto T Danzmann RG Gharbi K Howard P Ozaki A Khoo SKWoram RA Okamoto N Ferguson MM Holm LE Guyomard R HoyheimB A microsatellite linkage map of rainbow trout (Oncorhynchusmykiss) characterized by large sex-specific differences in recom-bination rates Genetics 2000 1551331-1345
11 Young WP Wheeler PA Coryell VH Keim P Thorgaard GH A detailedlinkage map of rainbow trout produced using doubled haploidsGenetics 1998 148839-850
12 Leder EH Danzmann RG Ferguson MM The candidate gene Clocklocalizes to a strong spawning time quantitative trait locusregion in rainbow trout J Hered 2006 9774-80
13 Martinez V Thorgaard G Robison B Sillanpaa MJ An application ofBayesian QTL mapping to early development in double haploidlines of rainbow trout including environmental effects Genet Res2005 86209-221
14 Ozaki A Sakamoto T Khoo S Nakamura K Coimbra MR Akutsu TOkamoto N Quantitative trait loci (QTLs) associated with resist-ancesusceptibility to infectious pancreatic necrosis virus (IPNV)in rainbow trout (Oncorhynchus mykiss) Mol Genet Genomics 200126523-31
15 Somorjai IM Danzmann RG Ferguson MM Distribution of tempera-ture tolerance quantitative trait loci in Arctic charr (Salvelinusalpinus) and inferred homologies in rainbow trout (Oncorhyn-chus mykiss) Genetics 2003 1651443-1456
16 Zimmerman AM Evenhuis JP Thorgaard GH Ristow SS A single majorchromosomal region controls natural killer cell-like activity inrainbow trout Immunogenetics 2004 55825-835
17 Brunelli JP Robison BD Thorgaard GH Ancient and recent duplica-tions of the rainbow trout Wilms tumor gene Genome 200144455-462
18 Gharbi K Ferguson MM Danzmann RG Characterization of Na K-ATPase genes in Atlantic salmon (Salmo salar) and comparativegenomic organization with rainbow trout (Oncorhynchusmykiss) Mol Genet Genomics 2005 273474-483
19 Moghadam HK Ferguson MM Danzmann RG Evidence for Hox geneduplication in rainbow trout (Oncorhynchus mykiss) a tetra-ploid model species J Mol Evol 2005 61804-818
20 Phillips RB Zimmerman A Noakes MA Palti Y Morasch MR Eiben LRistow SS Thorgaard GH Hansen JD Physical and genetic mappingof the rainbow trout major histocompatibility regions evidencefor duplication of the class I region Immunogenetics 200355561-569
21 Wright JE Jr Johnson K Hollister A May B Meiotic models to explainclassical linkage pseudolinkage and chromosome pairing intetraploid derivative salmonid genomes Isozymes Curr Top Biol MedRes 1983 10239-260
22 Thorgaard GH Chromosomal differences among rainbow troutpopulations Copeia 1983 3650-662
23 Phillips RB Nichols KM DeKoning JJ Morash MR Keatley KA RexroadCEIII Danzmann RG Drew RE Thorgaard GH Assignment of Rain-bow Trout Linkage Groups to Specific Chromosomes Genetics2006 in press
24 Guyomard R High level of residual heterozygosity in gynogeneticrainbow trout Salmo gairdneri Richardson Theoretical and AppliedGenetics 1984 67307-316
25 Thorgaard GH Allendorf FW Knudsen K Gene-centromere map-ping in rainbow trout high interference over long map distancesGenetics 1983 103771-783
26 Diter A Quillet E Chourrout D Suppression of first egg mitosisinduced by heat shocks in the rainbow trout Journal of Fish Biology1993 42777-786
27 Chourrout D Quillet E Induced gynogenesis in the rainbow trout sex and survival of progenies Production of all-triploid popula-tions Theoretical and Applied Genetics 1982 63201-205
28 SIGENAE [httpwwwsigenaeorg]29 Rozen S Skaletsky H Primer3 on the WWW for general users and
for biologist programmers In Bioinformatics Methods and ProtocolsMethods in Molecular Biology Edited by Krawetz S Misener and S Totowa NJ Humana Press 2000365-386
30 Jackson TR Ferguson MM Danzmann RG Fishback AG PE I M OC TJC Identification of two QTL influencing upper temperature tol-erance in three rainbow trout (Oncorhynchus mykiss) half-sibfamilies Heredity 1998 80143-151
31 Gharbi K Gautier A Danzmann RG Gharbi S Sakamoto T Hoyheim BTaggart JB Cairney M Powell R Krieg F Okamoto N Ferguson MMHolm LE Guyomard R A linkage map for brown trout (Salmotrutta) chromosome homeologies and comparative genomeorganization with other salmonid fish Genetics 20061722405-2419
32 Estoup A Presa P Krieg F Vaiman D Guyomard R (CT)n and (GT)nmicrosatellites a new class of genetic markers for Salmo truttaL (brown trout) Heredity 1993 71488-496
33 S G Bouchez M Chabrier P Milan D Schiex T CARTHAGENEmultipopulation integrated genetic and radiation hybrid map-ping Bioinformatics 2005 211703-1704
34 CarthaGene [httpwwwinrafrinternetDepartementsMIATCarthaGene]
35 Voorrips RE MapChart software for the graphical presentation oflinkage maps and QTLs J Hered 2002 9377-78
36 Danzmann RG Gharbi K Gene mapping in fishes a means to anend Genetica 2001 1113-23
37 Muller C Denis M Gentzbittel L Faraut T The Iccare web server anattempt to merge sequence and mapping information for plantand animal species Nucleic Acids Res 2004 32W429-W434
38 Oncorhynchus mykiss UniGene Build [httpwwwncbinlmnihgovUniGeneUGOrgcgiTAXID=8022]
39 Oncorhynchus mykiss Gene Index [httpwwwtigrorgtigr-scriptstgiT_indexcgispecies=r_trout]
40 NCBI Entrez Protein [httpwwwncbinlmnihgoventrezqueryfcgidb=Protein]
41 UniProt [httpwww piruniprotorgcgi-bintextSearch]
Page 13 of 13(page number not for citation purposes)
- Abstract
-
- Background
- Results
- Conclusion
-
- Background
- Results
-
- Number of informative loci
- Number of linkage groups
- Centromere mapping and arm numbers of linkage groups
- Duplicated regions
- Map length and genome coverage
- Comparative mapping with zebrafish
-
- Discussion
-
- Number of chromosome arms and genome coverage
- Alignment with other rainbow trout maps and zebrafish map
- Duplicated regions
-
- Conclusion
- Methods
-
- Mapping resource populations
- Microsatellite and SNP genotyping
- Linkage analysis and centromere mapping
- Comparative mapping with zebrafish Danio rerio
-
- Authors contributions
- Additional material
- Acknowledgements
- References
-
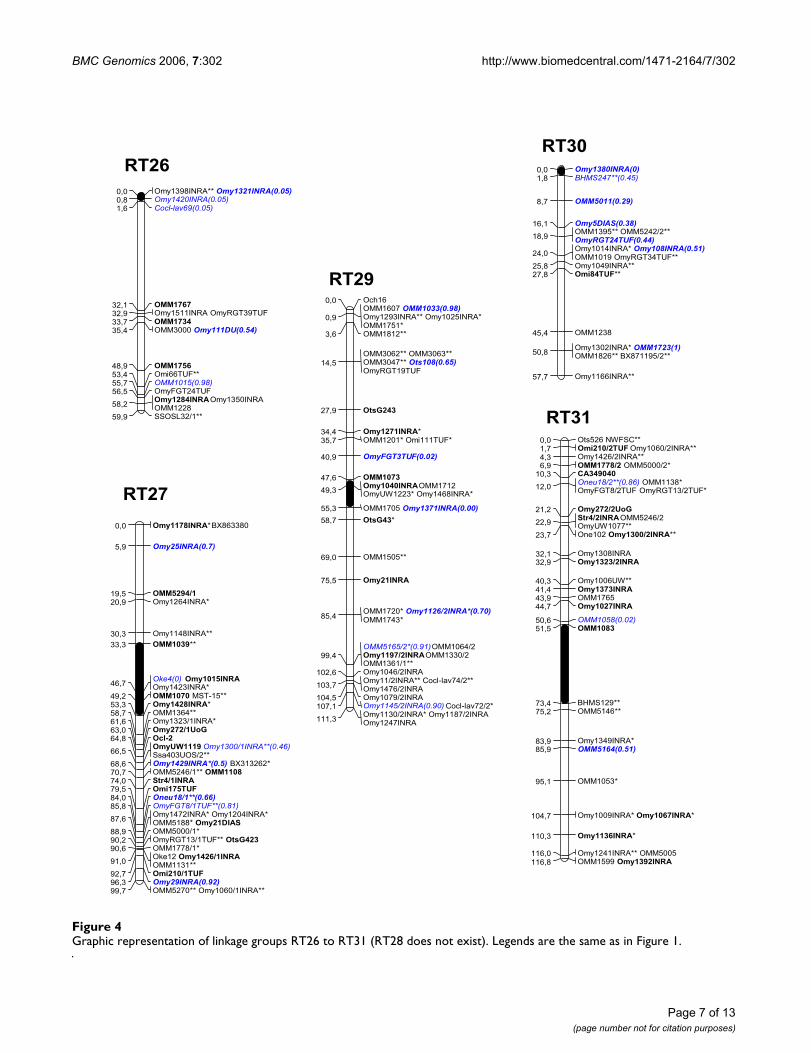
BMC Genomics 2006 7302 httpwwwbiomedcentralcom1471-21647302
Publish with BioMed Central and every scientist can read your work free of charge
BioMed Central will be the most significant development for disseminating the results of biomedical research in our lifetime
Sir Paul Nurse Cancer Research UK
Your research papers will be
available free of charge to the entire biomedical community
peer reviewed and published immediately upon acceptance
cited in PubMed and archived on PubMed Central
yours mdash you keep the copyright
Submit your manuscript herehttpwwwbiomedcentralcominfopublishing_advasp
BioMedcentral
Maugel (CNRS Laboratoire Evolution Geacutenomes et Speacuteciation Gif-sur-Yvette France) who provided the Software to screen the EST database
References1 Thorgaard GH Bailey GS Williams D Buhler DR Kaattari SL Ristow SS
Hansen JD Winton JR Bartholomew JL Nagler JJ Walsh PJ Vijayan MMDevlin RH Hardy RW Overturf KE Young WP Robison BD Rexroad CPalti Y Status and opportunities for genomics research with rain-bow trout Comp Biochem Physiol B Biochem Mol Biol 2002 133609-646
2 Amores A Force A Yan YL Joly L Amemiya C Fritz A Ho RK LangelandJ Prince V Wang YL Westerfield M Ekker M Postlethwait JH Zebrafishhox clusters and vertebrate genome evolution Science 19982821711-1714
3 Jaillon O Aury JM Brunet F Petit JL Stange-Thomann N Mauceli EBouneau L Fischer C Ozouf-Costaz C Bernot A Nicaud S Jaffe D FisherS Lutfalla G Dossat C Segurens B Dasilva C Salanoubat M Levy MBoudet N Castellano S Anthouard V Jubin C Castelli V Katinka M Vach-erie B Biemont C Skalli Z Cattolico L Poulain J De B V Cruaud CDuprat S Brottier P Coutanceau JP Gouzy J Parra G Lardier G ChappleC McKernan KJ McEwan P Bosak S Kellis M Volff JN Guigo R Zody MCMesirov J Lindblad-Toh K Birren B Nusbaum C Kahn D Robinson-Rechavi M Laudet V Schachter V Quetier F Saurin W Scarpelli CWincker P Lander ES Weissenbach J Roest CH Genome duplicationin the teleost fish Tetraodon nigroviridis reveals the early verte-brate proto-karyotype Nature 2004 431946-957
4 Meyer A Van de PY From 2R to 3R evidence for a fish-specificgenome duplication (FSGD) Bioessays 2005 27937-945
5 Allendorf FW Thorgaard GH Tetraploidy and the evolution of sal-monid fishes In The evolutionary Genetics of Fishes Edited by Turner BJNew-York Plenum Press 19841-53
6 Ohno S Wolf U Atkin NB Evolution from fish to mammals by geneduplication Hereditas 1968 59169-187
7 Rexroad CE III Rodriguez MF Coulibaly I Gharbi K Danzmann RGDekoning J Phillips R Palti Y Comparative mapping of expressedsequence tags containing microsatellites in rainbow trout(Oncorhynchus mykiss) BMC Genomics 2005 654
8 Danzmann RG Cairney M Davidson WS Ferguson MM Gharbi K Guyo-mard R Holm LE Leder E Okamoto N Ozaki A Rexroad CE IIISakamoto T Taggart JB Woram RA A comparative analysis of therainbow trout genome with 2 other species of fish (Arctic charrand Atlantic salmon) within the tetraploid derivative Salmoni-dae family (subfamily Salmoninae) Genome 2005 481037-1051
9 Nichols KM Young WP Danzmann RG Robison BD Rexroad C NoakesM Phillips RB Bentzen P Spies I Knudsen K Allendorf FW CunninghamBM Brunelli J Zhang H Ristow S Drew R Brown KH Wheeler PA Thor-gaard GH A consolidated linkage map for rainbow trout (Onco-rhynchus mykiss) Anim Genet 2003 34102-115
10 Sakamoto T Danzmann RG Gharbi K Howard P Ozaki A Khoo SKWoram RA Okamoto N Ferguson MM Holm LE Guyomard R HoyheimB A microsatellite linkage map of rainbow trout (Oncorhynchusmykiss) characterized by large sex-specific differences in recom-bination rates Genetics 2000 1551331-1345
11 Young WP Wheeler PA Coryell VH Keim P Thorgaard GH A detailedlinkage map of rainbow trout produced using doubled haploidsGenetics 1998 148839-850
12 Leder EH Danzmann RG Ferguson MM The candidate gene Clocklocalizes to a strong spawning time quantitative trait locusregion in rainbow trout J Hered 2006 9774-80
13 Martinez V Thorgaard G Robison B Sillanpaa MJ An application ofBayesian QTL mapping to early development in double haploidlines of rainbow trout including environmental effects Genet Res2005 86209-221
14 Ozaki A Sakamoto T Khoo S Nakamura K Coimbra MR Akutsu TOkamoto N Quantitative trait loci (QTLs) associated with resist-ancesusceptibility to infectious pancreatic necrosis virus (IPNV)in rainbow trout (Oncorhynchus mykiss) Mol Genet Genomics 200126523-31
15 Somorjai IM Danzmann RG Ferguson MM Distribution of tempera-ture tolerance quantitative trait loci in Arctic charr (Salvelinusalpinus) and inferred homologies in rainbow trout (Oncorhyn-chus mykiss) Genetics 2003 1651443-1456
16 Zimmerman AM Evenhuis JP Thorgaard GH Ristow SS A single majorchromosomal region controls natural killer cell-like activity inrainbow trout Immunogenetics 2004 55825-835
17 Brunelli JP Robison BD Thorgaard GH Ancient and recent duplica-tions of the rainbow trout Wilms tumor gene Genome 200144455-462
18 Gharbi K Ferguson MM Danzmann RG Characterization of Na K-ATPase genes in Atlantic salmon (Salmo salar) and comparativegenomic organization with rainbow trout (Oncorhynchusmykiss) Mol Genet Genomics 2005 273474-483
19 Moghadam HK Ferguson MM Danzmann RG Evidence for Hox geneduplication in rainbow trout (Oncorhynchus mykiss) a tetra-ploid model species J Mol Evol 2005 61804-818
20 Phillips RB Zimmerman A Noakes MA Palti Y Morasch MR Eiben LRistow SS Thorgaard GH Hansen JD Physical and genetic mappingof the rainbow trout major histocompatibility regions evidencefor duplication of the class I region Immunogenetics 200355561-569
21 Wright JE Jr Johnson K Hollister A May B Meiotic models to explainclassical linkage pseudolinkage and chromosome pairing intetraploid derivative salmonid genomes Isozymes Curr Top Biol MedRes 1983 10239-260
22 Thorgaard GH Chromosomal differences among rainbow troutpopulations Copeia 1983 3650-662
23 Phillips RB Nichols KM DeKoning JJ Morash MR Keatley KA RexroadCEIII Danzmann RG Drew RE Thorgaard GH Assignment of Rain-bow Trout Linkage Groups to Specific Chromosomes Genetics2006 in press
24 Guyomard R High level of residual heterozygosity in gynogeneticrainbow trout Salmo gairdneri Richardson Theoretical and AppliedGenetics 1984 67307-316
25 Thorgaard GH Allendorf FW Knudsen K Gene-centromere map-ping in rainbow trout high interference over long map distancesGenetics 1983 103771-783
26 Diter A Quillet E Chourrout D Suppression of first egg mitosisinduced by heat shocks in the rainbow trout Journal of Fish Biology1993 42777-786
27 Chourrout D Quillet E Induced gynogenesis in the rainbow trout sex and survival of progenies Production of all-triploid popula-tions Theoretical and Applied Genetics 1982 63201-205
28 SIGENAE [httpwwwsigenaeorg]29 Rozen S Skaletsky H Primer3 on the WWW for general users and
for biologist programmers In Bioinformatics Methods and ProtocolsMethods in Molecular Biology Edited by Krawetz S Misener and S Totowa NJ Humana Press 2000365-386
30 Jackson TR Ferguson MM Danzmann RG Fishback AG PE I M OC TJC Identification of two QTL influencing upper temperature tol-erance in three rainbow trout (Oncorhynchus mykiss) half-sibfamilies Heredity 1998 80143-151
31 Gharbi K Gautier A Danzmann RG Gharbi S Sakamoto T Hoyheim BTaggart JB Cairney M Powell R Krieg F Okamoto N Ferguson MMHolm LE Guyomard R A linkage map for brown trout (Salmotrutta) chromosome homeologies and comparative genomeorganization with other salmonid fish Genetics 20061722405-2419
32 Estoup A Presa P Krieg F Vaiman D Guyomard R (CT)n and (GT)nmicrosatellites a new class of genetic markers for Salmo truttaL (brown trout) Heredity 1993 71488-496
33 S G Bouchez M Chabrier P Milan D Schiex T CARTHAGENEmultipopulation integrated genetic and radiation hybrid map-ping Bioinformatics 2005 211703-1704
34 CarthaGene [httpwwwinrafrinternetDepartementsMIATCarthaGene]
35 Voorrips RE MapChart software for the graphical presentation oflinkage maps and QTLs J Hered 2002 9377-78
36 Danzmann RG Gharbi K Gene mapping in fishes a means to anend Genetica 2001 1113-23
37 Muller C Denis M Gentzbittel L Faraut T The Iccare web server anattempt to merge sequence and mapping information for plantand animal species Nucleic Acids Res 2004 32W429-W434
38 Oncorhynchus mykiss UniGene Build [httpwwwncbinlmnihgovUniGeneUGOrgcgiTAXID=8022]
39 Oncorhynchus mykiss Gene Index [httpwwwtigrorgtigr-scriptstgiT_indexcgispecies=r_trout]
40 NCBI Entrez Protein [httpwwwncbinlmnihgoventrezqueryfcgidb=Protein]
41 UniProt [httpwww piruniprotorgcgi-bintextSearch]
Page 13 of 13(page number not for citation purposes)
- Abstract
-
- Background
- Results
- Conclusion
-
- Background
- Results
-
- Number of informative loci
- Number of linkage groups
- Centromere mapping and arm numbers of linkage groups
- Duplicated regions
- Map length and genome coverage
- Comparative mapping with zebrafish
-
- Discussion
-
- Number of chromosome arms and genome coverage
- Alignment with other rainbow trout maps and zebrafish map
- Duplicated regions
-
- Conclusion
- Methods
-
- Mapping resource populations
- Microsatellite and SNP genotyping
- Linkage analysis and centromere mapping
- Comparative mapping with zebrafish Danio rerio
-
- Authors contributions
- Additional material
- Acknowledgements
- References
-


![The effects of benzo[a]pyrene on leucocyte distribution and antibody response in rainbow trout (Oncorhynchus mykiss)](https://static.fdokumen.com/doc/165x107/63254a034643260de90dad35/the-effects-of-benzoapyrene-on-leucocyte-distribution-and-antibody-response-in.jpg)