Candidate Genetic Markers Associated with Anadromy in Oncorhynchus mykiss of the Klickitat River
13
This article was downloaded by: [65.117.100.206] On: 13 July 2011, At: 13:08 Publisher: Taylor & Francis Informa Ltd Registered in England and Wales Registered Number: 1072954 Registered office: Mortimer House, 37-41 Mortimer Street, London W1T 3JH, UK Transactions of the American Fisheries Society Publication details, including instructions for authors and subscription information: http://www.tandfonline.com/loi/utaf20 Candidate Genetic Markers Associated with Anadromy in Oncorhynchus mykiss of the Klickitat River Shawn R. Narum a , Joseph S. Zendt b , Chris Frederiksen c , Nate Campbell a , Andrew Matala a & William R. Sharp c a Columbia River Inter-Tribal Fish Commission, Hagerman Fish Culture Experiment Station, 3059-F National Fish Hatchery Road, Hagerman, Idaho, 83332, USA b Yakama Nation, Yakima Klickitat Fisheries Program, Post Office Box 215, 1575 Horseshoe Bend Road, Klickitat, Washington, 98628, USA c Yakama Nation, Yakima Klickitat Fisheries Program, Natural Resource Annex, 4690 State Route 22, Toppenish, Washington, 98948, USA Available online: 25 Jun 2011 To cite this article: Shawn R. Narum, Joseph S. Zendt, Chris Frederiksen, Nate Campbell, Andrew Matala & William R. Sharp (2011): Candidate Genetic Markers Associated with Anadromy in Oncorhynchus mykiss of the Klickitat River, Transactions of the American Fisheries Society, 140:3, 843-854 To link to this article: http://dx.doi.org/10.1080/00028487.2011.588131 PLEASE SCROLL DOWN FOR ARTICLE Full terms and conditions of use: http://www.tandfonline.com/page/terms-and-conditions This article may be used for research, teaching and private study purposes. Any substantial or systematic reproduction, re-distribution, re-selling, loan, sub-licensing, systematic supply or distribution in any form to anyone is expressly forbidden. The publisher does not give any warranty express or implied or make any representation that the contents will be complete or accurate or up to date. The accuracy of any instructions, formulae and drug doses should be independently verified with primary sources. The publisher shall not be liable for any loss, actions, claims, proceedings, demand or costs or damages whatsoever or howsoever caused arising directly or indirectly in connection with or arising out of the use of this material.
-
Upload
independent -
Category
Documents
-
view
2 -
download
0
Transcript of Candidate Genetic Markers Associated with Anadromy in Oncorhynchus mykiss of the Klickitat River

This article was downloaded by: [65.117.100.206]On: 13 July 2011, At: 13:08Publisher: Taylor & FrancisInforma Ltd Registered in England and Wales Registered Number: 1072954 Registered office: Mortimer House,37-41 Mortimer Street, London W1T 3JH, UK
Transactions of the American Fisheries SocietyPublication details, including instructions for authors and subscription information:http://www.tandfonline.com/loi/utaf20
Candidate Genetic Markers Associated with Anadromyin Oncorhynchus mykiss of the Klickitat RiverShawn R. Narum a , Joseph S. Zendt b , Chris Frederiksen c , Nate Campbell a , AndrewMatala a & William R. Sharp ca Columbia River Inter-Tribal Fish Commission, Hagerman Fish Culture Experiment Station,3059-F National Fish Hatchery Road, Hagerman, Idaho, 83332, USAb Yakama Nation, Yakima Klickitat Fisheries Program, Post Office Box 215, 1575 HorseshoeBend Road, Klickitat, Washington, 98628, USAc Yakama Nation, Yakima Klickitat Fisheries Program, Natural Resource Annex, 4690 StateRoute 22, Toppenish, Washington, 98948, USA
Available online: 25 Jun 2011
To cite this article: Shawn R. Narum, Joseph S. Zendt, Chris Frederiksen, Nate Campbell, Andrew Matala & William R. Sharp(2011): Candidate Genetic Markers Associated with Anadromy in Oncorhynchus mykiss of the Klickitat River, Transactions ofthe American Fisheries Society, 140:3, 843-854
To link to this article: http://dx.doi.org/10.1080/00028487.2011.588131
PLEASE SCROLL DOWN FOR ARTICLE
Full terms and conditions of use: http://www.tandfonline.com/page/terms-and-conditions
This article may be used for research, teaching and private study purposes. Any substantial or systematicreproduction, re-distribution, re-selling, loan, sub-licensing, systematic supply or distribution in any form toanyone is expressly forbidden.
The publisher does not give any warranty express or implied or make any representation that the contentswill be complete or accurate or up to date. The accuracy of any instructions, formulae and drug doses shouldbe independently verified with primary sources. The publisher shall not be liable for any loss, actions, claims,proceedings, demand or costs or damages whatsoever or howsoever caused arising directly or indirectly inconnection with or arising out of the use of this material.

Transactions of the American Fisheries Society 140:843–854, 2011C© American Fisheries Society 2011ISSN: 0002-8487 print / 1548-8659 onlineDOI: 10.1080/00028487.2011.588131
SPECIAL SECTION: GENETIC ADAPTATION
Candidate Genetic Markers Associated with Anadromy inOncorhynchus mykiss of the Klickitat River
Shawn R. Narum*Columbia River Inter-Tribal Fish Commission, Hagerman Fish Culture Experiment Station,3059-F National Fish Hatchery Road, Hagerman, Idaho 83332, USA
Joseph S. ZendtYakama Nation, Yakima Klickitat Fisheries Program, Post Office Box 215, 1575 Horseshoe Bend Road,Klickitat, Washington 98628, USA
Chris FrederiksenYakama Nation, Yakima Klickitat Fisheries Program, Natural Resource Annex, 4690 State Route 22,Toppenish, Washington 98948, USA
Nate Campbell and Andrew MatalaColumbia River Inter-Tribal Fish Commission, Hagerman Fish Culture Experiment Station,3059-F National Fish Hatchery Road, Hagerman, Idaho 83332, USA
William R. SharpYakama Nation, Yakima Klickitat Fisheries Program, Natural Resource Annex, 4690 State Route 22,Toppenish, Washington 98948, USA
AbstractBoth environmental and genetic factors influence anadromy in rainbow trout Oncorhynchus mykiss, but the genetic
mechanisms that contribute to migratory selection are not well understood. In this study, we used a limited genomescan approach to identify candidate genetic markers associated with anadromy in 10 populations of O. mykiss from theKlickitat River, Washington. From an initial panel of 96 single-nucleotide polymorphism (SNP) markers, we identified3 SNPs that were significantly associated with anadromy after accounting for underlying population structure andselective environmental conditions. Univariate logistic regression of allele frequencies and residency/anadromy werealso significant, and thus three SNPs were considered candidate markers associated with anadromy (Omy IL6–320,Omy LDHB-2 i6, and Omy ndk-152). A multivariate logistic model was developed from the allele frequencies ofthese three markers to predict the potential for anadromy in natural populations. This model was applied to eightadditional populations of O. mykiss to evaluate its utility. The results of this study indicate that these markers arestrong candidates for association with anadromy in O. mykiss in the Klickitat River, but further testing is needed toevaluate this association across more of this species’ range. Common-garden experiments may also help clarify theassociation of these candidate markers with the smoltification phenotypes of individual fish.
Both environmental and genetic factors determine whetherindividual rainbow trout Oncorhynchus mykiss remain resident
*Corresponding author: [email protected] June 8, 2010; accepted September 17, 2010
rainbow trout or undergo the necessary physiological changes(smoltification) to prepare for anadromy (Shapovalov and Taft
843
Dow
nloa
ded
by [
65.1
17.1
00.2
06]
at 1
3:08
13
July
201
1

844 NARUM ET AL.
1954; Ricker 1972; Randall et al. 1987; Peven et al. 1994). Whilesome of the environmental factors that contribute to smoltifica-tion (such as photoperiod and temperature) have been evaluated(Hoar 1976), the genetic mechanisms that contribute to migra-tory behavior are not well known. Recent studies have confirmedthat genetic factors do play a role in smoltification (Throweret al. 2004; Nichols et al. 2008), and quantitative trait loci(QTL) have been identified that are associated with the pheno-typic traits of smolts, such as silvery appearance and streamlinedbody shape (Nichols et al. 2008). However, further research isneeded to apply this information to the monitoring and recoveryof natural populations of O. mykiss.
Smoltification is a trait of interest, since resident rainbowtrout and anadromous steelhead life history types may give riseto one another (e.g., Zimmerman and Reeves 2000; Throweret al. 2004). Therefore, resident rainbow trout are a potentialcontributing factor in the population abundance of steelheadand may be influential in the recovery of steelhead stocks listedunder the Endangered Species Act. Despite this potential, cur-rent recovery plans do not typically include resident rainbowtrout. Although genetic studies have indicated that the residentand anadromous life history types commonly interbreed whenfound in sympatry (e.g., Docker and Heath 2003; Olsen et al.2005), the ecotypes may persist as genetically distinct breedingpopulations in geographically proximate locations with differ-ing environments (Narum et al. 2004, 2008).
In this study, we evaluated a panel of 96 single-nucleotidepolymorphism (SNP) markers from diverse functional genes totest for associations with anadromy in populations with distinctecotypes of O. mykiss (i.e., resident or anadromous). We discusssignificant candidate markers and their putative gene functions,along with presenting a simple multivariate logistic model toidentify the potential of individual markers to predict ecotypesin the Klickitat River, Washington (and possibly broader geo-graphic regions).
METHODSTissue samples and populations.—Ten populations of
O. mykiss from the Klickitat River (Figure 1) that have beenpreviously characterized as either primarily resident or primar-ily anadromous (Narum et al. 2007, 2008) were used to testfor markers associated with anadromy. Briefly, the resident oranadromous status of each population was determined by ge-netic stock identification of adult steelhead returning to the sub-basin over multiple years. Populations with high proportionsof steelhead were considered primarily anadromous, and thosewith zero or low proportions were considered primarily resi-dent (average baseline simulation accuracy, 95.3%; see Narumet al. 2007 for details). These ecotype classifications were furthervalidated in landscape genetics analyses with 13 microsatelliteloci that provide evidence for the role that environmental con-ditions play in structuring resident and anadromous populationsin the Klickitat River (Narum et al. 2008). Therefore, fish were
sampled to represent a population that has been characterizedas resident or anadromous rather than attempting to identifythe ecotype or parental history of each individual since eachlife history can give rise to the alternative form. The same fishtissues from Narum et al. (2008) were used to test a panel ofSNP markers for association with anadromy in the KlickitatRiver, allowing previous microsatellite data to be used for someanalyses. For the current study, the tests for anadromy focusedon 10 populations in the middle section of the Klickitat Riversubbasin that included 6 resident and 4 anadromous populationsfrom a similar geographic area (Figure 1). To reduce the hier-archical structure, which could confound the results, these 10collections were chosen for initial analyses since they comprisepaired samples from a similar portion of the drainage. Eightother collections from the Klickitat River were treated as un-knowns and used to test a simple predictive model for ecotypedistinction (Figure 1). However, all collections had a priori infor-mation regarding each population’s primary life history ecotypefrom previous studies (Narum et al. 2007, 2008).
SNP genotyping and descriptive statistics.—Tissue samplesfrom each individual were processed with Qiagen DNeasy kitsto extract DNA from fin clips stored in 100% ethanol. IsolatedDNA from each sample was genotyped for 96 SNP markers(see Table 1) with Taqman chemistry (Applied Biosystems)and Fluidigm 96.96 dynamic array chips (reaction volumes of∼7 nL) for SNP genotyping. Since genotyping in nL reactionvolumes reduces the average starting copy number to a rangewhere genotyping accuracy becomes less reliable (Campbelland Narum 2009a), a preamplification protocol was used to in-crease the number of starting copies. Preamplification occurredin 7-µL reactions with 2 µL of genomic DNA and 5 µL ofpolymerase chain reaction (PCR) cocktail (3.5 µL of QiagenMultiplex Mastermix, 0.875 µL of 96 pooled primer sets at0.36 µM, and 0.625 µL water) under the following thermal cy-cling program: initial denaturing at 95◦C for 15 min; 14 cyclesof 95◦C for 15 s and 60◦C for 4 min; holding at 4◦C. Immedi-ately after cycling, 133 µL of nuclease free H2O or tris–EDTAbuffer was added to each PCR reaction and stored at 4◦C.
Preamplified template DNA was then genotyped with Flu-idigm 96.96 dynamic array chips via a three-step process: (1)SNP assays (Taqman primers/probes) and DNA samples weremixed according to manufacturers’ protocols and loaded ontothe chip with a Fluidigm IFC Controller instrument, (2) targetSNPs were amplified for 50 cycles on an Eppendorf thermalcycler specially formatted for the Fluidigm 96.96 chip, and (3)chips were scanned with a Fluidigm EP-1 instrument to detectfluorescently labeled allele-specific probes. Genotypes for eachassay were autoscored with Fluidigm SNP Analysis version2.1.1 software and verified by visual inspection with scoringguides provided by an assay database and a heterozygous indi-cator sample for each SNP.
Since the specific genes involved in the physiological pro-cess of smoltification are generally unknown, the SNPs in thisstudy were from expressed sequence tags (ESTs) with a wide
Dow
nloa
ded
by [
65.1
17.1
00.2
06]
at 1
3:08
13
July
201
1

GENETIC MARKERS ASSOCIATED WITH ANADROMY 845
FIGURE 1. Map of the Klickitat River subbasin showing the locations of the sample collection sites for O. mykiss. The dashed oval identifies the 10 collectionstreated as known ecotypes based on previous studies (Narum et al. 2007, 2008); sites outside the oval were considered to be of unknown ecotype. The symbol foreach site indicates the primary ecotype for that collection: resident (circles), anadromous (squares), or unknown (triangles).
Dow
nloa
ded
by [
65.1
17.1
00.2
06]
at 1
3:08
13
July
201
1

846 NARUM ET AL.
TABLE 1. Single-nucleotide polymorphic markers assayed in O. mykiss from the Klickitat River.
Marker Putative gene name/functionRemoved from
analysesa Referenceb
1. Omy SEXY1 Sex determination assay * M. Campbell2. Omy myclarp404-111 Acidic ribosomal phosphoprotein ** N. Campbell3. Omy Omyclmk436-96 Map kinase 4 ** N. Campbell4. Omy 113490-159 Unknown gene (expressed) Abadia-Cardoso et al. 20115. Omy 114315-438 Unknown gene (expressed) Abadia-Cardoso et al. 20116. Omy 121006-131 Immediate early response protein 5 Abadia-Cardoso et al. 20117. Omy 121713-115 Similar to vertebrate polymerase Abadia-Cardoso et al. 20118. Omy 123044-128 Unknown gene (expressed) Abadia-Cardoso et al. 20119. Omy 123048-119 40S ribosomal protein S26 Abadia-Cardoso et al. 2011
10. Omy 127236-583 A312aR protein Abadia-Cardoso et al. 201111. Omy 128693-455 Stathmin-like 4 Abadia-Cardoso et al. 201112. Omy 130295-98 Type II keratin K8b *** Abadia-Cardoso et al. 201113. Omy 130524-160 Growth arrest and
DNA-damage-inducible protein alphaAbadia-Cardoso et al. 2011
14. Omy 187760-385 Unknown gene (expressed) Abadia-Cardoso et al. 201115. Omy 95489-239 Unknown gene (expressed) Abadia-Cardoso et al. 201116. Omy 96222-125 Elongation factor 1-alpha Abadia-Cardoso et al. 201117. Omy 97077-73 Anti-proliferative cofactor Abadia-Cardoso et al. 201118. Omy 97660-230 Unknown gene (expressed) Abadia-Cardoso et al. 201119. Omy 97865-196 60S ribosomal protein L37a Abadia-Cardoso et al. 201120. Omy 97954-618 Unknown gene (expressed) Abadia-Cardoso et al. 201121. Omy aldB-165 Aldolase B *** Campbell et al. (2009)22. Omy aldB-414 Aldolase B Campbell et al. (2009)23. Omy ALDOA 1 Aldolase A Aguilar and Garza (2008)24. Omy aromat-280 Aromatase J. Dekoning25. Omy arp-630 Acidic ribosomal phosphoprotein Campbell et al. (2009)26. Omy aspAT-123 Aspartate aminotransferase Campbell et al. (2009)27. Omy aspAT-413 Aspartate aminotransferase Campbell et al. (2009)28. Omy b1-266 BAC clone sequence Sprowles et al. (2006)29. Omy b9-164 BAC clone sequence Sprowles et al. (2006)30. Omy BAC-B4-126 From BAC clone *** S. Young31. Omy BAC-B4-324 From BAC clone S. Young32. Omy cd28-130 CD28-like protein J. Dekoning33. Omy cd59-206 CD59-like protein 1 J. Dekoning34. Omy cd59b-112 CD59-like protein 2 J. Dekoning35. Omy colla1-525 Alpha 1 type 1 collagen J. Dekoning36. Omy cox1-221 Cyclooxygenase 1 Campbell et al. (2009)37. Omy cox2-335 Cyclooxygenase 2 J. Dekoning38. Omy crb-106 Carbonyl reductase, intron 3 Sprowles et al. (2006)39. Omy CRBF1-1 Carbonyl reductase, intron 1 *** Aguilar and Garza (2008)40. Omy cxcr-169 CXC chemokine receptor J. Dekoning41. Omy dacd1-131 Defender against cell death 1 *** N. Campbell42. Omy e1-147 BAC clone sequence Sprowles et al. (2006)43. Omy g1-103 Glucose-6 phosphate dehydrogenase Sprowles et al. (2006)44. Omy g12-82 cDNA clone 1RT158N23 B G12 J. Dekoning45. Omy gadd45-332 gadd45 beta ii N. Campbell46. Omy gdh-271 Glutamate dehydrogenase Campbell et al. (2009)47. Omy gh-334 Growth hormone 1 N. Campbell
Dow
nloa
ded
by [
65.1
17.1
00.2
06]
at 1
3:08
13
July
201
1

GENETIC MARKERS ASSOCIATED WITH ANADROMY 847
TABLE 1. Continued.
Marker Putative gene name/functionRemoved from
analysesa Referenceb
48. Omy gh-475 Growth hormone 1 N. Campbell49. Omy GHSR-121 Growth hormone secretegogue receptor N. Campbell50. Omy gluR-79 Glucocorticoid receptor N. Campbell51. Omy hsc715-80 Heat shock cognate 71 Campbell and Narum
(2009b)52. Omy hsf1b-241 Heat shock factor 1b Campbell and Narum
(2009b)53. Omy hsf2-146 Heat shock factor 2 Campbell and Narum
(2009b)54. Omy hsp47-86 Heat shock protein 47 Campbell and Narum
(2009b)55. Omy hsp70aPro-329 Heat shock protein 70a (promoter) Campbell and Narum
(2009b)56. Omy hsp90BA-193 Heat shock protein 90BA *** Campbell and Narum
(2009b)57. Omy hsp90BA-229 Heat shock protein 90BA Campbell and Narum
(2009b)58. Omy IL17-185 Interleukin 17 J. Dekoning59. Omy IL1b-163 Interleukin 1b J. Dekoning60. Omy IL6-320 Interleukin 6 J. Dekoning61. Omy inos-97 Inducible nitric oxide synthase J. Dekoning62. Omy LDHB-1 i2 Lactate dehydrogenase Aguilar and Garza (2008)63. Omy LDHB-2 e5 Lactate dehydrogenase Aguilar and Garza (2008)64. Omy LDHB-2 i6 Lactate dehydrogenase Aguilar and Garza (2008)65. Omy mapK3-103 Map kinase 4 N. Campbell66. Omy mcsf-268 Macrophage colony-stimulating factor
receptorJ. Dekoning
67. Omy mcsf-371 Macrophage colony-stimulating factorreceptor
J. Dekoning
68. Omy metA-161 Metallothionein A gene N. Campbell69. Omy metB-138 Metallothionein B gene N. Campbell70. Omy myoD-178 Myosin D Campbell et al. (2009)71. Omy nach-200 Voltage-gated sodium channel alpha type
IVJ. Dekoning
72. Omy NaKATPa3-50 Na/K ATPase alpha 3 Campbell et al. (2009)73. Omy ndk-152 Nucleoside diphosphate kinase N. Campbell74. Omy nkef-241 Natural killer efficiency factor *** Campbell et al. (2009)75. Omy nkef-308 Natural killer efficiency factor Campbell et al. (2009)76. Omy nramp-146 Natural resistance associated
macrophage proteinCampbell et al. (2009)
77. Omy Ogo4-212 Microsatellite Ogo4 Campbell et al. (2009)78. Omy OmyP9-180 P9-B genomic sequence Sprowles et al. (2006)79. Omy Ots208-138 Microsatellite Ots208 Campbell et al. (2009)80. Omy Ots249-227 Microsatellite Ots249 Campbell et al. (2009)81. Omy oxct-85 3-oxoacid CoA transferase 1a J. Dekoning82. Omy p53-262 Tumor protein p53 N. Campbell83. Omy pad-196 Peptidylarginine deiminase N. Campbell84. Omy PEPA-i6 Nonspecific dipeptidase (intron 6) Aguilar and Garza (2008)
(Continued on next page)
Dow
nloa
ded
by [
65.1
17.1
00.2
06]
at 1
3:08
13
July
201
1

848 NARUM ET AL.
TABLE 1. Continued.
Marker Putative gene name/functionRemoved from
analysesa Referenceb
85. Omy R0917-230 Recombination activating gene Sprowles et al. (2006)86. Omy R1175-137 Recombination activating gene Sprowles et al. (2006)87. Omy rapd-132 RAPD (OPC-02) marker sequence Sprowles et al. (2006)88. Omy rapd-167 RAPD (OPC-02) marker sequence Sprowles et al. (2006)89. Omy SECC22b-88 Vesicle-trafficking protein SEC22b-B N. Campbell90. Omy sSOD-1 Superoxide dismutase 1 Brunelli et al. (2008)91. Omy star-206 Steroidogenic acute regulatory protein J. Dekoning92. Omy stat3-273 Signal transducer/activator of
transcriptionJ. Dekoning
93. Omy tgfb-207 TGF-beta gene *** J. Dekoning94. Omy tlr3-377 Toll-like receptor 3 J. Dekoning95. Omy tlr5-205 Toll-like receptor 5 J. Dekoning96. Omy µ07–79-166 Unknown gene (from BAC/cDNA clone) S. Young
a * = sex marker, ** = hybrid identification marker (cutthroat trout and O. mykiss), *** = linked marker.b Names of contacts are given for unpublished information. Their e-mail addresses are as follows: M. Campbell ([email protected]), N. Campbell ([email protected]),
J. Dekoning ([email protected]), and S. Young ([email protected]).
variety of putative functions. The SNP markers used in this studywere also ascertained from a broad panel of samples includingrelated populations from the Columbia River (e.g., Campbellet al. 2009), suggesting that ascertainment bias should be lim-ited and affect all populations equally.
Tests for linkage disequilibrium (LD) between all pairs of lociwere performed using the Markov chain–Monte Carlo (MCMC)approximation of the exact test in GENEPOP version 3.3(Raymond and Rousset 1995). Because multiple comparisonswere involved and power was high with these tests, a Bonferronicorrection was used to protect against type I error.
A total of 96 SNPs were screened in this study, but 11 mark-ers were dropped from further statistical analyses (see Table1 for list). Two SNPs in the panel (Omy myclarp404–111 andOmy Omyclmk436–96) were used to detect potential hybridsof O. mykiss and cutthroat trout O. clarkii but dropped fromfurther analyses since hybrids were not identified in this study.One SNP was a sex marker (Omy SEX-Y1; Brunelli et al. 2008)and only used to test for sex linkage with other loci. Eight pairsof SNPs had highly significant LD (P < 0.0001), and the leastinformative of each pair (lowest minor allele frequency) wasdropped from further analyses. The 85 remaining SNPs wereincluded in subsequent statistical tests (Table 1).
Deviation from Hardy–Weinberg equilibrium (HWE) wasevaluated at each locus and population with the MCMC ap-proximation of Fisher’s exact test implemented in GENEPOPversion 3.3 (1,000 batches with 1,000 iterations; Raymond andRousset 1995). Minor allele frequencies (MAFs) were estimatedfor each SNP in each collection with GENEPOP.
Tests for SNP markers associated with anadromy.—Sincetests for outlier loci often provide false positives or false neg-atives (Akey 2009; Hermisson 2009), a three-step process wasused to identify candidate markers associated with anadromy
in this study: Step 1 entailed performing tests to identify initialcandidate markers after correcting for underlying populationstructure; step 2 entailed performing outlier tests to eliminateloci that were associated with selective environmental variables(not necessarily anadromy); and step 3 entailed performing uni-variate logistic regression of SNP allele frequencies on ecotype.Only markers that were statistically significant for all three cri-teria were considered candidates for association with anadromy.Additional markers were identified that may be under selectivepressure in different environments; these were not evaluatedfurther in our tests of anadromy.
To limit association bias due to underlying population struc-ture in tests for candidates (step 1), analyses with STRUCTUREversion 2.3.2 (Pritchard et al. 2000a; Hubisz et al. 2009) andSTRAT version 1.1 (Pritchard et al. 2000b) were implementedas suggested by Pritchard and Rosenberg (1999). This approachenables initial identification of distinct populations (k) and theancestry coefficient (Q) of each individual as a priori inputsfor association tests in STRAT. In a recent review by Zhanget al. (2008), this approach was shown to account for geneticstructure in association studies just as well as other methods,such as principal components analysis (i.e., Price et al. 2006).We completed the procedure for running STRAT as follows:(1) neutral microsatellite loci from Narum et al. (2008) wereused to run STRUCTURE and select the most likely number ofdistinct populations (“k”) from 10 iterations for each potential k-value from 1 to 10 (50,000 burn-in followed by 100,000 MCMCrepetitions); (2) the ancestry coefficients (mean Q values fromCLUMPP; Jakobsson and Rosenberg 2007) for each individualwere used to correct for underlying population structure; (3)the multilocus genotypes from 85 SNP markers and primarylife history of each individual were included in STRAT to testcandidate markers for significant association with anadromy.
Dow
nloa
ded
by [
65.1
17.1
00.2
06]
at 1
3:08
13
July
201
1

GENETIC MARKERS ASSOCIATED WITH ANADROMY 849
To identify SNP markers that were associated with environ-mental variables (step 2), we used the spatial analysis method(SAM) developed by Joost et al. (2008). This approach utilizesgeneral linear models and logistic regression to identify signif-icant associations of habitat characteristics with the presence/absence of alleles at genetic markers across all individuals inthe study. In the current data set, one allele for each SNP was re-coded as present (1) or absent (0) for all individual fish. Missinggenotype data were recoded with the nonnumerical designa-tion of “NaN.” Six environmental variables were included, asdescribed in Narum et al. (2008a): elevation (m), mean dailyhigh temperature (◦C), mean annual precipitation (cm), streamgradient-below (3 km downstream of each site), stream gradient-general (500 m below to 500 m above each site), and upstreamdistance (km) from the mouth of the Klickitat River. Owingto the high power of the SAM test to identify associations, aconservative α of 0.01 with Bonferroni correction (final criticalvalue of 0.00196) was used to reduce false positives in the Waldtest (as recommended by Joost et al. 2008). Markers with P-values below the critical value were considered candidates forassociation with the respective environmental variables.
The third step was initiated to further reduce the risk of falsepositives and to provide a more stringent test for associationof markers. All markers still considered as candidates after ac-counting for association bias using STRUCTURE/STRAT thatwere also not shown to be associated with environmental vari-ables were finally evaluated with univariate logistic regressionat the 10 collection sites. The minor allele frequency for eachmarker was plotted against ecotype (resident or anadromouslife history) and fitted to the following logistic regression curveusing KaleidaGraph version 4.0 (Synergy Software):
y = a + (b − a)/[1 + (x/c)d ],
where y = the y-axis, x = the x-axis, a = the maximum value ofy, b = the minimum value of y, c = the value of x at 50% y, andd = slope. Candidate markers that met the first two criteria andthat were also found to be significant in logistic regression tests(P < 0.05) were considered candidate markers for anadromy.
Individual candidate markers were then incorporated intoa multivariate regression model. This multivariate model wastested on all 18 of the collections identified in Figure 1, with 10of the collections being used to identify candidate markers and8 collections treated as of unknown ecotype (though all had apriori information regarding primary ecotype).
RESULTSOf the 850 tests for deviation from HWE (85 SNPs in
10 populations), there were 10 significant results (5 het-erozygote deficits and 5 heterozygote excesses). The observeddeviations were distributed randomly across loci and popu-lations, with 1 excess in Dead Canyon Creek (Omy gluR-79), 1 excess in lower White Creek (Omy Ots208–138), 1
deficit in lower Summit Creek (Omy 121713–115), 1 deficitin lower Trout Creek (Omy 96222–125), 2 deficits in TepeeCreek (Omy Ots208–138 and Omy tlr5–205), 1 excess in up-per White Creek (Omy Ots208–138), 1 deficit in upper Sum-mit Creek (Omy cox1–221), and 2 excesses in Brush Creek(Omy 113490–159 and Omy hsp47–86). Since no consistenttrends in deviations were observed among loci or populations,the markers and populations did not appear to violate the nullassumption of HWE. None of the 85 SNPs showed significantlinkage disequilibrium with sex.
In the initial step to identify candidate markers, analyseswith STRUCTURE and STRAT were applied using microsatel-lite (neutral) markers to identify underlying population struc-ture, and then all SNP markers were tested for association withanadromy. The results from STRUCTURE provided support fork = 6, as determined by the criteria in Evanno et al. (2005).The mean ancestry coefficient (Q) at k = 6 was included as aninput for the STRAT analysis to correct for population struc-ture, and the results indicated that there were 12 SNPs signif-icantly associated with anadromy (Table 2). These 12 markerswere considered initial candidate markers for association withanadromy.
Analysis with SAM indicated a total of 19 markers that weresignificant for one or more environmental variable, for a totalof 42 significant associations (Table 3). Each of the six en-vironmental variables was significant with at least one marker(Table 3), but temperature had the greatest number of associatedmarkers (11), followed by elevation (10), upstream distance (8),precipitation and stream gradient-below (5 each), and streamgradient-general (3). Of the initial 12 candidate markers iden-tified in STRAT, 6 also showed a significant association withenvironmental variables and thus were not considered candi-dates strictly for anadromy.
The remaining 6 SNPs (Omy 130524–160, Omy CD28–130, Omy hsp90BA-229, Omy IL6–320, Omy LDHB-2 i6, andOmy ndk-152) continued to be under consideration as candidatemarkers for anadromy and were tested via the third verifica-tion step. Of these, 3 markers had allele frequencies that weresignificantly correlated with anadromy in logistic regression(Figure 2). Thus, 3 markers (Omy IL6–320, Omy LDHB-2 i6,and Omy ndk-152) were verified under our protocol as candi-date markers associated with anadromy in the O. mykiss of theKlickitat River.
A simple multiple-regression model was developed fromallele frequencies of the three validated candidate markers topredict anadromy. The resulting model was as follows:
logit P = − 27.686 + (53.667 · MAF[Omy LDHB-2 i6])
+ (71.727 · MAF[Omy ndk-152])
+ (52.691 · MAF[Omy IL6-320]),
where MAF[w] is the minor allele frequency of marker w.The model was also applied to eight additional collections of
Dow
nloa
ded
by [
65.1
17.1
00.2
06]
at 1
3:08
13
July
201
1

850 NARUM ET AL.
TABLE 2. Initial list of candidate markers for anadromy identified with STRAT (Pritchard and Rosenberg 1999); marker numbers are as in Table 1.
Marker Putative gene name/function Significancea
7. Omy 121713-115 Similar to vertebrate polymerase **13. Omy 130524-160 Type II keratin K8b **32. Omy cd28-130 Cell death 28–like protein **33. Omy cd59-206 Cell death 59–like protein 1 **49. Omy GHSR-121 Growth hormone secretegogue receptor ***57. Omy hsp90BA-229 Heat shock protein 90BA **60. Omy IL6-320 Interleukin 6 ***64. Omy LDHB-2 i6 Lactate dehydrogenase ***68. Omy metA-161 Metallothionein A gene **69. Omy metB-138 Metallothionein B gene **73. Omy ndk-152 Nucleoside diphosphate kinase **90. Omy sSOD-1 Superoxide dismutase 1 **
a P < 0.01**; P < 0.001***.
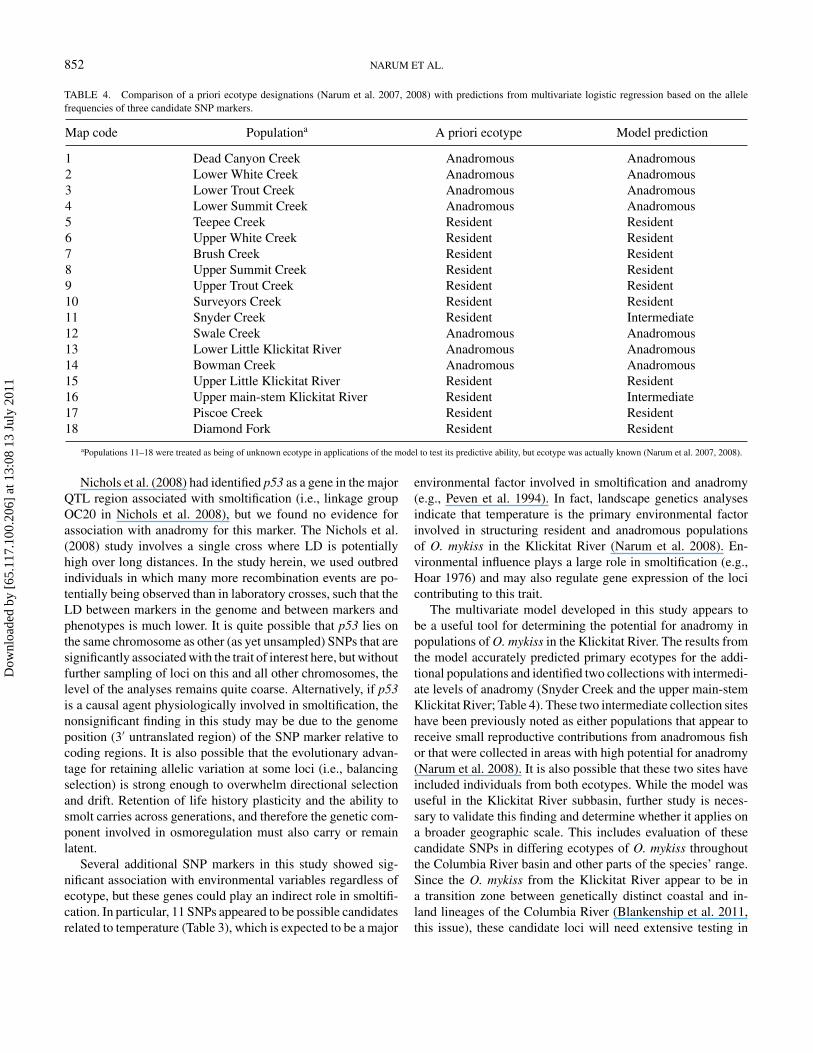
O. mykiss from the upper and lower regions of the KlickitatRiver. The results of the model were observed to be consistentwith previous determinations of residency or anadromy (Narumet al. 2007, 2008), but two populations appeared to be interme-diate between ecotype categories (Snyder Creek and the upperKlickitat River; Table 4). Specifically, the model output pro-vided two main groups of collections (corresponding to residentand anadromous) that were strongly separated, but Snyder Creekand the upper Klickitat River had values intermediate betweenthe two main groups.
DISCUSSIONSmoltification is a complex trait with many potential con-
tributing factors. In concert, these factors dictate whether anindividual fish remains in freshwater as a resident or undergoesanadromous migration to seawater, which are alternative fateswith profound influence on survival and productivity. Environ-mental cues such as photoperiod and temperature have beenshown to play a key role in smoltification (Zaugg and Wagner1973; Hoar 1976; Peven et al. 1994), indicating phenotypicplasticity in this trait. However, breeding studies of resident
TABLE 3. Single-nucleotide polymorphic markers significantly associated with environmental variables as determined by SAM analyses. See text for definitionsof variables.
Marker Environmental variable(s)
Omy 121713-115 ElevationOmy aromat-280 GenGradientOmy arp-630 Temperature, Elevation, BelGradientOmy aspAT-123 GenGradientOmy b1-266 Temperature, Elevation, UpDistance, BelGradientOmy cd59-206 Temperature, Elevation, UpDistance, PrecipitationOmy e1-147 TemperatureOmy g1-103 Temperature, UpDistance, PrecipitationOmy gh-475 BelGradientOmy GHSR-121 Temperature, UpDistanceOmy IL17-185 GenGradientOmy IL1b-163 Temperature, Elevation, UpDistance, Precipitation, BelGradientOmy mcsf-268 Temperature, Elevation, UpDistanceOmy metA-161 UpDistance, PrecipitationOmy metB-138 Temperature, UpDistanceOmy OmyP9-180 ElevationOmy Ots208-138 Temperature, Elevation, BelGradientOmy sSOD-1 Elevation, PrecipitationOmy tlr3-377 Temperature, Elevation
Dow
nloa
ded
by [
65.1
17.1
00.2
06]
at 1
3:08
13
July
201
1

GENETIC MARKERS ASSOCIATED WITH ANADROMY 851
FIGURE 2. Logistic regressions of the minor allele frequency (MAF) ofthree candidate markers—(a) Omy ndk-152, (b) Omy LDHB-2 i6, and (c)Omy IL6–320—on life history ecotype. Resident populations (n = 6) werecoded 0 and anadromous populations (n = 4) were coded 1.
and anadromous ecotypes of O. mykiss have also shown a sub-stantial genetic basis in plasticity among family lines (Throweret al. 2004). The genetic basis of smoltification in O. mykisshas been further evaluated with evidence for at least one ma-jor QTL region and multiple linkage groups being involved insmoltification (Nichols et al. 2008).
In this study, we identified three SNPs that were associatedwith anadromy and additional markers that may be under selec-tion in O. mykiss from differing environments. The three mark-ers associated with anadromy were not significantly linked andwere from genes with varying functions, including interleukin6 (Omy IL6–320), lactate dehydrogenase (Omy LDHB-2 i6),and nucleoside diphosphate kinase (Omy ndk-152). The puta-tive gene functions for these three genes were intriguing, sincenucleoside diphosphate kinase and lactate dehydrogenase aremetabolic genes and interleukin 6 is an immune response gene.Metabolic genes in particular could influence migration and sex-ual maturity in fish (e.g., Leonard and McCormick 1999), andinterleukin 6 is a mediator of inflammatory response in muscle(Iliev et al. 2007). The marker from interleukin 6 had the weak-est association with anadromy of the three candidate markers,and it is possible that demographic factors (i.e., bottlenecks orlow effective size) could have influenced the association withMAF despite the attempted correction with STRAT. It is alsopossible that these may not be the actual genes responsible forthe variation in anadromy observed in this study but rather mark-ers closely linked with other genes. This may highlight the needfor further verification of these candidate markers in common-garden studies to test genotype and phenotypic response as wellas the need for linkage mapping with fine scale QTL analyses.Additional genome scans on a finer level, whether QTL analysisor association mapping in outbred natural populations, wouldbe an equally valid and important next step. Further, microarrayand gene expression studies may be a useful approach to iden-tifying candidate genes involved in life history variation (Gigeret al. 2008).
Interestingly, our study included markers from genes thathad a priori potential to be associated with anadromy butwere not significant candidates in any phase of our analy-ses. These included markers from the Na+,K+-ATPase alpha3 gene (which is believed to be involved in osmoregulation;Lee et al. 1998) and the p53 tumor suppressor gene (whichhas been shown to be associated with the smoltification phe-notype; Nichols et al. 2008). However, only the alpha 1a and1b isoforms of Na+,K+-ATPase are found to be differentiallyregulated in rainbow trout in salinity challenges (Richardset al. 2003), and thus the alpha 3 isoform may not be di-rectly involved in osmoregulation or the process of smoltifi-cation. Further investigation into the role of Na+,K+-ATPasegenes with smoltification is strongly warranted though, sinceNa+,K+-ATPase has been shown to be involved in osmoregu-lation in rainbow trout (Lingwood et al. 2005) and other fishspecies (Bystriansky et al. 2006; McCairns and Bernatchez2010).
Dow
nloa
ded
by [
65.1
17.1
00.2
06]
at 1
3:08
13
July
201
1
852 NARUM ET AL.
TABLE 4. Comparison of a priori ecotype designations (Narum et al. 2007, 2008) with predictions from multivariate logistic regression based on the allelefrequencies of three candidate SNP markers.
Map code Populationa A priori ecotype Model prediction
1 Dead Canyon Creek Anadromous Anadromous2 Lower White Creek Anadromous Anadromous3 Lower Trout Creek Anadromous Anadromous4 Lower Summit Creek Anadromous Anadromous5 Teepee Creek Resident Resident6 Upper White Creek Resident Resident7 Brush Creek Resident Resident8 Upper Summit Creek Resident Resident9 Upper Trout Creek Resident Resident10 Surveyors Creek Resident Resident11 Snyder Creek Resident Intermediate12 Swale Creek Anadromous Anadromous13 Lower Little Klickitat River Anadromous Anadromous14 Bowman Creek Anadromous Anadromous15 Upper Little Klickitat River Resident Resident16 Upper main-stem Klickitat River Resident Intermediate17 Piscoe Creek Resident Resident18 Diamond Fork Resident Resident
aPopulations 11–18 were treated as being of unknown ecotype in applications of the model to test its predictive ability, but ecotype was actually known (Narum et al. 2007, 2008).
Nichols et al. (2008) had identified p53 as a gene in the majorQTL region associated with smoltification (i.e., linkage groupOC20 in Nichols et al. 2008), but we found no evidence forassociation with anadromy for this marker. The Nichols et al.(2008) study involves a single cross where LD is potentiallyhigh over long distances. In the study herein, we used outbredindividuals in which many more recombination events are po-tentially being observed than in laboratory crosses, such that theLD between markers in the genome and between markers andphenotypes is much lower. It is quite possible that p53 lies onthe same chromosome as other (as yet unsampled) SNPs that aresignificantly associated with the trait of interest here, but withoutfurther sampling of loci on this and all other chromosomes, thelevel of the analyses remains quite coarse. Alternatively, if p53is a causal agent physiologically involved in smoltification, thenonsignificant finding in this study may be due to the genomeposition (3′ untranslated region) of the SNP marker relative tocoding regions. It is also possible that the evolutionary advan-tage for retaining allelic variation at some loci (i.e., balancingselection) is strong enough to overwhelm directional selectionand drift. Retention of life history plasticity and the ability tosmolt carries across generations, and therefore the genetic com-ponent involved in osmoregulation must also carry or remainlatent.
Several additional SNP markers in this study showed sig-nificant association with environmental variables regardless ofecotype, but these genes could play an indirect role in smoltifi-cation. In particular, 11 SNPs appeared to be possible candidatesrelated to temperature (Table 3), which is expected to be a major
environmental factor involved in smoltification and anadromy(e.g., Peven et al. 1994). In fact, landscape genetics analysesindicate that temperature is the primary environmental factorinvolved in structuring resident and anadromous populationsof O. mykiss in the Klickitat River (Narum et al. 2008). En-vironmental influence plays a large role in smoltification (e.g.,Hoar 1976) and may also regulate gene expression of the locicontributing to this trait.
The multivariate model developed in this study appears tobe a useful tool for determining the potential for anadromy inpopulations of O. mykiss in the Klickitat River. The results fromthe model accurately predicted primary ecotypes for the addi-tional populations and identified two collections with intermedi-ate levels of anadromy (Snyder Creek and the upper main-stemKlickitat River; Table 4). These two intermediate collection siteshave been previously noted as either populations that appear toreceive small reproductive contributions from anadromous fishor that were collected in areas with high potential for anadromy(Narum et al. 2008). It is also possible that these two sites haveincluded individuals from both ecotypes. While the model wasuseful in the Klickitat River subbasin, further study is neces-sary to validate this finding and determine whether it applies ona broader geographic scale. This includes evaluation of thesecandidate SNPs in differing ecotypes of O. mykiss throughoutthe Columbia River basin and other parts of the species’ range.Since the O. mykiss from the Klickitat River appear to be ina transition zone between genetically distinct coastal and in-land lineages of the Columbia River (Blankenship et al. 2011,this issue), these candidate loci will need extensive testing in
Dow
nloa
ded
by [
65.1
17.1
00.2
06]
at 1
3:08
13
July
201
1

GENETIC MARKERS ASSOCIATED WITH ANADROMY 853
collections comprised of a single lineage (interior or coastal).Common-garden studies with resident and anadromous strainsof fish reared under controlled environmental conditions wouldalso allow testing of individual smoltification phenotypes andgenotypes at candidate markers.
ACKNOWLEDGMENTSAssistance in generating the genotype data were provided by
Lori Maxwell. Figure 1 was provided by David Graves. Fundingfor this study came from the Bonneville Power Administration.
REFERENCESAbadia-Cardoso, A., A. J. Clemento, and J. C. Garza. 2011. Discovery and
characterization of single-nucleotide polymorphisms in steelhead/rainbowtrout, Oncorhynchus mykiss. Molecular Ecology Resources 11(Supplement1):31–49.
Aguilar, A., and J. C. Garza. 2008. Isolation of 15 single-nucleotide polymor-phisms from coastal steelhead, Oncorhynchus mykiss (Salmonidae). Molec-ular Ecology Resources 8:659–662.
Akey, J. M. 2009. Constructing genomic maps of positive selection in humans:where do we go from here? Genome Research 19:711–722.
Blankenship, S. M., M. R. Campbell, J. E. Hess, M. A. Hess, T. W. Kassler,C. C. Kozfkay, A. P. Matala, S. R. Narum, M. M. Paquin, M. P. Small,J. J. Stephenson, K. I. Warheit, and P. Moran. 2011. Major lineages andmetapopulations in Columbia River Oncorhynchus mykiss are structured bydynamic landscape features and environments. Transactions of the AmericanFisheries Society 140:665–684.
Brunelli, J. P., K. J. Wertzler, K. Sundin, and G. H. Thorgaard. 2008. Y-specificsequences and polymorphisms in rainbow trout and Chinook salmon. Genome51:739–748.
Bystriansky, J. S., J. G. Richards, P. M. Schulte, and J. S. Ballantyne. 2006.Reciprocal expression of gill Na+/K+-ATPase α-subunit isoforms α1a andα1b during seawater acclimation of three salmonid fishes that vary in theirsalinity tolerance. Journal of Experimental Biology 209:1848–1858.
Campbell, N. R., and S. R. Narum. 2009a. Quantitative PCR assessment ofmicrosatellite and SNP genotyping with variable-quality DNA extracts. Con-servation Genetics 10:779–784.
Campbell, N. R., and S. R. Narum. 2009b. Identification and characterization ofheat shock response–related single-nucleotide polymorphisms in O. mykissand O. tshawytscha. Molecular Ecology Resources 9:1460–1559.
Campbell, N. R., K. Overturf, and S. R. Narum. 2009. Characterization of22 novel single-nucleotide polymorphism markers in steelhead and rainbowtrout. Molecular Ecology Resources 9:318–322.
Docker, M. F., and D. D. Heath. 2003. Genetic comparison between sym-patric anadromous steelhead and freshwater resident rainbow trout in BritishColumbia, Canada. Conservation Genetics 4:227–231.
Evanno, G., S. Regnaut, and J. Goudet. 2005. Detecting the number of clusters ofindividuals using the software STRUCTURE: a simulation study. MolecularEcology 14:2611–20.
Giger, T., L. Excoffier, U. Amstutz, P. J. R. Day, A. Champigneulle, M. M.Hansen, J. Kelso, and C. R. Largiader. 2008. Population transcriptomics oflife history variation in the genus Salmo. Molecular Ecology 17:3095–3108.
Hermisson, J. 2009. Who believes in whole-genome scans for selection? Hered-ity 103:283–284.
Hoar, W. S. 1976. Smolt transformation: evolution, behavior, and physiology.Journal of the Fisheries Research Board of Canada 33:1234–1252.
Hubisz, M. J., D. Falush, M. Stephens, and J. K. Pritchard. 2009. Inferringweak population structure with the assistance of sample group information.Molecular Ecology Resources 9:1322–1332.
Iliev, D. B., B. Castellana, S. MacKenzie, J. V. Planas, and F. W. Goetz.2007. Cloning and expression analysis of an IL-6 homolog in rainbow trout(Oncorhynchus mykiss). Molecular Immunology 44:1803–1807.
Jakobsson, M., and N. A. Rosenberg. 2007. CLUMPP: a cluster matching andpermutation program for dealing with label switching and multimodality inanalysis of population structure. Bioinformatics 23:1801–1806.
Joost, S., M. Kalbermatten, and A. Bonin. 2008. Spatial analysis method (SAM):a software tool combining molecular and environmental data to identifycandidate loci for selection. Molecular Ecology Resources 8:957–960.
Lee, T. H., J. C. Tsai, M. J. Fang, M. J. Yu, and P. P. Hwang. 1998. Isoformexpression of Na+-K+-ATPase a-subunit in gills of the teleost Oreochromismossambicus. American Journal of Physiology 275:R926–R932.
Leonard, J. B. K., and S. D. McCormick. 1999. The effect of migration dis-tance and timing on metabolic enzyme activity in an anadromous clupeid,the American shad (Alosa sapidissima). Fish Physiology and Biochemistry20:163–179.
Lingwood, D., G. Harauz, and J. S. Ballantyne. 2005. Regulation of fish gillNa+/K+-ATPase by selective sulfatide-enriched raft partitioning during sea-water adaptation. Journal of Biological Chemistry 280:36545–36550.
McCairns, R. J., and L. Bernatchez. 2010. Adaptive divergence between fresh-water and marine sticklebacks: insights into the role of phenotypic plas-ticity from an integrated analysis of candidate gene expression. Evolution64:1029–1047.
Narum, S. R., C. Contor, A. Talbot, and M. Powell. 2004. Genetic divergenceof sympatric resident and anadromous forms of Oncorhynchus mykiss in theWalla Walla River and Columbia River basin, USA. Journal of Fish Biology65:471–488.
Narum, S. R., J. S. Zendt, C. Frederiksen, and W. R. Sharp. 2007. Substructure ofnative steelhead in the Klickitat River and genetic ID of spawning populations.Pages 294–295 in R. F. Carline and C. LoSapio, editors. Proceedings of the 9thwild trout symposium: sustaining wild trout in a changing world. PublishingArts, Fort Collins, Colorado.
Narum, S. R., J. Zendt, D. Graves, and B. Sharp. 2008. Influence of landscape onresident and anadromous life history types of Oncorhynchus mykiss. CanadianJournal of Fisheries and Aquatic Sciences 65:1013–1023.
Nichols, K. M., A. F. Edo, P. A. Wheeler, and G. H. Thorgaard. 2008. Thegenetic basis of smoltification-related traits in Oncorhynchus mykiss. Genetics179:1559–1575.
Olsen, J. B., K. Wuttig, D. Fleming, E. J. Kretschmer, and J. K. Wenburg. 2005.Evidence of partial anadromy and resident-form dispersal bias on a fine scalein populations of Oncorhynchus mykiss. Conservation Genetics 7:613–619.
Peven, C. M., R. R. Whitney, and K. R. Williams. 1994. Age and length ofsteelhead smolts from the mid-Columbia River basin, Washington. NorthAmerican Journal of Fisheries Management 14:77–86.
Price, A. L., N. J. Patterson, R. M. Plenge, M. E. Weinblatt, and N. A. Shadick.2006. Principal components analysis corrects for stratification in genomewideassociation studies. Nature Genetics 38:904–909.
Pritchard, J. K., and N. A. Rosenberg. 1999. Use of unlinked genetic markersto detect population stratification in association studies. American Journal ofHuman Genetics 65:220–228.
Pritchard, J. K., M. Stephens, and P. Donnelly. 2000a. Inference of populationstructure using multilocus genotype data. Genetics 155:945–959.
Pritchard, J. K., M. Stephens, N. A. Rosenberg, and P. Donnelly. 2000b. As-sociation mapping in structured populations. American Journal of HumanGenetics 67:170–181.
Randall, R. G., M. C. Healy, and J. B. Dempson. 1987. Variability in lengthof freshwater residence of salmon, trout, and char. Pages 27–41 in M. J.Dadswell, R. J. Klauda, C. M. Moffitt, R. L. Saunders, R. A. Rulifson, andJ. E. Cooper, editors. Common strategies of anadromous and catadromousfishes. American Fisheries Society, Symposium 1, Bethesda, Maryland.
Raymond, M., and F. Rousset. 1995. GENEPOP (version 1.2): population genet-ics software for exact tests and ecumenicism. Journal of Heredity 86:248–249.
Richards, J. G., J. W. Semple, J. S. Bystriansky, and P. M. Schulte.2003. Na+/K+-ATPase α-isoform switching in gills of rainbow trout
Dow
nloa
ded
by [
65.1
17.1
00.2
06]
at 1
3:08
13
July
201
1

854 NARUM ET AL.
(Oncorhynchus mykiss) during salinity transfer. Journal of Experimental Bi-ology 206:4475–4486.
Ricker, W. E. 1972. Hereditary and environmental factors affecting certainsalmonid populations. Pages 19–160 in R. C. Simon and P. A. Larkin, editors.The stock concept in Pacific salmon: H. R. MacMillan lectures in fisheries.University of British Columbia Press, Vancouver.
Shapovalov, L., and A. C. Taft. 1954. The life histories of the steelhead rainbowtrout (Salmo gairdneri gairdneri) and silver salmon (Oncorhynchus kisutch)with special reference to Waddell Creek, California, and recommendationsregarding their management. California Department of Game and Fish, FishBulletin 98.
Sprowles, A. E., M. R. Stephens, N. W. Clipperton, and B. P. May. 2006. Fishingfor SNPs: a targeted locus approach for single-nucleotide polymorphismdiscovery in rainbow trout. Transactions of the American Fisheries Society135:1698–1721.
Thrower, F. P., J. J. Hard, and J. E. Joyce. 2004. Genetic architectureof growth and early life history transitions in anadromous and derivedfreshwater populations of steelhead. Journal of Fish Biology 65:286–307.
Zaugg, W. S., and H. H. Wagner. 1973. Gill ATPase activity related to parr–smolttransformation and migration in steelhead trout (Salmo gairdneri): influenceof photoperiod and temperature. Comparative Biochemistry and Physiology45B:955–965.
Zhang, F., Y. Wang, and H. Deng. 2008. Comparison of population-based asso-ciation study methods correcting for population stratification. PLoS (PublicLibrary of Science) One [online serial] 3:e3392.
Zimmerman, C. E., and G. H. Reeves. 2000. Population structure of sym-patric anadromous and nonanadromous Oncorhynchus mykiss: evidence fromspawning surveys and otolith microchemistry. Canadian Journal of Fisheriesand Aquatic Sciences 57:2152–2162.
Dow
nloa
ded
by [
65.1
17.1
00.2
06]
at 1
3:08
13
July
201
1