Lysosomal dysfunction increases exosome-mediated alpha-synuclein release and transmission
Upload
independentCategory
view
2download
0
Developmental and Comparative Immunology 37 (2012) 402–413
Contents lists available at SciVerse ScienceDirect
Developmental and Comparative Immunology
journal homepage: www.elsevier .com/locate /dc i
Characterisation and expression analysis of the rainbow trout (Oncorhynchusmykiss) homologue of the human dendritic cell marker CD208/lysosomalassociated membrane protein 3
Petronella Johansson a,b, Yolanda Corripio-Miyar a,c, Tiehui Wang a, Bertrand Collet b, Chris J. Secombes a,Jun Zou a,⇑a Scottish Fish Immunology Research Centre, University of Aberdeen, Zoology Building, Tillydrone Avenue, Aberdeen AB24 2TZ, Scotland, UKb Marine Scotland – Science, Marine Laboratory, 375 Victoria Road, Aberdeen AB11 9DB, Scotland, UKc The Roslin Institute and Royal (Dick) School of Veterinary Studies, University of Edinburgh, Midlothian EH25 9RG, Scotland, UK
a r t i c l e i n f o
Article history:Received 20 December 2011Revised 19 February 2012Accepted 21 February 2012Available online 6 March 2012
Keywords:Dendritic cellsRainbow troutLAMP3/CD208Maturation markers
0145-305X/$ - see front matter � 2012 Elsevier Ltd.http://dx.doi.org/10.1016/j.dci.2012.02.012
Abbreviations: dsRNA, double-stranded RNA; BM-DDC, dendritic cell; IPNV, infectious pancreatic necrosride; LAMP3, lysosomal associated membrane proteinplasmacytoid DC; PolyIC, polyinosinic-polycytidylicpatibility complex; Mo-Mac, monocyte-derived macr⇑ Corresponding author. Tel.: +44 1224 273796; fax
E-mail address: [email protected] (J. Zou).
a b s t r a c t
LAMP3/CD208 is a member of the lysosomal-associated membrane protein family and is used as a puta-tive marker for mature dendritic cells (DCs) in humans since it is upregulated upon DC activation andmaturation. This paper reports the cloning and sequencing of LAMP3 in rainbow trout. The predictedtrout LAMP3 shares the characteristic features of LAMP family members such as a C-terminal lysosomalsorting motif (G-Y-D-R-I) in the short C-terminal cytoplasmic tail, typical for lysosomal targeting, fourpotential N-linked glycosylation sites (NXS/T), four conserved cysteines in the membrane-proximaldomain and the luminal domain divided by a serine/proline-rich region. Expression studies revealed thattrout LAMP3, like chicken LAMP3, was constitutively expressed in a wide range of lymphoid tissues, athighest levels in the head kidney, liver and spleen, respectively. LAMP3 was also constitutively expressedin trout head kidney macrophages and RTS11 cells and the expression was shown to be induced in vivoafter infection with viral and bacterial pathogens and in cultured macrophages after modulation withmicrobial mimics (LPS and PolyIC). Thus, it is clear that if LAMP3 is expressed by trout DCs it is not exclu-sively expressed by them. However, the marker is valuable to further study antigen presentation in fishand to complement already known DC markers.
� 2012 Elsevier Ltd. All rights reserved.
1. Introduction include a stellate cell shape, nonadherence to plastic and very
Dendritic cells (DCs) are bone marrow derived leukocytes spe-cialized in antigen presentation in mammals (Steinman, 1991).Belonging to the innate immune system with the main functionto present antigens and as competent stimulators of naive T lym-phocytes, they are crucial for the initiation and modulation ofpathogen-specific adaptive immunity (Banchereau and Steinman,1998). Indeed, DCs are considered the most potent APCs in the im-mune system and act as a bridge between innate and adaptiveimmunity of vertebrates (Reis e Sousa, 2004). After encounter withappropriate immunologic stimuli, DCs undergo phenotypic andfunctional changes and become cells specialized in antigen presen-tation instead of antigen capture (Steinman, 1991). Mature DCs
All rights reserved.
C, bone marrow-derived DC;is virus; LPS, lipopolysaccha-
3; LC, Langerhans cell; PDC,acid; MHC, major histocom-ophages.: +44 1224 272396.
strong T cell stimulatory activity. Stable DCs will not change theircharacteristic morphology and nonadherence if the cytokines usedfor maturation are removed (Thurner et al., 1999). Other typicalfeatures of mature DCs are a loss of endocytic or phagocyticcapacities due to a low expression of Fc and complement receptors,since antigen uptake is no longer the main purpose of the cells.Instead they initiate a differentiation process leading to enhancedexpression of major histocompatibility complex (MHC) class Iand II molecules, surface markers such as CD83 and CD208/LAMP3(lysosomal-associated membrane protein 3) and costimulatorymolecules such as CD40, CD80 and CD86 during their migrationto secondary lymphoid organs where they become competent anti-gen-specific T cell stimulators (Zhou et al., 1992; Banchereau et al.,2000; Guermonprez et al., 2002).
LAMP3 is a member of the lysosomal-associated membraneprotein family and is expressed in human lymphoid organs andDCs. It is also constitutively expressed by alveolar type II epithelialpneumocytes, a subpopulation of lung peripheral cells which arereported to express LAMP3 in mouse, sheep, dog and rat (deSaint-Vis et al., 1998; Salaun et al., 2003, 2004; Akasaki et al.,

P. Johansson et al. / Developmental and Comparative Immunology 37 (2012) 402–413 403
2004; Meyerholz et al., 2006). In addition, LAMP3 expression hasbeen found in human epidermal keratinocytes of psoriatic lesions(Higaki et al., 2009). LAMP3 appears to be involved in MHC classII-restricted antigen presentation and plays a role in the transloca-tion of MHC class II molecules to the cell surface and the processingof exogenous antigens (de Saint-Vis et al., 1998; Elliott et al., 2007).DCs are a heterogeneous population of cells that can be dividedinto two subpopulations, the myeloid and the lymphoid lineage.Langerhans cells (LCs) and interstitial DCs belong to the myeloidlineage while thymic DCs and plasmacytoid DCs (PDCs) belong tothe lymphoid lineage (Miranda de Carvalho et al., 2005). Inhumans, LAMP3 mRNA is expressed in interstitial DCs and isupregulated after DC maturation and activation (de Saint-Vis etal., 1998; Akasaki et al., 2004). Polyinosinic-polycytidylic acid(PolyIC), a synthetic double-stranded RNA (dsRNA) that mimicsdsRNA synthesized by various types of viruses, has been shownto induce stable mature DCs expressing LAMP3 (Banchereauet al., 2000; Rouas et al., 2004; Gottenberg and Chiocchia, 2007).Stimulation with the bacterial component lipopolysaccharide(LPS) is also known to induce upregulation of LAMP3 during DCmaturation in both human interstitial DCs and chicken bone mar-row-derived DC (chBM-DC) (de Saint-Vis et al., 1998; Akasaki et al.,2004; Wu et al., 2010).
A number of studies suggest that DCs exist in fish. For example,expression of the DC marker CD209 in immune-related tissueshave been demonstrated in zebrafish in the study of Lin et al.(2009) and Lovy et al. (2009) found that spleen tissue in rainbowtrout and Atlantic salmon contains cells that morphologicallyresemble LCs. The latter study also demonstrated immune reactiv-ity within the cytoplasm of spleen and head kidney cells using anantibody against human Langerin/CD207 present in human LCs.The investigation of putative DCs in fish is important not only toaid health assessment and vaccine development against infectiousdisease in fish aquaculture, but also to study the evolution of im-mune systems through comparison of the fish immune systemwith that of higher vertebrates (Miller et al., 1998). In the presentstudy, the cloning of rainbow trout (Oncorhynchus mykiss) LAMP3by homology is described for the first time in fish, with the aimto define a novel marker for putative trout DCs. The complete troutLAMP3 cDNA sequence was identified and in addition to this,
Table 1Oligonucleotide primers used to amplify rainbow trout LAMP3 cDNAs and for gene expres
Primer namea Sequence (50–30)
LAMP3_F CAACATGCATCGTGAAACAATACCLAMP3_R GCAATCAGCAAGAGTCCCACAACT7 AATACGACTCACTATGGGCGSP6 CATTTAGGTGACACTATAGAATACGeneRacer™ RNA Oligo CGACUGGAGCACGAGGACACUGACAUGGAGeneRacer™ RNA Oligo dT GCTGTCAACGATACGCTACGTAACGGCATGGeneRacer™ 50 CGACTGGAGCACGAGGACACTGAGeneRacer™ 50 Nested GGACACTGACATGGACTGAAGGAGTALAMP3_R1 CAGGCTTCTCTGGGAGGCTTGATTGCTCLAMP3_R2 TAGGCCAGACTCATTTGTGGTGATGATGAdaptor primer CTCGAGATCGATGCGGCCGCAdaptor (dT)17 CTCGAGATCGATGCGGCCGCT17
LAMP3_F1 ACCACAGCCTCAAGTGTAATTCTCAGALAMP3_F2 TGAGTGCTGGGCTGACTTCAACAAGAGLAMP3conf_F CACAGAAGATGACAGACAAAGTCLAMP3conf_R CTCAGATCCTGTCATAGCCAGCTTGLAMP3exp_F CATGAAAAGCTGTTCCCAACTGCLAMP3exp_R GCACTCAACCTCCTCTCCAAACRainbow trout EF-1a _F GGGCAAGGGCTCTTTCAAGTRainbow trout EF-1a_R CGCAATCAGCCTGAGAGGTCD83_F GGTGAGGTGGTACAAGCTGGCD83_R AAGGGGTGCATCTAGAAGTGGMHCII_ F GTGAGACAGTGTCGATACTCCMHCII_R GTCATAGGCGCTGCACATCAGCATG
a F, Forward primer, R, reverse primer. The direction of the DNA sequence is from 50
expression of trout LAMP3 transcripts was studied in vivo afterinfection with viral and bacterial pathogens and in cultured macro-phages after modulation with microbial mimics such as LPS andPolyIC known to induce up-regulation of LAMP3.
2. Materials and methods
2.1. Fish
Rainbow trout, with an average length of 25–30 cm, were main-tained at the aquarium facilities of the Zoology building, Universityof Aberdeen, in a recirculation unit supplied with circulated waterat 14 �C in shaded tanks and fed twice a day with commercial pel-lets. Atlantic salmon (Salmo salar) smolts (mean weight (±SE)87.8 ± 7.7 g), kindly provided by Marine Harvest Ltd. (Invergarry,UK), were transferred to sea water and acclimatised for 4 weeksat 10 �C prior to commencing the trial.
2.2. Primers
The primers used for cloning of LAMP3 and real-time quantita-tive RT-PCR (qRT-PCR) detection of gene expression are detailed inTable 1. The primers for qRT-PCR were designed so that at leastone primer crossed an intron in order to exclude amplification frompotential genomic DNA contamination. Splice sites and intron–exonboundaries were determined by alignment of the predicted genomicSalmon sequence obtained from Ensemble with the correspondingcDNA using the GeneWise (Wise2 version 2.1.20 stable) program(Birney et al., 2004). All primers were designed using Primer3 (ver-sion 4.0) (Rozen and Skaletsky, 2000) and ordered from Sigma–Al-drich. The Oligonucleotide Properties Calculator (version 3.26)(http://www.basic.northwestern.edu/biotools/oligocalc.html) wasused for calculating oligo melting temperature, GC content andprimer pair Tm mismatch.
2.3. cDNA production
Fish were killed following anaesthesia and total RNA was iso-lated from rainbow trout head kidney, spleen, liver, intestine, gill,skin, thymus and heart in the presence of 1 ml of RNA Stat-60TM
sion analysis.
Application
Primers used to obtain initial fragments
Primers for gene cloning
CUGAAGGAGUAGAAA Primers for 50 RACEACAGTG(T)24
Primers for 30 RACE
Primers used to confirm the ORF
Primers for gene expression analysis
to 30.

404 P. Johansson et al. / Developmental and Comparative Immunology 37 (2012) 402–413
Reagent (IsoTex Diagnostics) and then treated with RNase-freeDNase I (Qiagen) according to the manufacturer’s instructions.Ten lg of treated total RNA was reverse transcribed to cDNA usinga RevertAid™ First Strand cDNA Synthesis Kit (Fermentas) accord-ing to the manufacturer’s instructions with Oligo(dT)18 primer(0.5 lg/ll) (Fermentas) that anneals selectively on the poly(A) tailof mRNA (Table 1). To obtain cDNA for 50 RACE (random amplifica-tion of cDNA ends), a GeneRacer™ Kit (Invitrogen) was used accord-ing to the manufacturer’s instructions. In brief, total RNA wasisolated from rainbow trout head kidney and spleen as describedabove, dephosphorylated with calf intestinal phosphatase andtreated with tobacco acid pyrophosphatase to remove the 50 endcap structure. The GeneRacer™ RNA Oligo was then ligated usingT4 RNA ligase (5 U/ll) to the 50 end of the RNA (Table 1). Subse-quently, 10 ll of the ligated RNA was reverse transcribed usingSuperScript™ III RT and the GeneRacer™ RNA Oligo dT Primer(900 ng/ll) to create RACE–ready first-strand cDNA with a knownpriming site at the 50 end (Table 1). To obtain cDNA for 30 RACE, thesame procedures were followed as for the cDNA production de-scribed above, with the exception that 1 ll Adaptor (dT)17
(500 lg/ml) replaced the Oligo(dT)18 primer.
2.4. Molecular cloning
The rainbow trout LAMP3 was obtained via search of the troutexpressed sequence tags (ESTs) within GenBank using sequenceinformation from the Homo sapiens open reading frame (ORF)(Acc. No. AJ005766). Gene specific RT-PCR primers were designedto the EST sequence for the generation of the cDNAs of LAMP3according to the predicted sequence (Table 1). The PCR productwas sequenced and the obtained sequence was found to lack aninitial start codon. Following isolation of a partial sequence ofLAMP3, a GeneRacer™ Kit (Invitrogen) was used to obtain thefull-length 50 end by RACE PCR. The full-length 30 end was obtainedusing cDNA isolated from rainbow trout head kidney and spleentissue modified for RACE PCR (Table 1). Gene specific RT-PCR prim-ers were designed according to the full length cDNA sequences ob-tained by RACE PCR to confirm the full-length ORF nucleotidesequence (Table 1). For a 50 ll PCR reaction the following werecombined: 2 ll of each of the primers (each 10 lM), 2 ll of cDNAor 2 ll of 50 RACE cDNA and 2 ll 30 RACE cDNA, 10 ll of 5� PCRbuffer, 1 ll of MgCl2 (50 mM), 1 ll dNTP (2.5 mM each), 31.75 llof PCR water and 0.25 ll MangoTaq DNA polymerase (5 U/ll) (Bio-line). The cycling conditions to generate the cDNA and the full-length 30 ends were 2 min at 94 �C, followed by 40 cycles of94 �C for 30 s, 55 �C for 30 s and 72 �C for 1 min, and finally anelongation at 72 �C for 10 min. The cycling conditions to generatethe full-length 50 ends were 2 min at 94 �C, followed by 35 cyclesof 94 �C for 30 s, 62 �C for 30 s and 72 �C for 30 s, and finally anelongation at 72 �C for 10 min. For the amplification of 50 ends byRACE PCR, hot-start RT-PCR was performed with paraffin wax(Sigma–Aldrich) using a reverse gene-specific primer and the Gen-eRacerTM 50 forward primer, followed by a nested PCR using theGenRacerTM 50 nested primer as forward primer and a gene-specificprimer as the reverse primer (Table 1). In parallel with all theabove PCR reactions, rainbow trout elongation factor 1-a (EF-1a)was also amplified and used as a positive control. All PCR productswere loaded on a 1.5% (w/v) agarose gel, with Hyperladder I (Bio-line) used as molecular weight marker, and visualized by stainingin ethidium bromide (100 ng/ml). The obtained PCR products ofthe correct size were cloned into pGEM�-T Easy Cloning Vector(Promega) according to the manufacturer’s instructions and trans-formed into RapidTrans™ TAM1 competent E. coli (Active Motif)cells. The recombinant cells were grown on MacConkey agar (Sig-ma–Aldrich) containing 100 lg/ml ampicillin overnight and 20white colonies from each plate were selected and screened using
the primers SP6 and T7 (Table 1) in the following RT-PCR protocol:an initial denaturation of 94 �C for 2 min, followed by 35 cycles of94 �C for 30 s, 58 �C for 30 s and 72 �C for 30 s and finally an elon-gation at 72 �C for 10 min. The colonies containing the required in-sert were grown overnight in 5 ml of LB medium with 2.5 ll ofampicillin (100 lg/ml) in a shaking incubator at 37 �C. PlasmidDNA was purified using a QIAprep� Plasmid DNA Miniprep kit(Qiagen) according to the manufacturer’s instructions and the puri-fied plasmids were sequenced by Eurofins MWG Operon using thevector specific primers M13 forward or M13 reverse to confirm theinsert size.
2.5. Sequence analysis
Already known LAMP homologues were used to characterise thegenerated trout LAMP3 using the Basic Local Alignment Search Tool(BLAST), available through the National Center for BiotechnologyInformation (NCBI) server (Altschul et al., 1990) or FASTA (Pearsonand Lipman, 1988) programs. Translation of the DNA sequenceswas performed using the Expert Protein Analysis System (ExPASy)proteomics server of the Swiss Institute of Bioinformatics (SIB)(Gasteiger et al., 2003). The secondary structure was predicted usingthe PHD secondary structure prediction method (Rost and Sander,1994; Rost, 1996) and the signature of the protein families was ana-lysed using the PROSITE database of protein families and domains(Falquet et al., 2002). Potential N-glycosylation sites were analyzedusing NetNGlyc (version 1.0) (http://www.cbs.dtu.dk/services/NetNGlyc/) and pairwise alignment between two amino acid (aa)sequences were used to identify regions of similarity to predict po-tential functional, structural and evolutionary relationships usingthe EMBOSS program needle (http://www.ebi.ac.uk/Tools/psa/emboss_needle/index.html). The presence of a signal peptide inthe predicted aa sequence was analyzed using SignalP (version3.0) (Bendtsen et al., 2004) and prediction of transmembrane heli-ces in proteins were determined using TMHMM (version 2.0)(http://www.cbs.dtu.dk/services/TMHMM/).
Protein sequence alignments and phylogenetic analysis of theprotein sequences were analysed using the CLUSTALW (version1.60) multiple sequence alignment package (Thompson et al.,1994). The phylogenetic tree was constructed using the neigh-bour-joining method, based on an aa alignment (ClustalW) of pro-tein sequences and displayed using MEGA5 software (Kumar et al.,2004). Genomics was finally used to visualize the conservation ofgene order in the LAMP3 locus among multiple species (Muffatoet al., 2010), including zebrafish and stickleback where LAMP3was identified in the genome of these species using the troutsequence.
2.6. Expression analysis of LAMP3 transcript in vivo
A comparative expression analysis of the trout LAMP3 mRNA indifferent tissues was quantified using qRT-PCR to assess levels ofexpression in vivo. Four healthy rainbow trout were anaesthetizedwith MS222, killed and tissues including head kidney, spleen, liver,gill, gonad, brain, muscle, gut and heart were removed asepticallyfor RNA preparation and cDNA synthesis as described above. Thesamples were analysed by qRT-PCR using the primers shown in Ta-ble 1. The cDNA samples (20 ll after cDNA production) were di-luted with 80 ll of TE buffer (10 mM Tris, 1 mM EDTA, pH 8.0)and 4 ll of each cDNA sample were duplicated in 96-well plates(Roche Applied Science) together with 2 ll of forward primer and2 ll of reverse primer (each 10 lM), 7 ll of PCR water and 5 llof LightCycler� 480 SYBR Green I Master GoTaq� qPCR MasterMix (Promega) including SYBR Green I dye, to monitor the ampli-fication of qRT-PCR products in a LightCycler� 480 System (RocheApplied Science). The efficiencies of the primers and subsequent

P. Johansson et al. / Developmental and Comparative Immunology 37 (2012) 402–413 405
quantification of the relative expression level of LAMP3 were per-formed by preparing a 10-fold serial dilution of standards frompurified and cloned plasmids to compare with each sample inthe same qRT-PCR run with the following qRT-PCR protocol: an ini-tial pre-incubation at 95 �C for 5 min, followed by 45 cycles of95 �C for 10 s, 60 �C for 20 s, 72 �C for 20 s. Quantification of thePCR signals was performed by comparison of the cycle thresholdvalue of the gene of interest with the cycle threshold value of thereference gene (rainbow trout EF-1a). For comparison between tis-sues, the LAMP3 expression in gonad was defined as 1.
To investigate whether LAMP3 is also involved in antiviral/anti-bacterial immune defence in fish, modulation of the expression ofLAMP3 mRNA was detected by qRT-PCR as above in cDNA samplesfrom gill of Atlantic salmon experimentally infected with virulentinfectious pancreatic necrosis virus (IPNV) (Shetland isolate 975/99) by intraperitoneal (i.p.) injection. The rainbow trout primersused in the previous experiment were also able to amplify salmonLAMP3 and the product was sequence verified to be correct. Thechallenge experiment, tissue collection, RNA preparation and cDNAsynthesis were performed as described in the study of McBeathet al. (2007). Samples taken at days 1, 5, 7, and 24 post-challengefrom this experiment were analysed. The efficiencies of the prim-ers and subsequent quantification of the relative expression levelof LAMP3 were performed by preparing a 10-fold serial dilutionof standards from purified and cloned plasmids to compare witheach sample in the same qRT-PCR run with the qRT-PCR protocolas described above. Quantification of the target gene transcriptwith the rainbow trout EF-1a reference gene transcript was madefollowing the Pfaffl method (Pfaffl, 2001). Expression of genes instimulated tissues is expressed relative to the gene expression ofunstimulated samples (PBS), which were used for calibration foreach investigated gene. The normalized gene expression data forstimulated and unstimulated control cells were compared to eachother for analysing transcriptional responses.
Modulation of the expression of trout LAMP3 mRNA after bacte-rial infection was also investigated in archived head kidney and gillcDNA samples from rainbow trout challenged i.p. with a patho-genic strain (MT3072) of Yersinia ruckeri, kindly provided by Dr.Tiehui Wang (SFIRC, Aberdeen). The challenge experiment, tissuecollection, RNA preparation and cDNA synthesis were performedas described in the studies of Wang et al. (2009, 2011a,b). Samplestaken at hours 6, 24, 48, and 72 post-challenge from this experi-ment were analysed. The expression of LAMP3 mRNA, as well thatof the control gene EF-1a, was detected by qRT-PCR as describedabove and the quantification of the target gene transcript wasmade following the Pfaffl method.
2.7. Expression of trout LAMP3 transcript by trout primarymacrophages
Trout head kidney macrophages were isolated as described inthe study of Stafford et al. (2001). Briefly, trout head kidney wasisolated as described above and head kidney leukocytes were iso-lated by passing the head kidney through a sterile nylon meshscreen and then centrifuging the cells at 400g for 30 min on a51% Percoll gradient. Cells at the medium–Percoll interface wereremoved and washed in serum-free medium by centrifuging thecells at 400g for 15 min. Viable leukocytes were enumerated usinga haemocytometer after staining with trypan blue (Gibco). Gener-ation of in vitro-derived trout kidney macrophages was performedby seeding 2 � 106 cells/ml trout kidney leukocytes into 25 cm2
flasks, incubating at 20 �C for 4 days until stimulation and subse-quent isolation of in vitro cultured adherent (macrophage-en-riched) head kidney leukocytes as a source of macrophages. The
trout primary macrophages were stimulated by direct addition oftwo microbial mimics, Escherichia coli (E. coli) LPS (25 lg/ml, fromstrain 055:B5; Sigma) and PolyIC (50 lg/ml; Sigma), or PBS as con-trol, and incubated for a further 4, 8 and 24 h. The concentrationsfor each stimulant were chosen from the previous studies of Hol-land et al. (2010), Wang et al. (2011a,b). The treatment was termi-nated by dissolving the cells in TRIzol (Invitrogen). The expressionof LAMP3 mRNA, as well that of the control gene EF-1a, was de-tected by qRT-PCR as described above using three individual flasksof cells for each treatment. The relative quantification of the targetgene transcript was made following the Pfaffl method.
2.8. Expression and modulation of trout LAMP3, CD83 and MHCIItranscript in the trout mononuclear/macrophage RTS-11 cell line byLPS and PolyIC
Modulation of the expression of trout LAMP3, CD83 and MHCIIchain mRNA was analysed in archived cDNA samples from themononuclear/macrophage cell line RTS-11 (Ganassin and Bols,1998). LAMP3, CD83 (Ohta et al., 2004) and MHCII were studied to-gether in these samples as all three are putative markers for DCsand may be co-modulated. With relatively small fold increasesanticipated this comparison across genes will likely be clearerusing a cell line than primary cultures where the variation wouldbe larger and hence why performed in the RTS-11 experiment.The cells had been stimulated with E. coli LPS and PolyIC for 4 h,8 h and 24 h, with the stimulation, cell collection, RNA preparationand cDNA synthesis described in Wang and Secombes (2009) andWang et al. (2011a,b). The expression of LAMP3, CD83 and MHCII,as well that of the control gene EF-1a, was detected by qRT-PCR asdescribed above using cDNA from three individual flasks of cells foreach treatment. The relative quantification of the target gene tran-script was made following the Pfaffl method.
2.9. Statistical analysis
Real-time quantitative PCR measurements were analyzed usingthe two tailed paired Student’s T-test to measure statistical signifi-cance between controls and treated groups, with P < 0.05 consid-ered significant. Anderson–Darling normality test was chosen toensure that the data set was normally distributed and thereforemet the requirements of the parametric test conducted. All statisti-cal analysis was performed using Minitab� 16 Statistical Software.
3. Results
3.1. Sequence analysis and characterisation of trout LAMP3
The trout LAMP3 cDNA was cloned by PCR amplification andconsisted of 1016 bp with a 792 bp ORF encoding a polypeptideof 263 aa (Acc. No. HE608240). The 30 UTR had a polyadenylationsignal (aataaa) 113 bp downstream of the translation terminationcodon and 19 bp upstream from the poly(A) tail. The predictedpolypeptide has a 227 aa extracellular domain, a 24 aa hydropho-bic transmembrane domain and a 12 aa short cytoplasmic domain,all features typical of type I transmembrane proteins. The polypep-tide has also a presumptive signal peptide of 24 aa. Included in theshort C-terminal cytoplasmic tail is a conserved C-terminal lyso-somal sorting motif (G-Y-D-R-I), required for lysosomal targeting(Hunziker and Geuze, 1996) (Fig. 1).
Multiple sequence alignment (Fig. 2) revealed good conservationof the LAMP3 aa sequences across vertebrates, with the exceptionthat the N-terminal region was absent in the fish sequences. Manyconserved aa residues were found in the membrane-proximal

Fig. 1. Nucleotide and predicted aa sequence of rainbow trout LAMP3 cDNA. The start and stop codons are boxed, the transmembrane domain is highlighted dark grey, thepresumptive signal peptide is highlighted grey, the polyadenylation signal is underlined, the conserved cysteines are underlined and bold, the C-terminal lysosomal sortingmotif (G-Y-D-R-I) included in the short C-terminal cytoplasmic tail is underlined and bold and the glycosylation sites (NXS/T) are boxed and bold.
406 P. Johansson et al. / Developmental and Comparative Immunology 37 (2012) 402–413
domain including four conserved cysteines which have the poten-tial to form two disulphide bridges. A serine/proline-rich region, atypical feature of LAMP family members was also apparent betweenthe luminal and proximal domains. A number of potential glycosyl-ation sites are also present in all of the molecules but only one sitewas (more or less) conserved across vertebrates (Fig. 2). The aa se-quence identity of the trout LAMP3 gene to other family memberswas 18.8–23.2%. Phylogenetic tree analysis (Fig. 3) also suggestedthat there is a close evolutionary relationship between the troutLAMP3 molecule and other vertebrate LAMP3 family members.The rainbow trout LAMP3 was clustered with the other fish LAMP3molecules, and in a clade together with mammalian LAMP3’s, thatwas separate from the LAMP1 and LAMP2 clades.
In humans, the LAMP3 gene is encoded on chromosome 3 (Chr.3), and was used to identify the putative trout LAMP3 based ongene sequence homology. The gene encoding chicken LAMP3 lieson Chr. 9 in a group of genes with conserved synteny with humanChr. 3. The zebrafish and stickleback LAMP3 were identified usingthe trout sequence and lie on Chr. 22 and Group VIII, respectively.Gene synteny between teleost species (zebrafish and stickleback)and non-teleost species (human and chicken) was used to help ver-ify that the LAMP3 gene we have identified in fish is an authentichomologue in these species. There was good conservation of manygenes within the LAMP3 locus, including MCCC1, ATP11B, SOX2,DNAJC19, FXR1, KNG1, ACAP2 and PPP1R2 (Fig. 3). However, sev-eral other genes close to LAMP3 in humans and chicken were ab-sent (CCDC39, MCF2L2, B3GNT5, LPP, DCUN1D1) which may havebeen inserted or lost from the locus after the divergence of fishfrom the main tetrapod lineage.
3.2. Expression analysis of trout LAMP3 transcript in vivo
The expression of trout LAMP3 mRNA in gonad, brain, gill, heart,liver, muscle, gut, spleen and head kidney from four healthy fishwas determined by qRT-PCR. The expression was detectable in alltissues examined (Fig. 5). The highest level of the LAMP3 transcriptwas detected in head kidney, liver and spleen, whereas the lowestlevel of LAMP3 was observed in gonad. The expression of LAMP3mRNA in gill cDNA samples from Atlantic salmon challenged i.p.with IPNV had increased significantly by day 5 (approximately5.2-fold over control), reached a peak by day 7 (approximately7.8-fold over control) and returned towards basal levels by day24 (Fig. 6A). The expression of LAMP3 mRNA in gill and head kid-ney from rainbow trout challenged i.p. with a pathogenic strain ofY. ruckeri increased significantly at 24 h post-challenge (approxi-mately 2.9-fold over control in gill tissue and 4.1-fold over controlin head kidney tissue). However, by 48 and 72 h post-challengeexpression returned towards basal levels (Fig. 6B).
3.3. Expression of trout LAMP3 transcript by trout primarymacrophages
The expression of trout LAMP3 mRNA in head kidney macro-phages following in vitro stimulation by PolyIC and E. coli LPSincreased significantly at 8 h post-stimulation (approximately4.5-fold over control with PolyIC and 3.8-fold over control withLPS), reached a peak at the same point and returned towards basallevels at 24 h (Fig. 7).

Fig. 2. Multiple amino acid alignment of mouse (Acc. No. AJ510130), human (Acc. No. AJ005766), salmon (EG917475), tetraodon (aa sequence extracted from Ensembl contigCAF96096 and predicted from Genscan), zebrafish (aa sequence extracted from Ensembl contig BX005105.6 and predicted from Genscan) and chicken (Acc. No. AM933592)LAMP3 molecules together with the putative trout (Acc. No. HE608240) LAMP3 molecule. Shaded areas represent conservation of aa similarity and gaps introduced foroptimal alignment by CLUSTALW are dashed. The conserved serine/proline-rich region is underlined with a dotted line below, the potential N-linked glycosylation sites (NXS/T) are underlined, the signal peptide is in bold, the transmembrane domain is in bold and italicized and the conserved cysteines are indicated with asterisks below.
P. Johansson et al. / Developmental and Comparative Immunology 37 (2012) 402–413 407
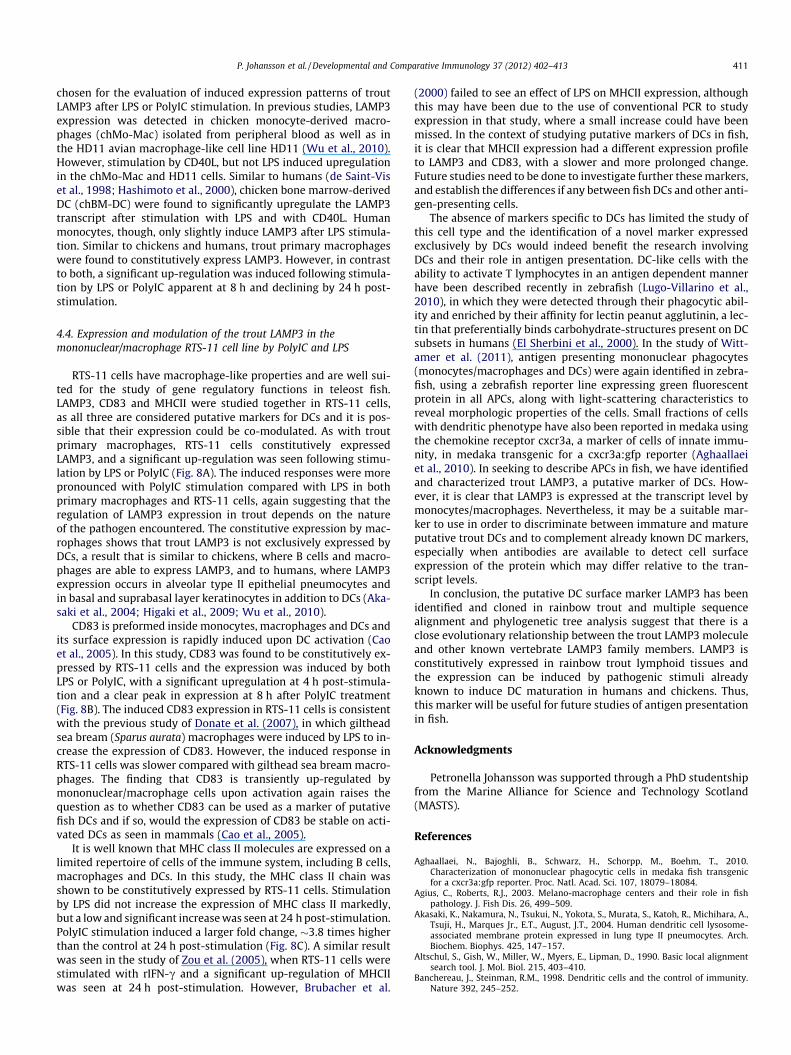
3.4. Expression and modulation of trout LAMP3, CD83 and MHCII inthe trout mononuclear/macrophage RTS-11 cell line by PolyIC and LPS
The expression of trout LAMP3 mRNA in the mononuclear/mac-rophage cell line RTS-11 following stimulation by PolyIC and E. coliLPS increased significantly at 8 h post-stimulation (approximately4.8-fold over control with PolyIC and 3.5-fold over control withLPS), reached a peak at the same time point and returned towards
basal levels at 24 h (Fig. 8A). The expression of CD83 increasedsignificantly at 4 h post-stimulation (approximately 14.0-foldover control with PolyIC and 13.1-fold over control with LPS),reached a peak at 8 h (approximately 19.7-fold over control withPolyIC and 16.6-fold over control with LPS) and returned towardsbasal levels at 24 h although still significantly elevated (Fig. 8B).Lastly, the expression of MHCII was not increased significantlyuntil 24 h post-stimulation, when it was approximately 3.8-fold

Fig. 3. Unrooted phylogenetic tree showing the relationship between the amino acid sequence of the rainbow trout LAMP3 protein homologue, compared with other knownLAMP family members. The tree was constructed using the neighbour-joining method, based on an amino acid alignment (ClustalW) of protein sequences and displayed usingMEGA5 software with options set as follows: Model/method: Jones–Taylor–Thornton (JTT) model. Gaps/missing data treatment: Pairwise deletion. Bootstrap values werecalculated from 10,000 repetitions. The Acc. Nos. of the LAMP3 genes are: mouse, AJ510130; rat, AAH83787; macaca, NP_001028044; human, AJ005766; cow, DAA33304;tetraodon, aa sequence extracted from Ensembl contig CAF96096 and predicted from Genscan; zebrafish, aa sequence extracted from Ensembl contig BX005105.6 andpredicted from Genscan; trout , HE608240; salmon, EG917475. The Acc. Nos. of the LAMP2 genes are: xenopus, AAI60795; cow, AAI02820; human, AAB67314; mouse,CAM17144; rat, P17046. The Acc. Nos. of the LAMP1 genes are: xenopus, NP_001087042; chinese hamster, NM_001246830; pig, NP_001011507; cow, Q05204; human,NM_005561; cat, NM_001163655.
Chicken Chr. 9
Human Chr. 3
Zebrafish Chr. 22
MCF2L2
PPP1R2
LPP
DCUN1D
ACAP2
KNG1
LAMP3
MCCC1
B3GNT5
DNAJC19
SOX2
ATP11B
FXR1
B3GNT5
DCUN1D
KNG1
LAMP3
MCCC1
MCF2L2
ACAP2
PPP1R2
DNAJC19
FXR1 DNAJC19
SOX2
ATP11B
FXR1
CCDC39 CCDC39
ATP11B
SOX2
LAMP3
MCCC1
MAP1S
KNG1
DNAJC19
FXR1
ATP11B
SOX2
LAMP3
MCCC1
PPP1R2
KNG1
MAP1S
ACAP2
Stickleback GroupVIII
APOD
ACAP2
PPP1R2
LPP
APOD
Fig. 4. Gene synteny conserved between teleost species (zebrafish and stickleback)and non-teleost species (human and chicken). The figure illustrates conservedsynteny between human Chr. 3, chicken Chr. 9, zebrafish Chr. 22 and sticklebackGroupVIII around LAMP3. Genes are shown as boxes. Gene symbols are cited fromGenomicus (Ensemble nomenclature).
408 P. Johansson et al. / Developmental and Comparative Immunology 37 (2012) 402–413
higher than in control cells with PolyIC and 3.1-fold higher withLPS (Fig. 8C).
4. Discussion
4.1. Sequence analysis and characterisation of trout LAMP3
The most extensive research concerning DCs has been carriedout for human and murine DCs but they have also been describedin several animal species such as horse, cat, cow, sheep, pig, non-hu-man primates, dog and chicken (Miranda de Carvalho et al., 2005).Previous studies suggest that they are present in early vertebratessuch as fish after discovery of morphological hallmarks of DCs in sal-monids, zebrafish and medaka (Lovy et al., 2006; Lin et al., 2009;Lugo-Villarino et al., 2010; Aghaallaei et al., 2010; Wittamer et al.,2011). LAMP3, which has been described as the most discriminativemarker specific for mature DCs, has been cloned previously in hu-mans, mice and chickens (de Saint-Vis et al., 1998; Salaun et al.,2003; Wu et al., 2010), and in this report the trout LAMP3 is clonedand characterised for the first time in fish. Although the LAMP3translation shares low identities (18.8–23.2%) to LAMP3 moleculesfrom other vertebrates, conserved aa residues, phylogenetic treeanalysis and the linkage of LAMP3 in other fish species to genesknown in the human and chicken locus (Fig. 4), all indicate thatthe trout LAMP3 molecule represents a new member of the troutLAMP family and an authentic homologue of LAMP3. In particularthe multiple sequence alignment revealed potential N-linked glyco-sylation sites (NXS/T), four conserved cysteines, a conserved serine/proline-rich region and a lysosomal sorting motif (Fig. 2), all hall-marks of LAMP family members. The N-terminal region was absent
in the trout molecule, which was also observed in the salmon,tetraodon and zebrafish sequences.

Fig. 5. In vivo expression of the trout LAMP3 mRNA. The constitutive expression of the trout LAMP3 mRNA is shown in nine tissues. The relative expression level for eachtissue was normalized against the expression level of EF-1a in the same tissue. Bars indicate means (±SEM) of four healthy fish.
1.0
2.0
3.0
4.0
5.0
6.0
7.0
8.0
9.0
1 5 7 24Fo
ld c
han
ge
rela
tive
to
co
ntr
ol
Time (d)
Time (h)
*
*
*
Fo
ld c
han
ge
rela
tive
to
co
ntr
ol
*
*
A
B
Fig. 6. Modulation of the LAMP3 mRNA expression in (A) gill tissue of Atlanticsalmon following i.p. injection with IPNV (Shetland isolate 975/99) for 1, 5, 7 and24 d and (B) in gill and head kidney tissues of rainbow trout following i.p. injectionwith a pathogenic strain (MT3072) of Y. ruckeri for 6, 24, 48 and 72 h. The relativelevel for each gene was detected by qRT-PCR and normalized to the expression ofEF-1a. The fold change is calculated as the average expression level of the treatmentgroup to that of the time-matched controls. Bars indicate means (±SEM) of four (A)or three (B) fish. Asterisks indicate where the increase of gene expression issignificant (P < 0.05), compared with respective uninfected control fish.
Fo
ld c
han
ge
rela
tive
to
co
ntr
ol
Time (h)
*
*
Fig. 7. Modulation of the trout LAMP3 mRNA expression in head kidney macro-phage primary cultures following stimulation by PolyIC (50 lg/ml), E. coli LPS(25 lg/ml), or phosphate-buffered saline (PBS) as control and incubation for 4, 8and 24 h. The relative level for each gene was detected by qRT-PCR and normalizedto the expression of EF-1a. The fold change is calculated as the average expressionlevel of the treatment group to that of the time-matched controls. Bars indicatemeans (±SEM) of cells from three fish. Asterisks indicate where the increase of geneexpression is significant (P < 0.05), compared with unstimulated controls.
P. Johansson et al. / Developmental and Comparative Immunology 37 (2012) 402–413 409
4.2. Expression analysis of the trout LAMP3 transcript in vivo
Previous studies have established that the expression pattern ofLAMP3 is tissue- and species-specific. The most striking result isthe finding that mouse LAMP3 mRNA is expressed in lung periph-eral cells, but is absent from lymphoid organs and from DCs acti-vated both in vitro and in vivo. In other words, despite the abovestudies mouse LAMP3 cannot be used as a marker of mature mouse
DCs (Salaun et al., 2003). In this study, trout LAMP3 expression wasdetectable in all tissues examined, with the highest expression inhead kidney, liver and spleen (Fig. 5). The fish head kidney andspleen are two organs responsible for filtering the blood and trap-ping of blood-borne pathogens and are considered major lymphoidtissues, since lymph nodes and bone marrow are absent in fish. Theaccumulation of antigens is thought to be an important role of thehead kidney and spleen and is required for initiating immuneresponses to antigens (Press and Evensen, 1999; Agius and Roberts,2003). These previous results are also consistent with the study ofLovy et al. (2011), in which an up-regulation of Langerin/CD207positive cells in head kidney was seen during microsporidial dis-ease of salmonids, using an antibody against human Langerin/CD207 and where the Langerin/CD207 positive cells were alsofound in spleen tissue of healthy fish. The kidney, spleen and to alesser extent the liver of teleost fish contain melanomacrophagecentres (MMC), defined groups of macrophage-like pigmented cellsproposed to be precursors of mammalian germinal centers andwhich cluster with cells expressing immunoglobulin mutator acti-vation-induced cytidine deaminase (Agius and Roberts, 2003; Pass-antino et al., 2005; Vigliano et al., 2006; Saunders et al., 2010). TheMMCs of salmonids do not form aggregates, but are instead less

Fold
cha
nge
rela
tive
to c
ontr
ol
Time (h)
*
*
Fold
cha
nge
rela
tive
to c
ontr
ol
Time (h)
*
*
**
* *
Fold
cha
nge
rela
tive
to c
ontr
ol
Time (h)
*
*
Fig. 8. Modulation of the trout LAMP3 (A), CD83 (B) and MHC class II (C) mRNAexpression in the mononuclear/macrophage cell line RTS-11 following stimulationby PolyIC (50 lg/ml), E. coli LPS (25 lg/ml), or phosphate-buffered saline (PBS) ascontrol and incubation for 4 h, 8 h and 24 h. The relative level for each gene wasdetected by qRT-PCR and normalized to the expression of EF-1a. The fold change iscalculated as the average expression level of the treatment group to that of thetime-matched controls. Bars indicate means (±SEM) of three independent cultures.Asterisks indicate where the increase of gene expression is significant (P < 0.05),compared with unstimulated controls.
410 P. Johansson et al. / Developmental and Comparative Immunology 37 (2012) 402–413
well-defined and are randomly distributed throughout the haemo-lymphopoietic tissue. As in non-salmonids, they can trap andretain antigens and are thought to be important in immune sur-veillance since they are associated with blood vessels and lympho-cytes (Press and Evensen, 1999). DCs, with the main function tocapture and process antigens to present to lymphocytes (Steinman,1991) have for this reason been considered to be associated with
MMCs, which could explain the highest constitutive expressionof trout LAMP3 in head kidney, spleen and liver tissue. Due tothe selective migration of DCs and their internalization and pro-cessing of foreign antigens in nonlymphoid organs before migrat-ing to secondary lymphoid tissues (Banchereau et al., 2000), arelative high expression of LAMP3 in both lymphoid and non-lym-phoid organs may be expected, as seen in trout. Although the con-stitutive expression of LAMP3 in nonlymphoid tissues is relativelyhigh, a comparison between tissues based on the lowest expressedtissue, show that the average expression of LAMP3 in lymphoid tis-sues is approximately 12-fold over non lymphoid tissues (data notshown).
Cells that resemble DCs have been discovered in the gill epithe-lium, connective tissue, and blood vessels of salmonid species, asseen with experimentally induced microsoporidial gill disease(Lovy et al., 2006). These DC-like cells were also observed occasion-ally in the gills of uninfected control fish, but were more frequentin infected gills. In addition, mammalian LAMP3 expression inmonocyte-derived DCs is known to be induced by viral or bacterialinfection (de Saint-Vis et al., 1998). In this study, expression ofLAMP3 was detected in gill tissue of healthy trout and to furtherevaluate the marker, expression profiles in gill tissue from virallychallenged salmon and bacterially challenged trout were investi-gated, with head kidney also studied in the latter case. LAMP3was found to be induced in both infection models and in both tis-sues in trout (Fig. 6). A significant up-regulation of LAMP3 in IPNVinfected gills could be seen by day 5, with a peak by day 7, whereasa significant upregulation in Y. ruckeri infected gills or head kidneycould be seen already at day 1 post-infection, with a decline afterthis time. The peak fold change was approximately three timesas high in virus-infected gills compared with bacteria-infectedgills, and approximately twice as high compared with bacteria-in-fected head kidney. The higher expression, constitutive as well asinduced, of the LAMP3 transcript in head kidney tissue comparedwith gill tissue of trout may reflect the role of the head kidney asthe fish equivalent of the bone marrow. Likewise the constitutiveand induced expression of LAMP3 transcript in gill tissue, a site al-ways exposed to pathogens from the external environment, couldbe due to the presence of APCs such as DCs within the gill, possiblyin the newly identified lymphoid tissue on the caudal edge of theinterbranchial septum (Haugarvoll et al., 2008). The question re-mains why induced LAMP3 expression can be seen in gill in exper-imental infections where the pathogen is injected i.p. The answermay be a systemic reaction, such as chemokines release, causingeither cell migration toward mucosal surfaces or specific geneinduction of LAMP3. Chemokines, key mediators of leukocyterecruitment, are secreted upon inflammatory stimuli by stromalcells and also by leukocytes themselves and regulate leukocytemigration and activation (Campbell et al., 1998). Tissue-specificchemokines have been reported that can direct the migration ofspecific cellular subsets to an anatomical site and distinct chemo-kine receptors expressed by DCs have been shown to regulate theirtraffic into tissue sites in response to inflammatory chemokines(Zlotnik and Yoshie, 2000). The difference in kinetics and transcriptlevel of induced LAMP3 expression in the two disease modelssuggests different host responses towards viral and bacterialinfections. It is well known that danger signals initiated by viralRNA or DNA, bacterial CpG-DNA or LPS, induce DC maturation(Banchereau and Steinman, 1998; Banchereau et al., 2000) butthese signalling pathways are still being elucidated in fish.
4.3. Expression of trout LAMP3 transcript in primary macrophages
Monocytes and macrophages are closely related to DCs (Picklet al., 1996; Cao et al., 2005) and trout primary macrophages were
P. Johansson et al. / Developmental and Comparative Immunology 37 (2012) 402–413 411
chosen for the evaluation of induced expression patterns of troutLAMP3 after LPS or PolyIC stimulation. In previous studies, LAMP3expression was detected in chicken monocyte-derived macro-phages (chMo-Mac) isolated from peripheral blood as well as inthe HD11 avian macrophage-like cell line HD11 (Wu et al., 2010).However, stimulation by CD40L, but not LPS induced upregulationin the chMo-Mac and HD11 cells. Similar to humans (de Saint-Viset al., 1998; Hashimoto et al., 2000), chicken bone marrow-derivedDC (chBM-DC) were found to significantly upregulate the LAMP3transcript after stimulation with LPS and with CD40L. Humanmonocytes, though, only slightly induce LAMP3 after LPS stimula-tion. Similar to chickens and humans, trout primary macrophageswere found to constitutively express LAMP3. However, in contrastto both, a significant up-regulation was induced following stimula-tion by LPS or PolyIC apparent at 8 h and declining by 24 h post-stimulation.
4.4. Expression and modulation of the trout LAMP3 in themononuclear/macrophage RTS-11 cell line by PolyIC and LPS
RTS-11 cells have macrophage-like properties and are well sui-ted for the study of gene regulatory functions in teleost fish.LAMP3, CD83 and MHCII were studied together in RTS-11 cells,as all three are considered putative markers for DCs and it is pos-sible that their expression could be co-modulated. As with troutprimary macrophages, RTS-11 cells constitutively expressedLAMP3, and a significant up-regulation was seen following stimu-lation by LPS or PolyIC (Fig. 8A). The induced responses were morepronounced with PolyIC stimulation compared with LPS in bothprimary macrophages and RTS-11 cells, again suggesting that theregulation of LAMP3 expression in trout depends on the natureof the pathogen encountered. The constitutive expression by mac-rophages shows that trout LAMP3 is not exclusively expressed byDCs, a result that is similar to chickens, where B cells and macro-phages are able to express LAMP3, and to humans, where LAMP3expression occurs in alveolar type II epithelial pneumocytes andin basal and suprabasal layer keratinocytes in addition to DCs (Aka-saki et al., 2004; Higaki et al., 2009; Wu et al., 2010).
CD83 is preformed inside monocytes, macrophages and DCs andits surface expression is rapidly induced upon DC activation (Caoet al., 2005). In this study, CD83 was found to be constitutively ex-pressed by RTS-11 cells and the expression was induced by bothLPS or PolyIC, with a significant upregulation at 4 h post-stimula-tion and a clear peak in expression at 8 h after PolyIC treatment(Fig. 8B). The induced CD83 expression in RTS-11 cells is consistentwith the previous study of Donate et al. (2007), in which giltheadsea bream (Sparus aurata) macrophages were induced by LPS to in-crease the expression of CD83. However, the induced response inRTS-11 cells was slower compared with gilthead sea bream macro-phages. The finding that CD83 is transiently up-regulated bymononuclear/macrophage cells upon activation again raises thequestion as to whether CD83 can be used as a marker of putativefish DCs and if so, would the expression of CD83 be stable on acti-vated DCs as seen in mammals (Cao et al., 2005).
It is well known that MHC class II molecules are expressed on alimited repertoire of cells of the immune system, including B cells,macrophages and DCs. In this study, the MHC class II chain wasshown to be constitutively expressed by RTS-11 cells. Stimulationby LPS did not increase the expression of MHC class II markedly,but a low and significant increase was seen at 24 h post-stimulation.PolyIC stimulation induced a larger fold change, �3.8 times higherthan the control at 24 h post-stimulation (Fig. 8C). A similar resultwas seen in the study of Zou et al. (2005), when RTS-11 cells werestimulated with rIFN-c and a significant up-regulation of MHCIIwas seen at 24 h post-stimulation. However, Brubacher et al.
(2000) failed to see an effect of LPS on MHCII expression, althoughthis may have been due to the use of conventional PCR to studyexpression in that study, where a small increase could have beenmissed. In the context of studying putative markers of DCs in fish,it is clear that MHCII expression had a different expression profileto LAMP3 and CD83, with a slower and more prolonged change.Future studies need to be done to investigate further these markers,and establish the differences if any between fish DCs and other anti-gen-presenting cells.
The absence of markers specific to DCs has limited the study ofthis cell type and the identification of a novel marker expressedexclusively by DCs would indeed benefit the research involvingDCs and their role in antigen presentation. DC-like cells with theability to activate T lymphocytes in an antigen dependent mannerhave been described recently in zebrafish (Lugo-Villarino et al.,2010), in which they were detected through their phagocytic abil-ity and enriched by their affinity for lectin peanut agglutinin, a lec-tin that preferentially binds carbohydrate-structures present on DCsubsets in humans (El Sherbini et al., 2000). In the study of Witt-amer et al. (2011), antigen presenting mononuclear phagocytes(monocytes/macrophages and DCs) were again identified in zebra-fish, using a zebrafish reporter line expressing green fluorescentprotein in all APCs, along with light-scattering characteristics toreveal morphologic properties of the cells. Small fractions of cellswith dendritic phenotype have also been reported in medaka usingthe chemokine receptor cxcr3a, a marker of cells of innate immu-nity, in medaka transgenic for a cxcr3a:gfp reporter (Aghaallaeiet al., 2010). In seeking to describe APCs in fish, we have identifiedand characterized trout LAMP3, a putative marker of DCs. How-ever, it is clear that LAMP3 is expressed at the transcript level bymonocytes/macrophages. Nevertheless, it may be a suitable mar-ker to use in order to discriminate between immature and matureputative trout DCs and to complement already known DC markers,especially when antibodies are available to detect cell surfaceexpression of the protein which may differ relative to the tran-script levels.
In conclusion, the putative DC surface marker LAMP3 has beenidentified and cloned in rainbow trout and multiple sequencealignment and phylogenetic tree analysis suggest that there is aclose evolutionary relationship between the trout LAMP3 moleculeand other known vertebrate LAMP3 family members. LAMP3 isconstitutively expressed in rainbow trout lymphoid tissues andthe expression can be induced by pathogenic stimuli alreadyknown to induce DC maturation in humans and chickens. Thus,this marker will be useful for future studies of antigen presentationin fish.
Acknowledgments
Petronella Johansson was supported through a PhD studentshipfrom the Marine Alliance for Science and Technology Scotland(MASTS).
References
Aghaallaei, N., Bajoghli, B., Schwarz, H., Schorpp, M., Boehm, T., 2010.Characterization of mononuclear phagocytic cells in medaka fish transgenicfor a cxcr3a:gfp reporter. Proc. Natl. Acad. Sci. 107, 18079–18084.
Agius, C., Roberts, R.J., 2003. Melano-macrophage centers and their role in fishpathology. J. Fish Dis. 26, 499–509.
Akasaki, K., Nakamura, N., Tsukui, N., Yokota, S., Murata, S., Katoh, R., Michihara, A.,Tsuji, H., Marques Jr., E.T., August, J.T., 2004. Human dendritic cell lysosome-associated membrane protein expressed in lung type II pneumocytes. Arch.Biochem. Biophys. 425, 147–157.
Altschul, S., Gish, W., Miller, W., Myers, E., Lipman, D., 1990. Basic local alignmentsearch tool. J. Mol. Biol. 215, 403–410.
Banchereau, J., Steinman, R.M., 1998. Dendritic cells and the control of immunity.Nature 392, 245–252.

412 P. Johansson et al. / Developmental and Comparative Immunology 37 (2012) 402–413
Banchereau, J., Briere, C.C., Davoust, J., Lebecque, S., Liu, Y.-J., Pulendran, B.,Palucka, K., 2000. Immunobiology of dendritic cells. Annu. Rev. Immunol. 18,767–811.
Bendtsen, J.D., Nielsen, H., von Heijne, G., Brunak, S., 2004. Improved prediction ofsignal peptides: SignalP 3.0. J. Mol. Biol. 340, 783–795.
Birney, E., Clamp, M., Durbin, R., 2004. Genewise and genomewise. Genome Res. 14,988–995.
Brubacher, J.L., Secombes, C.J., Zou, J., Bols, N.C., 2000. Constitutive and LPS-inducedgene expression in a macrophage-like cell line from the rainbow trout(Oncorhynchus mykiss). Dev. Comp. Immunol. 24, 565–574.
Campbell, J.J., Hedrick, J., Zlotnik, A., Siani, M.A., Thompson, D.A., Butcher, E.C., 1998.Chemokines and the arrest of lymphocytes rolling under flow conditions.Science 279, 381–384.
Cao, W., Lee, S.H., Lu, J., 2005. CD83 is preformed inside monocytes, macrophagesand dendritic cells, but it is only stably expressed on activated dendritic cells.Biochem. J. 385, 85–93.
De Saint-Vis, B., Vincent, J., Vandenabeele, S., Vanbervliet, B., Pin, J.-J., Aït-Yahia, S.,Patel, S., Mattei, M.-G., Banchereau, J., Zurawski, S., Davoust, J., Caux, C.,Lebecque, S., 1998. A novel lysosome-associated membrane glycoprotein, DC-LAMP, induced upon DC maturation, is expressed in MHC Class II compartment.Immunity 9, 325–336.
Donate, C., Roher, N., Balasch, J.C., Ribas, L., Goetz, F.W., Planas, J.V., Tort, L.,MacKenzie, S., 2007. CD83 expression in sea bream macrophages is a marker forthe LPS-induced inflammatory response. Fish Shellfish Immunol. 23, 877–885.
Elliott, B., Scolyer, R.A., Suciu, S., Lebecque, S., Rimoldi, D., Gugerli, O., Musat, E.,Sharma, R.N., Lienard, D., Keilholz, U., Testori, A., Eggermont, A., MacKie, R.,Robert, C., 2007.
El Sherbini, H., Hock, B., Fearnley, D., McLellan, A., Vuckovic, S., Hart, D.N., 2000.Lectin ligands on human dendritic cells and identification of a peanut agglutininpositive subset in blood. Cell. Immunol. 200, 36–44.
Falquet, L., Pagni, M., Bucher, P., Hulo, N., Sigrist, C.J., Hofmann, K., Bairoch, A., 2002.The PROSITE database, its status in 2002. Nucleic Acids Res. 30, 235–238.
Gasteiger, E., Gattiker, A., Hoogland, C., Ivanyi, I., Appel, R.D., 2003. ExPASy: theproteomics server for in-depth protein knowledge and analysis. Nucleic AcidsRes. 31, 3784–3788.
Ganassin, R.C., Bols, N.C., 1998. Development of a monocyte/macrophage-like cellline, RTS11, from rainbow trout spleen. Fish Shellfish Immunol. 8, 457–476.
Gottenberg, J.-E., Chiocchia, G., 2007. Dendritic cells and interferon mediatedautoimmunity. Biochimie 89, 856–871.
Guermonprez, P., Valladeau, J., Zitvogel, L., Thery, C., Amigorena, S., 2002. Antigenpresentation and T cell stimulation by dendritic cells. Annu. Rev. Immunol. 20,621–667.
Hashimoto, S.-I., Suzuki, T., Nagai, S., Yamashita, T., Toyoda, N., Matsushima, K.,2000. Identification of genes specifically expressed in human activated andmature dendritic cells through serial analysis of gene expression. Blood 96,2206–2214.
Haugarvoll, E., Bjerkås, I., Nowak, B.F., Hordvik, I., Koppang, E.O., 2008. J. Anat. 213,202–209.
Higaki, M., Higaki, Y., Kawashima, M., 2009. Increased expression of CD208 (DC-LAMP) in epidermal keratinocytes of psoriatic lesions. J. Dermatol. 36, 144–149.
Holland, J.W., Karim, A., Wang, T., Alnabulsi, A., Scott, J., Collet, B., Mughal, M.S.,Secombes, C.J., Bird, S., 2010. Molecular cloning and characterization ofinterferon regulatory factors 4 and 8 (IRF-4 and IRF-8) in rainbow trout,Oncorhynchus mykiss. Fish Shellfish Immunol. 29, 157–166.
Hunziker, W., Geuze, H.J., 1996. Intracellular trafficking of lysosomal membraneproteins. BioEssays 18, 379–389.
Kumar, S., Tamura, K., Nei, M., 2004. MEGA3: integrated software for molecularevolutionary genetics analysis and sequence alignment. Brief Bioinform. 5, 150–163.
Lin, A.-F., Xiang, L.-X., Wang, Q.-L., Dong, W.-R., Gong, Y.-F., Shao, J.-Z., 2009. The DC-SIGN of zebrafish: insights into the existence of a CD209 homologue in a lowervertebrate and its involvement in adaptive immunity. J. Immunol. 183, 7398–7410.
Lovy, J., Wright, G.M., Speare, D.J., 2006. Morphological presentation of a dendritic-like cell within the gills of Chinook salmon infected with Loma salmonae. Dev.Comp. Immunol. 30, 259–263.
Lovy, J., Savidant, G.P., Speare, D.J., Wright, G.M., 2009. Langerin/CD207 positivedendritic like cells in the haemopoietic tissues of salmonids. Fish ShellfishImmunol. 27, 365–368.
Lovy, J., Savidant, G.P., Wright, G.M., 2011. Ontogeny and disease responses ofLangerhans-like cells in lymphoid tissues of salmonid fish. Cell Tissue Res. 346,111–118.
Lugo-Villarino, G., Ballaa, K.M., Stachuraa, D.L., Bañuelosa, K., Werneckb, B.F.,Travera, D., 2010. Identification of dendritic antigen-presenting cells in thezebrafish. Proc. Natl. Acad. Sci. 107, 15850–15855.
Miller, N., Wilson, M., Bengtén, E., Stuge, T., Warr, G., Clem, W., 1998. Functional andmolecular characterization of teleost leukocytes. Immunol. Rev. 166, 187–871.
McBeath, A.J., Snow, M., Secombes, C.J., Ellis, A.E., Collet, B., 2007. Expressionkinetics of interferon and interferon-induced genes in Atlantic salmon (Salmosalar) following infection with infectious pancreatic necrosis virus andinfectious salmon anaemia virus. Fish Shellfish Immunol. 22, 230–241.
Miranda de Carvalho, C., Bonnefont-Rebeix, C., Rigal, D., Chabanne, L., 2005.‘‘Dendritic cells in different animal species: an overview’’. Pathol. Biol. 54, 85–93.
Muffato, M., Louis, A., Poisnel, C.E., Roest Crollius, H., 2010. Genomicus: a databaseand a browser to study gene synteny in modern and ancestral genomes.Bioinformatics 26, 1119–1121.
Meyerholz, D.K., DeGraaff, J.A., Gallup, J.M., Olivier, A.K., Ackermann, M.R., 2006.Depletion of alveolar glycogen corresponds with immunohistochemicaldevelopment of CD208 antigen expression in perinatal lamb lung. J.Histochem. Cytochem. 54, 1247–1253.
Ohta, Y., Landis, E., Boulay, T., Phillips, R.B., Collet, B., Secombes, C.J., Flajnik, M.F.,Hansen, J.D., 2004. Homologs of CD83 from elasmobranch and teleost fish. J.Immunol. 173, 4553–4560.
Passantino, L., Cianciotta, A., Jirillo, F., Carrassi, M., Jirillo, E., Passantino, G.F., 2005.Lymphoreticular system in fish: erythrocyte-mediated immunomodulation ofmacrophages contributes to the formation of melanomacrophage centers.Immunopharmacol. Immunotoxicol. 27, 147–161.
Pearson, W., Lipman, D., 1988. Improved tools for biological sequence comparison.Proc. Natl. Acad. Sci. 85, 2444–2448.
Pfaffl, M.W., 2001. A new mathematical model for relative quantification in real-time RT-PCR. Nucleic Acids Res. 29, 2002–2007.
Pickl, W.F., Majdic, O., Kohl, P., Stöckl, J., Riedl, E., Scheinecker, C., Bello-Fernandez,C., Knapp, W., 1996. Molecular and functional characteristics of dendritic cellsgenerated from highly purified CD14+ peripheral blood monocytes. J. Immunol.157, 3850–3859.
Press, C.McL., Evensen, Ø., 1999. The morphology of the immune system in teleostfishes. Fish Shellfish Immunol. 9, 309–318.
Reis e Sousa, C., 2004. Activation of dendritic cells: translating innate into adaptiveimmunity. Immunology 16, 21–25.
Rost, B., Sander, C., 1994. Combining evolutionary information and neural networksto predict protein secondary structure. Proteins 19, 55–72.
Rost, B., 1996. PHD: predicting one-dimensional protein structure by profile-basedneural networks. Methods Enzymol. 266, 525–539.
Rouas, R., Lewalle, P., El Ouriaghli, F., Nowak, B., Duvillier, H., Martiat, P., 2004.Poly(I:C) used for human dendritic cell maturation preserves their ability tosecondarily secrete bioactive IL-12. Int. Immunol. 16, 767–773.
Rozen, S., Skaletsky, H., 2000. Primer3 on the WWW for general users and forbiologist programmers. In: Misener, S., Krawetz, S.A. (Eds.), BioinformaticsMethods and Protocols: Methods in Molecular Biology. Humana Press, Totowa,pp. 365–386.
Salaun, B., de Saint-Vis, B., Clair-Moninot, V., Pin, J.J., Barthélemy-Dubois, C.,Kissenpfennig, A., Peronne, C., Bates, E., Mattei, M.G., Lebecque, S., 2003. Cloningand characterization of the mouse homologue of the human dendritic cellmaturation marker CD208/DC-LAMP. Eur. J. Immunol. 33, 2619–2629.
Salaun, B., de Saint-Vis, B., Pacheco, N., Pacheco, Y., Riesler, A., Isaac, S., Leroux, C.,Clair-Moninot, V., Pin, J.J., Griffith, J., Treilleux, I., Goddard, S., Davoust, J.,Kleijmeer, M., Lebecque, S., 2004. CD208/dendritic cell-lysosomal associatedmembrane protein is a marker of normal and transformed type II pneumocytes.Am. J. Pathol. 164, 861–871.
Saunders, H.L., Oko, A.L., Scott, A.N., Fan, C.W., Magor, B.G., 2010. The cellularcontext of AID expressing cells in fish lymphoid tissues. Dev. Comp. Immunol.34, 669–676.
Stafford, J.L., McLauchlan, P.E., Secombes, C.J., Ellis, A., Belosevic, E.M., 2001.Generation of primary monocyte-like cultures from rainbow trout head kidneyleukocytes. Dev. Comp. Immunol. 25, 447–459.
Steinman, R.M., 1991. The dendritic cell system and its role in immunogenicity.Annu. Rev. Immunol. 9, 271–296.
Thompson, J., Higgins, D., Gibson, T., 1994. ClustalW: improving the sensitivity ofprogressive multiple sequence alignment through sequence weighting, positionspecific gap penalties and weight matrix choice. Nucleic Acids Res. 22, 4673–4680.
Thurner, B., Röder, C., Dieckmann, D., Heuer, M., Kruse, M., Glaser, A., Kämpgen, E.,Bender, A., Schuler, G., 1999. Generation of large numbers of fully mature andstable dendritic cells from leukapheresis products for clinical appplication. J.Immunol. Methods 223, 1–15.
Vigliano, F.A., Bermudez, R., Quiroga, M.I., Nieto, J.M., 2006. Evidence for melano-macrophage centers of teleost as evolutionary precursors of germinal centers ofhigher vertebrates: An immunohistochemical study. Fish Shellfish Immunol. 21,467–471.
Wang, T., Bird, S., Koussounadis, A., Holland, J.W., Carrington, A., Zou, J., Secombes,C.J., 2009. Identification of a novel IL-1 cytokine family member in teleost fish. J.Immunol. 183, 962–974.
Wang, T., Secombes, C.J., 2009. Identification and expression analysis of twofishspecific IL-6 cytokine family members, the ciliary neurotrophic factor(CNTF)-like and M17 genes, in rainbow trout Oncorhynchus mykiss. Mol.Immunol. 46, 2290–2298.
Wang, T., Diaz-Rosales, P., Costa, M.M., Campbell, S., Snow, M., Collet, B., Martin, S.A.,Secombes, C.J., 2011a. Functional characterization of a non-mammalian IL-21:rainbow trout Oncorhynchus mykiss IL-21 up-regulate s the expression of the Thcell signature cytokines IFN- gamma, IL-10, and IL-22. J. Immunol 186, 708–721.
Wang, T., Huang, W., Costa, M.M., Martin, S.A., Secombes, C.J., 2011b. Two copies ofthe genes encoding the subunits of putative interleukin (IL)-4/IL-13 receptors,IL-4Ra, IL-13Ra1 and IL-13Ra2, have been identified in rainbow trout(Oncorhynchus mykiss) and have complex patterns of expression andmodulation. Immunogenetics 63, 235–253.
Wittamer, V., Bertrand, J.Y., Gutschow, P.W., Traver, D., 2011. Characterization of themononuclear phagocyte system in zebrafish. Blood 117, 7126–7135.

P. Johansson et al. / Developmental and Comparative Immunology 37 (2012) 402–413 413
Wu, Z., Hu, T., Butter, C., Kaiser, P., 2010. Cloning and characterisation of the chickenorthologue of dendritic cell-lysosomal associated membrane protein (DC-LAMP). Dev. Comp. Immunol. 34, 183–188.
Zhou, L.J., Schwarting, R., Smith, H.M., Tedder, T.F., 1992. A novel cell-surfacemolecule expressed by human interdigitating reticulum cells, Langerhans cells,and activated lymphocytes is a new member of the Ig superfamily. J. Immunol.149, 735–742.
Zlotnik, A., Yoshie, O., 2000. Chemokines: a new classification system and their rolein immunity. Immunity 12, 121–127.
Zou, J., Carrington, A., Collet, B., Dijkstra, J.M., Bols, N., Secombes, C.J., 2005.Identification and bioactivities of interferon gamma in rainbow troutOncorhynchus mykiss : the first Th1 type cytokine characterised functionallyin fish. J. Immunol. 175, 2484–2494.
Copyright © 2022 FDOKUMEN