Lysosomal enzymes are decreased in the kidney of diabetic rats
12
(This is a sample cover image for this issue. The actual cover is not yet available at this time.) This article appeared in a journal published by Elsevier. The attached copy is furnished to the author for internal non-commercial research and education use, including for instruction at the authors institution and sharing with colleagues. Other uses, including reproduction and distribution, or selling or licensing copies, or posting to personal, institutional or third party websites are prohibited. In most cases authors are permitted to post their version of the article (e.g. in Word or Tex form) to their personal website or institutional repository. Authors requiring further information regarding Elsevier’s archiving and manuscript policies are encouraged to visit: http://www.elsevier.com/copyright
-
Upload
independent -
Category
Documents
-
view
2 -
download
0
Transcript of Lysosomal enzymes are decreased in the kidney of diabetic rats

(This is a sample cover image for this issue. The actual cover is not yet available at this time.)
This article appeared in a journal published by Elsevier. The attachedcopy is furnished to the author for internal non-commercial researchand education use, including for instruction at the authors institution
and sharing with colleagues.
Other uses, including reproduction and distribution, or selling orlicensing copies, or posting to personal, institutional or third party
websites are prohibited.
In most cases authors are permitted to post their version of thearticle (e.g. in Word or Tex form) to their personal website orinstitutional repository. Authors requiring further information
regarding Elsevier’s archiving and manuscript policies areencouraged to visit:
http://www.elsevier.com/copyright

Author's personal copy
Lysosomal enzymes are decreased in the kidney of diabetic rats
Giovani B. Peres a, Maria A. Juliano b, Manuel J. Simões c, Yara M. Michelacci a,⁎a Departamento de Bioquímica, Escola Paulista de Medicina, UNIFESP, São Paulo, SP, Brazilb Departamento de Biofísica, Escola Paulista de Medicina, UNIFESP, São Paulo, SP, Brazilc Departamento de Morfologia, Escola Paulista de Medicina, UNIFESP, São Paulo, SP, Brazil
a b s t r a c ta r t i c l e i n f o
Article history:Received 4 May 2012Received in revised form 3 September 2012Accepted 27 September 2012Available online 29 September 2012
Keywords:Diabetes mellitusLysosomeCathepsinGlycosidaseKidneyTubular cells
The objective of the present study was to investigate the expression and activities of lysosomal enzymes thatact upon proteins and sulfated polysaccharides in diabetic rat kidney. Cathepsins, glycosidases and sulfataseswere studied on the 10th (DM-10) and on the 30th (DM-30) day of streptozotocin-induced diabetes mellitus(DM). The activity of cathepsin B, the main kidney cysteine protease, was decreased both in DM-10 andDM-30. Gel filtration chromatography of urinary proteins has shown the prevalence of low molecular weightpeptides in normal and DM-10 urine, in contrast to the prevalence of high molecular weight peptides and in-tact proteins in DM-30. These results show that the decrease in lysosomal proteases could explain, at least inpart, the increased albuminuria detected by radial immunodiffusion (RID), due to the excretion of less de-graded or intact albumin. Concerning sulfated polysaccharides, the activities of β-glucuronidase, N-acetyl-β-D-glucosaminidase, and N-acetyl-β-D-galactosaminidase were also decreased in DM-30, while aryl sulfa-tases did not vary. Increased toluidine blue metachromatic staining of the tissue suggests that the loweractivities of glycosidases could lead to intracellular deposition of partially digested molecules, and thiscould explain the decreased urinary excretion and increased tissue buildup of these molecules. The mainmorphological changes observed in kidney were proximal convoluted tubules with thinner walls and thinnerbrush border. Immunohistochemistry revealed that most of cathepsin B was located in the brush border ofproximal tubular cells, highlighting the involvement of proximal convoluted tubules in diabetic nephropathy.
© 2012 Elsevier B.V. All rights reserved.
1. Introduction
Diabetic nephropathy is a serious complication of diabetesmellitus(DM) and is the most common cause of end-stage renal disease [1]. Itaffects approximately one third of patients with type 1 or type 2 DM[2].
The initial development of diabetic nephropathy in type 1 DM gen-erally is indicated by microalbuminuria [3]. The changes in albuminexcretion rate have traditionally been attributed to changes in the glo-merular permselectivity barrier and intraglomerular pressure, withthe assumption that albumin remains intact during filtration andrenal passage [4]. However, studies with 3H-albumin in humanshave shown that 3H-albumin was metabolized to small fragmentsduring renal passage, and less than 4% of radioactivity was associatedwith intact albumin. These fragments were not detected by radioim-munoassay (RIA), one of the methods traditionally used to revealmicroalbuminuria [5]. In diabetic patients, intact albumin representedup to 55% of total radioactivity, possibly due to an inhibition of the
degradation rate, and this inhibition seems to be directly proportionalto the level of albuminuria detected by RIA [6].
On the other hand, there are evidences suggesting that proximal con-voluted tubules are important elements for albuminuria in streptozotocin(STZ)-type 1 diabetic rats. Using fluorescent-labeled albumin and intravi-tal microscopy, it was shown that diabetic rats presented similar glomer-ular permeability in the 12thweek,while demonstrating significantly lessfluorescent albumin in proximal tubule cells in comparison to non-diabetic controls [7]. Also, there are evidences indicating that cubilin, a460 kDa peripheral membrane protein, is essential for albuminreabsorption by proximal tubule cells, while megalin, a 600 kDa trans-membrane protein, drives internalization of cubilin-albumin complexes[8]. The concentration of these two proteins was found to be increasedin the urine of type 1 diabetes+microalbuminuria, suggesting that ab-normal shedding of megalin and cubilin could contribute to albuminuria[9].
Other aberrant renal processing in DM concerns sulfated polysac-charides. We have previously shown a marked decrease in the excre-tion of urinary glycosaminoglycans in rats with STZ-DM (expressed asGAGs/24 h), from the second week on [10]. The excretion rate of ex-ogenous dextran sulfates of different molecular weights was also de-creased in diabetic rats (10 and 30 days) [11]. In contrast, higheramounts of dextran sulfates, especially those of high molecularweights, accumulated in diabetic kidney and liver, suggesting cellular
Biochimica et Biophysica Acta 1832 (2013) 85–95
⁎ Corresponding author at: Disciplina de BiologiaMolecular, Departamento de Bioquímica,Escola Paulista de Medicina, UNIFESP, Rua Três de Maio, 100, 04044-020, São Paulo, SP,Brazil. Tel.: +55 11 5576 4438x1187; fax: +55 11 5573 6407.
E-mail address: [email protected] (Y.M. Michelacci).
0925-4439/$ – see front matter © 2012 Elsevier B.V. All rights reserved.http://dx.doi.org/10.1016/j.bbadis.2012.09.011
Contents lists available at SciVerse ScienceDirect
Biochimica et Biophysica Acta
j ourna l homepage: www.e lsev ie r .com/ locate /bbad is

Author's personal copy
internalization. The glycosaminoglycan concentration was also in-creased in diabetic kidney, mainly the glomerulus, due to dermatansulfate buildup [9,12].
Renal hypertrophy, with an increase in kidney protein content, is awell-recognized feature of diabetic nephropathy. This may be the re-sult of increased protein synthesis and/or decreased degradation.Olbricht and Geissinger [13] proposed a role for lysosomal proteolyticenzymes in diabetic renal hypertrophy and reported decreased activ-ities of cathepsin B and cathepsin L in proximal tubules of STZ-diabetic rats on the 4th day of diabetes, but these activities wereequal to controls six months later, when end stage renal hypertrophyhad already occurred. A decrease in the tubular cell protein break-down, with a reduction in the activities of tubular cathepsin B and ca-thepsin L, was also reported on the 2nd day of diabetes [14]. Therelevance of these proteolytic processes for diabetic nephropathyhas been recently highlighted with the proposition of autophagy,the lysosomal protein degradation pathway, as a therapeutic targetfor diabetic nephropathy [15]. Nevertheless, there are few reports onthe expression and activities of proteolytic enzymes between veryearly (2–4 days) and late stages (6 months) of diabetic nephropathy,and there are even fewer reports concerning lysosomal enzymes thatact upon sulfated polysaccharides, specifically glycosaminoglycans.
So, the aim of the present study was to investigate the expressionand activities of lysosomal enzymes that act upon proteins and sulfatedpolysaccharides – cathepsins, glycosidases and sulfatases – on days 10and 30 of STZ-type 1 DM in rats. The urinary excretion of proteins andpeptides was also characterized.
2. Materials and methods
2.1. Animals, urine samples, and tissues
The presentworkwas approved by the Ethical Committee of EscolaPaulista de Medicina—UNIFESP (CEP 0170/09), and was carried out inaccordance with UNIFESP guidelines, and also in accordance with EC
Directive 86/609/EEC for animal experiments http://ec.europa.eu/environment/chemicals/lab_animals/legislation_en.htm.
MaleWistar rats (n=52), 12 weeks of age (275–360 g bodyweight),were randomly assigned to one of four groups: control, 10 days (NL-10),diabetes, 10 days (DM-10), control, 30 days (NL-30), diabetes, 30 days(DM-30). Before the induction of DM, the animals were weighed, bloodglucose was measured (Advantage Kit Roche, Basel, Swiss), and the ani-mals were placed in metabolic cages for 24 h-urine collection. Diabeteswas induced in the 26 rats of DM groups by a single i.p. injection of STZ(60 mg/kg body weight). The drug was dissolved in 300 μl of 10 mM so-dium citrate buffer, pH 4.5. These animals were fed standard laboratorychow and a 5% glucose solution ad libitum, for 72 h. Afterwards, the glu-cose solution was replaced by water. The glycemia was measured 72 hafter STZ administration, and also at the end of each experiment (either10th or 30th day). Only animals that, at 72 h, presented blood glucosehigher than 250 mg/dl were considered “diabetic” [16]. The 26 age-matched animals that served as controls (NL-10 and NL30) receivedonly buffer (300 μl) and were fed standard laboratory chow and waterad libitum.
At the end of each experiment, the body weight was again deter-mined, and the ratswere placed inmetabolic cage for 24 h-urine collec-tion. The 24 h-urine volume was measured, the urine was centrifugedto remove debris, and used for determination of creatinine, total pro-tein, and albumin. Creatinine was quantified by the picric acid reactionin alkaline conditions (CELM creatinine kit, São Paulo, SP, Brazil); totalprotein wasmeasured by the pyrogallol red-molybdate complexmeth-od (Sensiprot, Labtest, Lagoa Santa, MG, Brazil) [17]; albumin was de-termined by two methods: (1) radial immunodiffusion (RID) basedon precipitation with rabbit antibodies against rat albumin [10],and (2) ELISA with Bethyl E110-125 Rat Albumin QuantificationSet (Montgomery, TX, USA).
After urine collection, the rats were euthanized, both kidneys wereremoved, weighed, and carefully cut in small fragments (~100 mgeach). These fragmentswere used for RNA extraction (Section 2.3), mea-surement of enzyme activities (Section 2.4), Western blotting and
Table 1Body weight, kidney weight, and glycemia of rats 10 days and 30 days after induction of diabetes mellitus (streptozotocin) and their matched controls.a
Group Body weight (g) Glycemia (mg/dl) Kidney weight Kidney/body weight
Initial Final Initial 72 h Final (g) (×10−3)
NL-10(n=13)
308±16 326±19 105±9 106±17 116±28 0.98±0.07 3.09±0.12
DM-10(n=11)
313±33 282±32⁎ 111±13 424±123⁎ 461±108⁎ 1.26±0.08⁎ 4.09±0.05⁎
NL-30(n=13)
300±22 325±19 108±13 123±25 108±21 1.01±0.02 3.38±0.05
DM-30(n=10)
326±28 247±6⁎ 111±10 416±144⁎ 456±81⁎ 1.14±0.06⁎ 4.61±0.18⁎
a The numbers are mean±standard deviation. The groups are as follows: NL-10, controls, 10 days; DM-10, diabetic, 10 days; NL-30, controls, 30 days; DM-30, diabetic, 30 days.⁎ Pb0.05 vs. Controls.
Table 224 h-urine volume, urinary creatinine, total protein, and albumin (measured by radial immunodifusion, RID, and by ELISA) on days 0, 10 and 30 after diabetes mellitus induction(streptozotocin) and their matched controls.a
Group Control (NL) Diabetes mellitus (DM)
Day 0 10 30 0 10 30
24 h-urine volume (ml) 7.0±0.9 9.1±1.2 8.0±2.1 6.8±1.2 97.0±8.4⁎ 84.6±11.9⁎
Urinary creatinine (mg/ml) 1.42±0.21 1.31±0.20 1.23±0.22 1.66±0.29 0.21±0.03⁎ 0.21±0.03⁎
Urinary protein (mg/ml) 1.84±0.27 1.86±0.16 1.80±0.65 1.89±0.36 0.22±0.08⁎ 0.45±0.12⁎
Urinary protein (mg/24 h) 12.9±2.7 16.8±2.0 13.6±2.9 12.8±2.2 20.5±5.9⁎ 37.9±11.0⁎
Urinary albumin (RID, mg/24 h) 0.47±0.18 0.66±0.36 0.48±0.23 0.46±0.23 0.89±0.19⁎ 2.50±1.59⁎
Urinary albumin (ELISA, mg/24 h) 1.12±0.37 1.67±0.94 1.31±0.70 1.04±0.56 2.03±0.60⁎ 7.38±2.31⁎
a The numbers are mean±standard deviation.⁎ Pb0.05 vs. Day 0.
86 G.B. Peres et al. / Biochimica et Biophysica Acta 1832 (2013) 85–95

Author's personal copy
quantification of total protein (Section 2.2). The kidney fragments wereput in sterile tubes, frozen in liquid nitrogen, and stored at −70 °Cuntil use.
2.2. Gel filtration chromatography and Western blotting
The molecular weight of urinary proteins was estimated by gel fil-tration chromatography. Urine samples (0.5–2 ml) were applied to acolumn (1×30 cm) of Sephadex G-100 Superfine, equilibrated andeluted with PBS (0.1 ml/min). The collected fractions (0.72 ml each)were analyzed for creatinine and protein.
Protein was quantified in the tissue extracts and also in the SephadexG-100 eluted fractions by amodified Lowryprocedurewith bicinchoninicacid [18] (BCA Protein Kit Assay, Pierce, IL, USA), using bovine serum al-bumin as standard. Urinary protein was measured by the pyrogallolred-molybdatemethod because creatinine interfereswith the BCAmeth-od. BCA was used to measure proteins in Sephadex G-100 fractions be-cause it detects both intact proteins and peptides. Aliquots (10 μl) ofthe protein-containing fractions were submitted to SDS–PAGE (12%),stained with silver nitrate in alkaline medium [19], and also revealed byWestern blotting for albumin (Bethyl A110-134P, 1:10,000).
Western blotting was also used to test the specificity of anti-cathepsin B and anti-β-actin antibodies, as previously described [20].In brief, after SDS–PAGE of tissue extracts, proteins were transferredto nitrocellulose membranes (Millipore, Billerica, MA, USA). Afterblocking (2% casein in Tris-buffered saline containing 0.05% Tween20—TBST), membranes were probed with either rabbit polyclonalanti-cathepsin B antibody (1:250, Cat. No. 06-480, Millipore) or rabbitmonoclonal anti-β-actin antibody (1:500) in 1% bovine serum
albumin (BSA) in TBST. Then, the membranes were washed withTBST and incubated with peroxidase-conjugated goat anti-rabbit IgGsecondary antibody (1:3,000, Millipore). The antibody bindingwas vi-sualized first through chemiluminescent substrate (ECL AdvanceWestern Blotting Detection Kit, GE Healthcare, Piscataway, NJ, USA),and then tetramethylbenzidine (KPL, Gaithersburg, MD, USA). Imageswere obtained in MF-ChemiBIS gel documentation system (DNR BioImaging Systems Ltd., Jerusalem, Israel) with the software GelCapture7.0.6 for Windows™.
2.3. RNA extraction, analysis, and qPCR
Each tissue fragment (~100 mg) was disrupted in liquid nitrogen,homogenized in 1 ml of QIAzol Lysis Reagent (QIAGEN Inc., CA,USA), and processed according to the manufacturer's instructions(QIAzol® Handbook, Sample and Assay Technologies, 2009). A260/280
and A260/230 were measured (ND-1000, NanoDrop, Delaware, USA),and samples with ratios lower than 1.8 and 1.7, respectively, werediscarded. The integrity of RNA was also evaluated through 28S and18S rRNA bands in agarose gel electrophoresis, Tris-borate-EDTA buff-er, as previously described [21,22]. To avoid contaminationwith geno-mic DNA, RNA samples were treated with DNase I (FermentasInternational, Inc., Ontario, Canada, 1 unit per μg of RNA, 30 min,37 °C) followed by 25 mM EDTA (1 μl/enzyme unit, 10 min, 65 °C),to inactivate DNase I.
One microgram of RNA was reverse-transcribed to complementa-ry DNA (cDNA) with RevertAid M-MuLV (Fermentas International,Inc., Ontario, Canada). The resulting single-strand cDNA was ampli-fied by qPCR in a reaction mixture containing 0.4 μM of each primer
Fig. 1. Gel filtration chromatography of urinary proteins. Urine samples from normal (NL) and diabetic (DM-10 and DM-30) rats were applied to a Sephadex G-100 Superfine column(1×30 cm), equilibrated and eluted with PBS. Fractions (0.72 ml) were collected at a flow rate of 0.12 ml/min. Panel (A) shows the protein profiles (BCA, A562); panel (B) shows theSDS–PAGE (12%) of aliquots (10 μl) of selected fractions (2, 4, 6, 8, 9, 10, 11, 12, 14), stained by silver nitrate in alkaline medium; panel (C) shows Western blotting revealed for ratalbumin of NL and DM-30 urine samples. Molecular weight markers are also shown.
87G.B. Peres et al. / Biochimica et Biophysica Acta 1832 (2013) 85–95

Author's personal copy
and 7.5 μl of SYBR Green (Rotor-Gene SYBR Green PCR Kit) (15 μlfinal volume). The thermal cycling conditions were as follows: initial5 min at 95 °C, followed by 40–45 cycles of denaturing at 95 °C for5 seconds, annealing at 60 °C for 10 seconds, and extension at 95 °Cfor 10 min. Cycle number and cDNA concentration were adjusted sothat amplified products remained within the linear range of the PCRreaction. PCR amplification was conducted on a Corbett Rotor-Gene6000 (QIAGEN, Inc., CA, USA). Each PCR was done in duplicate.
Relative gene expression was calculated by the 2−ΔΔCT method
developed by Livak and Schmittgen [23]. In this method, it is assumedthat the expression of a reference gene (housekeeping gene) is inde-pendent of external factors and that its expression is quite constant.In the present paper, two genes were used as references: ribosomalprotein 29S (RPS29) and β-actin (ACTB).
The PCR primers (Bioneer Corporation, Alameda, CA, USA) were asfollows: cathepsin B, forward 5′ GCTATCCCTCTGGAGCATGGAAC 3′,and reverse, 5′ GACGGGAGCCATTGACATGGT 3′; cathepsin L, forward5′ AGGCAATCAGGGCTGTAATGGAG 3′, and reverse, 5′ CGTTAGCCACA
GCATACTCAGCTC 3′; β-glucuronidase, forward 5′ CAGTGCTTCCACAGCGATGGA 3′, and reverse 5′ GTGATGTCAGCCTCAAAGGGGAG 3′,β-actin forward 5′ GGATGACGATATCGCTGCGCT 3′, and reverse 5′ CTGACCCATACCCACCATCACAC 3′, and S29 ribosomal protein forward5′ GTCAGTACGCGAAGGACATAGGC 3′, and reverse 5′ CAGGGTAGACAGTTGGTTTCATTGGG 3′.
2.4. Enzyme activities
Tissue samples (~100 mg) were disrupted in liquid nitrogen, andresuspended in 1 ml of 50 mM Tris–HCl buffer, pH 7.4, containing200 mM NaCl and 250 mM sucrose [24] plus 1 ml of 0.2% TritonX-100. After standing for 10 min in an ice bath, debris was removedby centrifugation (12,000 ×g, 10 min, 4 °C). Aliquots of the superna-tant (100 μl) were stored in sterile tubes at −70 °C until use (tissueextracts).
Protease activities were quantified by fluorometric assays using ei-ther carbobenzoxy-Phe-Arg-7-amide-4-methylcoumarin (Z-FR-MCA,
Fig. 2. Expression (mRNA) of cathepsin B, cathepsin L, and β-D-glucuronidase in diabetic (DM) and normal (NL) rat kidney. The expression of mRNA was normalized either by ribosomalprotein S29 (RPS29) or β-actin (ACTB). The expression of RPS29 varied in diabetes relative to ACTB, indicating that it is not a good housekeeping gene in DM. Data representmean±standarddeviation. Statistically significant differences between NL and DM are shown as Pb0.05.
88 G.B. Peres et al. / Biochimica et Biophysica Acta 1832 (2013) 85–95

Author's personal copy
Sigma-Aldrich Corp., St. Louis, MO, USA) or ε-NH2-caproyl-Cys(Bzl)-Cys(Bzl)-MCA (synthesized by Prof. Dr. Maria A. Juliano) [25], as sub-strates. These substrates were used to quantify total cysteine-proteases
and cathepsin B, respectively. The incubations were carried out in darkmicroplates (Corning, MA, USA), in 50 mM phosphate buffer, pH 6.3,containing 10 mM EDTA. The enzymes (10 μg of protein) were
Fig. 3. Kinetics of cysteine protease activities in diabetic (DM) and normal (NL) rat kidney. (A) Standard curve of free 7-amino-4-methylcoumarin (MCA), showing the linearity range.Tissue extracts (1–3 μl containing 10 μg of protein) were incubated with either 20 μM Z-FR-MCA (B), and 20 μM ε-NH2-caproyl-Cys(Bzl)-Cys(Bzl)-MCA (C) (200 μl final volume). Amaximum of 10% substrate consumption was considered, and each point represents mean±95% confidence interval of four replicates for all animals in each group. The presence ofPMSF did not affect the total protease activities. Inhibitor concentrations: PMSF=1 mM; CA074=1 μM; E64=5 μM.
89G.B. Peres et al. / Biochimica et Biophysica Acta 1832 (2013) 85–95
Author's personal copy
pre-activated by incubation of tissue extract aliquots with 2 mMdithiothreitol (DTT, 10 min, room temperature), and then the substratewas added (20 μM, 200 μl final volume). The fluorescence producedupon hydrolysis of the substrates was measured every 20 seconds inFlexStation 3 (Molecular Devices, CA, USA), using λexcitation=380 nmand λemission=460 nm. The assays were also performed in presenceof inhibitors: 1 mM phenylmethylsulfonyl fluoride (PMSF, inhibitorof serine-proteases), 5 μM E64 (irreversible inhibitor of cysteine-proteases) and 1 μM CA074 (irreversible inhibitor of cathepsin B).
The activities of β-D-glucuronidase, N-acetyl-β-D-glucosaminidase,N-acetyl-β-D-galactosaminidase, and sulfatases, were measured byspectrophotometric assays using the following substrates, respec-tively: 4-nitrophenyl β-D-glucuronide, 4-nitrophenyl N-acetyl-β-D-glucosaminide, 4-nitrophenyl N-acetyl-β-D-galactosaminide, and4-nitrophenyl sulfate (Sigma-Aldrich Corp., St. Louis, MO, USA). Allassays were performed in microplates, always as triplicates, andthe incubation mixtures (150 μl final volume) contained 50 mM so-dium acetate buffer, pH 5.0, 2 mM substrate and increasing amountsof tissue extracts (2–30 μl containing 20–120 μg of protein). After1 h incubation at 37 °C, the 4-nitrophenol released was solubilizedby addition of 1 MNaOH (150 μl), and the absorbancewasmeasuredimmediately at λ405 in a microplate reader (Molecular Devices, CA,USA).
2.5. Histology and immunohistochemistry
For histology and immunohistochemistry, one rat of each groupwas anesthetized with 10% chloral hydrate (4 ml/kg body weight),and perfused with filtered saline (150 ml, 12 ml/min) followed by
4% formalin in 0.1 M phosphate buffer, pH 7.4 (500 ml, 12 ml/min).The kidneys were removed, cut, dehydrated, embedded in paraffin,and cut in 4 μm sections. These sections were transferred to silane-coated microscope slides and dewaxed as previously described [26].
Kidney sections were stained with either hematoxylin and eosin(H&E) or toluidine blue, and images were obtained with a Zeiss Axiolabmicroscope (Carl Zeiss MicroImaging GmbH, Göttingen, Germany),equippedwith AxioCamMRCdigital camera and the software AxioVision.
For immunohistochemistry, the dewaxed slideswere transferred into200 ml of pre-warmed 10 mM sodium citrate buffer, pH 6.0 (95 °C). An-tigen retrieval was 30 min at 95 °C, 20 min on the bench, and 5 min inrunning water. Endogenous peroxidase was blocked by 3% hydrogenperoxide (10 min, 10 times), followed by running water (10 min) andphosphate buffered saline (PBS, 3 min, 3 times). Unspecific protein bind-ing was blocked by 200 μl of 1% bovine serum albumin (BSA, Cat. No.A3059, Sigma-Aldrich, St. Louis, MO, USA) and 2% fetal calf serum inPBS in a moist chamber at room temperature. The primary antibodywas rabbit anti-cathepsin B (Cat. No. 06-480, EMD Millipore, Billerica,MA, USA) diluted 1:100 in blocking solution. After overnight incubationat 4 °C and 3×5 minwashes in PBS, secondary antibody goat anti-rabbitIgG, HRP-conjugate (Cat. No. 12-348, EMDMillipore, Billerica, MA, USA)diluted 1:200 in blocking solutionwas added. After 90 min and 3×5 minwashes in PBS, nickel enhanced diaminobenzidine (Cat. No. 54-74-00,HistoMark Orange Peroxidase System, KPL, Inc., Gaithersburg, MD,USA) was used as HRP substrate. After running water, the tissues werecounterstained by hematoxylin solution, Harris modified (Cat. No.HHS16, Sigma-Aldrich, St. Louis, MO, USA), 30 sec. The excess of hema-toxylin was removed by 0.1% HCl in 70% ethanol, followed by 5 min inrunning water. Slides were dehydrated and mounted in Entellan (Cat.
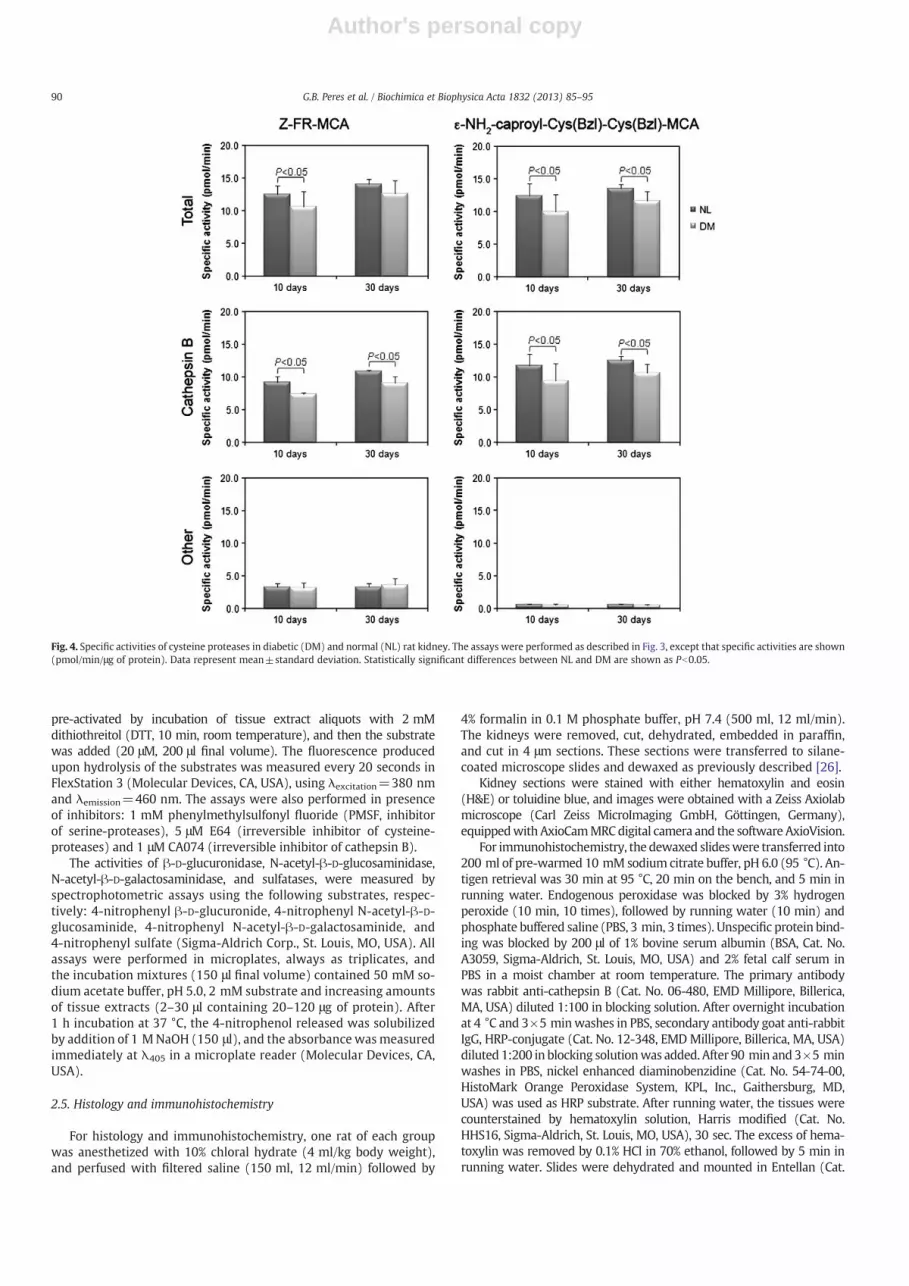
Fig. 4. Specific activities of cysteine proteases in diabetic (DM) and normal (NL) rat kidney. The assays were performed as described in Fig. 3, except that specific activities are shown(pmol/min/μg of protein). Data represent mean±standard deviation. Statistically significant differences between NL and DM are shown as Pb0.05.
90 G.B. Peres et al. / Biochimica et Biophysica Acta 1832 (2013) 85–95
Author's personal copy
No. 14800, Merck, Darmstadt, Germany) and sealed with clear nail pol-ish. Negative controls were incubated with blocking solution, at eachstep.
2.6. Statistical analysis
Statistical analysis was performed using PASW Statistics (SPSS Sta-tistics) for Windows™ (version 18.0.0). Data were evaluated for nor-mality by the Shapiro–Wilk test, and were standardized (z-score)when the parametric distribution was not observed. Bootstrap, a
resampling method, was also used to check for the stability of the ex-perimental data. Results are presented as mean±standard deviation,except for enzyme kinetics, when mean±95% confidence interval isshown. Differences between groups were analyzed by ANOVA. Valuesof Pb0.05 were considered significant.
3. Results
3.1. Glycemia, body weight, kidney weight, 24-h urine volume, urinarycreatinine, total protein, and albuminuria
Table 1 shows that 10 days and 30 days after STZ injection most ofthe experimental rats presented increased blood glucose concentra-tions. Two animals of the DM-10 group did not become diabetic andwere excluded, and three animals of the DM-30 group died beforethe end of the experimental period. In contrast to the control animals(NL-10 and NL-30), which gained weight, all the diabetic rats haveshown a progressive and significant decrease in body weight. Incontrast, the kidney weight increased in diabetic rats, as well as thekidney/body weight ratios.
Table 2 shows the 24 h-urine volume, and the concentrations of cre-atinine (colorimetric, picric acid reaction), total protein (measured by thepyrogallol red-molybdate complex colorimetric method), and albumin(measured by RID and ELISA). As expected, the urine volume increasedand the creatinine concentration decreased in diabetic animals. The pro-tein concentration also decreased in the urine (expressed as mg/ml), but24 h protein excretion increased. Urinary albumin also significantly andprogressively increased. Although different values were obtained by RIDand ELISA, the correlation coefficient of the two methods was very high(R2=0.9947).
3.2. Urinary proteins
Urine samples were submitted to gel filtration chromatography inSephadex G-100, and the eluted fractions were analyzed for creati-nine and total protein (Fig. 1-A). Aliquots of the fractions were alsosubmitted to SDS–PAGE (silver staining, Fig. 1-B) and Western blot-ting for albumin (Fig. 1-C). In normal urine, there was a prevalenceof low molecular weight peptides, which were revealed by BCA reac-tion and SDS–PAGE-silver staining, although intact albumin was alsopresent (Western blotting). Similar results were obtained for DM-10urine samples. In contrast, in the urine of rats that remained diabeticfor 30 days (DM-30), a prevalence of high molecular weight peptidesand proteins occurred.
3.3. Quantitative PCR (qPCR) for cathepsin B, cathepsin L andβ-glucuronidase
Two housekeeping genes—ribosomal protein S29 (RPS29) andβ-actin (ACTB) were included in the qPCR analysis, and the resultsobtained for 2−ΔΔC
T is shown in Fig. 2. The expression of RPS29 de-creased in diabetes-30 days relative to ACTB, indicating that at leastone of them is not a good housekeeping gene. Relative to RPS29, anapparent increase of lysosomal enzymes was observed on DM-30. Incontrast, no changes occurred in the expression of cathepsin Bwhen the expression was normalized by ACTB, while a significant de-crease in the relative expression of cathepsin L (10 days) andβ-glucuronidase (10 days and 30 days) occurred.
3.4. Activities of lysosomal enzymes
The kinetics of formation of fluorescent product from two differ-ent substrates – Z-FR-MCA and ε-NH2-caproyl-Cys(Bzl)-Cys(Bzl)-MCA – are shown in Fig. 3, either with or without inhibitors(PMSF, CA074 and E64). PMSF inhibits serine-proteases, E64 in-hibits cysteine-proteases, and CA074 inhibits only cathepsin B.
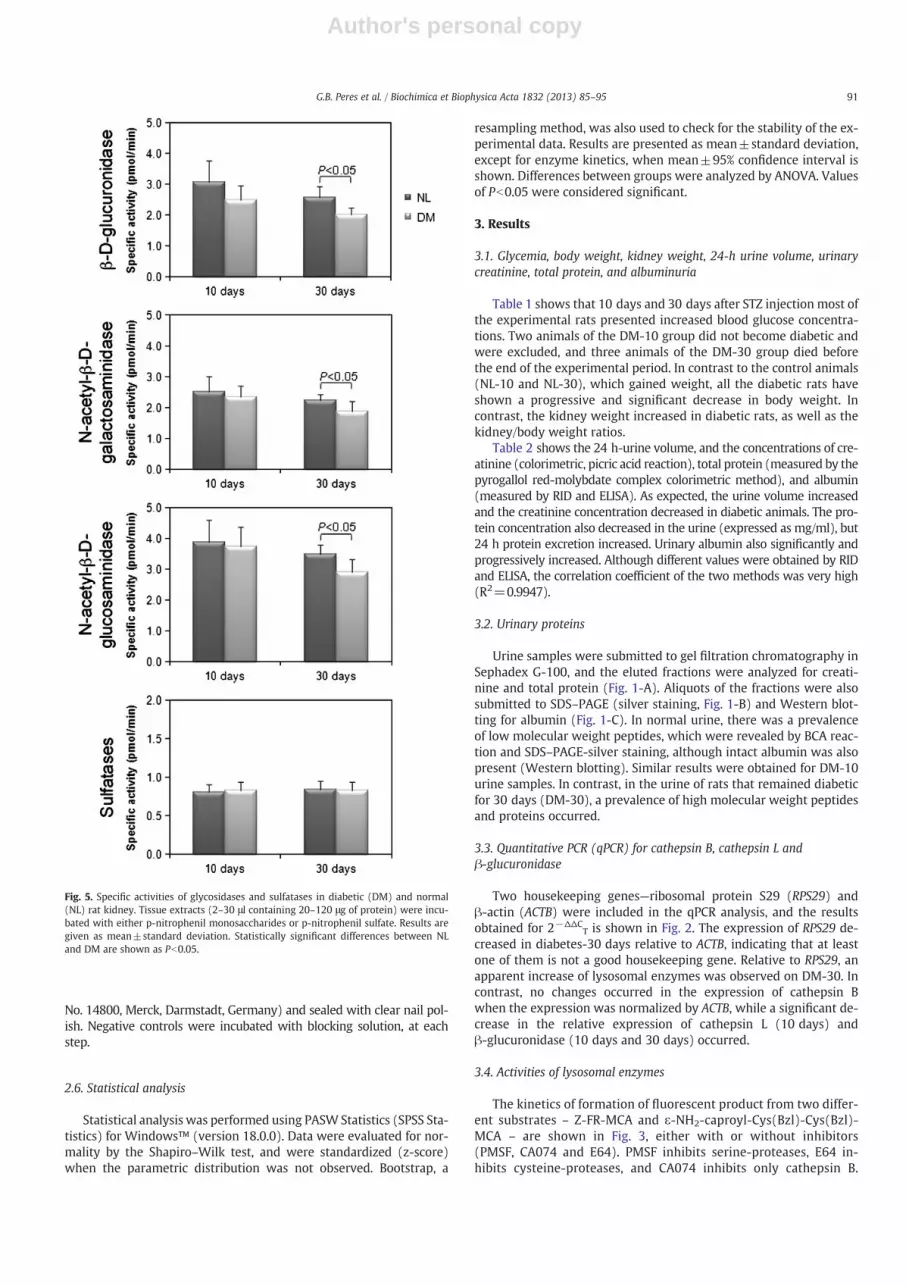
Fig. 5. Specific activities of glycosidases and sulfatases in diabetic (DM) and normal(NL) rat kidney. Tissue extracts (2–30 μl containing 20–120 μg of protein) were incu-bated with either p-nitrophenil monosaccharides or p-nitrophenil sulfate. Results aregiven as mean±standard deviation. Statistically significant differences between NLand DM are shown as Pb0.05.
91G.B. Peres et al. / Biochimica et Biophysica Acta 1832 (2013) 85–95

Author's personal copy
PMSF had no effect upon enzymatic activities on the substrates hereused, and no enzyme activities were detected in presence of E64, in-dicating that only cysteine-proteases were acting upon the sub-strates. Z-FR-MCA was substrate for cathepsin B and also othercysteine-proteases, while ε-NH2-caproyl-Cys(Bzl)-Cys(Bzl)-MCAwas substrate for cathepsin B only.
Fig. 4 shows that cathepsin B was the main cysteine protease pres-ent in rat kidney, both normal and diabetic. A decrease in cathepsin Bspecific activities occurred in diabetic kidneys, both on the 10th andon the 30th days. No changes were observed for other cysteine-proteases (resistant to CA074, Z-FR-MCA as substrate).
Concerning lysosomal glycosidases, a decrease in the specific activitieswas observed for β-D-glucuronidase, N-acetyl-β-D-glucosaminidase, andN-acetyl-β-D-galactosaminidase only on the 30th day of diabetes. In con-trast, the specific activities of aryl sulfatases did not vary (Fig. 5).
3.5. Histology of diabetic kidney
Fig. 6 shows that, in diabetic kidney, the tubular lumen was in-creased, both on the 10th and on the 30th days, with thinner wallsand increased stroma. The brush border of proximal convoluted tu-bules was also thinner, in comparison to normal controls.
Toluidine blue staining (Fig. 7) shows nucleus (blue) and proteo-glycans (metachromatic, purple). A higher intensity of metachromat-ic staining appeared in diabetic tubules, especially at the 30th day, incomparison to controls.
3.6. Western blotting and immunohistochemistry of cathepsin B
Fig. 8 shows that the expected bands of pro-cathepsin B (~40 kDa)and native cathepsin B (26 and 30 kDa) were detected by Western
Fig. 6. Optical microscopy of diabetic (DM) and normal (NL) rat kidneys. Tissue samples from normal and diabetic kidneys (10 days and 30 days of diabetes) were included in paraffin, cutin 4 μmsections, and stainedwithH&E. Lowmagnification images (bars=100 μm) show cortical region,with convoluted tubules andglomeruli. Arrow indicates stroma among convolutedtubules in DM cortex (30 days). Higher magnification images (bars=20 μm) of glomeruli and tubules are also shown.
92 G.B. Peres et al. / Biochimica et Biophysica Acta 1832 (2013) 85–95

Author's personal copy
blotting, indicating the antibody specificity. As a control, the Westernblotting of β-actin is also shown.
Immunohistochemistry for cathepsin B is shown in Fig. 9. Stronglabeling appeared in the brush border of proximal convoluted tubules,especially for diabetic kidney.
4. Discussion
The present paper reports decreased activities of lysosomal en-zymes on the 10th and the 30th days of DM. It also shows that, in con-trast to normal and early DM (10 days), on the 30th day of DM aprevalence of high molecular weight peptides and proteins appearedin the urine, indicating the excretion of less digested proteins.
Althoughmicroalbuminuria, which is considered the earliest man-ifestation of diabetic nephropathy, has been traditionally attributed to
changes in the glomerular permselectivity barrier, Comper et al. havepublished a series of papers suggesting that the glomerular filtrationbarrier is more leaky to albumin than previously accepted [27]. Itwas shown that, in normal kidney, albumin is internalized by endocy-tosis in proximal tubule cells, digested in lysosomes to low molecularweight fragments, and returned to the tubular lumen [28]. Our resultson urinary proteins and albumin are in agreement with this idea.
In 2001, using FITC-labeled albumin Tojo et al. have shown that, inthe early stages of diabetes mellitus (2 weeks), tubular reabsorptionof albumin was decreased in the proximal tubule of diabetic rats viaa decrease in endocytosis of albumin associated with decreased ex-pression of megalin [29]. Furthermore, it was shown that the degra-dation of reabsorbed proteins is inhibited in the proximal tubule ofdiabetes, via decreased cathepsin B and L activity in lysosomes [5,6].In 2003, it was shown that angiotensin II blockage restored albumin
Fig. 7. Optical microscopy of diabetic (DM) and normal (NL) rat kidney stained by toluidine blue. The experiment was performed as described in Fig. 6, except that the kidney sectionswere stained by toluidine blue. Arrows indicate metachromatic staining. Bars=20 μm.
Fig. 8. Representative Western blottings of cathepsin B and β-actin extracted from diabetic (DM) and normal (NL) rat kidney. Tissue extracts (3–5 μl containing 30 μg of protein) weresubmitted to SDS–PAGE (12% acrylamidewith 0.32% bisacrylamide for cathepsin B; 7.5% acrylamidewith 0.2% bisacrylamide for β-actin). Proteinswere transferred to nitrocellulosemem-branes for Western blottings probed with either rabbit polyclonal anti-cathepsin B or rabbit monoclonal anti-β-actin antibody. Specific bands were detected by secondary antibody(anti-rabbit IgG) conjugatedwith horseradish peroxidase (HRP) and ECL-chemiluminescent substrate. Images were obtainedwithMF-ChemiBIS gel documentation system. Each lane rep-resents a pool of four animals of each group.
93G.B. Peres et al. / Biochimica et Biophysica Acta 1832 (2013) 85–95

Author's personal copy
reabsorption by increasingmegalin expression in the early stages of di-abetes [30]. In 2011, the colocalization of cathepsin B and Alexa-bovineserum albumin (BSA) in proximal convoluted tubules of normal micewas reported [31]. The same authors have also shown that the intrinsiclysosomal protein Limp-2 (the murine homolog of human SCARB2)plays a role in the fusion of endosomes containing reabsorbed proteinsto lysosomes. The megalin/cubilin-dependent uptake of injectedAlexa-BSA in Limp-2-deficient mice was similar to normal, butAlexa-BSA persisted in proximal convoluted tubule, and did notcolocalize with cathepsin B [31]. Nevertheless, there is no evidence ofimpaired expression/function of SCARB2/Limp-2 in DM, suggestingthat the lower than normal protein digestion here reported is due to de-creased lysosomal enzyme activities (mainly cathepsin B) and/or de-creased megalin/cubilin-dependent protein uptake, not to decreasedendosome/lysosome fusion.
Additionally, decreased urinary excretion of GAGs occurred. Meta-chromatic staining of tubular cells by toluidine blue suggested build upof GAGs. The activities of all the lysosomal glycosidases here studied –
β-D-glucuronidase, N-acetyl-β-D-glucosaminidase, and N-acetyl-β-D-galactosaminidase – were decreased on the 30th day of DM. Althoughno changes in sulfatase activities were observed in our experimen-tal model, decreased sulfatases in DM isolated glomeruli havebeen previously reported [32]. Experimental evidences suggestthat sulfated polysaccharides are filtered and internalized by kidney
cells, although the receptor has not yet been characterized. In DM,due to a lower digestion rate, these compounds accumulate in thetissue (see references [10] for GAGs and [11] for dextran sulfate),possibly in proximal tubule cells as well.
We have previously reported that mesangial cells isolated from longterm diabetes mellitus (rats) synthesize and secrete increased amountsof dermatan sulfate proteoglycans, proportional to the time of disease[33]. These proteoglycans are supposed to be deposited in themesangialextracellular matrix. Now, we report an increase in tubular cell meta-chromatic staining. The decreased activity of lysosomal enzymes couldlead to intracellular accumulation of partially digested macromolecules(including proteoglycans), and these engorged endosomes could impairtubular cell function in many ways, including endocytosis, shedding ofreceptors, thinning of brush border, etc.
Concerning the expression of cathepsin B and β-glucuronidaseaccessed by qPCR, different results were obtained relative to thetwo reference genes here used. Relative to ACTB, the expression of ca-thepsin B did not vary and β-glucuronidase decreased in DM, whilerelative to RPS29, an apparent increase occurred on the 30th day(DM-30). Nevertheless, the expression of RPS29 decreased relativeto ACTB, indicating that at least one of them is not a good housekeep-ing gene. As Western blotting did not show any important increase(or decrease) in cathepsin B concentration (protein), and the enzymeactivities decreased in diabetic kidney, we considered ACTB as a better
Fig. 9. Immunohistochemistry of cathepsin B in diabetic (DM) and normal (NL) rat kidneys. Tissue sections were incubated with primary rabbit polyclonal anti-cathepsin B antibody.Anti-rabbit IgG conjugatedwith HRPwas used as secondary antibody, and nickel enhanced diaminobenzidine was used as HRP substrate. Tissues were counterstainedwith hematoxylinsolution (bars=20 μm).
94 G.B. Peres et al. / Biochimica et Biophysica Acta 1832 (2013) 85–95

Author's personal copy
reference gene. Other gene commonly used as reference is GAPDH(glyceraldehyde 3-phosphate dehydrogenase), but its expressionalso varies in diabetes [34,35], and could not be used.
The main morphological changes observed in kidney were proxi-mal convoluted tubules with thinner walls and thinner brush border.Immunohistochemistry staining has shown that most of the rat kid-ney cathepsin B occurred in proximal convoluted tubules. The strongstaining observed in diabetic tubules should be due to higher antigenconcentration due to brush border thinning. Nevertheless, an in-creased expression of cathepsin B on the 30th day is also possible, po-tentially trying to counteract the decreased activity, although noincrease has been observed in Western blotting (see Fig. 8).
Taken together, these results show that the decreased lysosomalprotease activities could explain, at least in part, the increased albumin-uria detected by RID, due to the excretion of less degraded albumin.
If the decrease in lysosomal enzymes here reported reflects a generallysosomal failure, it is possible that the lysosome-mediated autophagy,which has been recently recognized to play a renoprotective role underseveral conditions, could be deficient. This autophagy deficiency in dia-betic kidney couldmake tubular cells fragile under stress, possibly leadingto progression of diabetic nephropathy [15].
Acknowledgments
This research was supported by Fundação de Amparo à Pesquisa doEstado de São Paulo (FAPESP, grant nos. 2010/16022-5 and 2009/11817-2), São Paulo, SP, Brazil; Conselho Nacional de DesenvolvimentoCientífico e Tecnológico (CNPq, grant no. 308642/2010-4), Brasília, DF,Brazil; and Fundação Coordenação de Aperfeiçoamento de Pessoal deNível Superior (CAPES), Brasília, SP, Brazil. The authors want to expresstheir gratitude to Prof. Dr. Ivarne L.S. Tersariol for helpful discussion on ki-netics and specificity of cathepsin B, to Prof. Dr. Miriam GalvonasJasiulionis for her supportive assistance in the qPCR experiments, and toBSc. Rafael R. Patrício for assistance in perfusion experiments.
References
[1] A.N. Lasaridis, P.A. Sarafidis, Diabetic nephropathy and antihypertensive treatment:what are the lessons from clinical trials? Am. J. Hypertens. 16 (2003) 689–697.
[2] A.T. Reutens, R.C. Atkins, Epidemiology of diabetic nephropathy, Contrib. Nephrol.170 (2011) 1–7 (Epub 2011 Jun 9).
[3] R.E. Gilbert, M.E. Cooper, P.G. McNally, R.C. O'Brien, J. Taft, G. Jerums,Microalbuminuria: prognostic and therapeutic implications in diabetes mellitus,Diabet. Med. 11 (1994) 636–645.
[4] B.D. Myers, J.A. Winetz, F. Chui, A.S. Michaels, Mechanisms of proteinuria in dia-betic nephropathy: a study of glomerular barrier function, Kidney Int. 21(1982) 633–641.
[5] T.M. Osicka, S. Panagiotopoulos, G. Jerums, W.D. Comper, Fractional clearance ofalbumin is influenced by its degradation during renal passage, Clin. Sci. (Lond.)93 (1997) 557–564.
[6] T.M. Osicka, C.A. Houlihan, J.G. Chan, G. Jerums, W.D. Comper, Albuminuria in pa-tients with type 1 diabetes is directly linked to changes in the lysosome-mediateddegradation of albumin during renal passage, Diabetes 49 (2000) 1579–1584.
[7] L.M. Russo, R.M. Sandoval, S.B. Campos, B.A. Molitoris, W.D. Comper, D. Brown, Im-paired tubular uptake explains albuminuria in early diabetic nephropathy, J. Am.Soc. Nephrol. 20 (2009) 489–494.
[8] S. Amsellem, J. Gburek, G. Hamard, R. Nielsen, T.E. Willnow, O. Devuyst, E. Nexo, P.J.Verroust, E.I. Christensen, R. Kozyraki, Cubilin is essential for albumin reabsorptionin the renal proximal tubule, J. Am. Soc. Nephrol. 21 (2010) 1859–1867.
[9] K.M. Thrailkill, T. Nimmo, R.C. Bunn, G.E. Cockrell, C.S. Moreau, S. Mackintosh,R.D. Edmondson, J.L. Fowlkes, Microalbuminuria in type 1 diabetes is associat-ed with enhanced excretion of the endocytic multiligand receptors megalinand cubilin, Diabetes Care 32 (2009) 1266–1268.
[10] R.A. Cadaval, O. Kohlman, Y.M. Michelacci, Urinary excretion of glycosaminoglycansand albumin in experimental diabetes mellitus, Glycobiology 10 (2000) 185–192.
[11] C.R. de Lima, J.A. Aguiar, Y.M. Michelacci, Reduced urinary excretion of sulfatedpolysaccharides in diabetic rats, Biochim. Biophys. Acta 1741 (2005) 30–41(Epub 2004 Oct 19).
[12] Y.M. Michelacci, R.A.M. Cadaval, R.M. Rovigatti, O. Kohlman, Renal and urinaryglycosaminoglycans in an experimental model of chronic renal failure in rats,Exp. Nephrol. 9 (2001) 40–48.
[13] C.J. Olbricht, B. Geissinger, Renal hypertrophy in streptozotocin diabetic rats: roleof proteolytic lysosomal enzymes, Kidney Int. 41 (1992) 966–972.
[14] P. Shechter, R. Rabkin, Tubular cell protein degradation in early diabetic renal hy-pertrophy, J. Am. Soc. Nephrol. 4 (1994) 1582–1587.
[15] Y. Tanaka, S. Kume, M. Kitada, K. Kanasaki, T. Uzu, H. Maegawa, D. Koya, Autophagyas a therapeutic target in diabetic nephropathy, Exp. Diabetes Res. (2012) 1–12.
[16] J.F. Reckelhoff, V.L. Tygart, M.M. Mitias, S.L. Walcott, STZ-induced diabetes results indecreased activity of glomerular cathepsin and metalloprotease in rats, Diabetes 42(1993) 1425–1432.
[17] N. Watanabe, S. Kamei, A. Ohkubo, M. Yamanaka, S. Ohsawa, K. Makino, K.Tokuda, Urinary protein as measured with a pyrogallol red-molybdate complex,manually and in a Hitachi 726 automated analyser, Clin. Chem. 32 (1986)1551–1554.
[18] P.K. Smith, R.I. Krohn, G.T. Hermanson, A.K. Mallia, F.H. Gartner, M.D. Provenzano,E.K. Fujimoto, N.M. Goeke, B.J. Olson, D.C. Klenk, Measurement of protein usingbicinchoninic acid, Anal. Biochem. 150 (1985) 76–85.
[19] C.R. Merril, M. Bisher, M. Harrington, A.C. Steven, Coloration of silver-stained pro-tein bands in polyacrylamide gels is caused by light scattering from silver grainsof characteristic sizes, Proc. Natl. Acad. Sci. U. S. A. 75 (1988) 453–457.
[20] C.R. de Lima, J.A. Santos-Junior, A.C.P. Nazário, Y.M. Michelacci, Changes in glycos-aminoglycans and proteoglycans of normal breast and fibroadenoma during themenstrual cycle, Biochim. Biophys. Acta 1820 (2012) 1009–1019.
[21] J. Sambrook, D.W. Russel, Molecular Cloning: A Laboratory Manual, CSH LaboratoryPress, Cold Spring Harbor, NY, 2001.
[22] S. Fleigea, M.W. Pfaffl, RNA integrity and the effect on the real-time qRT-PCR per-formance, Mol. Aspects Med. 27 (2006) 126–139.
[23] K.J. Livak, T.D. Schmittgen, Analysis of relative gene expression data usingreal-time quantitative PCR and the 2(−Delta Delta C(T)) method, Methods 25(2001) 402–408.
[24] A. Laplante, D. Liu, M. Demeule, B. Annabi, G.F. Murphy, P. Daloze, H. Chen, R. Beliveau,Modulation of matrix gelatinases and metalloproteinase-activating process in acutekidney rejection, Transpl. Int. 16 (2003) 262–269.
[25] L.C. Alves, P.C. Almeida, L. Franzoni, L. Juliano, M.A. Juliano, Synthesis of Nalpha-protected aminoacyl 7-amino-4-methyl-coumarin amide by phosphorousoxychloride and preparation of specific fluorogenic substrates for papain, Pept.Res. 9 (1996) 92–96.
[26] D. Robertson, K. Savage, J.S. Reis-Filho, C.M. Isacke, Multiple immunofluorescencelabelling of formalin-fixed paraffin-embedded (FFPE) tissue, BMC Cell Biol. 9(2008) 13–23.
[27] W.D. Comper, L.M. Russo, The glomerular filter: an imperfect barrier is requiredfor perfect renal function, Curr. Opin. Nephrol. Hypertens. 18 (2009) 336–342.
[28] A.B. Maunsbach, Absorption of 125I-labeled homologous albumin by rat kidneyproximal tubule cells. A study of microperfused single proximal tubules by electronmicroscopic autoradiography and histochemistry, J. Am. Soc. Nephrol. 8 (1997)323–351.
[29] A. Tojo, M.L. Onozato, H. Ha, H. Kurihara, T. Sakai, A. Goto, T. Fujita, H. Endou, Re-duced albumin reabsorption in the proximal tubule of early-stage diabetic rats,Histochem. Cell Biol. 116 (2001) 269–276.
[30] A. Tojo, M.L. Onozato, H. Kurihara, T. Sakai, A. Goto, T. Fujita, Angiotensin II block-ade restores albumin reabsorption in the proximal tubules of diabetic rats,Hypertens. Res. 26 (2003) 413–419.
[31] H.J. Desmond, D. Lee, S.A. Fraser, M. Katerelos, K. Gleich, P. Martinello, Y.Q. Li, M.C.Thomas, R. Michelucci, A.J. Cole, P. Saftig, M. Schwake, D. Stapleton, S.F. Berkovic,D.A. Power, Tubular proteinuria inmice and humans lacking the intrinsic lysosom-al protein SCARB2/Limp-2, Am. J. Physiol. Renal Physiol. 300 (2011) F1437–F1447.
[32] M.J. Burne, Y. Adal, N. Cohen, S. Panagiotopoulos, G. Jerumns, W.D. Comper,Anomalous decrease in dextran sulfate clearance in the diabetic rat kidney, Am.J. Physiol. 274 (1998) F700–F708.
[33] S.J. Hadad, Y.M. Michelacci, N. Schor, Proteoglycans and glycosaminoglycans synthe-sized in vitro by mesangial cells from normal and diabetic rats, Biochim. Biophys.Acta 1290 (1996) 18–28.
[34] V. Catalán, J. Gómez-Ambrosi, F. Rotellar, C. Silva, A. Rodríguez, J. Salvador, M.J. Gil,J.A. Cienfuegos, G. Frühbeck, Validation of endogenous control genes in human ad-ipose tissue: relevance to obesity and obesity-associated type 2 diabetes mellitus,Horm. Metab. Res. 39 (2007) 495–500.
[35] M. Meller, S. Vadachkoria, D.A. Luthy, M.A. Williams, Evaluation of housekeep-ing genes in placental comparative expression studies, Placenta 26 (2005)601–607.
95G.B. Peres et al. / Biochimica et Biophysica Acta 1832 (2013) 85–95