Enzymes/non-enzymes classification model complexity based on composition, sequence, 3D and...
7
Enzymes/non-enzymes classification model complexity based on composition, sequence, 3D and topological indices Cristian Robert Munteanu a , Humberto Gonza ´ lez-Dı ´az b, , Alexandre L. Magalha ˜es a a REQUIMTE/Faculty of Science, Chemistry Department, University of Porto, Porto 4169-007, Portugal b Department of Microbiology and Parasitology, Faculty of Pharmacy, University of Santiago de Compostela, Santiago de Compostela 15782, Spain article info Article history: Received 15 March 2008 Received in revised form 15 May 2008 Accepted 6 June 2008 Available online 14 June 2008 Keywords: Protein models Protein secondary structures Star Graph Python application abstract The huge amount of new proteins that need a fast enzymatic activity characterization creates demands of protein QSAR theoretical models. The protein parameters that can be used for an enzyme/ non-enzyme classification includes the simpler indices such as composition, sequence and connectivity, also called topological indices (TIs) and the computationally expensive 3D descriptors. A comparison of the 3D versus lower dimension indices has not been reported with respect to the power of discrimination of proteins according to enzyme action. A set of 966 proteins (enzymes and non- enzymes) whose structural characteristics are provided by PDB/DSSP files was analyzed with Python/ Biopython scripts, STATISTICA and Weka. The list of indices includes, but it is not restricted to pure composition indices (residue fractions), DSSP secondary structure protein composition and 3D indices (surface and access). We also used mixed indices such as composition-sequence indices (Chou’s pseudo- amino acid compositions or coupling numbers), 3D-composition (surface fractions) and DSSP secondary structure amino acid composition/propensities (obtained with our Prot-2S Web tool). In addition, we extend and test for the first time several classic TIs for the Randic’s protein sequence Star graphs using our Sequence to Star Graph (S2SG) Python application. All the indices were processed with general discriminant analysis models (GDA), neural networks (NN) and machine learning (ML) methods and the results are presented versus complexity, average of Shannon’s information entropy (Sh) and data/ method type. This study compares for the first time all these classes of indices to assess the ratios between model accuracy and indices/model complexity in enzyme/non-enzyme discrimination. The use of different methods and complexity of data shows that one cannot establish a direct relation between the complexity and the accuracy of the model. & 2008 Elsevier Ltd. All rights reserved. 1. Introduction The fast growing amount of molecular biology data available creates necessity of fast computational chemistry methods to predict accurately protein properties. One of the most widely used methods is the quantitative structure activity relationship (QSAR) that already has more than 1600 molecular descriptors (Devillers and Balaban, 1999; Karelson, 2000), most of all used for small molecules. At the same time, the number of DNA and protein QSAR studies is increasing (Agrawal et al., 2005; Arteca and Tapia, 1999; Hua and Sun, 2001; Randic and Balaban, 2003) by the creation of new macromolecular descriptors named topological indices (TIs) using graph theory. The branch of mathematical chemistry dedicated to encode the DNA/protein information in graph representations by the use of TIs has become an intense research area with interesting works of Liao (Liao and Ding, 2005; Liao and Wang, 2004a, b; Liao et al., 2006), Randic, Nandy, Balaban, Basak and Vracko (Randic and Balaban, 2003; Randic, 2000; Randic and Basak, 2001; Randic et al., 2000) or our group (Aguero-Chapin et al., 2006). In addition, the computational approaches and theoretical analyses, such as structural bioinformatics (Chou, 2004a, b), network approach (Chou et al., 2006a, b; Chou and Cai, 2006; Gonza ´ lez-Dı ´az et al., 2008), molecular docking (Chou et al., 2003; Gao et al., 2007; Li et al., 2007; Zhang et al., 2006; Wang et al., 2008; Zheng et al., 2007), pharmacophore modeling (Chou et al., 2006a, b; Sirois et al., 2004), protein cleavage site prediction (Chou, 1993, 1996; Du et al., 2005a, b), QSAR (Du et al., 2005a, b, 2008; Gonzalez-Diaz et al., 2006a, b, c) and graphical operations (Althaus et al., 1993a, b; Andraos, 2008; Chou, 1989, 1990; Chou et al., 1994; Gonza ´ lez-Dı ´az et al., 2008), are providing very useful information and insights for drug design during the course of drug development. ARTICLE IN PRESS Contents lists available at ScienceDirect journal homepage: www.elsevier.com/locate/yjtbi Journal of Theoretical Biology 0022-5193/$ - see front matter & 2008 Elsevier Ltd. All rights reserved. doi:10.1016/j.jtbi.2008.06.003 Corresponding author. Tel.: +34981563100; fax: +34981594912. E-mail addresses: [email protected] (C.R. Munteanu), [email protected] (H. Gonza ´ lez-Dı ´az), [email protected] (A.L. Magalha ˜es). Journal of Theoretical Biology 254 (2008) 476– 482
Transcript of Enzymes/non-enzymes classification model complexity based on composition, sequence, 3D and...

ARTICLE IN PRESS
Journal of Theoretical Biology 254 (2008) 476– 482
Contents lists available at ScienceDirect
Journal of Theoretical Biology
0022-51
doi:10.1
� Corr
E-m
humber
journal homepage: www.elsevier.com/locate/yjtbi
Enzymes/non-enzymes classification model complexity based oncomposition, sequence, 3D and topological indices
Cristian Robert Munteanu a, Humberto Gonzalez-Dıaz b,�, Alexandre L. Magalhaes a
a REQUIMTE/Faculty of Science, Chemistry Department, University of Porto, Porto 4169-007, Portugalb Department of Microbiology and Parasitology, Faculty of Pharmacy, University of Santiago de Compostela, Santiago de Compostela 15782, Spain
a r t i c l e i n f o
Article history:
Received 15 March 2008
Received in revised form
15 May 2008
Accepted 6 June 2008Available online 14 June 2008
Keywords:
Protein models
Protein secondary structures
Star Graph
Python application
93/$ - see front matter & 2008 Elsevier Ltd. A
016/j.jtbi.2008.06.003
esponding author. Tel.: +34 981563100; fax:
ail addresses: [email protected] (C.R. Munt
[email protected] (H. Gonzalez-Dıaz), almagal
a b s t r a c t
The huge amount of new proteins that need a fast enzymatic activity characterization creates demands
of protein QSAR theoretical models. The protein parameters that can be used for an enzyme/
non-enzyme classification includes the simpler indices such as composition, sequence and connectivity,
also called topological indices (TIs) and the computationally expensive 3D descriptors. A comparison of
the 3D versus lower dimension indices has not been reported with respect to the power of
discrimination of proteins according to enzyme action. A set of 966 proteins (enzymes and non-
enzymes) whose structural characteristics are provided by PDB/DSSP files was analyzed with Python/
Biopython scripts, STATISTICA and Weka. The list of indices includes, but it is not restricted to pure
composition indices (residue fractions), DSSP secondary structure protein composition and 3D indices
(surface and access). We also used mixed indices such as composition-sequence indices (Chou’s pseudo-
amino acid compositions or coupling numbers), 3D-composition (surface fractions) and DSSP secondary
structure amino acid composition/propensities (obtained with our Prot-2S Web tool). In addition, we
extend and test for the first time several classic TIs for the Randic’s protein sequence Star graphs using
our Sequence to Star Graph (S2SG) Python application. All the indices were processed with general
discriminant analysis models (GDA), neural networks (NN) and machine learning (ML) methods and the
results are presented versus complexity, average of Shannon’s information entropy (Sh) and data/
method type. This study compares for the first time all these classes of indices to assess the ratios
between model accuracy and indices/model complexity in enzyme/non-enzyme discrimination. The use
of different methods and complexity of data shows that one cannot establish a direct relation between
the complexity and the accuracy of the model.
& 2008 Elsevier Ltd. All rights reserved.
1. Introduction
The fast growing amount of molecular biology data availablecreates necessity of fast computational chemistry methods topredict accurately protein properties. One of the most widelyused methods is the quantitative structure activity relationship(QSAR) that already has more than 1600 molecular descriptors(Devillers and Balaban, 1999; Karelson, 2000), most of all usedfor small molecules. At the same time, the number of DNAand protein QSAR studies is increasing (Agrawal et al., 2005;Arteca and Tapia, 1999; Hua and Sun, 2001; Randic and Balaban,2003) by the creation of new macromolecular descriptorsnamed topological indices (TIs) using graph theory. Thebranch of mathematical chemistry dedicated to encode the
ll rights reserved.
+34 981594912.
eanu),
[email protected] (A.L. Magalhaes).
DNA/protein information in graph representations by the use ofTIs has become an intense research area with interestingworks of Liao (Liao and Ding, 2005; Liao and Wang, 2004a, b;Liao et al., 2006), Randic, Nandy, Balaban, Basak and Vracko(Randic and Balaban, 2003; Randic, 2000; Randic and Basak,2001; Randic et al., 2000) or our group (Aguero-Chapin et al.,2006). In addition, the computational approaches and theoreticalanalyses, such as structural bioinformatics (Chou, 2004a, b),network approach (Chou et al., 2006a, b; Chou and Cai, 2006;Gonzalez-Dıaz et al., 2008), molecular docking (Chou et al., 2003;Gao et al., 2007; Li et al., 2007; Zhang et al., 2006; Wang et al.,2008; Zheng et al., 2007), pharmacophore modeling (Chou et al.,2006a, b; Sirois et al., 2004), protein cleavage site prediction(Chou, 1993, 1996; Du et al., 2005a, b), QSAR (Du et al., 2005a, b,2008; Gonzalez-Diaz et al., 2006a, b, c) and graphical operations(Althaus et al., 1993a, b; Andraos, 2008; Chou, 1989, 1990; Chouet al., 1994; Gonzalez-Dıaz et al., 2008), are providing very usefulinformation and insights for drug design during the course of drugdevelopment.

ARTICLE IN PRESS
C.R. Munteanu et al. / Journal of Theoretical Biology 254 (2008) 476–482 477
Several papers are proposing methods to identify the proteinsas enzymes or non-enzymes, as well as the enzyme family class(Bate and Warwicker, 2004; Cai and Chou, 2005a, b; Cai et al.,2005; Chou, 2005; Chou and Elrod, 2003; Chou and Cai, 2004a, b;Dobson and Doig, 2003, 2005; Shen and Chou, 2008). Shen andChou (2007) presented the web-server called ‘‘EzyPred’’. This toolis a three-layer predictor where the first layer is identifying aprotein as enzyme or non-enzyme, the second layer evaluates themain functional class and the third layer is predicting the subfunctional class.
In the present work, we used protein structural parametersincluding composition, sequence, connectivity and 3D descriptorsin order to study the complexity of the enzyme/non-enzymeclassification model. Composition, sequence and connectivityparameters (Star Graph’s Tis, Randic et al., 2007) are simpler than3D parameters but they are less computationally expensive.However, TIs ignore important aspects of protein spatial structureand hence are expected to be inaccurate. In any case, a comparisonof 3D versus lower dimension indices has not been reported withrespect to the power of discrimination of proteins according toenzyme action. One of the most frequently used TIs are theWiener’s, Balaban’s, Connectivity, and others indices (Todeschiniand Consonni, 2000). In this study, we combine both 3DIs andStar Graph’s TIs in order to build models to assess the ratiosbetween model accuracy and indices/model complexity inenzyme/non-enzyme discrimination.
Table 1
2. Materials and methods
2.1. Protein set
This work is based on a sample of 996 proteins used in aprevious study by Dobson and Doig (2005), from which 498 areenzymes and 498 are non-enzymes. Dobson and Doig constructedthe dataset using function definitions obtained from DBGet(Fujibuchi et al., 1997) PDB Enzyme (Bairoch, 2000) cross-linksand structural relations from the Astral SCOP 1.63 superfamilylevel dataset (Brenner et al., 2000; Chandonia et al., 2002). Theyhave been estimated that 5–10% of proteins are orphans (nohomologues), 10% have only one homolog, and 30% belong tofamilies with less than 10 members (see details in Dobson andDoig, 2005).
The PDB files are downloaded with Python scripts from thePDB data bank (Berman et al., 2000). The DSSP files were obtainedfrom the PDB files using the DSSP application (Kabsch and Sander,1983). The length of the sequences is up to 1014, with an averageof 217 amino acids (AA), and the species origin is not specified.
Composition attributes
Attribute No. of attributes
Total residues number 1
Total surface 1
2S count 8+3 (2S grouped) ¼ 24
2S concentration 8+3 (2S grouped) ¼ 24
2S fractions 4
AA surface 21
AA concentration 21
AA propensity in 2S 21 (AA)�8 (2S) ¼ 168
21 (AA)�3 (2S grouped) ¼ 63
AA polarity concentration 5
AA polarity propensity in 2S 5 (polarities)�8 (2S) ¼ 40
HSE 21
CNb 21
Pseudo-composition 420
Total attributes 834
2.2. Composition and access attributes
This group includes 11 types of attributes: nine obtained withour Python code/Prot-2S Web Tool (http://www.requimte.pt:8080/Prot-2S/), one with Biopython and one with the pseudo-composition web interface (Shen and Chou, 2008). The concept ofpseudo AA composition was used for the first time to predict theprotein cellular attributes by Chou (Chou, 2001).
In the first step, the PDB files are transformed in DSSP filesfrom which specialized functions extract basic data such as AAsequences, secondary structure sequences and AA accessibilitysurfaces. In the second step, other Python functions extract ninetypes of attributes such as protein residue number, total and AAsurfaces, secondary structure (2S) count/concentration, AA con-centration/propensities in 2S motifs and AA polarity concentra-tion/propensities in 2S motifs. The AA set includes the 20 classical
ones plus X, which often appears in PDB files and means a non-defined residue in the sequence. The polarity code is the standardone: hydrophobic/non-polar residues (H) ¼ A, C, F, I, L, M, P, V;negative (N) ¼ D, E; positive (P) ¼ H, K, R; uncharged/polarresidues/hydrophilic (U) ¼ G, N, Q, S, T, W, Y; not known (*) ¼ X.
The eight 2S motifs are classified according to the DSSPnotation (Kabsch and Sander, 1983): H for a-helices, G for 3–10helices, I for p-helices, T for turns, E for b-sheets, B for isolatedb-sheets, S for bend (curved coils) and C for random coils.
These classes can be used as they are defined or can be groupedin helices (HGI), sheets (EB) and coils (SC), as fractions (helices/coils, sheets/helices, sheets/coils), and as a new fraction betweenthe 2S motifs that contain hydrogen bonds and the rest withoutthese interactions. The attributes are presented as countingnumbers, percents and fractions.
Biopython function used the PDB files in order to calculate thehalf sphere exposure (HSE) and beta coordination numbers (CNb).The pseudo-composition input was prepared with couple ofPython routines that download all the FASTA files in one singlefile. The calculations are made with the Liu’s web interface (Shenand Chou, 2008), using the ‘‘dipeptide-composition’’ option andthe chain results are averaged. A detailed list of the attributes canbe found in Table 1.
2.3. Topological indices
In addition, we used connectivity indexes that are extensivelyused in QSAR (Abou-Shaaban et al., 1996; Luco and Ferretti, 1997;Gramatica et al., 2001; Ren, 2002; Bruno-Blanch et al., 2003;Gonzalez et al., 2005a, b). The protein chain sequences aretransformed in Star Graph representations (Randic et al., 2007)and several TIs are calculated. All these operations are done withour own Python application called Sequence to Star Graph (S2SG)Python application (Numeric as matrix support). There areversions for Windows/Linux operating systems and for single/batch calculations. This is an interactive tool where the user canchoose the level of calculations such as embedded graph,additional weights for each AA, Markov normalization, power ofthe matrix connectivity, the input files (files with sequences,groups and weights), the output files and the level of details(files for summary and detailed results). The input sequence filecontains PDB name, chain letter and the chain sequence. Thegroup file has one line for each group of AA; for instance, in theexample presented here one group for each AA type. The weightscan be read from a file with two columns: one with the AA nameand the other with the values of the weights. These values can be
ARTICLE IN PRESS
C.R. Munteanu et al. / Journal of Theoretical Biology 254 (2008) 476–482478
any AA property and in our calculations, we used the 2S AApropensities values resulted from our set of proteins. The fieldseparator is the TAB character in all the files. The summary filecontains the following TIs:
�
The trace of the n connectivity matrices (Trn):Trn ¼X
i
ðMnÞii, (1)
where n ¼ 0, y, power, M is the connectivity matrix (i� i
dimension); ii is the ith diagonal element;
� Harary number (H):H ¼1
2�X
ij
mij
dij
� ��wnw
j , (2)
where dij are the elements of the distance matrix, mij are theelements of the M connectivity matrix, wj are the weightelements, nw can be Eq. (1) for selection or (0) for no selectionof weights calculations;
� Wiener index (W):W ¼1
2�X
ij
dij �wnwj , (3)
�
Gutman topological index (S6):S6 ¼X
ij
degi � degj �wnw
j
dij, (4)
where degi are the elements of the degree matrix;
� Schultz topological index (non-trivial part) (S):S ¼1
2�X
ij
ðdegi þ degjÞ � dij �wnwj , (5)
�
Moreau–Broto, autocorrelation of topological structure (ATSn ,n ¼ 1, y, power); only with weights included:ATSn ¼X
ij
dpnij �wi �wj, (6)
where dpnij are the elements of the pair distance matrix when
the distance is n ;
� A modified Balaban distance connectivity index (Jmodif):Jmodif ¼ ðnodesþ 1Þ �X
ij
mij
Xk
dik �X
k
dkj �wnwj , (7)
where nodes+1 ¼ AA numbers/node number in the StarGraph+origin, Skdik ¼ node distance degree;
Table 2
�Data scale complexity
Data SC
Kier–Hall connectivity index (0X):
0X ¼X
i
wnwiffiffiffiffiffiffiffiffiffi
degi
p , (8)
Composition 0.0
� Composition and weight 0.2Sequence, no weight 0.4
Sequence and weight 0.6
2S without X-ray info 0.8
Sequence and 2S weight 1.0
3D info 1.2
Table 3Data scale complexity
Method MC
GDA 1
NN 2
ML 3
Randic connectivity index (1X):
1X ¼X
ij
mij �wnw
jffiffiffiffiffiffiffiffiffiffiffiffiffiffiffiffiffiffiffiffiffiffiffiffidegi � degj
q . (9)
In addition, the detailed output file contains the groupslist (g), matrix connectivity (M) that is modified if the graph isembedded, matrix weights (Mw) where the values are only indiagonal, list of matrices to n power (Mn), list of normalized Mn
(MpN), distance matrix (d), degree matrix (deg), pair distancesmatrix (dp). The matrix connectivity contains the embeddedinformation too.
An Excel database is then constructed using results from theS2SG summary files, Python/Biopython scripts for composition/access and pseudo-potentials Web server. During the next step,we use several methods in order to test different models forenzyme/non-enzyme property of the present protein set.
2.4. Statistical analysis
We tested the main actual QSAR methods used for classifica-tion problems such as statistical General Discriminant Analysis(GDA; Kowalski and Wold, 1982; Van Waterbeemd, 1995.),neural networks (NN; Diederich, 1990) and machine learning(ML). The first two methods were carried out with the packageSTATISTICA 6.0 (StatSoft.Inc., 2002) and the last with Weka 3.4(Frank, 2005). In order to decide if a protein is classified asenzyme or non-enzyme, we added an extra dummy variable(EnzOrNot; 1 for enzymes and 0 for non-enzymes) and a cross-validation variable (CV). In statistical prediction, the followingthree cross-validation methods are often used to examinea predictor for its effectiveness in practical application: indepen-dent dataset test, subsampling test, and jackknife test (Chouand Zhang, 1995). However, as demonstrated in (Chou andShen, 2007) through a crystal clear analysis, only the jackknifetest has the least arbitrariness. A brief yet convincing eluci-dation in this regard was also given in (Chou and Shen, 2008).Therefore, the jackknife test has been increasingly used byinvestigators to examine the accuracy of various predictors(see Chou and Shen, 2008 and the references cited therein). Inthe actual work, the independent data test is used by splitting thedata at random in a training series (train) used for modelconstruction, a prediction one (val) for model validationand a model selection group (sel; only for Machine Learning).The CV column is filled by repeating three train, 1 val and 1 selvalues. All independent variables are standardized prior to modelconstruction. The quality of the analysis was determined byexamining the training, cross-validation and selection-fittingdecisions. In addition, we calculated other variables such are thefollowings combined complexity (CC) and average of Shannon’sentropy (Sh).
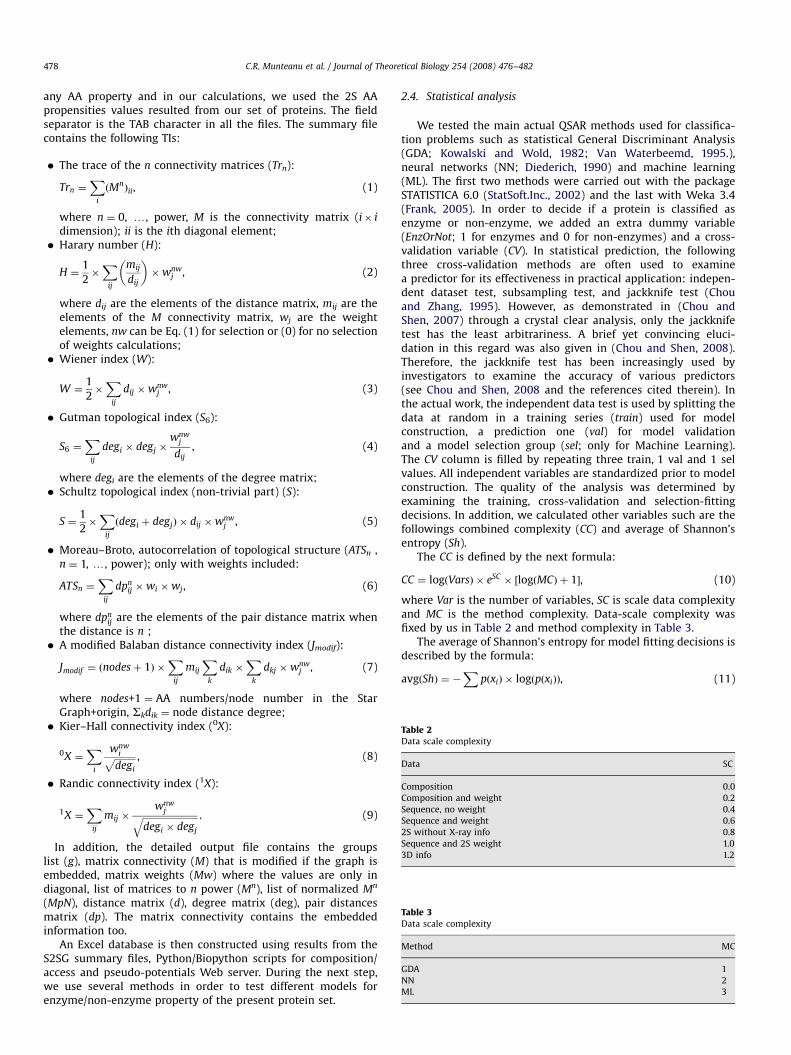
The CC is defined by the next formula:
CC ¼ logðVarsÞ � eSC � ½logðMCÞ þ 1�, (10)
where Var is the number of variables, SC is scale data complexityand MC is the method complexity. Data-scale complexity wasfixed by us in Table 2 and method complexity in Table 3.
The average of Shannon’s entropy for model fitting decisions isdescribed by the formula:
avgðShÞ ¼ �X
pðxiÞ � logðpðxiÞÞ, (11)

ARTICLE IN PRESS
Fig. 1. Detailed model accuracy for data type:method.
Fig. 2. Model accuracy versus empirical combined complexity.
C.R. Munteanu et al. / Journal of Theoretical Biology 254 (2008) 476–482 479
ARTICLE IN PRESS
C.R. Munteanu et al. / Journal of Theoretical Biology 254 (2008) 476–482480
where
pðxiÞ ¼zðxiÞP
xj, (12)
zðxiÞ ¼xik þ avgðxiÞ
sdðxiÞ
� �þminðxiÞ þ 1, (13)
p(xi) is the probability for a given fitting decision, z(xi) is thestandardization score for variable and sd(xi) is the standarddeviation of xi.
Xi is the SC-scale data complexity; Var is the variables; Coef isthe final equation coefficients; Tree the tree dimension; Leaves isthe number of leaves and Rules is the number of rules.
The following notation was used in the results presentedin the graphics: SG ¼ Star Graph; 2S ¼ secondary structure;SG-noW ¼ SG without 2S weight; SG-W ¼ SG with 2S weight;SG-ALL ¼ SG-noW+SG-W; Comp ¼ composition; Pse ¼ pseudo-amino acid composition; Access ¼ accessibility (ACC, HSE);NoSG ¼ Comp+Pse+2S+Access; ALL ¼ SG-ALL+NoSG.
The following classifiers were tested:
�
GDA: forward, backward and best subset; � NN: linear, multi-layer perception (MLP), probabilistic neuralnetwork (PNN), generalized regression neural network(GRNN), radial basis functions (RBF);
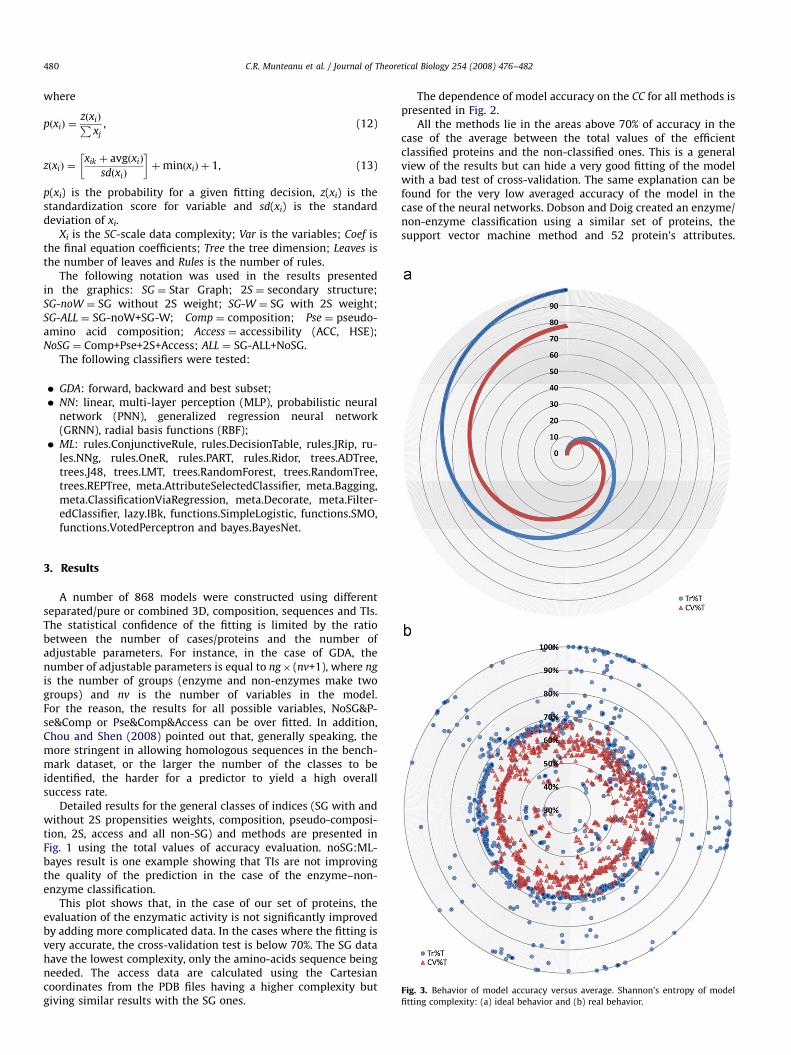
�Fig. 3. Behavior of model accuracy versus average. Shannon’s entropy of model
fitting complexity: (a) ideal behavior and (b) real behavior.
ML: rules.ConjunctiveRule, rules.DecisionTable, rules.JRip, ru-les.NNg, rules.OneR, rules.PART, rules.Ridor, trees.ADTree,trees.J48, trees.LMT, trees.RandomForest, trees.RandomTree,trees.REPTree, meta.AttributeSelectedClassifier, meta.Bagging,meta.ClassificationViaRegression, meta.Decorate, meta.Filter-edClassifier, lazy.IBk, functions.SimpleLogistic, functions.SMO,functions.VotedPerceptron and bayes.BayesNet.
3. Results
A number of 868 models were constructed using differentseparated/pure or combined 3D, composition, sequences and TIs.The statistical confidence of the fitting is limited by the ratiobetween the number of cases/proteins and the number ofadjustable parameters. For instance, in the case of GDA, thenumber of adjustable parameters is equal to ng� (nv+1), where ng
is the number of groups (enzyme and non-enzymes make twogroups) and nv is the number of variables in the model.For the reason, the results for all possible variables, NoSG&P-se&Comp or Pse&Comp&Access can be over fitted. In addition,Chou and Shen (2008) pointed out that, generally speaking, themore stringent in allowing homologous sequences in the bench-mark dataset, or the larger the number of the classes to beidentified, the harder for a predictor to yield a high overallsuccess rate.
Detailed results for the general classes of indices (SG with andwithout 2S propensities weights, composition, pseudo-composi-tion, 2S, access and all non-SG) and methods are presented inFig. 1 using the total values of accuracy evaluation. noSG:ML-bayes result is one example showing that TIs are not improvingthe quality of the prediction in the case of the enzyme–non-enzyme classification.
This plot shows that, in the case of our set of proteins, theevaluation of the enzymatic activity is not significantly improvedby adding more complicated data. In the cases where the fitting isvery accurate, the cross-validation test is below 70%. The SG datahave the lowest complexity, only the amino-acids sequence beingneeded. The access data are calculated using the Cartesiancoordinates from the PDB files having a higher complexity butgiving similar results with the SG ones.
The dependence of model accuracy on the CC for all methods ispresented in Fig. 2.
All the methods lie in the areas above 70% of accuracy in thecase of the average between the total values of the efficientclassified proteins and the non-classified ones. This is a generalview of the results but can hide a very good fitting of the modelwith a bad test of cross-validation. The same explanation can befound for the very low averaged accuracy of the model in thecase of the neural networks. Dobson and Doig created an enzyme/non-enzyme classification using a similar set of proteins, thesupport vector machine method and 52 protein’s attributes.

ARTICLE IN PRESS
C.R. Munteanu et al. / Journal of Theoretical Biology 254 (2008) 476–482 481
They obtained a classification of 76.17% using 20% leave out(Dobson and Doig, 2003).
The real and ideal behaviors of the model accuracy for theaverage Shannon’s entropy are compared in Fig. 3.
The ideal behavior (Fig. 3a) draws a spiral that starts from theless complex models and increase directly with the increasing ofthe complexity. In contrast, the real results (Fig. 3b) show that theideal pattern is far from the reality for our enzyme/non-enzymemodels and our particular sample used in the increasing of thepower of the method did not increase automatically the accuracyof the model.
4. Discussion
This study compares for the first time all these classes ofindices to assess the ratios between model accuracy and indices/model complexity in enzyme/non-enzyme discrimination.
The use of several statistic/ML methods and different complex-ity of data shows that one cannot establish a direct relationbetween the complexity and the accuracy of the model.
The calculation of these 3DIs presumes the knowledge of 3Dstructure and may become a time-consuming calculation task forlarge protein databases (Estrada et al., 2004; Estrada, 2003). As aconsequence, we investigated the ability of composition, se-quences and TIs to evaluate the enzymatic propriety of the newproteins. The simplest family of descriptors, the TIs, shows thatone can encode in some way the protein 3D structure relatedinformation and this can be a fast alternative to the not significantmore accurate, but more complex and higher time-consuming 3Dmodel. It is a fact that almost all TIs can be derived by similarvector–matrix–vector multiplication of different matrices andcontain essentially connectivity information (Estrada, 2001;Gonzalez-Diaz et al., 2005c).
In conclusion, the actual work shows that increasing thecomplexity of the data or method does not always imply a signi-ficant improvement in the accuracy of the enzyme/non-enzymesmodel. These results suggest the use of simplest data and the GDAfastest methods for modeling.
Acknowledgments
Cristian R. Munteanu thanks the FCT (Portugal) for supportfrom grant SFRH/BPD/24997/2005. Gonzalez-Dıaz Humbertoacknowledges an Isidro Parga Pondal research contract supportedby Xunta de Galicia, University of Santiago de Compostela (Spain)and FSE (Fondo Social Europeo).
References
Abou-Shaaban, R.R., Khamees, H.A., Abou-Auda, H.S., Simonelli, A.P., 1996. Atomlevel electrotopological state indexes in QSAR: designing and testing anti-thyroid agents. Pharm. Res. 13, 129–136.
Agrawal, V.K., Banerji, M., Gupta, M., Singh, J., Khadikar, P.V., Supuran, C.T., 2005.QSAR study on carbonic anhydrase inhibitors: water-soluble sulfonamidesincorporating b-alanyl moieties, possessing long lasting–intra ocular pressurelowering properties—a molecular connectivity approach. Eur. J. Med. Chem. 40(10), 1002–1012.
Aguero-Chapin, G., Gonzalez-Diaz, H., Molina, R., Varona-Santos, J., Uriarte, E.,Gonzalez-Diaz, Y., 2006. Novel 2D maps and coupling numbers for proteinsequences. The first QSAR study of polygalacturonases; isolation and predic-tion of a novel sequence from Psidium guajava L. FEBS Lett. 580 (3), 723–730.
Althaus, I.W., Chou, J.J., Gonzales, A.J., Diebel, M.R., Chou, K.C., Kezdy, F.J., Romero,D.L., Aristoff, P.A., Tarpley, W.G., Reusser, F., 1993a. Steady-state kinetic studieswith the non-nucleoside HIV-1 reverse transcriptase inhibitor U-87201E. J.Biol. Chem. 268, 6119–6124.
Althaus, I.W., Gonzales, A.J., Chou, J.J., Diebel, M.R., Chou, K.C., Kezdy, F.J., Romero,D.L., Aristoff, P.A., Tarpley, W.G., Reusser, F., 1993b. The quinoline U-78036 is a
potent inhibitor of HIV-1 reverse transcriptase. J. Biol. Chem. 268,14875–14880.
Andraos, J., 2008. Kinetic plasticity and the determination of product ratios forkinetic schemes leading to multiple products without rate laws: new methodsbased on directed graphs. Can. J. Chem. 86, 342–357.
Arteca, G.A., Tapia, O.J., 1999. Characterization of fold diversity among proteinswith the same number of amino acid residues. Chem. Inf. Comput. Sci. 39 (4),642–649.
Bairoch, A., 2000. The ENZYME database in 2000. Nucl. Acids Res. 28, 304–305.Bate, P., Warwicker, J., 2004. Enzyme/non-enzyme discrimination and prediction of
enzyme active site location using charge-based methods. J. Mol. Biol. 340 (2),263–276.
Berman, H.M., Westbrook, J., Feng, Z., Gilliland, G., Bhat, T.N., Weissig, H.,Shindyalov, I.N., Bourne, P.E., 2000. The protein data bank. Nucl. Acids Res.28, 235–242.
Brenner, S.E., Koehl, P., Levitt, M., 2000. The ASTRAL compendium for sequence andstructure analysis. Nucl. Acids Res. 28, 254–256.
Bruno-Blanch, L., Galvez, J., Garcia-Domenech, R., 2003. Topological virtualscreening: a way to find new anticonvulsant drugs from chemical diversity.Bioorg. Med. Chem. Lett. 13 (16), 2749–2754.
Cai, Y.D., Chou, K.C., 2005a. Using functional domain composition to predictenzyme family classes. J. Proteome Res. 4, 109–111.
Cai, Y.D., Chou, K.C., 2005b. Predicting enzyme subclass by functional domaincomposition and pseudo amino acid composition. J. Proteome Res. 4,967–971.
Cai, Y.D., Zhou, G.P., Chou, K.C., 2005. Predicting enzyme family classes byhybridizing gene product composition and pseudo-amino acid composition. J.Theor. Biol. 234, 145–149.
Chandonia, J.M., Walker, N.S., Conte, L.L., Koehl, P., Levitt, M., Brenner, S.E., 2002.ASTRAL compendium enhancements. Nucl. Acids Res. 30, 260–263.
Chou, K.C., 1989. Graphical rules in steady and non-steady enzyme kinetics. J. Biol.Chem. 264, 12074–12079.
Chou, K.C., 1990. Review: applications of graph theory to enzyme kinetics andprotein folding kinetics. Steady and non-steady state systems. Biophys. Chem.35, 1–24.
Chou, K.C., 1993. A vectorized sequence-coupling model for predicting HIVprotease cleavage sites in proteins. J. Biol. Chem. 268, 16938–16948.
Chou, K.C., 1996. Review: prediction of HIV protease cleavage sites in proteins.Anal. Biochem. 233, 1–14.
Chou, K.C., 2001. Prediction of protein cellular attributes using pseudo amino acidcomposition. PROTEINS: Structure, Function, and Genetics (Erratum: ibid,2001, Vol. 44, 60) 43, 246–255.
Chou, K.C., 2004a. Review: structural bioinformatics and its impact to biomedicalscience. Curr. Med. Chem. 11, 2105–2134.
Chou, K.C., 2004b. Molecular therapeutic target for type-2 diabetes. J. ProteomeRes. 3, 1284–1288.
Chou, K.C., 2005. Using amphiphilic pseudo amino acid composition to predictenzyme subfamily classes. Bioinformatics 21 (1), 10–19.
Chou, K.C., Cai, Y.D., 2004a. Predicting enzyme family class in a hybridizationspace. Protein Sci. 13, 2857–2863.
Chou, K.C., Cai, Y.D., 2004b. Using GO-PseAA predictor to predict enzyme sub-class.Biochem. Biophys. Res. Commun. 325, 506–509.
Chou, K.C., Cai, Y.D., 2006. Predicting protein–protein interactions from sequencesin a hybridization space. J. Proteome Res. 5, 316–322.
Chou, K.C., Elrod, D.W., 2003. Prediction of enzyme family classes. J. Proteome Res.2, 183–190.
Chou, K.C., Shen, H.B., 2007. Review: recent progresses in protein subcellularlocation prediction. Anal. Biochem. 370, 1–16.
Chou, K.C., Shen, H.B., 2008. Cell-PLoc: a package of web-servers for predictingsubcellular localization of proteins in various organisms. Nat. Protoc. 3,153–162.
Chou, K.C., Zhang, C.T., 1995. Review: prediction of protein structural classes. Crit.Rev. Biochem. Mol. Biol. 30, 275–349.
Chou, K.C., Kezdy, F.J., Reusser, F., 1994. Review: steady-state inhibition kinetics ofprocessive nucleic acid polymerases and nucleases. Anal. Biochem. 221,217–230.
Chou, K.C., Wei, D.Q., Zhong, W.Z., 2003. Binding mechanism of coronavirus mainproteinase with ligands and its implication to drug design against SARS.(Erratum: ibid., 2003, Vol. 310, 675). Biochem. Biophys. Res. Commun. 308,148–151.
Chou, K.C., Cai, Y.D., Zhong, W.Z., 2006a. Predicting networking couples formetabolic pathways of Arabidopsis. EXCLI J. 5, 55–65.
Chou, K.C., Wei, D.Q., Du, Q.S., Sirois, S., Zhong, W.Z., 2006b. Review: progress incomputational approach to drug development against SARS. Curr. Med. Chem.13, 3263–3270.
Devillers, J., Balaban, A.T., 1999. Topological Indices and Related Descriptors inQSAR and QSPR. Gordon and Breach, The Netherlands.
Diederich, J., 1990. Artificial Neural Networks: Concept Learning. IEEE PressPiscataway, NJ, USA.
Dobson, P.D., Doig, A.J., 2003. Distinguishing enzyme structures from non-enzymeswithout alignments. J. Mol. Biol. 330 (4), 771–783.
Dobson, P.D., Doig, A.J., 2005. Predicting enzyme class from protein structurewithout alignments. J. Mol. Biol. 345 (1), 187–199.
Du, Q.S., Mezey, P.G., Chou, K.C., 2005a. Heuristic molecular lipophilicity potential(HMLP): a 2D-QSAR study to LADH of molecular family pyrazole andderivatives. J. Comput. Chem. 26, 461–470.

ARTICLE IN PRESS
C.R. Munteanu et al. / Journal of Theoretical Biology 254 (2008) 476–482482
Du, Q.S., Wang, S.Q., Jiang, Z.Q., Gao, W.N., Li, Y.D., Wei, D.Q., Chou, K.C., 2005b.Application of bioinformatics in search for cleavable peptides of SARS-CoVMpro and chemical modification of octapeptides. Med. Chem. 1, 209–213.
Du, Q.S., Huang, R.B., Wei, Y.T., Du, L.Q., Chou, K.C., 2008. Multiple field three-dimensional Quantitative structure–activity relationship (MF-3D-QSAR).J. Comput. Chem. 29, 211–219.
Estrada, E., 2001. Generalization of topological indices. Chem. Phys. Lett. 336,248–252.
Estrada, E., 2003. Application of a novel graph-theoretic folding degree index to thestudy of steroid–DB3 antibody binding affinity. Comput. Biol. Chem. 27,305–313.
Estrada, E., Delgado, E.J., Alderete, J.B., Jana, G.A., 2004. Quantum-connectivitydescriptors in modeling solubility of environmentally important organiccompounds. J. Comput. Chem. 25, 1787–1796.
Frank, I.H.W.A.E., 2005. Data Mining: Practical Machine Learning Tools andTechniques. Kaufmann, San Francisco.
Fujibuchi, W., Goto, S., Migimatsu, H., Uchiyama, I., Ogiwara, A., Akiyama, Y.,Kanehisa, M., 1997. DBGET/LinkDB: an integrated database retrieval system.Pac. Symp. Biocomput. 3, 681–692.
Gao, W.N., Wei, D.Q., Li, Y., Gao, H., Xu, W.R., Li, A.X., Chou, K.C., 2007. Agaritine andits derivatives are potential inhibitors against HIV proteases. Med. Chem. 3,221–226.
Gonzalez, M.P., Teran, C., Teijeira, M., Besada, P., 2005a. Geometry, topology, andatom-weights assembly descriptors to predicting A1 adenosine receptorsagonists. Bioorg. Med. Chem. Lett. 15 (10), 2641–2645.
Gonzalez, M.P., Teran, C., Teijeira, M., Besada, P., Gonzalez-Moa, M., 2005b. BCUTdescriptors to predicting affinity toward A3 adenosine receptors. J. Bioorg.Med. Chem. Lett. 15 (15), 3491–3495.
Gonzalez-Diaz, H., Cruz-Monteagudo, M., Molina, R., Tenorio, E., Uriarte, E., 2005c.Predicting multiple drugs side effects with a general drug-target interactionthermodynamic Markov model. Bioorg. Med. Chem. 13 (4), 1119–1129.
Gonzalez-Diaz, H., Prado-Prado, F.J., Santana, L., Uriarte, E., 2006a. Unify QSARapproach to antimicrobials. Part 1: Predicting antifungal activity againstdifferent species. Bioorg. Med. Chem. 14, 5973–5980.
Gonzalez-Diaz, H., Perez-Bello, A., Uriarte, E., Gonzalez-Diaz, Y., 2006b. QSAR studyfor mycobacterial promoters with low sequence homology. Bioorg. Med. Chem.Lett. 16, 547–553.
Gonzalez-Diaz, H., Sanchez-Gonzalez, A., Gonzalez-Diaz, Y., 2006c. 3D-QSAR studyfor DNA cleavage proteins with a potential anti-tumor ATCUN-like motif. J.Inorg. Biochem. 100, 1290–1297.
Gonzalez-Dıaz, H., Gonzalez-Dıaz, Y., Santana, L., Ubeira, F.M., Uriarte, E., 2008.Proteomics, networks, and connectivity indices. Proteomics 8, 750–778.
Gramatica, P., Consolaro, F., Pozzi, S., 2001. QSAR approach to POPs screening foratmospheric persistence. Chemosphere 43 (4–7), 655–664.
Hua, S., Sun, Z., 2001. Support vector machine approach for protein subcellularlocalization prediction. Bioinformatics 17, 721–728.
Kabsch, W., Sander, C., 1983. Dictionary of protein secondary structure: patternrecognition of hydrogen-bonded and geometrical features. Biopolymers 22(12), 2577–2637.
Karelson, M., 2000. Molecular Descriptors in QSAR/QSPR. Wiley-Interscience, NewYork.
Kowalski, R.D., Wold, S., 1982. In: Krishnaiah, P.R., Kanal, L.N. (Eds.), Handbook ofStatistic. North Holland Publishing Company, Amsterdam, pp. 673–697.
Li, Y., Wei, D.Q., Gao, W.N., Gao, H., Liu, B.N., Huang, C.J., Xu, W.R., Liu, D.K., Chen,H.F., Chou, K.C., 2007. Computational approach to drug design for oxazolidi-nones as antibacterial agents. Med. Chem. 3, 576–582.
Liao, B., Ding, K., 2005. Graphical approach to analyzing DNA sequences. J. Comput.Chem. 26 (14), 1519–1523.
Liao, B., Wang, T.M., 2004a. Analysis of similarity/dissimilarity of DNA sequencesbased on nonoverlapping triplets of nucleotide bases. J. Chem. Inf. Comput. Sci.44 (5), 1666–1670.
Liao, B., Wang, T.M., 2004b. New 2D graphical representation of DNA sequences.J. Comput. Chem. 25 (11), 1364–1368.
Liao, B., Xiang, X., Zhu, W., 2006. Coronavirus phylogeny based on 2D graphicalrepresentation of DNA sequence. J. Comput. Chem. 27 (11), 1196–1202.
Luco, J.M., Ferretti, F.H., 1997. QSAR based on multiple linear regression and PLSmethods for the anti-HIV activity of a large Group of HEPT derivatives. J. Chem.Inf. Comput. Sci. 37 (2), 392–401.
Randic, M., 2000. Condensed representation of DNA primary sequences. J. Chem.Inf. Comput. Sci. 40 (1), 50–56.
Randic, M., Balaban, A.T., 2003. On a four-dimensional representation of DNAprimary sequences. J. Chem. Inf. Comput. Sci. 43 (2), 532–539.
Randic, M., Basak, S.C., 2001. Characterization of DNA primary sequences based onthe average distances between bases. J. Chem. Inf. Comput. Sci. 41 (3),561–568.
Randic, M., Vracko, M., Nandy, A., Basak, S.C., 2000. On 3-D graphical representa-tion of DNA primary sequences and their numerical characterization. J. Chem.Inf. Comput. Sci. 40 (5), 1235–1244.
Randic, M., Zupan, J., Vikic-Topic, D., 2007. On representation of proteins by star-like graphs. J. Mol. Graph Model 26 (1), 290–305.
Ren, B.J., 2002. Novel atomic-level-based AI topological descriptors: application toQSPR/QSAR modeling. Chem. Inf. Comput. Sci. 42 (4), 858–868.
Shen, H.B., Chou, K.C., 2007. EzyPred: a top-down approach for predicting enzymefunctional classes and subclasses. Biochem. Biophys. Res. Commun. 364,53–59.
Shen, H.B., Chou, K.C., 2008. PseAAC: a flexible web-server for generating variouskinds of protein pseudo amino acid composition. Anal. Biochem. 373, 386–388/http://chou.med.harvard.edu/bioinf/PseAA/S.
Sirois, S., Wei, D.Q., Du, Q.S., Chou, K.C., 2004. Virtual screening for SARS-CoVprotease based on KZ7088 pharmacophore points. J. Chem. Inf. Comput. Sci. 44,1111–1122.
StatSoft.Inc., 2002. p STATISTICA (data analysis software system), version 6.0.Available from: /www.statsoft.com.StatsoftS.
Todeschini, R., Consonni, V., 2000. Handbook of Molecular Descriptors. Wiley VCH,Weinheim, Germany.
Van Waterbeemd, H., 1995. Chemometric methods in molecular design. In:Manhnhold, R., Krogsgaard-Larsen, P., Timmerman, H., Van Waterbeemd, H.,Weinhiem, V.C.H. (Eds.), Method and Principles in Medicinal Chemistry,359pp.
Wang, J.F., Wei, D.Q., Chen, C., Li, Y., Chou, K.C., 2008. Molecular modeling of twoCYP2C19 SNPs and its implications for personalized drug design. Protein Pept.Lett. 15, 27–32.
Zhang, R., Wei, D.Q., Du, Q.S., Chou, K.C., 2006. Molecular modeling studies ofpeptide drug candidates against SARS. Med. Chem. 2, 309–314.
Zheng, H., Wei, D.Q., Zhang, R., Wang, C., Wei, H., Chou, K.C., 2007. Screening fornew agonists against Alzheimer’s disease. Med. Chem. 3, 488–493.