Indoor Oyster Mushroom farming, a livelihood diversification ...
Upload
khangminh22Category
view
1download
0
sustainability
Article
Have Bangladesh’s Polders Decreased LivelihoodVulnerability? A Comparative Case Study
Sanchayan Nath * , Frank van Laerhoven and Peter P. J. Driessen
Copernicus Institute of Sustainable Development, Utrecht University, Heidelberglaan 2, 3584 CS Utrecht,The Netherlands; [email protected] (F.v.L.); [email protected] (P.P.J.D.)* Correspondence: [email protected]
Received: 23 November 2019; Accepted: 11 December 2019; Published: 13 December 2019 �����������������
Abstract: Communities living in coastal regions are vulnerable to flooding, salinity intrusion,and natural hazards. This is aggravated by climate change. In order to reduce this vulnerability,governments have invested heavily in developing coastal infrastructures. One type of infrastructuredevelopment regards polders (i.e., pieces of land previously subject to permanent or temporal overflowthat are now surrounded by embankments that prevent inundation). The impact of polderization onlivelihood vulnerability is not straightforward and is therefore still poorly understood. In order toanalyze such impacts, we present a comparative case study of four polders in Bangladesh that arecharacterized by varying societal circumstances, hydrological conditions, hydrological interventions,and different levels of community response to polderization. How does livelihood vulnerability varytemporally and spatially in polders, and what explains such variation? We use data collected via162 surveys, 40 semi-structured interviews, and secondary research to analyze trends in the scoresof the livelihood vulnerability index. Based on our analysis, we argue that after accounting forinteractions amongst variables like hydrological conditions, hydrological interventions, communityresponse, and other societal factors, livelihood vulnerability is lower in polders characterized byhigher community involvement in using hydrological interventions to control the flow of saline water.
Keywords: livelihood vulnerability index; community governance; vulnerability; land-waterdynamics; climate change; salinity intrusion; drainage congestion
1. Introduction
Coastal regions around the world are a rich source of commercial and subsistence resources.These regions are therefore heavily populated [1]. Of the world’s human population, 23% live within100 km of the world’s coastline. By 2030, about 50% of the world’s population is likely to do so [2].This closeness to seas and oceans makes this populace vulnerable to flooding, salinity intrusion, andnatural hazards [1,3]. Such hazards can be devastating. For instance, a tropical cyclone that struck thecoastal belt of Bangladesh in 1991 resulted in a huge storm-surge and widespread flooding, leadingto the loss of more than 10,000 human lives and the displacement of millions [2]. The vulnerabilityof communities living in such areas is further aggravated by climate change [1]. Climate change isleading to an increase in tidal surges. The rate of sea-level rise is also accelerating, and coastal regionsmay witness sea-level rises of one meter or more by 2100 [4]. Coastal settlements are increasinglygetting impacted by flooding, inundation, coastline erosion, shoreline relocation, and salinity intrusion.Casualty levels are increasing [1].
In order to reduce the vulnerability of communities living in such regions, governments haveinvested heavily in coastal infrastructures, such as dykes, embankments, polders (defined in Section 2.1),and other polder-like structures [3]. The first polders and polder-like structures originated in theNetherlands in the 11th century. Over the years, other countries too have constructed such structures,
Sustainability 2019, 11, 7141; doi:10.3390/su11247141 www.mdpi.com/journal/sustainability

Sustainability 2019, 11, 7141 2 of 20
namely: Egypt and Morocco in Africa; China, Bangladesh, and India in Asia; Belgium and Denmark inEurope; USA in North America; and Argentina and Venezuela in South America [5].
In order to protect its coastal belt from flooding and salinity intrusion, since the 1960s Bangladeshhas constructed a large number of embankments in the region, leading to the creation of 139 polders [6].The construction of these polders was expected to aid agriculture and transform the region into afood-exporting region [7,8]. In the initial years of polderization, flooding reduced dramatically andagricultural productivity improved. But over time, water-logging and drainage congestion began toincrease in certain polders, especially those located in the south-western belt [9,10]. Between 1972 and2015, infilling was observed in conduit tidal channels located outside the polders. Such “newly createdland” is considered as “Khas land” in Bangladesh (in addition to such newly created land, other sourcesof Khas land in the polders of Bangladesh include land owned by public agencies; land belonging toémigrés before they emigrated from Bangladesh, now claimed by the government of Bangladesh; landacquisitioned during government auctions; and various kinds of checked, abandoned, or confiscatedland [11]). Over time, such land began to be reclaimed for agriculture [12]. As sea-levels rose, tidalsurges and salinity intrusion also increased in the polders [9,10].
The new water regime resulting from water-logging and increased salinity intrusion, induced bytidal-surges and created conditions for the introduction of shrimp farming in the polders of the region.Starting in the 1980s, the Bangladesh government, with active encouragement from international banksand agencies, began to encourage wide-spread shrimp farming in the region [8]. About 80% of theseshrimp farms came up in the south-western belt [13]. Khas land too began to be used for shrimpfarming [8,12]. This led to a net reduction in the amount of land used for agriculture. This changehas been accompanied by a corresponding increase in the amount of land used for aquaculture [14].Shrimp-farms may have contributed to increasing the economic development of the region. However,they also led to the destruction of the traditional agriculture-based ways of life in this region [8].In addition, these changes led to increasing poverty levels, thus affecting the vulnerability levelsof the community living in the coastal belt of Bangladesh. In other words, such changes affect thesustainability of livelihood practices in the region in the long run [15].
This article is narrowly focused on the twin phenomena of drainage congestion and salinityintrusion characterizing the polders in the south-western coastal belt of Bangladesh. In order to adaptto the trying conditions brought about by drainage congestion, starting in 1986, local communities incertain polders (polders 24 and 25) have periodically breached the embankments so as to re-establish(partly) the hydrological conditions that existed before polderization [16,17]. This practice is now beingreferred to as tidal river management (TRM). In the short-term, such actions did reduce the problemsof drainage congestion and waterlogging in the region. However, it also led to increased salinityintrusion (depending on the location and river regime), and such actions have further implicationsfor the vulnerability levels of the communities deriving their livelihoods from the polders associatedwith TRM.
In the face of increasing salinity intrusion in the south-western belt, shrimp farming is almost away of life in some of the polders (polder 21) of this region. However, starting in 1990, communities incertain polders (polder 22) widely resisted the introduction of shrimp-farming into their lands [8].
In other words, polders in the south-western belt of Bangladesh provide varied instances of howcommunities have responded to problems brought about by polderization during times of climatechange. Such responses have implications for the vulnerability of local communities residing incoastal regions.
Scholars have studied community involvement [18], community adaptation to climate change [19],vulnerability [19–21], and salinity intrusion [22] in Bangladesh. However, there is a limitedunderstanding of how and why community attributes, hydrological conditions (e.g., salinityintrusion, drainage congestion), the precise nature of hydrological interventions (e.g., the use ofpolder-infrastructure to control salinity intrusion), and the type and levels of community responseinteract and subsequently affect livelihood vulnerability [2,3,23–25].

Sustainability 2019, 11, 7141 3 of 20
Therefore, the research questions that this article seeks to answer are the following: Howdoes livelihood vulnerability vary temporally and spatially in polders characterized by differenthydrological conditions (salinity intrusion, drainage congestion), different hydrological interventions(use of polder-infrastructure to control salinity intrusion), and by different levels of communityresponse? What explains such variation? These questions are answered using data collected via surveys,semi-structured interviews, and secondary research on four polders located in the south-western beltof coastal Bangladesh.
2. Conceptualizing Key Concepts
2.1. Conceptualizing Polders
A polder can be conceptualized as a piece of land surrounded by embankments. The embankmentseparates this piece of land from the surrounding hydrological regime. A polder consists of the followingfour components: embankments, sluicegates, canals, and the enclosed land. The embankments protectthe enclosed land from flooding. The sluicegates are used to control the flow of water betweenthe polder and the surrounding hydrological regime. The canals convey water to and from theembankment into various sections of the polder [15,26]. In our study area, most polders were inhabitedand were characterized by a wide range of livelihood practices—ranging from subsistence agriculture tocommercial transport-services. Hydrological conditions in the polders (salinity intrusion and drainagecongestion), hydrological interventions (use of polder-infrastructure to control salinity intrusion), thetypes of livelihood practiced by local communities, and community responses to such conditionsprevailing in the polders influence the vulnerability of local communities.
2.2. Conceptualizing Vulnerability
In 2007, the IPCC (Intergovernmental Panel on Climate Change) defined vulnerability (to climatechange) as a measure of the extent to which communities are “susceptible to, and unable to cope with,adverse impacts of climate change” [27]. This definition of vulnerability is widely-accepted amongstscholars studying climate change. This definition is based on the conceptualization that vulnerabilityis a function of exposure, sensitivity, and adaptive capacity [28]. Exposure refers to the magnitudeand duration to which a community is affected by a climate-related phenomenon (such as increasedexposure to natural hazards). Sensitivity refers to the degree to which the community is affected by theexposure. Adaptive capacity refers to the ability of the community to withstand or recover from theexposure [29].
Drawing on this conceptualization, the authors of [29] developed an indicator-based vulnerabilityassessment tool “to estimate the differential impacts of climate change on communities”. This tool isknown as the livelihood vulnerability index (LVI). The theoretical framework underlying this index isthe sustainable livelihood approach proposed by the authors of [30]. A wide variety of empirical workbased on this approach has been conducted across the world in order to understand how communitiesadapt their livelihood strategies in the face of various shocks and disturbances. While some scholarsare skeptical of the usefulness of assessment tools, such as the LVI [31], and others have arguedthat vulnerability is difficult to measure [25], LVI has been used for the assessment of communityvulnerability across a wide range of sites, namely: in high-income [32] and low-income countries [23].
LVI is a composite measure in which the three components (exposure, sensitivity, and adaptivecapacity) of which vulnerability is a function are quantified in the following manner: (a) exposure ismeasured in terms of how the community has been affected by natural disasters; (b) adaptive capacityis quantified using the demographic profile of this community, their livelihood strategies, and thestrength of their social networks; and (c) sensitivity is assessed by measuring the food and watersecurity, and health status of the community. In other words, LVI is a composite index of the followingseven components: socio-demographic profile, livelihood strategies, strength of social networks, healthstatus, access to food, access to water, and exposure to natural hazards [29]. Each of these components
Sustainability 2019, 11, 7141 4 of 20
are assessed using multiple indicators, which are then aggregated into the composite index. Theseindicators are measured using household-level, primary data, in contrast to the secondary data usedfor the measurement of other vulnerability-assessment tools, of which the authors of [25,31] havebeen critical. The authors of [29] argue that doing so nullifies some of the pitfalls suffered by otherassessment tools. Another advantage of LVI is that the indicators can be customized to suit the uniqueconditions prevailing at different field-sites.
LVI was developed with the goal of understanding how various social, demographic, andhealth factors affect the vulnerability of communities impacted by climate change [29]. The varioussocio-economic factors that influence vulnerability include assets, income, age, gender, education,ethnicity, living conditions, and factors associated with social exclusion. Political variables (institutions,conflict, power, influence, and political stability) and governance variables (effectiveness of policiesand ability to deliver services) also influence vulnerability. Other factors include demography, healthand nutrition levels, livelihood (type of livelihood and level of self-sufficiency), infrastructure (access toinfrastructure and quality of infrastructure—condition of polder-embankment), geography (length ofcoast-line), ecology and environment (environmental stress and exposure to heat-waves), etc. [31,33,34].
3. Methods
3.1. Study Sites
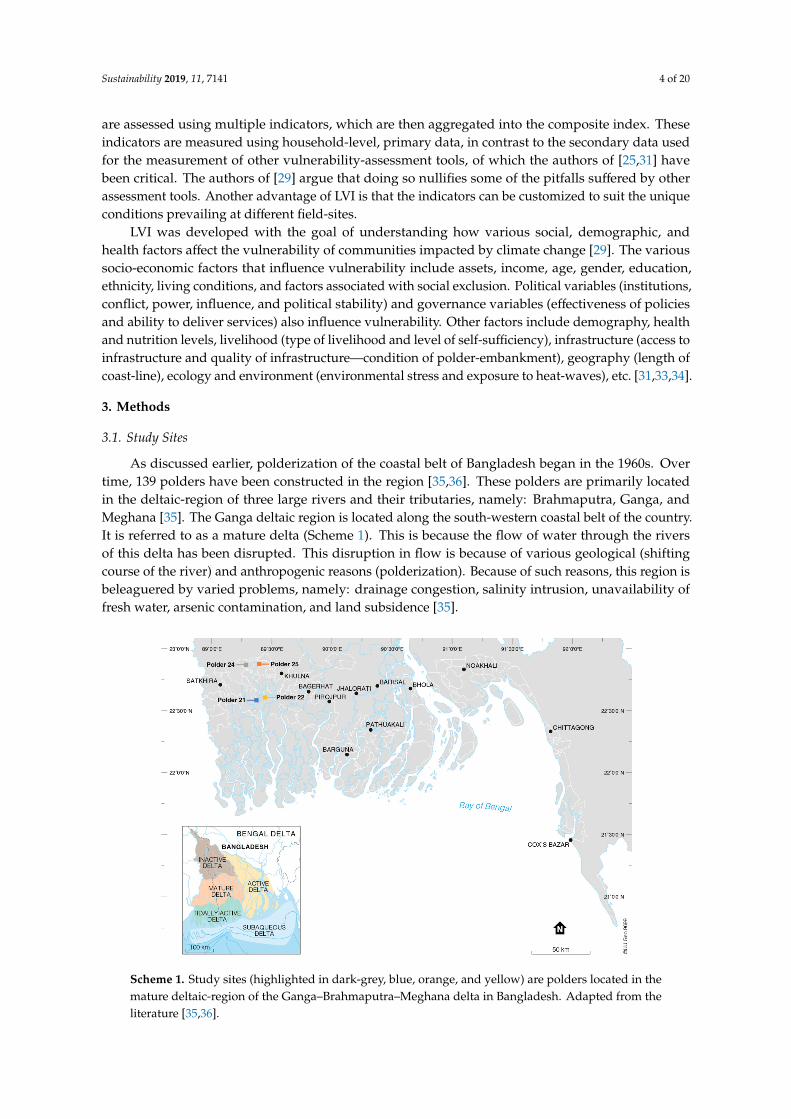
As discussed earlier, polderization of the coastal belt of Bangladesh began in the 1960s. Overtime, 139 polders have been constructed in the region [35,36]. These polders are primarily locatedin the deltaic-region of three large rivers and their tributaries, namely: Brahmaputra, Ganga, andMeghana [35]. The Ganga deltaic region is located along the south-western coastal belt of the country.It is referred to as a mature delta (Scheme 1). This is because the flow of water through the riversof this delta has been disrupted. This disruption in flow is because of various geological (shiftingcourse of the river) and anthropogenic reasons (polderization). Because of such reasons, this region isbeleaguered by varied problems, namely: drainage congestion, salinity intrusion, unavailability offresh water, arsenic contamination, and land subsidence [35].
Sustainability 2020, 12, x FOR PEER REVIEW 4 of 20
these components are assessed using multiple indicators, which are then aggregated into the composite index. These indicators are measured using household-level, primary data, in contrast to the secondary data used for the measurement of other vulnerability-assessment tools, of which the authors of [25,31] have been critical. The authors of [29] argue that doing so nullifies some of the pitfalls suffered by other assessment tools. Another advantage of LVI is that the indicators can be customized to suit the unique conditions prevailing at different field-sites.
LVI was developed with the goal of understanding how various social, demographic, and health factors affect the vulnerability of communities impacted by climate change [29]. The various socio-economic factors that influence vulnerability include assets, income, age, gender, education, ethnicity, living conditions, and factors associated with social exclusion. Political variables (institutions, conflict, power, influence, and political stability) and governance variables (effectiveness of policies and ability to deliver services) also influence vulnerability. Other factors include demography, health and nutrition levels, livelihood (type of livelihood and level of self-sufficiency), infrastructure (access to infrastructure and quality of infrastructure—condition of polder-embankment), geography (length of coast-line), ecology and environment (environmental stress and exposure to heat-waves), etc. [31,33,34].
3. Methods
3.1. Study Sites
As discussed earlier, polderization of the coastal belt of Bangladesh began in the 1960s. Over time, 139 polders have been constructed in the region [35,36]. These polders are primarily located in the deltaic-region of three large rivers and their tributaries, namely: Brahmaputra, Ganga, and Meghana [35]. The Ganga deltaic region is located along the south-western coastal belt of the country. It is referred to as a mature delta (map 1). This is because the flow of water through the rivers of this delta has been disrupted. This disruption in flow is because of various geological (shifting course of the river) and anthropogenic reasons (polderization). Because of such reasons, this region is beleaguered by varied problems, namely: drainage congestion, salinity intrusion, unavailability of fresh water, arsenic contamination, and land subsidence [35].
Scheme 1. Study sites (highlighted in dark-grey, blue, orange, and yellow) are polders located in themature deltaic-region of the Ganga–Brahmaputra–Meghana delta in Bangladesh. Adapted from theliterature [35,36].

Sustainability 2019, 11, 7141 5 of 20
In 1986, plagued by water-logging and drainage congestion in the region, local communities beganprotesting publicly for a solution to the problem. Frustrated by the lack of action from public agencies,these communities breached the embankment near Beel (a beel is a type of water-body) Dakatia ofpolder 25 in 1989–1990. The same situation arose in polder 24 in the 1990s. In 1997, local communitiesbreached the embankment near Beel Bhayna of polder 24. In the short-term, such actions did reducethe problems of drainage congestion and water-logging in the region. Therefore, learning from theactions of local communities, Bangladesh Water Development Board (BWDB)—the public agencyresponsible for the administration of polders—breached the embankment in another part (near BeelKhuksia) of polder 24 in 2006. However, such breaches also increased salinity intrusion into the polder.Some communities, whose agriculture land got inundated after the breaches, demanded compensationfrom BWDB. However, BWDB was not able to sort out land acquisition and compensation-relatedproblems to the satisfaction of local communities. Therefore, in 2012, when BWDB proposed anotherbreach in the embankment, this time near Beel Kapalia, some local communities protested against thebreach. No further breaches have been attempted in polders 24 and 25 since then [16,17].
Polder 24 and polder 25 lie along the banks of the river Hari (Scheme 2). As the river flows towardsthe Bay of Bengal, its name changes to Sibsa. Polders 21 and 22 lie along the banks of the river Sibsa,downstream from polders 24 and 25. In contrast to polders 24 and 25, which are located near some ofthe biggest towns and cities in Bangladesh, polders 21 and 22 are islands and are remotely located.
Sustainability 2020, 12, x FOR PEER REVIEW 5 of 20
Map 1. Study sites (highlighted in dark-grey, blue, orange, and yellow) are polders located in the mature deltaic-region of the Ganga–Brahmaputra–Meghana delta in Bangladesh. Adapted from the literature [35,36].
In 1986, plagued by water-logging and drainage congestion in the region, local communities began protesting publicly for a solution to the problem. Frustrated by the lack of action from public agencies, these communities breached the embankment near Beel (a beel is a type of water-body) Dakatia of polder 25 in 1989–1990. The same situation arose in polder 24 in the 1990s. In 1997, local communities breached the embankment near Beel Bhayna of polder 24. In the short-term, such actions did reduce the problems of drainage congestion and water-logging in the region. Therefore, learning from the actions of local communities, Bangladesh Water Development Board (BWDB)—the public agency responsible for the administration of polders—breached the embankment in another part (near Beel Khuksia) of polder 24 in 2006. However, such breaches also increased salinity intrusion into the polder. Some communities, whose agriculture land got inundated after the breaches, demanded compensation from BWDB. However, BWDB was not able to sort out land acquisition and compensation-related problems to the satisfaction of local communities. Therefore, in 2012, when BWDB proposed another breach in the embankment, this time near Beel Kapalia, some local communities protested against the breach. No further breaches have been attempted in polders 24 and 25 since then [16,17].
Polder 24 and polder 25 lie along the banks of the river Hari (map 2). As the river flows towards the Bay of Bengal, its name changes to Sibsa. Polders 21 and 22 lie along the banks of the river Sibsa, downstream from polders 24 and 25. In contrast to polders 24 and 25, which are located near some of the biggest towns and cities in Bangladesh, polders 21 and 22 are islands and are remotely located.
Map 2. Expanded map of the study sites (polders 21, 22, 24, and 25). Adapted from the literature [37]. The shaded parts represent various beels. Polders 22, 24, and 25 are densely populated. Residents live all across the polders. Polder 21 is sparsely populated. Most residents live along the embankments.
As discussed earlier, starting in the 1980s, shrimp farming spread in the coastal region [8]. About 80% of these shrimp farms came up in the Ganga deltaic region [13]. Shrimp farms are present in
Scheme 2. Expanded map of the study sites (polders 21, 22, 24, and 25). Adapted from the literature [37].The shaded parts represent various beels. Polders 22, 24, and 25 are densely populated. Residents liveall across the polders. Polder 21 is sparsely populated. Most residents live along the embankments.
As discussed earlier, starting in the 1980s, shrimp farming spread in the coastal region [8]. About80% of these shrimp farms came up in the Ganga deltaic region [13]. Shrimp farms are present inlarge numbers in polders 24 and 25. However, polders 21 and 22 differ from polders 24 and 25 in theintensity of shrimp farming. Shrimp farms can be categorized into two categories, namely: fresh-water

Sustainability 2019, 11, 7141 6 of 20
farms and saline-water farms. Amongst all of the four polders, polder 22 is the only polder that doesnot allow saline-water farms within its boundaries. When shrimp-farming began in the region inthe 1990s, local communities in polder 22 actively resisted its introduction. Protests turned violent.However, in-spite of repeated attempts over the last 30 years, polder 22 is the only polder in the regionwhere not a single acre of land is used for saline-shrimp farming [8]. The embankments in this polderare not breached at even a single point, and communities in this polder do not suffer from the problemsof salinity intrusion to the extent that other polders do. In contrast, shrimp-farming is almost a way oflife in polder 21. The embankment around this polder is breached at innumerable points to the extentthat saline-water flows in and out of the water uninterrupted. Sluicegates are rendered meaningless.Amongst the four polders discussed here, salinity intrusion is highest in this polder.
Rationale for Selection of Study Sites
Although there are 139 polders in the coastal belt of Bangladesh, the four polders (21, 22, 24, and25) discussed earlier comprise the study sites for this article. This is because they typify the hydrologicalconditions, hydrological interventions, and community responses that this article studies. These fourstudy sites represent four different pathways (Table 1, Scheme 2). The differences in these pathwayshave been shaped, in part, by the unique social, hydrological, and geo-morphological factors thatdistinguish the polders from each other. Salinity intrusion and drainage congestion is the highest inpolder 21 and the lowest in polder 22. Polders 24 and 25 are located in between. In addition, these fourpolders are characterized by different kinds of community response. In order to manage land-waterdynamics within their polders, communities living in these four polders made four different choices.Two of these polders (polders 24 and 25) are characterized by partially controlled flow of saline-waterinto some of the waterbodies in the polders. Communities in polder 25 self-organized themselvesand allowed for the partially controlled flow of saline-water into the polder. The embankment wasbreached by local communities. These breaches were opposed by public agencies. Polder 24 is different.In polder 24, the first few breaches were led by local communities and opposed by public agencies.The next few breaches were initiated by public agencies. In subsequent years, breaches were opposedby local communities. In other words, communities in polder 24 sometimes acted in opposition andsometimes in collusion with public agencies and allowed the partially controlled flow of saline-waterinto the polder. Community response against salinity intrusion is the most intense in polder 22.Communities in polder 22 self-organized themselves and completely stopped the flow of saline-waterinto their lands. Polder 21 is characterized by the uncontrolled flow of saline-water into its lands.Community response for or against salinity intrusion is non-existent. In other words, the four poldersare characterized by differences in community response, as well as by differences in hydrologicalconditions and hydrological interventions (Table 1).
Table 1. Characterizing study sites. Source of data: [37].
Hydrological Condition HydrologicalIntervention Community
ResponsePolder No. Area
(Hectares)Length of
Embankment (km)Salinity
IntrusionDrainage
CongestionFlow of Saline
Water
21 1417 17 High High Uncontrolled Non-existent
22 1630 20 Low Low Completelystopped Self-organized
24 28,340 26 Medium High Partiallycontrolled
Self-organizedand in collusion
with publicagencies
25 17,400 46 Medium Medium Partiallycontrolled Self-organized
Sustainability 2019, 11, 7141 7 of 20
3.2. Hypothesis, Dependent, and Independent Variables
The goal of this research is to understand how and why vulnerability varies temporally andspatially across polders characterized by different hydrological conditions (salinity intrusion anddrainage congestion), different hydrological interventions (use of polder-infrastructure to controlsalinity intrusion), and by different levels of community response.
The level of analysis is at the polder-level.The dependent variable is the vulnerability levels in a polder as measured using the LVI. The
independent variables are the (a) hydrological conditions in polders (salinity intrusion and drainagecongestion), (b) different hydrological interventions (use of polder-infrastructure to control salinityintrusion), (c) levels of community response, and (d) contextual societal factors (socio-economic,demographic, etc.).
It is hypothesized that vulnerability is lower in polders during time-periods characterized by(a) low salinity intrusion, (b) low drainage congestion, (c) embankments that control the flow ofsaline-water, and (d) higher levels of community response, and vice-versa. Such variations aremoderated by other societal factors.
3.3. Data Collection and Analysis Strategy
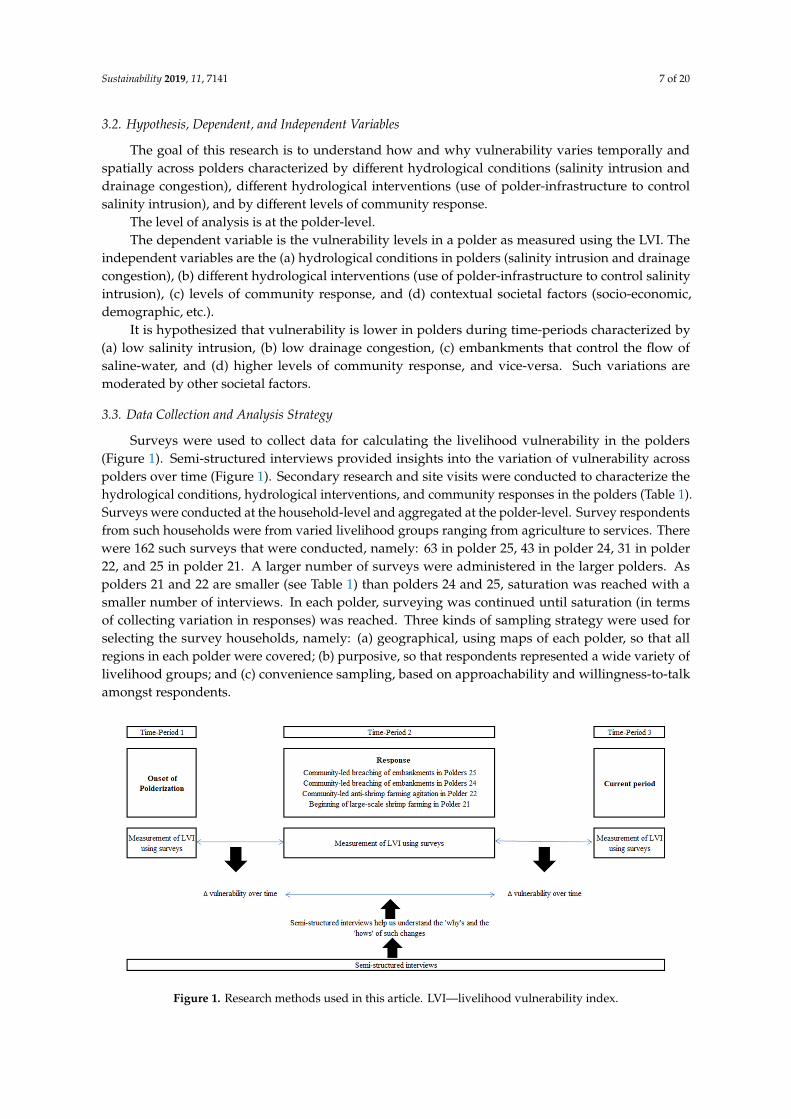
Surveys were used to collect data for calculating the livelihood vulnerability in the polders(Figure 1). Semi-structured interviews provided insights into the variation of vulnerability acrosspolders over time (Figure 1). Secondary research and site visits were conducted to characterize thehydrological conditions, hydrological interventions, and community responses in the polders (Table 1).Surveys were conducted at the household-level and aggregated at the polder-level. Survey respondentsfrom such households were from varied livelihood groups ranging from agriculture to services. Therewere 162 such surveys that were conducted, namely: 63 in polder 25, 43 in polder 24, 31 in polder22, and 25 in polder 21. A larger number of surveys were administered in the larger polders. Aspolders 21 and 22 are smaller (see Table 1) than polders 24 and 25, saturation was reached with asmaller number of interviews. In each polder, surveying was continued until saturation (in termsof collecting variation in responses) was reached. Three kinds of sampling strategy were used forselecting the survey households, namely: (a) geographical, using maps of each polder, so that allregions in each polder were covered; (b) purposive, so that respondents represented a wide variety oflivelihood groups; and (c) convenience sampling, based on approachability and willingness-to-talkamongst respondents.
Sustainability 2020, 12, x FOR PEER REVIEW 7 of 20
25 17,400 46 Medium Medium Partially controlled
Self-organized
3.2. Hypothesis, Dependent, and Independent Variables
The goal of this research is to understand how and why vulnerability varies temporally and spatially across polders characterized by different hydrological conditions (salinity intrusion and drainage congestion), different hydrological interventions (use of polder-infrastructure to control salinity intrusion), and by different levels of community response.
The level of analysis is at the polder-level. The dependent variable is the vulnerability levels in a polder as measured using the LVI. The
independent variables are the (a) hydrological conditions in polders (salinity intrusion and drainage congestion), (b) different hydrological interventions (use of polder-infrastructure to control salinity intrusion), (c) levels of community response, and (d) contextual societal factors (socio-economic, demographic, etc.).
It is hypothesized that vulnerability is lower in polders during time-periods characterized by (a) low salinity intrusion, (b) low drainage congestion, (c) embankments that control the flow of saline-water, and (d) higher levels of community response, and vice-versa. Such variations are moderated by other societal factors.
3.3. Data Collection and Analysis Strategy
Surveys were used to collect data for calculating the livelihood vulnerability in the polders (Figure 1). Semi-structured interviews provided insights into the variation of vulnerability across polders over time (Figure 1). Secondary research and site visits were conducted to characterize the hydrological conditions, hydrological interventions, and community responses in the polders (Table 1). Surveys were conducted at the household-level and aggregated at the polder-level. Survey respondents from such households were from varied livelihood groups ranging from agriculture to services. There were 162 such surveys that were conducted, namely: 63 in polder 25, 43 in polder 24, 31 in polder 22, and 25 in polder 21. A larger number of surveys were administered in the larger polders. As polders 21 and 22 are smaller (see Table 1) than polders 24 and 25, saturation was reached with a smaller number of interviews. In each polder, surveying was continued until saturation (in terms of collecting variation in responses) was reached. Three kinds of sampling strategy were used for selecting the survey households, namely: (a) geographical, using maps of each polder, so that all regions in each polder were covered; (b) purposive, so that respondents represented a wide variety of livelihood groups; and (c) convenience sampling, based on approachability and willingness-to-talk amongst respondents.
Figure 1. Research methods used in this article. LVI—livelihood vulnerability index.

Sustainability 2019, 11, 7141 8 of 20
In each household, three different versions of the instruments were administered. The threeversions represented the following three different time-periods (Figure 1): (a) the first version wasused to collect data for the current time-period (2019), (b) the second version was used to collect datafor the period when the “community response” occurred (1980s to the 2000s), and (c) the third versionwas used to collect data for the period (1960s) when polderization began in the region. Each of thethree versions took about thirty minutes to administer. All three versions were administered togetherat the same time.
LVI was calculated using this data. Therefore, LVI was calculated for three different time-periods.As will be discussed later, these indices were calculated in a rigorous manner using a well-established,tried and tested methodology. These measures of vulnerability were then used for case-study analysis.
After the completion of surveys, semi-structured interviews of key respondents were used togenerate narratives for explaining variation in vulnerability across polders. These interviews weredesigned to generate narratives for the three time-periods for which the surveys were administered(Figure 1). For each respondent, all three time-periods were covered in the same interview. Theseinterviews were administered mainly to schoolteachers and school-headmasters. This is becausesuch respondents are among the most literate in these regions. They are firmly embedded in localcommunities, have a good grasp of local happenings, and can take a birds-eye view of local practices.They are also easily accessible and interactions with them helped the researchers develop a goodunderstanding of the reasons for the variation of vulnerability in the region. Their age varied fromabout 30 to 55 years. An attempt was made to interview an equal number of male and femalerespondents. However, it was very difficult to capture the voices of women. Even in the presence of alocal female research assistant, most female respondents were hesitant to speak, and it was difficult tocapture rich narratives from them. There were 40 semi-interviews that were conducted. Interviewsvaried in duration from about twenty minutes to one hour.
The survey instrument and the guide for semi-structured interviews are available asSupplementary Materials.
Wherever possible, data collection issues have been resolved as rigorously as possible. For instance,as the surveys were collecting data for the period when polderization began in the area, it was necessaryto ensure that respondents’ memory could be trusted—that respondents were able to recollectinformation, as accurately as possible, for events which took place that far back in time. Therefore,before beginning the interviews, respondents were administered a couple of test questions to verify thattheir memories could be trusted. These questions tested for information that could be verified easily.For instance, respondents would be asked the following: when did Bangladesh attain independencefrom Pakistan? If respondents were unable to answer these test questions, they would not beadministered the survey questionnaire. However, note that the surveys and interviews intended tocapture information for time periods for which no records exist. This is because the region witnessed aturbulent socio-political history in the mid and late twentieth century. Therefore, even if some memorylapses exist, the analysis presented in this article makes an important contribution.
3.4. Calculating the Livelihood Vulnerability Index (LVI)
LVI consists of 30 indicators grouped into seven components. These components aresocio-demographic profile, livelihood strategies, social networks, health, food, water and naturaldisasters, and climate variability. For this research, several indicators proposed by the authors of [29]had to be tweaked according to ground-realities, after discussions with local stakeholders (see [23]).Also, some of the indicators apply only to the current time period. Table 2 lists information onthese indicators.

Sustainability 2019, 11, 7141 9 of 20
Table 2. Sub-components and indicators of the LVI.
Components Sub-Components Explanation of Sub-Component Whether Used in This Research
Socio-demographicprofile
Dependency ratio Ratio of the population under 15 and over 65 years of age tothe population between 19 and 64 years of age Yes
Percent of female-headed households Percentage of households where the primary adult is femaleNo, during surveys researchers were
unable to find any female-headedhouseholds in the study sites
Size of household Number of people who eats and sleeps in the house Replacement indicator for percent offemale-headed households
Percent of households where head ofhousehold has not attended school
Percentage of households where the head of the householdreports that they have attended 0 years of school Yes
Percent of households with orphansPercentage of households that have at least one orphan
living in their home. Orphans are children <18 years oldwho have lost one or both parents
Yes
Livelihood
Percent of households with familymember working in a different
community
Percentage of households that report at least one familymember who works outside of the community for their
primary work activityYes
Percent of households dependent solelyon agriculture as a source of income
Percentage of households that report only agriculture as asource of income Yes
Average agricultural livelihooddiversification index
The inverse of (the number of agricultural livelihoodactivities +1) reported by a household Yes
Health
Average time to health facility (minutes) Average time it takes the households to get to the nearesthealth facility Yes
Percentage of households with familymember with chronic illness
Percentage of households that report at least one familymember with chronic illness. Chronic illness was defined
subjectively by respondentYes
Percentage of households where a familymember had to miss work or school in
the last two weeks due to illness
Percentage of households that report at least one familymember who had to miss school of work due to illness in
the last two weeksYes
Average malaria exposure*preventionindex
Months reported exposure to malaria (mosquito-bornedisease) *Owning at least one bed net indicator (have bed
net = 0.5, no bed net = 1)No, almost all households had bed nets
Percentage of households with reportedexposure to mosquito-borne and/or
water-borne disease
Percentage of households with reported exposure tomosquito-borne and/or water-borne disease
Replacement indicator for averagemalaria exposure * prevention index

Sustainability 2019, 11, 7141 10 of 20
Table 2. Cont.
Components Sub-Components Explanation of Sub-Component Whether Used in This Research
Social Networks
Average receive/give ratio Ratio of number of times help received/number of timeshelp given Yes, but adapted
Average borrow/lend money ratio Ratio of a household borrowing money in the past month toa household lending money in the past month Yes
Percentage of households that have notgone to their local government forassistance in the past 12 months
Percentage of households that reported that they have notasked their local government for any assistance in the past
12 monthsYes
Food
Percentage of households dependent onfamily farm for food
Percentage of households that get their food primarily fromtheir personal farms Yes
Average number of months householdsstruggle to find food
Average number of months households struggle to obtainfood for their family Yes
Average crop diversity index The inverse of (the number of crops grown by ahousehold +1)
Yes, but adapted to include a largerdiversity of food items to reflect ground
realities
Percent of households that do notsave crops
Percentage of households that do not save crops fromeach harvest Yes
Percent of households that do notsave seeds
Percentage of households that do not have seeds from yearto year Yes
Water
Percent of households reportingwater conflicts
Percentage of households that report having heard aboutconflicts over water in their community Yes
Percentage of households that utilize anatural water source Percentage of households that utilize a natural water source
Yes, but adapted to capture localdynamics associated with purchased
water and tube-well
Average time to water source (minutes) Average time it takes the households to travel to theirprimary water source Yes
Percentage of households that do nothave a consistent water supply
Percentage of households that report that water is notavailable at their primary water source everyday Yes
Inverse of the average number of liters ofwater stored per household
The inverse of (the average number of liters of water storedby each household +1) Yes

Sustainability 2019, 11, 7141 11 of 20
Table 2. Cont.
Components Sub-Components Explanation of Sub-Component Whether Used in This Research
Natural disasters andclimate variability
Exposure to natural disasters Total number of floods, droughts, and cyclones that werereported by households in the past six years
Yes, but adapted to capture localdynamics associated with drainage
congestion. In addition, the indicatorwas adapted to allocate higher scores tohouseholds exposed to a wider variety of
hazards
Percentage of households that did notreceive a warning about the pending
natural disasters
Percentage of households that did not receive a warningabout the pending natural disasters Yes
Percentage of households with an injuryor death as a result of the natural
disasters
Percentage of households with an injury or death as a resultof the natural disasters Yes
Mean standard deviation of the dailyaverage maximum temperature
Mean standard deviation of the daily average maximumtemperature by month No, data not available at polder-level
Mean standard deviation of the dailyaverage minimum temperature
Mean standard deviation of the daily average minimumtemperature by month No, data not available at polder-level
Mean standard deviation of averageprecipitation Mean standard deviation of average precipitation by month No, data not available at polder-level
Sustainability 2019, 11, 7141 12 of 20
The mathematical approach used for calculating LVI is as proposed by the authors of [30].This approach has been used widely (see [23,32] for reference). First, the sub-components werestandardized using the following formula:
IndexSp =
(Sp − Smin
)(Smax − Smin)
(1)
where Sp is the value of the sub-component for polder p, and Smax and Smin are the maximum andminimum values, respectively, for each sub-component for all of the four polders.
Second, an index was developed for each of the seven components by aggregating thesub-components for each component using the following formula:
Cp =
∑ni=1 IndexSpi
n(2)
where Cp is one the seven components (socio-demographic profile (SD), livelihood strategies (LS),social networks (SN), health (H), food (F), water (W), and natural disasters (ND)) for polder p; IndexSpi
represents the various subcomponents indexed by i, which make up each of the seven components,and n is the number of sub-components in each component.
Third, the LVI for each polder was calculated using the following formula:
LVIp =
∑71 Wm ∗ Cpi∑7
1 Wm(3)
where LVIp is the livelihood vulnerability index for polder p. It is equal to the weighted average of theseven components. Wm is the weight for each component. It is equal to the number of sub-componentsthat constitute each component of Cpi.
Interpretation of score—in general, the higher the score of the index, the more vulnerable thecorresponding polder is.
4. Results
4.1. Variation of Livelihood Vulnerability Over Time
The livelihood vulnerability of communities living in all four polders has reduced over time(Figure 2). However, polder 22 is currently the least vulnerable of all of the polders, and polder 21is currently the most vulnerable. Polder 22 has also witnessed the most reduction in vulnerabilityacross all four polders, and polder 21 the least. The trajectory of polder 21 is different from thatof the other three polders. The livelihood vulnerability of polders 24, 25, and 22 increased duringthe response-period, but then dropped significantly. In contrast, polder 21 has followed a differenttrajectory. The livelihood vulnerability levels in this polder dropped sharply between the two earlierperiods and then steadied at a level higher than the other three polders. The livelihood vulnerabilitylevels of polders 24 and 25 have interchanged between time-period three and time-period one. Polder25 is now more vulnerable than polder 24. In time-period three, the situation was the opposite. Polder24 was more vulnerable than polder 25.

Sustainability 2019, 11, 7141 13 of 20
Sustainability 2020, 12, x FOR PEER REVIEW 12 of 20
where S is the value of the sub-component for polder p, and S and S are the maximum and minimum values, respectively, for each sub-component for all of the four polders.
Second, an index was developed for each of the seven components by aggregating the sub-components for each component using the following formula: C = ∑ IndexSn (2)
where C is one the seven components (socio-demographic profile (SD), livelihood strategies (LS), social networks (SN), health (H), food (F), water (W), and natural disasters (ND)) for polder p; IndexS represents the various subcomponents indexed by i, which make up each of the seven components, and n is the number of sub-components in each component.
Third, the LVI for each polder was calculated using the following formula: LVI = ∑ W ∗ C∑ W (3)
where LVI is the livelihood vulnerability index for polder p. It is equal to the weighted average of the seven components. W is the weight for each component. It is equal to the number of sub-components that constitute each component of C .
Interpretation of score—in general, the higher the score of the index, the more vulnerable the corresponding polder is.
4. Results
4.1. Variation of Livelihood Vulnerability Over Time
The livelihood vulnerability of communities living in all four polders has reduced over time (Figure 2). However, polder 22 is currently the least vulnerable of all of the polders, and polder 21 is currently the most vulnerable. Polder 22 has also witnessed the most reduction in vulnerability across all four polders, and polder 21 the least. The trajectory of polder 21 is different from that of the other three polders. The livelihood vulnerability of polders 24, 25, and 22 increased during the response-period, but then dropped significantly. In contrast, polder 21 has followed a different trajectory. The livelihood vulnerability levels in this polder dropped sharply between the two earlier periods and then steadied at a level higher than the other three polders. The livelihood vulnerability levels of polders 24 and 25 have interchanged between time-period three and time-period one. Polder 25 is now more vulnerable than polder 24. In time-period three, the situation was the opposite. Polder 24 was more vulnerable than polder 25.
Figure 2. Variation of the LVI over time for the four study sites. Figure 2. Variation of the LVI over time for the four study sites.
How can this finding be explained? The community response in polders 24, 25, and 22 mayhave affected the trajectories of vulnerability in these three polders in comparison to polder 21. Thecommunity-led movement to prevent the entry of saline-water in polder 22 probably contributedsignificantly to such behavior in comparison to polders 21, 24, and 25. Polder 21 has witnessed theleast improvement in livelihood vulnerability levels, probably because the polder has allowed forthe uncontrolled in-flow of saline-water into its lands. Polders 24 and 25, in contrast, have optedfor a partial inflow of saline-water into their lands, which probably explains why their livelihoodvulnerability levels are between that of polders 21 and 22. The livelihood vulnerability levels of polders24 and 25 have interchanged between time-period three and time-period one. This is probably becauseof the difference in the behavior of local communities and public officials in these polders. Polders 24and 25 allowed for the controlled-entry of saline-water into its lands. However, in polder 24, whileearlier attempts at allowing for the entry of saline-water into the polder were successful, later attemptsby public officials were actively resisted by local communities. Thus, saline-water was allowed to enterinto only some of the lands on polder 24. This probably explains why polder 24 is more vulnerablethan polder 22, and less vulnerable than polder 21.
4.2. Variation of the 7 LVI Sub-Components Over Time
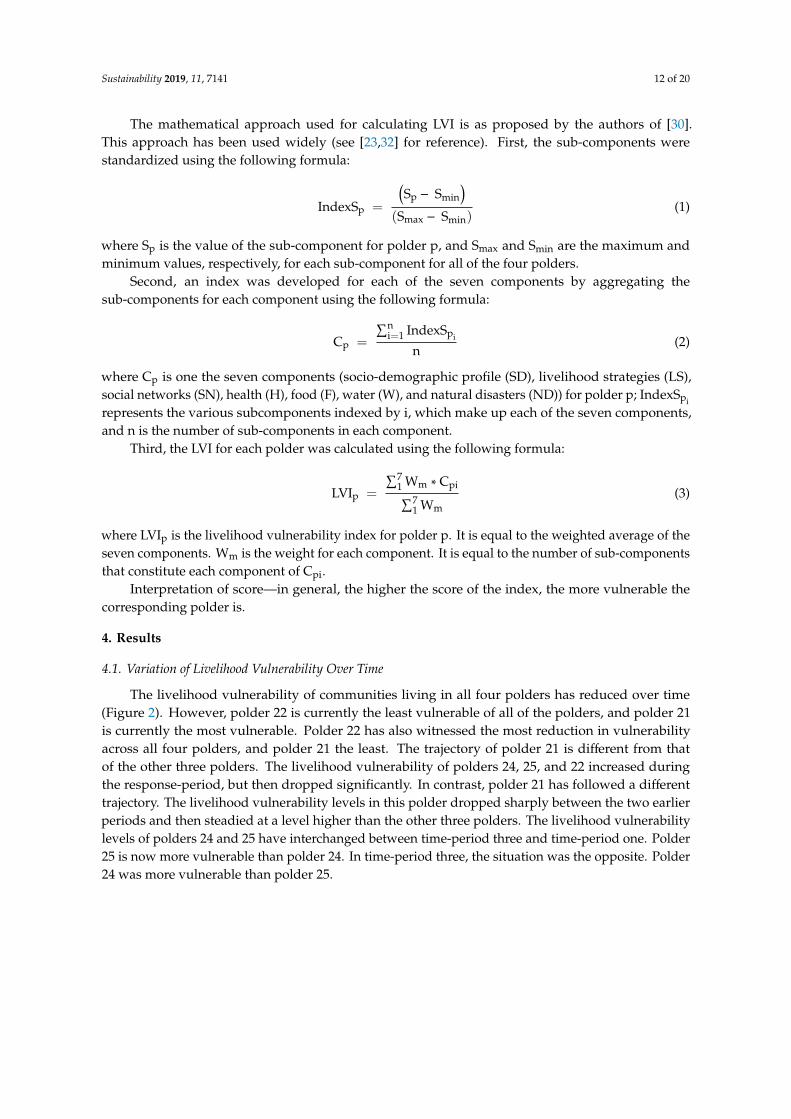
The livelihood vulnerability index (LVI) consists of multiple indicators grouped into sevensub-components, namely: socio-demographic profile, livelihood strategies, social networks, health,food, water, and natural disasters. Figure 2 illustrated the aggregated livelihood vulnerability levelsover time. Figure 3 breaks-down the aggregated score into seven different sub-components and mapsthese scores across the four polders over the three time-periods discussed earlier. Note, while thebehavior of polders can be compared with each other over time for each sub-component, the scorescannot be compared across the seven sub-categories.
Sustainability 2019, 11, 7141 14 of 20
Sustainability 2020, 12, x FOR PEER REVIEW 13 of 20
How can this finding be explained? The community response in polders 24, 25, and 22 may have affected the trajectories of vulnerability in these three polders in comparison to polder 21. The community-led movement to prevent the entry of saline-water in polder 22 probably contributed significantly to such behavior in comparison to polders 21, 24, and 25. Polder 21 has witnessed the least improvement in livelihood vulnerability levels, probably because the polder has allowed for the uncontrolled in-flow of saline-water into its lands. Polders 24 and 25, in contrast, have opted for a partial inflow of saline-water into their lands, which probably explains why their livelihood vulnerability levels are between that of polders 21 and 22. The livelihood vulnerability levels of polders 24 and 25 have interchanged between time-period three and time-period one. This is probably because of the difference in the behavior of local communities and public officials in these polders. Polders 24 and 25 allowed for the controlled-entry of saline-water into its lands. However, in polder 24, while earlier attempts at allowing for the entry of saline-water into the polder were successful, later attempts by public officials were actively resisted by local communities. Thus, saline-water was allowed to enter into only some of the lands on polder 24. This probably explains why polder 24 is more vulnerable than polder 22, and less vulnerable than polder 21.
4.2. Variation of the 7 LVI Sub-Components Over Time
The livelihood vulnerability index (LVI) consists of multiple indicators grouped into seven sub-components, namely: socio-demographic profile, livelihood strategies, social networks, health, food, water, and natural disasters. Figure 2 illustrated the aggregated livelihood vulnerability levels over time. Figure 3 breaks-down the aggregated score into seven different sub-components and maps these scores across the four polders over the three time-periods discussed earlier. Note, while the behavior of polders can be compared with each other over time for each sub-component, the scores cannot be compared across the seven sub-categories.
Figure 3. Variation of the seven sub-components of LVI over time for the four study-sites. Data renormalized in the range (0, 1) for visual clarity.
4.2.1. Variation of the Water Sub-Component.
The variation of the water sub-component of LVI mirrors the variation of LVI. The trajectory of polder 21 is different from that of the other three polders. The vulnerability of polders 24, 25, and 22 increased during the response-period, but then dropped significantly. In contrast, polder 21 followed a different trajectory. The vulnerability levels in this polder dropped sharply between the two earlier periods, and then increased. The vulnerability levels of polders B and C have interchanged between
Figure 3. Variation of the seven sub-components of LVI over time for the four study-sites. Datarenormalized in the range (0, 1) for visual clarity.
4.2.1. Variation of the Water Sub-Component
The variation of the water sub-component of LVI mirrors the variation of LVI. The trajectoryof polder 21 is different from that of the other three polders. The vulnerability of polders 24, 25,and 22 increased during the response-period, but then dropped significantly. In contrast, polder 21followed a different trajectory. The vulnerability levels in this polder dropped sharply between thetwo earlier periods, and then increased. The vulnerability levels of polders B and C have interchangedbetween time-period three and time-period one. Polder 25 is now more vulnerable than polder 24. Intime-period htree, the situation was opposite. Polder 24 was more vulnerable than polder 25.
How can this finding be explained? The similarity in variation between the water sub-componentand the aggregated LVI scores can be understood in terms of the fact that the water sub-componentpredominantly captures the vulnerabilities associated with the flow of saline-water into the polders.It is these dynamics that get reflected in the overall variation in the aggregated vulnerability levels.Salinity intrusion appears to be one of the primary reasons for the increase in vulnerability.
4.2.2. Variation of the Food Sub-Component
The variation of the food sub-component also mirrors the variation in aggregated LVI scores andthe variation in the water sub-component, as discussed earlier. The trajectory of polder 21 is differentfrom that of the other three polders. The vulnerability of polders 24, 25, and 22 increased duringthe response-period, but then dropped significantly. In contrast, polder 21 has followed a differenttrajectory. The vulnerability levels in this polder dropped sharply between the two earlier periods, andthen increased. The vulnerability levels of polders 24 and 25 have interchanged between time-periodthree and time-period one. Polder 25 is now more vulnerable than polder 24. In time-period three, thesituation was opposite. Polder 24 was more vulnerable than polder 25.
How can this finding be explained? The communities living in all four polders are predominantlyagricultural and fishing communities. They derive most of what they eat (their food) from their landand water. Thus, food vulnerability is intricately related to water vulnerability in all four polders.In other words, the presence of saline-water dramatically affects their access to food. The dynamicsassociated with saline-water and food also explains why the vulnerability associated with the foodsub-component for polder 22 is so low, compared with the other three polders. Polder 22 is the onlypolder of all the four polders that has never allowed saline-water to enter its lands. Saline-water
Sustainability 2019, 11, 7141 15 of 20
affects the vulnerability levels dramatically, probably because the introduction of saline-water affectsagricultural productivity. The staple diet for most of these communities is rice and fish. Saline-waterreduces rice cultivation and cuts-off the connection of these communities to their land. It forces themto go to the market for food, exposes them to the vagaries of the larger economic system and reducesself-sustainability, thus dramatically altering sustainability levels.
4.2.3. Variation of the Livelihood Strategies Sub-Component
The variation of the livelihood sub-component also mirrors the variation of aggregatedvulnerability levels and the variation in the water and food sub-components, as discussed earlier—withsome differences. The vulnerability levels in all four polders have fallen over time. However,vulnerability in polder 22 spiked during the response-period. This is in contrast to vulnerability in theother three polders, where the change is more gradual leading up to the response-period. In contrastto the earliest time-period where polder 22 was the least vulnerable, polder 22 is the most vulnerabilityduring the current times.
How can this finding be explained? Like food vulnerability, vulnerability associated withlivelihood strategies is closely related to water vulnerability. The introduction of saline-water affectslivelihood strategies, introduces the communities to shrimp farming, and reduces dependency onagriculture. It also forces communities to diversify their livelihood strategies. It is this diversification oflivelihood strategies, which probably explains why livelihood-wise, polder 22 appears more vulnerablethan the other three polders. Polder 22 was and continues to remain an agriculturally dependentpolder. However, saline-water plays a much greater role in the other three polders. Agriculture hasbeen severely affected there. This has forced communities to seek out a larger gamut of livelihoodstrategies, including migration.
4.2.4. Variation of the Health Sub-Component
The vulnerability of all four polders decreased during the response-period, but then increasedsignificantly. However, the vulnerability levels in polder 21 remained the highest throughout. Thevulnerability levels of polders 24 and 25 have interchanged between time-period three and time-periodone. The vulnerability levels in polders 21 and 22 are higher than polders 24 and 25 during currenttimes. They were also higher during the earliest time-period.
How can this finding be explained? The health vulnerability levels are higher in polders 21 and22, probably because both these polders are islands, whereas polders 24 and 25 are connected to themainland. Polders 24 and 25 are located closer to urban areas with better health facilities comparedwith polders 21 and 22.
4.2.5. Variation of the Socio-Demographic Sub-Component
All four polders have witnessed a steady decrease in socio-demographic vulnerability. However,in contrast to the trends for the other kinds of vulnerabilities, polder 21 is demonstrating a lowersocio-demographic vulnerability during current times compared with the other three polders. Polders21 and 22 have witnessed a more rapid reduction in socio-demographic vulnerability compared withpolders 24 and 25.
How can this finding be explained? The variations in socio-demographic vulnerability probablyreflect larger societal trends. In the past, amongst the four polders being studied, polder 21 was the leastaccessible from the regional centers of power. It attracted segments of society who were not acceptedby mainstream society. But, over time, as the arms of the state reached out to the remotest parts ofBangladesh, polder 21 and polder 22 got access to better education facilities. In contrast to polders 21and 22, polders 24 and 25 have always had greater access to such facilities, as they are located closer tothe regional centers of power. Over time, the socio-demographic gaps between the four polders havereduced considerably, and so have the differences in socio-demographic vulnerability amongst thefour polders. However, in recent years, a reverse action appears to be taking place in polders 21 and 22.

Sustainability 2019, 11, 7141 16 of 20
Polders 24 and 25 have a larger population of elderly family-members compared with polders 21 and22. This is probably because these polders are economically better-off compared with polders 21 and22, as they are located closer to urban centers and have greater access to higher-income and urbanlivelihood strategies. This enables families in polders 24 and 25 to have larger families, more children,and provide greater support for the elderly. The dependency ratios in polders 24 and 25 are thereforehigher than in 21 and 22. This is why the socio-demographic vulnerability of polders 24 and 25 incurrent times appears higher than that of polders 21 and 22.
4.2.6. Variation of the Social-Network Sub-Component
The social network vulnerability in polder 21 was the lowest amongst all four polders in all thethree periods. The social network vulnerability during the current time-period for polders 24, 25,and 22 are almost equal to each other. Social-network vulnerability in polder 24 has witnessed themost rapid reduction, but in current times, it is still higher than that of polder 21. The social networkvulnerability in polders 25 and 22 has not witnessed much variation over time.
How can this finding be explained? During current times, polder 21 is as isolated from the restof the country as it was decades ago. Amongst the four polders, this is the polder that is the mostdifficult to reach. During monsoons, this polder may become completely disconnected from the rest ofthe country. It is still economically less well-off than the other polders. In contrast, the other threepolders are thriving socially and economically. As in the past, in order to survive, the communities inthis polder have to depend on each other, even for the most basic needs. Social capital, therefore, hasremained high and at similar levels for long periods of time. Social-network vulnerability in polder 21has therefore remained the lowest, amongst all four polders.
4.2.7. Variation of the Natural Disasters Sub-Component
In the past, polders 21 and 22 were more vulnerable than polders 24 and 25. However, duringcurrent times, polders 24 and 25 are more vulnerable than polders 21 and 22.
How can this finding be explained? As polders 21 and 22 are islands and are located downstream,compared with polders 24 and 25, polders 21 and 22 have always been more vulnerable to coastalflooding and tropical storms. However, the construction of embankments has reduced coastal floodingin these two polders. In recent years, the coastal region has not witnessed large storms and wide-spreadflooding. Drainage congestion has always been high in polder 21. The residents of polder 21 havebecome accustomed to living in inundated lands. In contrast, drainage congestion is currently low inpolder 22. This probably explains why communities in polders 21 and 22 perceive themselves to bemore vulnerable in the past than they are now. In contrast, drainage congestion has been increasing inpolders 24 and 25. The communities in these polders, especially those of polder 24, are really worriedabout drainage congestion. They feel that their condition will continue to worsen. This probablyexplains why the communities in polders 24 and 25 perceive themselves to be more vulnerable thanpolders 21 and 22 during current times. The dramatic drop in (natural disaster-related) vulnerabilitylevels of polders 21 and 22 compared with polders 24 and 25 can also be probably attributed to thedevelopmental activities carried out in these polders during the response-period.
5. Discussion and Conclusions
As explained in the previous section, different polders have demonstrated different trajectoriesover time. The variation over time in the vulnerability of the communities living in these polders isassociated with the variation of hydrological conditions (salinity intrusion and drainage congestion)in these polders. Communities living in these polders have responded (self-organized or colludedwith various public agencies or refused to act) in order to shape the hydrological interventions (useof polder-infrastructure to control salinity intrusion) in the polders. Various societal factors (seeTable 3) appear to have moderated the association amongst the dependent variable (vulnerability)
Sustainability 2019, 11, 7141 17 of 20
and the independent variables (community responses, hydrological interventions, and hydrologicalconditions).
Table 3. Factors influencing vulnerability in polders.
Factor Affecting Polder Vulnerability Component of LVI
Hydrological interventions(use of polder-infrastructure to control
salinity intrusion)
Water sub-component Section 4.2.1
Food sub-component Section 4.2.2
Livelihood strategiessub-component Section 4.2.3
Macro-levelsocietal factors
Connectivity tomainland Health sub-component Section 4.2.4
Access to education andurbanization
Socio-demographicsub-component Section 4.2.5
Increased economicaffluence
Social-networksub-component Section 4.2.6
Ecological factors andstate-led developmental
activities
Natural disasterssub-component Section 4.2.7
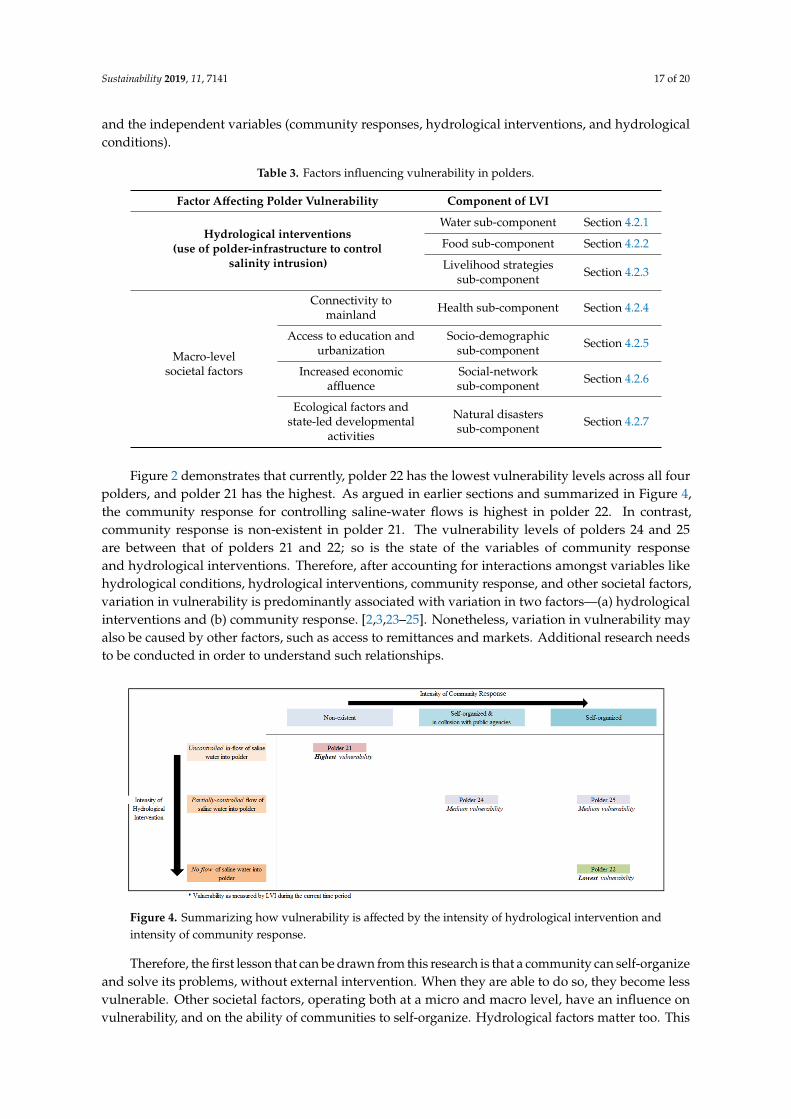
Figure 2 demonstrates that currently, polder 22 has the lowest vulnerability levels across all fourpolders, and polder 21 has the highest. As argued in earlier sections and summarized in Figure 4,the community response for controlling saline-water flows is highest in polder 22. In contrast,community response is non-existent in polder 21. The vulnerability levels of polders 24 and 25are between that of polders 21 and 22; so is the state of the variables of community responseand hydrological interventions. Therefore, after accounting for interactions amongst variables likehydrological conditions, hydrological interventions, community response, and other societal factors,variation in vulnerability is predominantly associated with variation in two factors—(a) hydrologicalinterventions and (b) community response. [2,3,23–25]. Nonetheless, variation in vulnerability mayalso be caused by other factors, such as access to remittances and markets. Additional research needsto be conducted in order to understand such relationships.Sustainability 2020, 12, x FOR PEER REVIEW 17 of 20
Figure 4. Summarizing how vulnerability is affected by the intensity of hydrological intervention and intensity of community response.
Therefore, the first lesson that can be drawn from this research is that a community can self-organize and solve its problems, without external intervention. When they are able to do so, they become less vulnerable. Other societal factors, operating both at a micro and macro level, have an influence on vulnerability, and on the ability of communities to self-organize. Hydrological factors matter too. This raises the following question: do such lessons apply in the face of climate change? Climate change is a reality that all communities living in coastal regions have to adapt to. In such areas, salinity intrusion will increase [9,10]. Drainage congestion could become a cause of concern in some polders, as is evident in the case of Bangladesh [9,10]. However, as this research demonstrates, empowering local communities to take their own decisions is one possible way to enable them to better adapt to climate change [38]. Therefore, we recommend that policymakers develop new measures for empowering polder dwellers by conducting capacity-building exercises targeted at civil society organizations working on polder-related matters.
The second lesson is about the phenomenon of tidal river management (TRM). In simple terms, TRM is the controlled release of river-water (and sediments) into the surrounding lands. Two of the four polders studied in this article (i.e., polders 24 and 25) have been associated with TRM-like practices. TRM has sometimes been touted as a successful strategy for simultaneously tackling the problems of drainage congestion, water-logging, and reduced river-flows in Bangladesh [17,18]. Tidal river management does solve these problems in the short-term. However, climate change complicates the situation. This is because TRM under the influence of climate change increases salinity intrusion into the polders, and dramatically alters the ways of life for local communities. This view is captured by the following reaction of one of the respondents interviewed for this research, namely, “We cannot eat prawns and shrimp all the time. We also need rice.”
In the long term, the controlled inflow of saline-water into polders provides a perverse incentive for the large-scale conversion of agricultural land into shrimp-farms. As discussed earlier, shrimp farming increases vulnerability levels amongst local communities [8,14,15]. Such changes are almost irreversible. Therefore, we recommend that before planning any new TRM-related activity in the polder areas, policy makers need to develop measures for mitigating the perverse impact of salinity intrusion on the vulnerability of polder dwellers.
This research demonstrates that vulnerability is the lowest in the polder (polder 22) that does not allow saline-water to flow into its lands. The situation is exactly the opposite in polder 21, which is characterized by innumerable breaches in its embankments. These breaches were created to increase the inflow of saline-water into the shrimp farms, which are ubiquitous in this polder. The contrast is particularly striking, because polders 21 and 22 are on opposite beds of the same river and are located in the same geographic location. What distinguishes one from the other is the level of community response and the level of hydrological intervention.
Figure 4. Summarizing how vulnerability is affected by the intensity of hydrological intervention andintensity of community response.
Therefore, the first lesson that can be drawn from this research is that a community can self-organizeand solve its problems, without external intervention. When they are able to do so, they become lessvulnerable. Other societal factors, operating both at a micro and macro level, have an influence onvulnerability, and on the ability of communities to self-organize. Hydrological factors matter too. This

Sustainability 2019, 11, 7141 18 of 20
raises the following question: do such lessons apply in the face of climate change? Climate change is areality that all communities living in coastal regions have to adapt to. In such areas, salinity intrusionwill increase [9,10]. Drainage congestion could become a cause of concern in some polders, as isevident in the case of Bangladesh [9,10]. However, as this research demonstrates, empowering localcommunities to take their own decisions is one possible way to enable them to better adapt to climatechange [38]. Therefore, we recommend that policymakers develop new measures for empoweringpolder dwellers by conducting capacity-building exercises targeted at civil society organizationsworking on polder-related matters.
The second lesson is about the phenomenon of tidal river management (TRM). In simple terms,TRM is the controlled release of river-water (and sediments) into the surrounding lands. Two ofthe four polders studied in this article (i.e., polders 24 and 25) have been associated with TRM-likepractices. TRM has sometimes been touted as a successful strategy for simultaneously tackling theproblems of drainage congestion, water-logging, and reduced river-flows in Bangladesh [17,18]. Tidalriver management does solve these problems in the short-term. However, climate change complicatesthe situation. This is because TRM under the influence of climate change increases salinity intrusioninto the polders, and dramatically alters the ways of life for local communities. This view is capturedby the following reaction of one of the respondents interviewed for this research, namely, “We cannoteat prawns and shrimp all the time. We also need rice”.
In the long term, the controlled inflow of saline-water into polders provides a perverse incentivefor the large-scale conversion of agricultural land into shrimp-farms. As discussed earlier, shrimpfarming increases vulnerability levels amongst local communities [8,14,15]. Such changes are almostirreversible. Therefore, we recommend that before planning any new TRM-related activity in thepolder areas, policy makers need to develop measures for mitigating the perverse impact of salinityintrusion on the vulnerability of polder dwellers.
This research demonstrates that vulnerability is the lowest in the polder (polder 22) that does notallow saline-water to flow into its lands. The situation is exactly the opposite in polder 21, which ischaracterized by innumerable breaches in its embankments. These breaches were created to increasethe inflow of saline-water into the shrimp farms, which are ubiquitous in this polder. The contrast isparticularly striking, because polders 21 and 22 are on opposite beds of the same river and are locatedin the same geographic location. What distinguishes one from the other is the level of communityresponse and the level of hydrological intervention.
Table 3 lists a wide range of factors that affect vulnerability in polders. However, vulnerabilitywithin polders can also be affected by other factors, such as government measures to redistribute Khasland amongst landless peasants to increase livelihood opportunities for such vulnerable populations.For instance, some scholars have argued that the self-sufficiency of such vulnerable populations hasincreased because of redistribution efforts [8]. However, as accurate data is not available on the amountof Khas land in Bangladesh (see [39]), and as there is no clarity on the amount of Khas land that hasbeen redistributed (see [39]), this research has not studied the effect of such redistribution efforts onlivelihood vulnerability in the polders. Additional research needs to be conducted in order to elucidatesuch relationships. Various kinds of technological interventions (such as automated sluicegates)may affect vulnerability levels in the polders. However, studying the relationship between suchtechnological interventions and vulnerability in polders is outside the scope of this article. Additionalresearch needs to be conducted to elucidate such relationships.
Supplementary Materials: The following are available online at http://www.mdpi.com/2071-1050/11/24/7141/s1: Appendix S1: Survey instrument: livelihood vulnerability index. Appendix S2: Questionnaire guide:semi-structured interviews.
Author Contributions: Conceptualization: S.N., F.v.L., and P.P.J.D.; data curation: S.N.; formal analysis: S.N.,F.v.L., and P.P.J.D.; funding acquisition: F.v.L.; investigation: S.N.; methodology: S.N., F.v.L., and P.P.J.D.; projectadministration: F.v.L.; validation: S.N.; writing (original draft): S.N., F.v.L., and P.P.J.D.
Sustainability 2019, 11, 7141 19 of 20
Funding: This research was funded by the Netherlands Organization for Scientific Research (NWO), grant numberW.07.69.201. The research is part of the Living Polders project, carried out by a consortium of partners. LivingPolders is part of NWO’s Urbanizing Deltas of the World (UDW) program.
Acknowledgments: We thank all respondents. We are grateful for the feedback we received from colleagues in theUDW Living Polders project and from participants in various stakeholder meetings, workshops, and conferences.We would also like to thank M. Shah Alam Khan, Dilip Datta, and their students for their thoughtful commentsduring various meetings.
Conflicts of Interest: The authors declare no conflicts of interest. The funder had no role in the design of thestudy; in the collection, analyses, or interpretation of data; in the writing of the manuscript; or in the decision topublish the results.
References
1. Neumann, B.; Vafeidis, A.T.; Zimmermann, J.; Nicholls, R.J. Future coastal population growth and exposure tosea-level rise and coastal flooding—A global assessment. PLoS ONE 2015, 10, e0118571. [CrossRef] [PubMed]
2. Adger, W.N.; Hughes, T.P.; Folke, C.; Carpenter, S.R.; Rockström, J. Social-ecological resilience to coastaldisasters. Science 2005, 309, 1036–1039. [CrossRef] [PubMed]
3. Renaud, F.G.; Syvitski, J.P.M.; Sebesvari, Z.; Werners, S.E.; Kremer, H.; Kuenzer, C.; Ramesh, R.; Jeuken, A.;Friedrich, J. Tipping from the Holocene to the Anthropocene: How threatened are major world deltas?Curr. Opin. Environ. Sustain. 2013, 5, 644–654. [CrossRef]
4. Nicholls, R.J.; Cazenave, A. Sea-level rise and its impact on coastal zones. Science 2010, 328, 1517–1520. [CrossRef]5. Inniss, L.; Simcock, A. The First Global Integrated Marine Assessment. World Ocean Assessment I; United Nations
Environmental Program: New York, NY, USA, 2016.6. Quassem, M.; van Urk, A.; van Alphen, J.; van Beek, E.; Taal, M. Participatory flood management: Comparative
study of the dutch and Bangladesh experience. In Floods, from Defence to Management; van Beek, E., Taal, M.,van Alphen, J., Eds.; Taylor & Francis: Leiden, The Netherlands, 2006; pp. 133–146.
7. Choudhury, N.Y.; Paul, A.; Paul, B.K. Impact of costal embankment on the flash flood in Bangladesh: A casestudy. Appl. Geogr. 2004, 24, 241–258. [CrossRef]
8. Paprocki, K.; Cons, J. Life in a shrimp zone: Aqua- and other cultures of Bangladesh’s coastal landscape.J. Peasant Stud. 2014, 41, 1109–1130. [CrossRef]
9. Auerbach, L.W.; Goodbred, S.L., Jr.; Mondal, D.R.; Wilson, C.A.; Ahmed, K.R.; Roy, K.; Steckler, M.S.; Small, C.;Gilligan, J.M.; Ackerly, B.A. Flood risk of natural and embanked landscapes on the Ganges–Brahmaputratidal delta plain. Nat. Clim. Chang. 2015, 5, 153–157. [CrossRef]
10. Alam, M.S.; Sasaki, N.; Datta, A. Waterlogging, crop damage and adaptation interventions in the coastalregion of Bangladesh: A perception analysis of local people. Environ. Dev. 2017, 23, 22–32. [CrossRef]
11. Das, D.; Mallick, B.; Vogt, J. Social process analysis in poverty alleviation program: A study of Khas-landdistribution in rural Bangladesh. J. Bangladesh Inst. Plan. 2012, 2075, 9363.
12. Wilson, C.; Goodbred, S.; Small, C.; Gilligan, J.; Sams, S.; Mallick, B.; Hale, R. Widespread infilling oftidal channels and navigable waterways in the human-modified tidal deltaplain of southwest Bangladesh.Elem.-Sci. Anthr. 2017, 5, 1–12. [CrossRef]
13. Ishtiaque, A.; Sangwan, N.; Yu, D.J. Robust-yet-fragile nature of partly engineered social-ecological systems:A case study of coastal Bangladesh. Ecol. Soc. 2017, 22. [CrossRef]
14. Akber, M.A.; Khan, M.W.R.; Islam, M.A.; Rahman, M.M.; Rahman, M.R. Impact of land use change onecosystem services of southwest coastal Bangladesh. J. Land Use Sci. 2018, 13, 238–250. [CrossRef]
15. Mukhopadhyay, A.; Hornby, D.D.; Hutton, C.W.; Lázár, A.N.; Johnson, F.A.; Ghosh, T. Land Cover andLand Use Analysis in Coastal Bangladesh. In Ecosystem Services for Well-Being in Deltas; Palgrave Macmillan:Cham, Switzerland, 2018; pp. 367–381.
16. Mutahara, M. Turning the tide. In The Role of Participation and Learning in Strengthening Tidal River Managementin the Bangladesh Delta; Wageningen University: Wageningen, The Netherlands, 2018.
17. Seijger, C.; Datta, D.K.; Douven, W.; van Halsema, G.; Khan, M.F. Rethinking sediments, tidal rivers anddelta livelihoods: Tidal river management as a strategic innovation in Bangladesh. Water Policy 2019, 21,108–126. [CrossRef]
18. Dewan, C.; Mukherji, A.; Buisson, M.-C. Evolution of water management in coastal Bangldesh: From temporaryearthen embankments to depoliticized community-managed polders. Water Int. 2015, 40, 401–416. [CrossRef]

Sustainability 2019, 11, 7141 20 of 20
19. Ayers, J. Resolving the Adaptation Paradox: Exploring the Potential for Deliberative AdaptationPolicy-Making in Bangladesh. Glob. Environ. Politics 2011, 11, 62–88. [CrossRef]
20. Huq, M.; Khan, M.F.; Pandey, K.; Ahmed, M.M.Z.; Khan, Z.H.; Dasgupta, S.; Mukherjee, N. Vulnerabilityof Bangladesh to Cyclones in A Changing Climate: Potential Damages and Adaptation Cost; The World Bank:Washington, DC, USA, 2010.
21. Sarker, M.N.I.; Wu, M.; Alam, G.M.M.; Shouse, R.C. Livelihood Vulnerability of Riverine-Island Dwellers inthe Face of Natural Disasters in Bangladesh. Sustainability 2019, 11, 1623. [CrossRef]
22. Abedin, M.A.; Habiba, U.; Shaw, R. Water Insecurity: A Social Dilemma, 1st ed.; Abedin, M.A., Ed.; InternationalEnvironment and Disaster Management Laboratory, Graduate School of Global Environment Studies, KyotoUniversity: Kyoto, Japan; Umma Habiba, International Environment and Disaster Management Laboratory,Graduate School of Global Environment Studies, Kyoto University: Kyoto, Japan; Rajib Shaw, InternationalEnvironment and Disaster Management Laboratory, Graduate School of Global Environmental Studies,Kyoto University: Kyoto, Japan; Emerald Group Publishing Limited: Bingley, UK, 2013; ISBN 9781781908839.
23. Panthi, J.; Aryal, S.; Dahal, P.; Bhandari, P.; Krakauer, N.Y.; Pandey, V.P. Livelihood vulnerability approach toassessing climate change impacts on mixed agro-livestock smallholders around the Gandaki River Basin inNepal. Reg. Environ. Chang. 2016, 16, 1121–1132. [CrossRef]
24. Miller, F.; Osbahr, H.; Boyd, E.; Thomalla, F.; Bharwani, S.; Ziervogel, G.; Walker, B.; Birkmann, J.; van derLeeuw, S.; Rockström, J.; et al. Resilience and Vulnerability: Complementary or Conflicting Concepts? Ecol.Soc. 2010, 15, 11. [CrossRef]
25. Adger, W.N. Vulnerability. Glob. Environ. Chang. 2006, 16, 268–281. [CrossRef]26. Keynotes: Polders of the World; Segeren, W.A. (Ed.) International Symposium: Lelystad, The Netherlands, 1982.27. Perry, M.; Canziani, O.; Palutikof, J.; Linden, P.V.D.; Hanson, C. Climate Change 2007: Impacts, Adaptation
and Vulnerability: Contribution of Working Group II to the Fourth Assessment Report of the IntergovernmentalPanel on Climate Change; Cambridge University Press for the Intergovernmental Panel on Climate Change:Cambridge, UK, 2007; ISBN 0521705975.
28. IPCC. Climate Change 2001: Impacts, Adaptation, and Vulnerability; Cambridge University Press: Cambridge,UK, 2001.
29. Hahn, M.B.; Riederer, A.M.; Foster, S.O. The Livelihood Vulnerability Index: A pragmatic approach toassessing risks from climate variability and change—A case study in Mozambique. Glob. Environ. Chang.2009, 19, 74–88. [CrossRef]
30. Scoones, I. Sustainable Rural Livelihoods: A Framework for Analysis; IDS Working Paper 72; Institute ofDevelopment Studies: Brighton, UK, 1998.
31. Turner II, B.L. Vulnerability and resilience: Coalescing or paralleling approaches for sustainability science?Glob. Environ. Chang. 2010, 20, 570–576. [CrossRef]
32. Shah, K.U.; Dulal, H.B.; Johnson, C.; Baptiste, A. Understanding livelihood vulnerability to climate change:Applying the livelihood vulnerability index in Trinidad and Tobago. Geoforum 2013, 47, 125–137. [CrossRef]
33. Alwang, J.; Siegel, P.B.; Jorgensen, S.L. Vulnerability: A View from Different Disciplines; The World Bank:Washington, DC, USA, 2001.
34. Brooks, N.; Neil Adger, W.; Mick Kelly, P. The determinants of vulnerability and adaptive capacity at thenational level and the implications for adaptation. Glob. Environ. Chang. 2005, 15, 151–163. [CrossRef]
35. GED. Bangladesh Delta Plan 2100: Draft; Bangladesh Planning Commission: Dhaka, Bangladesh, 2017.36. BWDB. Final Report, Volume VIII: Social & Environmental Reports, Coastal Embankment Improvement Project,
Phase-I (CEIP-I); Bangladesh Water Development Board: Dhaka, Bangladesh, 2012.37. IWM. Final Report, Main Report, Feasibility Study and Detailed Engineering Design for Long Term Solution of
Drainage Problems in the Bhabodah Area; Institute of Water Modeling: Dhaka, Bangladesh, 2010.38. Ostrom, E. A Polycentric Approach for Coping with Climate Change; The World Bank: Washington, DC, USA, 2009.39. Herrera, A. Access to khas land in Bangladesh: Discussion on the opportunities and challenges for landless
people. In Essay on Development Policy: NADEL MAS-Cycle 2014-2016; ETH Zurich: Zurich, Switzerland,2016; pp. 1–29.
© 2019 by the authors. Licensee MDPI, Basel, Switzerland. This article is an open accessarticle distributed under the terms and conditions of the Creative Commons Attribution(CC BY) license (http://creativecommons.org/licenses/by/4.0/).
Copyright © 2022 FDOKUMEN