Career Advancement for Construction Executives - Hornberger ...
Upload
khangminh22Category
view
3download
0
CARE India Solutions for Sustainable Development
E-46/12, Okhla Industrial Area-II
New Delhi - 110020
Division of Hindustan Thompson Associate Pvt. Ltd
8, Balaji Estate, Guru Ravidass Marg, Kalkaji,
New Delhi 110019
Kutch Livelihood and Education Advancement Project (K-LEAP)
Endline Evaluation Study
Report of Findings

Endline Evaluation Study: K-LEAP Final Report
IMRB International 2
TABLE OF CONTENTS
LIST OF TABLES .............................................................................................................................................................. 4
LIST OF FIGURES ............................................................................................................................................................ 5
LIST OF ABBREVIATIONS................................................................................................................................................. 6
EXECUTIVE SUMMARY ................................................................................................................................................... 7
CHAPTER 1 : INTRODUCTION .......................................................................................................................... 9
1.1 BACKGROUND ................................................................................................................................................. 10
1.2 KEY PURPOSE OF THE EVALUATION .................................................................................................................. 11
1.3 LAYOUT OF THE REPORT .................................................................................................................................. 12
CHAPTER 2 : RESEARCH METHODOLOGY .................................................................................................. 13
2.1 STUDY DESIGN AND TARGET GROUP ................................................................................................................ 14
2.2 GEOGRAPHICAL COVERAGE .............................................................................................................................. 15
2.3 SAMPLE SIZE ESTIMATION ................................................................................................................................ 16
2.4 SAMPLING METHODOLOGY.............................................................................................................................. 18
CHAPTER 3 : PROJECT IMPLEMENTATION AND DATA COLLECTION ................................................... 19
3.1 PRE-TESTING OF TOOLS .................................................................................................................................... 20
3.1.1. Objectives of Pre-testing .................................................................................................................................... 20
3.1.2. Pre-testing Exercise ........................................................................................................................................... 20
3.2 MAIN FIELDWORK ........................................................................................................................................... 21
3.2.1. Team Recruitments and Trainings ..................................................................................................................... 21
3.2.2. Data Collection .................................................................................................................................................. 22
3.2.3. Ethical Consideration and Confidentiality ......................................................................................................... 22
3.3 DATA MANAGEMENT....................................................................................................................................... 23
3.4 QUALITY CONTROL AND MONITORING ............................................................................................................. 24
CHAPTER 4 : CHARACTERISTICS OF THE SURVEY RESPONDENTS AND HOUSEHOLD PROFILE ..... 25
4.1. Demographic profile of the members of household .............................................................................................. 26
4.2. Ethnicity of the respondents and BPL status of households .................................................................................. 27
4.3. Type of house ......................................................................................................................................................... 28
4.4. Type of fuel for cooking and main source of drinking water ................................................................................. 28
4.5. Household membership in various committees ..................................................................................................... 30
4.6. Household income levels ........................................................................................................................................ 31
CHAPTER 5 : KEY FINDINGS – LIVESTOCK AND AGRICULTURE ............................................................ 32
5.1. Need for agriculture and livelihood intervention ................................................................................................... 33
5.2. Key findings – Livestock.......................................................................................................................................... 36
5.3. Key findings – Agriculture ...................................................................................................................................... 42
CHAPTER 6 : KEY FINDINGS – MICRO FINANCE ........................................................................................ 47
6.1. Need for micro finance ........................................................................................................................................... 48
6.2. Microfinance Federation ........................................................................................................................................ 48
6.3. Demographic profile of the respondents ............................................................................................................... 50
6.4. Self Help Group characteristics .............................................................................................................................. 50

Endline Evaluation Study: K-LEAP Final Report
IMRB International 3
CHAPTER 7 : KEY FINDINGS – EDUCATION................................................................................................. 55
6.1. Need for education initiative ................................................................................................................................. 56
6.2. Education scenario in primary schools ................................................................................................................... 57
6.3. Kasturba Gandhi Balika Vidyalaya (KGBV) and Primary Schools ........................................................................... 58
6.4. Classroom observations ......................................................................................................................................... 59
6.5. Impact – KGBVs and Primary Schools .................................................................................................................... 59
6.6. Scenario among adolescent girls ........................................................................................................................... 61
6.7. Adolescent Girls Learning Centres ......................................................................................................................... 61
6.8. Impact of AGLCs ..................................................................................................................................................... 63
6.9. School Management Committees (SMCs).............................................................................................................. 64

Endline Evaluation Study: K-LEAP Final Report
IMRB International 4
LIST OF TABLES
Table 1 Block wise number of sampled PSUs ......................................................................................... 15
Table 2 Sample size for quantitative component ..................................................................................... 16
Table 3 Sample size for qualitative component ....................................................................................... 17
Table 4 Main source of drinking water ................................................................................................... 28
Table 5 Type of fuel mainly used for cooking......................................................................................... 28
Table 6 Membership of household members in village level groups/ committees ................................. 30
Table 7 Awareness about gram sabha and frequency of attending it ...................................................... 31
Table 8 Livestock characteristics ............................................................................................................. 36
Table 9 Awareness about K-LEAP services and their availing ............................................................... 37
Table 10 Livestock insurance and livestock loan .................................................................................... 39
Table 11 Decision making ....................................................................................................................... 40
Table 12 Awareness and accessibility of livestock related personnel ..................................................... 41
Table 13 Crop characteristics .................................................................................................................. 43
Table 14 Awareness about K-LEAP services and their availing ............................................................. 44
Table 15 Agricultural loans ..................................................................................................................... 45
Table 16 Decision making ....................................................................................................................... 45
Table 17 Initiation of SHG ...................................................................................................................... 50
Table 18 Key activities carried out by SHG ............................................................................................ 51
Table 19 Key motivators behind joining the SHG .................................................................................. 51
Table 20 Type of training received .......................................................................................................... 52
Table 21 Type of loan taken by respondents during past three years ...................................................... 52
Table 22 Decision making ....................................................................................................................... 53
Table 23 Household visits of key personnel in relation to child’s education .......................................... 58
Table 24 Viewpoint regarding various services under K-LEAP ............................................................. 58
Table 25 Key activities conducted at AGLCs ......................................................................................... 61
Endline Evaluation Study: K-LEAP Final Report
IMRB International 5
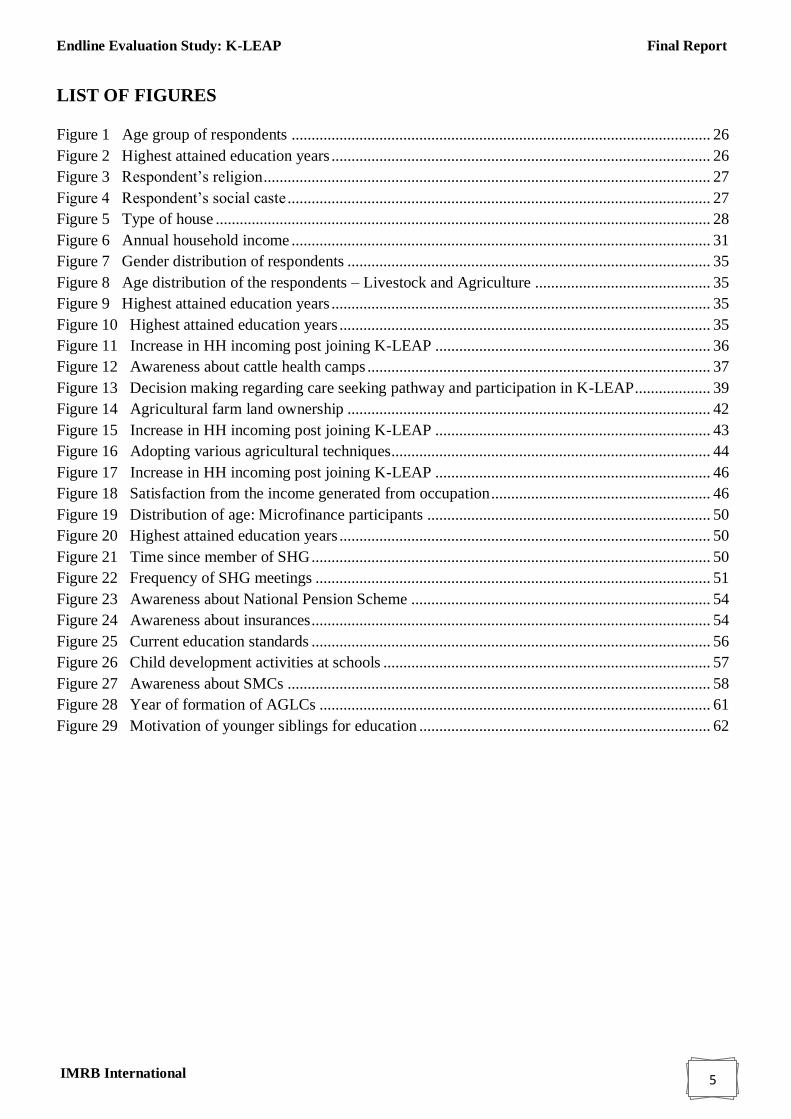
LIST OF FIGURES
Figure 1 Age group of respondents ......................................................................................................... 26
Figure 2 Highest attained education years ............................................................................................... 26
Figure 3 Respondent’s religion ................................................................................................................ 27
Figure 4 Respondent’s social caste .......................................................................................................... 27
Figure 5 Type of house ............................................................................................................................ 28
Figure 6 Annual household income ......................................................................................................... 31
Figure 7 Gender distribution of respondents ........................................................................................... 35
Figure 8 Age distribution of the respondents – Livestock and Agriculture ............................................ 35
Figure 9 Highest attained education years ............................................................................................... 35
Figure 10 Highest attained education years ............................................................................................. 35
Figure 11 Increase in HH incoming post joining K-LEAP ..................................................................... 36
Figure 12 Awareness about cattle health camps ...................................................................................... 37
Figure 13 Decision making regarding care seeking pathway and participation in K-LEAP ................... 39
Figure 14 Agricultural farm land ownership ........................................................................................... 42
Figure 15 Increase in HH incoming post joining K-LEAP ..................................................................... 43
Figure 16 Adopting various agricultural techniques................................................................................ 44
Figure 17 Increase in HH incoming post joining K-LEAP ..................................................................... 46
Figure 18 Satisfaction from the income generated from occupation ....................................................... 46
Figure 19 Distribution of age: Microfinance participants ....................................................................... 50
Figure 20 Highest attained education years ............................................................................................. 50
Figure 21 Time since member of SHG .................................................................................................... 50
Figure 22 Frequency of SHG meetings ................................................................................................... 51
Figure 23 Awareness about National Pension Scheme ........................................................................... 54
Figure 24 Awareness about insurances .................................................................................................... 54
Figure 25 Current education standards .................................................................................................... 56
Figure 26 Child development activities at schools .................................................................................. 57
Figure 27 Awareness about SMCs .......................................................................................................... 58
Figure 28 Year of formation of AGLCs .................................................................................................. 61
Figure 29 Motivation of younger siblings for education ......................................................................... 62
Endline Evaluation Study: K-LEAP Final Report
IMRB International 6
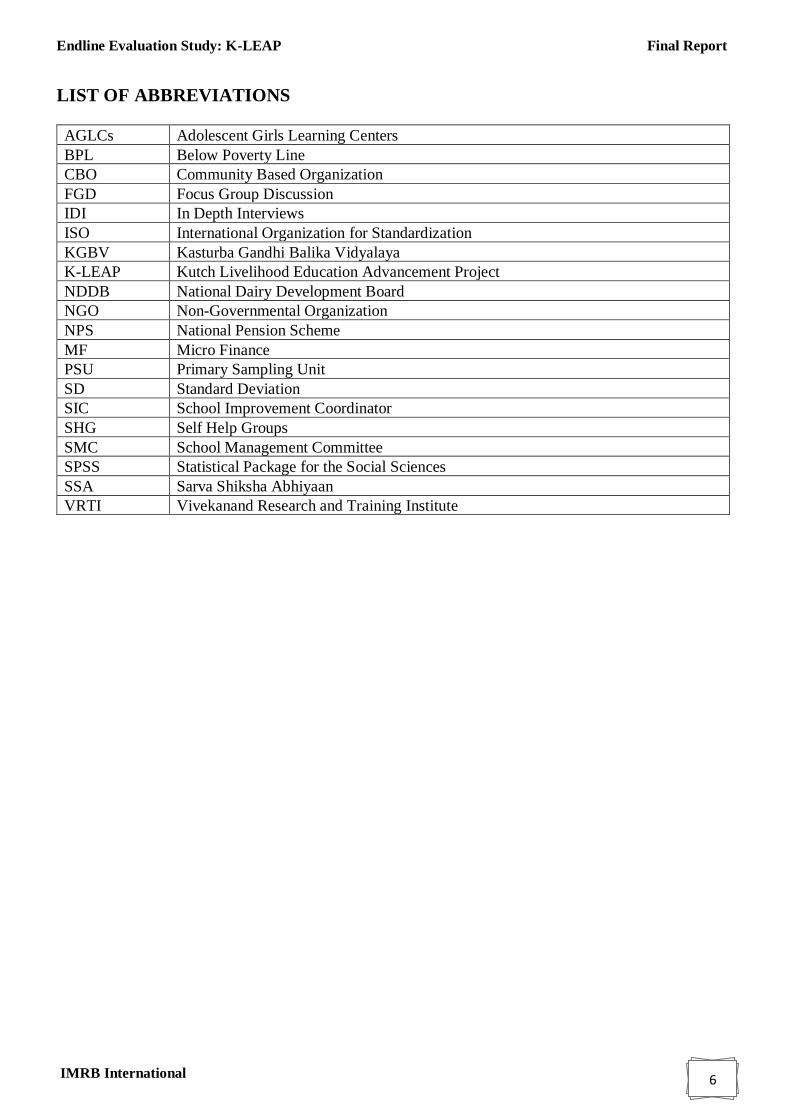
LIST OF ABBREVIATIONS
AGLCs Adolescent Girls Learning Centers
BPL Below Poverty Line
CBO Community Based Organization
FGD Focus Group Discussion
IDI In Depth Interviews
ISO International Organization for Standardization
KGBV Kasturba Gandhi Balika Vidyalaya
K-LEAP Kutch Livelihood Education Advancement Project
NDDB National Dairy Development Board
NGO Non-Governmental Organization
NPS National Pension Scheme
MF Micro Finance
PSU Primary Sampling Unit
SD Standard Deviation
SIC School Improvement Coordinator
SHG Self Help Groups
SMC School Management Committee
SPSS Statistical Package for the Social Sciences
SSA Sarva Shiksha Abhiyaan
VRTI Vivekanand Research and Training Institute

Endline Evaluation Study: K-LEAP Final Report
IMRB International 7
Executive Summary
This endline study was an attempt for measuring the extent to which the stated goals and objectives of the
K-LEAP had met and contributed towards increasing the income of the families, thereby resulting in
improving the quality of the life. As highlighted across various sections of the report, it was observed that
involvement in K-LEAP positively impacted the life of participants and also increased their household
income. Various initiatives undertaken as a part of K-LEAP are sustainable and have the potential to be
replicated in future.
In order to access the effectiveness of the various components of the project and to access whether multiple
memberships had any effect on living standards, we analysed the levels of current household income of
the respondents by cross tabulating it with the data of multiple membership as well as with the data of
various combination of the project component. Analysis of the data suggested that multiple memberships
of household in various initiatives had a positive relation to the household income. The households which
had participants associated with only one component were found to have a comparatively lower level of
average annual household income than the households where participants had multiple memberships.
Further synthesis of data suggested that irrespective of the fact that all the components of K-LEAP were
successful in enhancing the quality of life; the one combination which worked best was that of agriculture
and dairy component of K-LEAP. The households which had participants with this combination reported
a higher average annual household income than those with other combinations.
How did the initiatives performed individually?
Various activities undertaken under livelihood initiative led to an increase of livestock ownership and
better animal healthcare in the region. The dairy initiative was also highly successful intervention and most
of the livestock participants reported an increased milk production and were benefitted from the milk
marketing initiative. The linkage with formal dairy market has helped increase the prices of milk sold by
the livestock participants. Tie-ups with SARHAD Dairy and National Dairy Development Board (NDDB)
provided a ready market for milk for the milk producers. Trainings provided for improving the fat content
helped in increasing the fat content in the milk in the region which in turn helped in increasing the milk
prices.
In relation to the animal healthcare, para vet services were introduced which enabled livestock owners to
receive treatment for their cattle on time and lead to a regular vaccination of their cattle. Demand for breed
improvement services like artificial insemination spiked. Training provided for proper animal healthcare
enhanced the knowledge of the livestock owners and made them aware regarding the proper animal
healthcare practices. Cattle feed is now available at centres at the village and the members no more have
to travel far to buy cattle feed which has reduced the cost for each of the bags.
Agriculture initiatives too positively impacted the life of participants and by various activities undertaken,
ensured better irrigation facilities, better availability of seeds and led to a better return for farmers for their
produces. The Agro Service Centres created under K-LEAP have acted as a main source for purchasing
hybrid seeds. Around 70% of the participants who were involved in cultivation of cotton mentioned Agro
Service Centres as a main source for purchasing hybrid seeds. Services such as SMS based agriculture
updates, training on agriculture increased knowledge and awareness of the participants.
Micro Finance Federation was incorporated with a long term goal of providing financial services in the
Kutch district. The federation has contributed towards emancipation of its participants by forming SHGs.

Endline Evaluation Study: K-LEAP Final Report
IMRB International 8
Due to this women frequently step out of the house for meetings. This may not reflect drastic
empowerment, but at a setting where women are expected to confine themselves to the household chores,
such a change is certainly commendable. Their appreciation in perception as well as concrete benefits of
being part of the SHGs was unequivocal during the discussions.
The education initiative had a positive impact on the participants as it helped them perform better at school
and made learning interesting for them. Girl’s education level in primary schooling outclassed the boys.
AGLCs irrespective of new implementation helped in improving knowledge and skills of adolescents in
the implementation areas.
Few suggestions:
Additionally, there were a few suggestions made by different stakeholders while interactions during the
group discussions and interviews. The suggestions have been listed as follows:
a. Education initiatives should involve all the villagers at all levels of the program and should begin at
village level. This it will include most crucial stakeholders for making the program more effective
b. Villagers should be trained as para teachers to meet the needs of inadequate teachers in school
c. Program co-ordinators should be assigned lesser number of schools for better execution next time if
the program is implemented
d. Training on computers should be initiated as technology is very important nowadays
e. Support should be provided for starting a computer lab
f. Agricultural marketing can be introduced in the future and agro centres can also focus on agricultural
products
g. Producer Company can expand its reach to benefit higher number of villagers
Focus on staff retention is needed to continue operating the agro-centres, producer company, MF
federation effectively and their proper monitoring as it was observed that there were frequent changes in
program co-ordinators during the time the program was ongoing
Endline Evaluation Study: K-LEAP Final Report
IMRB International 9
Chapter 1 : Introduction
Endline Evaluation Study: K-LEAP Final Report
IMRB International 10
1.1 Background
Background and context of the study
A joint initiative of CARE and Cargill, the Kutch Livelihood and Education Advancement Project (K-
LEAP), was implemented in five blocks of Kutch district in Gujarat, India. Launched in the year 2008, the
key focus of this program was primarily on economic development of rural households and education for
primary school children. Following were the two key goals set by K-LEAP at its inception:
• To empower 9,000 families and marginalized local communities of 225 villages and to improve the
sustainable livelihood opportunities in five blocks of Kutch district of Gujarat in India
• To improve the quality and accessibility of primary education for over 43,000 children in 122 formal
schools
K-LEAP provided an improved schooling and learning opportunities to over 43,000 primary school
children and has created profitable economic opportunities for over 9,000 rural families in 225 villages,
identified on the basis of their fragile livelihood options and social and economic disparity.
K-LEAP livelihood programs, engaged with small and marginal farmers for improving agriculture
practices and infrastructure through various interventions such as farm bund, land reclamation, irrigation
facilities and capacity building to improve land productivity and fertility besides increasing profit margins
by supporting them with appropriate market information and value addition facilities. K-LEAP dairy
interventions focused on strengthening market systems at villages, ensuring availability extension services
for vaccination, breed improvement through artificial insemination, fodder and feeder shops and milk
collection facility. The project established a producer company to sustain the initiatives undertaken under
agriculture and dairy activities.
Micro finance interventions assisted women to establish and revive Self Help Groups (SHGs) for savings
and credit facilities. Besides providing opportunities for commencing household business activities, the
project also with the help of women formed member owned and controlled micro finance federation to
sustain micro finance activities.
K-LEAP education activities focused on improving schooling activities for children by improvising
teaching methods, teaching aids and equipping schools with recreational and learning facilities and
supporting teachers to adopt child centered teaching and class room management practices. The project
also aimed to increase retention of children at school besides mainstreaming children dropped out of
school. To achieve this program worked with formal school children, established Adolescent Girls
Learning Centers (AGLCs), supported Kasturba Gandhi Balika Vidyalaya (KGBV) schools and trained
School Management Committee (SMCs) members.

Endline Evaluation Study: K-LEAP Final Report
IMRB International 11
1.2 Key purpose of the evaluation
Understanding the effectiveness of any project and evaluating its impact on the target group is essential.
The results from such an exercise not only help programmers to understand the strengths and the
weaknesses of the project, but also help implementers in revising the strategy, if needed. The findings at
times also serve as a benchmark for setting targets for future projects.
The current endline evaluation study was conducted across the five blocks of Kutch district in Gujarat
where K-LEAP was implemented by CARE. The main purpose of the evaluation was to assess the extent
to which the project activities contributed in increasing the household income, in improving the quality of
life of the households by achieving the stated goal and objectives and in improving the quality and
accessibility of primary education. Apart from this, gaining an understanding of how the dairy, micro
finance, agriculture and education activities, which were carried out as a part of K-LEAP, helped the
communities was intended.
Research Objectives
The broad objectives of the evaluation was to measure how project helped communities in increasing their
access to practical needs (financial, technical and managerial expertise) and strategic needs (community
organizations, advocacy efforts in recognition of women contribution in economic activities)
• What was the increase in household income achieved by the project through its livelihood, dairy and
agriculture activities?
• To what extent project increased capacities of a family to increase household earning? What are the
livelihood options made available to them including financing mechanism either to commence or
strengthen existing livelihood activities?
• What are the participant’s perceptions on activities undertaken by K-LEAP to achieve its objectives,
whether it was adequate enough to deliver expected outputs, outcomes and capable of leading to
increased income?
• What were the changes in strategic activities pursued by the project to achieve its goals?
• How the project activities contributed towards improving quality of learning at public schools and
its impact on retention and enrolment rates of children at schools particularly female children.
• Whether the project activities helped in greater recognition of female literacy and positively
influenced household decisions in sending their children to school?
• How increased household income is helping families to improve the quality of life? (How the family
uses additional income for what purposes?)
• Whether the changes or impacts achieved at household level are sustainable or transitory? What are
the products, services and institutional arrangements are made available to help families in sustaining
the impacts?
• How the project increased community access to various agriculture and dairy extension services and
what were resources leveraged for complementing project activities
• How project activities led to greater recognition of women’s rights to access, control and ownership
of livelihoods and related resources

Endline Evaluation Study: K-LEAP Final Report
IMRB International 12
1.3 Layout of the report
The first chapter helps in understanding the background of the study, its rationale and the research
objectives. The second chapter provides an overview of the research methodology utilized and elaborates
upon the study design, target groups, sample size estimation and sampling methodology. Information
regarding the project implementation and data management has been put in chapter three. The subsequent
chapters present findings of the survey. In chapter 4, the characteristics of surveyed respondents and
household profile have been discussed. The participant group wise findings of the study have been
presented in the subsequent chapters. It starts with the chapter 5 which presents the key findings from
livestock and agriculture segments. Next two chapters’ viz. chapter 6 and chapter 7 present the key research
findings from microfinance and education segments. Across all the chapters both the quantitative findings
as well as qualitative findings have been presented.

Endline Evaluation Study: K-LEAP Final Report
IMRB International 13
Chapter 2 : Research Methodology

Endline Evaluation Study: K-LEAP Final Report
IMRB International 14
2.1 Study design and Target group
A cross sectional design was adopted in this study, covering households in the selected Primary Sampling
Units (PSUs) of the five blocks of Kutch district of Gujarat state by utilizing both quantitative and
qualitative methods of data collection. Under the quantitative component, the structured household
interviews were conducted with program participants (involved in the livelihood related to livestock,
agriculture and microfinance) whereas for education group, mother/primary care giver of children and
adolescents girls was interviewed. As a part of qualitative component, In Depth Interviews (IDIs) and
Focus Group Discussion (FGDs) were carried out with program stakeholders and participants at district,
block and community levels.
K-LEAP END LINE EVALUATION STUDY
Review of existing secondary documents related to education, livestock,
agriculture and micro finance specific to Gujarat state in particular to Kutch
district
Primary Data Collection through Quantitative and Qualitative
Methods
Household Interviews
Stakeholder interview at
community level
Stakeholder interview at block level
Stakeholder interview at district level
Stru
ctu
red
Inte
rvie
ws
In-d
epth
Inte
rvie
ws
(Qu
alit
ativ
e)
In-d
epth
Inte
rvie
ws
(Qu
alit
ativ
e)
In-d
epth
Inte
rvie
ws
and
FG
D (
Qu
alit
ativ
e)

Endline Evaluation Study: K-LEAP Final Report
IMRB International 15
2.2 Geographical Coverage
The study was conducted across selected five blocks viz. Adbasa,
Lakhpat, Mandvi, Mundra and Nakhatrana of Kutch district of Gujarat
where K-LEAP was implemented.
Table 1 Block wise number of sampled PSUs
S.
no. District Block name
Sampled PSUs
Total Agriculture Livelihood Micro-finance Education
SIC AGLC
1 Kutch Adbasa 17 2 5 4 2 4
2 Kutch Lakhapat 14 3 5 2 2 2
3 Kutch Mandvi 11 3 3 3 2 0
4 Kutch Mundra 12 3 4 3 2 0
5 Kutch Nakhtarana 9 2 4 3 0 0
Total 63* 13 21 15 8 6
*An additional PSU was selected for those PSUs where the total numbers of participants as per MIS list were less than 22
Endline Evaluation Study: K-LEAP Final Report
IMRB International 16
2.3 Sample Size Estimation
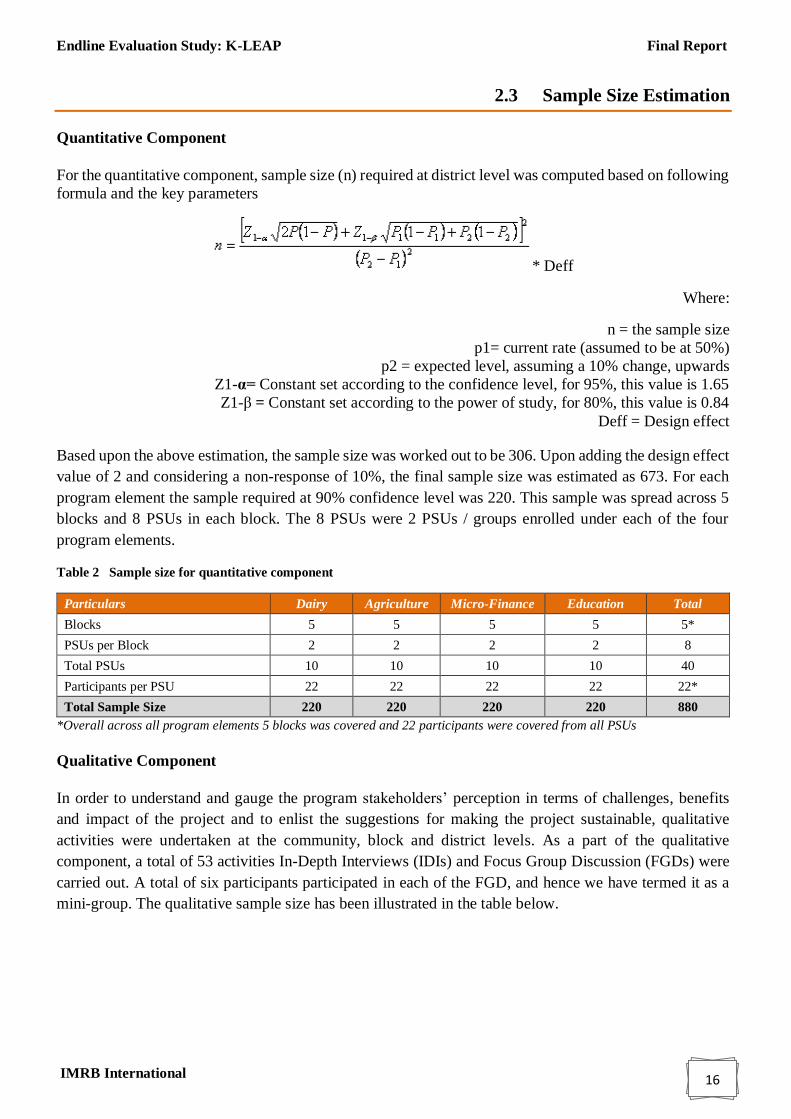
Quantitative Component
For the quantitative component, sample size (n) required at district level was computed based on following
formula and the key parameters
* Deff
Where:
n = the sample size
p1= current rate (assumed to be at 50%)
p2 = expected level, assuming a 10% change, upwards
Z1-α= Constant set according to the confidence level, for 95%, this value is 1.65
Z1-β = Constant set according to the power of study, for 80%, this value is 0.84
Deff = Design effect
Based upon the above estimation, the sample size was worked out to be 306. Upon adding the design effect
value of 2 and considering a non-response of 10%, the final sample size was estimated as 673. For each
program element the sample required at 90% confidence level was 220. This sample was spread across 5
blocks and 8 PSUs in each block. The 8 PSUs were 2 PSUs / groups enrolled under each of the four
program elements.
Table 2 Sample size for quantitative component
Particulars Dairy Agriculture Micro-Finance Education Total
Blocks 5 5 5 5 5*
PSUs per Block 2 2 2 2 8
Total PSUs 10 10 10 10 40
Participants per PSU 22 22 22 22 22*
Total Sample Size 220 220 220 220 880
*Overall across all program elements 5 blocks was covered and 22 participants were covered from all PSUs
Qualitative Component
In order to understand and gauge the program stakeholders’ perception in terms of challenges, benefits
and impact of the project and to enlist the suggestions for making the project sustainable, qualitative
activities were undertaken at the community, block and district levels. As a part of the qualitative
component, a total of 53 activities In-Depth Interviews (IDIs) and Focus Group Discussion (FGDs) were
carried out. A total of six participants participated in each of the FGD, and hence we have termed it as a
mini-group. The qualitative sample size has been illustrated in the table below.

Endline Evaluation Study: K-LEAP Final Report
IMRB International 17
Table 3 Sample size for qualitative component
Target respondents No. Activity type
Program Officials 2 IDIs
Government Officials 1 IDIs
Coordinators at Block Level 10 IDIs with a block coordinator for each program element (2)
in each of the 5 blocks
Key Stakeholder 3 IDIs with local govt. officials, market actors-from
banks/dairy
Teachers 4 IDIs with KGBV teachers
Classroom/School observations 4 At KGBV schools
Mentors/teachers 1 Mini-Groups-AGLC
Adolescent girls 2 Mini-Groups
Women leaders/Office bearers of institutions
managed by K-LEAP 5
IDIs with women leaders/office bearers of community and
institutions managed by K-LEAP
Producer Company and Micro Finance Federation 4 IDIs
Community Leaders 3 Mini-Groups
SHG members 3 Mini-Groups
SMC Members and teachers 5 Mini-Groups
Farmers Groups 3 Mini-Groups
Livestock Groups 3 Mini-Groups
Total Sample Size 53

Endline Evaluation Study: K-LEAP Final Report
IMRB International 18
2.4 Sampling Methodology
This study utilized a three staged sampling methodology, as illustrated in the ensuing paragraphs:
Stage 1: Selection of the blocks
The selection of block was purposive in nature and was completely based on the blocks where K-LEAP
was implemented.
Stage 2: Selection of the PSUs
The selection of PSUs was done by using Probability Proportion to Size (PPS) sampling technique from
the PSU wise participant list provided by the CARE team, which served as a sampling frame. A total of
64 PSUs were selected covering each of the four K-LEAP category. As discussed earlier, an additional
PSU was also selected for those PSUs where the total number of participants as per MIS list was less than
22.
Step 4: Selection of the participant households
In each of the selected PSU, target participant were randomly selected based upon the participant list
provided by the CARE team. A total of 22 participants HHs were covered in each of the selected PSU and
in case of a shortfall of participant households, a nearby selected PSU was approached to cover the
shortfall. In all the cases where it was observed that at a selected HH, participants belonging to multiple
K-LEAP initiatives were present (scenarios of multiple membership), all of them were covered and
interviewed.

Endline Evaluation Study: K-LEAP Final Report
IMRB International 19
Chapter 3 : Project Implementation and Data
Collection

Endline Evaluation Study: K-LEAP Final Report
IMRB International 20
3.1 Pre-testing of Tools
Prior starting the main fieldwork, pre-testing exercise was conducted under real field settings and involved
the same process that was followed during the main data collection. All the findings from pre-testing were
documented and incorporated in the final version of the questionnaires.
3.1.1. Objectives of Pre-testing
The pre-testing exercise was conducted to gather information mainly on the following points:
o Flow of the questions
o Ease in understanding the questions by the respondents
o Ease in administering of the questionnaire
o Length and time required in administering of the questionnaire
o Comprehensiveness in terms of information coverage
o Skipping, additional instructions etc. required for field interviewers o Testing of the language used and appropriateness of translations
3.1.2. Pre-testing Exercise
The draft research tools for undertaking the pretesting were developed by IMRB team while taking into
account the objectives of the survey and width of the information sought. After getting an approval from
CARE team on the questionnaires, the draft version of research tools were translated into local language
(Gujarati) for utilization during pre-testing exercise.
Pre-testing was undertaken in four villages of Naliya cluster of Abdasa block. It was ensured that the
villages selected for the pre-test were not among the sampled villages to be covered during the main survey.
A total of 21 interviews were conducted during the pre-test, covering all the four participant groups. Two
researchers travelled from New Delhi to Bhuj in order to undertake the pre-test. One day training of
investigators was organized prior to the pre-testing at Bhuj.

Endline Evaluation Study: K-LEAP Final Report
IMRB International 21
3.2 Main Fieldwork
3.2.1. Team Recruitments and Trainings
The recruitment of the field teams was done from the pool of investigators who possessed significant
experience in conducting social studies in Gujarat state and in order to confront rejections and drop-outs,
10% buffer resources were recruited. Gender distribution was maintained and both male investigators as
well as female investigators were considered for recruitment based on the following criterion:
o Educational Qualification (graduates or above were preferred)
o Experience in the field of social research
o Willingness and enthusiasm shown for the study
o Respect for ethics
o Communication skills (expressiveness of thoughts and ability to communicate purpose of the study)
o Attitude (intention to put in long hours of work)
o Willingness to work with the target community
o Other factors like convincing appearance and friendly body language and gestures
Final selection of the interviewers and supervisors was made based on their understanding and execution
of the sampling techniques, questionnaires and exhibition of interviewing skills during the field training
exercise. A list of the selected investigators was provided to CARE team after making their final selection
post completion of the training program. Keeping in view the timelines of the study, for quantitative
survey, a total of five teams with a composition of 4:1 (4 investigators and 1 supervisor) were deployed
on field while 3 teams consisting of one researcher and one moderator each were deployed for the
qualitative survey.
Field Team Trainings
In order to make investigators well acquainted with the tools, they were extensively trained prior to the
launch of the fieldwork. Separate trainings were organized for different components of this study i.e.
quantitative component and qualitative component. All the necessary documents were received from the
CARE team viz. approval on final questionnaire and on the sampled PSUs before the training of survey
teams. A brief manual explaining all the sections of questionnaire was prepared by the researchers from
IMRB which was used as a base for making investigators fully adept at using research tools. The training
manual included the field protocols to be followed and standard quality norms to be adhered.
Quantitative Survey Training
The field work for this study was managed by IMRB field office at Ahmedabad, Gujarat and considering
the same a three days training of field investigator was organized at Ahmedabad under the guidance of
CARE project team. The training sessions were undertaken jointly by members of CARE team and
researchers from IMRB.
Qualitative Survey Training
Two days training for the qualitative moderators was organized at Naliya (Adbasa block) of Kutch district.
The training was led by researchers from IMRB and the participants were briefed on the qualitative
discussion guides and questionnaires.

Endline Evaluation Study: K-LEAP Final Report
IMRB International 22
3.2.2. Data Collection
The quantitative research tools for this study, after being pre-tested were finalized in consultation with
CARE. The final translated version of the questionnaires was utilized for the training of the field teams
and post completion of the training; the field work was launched across all the selected blocks. The
duration of the fieldwork activities for the quantitative component of the study was two weeks.
The qualitative discussion guides and questionnaires were prepared by IMRB researchers and were shared
with the CARE team for their perusal and feedback. Upon their finalization, the training for the qualitative
component of the study was undertaken with the participation of professional qualitative research
moderators. All the qualitative interactions on field were audio recorded after availing informed consent
for the same from the respondents. The transcriptions of the audio files were undertaken by a professional
transcription team. The qualitative component of the fieldwork was undertaken for ten days post
completion of the qualitative training.
3.2.3. Ethical Consideration and Confidentiality
Ethical protocols were laid down and followed throughout the course of this study. Entire project team
working on the study including all the staff and freelancers maintained integrity and confidentiality of the
data collected. Informed consent was taken from each and every participant, wherein the purpose of the
assessment was explained. Their willingness to participate was asked and interview was conducted only if
the respondent gave their consent for the same. The respondents were also informed about the risks and
benefits for participating in this assessment. It was also clearly mentioned that they could decide anytime
during the interview not to respond or discontinue the interview. Confidentiality of the identification
details of the respondents was maintained and hence information collected could not be linked to any
individual respondent. All interviews were conducted in the vernacular language.
o An informed consent was taken from all the respondents before the interviews were conducted
o The name, and the contact details of the respondents were kept anonymous and no information
about their responses was released to a third party
o In order to not infringe upon the work schedules of the respondents, the field team made multiple
visits, so that they can take interviews when respondents were not preoccupied

Endline Evaluation Study: K-LEAP Final Report
IMRB International 23
3.3 Data Management
Data Scrutiny and Coding
All data entry forms were assigned a unique study identification number (study ID) to assist with data
management and data entry. Before data entry, each and every questionnaire was scrutinized. All coders
and supervisors who received training from the systems analyst were involved in scrutiny and coding.
During the scrutiny, open-ended responses were coded. All questionnaires were checked to ensure that
they had been assigned a study ID and that there was no identifying information for respondents recorded
on the questionnaire.
Data Entry
The data structure was developed by IMRB’s research team prior to start of the data entry. The data entry
operation was carried out using data entry and editing software - FoxPro and was completed on password-
protected computers. The data entry operation was initiated post completion of the data collection, data
scrutiny and data coding. Program-based logical checks were used to clean the data and the inconsistencies
were resolved on the basis of the responses recorded in the questionnaires. The system analyst for the study
as well as the core research team members closely monitored the data entry. Post completion of the data
entry, column wise ASCII data was fetched and it was read by using Quantum and SPSS software. The
final data analysis was done by using SPSS software.
Data Confidentiality
To avoid risks associated with the disclosure of sensitive information, every effort was made to ensure that
participant’s responses were kept confidential. Completed questionnaires, field notes and other study
results were kept locked in a dedicated storage facility and access to these was limited to the Principal
Investigator and to the data management consultant. The computer files containing participant data were
password protected and all personal identifiers (except study ID) were removed from analytic files. The
final data set was only accessed by IMRB staff and was hand over to CARE team. Names were not
recorded in any document and data was reported in aggregate form only. The research team was
responsible for data storage after the completion of the study.

Endline Evaluation Study: K-LEAP Final Report
IMRB International 24
3.4 Quality Control and Monitoring
Field department of IMRB has obtained International Organization for Standardization (ISO) certification
after developing conformance standards over the years. The field teams comprised of four levels of staff
who were involved in the data collection and monitoring of the data collection process. At the central level,
research team consisting of research manager and research associate, closely monitored the entire process
of data collection.
At the state level, all aspects of fieldwork was supervised and controlled by the field executive - the officer
in charge of the field who was responsible for maintaining the overall quality of data collection. Field
executive was on field during the fieldwork and coordinated with the research team regularly. Each team
of field investigators was led by a supervisor who supervised the fieldwork for his/her team. The main role
played by supervisor was to see if the investigators were comfortable with the flow of the questionnaire,
were canvassing the questions as they should be and were recording the responses correctly. Supervisors
back-checked/ accompanied 25% of all interviews to ensure that data was collected as per the study
requirements. They also carried out on-field quality checks, apart from 10% spot checks, to ensure data
quality.
Spot checks, in this context, refer to making sure that the investigators were filling the research tools
properly and conducting the interviews in identified locations/households. In an accompaniment the
supervisor accompanied the investigator to see whether the screening was done properly. Back checks
were done after an interview was completed. The supervisor went to the same household and after ensuring
that the household has indeed been covered, asked key questions from the questionnaire to ensure correct
responses. The supervisors conducted the back checks during the time when the team was working in the
same village, so that discrepancy if any were rectified in the village itself.
Adding to this, route plans and field updates were shared regularly to CARE officials for monitoring
purposes. For quality assurance and close monitoring of the fieldwork, one researcher of IMRB research
team was deployed on field throughout the duration of the fieldwork. Guidance from the CARE officials
was also sought as and when required throughout the fieldwork.

Endline Evaluation Study: K-LEAP Final Report
IMRB International 25
Chapter 4 : Characteristics of the Survey
Respondents and Household Profile

Endline Evaluation Study: K-LEAP Final Report
IMRB International 26
Characteristics of survey respondents and household profile
This subsection presents demographic and socioeconomic characteristics of the surveyed respondents. As
a part of this study, a total of 880 households were approached for interview across five selected blocks of
Kutch district. Basic demographics relating to which information was captured in this study and has been
presented in this section comprised of respondent’s gender, age group, educational levels, religion, social
category, occupation etc.
4.1. Demographic profile of the members of household
As illustrated above, a total of 880 households covering a population of 4,832 were visited and information
on age, sex, education, occupation was collected. The mean size of the households covered under the study
was five (SD=+2.09). More than half (56.9%) of the sampled households had a family size of less than or
equal to 5 members while a little higher than two fifth households (41.1%) had 6 – 10 members in their
family. Small percentage (1.9%) had a family of more than 10 members.
The figure below shows proportions of different age groups of the household members in the sampled
population. As illustrated, a high percentage of the household members were less than 14 years of age
(27.6%). This was followed by the ones who were in the age group of 15-24 years (23.2%). Mean age of
household members upon analysis came out to be 28 years. Analysis of data by gender indicated that an
equal proportion of male and female family members were present in the surveyed households (Male:
50.1%; Females: 49.9%).
Close to three-fifth of the household members (58.5%) were ‘currently married’. The percentage of
unmarried members were close to two fifth (39.2%) and a very few percentages were
widowed/separated/divorced (2.2%).
Question related to highest standard of completed education was administered to all the members who
were aged more than five years of age on the date of survey. It was found that more than two out of ten
household members (22.1%) had attained education for less than a year. Mostly the years of completed
education were either between one to five years (29.8%) or between six to eight years (26.4%). Very low
percentages reported being educated beyond 12 years (3.5%).
27.6
23.215.8
13.4
20.0
Age group of household members
Less than 14 years 15 to 24 years25 to 34 years 35 to 44 yearsMore than 45 years
Base (All HH members): 4832*Figures in %age
Figure 1 Age group of respondents
22.1
29.826.4
18.23.5
Highest education attainment
Less than one year Between 1-5 yearsBetween 6-8 years Between 9-12 years12 years and above
Base (All HH members>5 years): 4544*Figures
in %age
Figure 2 Highest attained education years

Endline Evaluation Study: K-LEAP Final Report
IMRB International 27
Findings reflect an improvement in the level of education from the baseline figures where more than
two-fifth of the population was illiterate and around a quarter had their primary education.
4.2. Ethnicity of the respondents and BPL status of households
The survey captured information related to religion and
social caste of the head of the household. At an overall
level, Hinduism and Islam were the two main religions
observed. While more than three-fourth households
followed Hinduism (78.1%), a little over one-fifth
households (21.7%) followed Islam.
Caste wise analysis indicated mostly the households
belonged either to General category (43.0%) or Other
Backward Caste (42.7%) category. Further, at an overall
level, close to six households out of ten were Above
Poverty Line (APL) households (57.3%) while nearly two
fifth households were a Below Poverty Line (BPL)
household (39.3%).
Upon cross tabulating the social caste data with the status of the household, it was observed that in General
category the households were mostly APL (68.5%) while the OBC households had nearly an equal
distribution of BPL (49.2%) and APL (47.2%) households. Percentage of APL category households was
again higher (53.5%) in Scheduled Caste households than BPL category (42.3%).
78.1
21.7
0.2
Religion of the respondents
Hindu Muslim Others
Base (All HHs): 880*Figures in %age
Figure 3 Respondent’s religion
Figure 4 Respondent’s social caste
43.0 42.7
11.12.1 1.1
General Other Backward Caste Scheduled caste Scheduled tribe No Response
0.0
25.0
50.0
75.0
100.0
Base (All HHs): 880*Figures in %age

Endline Evaluation Study: K-LEAP Final Report
IMRB International 28
4.3. Type of house
In order to classify a house as pucca1, semi-pucca2 or kachha3, the material used for constructing walls
and roof was observed. The assessment of the type of construction material and thereby the type of house
was based upon investigator’s observation.
Overall, a majority of the households were semi-pucca
(54.6%) followed by the ones who were pucca (30.1%)
and kachha (15.3%). More than nine out of ten Hindu
households were pucca (90.2%) while Muslim
households were mostly kachha (40.7%).
The baseline finding reflected that most of the
households were semi-pucca houses (71%). Findings
from our study indicates that the proportion of semi-
pucca houses have gone down (54.6%) while that of
pucca households have gone up (30.1%).
Mostly the households were ‘owned’ (97.2%) and very
low percentages reported them being ‘rented’ (2.6%). The mean number of rooms in a house was two and
in close to two-third households (63.3%), a separate room was being used as a kitchen.
4.4. Type of fuel for cooking and main source of drinking water
Most of the households reported electricity as the main source of lighting (94.7%). It was observed that
nearly all the households were electrified across the study blocks barring Lakhapat where kerosene was
the main source of lighting in more than one-fourth households (25.4%). When asked about type of fuel
mainly used for cooking, more than three-fourth households (76.7%) reported using ‘wood’. Use of
‘LPG/Natural gas’ was prevalent in around 16% households.
Household electrification has increased in the study blocks as compared to the baseline survey which
showed that 81% households were electrified.
1 Pucca Houses: All the houses where both walls and roof were made of high quality materials viz. burnt bricks, cement bricks,
metal/asbestos sheets, stones (duly packed with lime or mortar) and concrete. 2 Semi Pucca Houses: All the houses where a mix of low and high quality materials was utilized for constructing walls and roof. 3 Kachha Houses: The houses where both walls and roof were made of low quality materials viz. grass, leaves, reeds, bamboo,
mud, unburnt bricks, wood.
Table 4 Main source of drinking water Table 5 Type of fuel mainly used for
cooking
Characteristics
Characteristics
BASE: All households 880
BASE: All households 880
Piped water into dwelling yard/plot 63.2
Wood 76.7
Public tap/stand pipe 19.7
LPG/Natural Gas 16.4
Dug well - protected 5.6
Charcoal 2.8
15.3
54.6
30.1
Type of house
Kachha Semi-pucca Pucca
Base (All HHs): 880Figures in %
Figure 5 Type of house

Endline Evaluation Study: K-LEAP Final Report
IMRB International 29
Tanker /truck 2.8
Electricity/Heater 2.3
Tubewell or borewell 2.3
Bio gas/ Gobar gas 1.0

Endline Evaluation Study: K-LEAP Final Report
IMRB International 30
Analysis of the data corresponding to drinking water sources reveals that more than nine out of ten
households (92.5%) were using an improved source of drinking water while the usage of unimproved
sources remained limited to 7.5%. An improved source of drinking water includes, water piped into the
dwelling, yard or plot, water available from a public tap or standpipe, a tube well or borehole, a hand
pump, a protected dug well, a protected spring, and rainwater. The most common improved source of
drinking water was piped water into dwelling yard/plot (63.2%). Close to one-fifth households (19.7%)
obtained their drinking water from public tap/stand pipe, as could be seen from the adjacent table.
All the respondents were further asked whether in their household, purification of drinking water was
being done. Analysis indicates that at an overall level in two-third households (66.9%), drinking water was
purified prior drinking and key method used for purification was ‘straining through a cloth’ (90.7%).
Indicators in context of drinking water and its purification have improved. During the baseline survey,
dependency on public tap was highest (40%) while practice of purifying drinking water was deemed as
‘poor’ and close to two-third households had reported that they do not purify drinking water.
4.5. Household membership in various committees
The survey also accessed membership of respondents/any member of their household in various village
level groups/committee. Mostly the members of the interviewed households were member of at least one
group/committee and a low percentage of households (9%) were identified where none of the member was
a part of any of the group/committee. At an overall level, SHG was a group/committee which had highest
membership percentages. Respondents from more than one third households (36.9%) reported that at least
one member of their household was a member of SHG. This was followed by the membership of household
members in farmers committee (32.5%) and in livestock rearer committee (26.8%). In one household out
of ten, members were also found to be a part of AGLCs (9.9%) and dairy co-operatives (9.6%).
Table 6 Membership of household members in village level groups/ committees
Characteristics All
BASE: All households 880
Women Self Help Group 36.9
Farmers committee 32.5
Livestock rearer committee 26.8
Adolescents Girls Learning Centres (AGLC) 9.9
Dairy Co-operative 9.6
More than two third households (71.4%) were aware about gram sabhas and expect for a little more than
one fifth (21.2%), rest all had attended gram sabhas some or the other time, as could be seen below.
An increased awareness about gram sabhas existed among the households than the baseline survey
where around 64% households were aware about gram sabhas.
Endline Evaluation Study: K-LEAP Final Report
IMRB International 31
Table 7 Awareness about gram sabha and frequency of attending it
Characteristics All
Awareness about gram sabha
BASE: All households 880
Aware 71.4
Not Aware 28.5
Frequency of attending gram sabha
BASE: All households aware about gram sabha 628
Once 26.4
Twice 27.6
Thrice 15.3
Four times 4.8
More than four times 4.8
None 21.2
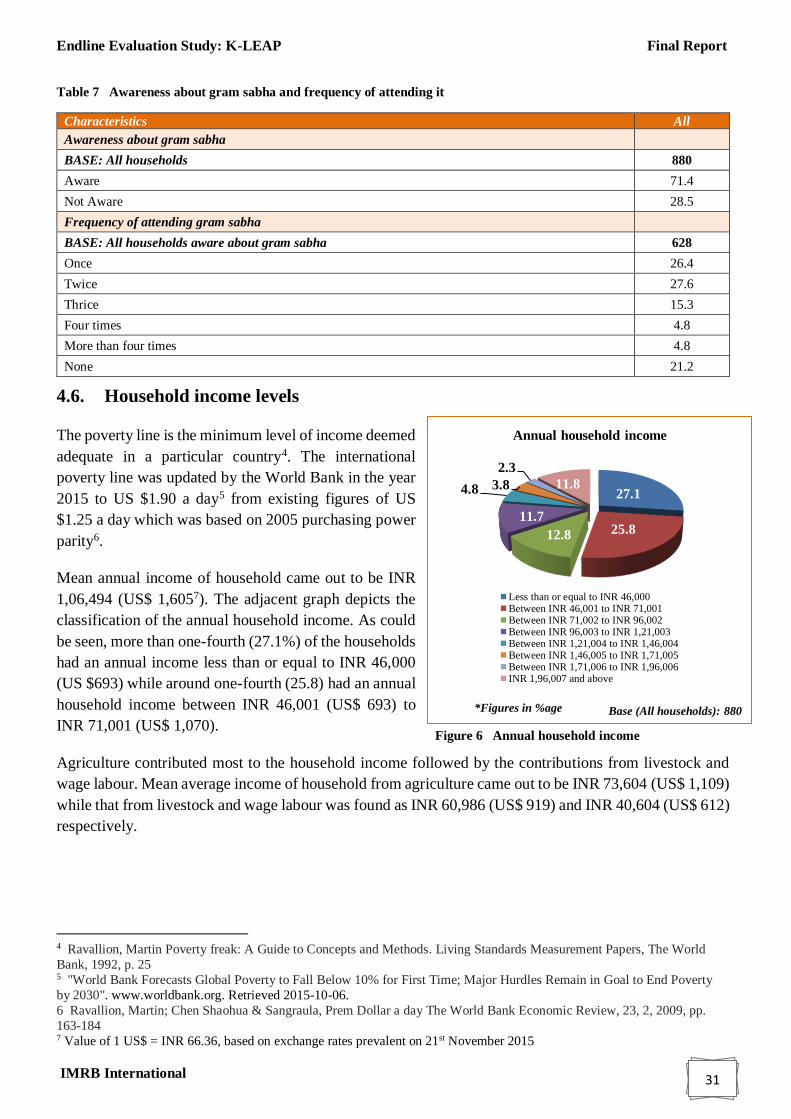
4.6. Household income levels
The poverty line is the minimum level of income deemed
adequate in a particular country4. The international
poverty line was updated by the World Bank in the year
2015 to US $1.90 a day5 from existing figures of US
$1.25 a day which was based on 2005 purchasing power
parity6.
Mean annual income of household came out to be INR
1,06,494 (US$ 1,6057). The adjacent graph depicts the
classification of the annual household income. As could
be seen, more than one-fourth (27.1%) of the households
had an annual income less than or equal to INR 46,000
(US $693) while around one-fourth (25.8) had an annual
household income between INR 46,001 (US$ 693) to
INR 71,001 (US$ 1,070).
Agriculture contributed most to the household income followed by the contributions from livestock and
wage labour. Mean average income of household from agriculture came out to be INR 73,604 (US$ 1,109)
while that from livestock and wage labour was found as INR 60,986 (US$ 919) and INR 40,604 (US$ 612)
respectively.
4 Ravallion, Martin Poverty freak: A Guide to Concepts and Methods. Living Standards Measurement Papers, The World
Bank, 1992, p. 25 5 "World Bank Forecasts Global Poverty to Fall Below 10% for First Time; Major Hurdles Remain in Goal to End Poverty
by 2030". www.worldbank.org. Retrieved 2015-10-06.
6 Ravallion, Martin; Chen Shaohua & Sangraula, Prem Dollar a day The World Bank Economic Review, 23, 2, 2009, pp.
163-184 7 Value of 1 US$ = INR 66.36, based on exchange rates prevalent on 21st November 2015
27.1
25.812.8
11.7
4.8 3.8
2.3
11.8
Annual household income
Less than or equal to INR 46,000Between INR 46,001 to INR 71,001Between INR 71,002 to INR 96,002Between INR 96,003 to INR 1,21,003Between INR 1,21,004 to INR 1,46,004Between INR 1,46,005 to INR 1,71,005Between INR 1,71,006 to INR 1,96,006INR 1,96,007 and above
Base (All households): 880*Figures in %age
Figure 6 Annual household income
Endline Evaluation Study: K-LEAP Final Report
IMRB International 32
Chapter 5 : Key Findings – Livestock and
Agriculture

Endline Evaluation Study: K-LEAP Final Report
IMRB International 33
Key findings – Livestock and Agriculture
Agriculture refers to the process of cultivating the soil for growing crops for sustenance and/or economic
gain. The primary aim of agriculture is to make the land productive and to protect it from deterioration and
misuse. Agricultural practices include irrigation, crop rotation, application of fertilizers and pesticides
which have evolved over the years. Agriculture is one of the major occupations of the Indian population,
employing approximately 56% of population.
Livestock farming includes rearing of animals for food and other related uses. It is a key livelihood and
risk mitigation strategy for small and marginal farmers. Livestock rearing has evolved as artificial
insemination, embryo transfer technique and better fodder for the animals which has improved the overall
livestock rearing practices. Livestock rearing helps beneficiaries economically and supplies them food
throughout the year.
5.1. Need for agriculture and livelihood intervention
K-LEAP has helped in changing the prevalent practices and has guided the villagers to adopt newer
methods for improving their lives. There was a need to introduce the agriculture and livestock interventions
in the Kutch district because of the following reasons:
a. High dependence on rain – Kutch region is a rain fed area and agriculture is dependent on rain for
irrigation due to lack of other irrigation facilities. Kutch region is prone to receiving irregular rainfall
which impacts the agriculture produce in that area. This has a direct impact on the income of the
people who rely on agriculture for their livelihood.
b. Lack of preparedness of farmers – Farmers usually purchase and sow the seeds after the first or
second rainfall as they are not prepared for sowing the seeds before the rains. This practice was
followed to avoid loss as it is difficult to predict the rainfall in the region.
c. Animal healthcare – It was difficult to get the services of veterinary doctors in Kutch due to the
huge demand supply gap in the area. For instance, only one veterinary doctor was available for 165
villages in the Kutch region. This made it difficult for villagers to avail the service of the veterinary
doctor who could not cover the entire region.
d. Lack of awareness of government programs – Government has initiated many programs for the
benefit of the people staying in backward and remote areas. But villagers in many areas did not know
about the current programs which had been introduced to benefit them.
e. Market Access – People staying in Kutch had sufficient milk produce but they did not get fair prices
for their produce as they were not linked to the formal dairy market. Villagers had to travel to urban
areas to get feed for their livestock which consumed a lot of their time as well as money.
Target group formation
Participatory Rural Appraisal as a baseline survey was conducted in Kutch district for need
assessment and identifying participants for the program. Farmer and livestock groups were
formed for implementing the program in villages. Villagers already involved in agricultural
activities were selected as members of the farmer group and villagers involved in livestock
rearing formed part of the livestock groups.

Endline Evaluation Study: K-LEAP Final Report
IMRB International 34
Cluster co-ordinators and change agents visited the villages to form groups and a member fee of INR 50
(US$ 0.8) was collected initially from all the participants. A maximum of 25 members were there in each
group.
Incorporation of Producer Company
Virat Rural Agro Producer Company was incorporated with the objective of making the initiatives
sustainable in the long term so that they can remain available for the members even after the completion
of the program. K-LEAP was initiated as a combined effort of CARE, its implementing partner and the
participants with an aim to make it a successful as well as sustainable initiative. The centres started for the
participants are still functional and other services like para vet, milk marketing is continuing.
Producer Company is capable of managing its functions and aims at developing its resources for capacity
building in the region. It has a dedicated team along with appointed directors who are responsible for
managing the day to day affairs of the company.
BEGINNING
It started in January 2012
It is registered under Companies Act
The initial funding for business of INR 15 lakh was given by CARE
It currently has 4,600 members
Monitored by CARE partner (VRTI)
PROJECT INITIATIVES
Centres provide cattle feed to villagers
Revolving fund was created to provide financial support
Para Vet services and training
Milk marketing
Cattle insurance
IMPACT
55 centres for cattle feed
Current turnover is INR 12-15 lakh per centre
Vaccination and artificial insemination has drastically increased
Milk prices have gone up by over INR 20
Training has helped members

Endline Evaluation Study: K-LEAP Final Report
IMRB International 35
Demographic profile of the respondents
The figure on the right depicts the gender wise
distribution of the livestock and agriculture
participants. As could be seen, most of the
participants were ‘male’ (Livestock: 85.8%;
Agriculture: 87.8%). The mean age of the
participants was skewed towards a higher age group
and it came out to be 45 years upon analysis.
As illustrated from the figure below, close to half of
the respondents were ‘more than 45 years of age’
(Livestock: 49.1%; Agriculture: 50.4%). This was
followed by the ones who were in the age group of
35-44 years (Livestock: 26.6%; Agriculture:
30.0%).
Figure 8 Age distribution of the respondents – Livestock and Agriculture
In relation to the highest standard of completed education, it was found that mostly the years of completed
education were ‘one to five’ (Livestock: 32.2%; Agriculture: 33.7%) or ‘less than one’ (Livestock: 29.2%;
Agriculture: 27.8%). As anticipated, while animal husbandry/livestock rearing was the primary occupation
of two-third livestock participants, about one-fifth livestock also mentioned agriculture as their prime
occupation. Among the agriculture participants, agriculture remained the key primary occupation. Mostly
the participants were head of their respective households.
3.4
21.026.6
49.1
2.2
17.430.0
50.4
15 to 24 years 25 to 34 years 35 to 44 years More than 45 years
0.0
25.0
50.0
75.0
100.0 Age distribution of respondent
Livestock
(N=268)
Agriculture
(N=272)
*Figures in %age
85.8 87.8
14.2 12.2
Livestock(N=268)
Agriculture(N=272)
0.0
25.0
50.0
75.0
100.0
Male
Female
*Figures
in %age
Figure 7 Gender distribution of respondents
29.2
32.2
21.0
12.4
5.2
Highest education attainment: Livestock
Less than one year
Between 1-5 years
Between 6-8 years
Between 9-12 years
12 years and above
Base (All livestock beneficiaries): 268*Figures in %age
Figure 9 Highest attained education years
27.8
33.7
23.3
14.8
0.4
Highest education attainment:
Agriculture
Less than one year
Between 1-5 years
Between 6-8 years
Between 9-12 years
12 years and above
Base (All agriculture beneficiaries): 272*Figures in %age
Figure 10 Highest attained education years

Endline Evaluation Study: K-LEAP Final Report
IMRB International 36
5.2. Key findings – Livestock
Livestock ownership, their breed and milk production:
Information on ownership of different kinds of livestock as well as their morbidity and mortality was
gained from livestock participants in the survey. It was seen that the intervention led to an increase of
livestock ownership and better animal healthcare in the region. In terms of livestock ownership, most of
the participants (83.6%) owned cow followed by two-third who reported an ownership of buffalo (65.8%).
Close to one participant out of ten mentioned owing goat/sheep (11.9%) and bullock (11.9%). ‘Deshi’ as
a breed of livestock was observed to be most famous among livestock participants. Irrespective of whether
the category under consideration was that of a cow or buffalo or goat/sheep, deshi breed of livestock was
prominently owned.
Comparison with the baseline findings indicates an increased number of livestock per livestock
developer. The maximum variation in ownership percentage was that for goat/sheep followed by cow and
buffalo. A drop in morbidity and mortality rates was also evident.
Table 8 Livestock characteristics
Characteristics Main breed Mean Ownership Mean morbidity Mean mortality
BASE: All livestock participants
(N=268) Name % 2007/08 2014 2007/08 2014 2007/08 2014
Cow Deshi 70.2 03 08 01 00 01 00
Buffalo Deshi 46.6 05 11 01 00 00 00
Bullock -- -- 02 02 00 00 00 00
Goat/Sheep Deshi 10.5 22 62 01 01 01 00
Most of the livestock participants reported milk production from livestock [Cow (80.6%)/Buffalo
(59.0%)]. On an average, while cows produced 15.6 litres of milk per day, the corresponding milk produce
remained at 13.3 litres per day from buffalos. Out of the total milk produced, per day on an average, the
participants were able to sell 13.7 litres of cow’s milk and 12.1 litres of buffalo’s milk.
Livestock related income:
At an overall level, more than nine out of ten livestock participants
(91.4%) were satisfied with the income being generated from their
occupation and a little over sixty percent (60.8%) reported that their
household income had increased post their involvement in the K-
LEAP. The key source of income for livestock participants was
‘Milk selling’ and on an average, mean annual income from this
source came out to be INR 70,865 (US$ 1068). Close to half of
participants (45.1%) reported that they had joined K-LEAP in the
year 2007/2008.
As compared to baseline indicators, a higher proportion of participants reported livestock related
income. The satisfaction from the income was also high among the participants. Baseline findings had
indicated that 56% participants had livestock related income while the satisfaction was observed to be
among three-fifth of the surveyed participants.
60.839.2
Increase in HH income post
joining K-LEAP
Yes
No
Base (All livestock
beneficiaries): 268
*Figures in %age
Figure 11 Increase in HH incoming post
joining K-LEAP

Endline Evaluation Study: K-LEAP Final Report
IMRB International 37
Livestock related services:
During the survey, livestock participants were probed regarding the availability of different kinds of
livestock services like fodder bank, livestock feed, trainings on animal husbandry, vaccination, medication,
artificial insemination and breeding/delivery facilities. Frequency of availing these services and the
corresponding satisfaction levels with the services was also inquired.
As could be seen from the table below, ‘vaccines for livestock’ (47.4%), ‘medicines for livestock’ (44.4%)
and ‘poushtik ahar/khan-dan centre’ (42.5%) were the three key livestock related services provided under
K-LEAP about which the participants were most aware. In line with awareness, the percent of availing
these services during past 12 months was also high. Fodder bank, irrespective of a comparatively lower
awareness, reported high availing and nearly half of the respondents (48.1%) who were aware about fodder
bank happened to use its services at least once during the past 12 months. Corresponding to all the livestock
related services provided under K-LEAP, a high amount of satisfaction was also observed, as illustrated
below.
Table 9 Awareness about K-LEAP services and their availing
*: Percentage not reported due to a low base
Less than half of participants (45.5%) were aware about cattle
health camps and close to half of the aware participants (48.4%)
mentioned that these camps are organized at their villages.
‘Vaccination’ and ‘general treatment for small diseases’ were the
main activities conducted during these camps, as reported by 84.8%
and 66.1% participants respectively.
During the survey, livestock participants were probed for
availability of fodder in terms of number of months in an average
year. On an average, the participants have availability of fodder for
seven months. One fourth of participants (25%) also reported that
fodder is available to them throughout the year.
Availability of funding:
Apart from micro finance services, revolving fund was made available to the members for the purchase of
cattle feed from the centres. Members can still avail this facility to purchase cattle feed from the centres
and repay in instalments.
Service Category
Awareness about K-LEAP
services
Availing of the K-LEAP
services
Satisfaction from K-LEAP
services
Base: All
livestock
participants
%
Awareness
BASE: All
aware
participants
% who
availed
services
during past
12 months
BASE: All
who availed
services
during past
12 months
% satisfied
to some
extent
Vaccines for livestock 268 47.4 127 55.9 71 81.7
Medicines for livestock 268 44.4 119 52.9 63 84.1
Poushtik ahar/Khan-dan centre 268 42.5 114 56.1 64 92.2
Training on animal husbandry 268 32.1 86 31.4 27 *
Artificial insemination 268 29.9 80 25.0 20 *
Fodder bank 268 29.5 79 48.1 38 94.7
Breeding/delivery 268 25.4 68 23.5 16 *
45.554.5
Awareness about cattle health
camps
Aware
Unaware
Base (All livestock
beneficiaries): 268
*Figures in %age
Figure 12 Awareness about cattle health
camps

Endline Evaluation Study: K-LEAP Final Report
IMRB International 38
During the baseline survey, most of the above listed livestock services were either not available or if
available, were not accessible. In fact the baseline report stated that participants had even laughed upon
when they were probed regarding the concept of formal training on animal husbandry. Due to efforts made
by K-LEAP project team, today a comparatively higher percentage of the participants are not only aware
about these services but are also availing the services frequently. Increased satisfaction from the services
is also evident among the participants, as could be accessed from the table above.
Presence of the dairy cooperatives and its membership:
During the baseline survey, only 6% of the respondents had reported having dairy in their village and
membership of participants with dairy was observed to be even lower at 1%. The findings from the endline
study indicate that presently close to three-fifth villages (59.3%) have dairy cooperatives and the
membership of participants in these cooperatives have also gone up to one-fourth (24.6%). The presence
of dairy cooperatives was observed to be comparatively higher in the villages of Mundra (86.4%) and
Mandvi (81.0%) blocks.
Milk marketing initiative: The cattle owners were not linked to the formal dairy market but CARE’s
intervention focused on these linkages to improve the household income of livestock owners. They entered
into tie-ups with SARHAD dairy and NDDB for bulk purchase of milk from the Kutch region. A roadmap
was created for each village to ease the process of procuring milk.
This initiative has drastically increased the income earned by cattle owners who now receive a fair price
for their milk produce. Milk prices have increased by over INR 20 (US$ 0.3) as earlier they received up to
INR 15 (US$ 0.2) for each litre but now can get up to INR 40 (US$ 0.6) depending on the fat content of
the milk. Fat content in milk is the deciding factor for the price of milk.
Livestock insurance and loan:
The awareness regarding the livestock insurance and loans for livestock was high but the percentage of
participants who availed these services remained low. In relation to both i.e. insurance as well as loan,
while close to two-third participants (Livestock insurance: 64.2%; Loans for livestock: 63.4%) were aware
about the service; close to one-tenth reportedly availed it (Livestock insurance: 12.2%; Loans for livestock:
15.3%).
Nevertheless, a comparison with the baseline findings indicates a noteworthy increase in both awareness
and availing of these services. Only about 5% participants in the baseline survey carried with them
knowledge about the livestock insurance while the awareness about the concept of livestock loan was
almost non-prevalent.
Milk Marketing has helped us a lot. It has led to an increase in income as well as livestock. We can
be sure that the milk can be sold to the dairy – Livestock group, Nakhatrana
“Convinced the dairy officials to buy milk from the cattle owners in Kutch district and assured them
of the quality and consistency of the milk supplied “– VRTI functionary, Naliya

Endline Evaluation Study: K-LEAP Final Report
IMRB International 39
Table 10 Livestock insurance and livestock loan
Livestock care seeking:
When inquired about how the sickness of livestock is treated when they fall sick, mostly it was reported
that a para-vet is approached for treatment (71.6%). More than one-fourth participants (26.5%) reported
that ‘treatment is done at home only’. More than two-fifth participants (42.5%) mentioned their
involvement in K-LEAP have impacted decision making about the care seeking pathway for livestock.
K-LEAP’s initiatives in animal healthcare were very crucial as the livestock owners in the Kutch region
reported a higher number of deaths and lack of proper veterinary service in the area prior K-LEAP.
a. Para vet services were introduced as part of the K-LEAP study to cater to needs of the cattle owners
who could not receive services from the veterinary doctor. Selected villagers were trained for two
months to provide them the skills and necessary inputs to function as para vet. This enabled the
livestock owners to receive proper healthcare for their cattle which was not the case earlier. Para vets
were trained to provide animal health care services (Example - five para vets trained in Abdasa block)
and were approached by the residents of the Kutch district. Para vet visits currently have gone up to
35 per month.
b. Vaccination and artificial insemination were introduced in Kutch district during K-LEAP. Livestock
regularly received vaccination as part of the K-LEAP and artificial insemination was also undertaken
under the project. The number of livestock covered gradually increased during the time period when
the project was operational. Artificial insemination had increased from 3-4 per month to 40 per month
and cattle vaccination had increased from zero to twice a year on regular basis. Linkage with
government programs helped the participants in receiving free of cost vaccines from the government.
The participants’ perception regarding the usefulness of K-LEAP
in context of decision making regarding care seeking pathway for
livestock was further accessed by capturing their response on a
five pointer scale.
Under the scenarios wherein the participants perceived K-LEAP
as beneficial, they rated it either as ‘1’ or ‘2’ indicating a ‘high
usefulness’ and ‘usefulness to some extent’ respectively. Under
the scenarios where K-LEAP was perceived as non-beneficial in
context of decision making regarding care seeking pathway for
livestock, participants provided a rating of either ‘4’ or ‘5’ which
showed ‘somewhat non-usefulness’ and ‘high non-usefulness’
respectively. All other cases were rated as ‘3’ i.e. neither useful
nor non-useful.
Service Category
Awareness Availing of service
Base: All livestock
participants % Awareness
BASE: All aware
participants % who availed service
Livestock insurance 268 64.2 172 12.2
Loans for livestock 268 63.4 170 15.3
42.557.5
Decision making regarding
care seeking pathway for
livestock and participation in
K-LEAP
Participation was impactful
Participation was non-impactful
Base (All livestock
beneficiaries): 268*Figures in %age
Figure 13 Decision making regarding
care seeking pathway and
participation in K-LEAP
Para vet services have helped as cattle does not fall sick frequently, vaccination is done on a regular
basis – Cattle owner, Abdasa
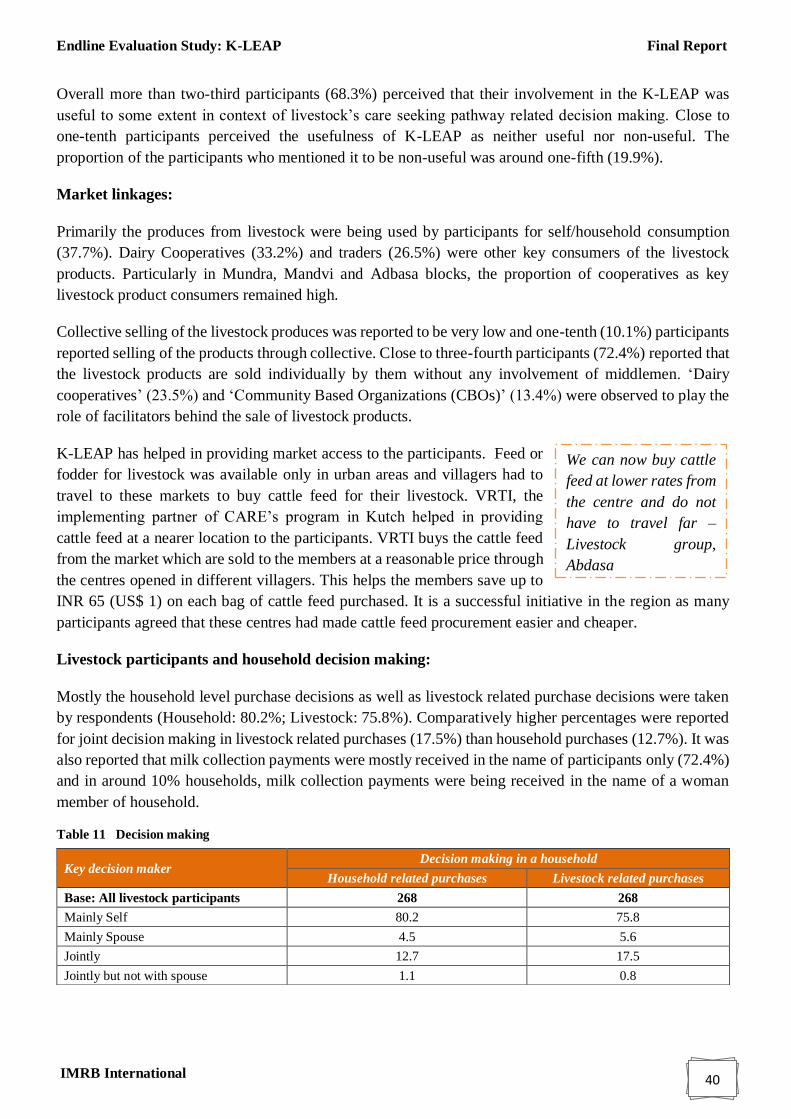
Endline Evaluation Study: K-LEAP Final Report
IMRB International 40
Overall more than two-third participants (68.3%) perceived that their involvement in the K-LEAP was
useful to some extent in context of livestock’s care seeking pathway related decision making. Close to
one-tenth participants perceived the usefulness of K-LEAP as neither useful nor non-useful. The
proportion of the participants who mentioned it to be non-useful was around one-fifth (19.9%).
Market linkages:
Primarily the produces from livestock were being used by participants for self/household consumption
(37.7%). Dairy Cooperatives (33.2%) and traders (26.5%) were other key consumers of the livestock
products. Particularly in Mundra, Mandvi and Adbasa blocks, the proportion of cooperatives as key
livestock product consumers remained high.
Collective selling of the livestock produces was reported to be very low and one-tenth (10.1%) participants
reported selling of the products through collective. Close to three-fourth participants (72.4%) reported that
the livestock products are sold individually by them without any involvement of middlemen. ‘Dairy
cooperatives’ (23.5%) and ‘Community Based Organizations (CBOs)’ (13.4%) were observed to play the
role of facilitators behind the sale of livestock products.
K-LEAP has helped in providing market access to the participants. Feed or
fodder for livestock was available only in urban areas and villagers had to
travel to these markets to buy cattle feed for their livestock. VRTI, the
implementing partner of CARE’s program in Kutch helped in providing
cattle feed at a nearer location to the participants. VRTI buys the cattle feed
from the market which are sold to the members at a reasonable price through
the centres opened in different villagers. This helps the members save up to
INR 65 (US$ 1) on each bag of cattle feed purchased. It is a successful initiative in the region as many
participants agreed that these centres had made cattle feed procurement easier and cheaper.
Livestock participants and household decision making:
Mostly the household level purchase decisions as well as livestock related purchase decisions were taken
by respondents (Household: 80.2%; Livestock: 75.8%). Comparatively higher percentages were reported
for joint decision making in livestock related purchases (17.5%) than household purchases (12.7%). It was
also reported that milk collection payments were mostly received in the name of participants only (72.4%)
and in around 10% households, milk collection payments were being received in the name of a woman
member of household.
Table 11 Decision making
Key decision maker Decision making in a household
Household related purchases Livestock related purchases
Base: All livestock participants 268 268
Mainly Self 80.2 75.8
Mainly Spouse 4.5 5.6
Jointly 12.7 17.5
Jointly but not with spouse 1.1 0.8
We can now buy cattle
feed at lower rates from
the centre and do not
have to travel far –
Livestock group,
Abdasa

Endline Evaluation Study: K-LEAP Final Report
IMRB International 41
Accessibility to livestock related personnel:
Among various livestock related personnel, para veterinary doctors were the ones about whom maximum
awareness (86.9%) existed among the participants. Their accessibility also remained high and easy. The
awareness and accessibility of ‘jila pashu chikitsa adhikari’8 and other agencies/institutions remained low.
Further, the participants were also probed if they have availed benefits under any government service and
only 5% of all the livestock participants assented to this question.
Table 12 Awareness and accessibility of livestock related personnel
Training and Awareness
a. Awareness programs were conducted for the members regarding scientific agricultural practices
where agriculture specialists were invited to participate and interact with the members. Members were
informed about the best agricultural practices to be adopted for improving the quality of the crops
grown. This has helped the farmers in improving the quality of crops grown in the Kutch region
b. Para vets were trained for two months to provide the necessary skills and knowledge for fulfilling
their responsibilities effectively in the absence of availability of a veterinary doctor
c. Training and awareness programs were also conducted covering any new agriculture practice, usage
of quality seeds and cattle feed as when deemed necessary for the members of livestock and
agricultural groups
8 District Veterinary Officer
Government personnel/
department
Awareness Whether aware before joining
K-LEAP Accessibility
Base: All
livestock
participants
%
Awareness
BASE: All
aware
participants
% aware
before joining
K-LEAP
BASE: All
aware
participants
%
Accessible
Para veterinary doctors 268 86.9 233 78.1 233 77.7
Jila Pashu Chikitsa Adhikari 268 34.7 93 62.4 93 46.2
Other agencies/institutions 268 27.6 74 54.0 74 43.3
Awareness has increased regarding scientific agricultural practices and can buy agricultural
equipment with the help of loan – Farmer, Mundra

Endline Evaluation Study: K-LEAP Final Report
IMRB International 42
5.3. Key findings – Agriculture
Land holding among the participants:
Majority of participants were land holders and the percentage of
landless participants was very low (4.0%). The adjacent figure
shows categorization of agricultural participants into marginal
farmers, small farmers and big farmers. As could be seen, mostly
the participants were marginal farmers (57.7%) i.e. owned less than
or equal to 3.5 hectares of agricultural farm land. Analysis of the
data indicated that the mean agricultural farmland ownership was
3.91 hectares.
The percentage of participants who leased out or leased in the
agricultural land although remained low (14.3% and 3.7%
respectively) and majorly the participants reported that the
agricultural farmland was operated by their household.
Irrigation facilities:
Close to two-third participants (63.9%) reported that an irrigation facility was present in their area. Most
common irrigation facility in the region was ‘well/bore well’ (76.4%) followed by ‘check dams’ (13.22%)
and ‘farm pond’ (12.6%). More than half of the participants (53.3%) have irrigation facility in less than
3.5 hectare of farm area while one-fifth (20.6%) reported it to be present in the farm area of between 3.5
hectares to 7.0 hectares. The mean farm area for which irrigation facility was available came out to be 3.4
hectares.
More than one-third participants (35.7%) had access to irrigation facility in both the cultivation season -
Rabi and Kharif season while around 32% participants had access to irrigation facility in ‘only Kharif’
(32.4%). Close to one-fourth (23.5%) reported access throughout the year.
Cultivation practices and usage of seeds:
Cultivation was observed to be practiced in the region either only during Kharif season (40.0%) or during
both Rabi and Kharif season (39.0%). During the survey, participants were probed regarding the details of
the crops sown during the last one year. As could be seen from the table below, the four major crops which
were sowed and cultivated in the lands of agricultural participants were cotton, cluster bean, castor and
ground nut.
During the survey, farmers were also probed for crop wise types of seeds used and the sources of seed
procurement. It was seen that for cultivation of cotton, castor and ground nut, mostly the participants used
‘hybrid’ seeds while local seeds were being preferred for cultivating cluster bean. BT-Total was the most
common used hybrid seed for cultivating cotton (16.5%) while Gujarat-II was the most common hybrid
seed used for cultivating castor (40.7%) and ground nut (49.0%). The main source for purchasing hybrid
seeds were Agro Service Centres created under K-LEAP. Around seventy percent of the participants who
were involved in cultivation of cotton mentioned Agro Service Centres as a main source for purchasing
hybrid seeds. The corresponding percentages remained at 76.8% and 52.5% among the participants who
cultivated castor and ground nut respectively.
57.7323.54
14.74.0
Agricultural farm land
ownership
Marginal farmers (<=3.5 hectares)
Small farmers (3.6 - 7.0 hectares)
Big farmers (<7.0 hectares)
No land holding
Base (All agriculture
beneficiaries): 272
*Figures in %age
Figure 14 Agricultural farm land
ownership

Endline Evaluation Study: K-LEAP Final Report
IMRB International 43
Table 13 Crop characteristics
During qualitative discussion, it came out that earlier the farmers usually travelled to urban areas to
purchase seeds. Considering this, initially a seed fair was organised for the benefit of the farmers. It
attracted a lot of sellers and buyers as the seeds were available at better prices due to the absence of
middlemen. But unfortunately it did not rain that year which resulted in a loss for all the farmers who had
purchased seeds. The initiative of seed fair was then modified and seeds were purchased in advance by
VRTI officials (implementing partner) to be sold to farmers as and when required. This step led to a
decrease of prices of seeds by INR 25 (US$ 0.4) per bag for the farmers and reduced the overall expenditure
of farmers.
Market linkages and sale of the produces:
Primarily the produces from agriculture were being used by traders (76.8%) and by end users on account
of direct sales (22.1%). Particularly in Lakhapat and Nakhtarana blocks, the proportion of traders as key
consumers remained high as compared to other study implementation blocks.
At an overall level, around eight out of ten agriculture participants
(80.9%) were satisfied with the income being generated from
their occupation. Among the ones dissatisfied, the key reasons for
dissatisfaction were ‘lack of rain’ (46.2%) and ‘not getting proper
market rates’ (30.8%). Little less than half participants (46.0%)
mentioned that various services provided under K-LEAP, helped
them in increasing their income levels.
Collective selling of the agricultural produces was reported to be
low and close to one-fifth (17.3%) participants reported selling of
the products through collective. Mostly the agricultural products
were sold individually by the farmers, as reported by close to
three-fourth participants (73.5%). Close to one-fourth participants (24.6%) mentioned that ‘Community
Based Organizations (CBOs)’ played a role of facilitators behind the sale of their agricultural products.
Noteworthy around 46% respondents also quoted that no body acts as a facilitator to them.
Agriculture related services:
‘SMS based agricultural update’ (50.7%) was the agriculture related service provided under K-LEAP
about which participants were most aware. Among other services, more than one-third respondents knew
about ‘advices on standard packaging practices’ (36.0%) and ‘agriculture service centres’ (34.6%). In line
with awareness, the percentage of the participants who at least once availed services of SMS updates
during the past 12 months was also high, as could be seen in the below table. Corresponding to all the
agriculture related services provided under K-LEAP, a high amount of satisfaction was also observed.
Name of the
Crop
% distribution
of different
types of crop
produced
Mean sowing
area
(in Hectares)
Mean
yield of
the crop
(in Kg)
Mean
market rate
of the crop
per Kg
(in INR)
Type of seed mostly
used for cultivation of
crop and its
percentage usage
The most
common
hybrid seed
used
Cotton 50.0 2.5 100.4 41.6 Hybrid 94.1 BT-Total Cluster bean
(Guvar) 37.9 1.8 53.9 37.5 Local 51.0 --
Castor 37.2 2.3 114.1 37.7 Hybrid 95.8 Gujarat-II
Ground nut 21.0 1.7 68.5 42.0 Hybrid 83.1 Gujarat-II
46.054.0
Increase in HH income post
joining K-LEAP
Yes
No
Base (All agriculture
beneficiaries): 272
*Figures in %age
Figure 15 Increase in HH incoming post
joining K-LEAP

Endline Evaluation Study: K-LEAP Final Report
IMRB International 44
Table 14 Awareness about K-LEAP services and their availing
During the baseline survey, most of the above listed agricultural services were either not available or
if available, were not accessible. Due to efforts made by K-LEAP project team, awareness is prevalent
among the participants about these services. Further, the aware participants also frequently availed the
services. A high satisfaction from the services is an indication of the successful implementation.
Agricultural techniques adopted by participants:
The percentage of participants who adopted either water
and soil conservation methods or improved farming
practices has been illustrated in the adjacent figure. As
could be seen, nearly one-fifth of the total agricultural
participants mentioned adopting these techniques.
‘Land levelling’ and ‘drip irrigation’ (42.3% each) were
the most common water and soil conservation methods
adopted while ‘organic farming’ (51.8%) and ‘multi
cropping’ (31.5%) were the two improved farming
practices commonly adopted by participants.
CARE along with its implementing partner promoted drip irrigation and
construction of farm bund for the purpose of rain water harvesting. Many
farmers during focused group discussions acknowledged use of these
techniques for agriculture and agreed that these have been useful in improving
their prevalent agricultural practices.
Agriculture land which was not levelled was unsuitable for cultivation so support was provided to the
farmers to solve this issue. Technical and financial support was provided to the farmers to level the land.
Even, farmer’s contributed to the fund used for land levelling which increased the coverage area of the
land levelled.
Similar to the trend observed in context of adopting agricultural techniques, the frequency of the
participants getting their soil tested was low and close to one-fifth participants mentioned that they ever
got the soil tested of their agricultural farm/land. Agro service centres (63.2%) and Vivekanand Research
and Training Institute (VRTI) (17.5%) were the two locations where soil testing was mainly conducted.
Meetings at VRTI were also a key source of technology related inputs being learned by participants.
Service Category
Awareness about
K-LEAP services
Availing of the K-LEAP
services
Satisfaction from
K-LEAP services
Base: All
agriculture
participants
%
Awareness
BASE: All
aware
participant
s
% who
availed
services
during
past 12
months
BASE: All
who
availed
services
during
past 12
months
%
satisfied
to some
extent
Advices on Standard Packaging
Practices 272 36.0 98 34.7 34 97.1
SMS based agricultural updates 272 50.7 138 62.3 86 76.7
Agriculture Service Centres 272 34.6 94 44.7 42 76.2
19.1 19.9
80.9 80.2
Water and soilconservation methods
Improved farmingpractices
0.0
25.0
50.0
75.0
100.0
Yes
No
*Figures in
%age Base (All agricultural beneficiaries):272
Figure 16 Adopting various agricultural techniques
We now grow crops
which need less water,
use drip irrigation for
agriculture – Farmer,
Nakhatrana

Endline Evaluation Study: K-LEAP Final Report
IMRB International 45
Agricultural loans:
A high awareness about agriculture related loans existed among the participants and more than two-third
(66.9%) were aware about it. More than half (52.2%) of the aware participants mentioned taking the
agricultural loans as well. Banks were the key source of these loans, as reported by 95.8% participants.
Table 15 Agricultural loans
Agricultural participants and household decision making:
Mostly the household level purchase decisions as well as agriculture related purchase decisions were taken
by respondents (Household: 84.2%; Agriculture: 86.8%). The trend of the joint decision making in
agriculture related purchase (10.6%) and household purchase (12.5%) was similar. Most of the participants
(61.0%) did not require any permission for spending money at their own disposal. Upon undertaking
gender wise analysis, it was seen mostly the key decision makers were males.
Table 16 Decision making
Satisfaction with the income and impact of K-LEAP services on household income
When asked whether the participants were satisfied with the income generated from their occupation, a
majority (80.9%) expressed satisfaction. The respondents who reported a dissatisfaction, were further
asked key reasons behind their dissatisfaction and ‘a lack of rain’ (46.2%) and ‘not getting proper rates’
(30.8%) were the two main reasons quoted for being dissatisfied.
At an overall level, less than half proportion of participants mentioned that their involvement in various
services provided as a part of K-LEAP helped them in increasing their income levels.
Service Category
Awareness Availing of agricultural loan
Base: All agricultural
participants
%
Awareness
BASE: All aware
participants
% who took
agricultural loan
Agricultural loans 272 66.9 182 52.2
Key decision maker Decision making in a household
Household related purchases Agriculture related purchases
Base: All agriculture participants 272 272
Mainly Self 84.2 86.8
Mainly Spouse 2.2 1.5
Jointly 12.5 10.7
Jointly but not with spouse 0.0 0.0

Endline Evaluation Study: K-LEAP Final Report
IMRB International 46
Understanding the challenges
• Changing the mind-set was a difficult task – The staff members discussed the initiatives personally
with the villagers to explain the benefits and gave examples of other functioning groups to motivate
prospective members.
• Lack of coordination – The groups lacked unity which was an impediment to create the desired
results. Program and block coordinators frequently interacted with the group members to sort out
personal differences.
• Introducing new methods – Initially it was difficult to convince the participants to adopt new and
scientific methods for agriculture as well as animal healthcare. The staff members re-assured the
community members that the entire program was initiated for the benefit of the community.
• Vagaries of nature - Some of the initial initiatives did not work very well due to unforeseen
circumstances. For instance, seed fair was organised for the farmers where they could directly buy the
seeds from the sellers. But it did not rain during that season so the initiative was redesigned to meet
specific needs. Seeds were then bought in advance by CARE’s partner NGO and farmers were able to
get the seeds from the centres.
46.054.0
Whether K-LEAP services
helped in increasing income
Yes
No
Base (All agriculture
beneficiaries): 272
*Figures in %age
Figure 17 Increase in HH incoming post
joining K-LEAP
80.9
19.1
Satisfaction from generated
income
Yes
No
Base (All agriculture
beneficiaries): 272
*Figures in %age
Figure 18 Satisfaction from the income
generated from occupation

Endline Evaluation Study: K-LEAP Final Report
IMRB International 47
Chapter 6 : Key Findings – Micro Finance
Endline Evaluation Study: K-LEAP Final Report
IMRB International 48
Key findings – Microfinance
Microcredit has been proclaimed as a tool to lift poor people,
particularly women, out of poverty, by providing access to credit to
fund business endeavours. Microcredit has subsequently expanded into
microfinance, which consists of offering a variety of financial products
to poor customers, including savings products, pension products,
insurance products, and credit for non-business expenditures. This can
provide them greater opportunity to improve their financial situation,
prepare for the future, and offset financial risk, much like the
traditional finance sector (Micro finance vision report, 2012). Micro finance institutions are seen to act as
a vehicle of inclusive growth for the low income households to help them build a sustainable livelihood.
Today the microfinance sector plays an important role in providing access to financial services to the
marginal sections of the society in India.
6.1. Need for micro finance
There was lack of access to financial services in the Kutch district. Banking services were
not available in every village and banks required collateral security for giving loans.
Relatives of the villagers could lend only a limited amount of money and villagers were
highly dependent on money lenders for credit who charged an exorbitant rate of up to 5
per cent per month. Micro finance was introduced in the Kutch district as an alternate
reliable source to obtain loans and empower women by providing them an opportunity to
become self-reliant and self-dependent.
6.2. Microfinance Federation
Microfinance federation had its humble beginning in the year 2012. It was registered under Section 80G
in December 2014. It was incorporated with a long term goal of providing financial services in the entire
region of the Kutch district. The federation offers multiple kinds of credit and credit plus services to its
members. Technical and financial support for its operations was provided by CARE. It is a sustainable
organisation as it is independently operated and has a dedicated team along with appointed directors to
manage the day to day operations of the federation.
The federation has managed to win the trust of the participants as a reliable source to obtain loans. There
are currently 506 self-help groups in the Kutch region with over 5,000 SHG members. Household income
has increased with the help of loans as money is available for investments. This has led to an increase in
the self-worth and respect of women. Awareness regarding healthcare, education, current affairs has risen
due to frequent interaction in group meetings.

Endline Evaluation Study: K-LEAP Final Report
IMRB International 49
Key Operations of MF federation
a. Self Help Groups – Groups known as SHGs comprising of only women members are formed with a
maximum of 20 members in a group. Each women deposits INR 50 (US$ 0.8) initially as member fee.
Leaders are elected for each group who are responsible for managing the functioning of the groups.
Address and identification proof of each member is required to be submitted to become a part of the
Self-help group.
b. Credit services – Education loan, loan for income generation activities and loan for health related
needs are made available to the members of the SHGs. The loan amount is capped at three times the
amount of savings of the group. The amount saved by the members is deposited in the bank account
opened for each SHG.
c. Credit plus services – Insurance coverage is available for each member by paying a premium of INR
170 (US$ 3) per year. Accidental insurance coverage is provided which pays up to INR 1 lakh (US$
1507) to the member depending on the severity of the injury. Health insurance is also available. The
federation has tied-up with Royal Sundaram for insurance. Pension service is also available for the
members.
d. Monitoring - Every transaction is noted down in the manual registers given to the groups and the
federation officials. Monthly meetings of the groups are conducted to discuss the progress as well as
functioning of the groups. Tally software is used for recording all the transactions. The block co-
ordinators and SHG officials frequently visit the villages where the SHGs have been formed.
e. Repayment- Monthly payment is made as per the pre-decided schedule for each group. The maximum
period for repayment is three years for all loans except agriculture loan which has to repay within six
months.
f. Utilisation of financial services - Group members have obtained loans for different purposes like
agriculture, buying sewing machine, education of children and other income generation & consumption
activities as shared by the members during focused group discussions. As per the data collected, 44
percent of the respondents reported taking a loan during the last three years. Out of these members, 33
percent had used loan for production purposes, 47 percent used it for consumption while around one
fifth (20 percent) used it for health, education or fixed assets related purchases.
“We did not go out often and never too far but now we travel to different places to attend meetings
all by ourselves…….this has helped us break our inhibitions of talking to unknown places and
vising new places” – SHG members, Abdasa
“It has helped change the mind set of women and their family members as women now as they get
an opportunity to get involved in income generating activities and interact with people with
different attitudes which creates an impact” – Block Co-ordinator, Lakhapat

Endline Evaluation Study: K-LEAP Final Report
IMRB International 50
6.3. Demographic profile of the respondents
All the interviews under the microfinance category were conducted with female participants whose mean
age was skewed towards higher age group. As illustrated from the figure below, one-third participants
(33.6%) were ‘more than 45 years of age’ followed by the ones who were in the age group of 35-44 years
(30.9%). The mean age of participants upon analysis came out to be 39 years. More than nine out of ten
micro finance participants were currently married (94.1%).
In terms of the highest standard of completed education, it was found that mostly the years of completed
education were ‘less than one’ (37.1%) or were ‘one to five’ (26.1%). When asked about primary
occupation, close to two-third participants reported being housewife (65.5%) apart from their involvement
in micro-finance activities.
6.4. Self Help Group characteristics
Agency who started SHG and participant’s association with SHG:
Almost all the participants (99.0%) mentioned that their SHGs were initiated/started by NGO/VRTI. In
Mandvi and Adbasa blocks, all the SHGs were reportedly started by NGO/VRTI. Most of the participants
had a long associated with their respective SHGs and chiefly the time period was more than four years
(56.4%). While the trend remained almost similar across all the blocks, only in Mundra a variation was
observed and close to four out of ten participants reported their association to be less than 12 months
(39.1%).
Table 17 Initiation of SHG
Characteristic
Base: All microfinance participants 312
NGO/VRTI 99.0
Government 0.3
Banks 0.6
37.1
26.1
23.5
10.8
2.6
Highest education attainment:
Microfinance
Less than one year
Between 1-5 years
Between 6-8 years
Between 9-12 years
12 years and above
Base (All microfinance beneficiaries): 312*Figures in
%age
Figure 20 Highest attained education years
8.127.4
30.9
33.6
Age distribution: Microfinance
15 to 24 years
25 to 34 years
35 to 44 years
More than 45 years
Base (All microfinance beneficiaries): 312*Figures in
%age
Figure 19 Distribution of age: Microfinance
participants
13.112.5
7.110.9
56.4
Time since member of SHG
Less than 12 months
Between 12 to 23 months
Between 24 to 35 months
Between 36 to 47 months
More than 48 months
Base (All microfinance beneficiaries): 312*Figures
in %age
Figure 21 Time since member of SHG

Endline Evaluation Study: K-LEAP Final Report
IMRB International 51
Activities carried out by SHG:
‘Savings and credits’ was the key activity carried out by more than half of the SHGs (54.0%) of whom the
participants were member of. This was followed by the SHGs doing ‘only savings’ (44.7%) as an activity.
Few percentages were also recorded corresponding to ‘group enterprise’ (4.8%) and social activities
(3.5%).
Table 18 Key activities carried out by SHG
Key activities of SHG
Base: All microfinance participants 312
Savings and credits 54.0
Only savings 44.7
Group enterprise 4.8
Social activities 3.5
Motivator behind participant’s joining of SHG:
It was observed that the K-LEAP project team was a key motivator behind the participants’ decision for
joining the SHGs. ‘Self-decision’ also directed participants to join SHGs (45.5%). Among the other key
motivators were spouse (31.4%) and friends/neighbours (30.8%).
Table 19 Key motivators behind joining the SHG
Key activities of SHG
Base: All microfinance participants 312
K-LEAP project team 50.3
It was a self - decision 45.5
Spouse 31.4
Friends/ Neighbours 30.8
Size of SHGs and their functioning:
Mostly the size of SHG, as reported by participants, was between ‘11 to 15 members’ (43.9%) and the
mean size of SHGs came out to be 13. One-third participants also reported the size of their SHGs as
between ‘5 to 10 members’.
Almost all the participants (99.4%) reported that they
know all the members of their group. Monthly meetings of
SHGs were common and when participants were asked
about the frequency of meetings of the group, close to nine
out of ten participants mentioned it as ‘at least monthly’
(87.5%). An active participation of members in these
meetings was evident from a high ‘yes’ percentage
(96.8%) recorded corresponding to the question ‘Do you
attend these meetings?’. Further, the participation of
members was also regular as nearly 83% participants who
attended these meetings reported that their frequency of
participating was ‘regular’.
4.5 6.1
87.5
0.6
Frequency of SHG meetings
At least Weekly
At least Fortnightly
At least Monthly
Less frequent
They never happen
Base (All microfinance beneficiaries): 312*Figures in
%age
Figure 22 Frequency of SHG meetings

Endline Evaluation Study: K-LEAP Final Report
IMRB International 52
The frequently held SHG meetings have provided the women folk a freedom to step out of their houses in
Kutch district. Women frequently come out of their homes to attend meetings at different places,
something which was not in practice earlier. This is a welcome change as they are no longer confined to
the four walls of their homes. This has definitely provided them freedom in terms of moving out of their
homes for their own work and independence of completing their tasks themselves.
As earlier stated, savings as an activity was being carried out by SHGs and the frequency was ‘monthly’.
On an average, INR 141.1 (US$ 2) was reported as being saved by the members per month. More than
two-third participants (68.9%) said that they received any training on SHG. Skill/vocational training
(85.6%) and training on conducting meetings (27.9%) were the key trainings received.
Table 20 Type of training received
Type of trainings
Base: All microfinance participants who received training 215
Skill / vocational training 85.6
Conducting meetings 27.9
Group enterprise 16.7
Leadership training 9.8
Linkage of SHGs with banks and other agencies:
When probed for the bank account information of their SHGs, more than eight out of ten participants
(83.9%) mentioned that their SHG had its own separate bank account and period of opening these bank
accounts was observed to be mostly post launching of the K-LEAP i.e. post 2008 (94.0%). High
percentages of SHGs were also observed to be lending money to the members (90.7%) while close to one-
third SHGs (31.1%) had received loans from any external sources. SHG federation, ideated as a part of K-
LEAP was the main source of loan to the SHGs (54.6%) followed by the banks (44.3%).
When asked about types of loan taken during past three years, participants mostly mentioned it as
consumption loans (47.1%) and production loans (33.1%). SHG groups and SHG federation were the key
sources of loans for the participants, as could be seen from the table below. Mostly the participants get the
credit as per the amount needed (85.3%).
Table 21 Type of loan taken by respondents during past three years
Type of loan
Type of loan Base: All
who took the
loan by type
of loan
Key sources of loan
Base: All
microfinance
participants who
took a loan
% who took
loan by type of
loan
Source
1 % Source 2 %
Consumption loans 136 47.1 64 SHG 79.7 SHG federation 7.9
Production loans 136 33.1 45 SHG 48.9 SHG federation 24.4
“Women are respected more by the family members……..they were not allowed to leave their homes
earlier but now go out frequently to attend meeting” – SHG members , Abdasa

Endline Evaluation Study: K-LEAP Final Report
IMRB International 53
Participants and household decision making:
Mostly the household level purchase decisions as well as livelihood related purchase decisions were taken
by spouse of participants (Household: 61.9%; Livelihood: 57.7%). In terms of decision making, the power
also rested with participants, although in lesser proportions (Household: 18.9%; Livelihood: 17.6%).
Table 22 Decision making
Women also stated during the discussions that their involvement in household decisions has slightly
improved as they had also started to contribute to the household income.
More than three-fourth participants (77.6%) reported that various services provided by K-LEAP helped in
increasing their income levels. The presence of Microfinance federation is certainly important to create an
enabling environment for the members. It has made a positive change in the areas of its intervention.
Access to finance has led to an improvement in the overall household income of the members as stated by
them during group discussions. The members said that they had used the additional income in improving
their overall standard of living.
Initial Challenges faced by MF federation
a. Members were not ready to pay service charges initially
b. Villagers did not trust and support any kind of financial scheme or initiative as they had been duped
by fraud companies earlier
c. It was difficult to convince women to form groups as they had not stepped out of their homes to
participate in such initiatives before
d. Most of the villagers were illiterate so it was difficult to explain the benefits of SHG formation
Future goals
a. Hostel to be constructed for adolescent girls in the future
b. Building sanitation facilities at the premises of the members with the help of the loan
c. To increase the numbers of SHG members beyond 10,000
d. To cover the entire region of Kutch in the future
e. They intend to build a mall for handicrafts in the future
f. Introduction of initiatives in the healthcare and education sectors
Insurances and National Pension Scheme (NPS):
Key decision maker Decision making in a household
Household related purchases Livelihood related purchases
Base: All microfinance participants 312 312
Mainly Self 18.9 17.6
Mainly Spouse 61.9 57.7
Jointly 15.4 19.9
Jointly but not with spouse 1.6 1.9
“I feel proud of myself as I can contribute to decisions which impact my family” – SHG member,
Mandvi
“Every member contributes in the decision making of the loan disbursement of the group which
makes them feel an important part of the group” – Block Co-ordinator, Abdasa

Endline Evaluation Study: K-LEAP Final Report
IMRB International 54
Awareness about insurance was seen among more than two-third participants (66.4%). Maximum
awareness was observed among the respondents from ‘Mandvi’ where more than three-fourth were aware
about insurances. ‘Life insurance’ (87.0%), ‘accident insurance’ (52.7%) and ‘health insurance’ (40.1%)
were the types of insurance respondents were most familiar with. Knowledge regarding ‘livestock
insurance’ and ‘crop insurance’ was low and close to one-tenth respondents were aware about them
(livestock insurance: 11.6%; crop insurance: 7.7%). Practice of adopting insurance was on a lower side as
compared to awareness and while 46% participants mentioned that any member in their household is
covered by life insurance, corresponding percentage for health insurance was around 15%.
In relation to National Pension Scheme (NPS), low awareness was observed and only around 15%
participants were aware about it. The enrolment in NPS was further low and only four percent out of the
total aware participants reported that they were currently enrolled in NPS.
66.4
33.0
Awareness about insurances
Aware
Unaware
Base (All microfinance
beneficiaries): 312*Figures
in %age
Figure 24 Awareness about insurances
14.7
85.3
Awareness about National Pension
Scheme
Aware
Unaware
Base (All microfinance
beneficiaries): 312
*Figures
in %age
Figure 23 Awareness about National Pension
Scheme

Endline Evaluation Study: K-LEAP Final Report
IMRB International 55
Chapter 7 : Key Findings – Education

Endline Evaluation Study: K-LEAP Final Report
IMRB International 56
Key findings – Education
Education is one of the best ways to empower women to lead a life of dignity and self-reliance. Access to
basic education for girls can create a huge impact in the lives of girls as it enables them to make genuine
choices to lead a worthy and happy life. It can create hope of a better future for girls by removing inequality
and gender discrimination. Thus, it is necessary to support basic education for girls which will also help
fulfil other development objectives.
Despite progress in recent years, girls continue to suffer severe disadvantage and exclusion in education
systems throughout their lives9. They still remain excluded from the education systems and face various
restrictions and barriers throughout their lives.
6.1. Need for education initiative
The girls in Kutch faced similar discrimination and were likely to drop out of schools due to the burden of
household work or financial difficulties. Many girls were not sent to school due to the load of household
chores and others faced prejudices like girls in a particular community do not study. These beliefs and
work responsibilities acted as a debilitating handicap for the girls who wanted to complete school. Many
of them dropped out of school and never completed their education due to other priorities.
The education initiative by CARE aimed at bridging the gap of education, developing skills in girls,
improving the teaching methods, providing study materials for improved learning and overall
improvement in the education levels of students especially girls in Kutch district. The programme program
worked with formal school children, established Adolescent Girls Learning Centres (AGLCs), supported
Kasturba Gandhi Balika Vidyalaya and trained School Management Committee (SMC) members.
Profiling of children
Across all the surveyed households, education profile was created for children and adolescents who were
in the age group of six years to twenty years. Analysis indicated that in total, four out of ten such children
were male while remaining were females. Close to two-third of them (65.1%) were continuing their
schooling and ‘government/local body schools’ were the most common schools to which more than eight
out of ten children (86.0%) in this age group were going to.
Among the ones who were currently going to any school, the percentage of children who were studying in
between 5th -7th standard (33.0%) and the ones who were studying in standard 8th or more (32.4%) were
maximum and were nearly equal.
9 http://www.unicef.org/education/bege_70640.html
3.89
26.7 29.5
38.9
5.8
31.636.3
26.3
0
10
20
30
40
50
Pre-primary class Between class 1-4 Between class 5-7 Class 8 or above
Current education standards by gender
Male
Female
Base (All HH members in the age group of 6 to 20 years who were going to school): 312*Figures in %age
Figure 25 Current education standards
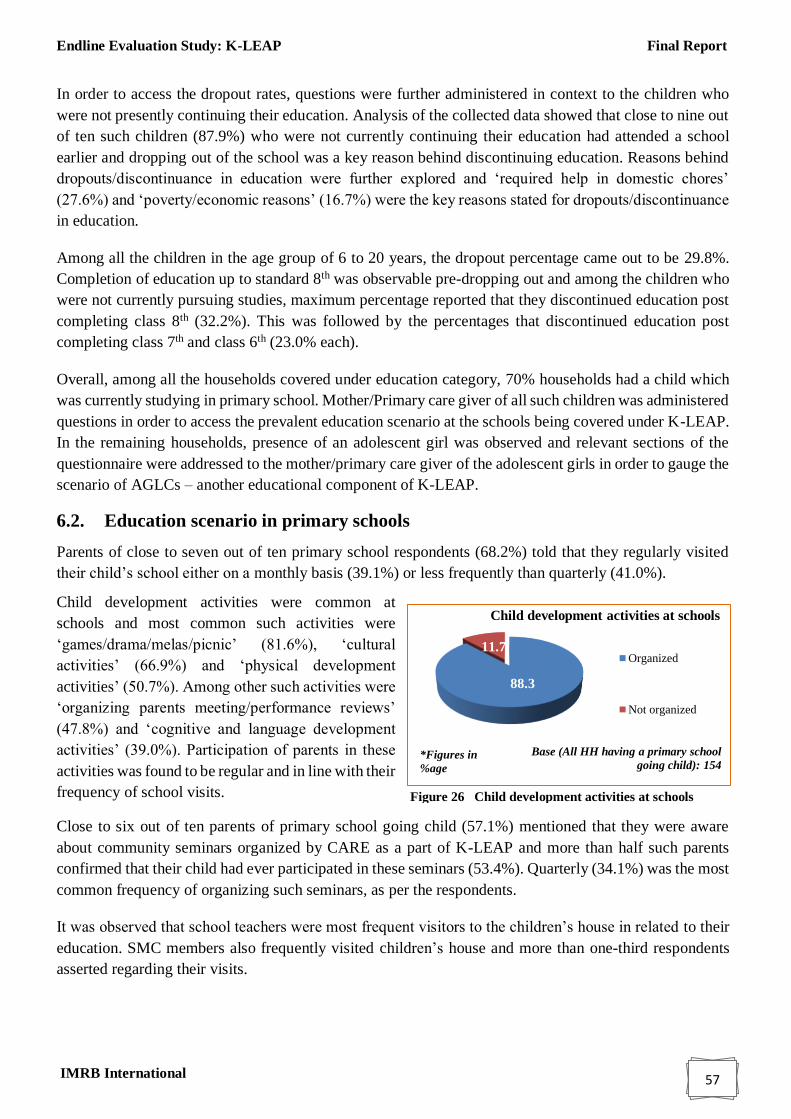
Endline Evaluation Study: K-LEAP Final Report
IMRB International 57
In order to access the dropout rates, questions were further administered in context to the children who
were not presently continuing their education. Analysis of the collected data showed that close to nine out
of ten such children (87.9%) who were not currently continuing their education had attended a school
earlier and dropping out of the school was a key reason behind discontinuing education. Reasons behind
dropouts/discontinuance in education were further explored and ‘required help in domestic chores’
(27.6%) and ‘poverty/economic reasons’ (16.7%) were the key reasons stated for dropouts/discontinuance
in education.
Among all the children in the age group of 6 to 20 years, the dropout percentage came out to be 29.8%.
Completion of education up to standard 8th was observable pre-dropping out and among the children who
were not currently pursuing studies, maximum percentage reported that they discontinued education post
completing class 8th (32.2%). This was followed by the percentages that discontinued education post
completing class 7th and class 6th (23.0% each).
Overall, among all the households covered under education category, 70% households had a child which
was currently studying in primary school. Mother/Primary care giver of all such children was administered
questions in order to access the prevalent education scenario at the schools being covered under K-LEAP.
In the remaining households, presence of an adolescent girl was observed and relevant sections of the
questionnaire were addressed to the mother/primary care giver of the adolescent girls in order to gauge the
scenario of AGLCs – another educational component of K-LEAP.
6.2. Education scenario in primary schools
Parents of close to seven out of ten primary school respondents (68.2%) told that they regularly visited
their child’s school either on a monthly basis (39.1%) or less frequently than quarterly (41.0%).
Child development activities were common at
schools and most common such activities were
‘games/drama/melas/picnic’ (81.6%), ‘cultural
activities’ (66.9%) and ‘physical development
activities’ (50.7%). Among other such activities were
‘organizing parents meeting/performance reviews’
(47.8%) and ‘cognitive and language development
activities’ (39.0%). Participation of parents in these
activities was found to be regular and in line with their
frequency of school visits.
Close to six out of ten parents of primary school going child (57.1%) mentioned that they were aware
about community seminars organized by CARE as a part of K-LEAP and more than half such parents
confirmed that their child had ever participated in these seminars (53.4%). Quarterly (34.1%) was the most
common frequency of organizing such seminars, as per the respondents.
It was observed that school teachers were most frequent visitors to the children’s house in related to their
education. SMC members also frequently visited children’s house and more than one-third respondents
asserted regarding their visits.
88.3
11.7
Child development activities at schools
Organized
Not organized
Base (All HH having a primary school
going child): 154*Figures in
%age
Figure 26 Child development activities at schools
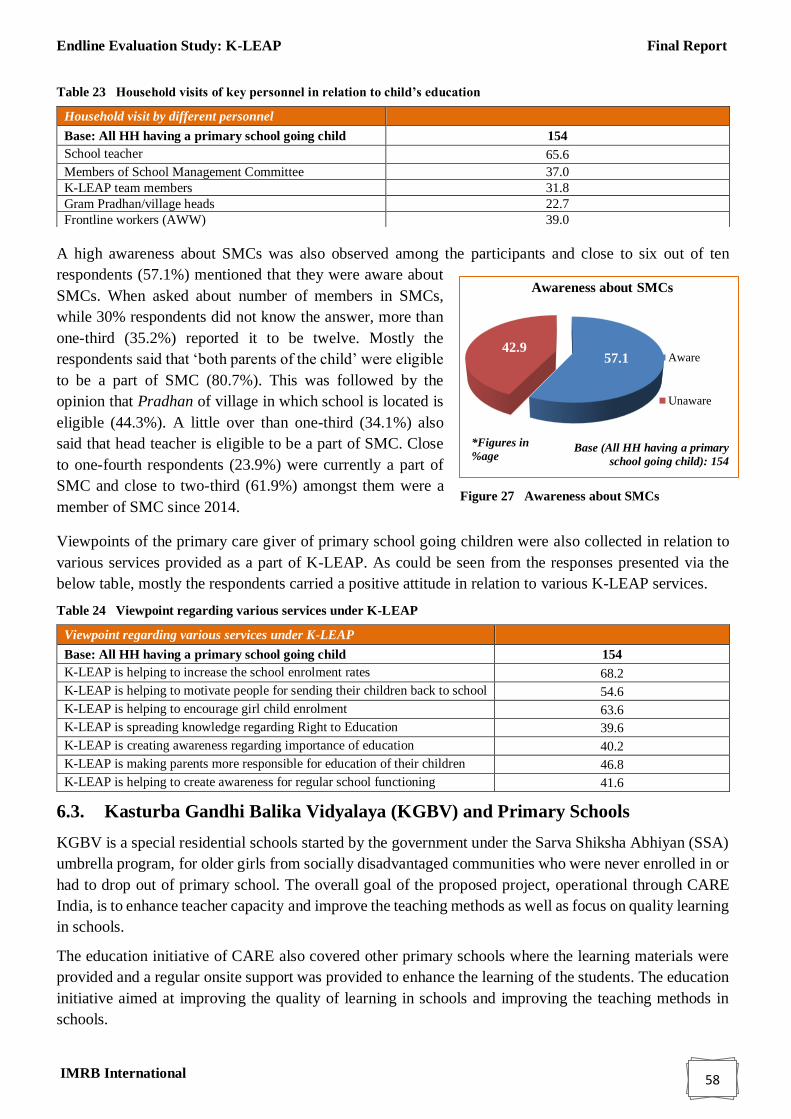
Endline Evaluation Study: K-LEAP Final Report
IMRB International 58
Table 23 Household visits of key personnel in relation to child’s education
A high awareness about SMCs was also observed among the participants and close to six out of ten
respondents (57.1%) mentioned that they were aware about
SMCs. When asked about number of members in SMCs,
while 30% respondents did not know the answer, more than
one-third (35.2%) reported it to be twelve. Mostly the
respondents said that ‘both parents of the child’ were eligible
to be a part of SMC (80.7%). This was followed by the
opinion that Pradhan of village in which school is located is
eligible (44.3%). A little over than one-third (34.1%) also
said that head teacher is eligible to be a part of SMC. Close
to one-fourth respondents (23.9%) were currently a part of
SMC and close to two-third (61.9%) amongst them were a
member of SMC since 2014.
Viewpoints of the primary care giver of primary school going children were also collected in relation to
various services provided as a part of K-LEAP. As could be seen from the responses presented via the
below table, mostly the respondents carried a positive attitude in relation to various K-LEAP services.
Table 24 Viewpoint regarding various services under K-LEAP
6.3. Kasturba Gandhi Balika Vidyalaya (KGBV) and Primary Schools
KGBV is a special residential schools started by the government under the Sarva Shiksha Abhiyan (SSA)
umbrella program, for older girls from socially disadvantaged communities who were never enrolled in or
had to drop out of primary school. The overall goal of the proposed project, operational through CARE
India, is to enhance teacher capacity and improve the teaching methods as well as focus on quality learning
in schools.
The education initiative of CARE also covered other primary schools where the learning materials were
provided and a regular onsite support was provided to enhance the learning of the students. The education
initiative aimed at improving the quality of learning in schools and improving the teaching methods in
schools.
Household visit by different personnel
Base: All HH having a primary school going child 154
School teacher 65.6
Members of School Management Committee 37.0
K-LEAP team members 31.8
Gram Pradhan/village heads 22.7
Frontline workers (AWW) 39.0
Viewpoint regarding various services under K-LEAP
Base: All HH having a primary school going child 154
K-LEAP is helping to increase the school enrolment rates 68.2
K-LEAP is helping to motivate people for sending their children back to school 54.6
K-LEAP is helping to encourage girl child enrolment 63.6
K-LEAP is spreading knowledge regarding Right to Education 39.6
K-LEAP is creating awareness regarding importance of education 40.2
K-LEAP is making parents more responsible for education of their children 46.8
K-LEAP is helping to create awareness for regular school functioning 41.6
57.142.9
Awareness about SMCs
Aware
Unaware
Base (All HH having a primary
school going child): 154
*Figures in
%age
Figure 27 Awareness about SMCs

Endline Evaluation Study: K-LEAP Final Report
IMRB International 59
6.4. Classroom observations
Classroom observation tools including educational process form and school environment community form
were used to get information regarding the functioning of the KGBVs in the Kutch region.
The educational process form provided information like the girls enrolled in schools, usage of learning
materials, infrastructural facilities and other things like the food and the management of the school. It was
observed that science and maths kit were being used for teaching the students, stationary & text books
were available for the girls, time tables were given to the girls, different teaching methods were being used
in classroom and there were multiple opportunities in the form of fairs, competitions, activities available
for the girls to participate. A separate library was not available at the KGBV though the primary schools
had libraries for their students. Separate computers were not available for the students at KGBV. Girls
agreed to helping each other with the lessons and participating in different activities in the school. They
enjoyed these activities and morning assembly now included various new initiatives like songs,
storytelling, news reading, physical activity and drama which made them interesting.
The school environment community form included information like the support provided, physical status,
daily utility, food expenses, menu in the school, meetings held in the school, participants in these meetings,
agenda of the meetings, linkage of the agenda of the meetings with the next meeting’s agenda and
community seminars organised in the school. It was observed that safe drinking water, bedding set,
uniform and electricity supply was available in the school. Daily utility things like the bathing soap,
detergent, oil, toothpaste and stationary was available in the school for the girls. Monthly staff meetings
were organised at the school which covered teaching-learning materials, financial issues, residential
facilities, children related issues, and infrastructure and community related topics as part of the discussions.
Also, the staff from the school had attended meeting at the district which covered capacity building,
training for the staff, financial issues, children and community related issue. School management
committee meetings were also regularly held which included parents and teachers as participants. These
meetings specifically focused on teaching learning methods and children related issues as part of the
meetings.
6.5. Impact – KGBVs and Primary Schools
Education initiative has created an impact in the lives of the participants by improving the quality of
learning and teaching methods. Better teaching methods help in developing the interests of students in
schools as they find it easy to grasp the contents of different subjects.
Improved teaching methods
As part of the program, newer techniques and ways of imparting knowledge were introduced in schools to
make it simpler for the students to learn. Tips and learning methods initiated by the program have held the
students in good stead as it has made learning easier for them. For instance, one of the tips given to teacher
was to use things to help students learn counting in school. Math and science kits given to schools made
learning interesting for students. Charts were given to these schools to help the students learn better along
with the learning materials provided for different classes.
Quality of learning

Endline Evaluation Study: K-LEAP Final Report
IMRB International 60
The quality of teaching improved as better learning methods were adopted in schools and students were
more receptive to imbibe the material given to them. For instance, the girls stated that methods like charts
and kits had helped them learn better and simplified the subjects for them. Students are able to read and
write better and the overall quality of studies in school improved.
Class room Management
The co-ordinators of CARE provided techniques for conducting the classes in an enabling manner thereby
managing the classes better. One such suggested technique required that teacher sits along with the
students. This was aimed at making students free to express themselves and ask questions without
inhibitions. It was observed that the technique resulted in gradually enabling the speaking ability of the
students in front of teachers and openly expresses their opinions.
Self-worth
Education empowers people and provides them an opportunity to lead a life of dignity. Girls acknowledged
an increase in confidence and ability to handle things all by themselves during the discussions. This helped
them value themselves more than before as they gained confidence to interact with people and express
themselves freely.
Opportunity for students
Support was provided for Bal Sabha and fairs organised for students. Girls who perform well were
appreciated for their work. Various competitions which were organized as a part of initiative such as debate
and essay writing helped in personality development. Sports activities including different kind of games
are part of the school curriculum which helps the students unwind as well as enjoy at school. Teacher and
students interaction has increased which has helped the students express themselves freely. Skill
development is also a focus in schools which helps the girls learn skills which can help them earn a
livelihood.
Effective tools and methods
There were various activities which transformed and contributed to the school improvement as part of the
program. The charts and kits were one of the effective ways to simplify the learning process for the
students. Visual medium always makes it easier to grasp things faster and they are retained by the students
for a longer term. The introduction of various activities in school helped build the overall personality of
students. The cultural and sports activities made learning interesting for the students. Students were
appreciated for their good work which acted as a motivation for them to perform better.
“A twelve year old girl who belonged to the tribal community was admitted to KGBV who had
never gone to school before. She had to be taught the basics of hygiene like bathing every day,
brushing every day and other activities which she gradually learned. She now can read as well as
write” – KGBV teacher, Naliya
Bal Sabha, Meena manch are organised for the students……..essay writing, sports, singing, dance
competitions are also conducted and best performances are awarded – Primary school teacher,
Mandvi

Endline Evaluation Study: K-LEAP Final Report
IMRB International 61
6.6. Scenario among adolescent girls
Four out of ten surveyed households under education
segment (40.9%) had a presence of an adolescent girl who
is/was benefitted by Bal Sakhi Kendra/Adolescent Girl
Learning Centre (AGLC). When asked about year in which
these AGLCs were created, more than one-third
respondents reported ‘2013’ (34.4%). However a very low
percentage of respondents (10%), mentioned that these
AGLCs were currently functional.
K-LEAP team members were the key motivators (83.3%)
behind making the household members send adolescent
girls to Bal Sakhi Kendras. School teachers (30%) and
frontline workers (AWWs) (12.2%) were other key motivators behind adolescents attending these schools.
Mostly skill based trainings (95.6%) and sports related activities (78.9%) were reportedly conducted at the
AGLCs.
6.7. Adolescent Girls Learning Centres
AGLCs were introduced according to CARE’s objectives as a ray
of hope for adolescent girls who never had an opportunity to go to
schools or dropped out in early stage. These were started as
alternative learning centres for education of adolescent girls through
teaching literacy and numeracy skills up to primary level. These
centres provided an opportunity for girls to receive skill based
trainings to be able to earn a livelihood for their family. Health
trainings were also conducted for the members. Various activities
like assemblies, bicycle riding, other sports activities and exposure visits were also conducted for the
adolescent girls. These centres are still functional in Kutch district, Gujarat where all these activities are
still conducted. A total of 15 centres were introduced in the Kutch region as part of the programme.
AGLC mentors are responsible for teaching the girls and overseeing the proper functioning of these
centres. These centres have raised the hopes of these disadvantaged girls who did not have an opportunity
to complete their education due to various impediments. They are now capable of handling basic
calculations, have gained exposure to the outside world and their confidence has gradually increased after
becoming part of the learning centres.
Table 25 Key activities conducted at AGLCs
Key activities
Base: All HH having an adolescent girl benefitted by K-LEAP 90
Skill based training: Designing, Silai etc. 95.6
Sports related (Cycling, Badminton, Carom) 78.9
Educational visits to places outside district 52.2
Health trainings for adolescent girls 48.9
Prize distribution 33.3
Radio speaking activity 24.4
8.9
12.2
22.2
18.9
2.2
34.4
1.1
DK/CS
2007
2010
2011
2012
2013
2015
0.0 20.0 40.0
Year of formation of AGLCs
AGLC
Year
Base (All HH having an adolescent
girl benefittetd by K-LEAP): 90
*Figures in
%age
Figure 28 Year of formation of AGLCs

Endline Evaluation Study: K-LEAP Final Report
IMRB International 62
Literary skills (94.4%), livelihood skills (77.8%) and life skills (55.6%) were the three key skills gained
by adolescent girls at these AGLCs as per the viewpoint of the respondents. The key motives behind
making an adolescent girl join AGLC came out to be ‘making her learn skills necessary for day to day life’
(72.2%) and ‘making her learn livelihood skills’ (71.1%). Four out of ten respondents also mentioned that
they send adolescent girls to AGLCs in order to make them gain self dependency (42.2%).
AGLCs provide skill based training to the girls to help them learn basic skills
needed to earn a livelihood as depicted in the table above. For instance, a 15
day training programme was organised for the mentors of the AGLCs with an
aim of developing the tailoring skills of girls in the learning centres. Apart
from this, health training was provided where issues like health hygiene,
reproductive system, and physical changes at adolescent age, importance of
nutritious food and information regarding the menstrual cycle was covered.
These trainings were liked by the girls, as acknowledged during the focused
group discussions.
In almost all the households (98.8%) where an adolescent girl
was benefitted from AGLC and a younder sibling was present,
the younger sibling got motivated regarding education. High
percentage of respondents (71.1%) mentioned that motivation
regarding enrolment in KGBY was provided at these AGLCs.
However the percentage of adolescent girls who joined
KGBV remained low at 5% and data reveals that a girl’s
requirement in household chores was one of the key reasons
stated behind her not joining KGBV. Cultural reasons and girl
joining livelihood activities were other key stated reasons in
this context.
98.8
1.2
Motivation of younger siblings for
education
Motivated
Not motivated
Base (All HH having an adolescent
girl benefittetd by K-LEAP and also
have girl's younger sibling): 86
*Figures in
%age
Figure 29 Motivation of younger siblings for
education
Impact of AGLCs on aspiration
and perception
for education
Very high impact
(32.2%)
High impact
(34.4%)
Medium impact
(24.4%)
Low impact
(6.7%)
Very low impact
(2.2%)
At an overall level, more than two-third
participants perceived that AGLCs highly
impacted their aspiration and perception for
education.
“One of the girls enrolled in AGLC did not
know how to read and write but now is
capable of handling the household budget all
by herself. Moreover, she has pledged that her
brother and sister will definitely complete
school though she did not get that
opportunity” – Block Co-ordinator, Abdasa

Endline Evaluation Study: K-LEAP Final Report
IMRB International 63
6.8. Impact of AGLCs
Desire to attend school
Girls drop out from school inadvertently due to other household
commitments and lose out an opportunity to create a worthwhile life for
themselves. AGLCs were started with an intention to provide basic education
to adolescent girls who drop out or do not get a chance to study in schools.
These girls learn basic reading and writing skills at these centres, build
friendships with other girls, receive vocational trainings, participate in
various activities and gain an exposure to the outside world. AGLCs adopt
interactive methods which makes learning fun for these girls. This created a
desire in them to join the formal education system and complete their
education as they realized the importance of learning in their lives. Further an impact in the mind set of
girls as well as their families was created who started supporting their education for the betterment of their
lives.
Increase in confidence
Girls learned new things and imbibed qualities from each other through regular interactions at the learning
centres. Site visits to places like the police stations, markets in urban areas gave them exposure and helped
in broadening their horizons. They gained different skills at the learning centres through the knowledge
and training imparted to them by the mentors. This gradually increased their ability to speak as they shed
their inhibitions and eventually their confidence increased.
Literary and Numeracy skills
The techniques adopted at the learning centres have made learning interesting for the members and have
provided them basic reading and writing skills to complete their day to day chores without depending on
others. For instance, they can now handle their household budgets without anyone’s help and can calculate
their income and expenditure of milk production to help their parents. This seems a small achievement but
it creates a huge difference in their lives as it eventually leads to an increase in the self-worth of these girls.
The girls shared their personal stories of managing the household budgets all by themselves and being able
to do the income as well as expenses calculations for their parents during the focused group discussions.
These centres have surely provided them an opportunity to explore newer things and learning skills which
they otherwise would never have been available to them.
Around eight-nine girls
have joined formal
schools after becoming
members of the
Adolescent girls
learning centres at
Naliya-VRTI,
functionary
“There were girls enrolled in AGLCs who had never gone out of the villages. We took them for
exposure to Naliya to show them the police station, important district places to increase their
knowledge” – VRTI functionary, Naliya
“Activites like sports, singing, dancing make learning fun and help us in shedding our inhibitions” –
Adolescent girls, Abdasa

Endline Evaluation Study: K-LEAP Final Report
IMRB International 64
Skill based training
AGLCs provide skill based training to the girls to help them learn basic skills
needed to earn a livelihood. A 15 day training programme was organised for
the mentors of the AGLCs with an aim of developing the tailoring skills of
girls in the learning centres. Apart from this, health training was provided
where issues like health hygiene, reproductive system, and physical changes
at adolescent age, importance of nutritious food and information regarding the
menstrual cycle was covered. These trainings were liked by the girls, as
acknowledged during the focused group discussions.
Family support
Education of women is possible only with an active support of their families else they generally tend to be
bound by the domestic responsibilities. It was very difficult to convince the parents of adolescent girls in
the initial stage when the learning centres had just started. VRTI (CARE’s implementing partner)
functionaries had to personally interact with the parents to convince them to send their girls to these centres
and inform them about the various advantages of becoming a member of these centres. After some initial
hesitation, they did agree to send their daughters and were glad that they had sent their girls to these centres
which had created a positive impact in their lives.
Overall improvement in life
It is imperative to lead a well-rounded life and education plays an important role in achieving an overall
happy life. Girls feel an improvement in their overall life after joining these centres as they not only gain
basic reading and writing skills but also gain exposure to various activities. These girls agreed to learning
newer skills and gaining knowledge by becoming members of these AGLCs as shared by them during the
discussions conducted in Abdasa and Lakhpat blocks of Kutch.
6.9. School Management Committees (SMCs)
SMCs exist for the benefit of the students at school and their parents. These committees comprise of 70
per cent women. Almost all the schools have a school management committee and meetings are held
regularly to solve the issues at school or discuss topics related to the schools. Parents who are members of
the SMCs have been imparted training on the provision of the Right to Education Act with reference to
the responsibility and role of SMCs.
Functioning of SMCs
Regular meetings are held for the SMC members with a different agenda for each of these meetings. These
SMCs function involve the development of the students and discussing activities as well as topics related
to their growth in school. Cultural, sports activities, singing, dance and disaster management presentation
were conducted for the students. The SMC members motivate children to participate in various
competitions and activities conducted at school. The formation of SMC has helped in involving the parents
in the activities of the school and motivating the children to perform better at school. Students are
appreciated and awarded for their good work. For instance, Aaj ka Gulab award is given to the children
who maintain cleanliness.

Endline Evaluation Study: K-LEAP Final Report
IMRB International 65
Understanding the challenges
• Convincing parents - Most common reason for low admission of girls in schools is lack of social
support. They are not allowed to leave homes and safety is another issue. Program co-ordinators had
to frequently interact with parents to encourage girl’s education.
• Interacting with females - Many of the program co-ordinators were male and it was difficult to work
with girls for them. It took some time for parents and girls to trust the program co-ordinators.
• Absence of members – SMC does not have full attendance during all the meetings. It was difficult to
influence the parents to actively participate in these meetings.
• Girl’s education – Families do not place importance on the education of girls and these girls often
spent the entire day completing household chores. AGLCs came as a relief for such girls who missed
an opportunity to learn at school.
• Lack of teachers and space- KGBV schools lack adequate teachers for the students and space is
insufficient to create separate labs or any other specific room in school.
• Frequent migration – Migration of parents led to drop out of the students and they were reluctant to
send them especially girls to school in the new place. But KGBV offered an alternative for parents to
leave behind their daughters to complete their education.
********
Copyright © 2022 FDOKUMEN