Livelihood and Sustainable Village Development
112
“Livelihood and Sustainable Village Development: A Study of Selected Villages” Dissertation Submitted to Krantiguru Shayamji Krishana Verma Kachchh University Mundra Road, Bhuj – Kachchh. For the Degree of Master of Philosophy In Economics Faculty: Arts By Goswami Dishabahen Arvindbharthi Under the guidance of Dr. Naimesh R. Desai Assistant Professor, Department of Statistics, Shri R.R.Lalan College of Arts and Science, Bhuj - Kachchh.
-
Upload
digitaluniversity -
Category
Documents
-
view
5 -
download
0
Transcript of Livelihood and Sustainable Village Development

“Livelihood and Sustainable Village Development:
A Study of Selected Villages”
Dissertation Submitted to
Krantiguru Shayamji Krishana Verma Kachchh University
Mundra Road,
Bhuj – Kachchh.
For the Degree of
Master of Philosophy
In
Economics
Faculty: Arts
By
Goswami Dishabahen Arvindbharthi
Under the guidance of
Dr. Naimesh R. Desai
Assistant Professor,
Department of Statistics,
Shri R.R.Lalan College of Arts and Science,
Bhuj - Kachchh.

2
Statement 1 I, the undersigned, Goswami Dishabahen Arvindbharthi declare that the
Dissertation to be submitted by me is my original work. No part of this research
is submitted to this university or elsewhere for any degree or diploma.
The Dissertation submitted by me is my original work. Data and tables
used in Dissertation are clearly indicated in references at the end of the tables.
Economic interpretation of data analysis is made to reach the conclusion of this
research.
Date: (Goswami Dishabahen Arvindbharthi)
Place:

3
Statement 2 I, undersigned, dissertation guide for Goswami Dishabahen
Arvindbharthi, declare that the work undertaken and submitted by Goswami
Dishabahen Arvindbharthi is to the best of my knowledge her original work and
she has not submitted earlier such work to any other university or to this
university for any other degree or diploma.
Dr. Naimesh R. Desai
Assistant Professor,
Department of Statistics,
Shri R. R. Lalan College,
Bhuj – Kachchh.

4
Acknowledgements:
First, I pray to god without whose kind blessings pursuits for knowledge
would not have begun.
After God I am grateful to my family for their emotional strength and
incessant love. I would like to express gratitude to my grandmother, my mother
and my brother for their constant care which encourages me in concentrate in
the work. I owe to my father who shared his most of time with me in collecting
data. I would like to appreciate kind help of my younger sister in making
tabulations.
I am really grateful to Dr. Tushar Hathi for encouraging me all the time
and for giving the broad knowledge of how to do research work.
I would like to express gratitude to my guide Dr. Naimesh R. Desai who
helped me a lot in finding solution of hypothesis, developed my points and
clarifying the points with statistical method.
I am also grateful to Shri R. R. Lalan College, in general and Department
of Economics in particular for strong foundations laid in me.
I put on record the administrative support from the Department of
Economics and specially Ms. Dhairya Bhatt for her constant help.
Finally I thank all my friends and colleagues, my all teachers and all those
people who kept me alive during the period of my course.

5
Table of Contents
Particulars Page
No.
Chapter 1: Introduction 11
1.1 fundamentals of ‘Capability, Equity and Sustainability 12
1.1.1 Capability 12
1.1.2 Equity 12
1.1.3 Sustainability 12
1.2 Concept of Livelihood 13
1.2.1 Conceptualization of livelihood in brief 14
1.2.2 Determinants of livelihood 15
1.2.3 The Nature of human livelihood 15
1.3 Concept of Sustainable Development 18
1.4 Concept of Sustainable Village Development 18
1.5 The Changing Faces of Rural Livelihood in India 19
1.5.1 Changing Trends in Agriculture 20
1.5.2 Changing Trends in Rural Non-Farm Sectors 21
References 23
Chapter 2: Research Design 25 2.1 Research problem 25
2.2 Review of literature 26
2.3 Objectives 31
2.4 Hypothesis 31
2.5 Design of Sample 31
2.6 Collections of data 32
2.7 Statistical tools 32
2.8 Significances of the research 33
2.9 Limitation of the research 33
Reference 34

6
Chapter 3: Overview of Study Area: District,
Sample Blocks and Sample Villages 37
3.1 Highlights of the District 37
3.2 District at glance (Year 2001) 38
3.3 Major Characteristics of District and importance
of the District in the form of Historical Bond 39
3.3.1 Agricultural, Mineral and Forest Products 39
3.3.2 Famous for its Block printing and embroidery 39
3.3.3 Contribution in the form of historical bond 40
3.4 Important statistics of Sample Blocks (Year 2001) 43
3.5 Highlights of Sample Blocks 44
3.6 Historical monuments and places of Tourist interest in blocks 46
3.7 Profile of the Sample Villages in brief 47
3.8 Important statistics of Sample Villages 48
Chapter 4: Summary of findings 52
4.1 Socio-Demographic profile of the sample households 53
4.2 Classification of sample households according
to availability of basic amenities 62
4.3 Detailed analysis of Source of Livelihoods of Sample
Households and Characteristics of it 82
4.3.1 Agricultural Labourers 82
4.3.2 Animal Husbandry 84
4.3.3 Farmers 86
4.3.4 Wage Labourers 91
4.4 Testing of Hypothesis 93
Chapter 5: Conclusions 100
Reference 102
List of Bibliography 103
Questionnaire 104

7
List of Tables Name of Tables Page
No.
1.1 Household livelihood in four categories of parts 15
3.1 Important Statistics of the District (Year 2001) 38
3.2 Important statistics of Sample Blocks (Year 2001) 43
3.3 Information of sample villages about approach to road
and distance from district and block head quarter 47
3.4 Important statistics of Sample Villages: 48
3.5 Classification of villages according to availability of amenities 49
4.1 Distributions of Sample Households by Religion 53
4.2 Distributions of Sample Households by Caste 54
4.3 Distributions of sample population by age group 55
4.4 Distribution of sample population by educational attainment 56
4.5 Classification of Sample Population according to percentage
of Illiterates and Literates 57
4.6 Classifications of Sample Households according to Occupation 59
4.7 Classifications of Sample Households according to Income 60
4.8 Distributions of Sample Households according to owner of the House 62
4.8.1 Distributions of Households According To Owner of the House 62
4.9 Distributions of Sample Households by Condition of the House 64
4.10 Distributions of Sample Households by Availability of Lighting 65
4.10.1 Distributions of households by availability of lighting 65
4.11 Distributions of Sample Households by type of fuel used for cooking 67
4.11.1 Distributions of Households by Type of Fuel Used For Cooking 67
4.12 Distributions of Sample Households by Availability of Sanitation 69
4.13 Distributions of Sample Households by availability of Separate
Kitchen 70
4.13.1 Distributions of Households by Availability of Separate Kitchen 70
4.14 Distributions of Sample Households by Source of Drinking Water 72
4.14.1 Distributions of Households by Source of Drinking Water 72
4.15 Classifications of Sample Households According To
Availability of Ration Card 74
8
4.16 Classifications of Sample Households According To
Bank Account and Insurance Availability 75
4.17 Classifications of Sample Households by Asset Availability 77
4.18 Distributions of Sample Households according to No. Of
Households having each of the Specified Assets in Numbers 78
4.19 Distributions of Sample Household by Size of Family
and Numbers of Rooms available (Nakhatrana Block) 79
4.19.1 Distributions of Sample Household by Size of Family
and Numbers of Rooms available (Abadasa Block) 80
4.20 Distributions of Sample Household by Number of
Married Couple in Family and Availability of Separate Room 80
4.21 Calculation of Agricultural Laborer’s Income 83
4.22 Calculation of Livestock Developer’s Income 85
4.23 Calculation of Farmers’s Income 87
4.23.1 Distribution of farmers according to land holding
capacity and income 89
4.23.2 Classification of farmers according to their usage of
fertilizers and selling procedure for production 90
4.24 Calculation of Wage Laborer’s Income 92
4.25 Hypothesis 1 94
4.26 Hypothesis 2 95
4.27 Hypothesis 3 96
4.27.1 Hypothesis 3 96
4.27.2 Hypothesis 3 97
4.27.3 Hypothesis 3 97
4.27.4 Hypothesis 3 98
4.27.5 Hypothesis 3 98

9
List of Charts Name of Figure Page
No.
1.1 Conceptualization of livelihood 14
1.2 Component and flows in livelihood 17
3.1 Map of the Kachchh District 36
3.2 Map of the Nakhatrana Block 41
3.3 Map of the Abadasa Block 42
4.1 Distributions of Sample Households by Religion 53
4.2 Distributions of Sample Households by Caste 54
4.3 Distributions of sample population by age group 55
4.4 Distributions of Sample Population by Educational Attainment 56
4.5 Distribution of Sample Population by Educational Attainment with
percentage
57
4.6 Classifications of sample households according to occupation 59
4.7 Classifications of sample households according to Income 60
4.8 Distribution of Households according to owner of the house (Both
Blocks in Sample Households and Blocks in General)
62
4.9: Distributions of Sample Households by Condition of the House
(Both Blocks in Sample Households and Blocks in General)
64
4.10 Distributions of Households by Availability of Lighting (Both
Blocks in Sample Households and Blocks in General)
66
4.11 Distributions of Households by Type of Fuel Used for Cooking
(Both blocks in sample households and blocks in general)
67
4.12 Distributions of Households by Availability of Separate Kitchen
(Both Blocks in Sample Households and Blocks in General)
70
4.13 Distributions of Households by Source of Drinking Water (Both
Blocks in Sample Households and Blocks in General)
72

10
4.14 Classifications of Sample Households according to availability of
Ration Card
74
4.15 Classifications of sample Households by having account in Bank 75
4.16 Classifications of sample households by asset availability 77
4.17 Distributions of Sample Households according to No. of
Households having Each of the Specified Assets in Numbers
78

11
Chapter-1 Introduction In almost every domain of human life, change is accelerating. This is true
where ever we look in the Ecological, Economic, Intellectual, Political,
Professional, Psychological, and Social or Technological aspects of life. It is not
just that change is fast; it is getting faster and faster. In this context, future
conditions become harder and harder to predict. In this way, we are failing to
predict ‘future uncertainty’ and we are wrong in our anticipations of the future
needs.
In this time of changes and future uncertainty, there is wide gap between
development of ‘Rural’ and ‘Urban’ areas. In the development process, the city
has been engine of modernization and progress whether it would be through
firstly commerce, industrialization, modernization and so on. On the other hand,
village perhaps is the most unsustainable form of industrial production, in the
modern world.
The implication for urban and rural development strategies, much of the
arguments and concentration apply to urban condition, but focus should be turn
up towards the rural. This is for two reasons. First the needs of the rural people
are likely to get even less attention. Material, aspiration and political
organization combine to concentrates resources in urban areas (Mehta 1990).
And the second rural areas in developing countries to support many more
people.
The conflicts between these two terms, urban and rural development,
should recognize that our rural resources is already unsustainable in those
regions where there is highest population growth rates and most weak rural
environment. Any strategies for development for the 21st century is concerned
with ‘People, Equity and Sustainability’ have the question of how a vastly larger
number of people can gain at least their basically decent rural livelihood in a
manner which can be sustained.

12
1.1 Fundamentals of Capability, Equity and Sustainability: From the debate of the past few years we have taken three concepts
variously found in the social sciences. Each concept is represented by a single
world. Each has two sides normatively and descriptive. Used normatively, each
states a desirable goal or criterion for evolution and used descriptively, each can
be measured in principle. The three concepts are ‘Capability, Equity and
Sustainability’.
1.1.1 Capability: The word capability has been used by Amartya Sen (Sen 1984, 1987) to
refer to being able to perform certain basic functioning to what a person is
capable of doing and being. It includes for example, to be adequately nourished
to be comfortably clothed, to avoid escapable morbidity and preventable
mortality, to lead a life without shame, to be able to visit and entertain one’s
friends, to keep track of what is going on and what is others are talking about
(Sen 1987:18; Dreeze and Sen 1990:11). Quality of life is in terms of valued
activities and the ability to choose and perform those activities. The word
capability, has a wide span and being democratically defined, has diverse specific
meaning of different places including the many criteria of well- being of poor
people themselves.
Within the generality of Sen’s use of capability, there is a subset of
‘Livelihood capabilities’ that include being able to cope with stress and shocks,
and being able to find and make use of livelihood opportunities.
1.1.2 Equity : In conventional terms equity can be measured in terms of relative income
distribution. But we use the word more broadly to imply a less unequal
distribution of assets, capabilities and opportunities and especially enhancement
of those of the most deprived. It includes an end to urban and rural poverty and
deprivation.
1.1.3 Sustainability : In development prose ‘Sustainable’ has replaced ‘integrated’ as a
versatile synonym for ‘good’. Few, if any, dissent from of the view that
development should now be sustainable. There are, though, many meanings and
interpretations of the term. Environmentally, sustainability refers to the new
13
global concern with pollution, global warming, deforestation, misuse or
overexploitation of non-renewable resources.
There should be a long term view to have a sense of ‘global village’ with
limited resources threatened by wasteful and polluting consumption on the one
hand and by rapid growth of population on the other. In the livelihood context,
we will use sustainability in a more focused manner to mean the ability to
maintain and improve livelihoods while maintaining or enhancing the local and
global assets and capabilities on which livelihood depend.
1.2 Concept of Livelihood : A concept of livelihoods was put forward in the report of an Advisory
Panel of the ‘World Commission on Environment and Development’. (WCED
1987a:2-5).
“A livelihood comprises the capabilities, assets (stores, resources, claim
and access) and activities required for a means of living; a livelihood is
sustainable which can cope with and recover from stress and shocks, maintain or
enhance its capabilities and assets, and provide sustainable livelihood
opportunities for the next generation; and which contributes net benefits to other
livelihoods at the local and global levels and in the short term and long term”.
A livelihood in its simplest sense is a means of gaining a living. It is an
integrated concept with ‘Capabilities, Equity and Sustainability.’ Capabilities
are both as an end and means of livelihood: a livelihood provides the support for
the enhancement and exercise of capabilities (an end); and capabilities (a mean)
permit to be gained. Equity is both an end a means: any definition of equity must
include adequate and decent livelihood for all (an end); and equity in assets and
access are pre- conditions (means) for gaining adequate and decent livelihood.
Sustainability too is both end and means: Sustainability in resources is value or
end in itself; and it provides conditions (means) for livelihood to be sustained for
future generations.
Livelihoods were seen as a means of serving the objectives of both equity
and sustainability. And it provides resources and conditions for the enhancement
and exercise of capabilities.

14
1.2.1 Conceptualization of livelihood in brief : Livelihoods of the people can never be understood in any one-track logic -
be it economic, social, technical, cultural or political. The figure which is given
below throws more light on the concept.
Figure 1.1: Conceptualization of livelihood
The figure has shown how the development strategy and assets can
impact on well-mannered livelihood. In terms of Risk and Vulnerability, we
accept and expand broad use of assets to include normal living as well as survival
in crisis. The livelihood approach is based on the asset status of the poor is
fundamental to understanding the options open to them, five categories of assets
(or capital) – natural, social, human, physical and financial. Analysis of assets
should be checked how access to assets changed over the time rather than what
people have. In terms of physical capital skilled labour, knowledge and creativity
of them are included and it effects direct on access of adequate and decent
livelihood. While in terms of natural capital include income earning activity
related to nature. Political, human and social capitals are interlinked with each
other. Variously provision of food, cash and other goods to satisfy human needs
and this is consumed or invested in other assets. Financial capital leads
production to surplus to immediate consumption requirement.
Source: Hiremath B., IRM, Anand

15
1.2.2 Determinants of livelihood: There are several initial determinants of livelihood. Many livelihoods are
largely predetermined by accident of birth livelihood. In village India, children
may be born into cast with assigned role as potters, farmers, shepherds, landless
Labourers. Gender also defined socially pervasive determinants of livelihood
activities. Not necessarily a person may be born, socialized and apprenticed into
present at birth livelihood- as a farmer with land and tools, forest guard with
trees, shopkeepers with shop and stock, and shepherds with animals, each of
them may in turn create a new household or households in the same occupation.
Some people improvise livelihood with largely determined by social,
economic and ecological environment in which they find themselves. A person or
a household may also chose a livelihood, especially through education and
migration. Those who are better of usually have a wider choice than those who
are worse off and wider choice is usually generated by growth. In a future of
accelerating change, skillful capabilities to develop new opportunities may more
needed.
1.2.3 The nature of human livelihoods: The simple definition of a livelihood is as a means of securing living
summary a reality which comes into focus as being complex.
The definition of livelihood can be different hierarchical level is the
household, usually meaning the human group which shares, same fireplace for
cooking. In adopting this level in which the well being and access of same
household members, and specially women and children, broader level of
complete family, the social group, and the community. As per this context we will
here use the household as the unit of analysis.
Table 1.1: Household livelihood in four categories of parts:
People Their livelihood capabilities
Activities What they do
Asset Tangible (resources and stores) and intangible (claims and
access) which provide material and social means
Gain or outputs A living, what they gain from what they do

16
The core of a livelihood can be expressed as a living and the main
components and relationship presented in figure 1.2
Figure 1.2: Component and flows in livelihood
PEOPLE
TANGIBLE ASSETS INTENGIBLE ASSETS Source: Swift (1989) Of these components, the most complex is the tangible and intangible
assets.
In approaching to this, Swift (1989) provides a good starting point. In his
analysis, he distinguished three classes of assets – investment, stores and claims.
Adopting his division of assets into tangible ‘tangible’ and ‘intangible’, separated
out stores and resources as a ‘tangible’, and claims and access as ‘intangible’.
While these are large categories, putting them together avoids problems of
overlapping. Stores are often resources and vice versa, and claims requires
access if they are to have any value. The two groups can be continued as follows:
Stores and Resources: These are tangible assets commanded by a household. ‘Stores’ include
food stocks, stores of a value such as a gold, jewellery and, and cash saving in
banks and credit schemes. ‘Resources’ include land, water, trees and livestock
and farm equipment, domestic tools etc. Assets are often both stores and
resources, as with livestock, trees and saving.
LIVELIHOOD CAPABILITIES
A LIVING
STORES AND RESOURCES
CLAIMS AND ACCESS
LIVELIHOOD CAPABILITIES
A LIVING
STORES AND RESOURCES
CLAIMS AND ACCESS
LIVELIHOOD CAPABILITIES
A LIVING
STORES AND RESOURCES
CLAIMS AND ACCESS
STORES AND RESOURCES
CLAIMS AND ACCESS
STORES AND RESOURCES
A LIVING
STORES AND RESOURCES
A LIVING
STORES AND RESOURCES
A LIVING
STORES AND RESOURCES
CLAIMS AND ACCESS
A LIVING
STORES AND RESOURCES
CLAIMS AND ACCESS
A LIVING
STORES AND RESOURCES
LIVELIHOOD CAPABILITIES
CLAIMS AND ACCESS
A LIVING
STORES AND RESOURCES

17
Claims and Access: These are intangible assets of a household. ‘Claims’ are demands and
appeals which can be made for material, moral or other practical support or
access. The support may take many forms, such as food, implements, loans, or
work. Claims are often made at times of stress or shock, or when other
emergency arise. Claims may be made on individuals or agencies, on relatives,
neighbors, communities, social group or NGO’s, government or the international
community, including programmers for poverty alleviation. They are based on
combinations of right, power, and moral requirement.
‘Access’ is the opportunity in practice to use a resource, store or service
or to use a resource, store or service or to obtain information, employment, food
or income. Services are including transport, education, health, and markets.
Information includes extension service, radio, television and news papers.
Technology includes techniques of cultivation and new seeds. Employment and
other income earning activities include rights to common property resources
(CPRs) such as fuel wood or grazing on communal lands.
Out of these tangible and intangible assets people construct and arrange a
living, using physical labour skills and knowledge. Skills and knowledge may be
acquired within the household, passed on generation to generation.
Rural livelihood themselves comprise one or more than one several
activities. These can include cultivation, wage labour, livestock developers,
artisan work, providing services in transport such as carrying. They variously
provide food, cash and other good to satisfy a wide variety of human needs.
As Swift (1989) points out, such investments occur when production leads
to a surplus beyond immediate consumption requirement. Investment are made
in enhancing or acquiring resources, in establishing claims, in gaining access,
and in improving capabilities.
Capabilities may be enhanced again through investment in education and
training. The results of successful investment are added quality of assets and/or
capabilities which can be used in future threats to survival. Improvement in
capabilities in the provide condition and opportunities for wide choices,
diminishing powerlessness, promoting self-respect, reinforce moral and in other
ways improving the quality of living.

18
1.3 Concept of Sustainable Development: The term sustainable development was first used by the Brundtland
Commission, “meets the needs of the present without compromising the ability of
future generation to meet their own needs.”
Sustainable Development is balancing the fulfillment of human needs with
protection of natural environment so that these needs can be met not only in
present but in the infinite future.
The term Sustainable development is not only focus on environmental
issues; it is also economic, social, and political and so on. In support to this some
United Nations text in the 2005 World Summit outcome document; refer to the
‘interpedently and mutually reinforcing pillars of sustainable development and
environmental protection.’ The universal declaration, “Cultural diversity is as
necessary for human kind as biodiversity is for nature. One of the roots of
development understood not simply in terms of economic growth but also as a
means to achieve a more satisfactory intellectual, emotional, moral, and
spiritual.” (Ghosh and Gupta: 2008:562)
Sustainable development requires that societies meet human need both by
increasing productive potential and by insuring equitable opportunities for all.
Sustainable development is a determined concept has sustainability and deep
ecology. Different conceptions between this and also expose tension between the
terms. Thus, the concept rests a large amount of debate as to its precise
definition.
1.4 Concept of Sustainable Village Development: According to District Census Handbook, Census of India, 2001
definition of village is “The basic unit for rural areas is the revenue village,
which has definite surveyed boundaries. The revenue village may comprise of
one or more hamlets but the entire village treated as one unit for presentation of
data. In un surveyed areas, like villages within forest areas, each habitant area
with locally recognized boundaries is treated as one village”.
Mostly the term village is use as agri-business. But it is not just only
agriculture. The associate village with agriculture is clearly only the part of
story. Village provide to all with food, with water, with resources and especially

19
with the places to be relaxed and so on. Another characteristic of village is
defined highest population growth. When we said that the satisfactions of human
needs are objectives of development, the essential need of huge numbers of
people in villages for food, for clothing, shelter, jobs are not being met and
beyond their basic needs this people have legitimate desire for an improved
quality of life.
In this context, sustainable village development should be defined in two
terms highest population growth and availability of environment. Village is
Sustainable when it can meet with the needs of present without compromising
the ability of future generation to meet their own need and sufficient use of
available environment resources.
1.5 The changing faces of rural livelihood in India: India is witnessing a series of changes since early nineties. In 2007, Sensex
crossed 20000 points at the same time India ranked 94th out of 118 countries in
the Global Hunger Index. Unprecedented numbers of farmers suicides, big
corporate houses entering into retail business, land allocation for Special
Economic Zones, boom in information technology and IT enabled services, zero
growth rates in employment, are among many such events that needs
introspection.
In recent years the Indian government has made huge investments in
development of infrastructure like roads, telecommunication, etc. It has also
passed legislation to benefit rural citizens. For example, under universal service
obligation, each village should have a village public telephone installed and
maintained by the service providers. Also, the “Right to Information Act” passed
recently was to make the government system accountable to the citizens.
However, civil society organizations are often unaware of such legislation and
they fail to pull the benefits. Corporate houses, private business houses and
largely urban citizens are making effective use of the provisions. Thus, the
benefits are inequitably distributed between the rural and urban areas. This
rural-urban divide in accessing infrastructure services coupled with inability of
civil society organizations to utilize the existing provisions has contributed to the
slow growth of livelihood opportunities in rural areas.

20
It takes holistic consideration of things that the poor might be vulnerable
to, assets and resources that help them thrive and survive, policies and
institutions that impact their livelihoods, how the poor respond to threats and
opportunities and what sort of outcomes the poor aspire to.
1.5.1 Changing trends in Agriculture: In recent years, land based livelihoods of small and marginal farmers are
increasingly becoming unsustainable, since their land has not been able to
support the family’s food requirements and fodder for their cattle. As a result,
rural households are forced to look at alternative means for supplementing their
livelihoods.
Majority of the farmers derived their livelihood from agriculture. During
the Tenth five year plan, Gross Domestic Product (GDP) originating from
agriculture and allied activities was 2.3 percent compared to 8.0 percent in the
industrial sector and 9.5 percent During this plan period, the growth in the
agriculture and allied activities averaged 2.3 percent which is lower than that of
3.2 percent during the 1990s and 4.4 percent during the 1980s. Also, there is a
shift from staples to cash crops which is the major reason for food insecurity.
From 1960-61 to 1998-99 the area under grain crops has gone down from 45
million hectares to 29.5 million hectares, area under cotton has increased from
7.6 to 9.3 million hectares and area under sugarcane has increased from 2.4 to
4.1 million hectares. Since 1990-91, due to the new economic policies, the area
under food grains and coarse grains have declined by -2 and -18 percent
respectively while area under non-food cash crops such as cotton and sugar-cane
have increased by 25 and 10 percent respectively. (Hiremath 2007)
The agricultural sector is facing the new challenges such as diminishing
land resources, factor productivity decline, threatened loss of bio-diversity,
natural resource degradation, widening economic inequality, etc that have
serious implications on the livelihoods of the poor. Indian agriculture has also
come under significant adjustment pressure from market liberalization and
globalization.
The changing consumer preferences have added to the complexities of
adjustment. The food consumption pattern in India is diversifying towards high

21
value commodities. The decline in per capita consumption of cereals, in
particular coarse cereals, has worsened the nutritional status of the rural poor.
In the case of the poor, total consumption of high value cereals like rice has
declined by 10 percent due to rise in prices of cereals in real terms during the
1990s and dietary diversification towards non-food grains. Similarly, average
daily intake of protein by the Indian population decreased from 60.2 grams to 57
grams in the rural area between 1993-94 and 2004-05 (Praduman Kumar, 2007).
Food security is only one (although extremely important) element of
livelihood security. But since farmers never make their decisions in a one-track
logic, it seems possible that the one-track security based on food alone would
have to be enlarged to the more holistic notion of security of livelihood, or
speaking even more simply- life-security. Livelihood security encompasses food
security, social security and psychic security. Each one of them has some basic
minimum entry level to achieve and maintain and also must be pursued in a
balanced way.
In the absence of adequate income farmers are attracting by off-farm
activity, it turns up in migration and becomes stable to overall livelihood
security. Many development agencies seek to reduce distress migration by
providing opportunities to farmers to increase their income from land based
activities through commercialization of agriculture. Often the approaches taken
are uneven.
1.5.2 Changing trends in rural non farm sectors: The rural non-farm economy is the primary source of income and
employment for many of India’s poor. The sector therefore plays a key role in
determining future prospects for employment growth and poverty alleviation in
the country. A large share of rural manufacturing involves agro-processing and
the production and supply of farm inputs. Agricultural performance therefore
tends to influence growth in the non-farm economy. A growing agriculture
demands production inputs in addition to supplying raw materials to transport,
processing and marketing firms. And increases in farm income stimulated
demand for consumer goods.
22
Rural livelihoods are affected by globalization such as entry of corporate
sector in retail business and expand in SEZ. With example of retail industries we
can understand the impact of it.
The entry of corporate retail is nothing but a hijack of India’s vibrant,
well organized retail service economy. Corporate retail will not create two
million jobs; but it will destroy 38 million livelihoods of people involved in
running small shops and street markets. The growth being projected as a new
contribution to the economy hides the destruction of the contribution of the 40
million people involved in small retail to the Indian economy(Hiremath b., 2007).
India is a land of retail democracy. Hundreds of thousands of weekly
haats and bazaars are located across the length and breadth of our country by
people's own self-organizational capacities. India’s streets are bazaars – lively,
vibrant, and safe and the source of livelihood for millions. India has the highest
shop density in the world, with 11 outlets per 1000 people not including the
village haats.
Our retail democracy is characterized by high levels of livelihoods in
retail with nearly 40 million employed accounting for 8 percent of the
employment and 4 percent of the entire population. It is predominantly self
organized with low capital input and highly decentralized. In a country with
large population and high levels of poverty, this model of retail democracy is the
most appropriate in terms of ecological sustainability and economic viability. By
2011, more than 6600 mega stores are planned with investment of Rs. 40,000
crore. Reliance plans to invest $5 billion over next four years to open thousands
of retail stores. Walmart’s partner Bharti also plans to invest up to $2.5 billion in
new stores in the next eight years. The entry of the giant corporate retail in
India's food market will have direct impact on India's 650 million farmers and
40 million people employed in tiny retail. (Hiremath B., 2007)
The rapid changes at the macro level that India witnessed since the early
nineties has contributed to the instability of the livelihood systems of the poorer
section of both rural and urban households. While the benefits of globalisation
process have largely accrued to the urban sector growth the rural sector has
been left behind. Slowdown in agricultural growth and productivity, changing
cropping patterns, increase in distress migration, changing consumption

23
patterns, government policies favouring industrial houses, among others have
seriously undermined the food and livelihood security of the poorer households.
References: WDR -1991, “World Development Report 1991”,Oxford University Press
for the World Bank
Sen A., 1981 “Poverty & Famines: an assay on Entitlement and Famines”,
Clarendon Press, Oxford.
-1984, “Resources, Values & Development” Basij Blackwell, Oxford.
-1987, “The standard of living”, The Tanner Lectures, Clare Hall,
Cambridge 1985, Cambridge Uni. Press, Cambridge.
Quoted from Chambers, R. and Conway, G., 1991 “Sustainable Rural
Livelihoods: practical concepts for the 21st century.” IDS Discussion
Paper 296
Dreze, J. and Sen A., 1989 “Public action for social Security: Foundations
and strategy” DEP No.20, the Development Economics Research
Program, London School of Economics, London- August.
Mehta S.B. “Garibo Garib Kem rahe chhe: Duniya na vikas ma saheri
tarfen no ek Abhays” University Granthnirma Board, 1990.
Lipton M. 1975-76, “Why poor people stay poor: A Study of Urban
bias in World Development.”
WCED, 1987 “FOOD 2000: Global Policies for Sustainable Agriculture”,
a report of the Advisory Panel on food security, agriculture, and
environment to the World Commission on Environment and
Development, Zed Books Ltd. London and New Jercy.
Swift, J. 1989 “Why are rural people vulnerable to famine” IDS (Institute
of Development Studies) Bulletin Vol.20. No.2.
Ghosh, D. and Gupta B. 2008 “Accessibility of Basic minimum services:
The Cornerstone of Sustainable Development” paper presented at “The
Indian Economic Associations 91st Annual Conference” Vol.1, 27th & 29th
Dec.2008. The Theme was “Economic Philosophy of Jawaharlal Nahru”
and “Inter Regional Disparities in India”.

24
Praduman Kumar, Mruthyunjaya, Madan M Dey Long-term Changes in
Indian Food Basket and Nutrition, Economic and Political Weekly
September 1, 2007, pp: 3567 -3572.
Hiremath B., 2007 “The Changes Faces of Rural Livelihoods in India”
paper presented at National Civil Society Conference on “What it Takes
Eradicate to Poverty” at Institute of Rural Management, Anand.

25
Chapter 2 Research Design: Research design is needed because it facilitates research operations as
sufficient as possible with maximum information and minimum expenditure of
effort, time and money. It is just like for better economical and attractive
construction of a house, we need blue print, well thought out and prepare by an
expert architect, as similarly we need a research design or a plan in advance of
data collection and analysis for our research project.
“A research design is the arrangement of conditions for the collection and
analysis of data in a manner that aims to combine significance to the research
purpose with economy in practice”. As such the design includes an outline of
what the researcher will do from writing the hypothesis and its operational
implications to the final analysis of data. In a brief, research design must, at
least, contain 1) a clear statement of the research problem; 2) procedures and
techniques to be used for gathering information; 3) the population to be studied
and sample define; 4) methods to be used in processing and analyzing data.
A brief description of the research design for this research is stated as
following:
2.1 Research problem: Quite often we all hear that a problem clearly stated is a problem half
solved. This statement signifies the need for defining a research problem. The
task of define research problem results into more specific formulation of not only
a meaningful from of an operational point of view, but it is equally capable of
paving the way for the development of hypothesis and for means of solving
problem itself. For this research, research problem is states in following terms:
A world in which poverty and inequality are widespread will always lying
on our front to ecological and other crises. And this happens because huge
numbers of rural people are even not meeting with the basic needs such as food,
clothing, shelter, jobs etc. Not only essential basic needs are question but they
have legitimate right for an improved quality of life. The problem is also defined
in terms of people who are accept the impact of it poor and enable to complain
effectively.

26
In India vast numbers of people are living in rural areas and facing
problem related to basic needs availability. It is also true that the problem stated
for, not just because of lack of resources but it is a failure of policy
implementation or we can observe that the whole concentration and resources
are derived in urban areas.
In this context, there are some questions arise: In what condition rural
people are living and what is accessibility of their to achieve their basic needs? Is
there any improvement in these condition or stated as it is; Is there availability of
livelihood in village are enough for present and future generation? And last what
do they gain from what activity they do?
In search of answer to all this questions, I have selected India’s one of the
biggest district in term of area and stands with long coastal line. There are so
many differences of environment and geographical structure within the district.
And it impacts direct on livelihood. Each block is differ from the another block
and as it is same for villages. Ones performance is good in agriculture and other
in any other activity such as animal husbandry, wage labour, trade, and so on.
But the villages are sufficient enough for people to meet their basic needs and
improved quality of life that is the question. It should be examined.
2.2 Review of literature: There is ample research work available concerning the theme. Some
which helped to design the work is summarized as under:
1. Andrew Dorward, Simon Anderson, Susanne Clark, Bernadette Keane and
Julieta Moguel, 2001 “Asset Functions and Livelihood Strategies: A Framework
for Pro-Poor Analysis, Policy and Practice”.
The paper builds the current highlights on the importance of assets in
increasing the productivity and reducing the vulnerability of poor people
livelihoods. A conceptual framework is developed that relates the functions and
attributes of poor people’s assets to their livelihood status and strategies. The
framework promotes more integrated consideration of different assets held by
the poor, and hence facilitates analysis for policy, capacity building and
technological interventions to expand livelihood opportunities for the poor.

27
2. Chakraborty P. Tiwari H., Jha M., (2009) “Sustainable Rural Livelihoods
through Participatory Natural Resource Management”.
The study basically deals with natural resource base and it focus how
natural resources Sustains Rural Livelihood and improves the economic and
social condition of people. The paper analyzed how livelihoods have been
improved in specific area due to the impact of policy intervention through
watershed development. Main focus of this paper is to highlight the impact of
watershed management on the environment and socio-economic aspect of rural
community through participatory natural rural management.
Overall the paper concluded that the participatory approach has notably
contributed towards the sustainability of livelihood for the community as a
consequence of natural resources stabilization. In this context, the beneficiaries
have been able to improve their livelihoods options in the process together with
reversing significantly the degradation of natural environment. The findings of
this paper is limited in the particular region (Midnapur, West Bengal) and it is
true because the universal program (for improvement in livelihood) can not
work effectively in the local area. There must be needed different kind of
livelihood strategies for grass root level.
3. DFID (1999–2005), Sustainable Livelihoods Guidance Note 10 “tools for main
streaming disaster risk reduction: Sustainable Livelihood Approach”.
‘Tools for mainstreaming disaster risk reduction: Sustainable livelihood
approach’ is a series of guidance notes for DFID and UNDP. For use by
development organizations in adapting programming, project appraisal and
evaluation tools to mainstream disaster risk reduction into their development
work in hazard-prone countries. The series is also of relevance to stakeholders
involved in climate change adaptation.
This guidance note explains how sustainable livelihoods thinking and
methods can support the incorporation of natural hazards and associated
disaster risk into development project planning. It briefly introduces Sustainable
Livelihood thinking and explains its application to projects and programmes,
with particular emphasis on its relevance to hazards and disasters. It reviews
methods used in Sustainable Livelihoods approaches to assess hazards,

28
vulnerability and risk, and discusses other factors in applying Sustainable
Livelihood to project cycle management.
4. Hiremath B.N., “The Changing Faces of Rural Livelihoods in India”.
This paper throws lights on how the rapid changes at the macro level that
India witnessed since nineties and contribution of this changes into the instability
of the livelihood system of both rural and urban. In the second part paper
observes that the benefits of globalization process derived by the urban sector
and it impact largely to the food and livelihood security of the poorer houses
(both rural and urban).
5. Ian Goldman, James Carnegie, Moscow Marumo, David Marumo, Elaine
Kela, Somi Ntonga, Ed Mwale, (2000) “Institutional support for Sustainable Rural
Livelihoods in Southern Africa: Framework and Methodology (with natural
resource perspectives”.
This paper reports on work carried out in Zimbabwe, Zambia and South
Africa, which used a Sustainable Livelihoods approach to assess the impact of
policy and services on poverty. It used the approach in following through a ‘the
public administration from village to central ministries’. As a result the
sustainable livelihoods framework has been adapted into one for examining
institutional issues. In the series of 50 papers this first paper addresses the
conceptual issues and methodological learning’s of undertaking this type of
audit.
The study has provided a holistic overview of policies and practices that
support or obstruct sustainable livelihood in particular region. An innovative
and participatory methodology has been developed for doing this. Care has been
taken to ensure local ownership since the strategies that have been proposed are
being taken forward.
6. Ian soones, 1997 “Sustainable rural livelihoods – A Framework for analysis”.
This paper outlines a framework for analyzing Sustainable Livelihood,
defined in relation to five key indicators. The indicators are creation of working
days; poverty reduction; well-being and capabilities; livelihood adaptation;
vulnerability and resilience and natural resource base sustainability. The
29
framework shows how, in different context, sustainable livelihood are achieve
through access to a range of livelihood resources (natural, economic, human and
social capitals) which are combined in the search of different livelihood strategies
(agricultural strengthening or reduction; livelihood diversification and
migration). Central part of this paper is analyzing the range of formal and
informal organizational and institutional factors that influence sustainable
livelihood outcomes.
This research project is exploring alternative routes to sustainable
livelihood for poor people in contrasting agro-ecological settings. The research
asks two questions: an analytic one – what institutional arrangements allow some
poor people to achieve secure, sustainable livelihoods, when others fail? ; And a
practical one – what policies can support the groups?
The work focuses on the institutional arrangements which allow people to
achieve sustainable livelihoods, or otherwise. We understand institutions in a
very broad sense to mean the regularized practice or patterns of behavior
structured by rules which have widespread use in society; such institution may
be formal or informal. Such institutions mediate the range of livelihood process
in rural areas. This paper focusing on four, these are such as processes:
agricultural strengthening, crop-livestock integration, livelihood diversification
and migration.
7. Miranda Cahn, Massey University, (2002) “Sustainable livelihoods approach:
Concept and Practice”.
The paper highlights the critiques the Sustainable Livelihood approach in
the context of rural development. In the paper it is describe as an approach not
only ‘a panacea for development’ but rather ‘a way of thinking’, the analytical
framework considerable potential to guide researchers and practitioners in rural
development and poverty reduction. It should be remind that the approach is
still growing as strengths and weaknesses emerge and discussion still continues.
Clearly the approach is sensitive to context and situation. As with any other tool,
success depends on both on how well the approach and associated frameworks
reflects the realities of life and on how sensitively, inclusively and competently
the approach is used in practice.

30
8. “TRANSPORT AND SUSTAINABLE RURAL LIVELIHOODS” P. Fouracre,
TRL Limited, paper presented at the Rural Travel and Transport Program,
U.K., 2001.
This paper provides work in the transport sector. The main factor which
characterize a rural transport environment are: the low population densities, low
levels of economic activity (low income), low vehicle ownership levels, poorer
provisions of roads (both in quality and quantity) and near absence of regular
transport services. This is also to be noted that the participation of rural is very
low level when it compare to urban.
It should be remind that, transport is a service to the impacts on the
development option of many of people’s livelihood. In an approach should be
think us that transport is a service industry and a means to an end not an end in
itself. As such the development of transport has to be seen in the wider context of
individual, household, community and to the country. And it is also true that, the
impacts of transport must be look in terms of basic level of economics, taking
account of social and environmental concerns and aspirations.
9. The working paper, “Sustainable Livelihoods: Concepts, Principles and
Approaches to Indicator Development”.
This paper provides the sustainable livelihood concept, its respective
components and gives preliminary thoughts towards the approach as ‘a means
for poverty elimination’. In the other section framework guided the development
of sustainable livelihood indicators and measure sustainable livelihood in the
areas of poverty reduction, sustainable development and participatory
development and their links to each other. In other words it insights in to
developing indicators for sustainable livelihood as an experiences associates with
measuring poverty, sustainability and participation and empowerment. This
working paper helps in clarifying some issues suggests the way in which
indicators for sustainable livelihood can be effectively developed, tasted and
eventually utilized by a variety of stakeholders.

31
2.3 Objectives: The objectives should be state for what kind of issues and variables are
checked for the particular research. Objectives focuses light on which
component of concept (or study) should be looked in the research. Particularly
for this research objectives are:
1. To find out the means of livelihoods of rural people.
2. To know what is the level of income and what kind of assets they have.
3. To know what is the role of education to improve opportunity in
achieving livelihood.
4. To know what is the size of family and their land availability.
2.4 Hypothesis: Formulating the hypothesis arise in the result of give specific direction to
research and for the purpose of testing the particular concept or thoughts; and it
also indicates the type of data required and the type of methods of data analysis
to be used. The following hypotheses are made here for this research:
1. Existing means of livelihood are adequate enough for sustainable village
development.
2. There is no relation between assets holding capacity and income
availability.
3. There are no significances in size of family and land availability.
4. Status of Education does not improve opportunity to achieve livelihood.
2.5 Design of Sample: All the items under consideration in any field of inquiry represent a
‘universe’ or ‘population’. It can be presumed that in such an inquiry when all
items are covered no element of chance is left and highest accuracy is obtained.
But in practice this may not be true. Because these type of inquiry involves a
great deal of time, money and energy. So the researcher must decide items for
selection what is technically called a sample. A sample design is a definite plan
for obtaining a sample from a given population. It refers to the technique or the
procedure the researcher would adopt in selecting items for the sample.
32
This research is related to livelihood condition and basic amenities of
household amenities and village’s amenities too. The researcher has select two
blocks of Kachchh and describes them as two clusters. From each cluster, four
villages are selected and from each village ten households have been selected. So
the each cluster has 40 households for analysis. For the selection of households,
choose four occupations such as Farmers, Animal Husbandry, Agricultural
Labourer and Wage Labourer, it depends on which kind of occupation found
most in the particular village. With sampling method there are total 80
households here for analyses.
2.6 Collections of data: Considering the research theme and looking at the assessment of ground
realities, it is required to collect primary data. For this research primary data
are collected with questionnaire method. Researcher arranged direct meeting
with household’s respondents. And other required secondary data are collected
from census report of government and village panchayat.
2.7 Statistical tools: In context of writing interpretation and to sustain the variety of data,
percentage and mode methods will be used in this research.
Do the facts support the hypothesis or they happen to be contrary? This is
the usual question which should be answered while testing hypothesis. And
answer is laid in the use of statistical methods. In this research, for testing of
hypothesis, tests will be used are such as Correlation, Chi-square test and
Analysis of variance (ANOVA).
First hypothesis is qualitative so it depends only on observation.
For Second and third hypotheses, Karl Pearson’s coefficient of
correlation method will be used and its formula is given below:
n∑xy – (∑x) (∑y)
r =
[n∑x2 - (∑x) 2][n ∑y2 - (∑y)2 ] For the fourth hypothesis two methods will be used. First we test each
occupation separately, for analyzing significance relationship between

33
educational status and income with Chi-square as a test of independence. The
formulas which will be used are given below: Ai Х Bj
For find out expected frequency, eij =
G Where Ai = Row total for the row of that cell,
Bi = Column total for the column of that cell,
G = Grand total.
This is the formula for Chi-square
After these Two Way ANOVA will be used.
2.8 Significance of the research: The concept of livelihood as an approach is an entry point to answer the
development problem. It focuses on the needs of rural poor and also focuses on
the role of asset at household level. The finding of this small research is
providing understanding vulnerability of rural poor and also throws a light on
future condition of them. Livelihood concept proved as a useful analytical device
to improve the lives of poor rural people. With this one region can build a plan of
action which effects change at the micro and macro levels.
2.9 Limitation of the research: A livelihood analysis attempts to account for all the possible outcomes of
it impacts on respondents. But furthermore, the analysis can also suggest what
strategies might adopt, and what support might need to be put in place to help
them for settle in future. In this sense, the livelihood analysis can be done as
impacts of development and also in terms of as evolutional of available
government schemes.

34
References:
Kothari C.R., “Research Methodology (Methods and Techniques)” New Age International (P) Limited, New Delhi, 2004.
Andrew Dorward, Simon Anderson, Susanne Clark, Bernadette Keane
and Julieta Moguel “Asset Functions and Livelihood Strategies: A
Framework for Pro-Poor Analysis, Policy and Practice” Published by
United Kingdom Department for International Development (DFID),
Contributed paper to European Association of Agricultural Economics
organized Seminar on ‘Livelihoods and Rural Poverty’, September 2001,
Imperial College Wye, U.K.
Chakraborty P. Tiwari H., Jha M. “Sustainable Rural Livelihoods through
Participatory Natural Resource Management” Journal of Rural
Development, vol.28, N-1, p. 85-100, Jan-March 2009.
DFID (1999–2005), Sustainable Livelihoods Guidance Note 10 “tools for main streaming disaster risk reduction: Sustainable Livelihood Approach”
Hiremath B.N., “The Changing Faces of Rural Livelihoods in India”
theme paper presented at Institute of Rural Management, Anand.
Conference organized by National Civil Society on “What it takes to
eradicate poverty” 4-6 Dec., 2007.
Ian Goldman, James Carnegie, Moscow Marumo, David Marumo, Elaine
Kela, Somi Ntonga, Ed Mwale “Institutional support for Sustainable Rural
Livelihoods in Southern Africa: Framework and Methodology (with natural
resource perspectives” Department for International Development (DFID)
no.49, March 2000.
Ian soones, “Sustainable rural livelihoods – A Framework for analysis”,
IDS Working paper 72, Discussion 1997.
Miranda Cahn, Massey University “Sustainable livelihoods approach:
Concept and Practice”
“TRANSPORT AND SUSTAINABLE RURAL LIVELIHOODS” P.
Fouracre, TRL Limited, paper presented at the Rural Travel and
Transport Program, U.K., 2001.
The working paper “Sustainable Livelihoods: Concepts, Principles and
Approaches to Indicator Development”

35
http://www.undp.org/sl/Documents/Indicators_and_eval/SL%20concepts/
sl_concepts,_priniples_and_approaches_to_indicator_development.htm on date 27th dec, 2009.

36

37
Chapter - 3 Overviews of the Study Area: District, Sample Blocks and
Sample Villages
3.1 Highlights of Kachchh District: Kachchh district is situated on the western end of the Gujarat state. It is
an ancient land possessed of great antiquity, which takes its name from its
geographical characteristics and topographical features resembling a tortoise.
This crescent shaped region called Kachchh forms part of north-west Gujarat. It
is bounded on the north and north-west by Pakistan, on the north-east by
Rajasthan state, on the east by the Banas Kantha and Patan districts, on the
south-east by Surendranagar district, on the south by the gulf of Kachchh and
Rajkot district and on the south-west by the Arabian Sea.
Some points in brief which highlight the district in general terms: Kachchh district is the 15th district in terms of population in state and in
terms of population density 35 persons per kilometer. As per population
density is concern district ranked 25th dense district in the state.
Kachchh district has the longest coast line of about 406 km.
Kachchh district is having 9th rank in sex ratio.
Kachchh district is having 950 villages among them 886 villages are
populated and 64 villages are unpopulated. In terms of village population,
Nakhatrana village is the most populated having 12,534 persons whereas
Hanumankhadi (Lakhpat) and Bharodiya (Mundra) villages is least
populated in district with 1 person each. And in terms of area of village,
Palansava village in Rapar block has the largest area of 13953.0 hectares
Sabhrai (nani) has the smallest area in Mandvi block having 48.0 hectares
among the villages of the district.
The economy of the district is basically dependent on agriculture as 42.2
percentage workers are engaged in agricultural activities and the
remaining 57.8 percentage are engaged in other works.
Basic chemical and chemical products (except products of petroleum and
coal), textile products (including weaving apparels), food products,
electricity, gas and water generation, water works supply etc. and wood
and wood products are most important non-agricultural economic
activities of the district.

38
3.2 District at glance (2001) Table 3.1
Particulars
State Gujarat
District Kachchh
Number of Villages
Total Inhabited Uninhabited
18,53918,066
433
950 886 64
Number of Households
Normal Institutional Houseless
96,91,36223,23848,115
3,20,588 778 382
Total
Person 50,671,017 15,83,225 Male 26,385,440 8,15,152
Female 24,285,440 7,68,073 Rural Person 31,740,767 1,108,333
Male 16,317,771 5,67,470
Female 15,422,996 5,40,863 Urban Person 18,930,250 4,74,892
Male 10,067,806 2,47,682 Female 8,862,444 2,27,210
Population
Urban 37 30 Percentage of
population Rural 63 70
Area (in sq. km.) 196,024 45,652
Density of population 258 35 (person per square kilometer)
Total 920 942 Rural 945 953
Sex ratio (Number of females per
1000 males) Urban 880 917 Number Per. Number Per.Persons 29,827,750 69.1 794,483 59.8Males 17,833,273 79.7 480,555 70.4Literacy rate
Females 11,994,477 57.8 313,928 48.6Source: Census of India, 2001 “District Census Handbook, Kachchh” Part ХII-A & B, Series25,
Gujarat.

39
3.3 Major characteristics of the District and contribution of the District
in the form of historical bond: Kachchh seems to have alienated from all other districts of Gujarat. It is
the biggest district of Gujarat. The population is comparatively very thin. Major
part of Kachchh is of course covered by the deserts. It has its own personality
and character. It is said “The winter is better at Sorath area and summer is
better at Gujarat, monsoon at Wagad and Kachchh is better for all seasons.”
Kachchh is situated on the western end of the state. The importance of Kachchh
is mainly because of its border with Pakistan.
3.3 1 Agricultural, Mineral and Forest Products: Kachchh district is endowed with economic resources such as agriculture
land. This district is famous for its wheat and cotton cash crops. Along with these
cash crops such as Bajari, Jowar, paddy, sugarcane are also grown in the
district. Various types of minerals are available in the district. Among them Red
Octine, White Clay, Iron Clay, Bauxite, Fire Clay, Lignite, Lime Stone, Silica
Sand are very important. Many industries have been established by government
and private sector. These industries are important from the point of view of their
employment in the district. Minor portion of this district is covered with forest.
More than 6.32% total geographical area of this district is under forest. The
chief forest products are Gorad, Baval, Vikalo, Ingor, Saledi, Dhaveda, Sajad,
Teak, Deshi Babul, Arduso and Semal.
3.3.2 Famous for its Block printing and embroidery: If any one deserves the credit of adding a touch of exotic colour to the
monochromatic desert scopes of the Rann of Kachchh and the arid, semi desert
scrubby grasslands of Banni, it is the embroiders. Techniques rage with the
community and region look for the simple needle work but wonderful effects of
Bavaliya embroidery to the fabulous bright yellow and red Banni embroidery,
both from the grass lands of Banni. Kachchh also specialized in block printing
and vegetables dyes. Paraffin wax resists, patricate printing material and bright
Ajrakh prints are still used, though now synthetic dyes and modern techniques
have been introduced as time saving measures.
40
3.3.3 Contribution in the form of historical bond:
Kachchh has gifted a number of great personalities to the society. The
modern history can never forget patriots like Shyamji Krishna Varma,
archaeologist like Bhagwanlal Indraji and Botanist like Jaikrishna Indraji. The
folk teller Dulerai Karani, researcher Ramsinhji Rathod and short story writer
like Jayant Khatri are few others to be named.

41
Map of Nakhatrana Block

42
Map of Abadasa Block

43
3.4 Important statistics of Sample Blocks (Year 2001):
Table 3.2
Particulars Nakhatrana AbadasaArea (in sq.km.) 1984.67 2398.26
33.6 38.6 Area under cultivation (Percentage to total area)
24.8 7.9 Area under irrigation (Percentage to total area)
132 166 119 150 Number of Villages
Total Inhabited Uninhabited 13 16
Total 129249 97508 Rural 129240 97508 Urban 0 0 Total 129249 97508 Males 65673 49740
Population
Females 63576 47768
65 41 Density of population (Persons per square kilometer)
968 960
Sex ratio (Number of females per 1000 males)
65.8 57.8 75.9 68.5 Literacy rate
Persons Males Females 55.4 46.1
20.5 22.4 Gap in Male-Female
Literacy rate
Source: Census of India, 2001 “District Census Handbook, Kachchh” Part ХII-A & B, Series25,
Gujarat.

44
3.5 Highlights of Sample Blocks: Kachchh has total 10 Blocks. Among them there are only three blocks
such as Lakhpat, Abadasa and Nakhatrana have total rural area. Abadasa block
has the highest number of villages i.e. 150, followed by Bhuj with 144 villages
while Gandhidham block has the lowest number of 8 villages. Nakhatrana block
is situated in the middle of the district. In terms of population, Nakhatrana
village is the highest populated village in district with 12,534 persons. In
Nakhatrana block total 3 villages have more than 5000 population such as
Nakhatrana (12,534), Kotda Jadodar (5,501) and Vithon (5,193), while in
Abadasa Block only one village Naliya (8,968). Nakhatrana is the head-quarter
of Nakhatrana Block and Naliya is the head-quarter of Abadasa Block.
In terms of sex ratio, Nakhatrna Block has 2nd number in the district with
968 females per 1000 males (1st is Mandvi with 997) and Abadasa has 4th rank
with 960 females.
In terms of total cultivated area, Nakhatrana block has 33.6 per cent of
cultivated area while Abadasa has 38.6 per cent. In terms of Irrigation facility to
total cultivated area Nakhatrana ranked 2nd with 24.8 percentage (Mandvi
ranked 1st with 27.5) in district, while Abadasa ranked 9th with only 7.9
percentage. In distribution of water by Narmada Project, most of provision in
Nakhatrana and Abadasa Block are distributed by Netra and Khirasara (villages
of Nakhatrana Block). In current time, Netra has provided irrigation facility to
total 135 villages and it covered 250 km area, after the Narmada project will
complete it will reached at 226 villages.
In terms of quality of land for agriculture Abadasa Block has the good
quality of land compare to Nakhatrana Block. In contrary, as per Agricultural
Production is concern contribution of Nakhatrana Block is larger than the
Abadasa block. In Nakhatrana Block farmers are familiar with traditional
agriculture. But they are very hard working and always ready to do anything for
getting maximum production. While in Abadasa Block farmers are now going to
do something for get maximum production. In recent time, Government provides
land to farmers of Punjab in Kothara and Mothada (Village of Abadasa block)
and they are doing really good in particular area to get maximum production.

45
The economy of Nakhatrana Block is basically depending on Agriculture
because 59.7 percentage of total working population is engaged in this sector.
Classification of working population is such as Cultivators are 21.4 per cent,
Agricultural Lobourers 38.3, Household Industry worker are 6.2 and Other
Workers are 34.2 per cent. Work participation between males and females is like
these, among total workers, there are total worker males 52.9 per cent and
worker females 27.8 per cent.
The larger number of people of Abadasa Block is also depending on
Agriculture for their livelihood. Among total working population 58.2 percent of
population are derived their livelihood from Agriculture. Classification of
working population is like these Cultivators are 27.1 per cent, Agricultural
Lobourers 31.1 per cent, Household Industry workers are 9.4 per cent and Other
Workers are 32.4 per cent. Work participation between males and females are
like these, among total workers, total male workers are 55.6 per cent and female
workers 34.0 per cent. This is not enough only give percentage of workers. It
should be examined that what they gains from what activity they do. In terms of
working days, wage rate, opportunity of livelihood all these are holding opposite
views between these two Block.
As per availability of basic amenities to total population is concern, there
are equal condition in total of 98.3 per cent villages are having education facility
(Primary School) in both Blocks. Medical facility is available for 93.6 per cent of
villages of Nakhatrana block, while in Abadasa it is available for 67.1 percent of
villages. Total villages approach by Pucca road is in Nakhatrana Block 95.2 per
cent and in Abadasa Block 84.2 per cent. In terms of banking facility, in
Nakhatrana Block it is available for 41.6 per cent of villages and in Abadasa it is
available for only 26.0 per cent of villages.

46
3.6 Historical monuments and places of Tourist interest in Sample
Blocks:
Abadasa: In Abadasa Block, there are five places viz. Suthari, Kothara, Jakhau,
Naliya and Tera which are known as the Jain Panchtirthi (group of five
pilgrim’s centers). In Kothara richest modern Jain temple in Kachchh was
completed in 1861 (v.s. 1917-1918). This temple dedicated to Shantinath, the
sixteenth of the Jain Saints.
Suthari, the village is known for “Balwantsagar Dam” constructed in the
memory of late Shri Balwantray Mehta, Ex. Chief Minister of Gujarat who died
here on the 19th September, 1965 at the time of Pakistan aggression when the
plane carrying him was shot down by the Pakistani Air Force.
Tera is recently declared as Heritage Village. In the village, there is
rehabilitation work for historical monument was done by the Government after
declaration as Heritage Village. There are temple of Jain worshipers and palace
of Rudrasinhji and beautiful pond which decorated by Sculptures of God and
Goddesses around.
Nakhatrana: In Nakhatrana, there are such places Pouanrogadh monuments (Manjal),
Yax mandir (Yax), Dhinodhar, than jagir etc. which are historical and tourist
interest places.
A Pouanrogadh monument is situated near the village of Manjal.
Pouanrogadh was, according to tradition, a town that belonged to Pouanra, the
nephew of legendary Lakha Fulani who once ruled over Kachchh. Of the two
protected monuments, the temple of Pouanreshwar is 10th century A.D. pre-
Solanki architecture, less ornate but distinctive due to its elaborate mandapa and
circumambulatory path. The mandapa which now exists only in part was
supported by heavy pillars capped by Kichakas. It rest on a high plinth and
bears sculptures of god and goddesses. Near by a Vadi or Medi or palace. It has a
structure which rests on a high plinth with mounding veering KritiMukhas. Only
the stone framework of beams now stands.
The Yax mandir is situated near by Nakhatrana village. In temple there
are 72 Devduts are holding weapons in hand and sit on the horse. Acoording to

47
the tradition it was said that they are come for the sake of save the villagers of
Pouanra. The Dhinodhar is very old place which is temple, according to
tradition, it is belonged to Dhormnath who pray ten years at this place and Than
Jagir is the associated with temple.
3.7 Profile of the Sample Villages in brief: For the study purpose, there are four villages selected from each Block. In
Nakhatrana Block, Rasaliya and Khombhadi villages are connected with pucca
road; while Rampar and Laxmipar villages are connect with kachcha road. As it
is for Abadasa Block, Bandiya and Ustiya villages are connected with pucca
road; while Khanay and Vamoti (nani) villages are connect with kachcha road.
The important statistics of villages are as follows:
Table 3.3: Information of sample villages about approach to road and distance
from district and block head quarter
Name of village
Distance from
District Hq. (Bhuj)(Km)
Distance from
Block Hq./ Name of
the Hq.(Km)
Approach to Kachcha/
Pucca road
Rasaliya 75 22(Nak.) Pucca Khombhadi(M) 73 20(Nak.) Pucca Rampar 85 32(Nak.) Kachcha Laxmipar 88 35(Nak.) Kachcha Bandiya 85 28(Aba.) Pucca Ustiya 90 23(Aba.) Pucca Khanay 90 35(Aba.) Kachcha Vamoti(N) 85 40(Aba.) Kachcha Notes: Hq. = Head quarter, Nak. = Nakhatrana, Aba. = Abadasa
Table 3.3 gives the details of distance form both district head quarter and
block head quarter. Also gives the detail of approach to road. All the villages are
far away from district head quarter, as per table shows, minimum distance is 73
and maximum distance 90 km. Sample villages are also found away from block
head quarter, as per table shows Vamoti(n) village has the far way from 40 km
and Khombhadi(m) 20 km away.

48
3.8 Important statistics of Sample Villages
Table 3.4: Important statistics of Sample Villages:
Name of block/Name of village
Are
a
(in h
ecto
rs)
Cul
tivat
ed
land
Ir
riga
ted
land
Population
Cas
te w
ise
dist
ribu
tion
of
popu
latio
n
Tot
al fa
mily
Tot
al B
PL fa
mily
Nakhatrana Male Female Total SC ST OBC General Total
Rasaliya 5024-24
2092 1092 1001 987 1988 207 0 480 1301 1988 454 166
Khombhadi(M)
1365.1 929.1
410 1231 1229 2460 104 71 385 1900 2460 453 136
Rampar 1829.6 939.4
411.7
548 519 1067 207 0 471 389 1067 189 49
Laxmipar 1462.7 928.3
412.6
442 464 906 270 36 180 420 906 158 75
Abadasa
Bandiya 4419.4 1433.2
0 418 410 828 9 0 50 769 828 157 145
Ustiya 1359.9 273.8
72.8 298 315 613 16 43 47 507 613 140 89
Khanay 2062.3 228.5
0 276 245 521 0 0 0 521 521 101 95
Vamoti(N) 3111.5 1067.6
22.7 310 299 609 106 21 89 393 609 141 101
Source: Village Panchayat
Table 3.4 gives the details of sample villages related to area, population,
total family and total BPL family in absolute number. In terms of total area of
villages, Rasaliya has the biggest land area and not only that but highest in
having cultivated land available, while Khombhadi(M) has the lowest in terms of
total area in sample villages. As per population is concern in sample villages,
Khombhadi (M) has the highest number of people and Khanay village is the least
populated. The villages of Nakhatrana Block are populated but the villages of
Abadasa Block are least populated and reason behind this is none other than
Agriculture. There is good quality of land in Abadasa Block but lake of ground
water and irrigation facility remain Agriculture sector behind. And where
Agricultural activity is not providing enough livelihoods, people must look at
another alternative. So migration is the reason behind the least population of the
sample villages of Abadasa Block. The table shows itself all other information in
absolute numbers which provide brief profile of the sample villages.

49
Table 3.5: Classification of villages according to availability of amenities
Name of Block/Village
Basic Facility
Dri
nkin
g w
ater
Com
mun
ity
Hal
lA
nim
al
Di s
pens
ary
Agr
i. M
arke
t
Dai
ry
Post
off
ice
Tel
epho
ne
Ban
k
Ele
ctri
city
Inte
rnet
Edu
catio
n
Hea
lth
Nakhatrana Rasaliya HT Yes No
(5) No (5)
No (5)
Yes Yes No (5)
Yes No P, S(5)
PHC (5)
Khombhadi (M)
HT Yes No (7)
No (7)
No (7)
No (7)
Yes No (7)
Yes No P, S(7)
PHC (7)
Rampar HT Yes No (4)
No (4)
No (4)
Yes Yes No (4)
Yes No P, S(4)
PHC (4)
Laxmipar HT No No (7)
No (7)
No (7)
No (7)
Yes No (7)
Yes No P, S(7)
PHC (7)
Abadasa Bandiya HT Yes No
(5) No (5)
No (5)
No (5)
No (5)
No (5)
Yes No P, S(5)
PHC (5)
Ustiya PT No No (10)
No (7)
No (7)
No (7)
No (5)
No (5)
Yes No P, S(10)
PHC (7)
Khanay PT No No (10)
No (10)
No (10)
No (10)
No (10)
No (10)
Yes No P(10),S(10)
PHC (10)
Vamoti(N) HT Yes No (18)
No (18)
No (18)
Yes Yes No (10)
Yes No P(10),S(10)
PHC (18)
Notes: Number in the bracket shows kilometers for amenities available near by
village,
HT = House Tap, PT = Public Tap, TW = Tube well, W = Well,
O(Other) = pond, lake, river
P = Primary School, S = Secondary School, H = Higher Secondary School
PHC = Primary Health Center, MH = Maternity Home
Table 3.4 reveals the details of basic amenities available to villages and if
not available there is given distance of availability of amenity near by village.
Most of the villages have House Tap as source of drinking water only 2 villages
using Public Tap for it. From sample villages, total 4 villages have community
hall and 4 not having this facility. All the villages have facility of electricity for
the house but there is irregular supply for Agriculture. Not a single village from
sample villages has the facility of animal dispensary, agricultural market, dairy,
bank and internet services. All the villages have facility of primary education but
no one have secondary and higher secondary school. As per health facility is
concern none of the village from sample villages has primary health center and
not even any private dispensary in a village. Only Bandiya village has private

50
dispensary running by Jain trustee of the villages who are settled in Mumbai.
The distance of PHC center is for the sample villages minimum 5 km and
maximum 18 km away. But sample villages have Nurse and ASHA worker in
village. Very few of the nurses are living in the villages. They visited the village
once in a week. So one can assume that how critical to achieve any health facility
for these villagers. If any one got a minor health trouble he has to go minimum 5
km away for getting private dispensary near by village.

51
ANXIETY FOR THE FUTURE….
CARE AND DARE FOR LIVELIHOOD

52
Chapter – 4 Summary of findings This chapter gives the details of sample households from sample villages.
For the analysis of livelihood, household is main component. Not only because
family members are sharing their meal together but they depending on each
other for each and every aspects of living. Livelihood of one’s is direct impact on
the other family members (mostly children, senior citizens and female). So it
would be checked that what the condition of household is.
All the primary data is divided in two parts, First part gives the details of
Socio - Demographic profile of Sample Households with Classifications of
Sample Households according to availability of Basic Amenities and Second part
give the details related to Source of Livelihoods of Sample Households and
Characteristics of it.
This chapter is divided in four parts such as: Socio – Demographic Profile
of Sample Households; Classifications of Sample Households according to
availability of Basic Amenities; Detailed analysis of Source of Livelihoods of
Sample Households and Characteristics of it and fourth part is about testing of
Hypothesis.

53
4.1 Socio – Demographic profile of the Sample Households: This section presents the profile of Sample Households covered during the
study with regard to Socio – Demographic point of view in the following
manners:
Table 4.1 Distributions of Sample Households by Religion
Village Name of Religion Total Hindu Muslim Jain Other Nakhatrana Rasaliya 5 5 0 0 10 Khombhadi(M) 7 3 0 0 10 Rampar 10 0 0 0 10 Laxmipar 5 5 0 0 10 Total 27 13 0 0 40 Percentage 67.5 32.5 0 0 100 Abadasa Bandiya 0 10 0 0 10 Ustiya 9 1 0 0 10 Khanay 7 3 0 0 10 Vamoti (N) 2 8 0 0 10 Total 18 22 0 0 40 Percentage 45 55 0 0 100 Grand total 45 35 0 0 80 Percentage 56.25 43.75 0 0 100 Figure 4.1 Distributions of Sample Households by Religion
Distributions of Sample Households by Religion (Nakhatrana Block)
67.50%
32.50%Hindu
Muslim
Distributions of Sample Household by Religion (Abadasa Block)
45.00%
55.00%HinduMuslim

54
Table 4.1 gives religion wise details of sample households. Among them
there are total 56.25 percentages of households following the Hindu religion and
43.75 percentages of households following Muslim religion. While look at block
wise details above mentioned there are 67.5 percentages of households following
the Hindu religion and 32.5 percentage of households following the Muslim
religion in Nakhatrana block, as it 45 percentage of households following the
Hindu religion and 55 percentage of households following the Muslim religion in
Abadasa block. In sample villages, Bandiya has all sample households following
Muslim religion and Rampar has the same condition for Hindu worshipers.
Table 4.2 Distributions of Sample Households by Caste
Village Name of Caste Total SC ST OBC GENERAL Nakhatrana Rasaliya 2 0 2 6 10 Khombhadi(M) 1 0 3 6 10 Rampar 2 2 4 2 10 Laxmipar 2 0 0 8 10 Total 7 2 9 22 40 Percentage 17.5 5 22.5 55 100 Abadasa Bandiya 0 0 0 10 10 Ustiya 1 0 0 9 10 Khanay 1 0 3 6 10 Vamoti (N) 2 0 2 6 10 Total 4 0 5 31 40 Percentage 10 0 12.5 77.5 100 G.Total 11 2 14 53 80 Percentage 13.75 2.5 17.5 66.25 100 Figure 4.2 Distributions of Sample Households by Caste
Distributions of Sample Households by Caste (Nakhatrana Block)
17.50%5.00%
22.50%55.00%
SCSTOBCGENERAL

55
Distributions of Sample Households by Caste (Abadasa Block)
0.00%
77.50%
12.50%
10.00%
SCSTO BCGENERAL
Table 4.2 gives the distribution of sample households according to caste in
absolute number and percentage. Among the total 80 sample households, 13.75
percentages of households found SC, 2.5 percentages are ST, 17.5 are OBC and
66.25 percentages are general. In Nakhatrana block, households distribution by
caste is such as 17.5 percentage households are SC, 5 percentage are ST, 22.5
percentage are OBC and 55 percentage are General, in Abadasa block it is as 10
percentage households are ST, 12.5 percentage OBC and 77.5 percentage
General.
Table 4.3 Distributions of sample population by age group
Percentage Age Male Female Total Male Female Total 0 to 6 21 16 37 56.76 43.24 100.00 6 to 15 35 41 76 46.05 53.95 100.00 15 to 25 80 63 143 55.94 44.06 100.00 25 to 40 35 45 80 43.75 56.25 100.00 40 to 55 43 36 79 54.43 45.57 100.00 55 to 70 19 9 28 67.86 32.14 100.00 70& above 3 7 10 30.00 70.00 100.00 Total 236 217 453 Percentage 52.10 47.90 100 Sex Ratio (number of females per 100 males) 92 Figure 4.3 Distributions of sample population by age group
Distributions of Sample Population by Age Group
0
20
40
60
80
100
120
140
0 to
6
6 to
15
15 to
25
25 to
40
40 to
55
55 to
70
70 &
abov
e
Age Group
Num
ber of
Per
sons
Male FemaleTotal

56
Table 4.3 gives the details of sample populations by age group and
particular with age group wise male-female in absolute numbers and percentage.
Total sample population is 453 persons with 236 males and 217 males. Sex ratio
for sample population is 92 (number of females per 100 males). From among all
age group there is highest numbers of population lies in 15 to 25 groups with 143
and lowest in 70 & above group with only 10 persons each. When look at age
group wise male-female population, there is highest 70 percentage females in 70
& above age group and there is wide gap in 55 to 70 age groups with Females are
32.14% and Males are 67.86%.
Table 4.4 Distribution of sample population by educational attainment
Age Illiterate Literate Male Female Total Male Female Total 6 to 15 0 0 0 39 37 76 15 to 25 12 14 26 60 57 117 25 to 40 15 33 48 21 11 32 40 to 55 28 31 59 12 8 20 55 to 70 12 8 20 5 3 8 70&above 4 6 10 0 0 0 Total 71 92 163 137 116 253 Figure 4.4 Distribution of Sample Population by Educational Attainment
Distribution of Sample Population by illiteracy
0
5
10
15
20
25
30
35
40
6 to
15
15 to
25
25 to
40
40 to
55
55 to
70
70 &
abov
e
Age Group
Num
ber of
per
sons
MaleFemale
Distribution of Sample Population by literacy
0
10
20
30
40
50
60
70
6 to 15
15 to
25
25 to
40
40 to
55
55 to
70
70 &
abov
e
Age Group
Num
ber of per
sons
Male Female

57
Table 4.4 gives the distribution of sample population by educational
attainment in particular age group and also with gender group in absolute
numbers. Total Illiterate persons 163 among them male are 71 and 92 females
are founded Illiterate from sample population, while total literate persons are
253 with 137 literate male and 116 literate female.
Table 4.5 Classification of Sample Population according to percentage of
Illiterates and Literates
Age Group Percentage of illiterate Percentage of literate Male Female Total Male Female Total 6 to 15 0.00 0.00 0.00 51.32 48.68 100.0015 to 25 8.39 9.79 18.18 41.96 39.86 81.8225 to 40 18.75 41.25 60.00 26.25 13.75 40.0040 to 55 35.44 39.24 74.68 15.19 10.13 25.3255 to 70 42.86 28.57 71.43 17.86 10.71 28.5770 & above 40.00 60.00 100.00 0.00 0.00 0.00Total 17.07 22.12 39.18 32.93 27.88 60.82Figure 4.5 Distribution of Sample Population by Educational Attainment with
percentage
Distribution of sample population by illiteracy
0.00 20.00 40.00 60.00 80.00 100.00 120.00
6 to 15
15 to 25
25 to 40
40 to 55
55 to 70
70 & above
Total
Age
gro
up
Percentage
Male Female Total
Distribution of sample population by literacy
0.00 20.00 40.00 60.00 80.00 100.00 120.00
6 to 15
15 to 25
25 to 40
40 to 55
55 to 70
70 & above
Total
Age
gro
up
Percentage
Male Female Total

58
Table 4.5 gives the detail above mentioned in percentage. There is total
illiteracy in the age group of 70 and above. Highest literacy is founded in age
group of 15 to 25. As looking towards the percentage of male and female literacy,
female literacy is decreasing when age was increasing and it is also founded that
it is lower in comparison to male literacy. While looking at grand total there are
total illiterate 39.18% and literate are 60.82%. Table it self provide all other
detail.

59
Table 4.6 Classifications of Sample Households according to Occupation
Village Farmer Animal Husbandry
Agricultural Labourer
Wage Labourer
Total
Nakhatrana Rasaliya 3 2 3 2 10 Khombhadi(M) 3 2 3 2 10 Rampar 3 3 2 2 10 Laxmipar 3 2 3 2 10 Abadasa Bandiya 2 2 6 0 10 Ustiya 6 2 2 0 10 Khanay 0 5 4 1 10 Vamoti (N) 0 4 2 4 10 Total 20 22 25 13 80 Percentage 25 27.5 31.25 16.25 100 Figure 4.6 Classifications of sample households according to occupation
Classifications of Sample Households according to occupation(Nakhatrana)
01
234
56
Ras
aliya
Kho
mbh
adi(M
)
Ram
par
Laxm
ipar
Name of Village
Num
ber of H
ouseho
lds
FarmerAnimal HusbandryAgri.Labourerwage labourer
Classifications of Sample Households by
Occupation(Abadasa)
0
1
2
3
4
5
6
Band
iya
Ustiya
Kha
nay
Vam
oti(N
)
Name of Village
Num
ber of
Hou
seho
lds
FarmerAnimal HusbandryAgri.Labourerwage labourer
Table 4.6 shows absolute numbers of sample households by village wise
occupational status. It is also indicate from table that among total 80 sample
households, there are 25 percentage of Farmers, 27.5 percentage of Animal
Husbandry, 31.25 of Agricultural Labourer and 16.25 are founded as Wage

60
Labourer. When look at village wise distribution of sample households, there
are, in the villages of Nakhatrana Block, all 4 occupations are founded but in the
villages of Abadasa village pattern regarding with one occupation. For example,
Bandiya village has majority numbers of sample households where engage in
Agricultural Labour, Ustiya village with Farmer, Khanay and Vamoti villages
with Animal Husbandry. While all the sample villages of Nakhatrana Block have
distributed equally with all four selected occupations.
Table 4.7 Classifications of Sample Households according to Income
Occupational status
Income group Farmer
Animal
Husbandry
Agricultural
Labourer
Wage
Labourer Total Percentage
Less than 15,000 0 7 12 4 23 29
15,000 to 50,000 2 10 12 9 33 41
50,000 to 85,000 2 3 1 0 6 8
85,000 to 1,20,000 4 0 0 0 4 5
1,20,000 to 1,55,000 0 1 0 0 1 1
1,55,000 to 1,90,000 1 0 0 0 1 1
more than 1,90,000 11 1 0 0 12 15
Total 20 22 25 13 80 100
Percentage 25 27.5 31.25 16.25 100 100
Figure 4.7 Classifications of Sample Households according to Income
Classification of sample households according to income
02468
101214
Less than15,000
15,000 to50,000
50,000 to85,000
85,000 to1,20,000
1,20,000 to1,55,000
1,55,000 to1,90,000
more than1,90,000
Income
Num
ber
of p
erso
ns
Farmer Animal Husbandry Agricultural Labourer Wage Labourer
Table 4.7 gives the distribution of sample household according to in which
income group they belong. According to income group in ascending order of the

61
percentage of households are: highest numbers of households, 41 percentage of
households, have income between income groups of 15,000 to 50,000; 29
percentage of households are having income groups of less than 15,000; 15
percentage of households are having income group more than 1, 90,000; 8
percentage of households are having income group 55,000 to 85,000; 5
percentage of households are having 85,000 to 1,20,000; and only 1 percentage of
households are having income groups 1,20,000 to 1,55,000 and 1,55,000 to
1,90,000.

62
4.2 Classifications of Sample Households according to availability of
Basic Amenities:
This section provides the classifications of Sample Households according
to availability of Basic Amenities in following manners:
Table 4.8 Distributions of Sample Households according to owner of the House
Table 4.8.1 Distributions of Households According To Owner of the House
Block Type of Ownership Total
Households Owned Rented Any other
Nakhatrana 24065 18370(76) 5273(22) 422(2) Abadasa 18249 14891(81) 2675(15) 683(4) Source: Census of India 2001, tables on Houses; household Amenities & Asset, CD no.6.
Figure 4.8: Distribution of Households according to owner of the house (Both
Blocks in Sample Households and Blocks in General)
NakhatranaBlock In Sample Households
52.50%47.50% own
rent
Nakhatrana Block In General
76%
22% 2%
O wnedRented Any other
Village Type of Ownership Own Rent Other Total Nakhatrana Rasaliya 3 7 0 10 Khombhadi(M) 5 5 0 10 Rampar 10 0 0 10 Laxmipar 3 7 0 10 Total 21 19 0 40 Percentage 52.5 47.5 0 100 Abadasa Bandiya 10 0 0 10 Ustiya 9 1 0 10 Khanay 6 4 0 10 Vamoti (N) 5 5 0 10 Total 30 10 0 40 Percentage 75 25 0 100 G.Total 51 29 0 80 Percentage 63.75 36.25 0 100

63
Abdasa Block In Sample Househods
75.00%
25.00%ownrent
Abadasa Block In General
81%
15% 4%
OwnedRented Any other
Table 4.8 gives the percentage and absolute number of sample households
according to owner of the house. Among 80 households 51 (63.75%) of the
respondents have own house. While looking at Block wise there are 52.5
percentages of households have their own house in Nakhatrana and in Abadasa
Block there are 75 percentages of households have their own house. In the
villages of Abadasa Block most of the houses are found to have built by financial
support of organizations. In Bandiya village all the houses are established by this
manner.
Table 4.8.1 gives the details of sample blocks households according to
owner of the house. In Nakhatrana block, 76% have own houses and 22% have
rented house. In Abadasa block, 81% have own houses and 15% have rented
houses.

64
Table 4.9 Distributions of Sample Households by Condition of the House
Village Condition of the house Kachcha Semi Pucca Pucca Total Nakhatrana Rasaliya 1 5 4 10 Khombhadi(M) 0 7 3 10 Rampar 0 3 7 10 Laxmipar 1 6 3 10 Total 2 21 17 40 Pecentage 5 52.5 42.5 100 Abadasa Bandiya 0 0 10 10 Ustiya 0 5 5 10 Khanay 0 4 6 10 Vamoti(N) 0 5 5 10 Total 0 14 26 40 Percentage 0 35 65 100 G.Total 2 35 43 80 Percentage 2.5 43.75 53.75 100 Figure 4.9: Distributions of Sample Households by Condition of the House (Both
Blocks in Sample Households and Blocks in General)
Nakhatrana Block In Sample Households
5.00%
52.50%
42.50% KachhaSemi PuccaPucca
Table 4.9 gives the distribution of sample households according to
condition of the house such as houses are Kachcha, Semi Pucca or Pucca. Among
sample households 53.75 percentages of households are founded Pucca, 43.75 of
percentages are Semi Pucca and 2.5 percentages are found Kachcha. In
Nakhatrana Block there only 5 percentages of houses are founded Kachcha
Abadasa Block In Sample Households
0.00%35.00%
65.00%
KachhaSemi PuccaPucca

65
houses, while in Abadasa Block not a single house is found Kachcha from sample
households. In Nakhatrana Block, there 52.5 percentages of houses are Semi
Pucca and 42.5 percentages are found Pucca and in Abadasa Block 35
percentages of houses are found Semi Pucca and 65 percentages are found Pucca
from sample household. By mean Semi Pucca houses are houses which covered
with roof of Deshi Naliya.
This table shows that among the sample houses Abadasa Block has the
highest percentage in Pucca houses. The reason behind these is that in the
villages of Abadasa Block, most of the Pucca houses are found to have built by
the large financial support of organizations.
Table 4.10 Distributions of Sample Households by Availability of Lighting
Village Source of Lighting Electricity Kerosene Solar energy Other Total Nakhatrana Rasaliya 10 0 0 0 10 Khombhadi(M) 10 0 0 0 10 Rampar 10 0 0 0 10 Laxmipar 9 1 0 0 10 Total 39 1 0 0 40 Percentage 97.5 2.5 0 0 100 Abadasa Bandiya 10 0 0 0 10 Ustiya 10 0 0 0 10 Khanay 8 2 0 0 10 Vamoti(N) 8 2 0 0 10 Total 36 4 0 0 40 Percentage 90 10 0 0 100 G.Total 75 5 0 0 80 Percentage 93.75 6.25 0 0 100 Table 4.10.1 Distributions of households by availability of lighting
Block Source of lighting Total
Households Electricity Kerosene Solar Energy
Other Oil
Any other
No lighting
Nakhatrana 24065 20405(84.79)
2781(11.56)
50(0.24)
58(0.24)
144(0.60)
627 (2.61)
Abadasa 18249 15905(87.16)
2201(12.6)
32(0.18)
56(0.31)
22(0.12)
33 (0.18)
Source: Census of India 2001, tables on Houses; household Amenities & Asset, CD no.6.
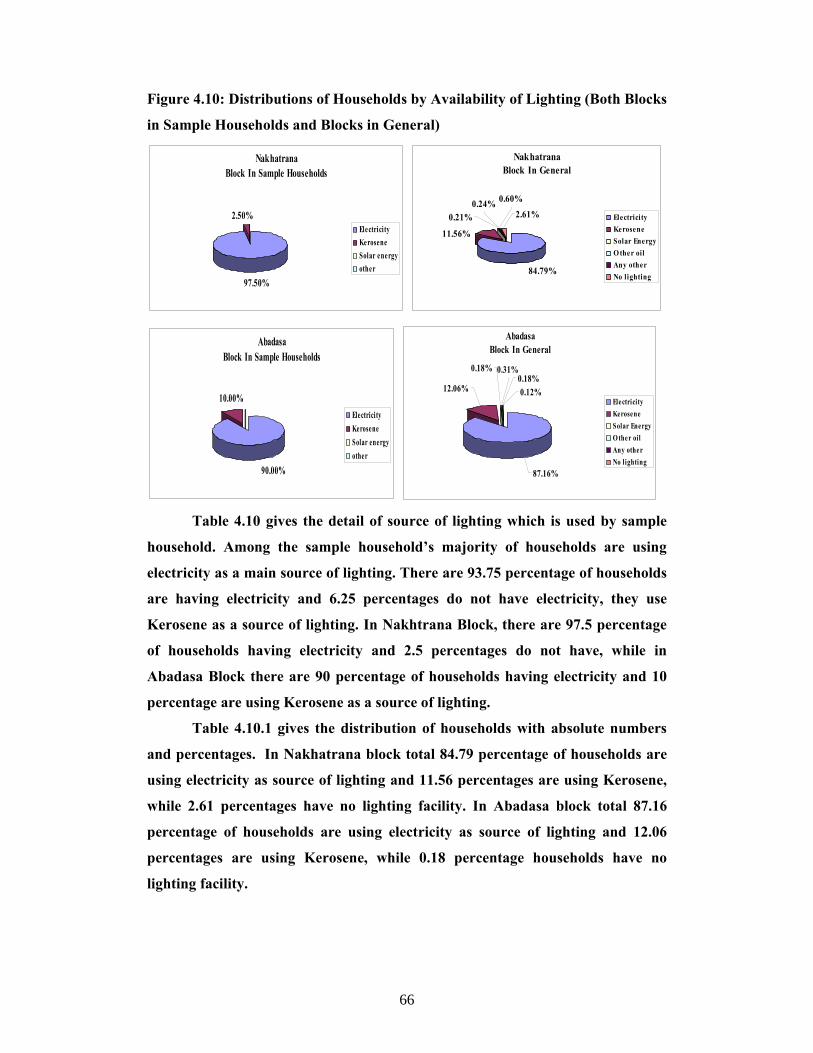
66
Figure 4.10: Distributions of Households by Availability of Lighting (Both Blocks
in Sample Households and Blocks in General)
Nakhatrana Block In Sample Households
97.50%
2.50%ElectricityKeroseneSolar energyother
Nakhatrana Block In General
84.79%
11.56%
0.21%0.24%
2.61%0.60%
ElectricityKeroseneSolar EnergyO ther oilAny otherNo lighting
Abadasa Block In Sample Households
90.00%
10.00%ElectricityKeroseneSolar energyother
Abadasa Block In General
87.16%
0.18%
12.06%
0.31%
0.12%0.18%
ElectricityKeroseneSolar EnergyOther oilAny otherNo lighting
Table 4.10 gives the detail of source of lighting which is used by sample
household. Among the sample household’s majority of households are using
electricity as a main source of lighting. There are 93.75 percentage of households
are having electricity and 6.25 percentages do not have electricity, they use
Kerosene as a source of lighting. In Nakhtrana Block, there are 97.5 percentage
of households having electricity and 2.5 percentages do not have, while in
Abadasa Block there are 90 percentage of households having electricity and 10
percentage are using Kerosene as a source of lighting.
Table 4.10.1 gives the distribution of households with absolute numbers
and percentages. In Nakhatrana block total 84.79 percentage of households are
using electricity as source of lighting and 11.56 percentages are using Kerosene,
while 2.61 percentages have no lighting facility. In Abadasa block total 87.16
percentage of households are using electricity as source of lighting and 12.06
percentages are using Kerosene, while 0.18 percentage households have no
lighting facility.

67
Table 4.11 Distributions of Sample Households by type of fuel used for cooking
Village Type of fuel used for Cooking Firewood Kerosene Cow dung Electricity Coal L.P.G. TotalNakhatrana Rasaliya 7 0 0 0 0 3 10 Khombhadi(M) 5 2 0 0 0 3 10 Rampar 8 0 0 0 0 2 10 Laxmipar 6 0 0 0 1 3 10 Total 26 2 0 0 1 11 40 Percentage 65 5 0 0 2.5 27.5 100 Abadasa Bandiya 10 0 0 0 0 0 10 Ustiya 4 0 0 0 0 6 10 Khanay 4 4 0 0 2 0 10 Vamoti(N) 6 1 0 0 3 0 10 Total 24 5 0 0 5 6 40 Percentage 60 12.5 0 0 12.5 15 100 G.Total 50 7 0 0 6 17 80 Percentage 62.5 8.75 0 0 7.5 21.25 100 Table 4.11.1 Distributions of Households by Type of Fuel Used For Cooking
Block Type of Fuel Total
household Firewood Crop residues
Cow Dung cake
Coal, Lignite
CharcoalKerosene LPG
Nakhatrana 24065 14343(60.30)
474(1.99)
344(1.45)
61(0.26)
6812 (28.64)
1752(7.37)
Abadasa 18249 12255(68.55)
303(1.61)
1217(6.81)
20(0.11)
3108 (17.39)
974(5.45)
Source: Census of India 2001, tables on Houses; household Amenities & Asset, CD no.6.
Figure 4.11: Distributions of Households by Type of Fuel Used for Cooking
(Both blocks in sample households and blocks in general)
Nakhatrana Block In Sample Households
65.00%
27.50%
5.00%
2.50%
FirewoodKeroseneCowdungElectricityCoalL.P.G.
Nakhatrana Block in General
60.30%
7.37%
28.64%
0.26%
1.45%1.99%
FirewoodCrop residuesCow Dung cakeCoal, LigniteKeroseneLPG

68
Abadasa Block In Sample Households
60.00%12.50%0.00%0.00%
12.50%
15.00% FirewoodKeroseneCowdungElectricityCoalL.P.G.
Abadasa Block in general
68.55%
5.45%17.39%
0.11%
1.69%
6.81%
FirewoodCrop residuesCow Dung cakeCoal, LigniteKeroseneLPG
Table 4.11 shows absolute number and percentage of sample households
according to what kind of fuel they are using for cooking. Among total 80 sample
households 62.5 percentages of households are using firewood and 21.25
percentages are using LPG as fuel. Even today there is large number of people
using Firewood as source of fuel for cooking. In both blocks condition is not
different in terms of using firewood, because 65 percentages of households of
Nakhatrana block are using Firewood for making food as it is 60 percentages of
households in Abadasa block. In terms of using LPG as fuel, there are 27.5
percentages of households in Nakhatrana and 15 percentages in Abadasa, and
there are only 5 percentage households using Kerosene in Nakhatrana while 12.5
percentages of households in Abadasa. There are 2.5 percentages of households
in Nakhatrana and 12.5 percentages of households in Abadasa are using Coal as
fuel for cooking.
Table 4.11.1 gives the detail of all the households from both blocks with
related to type of fuel use for cooking. In both block, the main source of fuel use
for cooking is firewood and Kerosene, as it is percentage give in the table. Total
60.30 percentages of households in Nakhatrana block and 68.55 percentages in
Abadasa block are using firewood as fuel for cooking.

69
Table 4.12 Distributions of Sample Households by Availability of Sanitation
Village Having facility of Bathroom
Having facility of Toilet
Nakhatrana Rasaliya 10 10 Khombhadi(M) 10 10 Rampar 10 10 Laxmipar 10 10 Total 40 40 Percentage 100 100 Abadasa Bandiya 10 10 Ustiya 10 10 Khanay 0 0 Vamoti(N) 5 5 Total 25 25 Percentage 62.5 62.5 G.Total 65 65 Percentage 81.25 81.25
Table 4.12 gives the detail of absolute number and percentage of sample
households related to having sanitation. From total 80 sample households
81.25% of household having facility of Bathroom and 81.25% are having facility
of Toilet. In the villages of Nakhatrana block all the sample households have
both facility of Bathroom and Toilet. In the villages of Abadasa block, there are
equal distributions in terms of having both facility, 25 percentage of sample
households have Bathroom and 25 percent of sample households have Toilet. But
in the village of Abadasa block (Bandiya) every households have both Facility
but very few are using Toilet.

70
Table 4.13 Distributions of Sample Households by availability of Separate
Kitchen
Village Availability of Kitchen Available Not
available Total
Nakhatrana Rasaliya 9 1 10 Khombhadi(M) 10 0 10 Rampar 10 0 10 Laxmipar 8 2 10 Total 37 3 40 Percentage 92.5 7.5 100 Abadasa Bandiya 10 0 10 Ustiya 10 0 10 Khanay 7 3 10 Vamoti (N) 10 0 10 Total 37 3 40 Percentage 92.5 7.5 100 G.Total 74 6 80 Percentage 92.5 7.5 100 Table 4.13.1 Distributions of Households by Availability of Separate Kitchen
Block Availability of Kitchen Total
Household Available Not Available
Cooking in open Not cooking
Nakhatrana 24065 16797 (69.79)
4264 (17.71)
2933 (12.18)
71 (0.32)
Abadasa 18249 13181 (72.22)
4039 (22.13)
898 (4.92)
131 (0.72)
Source: Census of India 2001, tables on Houses; household Amenities & Asset, CD no.6.
Figure 4.12: Distributions of Households by Availability of Separate Kitchen
(Both Blocks in Sample Households and Blocks in General)
Nakhatrana Block In Sample Households
92.50%
7.50%
AvailableNot available
Nakhatrana Block in General
12.19% 0.30%
69.80%
17.72%AvailableNot AvailableCooking in openNot Cooking

71
Abadasa Block In Sample Households
92.50%
7.50%
AvailableNot available
Abadasa Block in General
72.23%
22.13%
4.92% 0.72%
AvailableNot AvailableCooking in openNot Cooking
Table 4.13 shows the detail of sample households according to availability
of Separate Kitchen. There is no different condition between two blocks in
having facility of Kitchen. There are 92.5 percentages of households having
kitchen and 7.5 percentages do not have facility of Kitchen in both blocks. But
there is different condition in terms of Census definition. As per Census
Definition 'Kitchen is an exclusive room it must be within the house', but in this
villages of Nakhatrana Block most of Kitchens are founded outside the house in
exclusive room, while in Abadasa Block available Kitchen are also outside the
house only covered with roof.
Table 4.13.1 gives the condition above mentioned in both block in general.
Number in bracket shows the percentage. In both block there are some
households which are not cooking as it is in Nakhatrana 0.32% of households
and 0.72% households in Abadasa. There are 69.79% of households having
Separate Kitchen, 17.77% of households not having it and 12.38% of households
are founded cooking in open in Nakhatrana. While in Abadasa, 72.22% of
households have Kitchen, 22.13% of households do not have it and 4.92% of
households are cooking in open.

72
Table 4.14 Distributions of Sample Households by Source of Drinking Water
Village Source of drinking water
Total
Tap Tube Well Well Pond, Lake, River
House Public Nakhatrana Rasaliya 10 0 0 0 0 10 Khombhadi(M) 10 0 0 0 0 10 Rampar 10 0 0 0 0 10 Laxmipar 10 0 0 0 0 10 Total 40 0 0 0 0 40 Percentage 100 0 0 0 0 100 Abadasa Bandiya 10 0 0 0 0 10 Ustiya 0 10 0 0 0 10 Khanay 0 10 0 0 0 10 Vamoti (N) 0 10 0 0 0 10 Total 10 30 0 0 0 40 Percentage 25 75 0 0 0 100 G.Total 50 30 0 0 0 80 Percentage 62.5 37.5 0 0 0 100 Table 4.14.1 Distributions of Households by Source of Drinking Water
Source: Census of India 2001, tables on Houses; household Amenities & Asset, CD no.6.
Figure 4.13: Distributions of Households by Source of Drinking Water (Both
Blocks in Sample Households and Blocks in General)
Nakhatrana Block In Sample Households
House tap 100%
Nakhatrana Block In General
88.35%
0.86%0.05% 0.15%
1.28%
4.67%1.53%
3.10% TapHandpumpTubewellWellTank, Pond, LakeRiver, CanalSpringAny other
Block Source of Drinking Water Total
Households Tap Hand
pump Tube well
Well Tank Pond Lake
River Canal
Spring Any other
Nakhatrana 24065 21262 (88.35)
307 (1.28)
368 (1.53)
747 (3.10)
208 (0.86)
11 (0.05)
37 (0.15)
1125(4.67)
Abadasa 18249 9906 (54.28)
265 (1.45)
333 (1.82)
4949 (27.12)
2084 (11.42)
52(0.28)
83 (0.45)
577(3.16)

73
Abadasa Block In Sample Households
25%
75%
0%0%0%House tapPublic TapTubewellWellPond,Lake,River
Abadasa Block In General
54.28%
11.42%
27.12%
0.45%0.28%
3.16%
1.45%
1.82%
TapHandpumpTubewellWellTank, Pond, LakeRiver, CanalSpringAny other
Table 4.14 gives the distribution of sample households according to source
of drinking water. From the sample households not a single house found as
getting drinking water from well, tube well, pond, river or lake. From total 80
sample households 62.5 percentages of households getting water from house tap
and 37.5 percentages are getting from public tap. In the villages of Nakhatrana
block all the sample households (100%) receive drinking water from house tap.
While in the villages of Abadasa block, only 25 percentages of households are
getting drinking water from house tap and 75 percentages are getting their
drinking water from public tap.
Table 4.14.1 shows the detail above mentioned in general for both block.
In Nakhatrana block, 88.35 percentages of households derive drinking water
from tap. After tap all other sources for drinking water which used by
households are very few in numbers. In Abadasa block, the main source of
drinking water is distributed in 54.28 percentages of households are getting it
from tap, 27.12 percentages are from well and 11.42 percentages are tank, pond,
and lake.

74
Table 4.15 Classifications of Sample Households According To Availability of
Ration Card
Village Type of Ration Card Total APL BPL don’t have
card
Nakhatrana Rasaliya 3 6 1 10 Khombhadi(M) 6 3 1 10 Rampar 8 2 0 10 Laxmipar 4 6 0 10 Total 21 17 2 40 Percentage 52.5 42.5 5 100 Abadasa Bandiya 0 10 0 10 Ustiya 7 3 0 10 Khanay 1 9 0 10 Vamoti (N) 3 7 0 10 Total 11 29 0 40 Percentage 27.5 72.5 0 100 G.Total 32 46 2 80 Percentage 40 57.5 2.5 100 Figure 4.14 Classifications of Sample Households according to availability of
Ration Card
Classification of Sample Households according to availability of Ration Card
Nakhatrana Block
43%
5%
52%
APLBPLDO N’T HAVE
Classification of Sample Households according to availability of Ration Card
Abadasa Block
25%
72%
3%APLBPLDON’T HAVE

75
Table 4.15 given above shows the details of sample households according
to availability of Ration Card. From all sample households 57.5 percentage of
households are having BPL Card, 40 percentages are having APL Card and 2.5
percentages are don’t have any Card. In the villages of Nakhatrana block,
among sample households 52.5 per cent have APL Card, 42.5 per cent have BPL
Card and 5 per cent don’t have Card. While in Abadasa block, there are big
numbers of sample households found having BPL Card, from sample households
total 72.5 percentages of household are having BPL Card and 27.5 percentage
having APL Card.
Table 4.16 Classifications of Sample Households According To Bank Account
and Insurance Availability
Village Having Account in bank
Having Insurance
Nakhatrana Rasaliya 5 2 Khombhadi(M) 6 0 Rampar 8 1 Laxmipar 4 1 Abadasa Bandiya 0 0 Ustiya 6 0 Khanay 1 0 Vamoti(N) 3 0 Total 33 4 percentage 41.25 5
Rasaliya15%
Khombhadi(M) 18%
Rampar25%
Laxmipar 12%
Bandiya0%
Ustiya18%
Khanay 3%
Vamoti(N)9%
Rasaliya
Khombhadi
Rampar
Laxmipar
Bandiya
Ustiya
Khanay
Vamoti(N)
Figure 4.15 Classifications of sample Households by having account in Bank

76
Table 4.16 gives distributions of sample households according to having
account in bank. And also shows the number of sample households having
insurance. There are total 41.25 percentages of households from sample
households are having account in Bank. Most of them having account in
Denabank only one person in Rasaliya has an account in Post Office (NREGA
Scheme) and one person in Rampar having account in Sahkari Dairy. But not a
single village covered under the study has banking facility, In Nakhatarana such
facility is available at the distance of 5 to 7 km, while in Abadasa block it is
available only above 7 km away. And it will make the difference to join in such
facility which is not available nearby.
According to insurance availability there are only 5% of households are
found to have insurance. In Rasaliya both persons have LIC insurance, in
Laxmipar one person has LIC insurance and in Rampar one person has Crop
insurance.

77
Table 4.17 Classifications of Sample Households by Asset Availability
Village
Type of asset
Land Fan Radio/T.V.
Sewing machines
Telephone Mobile Cycle Vehicle
Nakhatrana Rasiliya 3 10 8 0 3 8 0 5 Khombhadi(M) 3 10 9 5 6 10 0 3 Rampar 3 10 6 0 2 10 0 3 Laxmipar 3 10 7 2 3 7 0 2 Total 12 40 30 7 14 35 0 13 Percentage 30 100 75 17.5 35 87.5 0 32.5 Abadasa Bandiya 2 10 2 1 0 10 0 0 Ustiya 6 10 10 0 5 10 0 1 Khanay 0 8 3 2 0 10 0 0 Vamoti(N) 0 10 8 1 0 10 0 1 Total 8 38 23 4 5 40 0 2 Percentage 20 95 57.5 10 12.5 100 0 5
Table 4.17 shows detail of sample household related to such kind of asset
available to them. There are total 30 percent households in Nakhatrana block
and 20 percentage households in Abadasa block have land as an asset (land
means cultivated land). In terms having fan, in Nakhatrana block 100 percentage
households and in Abadasa block 95 percentage households have fan. Among
sample households 100 percentage households in Abadasa block have mobile
phone, while in Nakhatrana block it rests for 87.5
Figure 4.16 Classifications of sample households by asset availability
Classifications of Sample Households by Asset availability:Nakhatrana Block
Mobile, 35
Radio/T.V. 30
Fan, 40
Land, 12
Sewing machine, 7
Telephone, 14
Cycle, 0Vehicle , 13 Land
FanRadio/T.V.Sewing machineTelephoneMobileCycleVehicle

78
Classifications of Sample Households by Asset availabity:Abadasa Block
Sewing machine, 4
Telephone, 5
Mobile, 40Fan, 38
Land, 8Cycle, 0Vehicle , 2
Radio/T.V. 23
LandFanRadio/T.V.Sewing machineTelephoneMobileCycleVehicle
Figure gives the details of block wise by assets availability with the name
of asset and with the absolute numbers. For example, ‘Mobile, 40’ it indicates
that from among block’s 40 sample households 40 households have mobile as an
asset.
Table 4.18 Distributions of Sample Households according to No. Of Households
having Each of the Specified Assets in Numbers
No. of asset which they having
No. of Households
Percentage
1 2 2.52 22 27.53 26 32.54 17 21.255 6 7.56 4 57 3 3.75
80 100
Figure 4.17 Distributions of Sample Households according to No. of Households
having Each of the Specified Assets in Numbers
Distributions of Sample Households according No. of Househlods having each of the specified asset
in Number
32.50%
7.50%
5.00% 2.50%3.75%
21.25%
27.50%
Having 1 asset
Having 2 asset
Having 3 asset
Having 4 asset
Having 5 asset
Having 6 asset
Having 7 asset

79
Table 4.18 gives the details of sample households according to No. of
households having each of the specified assets in numbers. From the given details
it is easily observed that only 2.5 per cent of households having 1 assets and only
3.75 per cent of households having 7 assets from sample households, most of the
households having assets in these groups: having 2 assets (27.5%), having 3
assets (32.5%) and having 4 assets (21.25%). Very few households are having 5
assets (7.5%) and having 6 assets (5%).
Table 4.19 Distributions of Sample Household by Size of Family and Numbers of
Rooms available (Nakhatrana Block)
Nakhatrana Household having numbers of room No. of
persons in family
No. of HH
1 2 3 4 5
Mode of the
rooms 2 1 0 0 0 1 0 4 3 1 0 0 0 1 0 4 4 3 1 0 2 0 0 3 5 12 2 5 3 2 0 2 6 13 3 6 4 0 0 2 7 3 1 2 0 0 0 2 8 3 1 1 0 1 0 0 9 3 1 1 0 1 0 0 10 1 0 1 0 0 0 0 40
Considering to the uneven size of family, for arriving more approximately
interpretation, the mode of the rooms is found out from data. As per table 4.19
shows, who have the smaller family size (2, 3, 4) rooms available for them are
minimum 3 and maximum four and who have the larger family size (5, 6, 7, 8, 9,
10) rooms available for them are minimum 1 and maximum 2. It indicates that
families with smaller size have more rooms in comparison with families of larger
size.

80
Table 4.19.1 Distributions of Sample Household by Size of Family and Numbers
of Rooms available (Abadasa)
Abadasa
Household having numbers of room No. of
persons in family
No. of HH
1 2 3 4 5
Mode of the
rooms 2 1 1 0 0 0 0 1 3 6 2 0 3 0 1 3 4 6 4 2 0 0 0 1 5 13 8 5 0 0 0 2 6 5 4 0 0 1 0 1 7 5 3 1 1 0 0 1 8 3 3 0 0 0 0 1 9 1 1 0 0 0 0 0 40
Table 19.1 shows the detail above mentioned, about size of family and
number of rooms available for them, for Abadasa block, As per table shows,
nearly all sample households have 1 room for them whatever the size of family.
When looking towards the size of family who have the smaller family size (2, 3, 4)
rooms available for them are minimum 1 and maximum 3 and who have the
larger family size (5, 6, 7, 8, 9, 10) rooms available for them are one room, only
one household have 2 rooms. It indicates insignificant difference between the
availability of rooms and the size of family.
Table 4.20 Distributions of Sample Household by Number of Married Couple in
Family and Availability of Separate Room
Available rooms
Mode of the
rooms
Block No. of Married
Couple in family
No. ofHH
1 2 3 4 5 Nakhatrana 1 31 3 13 9 6 0 2
2 8 2 5 1 0 0 2 3 1 1 0 0 0 0 1 4 0 0 0 0 0 0 0 40
Abadasa 1 24 14 6 3 0 1 1 2 16 13 2 0 1 0 1 3 0 0 0 0 0 0 0 4 0 0 0 0 0 0 0 40

81
Considering to the uneven numbers of rooms availability and number of
married couple in the family, to arrive more approximately interpretation for
the married couple has separate room for them mode of the rooms is found out
from data. Table 4.20 gives the details of numbers of married couple in family
and total numbers of rooms available. In Nakhatarana block, most of the
families have one married couple and availability of rooms for them are 2 rooms
and families who have more than one married couple (very few) numbers of
rooms available for them are minimum 1 and maximum 2. In Abadasa block,
among all sample families, families who have one married couple number of
rooms available for them is one and who have two married couples in family
numbers of rooms available for them is also one room.

82
4.3 Detailed analysis of Source of Livelihoods of Sample Households
and Characteristics of it:
In order to avoid inconsistency in calculating income, attempt is made to
have an estimates figure based on related information.
Contents of this section provide information regarding to the Source of
Livelihoods of Sample Households and also focuses on the characteristics of
livelihood. This division gives the details in ascending order of Sample
Households with which type of livelihood activity was founded during the study.
4.3.1 Agricultural Labourers This is most common source of livelihoods are found during the study.
Among the total 80 respondents, 31.25% of respondents are engaged in this
activity. This section provide details of daily wages, average working days in a
year, working place, annual income of head of the family and annual income of
households, education status of the respondents and all other characteristics are
as follows:
Characteristics of Agricultural Labourer: Most of the respondents have at least 10 to 15 years of experience with
occupation.
Majority of the respondents are found following the Muslim religion with
68% while the Hindus are 32%.
Among them 52% of respondents are living in owned house.
According to availability of ration card 1% don’t have card, 76% have
BPL card and 23% have APL card.
Most the Labourers in Nakhatrana block engaged entire year with same
occupation but in Abadasa block they are engaged in the activity for only
about 6 months.
Among the total sample households 36% of households are founded two
family members are engaged in agricultural labouring, 20% of
households are having 3 family members and 44% of households are
found 4 persons of the family members with same activity.
Dependency ratio is 1:3.
No one in Nakhatrana block founded in another activity but in Abadasa
block they are doing another activity such as transportations (carrying

83
vehicle), find out any mines activity or some of them believing leisure time
and doing nothing.
Migration for the work was found in only Abadasa block, in sample
households majority of the respondents are migrated from Abadasa block
to Nakhatrana block.
Table 21 Calculation of income for Agricultural Labourer:
Vill
age
Sr. N
o. o
f H
H
Wag
e R
ate/
Day
Ave
rage
wor
king
da
ys in
a y
ear
Wor
king
pla
ce
In V
illag
e/
Dis
tanc
e
Tot
al N
o. o
f Fa
mily
mem
ber
In sa
me
Occ
upat
ion
Ann
ual
Inco
me
of H
ead
Ann
ual
Inco
me
of H
H
Edu
catio
n of
Hea
d
Rasaliya 1 80 260 in village 2 20800 41600 Ill. 2 80 260 in village 4 20800 83200 Std.4 3 80 260 in village 2 20800 41600 Ill. Khombhadi 4 80 210 in village 4 16800 67200 Std.5 (M) 5 80 210 in village 4 16800 67200 Std.4 6 80 210 in village 2 16800 33600 Ill. Rampar 7 80 200 in village 3 16000 48000 Std.7 8 80 200 in village 2 16000 32000 Std.7 Laxmipar 9 80 250 in village 4 20000 80000 Std.4 10 80 250 in village 4 20000 80000 Ill. 11 80 250 in village 3 20000 60000 Ill. Bandiya 12 60 200 5kmaway 4 12000 48000 Ill. 13 60 200 5kmaway 4 12000 48000 Ill. 14 60 200 5kmaway 3 12000 36000 Ill. 15 60 200 5kmaway 4 12000 48000 Ill. 16 60 200 5kmaway 4 12000 48000 Ill. 17 60 200 5kmaway 2 12000 24000 Ill. Ustiya 18 60 200 5kmaway 2 12000 24000 Std.7 19 60 200 5kmaway 3 12000 36000 Std.5 Khanay 20 60 100 5kmaway 4 6000 24000 Ill. 21 50 100 5kmaway 2 5000 10000 Std.4 22 50 100 5kmaway 4 5000 20000 Ill. 23 50 100 5kmaway 2 5000 10000 Ill. Vamoti(N) 24 60 100 5kmaway 2 6000 12000 Ill. 25 60 100 5kmaway 3 6000 18000 Ill.
Table 21 gives all the details related to calculation of Agricultural
Labourer. First, to be noted, that there is no difference between daily wages of
male and female in this activity. According to daily wage condition is quite good
in Nakhatrana block as per table shows, while Abadasa block wages are different

84
village by village and also lowest with comparison to Nakhatrana block. In terms
of working days, in the villages of Nakhatrana block most of the respondents
have more than 200 working days, while in Abadasa block, villages ‘Bandiya’
and ‘Ustiya’ are also have 200 working days for agricultural labourer. As per
working place to the respondents, in the Nakhatrana block all can get work in
village but the distance is 5 km away for the respondents of Abadasa block. Most
of the agricultural labourers have income less than 20000 rupees and
household’s income is less than 85000 rupees. Among them total 64%
respondents are found illiterate and 36% are literate.
4.3.2 Animal Husbandry During the study, among the total 80 sample households, 27.5% of
respondents are engaged in the activity of Animal Husbandry. This is the second
highest source of livelihood after Agricultural Labourer. This section gives the
details of number of animals and type of animals which they have, daily
production of milk, income and educational status of the respondents.
Characteristics of Animal Husbandry: Most of the respondents have more than 15 years of experience with
occupation.
Majority of the respondents are founded follow the Hindu religion with
54.54% while the Muslim followers are 45.45%.
Among them 55% of respondents are living in owned house.
According to ration card there 50% of respondents have BPL card.
No one is founded into another occupation.
In terms of availability of fodder, in Abadasa block availability of fodder
is 6 months and in Nakhatrana block it is available for 7 to 8 months in a
year.
Most of the livestock developers have minimum two persons from the
family members are engaged in same activity.
Dependency ratio is 1:5.

85
Table 22 Calculation of Income for the Livestock developers:
Vill
age
Sr. N
o. o
f H
H
Tot
al
Ani
mal
s
Types of Animals
Prod
uctio
n of
Milk
Selli
ng
Ani
mal
Mon
thly
In
com
e
Ann
ual
Inco
me
Proc
edur
e of
milk
se
lling
Edu
catio
n
Cow Buffelo Sheep& Goat
In Liter/ per day
In Rupee
In Rupee
Rasaliya 1 5 4 1 0 4 No 1260 15120 Dir. ill. 2 50 0 0 50 0 Yes 10800 ill. Khobhadi 3 12 7 5 0 9 No 3360 40320 Dir. ill.
4 7 5 2 0 6 No 2100 25200 Dir. ill. Rampar 5 11 10 1 0 7 No 2520 30240 Dir. ill.
6 19 9 10 0 15 No 5880 70560 Dir. ill. 7 40 0 40 0 35 No 19800 237600 SD Std.
-3 Laxmipar 8 60 0 0 60 0 Yes 14400 ill. 9 10 6 4 0 10 No 3780 45360 Dir. illi.
Bandiya 10 15 7 8 0 11 No 3900 46800 Dir. ill. 11 10 2 8 0 9 No 3120 37440 Dir. ill. Ustiya 12 10
0 0 0 100 0 Yes 6000 72000 ill.
13 200
0 0 200 0 Yes 12000 144000 ill.
Khanay 14 7 4 3 0 5 No 1560 18720 Dir. ill. 15 9 3 6 0 10 No 3510 42120 Dir. Std.
4 16 5 2 3 0 4 No 1170 14040 Dir. ill. 17 50 0 0 50 0 Yes 900 10800 ill. 18 45 0 0 45 0 Yes 833.3
3 10000 ill.
Vamoti (N)
19 10 4 6 0 9 No 3120 37440 Dir. ill.
20 12 3 9 0 15 No 5070 60840 Dir. ill. 21 20 0 0 20 0 Yes 800 9600 Dir. ill. 22 30 0 0 30 0 Yes 833.3 10000 Dir. ill.
Notes: 1. HH-Household 2. SD -Sahkari Dairy. 3. ill. – Illiterate 4. Dir. - Direct
Table 22 gives all the details of the occupation. There is difference in price
of milk; In the Villages of Nakhatrana Block, they get average Rs.14/liter, while
in the Abdasa they get average Rs.13/liter. Whenever we looked about the
process of selling animals, every year they can sell 20% animals of total animals
they have and aggregate Rs.1200-1300 they can get from selling per Sheep or
Goat. Calculation of income is deal with detail mentioned above. From among
the respondents, only one respondent sell milk to the Sahkari dairy and all other
are selling individually. When look at educational status of them 90.90% are
founded illiterate. Looking towards income, only 22.72% are having income
more than 50000 and 77.27% having income less than 50000. All other detail is
shows by table it self.

86
During the study, according to the respondents, problems facing by them
are described as below:
The most common problem is found in all sample villages is fair prices of
product is un assured.
Second one is the unavailability of health services for livestock.
Cattle feed are very expensive and it is available at a very long distance.
4.3.3 Farmers During the study, after Animal Husbandry, agriculture is the third option
for livelihoods with 25% respondents are found engages in this activity.
Characteristics features of Farmers: Most of the respondents have more than 15 to 20 years experience with
occupation. All the farmers are living in owned house. Majority of the farmers are the Hindus (90%). Among the farmers 80% of farmers have APL ration card and 20% have
BPL card. All the farmers have their own land for cultivation. Dependency ratio is 1 for 4 persons.

87
Table 23 Calculation for farmer’s income:
Vill
age
No.
of F
arm
ers
Tot
al L
and
(in a
cre)
Ow
n la
nd
/Par
ticip
atio
n
Cul
tivat
ed
Lan
d
Irri
gatio
n
avai
labi
lity
Inst
rum
ent
The
y ha
ve
Mai
n cr
ops
Tim
e du
ratio
n of
Prod
uctio
n
(in M
onth
)
Prod
uctio
n
(per
Acr
e)In
Kg.
Tot
al P
rodu
ctio
n
(In
Kg.
)
6 m
onth
s inc
ome
(in R
upee
s)
Ann
ual
Inc
ome
of
Hea
d (in
Ru p
ees)
Edu
catio
n
Rasaliya 1 15.5 Own land 15 Bor Electric motor Groundnut 12 600 9000 270000 540000 Std.7
Tractor Cotton
2 10 Own land 10 Bor Electric motor Groundnut 12 550 5500 165000 330000 Std.7
Tractor Cotton
3 22 Own land 22 Bor Electric motor Groundnut 12 600 13200 396000 792000 Std.6
Tractor Cotton
Khombhadi(M) 4 15 Own land 15 Bor Electric motor Groundnut 12 600 9000 270000 540000 Std.7
Tractor Cotton
5 11 Own land 11 Bor Electric motor Groundnut 12 600 6600 198000 198000 Std.7
Tractor Cotton
6 20 Own land 20 Bor Electric motor Groundnut 12 600 12000 360000 720000 Std.7
Tractor Cotton
Rampar 7 5 Own land 5 No NIL Vetch 6 350 1750 70000 70000 Illiterate
Gram
8 7 Own land 7 Bor Electric motor Groundnut 12 600 4200 126000 252000 Illiterate
Cotton
9 10 Own land 10 Bor Electric motor Groundnut 12 600 6000 180000 360000 Std.3
Tractor Cotton

88
Laxmipar 10 9 Own land 9 Bor Electric motor Groundnut 12 500 4500 135000 270000 Std.7
Cotton
11 10 Own land 10 Bor Electric motor Groundnut 12 600 6000 180000 360000 Std.6
Tractor Cotton
12 11 Own land 11 Bor Electric motor Groundnut 12 600 6600 198000 396000 Std.7
Tractor Cotton
Abadasa
Bandiya 13 4 Own land 4 No NIL Vetch 6 300 1200 48000 48000 Std.4
Gram
14 7.5 Own land 7 No NIL Vetch 6 350 2450 98000 98000 Illiterate
Gram
Ustiya 15 6 Own land 6 Dam Oil engine Wheat 6 400 2400 72000 72000 Std.8
Groundnut
16 9 Own land 9 Dam Oil engine Wheat 6 400 3600 108000 108000 Std.3
Groundnut
17 4.5 Own land 4 Dam Oil engine Wheat 6 400 1600 48000 48000 Illiterate
Groundnut
18 7 Own land 7 No NIL Vetch, 6 350 2450 98000 98000 Std.7
Gram, sesame
19 4 Own land 4 No NIL Vetch 6 350 1400 56000 56000 Illiterate
Gram, sesame
20 7.5 Own land 7 No NIL Vetch 6 350 2450 98000 98000 Std.5
Gram sesame
Notes: According to Farmer, Aggregates Price of Groundnut & Cotton, Rs.1200 = 40kg Price of Vetch, Gram, Sesame, Rs.1600 = 40kg

89
Table 23 gives all the detailed information of farmers. Such as how much
land they have; availability of irrigation facility, instruments they have, cropping
pattern, time duration when they are engaged in production activity, per acre
production, annual income and educational status. As table indicate that there
are total 9(45%) farmers having land size from 4 to 8 acre; 6 (30%) farmers
having land from 8 to 12 acre; and 5 (25%) farmers having more than 12 acre of
land. In terms of availability of irrigation, in Nakhatrana 99% of farmers are
having irrigation facility only 1% farmer don’t have it, while 12.5% farmers in
Abadasa block do not have irrigation and 87.5% farmers are have it. Total 75%
of farmers haves instruments such as Electric motor, Tractor or Oil engine. As
per cropping pattern is concern, in Nakhatrana block, all farmers have
irrigation so they are producing Groundnut and Cotton, while in Abadasa block
who have irrigation they are producing the same, but who doesn’t have
irrigation they are producing Vetch, Gram and Sesame. Average per acre
productivity for Nakhatrana block is 616.6 Kg. and for Abadasa block it is 362.5
Kg. Most of farmers in Nakhatrana block are producing whole the year, while in
Abadasa block they are producing for 6 months in a year. Among the total of
farmers 25% of farmers are illiterate and 75% of farmers are literate. As per
annual income is concern, in Nakhatrana block, 99% of farmers having income
from more than 1 lakh and less than 7 lakh. Only one farmer having income
70000, while in Abadasa block 99% farmers are having income more than 45000
and less than 1 lakh only one farmer having income 1,08,000 rupees.
Table 23.1 Distribution of farmers according to land holding capacity and
income
Land
No. of farmers
Average Annual Income
In hector In rupees
0 to 2 5 588003 to 5 11 2334556 to 8 3 600000more than 8
1 792000
20 Table 23.1 gives the detail of farmers according to land holding capacity
and annual income. Among total 20 farmers, 80% of farmers having land less

90
than 5 or equal to 5 hectors. Only 20% farmers have land more than 5 hectors.
According to income 55% farmers have average income 233455 rupees and 25%
farmers have average income 58800 rupees and 15% farmers have average
income 600000 rupees and 5% farmers have income with 792000 rupees.
Table 23.2 Classifications of Farmers according their Usage of Fertilizers and
selling procedure for production
Village No. of farmers
Name of fertilizers
Selling product to whom /have any group
Rasaliya 3 URIA,DPAP, merchant no group Khombhadi(M) 3 URIA,DPAP, merchant no group Rampar 3 URIA,DPAP, merchant no group Laxmipar 3 URIA,DPAP, merchant no group Bandiya 2 manure merchant no group Ustiya 6 URIA,DPAP, merchant no group Khanay - NIL - - Vamoti(N) - NIL - - Total 20
Table 23.1 gives the details of usage of fertilizers and what type of
procedure is done by farmers for selling their products. All the farmers under
the study are found using manure as fertilizer with another type of fertilizers.
From total 20 farmers 18 farmers are using URIA and DPAP as fertilizers and
only 2 of them are using manure as fertilizers. All the farmers, under the study,
are selling their product to merchant and none of them have any kind of group
activity for selling products.
During the study, according to the respondents, problems facing by them
are described as below:
Insufficient, irregular and untimely rains are the biggest problem for
farmers.
Availability of seeds and credit are the two key inputs which play major
role in agricultural production. Farmers have to travel 20 to 30 Kms for
buy seeds, local merchant take higher prices of the seeds and Traders
take advantage of the situation by lending the farmers with credit with
killing rates of interest.
None of the single village is founded, under the study, have the facility to
provide fertilizers for the farmer.

91
4.3.4 Wage Labourers During the study total 16.25% of households are found engage in activity
of wage laboring. From sample households respondents are having different kind
of activity in wage labouring. This section gives the details of what activity was
done by them in wage laboring, wage rate of male and female, probably numbers
of days in which they are get work, wage laboring place or distance from the
place, and migration details.
Characteristic features of Wage Labourers: Half of the wage labourers are having experience of less than 10 years
with occupation.
Among them 46% are living in their own house and 54% are living in
rented house.
Majority of the founded follow the Hindu religion with 77% and where
the Muslim is 23%.
According to ration card, 1% don’t have card; 30% have APL and 69%
have BPL card.
Main activities which are done by the respondents are carrying vehicle
(Driver), working in mines activity, massioning and working in a shop.
Most the Labourers in Nakhatrana block engaged entire year with same
occupation but in Abadasa block they are engaged in the activity for only
about 6 months.
Among the total sample households 54% of households are founded two
family members are engaged in wage labouring, 8% of households are
having 3 family members and 38% of households are found 1(head of the
family) person of the family members with same activity.
Dependency ratio is 1:4. No one in Nakhatrana block founded in another activity but in Abadasa
block they are doing another activity such as transportations (carrying
vehicle), find out any mines activity or some of them believing leisure time
and doing nothing.
Migration for the work was not found with particular these wage
labourers.

92
Table 24 Calculation for wage labourer’s income: V
illag
e/
Blo
ck
Sr. n
o. H
H
Nam
e of
A
ctiv
ity
Ave
rage
ra
te
per
day
Wor
king
da
ys
In
Yea
r
Wor
king
pl
ace
In
Vill
age/
Dis
tanc
e
Tot
al N
o. o
f Fa
mily
m
embe
r in
O
ccup
atio
n
Mon
thly
Inc
ome
of
indi
vidu
al(I
n R
upee
)
Annual income of
Edu
catio
n of
H
ead
individual Household Rasaliya 1 Driver 83.33 170 in village 2 2500 14166.67 28333.33 std.7 2 Work in
MS 50 365 in village 3 1500 18000 54000 std.12
Khobhadi 3 Work in Shop
50 365 in village 2 1500 18000 36000 ill.
(M) 4 Driver 83.33 170 in village 2 2500 14166.67 std.7 Rampar 5 Massionar 150 180 in village 2 2250 27000 54000 ill. 6 Massionar 150 180 in village 2 2250 27000 54000 ill. Laxmipar 7 Driver 83.33 170 in village 1 2500 30000 30000 ill. 8 Driver 83.33 170 in village 2 2500 30000 60000 ill. Bandiya - - - - NIL - - - - - Ustiya - - - - NIL - - - - - Khanay 9 Mines 160 180 5kmaway 1 4800 28800 28800 ill. Vamoti 10 Mines 80 240 5kmaway 1 2400 19200 19200 ill. (N) 11 Mines 80 240 5kmaway 1 2400 19200 19200 Std.3 12 Driver 83.33 170 in village 1 2500 14166.67 14166.67 ill. 13 Driver 83.33 170 in village 1 2500 14166.67 14166.67 ill.
Notes: MS = medical store, ill. = illiterate.
Table 24 gives the information about wage labouring. In terms of wage
rate there different rate for male and female, especially in activity of massioning
male 150 rupees per day while woman can get 90 or 100 rupees. Majority of the
respondents are having working days less than 200, only four of the respondents
are having 250 to 365 working days. As working place is concern, in the villages
of Nakhatrana block, all wage labourer can get work in village while in the
villages of Abadasa block it is far away from village (about 5 Km away). As per
income is concern, 62% of labourer having income less than 50000 rupees and
38% of labourer have income from 50000 to 60000 rupees. Looking towards the
educational status of respondents 69% of lobourers are found illiterate and 31%
are literate.

93
4.4 Testing of hypotheses: (1) Existing means of Livelihood are adequate enough for Sustainable
Village Development.
For solution of this hypothesis the following points are glimpse from the
data available and observation.
Looking at the nature of development from time series perspectives there
is no bigger change in the condition of the sample villages. As per studying
Census report of District from 1971 to 2001 for sample villages, It has been
noticed that villages have same pattern of livelihood and there is no increment in
village’s amenities. Till the date there is traditional livelihoods are founded more
and no any other means of livelihood was founded. It indicates that the sources
of livelihoods are not expanded or penetrate by nature.
Considering rate of growth of population and it will turns into demand
patterns changes. Not just demand pattern for living is change or expanded but
also for sustainability of whatever economic activity was done by them or we can
say demand for occupational input is change. They need more and more
incentives for it. In this context, village total demand is expected to be growing
faster and higher as against the availability of opportunities is not meeting with
these.
Level of education and course of institutional living does not indicate
adaptability and affordability for change which restricts total development
process.
(2) In the livelihood concept assets play a key role for individual. General
belief also support to this. In general, it is accepted that asset holding a little is
also very helpful for them in time of uncertainty. But the question is affordability
of person for achieving asset. It appears that poor as they are they do not possess
the asset and in reverse lack of asset holding makes them poor. The interest is in
knowing whether it is true for sample households. With the help of following lets
examine.

94
H0: There is no relation between asset holding capacity and income availability.
H1: There is relation between asset holding capacity and income availability.
Solution:
Table 25
having asset
No. of HH
Average income per HH
(in rupees) 1 2 608002 22 314753 26 398814 17 510995 6 2257666 4 4365007 3 600000
80 Calculate from
Our two variables are number of asset and average income of Household.
r = 0.884403895 ≈0.88 is calculated from data available.
We reject our H0. So we accept H1.
Interpretation: it indicates that there is positive relationship between asset
holding capacity and income availability.
It means the asset holding capacity and income availability are increasing
in one direction.
(3) In the Economics there is a strong belief that where numbers of
persons in family are big they have smaller piece of land and when they having
number of persons in family are small available land for them is larger. In this
context, let us examine that is it true for our sample families.
To understand this, an attempt is made here, to establish correlation
between size of family and land availability.
H0: There is positive relation between the size of family and land availability.

95
Solution:
Table 26
No. of persons in family
No. of Household
Total Land available
Land per family
in vaar in foot 2 2 600 1800 9003 6 2650 7950 13254 8 1200 3600 4505 13 2950 8850 680.7696 6 1250 3750 6257 6 1000 3000 5008 5 900 2700 5409 4 850 2550 637.5
10 1 150 450 450Total 51 6108.27
Interpretation: r = -0.62983 ≈ -0.63. It indicates that there is negative correlation
between these two variables.
It supports the general belief of economics. The belief is true for sample
family, we can say that who have larger family the land available for them is
small and who have smaller size of family the land available for them are large.
As Amartya Sen said that the gap between ‘haves’ and ‘haves not’ are initiate
with small family have large number of asset and large family with small
number of asset.
(4) It always discussed that ones must have education for achieving better
livelihood or for wide opportunity for achieve livelihood. Is it true for all kind of
livelihood activity? Let’s find out it for our selected occupation, whether the
relationship between educational status and income. For testing this first we test
it for all four occupations with Chi-square (test of independence) method. After
that we also try to find the impact of educational status on income and impact of
educational status on occupational status. For testing this we will use two way
ANOVA. In the following manner we test our hypothesis.

96
H0 : Status of Education does not improve the opportunity to achieve livelihood.
Farmer
Table 27
Sr.no. Educational Status
Mean of Annual Income
More than mean
Less than mean
Total
1 Illiterate 104800 1 4 5 2 1 to 7 359866.7 7 8 15 8 12 20
First find out expected frequency, after that calculate the Chi-square.
Chi-square calculated value is 0.77
Degrees of freedom = (r-1) (c-1) = (2-1) (2-1) = 1
The table value of Chi-square for one degree of freedom at 5 percent level
of significance is 3.84.
The calculated value of Chi-square (0.77) is smaller than this table value
(3.84) which means that it is insignificant. So hypothesis is accepted.
Thus the result supports the hypothesis and we can say that the status of
education does not improve the opportunity to achieve livelihood. (In the
farming)
Animal Husbandry
Table 27.1
Sr.no. Educational Status
Mean of Annual Income
More than mean
Less than mean
Total
1 Illiterate 44515 6 14 20 2 1 to 7 56340 1 1 2
7 15 22
First find out expected frequency, after that calculate the Chi-square.
Chi-square calculated value is 0.99
Degrees of freedom = (r-1) (c-1) = (2-1) (2-1) = 1
The table value of Chi-square for one degree of freedom at 5 percent level
of significance is 3.84.
The calculated value of Chi-square (0.99) is smaller than this table value
(3.84) which means that it is insignificant. So hypothesis is accepted.

97
Thus the result supports the hypothesis and we can say that the status of
education does not improve the opportunity to achieve livelihood. (In the animal
husbandry)
Agricultural Labourer
Table 27.2
Sr.no. Educational Status
Mean of Annual Income
More than mean
Less than mean
Total
1 Illiterate 12400 5 11 16 2 1 to 7 15044.44 6 3 9
11 14 25
First find out expected frequency, after that calculate the Chi-square.
Chi-square calculated value is 0.42
Degrees of freedom = (r-1) (c-1) = (2-1) (2-1) = 1
The table value of Chi-square for one degree of freedom at 5 percent level
of significance is 3.84.
The calculated value of Chi-square (0.42) is smaller than this table value
(3.84) which means that it is insignificant. So hypothesis is accepted.
Thus the result supports the hypothesis and we can say that the status of
education does not improve the opportunity to achieve livelihood. (In the
agricultural labouring)
Wage labourer
Table 27.3
Sr.no. Educational Status
Mean of Annual Income
More than mean
Less than mean
Total
1 Illiterate 23148.15 5 4 9 2 1 to 7 16383.34 2 2 4
7 6 13
First find out expected frequency, after that calculate the Chi-square.
Chi-square calculated value is 1.
Degrees of freedom = (r-1) (c-1) = (2-1) (2-1) = 1
The table value of Chi-square for one degree of freedom at 5 percent level
of significance is 3.84.

98
The calculated value of Chi-square (1) is smaller than this table value
(3.84) which means that it is insignificant. So hypothesis is accepted.
Thus the result supports the hypothesis and we can say that the status of
education does not improve the opportunity to achieve livelihood. (In the wage
labouring)
Finally after this test we can conclude that for selected these four
occupations, there is no relationship between the educational status and income.
Now we test second part of this hypothesis. In the following manner (with two
way ANOVA)
H01: There is no impact of educational status on income.
H02: There is no impact of educational status on occupational status.
Table 27.4
Educational Status
Occupational Status (mean of income)
Farmer Animal Husbandry
Agricultural Labourer
Wage Labourer
illiterate 104800 44515 12400 23148.15 1 to 7 359866.7 56340 15044.44 16383.34
Table 27.5
ANOVA Source of Variation
SS df MS F F crit
Rows 8.63E+09 1 8.63E+09 1.079125 10.12796 Columns 6.42E+10 3 2.14E+10 2.675371 9.276628 Error 2.4E+10 3 8E+09 Total 9.68E+10 7
Fcal = 1.079 < F (0.05,1,3) = 10.23 we accept H01
Fcal = 2.67 < F (0.05,3,3) = 9.28 we accept H02
At the 5% level, the table value of F (for both rows and columns) ratios
are insignificant. So we accept both hypotheses. We can conclude that there is no
impact of educational status on income and there is no impact of educational
status on occupational status.
Finally, we can conclude that ‘Status of education does not improve the
opportunity to achieve livelihood’. It is true for these selected four occupation

99
because these are the skilled occupations and don’t required any formal
education. But they need that kind of education which can help them in getting
better advantages from whatever activity they do.

100
Chapter 5 Conclusion This brief research work reviews the ways in which the rural people living
and what kind of livelihood they derived from available resources in village.
When we compare these two blocks villages with each other we found that where
there is Agriculture is sustain and in good condition, in Nakhatrana block’s
villages, allied all other activities also in good condition. While in villages of
Abadasa block, Agriculture sector is not performing as good as per requirement
of the farmers and not providing enough livelihoods to the farmers, hence it
effects directly to all other activities of village. In sort we can say that overall
pattern of village development is depends on sources of livelihoods which are
available in village.
The first component for study is availability of amenities of both village in
general and household in particular. Availability of amenities and sources of
livelihood directly effect to the sustainability of the village. When we look at the
sample villages in terms of basic amenities such as drinking water, health,
education, telephone, internet, bank, post office, etc. apart from availability of
drinking water nothing is found adequate.
The fundamental for livable home is ownership of house, condition of the
house, safe drinking water, sanitation facility, rooms in respect size of family, etc.
And the potential means not only use of these services but simply that it is
located at certain distance most probably accessible from the household. The
current scenario of primary data of sample households, related to availability of
amenities of households, in the sample villages, are such as: 63.75 percentages of
households having own house. But when we look at the availability of room in
respect of size of family, small families have large number of rooms and large
families have only 1 or 2 rooms; according to condition of house 43.75
percentages of total sample households do not have pucca roof; 62.5 percentages
of households getting their drinking water from house tap and 37.5 percentages
are getting it from public tap. When looking toward purify drinking water not a
single household founded under the study which purifies drinking water.
From all other amenities asset plays a significant role in making ones life
comfortable and secure and it is also required for making improved and
sustainable life. Financial assets in context of availing banking services, as per
101
secondary data shows, Kachchh in total 35.94%, in rural area it is 29.34%
households having and in urban area 49.58% households having it; while in our
sample households it rests for 41.25% of households. In availability of assets,
some households don’t have any of the each specified assets, in Kachchh total
36.25% households are don’t have any asset, in rural area 44.71% households
and in urban area 18.80 households are don’t have any asset. While in sample
households not a single household is found with un-availability of assets.
When we are looking towards the livelihood’s conditions of this sample
village’s sample population, in the villages of Nakhatrana block it is founded in
good condition with comparison to the villages of Abadasa block. But the overall
situation is not as good as requirement of current time. Almost 52.5% of
households are having annual income less than 50,000 rupees. How this small
amount makes them sustain in the current situation and in the future? Is it
possible? So the things comes out from study that source of livelihood are found
least and it will turn into declining of total development process of village.
It observed from the study that sources of livelihoods are also found
stagnant and not meeting with the requirement of growing population. In this
context, Enhancements of livelihood activities and creating alternative livelihood
opportunities have been the focuses towards Sustainable Village Development.
In the study we are just talking about only the means of livelihoods which
are required for living. We observe it with comparison to income and availability
of amenities which is set position for them only for living, not for meets to live
with the improved ‘quality of life’. As Amartya Sen says “Quality of life is seen
in terms of valued activities and the ability to choose and perform those activities
and Quality of life is combination of hand, heart and head, the effective
combination of an appropriate mix lies in constructing livable of life.” But the
concept has a wide span and being democratically defined with specific meanings
of different people in different places; including the many criteria of well-being
of poor people themselves.
“Conditions for social and economic progress are simply those which
release the energies and creativity of the people and transform this creativity and
motivation for work into the means of production”. (Ekins P. 1992). This is the
wide thought which is really needed for the sustainability of household, village,
community, state and for the country.

102
It appears from the study that willingness to living better life and capacity
buildings of the respondents are the points which needed more attention. Most of
the people from sample villages do accept the condition whatever it is and do not
even show inclination to come out. It’s to be noted that ‘Improvement of local
standard of living will lift up the overall village life and sustainability of village’.
‘Sustainable development is possible only when local community base
initiative is supported by the state and the market.’(Ekins P. 1992). All over
development of village is also effect by availability of natural resources;
institutional and organizational support. The villages under the study have the
equal condition in terms of available natural resources. But it seems different in
terms of institutional support and organizational support.
And the purpose of development is to create an environment in which all
people can expand their capabilities and opportunities can be enlarged for both
present and future generations (UNDP 1994). This is the approach which is
needed for development of the urban and the rural area. Usually the term urban
and rural as a notion, we have to much more holistic and integrated and much
more horizontal to use terminology, which is often applied in our approaches to
problems. We have to see this as being a part of whole because the both are
interdependent on each others; one holding up others and there is integration
between them. A balanced which has been tipped historically in favour of the
urban, but balance is now changing with so many government scheme, one of
them is our 11th five year plan, and the goal is “inclusive growth”. It is genuinely
need of the time, isn’t it?
Reference
Ekins P., 1992 “A New World Order: grassroots movement for Global
Change”, Routledge, New Work. UNDP 1994, - United Nations Development Report, Prof A. K. Sen.

103
List of Bibliography
• Debal D., 2009 “BEYOND DEVELOPMENTALITY – constructing inclusive
freedom and sustainability”, Daanish Book, Delhi. • Ekins P., 1992 “A New World Order: grassroots movement for Global Change”,
Routledge, New Work. • Friedmen T., 2008 “Hot, Flat and Crowded” Penguin Books, England. • Ghosh R. N., Gabby R., Roy K., 1999 “Sustaining Development – Human
resources, Gender and Environment” Edited Book, Atlantic Publishers and
Distributers, New Delhi. • Haq M., 1995 “Reflection on Human Development”, Oxford University Press,
New York. • Parameswaran P., 2005 “Empowering People: Studies in Local Level
Development -2”, Daanish Book, Delhi. • Perry G., Burki S. J, 1998 “World Bank and Latin American Caribbean
Studies: Beyond the Washington Census Institutions Matter”, • Sen A., 1998 “Public Action to Remedy Hunger”, Forum for free enterprise,
Mumbai. • Sundaram K. V., Moni M., 2001 “Sustainable Development and Sustainable
Life Styles”, Edited Book, Northern Book Center, New Delhi. Reports
• Agarwal A., Narain S., 1997 “DYING WISDOM”, States of India’s 4th
Environment Report, Center for Science and Environment, New Delhi. • Fifth Summer School, 11th to 20th June, 1999 “Management of Common
Property Resources”, Program Material of IIM, Ahmedabad. • Census of India 2001, tables on Houses; household Amenities & Asset, CD no.6
• Baseline Survey Report March, 2009 “Sustainable Solutions for Augmenting
Livelihoods in Kachchh”, VRTI, Naliya. • “Ensuring Sustainability and Impact Change Agents in the SNEHAL
Program”, Care India, 2008. (SNEHAL – Sustained, Nutrition, Education,
Health And Livelihoods, program started in 2002, supported by USDA
(United States Department of Agriculture) and Care India)
• “SNEHAL - Tales of Transformation” Care India and USDA, 2009.

104
QUESTIONNAIRE FOR DISSERTATION
Sub.: “Livelihood and Sustainable Village Development:
A Study of Selected Villages”
•••••••••••••••••••••
•••••••••••••• • • • • • • •••••••• •
••••••••••••• • • • • • • •••••••••••••••
••••••••••••••••••••••• •••• ••••••
•••• •••••• •••• ••••• ••••• •• ••••••••
• • • • ••••• ••••• • ••• •••••••••••••••••••••
•••√••••••••••
•• •••••• • • • • • •
•• ••••••• • • • • • •
•••••••••••••••••••••••••••••
••••••••••••• • • •••• •••••••••••• • ••••••••••••••••••
••••••••••••••••••••••••••••• ••••••••••••••••••
••• •••••••••••••• • • •••••••••••••••• • ••••••••••••••••
•••••••••••
••••••••••••••••••••••••••••••••
•••••••••••••••• ••••••••••••••••••••••••••••••••
••••••••••••••••••• • •
•••••••••••••••••••
•
•
•
•
•
•

105
•••••••••••••••••••••••• ••••
•••• ••••• •••••
•••√••••••
•••••••••
• ••••
•• ••••••••••••••••••••• • •
•• •••••••••••••• • •
•• ••••••••••••• • •
•• •••••• ••••• • •
•• ••• • •
•• •••••••• • •
•• ••••• • •
•• •••••••••••••••• • •
•• ••••••••••••••• • •
••• ••••••••• • •
••• •••••••• • •
••• ••••••••••••••••••••••••• • •
••••••••••••••••••••••••••••••••••••••••••••
•••••••••••••••••••••••••••••••• ••••••••• • ••••••••••••••••••••
••••••••••••••••••••••••••••••••••••••••
•
•••••••••••••••••••••••••••••••••
••••
•
••••••• •••••• ••••••••
•••••••••• ••••
•• • ••••••••• • •
•• ••••••••••••• • •
•• ••••••••••••• • •
•• ••••••••••••••••••• • •
•
•

106
•••••••••• •••••••••••••••••••• ••••
••••
•
••••••• •••••• ••••••••
•••••••••• ••••
•• •••• ••••••••••••• • •
•• ••••••••••••••••• • •
•• •••••••• • •
•• •••• • •
•• • ••••••••• • •
•••• •••••••••••••••••••••••
••••••••••••••••••••••••••••••••••••
•••••••••••••••••••••••••••••••••••
•••••••••••••••••••••••••• • • ••• •••
••••••••••••••••••••••••••••••••••
••• ••••••••••••••••••••••• • • ••••••••••••••• •
• • • • • • •••••••••••••• • •
• • • • • • ••••••••••••••••••••••
• • • • • • • •••••••••• •••• •
• • • • • • •••• •••• •••• •••• •
•
•
•
•
•
•

107
•••••••••••••••••••••••••
••••••••••••••••••••••••••••••••••••• ••••••••• ••••••••• • •••
•••••••••••••••••• • • • •••••• • • ••••••••• ••••••
•••••••••• •••••••••••••• • • ••• • •••
•••••••••••••••••••••••••••• •••∼••••• ••• • •••
•••••••••••••••
••••••••••••••••••••••••••••••• • ••• • •••
••••••••••••••••••••••••••• • • ••••••••• ••••••• • •••
••••••••••••••••••••••••••••••••••• • ••••••• ••••••••• •••••••
• ••••••
••••••••••• • • • • •••••• • L.P.G•
••••••••••••••••••••••• • • ••••••••• •••••••••• ••••••••••••
• • • • • • ••••
•• • • • • • ••••••••••••••••••••• ••••••
•••••••• • • • • •••••• • •••••••• ••••
• • • • • • • •••
••••••••••••••••••••••••••••••••••• • • •••••••••••••• • •••••••••••••••
•• •••••••• • • • • •••••••••••••••••• •••••••
•••••••••••••••••••••••••••••••• • • ••••••• ••••• ••• •
• • • • • • •••••••••
•••••••••••••••••••••••••••• • ••••••••••••• •••••••• •••••••••
• • • • • • • ••••••••••••••••••••• •
• • • • • • • •••
•••••••••••••••••••••• •••••••••••••••
••••••••••••••
•••••••••••••••••• ••••
•
•
108
•••••••••••••••••••••• • • • ••••••••
••• •••••• •••••••
•••••••••••••
•••••
••∼•••
••••
••••• ••••••••••
••••••
•
•••••• •••••••••••
••••
••••••• • ••••••••••
• • • • • • • • •
• • • • • • • • •
• • • • • • • • •
• • • • • • • • •
• • • • • • • • •
• • • • • • • • •
• • • • • • • • •
• • • • • • • • •
••••••••••••••••••••••••••••• •••••••••••••••••••
••••••••••••••••••••••• •••••••••••••••••••••••••••••••••••••••••••••••••••••••••••••••••• •••••
•••
••••••••••••••••••• •••••••••••••• • •••••• • ••••• •
• •••••••••••••••••••••• • ••••••••••••••••••
••••••• • • • • • ••••••••••• • •••••••••
•••• • • • • • •••••••••••••••• •••••••
• • • • • • ••••••••••••••••
••••••••• •••••••
• •••••••••••••••• •
•••••••••••••••••••••••• • • ••• • • •••
•••••••••••••••• •••••••••
•••••••••••••••••••• • ••••••••••••••••••••• ••••••••••••••••
• • • ••••••••••
•••••••••••••••••••
••••••••••••••••••••••••••••••••••••••••••••••• •••••••••••••••••• ••••••••• •••••
••••••••••••••• ••••••••••••• •••

109
•••••••••••••••••••••••••••••••••••••• ••• • •••
•••••••••••••••••••••••
••••••••••••••••••••••••••••••••• • ••••••••• •••••••• •••••••
• • ••••••••••
• • • •••
•••••••••••••••••••• ••••••••••••••••• •••••••••• ••••••• • •••••••••
••••••••••••••••••••••••••••• • •••••••••••
•
• •

110
••••••••••••••••••••
••••••
••••••••••••••••••••••••••••••••••••
•••••••••••••••••••••••• •••••••••••••••••
•••••••••••
••••••••••••••••••••••••••• • • ••••••• ••••••••••••• ••••••••••••
• • • • • • ••••
••• • • • • • ••••• • • •••
•••••••••••••••••••••• •••••••••• •••••••• •••••••••••• • •••
••••••••••••••••••••••••••••••••
•••••••••••••••••• ••••••••••••••••• ••• • •••
•••••••••••••••••••••••••••••••• •••••• • • •••••••••••••••••••••••••
•••• •••••••••••••••••••••••••••••••••••••••••••••••••••••••••••••••••••••••••••••••••••••••
•••••••••••••••••••••••••••••••••••••••••••••••••••••••••••
•••••••••••••••••••••••••••••• •••• • •••
•••••••••••••••••••••••••••••••••••••• ••••• • •••• • •••••
• ••••••••••••••
••• •••••••
•••••••• ••••••••••••••••••••••• •
•••••••••••••••
••••••••••••••
••••••••••••••••••••
••••••••••••••
••••••••••••
•••••••••••••••• •••••••••••••••••••••
• •••••••••••••••
• ••••••••••••••••
• ••••••••••••••••••••••••••• •••••

111
••••••••••••••••••••••••••••••••••••• ••••••••••• ••••••••••• • •••
•
••••••••
••••••••••••••••••••••••••••••••••••
•••••••••••••••••••••••• •••••••••••••••••
•••••••••••
••••••••••••••••••••••••••• • • ••••••• ••••••••••••• ••••••••••••
• • • • • • NGO
••• • • • • • ••••• • • •••
•••••••••••••••••••••• •••••••••• •••••••• •••••••••••• • •••
••••••••••••••••••••••••••••••••
•••••••••••••••••• ••••••••••••••••• ••• • •••
••••••••••••••••
•••••••••••••••• •••••••••••• •••• • ••••••••••
••••• • ••••
••••
•
•••••••••••••••••••••••••••
••••••••••••••••••••••••••
••••••••••• •••••••••••••• •••••••••• ••••••••••••• ••••••••••••
•• •••••••••••• •••••••••••• ••••••••••
••••••••••••••••••••••••••••••••••••••••
•••••••••••
•••••••••••••••••••••••••• ••• • •••
•••••••••••••••• •••••••• ••
••••••••••••••••••••• ••• • •••
••••••••••••••••••••••••••••••••••
•••••••••••••••••••••••••••• ••• • •••

112
••••••••••••••••••••••••••••••••••• ••••••••••• ••••••••••• • •••
•
•••••••••• •••••••••••
••••••••••••••••••••• ••••••••••••••••••••• ••••••••••••••• • •••
••••••••••••••••••
••••••••• ••••••••••••••••••••••••••••••••••••••
•••••••••••••••••••••• • • • ••••••••••••••••••••••••••••••
••••••••• ••••••••••••••••••••••••••••••••••• ••••••••• • ••••••••••
• •••••••••••
•••••••••••••••••••••••••••••••••••••••••••••• •
•••••••••••••••••••••••••••••••••••••••••••••••• • • •••••••
•••••••••••••••••••••••••••••••••••• • ••
• • • • • • ••
• • • • • • ••
•••••••••••••••••••••••••••••••••••••••••••• • • ••••••
•••••••••••••••••••••••••••••••••••••••••••••••••••
•••••••••••••••••••••••• • • • ••• • •••
•
•
•
•