LIVELIHOOD PATTERN OF AGRICULTURAL LABOUR ...
25
LIVELIHOOD PATTERN OF AGRICULTURAL LABOUR HOUSEHOLDS IN RURAL INDIA: EVIDENCE FROM ORISSA Sushanta Mahapatra MADRAS INSTITUTE OF DEVELOPMENT STUDIES, CHENNAI, INDIA ABSTRACT Using primarily different published secondary data, the article analyses employment generation, income of different cate- gories of labour and the extent of indebtedness and earning prevalent among rural landless labourers and agricultural house- holds in rural Orissa, with a view to understanding their livelihood patterns. In this state—where more than 85 per cent of the popu- lation is rural—a third of rural households constitute landless labour households which depend completely on wage employment. An- other 60 per cent of rural households is comprised of marginal farmers and small farmers who do not generate sufficient income from their land. Even small farmers with up to five acres supple- ment their agriculture with outside jobs or wage employment. The evidence relating to rural labour households and agricultural labour households shows an explicit overall decline in employment both for male and female labour. There is also a decline in the average number of earning members per household. Clearly, the rural labour households and agricultural labour households in this state are characterised by low earning, decline in income, low con- sumption and high debt, and remedies will have to be found to generate more employment and income. KEYWORDS: Agriculture, earnings, employment, income, indebtedness, labour markets, livelihood, Orissa, rural labour Introduction and Literature Survey In recent years, several theoretical and empirical studies on the functioning of rural labour markets have appeared. An important trend in this literature has been to explain patterns of income and employment generation, number of days of work available for different kinds of rural labour, and the extent of earning and indebtedness prevalent among these households. The nexus of landlessness, growth of agricultural labourers and poverty has assumed major significance. The Indian rural workforce increased at the rate of 1.9 per cent per annum between 1971 and 1981, but since the net sown area has scarcely risen by 0.4 per cent over the whole decade, there would Copyright © 2007 SAGE Publications Los Angeles, London, New Delhi, Singapore SOUTH ASIA RESEARCH www.sagepublications.com DOI: 10.1177/026272800602700105 Vol. 27(1): 79–103 at PENNSYLVANIA STATE UNIV on February 19, 2016 sar.sagepub.com Downloaded from
-
Upload
khangminh22 -
Category
Documents
-
view
2 -
download
0
Transcript of LIVELIHOOD PATTERN OF AGRICULTURAL LABOUR ...

Mahapatra: Livelihood Pattern of Agricultural Labour 79
LIVELIHOOD PATTERN OFAGRICULTURAL LABOURHOUSEHOLDS IN RURAL INDIA:EVIDENCE FROM ORISSASushanta MahapatraMADRAS INSTITUTE OF DEVELOPMENT STUDIES, CHENNAI, INDIA
ABSTRACT Using primarily different published secondary data, thearticle analyses employment generation, income of different cate-gories of labour and the extent of indebtedness and earningprevalent among rural landless labourers and agricultural house-holds in rural Orissa, with a view to understanding their livelihoodpatterns. In this state—where more than 85 per cent of the popu-lation is rural—a third of rural households constitute landless labourhouseholds which depend completely on wage employment. An-other 60 per cent of rural households is comprised of marginalfarmers and small farmers who do not generate sufficient incomefrom their land. Even small farmers with up to five acres supple-ment their agriculture with outside jobs or wage employment.The evidence relating to rural labour households and agriculturallabour households shows an explicit overall decline in employmentboth for male and female labour. There is also a decline in theaverage number of earning members per household. Clearly, therural labour households and agricultural labour households in thisstate are characterised by low earning, decline in income, low con-sumption and high debt, and remedies will have to be found togenerate more employment and income.
KEYWORDS: Agriculture, earnings, employment, income, indebtedness,labour markets, livelihood, Orissa, rural labour
Introduction and Literature Survey
In recent years, several theoretical and empirical studies on the functioning of rurallabour markets have appeared. An important trend in this literature has been toexplain patterns of income and employment generation, number of days of workavailable for different kinds of rural labour, and the extent of earning and indebtednessprevalent among these households. The nexus of landlessness, growth of agriculturallabourers and poverty has assumed major significance. The Indian rural workforceincreased at the rate of 1.9 per cent per annum between 1971 and 1981, but since thenet sown area has scarcely risen by 0.4 per cent over the whole decade, there would
Copyright © 2007SAGE PublicationsLos Angeles,London,New Delhi,Singapore
SOUTH ASIARESEARCH
www.sagepublications.comDOI: 10.1177/026272800602700105
Vol. 27(1): 79–103
at PENNSYLVANIA STATE UNIV on February 19, 2016sar.sagepub.comDownloaded from

80 South Asia Research Vol. 27 (1)
be a rise in the magnitude and proportion of wage labourers (Krishnamurty, 1984).The states of Andhra Pradesh, Bihar, Karnataka, Maharashtra, Orissa, Tamil Naduand West Bengal have relatively large proportions of agricultural labourers, whichtogether constitute 70 per cent of the total agricultural labour force in the country.Barring Maharashtra, the other states have a high percentage of rural populationbelow the poverty line (according to the 38th round of the NSS pertaining to theyear 1983).
In traditional agriculture, labour market references are made to the time-specificityof labour contracts. It is presumed that short-period labour contracts, such as dailylabour, are more frequent than long-period contracts. A contrast is seen betweenwage contract, sharecropping and fixed-rent contract. Daily wage rates are determinedin the daily labour market. Daily casual labour contracts are the major form of labourcontract in traditional agriculture or rural economics (Sajjad, 1989). The above state-ments were empirically observed during a review of contracted arrangements, employ-ment, and wages in rural labour markets conducted by Binswanger and Rosenzweig(1984). They claimed that daily (or casual) labour is the principal form of labourcontract in South and South East Asia, a claim supported by empirical results fromBardhan and Rudra (1980a, 1980b). The authors’ findings are based on a surveyof 110 randomly-selected villages in West Bengal, with data collected in 1979. It wasfound that 83.6 per cent of total ‘labour families’ in all sample villages are ‘casuallabour families’.
Ravallion (1982) studied wage adjustment in Bangladesh before and after the1974 famine, finding that the most important immediate cause of starvation dur-ing the 1974 famine was a sharp drop in the food-purchasing power of agriculturalearnings. The rate at which agricultural work exchanged for food fell dramatically inBangladesh during the 1974 famine (Sen, 1981), so that landless agricultural workersand part-time farmers became the famine’s main victims. Sen (1981) thus attributedthe famine to ‘trade entitlement failure’.
Rao (1988) examined the nexus between the rural labour market and the wageemployment structure of a village. Villages fragmented rural labour markets in Indiaand elsewhere; research analysed inter-village mobility barriers, inside-outside differ-entiation and the nature of the intra-village labour exchange. Unemployment reducesthe opportunity cost of labour to peasants to below an institutionally determinedwage, while lack of ‘familiarity’ raises the cost of recruiting and employing non-village labourers to village employers above that wage. Hence, patron-client relationsbetween village employers and employees benefit both, and will be the characteristicform of rural labour exchange. Under appropriate conditions, sharecropping mayalso emerge as a way of organising production and of sharing rents within villages.Sarap (1989, 1991a) analysed patterns of contractual arrangement among rural labourhouseholds in Orissa. In backward agriculture the nature of contract between rurallabourers and employers is generally stable and not varied, but Indian agriculture hasundergone changes and the agricultural sector has become diversified, with a portionof rural labour migrating to urban areas in search of jobs. Further, government legis-lation has intervened in marketing. As a result, labour contracts are also undergoing
at PENNSYLVANIA STATE UNIV on February 19, 2016sar.sagepub.comDownloaded from
Mahapatra: Livelihood Pattern of Agricultural Labour 81
changes, affecting the terms and conditions of contracts, which are becoming moreflexible depending upon the bargaining power of parties.
There is much literature on the concept of ‘livelihood’ and on ‘sustainable live-lihood’. Livelihood consists of the capabilities, assets (including both material andsocial resources) and activities required for a means of living. A livelihood is sustainablewhen it can cope with and recover from stresses and shocks to maintain or enhanceits capabilities and assets, while not undermining the natural resource base (Chambersand Conway, 1992). One can also define livelihood in terms of work and employmentwith poverty reduction, in the form of off-farm work, as part of a wage labour systemor as subsistence production. Sen (1973) observed that there are three aspects of em-ployment: income (a wage for the employed), production (employment providing aconsumable output) and recognition (where employment provides recognition forbeing engaged in something worthwhile). Lipton (1983, 1994) pointed out that 200days a year seem to be used extensively as the minimum requirement for the generationof a livelihood.
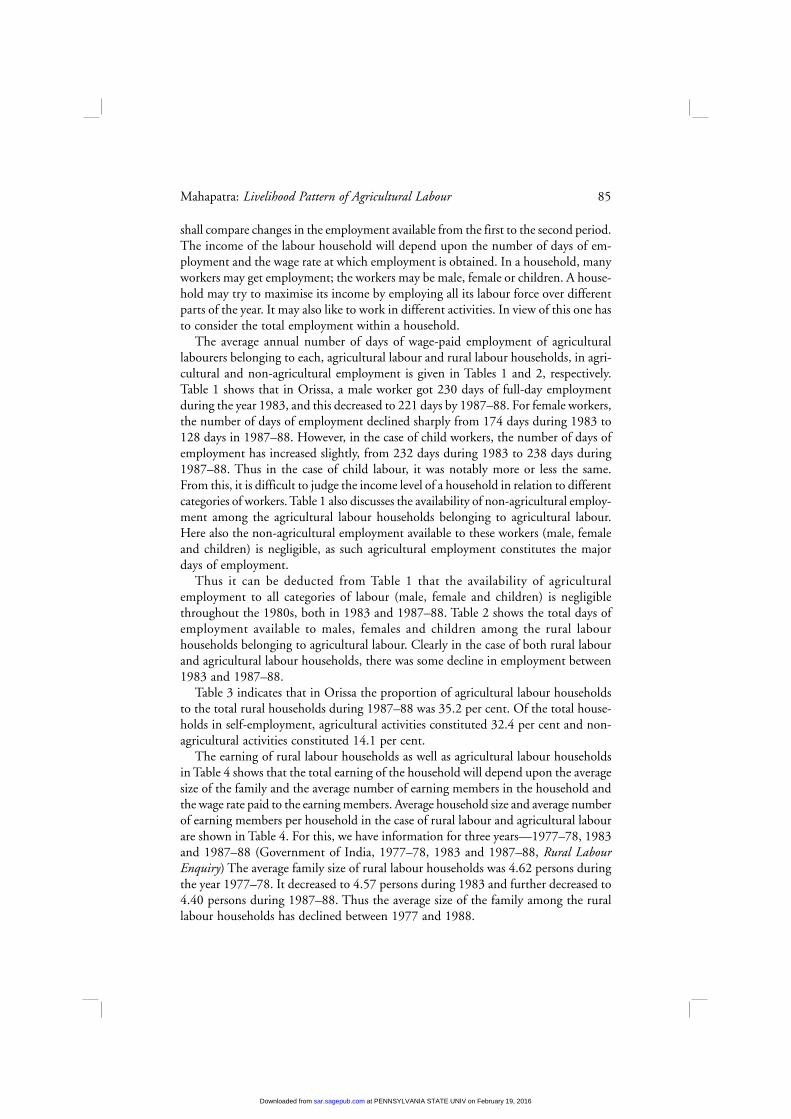
There is an overabundance of literature on interlinked land, labour and credittransactions. Most of this writing tries to explore the causes of interlinkage and outlinesits consequences for farm economy. It is argued that in a traditional setting landlordslease out land and by way of providing consumption loans extract surplus in theform of produce and free labour services. In their pioneering, extensive empiricalstudy, Bardhan and Rudra (1978) found mainly three types of linkages—credit-tenancy contracts, tenancy-labour links and labour-credit contracts. Since their samplehouseholds constituted only tenants and labourers (casual and permanent), theirstudy highlighted credit links with land and labour markets only and did not indicatethe crude links with input and output markets. The bargaining position of the weakerparty in the market is such that they lack not only the power to guide market forces,but also the ability to keep away from the market.
The need to secure a livelihood forces rural and agricultural labourers to enter theinterlocked market, and hence they are said to be ‘compulsively involved in the market’(Bharadwaj, 1974: 3). Not possessing sufficient land, many people are forced to selltheir labour, in the process subjecting themselves to the vagaries of the labour market.On the other hand, employment opportunities are so uncertain that people try tolease out land, again without being in a position to bargain for favourable terms andconditions. Various field studies (Bardhan and Rudra, 1978; Pleatteau et al., 1981;Sarap, 1991b) reveal extensive wage differences and price differentials in the interlinkedtransactions leading to exploitation of weaker parties, though some parties also foundinterest-free loans. Bardhan and Rudra (1978) pointed out that casual labourersworked at wages lower than market wages for their employer creditors. The under-pricing of labour services in credit-labour linkages was also observed by Sarap (1991b)and Pleatteau et al. (1981), though Bardhan and Rudra (1978) and Sarap (1991b)also observed interest-free arrangements to ensure a steady supply of labour, so thatthe payment of interest takes the form of wage cuts.
at PENNSYLVANIA STATE UNIV on February 19, 2016sar.sagepub.comDownloaded from

82 South Asia Research Vol. 27 (1)
The Setting: Orissa Past and Present
The state of Orissa is located across the sea from Myanmar, the gateway to South-East Asia, one of the fastest-developing regions of the world. The state has a coastlineof 482 kms on the Bay of Bengal and lies wholly in the tropical zone. Its rich alluvialsoil is crossed by a large number of rivers and rivulets and provides an ideal naturalbase for developing prosperous agriculture. The state is well-endowed with almost allresources for higher levels of development like land, labour, water, forests, a coastalarea and mineral deposits. The land area of the state is about 155,707 square kms,comprising 4.74 per cent of India’s landmass. With 36.71 million people it accountsfor 3.57 per cent of India’s population.
Nearly 85 per cent of Orissa’s population lives in rural areas, depending mostly onagriculture for its livelihood. The total cultivable land of the state is nearly 65.59lakh hectares; at the end of 2002–03 only 26.02 lakh hectares were irrigated. Despitevariations in land, soil and climatic conditions, the bulk of land is devoted to cultivationof food grains, especially rice. Nearly 63.75 per cent of the state’s population is engageddirectly or indirectly in agricultural activities. About a third of rural households con-stitute landless labour households that depend completely on wage employment.Another 60 per cent of rural households are marginal farmers and small farmers whoseland-size is very small; income generated from this land is so low that these house-holds also depend on wage employment. Lastly, even small farmers with land holdingsof up to five acres supplement their income with outside jobs or wage employment.Given this situation, studies of wage and employment of rural households areimportant.
The rest of the world knows Orissa for its past glories, scenic locations, art andarchitecture, rich culture and its peace-loving people. The lesser-known aspects ofthe state are its backwardness in social and economic development during the post-economic planning period. Historical reviews show that Orissa, then the Kalinga,was one of the most advanced regions in the country with prosperous trade and agri-culture. Unfortunately, the state lost its earlier pre-eminent position. Its impover-ishment began during the post-planning era and economic development in the statehas become a national concern. The state now enjoys the dubious distinction oflagging behind most other states in human development. Its adult literacy rate isonly 46 per cent and it has the lowest per capita rural income in the country, atRs. 3,028. There are a host of factors responsible for the present state of developmentin Orissa.
Demographic and Economic Indicators
The demographic profile obviously has an important bearing on the developmentprocess and labour markets. The following are some of the facts revealed in the 1991Census: the decennial population growth rate of Orissa during 1991–2001 was 15.94per cent, as against 20.06 per cent in the previous decade. The number of femalesper 1000 males increased slightly, from 927 in 1991 to 933 in 2001. The density ofpopulation, 203 persons per square km in 1991, increased to 236 in 2001. The
at PENNSYLVANIA STATE UNIV on February 19, 2016sar.sagepub.comDownloaded from

Mahapatra: Livelihood Pattern of Agricultural Labour 83
urban population of 13.38 per cent in 1991 increased to 14.97 per cent in 2001, butthe process of urbanisation has been slow in the state compared to the national average.On the literacy front, achievements have been noticeable but below the nationalaverage, as the literacy rate increased from 49.09 per cent in 1991 to 63.61 per centin 2001—as against 52.10 per cent to 65.38 per cent at the national level. The maleand female literacy rates, 63.1 per cent and 34.7 per cent respectively in 1991, increasedto 75.95 per cent and 50.97 per cent respectively by 2001. The state has a higherconcentration (38.41 per cent) of backward populations, comprising Scheduled Castes(16.20 per cent) and Scheduled Tribes (22.21 per cent), as against 25 per cent forIndia as a whole. The Scheduled Areas cover nearly 45 per cent of the total geographicalarea. The SC/ST literacy rate was 36.78 per cent and 22.31 per cent, respectively.
Orissa being one of the poorest states in the country, the rural picture is character-ised by low per capita income. The state is now more frequently subjected to naturalcalamities of flood and drought due to ecological imbalances caused by large-scaledevastation of forests and vegetative cover wrought in recent times. In 1999, a cyclonein the coastal belt badly affected the state’s economy (Government of Orissa, 2001).Scarcity of rainfall (989 mm) in the crop season of 2002 resulted in crop failure anddrought conditions in large parts of the state, leading to large-scale outmigration ofpeople from villages in this state (Action AID, 2002). The extensive drought situationhas become an issue of debate in the state legislature as well as in Delhi. Drought hasa long history in this region, first recorded by Arthur Cotton in 1841–42. Historicalrecords show that Orissa suffered from terrible droughts and famines in the fifteenthand sixteenth centuries (Gazetteer of India, 1992). Severe famine conditions havealso been recorded in 1770, 1774–75, 1792–93 and 1865–66 (Government of India,1878: 39).1
With population increase and consequent additions to the labour force, laboursupply continues to outstrip demand, resulting in accentuated problems of unemploy-ment and under-employment. The occupational classification from the 2001 censusdata reveals that the total workers in the state number 142.73 lakh, constituting38.89 per cent of the total state population. Out of the total number of workers, themain categories were cultivators (29.69 per cent), agricultural labourers (35.04 percent), household workers (4.83 per cent) and other workers (30.44 per cent). Theproportion of male workers to male population and female workers to female popula-tion in 2001 was 52.75 per cent and 24.62 per cent, respectively. The work par-ticipation rate in rural and urban areas in Orissa was 29.67 per cent and 38.47 percent, respectively. As alternative sources of livelihood in the rural areas are limited,the population pressure on land is high. The female work participation rate increasedfrom 19.8 per cent in 1981 to 20.8 per cent in 1991.
Unemployment poses a major problem for the state, with estimates that the totalbacklog of unemployment at the beginning of 2003–04 could be of the order of10.04 lakh persons. To tackle the problem of unemployment, during the Tenth Planall the wage employment and self-employment programmes of the Ninth Plancontinued with special emphases on the generation of employment opportunities inthe secondary sector, and on the setting up of new industries in the private sector.The Live Register maintained by the employment exchanges reveals that at the end
at PENNSYLVANIA STATE UNIV on February 19, 2016sar.sagepub.comDownloaded from

84 South Asia Research Vol. 27 (1)
of 2002, the number of educated unemployed in the state was 6.16 lakh, 80.84 percent of the total 7.62 lakh applicants. While the number of vacancies has not showna corresponding rise, the number of applicants in the Live Register continues toincrease. The total number of registrations in the employment exchanges during2002 was 1,41,234 and vacancies notified were 2,239. Out of the notified vacancies,placement was only made with respect to 2,601 persons, including the backlog of theprevious year (Government of Orissa, 2005).
The poverty situation in the state is alarming. Although the proportion of thepopulation below the poverty line has declined, it remains higher than the nationallevel in rural and urban areas. During 1987–88, about 48 per cent of the total popu-lation and 24 per cent of the urban population were below the poverty line as comparedto 34.4 per cent and 20.1 per cent, respectively, at the all-India level. Scarcity of cultiv-able land and even declining land-man-ratio in the state has made operational holdingssmaller and uneconomical. The worker population ratio in rural Orissa registered anincrease from 31 per cent in 1971 to 39 per cent in 1991. Per capita net state domesticproduct (NSDP) in the state was Rs. 4,726 and Rs. 1,578 during 1993–94 at currentand constant prices respectively, against Rs. 7,060 and Rs. 2,292 at national averages.
Objective and Data Sources
The main objective of the study is to analyse the pattern of employment and incomeamong the rural labour and agricultural households in rural Orissa to understandtheir livelihood pattern. The present study was undertaken with three specific ob-jectives: (i) to study the pattern of employment generation, i.e. number of days ofwork available for different kinds of rural labour; (ii) to examine the patterns ofincome of different categories of labour; and (iii) to document the extent of earningand indebtedness prevalent among these households. The analysis of rural agriculturallabour households is important as these households comprise a vulnerable segmentof the rural population, the percentage of which has increased significantly in almostall the states in India. The article primarily uses different published secondary reports,such as Rural Labour in India—A Compendium of Basic Facts (Government of India,1983). It also uses the Labour Bureau’s Indian Labour Year Book 1990–91, and RuralLabour Enquiry (RLE) Reports like Report on Employment and Un-employment 1987–88, on wages and earnings of rural labour households as well as on indebtednessamong rural labour households for 1983 and1987–88, respectively. In addition, thearticle uses particularly the 38th Round (1983) and the 43rd Round (1987–88) ofthe National Sample Survey Organization (NSSO), ‘Sarvekshana’.
Pattern of Employment, Income and Indebtedness among theRural and Agricultural Labour Households in Orissa
This section discusses the pattern of employment available to rural labour householdsin Orissa in recent years. We have survey data for the years 1983 and 1987–88. We
at PENNSYLVANIA STATE UNIV on February 19, 2016sar.sagepub.comDownloaded from
Mahapatra: Livelihood Pattern of Agricultural Labour 85
shall compare changes in the employment available from the first to the second period.The income of the labour household will depend upon the number of days of em-ployment and the wage rate at which employment is obtained. In a household, manyworkers may get employment; the workers may be male, female or children. A house-hold may try to maximise its income by employing all its labour force over differentparts of the year. It may also like to work in different activities. In view of this one hasto consider the total employment within a household.
The average annual number of days of wage-paid employment of agriculturallabourers belonging to each, agricultural labour and rural labour households, in agri-cultural and non-agricultural employment is given in Tables 1 and 2, respectively.Table 1 shows that in Orissa, a male worker got 230 days of full-day employmentduring the year 1983, and this decreased to 221 days by 1987–88. For female workers,the number of days of employment declined sharply from 174 days during 1983 to128 days in 1987–88. However, in the case of child workers, the number of days ofemployment has increased slightly, from 232 days during 1983 to 238 days during1987–88. Thus in the case of child labour, it was notably more or less the same.From this, it is difficult to judge the income level of a household in relation to differentcategories of workers. Table 1 also discusses the availability of non-agricultural employ-ment among the agricultural labour households belonging to agricultural labour.Here also the non-agricultural employment available to these workers (male, femaleand children) is negligible, as such agricultural employment constitutes the majordays of employment.
Thus it can be deducted from Table 1 that the availability of agriculturalemployment to all categories of labour (male, female and children) is negligiblethroughout the 1980s, both in 1983 and 1987–88. Table 2 shows the total days ofemployment available to males, females and children among the rural labourhouseholds belonging to agricultural labour. Clearly in the case of both rural labourand agricultural labour households, there was some decline in employment between1983 and 1987–88.
Table 3 indicates that in Orissa the proportion of agricultural labour householdsto the total rural households during 1987–88 was 35.2 per cent. Of the total house-holds in self-employment, agricultural activities constituted 32.4 per cent and non-agricultural activities constituted 14.1 per cent.
The earning of rural labour households as well as agricultural labour householdsin Table 4 shows that the total earning of the household will depend upon the averagesize of the family and the average number of earning members in the household andthe wage rate paid to the earning members. Average household size and average numberof earning members per household in the case of rural labour and agricultural labourare shown in Table 4. For this, we have information for three years—1977–78, 1983and 1987–88 (Government of India, 1977–78, 1983 and 1987–88, Rural LabourEnquiry) The average family size of rural labour households was 4.62 persons duringthe year 1977–78. It decreased to 4.57 persons during 1983 and further decreased to4.40 persons during 1987–88. Thus the average size of the family among the rurallabour households has declined between 1977 and 1988.
at PENNSYLVANIA STATE UNIV on February 19, 2016sar.sagepub.comDownloaded from

86 South Asia Research Vol. 27 (1)
Tabl
e 1
Wag
e pa
id e
mpl
oym
ent
of a
gric
ultu
ral l
abou
rers
bel
ongi
ng t
o ag
ricu
ltur
al la
bour
hou
seho
lds
in a
gric
ultu
ral a
nd n
on-a
gric
ultu
ral e
mpl
oym
ent
(Num
ber
of f
ull d
ays
in a
yea
r)
Agr
icul
tura
l E
mpl
oym
ent
Non
-Agr
icul
tura
l E
mpl
oym
ent
Tota
l
198
319
87–8
819
8319
87–8
819
8319
87–8
8
Stat
e/In
dia
MF
CM
FC
MF
CM
FC
MF
CM
FC
Ori
ssa
219
165
232
207
115
236
117
014
132
230
174
232
221
128
238
All
Indi
a22
719
023
023
115
722
911
87
127
1123
819
823
724
316
424
0
Sour
ce: R
ural
Lab
our
Inqu
iry
Repo
rt o
n Em
ploy
men
t an
d U
n-em
ploy
men
t 19
87–8
8, 1
16, 1
19 a
nd 1
22.
Not
e: M
—M
ale,
F—
Fem
ale,
C—
Chi
ldre
n
at PENNSYLVANIA STATE UNIV on February 19, 2016sar.sagepub.comDownloaded from

Mahapatra: Livelihood Pattern of Agricultural Labour 87
Tabl
e 2
Wag
e pa
id e
mpl
oym
ent
of a
gric
ultu
ral l
abou
rers
bel
ongi
ng t
o ru
ral l
abou
r ho
useh
olds
in
agri
cult
ure
and
non-
agri
cult
ural
em
ploy
men
t
(Num
ber
of f
ull d
ays
in a
yea
r)
Agr
icul
tura
l E
mpl
oym
ent
Non
-Agr
icul
tura
l E
mpl
oym
ent
Tota
l
1983
198
7–88
1983
1987
–88
1983
1987
–88
Stat
e/In
dia
MF
CM
FC
MF
CM
FC
MF
CM
FC
Ori
ssa
218
166
232
206
114
232
128
—14
122
230
174
232
220
126
234
All
Indi
a22
718
922
923
015
722
912
87
137
1113
919
723
624
316
424
0
Sour
ce: R
ural
Lab
our
Inqu
iry
Repo
rt o
n Em
ploy
men
t an
d U
n-em
ploy
men
t 19
87–8
8, 1
25, 1
28 a
nd 1
31.
Not
e: M
—M
ale,
F—
Fem
ale,
C—
Chi
ldre
n
at PENNSYLVANIA STATE UNIV on February 19, 2016sar.sagepub.comDownloaded from

88 South Asia Research Vol. 27 (1)
Tabl
e 3
Perc
enta
ge d
istr
ibut
ion
of r
ural
labo
ur h
ouse
hold
s an
d po
pula
tion
by
hous
ehol
d ty
pe in
Ori
ssa
and
all I
ndia
Peri
od o
f Su
rvey
: Jul
y 19
87–J
une
1988
Rur
al H
ouse
hold
sR
ural
Pop
ulat
ions
Self-
Em
ploy
men
tSe
lf-E
mpl
oym
ent
Agr
icul
tura
lO
ther
Agr
icul
tura
lO
ther
Lab
our
Lab
our
Oth
erL
abou
rL
abou
rO
ther
Stat
e/In
dia
Agr
iN
on-A
gri
Hou
seho
ldH
ouse
hold
Hou
seho
ldA
gri
Non
-Agr
iH
ouse
hold
Hou
seho
ldH
ouse
hold
Ori
ssa
32.4
14.1
35.2
7.5
10.5
3814
.532
6.5
8.9
All
Indi
a37
.712
.330
.79
10.1
42.8
12.8
288.
48.
1
Sour
ce: N
SSO
Sar
veks
hana
NSS
43r
d R
ound
198
7–88
, 23–
4.
at PENNSYLVANIA STATE UNIV on February 19, 2016sar.sagepub.comDownloaded from

Mahapatra: Livelihood Pattern of Agricultural Labour 89
Tabl
e 4
Ave
rage
siz
e of
hou
seho
lds
and
earn
ing
stre
ngth
Agr
icul
tura
l La
bour
Hou
seho
ldR
ural
Lab
our
Hou
seho
lds
Ave
rage
siz
e of
the
fam
ilyA
vera
ge e
arni
ng s
tren
gth
Ave
rage
siz
e of
the
fam
ilyA
vera
ge e
arni
ng s
tren
gth
Stat
e/In
dia
1977
–78
1983
198
7–88
1977
–78
198
319
87–8
819
77–7
819
8319
87–8
819
77–7
819
8319
87–8
8
Ori
ssa
4.60
4.58
4.44
2.00
2.01
1.88
4.62
4.57
4.40
1.99
1.99
1.87
All
Indi
a4.
674.
634.
602.
132.
072.
004.
724.
644.
632.
082.
021.
98
Sour
ce: R
LE R
epor
t on
Wag
es a
nd E
arni
ng o
f Rur
al L
abou
r H
ouse
hold
s for
198
3 &
198
7–88
, 67,
70,
73
and
76.
Not
e: E
arni
ng st
reng
th is
def
ined
as t
he n
umbe
r of
per
sons
repo
rtin
g ag
ricu
ltura
l lab
our,
non-
agri
cultu
ral l
abou
r an
d/or
oth
er o
ccup
atio
n as
thei
r us
ual o
ccup
atio
n.
at PENNSYLVANIA STATE UNIV on February 19, 2016sar.sagepub.comDownloaded from

90 South Asia Research Vol. 27 (1)
Given the declining family size, one can expect that fewer family members areavailable to do paid work, as shown in Table 4. The average earning strength was1.99 in 1977–78 and 1983. It declined to 1.87 during 1987–88. Regarding the aver-age size of the household and earning strength of agricultural labour householdsduring the same period, Table 4 shows the average size of the family was 4.6 personsduring 1977–78. It decreased to 4.58 by 1983 and further to 4.44 by 1987–88, indi-cating constant decline in the average size of the family during the entire period.
Discussing the earning strength of agricultural labour households during the sameperiod in Table 4, we also see decline during this period. The average earning strengthin Orissa was 2.00 during 1977–78; it increased slightly to 2.01 during 1983, buthad declined again to 1.88 by 1987–88. A similar pattern is found in rural labourhouseholds in Table 4.
The total earning of the household will be influenced by the composition of theearning members, as female workers may get lower wages compared to males. Childrenwould earn even less, but are not covered separately in Table 5, where we have infor-mation relating to the average number of wage earners among the rural labour andagricultural labour households for the year 1987–88. In rural labour households theaverage number of wage earners was 1.32, 1.09 for male workers and 0.23 for females.The average number of wage earners for agricultural labour households in the statewas 1.35 during the same period, 1.12 for male workers and 0.23 for females. Thusthere was not much difference in terms of the average number of workers among therural labour and agricultural labour households.
Table 5 Average number of wage earners per household by sex during 1987–88
Agricultural Labour Households Rural Labour Households
State/India Male Female Total Male Female Total
Orissa 1.12 0.23 1.35 1.09 0.23 1.32All India 1.05 0.32 1.37 1.01 0.3 1.31
Source: RLE Report on Wages and Earnings of Rural Labour Households 1987–88, 79 and 82.
The average daily earnings of men, women and children belonging to agriculturallabour households in agricultural occupations during 1987–88 are listed in Table 6.It was Rs. 7.92 for male workers, Rs. 6.06 for females and Rs. 4.66 per child workers.Thus, women workers received lower wages than males, and children lower wagesthan females. We also have information relating to the average real earnings of malesbelonging to an agricultural labour household. The average daily wage earning ofmales in the state in terms of money earning was Rs. 3.81 in 1983, which increasedto Rs. 7.92 in 1987–88. However, in terms of real earning there was an increase fromRs. 3.81 to only Rs. 6.98 during the same period. Thus, the increase of real earningis significantly lower in comparison with that of money earning.
at PENNSYLVANIA STATE UNIV on February 19, 2016sar.sagepub.comDownloaded from

Mahapatra: Livelihood Pattern of Agricultural Labour 91
Table 6 Average daily earnings of males, females and children belonging to agricultural labourhouseholds in agricultural occupations during 1987–88
Male Female Children
State/India Cash Kind Total Cash Kind Total Cash Kind Total
Orissa 6.19 1.73 7.92 3.94 2.12 6.06 2.83 1.83 4.66All India 7.25 2.17 9.42 5.19 1.81 7 4.48 1.53 6.01
Source: RLE Report on Wages and Earnings of Rural Labour Households 1987–88, 109–11.
As Table 7 demonstrates, the average daily earning of a male worker during1987–88 was Rs. 7.92 in agricultural labour households and Rs. 7.79 for rural labourhouseholds. This table shows that the state-wise average daily earnings of men in1987–88 are even lower than the minimum wages fixed by the Government of Orissaunder the Minimum Wages Act, 1948 as on 31 December 1983.
Table 7 Average daily earnings of males in agricultural operations vis-à-vis the minimumagricultural wages fixed under the Minimum Wages Act, 1948
Average daily earnings during 1987–88for men belonging to
State/India Agr. labour households Rural labour households
Orissa Rs 7.92 Rs 7.79 10.00All India Rs 9.42 Rs 9.46 8.50–12.75
Source: Rural Labour Enquiry Report on Wages and Earnings, Rural Labour Households (43rd Roundof NSS), 236.
The evidence provided in Table 8 shows that agricultural operations constitute themajor activity both for rural labour households and agricultural labour householdsas far as wage earning is concerned. The average earnings of both categories of labourwere low, both in terms of money wage as well as in real wage terms. Table 8 showsthat the average daily earning of men belonging to all rural labour households engagedin agricultural operations was Rs. 3.66 during 1983, and increased to Rs. 7.89 in1987–88.
The actual earnings of the household may not be fully utilised for consumptionpurposes if the household has to part with a portion of earnings for loan repayment.Thus it is important to know about the past loan indebtedness of these households.The indebtedness of agricultural labour households is indicated in Table 9. Thepercentage of indebted rural labour households in Orissa was 40.08 in 1983 and35.40 in 1987. In the case of agricultural labour households it was 40.75 per cent
The prevailing minimumrates of wages (per day)
under the MinimumWages Act, 1948, as on
31 Dec. 1983 (Rs.)
at PENNSYLVANIA STATE UNIV on February 19, 2016sar.sagepub.comDownloaded from

92 South Asia Research Vol. 27 (1)
Tabl
e 8
Ave
rage
dai
ly e
arni
ngs
in a
gric
ultu
ral o
ccup
atio
ns v
is-à
-vis
tho
se in
oth
er s
ecto
rs o
f th
e ec
onom
y (R
s.)
Ave
rage
dai
ly e
arni
ngs
ofm
en b
elon
ging
to
all r
ural
Ave
rage
ear
ning
s in
agr
icul
tura
l ope
rati
ons
labo
ur h
ouse
hold
s en
gage
d in
Ave
rage
dai
ly e
arni
ng d
urin
g 19
83 in
as r
atio
s of
ave
rage
ear
ning
s in
Stat
e/ag
ricu
ltur
al o
pera
tion
s (R
LE)
Fact
orie
sC
oal
Min
esPl
anta
tion
sFa
ctor
ies
Coa
l M
ines
Plan
tati
ons
Indi
a19
83 1
987–
8819
88A
pril
1988
1988
–89
Col
-3/
Col
-4C
ol-3
/ C
ol-5
Col
-3/
Col
-6
12
34
56
78
9O
riss
a3.
667.
8928
.23
75.4
—0.
280.
1—
All
Indi
a4.
639.
4636
.32
74.7
8—
0.26
0.13
—
Sour
ce: I
ndia
n La
bour
Yea
r B
ook
(199
0–91
)
at PENNSYLVANIA STATE UNIV on February 19, 2016sar.sagepub.comDownloaded from

Mahapatra: Livelihood Pattern of Agricultural Labour 93
Tabl
e 9
Ext
ent
of i
ndeb
tedn
ess
amon
g ag
ricu
ltur
al l
abou
r ho
useh
olds
/rur
al l
abou
r ho
useh
olds
Agr
icul
tura
l la
bour
hou
seho
lds
Rur
al l
abou
r ho
useh
olds
Perc
enta
gePe
rcen
tage
of i
ndeb
ted
Ave
rage
deb
tA
vera
ge d
ebt
per
of i
ndeb
ted
Ave
rage
deb
tA
vera
ge d
ebt
per
hous
ehol
ds (
%)
per
hous
ehol
din
debt
ed h
ouse
hold
hous
ehol
dspe
r ho
useh
old
inde
bted
hou
seho
ld
Stat
es/I
ndia
1983
1987
–88
1983
1987
–88
1983
1987
–88
1983
1987
–88
1983
1987
–88
1983
1987
–88
12
34
5 6
7 8
910
1112
13O
riss
a40
.75
36.1
341
516
886
1435
40.0
835
.432
450
380
814
19A
ll In
dia
51.0
539
.477
476
915
1619
5250
.42
39.1
806
787
1598
2014
Sour
ce: R
ural
Lab
our
Enqu
iry,
1987
–88,
Rep
ort
on I
ndeb
tedn
ess A
mon
g R
ural
Lab
our
Hou
seho
lds.
at PENNSYLVANIA STATE UNIV on February 19, 2016sar.sagepub.comDownloaded from

94 South Asia Research Vol. 27 (1)
during 1983 and 36.10 per cent during 1987–88. Thus, roughly 40 per cent of therural labour households were indebted during 1983 compared to about 35 per centin 1987–88.
Table 9 also shows that the average amount of debt in the case of rural labourhouseholds was Rs. 324 in 1983, increasing to Rs. 503 for the period 1987–88. Theaverage debt per indebted household was Rs. 808 in 1983, and increased to Rs. 1419in 1987–88. In agricultural labour households the average amount of debt per house-hold during 1983 was Rs. 341, which rose to Rs. 518 by 1987–88. The average amountof debt per indebted household was Rs. 888 in 1983, and Rs. 1435 during 1987–88by contrast (Table 9). Thus there was an increase of average amount of debt perhousehold and per indebted household during the period 1983–87 for both agri-cultural labour households and rural labour households. In this situation, the actualnet earnings of all these households will be lower.
Table 10 indicates that the incidence of indebtedness among the Scheduled Casterural labour households was 40.70 per cent during 1983, declining slightly to 38.70per cent during 1987–88. Similarly for Scheduled Tribes, it was 29.50 per cent in1983, declining to 24.10 per cent in 1987–88.
Table 10 Extent of indebtedness among rural labour households by caste
Percentage of Indebted Households
Schedule Caste Scheduled Tribe All Classes
States/India 1983 1987–88 1983 1987–88 1983 1987–88
Orissa 40.7 38.7 29.5 24.1 40.08 35.4All India 55.89 43.3 34.14 30 50.42 39.1
Source: Rural Labour Enquiry 1987–88 Report on Indebtedness Among Rural Labour Households,115.
Table 11(a) shows that the average hereditary loan of indebted agriculturallabour households in Orissa was Rs. 44 during 1983 but had increased to Rs. 64 by1987–88. Similarly the contracted loan of indebted agricultural households wasRs. 792 during 1983 and increased to Rs. 1371 by 1987–88. Thus, of the averagetotal loan among indebted agricultural labour households of Rs. 1435 in 1987–88,only Rs. 64 was a hereditary loan and the rest (Rs. 1371) was a contracted loan ofwhich Rs. 211 was in kind and Rs. 127 partly in cash and partly in kind. The averageloan per agricultural labour household was Rs. 341 in 1983, and increased to Rs. 518during 1987–88.
Similarly, Table 11(b) shows the average amount of debt among rural labour house-holds by nature of loan and average loan per household. Of the average total loanamong indebted rural labour households of Rs. 1419 in 1987–88, only Rs. 75 was ahereditary loan and the rest (Rs. 1344) was a contracted loan, of which Rs. 216 wasin kind and Rs. 141 partly in cash and partly in kind. The average loan per rurallabour household was Rs. 324 in 1983, and increased to Rs. 503 during 1987–88.
at PENNSYLVANIA STATE UNIV on February 19, 2016sar.sagepub.comDownloaded from

Mahapatra: Livelihood Pattern of Agricultural Labour 95
Tabl
e 11
(a)
Ave
rage
am
ount
of
debt
am
ong
agri
cult
ural
labo
ur h
ouse
hold
s by
nat
ure
of lo
an a
nd a
vera
ge lo
an p
er h
ouse
hold
s (R
s.)
4+6
+8 5
+7+9
10+2
11+
3
Stat
es/I
ndia
1983
1987
–88
1983
1987
–88
1983
1987
–88
1983
1987
–88
1983
1987
–88
1983
1987
–88
1983
1987
–88
12
34
56
78
910
1112
1314
15O
riss
a44
6458
310
3317
721
132
127
792
1371
836
1435
341
518
All
Indi
a41
102
921
1346
491
261
6324
314
7518
5015
1619
5277
476
9
Sour
ce: R
ural
Lab
our
Enqu
iry
1987
–88,
Rep
ort
on I
ndeb
tedn
ess A
mon
g R
ural
Hou
seho
lds,
118.
Her
edit
ary
loan
(ind
ebte
dho
useh
olds
)in
cas
hin
kin
d
Part
ly in
cash
& p
artl
y in
kind
Ave
rage
loan
(her
edit
ary
and
cont
ract
ed)
per
inde
bted
hous
ehol
dA
vera
ge lo
an p
erho
useh
old
(all
hous
ehol
ds)
Con
trac
ted
Loan
(In
debt
ed H
ouse
hold
s)
Tota
l
at PENNSYLVANIA STATE UNIV on February 19, 2016sar.sagepub.comDownloaded from

96 South Asia Research Vol. 27 (1)
Tabl
e 11
(b)
Ave
rage
am
ount
of
debt
am
ong
rura
l lab
our
hous
ehol
ds b
y na
ture
of
loan
and
ave
rage
loan
per
hou
seho
lds
(Rs.
)
Stat
es/I
ndia
1983
1987
–88
1983
1987
–88
1983
1987
–88
1983
1987
–88
1983
1987
–88
1983
1987
–88
1983
1987
–88
12
34
56
78
910
1112
1314
15O
riss
a41
7556
698
716
721
634
141
767
1344
808
1419
324
503
all
indi
a50
101
103
1406
448
286
6122
115
4919
1315
9820
1480
678
7
Sour
ce: R
ural
Lab
our
Enqu
iry
1987
–88,
Rep
ort
on I
ndeb
tedn
ess A
mon
g R
ural
Lab
our
Hou
seho
lds,
121.
Her
edit
ary
loan
(ind
ebte
dho
useh
olds
)in
cas
hin
kin
d
Part
ly in
cas
han
d pa
rtly
in k
ind
Ave
rage
loan
per
(her
edit
ary
and
cont
ract
ed)
per
inde
bted
hous
ehol
d
Ave
rage
loan
per
hous
ehol
d(a
ll ho
useh
olds
)
Con
trac
ted
Loan
(In
debt
ed H
ouse
hold
s)
Tota
l
at PENNSYLVANIA STATE UNIV on February 19, 2016sar.sagepub.comDownloaded from

Mahapatra: Livelihood Pattern of Agricultural Labour 97
Thus in agricultural labour households (Table 11a) and rural labour households(Table 11b) the situation is quite similar and points to increases in indebtedness.
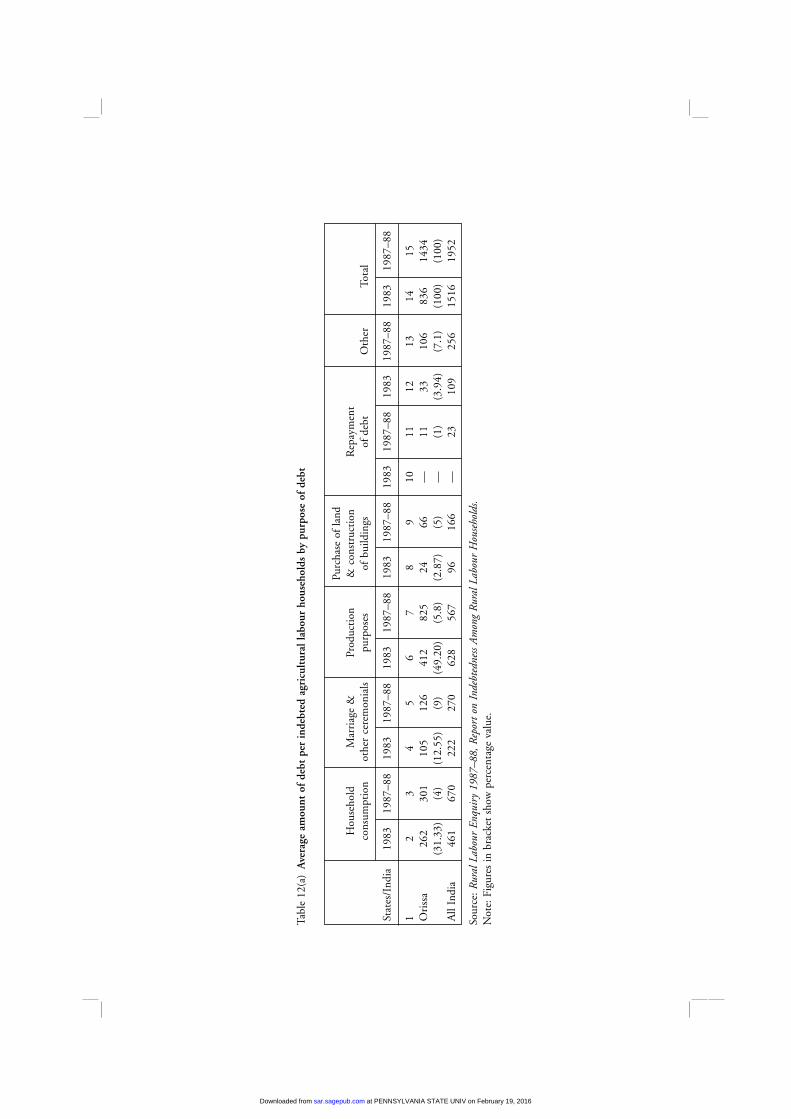
Next, Table 12(a) shows the average amount of debt per indebted agriculturallabour household and Table 12(b) rural labour households by purpose of debt separ-ately. In Table 12(a), the total debt of agricultural labour households is Rs. 836 during1983. Consumption loan constitutes Rs. 262 (31.33 per cent), loans for marriageand other ceremonial purposes constitute Rs. 105 (12.55 per cent); for productivepurposes it was Rs. 412 (49.28 per cent), for the purchase of land and constructionof buildings it was Rs. 24 (2.87 per cent). For repayment of old debts, the data are notavailable. For other purposes it was Rs. 33 (3.94 per cent). During the 1987–88 periodthe total amount of debt increased from Rs. 836 to Rs. 1434. Thus, Table 12(a)shows that agricultural labour households borrowed most for productive purposesfollowed by consumption purposes, then marriage and other ceremonial purposesduring the period 1983–87. In the case of rural labour households the situation issimilar (Table 12[b]).
We now move on to consider the average amount of debt per indebted agricultural labour household (Table 13[a]) and rural labour household (Table 13[b]) bysource of debt, for 1983 and 1987–88 respectively. The source-wise distribution ofloan raised by agricultural and rural labour households during the years 1983 and1987–88 for Orissa shows that the institutional financing of debt through thegovernment, Co-operative Societies and banks is gaining in popularity compared toinformal sources of loans such as moneylenders, shopkeepers, friends, relatives andothers. In both cases, banks are the largest source of loans, followed by Co-operativeSocieties, then the government (among formal sources) during 1987–88. For informalborrowing, the village moneylender remains the largest source, followed by friends,relatives and then shopkeepers.
Concluding Thoughts
The evidence provided above relating to rural labour households and agriculturallabour households in Orissa clearly shows that in the case of both male and femalelabour there has been a decline in employment over the years. Further, there hasalso been a decline in the average number of earning members per household. Onthe other hand, average amounts of debt per indebted household during the period1983–87 for both agricultural and rural labour households have increased. The actualearnings of all these households will therefore have been lower. Clearly, both rurallabour households and agricultural labour households in the state are characterisedby declining earning, low income, low consumption and high debt. It is, however,shown that the incidence of indebtedness among the Scheduled Caste rural labourhouseholds was 40.70 per cent during 1983, and declined to 38.70 per cent during1987–88. Similarly, in case of Scheduled Tribes it was 29.50 per cent in 1983, decliningto 24.10 per cent in 1987–88. This means that not all rural households in Orissa areindebted, but those which are would face growing difficulties for their livelihood.
at PENNSYLVANIA STATE UNIV on February 19, 2016sar.sagepub.comDownloaded from
98 South Asia Research Vol. 27 (1)
Tabl
e 12
(a)
Ave
rage
am
ount
of
debt
per
ind
ebte
d ag
ricu
ltur
al la
bour
hou
seho
lds
by p
urpo
se o
f de
bt
Purc
hase
of
land
Hou
seho
ldM
arri
age
&Pr
oduc
tion
& c
onst
ruct
ion
Rep
aym
ent
cons
umpt
ion
othe
r ce
rem
onia
lspu
rpos
esof
bui
ldin
gsof
deb
tO
ther
Tota
l
Stat
es/I
ndia
1983
1987
–88
1983
1987
–88
1983
1987
–88
1983
1987
–88
1983
1987
–88
1983
1987
–88
1983
1987
–88
12
34
56
78
910
1112
1314
15O
riss
a26
230
110
512
641
282
524
66—
1133
106
836
1434
(31.
33)
(4)
(12.
55)
(9)
(49.
20)
(5.8
)(2
.87)
(5)
—(1
)(3
.94)
(7.1
)(1
00)
(100
)A
ll In
dia
461
670
222
270
628
567
9616
6—
2310
925
615
1619
52
Sour
ce: R
ural
Lab
our
Enqu
iry
1987
–88,
Rep
ort
on I
ndeb
tedn
ess A
mon
g R
ural
Lab
our
Hou
seho
lds.
Not
e: F
igur
es in
bra
cket
sho
w p
erce
ntag
e va
lue.
at PENNSYLVANIA STATE UNIV on February 19, 2016sar.sagepub.comDownloaded from

Mahapatra: Livelihood Pattern of Agricultural Labour 99
Tabl
e 12
(b)
Ave
rage
am
ount
of
debt
per
inde
bted
rur
al la
bour
hou
seho
lds
by p
urpo
se o
f de
bt
Purc
hase
of
land
Hou
seho
ldM
arri
age
&Pr
oduc
tion
& c
onst
ruct
ion
Rep
aym
ent
cons
umpt
ion
othe
r ce
rem
onia
lspu
rpos
esof
bui
ldin
gsof
deb
t O
ther
Tot
al
Stat
es/I
ndia
1983
1987
–88
1983
1987
–88
1983
1987
–88
1983
1987
–88
1983
1987
–88
1983
1987
–88
1983
1987
–88
12
34
56
78
910
1112
1314
15O
riss
a25
729
997
127
396
812
2558
—7
3311
380
814
18A
ll In
dia
512
677
248
311
610
541
121
223
—22
107
240
1598
204
Sour
ce: R
ural
Lab
our
Enqu
iry
1987
–88,
Rep
ort
on I
ndeb
tedn
ess A
mon
g R
ural
Lab
our
Hou
seho
lds.
at PENNSYLVANIA STATE UNIV on February 19, 2016sar.sagepub.comDownloaded from

100 South Asia Research Vol. 27 (1)
Tab
le 1
3(a)
Ave
rage
am
ount
of
debt
per
inde
bted
agr
icul
tura
l lab
our
hous
ehol
ds b
y so
urce
of
debt
(R
s.)
Co-
oper
ativ
eM
oney
Frie
nds
and
Stat
es/
Gov
ernm
ent
soci
etie
sB
anks
Em
ploy
ers
lend
ers
Shop
keep
ers
rela
tive
sO
ther
sTo
tal
Indi
a19
8319
87–8
819
8319
87–8
819
8319
87–8
819
8319
87–8
8 1
983
1987
–88
198
319
87–8
8 1
983
1987
–88
198
319
87–8
819
8319
87–8
8
Ori
ssa
3711
531
624
917
968
430
5710
011
721
5153
111
102
5183
614
34A
ll In
dia
4470
119
195
505
410
211
254
282
429
7015
116
426
312
117
515
16 1
952
Sour
ce: R
ural
Lab
our
Enqu
iry
1987
–88,
Rep
ort
on I
ndeb
tedn
ess A
mon
g R
ural
Lab
our
Hou
seho
lds.
at PENNSYLVANIA STATE UNIV on February 19, 2016sar.sagepub.comDownloaded from

Mahapatra: Livelihood Pattern of Agricultural Labour 101
Tab
le 1
3(b)
Ave
rage
am
ount
of
debt
per
inde
bted
rur
al la
bour
hou
seho
lds
by s
ourc
e of
deb
t (R
s.)
Co-
oper
ativ
eM
oney
Frie
nds
Stat
es/
Gov
ernm
ent
soci
etie
sB
anks
Em
ploy
ers
lend
ers
Shop
keep
ers
and
rela
tive
sO
ther
s T
otal
Indi
a19
8319
87–8
819
8319
87–8
819
8319
87–8
819
8319
87–8
819
83 1
987–
8819
8319
87–8
819
8319
87–8
819
8319
87–8
819
8319
87–8
8
Ori
ssa
3412
229
624
517
966
631
213
9813
020
4851
100
9853
808
1419
All
Indi
a65
7316
319
044
811
919
524
634
043
684
186
186
289
117
175
1598
2014
Sour
ce: R
ural
Lab
our
Enqu
iry
1987
–88,
Rep
ort
on I
ndeb
tedn
ess A
mon
g R
ural
Lab
our
Hou
seho
lds.
at PENNSYLVANIA STATE UNIV on February 19, 2016sar.sagepub.comDownloaded from

102 South Asia Research Vol. 27 (1)
Based on the present study, some brief suggestions can be made as part of policyinitiatives for rural labour households and agricultural labour households. In a statelike Orissa, the low demand for labour evidently forces many workers to migrate toother parts of the country in order to secure livelihoods. In order to reduce the flowof migration and generate more local employment and income, local demand foragricultural labour needs to be enhanced, perhaps through improvement of irrigationfacilities and adoption of new technologies in dry areas.
Acknowledgements
An earlier version of this paper was presented at the 44th Annual Conference of the IndianSociety of Labour Economics, held at the Department of Economics, Guru Nanak Dev Univer-sity, Amritsar on 26–27 December 2002. I am grateful to the participants of the Conferencefor their valuable comments and suggestions. However, responsibility for mistakes, if any,rests with me.
Note
1 In 1865–66 occurred a famine of the most intense character, commonly known as ‘NaAnka Durbhikhya’, the greatest calamity in Orissa of the 19th century. Mortality in thethree districts of Cuttack, Puri and Baleshwar was roughly estimated at 10 lakhs out of atotal population of 37 lakhs.
References
ActionAid (2002) Orissa Drought (2000&2002): A People’s Report. 30 November.Bardhan, Pranab and Rudra, Ashok (1978) ‘Interlinkage of Land, Labour and Credit Relations:
An Analysis of Village Survey Data in East India’. Economic and Political Weekly, 13(6&7):367–84.
Bardhan, Pranab and Rudra, Ashok (1980a) ‘Types of Labour Attachment in Agriculture.Results of a Survey in West Bengal, 1979’. Economic and Political Weekly, 30 August,15(35): 1477–84.
Bardhan, Pranab and Rudra, Ashok (1980b) ‘Labour Employment and Wages in Agriculture.Results of a Survey in West Bengal, 1979’. Economic and Political Weekly, 5–8 November,15(45&46): 1943–9.
Bharadwaj, K. (1974) Production Conditions in Indian Agriculture. Cambridge: CambridgeUniversity Press.
Binswanger, H. P. and Rosenzweig, M. R. (eds.) (1984) Contractual Arrangements, Employmentand Wages in Rural Labour Markets in Asia. New Haven: Yale University Press.
Chambers, R. and Conway, G. (1992) Sustainable Rural Livelihoods: Practical Concepts for the21st Century. Brighton: Institute of Development Studies. [IDS Discussion Paper 296].
Government of India (1878) Report of the Indian Famine Commission. Calcutta: Office of theSuperintendent of Government Printing.
Government of India (1963–64, 1964–65, 1974–75, 1977–78, 1983 and 1987–88) RuralLabour Enquiry. Chandigarh: Labour Bureau, Ministry of Labour.
Government of India (1983) Rural Labour in India: a Compendium of Basic Facts. Shimla andChandigarh: Labour Bureau, Ministry of Labour.
Government of India (1983 and 1987–88) Rural Labour Enquiry, Report on Wages and Earningof Rural Labour Households. Chandigarh: Labour Bureau, Ministry of Labour.
at PENNSYLVANIA STATE UNIV on February 19, 2016sar.sagepub.comDownloaded from

Mahapatra: Livelihood Pattern of Agricultural Labour 103
Government of India (1983 and 1987–88) Rural Labour Enquiry, Report on Indebtedness AmongRural Labour Households. Chandigargh: Labour Bureau, Ministry of Labour.
Government of India (1987–88) Rural Labour Enquiry, Report on employment andUnemployment. Chandigarh: Labour Bureau, Ministry of Labour.
Government of India (1989) The 38th Round 1983, Report on the Third Quinquennial Surveyon employment and Unemployment. New Delhi: National Sample Survey Organisation.
Government of India (1990) The 43rd Round 1987–88. New Delhi: National Sample SurveyOrganisation.
Government of India (1990–91) Indian Labour Year Book. Shimla and Chandigarh: LabourBureau, Ministry of Labour.
Government of Orissa (1984) Economic Survey of Orissa, 1983–84. Bhubaneshwar: Bureau ofStatistics and Economics.
Government of Orissa (1992) Gazetteer of India 1992: Orissa State. Cuttack: Orissa Govern-ment Press.
Government of Orissa (2001) Economic Survey of Orissa, 2000–01. Bhubaneshwar: Bureau ofStatistics and Economics.
Government of Orissa (2005) Economic Survey of Orissa, 2004–05. Bhubaneshwar: Bureau ofStatistics and Economics.
Krishnamurthy, S. (1988) ‘Wage Differentials in Agriculture by Caste, Sex and Operations’.Economic and Political Weekly, 23(50): 2651–7.
Lipton, M. (1983) Labour and Poverty. Washington: World Bank. [World Bank Staff WorkingArticle, 616].
Lipton, M. (1994) Growing Points in Poverty Research: Labour Issues. Geneva: IILS. [Inter-national Institute for Labour Studies. Discussion Paper, 66].
Pleatteau, J. Ph., Murickan, J., and Delbar, E. (1981) Interlinkage of Credit, Labour and Market-ing Relations in Traditional Marine Fishing: The Case of Purakkad (Kerala). Delhi: Hindustan.
Rao, J. Mohan (1988) ‘Fragmented Rural Labour Market’. The Journal of Peasant Studies,( January) 15(2): 238–57.
Ravallion, Martin (1982) ‘Agricultural Wages in Bangladesh Before and After the 1974 Famine’.Bangladesh Development Studies, 10: 75–90.
Sajjad, Zohir (1989) ‘Wage and Labour Market in Agriculture. Some Comments’. BangladeshDevelopment Studies, 17(4): 83–91.
Sarap, Kailas (1989) ‘Trends in Wage Rates and Living Conditions of Agricultural Labour inOrissa’. Man and Development, (September) 11(3): 113–23.
Sarap, Kailas (1991a) ‘Changing Contractual Arrangement in Agricultural Labour Market.Evidence from Orissa’. Economic and Political Weekly, 28 December, 26(52): A167–76.
Sarap, Kailas (1991b) Interlinked Agrarian Markets in Rural India. New Delhi: Sage.Sen, A. K. (1973) ‘Dimensions of Unemployment in India’. Convocation Address. Calcutta:
Indian Statistical Institute.Sen, A. K. (1981) ‘Ingredients of Famine Analysis: Availability & Entitlements’. Quarterly
Journal of Economics, (August) 96(3): 433–64.
Sushanta Kumar Mahapatra is a Research Scholar at the Madras Institute of Devel-opment Studies (MIDS).Address: Madras Institute of Development Studies, No. 79, Second Main Road,Gandhi Nagar Adyar, Chennai 600020, Tamil Nadu, India. [email: [email protected]]
at PENNSYLVANIA STATE UNIV on February 19, 2016sar.sagepub.comDownloaded from