IMPACT OF LIVELIHOOD STRATEGIES ON HOUSEHOLD ...
19
Urassa, J.K. & Lyatuu, P.M. (2019). Impact of Livelihood Strategies on Household Wellbeing in Land Shortage Villages of Mvomero District, Tanzania. 95 East African Journal of Social and Applied Sciences [EAJ-SAS] Vol. 1, Issue 2, 2019 IMPACT OF LIVELIHOOD STRATEGIES ON HOUSEHOLD WELLBEING IN LAND SHORTAGE VILLAGES OF MVOMERO DISTRICT, TANZANIA Patricia M. Lyatuu Department of Gender Studies, The Mwalimu Nyerere Memorial Academy (MNMA), Email; [email protected] , Justin K. Urassa Development Studies Institute, Sokoine University of Agriculture, ABSTRACT This paper examines a household’s wellbeing status (HWBS) and its relationship wi th Livelihood Strategies (LS) and demographic characteristics (DC) in the land shortage villages of Mvomero District, Tanzania. Through a cross-sectional research design, a structured questionnaire was administered to 267 randomly selected households. The findings show that 95.3% of households were unwell expressly in Mgeta villages; only 6.7% formed a well-off category. Unlike the hypothesis, a combination of on and off-farm LS confirmed to have a positive significant influence (p < 0.05) on the likelihood for a household to be well-off, whilst sole farming demonstrated a negative influence. Likewise, unlike the hypothesis, location of a household and sex of its head verified to have a negative influence (p < 0.05) on the likelihood for a household to be well-off. It is concluded that the majority of households are not well and only a combination of on and off-farm LS enhance wellbeing except for female headed households and those located within shrunken arable land areas. Tanzania’s Development agencies are advised to encourage LS diversification, relocation to land abundant area while paying special attention to female headed households. Key terms: Arable land, diversification, livelihood strategies, household Well-Being, farming Paper type: Research paper Type of Review: Peer Review 1.0 INTRODUCTION The concept of wellbeing is currently used in defining people’s welfare encompassing objective measures of achievement and as views of concerned individuals (Chambers et al., 1997; Camfield et al., 2010 Urassa, 2010). Consequently, Guardiola et al. (2013) suggest that effective poverty interventions should focus on how the poor conceptualize poverty and how they struggle to attain their Well-Being. Effective focus of poverty interventions is critical because worldwide, 1.4 billion people still live on less than USD 1. 25 a day and about 1 billion people are suffering from hunger (IFAD, 2012). According to IFAD (2012) the poorest rely on farming meaning that access to land is critical for their wellbeing. Globally, factors such as need for bulk arable land for production of food and bio-fuels, conservation policies and high population growth have contributed to reduce access to arable land among the rural people (Robertson and Pinstrup, East African Journal of Social and Applied Sciences (EAJ-SAS) Vol.1, No.2 Publication Date: December 30, 2019 ISSN: 0856-9681 The current issue and full text archive of this journal is available at: http//www.mocu.ac.tz Cite this article as: Urassa, J. K. & Lyatuu, P. M. (2019). Impact of Livelihood Strategies on Household Wellbeing in Land Shortage Villages of Mvomero District, Tanzania, East African Journal of Social and Applied Sciences, 1(2), 95- 113.
-
Upload
khangminh22 -
Category
Documents
-
view
1 -
download
0
Transcript of IMPACT OF LIVELIHOOD STRATEGIES ON HOUSEHOLD ...

Urassa, J.K. & Lyatuu, P.M. (2019). Impact of Livelihood Strategies on Household Wellbeing in Land Shortage Villages of Mvomero District, Tanzania.
95
East African Journal of Social and Applied Sciences [EAJ-SAS] Vol. 1, Issue 2, 2019
IMPACT OF LIVELIHOOD STRATEGIES ON HOUSEHOLD WELLBEING IN LAND SHORTAGE VILLAGES OF MVOMERO DISTRICT, TANZANIA
Patricia M. Lyatuu Department of Gender Studies,
The Mwalimu Nyerere Memorial Academy (MNMA), Email; [email protected],
Justin K. Urassa
Development Studies Institute, Sokoine University of Agriculture,
ABSTRACT This paper examines a household’s wellbeing status (HWBS) and its relationship with Livelihood Strategies (LS) and demographic characteristics (DC) in the land shortage villages of Mvomero District, Tanzania. Through a cross-sectional research design, a structured questionnaire was administered to 267 randomly selected households. The findings show that 95.3% of households were unwell expressly in Mgeta villages; only 6.7% formed a well-off category. Unlike the hypothesis, a combination of on and off-farm LS confirmed to have a positive significant influence (p < 0.05) on the likelihood for a household to be well-off, whilst sole farming demonstrated a negative influence. Likewise, unlike the hypothesis, location of a household and sex of its head verified to have a negative influence (p < 0.05) on the likelihood for a household to be well-off. It is concluded that the majority of households are not well and only a combination of on and off-farm LS enhance wellbeing except for female headed households and those located within shrunken arable land areas. Tanzania’s Development agencies are advised to encourage LS diversification, relocation to land abundant area while paying special attention to female headed households. Key terms: Arable land, diversification, livelihood strategies, household Well-Being, farming Paper type: Research paper Type of Review: Peer Review
1.0 INTRODUCTION
The concept of wellbeing is currently used in defining people’s welfare encompassing objective measures of achievement
and as views of concerned individuals (Chambers et al., 1997; Camfield et al., 2010 Urassa, 2010). Consequently, Guardiola
et al. (2013) suggest that effective poverty interventions should focus on how the poor conceptualize poverty and how
they struggle to attain their Well-Being. Effective focus of poverty interventions is critical because worldwide, 1.4 billion
people still live on less than USD 1. 25 a day and about 1 billion people are suffering from hunger (IFAD, 2012).
According to IFAD (2012) the poorest rely on farming meaning that access to land is critical for their wellbeing.
Globally, factors such as need for bulk arable land for production of food and bio-fuels, conservation policies and high
population growth have contributed to reduce access to arable land among the rural people (Robertson and Pinstrup,
East African Journal of Social and Applied Sciences (EAJ-SAS) Vol.1, No.2 Publication Date: December 30, 2019
ISSN: 0856-9681
The current issue and full text archive of this journal is available at: http//www.mocu.ac.tz
Cite this article as: Urassa, J. K. & Lyatuu, P. M. (2019). Impact of Livelihood Strategies on Household Wellbeing in
Land Shortage Villages of Mvomero District, Tanzania, East African Journal of Social and Applied Sciences, 1(2), 95-113.

Urassa, J.K. & Lyatuu, P.M. (2019). Impact of Livelihood Strategies on Household Wellbeing in Land Shortage Villages of Mvomero District, Tanzania.
96
East African Journal of Social and Applied Sciences [EAJ-SAS] Vol. 1, Issue 2, 2019
2010; Smith et al., 2013). High population pressure on arable land among villages bordering Tanzanian’s nature reserves is
a major issue (Kusiluka et al., 2011; Mustalahti et al., 2012; Nyenza et al., 2013). Nevertheless, 90% of the inhabitants are
employed in farming (Lopa et al., 2012). In addition, other factors responsible for critical land scarcity in these villages are
(a) the eviction of farmers from their former farms to give way for the establishment of reserves and (b) the farmer’s
preference of favourable weather for most crops and guaranteed water sources in Uluguru catchments. The sustainability
of the reserve however, is uncertain because the bordering farms have shrunken hence, farmers are likely to encroach and
degrade the reserve especially if the undertaken livelihood strategies do not ensure their wellbeing.
Consequently, this might negatively affect the supply of water to more than 4 million people and the general ecosystem
(URT, 2013; Lopa et al., 2012). This is because the economic activities through which studied households supplement farm
income are linked to land and forest resources. Such activities include weaving, charcoal making, sell of fuel wood, brick
making and carpentry (Lyatuu and Urassa, 2015). In that view when these people do not get satisfactory resources from
own land the immediate source remain to be the adjacent reserves. These people therefore, in their efforts to meet daily
needs or attain desired wellbeing may be forced to derive required resources from the reserves at any cost including
flouting conservation restrictions. The wellbeing of the dwellers in villages adjacent to the reserve is therefore very
important if the reserve is to remain sustainable (Naylor, 2011). Tanzania’s National Land Policy of 1997 and the Land Act
of 1999 have together been facilitating relocation from land scarce to areas of low population density without success
(Lugoe, 2010). Despite the government efforts to encourage relocation, farmers in villages bordering Uluguru mountains
are expanding farms through seasonal migration, trekking long distances and engaging in off-farm LS to cope with arable
land shortage and complement the declining farm income (Lopa et al., 2010). However, households lack labour skills,
savings and credits necessary for engaging in high paying off-farm livelihoods strategies (Lyatuu and Urassa, 2015). This
raises the query on whether the responses of households to land scarcity enable them to attainment wellbeing.
Further to the above, recent studies on rural livelihoods in Tanzania have reported that as a result of eviction from the
Uluguru productive lands, farmers were unable to reorganize their livelihood strategies (Kusiluka et al., 2011; Augustino
et al., 2013; Nyenza et al., 2013). Moreover, Augustino et al. found that people were migrating and diversifying livelihoods
to cope with the shortage of arable land. None of these studies however, has explained the link between the opted LS and
household’s wellbeing in land scarce areas. However, such information is necessary to inform the focus of poverty
interventions in the land scarce areas. Moreover, other studies elsewhere (Barrett et al., 2001; Urassa, 2010) have noted that
household socio-demographic characteristics (HDC) such as a household head’s age, sex and marital status as well as its
location have significant influence on its wellbeing. In this view, it was important to critically analyse the link between
pursued LS, HDC and WBS. This paper addresses the above-mentioned information gap by exploring the influence of LS
and HDC on HWB in land scarce areas. Broadly, the paper answers the question; to what extent do households’ responses
to land scarcity facilitate the attainment of wellbeing? Specifically, the paper addresses the following questions; how do
local people conceptualize their wellbeing? What is the status of household wellbeing? What is the influence of pursued
LS and HDC on wellbeing? To answer the last question the paper tests the hypothesis that the odds of attaining wellbeing
were the same among households venturing in different livelihood strategies.
1.1 Conceptualization of the Study
The conceptualization of this study was informed by the sustainable livelihood framework (SLF) and empirical literature.
The sustainable rural livelihoods framework as outlined by Scoones (1998: 3) suggests that, any analysis of sustainable
livelihoods should ask the following question:
Given a particular context (of policy setting, politics, history, agro-ecology and socio-economic conditions), what
combination of livelihood resources (different types of ‘capital’) result in the ability to follow what combination of livelihood

Urassa, J.K. & Lyatuu, P.M. (2019). Impact of Livelihood Strategies on Household Wellbeing in Land Shortage Villages of Mvomero District, Tanzania.
97
East African Journal of Social and Applied Sciences [EAJ-SAS] Vol. 1, Issue 2, 2019
strategies (on farm, off-farm and migration) with what outcomes (including risk reduction, higher income, food security,
environmental conservations and total wellbeing)?
The question depicts that any livelihood analysis intending to inform rural poverty interventions should focus on the link
between livelihood assets, livelihood strategies and livelihood outcomes. Such an analysis leads to an appreciation of any
strengths/ opportunities/ weaknesses/threats attached to the pursued LS. That kind of understanding may guide
appropriate poverty interventions aiming at either promoting positive or discouraging negative aspects of LS for
enhancing attainment of people’s priorities (Ashley and Carney, 1999).
The literature further show that a household’s socio-demographic characteristics such as educational attainment,
dependency ratio, geographical location, sex and marital status of the household head have an influence on attainment of
its Wellbeing(Barrett et al., 2001; Urassa, 2010). For instance, Urassa (2010) point out that, higher educational attainment
enhances attainment of Wellbeing because by using the attained skills and knowledge household members may engage in
high paying LS thus, obtain reasonable income to improve its living standard. The geographic location has an important
bearing on access to the key assets for engaging in high paying LS and ultimately attainment of livelihood goals (Urassa,
2010). Generally, households located in areas where population density is reasonably normal (51 persons per square
Kilometers in Tanzania) and arable land is abundant are expected to be land secured. Using land as a collateral/rental or
commodity such as households may secure financial and social capital useful for realising its livelihood goals.
Literature on livelihoods also point out the existence of a relationship between sex and marital status of a household’s
head and its attainment of wellbeing (Ellis and Biggs, 2001; Ellis, 2006; Urassa, 2010; Howe et al., 2012). According to
Urassa and Howe et al. women in Sub-Saharan Africa including Tanzania are deprived from socio-political participation,
and economic opportunities. In that view the majority of female headed households (FHHs) are disadvantaged in terms
of livelihood resources, information and technology necessary for attainment of wellbeing (Godfray et al., 2010). Married
women however, may gain access to resources through their husbands. In addition, literature (Ellis and Freeman 2004;
Barrett et al., 2001) also point out that, households with high dependency ratio face difficulties in attaining Wellbeing as
they use most of their earnings in care and development of their large sized dependants.
Based on the framing of the SLF and the literature on the influence of household socio-demographic characteristics on its
wellbeing, the study conceptualized that the type of a livelihood strategy undertaken by a household depends on its
resource endowment and it can influence its attainment of desired wellbeing. Back to the context of arable land scarcity
among farmers; it was conceptualized that farm households are less likely to attain desired levels of wellbeing because
they are not land secured. Those households located within highly shrunken arable land such as Mgeta and those coping
with land scarcity through venturing in exclusive off-farm LS were expected to lag below the well-off line because they
lack land, a base resource for capital and services necessary for high paying off-farm LS. Moreover, households
combining on and off-farm LS were expected to be well-off because they complement farm income with income from
non-farm LS. Furthermore, female headed households were expected to be less well-off because they are deprived from
access and control of social, political and economic resources. Moreover, households with high dependency ratios were
expected to be less well-off compared to their counterparts because of their need to care and invest in their extra human
resource.
1.2 Description of the Study Area
The study was conducted in Mlali and Mgeta Divisions of Mvomero District, Morogoro Region (Figure 1). The District is
located between longitudes 370 10′ and 380 31′E and Latitudes 50 50′ and 700 4′ S with Uluguru Mountains rising at their
highest parts to more than 2600 meters above sea level. Annual rainfall ranges between 600mm and 2000mm being lowest
at the foothill and highest between 400m to 2000m altitude above sea level. The temperature in the District ranges from 18

Urassa, J.K. & Lyatuu, P.M. (2019). Impact of Livelihood Strategies on Household Wellbeing in Land Shortage Villages of Mvomero District, Tanzania.
98
East African Journal of Social and Applied Sciences [EAJ-SAS] Vol. 1, Issue 2, 2019
– 30 degrees Centigrade (Mvomero District Office, 2011). Such characteristics of weather attract many farmers hence,
more than 150,000 people live on the slopes of the Uluguru Mountains and have their farms up to the nature reserve
boundary (Lopa et al., 2012). These farmers however, engage in seasonal migration to gain more land, they also diversify
LS to complement farm income (Lyatuu and Urassa, 2015). In that view, it was considered that the study could offer
appropriate results on the influence of LS on a household’s Wellbeingin land scarce areas and with a possibility for results
being applicable to other rural areas of Tanzania with similar context.
1.3 Study Design and Sampling Procedure
The study adopted a cross-sectional research design whereby qualitative and quantitative data were collected once from
each village. This design was appropriate because it allows collection of data at a single point in a time, while enabling
estimation of the prevalence of outcome of interest (household wellbeing in this case) as samples are always taken from
the whole population (Kothari, 2004). In addition, this design is cost effective and takes little time while assuring
appropriate quality of data. Selection of respondents employed a multi-stage sampling procedure. First, two Divisions of
Mgeta and Mlali were purposely selected because they both face arable land scarcity as reported by Kusiluka et al., 2011).
Second, 4 villages from each Division and thirty-four households from each village were randomly selected because they
equally face land scarcity. The sample size of 34 cases per village is supported by Bailey (1998) and Kimia (2008) who
argued that regardless of the population size, the minimum sample or sub-sample of 30 cases is appropriate for a research
in which statistical data analysis is to be done. In addition, Kothari (2004) point out that the sampling error can be
reduced by increasing the sample size. In that view, 34 cases were expected to provide appropriate statistical analysis
while minimizing sample errors such as lost or incorrectly filled questionnaires. Furthermore, 8-12 participants from each
village were randomly selected to participate in focus groups discussions (FGD) for effective participation and good
quality of data as advised by Masadeh (2012). The selection of FGD participants was based on gender and age
representation to allow representation of views and opinions of males and female members from youths (18-35 years age),
adults (36 – 55 years old) and the elderly (above 55 years of age).
1.4 Data Collection
Both quantitative and qualitative data were collected in order to allow the two methods to complement each other
because each method has its strength and weakness (Tashakkori and Teddlie, 2010). Quantitative data on HWB indicators
performance, HDC and types of LS undertaken by households were collected from 267 households using a structured
questionnaire. Qualitative data on the conceptualization of a household’s Well-Being, and challenges related to the
pursued LS were collected through focus group discussions (FGDs) from each village using a checklist of items to guide
the discussions.
1.5 Measurement of Variables
In this study the independent variables were LS and HDC (dummies of; on-farm LS, off-farm LS, and a combination of on
and off-farm LS, sex of household head, location; 1= Mlali, 0 = Mgeta and number of dependants). The dependent variable
was HWBS categorised into; (1) not well (2) moderately well-off and (3) well-off. A household’s Wellbeingwas measured
using six indicators as conceptualized in the study area and conforming to the Tanzania Rural Development Policy (URT,
2001). The selected indicators include; (1) extent of household’s food self-provisioning defined as a household’s ability to
meet its annual food needs from self-production and receipts in kind either from labour transactions or claims (2)
household’s resilience ability defined as a household’s ability to overcome risks while maintaining its assets (3) possession
of sanitation facility defined as household’s possession and use of modern toilet i.e. the one with a minimum depth of six
feet, has pit lid, walled and roofed. The local toilet according to FGD participants and URT (2001) lack some of the
qualities of modern toilet (4) possession of a decent housing condition i.e. a house made of concrete or burnt brick walls,
corrugated iron sheet roof and cement floor (5) possession of durable assets such as water pump, milling machine,
television set, solar panels, motorbike, and car (6) possession of semi-durable assets such as a bicycle, mobile phone and
radio.

Urassa, J.K. & Lyatuu, P.M. (2019). Impact of Livelihood Strategies on Household Wellbeing in Land Shortage Villages of Mvomero District, Tanzania.
99
East African Journal of Social and Applied Sciences [EAJ-SAS] Vol. 1, Issue 2, 2019
1.6 Data Analysis
Quantitative data obtained through the structured questionnaire were analysed using the statistical package for social
sciences (SPSS) software. Descriptive statistics such as frequencies and percentages were determined to establish the
performance of household wellbeing status (HWBS) indicators and the general HWBS. In determining HWBS, the study
adopted the methods of constructing socio-economic status (SES) indices using data on household characteristics and
asset ownership. This method employs data of household’s assets such as durable and semi-durable goods to describe
household welfare instead of using household’s income or expenditure data (Kolenikov and Angeles, 2009; Howe et al.,
2012). The choice of the above method is based on the evidence that money metric measure is too narrow for defining a
household’s welfare and that the SES index is most likely to be consistent with the financial means (Vyas and
Kumaranayake, 2006). In addition, the index requires less data intensive which result in smaller measurement. The
method was appropriate for the current study because it uses household characteristics and asset ownership variables to
estimate a household’s welfare, the same variables are used to measure a household’s wellbeing in the study.
Wellbeing indices were constructed using the set of indicators presented under section 2.4. Since data on household
characteristics and asset ownership comprised multidimensional variables, Principal Component Analysis (PCA) was
employed to organize and reduce dimensionality of variables with a minimal loss of information in the total variation
explained (Vyas and Kumaranayake, 2006; Howe et al., 2010). Basically, the PCA created weights, standard deviations and
means for each variable. The outputs of PCA were two tables; the first table presented the means and standard deviations
while the second table presented eight weights/component scores for each variable (Appendix 1). According to Vyas and
Kumaranayake (2006) the first principal component for each variable is the measure of wealth. Following Vyas and
Kumaranayake, this paper considered the first principal component for each variable to be the weighted measures of
Well-Being. The obtained weights, means and standard deviations for each variable were substituted to Filmer and
Pritchett (2001)’s asset index formula to construct a Wellbeingindex score for each household. The employed asset index
formula is presented below:
Aj = f1 (a j1-a1) / (si) +<+ fn (ajn - an)/ (Sn) (Filmer and Pritchett, 2001; Howe et al., 2010).
Aj = where
Aj = Wellbeingindex for each household (j =1,<<., n)
fi = the weight for each Wellbeingindicator of a household (i =1,<<,n)
aji = the ith indicator of jth household (i ,j =1,<<,n)
ai = the mean of ith indicator of household (i =1,<<,n)
si = the standard deviation of ith Wellbeingindicator of a household (i =1,<,n)
The assessment of the relationship between livelihood strategies, selected demographic characteristics and household-
wellbeing followed two steps. First, households were categorised into three groups in order of; low - the not well or ailing
households, middle – moderately well-off household and high comprising the well-off households based on the
computed wellbeing index. The constructed household wellbeing index could be included as a continuous independent
variable in a regression model; however, the estimated coefficient would be hard to interpret. To address the problem of
interpreting estimates from the huge continuous indices, other studies have used cut-off points to differentiate
households into broad socio-economic (SES) categories (Montgomery, et al. 2000; Filmer & Pritchett 2001; Houweling, et
al., 2003). Generally, a variable with a positive factor score is associated with higher SES, and conversely a variable with a
negative factor score is associated with lower SES (Vyas & Kumaranayake, 2006). In view of the above fact, the paper
considers households with a positive wellbeing index to be well- off, and those scoring negative to be not well.

Urassa, J.K. & Lyatuu, P.M. (2019). Impact of Livelihood Strategies on Household Wellbeing in Land Shortage Villages of Mvomero District, Tanzania.
100
East African Journal of Social and Applied Sciences [EAJ-SAS] Vol. 1, Issue 2, 2019
The categorization of households into broad wellbeing categories in this paper employed visual binning procedure
available under the transform option of SPSS menu. The calculated households’ wellbeing indices ranged from -2 to 0.46.
The distribution of households within the indices dictated only two cut-off points (-1. and 0.1) beginning at -2.
Households were therefore, classified into three categories. The lower category comprised ailing households scoring from
-2 to -1(52.8%), the middle group consist moderately well-off households scored between -1 and 0.1 (40.4%) and the third
group encompassed the well-off households that scored 0.1 and above (6.7%). Second, a multinomial logistic regression
was employed to assess the influence of pursued livelihood strategies and its socio- demographic characteristics on the
likelihood for a household to be well-off. According to Pallant (2010) and Field (2013) multinomial logistic regression is
the appropriate model to predict categorical outcomes with more than two categories such as the dependent variable in
the current study. The model used is shown below:
P (y) = eα+ β1x1 + < βkxk k
1 + eα+ β1x1 + < βkxk (Agresti and Finlay, 2009).
Where:
P (y) = household’s Well-Being, e= the natural log, α= the intercept of the equation, β1 to βk= coefficients of the predictor
variables and x1-xk= predictor variables presented under section 2.4.
Qualitative data from the FGDs were analysed using content analysis and the obtained information was used to
complement information obtained from analysis of quantitative data in answering the pre-determined research questions.
2.0 FINDINGS 2.1 Conceptualization of Wellbeing in the Study Area
The study determined the level of household wellbeing building on local people perspectives on the indicators of
household wellbeing (HWB) complementing those highlighted in the Tanzania rural Development Strategy. Table 1
provides detailed description of the wellbeing indicators as conceptualized in the study area. According to FGDs
participants both in Mgeta and Mlali a well- off household in the study area is the one which is food self-sufficient
throughout the year, can use own savings to overcome shocks, can afford children education up to secondary level,
possesses high valued assets or durable assets (car, milling machines, television set, solar panel), and modern house
(roofed with iron sheets, walls made of concrete or burnt bricks and concrete floor). Further, they consider a household to
be moderately well-of when it possesses moderate valued assets (bicycle, mobile phone, and radio) and can afford
primary education for children.
2.2 Households Wellbeing Status as per Selected Indicators
The study assessed household’s wellbeing status (HWBS) based on the developed HWBS index. The results on indicator
performance and the general wellbeing status of individual households are presented in Table 2 and Figure 2
respectively. As indicated in Table 2, it was encouraging that though, 76% and 69% of Mgeta and Mlali households
respectively possess local toilets at least 21.4% and 30.1% of them respectively possess improved toilets implying that they
were at less risk of communicable diseases such as cholera and dysentery. The findings also show that 93% and 86% of
Mgeta and Mlali households respectively were food self- provisioning throughout 2011 implying that they were secured
in terms of food availability. However, the processes through which Mgeta households cultivate food involve wastage of
extra production time through travelling to distant farms as reported by Lyatuu and Urassa (2014). This implies that the
extra time spent on trekking to farms could have been properly invested on production hence; enhance realization of
other livelihood priorities. Therefore, any strategy to reduce time spent on travelling to farms could contribute to improve
progress in their realization of Well-Being.
Moreover, although the findings show that 100% of the surveyed houses were roofed with iron sheet, 58% and 54% of
Mgeta and Mlali houses respectively were made of mud floor implying that more than half of the studied households

Urassa, J.K. & Lyatuu, P.M. (2019). Impact of Livelihood Strategies on Household Wellbeing in Land Shortage Villages of Mvomero District, Tanzania.
101
East African Journal of Social and Applied Sciences [EAJ-SAS] Vol. 1, Issue 2, 2019
were not well-off in terms of housing condition. Table 2 also shows a high inequality in asset possession. The distribution
of durable assets among Mgeta households was concentrated to 11.5% of households ranging from lack of car and solar
panel to only 7% possessing television sets. In addition, durable assets were evenly distributed among 13% of Mlali
households with 0.7% possessing water pumps and 2.9% possessing solar panels and motor cycles. Furthermore, findings
shown in Figure 2 reveal that 36% of households in both sites were not well. Parallel to this, Table 2 shows that 57% and
81% of Mgeta and Mlali households respectively dispose assets in order to cope with risks meaning that they lack ability
to overcome risks and shocks (resilience). The main disposed asset as mentioned by respondents was land, and was
mostly done by Mlali households because they had larger portions of land relative to Mgeta. This finding predicts the
high probability for many households becoming landless in future if their resilience is not enhanced.
Figure 2 show that Mgeta comprised a larger proportion (69%) of ailing households relative to Mlali households (36%).
The higher incidence of ailing households in Mgeta than Mlali can be attributed to the arguments presented by the FGDs
participants that, Mgeta households are forced to divide their labour seasonally following the need for men to gain
additional farms through migration. According to the FGDs’ participants, migration has led to many female headed
households as some of the migrated men decided to re-marry and remain in villages of destination. Literature also shows
that the divided household labour reduces productivity (Bebbington, 1999; Di Falco et al., 2010).
Additionally, the FGD participants also pointed out that households located in Mgeta incur guarding and transportation
costs for crops cultivated outside the resident villages. The FGDs participants also reported that, farmers are compelled to
apply industrial fertilizer excessively on farms located in terrain slopping to improve fertility of the frequently eroded
soil. The divided labour might be contributing to low productivity; likewise, the above-mentioned extra costs of
production such as guarding and transportation costs might be reducing profitability hence, hindering the attainment of
Well-Being. The findings on assets portfolio and general wellbeing connote that households’ wellbeing attainment was
insignificant; hence, predicting possibilities for households to encroach and degrade the neighbourhood reserve in their
efforts to meet their daily needs.
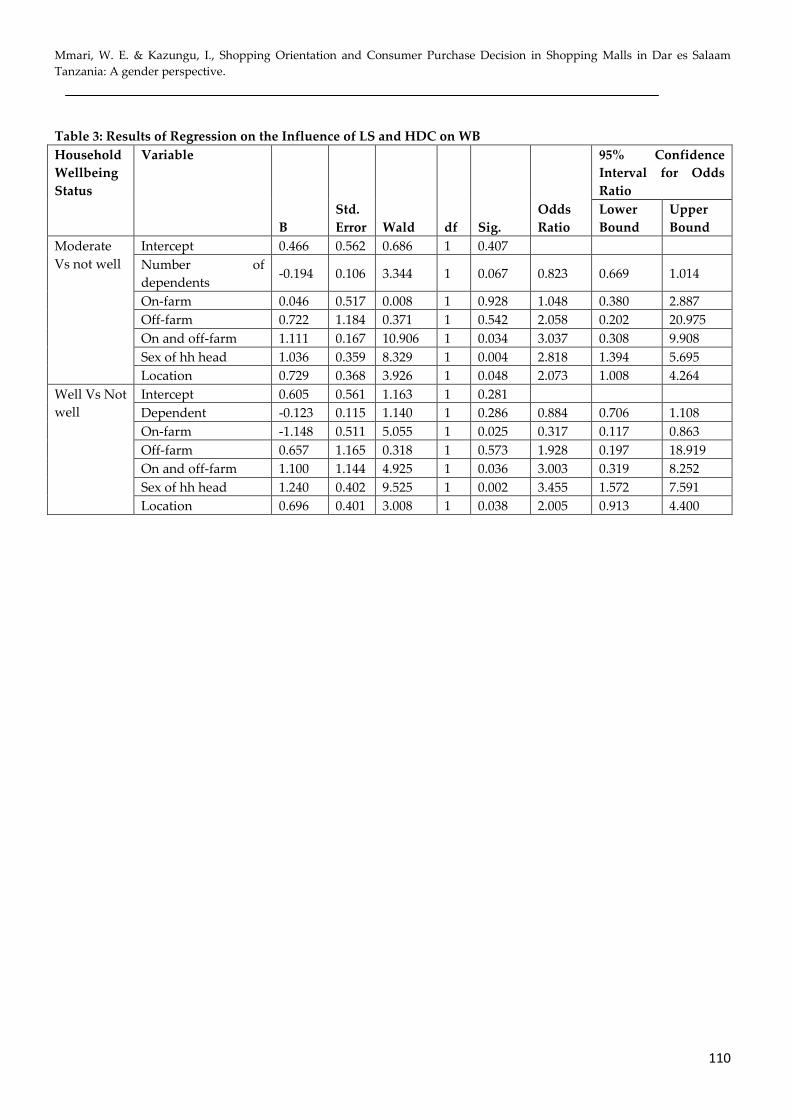
2.3 The Influence of Livelihood Strategies on a Household’s Well-Being
Multinomial logistic regression was used to test the hypothesis that the odds of households attaining wellbeing were the
same among households venturing in different livelihood strategies under different socio-demographic background.
Results of multinomial logistic regression are presented in Table 3. The model was statistically significant, χ2 (10, n = 267)
= 38.361, p = 0.000 indicating that it was able to distinguish between well-off, moderately well-off and not well households
(Field, 2013). The model as a whole explained 32% (Nagelkerke R squared) of the variance in households’ wellbeing.
Unlike the hypothesis, the findings (Table 3) show that six variables as clarified in the following paragraph demonstrated
to have a significant influence (p < 0.05) on the likelihood for a household to be well-off.
The B values and odds ratios for the variables measuring the influence of LS (farming, non-farm and combination of
farming and non-farm LS) tell us that households engaged in diversity of LS (combination of farm and no-farm LS) were 3
times more likely to be well-off than being not well (Table 3). The values and ratios also show that those households
engaged in on-farm LS alone were 3 times less likely to be well-off than being not well. These findings are explained by
the arguments raised by FGD participants that households undertake multiple LS because farming alone does not offer
sufficient earnings for meeting household’s basic needs. FGD participants further reported that households use income
from non-farm activities to purchase farm inputs and implements. It is therefore, very possible that those households
engaged on farming solely remain unable to complement farm income and also to diversify risks related to farming, i.e.
when crops and animals fail due to natural disasters, the suvivours remain unable to cultivate in the following season as
they lack other sources of income. Therefore, such households fall into destitution. In line with the above argument,
literature shows that livelihood diversification contributes about 30%-50% of rural Tanzanian household income (URT,
2011). The findings underscore the relevance of sustainable livelihoods framework especially its emphasis on

Urassa, J.K. & Lyatuu, P.M. (2019). Impact of Livelihood Strategies on Household Wellbeing in Land Shortage Villages of Mvomero District, Tanzania.
102
East African Journal of Social and Applied Sciences [EAJ-SAS] Vol. 1, Issue 2, 2019
understanding the link between livelihood strategies and livelihood priorities for informed effective focus of poverty
interventions. For instance, for this case it is evidently indicated by study findings that although the majority of
households, venture on exclusive farming, only the combination of farm and non-farm LS has potential to enhance
wellbeing in the study area. Consequently, the findings on the general household wellbeing show that majority of
households were ailing whereby, only 6.7% of them had a positive index score and yet the scores were below 0.5 ranging
from 0 - 0.46 meaning that they can fall in ill-being any time.
Furthermore, the odds ratios and B values for a variable measuring the influence of a household’s location as presented in
table 3 show that households located in Mlali demonstrated to be 2 times more likely to be well-off than being not well
relative to those located in Mgeta. These findings agree with the findings on households’ general wellbeing status (Figure
2) which indicated that Mgeta has greater proportion of ailing household than Mlali. The explanation for these findings
can be attributed to the occurrence of higher costs of production among households located in Mgeta compared to the
counterpart households located in Mlali. The production costs in Mgeta are inflated by demands for seasonal migration
and frequent incidence of soil erosion. Seasonal migration compels households to incur double costs of family care;
households also incur costs of guarding crops in fields and transporting the produce back home.
Seasonal Migration also leads to divided households’ labour force as men work outside the resident villages; these
obviously reduce the returns. A study on land access and livelihood strategies in Mvomero District reported that lack of
irrigation water prevent migrants to settle in their destinations. In Mgeta they get irrigation water from nearby
catchments which they use to irrigate vegetables; their cash crops (Lyatuu and Urassa, 2015). Moreover, soil erosion
compels high demand for of industrial fertilizers which again the FGDs participants posed a concern that most of
households do not afford hence, they obviously get little harvests. This finding implies that extra costs of production
resulting from seasonal migration and high demand for industrial fertilizers contribute towards reducing Mgeta
household’s ability to attain wellbeing.
Similarly, the B value and odds ratio for a variable measuring the influence of a household head’s sex verified that male
headed households were 2.8 more likely to be moderately well-off and 3.5 times more likely to be well-off than being not
well as compared to female headed households (FHHs). This can be attributed to the processes through which women
become household heads in the study area. According to FGDs participants, women become de-facto heads due to death
of male partner, divorce, abandonment/separation and male migration. In addition, though the studied community is
matrilineal, ownership and control of resources particularly land is under the custodian of male relatives. Under such
circumstance (FHHs) are also subjected to gender discrimination on resource ownership and control. In that view they
also lack economic and social support from male partner/parent and remain vulnerable to social and economic exclusions.
For example FGDs participants pointed out that it is very hard for a woman to access irrigation water because the
management is always done during the nights when women are unable to move alone. However, the main source of cash
income for farm households in the area as explained by FGD participants is sale of vegetables. The cultivation of
vegetables according to FGDs participants depends solely on irrigation water implying that those FHHs which also do
not have any adult male member are disadvantaged in getting income from cash crops because they fail to access
irrigation water. This finding underscores the contribution of demographic characteristics especially the household head’s
sex on household’s ability to attain wellbeing in the study area whereby, FHHs are disadvantaged.
3.0 CONCLUSIONS AND RECOMMENDATIONS
Based on the study’s findings, it is concluded that in the study area wellbeing of a household is defined by its socio-
economic characteristics including ownership of assets, housing condition, resilience and food self-provisioning ability. It
is also concluded that generally, majority of households are not well as they lack most of qualities which to them are
determinants of wellbeing. The paper also concludes that, neither sole farming nor exclusive non-farm livelihood

Urassa, J.K. & Lyatuu, P.M. (2019). Impact of Livelihood Strategies on Household Wellbeing in Land Shortage Villages of Mvomero District, Tanzania.
103
East African Journal of Social and Applied Sciences [EAJ-SAS] Vol. 1, Issue 2, 2019
strategies (LS) enhance the attainment of wellbeing. Nonetheless, the combination of farming and non-farm LS (LS
diversification) has a significant contribution on the attainment of wellbeing. However, the contribution of LS
diversification on wellbeing is low because the players lack necessary capital such as labour skills, funds, and education
for engaging in higher paying LS. In addition, female headed households (FHHs) and those located in highly shrunken
arable land are disadvantaged in attaining wellbeing. There is a need therefore, to enhance the attainment of wellbeing in
the area through improving LS, supporting FHHs to overcome social exclusion and helping households located in
villages where land has been highly shrunken and soil has been exhausted to reduce the costs of transportation, guarding
property and industrial fertilizers. Tanzania government and other development agencies are advised to promote
diversification of LS in land scarce areas. A further analysis of gender specific constrains faced by FHHs towards
attainment of wellbeing is necessary to inform specific interventions for enhancing their realization of Well-Being.
However, for such strategies to be successful there need to be consideration for support of rational relocation from areas
where land has highly shrunken (such as Mgeta) to areas with abundant land.
3.1 Acknowledgement
The authors are grateful to God Almighty for Divine help, Policy Research for Development the former Research for
Poverty Alleviation (REPOA) for financial support, and respondents for devoting their time to provide information for
this study.
REFERENCES
Agresti, A., and B. Finlay. (2009). Statistical Methods for the Social Sciences: With SPSS from A to Z: A Brief Step-by-Step
Manual. Boston: Allyn & Bacon. 609 pp.
Allison, E. H., and Frank Ellis. (2001). The Livelihoods Approach and Management of Small-Scale Fisheries. Marine Policy
25 (5): 377–88.
Ashley, C and Carney, D. (1999). Sustainable Livelihoods: Lessons from Early Experience. Department for International
Development, 94 Victoria Street London SW1E 5JL. Russell Press Ltd., Nottingham. (7): 1, 64pp.
Augustino, S., Eriksen, S. Makonda F. S. B., and Amanzi, N. (2013). Climate Change Adaptation Strategies by Local
Farmers in Kilombero District, Tanzania. Ethiopian Journal of Environmental Studies and Management 6 (6): 724–36.
Bailey, D. K (1998). Methods of social science research. The Free Press Collier Macmillan Publisher, London 478pp.
Barrett, C. B, T Reardon, and P Webb. (2001). Nonfarm Income Diversification and Household Livelihood Strategies in
Rural Africa: Concepts, Dynamics, and Policy Implications. Food Policy 26 (4): 315–31.
Bebbington, A. (1999). Capitals and Capabilities: A Framework for Analyzing Peasant Viability, Rural Livelihoods and
Poverty. World Development 27 (12): 2021–44.
Camfield, L., Natalia, S., and Martin, W. (2010). Children’s Wellbeingin Developing Countries: A Conceptual and
Methodological Review. European Journal of Development Research 22 (3): 398–416.
Chambers, R. (1997). Whose Reality Counts? Putting the First Last. Intermediate Technology Publications Ltd (ITP), 297pp.
[http://www.cabdirect.org]. [21/8/2014].
Chuma, J., and Molyneux, C. (2009). Estimating Inequalities in Ownership of Insecticide Treated Nets: Does the Choice of
Socio-Economic Status Measure Matter? Health Policy and Planning 24 (2): 83–93.
Coulthard, S., Derek, J., and J. Allister, M. (2011). Poverty, Sustainability and Human Wellbeing: A Social
WellbeingApproach to the Global Fisheries Crisis. Global Environmental Change 21 (2): 453–63.

Urassa, J.K. & Lyatuu, P.M. (2019). Impact of Livelihood Strategies on Household Wellbeing in Land Shortage Villages of Mvomero District, Tanzania.
104
East African Journal of Social and Applied Sciences [EAJ-SAS] Vol. 1, Issue 2, 2019
Deininger, K. (2011). Challenges Posed by the new wave of Farmland Investment.” The Journal of Peasant Studies 38 (2):
217–47.
Di Falco, S., Ivan P., Aleksi A., and Tom M. van R. (2010). Agro-biodiversity, Farm Profits and Land Fragmentation:
Evidence from Bulgaria. Land Use Policy 27 (3): 763–71.
Ellis, F., and Freeman A. H. (2004). Rural Livelihoods and Poverty Reduction Strategies in Four African Countries. Journal
of Development Studies 40 (4): 1–30.
Ellis, F., and Biggs, S. (2001). Evolving Themes in Rural Development 1950s-2000s. Development Policy Review 19 (4): 437–
48.
Ellis, F. (1998). Household Strategies and Rural Livelihood Diversification. The Journal of Development Studies 35 (1): 1–38.
Ellis, F. (2006). Agrarian Change and Rising Vulnerability in Rural Sub-Saharan Africa.” New Political Economy 11 (3): 387–
97.
Field, A. (2013). Discovering statistics using IBM SPSS statistics. Sage, 857pp. Retrieved from [http://books.google.com].
[10/10/2014].
Filmer, D., and Pritchett, L. H. (2001). Estimating wealth effects without expenditure data or tears: An application to
educational enrollments in states of India. Demography, 38(1), 115–132.
Giliba, R. A., Celestine S. M., Mary P., Canisius J. K., Almas M. K., Leonard I. C., and Emmanuel B. M. (2011). Human
Activities Influencing Deforestation on Meru Catchment Forest Reserve, Tanzania. Journal of Human Ecology 33 (1):
17–20.
Guardiola, J., Francisco G.G., Miguel A. G.R., and Ángel L.G. (2013). Does Higher Income Equal Higher Levels of
Happiness in Every Society? The Case of the Mayan People. International Journal of Social Welfare 22 (1): 35–44.
Herani, G. M., Pervez W., Allah W. R., and Riaz A. S. (2008). The Nature of Poverty and Its Prospects: Pakistan Evidence.
[http://mpra.ub.uni-muenchen.de]. [10/8/2014].
Howe, L.D., Bruna G., Alicia M., David G., Deborah J., Obinna O., Rita P., Elizabeth A. W., Debbie A. L., and James R. H.
(2012). Measuring Socio-Economic Position for Epidemiological Studies in Low-and Middle-Income Countries: A
Methods of Measurement in Epidemiology Paper. International Journal of Epidemiology, 3 (2): 9pp.
Howe, L. D., James R. H., George B. P., Bianca L. De S., and Sharon R. A. H. (2010). Subjective Measures of Socio-
Economic Position and the Wealth Index: A Comparative Analysis. Health Policy and Planning, 2 (1): 8pp.
IFAD- International Fund for Agricultural Development, (2012). Land Tenure Security and Poverty Reduction. Rural
Poverty report. Italy, 44pp. [http://www.ruralpovertyportal.org]. [29/1 2014].
Kimia, M. (2008). Research Methodology; Guidance to Researchers in Colleges and Universities with Some Review Questions.
Prompt Printers and Publishers Ltd. Arusha.100pp.
Kolenikov, S., and Gustavo A. (2009). Socioeconomic Status Measurement with Discrete Proxy Variables: Is Principal
Component Analysis a Reliable Answer? Review of Income and Wealth 55 (1): 128–65.
Kothari, C. (2004). Research Methodology; Methods and Techniques. New Age International Limited Publishers. New Delhi:
401pp.
Kusiluka, M. M., Sophia K., Moses A. K., Esron D. K., and Lughano J.M K. (2011). The Negative Impact of Land
Acquisition on Indigenous Communities’ Livelihood and Environment in Tanzania. Habitat International 35 (1):
66–73.

Urassa, J.K. & Lyatuu, P.M. (2019). Impact of Livelihood Strategies on Household Wellbeing in Land Shortage Villages of Mvomero District, Tanzania.
105
East African Journal of Social and Applied Sciences [EAJ-SAS] Vol. 1, Issue 2, 2019
Lopa, D., Iddi M., George J., Thabit M., Paul H., Mark E.J., Tom B., Beria L., Meine van N., and Neil D. B. (2012). Towards
Operational Payments for Water Ecosystem Services in Tanzania: A Case Study from the Uluguru Mountains.
Oryx 46 (01): 34–44.
Lugoe, F. N. (2010). Land–Pillar No. 5 of Kilimo Kwanza. Occasional Paper. DILAPS, Dar es Salaam. 67pp.
Lugoe, F. N. (2008). A Century of Government Regulated Land Access in Tanzania. In Video conferencing Workshop on Land
Administration in Tanzania. Searching for Alternative Approach, May, 12-15, 2008. DIPLAS, 27pp.
Lyatuu, P. M. and Urassa J. K. (2014). Land Access and Associated Factors in Densely and Sparsely Populated Areas:
Mvomero District Tanzania. Intersect: The Stanford Journal of Science, Technology and Society 8 (1): 1-20.
[http://ojs.stanford.edu]. [10/8/2014].
Lyatuu, P. M. and Urassa, J. K. (2015). Land Access and Livelihood Strategies in Mvomero District, Tanzania. International
Journals of Physical and Social Science 5 (3): 256-276.
Masadeh, M. A. (2012). Focus group: reviews and practices. International Journal of Applied Science and Technology 2(10): 63-
68.
Mekonnen, A., Afework B., Graham H., Eyob T., and Anagaw A. (2010). Population Size and Habitat Preference of the
Vulnerable Bale Monkey Chlorocebus Djamdjamensis in Odobullu Forest and Its Distribution across the Bale
Mountains, Ethiopia.” Oryx 44 (04): 558–63.
Montgomery, M. R., Gragnolati, M., Burke, K. A., and Paredes, E. (2000). Measuring living standards with proxy
variables. Demography, 37(2), 155–174.
Mustalahti, I.A. Bolin, E. B, & Paavola J. (2012). Can REDD+ Reconcile Local Priorities and Needs With Global Mitigation
Benefits? Lessons from Angai Forest. Tanzania. Journal of Ecology and Society 17(1): 16-27.
Mvomero District Office. (2011). Mvomero District Profile. 43pp.
Naylor, R. (2011). Expanding the Boundaries of Agricultural Development. Food Security 3 (2): 233–51.
Nyenza, O. M., Nzunda, E. F. and Katani, J. Z. (2013). Socio-Ecological Resilience of People Evicted for Establishment of
Uluguru Nature Reserve in Morogoro Region, Tanzania. Forests, Trees and Livelihoods 22 (3): 190–203.
Pallant, J. (2010). SPSS survival manual: A step by step guide to data analysis using SPSS. McGraw-Hill International,
350pp.
Robertson, B., and Per Pinstrup, A.. (2010). Global Land Acquisition: Neo-Colonialism or Development Opportunity? Food
Security 2 (3): 271–83.
Rydin, Y. (2010). Governing for Sustainable Urban Development. Earthscan, 57pp. [http://books.google.com]. [10/11/2014].
Salafsky, N., Richard M., Kent H. R., and John G. R. (2002). Improving the Practice of Conservation: A Conceptual
Framework and Research Agenda for Conservation Science. Conservation Biology 16 (6): 1469–79.
Scoones, I. (1998). Sustainable Rural Livelihoods: A Framework for Analysis. IDS Working Paper no 72: pp 22.
[http://mobile.opendocs.ids.ac.uk]. Site visited on 20/12/2014.
Smith, P., Helmut, H., Alexander P., Karl-heinz E., Christian, L., Richard, H., Francesco N. T. (2013). How Much Land-
Based Greenhouse Gas Mitigation Can Be Achieved without Compromising Food Security and Environmental
Goals? Global Change Biology 19 (8): 2285–2302.
Tashakkori, A., and Charles T. (2010). Sage Handbook of Mixed Methods in Social and Behavioral Research. Sage, 412pp.
[http://books.google.com]. Site Visited on 10/8/2014.

Urassa, J.K. & Lyatuu, P.M. (2019). Impact of Livelihood Strategies on Household Wellbeing in Land Shortage Villages of Mvomero District, Tanzania.
106
East African Journal of Social and Applied Sciences [EAJ-SAS] Vol. 1, Issue 2, 2019
Urassa, J. K. (2010). Rural Household Livelihoods, Crop Production and Wellbeingafter a Period of Trade Reforms: A
Case Study of Rukwa, Tanzania. University of Sussex. 247pp
URT. (United Republic of Tanzania). (2001). Rural Development Policy. PO; Regional Administration and Local Government.
Government Printer, Dar es Salaam 88p:
URT. (2011). The Tanzania Five Year Development Plan 2011/2012 – 2015/2016, Unleashing Tanzania’s Latent Growth
Potentials. President’s Office Planning Commission: 181p.
URT. (2013). 2012 Population and Housing Census. National Bureau of Statistics Ministry of Finance Dar es Salaam and
Office of Chief Government Statistician President’s Office, Finance, Economy and Development Planning
Zanzibar: 264pp.
Vyas, S., and Kumaranayake, L. (2006). Constructing Socio-economic Status Indices: How to Use Principal Components
Analysis. Health Policy and Planning, 21(6), 459–468.
WWF, CARE, IIED and PREM (2007). Final Report on Social and Livelihoods Assessment for Villages around East
Usambara and Uluguru Mountains. Equitable Payments for Watershed Services: Phase 1, Making the Business
Case. A Joint Programme in Tanzania: 96 pp.

Urassa, J.K. & Lyatuu, P.M. (2019). Impact of Livelihood Strategies on Household Wellbeing in Land Shortage Villages of Mvomero District, Tanzania.
107
East African Journal of Social and Applied Sciences [EAJ-SAS] Vol. 1, Issue 2, 2019
APPENDICES
Figure 1: Map of Mvomero District Showing Studied Villages
Source: Sketched by an expert at Sokoine University of Agriculture during field work

Table 1: Household’s Wellbeing Status as Conceptualized in the Study Area
Indicator Well-off Households Moderately Well-off
Households
Non well-off Households
Household’s food
provision
Self-provisioning Receive food aids between
harvest
Reduce consumption between
harvest
Resilience ability Use savings to overcome
risks
Receive aids in time of risks Sell assets to cope with risks
Type of toilet
possessed
Modern toilet Local toilets Do not possess toilet
Housing wall material concrete or burnt bricks Walls made of mud bricks poles and mud
Housing floor material Floor is made of cement Floor made of animal
residue
Earth floor
Housing roof material Roof is made of iron
sheets
Roof made of animal
residue
Thatch roofing
Portfolio of assets Possess durable assets Possess semi-durable assets Lack semi and durable assets

Mmari, W. E. & Kazungu, I., Shopping Orientation and Consumer Purchase Decision in Shopping Malls in Dar es Salaam
Tanzania: A gender perspective.
97
Figure 2: Results of descriptive Analysis on Households’ Wellbeing Status

Mmari, W. E. & Kazungu, I., Shopping Orientation and Consumer Purchase Decision in Shopping Malls in Dar es Salaam
Tanzania: A gender perspective.
109
Table 2: Results on Households’ Wellbeing Indicator Performance (n= 267)
Indicator Variable
Mean
Std.
Deviation
Component
Score
Mgeta n =
131
Mlali n =
136
Percent Percent
Type of toilet Improved toilet 0.2584 0.43859 0.557 21.4 30.1
Local toilet 0.7266 0.44655 -0.620 76.3 69.1
No toilet 0.0150 0.12171 -0.014 2.3 0.9
Resilience ability Use own savings 0.1353 0.34208 0.007 19.8 7.4
Receive aid 0.1729 0.37819 0.012 22.9 11.8
Erode assets 0.6917 0.46178 -0.024 56.5 80.9
Housing condition Burnt/concrete brick
walls 0.6704 0.47095 0.046 50.4
83.1
Mud brick walls 0.2547 0.43650 0.086 42 9.5
Poles and mud walls 0.0749 0.26373 -0.026 7.6 7.4
Cement floor 0.4419 0.49755 0.154 42 46.3
Mud floor 0.5581 0.49755 -0.154 58 53.7
Iron sheet roofing 0.000 0.0000 0.002 100 136
Possession of durable
assets
Car 0.0075 0.08639 0.005 0 1.5
Generator 0.0225 0.14849 0.000 1.5 2.9
Water pump 0.0150 0.12171 0.002 2.3 0.7
Solar panel 0.0150 0.12171 0.002 0 2.9
Motor bike 0.0451 0.20755 0.002 0.8 2.9
Television set 0.0451 0.20755 0.010 6.9 2.2
Possession of semi-
durable assets
Bicycle 0.0377 0.19020 -0.033 6.9 0.7
Radio 0.5581 0.49755 -0.056 59.5 52.2
Mobile phone 0.4195 0.51671 -0.022 41.2 38.2
Food self -provisioning Own source 0.8951 0.30696 0.003 93.1 86
Receive food aid 0.0337 0.18082 0.023 2.3 4.4
Reduce
consumption 0.0712 0.25758 -0.080 4.6
9.6
Mmari, W. E. & Kazungu, I., Shopping Orientation and Consumer Purchase Decision in Shopping Malls in Dar es Salaam
Tanzania: A gender perspective.
110
Table 3: Results of Regression on the Influence of LS and HDC on WB
Household
Wellbeing
Status
Variable
B
Std.
Error Wald df Sig.
Odds
Ratio
95% Confidence
Interval for Odds
Ratio
Lower
Bound
Upper
Bound
Moderate
Vs not well
Intercept 0.466 0.562 0.686 1 0.407
Number of
dependents -0.194 0.106 3.344 1 0.067 0.823 0.669 1.014
On-farm 0.046 0.517 0.008 1 0.928 1.048 0.380 2.887
Off-farm 0.722 1.184 0.371 1 0.542 2.058 0.202 20.975
On and off-farm 1.111 0.167 10.906 1 0.034 3.037 0.308 9.908
Sex of hh head 1.036 0.359 8.329 1 0.004 2.818 1.394 5.695
Location 0.729 0.368 3.926 1 0.048 2.073 1.008 4.264
Well Vs Not
well
Intercept 0.605 0.561 1.163 1 0.281
Dependent -0.123 0.115 1.140 1 0.286 0.884 0.706 1.108
On-farm -1.148 0.511 5.055 1 0.025 0.317 0.117 0.863
Off-farm 0.657 1.165 0.318 1 0.573 1.928 0.197 18.919
On and off-farm 1.100 1.144 4.925 1 0.036 3.003 0.319 8.252
Sex of hh head 1.240 0.402 9.525 1 0.002 3.455 1.572 7.591
Location 0.696 0.401 3.008 1 0.038 2.005 0.913 4.400

Mmari, W. E. & Kazungu, I., Shopping Orientation and Consumer Purchase Decision in Shopping Malls in Dar es Salaam
Tanzania: A gender perspective.
111
Appendix 1: Outputs of Principle Component Analysis for weighting the Indicators of Well-Being
Table 4: Descriptive Statistics of Principal Component Analysis
Wellbeing Indicator Mean Std. Deviation Analysis Na Missing N
Possess improved toilet 0.2584 0.43859 267 0
Possess local toilet 0.7266 0.44655 267 0
No toilet 0.015 0.12171 267 0
Use own savings 0.1353 0.34208 267 1
Receive aids 0.1729 0.37819 267 1
Erode assets 0.6917 0.46178 267 1
Burnt or concrete bricks 0.6704 0.47095 267 0
Un-burnt bricks 0.2547 0.4365 267 0
Poles and mud walls 0.0749 0.26373 267 0
Concrete floor 0.4419 0.49755 267 0
Mud floor 0.5581 0.49755 267 0
Animal dung floor 0 0 267 0
Possess car 0.0375 0.19023 267 0
Possess generator 0.0225 0.14849 267 0
Possess water pump 0.0599 0.23779 267 0
Possess solar panel 0.0599 0.23779 267 0
Possess motor cycle 0.0824 0.27548 267 0
Possess tv 0.0861 0.2811 267 0
Possess bicycle 0.1504 0.35744 267 1
Possess radio 0.5451 0.49796 267 1
Possess mobile phone 0.4307 0.50363 267 0
Is food self sufficient 0.8951 0.30696 267 0
Receive food aid 0.0337 0.18082 267 0
Reduce consumption 0.0712 0.25758 267 0
Own land 0.8614 0.34615 267 0
a. For each variable, missing values are replaced with the variable mean.
Source: Analysis of field data

Mmari, W. E. & Kazungu, I., Shopping Orientation and Consumer Purchase Decision in Shopping Malls in Dar es Salaam
Tanzania: A gender perspective.
112
Table 5: Component Score Coefficient Matrix
Component
1 2 3 4 5 6 7 8
Possess improved toilet .557 .160 .009 .054 -.027 -.014 -.038 -.012
Possess local toilet -.620 -.201 .009 -.083 .000 .013 -.002 .048
No toilet -.014 .010 -.005 .008 .007 .000 .011 -.010
Use own savings .007 -.008 .011 -.039 -.196 -.067 -.665 .020
Receive aids .012 .015 .015 .001 .615 .021 .350 -.025
Erode assets -.024 -.006 -.033 .051 -.487 .065 .471 .003
burnt or concrete bricks .046 .100 .034 -.613 .064 .023 -.046 .049
Un-burnt bricks -.086 -.082 -.003 .531 .002 -.065 .044 .031
Poles and mud walls -.026 -.006 -.017 .022 -.037 .026 .000 -.046
Concrete floor .154 -.609 -.009 .097 .006 .032 -.004 -.002
mud floor .154 .609 .009 -.097 -.006 -.032 .004 .002
possess car .002 .000 .000 -.001 .001 .007 .001 -.004
possess generator .005 .000 -.005 -.003 -.003 .029 .004 -.008
possess water pump .000 .000 .007 .001 -.003 .004 .002 .006
possess solar panel .002 -.002 -.001 .000 -.006 .017 -.002 -.002
possess motor bike .002 -.006 .006 .014 -.004 .041 .018 .017
possess television set .002 -.005 -.016 -.004 .025 .055 .026 -.019
possess bicycle -.010 -.019 .005 .022 .001 .028 .021 .015
possess radio -.033 -.003 -.076 -.080 .027 -.133 -.033 1.027
possess mobile phone -.056 -.096 .123 .045 -.075 .979 -.190 -.175
Is food self sufficient .022 .010 -.618 -.012 -.013 .025 .064 -.069
Receive food aid -.003 .001 .089 -.009 .009 .012 -.004 -.015
Reduce consumption -.023 -.010 .392 .022 -.002 -.039 -.048 .080
Source: Analysis of field data