Rapid Household Economy Approach
32
Rapid Household Economy Approach Recovery Analysis for Urban and Peri-Urban Coastal Zones in Eastern Leyte Save the Children International June, 2014
-
Upload
khangminh22 -
Category
Documents
-
view
7 -
download
0
Transcript of Rapid Household Economy Approach

Rapid Household Economy Approach
Recovery Analysis for Urban and Peri-Urban Coastal Zones
in Eastern Leyte
Save the Children International
June, 2014

Acknowledgements:
Many thanks are due to the Save the Children Philippines Country Office and the Haiyan Response
Team in particular for actively supporting this assessment at such a crucial time in the response.
Support from the teams in Manila and especially from the Tacloban field office, which hosted the
assessment team for two weeks and provided all of the necessary logistical and administrative
support, was greatly appreciated.
In particular the efforts of the Food Security and Livelihoods teams from the Tacloban, Estancia and
Ormoc field bases - who’s active participation and knowledge of the local context added great value
to data collection and analysis – are commendable. The staff who participated in the assessment
include: Gustavo Cavero (FSL Program Manager, Tacloban), Kyaw Oo Maung (FSL Program Manager,
Estancia), Jenepher Lusaynon (FSL Officer, Estancia), Junalie Katalbas (FSL Officer Tacloban), Robert
Abellar (FSL Community Mobiliser Tacloban), David Petronio (FSL Community Mobiliser Tacloban),
Sheena Calicoy (FSL Community Mobiliser, Tacloban), Rizza Asis (FSL Community Mobiliser,
Tacloban), Ison Verunque (FSL Community Mobiliser, Tacloban), Mario Roca (FSL Community
Mobiliser, Tacloban) and Michael Patcho (FSL Coordinator, Ormoc). The assessment was also
supported by FSL technical advisors who brought a broad range of experience and insight to the
analysis, namely: Ruth Aggiss, Rosie Jackson, Jae Estuar, Mohammed Addum and Josh Leighton.
The guidance of Alex King, a consultant with the Food Economy Group, greatly facilitated the entire
process and her participation has been a critical component of a quality outcome.
A very special thanks also goes to the community leaders and individual households who took time
out of their busy days to share their experiences with us.

Table of Contents
1) INTRODUCTION .............................................................................................................. 4
2) BACKGROUND AND METHODOLOGY ............................................................................ 4
PART I: FOOD SECURITY AND LIVELIHOODS - PRE YOLANDA
3) BASELINE ANALYSIS ........................................................................................................ 6
3.1 ZONE DESCRIPTIONS ................................................................................................ 6
3.2 ZONE MAPS .............................................................................................................. 7
3.3 BASELINE MARKET FUNCTION ................................................................................. 7
3.4 SEASONAL CALENDAR .............................................................................................. 7
3.5 WEALTH BREAKDOWN ............................................................................................. 9
3.6 SOURCES OF FOOD ................................................................................................. 11
3.7 SOURCES OF INCOME ............................................................................................. 11
3.8 EXPENDITURE PATTERNS ....................................................................................... 14
3.9 BASELINE SUMMARY .............................................................................................. 14
PART II: OUTCOME ANALYSIS
4) CURRENT YEAR SCENARIOS ......................................................................................... 15
4.1 EXPLAINING THE THRESHOLDS .............................................................................. 15
4.2 POST TYPHOON SCENARIO: NOVEMBER – DECEMBER, 2013 ............................... 16
4.3 CURRENT SITUATION: MAY – JUNE, 2014 .............................................................. 19
5) FORECAST: OCTOBER, 2014 – ONE YEAR ON ............................................................... 25
PART III: CONCLUSIONS AND RECOMMENDATIONS
6) CONCLUSIONS .............................................................................................................. 27
7) RECOVERY PROGRAMMING OPTIONS ......................................................................... 29

1. Introduction
This assessment was carried out just over six months on from Typhoon Yolanda, as humanitarian
operations are typically moving from relief to longer term recovery. At this stage Save the Children
were interested in testing some of the assumptions that have been made internally, as well as within
the broader humanitarian community, in regards economic recovery. Specifically, considering how
far relief interventions have gone in supporting community stability and recovery thus far. The
content of this report forms part one of a process which will involve a detailed analysis of Hazards,
Vulnerabilities and Capacities (HVCA) and which is designed to form a solid foundation for ongoing
programming as communities continue to recover from the devastating impact of Typhoon Yolanda.
For this purpose the Rapid HEA was identified as a means to support a better understanding of the
socio-economic determinants of survival and recovery.
The assessment covers two representative livelihoods zones in Save the Children’s Eastern Leyte
programme area. As this report is read it should be noted that the zones included in this assessment
were some of the most severely affected by the typhoon. To that end, households lost a great deal
but critically, to the analysis, they were some of the best served by the humanitarian response.
Similarities are noted throughout this report between the two zones, both in the complex nature of
the livelihoods strategies employed and in the reliance on major import and export markets in
eastern Leyte. The analysis that follows the baseline information identifies the largely successful
interventions made in these areas in ensuring that households met minimum consumption
requirements in the months following the typhoon. However, it also highlights the need to move
swiftly from relief interventions to those that promote community engagement, income recovery
and market strengthening as key determinants of recovery.
The report is split into 3 sections. The first provides a detailed analysis of the income and
expenditure patterns of different wealth groups in two livelihood zones prior to typhoon Yolanda.
This section is followed by “outcome analysis” which supports a projection of current food and
income security, with a reflection on how different aid efforts have impacted on the current
situation. A summary of needs met within the first couple of months, a description of the current
situation as well as a projection up to one year post-typhoon to illustrate the evolution of the
situation, with the consideration of recovery needs per wealth group, are all made in this section.
The report concludes with a summary of recommendations for recovery programming.
2. Background and Methodology
Typhoon Yolanda (internationally known as Haiyan) made first landfall in the early morning of
November 8, 2013 on the island of Guiuan, in the province of Eastern Samar. Yolanda made
subsequent landfalls south of Tacloban City in Leyte province, on Daanbantayan and Bantayan
Islands in Cebu province, the provinces of Capiz and Iloilo on the island of Panay and finally in
Palawan province.
According to the United Nation’s estimates, 14.1 million people have been affected by the typhoon
across nine regions, of which 4.1 million people remain displaced. According to the government of

the Philippines and humanitarian agencies over 500,000 homes were completely destroyed. An
estimated 2.6 million people have been severely affected, including just over 1.6 million children.
Typhoon Yolanda killed 6,201 people and 1,785 remain missing.
This component of broader recovery analysis, the Rapid Household Economy Approach (HEA), was
funded and undertaken by Save the Children International. The overall objectives were to: 1) assess
the food security and livelihoods needs of the Typhoon Yolanda affected population, alongside
relevant market analysis, in two livelihood zones in SC operational areas of the Philippines; 2) to
inform strategic decisions and any potential scale-up for recovery programming; and 3) provide a
platform to inform economic recovery needs across all SC technical sectors. Further to the increased
understanding of livelihood zones and strategies, wealth breakdowns, seasonality, and recovery
support needed across the two selected livelihood zones, it is hoped that a rapid HEA will provide a
livelihoods-based entry point for DRR analysis & mapping as well as a multi-sector recovery baseline.
The methodology was essentially that of a normal HEA baseline assessment with the following
differences in order to cut down on the overall time and resources that would be needed:
Completion of an online training course by field team members prior to the assessment with
an additional two days of classroom training, instead of the five days usually needed for a
traditional HEA, which included tailoring the interview forms to the local context;
Six days of fieldwork instead of the 10-12 days usually required;
Five barangays visited per livelihood zone instead of 8-12;
The use of current year (post “shock”) monitoring information gathered from a variety of
sources in addition to HEA baseline information for the reference year; and,
Three days instead of at least six days to analyse reference year information, set up a single
zone analysis spreadsheet, run the current year scenario per livelihood zone.
In order to answer broader questions on recovery from a large rapid onset emergency the Rapid HEA
tools were amended to include greater detail collected on the present situation, community
perceptions and an analysis of aid received by each of the livelihood zones. The strengths and
weaknesses of using the Rapid HEA for this purpose are discussed in Annex 1 of this report and will
be used internally to see how the Rapid HEA can support appropriate analysis following rapid onset
emergencies in the future.
Part I: Food Security and Livelihoods – Pre Yolanda
This section summarises the data collected in two livelihoods zones (LZ) in Leyte Province. As per a
typical HEA report it starts with a description of the zones, including the key characteristics, a wealth
breakdown and a seasonal calendar. This information is followed by a description of the income and
expenditure patterns of each zone. As Save the Children sought to draw conclusions for
programming in this area the two zones are presented in the same section. Although LZ specific data
is available, where sufficiently similar findings are presented data from one zone is used as an
example and where differences were found this is articulated.

3. Baseline Analysis
3.1 Zone descriptions:
The two livelihood zones selected for this phase of assessment were 1) the Tacloban City Coastal
Zone and 2) the Peri-Urban Coastal Zone. Though both zones show certain similarities in terms of
proximity to major markets, a wide variety of income sources and livelihood strategies on a
household level as well as the relative prominence of the fishing sector, there are substantial
differences which denote separate livelihood zones.
3.1.1 Tacloban City Coastal Zone: The 5 urban barangays1 identified for the Tacloban City Coastal
Zone were some of the worst affected by the typhoon; most notably by the devastating storm surge.
All assessed barangays were on the coast line within 5 km of the city centre. Their shared proximity
to both the commodity and labour markets of urban Tacloban, as well as to the fishing economy,
constitute the key characteristics of the livelihood zone. By nature of being an urban zone a
multitude of casual labour opportunities are present as are a range of trading activities across all
wealth groups leading to a variety of livelihood strategies and income sources on a household level.
Livelihoods associated with rural to urban linkages are also present. These communities were
deemed to be similar in terms of pre typhoon wealth; all having a small number of wealthier
households as well as a majority of poorer households depending primarily on fishing and casual
labour. This zone is more dependent on the seasonal demands on labour and commodities, including
fish, for their livelihoods than the seasonal determinants of agriculture and associated livelihoods,
which figure more strongly in the Peri-Urban Coastal Zone. Peak income and expenditure times
correlate strongly to the broader consumption markets of all surrounding communities.
3.1.2 Peri Urban Coastal Zone: In addition to the more urban barangays assessed within the Tacloban
City Coastal zone, five barangays south of Tacloban City2 along the eastern coast of Leyte Province
made up the second livelihood zone. All barangays within the Peri-Urban Coastal Zone were within
30 kilometres of Tacloban City and were also among some of the most severely affected by the
typhoon. The assessed barangays were generally peri-urban, with a mixed livelihoods profile
incorporating both urban and rural livelihood strategies – with the key characteristics including
fishing, rice farming, coconut farming, and given the relative proximity to the main markets of
Tacloban City, a variety of trading activities. This zone is more dependent on the seasonal
determinants of agriculture and associated livelihoods than Tacloban city; however the demands on
labour and commodities also play a significant role and peak income and expenditure times still
correlate strongly to the broader consumption markets of all surrounding communities.
1 Assessed barangays for the Tacloban City Coastal zone were barangays 68, 70, 88, 89, and 90.
2 The barangays were Telegrafo, Dona Brigida, Cabuyan, San Roque and Sabung Daguitan.
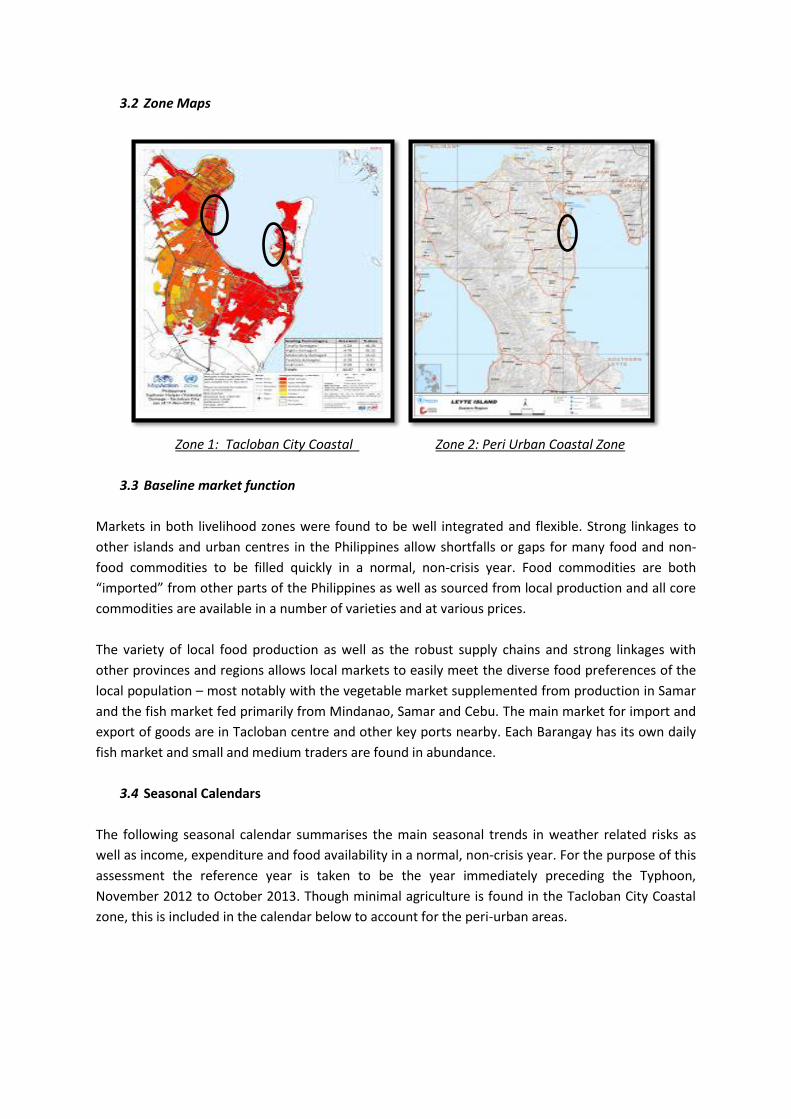
3.2 Zone Maps
Zone 1: Tacloban City Coastal Zone 2: Peri Urban Coastal Zone
3.3 Baseline market function
Markets in both livelihood zones were found to be well integrated and flexible. Strong linkages to
other islands and urban centres in the Philippines allow shortfalls or gaps for many food and non-
food commodities to be filled quickly in a normal, non-crisis year. Food commodities are both
“imported” from other parts of the Philippines as well as sourced from local production and all core
commodities are available in a number of varieties and at various prices.
The variety of local food production as well as the robust supply chains and strong linkages with
other provinces and regions allows local markets to easily meet the diverse food preferences of the
local population – most notably with the vegetable market supplemented from production in Samar
and the fish market fed primarily from Mindanao, Samar and Cebu. The main market for import and
export of goods are in Tacloban centre and other key ports nearby. Each Barangay has its own daily
fish market and small and medium traders are found in abundance.
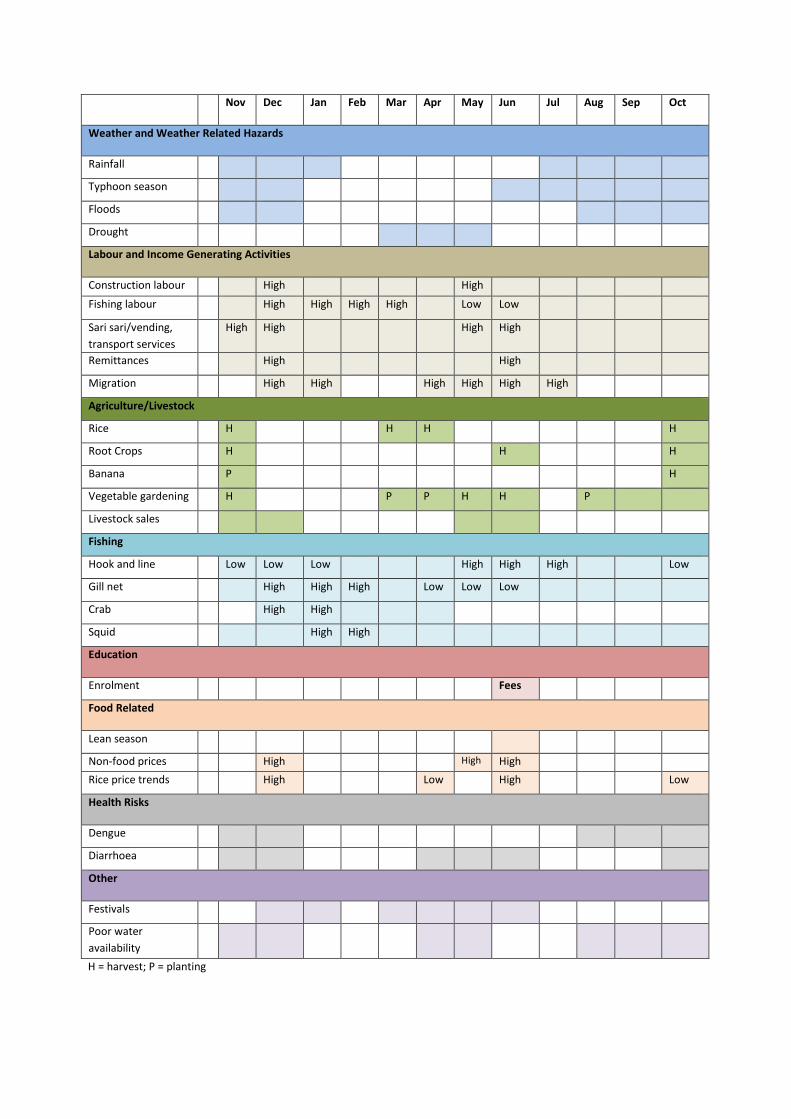
3.4 Seasonal Calendars
The following seasonal calendar summarises the main seasonal trends in weather related risks as
well as income, expenditure and food availability in a normal, non-crisis year. For the purpose of this
assessment the reference year is taken to be the year immediately preceding the Typhoon,
November 2012 to October 2013. Though minimal agriculture is found in the Tacloban City Coastal
zone, this is included in the calendar below to account for the peri-urban areas.
Nov Dec Jan Feb Mar Apr May Jun Jul Aug Sep Oct
Weather and Weather Related Hazards
Rainfall
Typhoon season
Floods
Drought
Labour and Income Generating Activities
Construction labour High High
Fishing labour High High High High Low Low
Sari sari/vending,
transport services
High High High High
Remittances High High
Migration High High High High High High
Agriculture/Livestock
Rice H H H H
Root Crops H H H
Banana P H
Vegetable gardening H P P H H P
Livestock sales
Fishing
Hook and line Low Low Low High High High Low
Gill net High High High Low Low Low
Crab High High
Squid High High
Education
Enrolment Fees
Food Related
Lean season
Non-food prices High High High
Rice price trends High Low High Low
Health Risks
Dengue
Diarrhoea
Other
Festivals
Poor water
availability
H = harvest; P = planting

In general, the most difficult months to meet food and other household needs during the reference
year were May – June and December – January; what would normally be referred to as the “lean
season” in other livelihood zones. Due to the urban and peri-urban context of the zones and
considering the main livelihood activities of the population this “lean season” is not necessarily
related to production cycles, such as rice cultivation, but is more strongly linked to increases in
household expenditure - especially education enrolment fees and other social obligations in the
spring, as well as the winter holiday season. Rice harvests do play a more important role in defining
income and food availability in the peri urban zone, however. There is a corresponding increase in
activity for many of the main income generating activities at these times including sari sari stores
and petty trade, tailoring, and food vending. Livestock sales also generally peak in November to
December and again in May to June, to help cover additional household expenses.
The fishing calendar varies greatly depending upon the type of fishing techniques that are used
(hook/line, gill net, etc.) December to March is the peak season for many fishing activities as there
are gill net fishing as well as crab and squid trapping all happening at the same time and there is
more opportunity for fishing labour during these months. Fishing activity is reduced during typhoon
season however (June to December) given the conditions at sea.
3.5 Wealth Breakdown
The wealth breakdown was determined by community representatives during focus group
discussions. Though guidelines were used to support decision making and facilitate discussion, the
criteria were identified by the groups themselves. Characteristics were similar across all groups and
therefore are assumed to be representative within each zone. Though there were some differences
between the zones, community wealth breakdown was largely determined by the level of asset
ownership (including land in some peri-urban barangay) as well as income sources and levels in both
zones; with education and the type of housing as additional determinants of wealth in the urban
zone and household size and access to credit in the peri-urban zone.
Wealth
Group
% HH HH
size
Number
earning
Average Income
per household
per month
(Pesos)
Sources of income Productive Assets Level of
Education
Very poor 25 –
40%
5 - 7 2-3 Urban: 10,000 –
15,000
Peri urban:
6,000 – 11,500
Unskilled Labour –
construction, fishing
and agricultural (peri
urban), Pedi-cab and
petty trade.
Little to none; may have 1 – 2 pigs in peri urban areas.
Elementary
Poor 30-
45%
5 - 7 2 Urban: 20,000 –
25,500
Peri Urban:
11,500 – 16,500
Small trade; Drivers;
semi-skilled labour and
tenant farmers (peri
urban)
Pedi cab; Small
motorised boats;
Small Sari sari
store/inputs; 1-2
pigs
High school
Middle 15 –
20%
4 - 6 1 Urban: 36,500 –
57,000
Peri urban:
16,500 – 30,000
Government & Private
employees, Medium
Trade & Transport
owners, remittance,
1-2 Pedicab; 1-2
tricycles; Jeepney;
Medium sari sari;
Small / medium
High school /
college

Fishing, coconut/rice
farming (peri urban)
motorised boats;
1 – 3 HA of land
(peri urban)
Better Off 5 –
15%
4 - 5 1 NK Large business, Asset
ownership, remittance
NK College /
university
Very poor households are characterised by their lack of productive assets (except for a few pigs in
the peri urban zone) and simple housing of nipa and bamboo. The very poor generally rely on
unskilled labour for the majority of their income, with the kinds of labour varying according to the
season (especially in the peri urban zone)3. The average household size is slightly larger than the
poor group, representing a marginally greater dependency ratio. Both poor and very poor groups are
estimated to have 2-3 adults. The very poor have an average of one out-of-school child and rarely
have children in high school due to the increased costs associated with this and the need for
additional income4.
The poor group typically consists of households with a minor asset base – often owning a small boat,
or having access to a small amount of land as tenant farmers (up to 1 hectare) in certain areas of the
peri-urban zone, or owning pedi-cabs in the urban zone. Poor households were more likely to be
engaged in more skilled labour (e.g. masonry) than the very poor or were doing small-scale trade or
business. The poor were found to be the most diverse group out of all the wealth groups, in terms of
livelihood strategies and income sources. Households in the poor wealth group are slightly larger in
size than the middle and better off and generally have houses constructed of wood (coco lumber),
bamboo and concrete. Expenditure in this group is approximately half that of the middle-income
households, as is the income given the lack of access to external remittance and permanent
employment.
The middle and better off households are those receiving remittance and in permanent jobs with the
government and private organisations. These households are typically smaller in size, have one
reliable income source and will have active members with college degrees. Remittance levels in
some middle income households can be as high as the total sum of income for the very poor. This is
especially the case in urban areas. The middle income households own much of the local productive
asset base and therefore are key income providers to the poor and very poor through transport and
labour.
3 For example, in the peri urban zone, fishing labourers normally engage in a different activity (e.g. construction labour)
during the low season for fishing. 4 In the Tacloban City Coastal areas, the per capita income of the very poor households puts them just above the Philippines
poverty threshold, whereas in the Peri Urban Coastal zone the very poor would fall under the poverty threshold.

3.6 Sources of Food
The graph to the left presents the sources of food for
households in different wealth groups in the peri urban
zone for the reference year running from November 2012
to October 2013. Food is presented as a percentage of
2100 kcal per person per day for the 12-month period
immediately preceding Typhoon Yolanda.
Not surprisingly, considering the zones, households are
almost 100% dependent on market purchase for staple and
non-staple food items - with the urban zone purchasing an
even higher proportion5 of their food on local markets than
the peri urban - with the exception of some fresh fish for the middle income households, seasonal
vegetable production and a small percentage of chicken consumption6. Although fishing is a key
economic activity, households are likely to sell their catch in order to purchase preferred and/or
cheaper produce in return (much of which comes from other islands). There are occasional gifts of
food commodities but not large enough to be a significant contribution to kilocalorie intake.
All wealth groups in both zones ate a varied diet daily during the reference year. More than 25
different items are consumed each week and an average of 1kg of fresh fish each day. Rice is the
staple food and makes up 60% - 70% of the diet of the middle income households and slightly more
for the poor and very poor. It is generally available in different qualities and prices on local markets
of all sizes – bought in bulk by the middle group and daily in smaller quantities by poorer groups.
3.7 Sources of Income
There were a variety of income sources found within all wealth groups, in both zones, with the poor
and very poor households in particular relying on a number of livelihoods strategies for survival. For
this reason there were considerable challenges in standardising some of the analysis. As the analysis
covers urban and peri-urban zones much of the economy is dependent on the trade and service
linkages between urban and rural areas. Given the coastal location, fishing is a significant source of
income but for the poorest households petty trade, construction labour and labour associated with
transport provision (pedi-cabs, etc.) are of equal importance in many of the barangays. As might be
expected, given the volume of food purchased trade is a significant source of income for all wealth
groups, especially in the more urban areas. Some typical urban livelihood strategies7 are set out
below as examples for interpretation of the report:
5 In the urban areas poor and very poor are exclusively dependent on purchase for staple and non-staple foods.
6 Certain communities in the peri urban zone did cover a larger percentage of their needs with their own rice production –
however the majority of kilo calories were still purchased. Cassava is also a more substantial part of the diet in some peri
urban barangays. 7 Again, in the peri urban zone agriculture – both rice and coconut cultivation – would figure more prominently in terms of
income for some of the wealth groups.

Wealth Group Example livelihood strategy 1 Example livelihood strategy 2
Very poor Man working 6-7 days per week: 6-7 days
fishing labour
Woman working 5 days per week: small
scale vending
One additional worker 2.5 days per week
(often a teenage child): Laundry /
domestic work
+ 4ps social support
Man working 6-7 days per week: 4 days
Construction labour 2-3 days pedicab
Woman working 5 days per week: Laundry /
domestic
One additional worker 2.5 days per week
(often a teenage child): Pedicab/ fish vending
+ 4ps social support
Poor Man working 6-7 days per week: Pedicab
owner / driver
Woman working 5-6 days per week: small
Sari sari store
Man working 6-7 days per week: semi-skilled
construction labour / fishing labour
Woman working 5-6 days per week: Prepared
food sales
Middle Man working: Tricycle owner / operator
+ income from rent of items
+ remittance
Man working: Medium fishing boat owner /
contractor
+ income from Sari sari and remittance
Tacloban City Coastal Income: For the purpose of analysis in urban barangays, income sources were
split into social support (including the 4ps), livestock, casual labour (including unskilled and skilled
fishing, construction and domestic labour) and self-employment (including any income obtained
through asset ownership – trading, pedi-cab and tricycle operators and fishing boat owners).
The middle income households owned assets
ranging from multiple motorised boats, nets and
associated fishing assets, in addition to
transportation assets to rent (tricycles, jeepneys,
etc.) as well as often substantial vending capital.
Due to the ownership of these assets the middle
income group provide fishing labour and other
income generating opportunities to the poor and
very poor households.
Fishing labour is generally enumerated, with two
labour rates related to the size of the boat and to the volume of the catch. Poor households will
typically have more consistent, reliable access to organised fishing labour sources than the very
poor, who may engage in piece meal, opportunistic labouring. Fish drying and production of
fermented fish is associated with the poorest households and is rarely linked to organised trade. The
very poor may also work as porters and dock workers on larger scale fishing operations closer to the
town port. Fish vending has a significant range in income, related to the source and destination
market. The most lucrative trading resulting in as much as 100 times the income of the smallest
income for vendors selling by fresh fish by the plate.
All wealth groups are involved in trade from small-scale street vending to medium size traders (sari
sari stores). In addition to the large market places found in Tacloban centre there are also central
markets within groups of barangays and commonly markets within each barangay. Though often the
main source of income for some of the poor households, for middle and very poor households

formal and informal trade contributes an important secondary income. For the very poor, street
vending and petty trade may be used as a temporary income to cover expenditure in months of high
spend.
Small livestock holdings, especially pigs, are another minor source of income for many households.
Especially among the poor no more than 1 or 2 pigs may be owned and the strategy of purchasing
piglets and fattening them up over a period of months is more of a savings mechanism to cover
household expenditure than an income generating activity.
Income per household in this zone is laid out in the table below as an example of the total income at
a household level. The income gap between the very poor and middle in the Tacloban City Coastal
zone is considerably greater than in the more rural, peri-urban zones. In addition, the total income
at a household level is marginally greater, correlating to the additional cost of living in urban areas
where water is more frequently purchased and transport costs (for work, etc.) are more substantial.
Despite the marginally larger monthly income this puts the very poor almost exactly on the 2012
Philippines poverty line and amounts to a total of $1.40 per person per day.
Peri Urban Coastal Income: Income sources for the peri-urban zone were found to be as diverse as
the more urban areas. The most diverse group in terms of income sources was the poor - consisting
of some working as tenant farmers, some as fishermen owning boats, some as skilled labour and
some engaged in small-scale sari-sari trade. However this varied from barangay to barangay.
The very poor were found to be more homogenous and
typically were engaged in unskilled labour given their
lack of assets (such as land holdings or boats). The
middle income group gain their income primarily from
businesses (often linked to fishing), larger sari-sari
trading or through contracted/salaried employment (e.g.
teachers, health workers, etc.). The better off were not
interviewed during the assessment but they were
typically gaining their income from working in highly

skilled jobs – such as engineers, etc. - through overseas remittances, and as larger land owners
(typically having land outside of their barangay).
Across the poor and very poor groups, raising pigs for fattening and selling was a more common
income source than in urban areas. Though, as in more urban barangays, it is not highly profitable,
and is more of a savings mechanism.
3.8 Expenditure patterns in the Baseline
The graph to the right presents expenditure
patterns for households in different wealth
groups in the peri urban zone, for the period
running from November, 2012 through
October, 20138.
The proportion of money spent on food
decreased across wealth groups, with the
very poor spending 70-80% of their income
on food, while the middle spent 40-50%.
Expenditure on food (combining staple and
non-staple expenditure) was generally found
to be the most significant expenditure
category for the very poor and poor households.
Overall expenditure on social services (such as education and health) increased with wealth, but
represents a similar proportion of expenditure across wealth groups. Education costs include school
fees (for secondary school), stationery, uniforms, transport and pocket money. The category
‘household items’ includes soap and other hygiene items, coffee, condiments, etc. The category of
‘other’ mostly includes tobacco, alcohol (coconut wine), soft drinks, mobile phone credit, religious
contributions, and extra expenditure during festivals. As this chart above illustrates, proportional
spending on these categories could be seen to be key determinants of wealth. For example, in the
middle income household spending on social services is more than double that of the poor and very
poor, reflecting access to private education and health facilities.
3.9 Summary – Food Security and Livelihoods, Pre Yolanda
In the year immediately preceding Typhoon Yolanda, households in both livelihood zones were
purchasing almost all of their food through local markets. All wealth groups normally consumed a
wide variety of food on a daily and weekly basis and covered their minimum kilocalorie
requirements. Though there is a notably large income and expenditure gap between the poor and
the wealthier groups, the gap between the poor and very poor is marginal with the very poor being
distinguishable from the poor by a small asset base and a marginally higher dependency ratio.
8 Expenditure patterns, in terms of the ratio of household expenses on certain items, was found to be similar in urban
barangays with the main difference being the overall expenditure (gross sum) is considerably higher considering the cost of
living.

Given the elasticity of some of these income sources, the next sections of this report will consider,
amongst other things, the possibility that the loss of assets as a result of the typhoon and the large
scale redistribution of assets resulting from the humanitarian response has had a significant impact
on meeting immediate household needs, but has done relatively little to support recovery of
affected households.
Part II: Outcome Analysis
Typhoon Yolanda had an immediate and dramatic impact on household economy. In the areas close
to the coast line the storm surge completely destroyed anything within its reach including shelter
and boats, nets and other equipment, productive assets such as pedi-cabs and livestock. The wind
and rain destroyed coconut plantations and small gardens, rice paddy and rice stocks. The impact
was indiscriminate of wealth group and caused losses and damages which are far greater than
normal recovery capabilities. The following scenarios use the baseline household economy data per
zone, additional data collected on asset loss at a community and household level, as well as a
mapping of aid received to describe the impact on households.
The first scenario looks at the effectiveness of the response in the first couple of months and pulls
out some interesting comparisons between the LZ which received cash based support and those
which did not. The second scenario looks at the picture now and considers the appropriateness of
the continued focus on distribution of relief items in a market based economy. The final scenario
considers the situation one year on in order to provide information on the ability of households to
recover and to draw conclusions for programming in economic recovery. This final scenario takes
into account9 the efforts made to date by communities and by humanitarian organisations.
4. Current Year Scenarios
4.1 Explaining the Thresholds
This section of the report looks into the six months following Typhoon Yolanda using predetermined
survival and livelihoods protection thresholds10. As an example, the following graph shows household
expenditure levels of very poor households in Tacloban City Coastal zone in relation to the survival
and livelihood protection thresholds during the reference year. In this graph it can be demonstrated
that the very poor were close to the livelihoods protection threshold in the baseline year as the
thresholds were calculated based on the consumption of poor households.
9 In the LZs covered there is an average community estimated recovery level of 50% across livelihoods and other assets.
10 The survival threshold includes a minimum basket of goods calculated to meet food needs. It includes fish, oil, rice and
vegetables as well as other items necessary for preparing food such as cooking fuel and water. A standard livelihood
protection threshold includes everything in the survival threshold plus additional expenses required to sustain livelihoods
(including, access to basic services such as health and education) and achieve locally acceptable standards of living.

In order to analyse the shock to baseline household economy resulting from the typhoon, in addition
to the impact of the humanitarian response over time, and in relation to the survival and livelihood
protection thresholds 2 scenarios have been developed – 1 detailing the situation during the initial
two months following the typhoon (November and December, 2013) and another for the current
situation (May and June, 2014).
4.2 Post typhoon scenario – November and December, 2013
The following assumptions formed the basis of the first scenario for the two months immediately
following the typhoon11:
Key assumptions Rationale
Staple food prices: +50% Due to heavy damage to market infrastructure,
sluggish supply chains for many commodities
and high fuel and transportation costs.
Food aid: meeting 80% of kcal needs
Initially conducted by the government; followed
by large-scale operations of the WFP and other
humanitarian organisations in December which
blanketed Tacloban city and much of eastern
Leyte.
Livestock (pig) sales income: zero Following heavy losses during the typhoon.
Casual labour income: -90% During the first few weeks casual labour would
have been non-existent, however over the initial
two month period sporadic opportunities did
become available as roads were cleared and the
recovery process began.
Remittances: +50% Especially for the middle income group – larger
remittances were received due to the crisis as
11
The basis of these assumptions is pulled from secondary data and information collected during interviews with community
representatives.
0
20000
40000
60000
80000
100000
120000
140000
160000
BaselineExpenditure
Survival basket Livelihoodprotection
basket
Survival and Livelihoods Protection Thresholds
OthersElectricity and rentTransportWaterHygiene itemsCooking fuelMedicinesEducatiomOther foodCooking OilVegetablesFresh FishRice

well as being in line with seasonal trends.
Self-employment income: -80% As early as the first few weeks some petty trade
had already started, however at a greatly
reduced scale. Transportation income (pedi cabs,
etc.) would have been stalled until roads were
cleared.
Social support (4Ps): zero 4Ps payments were stalled for the first few
months following the typhoon.
Vegetable production: zero What little income and consumption was provided was reduced to zero following the typhoon.
Fishing income: zero Given the damage to boats and fishing equipment the initial two months were marked by a drastic reduction in fishing activity.
In addition to the table above, one significant difference between livelihood zones was that urban
areas also benefited from the high concentration of humanitarian actors in the immediate aftermath
of the typhoon. Cash transfer programming – both unconditional grants (of a substantial amount)
and cash for work opportunities – was regularly cited during discussions with community leaders
and household representatives. Given the fact that the assessed barangays in the Tacloban city
coastal zone experienced almost blanket coverage of cash transfers, this has been factored in to the
post typhoon scenario; with 11,400 pesos on average for participating in cash for work and 12,000
pesos on average for unconditional cash grants.
The following graphs show all food and income sources per wealth group (adjusted in function of the
assumptions listed above) relative to the survival and livelihoods protection thresholds in the initial
two months following the typhoon for both zones.

Tacloban City Coastal Zone:
Peri Urban Coastal Zone:
This snapshot of the situation in November – December, 2013 illustrates the relative success of the
initial phases of the humanitarian response in meeting the minimum consumption needs of affected
communities in both zones; though to a much greater degree in urban Tacloban where there was a
convergence of cash based and in-kind support.

Tacloban City Coastal: In the Tacloban City Coastal zone there was a considerable amount of both
food aid and cash transfer programming which blanketed the assessed barangays during the first
few months. As shown above, this ensured that essential household needs were being met and
households were able to remain above both key thresholds. A small amount of self-employment
and casual labour continued in both areas as well where assets had not been totally lost and/or
where a small demand continued – in the case of the poor and very poor this was usually in fishing
and in petty trade, initially. The middle income group would still have been able to maintain income
above the livelihood protection threshold (following the initial acute phase of the crisis), even in the
absence of humanitarian aid, given the increase in remittance as well as the salary gained from more
permanent employment (though delays in payment did occur during the first several weeks until
banks reopened).
Peri Urban Coastal: Income from crops would have been reduced to zero (given the damage to rice
stocks which had just been harvested) as would any income linked to livestock holdings. While some
labour opportunities did come online following the initial acute phase of the crisis, these only
supplemented the support that all households were receiving during the first two months of the
crisis. The graph above indicates that in the immediate aftermath of the typhoon that all wealth
groups greatly needed humanitarian support in order to meet their survival and livelihood
protection thresholds. With relief support the middle income and poor groups were able to meet
the survival thresholds initially. The very poor, however, fell just under the survival threshold which
would have entailed a higher reliance on negative coping strategies involving compromises on food
intake as well as reducing other “non-essential” expenditure, such as on education, clothing, etc.
Scenario Summary: November – December, 2013: The humanitarian relief was effective in
addressing the needs of most of the affected populations. This effort was most effective in urban
areas of Tacloban city as greater aid was received in these areas and this assistance included a
combination of cash and in-kind support. All poor and very poor households needed to compromise
on immediate consumption but very poor households in peri-urban areas employed more significant
coping strategies.
4.3 Current situation: May – June, 2014
The second scenario shows the current situation, at just over 6 months on from Yolanda’s landfall.
The following assumptions form the basis of the current scenario:
Key Assumptions Rationale
Staple food prices: +25% Current market data indicates that many staple
food prices are as much as 25% higher than the
same period in the reference year.
Food aid stocks: meeting 67% of kcal needs Many respondents indicated that they still have
food stocks remaining from the distributions
which stopped in April (mostly rice and various
canned goods).
Livestock (pig) sales income: zero The rural-urban livestock trade has yet to

resume in many affected areas.
Casual labour income
For the very poor: - 22%
For the poor: + 8%
For the peri urban zone: - 50%
The very poor are still reliant on unskilled labour
opportunities which remain irregular and low
paying. While certain jobs in some areas are
showing increases for wage rates, others are
showing a decline in wages or fewer
opportunities to work in a given week.
Poor households are accessing jobs which
require a larger skill set (when compared to the
very poor), and generally have a larger income –
most notably in the construction sector.
Remittances: - 25% Remittance is reportedly down – due to the
volume sent in the first few months mostly
affecting the middle income group – and
seasonal trends in remittance.
Self-employment income
For the poor/very poor: - 48%
For the middle income: - 29%
For peri urban households: -50%
While there has been significant recovery in
terms of self-employment for some households,
the constraints of unrecovered assets, lack of
capital, lack of purchasing power amongst the
general population and increased competition in
some areas leads to generally reduced income.
Social support (4Ps): normal 4Ps have resumed as in the reference year.
Cash transfer programming income: zero Pockets of cash transfer programming is still on-
going, though no longer blanketing the
population (generally smaller-scale CFW).
Fishing: -40% Boats and fishing equipment have been rehabilitated in many communities and more support is planned by the government and other actors, however large gaps remain.
Considering the assumptions above, and using the standard survival and livelihoods protection
thresholds, the current situation is as follows:

Tacloban City Coastal:
Peri-Urban Coastal:
Over the past several months demand for labour, especially in the construction sector, has increased
when compared to the situation immediately following the typhoon; though at a greater scale in
more urban areas. Average wages have also increased by as much as 35% for skilled labour and 25-
30% for unskilled labour (though there remains a lack of skilled labour in urban Tacloban).While the
daily wage rates as well as the amount of job opportunities have increased for certain sectors there
has been a reduction in income across all wealth groups when compared to the reference year

which is largely due to the general decline in trade which impacts heavily on primary or secondary
sources of income across all wealth groups. While many sari-sari stores reopened very quickly after
the typhoon12 most have yet to reach a level of sales comparable to those prior to Yolanda, due to
low demand for many of the main commodities, especially rice and other food items, as well as a
lack of sufficient investment capital.
Given the reduction in income, as well as the duration of some forms in-kind relief conducted by a
variety of actors, the demand for many commodities is substantially lower than the reference year.
Demand for rice, in particular, is currently very low - with many sari-sari stores not selling rice at the
moment and larger traders’ and millers’ trade volumes reduced by as much as 40%. Additionally, rice
supply is far lower than last year because of a reduced harvest locally. Many businesses have started
importing from outside Leyte but are not yet supplying pre-Yolanda quantities. Fish markets are
slightly more stable than rice markets given the fact that large amounts of fish are imported from
Mindanao, Eastern Samar and Cebu. The local fish supply however has been reduced due to the loss
of boats, fishing gears and debris in fishing areas. Both fish dealers and retailers sell half of what they
did before Yolanda, mainly due to reduced purchasing power and reduced demand. Despite the fact
that dealers allow traders to buy fish on credit, the number of active fish traders is reduced due to
lost capital.
Tacloban City Coastal: As shown in the graphs above, the increased income from both self-
employment and casual labour (when compared to the first two months after the typhoon) would
allow middle income and poor households in more urban areas to meet the standard survival and
livelihood protection thresholds; even if remaining food stocks had already been exhausted. For the
very poor however, we can see a lingering reliance on food stocks (and the reduction in expenditure
that this entails) to meet these minimum thresholds of survival and livelihoods protection.
Peri Urban Coastal: Despite the fact that food and income gained from field crops and fishing are
down, with the remaining food stocks in many households (following months of relief distributions)
and with the resumption of trading activities, certain casual labour opportunities and self-
employment the poor and middle income households are able to meet both their survival and
livelihoods protection thresholds at present. The very poor households however may not be able to
meet their survival needs when food stocks are exhausted over the coming weeks and risk falling
back on negative coping strategies to make up for any gaps. Even factoring in the remaining food
stocks, many the very poor households are still just under their livelihood protection threshold.
Given the massive loss of productive assets, as well as shelter, and the impact on household
economy that would result from decisions (e.g. compromises) on expenditure levels necessary for
recovery, while at the same time maintaining minimum food consumption levels, a standard
livelihood threshold may not be entirely accurate in showing the current situation of household
economy. Therefore, for the purposes of assessing “recovery needs” the livelihood protection
12
There is anecdotal evidence which indicates that livelihood strategies amongst some households are shifting, rather than stunting. For example, households who were previously engaged in fishing and less so in trade may have invested a small amount of money (perhaps coming from humanitarian interventions) in some form of petty trade given the fact that this is a relatively simple activity to get started and would result in relatively quick turnaround in income (however small) in order to cover the lack of income from fishing labour following the typhoon.

threshold has been adjusted, per wealth group, to reflect the additional costs of recovering
productive assets, as well as rebuilding shelter to “minimum humanitarian standards”.
The following graphs represent the current situation, adjusted to reflect these recovery needs13:
Tacloban City Coastal:
Peri Urban Coastal:
13
The associated shelter costs considered “build back better” construction techniques, including the use of timber frames, corrugated iron sheeting as roofing, and bamboo walls. However, given the high cost of these kinds of materials (between 20,000 – 30,000 pesos depending upon the size) it is much more likely that the vast majority of poor and very poor households would opt for the much cheaper nipa hut construction which is the most common in the zone. The kinds of assets owned per wealth group – tricycles, pedicabs, inputs for petty trade and market stall, etc. – were also calculated into the recovery threshold. The overall costs were then adjusted to reflect the average amount of “recovery” that has occurred in the assessed zones as estimated by community leader interviews – which equates approximately 50% reduction of the overall costs.

Tacloban City Coastal: The middle income group is currently well above the livelihoods
protection/recovery threshold and even in the absence of current food stocks should be able to
recover on their own. However, the rate of recovery is still likely to be hampered by the overall
reduction of purchasing power across all wealth groups. The impact of in-kind distributions by a
variety of actors – especially considering the duration of these distributions (as much as 6 months)
has also likely played a strong role in limiting the speed of recovery amongst some of the larger sari-
sari stores and other traders in the middle income group. Considering the current availability of food
stocks, many of the poor households would also be able to recover to pre-typhoon levels; though
slowly. However, moving forward and in the absence of additional aid, the poor groups will struggle
to recover to humanitarian standards, even with substantial compromises on other household
expenditure and increasing secondary or tertiary income sources.
Peri Urban Coastal: As shown above, even with the additional resources at a household level in the
form of food stocks, even the middle income group would struggle to meet their basic needs while
investing in recovery in a way that would meet humanitarian minimum standards. At present, when
considering the additional costs of rebuilding shelter and livelihoods, the poor group would also fall
far short of meeting their substantial recovery needs.
For the very poor in both zones even considering the current availability of food stocks on a
household level, current income levels still fall well short of the levels needed to meet recovery
standards. In fact, the very poor may even fall below the “survival” threshold when food stocks run
out. This is not to say that a food crisis is expected in the coming months. The very poor, as well as
the poor, households would look to expand their income generating options through additional
labour opportunities, increasing petty trade activity, etc. They would also look to make up for these
gaps through continued compromises on household expenditure, including reductions in “non-
essential” expenses (including education) in order to fill gaps.
Considering the substantial costs of recovering both livelihoods and shelter while maintaining
minimum consumption levels - in the absence of continued support, the poorest households in both
zones will not be able to recover and risk falling back on negative coping strategies which will result
in negative outcomes for children.
It should also be noted that while many households, especially in the Tacloban City Coastal zone, are
currently meeting minimum requirements for food and other household needs – there are major
reductions in living standards which are currently being used and may increase moving forward
when stocks from food aid are exhausted.

5. Forecast: One year post Yolanda – October14, 2014
Looking forward to October, 2014 – 1 year on from the typhoon, the following assumptions have
been made in order to forecast the evolution of recovery needs:
Key Assumption Rationale
Staple food prices +4% Rice markets should stabilise with increased
demand as food stocks run out and the price is
projected to increase in-line with general
inflation rate.
Food aid = 0 Any remaining stocks have long since run out.
Livestock (pig) sales income: zero Perhaps some households will have regained this
minor source of income but not yet comparable
to pre-typhoon levels.
Casual labour income -6%
For peri urban areas: -20%
Driven largely by the construction sector labour
opportunities – in terms of the number of
opportunities and wage rates – are close to pre-
typhoon levels in urban barangays, though
slightly less so in peri urban barangays.
Self-employment income: -29%
For peri urban areas: -20%
Many new petty traders and sari sari stores are
operating, but with reduced capital and lower
levels of profit when compared to the reference
year.
The following graphs show a projection of household economy per wealth group, considering the
larger “recovery threshold” in October, 2014.
Tacloban City Coastal:
14
October has been selected as a reference point as it marks the end of our reference year – just prior to the typhoon.

Peri Urban Coastal:
Tacloban City Coastal: As shown above, the middle income group will likely be in a much more stable
position by October, 2014, especially as income sources recover to a point close to pre-typhoon
levels. The poor group as well, considering the expansion of their income sources between now and
October would also be above the recovery threshold, though minimally. The very poor, however,
would be just over their survival threshold – with 4P’s support and increasing income from some of
their casual labour and self-employment opportunities compared to the current situation (though
still below reference year levels). While they would be able to cover minimum survival needs, they
would still be quite far from adequate recovery in the absence of external support.
Peri Urban Coastal: While all wealth groups’ household economy will likely improve by October,
2014, none of them are projected to meet their recovery needs alone. The middle income will be
close, though the process of recovery will be long and will entail continued compromises on living
standards as well as humanitarian minimum standards (likely in terms of the quality of their shelter
rehabilitation). The poor and very poor groups, even with improving income levels relative to the
current situation, will both fall well below the livelihood recovery threshold.

Summary of HEA scenarios:
As discussed in the sections above, the humanitarian response did well during the initial months
following the typhoon in terms of stabilising household economy and covering basic food and non-
food needs. However, given the duration of certain forms of support, as well as concentrations of aid
in certain areas, a solid foundation for recovery programming has not been set for many of the
poorest households in both zones. Moving forward however, gaps are likely to be much more
pronounced more rural areas.
Part III: Conclusions and Recommendations
6. Conclusions
Following the scenarios and analysis above, and considering the various discussions with community
leaders, household representatives, market traders and other key informants conclusions are drawn
and presented below. Recommendations and an analysis of how Save the Children intends to use
these findings are presented in the table following these conclusions.
1. Understanding livelihoods approaches is crucial to appropriate and effective targeting of
support
During the initial phases of the response a “one-size-fits-all” approach was taken in many barangays.
This was due to a number of valid factors including the scale of the needs, the speed that was
necessary to deliver life-saving support, etc. However, moving forward, there needs to be more
appropriate forms of support in order to achieve recovery benchmarks, especially in terms of shelter
and livelihoods.
There is also anecdotal evidence which indicates that there has been a “shake-up” of livelihood
strategies at the bottom of the wealth spectrum with movement between the poor and very poor
groups. This is largely due to 1) the fragility of their asset base prior to the typhoon, 2) the losses
incurred during the typhoon, and 3) the type of humanitarian response to date. Emerging strategies
and relationships between wealth groups need to be better understood in order to support
households during the recovery phase.
2. The poor and very poor (50 – 75 % of the populations) are unable to increase income
sufficiently to rebuild adequate shelter and livelihoods simultaneously and unaided.
When considering the size of the investments that will be necessary to rebuild livelihoods and
shelter at the same time a negative correlation between shelter and livelihoods becomes evident.
While income levels have started to rise throughout the zone, they have not yet regained pre-
Yolanda levels and remain far from the levels that would be needed to invest properly in recovery.
For this reason, the very poor are especially prone to remaining in inadequate shelter, and making
risky choices around household expenditure and engaging in protracted negative coping strategies
which will inevitably result in negative outcomes for children in the short, medium and long term.

3. Very poor households lack the productive assets necessary to ensure reliable coverage of
household needs and lack the skills needed to access higher paying and more stable income
opportunities
Lifting the very poor to the poor wealth group is a matter of increasing skill and productive assets.
While the first phase responses of government agencies and humanitarian actors (such as blanket
food and cash distributions) did succeed in maintaining household consumption patterns at
humanitarian standards, subsequent phases of the response need to be “smarter” in addressing the
underlying challenges of household economy of the poorest households.
4. Without appropriate support there is a risk of increase numbers of children out of school; very
poor households may not be able to prioritise education
One of the determinants of wealth in the assessed barangays, especially in differentiating between
the poor and very poor households, was whether or not the household could maintain school
enrolment post typhoon. Given the variety of choices in regard to household expenditure, reducing
education costs is among the first “non-essential” expenditure that households will cut. (However, it
should be noted that the non-prioritisation of education is not only economical, but is also socio-
cultural).
5. Poor community engagement in decision making has resulted in uneven and often
inappropriate distribution of inputs
The majority of aid has been “prescriptive” in nature and too often applied in a “one size fits all”
manner. This has led to some inappropriate distributions (i.e. more boats than fishing households, in
some cases) and less effective interventions, especially in terms of meeting recovery needs.
6. Potential aid dependency
While communities and households have been able to recover to some extent (estimated at 50% on
average in the assessed barangays) the rate of recovery has been hampered by months of in-kind
relief distributions, lack of community consultation, and formulaic approaches to relief. Had the shift
to other forms of support been made earlier we may have a greater degree of recovery at the
current time.
7. Delayed recovery means poor and very poor households are less resilient for the coming
Typhoon season.
The October 2014 scenario does not account for another typhoon making landfall, or for flooding or
any other natural disaster. Should even a relatively minor event occur any gains in recovery would
be negated – especially in regards to shelter rehabilitation and recovery of productive livelihood
assets.

7. Recovery programming options
Problem
Response When and for how
long
Why – relevance to
economic security
Programming
considerations
Programming Approaches
Poor community engagement in
decision making has resulted in
uneven distribution of inputs and
missed opportunities for recovery
Continue to enhance recovery
analysis, incorporating
appropriate levels of community
engagement
Consider complimenting recovery
support with access to community
grants to support community
driven initiatives
Immediately – and as a
part of integrated
programming
Communities and
households are
recovering at different
speeds as a result of
varied impact and varied
response.
Needs to be accompanied
by investment in
information analysis.
Potential aid dependency Consider micro finance for the
poor households as a means to
providing cash based support15.
Consider the different products
that may be involved – health
insurance, weather
related/livelihood insurance,
related financial services, savings,
etc.
Running through
phases 2 and 3 of the
response.
More sustainable
recovery solutions for
poor households.
Risks of default and
increased debt if not
targeted correctly (i.e. not
an appropriate intervention
for the very poor).
15 Many poor households will likely be in a position to repay low interest loans moving forward; alternative approaches will be necessary for very poor households.

Economic Programming
Very poor households lack the skills
to access higher paying and more
stable income opportunities.
Targeted vocational training for
the main income earner in the
household followed by support to
linking households with
sustainable job opportunities.
Move forward with vocational
training for youth.
Immediately (the
sooner income earners
are skilled-up the
sooner other forms of
assistance are no
longer necessary
amongst the most
vulnerable).
6 months
To support growth of
very poor HH income.
Facilitate a shift from
extreme poverty to
build economic
resilience amongst the
most vulnerable.
Programme in conjunction
with other sectors,
especially shelter.
Very poor households lack the
productive assets necessary to
ensure reliable coverage of
household needs.
Targeted distribution of
conditional cash transfers and/or
in-kind support to build
productive assets.
Immediately/continued To support the growth
of very poor household
income/asset base and
build economic
resilience.
Ensure adequate
understanding of pre-
existing livelihoods and any
shifts that have occurred;
avoid over distribution of
one item/”one size fits all”;
be flexible in the modality
of delivery and adapt to an
evolving context
Very poor households may struggle
to cover food needs while
rebuilding livelihoods and shelter in
the absence of income support.
Income support is supplemented
by rice/food vouchers to stabilise
household economy – as a
supplementary intervention.
Maximum 3 months. To stabilise household
economy and support
food consumption;
supporting rice market
recovery.
Understanding that food
assistance writ large is no
longer appropriate – this is
an intervention to protect
recovery
Very poor households have no Distribution of livestock (pigs and Immediately; and To provide for Ensure community

savings or viable safety net for
times of increased expenditure
chickens) as a supplement to
other interventions; links to
building a productive asset base
(as above).
sustained over
subsequent phases of
the response.
emergency spending
and planning for
expensive months (e.g.
Start of school).
engagement in targeting.
Essential links to other sectors
Poor and very poor households are
not able to recover adequate
shelter without adequate support.
Deliver sufficient support – mix of
cash and in-kind depending upon
needs and markets.
Before the upcoming
typhoon season.
To protect recovered
assets and support more
holistic recovery.
Implement in conjunction
with livelihoods support –
to protect investments.
Very poor households are not able
to prioritise education
Prioritise income support for
households with young people
who are contributing to household
income.
Targeted vocational training for
out of school young people
Link with and support night
schools where relevant
Phase 2 & 3 recovery Skills & education a
determinant of wealth
breakdown and access
to ‘better’ jobs
Very poor households
unable to meet
livelihoods threshold
leading to an increased
risk to education
outcomes moving
forward
Increased numbers of children out
of school
Distribution of school items
immediately
Targeted income support to the
very poor (see above)
Input support
immediately (as is
ongoing)
Structured support to
income as outlined

above
Poor living conditions – open
defecation common prior to the
Typhoon in some Urban areas
Prioritised and targeted support to
the provision of WASH
Immediately Hygiene and health
costs – ability to work
Link to community
engagement grants