State of Economy: An Overheating Economy?
39
Transcript of State of Economy: An Overheating Economy?


Foreword
The Social Policy and Development Centre is pleased to presentits annual review of the state of the economy in the light of thePakistan Economic Survey 2004-05 and the Federal Budget
2005-06. As soon as the Survey and the Budget are released, theSPDC team goes to work in analyzing the new data, assessing themacroeconomic and fiscal policies, and examining the implications forthe macroeconomic situation and for the poverty and socialdevelopment picture. Our goal is to conduct a thorough and detailedanalysis, including inputting the new data into our large-scaleIntegrated Social Policy and Macro model and conducting any modelsimulations and other econometric work that are necessary to shedlight on the major issues that we see as being pertinent. The researchhas been conducted over a period of two to three weeks, and theReview has been completed within a month of the release of theSurvey and the Budget.
The Review is an effort to objectively present the situation withrespect to the state of the economy. It highlights the impressivegrowth performance and the Government's role in achieving that. Butit also emphasizes that some signs of overheating and stress are nowemerging in the economy that policy makers and other economicparticipants would be ill-advised to ignore. We hope that allstakeholders will find this annual review of Pakistan's economy useful.
Dr. Shaghil Ahmed Acting Managing Director
(i)

SPDC Team
Shaghil Ahmed Haroon Jamal Qazi Masood Ahmed Kalim Hyder Iffat Ara Amir Jahan Khan Farhan Sami KhanAurangzeb Tabinda Areeb Haider Hussain Abdul Aleem Khan
Rizwanullah Khan
Research
Computer Graphics & Designing
(iii)

C o n t e n t s
MACROECONOMIC ANALYSIS . . . . . . . . . . . . . . . . . . . . . . . . . . . . . . . . . . . .1Growth . . . . . . . . . . . . . . . . . . . . . . . . . . . . . . . . . . . . . . . . . . . . . . . . . . . . .2Employment . . . . . . . . . . . . . . . . . . . . . . . . . . . . . . . . . . . . . . . . . . . . . . . . .7Inflation . . . . . . . . . . . . . . . . . . . . . . . . . . . . . . . . . . . . . . . . . . . . . . . . . . . .10External Sector . . . . . . . . . . . . . . . . . . . . . . . . . . . . . . . . . . . . . . . . . . . . . .14Poverty and Social Development . . . . . . . . . . . . . . . . . . . . . . . . . . . . . . . . .19
FISCAL ANALYSIS . . . . . . . . . . . . . . . . . . . . . . . . . . . . . . . . . . . . . . . . . . . .21Budget Deficit . . . . . . . . . . . . . . . . . . . . . . . . . . . . . . . . . . . . . . . . . . . . . . .22Revenues . . . . . . . . . . . . . . . . . . . . . . . . . . . . . . . . . . . . . . . . . . . . . . . . . .23Current and Development Expenditures . . . . . . . . . . . . . . . . . . . . . . . . . . .26Intergovernmental Relations and Regional Development . . . . . . . . . . . . . . .29
CONCLUSIONS . . . . . . . . . . . . . . . . . . . . . . . . . . . . . . . . . . . . . . . . . . . . . . .30
(v)

List of Tables and ChartsTable 1: Growth by Sector . . . . . . . . . . . . . . . . . . . . . . . . . . . . . . . . . . . . . . . . . .2Table 2: Growth by Expenditure . . . . . . . . . . . . . . . . . . . . . . . . . . . . . . . . . . . . . .3Table 3: Growth Accounting . . . . . . . . . . . . . . . . . . . . . . . . . . . . . . . . . . . . . . . . .5Table 4: Current Account . . . . . . . . . . . . . . . . . . . . . . . . . . . . . . . . . . . . . . . . . .14Table 5: Major Exports . . . . . . . . . . . . . . . . . . . . . . . . . . . . . . . . . . . . . . . . . . . .17Table 6: Major Imports . . . . . . . . . . . . . . . . . . . . . . . . . . . . . . . . . . . . . . . . . . . .18Table 7: Imports by Economic Categories . . . . . . . . . . . . . . . . . . . . . . . . . . . . . .19Table 8: Components of SDI . . . . . . . . . . . . . . . . . . . . . . . . . . . . . . . . . . . . . . . .20Table 9: The Federal Budget . . . . . . . . . . . . . . . . . . . . . . . . . . . . . . . . . . . . . . .22Table 10: Fiscal Deficit Financing . . . . . . . . . . . . . . . . . . . . . . . . . . . . . . . . . . . . .23Table 11: Target and Actual Federal Receipts . . . . . . . . . . . . . . . . . . . . . . . . . . . .23Table 12: CBR Tax Collections . . . . . . . . . . . . . . . . . . . . . . . . . . . . . . . . . . . . . . .24Table 13: Growth in Custom Duties . . . . . . . . . . . . . . . . . . . . . . . . . . . . . . . . . . .25Table 14: Non-Tax Revenue . . . . . . . . . . . . . . . . . . . . . . . . . . . . . . . . . . . . . . . . .25Table 15: Budgeted and Actual Federal Expenditures . . . . . . . . . . . . . . . . . . . . . .26Table 16: Current Expenditure . . . . . . . . . . . . . . . . . . . . . . . . . . . . . . . . . . . . . . .27Table 17: Subsidies . . . . . . . . . . . . . . . . . . . . . . . . . . . . . . . . . . . . . . . . . . . . . . .28Table 18: Targeted and Actual Development Expenditure . . . . . . . . . . . . . . . . . . .29Table 19: Provincial Transfers to Federal Government . . . . . . . . . . . . . . . . . . . . .30Table 20: Financing of Provincial Development Prgramme . . . . . . . . . . . . . . . . . .31
Chart 1: Sectoral Contribution to Growth . . . . . . . . . . . . . . . . . . . . . . . . . . . . . . . .3Chart 2: Contribution to Growth of Selected Expenditure Components . . . . . . . . .4Chart 3: Actual and Trend Real GDP Growth . . . . . . . . . . . . . . . . . . . . . . . . . . . .6Chart 4: Investment . . . . . . . . . . . . . . . . . . . . . . . . . . . . . . . . . . . . . . . . . . . . . . .6Chart 5: Interest Rate (T-Bill Rate) . . . . . . . . . . . . . . . . . . . . . . . . . . . . . . . . . . . .7Chart 6: Dynamics of Employed Labour Force . . . . . . . . . . . . . . . . . . . . . . . . . . .7Chart 7: Sectoral Growth 2002-2004 . . . . . . . . . . . . . . . . . . . . . . . . . . . . . . . . . . .8Chart 8: Change in Labour Force 2002-2004 . . . . . . . . . . . . . . . . . . . . . . . . . . . .9Chart 9: Trend in Unemployment Rate . . . . . . . . . . . . . . . . . . . . . . . . . . . . . . .9Chart 10: CPI Inflation . . . . . . . . . . . . . . . . . . . . . . . . . . . . . . . . . . . . . . . . . . .10Chart 11: Contributions of Components to 12-month CPI Inflation . . . . . . . . . .10Chart 12: Contribution Shares of Increase in CPI Inflation from 2004 to 2005 . .11Chart 13: Relationship between Output Gap and Inflation . . . . . . . . . . . . . . . .12Chart 14: Sources of CPI Inflation . . . . . . . . . . . . . . . . . . . . . . . . . . . . . . . . . .13Chart 15: Real Credit to the Private Sector . . . . . . . . . . . . . . . . . . . . . . . . . . .14Chart 16: International Reserves . . . . . . . . . . . . . . . . . . . . . . . . . . . . . . . . . . .15Chart 17: Exchange Rates . . . . . . . . . . . . . . . . . . . . . . . . . . . . . . . . . . . . . . . .16Chart 18: Economic and Social Growth . . . . . . . . . . . . . . . . . . . . . . . . . . . . . .20Chart 19: Components of Social Development Index . . . . . . . . . . . . . . . . . . . .21Chart 20: Tax Shares . . . . . . . . . . . . . . . . . . . . . . . . . . . . . . . . . . . . . . . . . . . .24Chart 21: Composition of Expenditure . . . . . . . . . . . . . . . . . . . . . . . . . . . . . . .27
(vii)

An Overheating Economy?
Research Report No. 62 1
MACROECONOMIC ANALYSIS
According to data reported in theGovernment of Pakistan's EconomicSurvey 2004-05, Pakistan's economy
grew a solid 8.4 percent in FY 2005, one ofthe highest growth rates in the world andsurpassing expectations for the third straightyear. Unlike last year, the growth is morebalanced, with the agriculture,manufacturing, wholesale and retail trade,and services sectors all making significantcontributions. Our analysis, suggests thatthere have been some gains in productivityand, to some extent, in employment as well.The performance is impressive and nodoubt is bolstered by the macroeconomicstability that the government hasengendered over the past few years.
However, there are signs of stress and,in particular, overheating now emerging inthe economy that policy makers and otherparticipants in the economy would be ill-advised to ignore. The most obvious one isinflation, which, based on 12-monthchanges in consumer prices, surpassed 11percent in April. Although supply-sidefactors, which have kept food prices andworld oil prices high, account for asignificant chunk of the increase in inflation,there are underlying demand-sidepressures building up as well, which wedocument in this report. The State Bank ofPakistan seems well aware of thesepressures, and the loose stance ofmonetary policy has begun to reverse--appropriately to us--and more tightening isprobably in order. The provisions in theFederal Budget 2005-06 announced onJune 6 also pose a significant challenge forthe macroeconomic situation. In particular,the proposed increase in the budget deficitexacerbates inflationary pressures andmakes the central bank's task all the moredifficult over the coming quarters.
Another development to keep awatchful eye on is the widening trade deficit,which has turned a current account surplus
into a deficit in FY 2005. Some outpacing ofexports by imports is to be expected in aneconomy which is growing faster than itstrading partners and in which the growth isnot being led by exports. But the differencebetween the growth rate of real imports inthe national income accounts (44 percent)and real exports (8 percent) seemsexcessive and is also suggestive of anoverheating economy. Financing of thecurrent account deficit is not an issue in theshort run, but a continuing trend of awidening current account deficit will haveadverse effects on expectations that couldthreaten the hard-earned credibility on themacroeconomic front. The argument thatmuch of the increase in imports is goingtowards buying up of machinery and othercapital goods which will engineer futuregrowth and future exports is only partlycomforting. This is because the overallinvestment position does not look all thatrosy with real private investment as a shareof real GDP continuing to fall. With risinginterest rates and a continued increase inthe relative price of capital, a reversal in theinvestment-output ratio does not appear tobe on the cards any time soon.
The long-term prospects of theeconomy depend, of course, on how muchof the growth momentum is sustainable.Only per capita growth that results from anincrease in the productive capacity of aneconomy can, and should be, sustained.Quantifying the notion of productivecapacity--in other words, potential output--isnotoriously difficult for any economy.Qualitatively, in the case of Pakistan, onecan discern a combination of transient, e.g.the contribution of weather to a bumpercotton crop, and more persistent, e.g. policystability, in the recent surge in economicactivity. Some illustrative quantitativeestimates that we have made usingstatistical techniques suggest a significantgain in the growth rate of Pakistan'spotential output over the past few years, forwhich the present government deserves

An Overheating Economy?
Research Report No. 622
due credit. But the estimates also suggestthat potential growth may not quite havereached 7 percent yet. While admittedlythese estimates are highly uncertain, weemphasize that overestimating potentialgrowth runs the risk of allowing aggregatedemand, particularly consumption demand,to elevate to a level that cannot bemaintained in the long run with its attendantproblems.
On the poverty front,in the absence of up todate data, it is difficult tosay what the recentacceleration in per capitareal income has done topoverty. The forces atwork in the Social Policyand Development Centre's(SPDC's) Integrated SocialPolicy and Macro (ISPM)model suggest only amodest net reduction inpoverty as a result of thehigh per capita growthrate--the gains from the size of the pieincreasing are being partially offset byfactors such as rapid increases in foodprices and a decrease in the investment-output ratio, which our model documents tobe poverty-increasing. Moreover, we havealso computed a new Social DevelopmentIndex based on indicators of health,education, and access to services such astelephones and electricity. Unfortunately,the growth in this Social Development Indexhas been relatively weak over the 2000-2004 period, despite remarkable progresson the growth front.
We continue to maintain, based on ourmodel simulations, that direct interventionsto reduce income and asset inequality arerequired to make a significant dent intopoverty at an acceptable pace. Whileimprovements have been made in thisregard by budgeting additional developmentoutlays in the new Federal Budget, there isstill a long way to go down the road of
utilizing these effectively and channelingthem to the components, e.g. education andhealth, which matter most for povertyreduction and social sector development.
Growth
Output accelerated significantly inFY2005, with real GDP at factor cost
measured in FY2000 prices expanding by8.4 percent, compared with 6.4 percent the
previous year (Table 1). The growth is well-balanced with the manufacturing andwholesale and retail trade sectors growingat double-digit rates, agricultural outputincreasing by 7.5 percent, and other sectorsalso expanding significantly.
The supply-side sectoral contributions togrowth (in percentage points) are shown inChart 1. These are obtained by multiplyingthe sectoral growth rates by their respectiveshare in total output. The manufacturingsector adds the same, about 2¼ percentagepoints, to total output growth in each of thepast two years. However, the contribution ofagriculture has more than tripled from ½percentage points of growth last year toabout 1¾ percentage points this year, andthe contribution of wholesale and retail tradehas also increased by ¾ percentage points.Thus, manufacturing has continued toperform, and output in agriculture, wholesaleand retail trade, and in other (primarilyservice-oriented) sectors has accelerated.
TABLE 1GROWTH BY SECTOR
Growth Rates (Percent)At constant factor cost of FY 2000
Sector FY 2001 FY 2002 FY 2003 FY 2004 FY 2005Total (GDP at Factor Cost) 1.8 3.1 4.8 6.4 8.4Agriculture -2.2 0.1 4.1 2.2 7.5Manufacturing 9.3 4.5 6.9 14.1 12.5Transport and Communication 5.3 1.2 4.3 5.5 5.6Wholesale and Retail Trade 4.5 2.8 6.0 8.1 12.0Others -1.2 5.9 3.8 5.0 5.4
Source: Pakistan Economic Survey 2004-05

Table 2 reports the demand-sidecomponents of real GDP measured atmarket prices. Real private consumptiongrew a striking 16.8 percent in FY2005,according to data reported in the EconomicSurvey, double the rate posted last year.Real imports, after declining significantly lastyear surged 44.1 percent this year. By
contrast, private fixed investment increasedonly a modest 4.8 percent from the ratherlow base implied by last year's 11 percentcontraction. And, with the decline in publicinvestment of more than 5 percent, theoverall investment picture is a cause forconcern. The very high growth rates ofprivate consumption and imports in FY2005
relative to those of privatefixed investment andexports are suggestive ofan overheating economy.
The decline of 11percent in private fixedinvestment in FY2004shown in Table 2 ispuzzling, as against the 8percent expansionreported for the same yearin the previous EconomicSurvey (not shown here).Similarly, a decline of
An Overheating Economy?
Research Report No. 62 3
TABLE 2GROWTH BY EXPENDITURE
Growth Rates (Percent)At constant market prices of FY 2000
Sector FY 2001 FY 2002 FY 2003 FY 2004 FY 2005Total (GDP at market price) 1.7 3.1 4.8 6.4 7.9Private Consumption 2.3 1.2 0.8 8.2 16.8Public Consumption -20.1 15.0 7.2 2.1 2.3Private Fixed Investment 2.9 13.2 5.7 -11.0 4.8Public Fixed Investment 7.4 -24.5 -0.2 14.0 -5.6Exports 12.2 10.0 28.4 -1.5 7.6Imports 2.2 3.0 11.2 -8.6 44.1
Source: Pakistan Economic Survey 2004-05
CHART 1SECTORAL CONTRIBUTION TO GROWTH
Total (GDP at FC) 100
Agriculture 23
Manufacturing 18
Transport and Communication 11
Wholesale and Retail Trade 18
Others 29
9
8
7
6
5
4
3
2
1
0
Others1.5
Agriculture1.7
Others1.6
Sectoral Shares(%)
Transport & Comm.0.6
Transport & Comm.0.6
Agriculture0.5
Wholesale &Retrail Trade
1.5
Wholesale &Retrail Trade
2.2
Manufacturing2.3
Manufacturing2.2
Perc
enta
gePo
ints
FY 2004 FY 2005
Source: SPDC estimates based on data from Pakistan Economic Survey 2004-05
6.4
8.4

nearly 6 percent in private consumption inFY2004 reported last year has been revisedto an expansion of more than 8 percent, asreported in this year's Economic Survey. Itseems difficult to rationalize such large datarevisions in a single year.
Chart 2 depicts the contributions togrowth of different types of expenditure.
The contribution of final private domesticdemand--the sum of the privateconsumption and private investment bars--is about 12½ percentage points of growth inFY2005, of which only about ½ percentagepoints is accounted for by private fixedinvestment. With the growth in real importssurpassing that of exports by a wide margin,
real net exports shaved off almost 5percentage points from growth. Themagnitude of growth in private consumptionrecorded in FY2005 is likely not sustainableand, in fact, attempts to sustain it mightprove counterproductive.
As part of SPDC's large-scale ISPMmodel, we have estimated aggregate and
sectoral production functions. Theestimates can be used to do agrowth accounting exercise thatdecomposes growth into that due tochanges in the quantity of inputsused and that which can beattributed to shifts in the productionfunction (i.e. productivity gains--theability to get more output from anygiven amount of inputs). In principle,shifts to the production function canbe a result of both transient factors(such as weather-related shocks)and more permanent gains inproductivity (such as due totechnological improvements andgovernment policies).
The results of the growthaccounting exercise for overallgrowth and for agricultural growthare presented in Table 3. Theincrease in inputs added 2.1percentage points to overall growthin FY2005, three-fourths of whichwas the contribution of capital. Theshifts in production functionaccounted for 6.2 percentage pointsof the growth, of which almost a halfcan be attributed to the increase incotton production. In the case ofagricultural output, all but about 1percentage point of the 7.5 percent
growth in FY2005 resulted from productionfunction shifts, of which cotton productioncontributed 5 percentage points. However,the contribution of inputs--specificallylabour--to agricultural growth was asubstantial at 2.6 percentage points ofgrowth during the previous year.
An Overheating Economy?
Research Report No. 624
CHART 2CONTRIBUTION TO GROWTH OF SELECTED
EXPENDITURE COMPONENTS
14
12
10
8
6
4
2
0
-2
-4
-6
FY 2004 FY 2005
Net Exports-4.7
Net Exports1.1
Private FixedInvestment
0.5
Private FixedInvestment
-1.3
PrivateConsumption
12.1
PrivateConsumption
5.8
Perc
enta
gePo
ints
Source: SPDC estimates based on data from Pakistan Economic Survey 2004-05

An Overheating Economy?
Research Report No. 62 5
The large share of growth accountedfor by production function shifts this yearindicates significant gains in total factorproductivity. A substantial portion of theseshifts, however, came in the shape of abumper cotton crop. To the extent that thisis plausibly partly a result of transientfactors, such as good weather and arelatively favourable virus position, it shouldnot lead to excessive euphoria or misplacedcomplacency.
This brings us to a key question aboutthe state of the economy: How much of thegrowth momentum is sustainable goingforward? Ideally one would want to computethe productive capacity (or potential output)of an economy under the assumption of fullemployment of all available factors ofproduction and with all the policy andstructural changes that have taken place built
in. The growth rate of thispotential output could thenbe interpreted as thesustainable rate ofeconomic growth. This is adifficult exercise toaccomplish, particularly fordeveloping countries. Onecrude alternative that isoften used is to determine,using statistical methods,where the long-run trend inoutput seems to he headed,given the actual historicalbehavior. Assuming thegovernment's achievementof the target growth rate of7 percent for 2006 and2007, the picture thatemerges from such anexercise for Pakistan isdepicted in Chart 3.
Several features ofthis chart are noteworthy.First, the actual growthpattern for Pakistan hasbeen quite volatile.
Second, during the 1980s and 1990s, trendgrowth appears to have declined, fromabout 6 percent in 1981 to just 4 percent in2000. There has been a notable shifttoward growth since then, which has pulledup potential growth from its low point of 4percent to about 5½ percent. The exactnumbers here are highly uncertain and onlymeant to be illustrative. The main point isthat while it seems very plausible that thegovernment has facilitated a turnaround inpotential growth in recent years, it seemsequally plausible that potential growth hasnot quite reached rates of 7 percent to 8percent yet.
Some other telling evidence that itmight be difficult to immediately sustaingrowth rates in the range of 7 percent to 8percent from now onwards comes from thebehaviour of the investment-to-GDP ratio,
TABLE 3GROWTH ACCOUNTING
Sector FY 2001 FY 2002 FY 2003 FY 2004 FY 2005Total Growth (%) 1.8 3.1 4.8 6.4 8.4
Contribution (%Points) of:Inputs 2.8 3.2 2.6 2.9 2.1
Of whichCapital 2.4 2.2 2.2 1.9 1.6Labor 0.5 0.9 0.5 1.0 0.5
Production function shifts -1.0 -0.1 2.2 3.5 6.2Of which:
Change in cotton production -0.3 -0.1 -0.2 -0.1 2.8
Agricultural Growth (%) -2.2 0.1 4.1 2.2 7.5
Contribution (% Points) of :
Inputs 1.3 -3.4 0.4 2.6 0.8Of which
Capital 0.0 0.0 0.0 -0.1 -0.1Labor 0.9 -3.7 0.8 2.6 0.9
Production function shifts -3.5 3.5 3.7 -0.4 6.6Of which:
Change in cotton production -0.5 -0.1 -0.4 -0.2 5.0
Source: SPDC estimates.

displayed in Chart 4. Investment, which washovering at an already modest 12½ percentof GDP during the 1990s, has declinedfurther, to about 11 percent of GDP, onaverage, during the period 2003-05. This
has occurred despite strong imports ofmachinery and capital goods. The fall isprobably due in part to an increase ininterest rates, from a low of 2 percent inFY2003 to more than 7 percent in FY2005,
An Overheating Economy?
Research Report No. 626
CHART 3ACTUAL* AND TREND REAL GDP GROWTH
*For 2006, 2007 projected growth of 7% has been usedSource: Actual is from Pakistan Economic Surve 2004-05
Trend is SPDC estimate based on popular statistical filter (Hodrick-Prescott Filter)
10
9
8
7
6
5
4
3
2
1
0
1980
1982
1984
1986
1988
1990
1992
1994
1996
1998
2000
2002
2004
2006
Perc
ent Ac
tual
Trend
CHART 4INVESTMENT
Source: SPDC estimates based on data from Pakistan Economic Survey, 2004-05 and 2002-03.
13.0
12.5
12.0
11.5
11.0
10.5
10.0
1.20
1.15
1.10
1.05
1.00
0.95
0.90
0.85
0.80
Perc
ent R
atio
1991-93 1994-96 1997-99 2000-02 2003-05
Relative Price of Investment
Private Investment-to-GDP
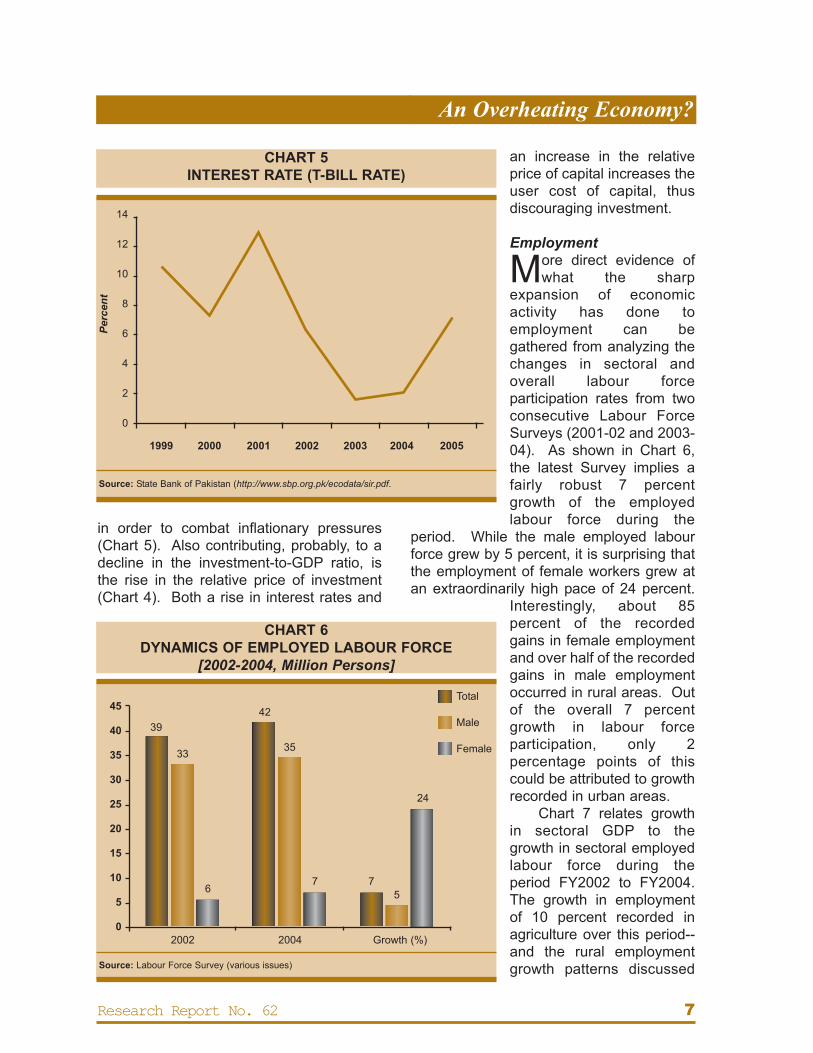
in order to combat inflationary pressures(Chart 5). Also contributing, probably, to adecline in the investment-to-GDP ratio, isthe rise in the relative price of investment(Chart 4). Both a rise in interest rates and
an increase in the relativeprice of capital increases theuser cost of capital, thusdiscouraging investment.
Employment
More direct evidence ofwhat the sharp
expansion of economicactivity has done toemployment can begathered from analyzing thechanges in sectoral andoverall labour forceparticipation rates from twoconsecutive Labour ForceSurveys (2001-02 and 2003-04). As shown in Chart 6,the latest Survey implies afairly robust 7 percentgrowth of the employedlabour force during the
period. While the male employed labourforce grew by 5 percent, it is surprising thatthe employment of female workers grew atan extraordinarily high pace of 24 percent.
Interestingly, about 85percent of the recordedgains in female employmentand over half of the recordedgains in male employmentoccurred in rural areas. Outof the overall 7 percentgrowth in labour forceparticipation, only 2percentage points of thiscould be attributed to growthrecorded in urban areas.
Chart 7 relates growthin sectoral GDP to thegrowth in sectoral employedlabour force during theperiod FY2002 to FY2004.The growth in employmentof 10 percent recorded inagriculture over this period--and the rural employmentgrowth patterns discussed
An Overheating Economy?
Research Report No. 62 7
CHART 5INTEREST RATE (T-BILL RATE)
Source: State Bank of Pakistan (http://www.sbp.org.pk/ecodata/sir.pdf.
14
12
10
8
6
4
2
0
Perc
ent
1999 2000 2001 2002 2003 2004 2005
CHART 6DYNAMICS OF EMPLOYED LABOUR FORCE
[2002-2004, Million Persons]
Source: Labour Force Survey (various issues)
45
40
35
30
25
20
15
10
5
0
39
33
42
35
67 7
5
24
2002 2004 Growth (%)
Total
Male
Female

above--translated into only a 6 percentincrease in agricultural sector GDP. Thissuggests that other factors, such as capital,might have been lagging behind in theagriculture sector over the period. Bycontrast over the same period of 2002-2004,while the employed labour force inmanufacturing grew only about 7 percent,real GDP of manufacturing increased a solid22 percent, the highest gain of all the majorsectors shown. This is suggestive of higherproductivity and/or more capacity utilizationin this sector, which were also hinted at byour growth accounting exercise discussedearlier. However, the phenomenon meritsfurther detailed investigation and research.Another interesting aspect of the dynamicbehaviour of employment and GDP is visiblein the construction sector. Despite 4 percentgrowth in the labor force from 2002 to 2004in this sector, a decline in real GDP isrecorded.
Growth of the non-agricultural labourforce disaggregated into formal and informal
sectors, exposes another area of concern.For statistical purposes, the non-agricultureinformal sector in Pakistan is defined asfollows: all household enterprises ownedand operated by own-account workers,irrespective of the size of the enterprises; orhousehold enterprises owned and operatedby employers with less than 10 personsengaged. As shown in Chart 8, all non-agriculture formal sectors registereddeclines in employment over the period2002-2004. Apparently, all of the growth inthe non-agriculture employed labor force(about 2 million) is recorded in the informalsector. Thus the employment-generatingpart of the high GDP growth in themanufacturing and service sectorsobserved during the period appears to bedue to expansions in informal sectors only,which raises some questions.
There is an evident decline in theunemployment rate, as depicted in Chart 9.The data show that the overallunemployment rate has decreased from 8.3
An Overheating Economy?
Research Report No. 628
CHART 7SECTORAL GROWTH 2002-2004
[Percentage]
Source: SPDC estimates
25
20
15
10
5
0
-5
Labor Force Real GDP
10
22
15
1012
6 7 74
-3
4 4
Agriculture Manufacturing Trade Construction Transport & CommunityCommunication Services

An Overheating Economy?
Research Report No. 62 9
CHART 8CHANGE IN LABOR FORCE 2002-2004
[Million Persons]
Source: Labour Force Survey (various issues)
CHART 9TREND IN UNEMPLOYMENT RATE
Source: Pakistan Economic Survey (various issues)
9.0
8.0
7.0
6.0
5.0
4.0
3.0
2.0
1.0
0.01980s 1990-94 1995-99 2000-01 2001-02 2002-03 2003-04
GDP
Unemployment
6.1
4.9
4.0
1.8
3.1
4.8
6.4
7.77.8
8.3
6.06.06.2
3.4
4
3
2
1
0
-1
1.61
0.39
0.82
0.23 0.150.37
3.56
-0.04-0.41
-0.13 -0.05 -0.12
-0.76Agriculture Manufacturing Trade Construction Transport & TotalCommunity
Communication Services
Formal Informal
Perc
ent

percent in 2001-02 to 7.7 percent in 2003-04. Thus, the high GDP growth recordedover the period is making a dent intounemployment, but it should be noted thatthe unemployment rate still remains farabove the average rate of 3.4 percent thatprevailed in the 1980s.
Inflation
Following a generally declining trendsince about the mid-1990s, inflation has
picked up sharply since last year, reachingdouble-digit levels in April on the basis of12-month changes in consumer prices(Chart 10). The chart also demonstratesthat the rise in inflation has not just beenrestricted to increases in food and transportand communications prices (which includethe price of oil). A measure of CPI inflationthat excludes these two components (alsographed in Chart 10) still shows a doublingfrom about 4 percent to 8 percent over thepast year.
The contributions to inflation of thedifferent components of the CPI are shownin Chart 11. Of the 8.5 percent rise inconsumer prices from June 2003 to June
An Overheating Economy?
Research Report No. 6210
CHART 10CPI INFLATION (12-MONTH CHANGES)
Source: Based on data from SBP Annual Report (various issues)
14
12
10
8
6
4
2
0
Perc
ent
Jul
Oct
Jan
Apr Ju
l
Oct
Jan
Apr Ju
l
Oct
Jan
Apr Ju
l
Oct
Jan
Apr Ju
l
Oct
Jan
Apr Ju
l
Oct
Jan
Apr Ju
l
Oct
Jan
Apr Ju
l
Oct
Jan
Apr Ju
l
Oct
Jan
Apr
CPI Inflation
CPI Inflationexcluding Foodand Transport &Communication
1996 1997 1998 1999 2000 2001 2002 2003 2004 2005
CHART 11CONTRIBUTIONS OF COMPONENTS TO
12-MONTH CPI INFLATION
12
10
8
6
4
2
0
Food,Beverages
and Tobacco5.2
Food,Beverages
and Tobacco6.4
House Rent1.9
House Rent2.8
Others0.8
Others1.1
Transpt. & Comm.0.6
Transpt. & Comm.0.8
Perc
enta
gePo
ints
June 03 - June 04 April 04 - April 05
Source: SPDC estimates based on data from SBP Annual Report(various issues)
8.5%
11.1%

2004, 5.2 percentage points (or 63 percent)was accounted for by rises in food pricesand another 1.9 percentage points byincreases in the house rent component.Between April 2004 and April 2005, foodprice increases continued to be a heavycontributor to inflation, adding 6.4percentage points to CPI inflation, but thehouse rent component and othercomponents also added significantly, 2.8percentage points and 1.1 percentagepoints, respectively.
Chart 12 displays the proportion of thechange in CPI inflation between FY2004and FY2005 that can be accounted for bythe different components. Together, foodprices and transportation andcommunications prices account for a littleover a half of the increase in inflation inFY2005. In other words, nearly half of therise in inflation from the previous year isaccounted for by an increase in the houserent and other components. This suggeststhat demand-side pressures to inflationhave now built up significantly in addition tosupply-side pressures that work throughvolatile oil and food prices.
This merits further investigation.According to macroeconomic theory, one ofthe key determinants of fundamentalinflationary pressures in the economy is theoutput gap, the deviation of actual outputfrom potential output. If the output gap ispositive--that is, the actual output of theeconomy is above the level that can besustained in the long run--there is atendency for inflation to increase due tocapacity constraints, overtime shifts,bottlenecks, running down of inventories,etc. On the other hand, if there is sparecapacity and actual output is belowpotential, there is a tendency for the rate ofinflation to decline. This does not, of course,mean that higher growth rates lead to higherinflation necessarily. If actual growth is high,but the productive capacity of the economyis keeping pace and the extra output beingdemanded is being produced easily, thereshould be no pressure on inflation toincrease. Or, if actual growth is high relativeto potential growth, but the economy hadbeen mired in a recessionary situationwhere the actual level of output to begin withwas much lower than the level of potential
output, then actual output growingfaster is just a catching up processand should not lead to higherinflation.
So what does the output gapsituation of Pakistan look like, andwhat implications does this havefor inflation? Based on theestimates of potential output thatwe obtained earlier (which weagain emphasize are meant to beillustrative only), since the mid-1990s, Pakistan's output gap hasgenerally been falling and inflationhas shown a tendency to fall withit (Chart 13). In 2003, the outputgap turned around and started torise, and it is about the same timethat inflation also turned aroundand started to pick up. However,the output gap was still negative
An Overheating Economy?
Research Report No. 62 11
CHART 12CONTRIBUTION SHARES OF INCREASE IN
CPI INFLATION FROM 2004 TO 2005
Source: SPDC estimates
Transporation &Communication
10%
Food, Beverages& Tobacco
43%
House Rent33%
Others14%

until last year. Now it has turned positive inFY2005 and, with forecasted growth of 7percent in 2006 and 2007, the output gapwill pick up further. On this count,inflationary pressures, unless checkedappropriately will become more severe.
We have also estimated aneconometric equation for inflation based ondeterminants that are suggested byeconomic theory. The model incorporatesthe effects of the output gap as mentionedabove, expectation or inertial effects throughthe previous year's inflation rate, pass-through from nominal exchange ratechanges, the impact of the world price ofimports (including oil imports), and theinfluence of changes in excess liquidity inthe market, proxied by the lagged value ofgrowth in the money supply-to-GDP ratio.The model fits fairly well on statistical criteriaand is able to explain about two-thirds of thevariation in the CPI inflation rate.
The sources of inflation based on thismodel for FY2004 and FY2005 are shown in
Chart 14. The contribution of the world priceof imports was quite large in FY2004--themodel's predicted effect on inflation fromchanges in world price of our imports was 62percent of the actual inflation rate for thatyear. Changes in the money supply-to-GDPratio have made less of a contribution toinflation this year than last year, but thecontribution is still positive. The model alsohelps us to assess price pressures for nextyear. First, with a rise in inflation this year,the expectations effects which are quitelarge will only exacerbate. Second, if therupee depreciates more, this will have somepass through effects on inflation. Third, theoutput gap turned positive this year with theimplication that it has now become a sourceof inflationary pressure. These three factorswill not necessarily automatically dissipatewith a deceleration of food prices and worldoil prices, and the now tightening stance ofmonetary policy needs to be maintained.
Chart 14 also shows that about a third ofthe inflation rate in FY2005 is not explained by
An Overheating Economy?
Research Report No. 6212
CHART 13RELATIONSHIP BETWEEN OUTPUT GAP* AND INFLATION
*Output Gap is percent deviation of actual output from potential output. Potential output is computed from a statistical filter (Hodrick PrescottFilter). Growth of 7% is assumed in 2006 and 2007 in working the projections of output gap for these years.
Source: SPDC estimates
14
12
10
8
6
4
2
0
5
4
3
2
1
0
-1
-2
-3
-4
-5
Perc
ent Percent
1996 1997 1998 1999 2000 2001 2002 2003 2004 2005 2006 2007
Output Gap
Inflation (CPI)

the variables in our equation but accountedfor by other factors not modeled, i.e. theresidual. One of these non-modeled factorsmight be the recent expansion of real credit tothe private sector, for which we do not haveconsistent data for a long enough period to beable to incorporate this variable directly in ourequation.
As can be seen from Chart 15, realcredit to the private sector has certainly
expanded sharply over the past two years.No doubt this growth in credit hascontributed to the recent strength of theeconomy, but the relationship betweencredit and growth can be tricky one. Cross-country evidence establishes a positiverelationship between financial developmentand growth. But, this holds only up to apoint. There is also evidence that oncecredit goes beyond the point that can be
An Overheating Economy?
Research Report No. 62 13
CHART 14SOURCES OF CPI INFLATION
Source: SPDC estimates
Growth in Money-to-GDP Ratio (Lagged)
38%
Growth in Money-to-GDP Ratio (Lagged)
11%
Output Gap(Demand Relative toSupply Pressures)
-15%
Nominale ExchangeRate Depreciation
-8%
Nominale ExchangeRate Depreciation
8%
Other Factors(Residual)
-22%
Other Factors(Residual)
33%
ExpectationsIntertia45%
Expectations(Intertia)
33%
Import PriceDollars62%
( F Y 2 0 0 4 )
( F Y 2 0 0 5 )
Output Gap(Demand Relative toSupply Pressures)
2%
Import Pricein Dollars
13%

safely supported by thebanking system and the existingregulatory environment, it canhave adverse effects on theeconomy. Of course, whencredit growth becomesexcessive is in the eye of thebeholder and, clearly, moreresearch needs to be done onthis issue.
On balance, the aboveevidence appears to suggest aneed for some cooling off ofdemand in the short run, whileat the same time continuingpolicies and changes thatwould in the long run create anenabling environment forgrowth in the range of 7percent to 8 percent to becomesustainable.
External Sector
The trade deficitwidened to $3.4
billion during the periodof July 2004 to March2005 from its value of$0.6 billion over thesame nine months ayear ago (Table 4).This reflected importgrowth of about 40percent (from about$10 billion to $14billion), which outpacedexport growth of 15percent (from $9 billionto about $10½ billion).With the deficit on theservices balance alsodoubling, the currentaccount during theperiod registered adeficit of $1.4 billioncompared to a surplus
An Overheating Economy?
Research Report No. 6214
CHART 15REAL CREDIT TO THE PRIVATE SECTOR
Source: SPDC estimates based on data from SBP, Annual Report (various issues)
300
250
200
150
100
50
0
Rup
ees
Billio
n
1995
9476 71
83
18
54 49
151
279
107
1996 1997 1998 1999 2000 2001 2002 2003 2004
TABLE 4CURRENT ACCOUNT
(US $ Million)
Trade Balance -444 -1212 -645 -3378Exports (f.o.b) 10889 12395 9175 10572Imports (f.o.b) -11333 -13607 -9820 -13950
Services (Net) -2128 -3585 -2240 -4238Receipts 2967 2914 2382 2660Payments -5095 -6499 -4622 -6898
Shipment -951 -1241 -887 -1266Investment Income -2381 -2392 -1691 -1884Others -1763 -2866 -2044 -3748
Private Unrequited Transfers (net) 5737 6110 4390 6258(Workers Remittances) 4237 3871 2875 3051
Current Account Balance 3165 1313 1505 -1358
Trade Balance as % of GDP 1.3 3.4 - -
Current Account Balance 3.8 1.4 - -as % of GDP
Source: Pakistan Economic Survey, 2004-05
FY 2003 FY 2004 FY 2004 FY 2005July - March

of $1.5 billion over the same months a yearago. However, the current account deficit
was much less than the deficit onmerchandise trade and services combined($7.6 billion) during the July 2004 to March2005 period because net private unrequitedtransfers were positive to the tune of $6.2billion. In particular, workers' remittancesfrom abroad have started to increase again,rising to about $3 billion during the period.
Even though the current account hasdipped into the red, financing it is not anissue at the moment. The central bank'swar chest of international reserves, graphedin Chart 16, has continued to rise and stoodat nearly $14 billion in March 2005.However, expressed in relation to imports,reserves have fallen to about 9 months ofimports from 12 months of imports inFY2004. The government also has beenable to tap international markets at betterterms and should be able to continue to do
so in the near future. That said, if thecurrent account deficit gets much worse and
persists, this could havecredibility effects that couldjeopardize macroeconomicstability and make it'sfinancing more difficultthrough an increase in thecountry risk premium.
Over the past year orso, the rupee hasdepreciated more than 3percent against the dollar(Chart 17). However, thisdevelopment by itself isunlikely to improve ourcompetitiveness and boostour exports relative toimports because ourinflation rate has been muchhigher than that of ourtrading partners. Adjustingfor this price differential, atrade-weighted real effectiveexchange rate (REER) thatwe have computed showsan appreciation, on balance,over the past year (Chart
17). However, the REER remains at adepreciated level, relative to historicalaverages.
The behavior of major exports is shownin Table 5. Over the nine-month period fromJuly 2004 to March 2005, total exports grewabout 15 percent compared with the sameperiod a year earlier. This was higher thangrowth of 10 percent in exports recorded inFY2004 relative to FY2003. Note thatexports of textiles manufactures, which lastyear constituted about two-thirds of totalexports, increased just 2.1 percent.However this slow growth was made up by23.4 percent growth in exports of primarycommodities (led by raw cotton), 22.4percent growth in exports of othermanufactures, and 90.3 percent growth inexports of other goods. While thediversification of Pakistan's export base is a
An Overheating Economy?
Research Report No. 62 15
CHART 16INTERNATIONAL RESERVES*
*Gold and Foreign Exchange Reserves**End of periodSource: SBP Annual Report (various issues)
16
14
12
10
8
6
4
2
0
US
$Bi
llion
3.8
7.1
11.5
13.213.7
FY 01** FY 02** FY 03** FY 04** Mar. 05

welcome development, the relatively weakperformance of textiles manufactures doesnot augur well for making inroads in thepost-textile quota environment, although it isprobably too early to tell just yet. Onepossible reason for the relatively weakperformance of textiles in value terms mightbe that gains in export volume (quantity) arebeing offset by decreases in export unitvalues. In that case, we should see higher(and positive) growth rates of volumescompared to those of values, which doesnot appear to be the case generally, exceptfor towels and ready-made garments.
Table 6 reveals that total imports rosenearly 40 percent during the July 2004 toMarch 2005 period, relative to their valueduring the same months a year ago. Thiscame on the heels of strong import growthlast year as well. Strong increases wererecorded in nearly all major groups withgrowth of 20.8 percent in food imports (ledby wheat), 54.9 percent in machineryimports (which constitute about a third of allimports), 30.9 percent in petroleum and
petroleum products, and 32.9 percent inimports of agriculture and chemical goods(including fertilizer and insecticides).Considering components within the broadgroups, the increases in import volumegrowth are generally less pronounced thanthat of import value growth, reflectingincreases in unit values of imports as well.
As shown in Table 7, the growth rates ofimports by type of good during the July 2004to December 2004 period from a year earlierwere 30.9 percent for capital goods, 57.7percent for raw material for capital goods,and 32.9 percent for raw material forconsumer goods. Consumer goods importshave also been strong, rising 41.5 percent,but they have a share of only 10 percent.There is, thus, much to the argument thatimports are of the productive kind and couldlead down the road to much stronger exportperformance. However, it is not hearteningthat despite strong imports of capital goods,including machinery, the performance ofprivate fixed investment (discussed earlier)has been rather weak.
An Overheating Economy?
Research Report No. 6216
CHART 17EXCHANGE RATES
Source: Nominal: from SBP Statistical BulletinREER (Real Effective Exchange Rate):SPDC estimates
Note: A rise in exchange rate represents a depriciation of the rupee.
60.0
59.5
59.0
58.5
58.0
57.5
57.0
56.5
56.0
101.5
101.0
100.5
100.0
99.5
99.0
98.5
98.0
Mar
. 04
Apr
. 04
May
. 04
Jun.
04
Jul.
04
Aug
. 04
Sep
. 04
Oct
. 04
Nov
. 04
Dec
. 04
Jan.
05
Feb.
05
Mar
. 05
Rup
ees
perU
S$
Index(M
ar.04=
100)
REER
Nominal

An Overheating Economy?
Research Report No. 62 17
Prim
ary
Com
mod
ities
1012
9.1
1017
8.3
0.5
-74
48.
491
99.
023
.4-
Ric
e55
663
514
.20.
246
160
230
.431
.0R
aw c
otto
n49
48-2
.7-3
2.3
3594
171.
419
0.0
Fish
& F
ish
Pre
para
tion
135
153
13.7
10.8
115
98-1
5.4
-24.
0Fr
uits
8310
323
.436
.977
71-7
.8-2
1.0
Vege
tabl
es32
31-0
.6-1
1.4
1817
-5.6
-48.
0To
bacc
o5
1110
6.1
-9
7-2
2.2
-27.
0W
heat
130
6-9
5.4
-96.
26
--
-Sp
ices
1619
20.0
17.2
1510
-35.
9-3
2.0
Oil
seed
s, n
uts
and
kern
als
711
55.6
34.4
821
162.
524
7.0
Text
ile M
anuf
actu
res
7264
65.1
8073
65.6
11.1
-58
5065
.759
7258
.52.
1-
Cot
ton
Yarn
928
1127
21.4
-3.9
848
729
-13.
9-9
.0C
otto
n C
loth
1346
1712
27.2
18.3
1221
1333
9.2
5.0
Kni
twea
r11
4714
5927
.227
.310
3112
6522
.810
.0B
edw
ear
1329
1383
4.1
1.0
1008
910
-9.7
-1.0
Tow
els
375
404
7.7
1.2
277
345
24.5
32.0
Rea
dym
ade
Gar
men
ts10
9399
3-9
.1-2
4.3
733
754
2.9
11.0
Syn
thet
ic T
extil
e57
447
1-1
8.0
-16.
937
522
1-4
1.1
-39.
0O
ther
s47
252
511
.2-
359
415
15.6
-
Oth
er M
anuf
actu
res
2043
18.3
2149
17.5
5.2
-15
9017
.919
4619
.122
.4-
Car
pets
, Rug
s &
Mat
s22
123
14.
8-2
.616
418
814
.39.
0P
etro
luem
& P
etro
luem
Pro
duct
s24
929
518
.5-1
.819
431
662
.936
.0Sp
orts
Goo
ds33
532
5-3
.1-
229
212
-7.6
-Le
athe
r Tan
ned
235
252
7.2
4.6
177
202
14.7
11.0
Leat
her M
anuf
actu
res
387
414
7.2
-31
134
711
.6-
Foot
wea
r12
11-1
3.6
27.7
6583
27.7
53.0
Sur
gica
l Goo
ds &
Inst
rum
ents
150
133
-11.
6-
100
118
17.9
-C
utle
rry
3030
0.3
24.0
2120
-4.8
-O
nyx
Man
ufac
ture
d12
12-1
.82.
08
7-1
2.5
-15.
0C
hem
ical
s &
Pha
rmac
eutic
als
261
263
0.8
-19
625
630
.5-
Eng
inee
ring
Goo
ds74
100
35.1
-69
115
66.9
-G
ems
& J
ewel
ry25
2813
.8-
2017
-15.
0-
Furn
iture
810
15.5
-7
928
.6-
Mol
asse
s45
473.
114
.529
5693
.111
.0
Oth
ers
841
7.5
1075
8.7
27.7
-72
0.6
8.1
1371
13.4
90.3
-
Tota
l11
160
100.
012
313
100.
010
.3-
8905
100.
010
207
100.
014
.6-
Sour
ce:P
akis
tan
Eco
nom
ic S
urve
y 20
04-0
5, S
BP
Ann
ual R
epor
t (20
03-0
4), a
nd S
BP
Third
Qua
rterly
Rep
ort 2
004-
05
TAB
LE 5
MA
JOR
EXP
OR
TS(V
alue
s in
US
$ M
illio
n)Ju
ly-M
arch
July
-Mar
chJu
ly-M
arch
FY20
03FY
2004
Gro
wth
(%)
FY20
04FY
2005
Gro
wth
(%)
Valu
e%
Sha
reVa
lue
% S
hare
Valu
eQ
uant
ityVa
lue
% S
hare
Valu
e%
Sha
reVa
lue
Qua
ntity

An Overheating Economy?
Research Report No. 6218
Food Group
9788.0
10336.6
5.7-
7817.4
9426.5
20.6-
Wheat U
nmiled
2924
-17.8-27.0
1556
271.5306.0
Tea173
19311.5
7.2151
17515.7
15.0S
oyabean Oil
4846
-4.02.3
4049
21.3-22.0
Palm
Oil
539613
13.75.7
466478
2.52.0
Pulses
11675
-35.233.7
5383
56.850.0
Others
7484
12.856
10282.4
-
Machinery G
roup2942
24.14220
27.143.4
-2513
23.93892
26.954.9
-P
ower G
enerating269
2783.5
-205
27332.7
-Textile
532598
12.4-
419697
66.3-
Construction &
Mining
101102
0.2-
73112
53.6-
Electrical &
apparatus217
25819.1
-180
22827.0
-R
oad Motor Vehicles
501653
30.2-
482706
46.5-
Others
13232332
76.3-
11531876
62.7-
Petroleum G
roup3066
25.13167
20.33.3
-2108
20.12761
19.130.9
-P
etroleum P
roducts1700
1401-17.6
35.9936
114922.9
8P
etroleum C
rude1367
176529.2
16.21173
161137.4
19
Textile Group
2221.8
2611.7
17.6194
1.8238
1.622.6
Agri/O
ther Chem
ical Group
216117.7
279817.9
29.5-
197218.8
262118.1
32.9-
Fertilizer240
28518.7
4.1191
26237.5
10.0Insecticides
59124
112.186.2
78107
37.229.0
Plastic M
aterial421
54930.4
18.0387
58150.1
33.0M
edicinal Products
222275
23.88.9
201200
-0.517.0
Other
12191565
28.3-
11151471
31.9-
Metal G
roup507
4.2688
4.435.5
-477
4.5857
5.979.6
-Iron &
Steel402
51227.3
15.0351
62578.1
84.0other
105176
67.2-
126232
83.7-
Miscellaneous/O
thers2344
19.23426
22.046.2
-2452
23.43158
21.828.8
-
Total12220
100.015592
100.027.6
-10497
100.014469
100.037.8
-
Source:Pakistan E
conomic S
urvey 2004-05, SB
PA
nnual Report (2003-04), and S
BP
Third Quarterly R
eport 2004-05
TAB
LE 6M
AJO
R IM
POR
TS(Values in U
S $ Million)
July-March
July-March
July-March
FY2003
FY2004
Grow
th (%)
FY2004
FY2005
Grow
th (%)
Value%
ShareValue
% Share
ValueQ
uantityValue
% Share
Value%
ShareValue
Quantity

An Overheating Economy?
Research Report No. 62 19
Poverty and Social Development
The recent Pakistan Economic Surveyenlightens us that "Readers would have
to wait till December 2005 to get estimatesof poverty from the Provincial level survey ofthe PSLM which is focusing on householdconsumption and expenditure…. Theestimates of poverty for 2004-05 would thenbe available for all of us."
SPDC's large-scale ISPM model has apoverty and inequality module in it. Povertyis estimated to be a function of per capitaincome and income inequality; inequality, inturn, is estimated to be function of variablessuch as per capita income, food prices,investment-output ratio, and developmentexpenditures as a share of GDP, etc. Inprinciple, therefore, we have the expertise toforecast poverty for 2005 but, in practice,this requires us to take a stand on what ishappening to inequality or how therelationship between per capita income andinequality has changed recently. If we takethe historical relationship between percapita growth and inequality, then our modelpredicts poverty to have gone up becausehistorically per capita growth has beenaccompanied by significant increases inincome inequality. On the other hand, if weassume that the recent per capita growth isdistribution-neutral, then poverty isprojected to have gone down, but only
modestly because thep o v e r t y - r e d u c i n geffects of growth arepartially offset by thep o v e r t y - i n d u c i n geffects of increases infood prices and a fallin investment as ashare of GDP.
We would preferto let the data speakfor itself about howthe relationshipbetween per capitagrowth and inequality
has changed and, therefore, eagerly awaitthe new PSLM/HIES survey. Meanwhile,let's focus on social development and relateit to economic performance. There is nowwidespread dissatisfaction with per capitaincome as the sole indicator to measure thewell-being of a nation in any case. Theemphasis has now shifted to alternativemeasures of development. Socialindicators, quality of life, basic needs,human development, and standard of livingare the new approaches, which are beingdiscussed and propagated by internationalinstitutions and concerned scholars. Interestin social development as a developmentpolicy objective appears to have beenpromoted by the observed unevenness inthe economic performance of developingcountries. In many cases, despite positiveand high GDP growth rates, economicdevelopment has failed to reach allsegments of society and the poorest havehardly reaped any of the benefits ofdevelopment.
To summarize various social indicators,we constructed a Social Development Index(SDI) for Pakistan using the "PrincipalComponent" statistical technique for theperiod 1960-2004. The choice ofcomponent variables for forming thecomposite SDI is primarily governed by theavailability of consistent time series data.Individual indicators used to create the
TABLE 7IMPORTS BY ECONOMIC CATEGORIES
(US $ Million)
FY 2004 FY 2005 (July - December) (July - December)Value % Share Value % Share % Change
Categories (1) (2) (3) (4) (3 over 1)Capital Goods 2084 32 2729 31 31
Raw Material for Capital Goods 450 7 710 8 58
Raw Material for Consumer Goods 3418 52 4542 51 33
Consumer Goods 658 10 932 10 42
Total 6611 100 8913 100 35
Source: SPDC estimates based on data from Pakistan Economic Survey 2004-05

components of the SDI represent healthservices, education facilities, andconsumption of durable goods and energy.The constituent variables of the SDI are
listed in Table 8. All data on these variablesare taken from various issues of thePakistan Economic Surveys.
The comparison between growth in theSDI index and per capita real GDP growth isdepicted in Chart 18. From the 1960s untilthe 1980s, changes in per capita growth andgrowth in social development are positivelyrelated. In particular, the 1970s period ofproclaimed trickle-up policies led to slippagein per capita growth, which was alsoaccompanied by slippage in growth of socialdevelopment. This bolsters the argumentthat higher growth in income is aprerequisite for higher achievement in socialand human development. Nevertheless, thepositive relationship between growth andimprovements in social development doesnot hold strongly in the fourth period. Duringthe 1990s, a decrease in per capita GDPgrowth did not significantly affect SDIgrowth. This is perhaps indicative of theSocial Action Programme's (SAP) successin improving access to basic public social
An Overheating Economy?
Research Report No. 6220
TABLE 8COMPONENTS OF SDI
Consumption:Cars Per Million PopulationTelephone Per Million PopulationProportion of Non-Agriculture Labor ForceElectricity Generation Per Million Population
Education:Primary Male Enrollment Rate Primary Female Enrollment RateSecondary Male Enrollment RateSecondary Female Enrollment RateTertiary MaleEnrollment RateTertiary Female Enrollment Rate
Health:Physicians Per Million PopulationHospital Beds Per Million PopulationInfant Survival Rate Per 1000 Live Births
CHART 18ECONOMIC AND SOCIAL GROWTH
[Average Annual Growth Rates]
Source: SPDC estimates
4
3
2
1
0
2.89
1.531.64
3.02
1.792.01 1.92
2.04
0.95
2.36
1.48
60’s 70’s 80’s 90’s 2000-2004 1960-2004
1
Per Capita GDP
Social Development Index

An Overheating Economy?
Research Report No. 62 21
services and the dynamism demonstratedby the private sector in filling the gap indemand.
The last period exhibits a completelydifferent and rather disconcerting picture.Despite sizable gains in per capita real GDPduring the 2000-2004 period, the averagegrowth in SDI is quite low, compared withthe 1980s and 1990s. The componentanalysis (Chart 19) clearly revealscontinued solid performance in theconsumption component of the SDI (whichmeasures availability of cars, telephones,and electricity), but average growth ineducation and health indicators since 2000has been visibly inglorious. However, to befair, the year-wise growth rates in the healthand education components of SDI doindicate some upward trend after 2002.
The evidence, based on the selectedindictors and methodology suggest thateconomic growth is a pre-requisite for socialdevelopment. Nevertheless, over the past
few years, the gap between economicperformance and social development,especially human development as it relatesto health and education, has widened, whichneeds to be redressed on an urgent basis.
FISCAL ANALYSIS
Unencumbered by IMF pressures forfiscal restraint, the Federal Budget2005-06 turns the stance of fiscal
policy significantly more expansionary. Thishas both positive and negative aspects.The substantial increases in developmentexpenditures, which can potentially helpalleviate poverty and foster social andhuman development are to be lauded. Alsoto be commended, in principle, are the taxincentives being provided to exporters in anattempt to broaden the source of growth toinclude exports.
CHART 19COMPONENTS OF SOCIAL DEVELOPMENT INDEX
[Average Annual Growth Rates]
Source: SPDC estimates
4
3
2
1
0Per Capita GDP Social Development Education Health Consumption
Index
2.89
1.64
3.02
2.01 2.04
1.53
1.79 1,
92
0.95
2.05
0.46
1.96
2.33
0.34
0.97
1.81
2.19
0.95
0.21
1.74
1.05
1.58
1.85
1.69
1
1960s 1970s 1980s 1990s 2000-2004

But the widening gap between totalexpenditures and total revenues, leading toan increase in the budget deficit, may not bewise in an economy which is experiencingdouble-digit inflation and is showing signs ofoverheating. Adjusted for the businesscycle, the budget is even moreexpansionary than it might appear at first.More efforts should be made to finance therequisite increase in developmentexpenditures through some expenditureswitching and through more targetedmeasures to increase tax revenues andexpand the tax base. Moreover, theexperience from last year suggests that thePublic Sector Development Programme(PSDP) needs considerable improvement tomore effectively channel and utilize theexpenditures. Otherwise, the government'sintentions underlying the increasedallocation of development expenditures maynot have the desired results in addressingthe problems of poverty, inequality, and lackof social development more generally.
Budget Deficit
The revised fiscal deficit of Rs. 246 billionfor FY2005 is Rs. 33 billion (or 15½
percent) more than budgeted, as reported inTable 9. Moreover, in FY2006, the budgetdeficit is slated to increase further by nearly20 percent from this revised estimate. As ashare of GDP, the revised budget deficit of3.8 percent of GDP is projected to increaseto 4 percent of GDP in FY2006, if weassume economic growth of 7 percent andinflation of 6 percent for that year. To theextent that the deficit is being fueled by theprojected increase of nearly 35 percent indevelopment expenditures, it should beexpected to spur growth further. But notethat development expenditures start off froma low base, with their share in totalexpenditure being just 20 percent.Moreover, even though currentexpenditures are expected to rise only 5.3percent from the revised estimates forFY2005, the revised estimates of theseexpenditures were 12.4 percent higher thanbudgeted for that year. Compared tobudgeted values for FY2005, the budget forFY2006 implies an increase in current
An Overheating Economy?
Research Report No. 6222
TABLE 9THE FEDERAL BUDGET
(Rs. Billion)
FY 2005 FY 2006Budgeted Revised Growth (%) Budgeted Growth (%)
Categories (1) (2) (2 over 1) (3) (3 over 2)
Current Expenditures 700.8 784.7 12.0 826.5 5.3Minus Repayment of Foreign Loans 51.1 54.3 6.2 65.3 20.4
Current Expenditures (excludingRepayments of Foreign Debt) 649.7 730.4 12.4 761.2 4.2
Plus Development Expenditures 202.0 202.0 0.0 272.0 34.7Minus Net Revenue Receipts 557.2 630.0 13.1 643.1 2.1Minus Self-Financing of PSDP by Provinces 33.1 38.4 16.0 41.0 6.7Minus Recovery of Loans from Provinces 13.2 28.7 116.5 14.4 -49.6Minus Provincial Surplus 31.6 6.2 -80.5 33.5 442.5Minus Net Lending to others 3.6 -16.9 -565.8 6.2 -136.5
FISCAL DEFICIT 213.0 246.0 15.5 295.0 19.9 FISCAL DEFICIT as % of GDP 3.3 3.8 - 4.0p -
Source: Federal Budget in Brief 2005-06p = Projected

expenditures of about $125 billion, while theincrease in development expenditures is$70 billion. Net revenue receipts, on theother hand, increase relatively less fromtheir budgeted amount by about $85 billion.
The financing of the budget deficit isshown in Table 10. The dependence onexternal sources to finance the budgetdeficit has increased in recent years, with ashare in financing of more than 55 percentin the revised estimates for FY2005. InFY2006, this dependence is expected to godown some, but remain over 40 percent.Another important source of financing forthe deficit is bank borrowing. In FY2005,such borrowing was budgeted to finance Rs.45 billion of the deficit, but ended upfinancing more than Rs 80 billion and againis expected to finance Rs. 98 billion of thedeficit in FY2006. This is an alarming trendin the prevailing inflationary environment.
Revenues
Table 11 provides a comparison ofbudgeted and revised figures of gross
revenue receipts and their components.The table indicates that gross revenuereceipts were 10 percent higher than thebudgeted figure for FY2005. However, thislargely reflects an increase of $107 billion(or 71 percent) relative to target in non-tax
An Overheating Economy?
Research Report No. 62 23
FINANCING OF THE DEFICIT 213.1 246.0 15.5 295.0 19.9Non-Bank Borrowings 74.7 13.3 -82.2 55.4 315.3Share (%) 35.1 5.4 - 18.8 -
Net External Resources 78.2 141.9 81.5 121.6 -14.3Share (%) 36.7 57.7 - 41.2 -
Bank Borrowings 45.1 80.8 78.9 98.0 21.4Share (%) 21.2 32.8 - 33.2 -
Privatization Proceeds 15.0 10.0 -33.3 20.0 100.0Share (%) 7.0 4.1 - 6.8 -
Source: Federal Budget in Brief 2005-06
TABLE 10FISCAL DEFICIT FINANCING
(Rs. Billion)
2004-05 Growth 2005-06 GrowthHeads Budgeted Revised (%) Budgeted (%)
(1) (2) (2 over 1) (3) (3 over 2)
TABLE 11TARGET AND ACTUALFEDERAL RECEIPTS
(Rs. Billion)2001-02 2002-03* 2003-04* 2004-05**
Gross Revenue ReceiptsTarget 643.8 674.9 728.4 796.3 Actual 618.9 703.3 769.9 875.3 Actual as % of Target 96.1 104.2 105.7 109.9
Tax Revenues (CBR)Target 457.7 460.6 510.0 580.0Actual 404.1 460.6 518.9 590.0 Actual as % of Target 88.3 100.0 101.7 101.7
Direct TaxesTarget 149.8 148.4 161.1 181.9Actual 142.5 151.9 165.3 182.7Actual as % of Target 95.1 102.4 102.6 100.4
Indirect TaxesTarget 307.9 312.2 348.9 398.1Actual 261.6 308.7 353.6 407.3 Actual as % of Target 85.0 98.9 101.3 102.3
Import DutiesTarget 69.6 56.5 78.1 103.2Actual 47.8 68.8 89.9 113.9Actual as % of Target 68.7 121.8 115.1 110.4
Federal ExciseTarget 53.1 50.0 47.7 45.7Actual 47.2 44.8 44.6 54.4Actual as % of Target 88.9 89.6 93.5 119.0
Sales TaxTarget 185.2 205.7 223.1 249.2Actual 166.6 195.1 219.1 239.0Actual as % of Target 89.9 94.8 98.2 95.9
SurchargesTarget 47.0 60.5 61.1 65.3Actual 54.9 66.9 64.4 27.1Actual as % of Target 116.7 110.5 105.3 41.6
Non-Tax RevenuesTarget 139.1 153.8 157.2 151.0 Actual 159.9 175.8 186.6 258.2 Actual as % of Target 115.0 114.3 118.7 170.9
Sources: Targets and Revised Estimates are from Federal Budget in Brief (various issues)Actuals are from SBP Annual Report (various issues) and SBP Website
Note: Non-Tax Revenues for 2003-04 & 2004-05 also includes Workers' ProfitParticipation Tax, Foreign Travel Tax and Airport Tax.* Revised Estimates for Surcharges and Non Tax Revenue, otherwise Actuals** All Revised Estimates

revenues. According to the revisedestimates, CBR tax revenue was Rs. 10billion (or 1.7 percent) higher than the target.Collection from surcharges amounted toonly about 42 percent of the budgetedamount, largely because of the shortfall inthe petroleum development levy resultingfrom an increase in international oil prices.The sales tax target was again missed by asignificant amount, as in recent years.
CBR tax collections for FY2006 areanalyzed in Table 12. Revised figuresindicate that CBR tax collections rose nearly14 percent in FY2005 over the previousyear and are projected to increase about 17percent in FY2006. Considering thecomposition of taxes, revenues from indirecttaxes, which constitute about 70 percent oftotal tax revenues, increased 15 percent inFY 2004; whereas direct taxes, which
constitute about 30 percent oftotal tax revenues, increasedrelatively less, by 10 percent.Thus, the share of direct taxesin total taxes, depicted in Chart20 has fallen in recent years.This has made a tax system,which already lacks enough taxprogressivity, even lessprogressive (Note thatprogressivity measures theextent to which the rich bear agreater burden of taxes as ashare of their income than thepoor do). The projected growthof nearly 18 percent in direct taxrevenue in FY2006 versus 16½percent in indirect tax revenue
An Overheating Economy?
Research Report No. 6224
TABLE 12CBR TAX COLLECTIONS
(Rs. Billion)
A C T U A L Revised Budgeted
2000-01 2001-02 2002-03 2003-04 2004-05 2005-06TAX REVENUES 392 404 461 519 590 690
Growth (%) 13.0 3.0 14.0 12.7 13.7 16.9
Direct Taxes 125 143 152 165 183 215Growth (%) 10.3 14.4 6.6 8.8 10.5 17.9
Indirect Taxes 268 262 309 354 407 475Growth (%) 14.3 -2.3 18.0 14.5 15.2 16.5Customs 65 48 69 90 114 121Growth (%) 5.5 -26.5 43.9 30.7 26.7 6.4Federal Excise 49 47 45 45 54 59Growth (%) -12.0 -3.9 -5.1 -0.4 22.0 9.2Sales Tax 154 167 195 219 239 294Growth (%) 31.6 8.5 17.1 12.3 9.1 23.0
Source: SBP website and Federal Budget in Brief 2004-05
CHART 20TAX SHARES
Source: SPDC estimates based on data from Pakistan Economic Survey 2004-05,SBP website and Federal Budget in Brief 2005-06
36
35
34
33
32
31
30
29
28
161514131211109876
2000-01 2001-02 2002-03 2003-04 2004-05
Direct Tax as % of Total Tax
Total Tax-to-GDP Ratio
31.8
35.3
33.0
31.9
31.0
9.09.49.69.29.4

will make only a minoradjustment to thecomposition of taxes.
Moreover, theoverall tax-to-GDP ratio,also depicted in Chart20, has also fallenslightly in recent yearsand, at less than 10percent, remains verylow even by developingcountry standards.Better tax performanceis needed if the increasein developmentexpenditures projectedin the FY2006 Budget isto be sustained withoutadding to concernsabout the budget deficit.
According torevised data, revenuesfrom custom dutiesincreased 32 percent inFY2005 over FY2004,reflecting a surge ofimports last year (Table13). However, it seemsrather strange that evenfor revised data 10 out of13 items display exactlythe same rate of growthof 27 percent. Thisraises some questionsabout the plausibility ofthe data.
Another notableaspect of the budget isthe build-up of non-taxrevenues, from aboutRs 165 billion in FY2002to Rs. 258 billion inFY2005 (Table 14),representing an annualcumulative growth rateof 16 percent. Itemswith a major share innon-tax receipts are
An Overheating Economy?
Research Report No. 62 25
Chemical & Chemical Products 27% 27% 6%Dyes, Colors, Paints & Varnishes 27% 27% 6%Iron, Steel & Manufactures 27% 27% 6%Machinery 27% 16% 6%Metals (Other than Gold) 27% 27% 6%Minerals, Fuel Oils (POL) 27% 27% 6%Rubber & Rubber Products 27% 27% 6%Plastic Resins etc. 27% 27% 6%Vehicles 27% 2% 6%Wood Pulp & Papers 27% 27% 6%Yarn & Fabrics 27% 27% 6%Medical & Photographic Equip. 27% 27% 6%Other Items 30% 35% 26%Gross Collection 28% 28% 16%Less: Refund / Rebates 11% 11% 6%CUSTOM DUTIES (Net) 32% 32% 17%
B.E. Budget Estimate, R.E. Revised Estimate
Source: SPDC estimates based on Explanatory Memorendum on Federal Receipts (various issues)
TABLE 13GROWTH IN CUSTOM DUTIES
Growth in B.E Growth in R.E Growth in R.E(FY 2005 over FY 2005 over (FY 2006 over
FY 2004) FY 2004) FY 2005)
Interest 54.2 54.0 67.3 61.1 4.1Provinces 29.5 28.0 26.4 24.3 -6.3Local Bodies 19.6 10.7 12.4 13.1 -12.7Financial Insitutions 5.4 4.2 5.4 5.3 -0.9Non- Financial Institutions 18.8 29.8 29.8 25.6 10.9
WAPDA 16.4 26.5 27.6 23.6 12.9Other Autonm. Bodies/Corp. 2.4 3.2 2.1 2.0 -5.7
Govt. Servants, Commercial Deptt.,AJK & Others 3.9 3.5 4.7 6.9 20.8Less: Estimated Shortfall -23.0 -22.2 -11.4 -14.0 -15.3
Dividends & Returns 26.5 27.7 33.4 57.5 29.5Defence 26.0 56.3 42.9 61.4 33.1
Effective & Non-Effective 2.5 2.5 2.5 2.9 4.9Receipts from UN and Misc. Receipts 23.5 53.8 40.4 58.5 35.5
Miscellaneous and Others 58.0 37.8 43.0 78.2 10.5TOTAL NON-TAX REVENUE** 165 176 187 258 16.2
Source: SPDC estimates based on Explanatory Memorendum on Federal Receipts (various issues)Note: *Annual cumulative growth rate**Non-Tax Revenue for 2003-04 & 2004-05 also includes Workers' Profit Participation Tax, ForeignTravel Tax and Airport Tax
TABLE 14NON-TAX REVENUE
(Rs. Billion)
Revised Estimates ACGR*FY 2002 FY 2003 FY 2004 FY 2005 (%)

interest receipts, dividends from non-financialinstitutions (OGDC and PTCL being the maincontributors), and defence earnings. Defenceearnings have registered an annualcumulative growth rate of 33 percent sinceFY2002, largely being driven by receipts fromthe U.N. and miscellaneous receipts, whichappear to have been bolstered by Pakistan'srole as an ally against the war on terrorism.The main concern about the recent surge innon-tax revenues is whether this can berelied upon as a source of revenue on asustained basis.
Current and DevelopmentExpenditures
Table 15 provides a comparisonof budgeted and actual federal
expenditures. In the currentexpenditures category, there wasoverspending of 12 percent inFY2005 relative to the target level.Debt servicing was over thebudgeted amount by 3.5 percent,an improvement over FY2004when the target was overshot by24 percent. Defence spendingincreased 12 percent in FY2005relative to the budgeted amount forthe year and the category "OtherCurrent Expenditures" exceededits target by 33 percent. On apositive note, the developmentexpenditures target was fulfilled forthe first time in at least 5 years.That said, it seems as though theextra fiscal space created byhigher-than-expected GDP growthwent towards extra currentexpenditures rather than extradevelopment expenditures.
One should not feel toocomplacent about developmentexpenditures in any case becausetheir relative share is very low tobegin with. As shown in Chart 21,the share of developmentexpenditures in total expenditurewas budgeted to be just 22 percentin FY2005 and the revised
estimates indicate that the actual shareturned out to be even a bit less at 20 percent.On the other hand, defence expenditure anddebt servicing and repayment account forabout half of total expenditure. It isimperative to shift the composition ofexpenditures more toward developmentexpenditures to combat poverty and createan enabling environment for socialdevelopment, and the projected increase ofthe share of development expenditures intotal spending to 25 percent implied by theBudget FY2006 is a welcome development.
An Overheating Economy?
Research Report No. 6226
TABLE 15BUDGETED AND ACTUALFEDERAL EXPENDITURES
(Rs. Billion)
2001-02 2002-03* 2003-04* 2004-05*Current Expenditures
Budget Estimates 621.7 608.0 645.2 700.8 Actual 650.4 673.3 714.0 784.7 Actual as % of B.E. 104.6 110.7 110.7 112.0
DefenceBudget Estimates 131.6 146.0 160.3 193.9 Actual 149.3 160.1 180.5 216.3 Actual as % of B.E. 113.4 109.7 112.7 111.5
Debt ServicingBudget Estimates 329.2 289.7 256.0 265.3Actual 318.7 257.4 317.7 274.7Actual as % of B.E. 96.8 88.9 124.1 103.5
SubsidiesBudget Estimates 20.7 20.8 - 59.5 Actual 25.5 49.8 - 51.4 Actual as % of B.E. 123.1 239.4 - 86.3
Other Current ExpendituresBudget Estimates 140.2 151.4 229.0 182.0 Actual 156.9 205.9 215.8 242.3 Actual as % of B.E. 111.9 136.0 94.2 133.2
Public Sector Development Program (PSDP)Budget Estimates 130.0 134.0 160.0 202.0Actual 126.3 131.6 154.4 202.0Actual as % of B.E. 97.1 98.2 96.5 100.0
Federal Current Expenditure + PSDPBudget Estimates 751.7 742.0 805.2 902.8 Actual 776.6 804.9 868.4 986.7 Actual as % of B.E. 103.3 108.5 107.8 109.3
Source: SBP Annual Report and Federal Budget in Brief (various issues)Note: Subsidy figures are not available for 2003-04* Revised Estimates

Estimated current expenditures in thenew FY2006 Budget and a comparison ofthese with the previous year's figures arereported in Table 16. The total of theseexpenditures is expected to grow a bit more
than 5 percent over the next year. This is arelatively restrained growth rate but followshigher-than-budgeted spending in FY2005,as noted above. Note that the growth rateof spending on transfer payments,
An Overheating Economy?
Research Report No. 62 27
CHART 21COMPOSITION OF EXPENDITURE
2004-05 Budgeted 2004-05 Revised 2005-06 Budgeted
Source: SPDC estimates based on Federal Budget in Brief 2005-06
Develop-ment22%
Other27%
Defence21%
DebtServicing &Repayment
30%
Develop-ment20%
Other30%
Defence22%
DebtServicing &Repayment
28%
Develop-ment25%
Other27%
Defence20%
DebtServicing &Repayment
28%
General Public Service 423.8 469.0 10.7 503.1 7.3Executive & Legislative Organs, Financial 349.5 342.5 -2.0 399.4 16.6Interest on Domestic Debt 170.2 180.1 5.8 190.2 5.6Interest on Foreign Debt 44.0 40.4 -8.3 45.8 13.4Repayment of Foreign Debt 51.1 54.3 6.2 65.3 20.4Pensions 42.5 42.5 0.0 43.4 2.1Others 41.7 25.3 -39.4 54.6 116.3Foreign Economic Aid 0.1 0.1 0.0 0.1 26.7Transfer Payments 65.4 118.5 81.2 79.8 -32.7General Services 1.7 1.1 -33.7 1.3 11.5Basic Research 0.6 0.8 46.8 0.9 10.7R&D General Public Services 2.5 2.5 0.7 2.9 16.9Admn. Of General Public Service 0.4 1.2 190.5 0.5 -61.8General Public Services not defined elsewhere 3.7 2.2 -40.3 18.3 732.7
Defence Affairs & Services 193.9 216.3 11.5 223.5 3.3Public Order and Safety Affairs 15.1 17.5 16.4 18.7 6.7Economic Affairs 48.8 62.2 27.5 56.4 -9.2Environment Protection 0.1 0.1 0.0 0.1 8.1Housing and Community Amenities 0.8 0.9 4.1 0.9 -0.3Health Afairs and Services 3.3 3.3 0.8 4.1 25.9Recreational, Cultural and Religion 2.2 2.2 2.2 2.3 2.9Education Affairs and Services 12.2 12.3 1.0 16.6 34.9Social Protection 0.5 0.9 60.1 0.6 -27.8Total 700.8 784.7 12.0 826.5 5.3
Source: Federal Budget in Brief 2005-06
TABLE 16CURRENT EXPENDITURE
(Rs. Billion)
FY 2005 FY 2006Heads Budgeted Revised Growth (%) Budgeted Growth (%)
(1) (2) (2 over 1) (3) (3 over 2)

Administration of General Public Service,and Social Protection are projected to besignificantly negative. This might perhapsbe due to the tremendous overspending onthese items relative to budgeted amounts inFY2005, although the original budgetedamounts on some of these items, such asonly Rs. 0.5 billion for Social Protection,might be considered small. Currentexpenditures on education and health,however, are slated to receive a boost of 35percent and 26 percent, respectively, inFY2006.
Total subsidies in FY2006 are projectedto be about Rs. 72 billion, as against therevised estimates of roughly Rs. 51 billion inFY2005 (Table 17). The table reveals thatWAPDA and KESC continue to be the mainrecipients of federal subsidies, with theircombined share of 62 percent according torevised FY2005 figures. Budget estimatesfor FY2006 project this share to be droppingto 46 percent. However, if the contributionto unbundled WAPDA power distributioncompanies (DISCO) of 29 percent of allsubsidies is included, total subsidies to thepower sector continue to be hefty.
As mentioned above, developmentexpenditure in FY2005 was commendablyon target with 100 percent utilization of thebudgeted Rs. 202 billion expenditures in this
category. Moreover, the FY2006 Budgethas projected an increase in developmentexpenditures to Rs. 272 billion, whichrepresents a 35 percent increase. Acomparison of targeted and revisedexpenditures in different categories ofdevelopment expenditures for FY2005,presented in Table 18, reveals someinteresting features. While the overallutilization rate was exactly 100 percent, thecategory-wise decomposition indicates thatDivisions such as Finance, Interior, and theCabinet utilized substantially more than theirbudgeted amounts. This came at theexpense of Social Development categoriessuch as the Education, WomenDevelopment, and Labour/ManpowerDivisions, whose allocated budgets wereunderutilized by 40 percent, 87 percent, and25 percent, respectively.
Amid reports that the developmentspending was largely backloaded into thefourth quarter, this raises concerns aboutthe appropriate channeling and properutilization of the development expendituresbudget. Thus, together with the projectedincrease in development expenditures forFY2006 that the government has alreadyannounced, it also needs to improvedelivery and appropriate use of these funds.
An Overheating Economy?
Research Report No. 6228
TABLE 17SUBSIDIES
(Rs. Billion)
Subsidies for WAPDA 17.1 29 22.0 43 24.0 33
Subsidies for KESC 13.0 22 9.7 19 9.6 13
Others 29.4 49 19.7 38 38.8 54
Of Which:
Inter Disco Tariff Differential 19.6 33 0.0 0 21.0 29
TOTAL SUBSIDIES 59.5 100 51.4 100 72.3 100
Source: Federal Budget in Brief 2005-06
2004-05 2005-06Budget Share (%) Revised Share (%) Budget Share (%)

Intergovernmental Relationsand Regional Development
Table 19 highlights the transfersmade by provincial
governments to the federalgovernment on account of interestpayments, recovery of federalloans, self financing of PSDP, andthe provincial surplus. Amongthese four heads, interestpayments and loan repaymentsare physically transferred to thefederal government, while theother two, though not physicallytransferred, add up to totalresources that contribute toreducing the federal deficit. Thetotal provincial transfers as a shareof the divisible pool are projectedto decrease from 44 percent inFY2004 to about 39 percent inFY2006, but the latter figure is stilla high share that restrains theprovinces in their ability to providebasic social services includingeducation, health, and publichealth.
Inequality generally andregional inequality particularly isan important outcome ofgovernment economic policies inlast two decades. Limited transfersof funds from the federal toprovincial governments on thebasis of population are causinginequality. Moreover, skeweddistribution of federal governmentPSDP and non-PSDPexpenditures are aggravating thissituation. There are two relevantissues in the allocation ofdevelopment expenditures. Firstout of total PSDP allocation, whatis the fraction that each provincegets? Second, what percentage ofprovincial Allocation of theDivisible Pool (ADP) is financed byfederal assistance?
An Overheating Economy?
Research Report No. 62 29
FEDERAL 148.0 148.0 0.0Infrastructure Development 73.0 72.7 -0.4
Water/Power Div. 20.8 21.4 3.1WAPDA (Power) 14.2 14.2 0.0Pakistan Atomic Energy Comm. 4.8 4.1 -14.1Pak Nuclear Regulatory Auth. 0.0 0.0 -Petroleum & Natural Resource Dev 0.5 1.1 102.1Commu. Division/Ports-Shipp 23.4 22.4 -4.0Railways Division 9.3 9.4 1.5
Social Development 50.2 50.4 0.5Finance Div. 7.6 9.3 22.3Special Programmes 8.8 9.4 6.8Education Division 3.4 2.0 -39.6HEC 9.1 9.1 0.0Health Division 6.0 5.6 -7.4Popul. Welfare Div 2.6 2.6 0.2Women Dev. Div 1.3 0.2 -86.7Social Welf/Sp Edu Div 0.0 0.6 -Labour/Manpower 0.1 0.1 -24.8KA/NA Division/SAFRON 11.2 11.5 2.4
Others 24.9 24.9 0.1IT/Telecom Division 2.7 2.4 -11.1Science/Tech Research 1.9 1.7 -10.7Culture/Sports/Youth/Tourism 0.6 0.6 -2.8Works Division 0.9 1.0 8.5Defence Division 1.0 1.1 9.3Food/Agri/Livestock 7.3 7.1 -3.1Local Govt/RD Division 0.3 0.3 0.0Environment 0.4 0.4 5.3Industries/Production 0.4 0.4 -8.2Interior Division 4.9 5.7 16.5Law/Justice/Human Rights 2.4 2.4 0.2Establishment Division 0.0 0.0 -8.0Cabinet Division 0.4 0.7 48.4Information and Broadcasting 0.5 0.4 -14.3Narcotics Control Div. 0.2 0.2 -1.4Planning/Dev Division 0.7 0.5 -33.0Statistics Division 0.1 0.0 -23.6M/o Foreign Affairs 0.2 0.1 -66.7Commerce Division 0.0 0.0 0.0
PROVINCIES 54.0 54.0 0.0
TOTAL DEVELOPMENT OUTLAY 202.0 202.0 0.0
Source: Public Sector Development Program 2004-05 & 2005-06
TABLE 18TARGETED AND ACTUAL
DEVELOPMENT EXPENDITURE(Rs. Billion)
Ministries / Dividions / FY 2004-05 Growth
Corporations Original Revised (%)

The analysis of federal assistance inprovincial ADPs (Table 20) shows that bothsouthern provinces Balochistan and Sindhhave got reasonable shares in FY2006.However, this trend should continue and befurther enhanced in years to come to narrowthe regional inequality gap of North andSouth. For example, the table shows that inFY2005, the federal contribution washighest for Balochistan (45 percent ofprovincial ADP) and in FY2006 it isestimated to be 43.5 percent of provincialADP. In contrast, for other three provinces,federal assistance has been increased bymore than 10 percentage points in FY2006.
The Table also reveals how the totalfederal assistance to provinces is distributedamong them. The highest share of federalassistance is allocated to Punjab and NWFPin both fiscal years (41 percent and 23percent, respectively, in FY2005, and 42percent and 27 percent, respectively, inFY2006). On the other hand, Balochistan'sshare is reduced from 20 percent of totalfederal assistance to 11 percent whereasSindh's share is increased from 17 percentin FY2005 to 20 percent in FY2006. Federalfunds for development programs should beallocated with both population compositionand provincial poverty levels in mind. Given
the fact that Sindh and Balochistan are thetwo most deprived provinces in terms ofpoverty incidence, meticulous attention isneeded in order to correct the growingNorth-South divide.
CONCLUSIONS
The growth performance of Pakistan'seconomy in FY2005 has beenimpressive and the environment of
macroeconomic stability that thegovernment has promoted has contributedto this, no doubt. Real GDP acceleratedfurther and unlike last year which showedrather disappointing growth in theagricultural sector, the growth has becomemuch more balanced. There is someevidence of increases in productivity andemployment as well.
However, some of the growth can beattributed to transient factors, such as therole of good weather in generating a bumpercotton crop. While efforts to increase thecountry's long-run sustainable rate ofeconomic growth should continue, there aresigns that the economy is now overheating.Thus, in the short run at least, there is someneed to cool off demand. Further
An Overheating Economy?
Research Report No. 6230
Interest Receipts from Provinces 26.4 24.3 22.6Recovery of Loans from Provincs 17.3 28.7 14.4Self Financing of PSDP by Provinces 34.8 38.4 41.0Provincial Surplus 14.3 6.2 33.5
Total Provincial Transfers 92.8 97.6 111.5Fiscal Deficit 173.9 246.0 295.0
Total Provincial Transfers as % of Fiscal Deficit 53.4 39.7 37.8Divisible Pool Transfers* 211.4 245.3 284.3
Total Provincial Transfers as % of Divisible Pool 43.9 39.8 39.2
* Including Straight TransfersSource: SPDC estimates based on Federal Budget in Brief and Explanatory Memorendum on Federal Receipts (various issues)
TABLE 19PROVINCIAL TRANSFERS TO FEDERAL GOVERNMENT
(Rs. Billion)
2003-04 2004-05 2005-06Revised Revised Budget

accelerating demand by an excessiveamount in a developing economy that isoverheating can be a recipe for a boom-bustcycle that ends in crisis.
The rise in inflation to double digits is amatter of concern. Although much of it canbe attributed to supply-side factors whichhave increased food prices and world oilprices, there is evidence of demand sidepressures as well. It is imperative that thenow tighter stance of monetary policy thatthe central bank has adopted shouldcontinue for a while and even becometighter to abate inflationary pressures.There is strong evidence from all over theworld that if inflation gets beyond a certainpoint and stays there for a while, it can havevery deleterious effects on economic
growth. Moreover, it also increases povertyand inequality. Bank credit to the privatesector, having done its job of spurringdemand, should also be reined in to preventhousehold debt from reachingunsustainable proportions.
Higher growth than its trading partnersis also widening Pakistan's trade deficit andhas turned a current account surplus into adeficit. The current account deficit is not asource of pressure yet, but this trend shouldnot be allowed to continue. Therefore, theeffort to target exports and make them animportant mechanism, over time, forsustaining the high growth should continueand intensify.
Along with the emphasis on growth,there is also a need for a more concerted
An Overheating Economy?
Research Report No. 62 31
TABLE 20FINANCING OF PROVINCIAL DEVELOPMENT PROGRAMME
FY 2005 (REVISED ESTIMATES)
Province wise composition of ADP FinancingADP 100.0 100.0 100.0 100.0 100.0Provincial Contribution 75.7 76.1 65.1 54.7 71.1Federal Assistance 24.3 23.9 34.9 45.3 28.9
Financing as Percentage of Four-Province-Combined ADPADP 48.5 19.9 19.1 12.5 100.0Provincial Contribution 51.6 21.3 17.4 9.6 100.0Federal Assistance 40.8 16.5 23.0 19.6 100.0
FY 2006 (BUDGET ESTIMATES)
Province wise composition of ADP FinancingADP 100.0 100.0 100.0 100.0 100.0Provincial Contribution 65.3 62.0 49.3 56.5 60.3Federal Assistance 34.7 38.0 50.7 43.5 39.7
Financing as Percentage of Four-Province-Combined ADPADP 47.7 20.8 21.3 10.3 100.0Provincial Contribution 51.6 21.3 17.4 9.6 100.0Federal Assistance 41.7 19.9 27.2 11.2 100.0
Source: SPDC estimates based on Explanatory Memorendum on Federal Receipts 2005-06
Punjab Sindh NWFP Balochistan Total
Punjab Sindh NWFP Balochistan Total

effort on direct interventions to help alleviatepoverty, reduce inequality, and foster socialdevelopment more generally. The budget israther silent on the specifics of how todirectly tackle poverty and incomeinequality. The proposed increase indevelopment expenditures of 35 percent inthe federal budget for FY2006 is, of course,much needed--and this trend shouldcontinue. At the same time, though, forthese increases in developmentexpenditures to be an effective tool foraiding social and human development, thereis a need to reform the mechanisms for theappropriate channeling and utilization of thefunds under the PSDP. Moreover, the abilityof the provinces to provide social services isrestrained by the substantial reverse flow ofresources back to the federal government.
Along with development expenditures,other government expenditures are alsobudgeted to rise and revenue receipts, inparticular tax revenues, are not projected tokeep pace. This will result in further
widening of the federal government deficit,which might not prove too wise in anoverheating economy. The expansionarystance of fiscal policy puts pressure on thecentral bank and makes its job of controllinginflation more difficult.
In our view, increasing developmentexpenditures by a meaningful amount iscritical and cannot be compromised. Butgreater effort is needed to finance theseincreases through expenditure switchingand more tax revenues to preventexpanding budget deficits from fuelinginflationary pressures further. Pakistan'sratio of taxes to GDP at less than 10 percentis low even by developing country standardsand the fraction of the working populationthat file tax returns is trivial. The tax systemshould also be made more pro-poor byrendering it more progressive, e.g. bychanging the composition of taxes towarddirect taxes from indirect taxes, so the richbear a greater burden of taxes.
An Overheating Economy?
Research Report No. 6232


Social Policy and Development Centre15-Maqbool Co-operative Housing SocietyBlock 7 & 8, Karachi 75350, PakistanTel: (92-21) 111-113-113Fax: (92-21) 4534285E-mail: [email protected]://www.spdc-pak.com