Investigating the potential of overheating in UK dwellings as a consequence of extant climate change
12
Investigating the potential of overheating in UK dwellings as a consequence of extant climate change A.D. Peacock n , D.P. Jenkins, D. Kane Urban Energy Group, School of the Built Environment, Heriot Watt University, Riccarton, Edinburgh, EH14 4AS article info Article history: Received 25 November 2008 Accepted 12 January 2010 Available online 10 April 2010 Keywords: Domestic Overheating Climate change Thermal mass Simulation abstract Dynamic simulation is used with defined domestic building variants to investigate internal temperatures of UK dwellings. Factors such as a warming climate and varying internal heat gains are estimated to examine whether UK domestic buildings are likely to be prone to overheating in the future, and therefore require mechanical air conditioning. The study suggests that the ability, or inability, of the occupant to adapt to bedroom temperature is paramount in the understanding of the conditions for overheating. While this is difficult to quantify (and a range of comfort temperatures are proposed), the effect of changing the building construction and geographical location can result in significantly different thermal conditions. As might be expected, the problem appears most noticeable for buildings in the south of the UK and with lightweight constructions. Even with a window-opening schedule applied to such a scenario, the average internal temperature is simulated as being over 28 1C for almost 12% of the year. A different metric, defined as ‘‘cooling nights’’, suggests that there might be a cooling problem in bedroom areas for approximately a third of the year. In the North of the UK, and also for solid wall dwellings, this problem diminishes significantly. & 2010 Elsevier Ltd. All rights reserved. 1. Introduction The UK Government has recently placed on a legislative footing the pledge to reduce CO 2 emissions by 80% by 2050 (DEFRA, 2008a). The extent to which these savings will be achieved will to some extent be predicated on the response of the domestic sector which currently is responsible for approxi- mately 27% of all UK CO 2 emissions (Shorrock et al., 2003). In addition, in successive IPCC Working Group reports (Levine et al., 2007) and UK Government Energy White Paper (DTI, 2006), it has been concluded that substantial reductions in CO 2 emissions from energy use in domestic buildings can be achieved using energy efficiency technologies that already exist widely and have been successfully deployed. A series of projects have indicated the technologies that could be deployed in the existing stock to achieve these cuts (Peacock et al., 2007; WWF-UK, 2008; Bell and Lowe, 2000). In the main, these do not include an assessment of how energy consumption (and commensurate CO 2 emissions) might grow in the domestic sector in future decades. Two factors that may cause CO 2 emissions to rise in the future are; (a) increased electricity consumption—for instance electricity consumption rose by an average of 1.3% per annum between 1990 and 2005 with this trend projected to continue or increase due to the growth of the consumer electronics and home entertainment market (BERR, 2008; EST, 2006) and (b) a warming UK climate (Jenkins et al., 2007). These two factors have a somewhat symbiotic relationship as the former leads to increased internal gains in housing, the latter to increased external gains and the combination of the two may herald a cooling season in the UK domestic sector. A cooling season may be viewed as a period of time where mechanical cooling is required to maintain some pre-defined thermal comfort condition. This will be a largely novel energy demand in the UK that will potentially have a detrimental effect on the ability of the domestic sector to contribute to the aforementioned targets. This investigation considers how the advent of a cooling season might be judged in the UK. Using this judgement it then explores, using a modelling approach, how three domestic building variants of differing constructions respond to both a possible change in electrical consumption and the forecasted, near term warming of the UK climate. This UK climate was represented using UK Climate Impacts Programme 2002 (UKCIP02) algorithms (Belcher et al., 2005) for 2010–2040 to morph CIBSE Test Reference Year (TRY) 2005 climates (CIBSE, 2005) using a medium high emissions scenario. 2. Domestic cooling requirement It is thought that early market growth in domestic air conditioning systems may be driven by distress purchasing ARTICLE IN PRESS Contents lists available at ScienceDirect journal homepage: www.elsevier.com/locate/enpol Energy Policy 0301-4215/$ - see front matter & 2010 Elsevier Ltd. All rights reserved. doi:10.1016/j.enpol.2010.01.021 n Corresponding author. Tel.: + 44 131 451 4637; fax: + 44 131 451 3132. E-mail address: [email protected] (A.D. Peacock). Energy Policy 38 (2010) 3277–3288
Transcript of Investigating the potential of overheating in UK dwellings as a consequence of extant climate change

ARTICLE IN PRESS
Energy Policy 38 (2010) 3277–3288
Contents lists available at ScienceDirect
Energy Policy
0301-42
doi:10.1
n Corr
E-m
journal homepage: www.elsevier.com/locate/enpol
Investigating the potential of overheating in UK dwellingsas a consequence of extant climate change
A.D. Peacock n, D.P. Jenkins, D. Kane
Urban Energy Group, School of the Built Environment, Heriot Watt University, Riccarton, Edinburgh, EH14 4AS
a r t i c l e i n f o
Article history:
Received 25 November 2008
Accepted 12 January 2010Available online 10 April 2010
Keywords:
Domestic
Overheating
Climate change
Thermal mass
Simulation
15/$ - see front matter & 2010 Elsevier Ltd. A
016/j.enpol.2010.01.021
esponding author. Tel.: +44 131 451 4637; fa
ail address: [email protected] (A.D. Peaco
a b s t r a c t
Dynamic simulation is used with defined domestic building variants to investigate internal
temperatures of UK dwellings. Factors such as a warming climate and varying internal heat gains are
estimated to examine whether UK domestic buildings are likely to be prone to overheating in the
future, and therefore require mechanical air conditioning. The study suggests that the ability, or
inability, of the occupant to adapt to bedroom temperature is paramount in the understanding of the
conditions for overheating. While this is difficult to quantify (and a range of comfort temperatures are
proposed), the effect of changing the building construction and geographical location can result in
significantly different thermal conditions. As might be expected, the problem appears most noticeable
for buildings in the south of the UK and with lightweight constructions. Even with a window-opening
schedule applied to such a scenario, the average internal temperature is simulated as being over 28 1C
for almost 12% of the year. A different metric, defined as ‘‘cooling nights’’, suggests that there might be a
cooling problem in bedroom areas for approximately a third of the year. In the North of the UK, and also
for solid wall dwellings, this problem diminishes significantly.
& 2010 Elsevier Ltd. All rights reserved.
1. Introduction
The UK Government has recently placed on a legislativefooting the pledge to reduce CO2 emissions by 80% by 2050(DEFRA, 2008a). The extent to which these savings will beachieved will to some extent be predicated on the response ofthe domestic sector which currently is responsible for approxi-mately 27% of all UK CO2 emissions (Shorrock et al., 2003). Inaddition, in successive IPCC Working Group reports (Levine et al.,2007) and UK Government Energy White Paper (DTI, 2006), it hasbeen concluded that substantial reductions in CO2 emissions fromenergy use in domestic buildings can be achieved using energyefficiency technologies that already exist widely and have beensuccessfully deployed.
A series of projects have indicated the technologies that couldbe deployed in the existing stock to achieve these cuts (Peacocket al., 2007; WWF-UK, 2008; Bell and Lowe, 2000). In the main,these do not include an assessment of how energy consumption(and commensurate CO2 emissions) might grow in the domesticsector in future decades. Two factors that may cause CO2
emissions to rise in the future are; (a) increased electricityconsumption—for instance electricity consumption rose by anaverage of 1.3% per annum between 1990 and 2005 with thistrend projected to continue or increase due to the growth of the
ll rights reserved.
x: +44 131 451 3132.
ck).
consumer electronics and home entertainment market (BERR,2008; EST, 2006) and (b) a warming UK climate (Jenkins et al.,2007). These two factors have a somewhat symbiotic relationshipas the former leads to increased internal gains in housing, thelatter to increased external gains and the combination of the twomay herald a cooling season in the UK domestic sector. A coolingseason may be viewed as a period of time where mechanicalcooling is required to maintain some pre-defined thermal comfortcondition. This will be a largely novel energy demand in the UKthat will potentially have a detrimental effect on the ability of thedomestic sector to contribute to the aforementioned targets.
This investigation considers how the advent of a coolingseason might be judged in the UK. Using this judgement it thenexplores, using a modelling approach, how three domesticbuilding variants of differing constructions respond to both apossible change in electrical consumption and the forecasted,near term warming of the UK climate. This UK climate wasrepresented using UK Climate Impacts Programme 2002(UKCIP02) algorithms (Belcher et al., 2005) for 2010–2040 tomorph CIBSE Test Reference Year (TRY) 2005 climates (CIBSE,2005) using a medium high emissions scenario.
2. Domestic cooling requirement
It is thought that early market growth in domestic airconditioning systems may be driven by distress purchasing
ARTICLE IN PRESS
A.D. Peacock et al. / Energy Policy 38 (2010) 3277–32883278
during extreme events, for example the 2003 heat waves (Wrightet al., 2005). For instance, anecdotal reporting suggested thatmajor DIY chains in the UK sold out of portable air conditioningunits during the 2003 heat wave. However, there is evidence fromthe United States to suggest that the eventual market saturationlevel of domestic air conditioning will be determined not byextreme events but by cooling degree days (Sailor and Pavlova,2003). It is possible to apply the relationships developed in the USto predict the eventual prevalence of domestic air conditioning inthe UK. When cooling degree days were computed using a basecomfort temperature of 18.3 1C, no market for domestic airconditioning in Edinburgh and London was found when the2005 CIBSE TRY climate files were used in conjunction with thesealgorithms. This is broadly the figure returned in the marketinginformation that could be found for 2005 although specific datafor the domestic sector is limited due in part to the small size ofthe market (Kemna et al., 2005). However, a saturation level of0.18, i.e. air conditioning would be installed in 18% of homes, wasfound for London when the morphed climate files were used. Nomarket evolved for Edinburgh. If the UK response to airconditioning mimics that of the US then in London alone550,000 homes would have installed air conditioning equipment,nominally by 2030.
Of course this assumes that UK residents will exhibitbehavioural responses similar to those seen in the US. It is alsouncertain whether external temperature itself or the effect ofexternal temperature on internal temperature will be a determi-nant of behavioural response. In the southern states of the US, airconditioning has become the most important determinant of thegeography of everyday life with walking, shopping, eating,entertainment and sleeping all associated with artificially cooledenvironments (Wilhite, 2007). The extent to which the relation-ship between cooling degree day and saturation point of domesticair conditioning is upheld is likely to be to some extent predicatedon the experience householders currently have of air conditionedenvironments. In the UK this is much more prevalent than itwas 10 years ago. It is thought that approximately 70% of theUK car fleet (DEFRA, 2008b), 70% of London offices and approxi-mately 65% of London retail premises are fully air conditioned(Brown et al., 2006).
The air conditioning industry itself is also likely to play a rolein determining the societal acceptance of domestic air condition-ing (Cooper, 1998). The historical emergence of air conditioning inthe US was pre-dated by an intellectual debate about whether anartificial indoor climate was the goal. Once this debate was won,then the means to achieve this end more easily became acceptedas a societal necessity. Similarly, the emergence of a consensusthat the indoor climate should conform to some ‘‘standard’’ wasalso seen as being critical as it ensured that the natural climatewould always appear inadequate to a controlled ‘‘man-made’’climate.
Additional factors that will drive the market forward are (a)the rise in energy efficiency of air conditioning that has reducedthe cost of the energy service it provides (Herring and Roy, 2007)and (b) the reduction in the capital cost of a single unit for adomestic dwelling (a domestic split system can be purchased inthe UK for under £500 (Twenga, 2008)). In summary, thehouseholder in the UK may become behaviourally attuned tocooling energy services and for a significant proportion of thepopulation neither the capital nor running costs associated with itrepresent barriers to its adoption.
However, UK residents may be culturally less likely topurchase domestic air conditioning and both the societalimperative and the external/internal environment required totrigger purchase may be different to that seen in the US. Definingthe internal environment condition that could be constituted as
an overheating trigger is complicated. Some evidence would seemto point to the temperature of the bedroom as being critical inunderstanding overheating. For instance, a study in the US foundthat the highest risk factor for heat-related death is a bedroomlocated on the second floor without air conditioning (Naughtonet al., 2002). Heat-related death is clearly an extreme manifesta-tion of heat stress. However, all citizens can be affected byelevated night-time temperatures that can cause increasedwakefulness and impaired sleep quality leading to reducedproductivity, diminished attentiveness and impaired judgement(Yanase, 1981). Clearly for many occupants there may beconsiderably less latitude for adaptive behaviour to combatoverheating during sleeping hours.
It has been shown in numerous studies that an ambienttemperature higher than thermal neutral temperature increasesthermal load and suppresses slow wave sleep (SWS) and rapid eyemovement (REM) sleep while increasing wakefulness (Okamoto-Mizunoa et al., 2005, 1999; Haskell et al., 1981). Additionally,exposure to elevated temperatures in the early stages of sleepprovoked increased wakefulness and suppressed paradoxicalsleep whereas exposure to these temperatures during latterstages of sleep had little effect (Okamoto-Mizunoa et al., 2005).However, defining a thermal neutral temperature for sleeping isless well understood than, say, thermal comfort in offices. Anumber of studies (Haskell et al., 1981; Macpherson, 1973;Candas et al., 1982; Palca, 1986; Di Nisi et al., 1989; Dewasmeset al., 2000; Raymann et al., 2007) have been carried out that haveattempted to identify a thermal neutral limit for sleeping abovewhich the subject sought cooler surroundings (Table 1). Theconcept of an upper limit to thermal neutrality was alsoconsidered with respect to adaptive behaviour (Lin and Deng,2008). A comfort equation applicable to sleeping thermal environ-ments was proposed for subtropical regions that indicated athermal neutral range of between 18 and 32 1C depending on theinsulation level of the bedding. The behavioural or attitudinalresponses to the concept of adaptation through changing theinsulation level of bedding were not considered. When all studieswere considered, the upper limit of thermal neutrality was foundto be between 28 and 32 1C, similar to that quoted in Golding et al.(1989) (28–33 1C) i.e. at some temperature between 28 and 32 1C,discomfort will be felt.
In addition to considering thermo neutral sleeping tempera-tures that could be considered as trigger points indicating theonset of a cooling season, it is also important to consider thebehavioural response of householders once the air conditioningequipment has been installed. It is highly unlikely that theoperating periods of air conditioning equipment will be restrictedto periods where discomfort is approached. Rather, once pur-chased the air conditioning system will be used for longerperiods. He et al. (2005) surveyed UK homes that had installedair conditioning and found that the average duration of operationon days when the air conditioning unit was switched on was 7 h.For bedrooms, the set-point temperature at which the air condi-tioning system switched on ranged between 22.7 and 25 1Cwith the bedroom subsequently maintained at a temperature ofbetween 18.8 and 22.1 1C (Table 2). This is considerably lowerthan the range of thermal neutrality shown in Table 1. Lin andDeng (2006) conducted a similar study in air conditioned flatsin Hong Kong that identified that over 80% of respondentsmaintained their bedroom temperatures at or below 24 1C(Table 2).
Wright et al. (2005) monitored the temperatures of bedroomsduring the 2003 heat wave in Manchester and London, a periodwhen over 2000 additional deaths were recorded in the UK(Table 3). These show that mean bedroom temperatures in thehouses monitored in London were at the lower end of the thermal

ARTICLE IN PRESS
Table 1Upper limit of thermal neutrality associated with sleep.
Reference Temperature (1C) Location Description
Macpherson (1973) 29–32 Sydney Bedroom air temp.
Haskell et al. (1981) 29 California Bedroom air temp.
Candas et al. (1982) 32 France Bedroom air temp.
Palca (1986) 29 California Bedroom air temp.
Di Nisi et al. (1989) 30 France Bedroom air temp.
Dewasmes et al. (2000) 28 France Bedroom air temp.
Lin et al. (2008) 18–32 Tropics Bedroom air temp.
Raymann et al. (2007) 34–36 General Under bed covers–microclimate temp.
Table 2Measured bedroom temperatures for dwellings fitted with air conditioning systems.
Reference Temperature (1C) Location Description
He et al. (2005) 22.7–25.0 Southern England Air conditioning unit–bedroom switch on temperature
He et al. (2005) 18.8–22.1 Southern England Maintained bedroom temperature with air conditioning unit
Lin et al. (2008) 24 Hong Kong Maintained bedroom temperature with air conditioning unit
Table 3Measured bedroom temperatures during the 2003 heat wave in the UK.
Reference Temperature (1C) Location Description
Wright et al. (2005) 24.0–27.6 Manchester, UK Measured mean bedroom temp during 2003 heat wave
Wright et al. (2005) 27.2–28.4 London, UK Measured mean bedroom temp during 2003 heat wave
A.D. Peacock et al. / Energy Policy 38 (2010) 3277–3288 3279
neutrality range shown in Table 1, whereas those in Manchesterwere just below this range.
3. Internal gains scenarios
Domestic energy demand can be difficult to predict and model,primarily due to the diversity of occupant behaviour. Thisdiversity can affect a range of factors relating to domestic energyuse, particularly appliance and lighting usage, space heatingdemand periods, intentional ventilation, and casual thermal gainsfrom occupants and appliances. The Building Integrated Micro-Generation (BIM-G) Model (Kane and Newborough, 2006) wasdeveloped to facilitate supply–demand matching (i.e. comparingenergy supply profiles with energy demand profiles with a hightemporal precision) of thermal and/or electrical micro-generationand storage systems. The model is used to generate thermal andelectrical demand profiles attributed to a building of specifiedconstruction, using profiles of occupancy, appliance, light anddomestic hot water (DHW) usage, and accounting for ventilationand space heating control periods defined for a designatedhousehold.
The model was populated using a bottom-up approach todemand estimation. Analysis of national UK surveys on householdcompositions (ONS, 2002) and occupant time-use behaviour(ONS, 2000) provided a numerical basis to define a profile ofoccupation and sleep patterns that was deemed representative ofthe household variant chosen. This occupancy pattern was used todefine space heating control periods, a major driver of thermaldemand, and to define time periods during which certainclassifications of electrical or DHW equipment could reasonablybe expected to operate. After reviewing a range of studiesexamining the usage, ownership and consumption of appliances(Mansouri et al., 1996; MTPROG, 2007), lighting (Peacock et al.,2007; MTPROG, 2007; Stokes et al., 2004) and DHW (MTPROG,2007; Jordan and Vajen, 2001), a series of equipment usageprofiles were specified for the target household, the validity of
which was later checked by comparison with data extracted froma database of electrical load profiles (Newborough and Augood,1999) and demand profile monitoring studies (Wood and New-borough, 2003; Knight and Ribberink, 2007). Table 4 lists theappliances assumed to be present in the dwelling defined for thisstudy, along with annual energy consumption.
This analysis was further informed by in-situ monitoring ofindividual appliance electrical load signatures, coupled with theanalysis of appliance temperature monitoring, design guideassumptions (ASHRAE, 2001), and other sources (MTPROG,2007; Anderson, 2002). These were used to generate electricaland DHW demand profiles, along with associated equip-ment thermal gain profiles. Design guide-derived assumptions(ASHRAE, 2001; CIBSE, 2006) on task-dependant metabolic heatemission were correlated with the occupancy pattern to producea temporal profile of metabolic gains (sensible and latent)(Table 5) (CIBSE, 2006). These activities can then be varied todescribe the typical working day (of sleeping, getting up, going towork, etc.).
The profiles of occupancy, lighting and appliances are alsovaried to account for weekdays and weekend days. Seasonalvariation is addressed through lighting use that is driven byavailable daylight, as experienced during three distinct seasons;winter, ‘‘shoulder’’ (i.e. spring and autumn) and summer. Theresulting lighting configuration for the dwelling is summarised inTable 6.
An attempt was also made to predict the difference betweenthe internal heat gains of the base case (2005) and the future case(2030) versions of the building variant by considering changes toappliances and lighting. To this end, two alternative scenarioswere considered: for a reduced electrical demand (scenario B),and an increased electrical demand (scenario C), with scenario Abeing the 2005 baseline scenario.
The defined scenarios for appliance and equipment usage, seeTable 7, were based on specific changes at an individual appliancelevel and so represent potentially feasible transformations todomestic energy patterns. Scenario B assumes the same usage

ARTICLE IN PRESS
Table 4Overview of appliances and energy use in the chosen domestic variant for the 2005
baseline.
Appliance Number Energy use (kWh/year)
TV 3 383
TV accessories 2 184
PC & peripherals 3 97
Audio 3 255
Telephony 1 35
Games console 1 63
Other consumer electronics n/a 86
Table 5Occupant metabolic heat gains by activity.
Activity Male gains (W) Female gains (W) Child gains (W)
Sleeping 55 47 42
Vacant 0 0 0
Active 96 82 72
Relaxing 71 61 54
Table 6Overview of lighting usage in the dwelling by room area.
Dwelling
area
Floor
area
(m2)
Design
illuminances
(lux)
Light
intensity
(Lumens)
Use per
day (hr)
Bulb type
Hall 8 150 1200 4 CFL
Lounge 36 150 5400 3.9 CFL
Landing 8 150 1200 3.5 CFL
Dining 8 100 800 1.9 Incandescent
Kitchen 20 300 6000 1.5 Halogen
Bedrooms 48 50 2400 0.9 Incandescent
Bathroom 16 150 2400 0.5 Incandescent
Table 7Overview of electrical demands of gains scenarios A, B and C.
Appliance Annual energy consumption (kWh)
Scenario A
(base case)
Scenario B Scenario C
Consumer electronics 1113 1113 1421
Refrigeration 708 708 927
Lighting 747 129 444
Space heating pumps (electric) 400 400 400
Kitchen/cooking 1510 1510 1510
Electric shower 915 915 915
Other 289 289 289
Total 5682 5064 5906
Change in electrical demand (relative to base case) �10.9% +4.0%
00:00Time
Occupant (sensible)
Lights
Appliances
0
2
4
6
8
10
12
14
0
2
4
6
8
10
12
14
Time
Inte
rnal
hea
t gai
n pr
ofile
(W/m
2 )In
tern
al h
eat g
ain
prof
ile (W
/m2 ) Occupant (sensible)
Lights
Appliances
04:00 08:00 12:00 16:00 20:00
00:00 04:00 08:00 12:00 16:00 20:00
Fig. 1. Weekday (a) and weekend (b) internal heat gain profiles for the chosen
variant for scenario C.
A.D. Peacock et al. / Energy Policy 38 (2010) 3277–32883280
patterns for appliances and refrigeration but with a reduction inlighting, due to light emitting diodes (LED) replacing all lighting(where scenario A has a mixture of incandescent, compactfluorescent and halogen lights). For scenario C, a change inconsumer electronics electrical demand was assumed basedupon a 1% annual increase in consumption for every yearbetween 2005 and 2030. For the same scenario, the increasein refrigeration usage is due to the inclusion of a drinks fridge,the market presence of which the MTPROG (2007) expectsto rise significantly by 2030. The energy consumption of theseglass-fronted and (often) inefficient secondary refrigerationunits can be significant and with the inherent 24 h operationof such appliances, they could substantially increase the base-load of domestic electricity demand profiles. Scenario C isassumed to utilise compact fluorescent lighting throughout
the house (i.e. a more pessimistic scenario than the LEDs ofscenario B). Reductions in lighting consumption were estima-ted from a lighting model developed for the Tarbase project(Banfill and Peacock, 2007).
Fig. 1 shows the resulting heat gain profiles for occupants(sensible), lighting and appliances in the chosen variant (wherethe electrical demand of appliances and lighting is assumed to beapproximately equal to the emitted heat gains (Wilkins andHosni, 2000)). Scenario C has been chosen as this is the worst-casescenario in terms of any overheating risk. It should be noted that,with the three gains scenarios being based on assumed futurepractices rather than an arbitrary increase or decrease in internalheat gains, there is not a large annual difference in total electricalusage. This would intuitively suggest that the effect of changingthe gains scenario on the internal temperatures will be small. Thisis further quantified in Section 4.
4. Simulation of domestic cooling
The defined buildings, as described below, are simulatedwithin the ESP-r building software package. The same basic
ARTICLE IN PRESS
A.D. Peacock et al. / Energy Policy 38 (2010) 3277–3288 3281
building design is chosen to illustrate domestic energy use, butseveral scenarios are identified to use with this design model.
4.1. Scenario configuration
Three main variables are identified as being crucial to under-standing the risk of overheating occurring in dwellings, namely:climate, construction and internal heat gains. To account for thedifference between a northern and southern location in the UK,Edinburgh and London climate files are used (based on CIBSE TestReference Years (CIBSE, 2005)) for the year 2005. These twoclimate files are also modified, using a climate change algorithm(Belcher et al., 2005), to account for possible external conditionsin the year 2030.
The thermal mass and thermal transmittance of the dwellingare considered by defining three different constructions for thesame detached dwelling. These relate to: Variant 5, a 1988timber-frame dwelling (wall U-value of 0.47 W/m2K); Variant 6, a2002 twin leaf masonry dwelling with improved insulation(wall U-value of 0.37 W/m2K); and Variant 7. a pre-1900 solidwall dwelling (wall U-value of 1.6 W/m2K). The latter construc-tion will have, as a result of the solid wall, greater thermal massthan the other two buildings. The numbers of the variants arearbitrary and refer to the categories of the Tarbase project fromwhich the buildings are based. These constructions are discussedin further detail elsewhere (Peacock et al., 2007). Table 8 alsoprovides a summary of the building characteristics. The definedair-changes account for a baseline infiltration rate of 0.40 ac/hand then additional occupancy-related ventilation of 0.31 ac/h(from ‘‘trickle vents’’ above windows). It is likely that thedwellings will have different infiltration levels based onconstruction detailing and specific location. Ascribing thesedifferences would however introduce a somewhat arbitrarydistinction, as the process of attributing infiltration level todwellings described in the manner used here is by no meanscertain. The bathroom and kitchen have mechanical ventilationfans of 15 and 30 l/s that operate based on the occupancyassumptions of Section 3.
Finally, the internal heat gain profile (from occupants,equipment/appliances and lighting) can have a significant effecton the internal temperatures of a dwelling. Three scenarios, asdetailed in Section 3, are defined to account for this, namely:expected ‘‘current’’ usage; future scenario with LED lighting;future scenario with increased compact fluorescent lighting butincreased appliance usage.
Table 8Total number of air-changes (per hour) for the domestic variants.
Time period Total air change from infiltration and ventilation (ac/h)
Weekday Weekend
Bathroom Kitchen Other Bathroom Kitchen Other
00:00–07:00 0.71 0.71 0.71 0.71 0.71 0.71
07:00–08:00 1.20 0.71 0.71 0.75 0.71 0.71
08:00–09:00 0.54 0.55 0.55 0.75 0.71 0.55
09:00–10:00 0.40 0.40 0.40 0.71 0.71 0.71
10:00–12:00 0.40 0.40 0.40 0.71 0.71 0.71
12:00–13:00 0.40 0.40 0.40 0.71 1.34 0.71
13:00–14:00 0.40 0.40 0.40 0.71 0.96 0.71
14:00–16:00 0.40 0.40 0.40 0.71 0.71 0.71
16:00–17:00 0.55 0.55 0.55 0.71 0.98 0.71
17:00–18:00 0.71 1.63 0.71 0.71 2.08 0.71
18:00–19:00 0.71 1.41 0.71 0.71 0.71 0.71
19:00–00:00 0.71 0.71 0.71 0.71 0.71 0.71
This provides up to 36 possible combinations to ascertain theexistence of overheating in a domestic dwelling (i.e. 4 climates,3 constructions and 3 gains scenarios).
4.2. Model configuration
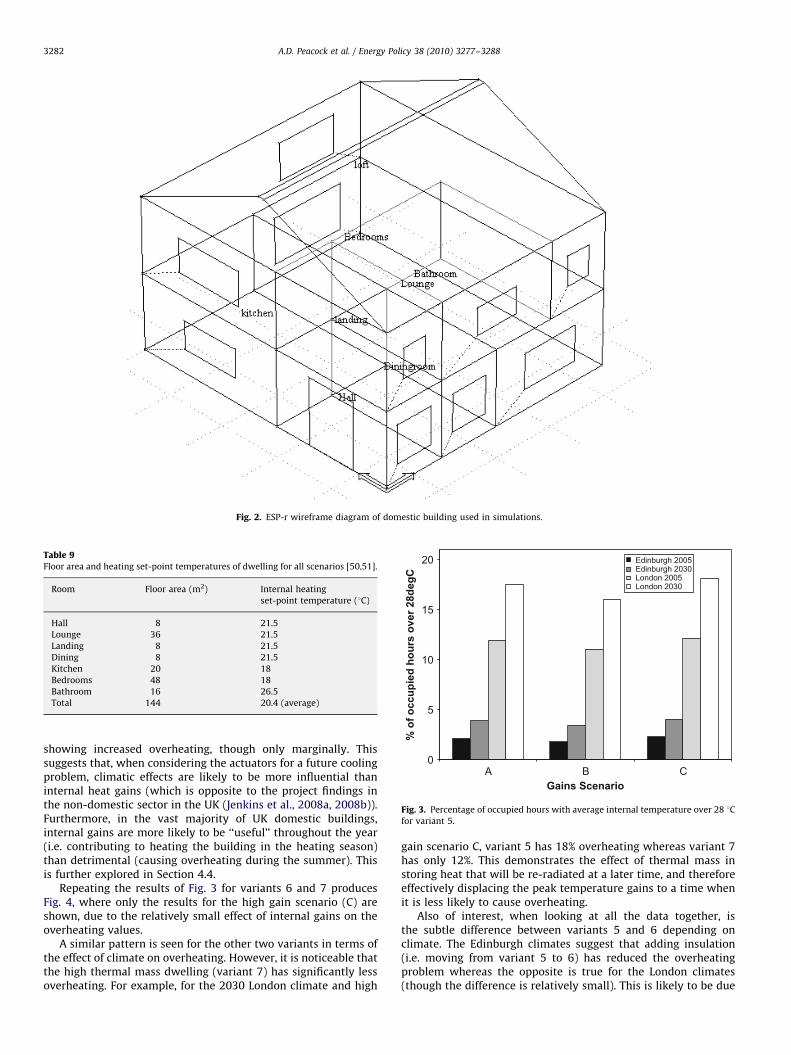
The dwelling itself is illustrated in Fig. 2. Table 9 gives asummary of all the areas and activities assumed within the house(based on published design guidance (CIBSE, 2002; DCLG, 2005)).The glazing ratio is found to be 16% of external wall area andshading occurs due to neighbouring buildings (of a similar size) ata distance of 5 m away on all sides of the building. The total floorarea is 144 m2 and the floor to ceiling height is 2.4 m.
4.3. Results of simulation
The two main indicators used to highlight uncomfortableinternal temperatures are the percentage of average internaltemperatures (during occupant hours) that exceed 28 1C (oftenused as a metric for occupant thermal discomfort (CIBSE, 2006))and also the number of ‘‘cooling nights’’ in a year, as judged by thetemperature of the bedroom at 11 pm (when the occupants areassumed to be in the bedroom). This definition is based onempirical data (He et al., 2005) suggesting the temperatures thatoccupants in dwellings find comfortable before having to act toreduce the temperature. Based on this data, 23.9 1C is the internalair temperature beyond which an occupant in a bedroom duringsleeping hours might act. Therefore, the initial definition of acooling night in this study is a night when, at 11 pm, thetemperature of 23.9 1C is exceeded in the bedroom zone of thebuilding. For such an occurrence, the occupant will be discom-forted and therefore be more likely, should such occasions ariseregularly, to resort to mechanical cooling. These definitions willnow be used to analyse the results of the simulations of thedefined buildings and scenarios (though other comfort tempera-tures will be considered in Section 4.3.4).
Initial simulations will assume that no action is taken by theoccupant to reduce the temperature (i.e. no windows are opened),which would provide a worst-case scenario. Section 4.3.3 thenre-simulates the scenarios with the most overheating to investi-gate whether window openings might be sufficient in providingsatisfactory comfort temperatures.
4.3.1. Occurrence of high temperatures (428 1C)
throughout dwelling
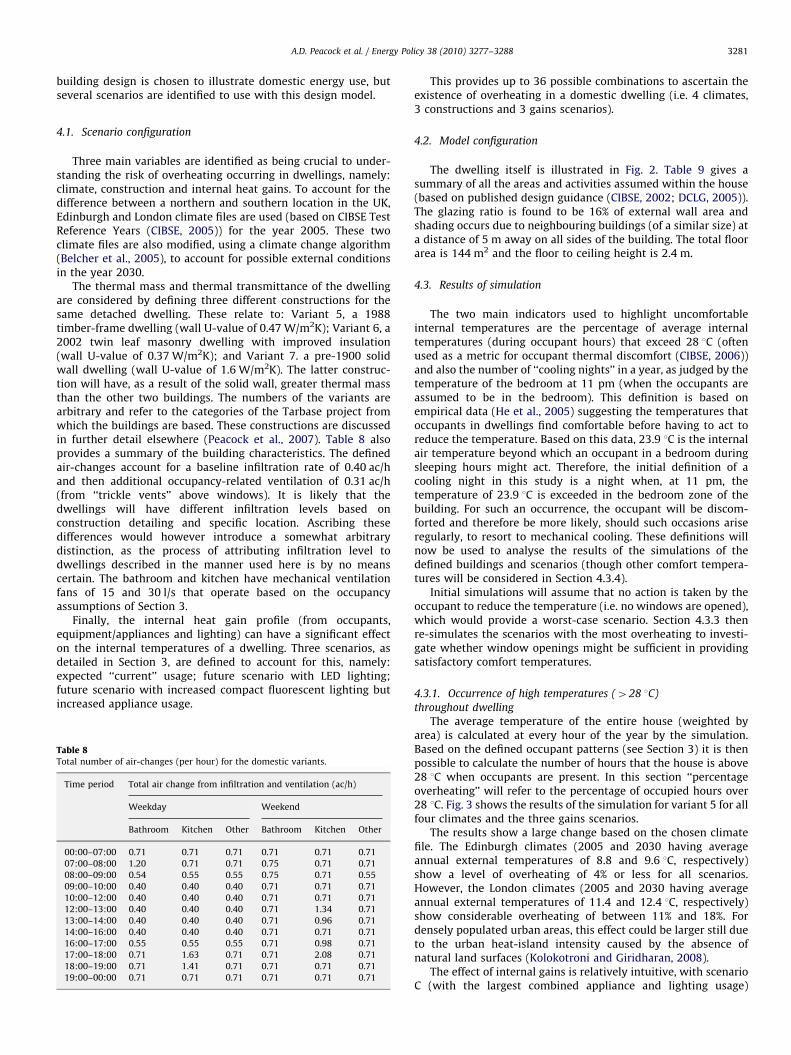
The average temperature of the entire house (weighted byarea) is calculated at every hour of the year by the simulation.Based on the defined occupant patterns (see Section 3) it is thenpossible to calculate the number of hours that the house is above28 1C when occupants are present. In this section ‘‘percentageoverheating’’ will refer to the percentage of occupied hours over28 1C. Fig. 3 shows the results of the simulation for variant 5 for allfour climates and the three gains scenarios.
The results show a large change based on the chosen climatefile. The Edinburgh climates (2005 and 2030 having averageannual external temperatures of 8.8 and 9.6 1C, respectively)show a level of overheating of 4% or less for all scenarios.However, the London climates (2005 and 2030 having averageannual external temperatures of 11.4 and 12.4 1C, respectively)show considerable overheating of between 11% and 18%. Fordensely populated urban areas, this effect could be larger still dueto the urban heat-island intensity caused by the absence ofnatural land surfaces (Kolokotroni and Giridharan, 2008).
The effect of internal gains is relatively intuitive, with scenarioC (with the largest combined appliance and lighting usage)
ARTICLE IN PRESS
Fig. 2. ESP-r wireframe diagram of domestic building used in simulations.
Table 9Floor area and heating set-point temperatures of dwelling for all scenarios [50,51].
Room Floor area (m2) Internal heating
set-point temperature (1C)
Hall 8 21.5
Lounge 36 21.5
Landing 8 21.5
Dining 8 21.5
Kitchen 20 18
Bedrooms 48 18
Bathroom 16 26.5
Total 144 20.4 (average)
0
5
10
15
20
CBAGains Scenario
% o
f occ
upie
d ho
urs
over
28d
egC
Edinburgh 2005Edinburgh 2030London 2005London 2030
Fig. 3. Percentage of occupied hours with average internal temperature over 28 1C
for variant 5.
A.D. Peacock et al. / Energy Policy 38 (2010) 3277–32883282
showing increased overheating, though only marginally. Thissuggests that, when considering the actuators for a future coolingproblem, climatic effects are likely to be more influential thaninternal heat gains (which is opposite to the project findings inthe non-domestic sector in the UK (Jenkins et al., 2008a, 2008b)).Furthermore, in the vast majority of UK domestic buildings,internal gains are more likely to be ‘‘useful’’ throughout the year(i.e. contributing to heating the building in the heating season)than detrimental (causing overheating during the summer). Thisis further explored in Section 4.4.
Repeating the results of Fig. 3 for variants 6 and 7 producesFig. 4, where only the results for the high gain scenario (C) areshown, due to the relatively small effect of internal gains on theoverheating values.
A similar pattern is seen for the other two variants in terms ofthe effect of climate on overheating. However, it is noticeable thatthe high thermal mass dwelling (variant 7) has significantly lessoverheating. For example, for the 2030 London climate and high
gain scenario C, variant 5 has 18% overheating whereas variant 7has only 12%. This demonstrates the effect of thermal mass instoring heat that will be re-radiated at a later time, and thereforeeffectively displacing the peak temperature gains to a time whenit is less likely to cause overheating.
Also of interest, when looking at all the data together, isthe subtle difference between variants 5 and 6 depending onclimate. The Edinburgh climates suggest that adding insulation(i.e. moving from variant 5 to 6) has reduced the overheatingproblem whereas the opposite is true for the London climates(though the difference is relatively small). This is likely to be due

ARTICLE IN PRESS
0
2
4
6
8
10
12
14
16
18
20
% o
ccup
ied
hour
s >2
8deg
C
Edinburgh 2005Edinburgh 2030London 2005London 2030
Variant 5 Variant 6 Variant 7
Fig. 4. Percentage of occupied hours with average internal temperature over 28 1C
for scenario C for all 3 variants.
0
20
40
60
80
100
120
140
CBAGains Scenario
Num
ber o
f nig
hts
requ
iring
coo
ling
Edinburgh 2005Edinburgh 2030London 2005London 2030
Fig. 5. Cooling nights per year in variant 5 across all scenarios.
0
20
40
60
80
100
120
140
Coo
ling
nigh
ts p
er y
ear
Edinburgh 2005Edinburgh 2030London 2005London 2030
Variant 5 Variant 6 Variant 7
A.D. Peacock et al. / Energy Policy 38 (2010) 3277–3288 3283
to the level of gains (both externally and internally generated)already present in the building. For the Edinburgh climates, theexternal temperatures and solar gain are significantly less thanthe London equivalent. Therefore, adding insulation is less likelyto cause a problem with trapping in ‘‘unwanted’’ gains (as theinternal temperatures are, for most of the year, relatively low) andso variant 6 has less of an overheating problem than variant 5(with the insulation having a small effect as a thermal breakbetween external and internal temperatures). However, for theLondon climates the higher external temperatures and solar gain,are, in terms of overheating, more sensitive to the existence ofinsulation and so variant 6 has more of an overheating problemthan variant 5 for these locations. Despite this, even in London it isstill desirable to use insulation due to the effect on the heatingload (see Section 4.4). The overheating risk could be amelioratedby changing the location of the insulation with respect to thethermal mass and it is important that this is considered during thedesign phase in the new build sector.
Fig. 6. Cooling nights per year across all scenarios for all variants for scenario C for
all 3 variants.
4.3.2. Occurrence of cooling nights
The results of cooling nights in variant 5 for all scenarios areshown in Fig. 5. The trend is similar to that seen with the averageoverheating analysis of Section 4.3.1, though the effect of climateappears to be slightly less pronounced. This may be due to the factthat, with the temperature calculated at 11 pm every night, theexternal night-time temperature difference between Edinburghand London is not quite as great as that of the average all-daytemperature. Despite this, the London climates are still predictedas having approximately twice the number of nights requiringcooling as the respective Edinburgh climates. Without anyintervention from the occupant, the 2030 London climate issuggesting that almost a third of nights during the year would bewarmer than the 23.9 1C bedroom comfort temperature. As withSection 4.3.1, the difference between the three internal gainscenarios is small. To further investigate this, variant 5 was re-simulated without any small power or lighting gains (thoughoccupant metabolic gains were retained) for the London 2005climate. This returned 73 cooling nights, compared to 103 coolingnights for the same building and climate with gain scenario C, i.e.a 100% reduction in small power and lighting gains results in a29% reduction in the number of cooling nights. This would implythat small power and lighting gains will only make a largedifference to overheating if we see a radical change in internalactivity by 2030 (though it could be argued that incremental
increases in internal gains might contribute to a ‘‘tipping-point’’for domestic overheating being arrived at). As a result of therelatively small differences in overheating between the gainsscenarios, subsequent discussions will refer to the high gainscenario (C) to define internal activity.
The results for the other variants are included in Fig. 6. Theeffect between the three building variants, and the role of thermalmass, is as described in Section 4.3.1. There is a vast differencebetween, taking the two extremes, variant 7 for the 2005Edinburgh climate (with 27 nights being above the comforttemperature) and variant 6 for the 2030 London climate(124 nights). This suggests that, when attempting to reduceoverheating and, ultimately, reduce the chances that mechanicalair conditioning will be adopted, the approach towards onebuilding should not be the same as another (even within theconfines of the UK).
There is evidence that high and prolonged periods of raisedtemperature may have a larger impact than would be expectedfrom the simple linear relationships that have been foundbetween morbidity and mortality and climatic conditions. Menne(2003) has suggested that this is due to the thermal stress posedby high and prolonged night-time temperatures. It is thereforeuseful to understand not only the frequency that cooling nights

ARTICLE IN PRESS
Table 10Cooling nights and consecutive cooling periods for all variants for gains scenario C.
Climate file Variant 5 Variant 6 Variant 7
Cooling nights/year Longest consecutive
number of cooling nights
Cooling nights/year Longest consecutive
number of cooling nights
Cooling nights/year Longest consecutive
number of cooling nights
Edinburgh 2005 48 18 36 22 27 5
Edinburgh 2030 66 29 59 29 49 22
London 2005 103 72 97 71 84 41
London 2030 121 72 124 105 105 72
0
2
4
6
8
10
12
14
16
18
20
Edinburgh V7
% o
ccup
ied
hour
s ov
er 2
8deg
C
No window openingWith window opening
London V7London V6Edinburgh V6LondonV5 Edinburgh V5
Fig. 7. Effect of window openings on overheating in all variants for 2030 climates.
20
40
60
80
100
120
140
Coo
ling
nigh
ts
No window openingWith window opening
A.D. Peacock et al. / Energy Policy 38 (2010) 3277–32883284
occur, but also to what extent they occur consecutively. Table 10summarises the maximum consecutive cooling period (in terms ofnumber of uninterrupted nights requiring cooling) for eachscenario. The results indicate a relatively concentrated period ofcooling nights with, for example, 105 of the 124 cooling nightsoccurring consecutively. This concentration of a distinct domesticcooling season is more pronounced for the warmer Londonclimates, with the Edinburgh climates being more prone to theodd, intermittent night requiring cooling. All cooling nights fromthe simulations fall into the May to September period.
4.3.3. Effect of window openings
All the above simulations assume that overheating occurswithout occupant intervention. In reality this is unlikely to be thecase, with windows opened during large parts of the summer.Characterising in detail the effect of window openings in a specificdwelling is made complex not only because of the need to judgehow occupants might react to internal temperatures but alsobecause of the plethora of window designs and orientationspossible and their attendant effects, for instance on the capacityto provide cross ventilation. A simplified method was thereforedefined to account for a non-mechanical cooling strategy; thesimulations for the high gain scenario (C) using the 2030Edinburgh and London climates are repeated for the threebuilding variants with an increased air change throughout thedwelling. This will indicate if a potential cooling problem mightstill exist even with occupants adopting a window-openingstrategy for large parts of the potential cooling season.
The air-changes introduced in the model are based onpublished recommendations (DEFRA, 2005). This suggests that awindow opened by 5 cm (deemed suitable for this study) canprovide 0.6 ach to the room in question. This can be increased to1 ach if two opposite windows are able to create cross-flowventilation. This latter case is true for the lounge zone in thesimulated building, with all other buildings receiving an extra0.6 ach during window-opening times. The periods for which thewindows are open assume:
0Edinburgh V7 London V7London V6Edinburgh V6LondonV5 Edinburgh V5
�
Fig. 8. Effect of window openings on cooling nights in all variants for 2030climates.
the potential cooling season is from May to September(as indicated by the worst-case scenario of the previoussimulations). The windows are not opened outside thesemonths,
� the bedroom windows are kept open throughout the night(this should fully test, ignoring noise and security issues, themaximum effect the windows might have on overheating),
� all other windows are open if an occupant is present in thehouse but closed at night,
� all windows are closed when occupants are not present.Figs. 7 and 8 show the results of the window openings. Thenumber of hours that the average temperature exceeds 28 1C issignificantly reduced, with the indication that overheating, for the
defined variants, might not be a problem for a future 2030Edinburgh climate. The same cannot be said for the 2030 Londonclimate—the increased air change has had a significant effect but9.5% to 11.5% of occupant hours are still over 28 1C. The chosenwindow-opening schedule considered here overlooks a number ofsignificant issues. For instance, window-opening behaviour inurban locations is likely to be constrained by factors such asingress of external noise or pollution and also issues surroundingsecurity. This would suggest that further adaptation interventionsmay be required for dwellings in urban locations to preventoverheating (Orme, 2003).

ARTICLE IN PRESS
Table 11Consecutive cooling nights (high gain scenario C) with and without opened
windows for 2030 climates.
Variant Edinburgh 2030 London 2030
Windows
closed
Windows
opened
Windows
closed
Windows
opened
5 29 7 72 70
6 20 7 105 70
7 22 5 72 41
Fig. 9. Cooling nights per year for variant 6 for high gain scenarios.
Fig. 10. Cooling nights per year for variant 7 for high gain scenarios.
Fig. 11. Longest consecutive cooling period for variant 6 for high gain scenarios.
A.D. Peacock et al. / Energy Policy 38 (2010) 3277–3288 3285
In Fig. 7, comparing the differences between the three differentconstructions suggests that increasing the ventilation is moreeffective for variant 5 and 6 than for 7. This effect is again acombination of differences in thermal mass and U-value but islargely due to the fact that variant 7 will have less trapped heatthat requires removal, and so the benefit of opening the windows(particularly the bedroom windows at night) is slightly reduced.
The number of cooling nights (Fig. 8) gives similar indications.The effect seen with the London climates is significant but notsufficient to be able to confidently ignore the threat of futureoverheating problems in the domestic sector. Perhaps of equalsignificance is the change in number of consecutive coolingnights, as shown in Table 11. For the Edinburgh climate, for allbuilding variants, there is now only 5–7 days where there is aconsecutive need for cooling the bedroom. The London climate isstill showing large periods of consecutive cooling periods. Bothvariants 5 and 6 have been reduced to the same number ofconsecutive cooling nights (despite initially having very differentvalues). This could imply that, even after jettisoning excess heatduring the night through the added ventilation of open windows,the night-time external temperatures are so high for the 2030London climate that it becomes more and more difficult to reducethe size of this potential cooling season. While a different lengthof season might be found by simulating other buildings, if theability to remove heat from, in particular, the bedroom at nightbecomes restricted by higher external night-time temperatures,then passive ventilation might tend towards a natural limit inpreventing overheating.
4.3.4. Effect of bedroom comfort temperature
The above results have used 23.9 1C as the maximummaintained bedroom temperature at night. To examine theimportance of this set-point, a sensitivity analysis is now carriedout for the scenarios used in Section 4.3.3 (i.e. the high gainscenario with the 2030 Edinburgh and London climate files).Figs. 9 and 10 give the number of cooling nights per year forvariants 6 and 7 (with variant 5 being similar to variant 6).Also included are the results when windows are opened(i.e. ‘‘Edin2030’’ refers to no windows opened and ‘‘Edin2030W’’refers to the repeated simulation but with the increasedventilation from windows as described above).
There is a general trend throughout all these simulationswhere, as the comfort temperature is increased, window openingshave less of an effect. This is particularly true for the 2030Edinburgh climate where, at temperatures of over 28 1C, thereduction in cooling nights due to window openings tendstowards insignificance. As suggested previously, the windowopenings have slightly more of an effect on variants 5 (and 6)when compared to variant 7.
Figs. 11 and 12 give the corresponding graphs for consecutivecooling nights in variants 6 and 7. Again it is slightly subjective toimagine a consecutive overheating period that an occupant mightfind unacceptable (and so decide to purchase a domestic airconditioning unit). Also, with the study relying on simulation, a
predicted single day respite from consecutive cooling will resetthe count of this period (which explains the difference in Table 11between variants 5 and 6, despite them being very similar interms of total cooling days). There is also the question of, with

ARTICLE IN PRESS
Fig. 12. Longest consecutive cooling period for variant 7 for high gain scenarios.
0
2000
4000
6000
8000
10000
12000
14000
16000
Variant 5 Variant 6 Variant 7
Hea
ting
cons
umpt
ion
(kW
h/yr
)
Edinburgh 2005Edinburgh 2030London 2005London 2030
Fig. 13. Heating consumption (predicted by ESP-r) for all variants with gains
scenario C.
A.D. Peacock et al. / Energy Policy 38 (2010) 3277–32883286
respect to user reaction to dealing with overheating, whetherintermittent cooling periods, e.g. a sudden day or two ofoverheating, will be more important than a longer period ofoverheating that the occupant might become accustomed to(through thermal adaptation). The Edinburgh climate simulationsare seen to have, particularly for comfort temperatures of greaterthan 24 1C, relatively small consecutive cooling periods for allvariants (i.e. less than a week). To produce consecutive coolingperiods of less than a week for the London equivalent wouldrequire comfort temperatures of 28 1C and above.
4.4. Heating requirements
It is important, when suggesting the ability of differentbuildings to avoid overheating, to account for the heatingconsumptions of those same buildings. Fig. 13 gives the annualheating consumptions for all the described variants (with gainsscenario C), based on heating requirements simulated by ESP-r,and with a boiler efficiency of 88% (DEFRA, 2005) applied.
A small correction should be applied to these figures toaccount for thermal bridging, particularly important when, aswith variant 5, a timber frame is present. For such a dwelling,thermal bridging might occur for 15% of the building envelope
area (DEFRA, 2005). However, such detail is without the scope ofthis particular study.
The solid wall dwelling shows considerably higher heatingconsumption due to the relatively poor U-values. This isimportant to note as the same building is predicted to have thesmallest degree of overheating. The sum total of both these effectswould be to conclude that, for the UK, solid wall dwellings,despite having high thermal mass which reduces overheating, arenot energy-efficient throughout the year. A more desirablebuilding, from a heating and cooling perspective (particularly inthe south of the UK), would have both high thermal mass and lowU-values.
5. Conclusions
If the behavioural response of UK householders to a warmingclimate is akin to that of relationships found in the US then it isforecasted that 18% of homes in the South of England will haveinstalled domestic air conditioning systems by 2030. This wouldsuggest that extant climate change will pass through a tipping-point in the next two decades creating a domestic cooling season.However, defining upper limits of thermal comfort in domesticdwellings is a complex and an under researched pathway. Mostthermal comfort research has been conducted in office buildingsand then assumed for domestic buildings. A key aspect of thermalcomfort is that it is an amalgam of physiological and mentalresponse to a climatic condition. Our mental state at home andthe range of adaptive behaviour possible is distinct to that in theoffice and therefore perceptions of comfort are likely to be quitedifferent. A further complexity is introduced associated with thethermo-neutrality of sleep. Two indices were defined here toexplore overheating that are intended to be indicative rather thanconclusive; the first was a simple whole house average tempera-ture, the second introduced the concept of cooling nightsassuming that 23.9 1C is an indicative cooling set-point, and thenestimating the effect of changing this set-point.
The experience of the air conditioning industry in the USsuggests that the development of a mass market is predicated tosome degree on the involvement of the industry itself in definingthe need for an artificial indoor climate on one hand and thedefinition of standards on the other.
There would seem to be a role for policy for addressing issuessurrounding occupant and household scenarios that representhealth related risk from elevated temperatures. Clearly, there arelikely to be occurrences where the presence of an air conditioningsystem represents a key factor in reducing the impact of futureheat waves. However, it is important that existing policyinitiatives currently in place for mitigation technological inter-ventions are extended to adaptation interventions. The deploy-ment of domestic air conditioning may not in itself represent astep change in domestic energy consumption. However, theextension of controlled climates to the domestic sector mayprompt behaviour that is more likely to accentuate rather thanameliorate energy consuming behaviour.
Three domestic building variants were defined within a seriesof climate and internal activity scenarios to explore the change inoverheating risk described by these indices. The simulationsaccounted for forecasted near term warming of the climate,nominally by the year 2030, in both Edinburgh and London.
The effect of increased internal gains associated with plausibleincreases in electrical demand was not found in itself to produce asubstantially increased risk of overheating in any of the dwellingsstudied here.
In common with other studies, the simulations suggest thatlow thermal mass dwellings will be prone to overheating (Hacker,

ARTICLE IN PRESS
A.D. Peacock et al. / Energy Policy 38 (2010) 3277–3288 3287
2008). A significant proportion of the existing UK housing stockcan be considered to be low thermal mass and will therefore bedisadvantaged by extant climate change. However, this is not tosuggest that the existence of future overheating will be solelydetermined by the thermal mass of a dwelling. With an optimisticwindow-opening adaptation strategy, the advantages of increasedthermal mass when compared to the lighter-weight variantsinvestigated become less pronounced. The comparisons betweenthe constructions of the dwellings lead to an interestingconclusion. If using average internal temperature (throughoutthe day) as the overheating metric, the change in buildingmaterial of variant 7 reduces overheating by, approximately,30% when compared to variant 6. However, if using night-timetemperature as the overheating metric, the reduction is only inthe region of 15% between these two substantially differentconstructions. This is likely to be due to the fact that thermal masswill have a greater effect during the day, when it is absorbingexternal heat gains, whereas during the night it is actually re-radiating heat, not absorbing it (though the night-time tempera-ture is still likely to be less). Also, there is greater heat loss invariant 7 due to the higher U-value, so it would be incorrect toassume that the 15% and 30% values are a result of thermal massalone. This would therefore imply that more empirical data isneeded to define two problem areas, namely: (a) what is asuitable overheating metric for characterising when people mightshow thermal discomfort in their homes and (b) if night-timetemperatures are a suitable metric, are we overestimating how farthermal mass can reduce the overheating problem (and is thisanalysis even further complicated by many high thermal massdwellings in the UK also having high U-values)?
Even accounting for these fundamental issues, the mainparameters causing overheating appear to be those relating tolocal climate, whether due to predicted climate change by 2030 ordue to the increased summer temperatures in the south of theUK—it is also suggested that the microclimate of a ‘‘heat-island’’such as London will exacerbate this effect. The differencesbetween Edinburgh and London climates and 2005 and 2030climates were pronounced. The results predicted that theincidence of overheating in Edinburgh in any of the dwellings in2030 will not exceed that for London using 2005 climate files. Thedifference between the two well insulated dwellings investigatedhere was less pronounced than might have been expected. Thetwin leaf masonry and timber frame constructions both hadsimilar levels of overheating suggesting that thermal mass per sewill not predetermine the risk posed by warming climates toexisting dwellings. The results suggest that another contributingfactor that will affect overheating risk is the trapping of gains inthe dwelling as a consequence of the positioning of theinsulation—conventionally inside the thermal mass. For newbuild dwellings, and also accounting for heating consumption, onesolution to achieving a building that performs well during thesummer and winter may be to ensure a high thermal mass andlow U-value.
In the UK, gaining empirical evidence for such a ‘‘coolingtipping-point’’, where occupants can no longer maintain theirdesired comfort temperature by passive means alone (e.g. open-ing windows), is difficult. This is partly because the problem beingdiscussed is not yet manifest—the concern suggested by thisstudy is that a warming climate is likely to make domesticoverheating a more widespread issue in the future. The use ofmechanical cooling in the home, for buildings that have not beendesigned with overheating in mind, represents an additionalsource of domestic CO2 emissions, adding an additional burden tocurrent legislation that is being implemented to reduce thecarbon emissions of existing UK homes. Further to this, a precisedefinition of overheating, in a UK context, is still not apparent.
It should be emphasised that this is a simulation exercise forspecific building types and specific scenarios. While furthersimulations might add to the study, it is suggested that moreempirical evidence would be most valuable in this research area.
Acknowledgement
The Tarbase project is funded by the UK Carbon Trust andEngineering and Physical Sciences Research Council (EPSRC) as partof the Carbon Vision Buildings programme (Grant no. GR/S94285/01).
References
Anderson, B.R., 2002, BREDEM-12 Model description 2001 update, BuildingResearch Establishment.
ASHRAE, 2001, American Society of Heating, Refrigerating and Air-ConditioningEngineers, ASHRAE Fundamentals Handbook, Chapter 29.
Banfill, P.F.G., Peacock, A.D., 2007. Energy efficient new housing—the UK reachesfor sustainability. Building Research and Information 35, 426–436.
Belcher, S.E., Hacker, J.N., Powell, D.S., 2005. Constructing design weather data forfuture climates. Building Services Engineering Research and Technology 26,49–61.
Bell, M., Lowe, R.J., 2000. Energy efficient modernisation of housing: a UK casestudy. Energy and Buildings 32, 267–280.
BERR, 2008, Digest of UK Energy Statistics: /http://www.dti.gov.uk/energy/statistics/publications/prices/index.htmlS, UK Government.
Brown, N., Caeiro, J.A.J., Bruhns, H., Wright, A.J., Summerfield, A.J., Oreszczyn, T.,2006, Air conditioning surveys in the UK retail sector, or ’Keeping the Cold in’,Improving Energy Efficiency in Commercial Building Conference.
Candas, V., Libert, J.P., Muzet, A., 1982. Heating and cooling stimulations duringSWS and REM sleep in man. Journal of Thermal Biology 7, 155–158.
CIBSE, 2002, Chartered Institute of Building Services Engineers, Heating, CIBSEGuide B1.
CIBSE, 2005, Met Office Hourly Weather Data, Chartered Institution of BuildingServices Engineers/UK Meteorological Office.
CIBSE, 2006, Chartered Institute of Building Services Engineers, EnvironmentalDesign, CIBSE Guide A.
Cooper, G., 1998. Air-conditioning America: Engineers and the ControlledEnvironment, 1900–1960. John Hopkins University Press, Baltimore.
DCLG, 2005, UK Department of Communities and Local Government, EnglishHouse Condition Survey.
DEFRA, 2005, UK Government’s Standard Assessment Procedure (SAP) for EnergyRating of Dwellings, BRE/DEFR.
DEFRA, 2008a, Climate Change Bill Final Impact Assessment, UK Government.DEFRA, 2008b, Guidelines to Defra’s GHG Conversion Factors: Methodology Paper
for Transport Emission Factors, UK Government.Dewasmes, G., Telliez, F., Muzet, A., 2000. Effects of a nocturnal environment
perceived as warm on subsequent daytime sleep in humans. Sleep 23 (3),409–413.
Di Nisi, J., Ehrhart, J., Galeou, M., Libert, J.P., 1989. Influence of repeated passivebody heating on subsequent night sleep in humans. European Journal ofApplied Physiology 59, 138–145.
DTI, 2006, Energy Challenge – Energy Review, UK Government.EST, 2006, The rise of the machines: a review of energy using products in the home
from the 1970s to today, Energy Saving Trust.Golding, L.A., Yousef, M.K., 1989. Thermoneutral zone of old men and women. In:
Yousef, M.K. (Ed.), Milestones in Environmental Physiology. SPB Academic,The Hague, The Netherlands.
Hacker J.N., (2008) Climate change in London: implications for passive and activecooling of dwellings, Arup, 13 Fitzroy St, London W1T 4BQ, UK.
Haskell, E.H., Palca, J.W., Walker, J.M., Berger, R.J., Heller, H.C., 1981. The effects ofhigh and low ambient temperatures on human sleep stages. Electroencepha-lography and Clinical Neurophysiology/Electromyography and Motor Control51, 494–501.
He, J., Young, A.N., Pathan, A. and Oreszczyn, T., 2005, Air conditioning energy usein houses in Southern England, dynamic analysis, Simulation and TestingApplied to The Energy and Environmental Performance of BUILDINGSConference, Athens.
Herring, H., Roy, R., 2007. Technological innovation, energy efficient design and therebound effect. Technovation 27 (4), 194–203.
Jenkins, D.P., Peacock, A.D., Banfill, P.F.G., 2008. Will future low-carbon schools inthe UK have an overheating problem? Building and Environment in press(available online)
Jenkins D.P., Peacock A.D., and Liu Y., 2008, Assessing the risks and likelihood ofeliminating cooling loads in UK offices, 5th International Conference,improving energy efficiency in commercial buildings (IEECB’08), Frankfurt.
Jenkins, G.J., Perry, M.C., and Prior, M.J.O., 2007, The Climate of the United Kingdomand recent trends, Met Office Hadley Centre, Exeter, UK.
Jordan, U., Vajen, K., 2001. Influence of the DHW load profile on the fractionalenergy savings. A Case Study of a Solar Combi-System with TRNSYSSimulations Solar Energy 69, 97–208.

ARTICLE IN PRESS
A.D. Peacock et al. / Energy Policy 38 (2010) 3277–32883288
Kane, D. and Newborough, M., 2006, Estimating carbon savings for domestic base-load micro-CHP systems, World Renewable Energy Congress (WREC) IX:Proceedings of WREC ’06.
Kemna, R., van Elburg, M., Li, W. and van Holsteijn, R., 2005, Methodology studyeco-design of energy-using products (MEEUP): product cases report, FinalReport.
Knight, I. and Ribberink, H., 2007, European and Canadian non-HVAC Electric andDHW Load Profiles for use in Simulating the Performance of ResidentialCogeneration System, Report of Subtask A of FC CCOGEN-SIM, Annex 42 of theInternational Energy Agency.
Kolokotroni, M., Giridharan, R., 2008. Urban heat island intensity in London: aninvestigation of the impact of physical characteristics on changes in outdoorair temperature during summer. Solar Energy 82, 986–998.
Levine, M., Urge-Vorsatz, D., Blok, K., Geng, L., Harvey, D., Lang, S., Levermore, G.,Mongameli Mehlwana, A., Mirasgedis, S., Novikova, A., Rilling, J., Yoshino, H.,2007. Residential and commercial buildings. In: Metz, B., Davidson, O.R., Bosch,P.R., Dave, R., Meyer, L.A. (Eds.), Climate Change 2007: Mitigation. Contributionof Working Group III to the Fourth Assessment Report of the Intergovern-mental Panel on Climate Change. Cambridge University Press, Cambridge,United Kingdom and New York, NY, USA.
Lin, Z., Deng, S., 2006. A questionnaire survey on sleeping thermal environmentand bedroom air conditioning in high-rise residences in Hong Kong. Energyand Buildings 38, 1302–1307.
Lin, Z., Deng, S., 2008. A study on the thermal comfort in sleeping environments inthe subtropics – developing a thermal comfort model for sleeping environ-ments. Building and Environment 43, 70–81.
Macpherson, R.K., 1973. Thermal stress and thermal comfort. Ergonomics 16 (5),611–622.
Mansouri, I., Newborough, M., Probert, D., 1996. Energy consumption in UK house-holds: impact of domestic electrical appliances. Applied Energy 54, 211–285.
Menne, B., 2003, Heat-waves: impacts and responses, WHO briefing note for thefifty-third session of the WHO Regional Committee for Europe, Vienna, Austria.
MTPROG, 2007, UK Market Transformation Programme, /www.mtprog.comS.Naughton, M.P., Henderson, A., Mirabelli, M.C., Kaiser, R., Wilhelm, J.L., Kieszak,
S.M., Rubin, C.H., McGeehin, M.A., 2002. Heat-related mortality during a 1999heat wave in Chicago. American Journal of Preventative Medicine 22 (4).
Newborough, M. and Augood, P., 1999, Demand-side management opportunitiesfor the UK domestic sector, Institution of Electrical Engineers (IEE) Proceed-ings: Generation, Transmission and Distribution, 146, pp. 283–293.
Okamoto-Mizuno, K., Mizuno, K., Michie, S., Maeda, A., Iizuka, S., 1999. Effects ofhumid heat exposure on human sleep stages and body temperature. Sleep 22,767–773.
Okamoto-Mizunoa, K., Tsuzukia, K., Mizunob, K., Iwakic, T., 2005. Effects of partialhumid heat exposure during different segments of sleep on human sleepstages and body temperature. Physiology & Behaviour 83, 759–765.
ONS, 2000, UK Government Office for National Statistics, Time Use Survey.ONS, 2002, UK Government Office for National Statistics, General Household
Survey.Orme, M., (2003), Control of overheating in future housing, – design guidance for
low energy strategies, John Palmer, Faber Maunsell, St Albans.Palca, J.W., 1986. Thermoregulation, metabolism, and stages of sleep in cold,
exposed men. Journal of Applied Physiology 61, 940–947.Peacock, A.D., Banfill, P.F., Newborough, M., Kane, D., Turan, S., Jenkins, D., Ahadzi,
M., Bowles, G., Eames, P.C., Singh, H., Jackson, T. and Berry, A., 2007, ReducingCO2 emissions through refurbishment of UK housing, European Council for anEnergy Efficient Economy, Summer Study, Cote d’Azur.
Raymann, R.J.E.M., Swaab, D.F., Van Someren, E.J.W., 2007. Skin temperature andsleep-onset latency: changes with age and insomnia. Physiology & Behavior90, 257–266.
Sailor, D.J., Pavlova, A.A., 2003. Air conditioning market saturation and long-termresponse of residential cooling energy demand to climate change. Energy 28,941–951.
Shorrock, L.D., Utley, J.I., 2003. Domestic Energy Fact File 2003. Building ResearchEstablishment Press.
Stokes, M., Rylatt, M., Lomas, K., 2004. A simple model of domestic lightingdemand. Energy and Buildings 36, 103–116.
Twenga, 2008, /http://www.twenga.co.uk/offer/13384/5212207012990821794.htmlS accessed November 2008.
Wilhite H., 2007, Will efficient technologies save the world? A call for newthinking on the ways that end-use technologies affect energy using practices,European Council for an Energy Efficient Economy, Summer Study, Coted’Azur.
Wilkins, C., Hosni, M., 2000. Heat gain from office equipment. ASHRAE Journal 42,6.
Wood, G., Newborough, M., 2003. Dynamic energy-consumption indicators fordomestic appliances: environment, behaviour and design. Energy andBuildings 35, 821–841.
Wright, A.J., Young, A.N., Natarajan, S., 2005. Dwelling temperatures and comfortduring the August 2003 heat wave. Building Service Engineering 26, 285.
WWF-UK, 2008, Centre for Sustainable Energy/Association for The Conservation ofEnergy, how low: achieving optimal carbon savings from the UK’s existinghousing stock.
Yanase, T., 1981. A condition for good sleep—managements for sleep. In: Endou, S.,Okudairu, N. (Eds.), Sleeplessness. Yuhikaku, Tokyo, pp. 275–285.