Variation in tooth mark frequencies on long bones from the assemblages of all three extant...
27
Variation in tooth mark frequencies on long bones from the assemblages of all three extant bone-collecting hyaenids Brian F. Kuhn a , b , Lee R. Berger b and John D. Skinner a a Centre for Veterinary Wildlife Studies, Faculty of Veterinary Science, University of Pretoria, Pvt Bag X04, Onderstepoort 0110, South Africa b Institute for Human Evolution and the Bernard Price Institute for Palaeontological Research, School of GeoSciences, University of the Witwatersrand, Johannesburg, WITS 2050, South Africa Abstract Tooth mark frequencies on long bones are examined from the assemblages of all three extant bone- collecting hyaenids. Comparisons are made with a recent study examining tooth mark frequencies and possible sources of variation from a single spotted hyaena (Crocuta crocuta) assemblage (Faith, J.T., 2007. Sources of variation in carnivore tooth-mark frequencies in a modern spotted hyena (Crocuta crocuta) den assemblage, Amboseli Park, Kenya. Journal of Archaeological Science 34 (10), 1601–1609). The factors that may influence tooth mark frequencies are fragment size, fragments from different sized animals, region of skeletal element and bone density. All four factors are examined in the present study and compared across species and with previous results. The results indicate that there is a great deal of variation in tooth mark frequencies not only between the species but also from the same species. Keywords: Tooth marks; Striped hyaena; Spotted hyaena; Brown hyaena; Taphonomy 1. Introduction Variations in carnivore damage found between various carnivore species have been investigated on a broad scale previously (Haynes, 1983 ). In an attempt to illustrate possible sources of variation in carnivore tooth mark frequencies Faith (2007) conducted an examination of the remains of prey animals previously collected from a spotted hyaena (Crocuta crocuta) den in Amboseli Park, Kenya. He examined four specific questions in relation to tooth marks frequency: ‘(1) How does long-bone fragment size impact tooth-mark frequencies? (2) How do tooth-mark frequencies vary across taxa of different body size classes? (3) How does the incidence of tooth-marking vary across portions of different long bone elements? (4) What is the relationship between tooth-mark
-
Upload
independent -
Category
Documents
-
view
0 -
download
0
Transcript of Variation in tooth mark frequencies on long bones from the assemblages of all three extant...

Variation in tooth mark frequencies on long bones from the assemblages of all three extant
bone-collecting hyaenids
Brian F. Kuhna, b, Lee R. Bergerb and John D. Skinnera
aCentre for Veterinary Wildlife Studies, Faculty of Veterinary Science, University of Pretoria, Pvt
Bag X04, Onderstepoort 0110, South Africa
bInstitute for Human Evolution and the Bernard Price Institute for Palaeontological Research,
School of GeoSciences, University of the Witwatersrand, Johannesburg, WITS 2050, South Africa
Abstract
Tooth mark frequencies on long bones are examined from the assemblages of all three extant bone-
collecting hyaenids. Comparisons are made with a recent study examining tooth mark frequencies
and possible sources of variation from a single spotted hyaena (Crocuta crocuta) assemblage (Faith,
J.T., 2007. Sources of variation in carnivore tooth-mark frequencies in a modern spotted hyena
(Crocuta crocuta) den assemblage, Amboseli Park, Kenya. Journal of Archaeological Science 34
(10), 1601–1609). The factors that may influence tooth mark frequencies are fragment size,
fragments from different sized animals, region of skeletal element and bone density. All four factors
are examined in the present study and compared across species and with previous results. The
results indicate that there is a great deal of variation in tooth mark frequencies not only between the
species but also from the same species.
Keywords: Tooth marks; Striped hyaena; Spotted hyaena; Brown hyaena; Taphonomy
1. Introduction
Variations in carnivore damage found between various carnivore species have been investigated on
a broad scale previously (Haynes, 1983). In an attempt to illustrate possible sources of variation in
carnivore tooth mark frequencies Faith (2007) conducted an examination of the remains of prey
animals previously collected from a spotted hyaena (Crocuta crocuta) den in Amboseli Park,
Kenya. He examined four specific questions in relation to tooth marks frequency: ‘(1) How does
long-bone fragment size impact tooth-mark frequencies? (2) How do tooth-mark frequencies vary
across taxa of different body size classes? (3) How does the incidence of tooth-marking vary across
portions of different long bone elements? (4) What is the relationship between tooth-mark

frequency and bone density?’ (Faith, 2007, p. 1602). Faith limits the long bone data set to mammal
remains, and appears to exclude anything smaller than springhares (Pedetes capensis). In addition
the sample set is limited to weathering stages 0–1 (weathering data follow Behrensmeyer, 1978).
Faith concludes that there is a positive relationship between per cent tooth marks and the length of
fragments, as well as a direct relationship between tooth marks and prey body size. The 2007 study
indicates that tooth mark frequencies are highly variable across various portions of the long bone
elements. The relationship between bone density and tooth mark percentages, as shown by Faith, is
negative for long bone epiphyses and proximal/distal shafts while mid shafts show no relationship
with bone density.
Our study looks at the same questions for all three bone-collecting hyaenids from four countries and
two continents. In order to make as direct a comparison as possible between our study and the
results reported by Faith, our study examined the long bone remains from mammals with
weathering stages 0–1. In addition, data without weathering limitations were also examined in order
to determine if weathering influences the outcome. In data sets where Faith limits the examination
to bovid size class 2–3 (following Brain, 1981), our study gives data for all mammals as well as
data limited to bovid size class 2–3. Our study also indicates that, when the assemblages of all three
extant bone-collecting hyaenas are examined, the tooth mark frequencies are significantly different
between the species as well as different within the species when various limitations are placed upon
the data sets.
2. Study sites
For our study hyaena dens were located and the associated faunal remains examined from dens in
Jordan, South Africa, Botswana and Namibia. For precise locations of the Jordan dens see Kuhn
(2005) and for study site locations in southern Africa see Kuhn et al. (2008). In Jordan the faunal
accumulations of five active striped hyaena (Hyaena hyaena) dens were collected and examined in
three areas of the eastern desert. Four spotted hyaena dens were located and the faunal remains
examined in the Mashatu Game Reserve, Botswana and two dens located in the Namib-Naukluft
Park, Namibia. In South Africa three active brown hyaena (Parahyaena brunnea) dens from the
Rietvlei Nature Reserve were collected from and the faunal remains examined. Additional faunal
remains from South Africa were collected from active brown hyaena dens near the Gladysvale
palaeontology site. The faunal remains from nine brown hyaena dens in the south west of Namibia
on the Luderitz Peninsula and in Diamond Area No. 1 were analysed in situ. Faunal remains
previously collected by Skinner and van Aarde (1991) and Skinner et al. (1998) from Diamond
Area No. 1 were reanalysed and included in this study.

3. Materials and methods
Our study examined more than 27 000 bones, 7843 of which were identified as long bones, from the
dens of all three extant bone-collecting hyaenas. Only material from terrestrial mammals, excluding
species smaller than hyraxes (Procavia capensis) was included. Species identified with NISP
(number of identified specimens) and MNI (minimum number of individuals) for the three hyaena
species can be seen in Table 1. NISP (0–1) and MNI (0–1) refer to material with weathering stages
0–1. MNI was calculated using the body side of long bones for each species. For each specimen
data recorded were: skeletal element, taxon, bovid size class, portion of long bone, length of
specimen and carnivore tooth marks (presence). Macroscopic tooth marks were noted with the
naked eye. Division of skeletal elements followed Marean and Spencer (1991) in dividing the long
bones into proximal end, proximal shaft, distal end, distal shaft and middle shaft, for the sake of
documenting carnivore tooth marks at specific locations on long bones and long bone fragments.
Like Faith, we examine the percentage of tooth marks on long bones in relation to the total number
of long bones.
Table 1. NISP and MNI of faunal remains collected by each species of hyaena
Taxon NISP NISP (0–1) MNI MNI (0–1)
Striped hyaenas
Camelus dromedarius 275 127 25 9
Camel/horse size 26 2
Equus caballus 20 18 4 3
Bos spp. 3 3 1 1
Canid 41 22 5 3
Equus asinus 78 43 9 7
Vulpes spp. 5 2 4 2
Capra hircus 16 13 4 3
Ovis/Capra 31 28 5 5
Ovis aries 5 5 2 2
Gazella spp. 12 12 3 3
Hare/small fox size 1 1 1 1
Lepus spp. 4 1 4 1

Taxon NISP NISP (0–1) MNI MNI (0–1)
Sus scrofa 1 0 1 0
Bovid size 2 1003 839 5 4
Bovid size 3 37 21 6 4
Bovid size 4 1083 371 2 2
Total 2641 1379 56 52
Spotted hyaenas
Aepyceros melampus 82 19 13 3
Tragelaphus strepsiceros 38 5 4 1
Connochaetes taurinus 8 1 3 1
Papio cynocephalus 4 3 2 1
Phacochoerus africanus 6 3 2 1
Procavia capensis 5 4 2 2
Capra hircus 6 1 1 1
Raphicerus campestris 5 3 2 1
Sylvicapra grimmia 1 1 1 1
Equus burchellii 20 4 3 1
Crocuta crocuta 1 1 1 1
Bovid size 1 2 2 1 1
Bovid size 2 23 17 2 2
Bovid size 3 28 6 4 1
Total 229 70 41 18
Brown hyaenas
Antidorcas marsupialis 46 9 6 1
Oryx gazella 61 3 7 1
Damaliscus dorcas phillipsi 6 5 1 1
Connochaetes taurinus 2 2 1 1

Taxon NISP NISP (0–1) MNI MNI (0–1)
Alcelaphus buselaphus 1 1 1 1
Syncerus caffer 2 2 1 1
Oreotragus oreotragus 7 0 2 0
Equus burchellii 5 4 1 1
Canis familiaris 178 9 32 1
Canis mesomelas 121 13 15 3
Vulpes chama 22 1 4 1
Felis (domestic size) 44 3 6 1
Parahyaena brunnea 31 2 7 1
Bovid size 2 6 6 2 2
Bovid size 3 2 2 1 1
Total 534 62 87 17
Analyses of faunal material were completed using reference collections housed at the Council for
British Research in the Levant, Amman, Jordan, the Palaeoanthropology Unit for Research and
Exploration (PURE), Bernard Price Institute for Palaeontological Research, University of the
Witwatersrand, Johannesburg, South Africa and four publications ([Hillson, 1992], [Peters, 1986],
[Schmid, 1972] and [Walker, 1985]). Specimens from South Africa and Botswana were collected,
bagged, labelled and transported to laboratory facilities at PURE, the Bernard Price Institute for
Palaeontological Research, University of the Witwatersrand, Johannesburg, for identification and
analysis. Analyses of faunal remains in Namibia had to be completed in situ at the den sites,
complying with protocols set by NAMDEB Diamond Company and the Namibian Ministry of
Environment and Tourism.
4. Results
4.1. Tooth marks and length of long bones and long bone fragments
Table 2 illustrates the per cent tooth marks on long bones across 20 mm length intervals. Included
in the table are results that, like Faith, limit the data to specimens with weathering stages 0–1 as
well as data unlimited by weathering stages. The relationship between the length of long bone and
long bone fragment was positive for all three hyaena species, whether the data were limited or not,

but only significant for spotted hyaenas and brown hyaenas whereas the correlation was not
significant for striped hyaenas with limited data sets (spotted hyaena: unlimited r = 0.998,
p = <0.0001, limited r = 0.994, p = <0.0001; brown hyaena: unlimited r = 0.996, p = <0.0001,
limited r = 0.974, p = <0.0001; striped hyaena: unlimited r = 0.514, p = 0.19. limited r = 0.278,
p = 0.50).
Table 2. Percentage of tooth marked (%TM) long bones across 20 mm size groupings; N is the total
number of long bones for each size grouping
Length in mm Striped hyaena
Spotted hyaena
Brown hyaena
N %TM N %TM N %TM
Weathering stages 0–1
0–20.0 201 8.5 10 40.0 0 0.0
20.1–40.0 312 32.4 9 33.3 2 100.0
40.1–60.0 223 63.7 6 33.3 3 66.7
60.1–80.0 196 85.2 10 70.0 2 0.0
80.1–100.0 159 91.8 5 80.0 7 85.8
100.1–120.0 97 95.9 4 75.0 4 75.0
120.1–140.0 62 90.3 5 60.0 7 57.1
>140 214 97.2 19 57.9 27 88.9
Total 1464 70.6 68 56.2 52 59.2
All weathering stages
0–20.0 205 8.3 11 36.4 3 66.7
20.1–40.0 525 19.2 16 50.0 22 54.6
40.1–60.0 493 29.4 15 60.0 39 35.9
60.1–80.0 313 55.6 16 56.3 53 49.1
80.1–100.0 290 52.4 22 72.3 73 61.6
100.1–120.0 186 54.8 19 52.6 65 69.2
120.1–140.0 123 47.2 16 81.3 88 64.8

Length in mm Striped hyaena
Spotted hyaena
Brown hyaena
N %TM N %TM N %TM
>140 414 57.3 118 55.1 203 69.5
Total 2549 40.5 233 58.0 546 58.9
4.2. Prey body size and tooth mark frequencies
Previous works contend that bovid class size 2 and 3 are the most abundant remains found in
modern assemblages. While our study concurs that bovid class size 2 and 3 are the most abundant
for spotted hyaenas and brown hyaenas, Table 1 illustrates that bovid size class 1 occurs (though
not in great abundance) in accumulations of spotted hyaenas and brown hyaenas and bovid size
class 4 occurs in accumulations of brown hyaenas and occurs in equal abundance to bovid size class
3 in striped hyaena accumulations. For matters of direct comparison Table 3 limits the range of data
to mid shaft fragments of bovid class size 2 and 3 only. Examining the limited data, as prey size
increases the per cent tooth marks increases by 50% for spotted hyaenas and 51% for striped
hyaenas, but decreases by 37.5% for brown hyaenas. The unlimited data indicate an increase in
tooth mark frequency in relation to increased prey size for striped hyaenas (20.8%) and brown
hyaenas (1.7%), while spotted hyaena accumulations exhibit a decrease of 12%. With the exception
of the unlimited brown hyaena data, whether the tooth mark frequencies increase or decrease the X2
are greater than the 6.53 reported by Faith and are significant. Further restricting the data to only
include fragments from 20 to 60 mm in length illustrates a negative relation between prey body size
and tooth mark frequencies for all three unlimited data sets with each decrease being significant for
brown hyaenas and not significant for striped hyaenas or spotted hyaenas (striped hyaena X2 = 8.54
(p = 0.014), brown hyaena X2 = 0.21 (p = 0.90), spotted hyaena X2 = 2.04 (p = 0.361)). The spotted
hyaena assemblage limited to length and weathering 0–1 shows an increase in tooth marks as prey
body size increases (X2 = 0.03, p = 0.985). Prey body size class 3 does not occur in assemblages
from striped hyaenas or brown hyaenas when limited to length 20–60 mm.

Table 3. Mid shaft fragments with per cent tooth marked (%TM) for bovid size class 2 and 3
mammals, weathering stages 0–1 and all weathering stages where N is the total number of
specimens
Striped hyaena (0–1) N %TM Striped hyaena N %TM
Long-bone mid shafts Long-bone mid shafts
Size 2 863 49 Size 2 1105 42.4
Size 3 30 100 Size 3 129 63.6
Long-bone mid shafts (fragment length 20.0–60.0 mm)
Long-bone mid shafts (fragment length 20.0–60.0 mm)
Size 2 576 46.4 Size 2 691 30.1
Size 3 0 0 Size 3 10 20
Brown hyaena (0–1) N %TM Brown hyaena N %TM
Long-bone mid shafts Long-bone mid shafts
Size 2 8 87.5 Size 2 58 82.8
Size 3 2 50 Size 3 71 84.5
Long-bone mid shafts (fragment length 20.0–60.0 mm)
Long-bone mid shafts (fragment length 20.0–60.0 mm)
Size 2 0 0 Size 2 5 80
Size 3 0 0 Size 3 18 72.2
Spotted hyaena (0–1) N %TM Spotted hyaena N %TM
Long-bone mid shafts Long-bone mid shafts
Size 2 12 33.3 Size 2 111 63.1
Size 3 6 83.3 Size 3 94 51.1
Long-bone mid shafts (fragment length 20.0–60.0 mm)
Long-bone mid shafts (fragment length 20.0–60.0 mm)
Size 2 6 16.7 Size 2 17 47.1
Size 3 2 50 Size 3 52 34.6

4.3. Distribution and frequency across long bone elements
Examining specific long bones, tooth marks (by location following Marean and Spencer, 1991) and
the relative frequencies of tooth marks were documented for sample sets that include bovid class
size 2 and 3 (Table 4), bovid class size 2 and 3 with weathering limited to 0–1 (Table 5), all
terrestrial mammals (Table 6) and all terrestrial mammals with weathering limited to 0–1 (Table 7).
Specific long bones examined include femurs, tibiae, humeri, radii, and metapodials. Metapodials
include metacarpals and metatarsals as well as specimens identified only as metapodials. Frequency
of tooth marks and location are recorded as well as the relevant percentages for each specific long
bone. The data reported here refer to general tooth mark locations and the percentage in relation to
element. While restricting the data to bovid class size 2–3 and weathering 0–1 reduces the incidence
of tooth marks in the data set, the relative frequencies of tooth marks across the specific regions of
long bones remain consistent for all three species of hyaena.

Table 4. Anatomical distribution and frequency of tooth marks across long bone elements, bovid
size 2–3
Portion
Element
Femur
Tibia Humerus Radius Metapodials
TM % TM % TM % TM % TM %
Striped hyaena
Proximal end 5 29.4 18 41.9 8 40 17 32.7 14 19.2
Proximal shaft 1 5.9 11 25.6 0 0 8 15.4 5 6.9
Distal shaft 0 0 2 4.7 0 0 7 13.5 2 2.7
Distal end 6 35.1 14 33 10 50 17 32.7 13 17.8
Middle shaft 2 11.8 6 14 0 0 10 19.2 12 16.4
Brown hyaena
Proximal end 14 67 6 26.1 10 66.7 6 28.6 7 20.0
Proximal shaft 2 9.5 8 34.8 2 13.3 5 23.8 4 11.4
Distal shaft 5 24 5 21.7 3 20 4 19.1 13 37.1
Distal end 14 66.7 3 13 10 66.7 6 28.6 6 17.1
Middle shaft 2 9.5 2 8.7 4 26.7 1 4.8 6 17.1
Spotted hyaena
Proximal end 9 34.6 4 18.2 13 33.3 2 10.5 5 12.2
Proximal shaft 4 15.4 2 9.1 8 20.5 1 5.3 8 19.5
Distal shaft 5 19.2 3 13.6 9 23.1 4 21.1 3 7.3
Distal end 10 38.5 0 0 11 28.2 3 15.8 6 14.6
Middle shaft 1 3.9 3 13.6 3 7.7 0 0 3 7.3

Table 5. Anatomical distribution and frequency of tooth marks across long bone elements, bovid
size 2–3, weathering 0–1
Portion
Element
Femur
Tibia Humerus Radius Metapodials
TM % TM % TM % TM % TM %
Striped hyaena
Proximal end 6 54.6 17 46.0 6 40.0 17 34.7 14 29.2
Proximal shaft 1 9.1 11 29.7 0 0 8 16.3 5 10.4
Distal shaft 0 0 3 8.1 1 6.7 7 14.3 1 2.1
Distal end 8 72.7 14 37.8 9 60 17 34.7 12 25.0
Middle shaft 2 18.2 6 16.2 1 6.7 11 22.5 12 25
Brown hyaena
Proximal end 2 100 1 20 4 100 0 0 3 25.0
Proximal shaft 1 50 1 20 1 25 2 50 2 16.7
Distal shaft 1 50 1 20 0 0 1 25 5 41.7
Distal end 1 50 0 0 3 75 1 25 2 16.7
Middle shaft 1 50 2 10 3 75 1 25 4 33.3
Spotted hyaena
Proximal end 3 27.3 0 0 2 33.3 0 0 2 25
Proximal shaft 4 37 1 14.3 2 33.3 1 12.5 2 25
Distal shaft 2 18 1 14.3 3 50 1 12.5 0 0
Distal end 3 27.3 0 0 2 33.3 1 12.5 1 13
Middle shaft 0 0 1 14.3 0 0 0 0 1 12.5

Table 6. Anatomical distribution and frequency of tooth marks across long bone elements, all
terrestrial mammals
Portion
Element
Femur
Tibia Humerus Radius Metapodials
TM % TM % TM % TM % TM %
Striped hyaena
Proximal end 11 19.6 37 30.6 34 50.0 25 22.9 48 21.2
Proximal shaft 1 1.8 15 12.4 1 1.5 17 15.6 8 3.5
Distal shaft 2 3.6 4 3.3 2 2.9 8 7.3 5 2.2
Distal end 12 21.4 22 18.2 38 55.9 23 21.1 49 21.60
Middle shaft 3 5.4 11 9.1 6 8.8 16 14.7 22 9.9
Brown hyaena
Proximal end 33 47 30 27.3 29 35.8 10 11.5 8 4.1
Proximal shaft 11 16 38 34.6 27 33.3 13 14.9 8 4.1
Distal shaft 14 20 15 13.6 10 12.4 15 17.2 17 8.6
Distal end 32 45.7 19 17.3 26 32.1 15 17.2 6 3
Middle shaft 3 4.3 4 3.6 6 7.4 2 2.3 9 4.6
Spotted hyaena
Proximal end 12 32.4 5 15.2 15 31.9 4 13.8 4 6.9
Proximal shaft 7 18.9 4 12.1 10 21.3 1 3.5 9 15.5
Distal shaft 7 18.9 3 9.1 10 21.3 5 17.2 3 5.2
Distal end 13 35.1 3 9.1 12 25.5 4 13.8 5 8.6
Middle shaft 1 2.7 3 9.1 3 6.4 1 3.5 2 3.5
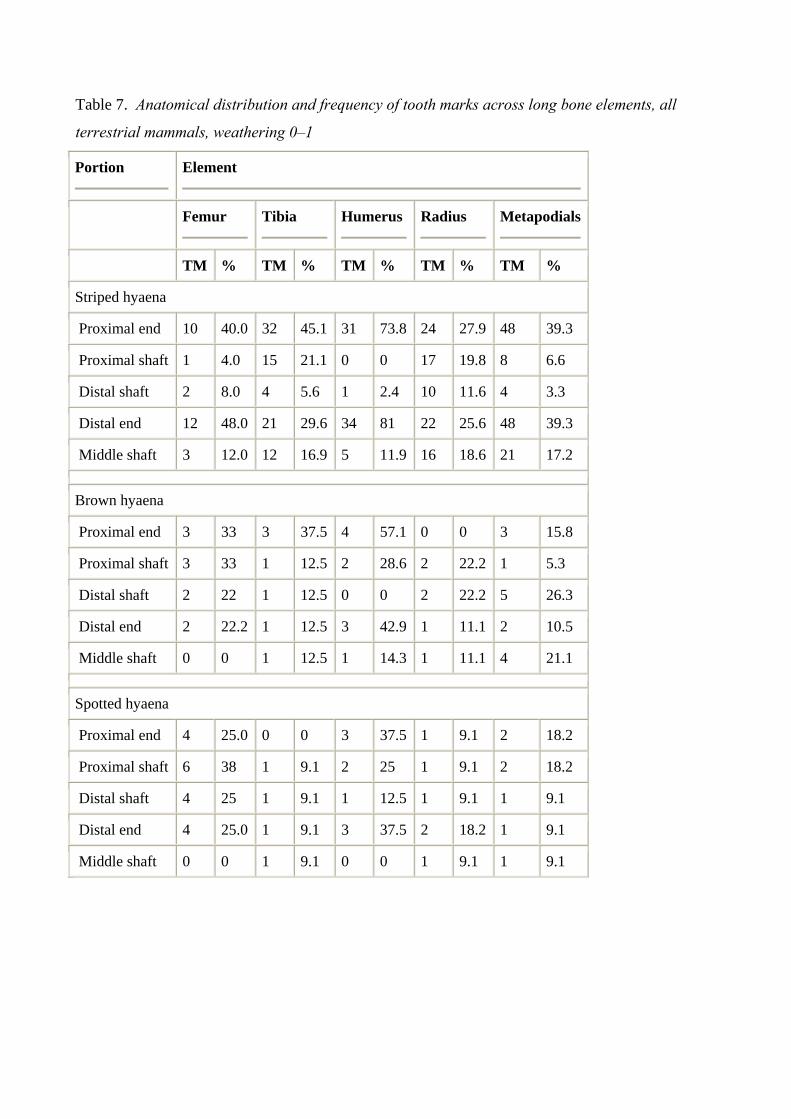
Table 7. Anatomical distribution and frequency of tooth marks across long bone elements, all
terrestrial mammals, weathering 0–1
Portion
Element
Femur
Tibia Humerus Radius Metapodials
TM % TM % TM % TM % TM %
Striped hyaena
Proximal end 10 40.0 32 45.1 31 73.8 24 27.9 48 39.3
Proximal shaft 1 4.0 15 21.1 0 0 17 19.8 8 6.6
Distal shaft 2 8.0 4 5.6 1 2.4 10 11.6 4 3.3
Distal end 12 48.0 21 29.6 34 81 22 25.6 48 39.3
Middle shaft 3 12.0 12 16.9 5 11.9 16 18.6 21 17.2
Brown hyaena
Proximal end 3 33 3 37.5 4 57.1 0 0 3 15.8
Proximal shaft 3 33 1 12.5 2 28.6 2 22.2 1 5.3
Distal shaft 2 22 1 12.5 0 0 2 22.2 5 26.3
Distal end 2 22.2 1 12.5 3 42.9 1 11.1 2 10.5
Middle shaft 0 0 1 12.5 1 14.3 1 11.1 4 21.1
Spotted hyaena
Proximal end 4 25.0 0 0 3 37.5 1 9.1 2 18.2
Proximal shaft 6 38 1 9.1 2 25 1 9.1 2 18.2
Distal shaft 4 25 1 9.1 1 12.5 1 9.1 1 9.1
Distal end 4 25.0 1 9.1 3 37.5 2 18.2 1 9.1
Middle shaft 0 0 1 9.1 0 0 1 9.1 1 9.1

4.4. Correlation between tooth mark frequency and bone density
The per cent tooth marks in relation to bone density have been plotted in Fig. 1, Fig. 2, Fig. 3,
Fig. 4, Fig. 5, Fig. 6, Fig. 7, Fig. 8 and Fig. 9 for all three species of hyaena, illustrating data sets
with all mammal remains and no limitations, all mammal remains with weathering limited to 0–1,
bovid size class 2–3 and bovid size class 2–3 with weathering limited to 0–1. Bone densities used
are the mean value (BMD1) for wildebeest (Connochaetes taurinus) (Lam et al., 1999). All
fragments identified as metatarsals, metacarpals and metapodials are combined (identified as Mp3
in the figures) and the densities averaged for the analysis.
Fig. 1. (A) Correlation between tooth mark per cent and bone density (wildebeest Lam et al., 1999)
for long bone epiphyses (r = −0.384, p = 0.137) from striped hyaena dens including all mammals
without weathering limitations. (B) Correlation between tooth mark per cent and bone density
(wildebeest Lam et al., 1999) for long bone epiphyses (r = −0.353, p = 0.158) from striped hyaena
dens including all mammals with weathering 0–1. (C) Correlation between tooth mark per cent and
bone density (wildebeest Lam et al., 1999) for long bone epiphyses (r = −0.530, p = 0.057) from
striped hyaena dens, bovid size 2–3, no weathering limitations. (D) Correlation between tooth mark
per cent and bone density (wildebeest Lam et al., 1999) for long bone epiphyses (r = −0.271,
p = 0.224) from striped hyaena dens, bovid size 2–3, weathering 0–1.

Fig. 2. (A) Correlation between tooth mark per cent and bone density (wildebeest Lam et al., 1999)
for long bone epiphyses (r = −0.746, p = 0.006) from brown hyaena dens including all mammals
without weathering limitations. (B) Correlation between tooth mark per cent and bone density
(wildebeest Lam et al., 1999) for long bone epiphyses (r = −0.647, p = 0.022) from brown hyaena
dens including all mammals with weathering 0–1. (C) Correlation between tooth mark per cent and
bone density (wildebeest Lam et al., 1999) for long bone epiphyses (r = −0.512, p = 0.065) from
brown hyaena dens, bovid size 2–3, without weathering limitations. (D) Correlation between tooth
mark per cent and bone density (wildebeest Lam et al., 1999) for long bone epiphyses (r = −0.583,
p = 0.039) from brown hyaena dens, bovid size 2–3, weathering 0–1.

Fig. 3. (A) Correlation between tooth mark per cent and bone density (wildebeest Lam et al., 1999)
for long bone epiphyses (r = −0.729, p = 0.008) from spotted hyaena dens including all mammals
without weathering limitations. (B) Correlation between tooth mark per cent and bone density
(wildebeest Lam et al., 1999) for long bone epiphyses (r = −0.300, p = 0.199) from spotted hyaena
dens including all mammals, weathering 0–1. (C) Correlation between tooth mark per cent and
bone density (wildebeest Lam et al., 1999) for long bone epiphyses (r = −0.549, p = 0.050) from
spotted hyaena dens, bovid size 2–3, without weathering limitations. (D) Correlation between tooth
mark per cent and bone density (wildebeest Lam et al., 1999) for long bone epiphyses (r = −0.142,
p = 0.348) from spotted hyaena dens, bovid size 2–3, weathering 0–1.

Fig. 4. (A) Correlation between tooth mark per cent and bone density (wildebeest Lam et al., 1999)
for long bone proximal and distal shafts (r = 0.135, p = 0.355) from striped hyaena dens with all
mammals, no weathering limitations. (B) Correlation between tooth mark per cent and bone density
(wildebeest Lam et al., 1999) for long bone proximal and distal shafts (r = 0.167, p = 0.322) from
striped hyaena dens with all mammals, weathering 0–1. (C) Correlation between tooth mark per
cent and bone density (wildebeest Lam et al., 1999) for long bone proximal and distal shafts
(r = −0.054, p = 0.441) from striped hyaena dens, bovid size 2–3, no weathering limitations. (D)
Correlation between tooth mark per cent and bone density (wildebeest Lam et al., 1999) for long
bone proximal and distal shafts (r = −0.027, p = 0.471) from striped hyaena dens, bovid size 2–3,
weathering 0–1.

Fig. 5. (A) Correlation between tooth mark per cent and bone density (wildebeest Lam et al., 1999)
for long bone proximal and distal shafts (r = −0.591, p = 0.036) from brown hyaena dens with all
mammals and no weathering limitations. (B) Correlation between tooth mark per cent and bone
density (wildebeest Lam et al., 1999) for long bone proximal and distal shafts (r = −0.588,
p = 0.037) from brown hyaena dens with all mammals, weathering 0–1. (C) Correlation between
tooth mark per cent and bone density (wildebeest Lam et al., 1999) for long bone proximal and
distal shafts (r = 0.337, p = 0.171) from brown hyaena dens, bovid size 2–3, no weathering
limitations. (D) Correlation between tooth mark per cent and bone density (wildebeest Lam et al.,
1999) for long bone proximal and distal shafts (r = −0.092, p = 0.4) from brown hyaena dens,
bovid size 2–3, weathering 0–1.

Fig. 6. (A) Correlation between tooth mark per cent and bone density (wildebeest Lam et al., 1999)
for long bone proximal and distal shafts (r = −0.389, p = 0.133) from spotted hyaena dens with all
mammals, no weathering limitations. (B) Correlation between tooth mark per cent and bone density
(wildebeest Lam et al., 1999) for long bone proximal and distal shafts (r = −0.431, p = 0.107) from
spotted hyaena dens with all mammals, weathering 0–1. (C) Correlation between tooth mark per
cent and bone density (wildebeest Lam et al., 1999) for long bone proximal and distal shafts
(r = −0.139, p = 0.351) from spotted hyaena dens, bovid size 2–3, no weathering limitations. (D)
Correlation between tooth mark per cent and bone density (wildebeest Lam et al., 1999) for long
bone proximal and distal shafts (r = −0.288, p = 0.21) from spotted hyaena dens, bovid size 2–3,
weathering 0–1.

Fig. 7. (A) Correlation between tooth mark per cent and bone density (wildebeest Lam et al., 1999)
for long-bone mid shafts (r = 0.747, p = 0.044) from striped hyaena dens with all mammals and no
weathering limitations. (B) Correlation between tooth mark per cent and bone density (wildebeest
Lam et al., 1999) for long-bone mid shafts (r = 0.806, p = 0.026) from striped hyaena dens with all
mammals, weathering 0–1. (C) Correlation between tooth mark per cent and bone density
(wildebeest Lam et al., 1999) for long-bone mid shafts (r = 0.330, p = 0.252) from striped hyaena
dens, bovid size 2–3, no weathering limitations. (D) Correlation between tooth mark per cent and
bone density (wildebeest Lam et al., 1999) for long bone mid (r = 0.354, p = 0.246) from striped
hyaena dens, bovid size 2–3, weathering 0–1.

Fig. 8. (A) Correlation between tooth mark per cent and bone density (wildebeest Lam et al., 1999) for long-bone mid shafts (r = −0.215, p = 0.341) from brown hyaena dens with all mammals and no weathering limitations. (B) Correlation between tooth mark per cent and bone density (wildebeest Lam et al., 1999) for long-bone mid shafts (r = 0.896, p = 0.008) from brown hyaena dens with all mammals, weathering 0–1. (C) Correlation between tooth mark per cent and bone density (wildebeest Lam et al., 1999) for long-bone mid shafts (r = −0.11, p = 0.418) from brown hyaena dens, bovid size 2–3, no weathering limitations. (D) Correlation between tooth mark per cent and bone density (wildebeest Lam et al., 1999) for long-bone mid shafts (r = −0.473, p = 0.172) from brown hyaena dens, bovid size 2–3, weathering 0–1.

Fig. 9. (A) Correlation between tooth mark per cent and bone density (wildebeest Lam et al., 1999)
for long-bone mid shafts (r = 0.252, p = 0.315) from spotted hyaena dens with all mammals and no
weathering limitations. (B) Correlation between tooth mark per cent and bone density (wildebeest
Lam et al., 1999) for long-bone mid shafts (r = 0.829, p = 0.021) from spotted hyaena dens with all
mammals, weathering 0–1. (C) Correlation between tooth mark per cent and bone density
(wildebeest Lam et al., 1999) for long-bone mid shafts (r = 0.36, p = 0.242) from spotted hyaena
dens, bovid size 2–3, no weathering limitations. (D) Correlation between tooth mark per cent and
bone density (wildebeest Lam et al., 1999) for long-bone mid shafts (r = 0.555, p = 0.127) from
spotted hyaena dens, bovid size 2–3, weathering 0–1.
Fig. 1, Fig. 2 and Fig. 3 illustrate the per cent tooth marks and bone density for the epiphyses of
long bones. For all three hyaena species and for all four data sets the relationship is negative,
meaning that as the bone density increases the per cent tooth marks decreases. For striped hyaenas
the only data set where this is significant is the one looking at bovid class size 2–3 and no
weathering limitations (Fig. 1C). All four data sets from brown hyaenas were significant (Fig. 2A–
D), and the two spotted hyaena data sets without weathering limitations are also significant (Fig. 3A
and C).

Examining the correlation between proximal and distal shaft densities and per cent tooth marks for
each species and all four data sets are illustrated in Fig. 4, Fig. 5 and Fig. 6. For striped hyaenas,
when one examines the data using all mammal remains, the relationship is positive (meaning that as
the bone density increases the per cent tooth marks increases) but non-significant (Fig. 4A and B).
The relationship is negative and non-significant when one examines data limited to bovid class size
2–3 (Fig. 4C and D). Examining the data sets from the brown hyaenas illustrates negative and
significant relationships when examining data from all mammals (Fig. 5A and B). When examining
the data set limited to bovid class size 2–3 (Fig. 5C) the relationship is positive and non-significant,
whereas when the weathering limitation is added to the bovid class size 2–3 data set the relationship
is negative and non-significant (Fig. 5D). All four data sets for spotted hyaenas have negative
relationships and are non-significant (Fig. 6A–D).
Examining the figures for long bone mid shaft fragments for striped hyaenas illustrates that the
relationship for all four data sets is positive, but only significant when examining the data sets for
all mammals (Fig. 7A and B) and non-significant for the data sets limited to bovid class size 2–3
(Fig. 7C and D). For the brown hyaena data sets the unlimited data (Fig. 8A) and the data limited to
bovid class size 2–3 (Fig. 8C and D) have a negative relationship that is non-significant. The data
set with all mammals and limited to weathering 0–1 has a positive and significant relationship
(Fig. 8B). The relationship between tooth marks and mid shafts for spotted hyaenas is positive for
all four data sets. The relationship is non-significant for the two data sets without weathering
restrictions (Fig. 9A and C) and significant for the data sets limited to weathering 0–1 (Fig. 9B and
D).
5. Discussion
When examining the question of fragment length and per cent tooth marks our study supports Faith
and previous work by Pobiner et al. (2002), that there is a direct correlation between fragment
length and tooth mark frequencies. This relationship is evident for all three hyaena species known to
collect bones. One problem, as pointed out by Faith, is that other factors such as trampling and
weathering, can drive down the per cent of observed tooth marks. Our study shows that weathering
overall does indeed affect the per cent of observed tooth marks.
Our study indicates that the relationship between prey body size and frequency of tooth marked
bones is not as straightforward as Faith suggested. If one were to examine striped hyaena
assemblages one would concur with the previous study that as prey body size increases so does the
per cent of tooth marks. However, as illustrated in Table 3, for brown hyaenas the per cent of tooth
marks declines when the data are limited to weathering 0–1 as well as data not limited to

weathering but constrained to size 20–60 mm and only increases by less than 2% when the data are
not limited. Spotted hyaena assemblages show a marked increase in the per cent tooth marks in
relation to size for data limited to weathering 0–1 but this percentage decreases when unlimited data
are examined, this is further evidence that weathering reduces the observed frequency of tooth
marks.
Percentages of tooth marked portions of long bone specimens differ between skeletal elements as
well as between hyaena species. This can be explained in part by the relationship between bone
density and tooth mark frequencies. Comparing the data from spotted hyaenas to the spotted hyaena
trends reported by Faith for the three distinct regions of long bones support his data; the
relationships for epiphyses and proximal/distal shafts are negative while the relationship for mid
shafts is positive. This is true for all four data sets reported here for spotted hyaenas. For brown
hyaenas the data limited to weathering 0–1 and bovid size class 2–3 follow the same patterns as
those of spotted hyaena accumulations reported here as well as Faith's results. The variation occurs
for data limited to bovid size class 2–3 for proximal and distal shafts and data reported for mid
shafts. For the proximal and distal shafts the relationship is positive, while the relationships for
three of the four mid shafts are negative. The data for striped hyaenas show a similarity to both
spotted hyaena and brown hyaena data sets when examining the relationships of tooth marks and
the long bone epiphyses and similar to spotted hyaena data for mid shaft fragments. In this instance
the variation occurs when the bovid size class restrictions are removed. When the data sets are
limited to bovid size class 2–3 the relationship is negative like that of spotted hyaenas, but when the
bovid size class limitation is removed the relationship between bone density and tooth mark
frequency is positive.
6. Conclusion
Examining the questions originally cast by Faith: ‘1) How does long-bone fragment size impact
tooth-mark frequencies? 2) How do tooth-mark frequencies vary across taxa of different body size
classes? 3) How does the incidence of tooth-marking vary across portions of different long bone
elements? 4) What is the relationship between tooth-mark frequency and bone density?’ (Faith,
2007, p. 1602) and comparing them to our study we find that: (1) Fragment size is related to tooth
mark frequency for all three species, the analysis indicates that the relation is significant for all but
one of the data sets examined. (2) Examining prey body size and tooth mark frequencies across the
three hyaena species reveals that brown hyaenas leave behind different frequency patterns than the
other two species of hyaenas. (3 and 4) When looking at something which appears to be fairly
straightforward, like tooth mark frequency across various portions of long bones and tooth mark

frequency in relation to bone density one finds variation not only between the hyaena species but
also within the species when various limitations are placed on the data sets. It is the limitations
placed upon the data examined which has consequences that need to be answered before we can
attempt to correct for the variation. Like Faith and Lupo and O'Connell (2002) suggest, the study of
tooth mark frequencies is not a simple matter. This further supports the previous work by Haynes
(1983) documenting variation between species and exposes variations that are found within a
species. Our study clearly shows that tooth mark frequencies of a single species of hyaena are not
representative of the other extant species, not to mention extinct species. When examining the
relationship between bone density and tooth marks our study indicates variation between and within
species that warrants more research be done before any sort of corrections for variation suggested
by Faith can be implemented with any confidence.
Acknowledgements
The Palaeoanthropological Scientific Trust (PAST) and the University of Pretoria financed the
project in southern Africa. The Council for British Research in the Levant (CBRL) and the Institute
of Archaeology, University College London supported the Jordanian portion of fieldwork. Grateful
appreciation is accorded: Rietvlei Nature Reserve, South Africa; Mashatu Game Reserve,
Botswana; The Brown Hyaena Research Project, NAMDEB Diamond Company, Gobabeb Desert
Research and Training Centre, and the Ministry of Environment and Tourism, all of Namibia; the
Higher Council for Science and Technology, Amman, Badia Research and Development Centre,
Safawi, and the CBRL offices Amman, all in Jordan. Thanks for very constructive comments from
an anonymous reviewer on an early draft of this manuscript.

References
Behrensmeyer, 1978 A.K. Behrensmeyer, Taphonomic and ecologic information from bone
weathering, Paleobiology 4 (1978), pp. 150–162.
Brain, 1981 C.K. Brain, The Hunters or the Hunted? An Introduction to African Cave Taphonomy,
The University of Chicago Press, Chicago (1981).
Faith, 2007 J.T. Faith, Sources of variation in carnivore tooth-mark frequencies in a modern spotted
hyena (Crocuta crocuta) den assemblage, Amboseli Park, Kenya, Journal of Archaeological
Science 34 (10) (2007), pp. 1601–1609.
Haynes, 1983 G. Haynes, A guide for differentiating mammalian carnivore taxa responsible for
gnaw damage to herbivore limb bones, Paleobiology 9 (2) (1983), pp. 164–172.
Hillson, 1992 S. Hillson, Mammal Bones and Teeth; an Introductory Guide to Methods of
Identification, Dorset Press, Dorchester, Dorset, UK (1992).
Kuhn et al., 2008 Kuhn, B.F., Berger, L.R., Skinner, J.D., 2008. Examining criteria for identifying
and differentiating fossil faunal assemblages accumulated by hyaenas and hominins using extant
hyaenid accumulations. International Journal of Osteoarchaeology,
Kuhn, 2005 B.F. Kuhn, The faunal assemblages and taphonomic signatures of five striped hyaena
(Hyaena hyaena syriaca) dens in the desert of eastern Jordan, Levant 35 (2005), pp. 221–234.
Lam et al., 1999 Y.M. Lam, X. Chen and O.M. Pearson, Intertaxonomic variability in patterns of
bone density and the differential representation of bovid, cervid, and equid elements in the
archaeological record, American Antiquity 64 (1999), pp. 343–362.
Lupo and O'Connell, 2002 K.D. Lupo and J.F. O'Connell, Cut and tooth mark distributions on large
animal bones: ethnoarchaeological data from the Hadza and their implications for current ideas
about early human carnivory, Journal of Archaeological Science 29 (2002), pp. 85–109.

Marean and Spencer, 1991 C.W. Marean and L.M. Spencer, Impact of carnivore ravaging on zoo-
archaeological measures of element abundance, American Antiquity 56 (1991), pp. 645–658.
Peters, 1986 Peters, J. 1986. Osteomorphology and Osteometry of the Appendicular Skeleton of
African buffalo, Syncerus caffer (Sparrman, 1779) and cattle, Bos primigenius f. Taurus Bojanus,
1827. Occasional papers, Laboratory voor Paleaontologie. Rijks Universiteit, No.1 Ghent, Belgium.
Pobiner et al., 2002 Pobiner, B.L., Ferraro, J.V., Blumenschine, R.J., Capaldo, S.D., Cavallo, J.A.,
Madrigal, T.C., 2002 The effect of Bone Size on the Likelihood of Modification by Hominids and
Hyenas, and its Implications for Intrerassemble Zooarchaeological Comparisons.
Paleoanthropology Society, Denver, Colorado.
Schmid, 1972 E. Schmid, Atlas of Animal Bones, Elsevier Publishing Company, Amsterdam–
London–New York (1972).
Skinner and van Aarde, 1991 J.D. Skinner and R.J. van Aarde, Bone collecting by brown hyaenas
Hyaena brunnea in the central Namib Desert, Namibia, Journal of Archaeological Science 18
(1991), pp. 513–523.
Skinner et al., 1998 J.D. Skinner, M.A. Haupt, M. Hoffmann and H.M. Dott, Bone collecting by
brown hyaenas Hyaena brunnea in the Namib Desert: rate of accumulation, Journal of
Archaeological Science 25 (1998), pp. 69–71.
Walker, 1985 R. Walker, A Guide To Post-Cranial Bones of East African Animals: Mrs. Walker's
Bone Book, Hylochoerus Press, Norwich, England (1985).