Collecting Feedback during Software Engineering Experiments
35
Collecting Feedback During Software Engineering Experiments AMELA KARAHASANOVIC ´ [email protected] Simula Research Laboratory, P.O. Box 134, NO-1325, Lysaker, Norway BENTE ANDA [email protected] Simula Research Laboratory, P.O. Box 134, NO-1325, Lysaker, Norway ERIK ARISHOLM [email protected] Simula Research Laboratory, P.O. Box 134, NO-1325, Lysaker, Norway SIW ELISABETH HOVE [email protected] Simula Research Laboratory, P.O. Box 134, NO-1325, Lysaker, Norway MAGNE JØRGENSEN [email protected] Simula Research Laboratory, P.O. Box 134, NO-1325, Lysaker, Norway DAG I. K. SJØBERG [email protected] Simula Research Laboratory, P.O. Box 134, NO-1325, Lysaker, Norway RAY WELLAND [email protected] Department of Computing Science, University of Glasgow, 17 Lilybank Gardens, Glasgow, G12 8RZ, UK Editor: Jean Scholtz Abstract. Objective: To improve the qualitative data obtained from software engineering experiments by gathering feedback during experiments. Rationale: Existing techniques for collecting quantitative and qualitative data from software engineering experiments do not provide sufficient information to validate or explain all our results. Therefore, we would like a cost-effective and unobtrusive method of collecting feedback from subjects during an experiment to augment other sources of data. Design of study: We formulated a set of qualitative questions that might be answered by collecting feedback during software engineering experiments. We then developed a tool to collect such feedback from experimental subjects. This feedback-collection tool was used in four different experiments and we evaluated the usefulness of the feedback obtained in the context of each experiment. The feedback data was triangulated with other sources of quantitative and qualitative data collected for the experiments. Results: We have demonstrated that the collection of feedback during experiments provides useful additional data to: validate the data obtained from other sources about solution times and quality of solutions; check process conformance; understand problem solving processes; identify problems with experiments; and understand subjects’ perception of experiments. Conclusions: Feedback collection has proved useful in four experiments and we intend to use the feedback-collection tool in a range of other experiments to further explore the cost-effectiveness and limitations of this technique. It is also necessary to carry out a systematic study to more fully understand the impact of the feedback-collecting tool on subjects’ performance in experiments. Keywords: Qualitative studies, data collection, tool support, software engineering experiments, feedback, experience sampling. Empirical Software Engineering, 10, 113–147, 2005. # 2005 Springer Science + Business Media, Inc. Manufactured in The Netherlands.
Transcript of Collecting Feedback during Software Engineering Experiments

Collecting Feedback During Software EngineeringExperiments
AMELA KARAHASANOVIC [email protected]
Simula Research Laboratory, P.O. Box 134, NO-1325, Lysaker, Norway
BENTE ANDA [email protected]
Simula Research Laboratory, P.O. Box 134, NO-1325, Lysaker, Norway
ERIK ARISHOLM [email protected]
Simula Research Laboratory, P.O. Box 134, NO-1325, Lysaker, Norway
SIW ELISABETH HOVE [email protected]
Simula Research Laboratory, P.O. Box 134, NO-1325, Lysaker, Norway
MAGNE JØRGENSEN [email protected]
Simula Research Laboratory, P.O. Box 134, NO-1325, Lysaker, Norway
DAG I. K. SJØBERG [email protected]
Simula Research Laboratory, P.O. Box 134, NO-1325, Lysaker, Norway
RAY WELLAND [email protected]
Department of Computing Science, University of Glasgow, 17 Lilybank Gardens, Glasgow, G12 8RZ, UK
Editor: Jean Scholtz
Abstract. Objective: To improve the qualitative data obtained from software engineering experiments by
gathering feedback during experiments. Rationale: Existing techniques for collecting quantitative and
qualitative data from software engineering experiments do not provide sufficient information to validate or
explain all our results. Therefore, we would like a cost-effective and unobtrusive method of collecting feedback
from subjects during an experiment to augment other sources of data. Design of study: We formulated a set of
qualitative questions that might be answered by collecting feedback during software engineering experiments.
We then developed a tool to collect such feedback from experimental subjects. This feedback-collection tool
was used in four different experiments and we evaluated the usefulness of the feedback obtained in the context
of each experiment. The feedback data was triangulated with other sources of quantitative and qualitative data
collected for the experiments. Results: We have demonstrated that the collection of feedback during
experiments provides useful additional data to: validate the data obtained from other sources about solution
times and quality of solutions; check process conformance; understand problem solving processes; identify
problems with experiments; and understand subjects’ perception of experiments. Conclusions: Feedback
collection has proved useful in four experiments and we intend to use the feedback-collection tool in a range of
other experiments to further explore the cost-effectiveness and limitations of this technique. It is also necessary
to carry out a systematic study to more fully understand the impact of the feedback-collecting tool on subjects’
performance in experiments.
Keywords: Qualitative studies, data collection, tool support, software engineering experiments, feedback,
experience sampling.
Empirical Software Engineering, 10, 113–147, 2005.# 2005 Springer Science + Business Media, Inc. Manufactured in The Netherlands.

1. Introduction
The authors have carried out many software engineering experiments and within these
we have collected quantitative data, for example: time to complete an experiment;
number of tasks completed within a specified time; and logging of activities during the
experiment (which commands were used in an editor or tool). We have also collected
qualitative data after the experiments through interviews with subjects and question-
naires, and by using expert opinions to assess the quality of designs and code, for
example. However, we would also like to collect qualitative feedback from subjects
during the experiment so that we can ascertain why they are doing things, whether they
are having problems, what they are thinking about, etc. We believe that by collecting
such qualitative data during the experiment we will enhance the value of quantitative
data and other qualitative data collected.
One of the initial motivations for our work was an experiment to evaluate the use of
tools and operations within a programming environment (Welland et al., 1997). Although
we had detailed logs of what the users were doing we had no explanation of why they
were doing certain sequences of operations or why there were gaps in the sequences of
events recorded. We then realised that there were a whole range of questions that we
could attempt to answer if we had more contemporaneous qualitative data. Possible
questions were:
� How do we check that high level measures, such as solution times and quality of the
solutions, have not been affected by unforeseen circumstances?
� How do we ensure or check that the instructions given to the subjects actually are
followed during an experiment?
� How do we understand how and why subjects have ended up with their solutions?
� How do we observe problems with the experiment material (tasks, programs,
documentation, etc.), and support tools and environments that may influence the
experimental conduct?
� How do we record people_s perception of the experimental situation?
Data on subjects_ cognitive processes and experience may be collected after a task or
experiment by post-task interviews and questionnaires (Yin, 1994), retrospective think-
aloud (Ericsson and Simon, 1993) and videotape reconstructions (Genest and Turk,
1981). Nevertheless, recall accuracy decreases linearly over time (Bernard et al., 1982;
Conrath et al., 1983) (Ericsson and Simon, 1993). Furthermore, the subjects may create
their own Ftheories_ of what the problem was during the task-solving process after they
discover the solution. This post facto rationalisation may give a false impression of the
cause of the problem (Ericsson and Simon, 1993; Nielsen, 1993). Therefore, we believe
that by collecting such data during an experiment we will obtain more immediate
feedback about subjects_ thoughts, problem-solving processes and experiences.
114 KARAHASANOVIC ET AL.

We would like a method that would allow us to inexpensively gather data from subjects
during software engineering experiments. Hence, we developed a simple tool to gather
written feedback from subjects. At regular intervals during a study, this feedback-
collection tool provides a web-based screen on which the subjects write down their
thoughts and experience. This feedback together with timestamps is stored for later
analysis. When proposing a data collection method one should demonstrate that it
provides data consistent with data from other sources, that it provides useful additional
information and that it minimally disrupts the experiment. The feedback collected needs
to be triangulated with quantitative data collected, such as timings and activity logs, and
other sources of subjective data, such as interviews, questionnaires and expert
assessment of the quality of solutions.
The feedback-collection tool was used in four experiments, with different primary
objectives, in which the number of subjects varied from one to 53. The duration of the
experiments varied from 90 minutes to 35 hours. Each experiment used a number of data
collection methods, both quantitative and qualitative, in addition to the feedback-
collection tool. Our experience showed that the feedback collected provided validation
and explanation of data from other sources, useful insights into the cognitive processes
used in solving problems and informative comments on the experience of the participants
during the experiments.
Our approach to collecting data during experiments is related to other work on
experience sampling, event-recording and concurrent think-aloud. The approach we have
used could be considered as a form of experience sampling (Larson and Csikszentmihalyi,
1983) although the constrained experimental context and emphasis on problem solving in
our work gives a much more focussed environment for collecting experience data. Think-
aloud methods have proved useful for collecting data concerning subjects in cognitive and
usability studies (Anderson, 1987; Denning et al., 1990; Ericsson and Simon, 1993). These
methods typically involve human observers and are expensive regarding time spent by
observers in addition to that used by the subjects. Therefore, they become prohibitive for
studies with a large number of subjects or running over an extended time period.
The remainder of this paper is organised as follows. Section 2 describes our method
for collecting feedback and the principles of our approach. We then describe the
feedback-collection tool that we have developed to gather qualitative data during
software engineering experiments in Section 3. Our experience of using the feedback
method is described in Section 4. We start by giving an overview of the four experiments
that we collected feedback from using our tool; we then describe what kind of data we
collected using the tool; and how we used this data and triangulated it with other
quantitative and qualitative sources of data. Section 5 discusses the impact on the subjects
of using the feedback-collection tool. Section 6 discusses the related work and Section 7
concludes by considering the lessons learned and the possibilities for future work.
2. Method for Collecting Feedback
This section describes a feedback collection method (FCM). The basic principle is that
experimental subjects are asked for feedback at different times during an experiment,
COLLECTING FEEDBACK DURING SOFTWARE ENGINEERING EXPERIMENTS 115

each such request for feedback is called a probe. We interrupt the subject_s work to seek
immediate feedback on what they are currently doing or have done within the time
interval since the last interruption. The time for giving feedback is limited as we want to
get short focussed feedbacks frequently rather than extended and considered feedback,
which we might get from a post-task questionnaire, for example.
Subjects may be asked general questions such as BWhat are you thinking now?^ and
BWhat have you done since the last time you were asked a question?^ or more specific
questions such as BHow did you complete this task?^ or BWhy did you use this tool?^Specific questions need to be defined for a particular experiment, based upon the
objectives of the experiment and the identification of points at which these questions
should be triggered.
In the following discussion, we discuss the timing of interruptions and the potential
impacts of different interruption strategies, describe the kinds of feedback that we
expect to collect, and finally how we envisage using the feedbacks that we have
collected.
2.1. Collecting Feedback
Whenever the subject receives a probe, requesting feedback, they are given a limited
time to type text, answering the question. Therefore, we have two parameters to consider,
the frequency of probing and the time allowed for feedback.
However, the frequency of probing can be controlled in a number of ways. There are a
variety of strategies that could be used to decide when to probe:
� At random pointsVsubjects can be prompted at random points to find out what they
are currently doing, probes need to be generated using some suitable distribution
dependent upon number of probes per subject required within an experiment.
� At regular intervalsVsubjects can be prompted for input at fixed intervals, the
frequency of probes should be related to the overall length of the experiment and the
nature of the tasks.
� Subject drivenVthe subject provides feedback whenever they feel it is appropriate.
The problem with this approach is that we may not get any input!
� Event-driven
A. After finishing a given taskVthe experiment consists of a sequence of tasks and
we seek feedback about each task.
B. When given commands are executedVif we are interested in why users are
executing particular commands (or using particular tools) then we trigger the
probe whenever the command is executed or a specified tool is invoked.
116 KARAHASANOVIC ET AL.

C. When an error occursVif we detect a predictable error, such as misuse of a
technique then we can trigger a probe to ask what the subject is trying to do.
D. Other kinds of unexpected behaviourVthis is an exception handler that probes the
subject if something unexpected occurs.
Of course, these strategies are not mutually exclusive; various combinations of the above
are possible. For example, we could allow the subjects to control the frequency of
interaction but if they have not given any input for a certain time then they are asked to
give feedback. If we have a task-based approach then we might want to combine this
with asking for input after a certain time has elapsed to see why the subject has not
completed the task within a reasonable time.
Whatever strategy is used to generate probes, the subject_s current work is interrupted
and they have to switch context to answer the question. The subjects have to comprehend
the question, formulate a response and type it, before switching back to the current task.
When subjects are asked to verbalise while performing a task, this may affect their
performance. Verbalisation may slow the subjects down (Sanderson, 1990) or improve
their performance (Berry and Broadbent, 1990; Wright and Converse, 1992). When
writing is used for the externalisation of thoughts, as in FCM, then similar effects can be
expected (Ericsson and Simon, 1998; Vygotsky, 1994).
As the ability to recall a specific event with detailed information deteriorates rapidly
over time, reducing the time between probes in FCM increases the completeness of the
collected data. At the same time it may affect the subjects_ performance. Therefore, there
is a trade-off between the completeness of the collected data and the impact of
interruptions on the subjects_ performance. Choice of frequency of probing should be
based on the duration of the experiments, complexity of the given tasks and the
experience from the pilot experiments.
Subjects are given a restricted amount of time to provide feedback in response to each
probe. The time allowed for feedback is restricted for two main reasons. First, to reduce
the impact on the experiment; if we restrict the time for feedback then we can quantify
the amount of time taken away from the main problem solving tasks of the experiment.
The second reason for restricting time for feedback is that we want to get immediate
feedback (first impressions) from the subjects rather than long comments that may reflect
a rationalised view of what they were doing. When the subjects are asked to write down
their thoughts, this usually takes longer than giving verbal feedback, and their
performance depends on their fluency in typing. So the time we allow for feedback
must take into account: the overhead of switching context and how much information the
subject is likely to be able to type within a given time.
2.2. Categorising Feedback
There are a number of different types of information that we could get from our feedback
collection method. We have divided these into three major categories: experimental
COLLECTING FEEDBACK DURING SOFTWARE ENGINEERING EXPERIMENTS 117

context, subjects_ perceptions and experimental conduct, which are discussed below. In
practice, one feedback may belong to more than one category.
2.2.1. Experimental Context
Experimental context is concerned with the envelope within which an experiment is
conducted, including: unscheduled events that occur during an experiment, the
information given to the subjects and their background, the computational support
provided and the physical environment.
There are a variety of feedbacks that could give us information about the experimental
context. We have identified the following sub-categories. It should be noted that the
types of problems we are identifying are those that affect individuals. A major problem
during an experiment, such as a fire alarm or server failure, should be identified and dealt
with by the researcher conducting the experiment.
Breaks and Disruptions. Some feedbacks will give us information about unscheduled
events that caused the subject to lose time during the experiment. Some of these
feedbacks provide us within an approximate form of quantitative data, for example FItook a five minute break,_ but exact timings would have to be verified from other data
sources.
In designing experiments we endeavour to provide suitable scheduled breaks, for
example between tasks, but feedbacks of this type will give us information about other
individual breaks and disruptions. If we are conducting a longitudinal experiment
without close supervision then this type of feedback is especially valuable.
Background Knowledge. It is assumed that each subject has a minimal set of skills prior
to starting the experiment. For example, these assumptions might relate to a subject_sknowledge of a particular design method or their programming ability in a given
language. Feedbacks may reveal that these assumptions are invalid for certain subjects.
Experimental Material. Feedback may identify particular problems with the materials
that are subject of investigation for example: documentation about the experiment, task
descriptions, design documents to be used in the experiment, programs to be read or
modified, tools that are being evaluated, etc.
Supporting Tools. Most software engineering experiments rely on the use of supporting
tools, such as design editors or programming environments, which are not the primary
focus of the experiment. Some feedbacks will give us information about specific
individual problems with these tools.
Physical Environment. The experiment takes place within a particular environment,
which can influence the result of the experiment, and feedback may identify problems
with this environment. The conduct of the experiment may be affected by the physical
location (such as working in a multi-seat laboratory versus an individual office, the
118 KARAHASANOVIC ET AL.

amount of working space per subject, heating, lighting, etc.); the type of machines and
their supporting software environment; and the presence of observers and their
interaction with subjects.
2.2.2. Subjects’ Perceptions
Some feedbacks may record subjects’ perceptions of our experiment; these may range
from significant problems to simple comments. We have identified three sub-categories.
Stress. Subjects may give feedback on their personal feelings regarding time pressure,
feeling tired or bored, having difficulty concentrating, etc.
External Disturbance. Subjects may be distracted by external events, such as the
behaviour of another subject, which are not necessarily perceived by other subjects.
General Reflections. Some feedbacks simply provide us with information that the
subject is comfortable with the experiment and do not reveal any problems.
2.2.3. Experimental Conduct
Feedback related to the experimental conduct will give us more information about the
way in which subjects carried out the experiment, giving us information about problem
solving activities. We have identified three subcategories.
Task-Performing Actions. Feedbacks in this subcategory give us information about the
subjects_ current actions when performing the experimental tasks. In practice, this
subcategory will need to be subdivided to pick out different groups of actions that are
relevant for a given experiment or group of experiments.
Planning and Strategy. Feedbacks in this subcategory will give information on general
strategy, specific plans or alternatives considered, or an explanation of something they
have done, thus providing insights into problem solving.
Comprehension. Some subjects may be struggling because they do not understand how
to solve a particular problem, for example, because they cannot understand a piece of
code provided, or they are not sure how to use the tool under investigation.
2.2.4. Extensions to the Categorisation
We have identified a general categorisation of feedbacks that we expect to get from our
feedback collection method and this is summarised in Table 1. However, in analysing
COLLECTING FEEDBACK DURING SOFTWARE ENGINEERING EXPERIMENTS 119

any particular collection of feedbacks we may decide to further subdivide any of the
above subcategories, if the number and kind of feedbacks indicates that this would be
useful. It is quite likely that subcategory 3.1, task-performing actions, will need to be
specialised for a given experiment or group of related experiments. For example, if the
primary focus of the experiment is the use of a particular method then we may identify
sub-categories of feedback that are of interest for this specific experiment.
2.3. Using the Feedbacks
In Section 2.2 we discussed a broad categorisation of feedbacks. We now consider how
these feedbacks might be used to improve the quality of our software engineering
experiments. Before looking at possible uses of feedbacks there are some general
observations to be made.
The most important point is that all feedbacks are subjective and the researcher must
judge the significance of any given feedback, or group of feedbacks, and whether it can be
used in any way. It should also be noted that there is not a one-to-one mapping between
categories of feedback and uses of feedback. Finally, it is worth re-iterating that we expect
feedback information to be triangulated with other sources of data whenever possible.
We will now consider potential uses of feedback data and from what categories of
feedback relevant information is likely to be available for these uses.
2.3.1. Experimental Validity
A fundamental question concerning results from an experiment is how valid the results
are (Wohlin et al., 1999). Many of the feedbacks collected could potentially help us
identify threats to validity of our experiments. We consider how the different categories
of feedback identified above relate to important aspects of validity. Definitions of
Table 1. Categorisation of
feedbacks.
1 Experimental Context
1.1 Breaks and Disruptions
1.2 Background Knowledge
1.3 Experimental Material
1.4 Supporting Tools
1.5 Physical Environment
2 Subjects’ Perceptions
2.1 Stress
2.2 External Disturbance
2.3 General Reflections
3 Experimental Conduct
3.1 Task-performing Actions
3.2 Planning and Strategy
3.3 Comprehension
120 KARAHASANOVIC ET AL.

different types of validity were introduced by Campbell (Campbell and Stanley, 1963).
In this paper we use the modified definitions given by Wohlin (Wohlin et al., 1999).
Construct Validity. The construct validity is concerned with the relationships between
theory and observation (Wohlin et al., 1999). It concerns whether the independent and
dependent variables accurately measure the concepts we intend to study. Common high
level measures in software engineering experiments are time taken to complete the tasks
of the experiment and quality of the solutions. How do we ensure or check the construct
validity of these measures? FCM can be used to explain variations due to Bnoise^ in the
measures, which in turn can help us identify construct validity problems and outliers in
our dependent variables.
Feedbacks about breaks and disruptions could potentially allow us to adjust solution
times or even exclude subjects but, as noted earlier, these feedbacks do not provide
accurate quantitative data. However, we may be able to triangulate this type of feedback
with data from logging tools, for example. Some feedbacks on the use of supporting tools
may also indicate that subjects have lost time during the experiment. For example, the
FCM may reveal that a person spent non-productive time on some technical problem
with a PC or a development tool. In this case, the task times of that subject can be
considered an outlier or we can even somehow adjust the time spent.
Internal Validity. The internal validity is concerned with the relationship between the
treatment and the outcome. We want to make sure that there is a causal relationship
between them, i.e., that the treatment causes the outcome (Wohlin et al., 1999). Lack of
knowledge could be a general threat to internal validity (as a confounding factor) if a
significant number of subjects identify this as a problem. However, it is more likely to
identify specific subjects who are inadequately qualified for an experiment and should be
considered for exclusion from the results. Similarly, a major error in the experimental
materials might be a Fshow stopper_ but in our experiments such significant errors should
have been eliminated by running pilot experiments. Feedback on problems with
understanding the use of supporting tools is often another symptom of a subject_s lack
of background and is most likely to be an individual problem.
Some experiments are concerned with process conformance and require subjects to
adhere to certain instructions, for example to use a specified method or tool, during an
experiment (Basili et al., 1999). Failure to follow the required process is a major threat to
internal validity and can be identified by analysing sequences of task-performing actions
or using feedbacks about planning and strategy. This is an area where formulating
specific questions about the use of methods or tools is valuable, rather than asking
general questions about current activity.
Feedbacks about the physical environment may indicate effects on an individual_sperformance but as long as all subjects work in the same experimental environment it
seems unlikely to be a major threat to internal validity. Subjects_ perceptions of stress
and external disturbance are also potential threats to internal validity that can be
identified through the collected feedback. Such feedback may also reflect problems such
as poor experimental design, lack of background knowledge or problems with the
physical environment.
COLLECTING FEEDBACK DURING SOFTWARE ENGINEERING EXPERIMENTS 121

2.3.2. Explaining Experimental Results
Having satisfied ourselves regarding the validity of our experimental results and, if
necessary having made adjustments to our empirical data, we then analyse the results of
our experiment, typically using measures such as the time to complete a task and the
quality of the solution. Feedbacks on the experimental conduct may shed light on
significant differences in the time taken to complete tasks or the quality of solutions. For
example, we may be able to increase our understanding of such differences by looking
for specific sequences of actions that are either likely to lead to a good solution or
alternatively, indicate a poor choice of technique. Such differences in completion times
or quality of solutions may also be explained by differences in the subjects_ general
solution strategy or levels of comprehension. This type of analysis may lead us to
formulate new hypotheses that can be tested in further experiments.
2.3.3. Experimental Ethics
Considering ethical issues is an important part of conducting empirical studies in software
engineering, for moral and pragmatic reasons (Singer and Vinson, 2001). Subjects_perceptions of an experiment may indicate that there are ethical problems with our
experiment. For example, if significant numbers of subjects complain about the stress levels
during the experiment or report feeling tired then this may indicate an ethical problem.
2.3.4. Improving Experimental Design
Feedbacks from a number of categories may highlight problems with our experimental
design. We can use this information to improve the existing experimental design or as
input to the design of future experiments of a similar nature. Lack of background
knowledge suggests that we need to screen our subjects more carefully or that we need to
reconsider the structure of the experiment. Faults in the experimental material need to be
fixed if the experiment is likely to be re-used. Problems with using the supporting tools
might point to the need for better help facilities or even the need for some pre-experiment
training; feedbacks on such problems may be correlated with logging information on tool
usage, if available. Negative feedback on the physical environment may potentially be
used to improve future experiments. However, providing an ideal working environment
may not be realistic. This shortcoming could affect the external validity of an experiment.
Subjects_ perceptions may also identify areas for improvement although many of these
feedbacks may be very individual in nature and therefore difficult to use.
2.3.5. Summary of the Use of Feedbacks
Table 2 summarises the relationship between the general categories of feedback
discussed in Section 2.2 and the potential uses of this feedback.
122 KARAHASANOVIC ET AL.

2.4. Summary of the Feedback Collection Method
In this section we have outlined the principles of our feedback collection method. To
implement the method, we need to undertake the following steps:
� Instrument the experimental context to collect feedbacksVour tool and its supporting
environment for collecting feedback is described in Section 3;
� Choose the type of questions, the timing of interrupts and the length of time allowed
for feedbacks for each experiment, four case studies are outlined in Section 4.1;
� Collect feedback and categorise according to a coding scheme based on the general
categories described in Section 2.2. The analysis of feedbacks from four experiments
is discussed in Section 4.2;
� Consider the different ways in which the feedbacks could be used, assess their impact
on the experiment and triangulate with other sources of empirical data, and take
appropriate action if necessary. Examples of using feedbacks are given in Section 4.3.
3. The Feedback-Collection Tool
We have developed a tool to support the feedback collection method called the feedback-
collection tool. The tool implements a regular-interval probing strategy, as described
above. More specifically, it satisfies the following requirements:
� At regular intervals, it requests feedback from subjects (a probe)
� It collects the feedback from the subjects and stores it, together with timestamps and
identifications of the subjects
� It limits the time available for feedback
Table 2. Use of categories of feedback.
Use of feedback Categories of feedback
Experimental Validity
Construct Validity 1.1, 1.4
Internal Validity 1.2, 1.3, 1.4, 1.5, 2.1, 2.2
-Process Conformance 3.1, 3.2
Explaining Experimental Results 3
Experimental Ethics 2.1
Improving Experimental Design 1.2, 1.3, 1.4, 1.5
COLLECTING FEEDBACK DURING SOFTWARE ENGINEERING EXPERIMENTS 123

� For each task in the experiment, it provides the flexibility to change:
A. the question or questions we use to elicit feedback
B. frequency of probing
C. the time allowed for feedback
To prompt subjects for feedback, a screen for entering data (the feedback-collection
screen) appears at regular intervals; time intervals restart from zero for each task, if
appropriate. This screen presents the probe to the subjects, who are asked to briefly
answer one or more questions on the screen. They answer within a limited time and save
their feedback by clicking the Save button. The screen disappears when the feedback is
saved or when the available time runs out. The time remaining to provide a feedback is
shown by a counter on the screen. The feedbacks written by the subjects are saved in a
database together with timestamps. Figure 1 gives an example of the feedback-collection
screen. The question used in this example is BWhat are you thinking now?^ A dialogue
box for entering the feedback is placed below this question. The time remaining for
finishing the current feedback (16 seconds in this example) is shown at the top of the
screen.
An administrator can easily change the question, the frequency of probing and the time
allowed for feedback via a web-based interface. Several questions may be posed in the
same window. Probes are associated with experimental tasks (design or programming
tasks in our experiments) and so it is possible to ask different questions, to set different
frequencies of probing and times for feedback for different tasks.
3.1. Implementation
The feedback-collection tool is implemented as a part of the web-based Simula
Experiment Support Environment (SESE) developed in our research group.1 SESE
Figure 1. The feedback-collection screen.
124 KARAHASANOVIC ET AL.

automates some of the logistics for large-scale controlled experiments. It allows
researchers to define experiments, including all the detailed questionnaires, task
descriptions and necessary code, assign subjects to a given experiment session, run and
monitor each experiment session and collect the results from each subject for analysis.
SESE provides multi-platform support for download and upload of experimental
materials and task solutions. SESE is deployed on an n-tier client/server architecture.
The SESE application layer runs on one computer and the database on another. The
feedback-collection tool is implemented in HTML and JavaScript. The user communi-
cates with the tool via a web browser. A program on the server side, implemented in
Java, processes responses from the user. User feedback is stored in a database (MS SQL-
server). A former version of SESE (not including the feedback-collection tool) and
experiences of using it are described more fully in (Arisholm et al., 2002).
A prototype of this environment, developed in a unix context, collects feedback from
users and automatically logs user operations. The following user operations are logged
together with timestamps: windows operations, keystrokes, operations on the mouse
buttons and unix commands. A more detailed description of this prototype can be found
in (Karahasanovic, 2002; Karahasanovic et al., 2001).
4. Experience of Using the Feedback Collection Method
This section describes the studies in which we used the feedback-collection tool, the kind
of data we collected by this tool and how we used this data.
4.1. Experiments
The feedback-collection method was used for data collection in four studies, summarised
in Table 3. The length of these studies varied from 90 minutes to 35 hours and number of
subjects from one to 53. In all these studies we wanted to gain experience with respect to
usefulness of the data collected by the FCM. In Studies I to III, all subjects used the
feedback-collection tool. However, in Study IV, we also wanted to test potential effects
of the FCM on the subjects_ performance. Half of the subjects worked in the FCM
condition and the other half of them worked in control silent condition (without the
FCM). In our experiments we used only a single question on each feedback-collection
screen.
Adequacy of frequency of probing, time for feedback and probes were tested in pilot
studies. For example, in Study III, a pilot experiment with five subjects was conducted
with 10 minute time intervals between probes. Based on the complexity of the tasks and
the experience from the pilot experiment we increased the frequency to 15 minutes.
Observers were present in these studies to provide technical support if problems with
any supporting tools or environments occurred but they had no role in the evaluation of
the FCM.
COLLECTING FEEDBACK DURING SOFTWARE ENGINEERING EXPERIMENTS 125

4.1.1. Study I
A controlled student experiment was conducted to evaluate how an impact analysis tool
called SEMT (Karahasanovic, 2000) supports schema changes. In this experiment we
compared two versions of this tool, which identifies the impact of schema changes on
Java applications; the first version using a fine level of granularity and the second
operating at a coarse level of granularity (Karahasanovic and Sjøberg, 2001).
The two versions were evaluated with respect to productivity of managing schema
changes and user satisfaction. The subjects conducted change tasks on a Java application.
The solution times and user commands were automatically recorded by a logging tool.
The quality of the solutions was assessed by the researcher on the basis of a correct
solution proposed by a person not involved in the research and correct answers were
counted by the unix diff tool. Information on user satisfaction was collected by a
questionnaire and by the feedback-collection method. Furthermore, the feedback-
collection method was used to identify events during the experiment that might affect
the performance of the subjects. The probe appeared every ten minutes with the text
BWhat are you thinking and feeling now?^ The subjects were instructed to describe what
they were thinking just before the probe appeared.
4.1.2. Study II
A controlled explorative study with one professional was conducted to investigate
whether a tool that presents the impacts of schema changes as a graph (SEMT) improves
the productivity of managing schema changes and increases user satisfaction compared
Table 3. Survey of studies.
Study I Study II Study III Study IV
Objective tool evaluation tool evaluation process evaluation method evaluation
Subjects 14 1 53 20
Duration 90 minutes 35 hours 3 to 5 hours 5 to 8 hours
Collected data -solution times
-assessment of
the solutions
-user satisfaction
-solution times
-assessment of
the solutions
-user satisfaction
-solution times
-assessment of
the solutions
-solution times
-assessment of
the solutions
Technology Java Java UML UML and Java
Supporting
environments
and tools
unix
emacs
unix
emacs
unix
Tau UML
unix
emacs
Tau UML
Other data
collection methods
-automatic logging
of commands
and solution times
-questionnaire
-automatic logging
of commands
and solution times
-interview
-automatic logging
of solution times
-automatic logging
of solution times
-interviews
-questionnaires
Frequency
of probing
10 minutes 10 minutes 15 minutes 15 minutes
Time for feedback 1 minute 2 minutes 2 minutes 2 minutes
126 KARAHASANOVIC ET AL.
with tools that present impacts as text (Source Navigator from RedHat and unix
command-line tools, find, grep) (Karahasanovic and Sjøberg, 2002). The study took
place over 35 hours, divided into three phases during an 11-week period. The subject
used respectively unix, Source Navigator and SEMT to perform tasks in Java during each
of the phases.
We collected the solution times, logged the users_ commands and assessed the
solutions in the same way as in Study I. The purpose and use of the FCM, frequency of
its appearance and the question were the same as in Study I. We also conducted an
interview with the subject.
4.1.3. Study III
A controlled experiment (Anda and Sjøberg, 2003) was conducted to test whether
different ways of applying use case models in a UML design process affect:
� the completeness of the model measured by the number of functions in the
requirements specification that are implemented,
� the structure of the design model, and
� the time needed to achieve a good design.
The students were given guidelines describing the process to apply. The case tool Tau
UML from Telelogic was used to perform the tasks. The subjects spent between three
and five hours performing the tasks. The solution time was automatically recorded by
SESE and the solutions were assessed by an expert not involved in the research. The
FCM in this study was used primarily to check process conformance, that is, the extent to
which the subjects actually followed the given guidelines. The subjects were instructed
to recall both their thoughts and actions. The probe BWhat have you done since the last
screen?^ appeared every 15 minutes.
4.1.4. Study IV
A controlled experiment (Arisholm et al., 2003) was conducted to test:
� whether the presence of UML documentation (class diagrams and sequence diagrams)
improves the ease of understanding and modification of object-oriented software,
� whether the use of the feedback-collection tool provides valuable additional infor-
mation compared with a control group not using FCM, and
� whether use of the feedback-collection tool affects subject performance (time taken to
perform tasks and the correctness of solutions) compared with the control group.
COLLECTING FEEDBACK DURING SOFTWARE ENGINEERING EXPERIMENTS 127

The experiment was divided in two sessions and the students were asked to perform six
change tasks. The dependent variables of the study were solution time (in minutes spent
to perform the tasks) and quality of the solutions. The solution time was reported by each
subject using a task questionnaire. The correctness of the task solutions was assessed by
the researchers.
The subjects were divided into four groups, as shown in Table 4. All the subjects used
emacs and a Java compiler to perform the change tasks. The Java programming tasks
were identical for all four groups. However, the subjects assigned to the UML condition
used the case tool Tau UML to read and update the UML design documentation for each
Java program, whereas the subjects assigned to the No UML group received no UML
documentation. For the subjects assigned to the FCM condition, the probe appeared
every 15 minutes with the text BWhat have you been thinking about while solving this
task?^ The subjects were instructed to recall their thoughts while performing the last
task.
4.2. Collected Feedback
The feedback-collection tool was used frequently in all the four studies. Some data was
missing because nothing was written on the screen or the feedback was unfinished,
unreadable because of misspelling or contained no information.
As Study I was quite short (90 minutes), the time available for writing was limited
to one minute. Among the 90 feedbacks, 14 (16%) were missing or unfinished. We
increased the available time to two minutes in the remaining three studies. In Studies III
and IV, the feedback-collection screen was enhanced to show the subjects how much time
they had remaining for writing. The number of missing and unfinished feedbacks for
Studies IIYIV decreased to three of 103 (3%), 17 of 451 (4%), and three of 218 (1%)
respectively.
The feedbacks varied in length from one or two words (Btask 3,^ for example) to four
or five sentence paragraphs describing what had been done or proposing improvement of
the technology being studied. There was no relation between the length of the feedbacks
and the frequency of probing.
To facilitate analysis of the collected feedbacks we used the coding process described
by Seaman (Seaman, 1999). We categorised the collected feedbacks according to the
categories described in Section 2.1. This was done by two researchers in parallel; one
researcher was not involved in the evaluation of the feedback-collection method.
Encoded files were inspected for differences and questionable feedbacks. These were
then resolved through discussion and analysis of their context. The researchers initially
Table 4. Group assignment in Study IV.
UML No UML
FCM 4 6
Control group 5 5
128 KARAHASANOVIC ET AL.

agreed 87 percent of time. Table 5 shows the frequency of the feedbacks in the four
studies.
The majority of collected feedbacks (between 56 and 85 percent) describe the tasks-
performing actions. As the purpose of the first two studies was to evaluate the impact
analysis tool, the percentage of feedbacks on the tool being evaluated (experimental
material subcategory) is larger than in the other studies. In Study III some subjects
experienced technical problems with the Tau UML tool due to the heavy load of 26 people
working simultaneously. Therefore, the percentage of feedbacks on breaks and disruptions
(6%) and feedbacks on supporting tools (7%) is larger than in the other studies.
In analysing the feedbacks we used a more detailed breakdown for some sub-
categories. In some instances, more detailed analysis was done to give more information
in case it was required, and for particular experiments it was useful to provide a more
detailed categorisation of task performing actions. For example, we did a more detailed
analysis of breaks and disruptions which is shown in Table 6.
We can see from this more detailed analysis that there was a different distribution of
breaks and disruptions between studies III and IV; this could provide some useful
additional information to the researchers conducting the experiments. By doing a more
detailed analysis of feedbacks in our initial pass though the feedback data we avoided the
Table 5. Frequency of feedbacks.
Feedback Study I Study II Study III Study IV
1 Experimental context
1.1 Breaks and disruptions 2 (2.6%) 4 (4.0%) 49 (6.6%) 15 (3.4%)
1.2 Background knowledge 2 (2.6%) 16 (2.1%) 14 (3.1%)
1.3 Experimental material 8 (10.5%) 6 (6.0%) 5 (0.7%) 3 (0.7%)
1.4 Supporting tools 54 (7.2%) 1 (0.2%)
1.5 Physical environment 8 (1.1%) 7 (1.6%)
2 Subjects’ perception
2.1 Stress 4 (5.3%) 15 (2.0%) 14 (3.1%)
2.2 External disturbance 2 (0.3%)
2.3 General reflections 1 (0.1%) 2 (0.5%)
3 Experimental conduct
3.1 Task-performing actions 53 (69.8%) 85 (85.0%) 488 (65.1%) 252 (56.2%)
3.2 Plan and strategy 5 (5.0%) 97 (12.9%) 100 (22.3%)
3.3 Comprehension 7 (9.2%) 14 (1.9%) 40 (8.9%)
Total 76 100 749 448
Table 6. Detailed breakdown of the Subcategory 1.1 (breaks and disruptions).
Study I Study II Study III Study IV
1.1 Breaks and disruptions
1.1.1 Breaks 8 (1.1%) 12 (2.7%)
1.1.2 Disruptions 2 (2.6%) 4 (4%) 38 (5.1%) 2 (0.4%)
1.1.3 Other activities 3 (0.4%) 1 (0.2%)
COLLECTING FEEDBACK DURING SOFTWARE ENGINEERING EXPERIMENTS 129

problem of having to carry out re-analysis of feedbacks if an interesting result appeared
in one of the subcategories.
For Studies I and II (evaluating an impact analysis tool) and Study IV (evaluating the
use of UML documentation), it was useful to break down subcategory 3.1 (task-
performing actions) into several more detailed categories, as shown in Tables 7 and 8),
indicating how the subjects_ actions were distributed over the activities of interest.
However, these detailed categorisations are only relevant for these specific experiments.
4.3. Use of the Feedbacks
The collected feedbacks were used together with other data sources to identify threats to
validity, to explain the results and to improve our future experiments. In Studies I and II
the principal researcher assessed the usefulness of the collected feedback. In Studies III
and IV usefulness of the feedback was independently assessed by two researchers who
were not involved in the evaluation of the feedback-collection method.
Table 9 shows how the feedback we collected was used and how it was triangulated
with other sources of data. The following data sources were used in our experiments:
automatically recorded solution times (ST), log files (LF), assessment of the solutions
(AS), interviews (I), questionnaires (Q) and collected feedbacks (FB). These data sources
were used as primary sources of information (Primary), as supporting evidences
(Supporting), to modify information provided by other data sources (Modifying), and to
give more details and explain information provided by other data sources (Explaining).
The main categories in Table 9 match those of Table 2, where BValidating solution
times^ is an example of Construct Validity and BProcess Conformance^ is a special case
of Internal Validity. We have extended the Explaining experimental results category to
include specialised subcategories relevant to specific studies.
Table 8. Detailed analysis of task-performing actions for Study IV.
3.1 Task-performing actions
3.1.1 Actions on code (edit. search. compile) 165 (36.8%)
3.1.2 Actions on UML diagrams
3.1.2.1 Actions on UML class diagrams 9 (2%)
3.1.2.2 Actions on UML sequence diagrams 38 (8.5%)
3.1.2.3 Actions on unspecified UML diagrams 10 (2.2%)
3.1.3 Other actions 30 (6.7%)
Table 7. Detailed analysis of task-performing actions for Studies I and II.
Study I Study II
3.1 Task-performing actions
3.1.1 Actions with tool under study 43 (56.6%) 12 (12%)
3.1.2 Other action 10 (13.2%) 73 (73%)
130 KARAHASANOVIC ET AL.

The rest of the section illustrates these different uses of feedback with examples taken
from the four studies. In the examples of feedbacks presented in the following
subsections, [. . .] indicates an explanatory comment added by us. The majority of the
examples were originally written in Norwegian and have been translated for this paper.
4.3.1. Construct Validity: Validating Solution Times
Our subjects reported on different breaks and disruptions during the experiments. Table 10
gives examples of such feedbacks.
We used some of these feedbacks to validate our conclusions about the time taken to
complete the tasks. In Study II, the subject wrote that he had problems with emacs while
performing a task with SEMT. We examined the command log files and discovered that
the subject actually had to start emacs several times. From the log files we were able to
identify the amount of wasted time. In the same study, the subject also wrote that he did
not understand the command for finding the impacts on two classes while performing
another task with SEMT. By analysing the SEMT log file, we identified when the subject
Table 10. Feedbacks on breaks and disruptions.
Feedback Study
Problems with emacs. II
Problems with SEMT [the impact analysis tool used in the experiment]; I don’t understand
the command for finding impacts on two classes
II
I have spent approximately 10 minutes on transferring some files because I was logged on
with the wrong user ID, disregard this time
III
Tau [the UML tool used in the experiment] doesn’t work. I have done nothing since the
last window.
III
Coffee break III
It can’t be that 15 minutes have already passed. I am not closer to the solution.
I think I need a break [the same subject 15 minutes later] I had a break. I see things differently.
I think I am closer now.
IV
Table 9. Use of the collected feedbacks in our studies.
Primary Supporting Modifying Explaining
Experimental validity
Validating solution times ST LF FB LF
Process conformance FB
Explaining experimental results
Use of the UML documentation I FB, Q FB
Use of the time I FB FB
Explaining the solutions AS FB
Problems in comprehension I FB FB, Q
Use of the tool being evaluated ST FB
Experimental Ethics FB
Improving experiment design FB
COLLECTING FEEDBACK DURING SOFTWARE ENGINEERING EXPERIMENTS 131

actually started to work on this task. In Study III, some subjects experienced technical
problems that affected the time these subjects spent on task solving. We used the
feedbacks reporting these problems to identify when the subjects actually started to work
on the task and adjusted the time spent for each student (time was recorded automatically
by SESE). In the same study one subject reported that he spent about 10 minutes on
transferring some unnecessary files. We subtracted this time from the time he spent on
the task solving.
When the subjects reported a break we did not adjust the solution times. We assumed
that this time was not wasted as it was easier for the subjects to work on the tasks after a
break. Furthermore, all subjects spent approximately the same time on these breaks.
4.3.2. Internal Validity: Validating Process Conformance (Study III)
In Study III, the feedbacks describing actions the subjects performed during the
experiment were used to check process conformance. At the beginning of an experiment,
the subjects were given instructions on how to conduct the experiment. Validity of the
experimental conclusions depends on whether the subjects actually followed these
instructions. An example of a sequence of feedbacks is presented in Table 11 (timestamps
are given in minutes from the start of the experiment). This subject realised after 45
minutes that he had not followed the instructions. Although the subject continued with the
experiment and gave further feedbacks, he was excluded from the results for the
experiment. The feedbacks helped us to identify six subjects that did not follow the given
guidelines for a method under study and those subjects were excluded from the analysis.
4.3.3. Explaining Experimental Results
Use of the UML Documentation (Study IV). In Study IV, the feedbacks were used to
study how the UML documentation changed the way in which the subjects understood,
coded and tested the change tasks. The feedbacks describing task-performing actions were
divided into three groups: 12.7% of total number of feedbacks addressed actions that
involved using the UML documentation (search, update), 36.8% addressed actions on
program code (search, edit, compile) and 6.7% addressed other actions like reading task
Table 11. A sequence of feedbacks used to identify one subject that did not follow the guidelines.
Timestamp Feedback
50 It is a new thing to me to start with class diagrams, but ok. I am tired because I worked a lot
for another course.
65 I am trying to make class diagrams. I am working on the Borrower class.
80 I am going to make a class diagram, not a domain model.
95 I’ve read the task description again. I had to start again because I did not follow
the instructions.
132 KARAHASANOVIC ET AL.
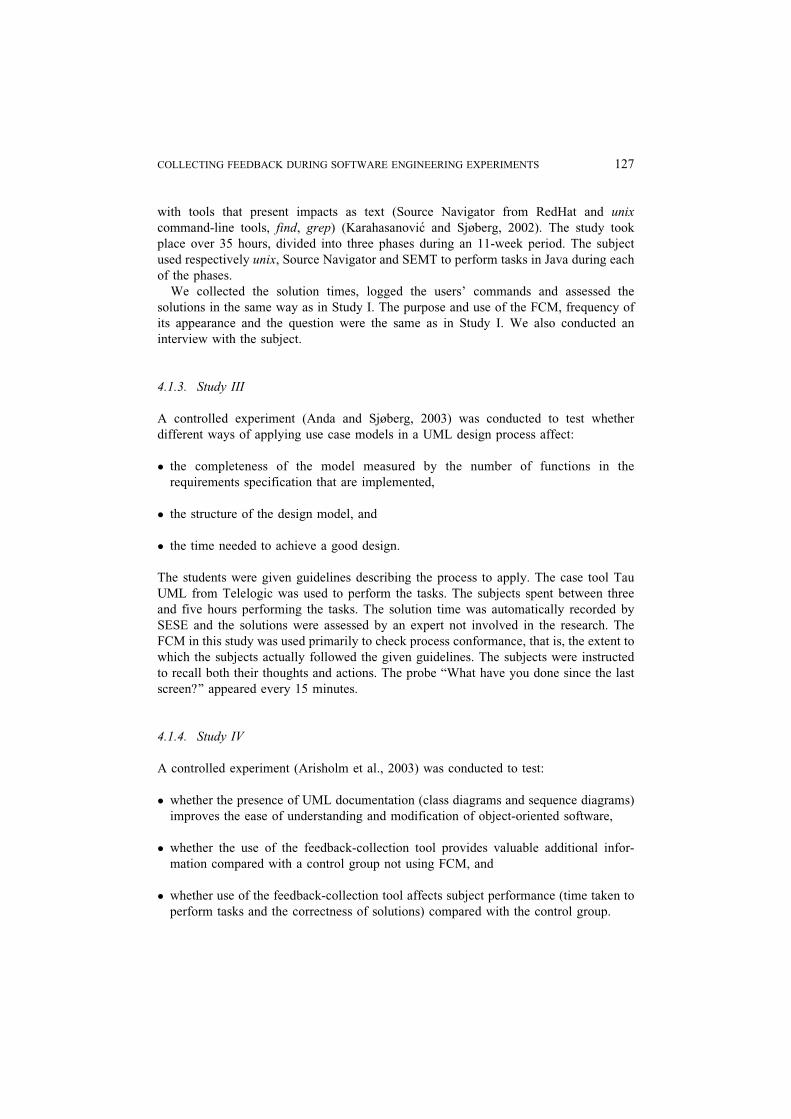
descriptions. Table 12 gives examples of feedbacks addressing use of the UML
documentation.
During the interviews, conducted after the experiment, the subjects explained how
they used the UML documentation. Based on this information we identified differences
in the use of UML documentation. We found that some subjects used the UML docu-
mentation actively to identify change locations prior to performing code modifications,
whereas others ignored the UML documentation and instead used the Java code to
understand how to change the program. The feedbacks provided supporting evidence for
the differences identified by the interviews. They also provided a more detailed task
related picture of these differences.
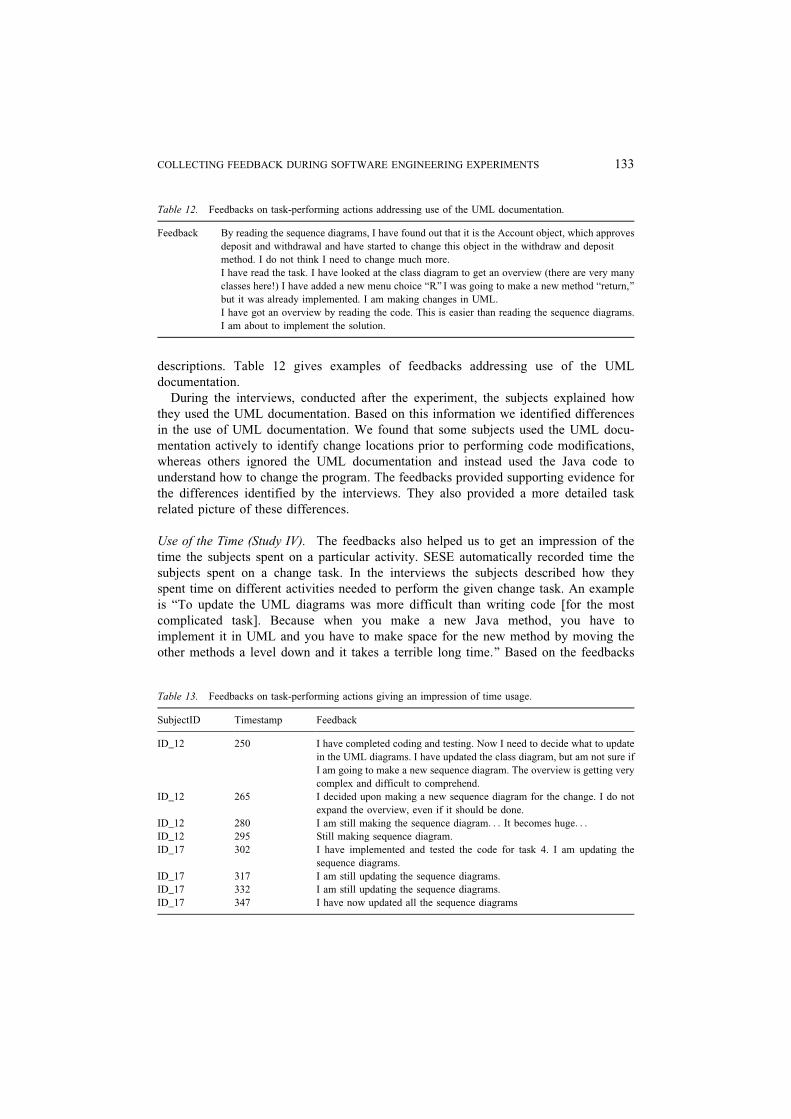
Use of the Time (Study IV). The feedbacks also helped us to get an impression of the
time the subjects spent on a particular activity. SESE automatically recorded time the
subjects spent on a change task. In the interviews the subjects described how they
spent time on different activities needed to perform the given change task. An example
is BTo update the UML diagrams was more difficult than writing code [for the most
complicated task]. Because when you make a new Java method, you have to
implement it in UML and you have to make space for the new method by moving the
other methods a level down and it takes a terrible long time.^ Based on the feedbacks
Table 12. Feedbacks on task-performing actions addressing use of the UML documentation.
Feedback By reading the sequence diagrams, I have found out that it is the Account object, which approves
deposit and withdrawal and have started to change this object in the withdraw and deposit
method. I do not think I need to change much more.
I have read the task. I have looked at the class diagram to get an overview (there are very many
classes here!) I have added a new menu choice BR. I was going to make a new method Breturn,^but it was already implemented. I am making changes in UML.
I have got an overview by reading the code. This is easier than reading the sequence diagrams.
I am about to implement the solution.
Table 13. Feedbacks on task-performing actions giving an impression of time usage.
SubjectID Timestamp Feedback
ID_12 250 I have completed coding and testing. Now I need to decide what to update
in the UML diagrams. I have updated the class diagram, but am not sure if
I am going to make a new sequence diagram. The overview is getting very
complex and difficult to comprehend.
ID_12 265 I decided upon making a new sequence diagram for the change. I do not
expand the overview, even if it should be done.
ID_12 280 I am still making the sequence diagram. . . It becomes huge. . .ID_12 295 Still making sequence diagram.
ID_17 302 I have implemented and tested the code for task 4. I am updating the
sequence diagrams.
ID_17 317 I am still updating the sequence diagrams.
ID_17 332 I am still updating the sequence diagrams.
ID_17 347 I have now updated all the sequence diagrams
COLLECTING FEEDBACK DURING SOFTWARE ENGINEERING EXPERIMENTS 133

and their timestamps we could approximately determine how much time they spent on
this particular activity. Two examples of useful sequences of feedbacks are shown in
Table 13; feedbacks are given together with subject id and timestamp in minutes from
the start of the experiment.
Explaining the Solution. Some of the subjects explained their plans, strategies and
alternatives they were considering and some examples are given in Table 14. The first
feedback in this table explains why some classes were left out of the solution. The other
two feedbacks show that the subjects were thinking about a strategy that would give a
better quality final solution but decided to implement an easier solution (which is the one
the researcher analysed). The feedbacks thus explained the assessed quality of the
solutions.
Problems in Comprehension (Study IV). In study IV, the subjects reported problems
with comprehension of the program as a whole and language specific problems such as
converting an integer to a string, see Table 15. This type of problem was reported by four
subjects in interviews, by three subjects in post-task questionnaires and by seven subjects
in FCM screens. The feedbacks provided the most complete picture and explained
important sources of variation in programming effort and solution correctness. The last
feedback in Table 15 is an example of using a feedback for two different purposes: to
explain the solution given and to identify a lack of background knowledge.
Use of Tools in the Task Solution Process (Studies I and II). In Studies I and II, the
feedbacks shown in Table 16 helped us to identify some of the problems with SEMT:
lack of integration with a programming environment and missing update of the graph
when the Java code changed. This information was used to improve the tool.
Table 15. Feedbacks on comprehension problems.
Feedback I have problems with understanding the structure in the account class. There is no storage
for deposit and withdrawal as far as I can see.
I have sometimes problems with seeing the whole picture, because there are several levels
with products, ingredients and dispensers. I try to make the recipe check the ingredients if
it is possible to make coffee.
I have compiled the code and fixed errors. It is difficult to convert an int to a string. I know
that I have done this several times before, but I do not remember how I have done it.
Table 14. Feedbacks on planning and strategy.
Feedback Study
I think I will make an array in the classes for book and film that keeps track of copies. III
I am working on the sequence diagram for UC1 [refers to Use Case 1 in the task description].
Maybe I should model a register to get the information out.
III
I have considered a way to solve the test task. I first thought about adding the elements in a
kind of stack (since it would make it easy to print out backwards), but it does not work this
way. Consequently, I will add the elements in the normal way.
IV
134 KARAHASANOVIC ET AL.

We also logged user commands to validate usefulness of different commands in Study II.
The analysis of the log files showed that the subject frequently used the commands for
finding change impacts (31.3% of all commands). In the collected feedbacks the subject
explained that this functionality helped him to solve the given change tasks.
However, the collected feedbacks could not explain all findings. The analysis of
the SEMT log file showed that the redraw command was used quite often (20.3 %).
The collected feedbacks provided no explanation for this but in the interview after the
study the subject explained that he often needed to hide the methods and the fields he
expanded in the previous step. As SEMT has no such command, he had to redraw the
graph.
4.3.4. Experimental Ethics
Some subjects in our experiment reported that they felt stressed, tired and frustrated but
we also received some positive feedback! Examples from different studies are shown in
Table 17. It is not possible to avoid stress during the experiments. However we realized
that we should pay more attention to informing our subjects about the problems that may
occur during the experiments. During the introduction session and in the post-experiment
interviews we should say more about the complexity of the experiment tasks and take
care to debrief the subjects properly.
Table 16. Feedbacks on the tool under study (experimental material category).
Feedback Study
SEMT [impact analysis tool] was unable find the impacts of a class field (titleName) on the class
constructor.
I
I cannot see any changes in SEMT when I change the Java code. What do I have to do in order to
see the changes I have made?
II
I think that SEMT is helpful in giving the affected classes in graphical format, but it would be
more effective if it were combined with an editor.
II
Table 17. Feedbacks on subjects’ perception of the experiment.
Feedback Study
I am tired and have problems to concentrate. II
I had a period with lower productivity and bad concentration, but it is better now. IV
A bit frustrated!! I don’t understand the task. [the same student 10 minutes later] I understand
a bit more. I am coding right now.
I
I stuck. I cannot go either forward or back. I am at the same place as I was for two hours ago,
and I am not really motivated to try more.
IV
Doing well III
I feel time pressure. I
I am disturbed by the neighbour. He talks to himself and to others. III
I really learned a lot. I think this will be useful for the exam. III
COLLECTING FEEDBACK DURING SOFTWARE ENGINEERING EXPERIMENTS 135

4.3.5. Improving the Experimental Context
We collected different feedbacks on the experimental context during our studies,
examples are shown in Table 18. Before each experiment we made some assumptions
about the subjects_ background knowledge of the methods, tools and languages used in
the experiment. For example, some of the subjects reported that they had insufficient
knowledge of Java. We found only one feedback reporting problem in the experiment
documentation. We believe that this low number is because we conducted pilot
experiments.
The subjects also reported problems with supporting tools. They experienced problems
with emacs and lack of a help function in Study II. Subjects from the group solving
problems with pen and paper in Study III expressed their dissatisfaction. Some subjects
had problems when using Tau UML in Study IV. Furthermore, the subjects identified
problems with the experimental environment: the room, the equipment and the
interaction with other subjects or the researchers during the experiment. All this
information has been useful input to improve the organisation of our experiments.
4.4. Summary of the Results
In this section we have presented examples of feedbacks collected by our tool and
described how we used them. The feedback-collection tool was frequently used and
provided valuable information regarding all our experiments. However, the collected
feedbacks varied in length and their usefulness for the researchers. We also noticed that
different subjects provided different types of feedbacks. While some subjects described
their actions very briefly other provided long explanations for their actions. We believe
that better instructions before the experiment could help to increase the usefulness of the
feedbacks for researchers.
Table 18. Feedbacks on the experimental context.
Feedback Study
Feedbacks on the background knowledge
I should know Java better. I
I have compiled the code and fixed errors. It is difficult to convert an int to a string. I know that
I have done this several times before, but I do not remember how I have done it.
IV
Feedback on the experimental documentation
Should I delete isbn field or write it as a comment? II
Feedbacks on supporting tools
Problems with emacs. II
I hate Tau UML. It is not possible to draw a straight line. IV
Feedbacks on the physical environment
I don’t have enough space to work. I’ve got a neck pain. III
I am waiting for Erik to come and help me with making an integer to an object. [the same subject
15 minutes later] I’ve got a help. I was not aware that I could use Java API from internet.
IV
136 KARAHASANOVIC ET AL.

5. Impacts on Subject_s Performance
In Study IV we measured impacts of the feedback-collection tool on the performance of
the subjects regarding the time the subjects spend on their tasks (Section 5.1) and the
quality of their solutions (Section 5.2). The subjects_ experience of the use of the
feedback-collection tool is described in Section 5.3. Analysis of impacts on subject_sperformance was conducted by researchers who were not involved in the evaluation of
the feedback-collection method.
5.1. Solution Time (Study IV)
In Study IV, we compared the time spent on understanding, coding and testing the
change tasks (i.e., solution time) for those subjects assigned to the feedback-collection
condition with those assigned to the control group. Table 19 shows the descriptive
statistics. The results suggest that the subjects assigned to the feedback-collection
condition required slightly less effort than the subjects assigned to the control group, but
only for those subjects given no UML documentation. Thus, the feedback-collection
method might introduce a bias regarding the dependent variable solution time in
experiments involving program comprehension activities. The potential bias caused by
such interaction effects should be accounted for when analyzing the main effects of the
UML documentation on solution time. This can, for example, be achieved by using a
general linear modelling (GLM) approach on the dependent variable solution time, and
including an interaction term between the experimental conditions (i.e., UML*Feedback-
collection) (Freund and Wilson, 1998). Using such an analysis approach for the data in
Table 19, the difference in time due to the presence or absence of the feedback-collection
condition is far from statistically significant (Arisholm et al., 2003). Nevertheless, given
the low number of subjects in each group, the results should be interpreted with caution.
5.2. Quality of the Solution (Study IV)
Table 20 shows cross-tabulation statistics on the number of subjects achieving correct
versus faulty solutions on the change tasks for the four experimental groups in Study IV.
The results suggest that the subjects assigned to the feedback-collection condition were
slightly more likely to produce correct solutions than were the subjects assigned to the
Table 19. Solution times (in minutes) in Study IV.
N Mean Median StDev Min Max Q1 Q3
No UML Control group 5 131 123 81 31 240 59 208
FCM 6 119 102 50 73 193 78 172
UML Control group 5 102 105 23 67 127 81 122
FCM 4 103 102 20 78 128 84 122
COLLECTING FEEDBACK DURING SOFTWARE ENGINEERING EXPERIMENTS 137
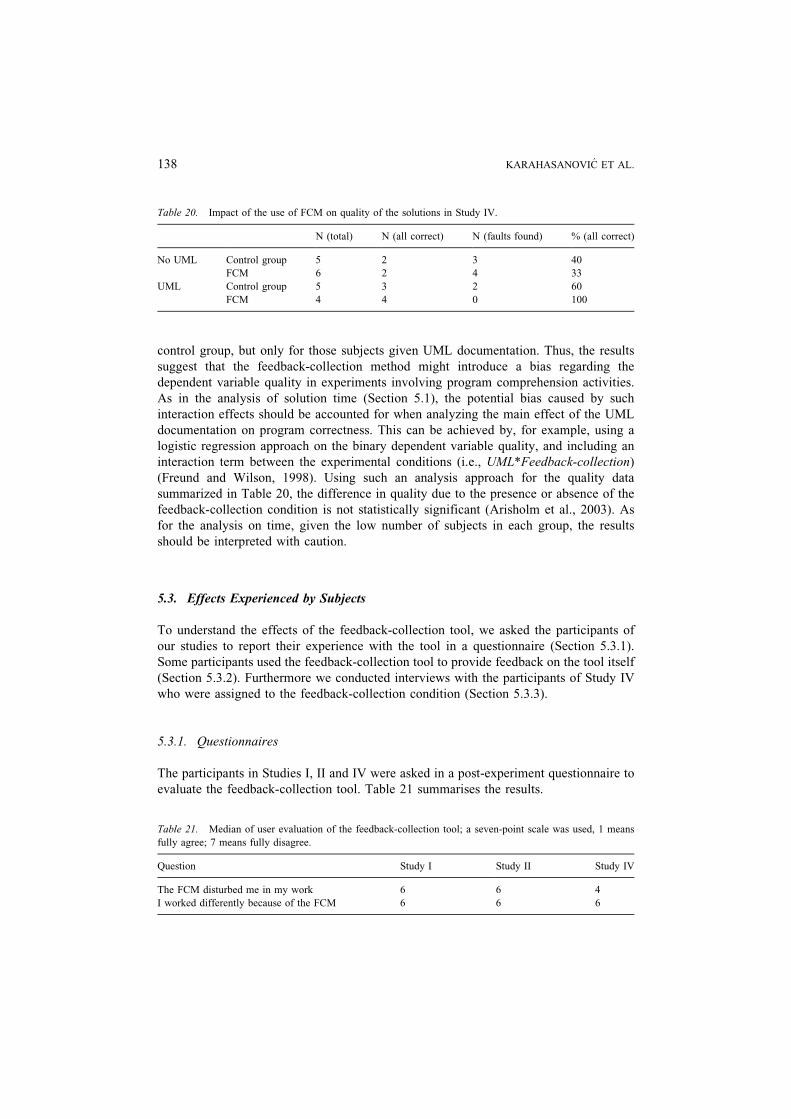
control group, but only for those subjects given UML documentation. Thus, the results
suggest that the feedback-collection method might introduce a bias regarding the
dependent variable quality in experiments involving program comprehension activities.
As in the analysis of solution time (Section 5.1), the potential bias caused by such
interaction effects should be accounted for when analyzing the main effect of the UML
documentation on program correctness. This can be achieved by, for example, using a
logistic regression approach on the binary dependent variable quality, and including an
interaction term between the experimental conditions (i.e., UML*Feedback-collection)
(Freund and Wilson, 1998). Using such an analysis approach for the quality data
summarized in Table 20, the difference in quality due to the presence or absence of the
feedback-collection condition is not statistically significant (Arisholm et al., 2003). As
for the analysis on time, given the low number of subjects in each group, the results
should be interpreted with caution.
5.3. Effects Experienced by Subjects
To understand the effects of the feedback-collection tool, we asked the participants of
our studies to report their experience with the tool in a questionnaire (Section 5.3.1).
Some participants used the feedback-collection tool to provide feedback on the tool itself
(Section 5.3.2). Furthermore we conducted interviews with the participants of Study IV
who were assigned to the feedback-collection condition (Section 5.3.3).
5.3.1. Questionnaires
The participants in Studies I, II and IV were asked in a post-experiment questionnaire to
evaluate the feedback-collection tool. Table 21 summarises the results.
Table 20. Impact of the use of FCM on quality of the solutions in Study IV.
N (total) N (all correct) N (faults found) % (all correct)
No UML Control group 5 2 3 40
FCM 6 2 4 33
UML Control group 5 3 2 60
FCM 4 4 0 100
Table 21. Median of user evaluation of the feedback-collection tool; a seven-point scale was used, 1 means
fully agree; 7 means fully disagree.
Question Study I Study II Study IV
The FCM disturbed me in my work 6 6 4
I worked differently because of the FCM 6 6 6
138 KARAHASANOVIC ET AL.

The participants in Study I claimed that they were not disturbed or influenced by the
feedback-collection tool. The subject in Study II was exposed to the feedback-
collection tool for 35 hours. He also claimed that he was not disturbed by the tool, but
the feedbacks he wrote were shorter and less diverse than the feedbacks of the subjects
in the other studies. The participants Study IV were exposed to the feedback-collection
tool for five to eight hours. They were more disturbed by the feedback-collection tool
than the participants in Study I, but still claimed that their work was not influenced by
the tool.
5.3.2. Feedbacks on the Feedback-Collection Tool
Three participants in Study I wrote explicitly on the feedback-collection screen that they
liked it; one of them wrote: BThis screen is a very good idea. It helps me to keep
focussed.^ Two participants in Study III wrote that they were irritated by the feedback-
collection tool.
5.3.3. Interviews (Study IV)
We interviewed the participants in Study IV who were assigned to the feedback-
collection condition (total 10 subjects). They were asked to describe their experience
with the feedback-collection tool.
The tool was experienced differently among the subjects. Several subjects felt that the
feedback-collection tool positively influenced the way they performed the tasks because
they became more conscious of their thoughts and actions. It helped them to capture the
thoughts, gain new perspectives, remember more clearly what they were doing and
become aware of flaws in the solutions. This is illustrated by the following comments:
. . .particularly during the last task, it affected my solution a little bit because I had to
think . . . and then I discovered that something was not optimal. It changed my
thoughts, so . . . I had some new thoughts. Without it . . . maybe the thoughts would
disappear.
One subject reported that the feedback-collection tool made her less frustrated during the
experiment:
If there were problems, I could at least write why I spent so long time, so, you know, I
became less frustrated.
The majority did not feel that the feedback-collection tool stole time from the
performing of the tasks. Two subjects reported that the small breaks in the experiment
were useful. Some subjects claimed not to be influenced by the feedback-collection tool
at all. Being interrupted while working was not problematic for most subjects. However,
COLLECTING FEEDBACK DURING SOFTWARE ENGINEERING EXPERIMENTS 139

one subject felt that disturbance by the feedback-collection tool affected his work
significantly:
But, during the last task, I had a feeling that I had just started with the task and it
appeared, I forgot what I was working with, and I had to start from the beginning
again and . . . it interrupted me all the time.
6. Related Work
A wide range of methods based on self-reporting cognitive processes during a study have
been proposed. These methods have in common that subjects are asked to provide reports
of their ongoing thoughts, feelings or experience. They fall into three broad categories:
thought and experience sampling, event recording and concurrent think-aloud.
6.1. Thought and Experience Sampling
In thought-sampling the subjects are interrupted randomly and asked to report their
thoughts in oral or written form (Genest and Turk, 1981). In the earliest uses of thought-
sampling the subjects were interrupted by a researcher in a laboratory setting (Aserinsky
and Kleitman, 1953). In newer uses of this method the subjects were given a portable
tone generator that randomly generates tones (Hurlburt, 1979). This allowed sampling of
thoughts over a longer time period and in naturalistic settings.
Similar to this is experience-sampling (Larson and Csikszentmihalyi, 1983). The subjects
carry electronic pagers which randomly generate tones. When a tone sounds, the subjects
answer a questionnaire. A computer application of this method called auto-ask has been
developed to study web users_ internal experience (Chen and Nilan, 1998). This application
randomly activates a questionnaire that pops up on the top of users_ web browsers.
Our approach can be considered as a form of experience sampling. However, the
experience-sampling method collects feedback during subjects_ daily activities in
naturalistic settings whereas our method collects feedback from subjects while they are
solving given problems in a laboratory setting. Consequently, we have to reduce the
impact of the data collection method on the subjects_ solution times. The feedback-
collection method therefore limits the time for feedback whereas in the experience-
sampling method this time is normally unlimited. Related to that is the number of
questions subjects have to answer. In our studies we used one open-ended question per
probe whereas in the experience-sampling method a questionnaire consisting of several
open-ended questions and numerical scales was used.
6.2. Event Recording
In event recording the subjects are asked to report whenever a certain kind of event
occurs (Genest and Turk, 1981). An application of this method in usability studies has
140 KARAHASANOVIC ET AL.

been reported by Ivory and Hearst (Ivory and Hearst, 2001). Event-driven dialog boxes
are embedded within a software prototype (Abelow, 1993). A dialog box asking BWhy
did you use this command?^ appears when a subject uses a particular command or makes
a mistake. The main advantage of this method is collecting feedback on infrequent but
important events (Genest and Turk, 1981). Nevertheless, a request for specific
information may change the thoughts and behaviour of the subjects. An additional
filtering process occurs between the time a thought (information) is stored in a short-time
memory (heeded) and the time this thought is reported (Ericsson and Simon, 1993).
Subjects_ reports may also be influenced by demand characteristics and social
desirability (Genest and Turk, 1981). For example, when the subjects are asked why
they used a particular command, they might conclude that this was wrong and avoid
using it in the rest of the experiment.
6.3. Concurrent Think-Aloud
Traditionally, the think-aloud protocol was used to study cognitive processes in
psychology (Anderson, 1987; Ericsson and Simon, 1993). It has also become a valuable
research method in several applied disciplines. For example, it has been used in medicine
to identify strategies used by experts and to evaluate the effects of new technologies on
decision-making processes (Jungk et al., 2000; Patel et al., 2001); in education to identify
strategies and processes used in learning environments (Davidson et al., 1996; Garner,
1988; Nathan, 1991); in software engineering for development of a comprehension
model (von Mayrhauser and Lang, 1999); and in usability evaluation (Boren and Ramey,
2000; Denning et al., 1990; Haak and Jong, 2003).
The subjects are instructed to verbalise whatever they are saying silently to themselves
(talk-aloud) or to verbalise whatever they are thinking (think-aloud) (Ericsson and
Simon, 1993). An observer records a subject_s verbalisations and may prompt the subject
to provide feedback, for example if the subject is not verbalising or the observer wishes
to ascertain the reason for some action. Our tool could be extended to implement subject-
driven probing. A prompt could remind subjects to provide a feedback if they have not
given any feedback for a certain period of time. This would provide a snapshot of the
feedback collected by the think-aloud method.
According to the theory of verbalisation processes, continuous verbalisation during a
task provides a more complete picture of the cognitive processes than other self-
reporting methods (Ericsson and Simon, 1993). It may affect performance of the subjects
(Berry and Broadbent, 1990; Sanderson, 1990; Wright and Converse, 1992), but it has
been argued that this effect can be minimised by employing warm-up trials and by
following guidelines for the think-aloud protocol (Ericsson and Simon, 1993).
The think-aloud method involves humans (observers and subjects) and is time
consuming for both observer and subject. Costs and organisational effort therefore
increase rapidly with the number of subjects and/or the length of the tasks. If the method
is conducted in special purpose usability laboratories these costs increase further.
Because it is based on sampling, the feedback collection method provides a less
complete picture of subjects_ thoughts and experience during an experiment than the
COLLECTING FEEDBACK DURING SOFTWARE ENGINEERING EXPERIMENTS 141

think-aloud method. However, it allows cost-effective data collection in experiments
with larger numbers of subjects or running over an extended time. We remove the need
for human observers to record verbalizations by using the feedback-collection screen but
there is still an additional cognitive load on the subjects whenever they are asked to
provide feedback.
7. Conclusions and Future Work
This paper has focused on the usefulness of gathering feedback from subjects during
software engineering experiments. We presented a feedback-collection method and
reported our experience with it. We implemented a tool based on this method that
interrupts the subjects at regular intervals and instructs them to write down their thoughts
on a web-based screen and stores the feedback in a database. We used this tool in four
experiments. We proposed a broad categorisation of feedback that we could get from this
method, reported the kind of data we collected and described how these data were useful
in our experiments. Our results showed that the feedback-collection tool is a valuable
means for collecting qualitative data about subjects in software engineering experiments.
The collected feedback helped us to validate solution times collected by other means, to
check process conformance, to understand sources of variation in programming effort
and solution correctness. The results of the interviews and questionnaires showed that the
subjects were mostly positive about the tool. The participants felt that they needed better
instructions to write feedbacks.
The results of one of the experiments suggested that use of the feedback-collection tool
might slightly improve the performance of the participants. The participants assigned to
the feedback-collection condition spent slightly less time and were slightly more likely to
produce correct solutions than the participants assigned to the silent condition.
The feedback-collection tool allowed us to collect qualitative data on subjects in a
relatively easy and inexpensive way. Based on our experience, we recommend the use of
the feedback-collection method in software engineering studies with many subjects or
that are long-term. We recommend also that the participants should receive training in
verbalising their thoughts on the feedback-collection screen. Furthermore, different
questions, frequencies of the screen appearance and available times for writing should be
tested for individual experiments using pilot studies. The categorization of feedbacks we
proposed was useful in the context of our experiments. Nevertheless, different categories
might be needed for different type of software engineering experiments.
Note that the feedback-collection tool provides a less complete description of the
cognitive processes than the think-aloud method with a human observer and thus is not
appropriate for studies in which completeness of mental process is essential.
Furthermore, the feedback-collection tool collects subjective information that should
be used to complement other data collection methods. Because we capture data together
with timestamps, the information collected by the feedback-collection screen can easily
be compared with objective information such as log files and solution times.
We intend to conduct several experiments to investigate the feedback-collection tool
further. The first experiment will use the design proposed by Ericsson (Ericsson, 2003).
142 KARAHASANOVIC ET AL.

The performance and collected protocols will be compared for four groups of subjects
who perform the same set of tasks: one group who think aloud; one group who give
immediate retrospective reports; one group who use a new verbal-report procedure, the
feedback-collection method in our case; and one silent control group. The analysis will,
we hope, help us to better understand the advantages and disadvantages of the feedback-
collection method. We also plan to further explore use of this tool with different
frequencies of probing, a range of times for feedback, with multiple questions within one
probe and with different questions for different tasks.
Because the present implementation of the tool is a part of the Simula Experiment
Support Environment (SESE) we were only able to evaluate it within Simula. However,
ideas presented here may be useful for other researchers and we also plan to evaluate use
of the feedback-collection method together with a mechanism for capturing user actions
called GRUMPS developed at University of Glasgow (Evans et al., 2003).
Acknowledgments
The authors are grateful to the students of the Department of Informatics at the
University of Oslo who participated in our experiments. We thank Samera Afsheen Ali
for contributions on the experiment on the effects of UML documentation on the
maintainability of object-oriented software. We thank Malcolm Atkinson and Anders
Ericsson for valuable information and advice; Annita Fjuk, Glen Farley, Richard Thomas
and Chris Wright for their constructive comments on this paper; and Gunnar Carelius for
his technical assistance. We are grateful to the anonymous reviewers for their useful
suggestions.
Note
1. SESE is not currently available commercially but Simula is willing to share the technology with
other interested researchers. Contact Dag Sjøberg ([email protected]) for further information.
References
Abelow, D. 1993. Automating feedback on software product use. CASE Trends December: 15Y17.
Anda, B., and Sjøberg, D. I. K. 2003. Applying use cases to design versus validate class diagramsVA
controlled experiment using a professional modelling tool. IEEE International Symposium on Empirical
Software Engineering (ISESE 2003). Rome, Italy, pp. 50Y60.
Anderson, J. R. 1987. Methodologies for studying human knowledge. Behavioural and Brain Science
10: 467Y505.
Arisholm, E., Sjøberg, D. I. K., Carelius, G., and Lindsjørn, Y. 2002. A web-based support environment for
software engineering experiments. Nordic Journal of Computing 9(4): 231Y247.
Arisholm, E., Ali, S. A., and Hove, S. E. 2003. An initial controlled experiment to evaluate the effect of UML
design documentation on the maintainability of object-oriented software in a realistic programming
environment. Simula Research Laboratory, Technical Report 2003Y04.
Aserinsky, E., and Kleitman, N. 1953. Regularly occurring periods of eye mobility and concomitant phenomena
during sleep. Science 118: 273Y374.
COLLECTING FEEDBACK DURING SOFTWARE ENGINEERING EXPERIMENTS 143

Basili, V. R., Shull, F., and Lanubile, F. 1999. Building knowledge through families of experiments. IEEE
Transactions on Software Engineering 25(4): JulyYAug., 456Y473.
Bernard, H., Killorth, P., and Sailer, L. 1982. Informant accurracy in social-network data. An experimental
attempt to predict actual communication from recall data. Social Science Research 11: 30Y36.
Berry, D. C., and Broadbent, D. E. 1990. The role of instruction and verbalization in improving performance on
complex search tasks. Behaviour and Information Technology 9(3): MayYJune, 175Y190.
Boren, M. T., and Ramey, J. 2000. Thinking-aloud: Reconciling theory and practice. IEEE Transactions on
Professional Communication 43(3): September, 261Y278.
Campbell, D. T., and Stanley, J. C. 1963. Experimental and Quasi-Experimental Designs for Research. Boston,
MA, USA: Houghton Mifflin Company.
Chen, H., and Nilan, M. 1998. An exploration of web users’ internal experience: Application of the experience
sampling method to the web environment. WebNet 98 World Conference. Orlando, Florida.
Conrath, D. W., Higgins, C. A., and McClean, R. J. 1983. A comparison of questionnaire versus diary data.
Social Networks 5: 315Y322.
Davidson, G. V., Shorter, L., Crum, A., and Lane, J. 1996. Children’s use of learning strategies and decision
making in hypertext computer lesson. ED MEDIA 96, Conference on Educational Multimedia and
Hypermedia. Assoc. Adv. Comp. Educ., Charlottesville, VA, USA.
Denning, S., Hoiem, D., Simpson, M., and Sullivan, K. 1990. The value of thinking-aloud protocols in industry:
A case study of microsoft. Proceedings of the Human Factors SocietyY34th Annual Meeting. Santa Monica,
1285Y1289.
Ericsson, K. A. 2003. Valid and non-reactive verbalisation of thoughts. In Preparation.
Ericsson, K. A., and Simon, H. A. 1993. Protocol Analysis: Verbal Reports as Data. Cambridge,
Massachusetts: The MIT Press.
Ericsson, K. A., and Simon, H. A. 1998. How to study thinking in everyday life: Contrasting think-aloud
protocols with descriptions and explanations of thinking. Mind, Culture and Activity 5(3): 178Y186.
Evans, H., Atkinson, M., Brown, M., Cargill, J., Crease, M., Draper, S., Gray, P., and Thomas, R. 2003. The
pervasiveness of evolution in GRUMPS software. Software-Practice & Experience 33(2): 99Y120.
Freund, R. J., and Wilson, W. J. 1998. Regression Analysis: Statistical Modeling of a Response Variable.
Academic Press.
Garner, R. 1988. Verbal-report data on cognitive and metacognitive strategies. In: Weinstein C. E. et al., (eds),
Learning and Study Strategies: Issues in Assessment, Instruction, and Evaluation. San Diego, CA: Academic
Press, Inc., pp. 63Y100.
Genest, M., and Turk, D. C. (1981). Think-aloud approaches to cognitive assessment. In Merluzzi, C. R. et al.
(eds.), Cognitive Assessment. Guilford Press, New York, pp. 223Y269.
Haak, M. J., and Jong, D. T. M. 2003. Exploring two methods of usability testing: Concurrent versus
retrospective think-aloud protocols. IEEE Computer Society 285Y287.
Hurlburt, R. T. 1979. Random sampling of cognitions and behaviour. Journal of Research in Personality 13:
103Y111.
Ivory, M. I., and Hearst, M. A. 2001. The state of the art in automating usability evaluation of user interfaces.
ACM Computing Surveys 33(4): 470Y516.
Jungk, A., Thull, B., Hoeft, A., and Rau, G. 2000. Evaluation of two new ecological interface approaches for
the anesthesia workplace. Journal of Clinical Monitoring and Computing 16(4): 243Y258.
Karahasanovic, A. 2000. SEMTVA tool for finding impacts of schema changes. NWPER’2000 Nordic
Workshop on Programming Environment Research. Lillehammer, Norway, pp. 60Y75.
Karahasanovic, A. 2002. Supporting Application Consistency in Evolving Object-Oriented Systems by Impacts
Analysis and Visualisation, Ph.D. Thesis, Faculty of Mathematics and Natural Science, University of Oslo,
Unipub, ISSN 1501Y7710, Nr. 234.
Karahasanovic, A., and Sjøberg, D. I. K. 2001. Visualising impacts of database schema changesVA controlled
experiment. 2001 IEEE Symposium on Visual/Multimedia Approaches to Programming and Software
Engineering. Stresa, Italy: IEEE Computer Society, 358Y365.
Karahasanovic, A., and Sjøberg, D. I. K. 2002. Visualising impacts of change in evolving object-oriented
systems: An explorative study. International Workshop on Graph-Based Tools GraBaTs’02. Barcelona,
Spain, pp. 22Y31.
144 KARAHASANOVIC ET AL.

Karahasanovic, A., Sjøberg, D. I. K., and Jørgensen, M. 2001. Data collection in software engineering
experiments. Information Resources Management Association International Conference, Soft. Eng. Track.
Toronto, Ontario, Canada, pp. 1027Y1028.
Larson, R., and Csikszentmihalyi, M. 1983. The experience sampling method. In R. H. T. (ed.), Naturalistic
Approaches to Studying Social Interaction. Jossey-Bass, San Francisco, pp. 42Y56.
Nathan, M. J. 1991. A simple learning environment improves mathematical reasoning. Intelligent Tutoring
Media 2(3Y4): 101Y111.
Nielsen, J. 1993. Usability Engineering. AP Professional.
Patel, V. L., Arocha, J. F., Diermeier, M., How, J., and Mottur-Pilson, C. 2001. Cognitive psychological studies
of representation and use of clinical practice guidelines. International Journal of Medical Informatics 63(3):
147Y167.
Sanderson, P. M. 1990. Verbal protocol analysis in three experimental domains using SHAPA. Proceedings of
the Human Factors Society, 34th Annual Meeting. Santa Monica, CA, pp. 1280Y1284.
Seaman, C. 1999. Qualitative methods in empirical studies of software engineering. IEEE Transactions on
software Engineering 25(4): July/August, 557Y572.
Singer, J., and Vinson, N. 2001. Why and how research ethics matters to you. Yes, you! Empirical Software
Engineering 6: 287Y290.
von Mayrhauser, A., and Lang, S. 1999. A coding scheme to support systematic analysis of software
comprehension. IEEE Transactions Software Engineering 25(4): 526Y540.
Vygotsky, L. S. 1994. Thought and Language. Cambridge, MA: MIT Press.
Welland R., Sjøberg D., and Atkinson, M. 1997. Empirical analysis based on automatic tool logging. Empirical
Assessment & Evaluation in Software Engineering (EASE97). Keele, UK.
Wohlin, C., Runeson, P., Host, M., Ohlsson, M. C., Regnell, B., and Wesslen, A. 1999. Experimentation in
Software EngineeringVAn Introduction. Boston: Kluwer Academic Publishers.
Wright, R. B., and Converse, S. A. 1992. Method bias and concurrent verbal protocol in software usability
testing. Proc Human Factors Society 36th Annual Meeting. Atlanta, Georgia, pp. 1220Y1224.
Yin, R. K. 1994. Case Study Research. Thousand Oaks, California: SAGE Publications.
Amela Karahasanovic received her M.Sc. degree in computer science from the University of Sarajevo in 1989
and Ph.D. degree in computer science from the University of Oslo in 2002. She has nine years industry
experience in Bosnia and Herzegovina and Norway as system developer and project manager. She is now a
postdoctoral fellow at Simula Research Laboratory and an associate professor in the Department of Informatics
at the University of Oslo. Her research interests include research methods in empirical software engineering,
visual languages, software comprehension and object-oriented analysis and design.
COLLECTING FEEDBACK DURING SOFTWARE ENGINEERING EXPERIMENTS 145

Bente Anda received an M.Sc. degree in informatics in 1991 and a Ph.D. degree in informatics in 2003, both
from the University of Oslo. She has worked three years as lecturer at The Norwegian School of Information
Technology (NITH) and four years as consultant and project manager in IBM. She now works as research
scientist at Simula Research Laboratory and associate professor in the Department of Informatics, University of
Oslo. Her research interests include empirical evaluation of methods for object-oriented analysis and design,
use case based estimation of software development effort and software process improvement.
Erik Arisholm received the M.Sc. degree in electrical engineering from the University of Toronto and the
Ph.D. degree in computer science from the University of Oslo. He has seven years industry experience in
Canada and Norway as a lead engineer and design manager. He is now a researcher in the Department of
Software Engineering at the Simula Research Laboratory and an associate professor in the Department of
Informatics at the University of Oslo. His main research interests are object-oriented design principles and
methods, static and dynamic metrics for object-oriented systems, and methods and tools for conducting
controlled experiments in software engineering. He is a member of the IEEE and IEEE Computer Society.
Siw Elisabeth Hove received her M.Sc. in computer science from the University of Oslo in 2003. She is a
research assistant at Simula Research Laboratory. Her research interests are within analysis of qualitative data
in software engineering studies.
146 KARAHASANOVIC ET AL.

Magne Jørgensen received the Diplom Ingeneur degree in Wirtschaftswissenschaften from the University of
Karlsruhe, Germany, in 1988 and the Dr. Scient. degree in informatics from the University of Oslo, Norway in
1994. He has about 10 years industry experience as software developer, project leader and manager. He is now
professor in software engineering at University of Oslo and member of the software engineering research group
of Simula Research Laboratory in Oslo, Norway.
Dag I.K. Sjøberg received the M.Sc. degree in computer science from the University of Oslo in 1987 and Ph.D.
degree in computing science from the University of Glasgow in 1993. He has five years industry experience as
consultant and group leader. He is now the research manager of the Department of Software Engineering at the
Simula Research Laboratory and a professor of software engineering in the Department of Informatics at the
University of Oslo. Among his research interests are research methods in empirical software engineering,
software process improvement, software effort estimation, and object-oriented analysis and design. He is a
member of the IEEE and IEEE Computer Society.
Ray Welland is Professor of Software Engineering in the Department of Computing Science at the University
of Glasgow, Scotland. He was Head of Department (Chairman) from 1996 to 2003. His research interests
include: software engineering environments, meta-CASE tools, empirical software engineering, web
engineering and cultural heritage computing. He has collaborated with Dag Sjøberg for more than ten years
and is a regular visitor to the Simula Research Laboratory in Oslo.
COLLECTING FEEDBACK DURING SOFTWARE ENGINEERING EXPERIMENTS 147