HAPTIC INTERFACE CONTROL DESIGN FOR PERFORMANCE AND STABILITY ROBUSTNESS

PLEASE SCROLL DOWN FOR ARTICLE
This article was downloaded by: [UT University of Technology Delft]On: 22 October 2008Access details: Access Details: [subscription number 789195178]Publisher Taylor & FrancisInforma Ltd Registered in England and Wales Registered Number: 1072954 Registered office: Mortimer House,37-41 Mortimer Street, London W1T 3JH, UK
ErgonomicsPublication details, including instructions for authors and subscription information:http://www.informaworld.com/smpp/title~content=t713701117
Haptic gas pedal feedbackM. Mulder a; M. Mulder a; M. M. van Paassen a; D. A. Abbink b
a Department of Aerospace Engineering, Delft University of Technology, Delft, The Netherlands b Departmentof Mechanical Engineering, Delft University of Technology, Delft, The Netherlands
Online Publication Date: 01 November 2008
To cite this Article Mulder, M., Mulder, M., van Paassen, M. M. and Abbink, D. A.(2008)'Haptic gas pedalfeedback',Ergonomics,51:11,1710 — 1720
To link to this Article: DOI: 10.1080/00140130802331583
URL: http://dx.doi.org/10.1080/00140130802331583
Full terms and conditions of use: http://www.informaworld.com/terms-and-conditions-of-access.pdf
This article may be used for research, teaching and private study purposes. Any substantial orsystematic reproduction, re-distribution, re-selling, loan or sub-licensing, systematic supply ordistribution in any form to anyone is expressly forbidden.
The publisher does not give any warranty express or implied or make any representation that the contentswill be complete or accurate or up to date. The accuracy of any instructions, formulae and drug dosesshould be independently verified with primary sources. The publisher shall not be liable for any loss,actions, claims, proceedings, demand or costs or damages whatsoever or howsoever caused arising directlyor indirectly in connection with or arising out of the use of this material.

Haptic gas pedal feedback
M. Muldera*, M. Muldera, M.M. Van Paassena and D.A. Abbinkb
aDepartment of Aerospace Engineering, Delft University of Technology, Delft, The Netherlands;bDepartment of Mechanical Engineering, Delft University of Technology, Delft, The Netherlands
Active driver support systems either automate a control task or present warnings todrivers when their safety is seriously degraded. In a novel approach, utilising neitherautomation nor discrete warnings, a haptic gas pedal (accelerator) interface wasdeveloped that continuously presents car-following support information, keeping thedriver in the loop. This interface was tested in a fixed-base driving simulator. Twenty-one drivers between the ages of 24 and 30 years participated in a driving experiment toinvestigate the effects of haptic gas pedal feedback on car-following behaviour. Resultsof the experiment indicate that when haptic feedback was presented to the drivers, someimprovement in car-following performance was achieved, while control activitydecreased. Further research is needed to investigate the effectiveness of the system inmore varied driving conditions. Haptics is an under-used modality in the application ofhuman support interfaces, which usually draw on vision or hearing. This studydemonstrates how haptics can be used to create an effective driver support interface.
Keywords: haptic feedback; car-following; driver support; human–machine systems;driving simulator
1. Introduction
Most of the active driver support systems available today can be labelled as what Goodrich
and Boer (2000) call task automation: safely promoting comfort. By automating routine
skills that were previously required of drivers, for example, speed regulation and car-
following with advanced cruise control (ACC), driving is made easier without compromis-
ing safety. More recent support systems are focusing on what Goodrich and Boer (2000)
call response automation: comfortably promoting safety. This type of automation informs
drivers when their safe-field-of-travel is degrading seriously, urging them to take
appropriate action to restore this situation to an acceptable level of safety. For example,
lane departure warning systems warn drivers that they are deviating dangerously from their
current lane, urging them to make corrective actions toward the lane centre.
The limited set of operational circumstances of task automation and the, usually,
discrete on/off nature of the currently available response automation systems pose prob-
lems for the effectiveness of these systems in enhancing safety. When operational con-
straints of task automation are not clear or are not easily identifiable, driver performance
might actually become worse in the most critical situations. Rudin-Brown and Parker
(2004), for example, found that, compared to unassisted driving, drivers using ACC took
*Corresponding author. Email: [email protected]
Ergonomics
Vol. 51, No. 11, November 2008, 1710–1720
ISSN 0014-0139 print/ISSN 1366-5847 online
� 2008 Taylor & Francis
DOI: 10.1080/00140130802331583
http://www.informaworld.com
Downloaded By: [UT University of Technology Delft] At: 14:10 22 October 2008
longer to react to the lead vehicle’s brake lights, that is, when ACC’s braking authority
limits were reached and drivers had to take over longitudinal control of the vehicle.
A fundamental problem with discrete warning systems is the need to balance false
alarm rates and missed detections. Because of the severe consequences of a missed
detection, it is important that their number is near-zero. Dingus et al. (1997) show that, in
a simple calculation based on an estimated average driver involvement in a car crash of
once every five years and one out of five car crashes of a rear-end collision, drivers will,
theoretically, be involved in a rear-end crash only once every 25 years. This indicates that
true warnings rarely occur. To minimise the chance of a missed detection, however, the
frequency of false alarms and unnecessary alarms will be relatively high. Lees and Lee
(2007) point out that unnecessary alarms can foster driver trust and compliance to
subsequent warnings because they can help drivers understand how the warning system
works. False alarms fail in this respect, removing the possibilities for drivers to familiarise
themselves with the system. Without familiarisation, drivers might not be able to respond
as quickly and as appropriately to warnings as was intended in the design.
To overcome the potential negative human factors aspects that come with discrete
warning systems, while not constraining a support system to a limited set of operational
circumstances as with most task automation systems, a haptic gas-pedal interface was
investigated that displays car-following support information continuously. The motivation
for using haptic feedback was that it would allow drivers to virtually ‘touch’ their
environment through the haptic interface. Like obtaining visual information from the
driving scene by continuously scanning the road and other road users, the haptic
information would easily be available as an integral part of the control task of driving an
automobile.
Haptic gas-pedal feedback to support drivers in their driving tasks has been applied
before to speed control tasks, collision avoidance tasks and also car-following. Godthelp
and Schumann (1993) investigated an active gas pedal (accelerator) to support speed
control. The speed error relative to a normative speed limit was related to constant
counterforce on the gas pedal. They found that the haptic display yielded the lowest speed
error compared with alternative displays. Hjalmdahl et al. (2002) indicated that variance in
speed decreased and compliance with speed limits improved with their haptic gas pedal for
speed control. Verwey et al. (1993) also described a haptic gas-pedal collision avoidance
system that increased the force on the gas pedal with 25 N when – and for as long as – the
activation criterion was above a pre-determined threshold value. The haptic gas pedal with
a 4 s time-to-contact (TTC) activation criterion resulted in the largest decrease in
following separation and the least increase in driving speed and time spent in the left lane
(less overtaking). Continental Temic announced the launch of an Active Distance Support
system at the end of 2005. This system would provide a counterforce on the gas pedal
when the lead vehicle was getting too close. The force feedback pedal was also said to be
active when ACC is engaged so that drivers receive feedback on the controller activity
(Continental 2004).
In the haptic gas-pedal design for car-following support, haptic information of the
safe-field-of-travel boundaries provides them, first of all, with a complementary channel,
besides vision, to determine these boundaries. Second, continuous haptic presentation of
the boundaries enables continuous haptic perception of these boundaries. Third, by
presenting the haptic information through the gas pedal, a direct connection is created
between stimulus and response, that is, longitudinal control information is presented
through the longitudinal control channel in such a way that the stimulus is compatible
with the required response (Sheridan and Ferrell 1974, Wickens 1992).
Ergonomics 1711
Downloaded By: [UT University of Technology Delft] At: 14:10 22 October 2008

Drivers can adjust their foot admittance, that is, their willingness to yield to forces,
depending on the task they are executing (Abbink et al. 2004). A normal, passive gas pedal
requires drivers to execute a position task (maintaining a constant position of the gas
pedal). Even during car-following, when drivers are not necessarily trying to maintain a
desired speed but rather a desired separation with the lead vehicle, gas pedal control
reduces the separation control task to a position control task of the gas pedal. Although
the driving task remains the same during car-following with haptic feedback (maintaining
inter-vehicle separation), the interpretation of the control task of the gas pedal may change
from a position task to a force task (maintaining a constant force on the gas pedal, by
yielding to force changes) by proper design of the haptic feedback logic.
The main objective of this study was to investigate the influence of haptic gas pedal
feedback on driver control behaviour during car-following. To this end, a car-following
experiment was conducted in a fixed-base driving simulator, in which drivers experienced
force feedback, stiffness feedback and no feedback (the baseline condition).
When using the haptic gas pedal, drivers were expected to adopt a force task strategy
to benefit from the provided haptic feedback. Based on the richer feedback content of
stiffness feedback, the force task strategy was furthermore expected to be more apparent
with stiffness feedback than with force feedback. If drivers adopted a force task, the
standard deviation of the measured pedal forces of the force feedback and stiffness
feedback conditions was expected to be significantly smaller than those of the condition
without haptic feedback.
Since the haptic feedback informed drivers of separation changes with the lead vehicle
through a complementary sensory modality, it was likely that the perceptibility of these
changes would increase. Both haptic feedback systems were expected, therefore, to yield
similar or better car-following performance compared to the baseline condition without
haptic feedback.
The stimulus-response compatibility of the haptic feedback signals with the desired
control action for maintaining a desired separation with a lead vehicle was expected to
increase the control sensitivity of drivers, leading to more efficient control activity.
2. Method
2.1. Experiment design
A repeated measures, between-subjects design was used, in which one independent
variable, S, was tested: no haptic feedback (Snone); force feedback (Sforce); or stiffness
feedback (Sstiffness).
During car-following, the lead vehicle speed of 100 km/h was disturbed with a crested,
stochastic sum of sinusoids with a maximum amplitude Ad of 10 km/h and a maximum
bandwidth fd of 0.5 Hz. This signal manifested itself to the participants as an
unpredictable lead vehicle speed disturbance.
In total, 20 intervals of 1 min driving were recorded for each participant, thus yielding
20 repetitions of the same driving condition per driver. To be able to detect any pairwise
difference in means in the dependent measures of at least 1 SD unit, with probability 0.90,
using Scheffe’s multiple comparison procedure with a ¼ 0.05, an estimated minimum
sample size of 26 per tested condition would be necessary (Pearson and Hartley 1951,
Levin 1975). With 20 repetitions per subject, the sample size obtained in this experiment
was assumed to be sufficient to be representative for the particular condition
(at least 120 samples per condition). Total driving time per participant was approximately
30 min.
1712 M. Mulder et al.
Downloaded By: [UT University of Technology Delft] At: 14:10 22 October 2008

2.1.1. Dependent measures
Car-following performance, control activity and physical workload were the main
parameters of interest for this study. In order to determine car-following performance,
time headway (THW) and the inverse of time-to-contact, iTTC, were recorded
(Brackstone and McDonald 2007). THW can be interpreted as an estimate of the safety
margin, or safe-field-of-travel, drivers adopt during car-following (Boer 1999), since it
represents the maximum amount of time drivers have to react to a deceleration of the lead
vehicle (van Winsum and Heino 1996, Taieb-Maimon and Shinar 2001). Boer (1999)
characterises TTC as the amount of time drivers have to ‘intervene by employing a suitable
skill to avoid an impending crash’. THW and iTTC express car-following performance,
therefore, in terms of how well drivers can maintain their safe-field-of-travel, which is
directly related to what the haptic feedback system is intended to communicate. THW and
iTTC are defined as in Equations (1) and (2).
THW ¼xrel
vcarð1Þ
iTTC ¼�vrel
xrelð2Þ
with xrel, vrel, and vcar representing the relative distance, relative velocity and own car speed
respectively.
For control activity, the gas pedal position ap was measured. Mean and standard
deviation were determined off-line.
During car following, the fluctuations of the pedal force due to the haptic feedback
forces will be relatively small compared to the static component of the pedal force, that is,
the minimum force drivers have to exert on the gas pedal to depress the pedal to the
desired ap. The mean pedal depression force Fp – as an estimate of the average static
component of the pedal force – is, therefore, the biggest contributor to physical load. Since
there was no electromyography (EMG) equipment available during the experiment, it was
not possible to determine actual workload for each subject individually, as this depends on
the amount of muscle (co-)contraction. Instead, the mean Fp was used as an indicator of
the physical load.
2.2. Participants
A total of 21 participants between the ages of 24 and 30 years (mean age 26 + 1.9; two
females and 19 males) participated voluntarily in the experiment. Six subjects (one female;
five males) were given the baseline condition without the haptic feedback system (Snone); eight
subjects (all male) were given the force feedback system (Sforce); and seven subjects (one
female; six males) were given the stiffness feedback system to drive with (Sstiffness). All subjects
had a valid driver’s licence and an average driving experience of 7 + 2.2 years, driving on
average three short trips per week. None of the participants was visually or otherwise
physically impaired such that it could influence their driving performance in the simulator.
2.3. Apparatus
The experiment was conducted in a fixed-base driving simulator (see Figure 1a) equipped
with an actuated gas pedal (see Figure 1b) capable of delivering the force and stiffness
Ergonomics 1713
Downloaded By: [UT University of Technology Delft] At: 14:10 22 October 2008

feedback as determined by the haptic feedback logic (see Mulder 2007, for details on
the implementation). The brake pedal and steering wheel were passive, as in a normal car.
The simulated vehicle was a heavy, but powerful vehicle with automatic transmission. The
driving scene was projected on the laboratory wall at a distance of 2.9 m from the driver-
eye reference point. The dimensions of the projected driving scene were 3.3 m 6 2.1 m,
resulting in a 608 horizontal and 408 vertical field-of-view. The graphical resolution of this
projection was 1280 6 1024 pixels. Engine sounds, tyre rumble and wind sounds were
audible from a surround sound system.
An in-vehicle sensor system was simulated, capable of providing distance and speed
information of leading vehicles (see, for example, Gandhi and Trivedi 2006 for a novel
environment detection and mapping technique as well as a comprehensive literature survey
of existing environment sensing systems). This information, together with the speed of own
vehicle, was used as input to the control logic that determines the haptic feedback cues that
are to be presented to the driver. Data acquisition was done at 50 Hz.
2.4. Procedure
Prior to the experiment, drivers were given a written task instruction. They were asked to
follow the lead vehicle at a prescribed separation of 1.5 s THW, a slightly higher than
average THW as measured, for example, by Piao and McDonald (2003) on motorways in
Europe. To help drivers drive at the required THW separation, a partially translucent
rectangle, or THW-indicator, was shown at an exact THW of 1.5 s for 10 s before data
recording started. When the rear bumper of the lead vehicle touched the THW-indicator,
the separation between own vehicle and the lead vehicle was exactly 1.5 s. After the
THW-indicator disappeared, data were recorded for the next 60 s, after which the
THW-indicator appeared again. This visual ‘calibration’ method was applied to avoid
cumulative drift in inter-vehicle separation between repeated measures during the
experiment. Cumulative drift in THW would make comparison of data between drivers
and even within drivers much more difficult or would require considerably longer periods
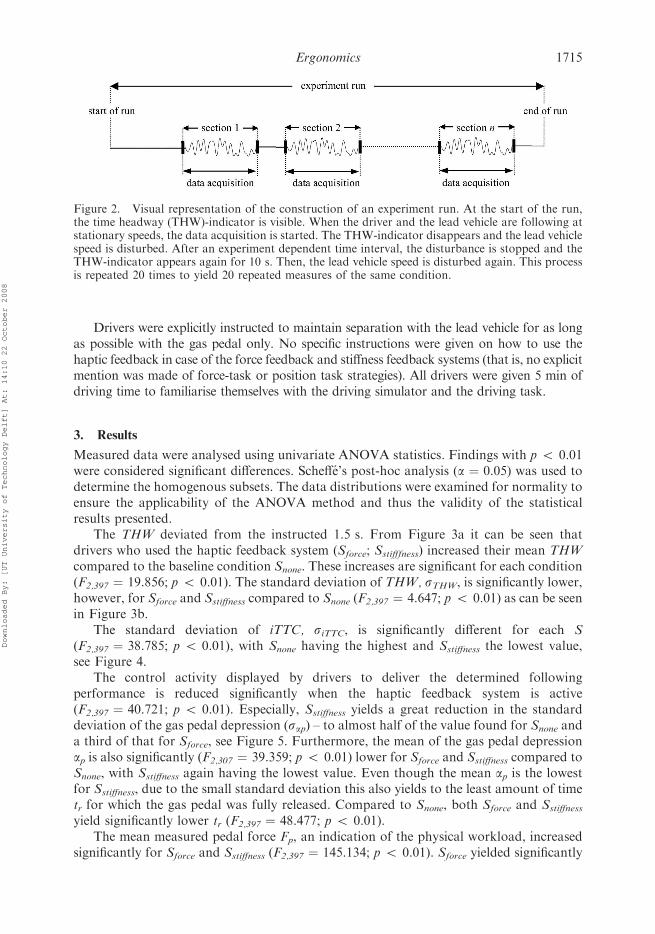
of driving per participant. In Figure 2, the general idea of the repeated measurements and
the THW calibration is visualised.
Figure 1. Photo of the fixed base driving simulator setup (a) and details of the actuated gaspedal (b).
1714 M. Mulder et al.
Downloaded By: [UT University of Technology Delft] At: 14:10 22 October 2008
Drivers were explicitly instructed to maintain separation with the lead vehicle for as long
as possible with the gas pedal only. No specific instructions were given on how to use the
haptic feedback in case of the force feedback and stiffness feedback systems (that is, no explicit
mention was made of force-task or position task strategies). All drivers were given 5 min of
driving time to familiarise themselves with the driving simulator and the driving task.
3. Results
Measured data were analysed using univariate ANOVA statistics. Findings with p 5 0.01
were considered significant differences. Scheffe’s post-hoc analysis (a ¼ 0.05) was used to
determine the homogenous subsets. The data distributions were examined for normality to
ensure the applicability of the ANOVA method and thus the validity of the statistical
results presented.
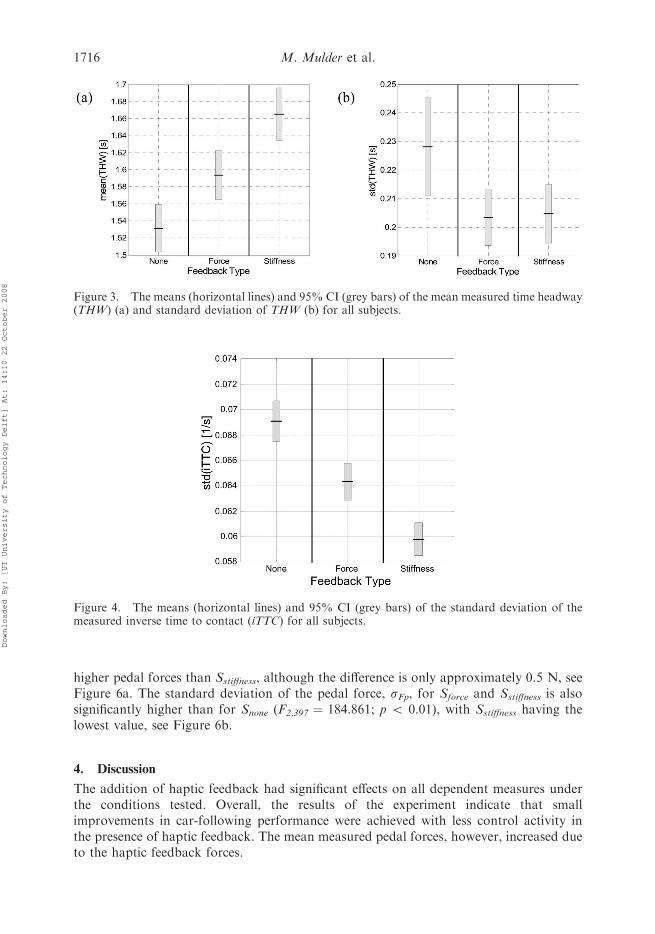
The THW deviated from the instructed 1.5 s. From Figure 3a it can be seen that
drivers who used the haptic feedback system (Sforce; Sstifffness) increased their mean THW
compared to the baseline condition Snone. These increases are significant for each condition
(F2,397 ¼ 19.856; p 5 0.01). The standard deviation of THW, sTHW, is significantly lower,
however, for Sforce and Sstiffness compared to Snone (F2,397 ¼ 4.647; p 5 0.01) as can be seen
in Figure 3b.
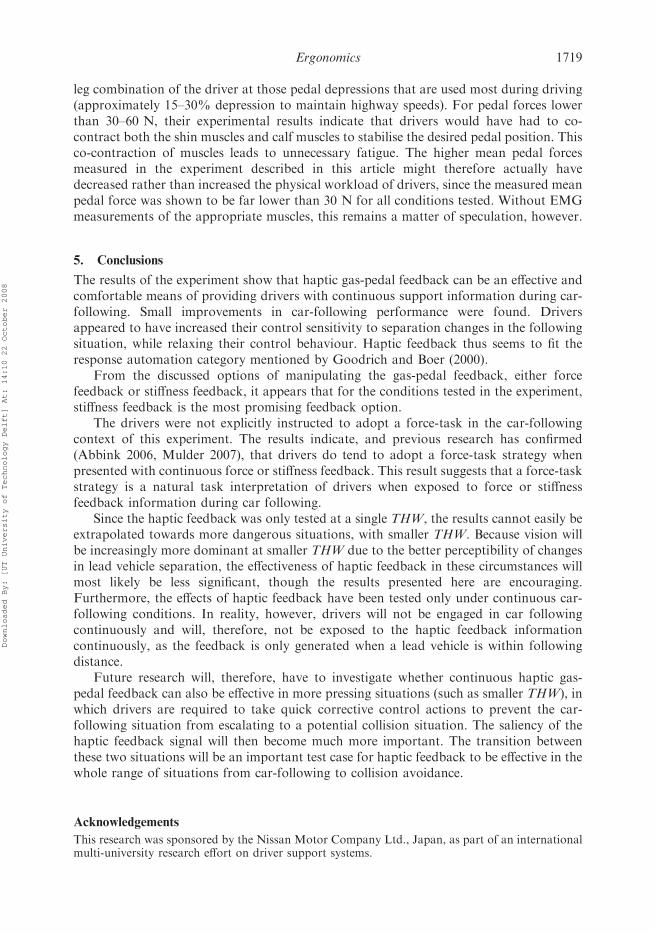
The standard deviation of iTTC, siTTC, is significantly different for each S
(F2,397 ¼ 38.785; p 5 0.01), with Snone having the highest and Sstiffness the lowest value,
see Figure 4.
The control activity displayed by drivers to deliver the determined following
performance is reduced significantly when the haptic feedback system is active
(F2,397 ¼ 40.721; p 5 0.01). Especially, Sstiffness yields a great reduction in the standard
deviation of the gas pedal depression (sap) – to almost half of the value found for Snone and
a third of that for Sforce, see Figure 5. Furthermore, the mean of the gas pedal depression
ap is also significantly (F2,307 ¼ 39.359; p 5 0.01) lower for Sforce and Sstiffness compared to
Snone, with Sstiffness again having the lowest value. Even though the mean ap is the lowest
for Sstiffness, due to the small standard deviation this also yields to the least amount of time
tr for which the gas pedal was fully released. Compared to Snone, both Sforce and Sstiffness
yield significantly lower tr (F2,397 ¼ 48.477; p 5 0.01).
The mean measured pedal force Fp, an indication of the physical workload, increased
significantly for Sforce and Sstiffness (F2,397 ¼ 145.134; p 5 0.01). Sforce yielded significantly
Figure 2. Visual representation of the construction of an experiment run. At the start of the run,the time headway (THW)-indicator is visible. When the driver and the lead vehicle are following atstationary speeds, the data acquisition is started. The THW-indicator disappears and the lead vehiclespeed is disturbed. After an experiment dependent time interval, the disturbance is stopped and theTHW-indicator appears again for 10 s. Then, the lead vehicle speed is disturbed again. This processis repeated 20 times to yield 20 repeated measures of the same condition.
Ergonomics 1715
Downloaded By: [UT University of Technology Delft] At: 14:10 22 October 2008
higher pedal forces than Sstiffness, although the difference is only approximately 0.5 N, see
Figure 6a. The standard deviation of the pedal force, sFp, for Sforce and Sstiffness is also
significantly higher than for Snone (F2,397 ¼ 184.861; p 5 0.01), with Sstiffness having the
lowest value, see Figure 6b.
4. Discussion
The addition of haptic feedback had significant effects on all dependent measures under
the conditions tested. Overall, the results of the experiment indicate that small
improvements in car-following performance were achieved with less control activity in
the presence of haptic feedback. The mean measured pedal forces, however, increased due
to the haptic feedback forces.
Figure 3. The means (horizontal lines) and 95% CI (grey bars) of the mean measured time headway(THW) (a) and standard deviation of THW (b) for all subjects.
Figure 4. The means (horizontal lines) and 95% CI (grey bars) of the standard deviation of themeasured inverse time to contact (iTTC) for all subjects.
1716 M. Mulder et al.
Downloaded By: [UT University of Technology Delft] At: 14:10 22 October 2008

Despite the fact that drivers drove significantly further from the THW than they were
asked to drive (1.5 s) for Sforce and Sstiffness, the standard deviations of THW and iTTC
remained lower than for Snone. With the higher mean THW, the visual effects of changes in
lead vehicle separation would have been less salient. One may expect that this leads to an
increase in sTHW, since reaction to THW differences becomes more difficult. This
decreased visual saliency, however, is more than offset by the haptic feedback. In these
conditions, a lower sTHW was found, meaning a more accurate tracking of the lead vehicle.
It must be noted here, though, that these simulator results yield sTHW’s approximately 0.1–
0.2 s smaller than measured (for all S), for example, on highways in Europe by Piao and
McDonald (2003), even though their corresponding measured average THW is
approximately 0.5–0.6 s lower than in the driving simulator (for all S). Thus, the driving
simulator environment and/or task already seems to have an increased perceptibility of the
changes in THW. This increase in perceptibility of the changes in THW in the simulator
Figure 5. Mean measured gas pedal position, ap, vs. standard deviation of ap. Bubble size indicatesthe percentage, tr, of the total experiment time the gas pedal was released completely.
Figure 6. The means (horizontal lines) and 95% CI (grey bars) of the mean measured pedal force,Fp (a) and the standard deviation of Fp (b) for all subjects.
Ergonomics 1717
Downloaded By: [UT University of Technology Delft] At: 14:10 22 October 2008

environment might be caused by the experiment conditions, which required of the drivers
mainly to focus on the car-following task. In real-life driving situations, drivers will not be
focused on car following alone.
More pronounced effects are found for the control activity. With haptic feedback,
drivers displayed far less control activity than without haptic feedback. Especially, Sstiffness
yielded very low control activity compared to Sforce and Snone. Thus, drivers seem to be
controlling their vehicle in a much more relaxed manner without, however, sacrificing
following performance. This also leads to less time during which the pedal is not
depressed, resulting in longer periods of time during which they can benefit from the
information that is provided haptically. In addition, the standard deviation of the
measured pedal force was also lowest for Sstiffness. The combination of low control activity
and low variation in measured pedal forces is especially salient in Sstiffness. These results are
in accordance with the results of neuromuscular measurements of the foot while
controlling a gas pedal as presented by Abbink (2006). Those results show that the
presence of haptic gas-pedal feedback during car following increases the ankle–foot
admittance (that is, the causal relationship between position and force). A larger
admittance means that drivers gave way to the feedback forces more (adopting a force
task), instead of resisting them (adopting a position task). It appears that drivers adopted
a force task strategy in controlling the gas pedal when receiving haptic feedback. The force
task strategy is more salient for Sstiffness.
The benefit of a force-task strategy is found in the increased admittance, which
inherently increases the influence of the feedback forces on the pedal deviations. The
increased admittance is partly realised by increased reflexive muscle activity, which allows
for much faster reactions to changing forces (de Vlugt et al. 2002, Abbink et al. 2004), and
thus to changes in the car-following situation. Note that drivers can choose to change their
admittance: if they do not agree with the feedback forces, they can easily resist them.
Adopting a force-task strategy in controlling the gas pedal is possible only when there is a
continuous presentation of feedback forces, unlike binary types of haptic feedback such as
force pulses or vibrations. Furthermore, the continuous exposure to the feedback forces
increases driver familiarity with the system and explicitly communicates that the system is
operational, thereby implicitly announcing the boundaries of the safe-field-of-travel.
The substantial reductions in control activity indicate that the most beneficial effect of
the tested haptic feedback systems seems to be increased driver control comfort during car
following. Some caution should be exercised in ascribing these results entirely to the
presence of haptic feedback. The absence of motion in the driving simulator, and hence the
absence of the comfort-decreasing effect of fluctuating accelerations, has most likely
influenced the results. In a moving-base simulator or in a real car, the difference in control
activity for Snone and Sforce and Sstiffness is expected to be smaller. Rockwell (1972) indicates
that humans can sense as little as +0.01 g of vehicle acceleration. This is well below the
accelerations drivers would have experienced (in the order of +0.04 g) had the simulator
been able to provide motion. Because the vehicle dynamics filtered out most effects of the
high frequency inputs from the gas pedal, drivers would, with motion cues, have been able
to notice the ineffectiveness of their high frequency control actions better and thus have
less high-frequency control variation in the Snone configuration, making the differences
between this condition and the Sforce and Sstiffness conditions smaller.
The measured mean pedal forces were found to be higher for the haptic feedback
conditions, indicating that the physical workload might have been higher with haptic
feedback. Abbink (2006), however, shows that, energy-wise, it is favourable to have a
static component of the pedal force that is at least as high as the exerted force of the foot/
1718 M. Mulder et al.
Downloaded By: [UT University of Technology Delft] At: 14:10 22 October 2008
leg combination of the driver at those pedal depressions that are used most during driving
(approximately 15–30% depression to maintain highway speeds). For pedal forces lower
than 30–60 N, their experimental results indicate that drivers would have had to co-
contract both the shin muscles and calf muscles to stabilise the desired pedal position. This
co-contraction of muscles leads to unnecessary fatigue. The higher mean pedal forces
measured in the experiment described in this article might therefore actually have
decreased rather than increased the physical workload of drivers, since the measured mean
pedal force was shown to be far lower than 30 N for all conditions tested. Without EMG
measurements of the appropriate muscles, this remains a matter of speculation, however.
5. Conclusions
The results of the experiment show that haptic gas-pedal feedback can be an effective and
comfortable means of providing drivers with continuous support information during car-
following. Small improvements in car-following performance were found. Drivers
appeared to have increased their control sensitivity to separation changes in the following
situation, while relaxing their control behaviour. Haptic feedback thus seems to fit the
response automation category mentioned by Goodrich and Boer (2000).
From the discussed options of manipulating the gas-pedal feedback, either force
feedback or stiffness feedback, it appears that for the conditions tested in the experiment,
stiffness feedback is the most promising feedback option.
The drivers were not explicitly instructed to adopt a force-task in the car-following
context of this experiment. The results indicate, and previous research has confirmed
(Abbink 2006, Mulder 2007), that drivers do tend to adopt a force-task strategy when
presented with continuous force or stiffness feedback. This result suggests that a force-task
strategy is a natural task interpretation of drivers when exposed to force or stiffness
feedback information during car following.
Since the haptic feedback was only tested at a single THW, the results cannot easily be
extrapolated towards more dangerous situations, with smaller THW. Because vision will
be increasingly more dominant at smaller THW due to the better perceptibility of changes
in lead vehicle separation, the effectiveness of haptic feedback in these circumstances will
most likely be less significant, though the results presented here are encouraging.
Furthermore, the effects of haptic feedback have been tested only under continuous car-
following conditions. In reality, however, drivers will not be engaged in car following
continuously and will, therefore, not be exposed to the haptic feedback information
continuously, as the feedback is only generated when a lead vehicle is within following
distance.
Future research will, therefore, have to investigate whether continuous haptic gas-
pedal feedback can also be effective in more pressing situations (such as smaller THW), in
which drivers are required to take quick corrective control actions to prevent the car-
following situation from escalating to a potential collision situation. The saliency of the
haptic feedback signal will then become much more important. The transition between
these two situations will be an important test case for haptic feedback to be effective in the
whole range of situations from car-following to collision avoidance.
Acknowledgements
This research was sponsored by the Nissan Motor Company Ltd., Japan, as part of an internationalmulti-university research effort on driver support systems.
Ergonomics 1719
Downloaded By: [UT University of Technology Delft] At: 14:10 22 October 2008

References
Abbink, D.A., 2006. Neuromuscular analysis of haptic gas pedal feedback during car following. Thesis(PhD). Delft University of Technology.
Abbink, D.A., van der Helm, F.C.T., and Boer, E.R., 2004. Admittance measurements of the footduring ‘maintain position’ and ‘relax’ tasks on a gas pedal. In: Proceedings of the IEEEinternational conference on systems, man, and cybernetics, 10–13 October 2004, Den Haag,the Netherlands. 2519–2524.
Brackstone, M. and McDonald, M., 2007. Driver headway: how close is too close on a motorway?Ergonomics, 50, 1183–1195.
Boer, E.R., 1999. Car following from the driver’s perspective. Transportation Research – Part F:Traffic Psychology and Behaviour, 2, 201–206.
Continental, 2004. Active distance support: ACDIS [online]. Available from: http://www.conti-online.com/generator/www/de/en/cas/cas/themes/products/powertrain_and_chassis/chassis_control_systems/download/download_acdis_en.pdf [Accessed 27 March 2008].
de Vlugt, E., Schouten, A.C., and van der Helm, F.C.T., 2002. Adaptation of reflexive feedbackduring arm posture to different environments. Biological Cybernetics, 87, 10–26.
Dingus, T.A., et al., 1997. Human factors field evaluation of automotive headway maintenance/collision warning devices. Human Factors, 39, 216–229.
Gandhi, T. and Trivedi, M.M., 2006. Vehicle surround capture: survey of techniques and a novelomni-video-based approach for dynamic panoramic surround maps. IEEE Transactions onIntelligent Transportation Systems, 7, 293–308.
Godthelp, J. and Schumann, J., 1993. Intelligent accelerator: an element of driver support. In:A.M. Parks and S. Franzen, eds. Driving future vehicles. London: Taylor & Francis, 265–275.
Goodrich, M.A. and Boer, E.R., 2000. Designing human-centered automation: tradeoffs in collisionavoidance system design. IEEE Transactions on Intelligent Transportation Systems, 1, 40–54.
Hjalmdahl, M., Almqvist, S., and Varhelyi, A., 2002. Speed regulation by in-car active acceleratorpedal – effects on speed and speed distribution. IATSS Research, 26, 60–67.
Lees, M.N. and Lee, J.D., 2007. The influence of distraction and driving context on driver responseto imperfect collision warning systems. Ergonomics, 50, 1264–1286.
Levin, J.R., 1975. Determining sample size for planned and post hoc analysis of variancecomparisons. Journal of Educational Measurement, 12, 99–108.
Mulder, M., 2007. Haptic gas pedal feedback for active car-following support. Thesis (PhD). DelftUniversity of Technology.
Pearson, E.S. and Hartley, H.O., 1951. Charts of the power function for analysis of variance tests,derived from the non-central F-distribution. Biometrika, 38, 112–130.
Piao, J. and McDonald, M., 2003. Low speed car following behaviour from floating vehicle data. In:Proceedings of the IEEE intelligent vehicles symposium, 9–11 June 2003, Columbus, Ohio, USA.462–467.
Rockwell, T.H., 1972. Skills, judgment and information acquisition in driving. In: T.W. Forbes, ed.Human factors in highway traffic safety research. New York: Wiley-Interscience, 133–164.
Rudin-Brown, C.M. and Parker, H.A., 2004. Behavioural adaptation to adaptive cruise control(ACC): Implications for preventive strategies. Transportation Research Part F, 7, 59–76.
Sheridan, T.B. and Ferrell, W.R., 1974. Man-machine systems: Information, control, and decisionmodels of human performance. Cambridge, Massachusetts: MIT Press.
Taieb-Maimon, M. and Shinar, D., 2001. Minimum and comfortable driving headways: Realityversus perception. Human Factors, 43, 159–172.
van Winsum, W. and Heino, A., 1996. Choice of time-headway in car-following and the role of time-to-collision information in braking. Ergonomics, 39, 579–592.
Verwey, W.B., et al., 1993. GIDS functions. In: J.A. Michon, ed. Generic intelligent driver support.London: Taylor & Francis, 113–146.
Wickens, C.D., 1992. Engineering psychology and human performance. New York: HarperCollins.
1720 M. Mulder et al.
Downloaded By: [UT University of Technology Delft] At: 14:10 22 October 2008
Copyright © 2022 FDOKUMEN