critical experiments, measurements - NRC.gov
246
N UREG/CR-0825 BMI-2025 CRITICAL EXPERIMENTS, MEASUREMENTS AND ANALYSES TO ESTABLISH A CRACK ARREST METHODOLOGY FOR NUCLEAR PRESSURE VESSEL STEELS 4th Annual Report October 1977 - October 1978 G.T.Hahn P. C. Gehlen J. Lereim R. G. Hoagland A. J. Markworth D. R. Farmelo C. W. Marschall R.G.Jung C. Popelar M. F. Kanninen A. R. Rosenfield W. J. Zielenbach Battelle-Columbus Laboratories 2375 535 Prepared for U. S. Nuclear Regulatory Commission 7906180 719'
-
Upload
khangminh22 -
Category
Documents
-
view
4 -
download
0
Transcript of critical experiments, measurements - NRC.gov
N UREG/CR-0825BMI-2025
CRITICAL EXPERIMENTS, MEASUREMENTSAND ANALYSES TO ESTABLISH
A CRACK ARREST METHODOLOGY FORNUCLEAR PRESSURE VESSEL STEELS
4th Annual ReportOctober 1977 - October 1978
G.T.Hahn
P. C. Gehlen J. LereimR. G. Hoagland A. J. MarkworthD. R. Farmelo C. W. MarschallR.G.Jung C. PopelarM. F. Kanninen A. R. Rosenfield
W. J. ZielenbachBattelle-Columbus Laboratories
2375 535
Prepared forU. S. Nuclear Regulatory Commission
7906180 719'

llOTICE
This report was prepared as an account of work sponsored byan agency of the United States Government. lieither theUnited States Government nor any agency thereof, or any oftheir emp!cyces, makes any warranty, expressed or implied, orasst.mes any legal liability or responsibility for any third party'suse, cr the results of such use, of any information, apparatusproduct or process disclosed in this report, or represents thatits use by such third party would not intrin;e privately ownedrights.
'IlJ3,7/ -
2 34 3
,
%
Available fromNational Technical Information Service
Sprin9 ield, Virginia 22161.f

NUREG/CR-0825BMI 2025R5
CRITICAL EXPERIMENTS, MEASURFliENTS,AND ANALYSES TO ESTABLISil
A CRACK ARREST METil0DOLOGY FORNUCLEAR PRESSURE VESSEL STEELS
4th Annt.al Report
October 1977 - October 1978
G. T. llahnP. C. Gehlen A. J . Ma rkwo r t hD. R. Farmelo C. W. MarschallR. G. Iloagland C. PopelarR. G. Jung A. R. RosenfieldM. F. Kanninen W. J. ZielenbachJ. Lereim
Manuscript Completed: April 1979Date Published: May 1979
2376 337
Battelle Columbus Laboratories505 King Avenue
Columbus, Oil 43201
Prepared forDivision of Reactor Safety Re;earch
Office of Nuclear Regulatory ResearchU. S. Nuclear Regulatory Commis<; ionUnder Contract No. AT(49-24)-0293
NRC FIN NO. A4046

111
FCREWORD
This project is part of a larger, coordinated effort to establish
a rational crack arrest methodology for nuclear pressure vessels. Research
is being performed at Battelle's Columbus Laboratories, and at the Universityof Maryland with the support of the U. S. Nuclear Regulatory Commission.Studies by the Materials Research Laboratory and the Institut furFestkorpermechanik, Freiburg, Germany, are being sponsored by the ElectricPower Research Institute. The program is implementing recommendations of aPVRC/MPC Working Group on crack arrest and includes work on dynamic fracture
mechanics analysis, measurements of crack arrest in a variety of systems.
using common experimental materials, and photoelastic studies of fastfracture and arrest. The efforts of the four participating institutions
integrated and complementary and are being coordinated by theare
respective project managers: P. Albrecht (NRC) and T. U. Marston (EPRI).The authors are grateful for the assistance provided by R. D.
Cheverton, S. K. Iskander and their colleagues at Oak Ridge NationalLaboratory which facilitated the dynamic analysis of their thermal shockexperiment. The authors also wish to acknowledge the advice and supportof P. Albrecht, T. U. Marston, and the late E. K. Lynn, which hasaided the program in many ways.
2375 338
.
v
ABSTRACT
Results cf a program seeking (1) dynamic analyses of crack arrestin thermally stressed nuclear pressure vessels, (11) standardization of a
laboratory test method for measuring the crack arrest toughness, and(iii) a crack arrest toughness data base for unirradiated and irradiated
nuclear steels and weldments are described.The dynamic finite difference analysis of a radial, part-through
crack in a thick-walled cylinder is refined and applied to the Oak RidgeNational I.aboratories Thermal Shock experiment TSE-4 The influences of the
mesh size and aspect ratio on the static stress intensity values are examined
and the results compared with finite element calculation. Dynamic calcula-tions of the run-arrest event corresponding with TSE-4 conditions are
described. The calculations reveal that the contribution of a dynamiceffect to the stress intensity at arrest is negligible for the relatively
small crack jump amounting to 9% of the remaining ligament in this case.Consistant with this, the crack arrest toughness value measured for the
cylinder material is very close to the statically calculated stress
intensity acting on the TSE-4 cylinder at arrest. A run-arrest result
involving a hypothet ical large crack jump amounting to 69% of the remainingligament is a lso examined. In this case, the dynamic analysis shows the
crack propagates 52% farther than predicted by the static analysis.First attempts to apply the finite difference analysis of a radial
crack to a cylinder geometry comparable to the full-scale vessel show that
a substantial refinement of the mesh is required. The governing equationsefor dynamic ~ propagat ion and arrest of a continuous circumferential crack
emanating from the inner surface of a hollow cylinder are developed.Finally, the influence of a strong crack velocity dependence of the tough-ness on the test practice reference curves is examined analytically. Thecalculations show that the dependence does not interfere with the evaluation
of the arrest toughness from the size of the crack jump.A large body of crack arrest toughness measurements on unirradiated
A533B plate, A508 forging material, a submerged arc weldment and the
quenched-only A508 steel from the ORNL thermal shock cylinder are presented.
2375 339

vi
The measurements were performed at temperatures in the range of RT togand at temperatureriDT + 100*C for the base plate and weldment,RT
corresponding to initiation and arrest in TSE-4 for the quenched-onlymaterial. A statistical analysis shows that the tiDT is a more reliable
indexing temperature than the RT;DT* Iava ues r masa e
tanalysis of the tests are 32% smaller than the K values btained from a
b
(both K , and Kg) aredynamic analysis. The arrest toughness values g
significantly above the level of the K cu ve, but the arrest toughnessIR
values for the weldment are 30% to 40% lower and its K , values straddley
the K curve. The crack arrest toughness values of the as-quenched steelIR
are consistent with the size of the crack jump in the ORNL Intermediate
Vessel Test ITV-8. Fractographic studies indicate substantial amounts ofshear fracture on surfaces making a large angle with the average fracture
plane. Quantitative studies indicate that the absolute value of K ,isg
consistent with the relative amounts of brittle cleavage and ductile shear
observed.
Rectangular duplex-DCB specimens designed to measure the crack
arrest toughness of a high copper A508 weldment after irradiation, havebeen exposed to a fluence of 1 x 10 fast neutrons /cm at about 288*C.Test materials, procedures, c ..d irradiation conditions are described.
Finally, incomplete results from 14 laboratories participating inthe ASTM cooperative test program on crack arrest toughness are summarized.
The program is examining two test procedures and provides for a total of300 tests by the 30 participating laboratories,
i
2376 #.
v.&i t
v11
TABLE OF CONTENTS
Page
FOREWORD . 111. . . . . . . . . . . . . . . . . . . . . . . . .. . . .
ABSTRACT . v. . . . . . . . . . . . . . . . . . . . . . . . .. . . .
1. PROGRAM SUMMARY 1-1. . . . . . . . . . . . . . . . . . . ... . .
1.1. Introduction 1-1. . . . . . . . . . . . . . . . . .. . . .
1.2. Scope and Summary of Results 1-1. . . . . . . . . . .. ..
Task 2: Dynamic Analyses 1-2. . . . . . . . . . . .. . ..
Task 3: Standard Test Practice 1-3. . . . . . . . . . .. .
Task 4: Data Base 1-3. . . . . . . . . . . . . . .. . ..
Unitradiated Base Plates 1-3. . . . . . . . . . . .. . .
Weldment 1-4. . . . . . . . . . . . . . . . . . . .. . ..ORNL Quenched-Only A508 . 1-4. . . . . . . . . . . .. . . .
Irradiated High Copper Weldment 1-4. . . . . . . .. . ..
Task 5: Cooperative Test Program . 1-5. . . . . . .. . . .
PUBLICATIONS AND REPORTS 1-6. . . . . . . . . . . . . . ... ..
2. DYNAMIC FRACTURE MECHANICS ANALYSIS . . . . . . . . . .. . . . 2-1
2.1. Formulation for the Dynamic Propagation of a RadialCrack in a Thick-Walled Cylinder 2-1. . . . . . . .. . ..
2.2. Application of Dynamic Radial Crack Analysis to theORNL Thermal Shock Experiment TSE-4 . 2-9. . . . . ... . .
2.2.1. Static Analysis of Stress Intensity Parametersfor TSE-4 . 2 1.0. . . . . . . . . . . . . .. .. .
2.2.2. Dynamic Analysis of Test Fracture and Arrestin TSE-4 2-15. . . . . . . . . . . . . . . ... . .
2.3. Dynamic Calculation of a Long Radial Crack Jump inTSE-9 2-21. . . . . . . . . . . . . . . . . . . . . ... . .
2.4. Application of Dynamic Radial Crack Analysis to Full-Scale Vessel-Type Cylinder Geometry . 2-22. . . . . . . . . .
2.5. Formulation for the Dynamic Propagation of a Circum-ferential Crack in the Wall of a Cylinder . 2-31. . .. . . .
2.5.1. The F uations of Motion 2-31l . . . . . . . . .. . ..
2.5.2. The Energy Release Rate 2-47. . . . . . . . ... . .
2.5.3. Initial Conditions 2-48. . . . . . . . . . .... .
2.6. Influence of the K p-Crack Velocity Dependence on theI
Test Practice Reference Curves . . . . 2-49. . . . . . . .
0; 2, ,- 2375 34i
viii
TABLE OF CONTENTS (Continued)
Page
3. CRACK ARREST DATA BASE FOR UNIRRADIATED NUCLEAR PRESSUREVESSEL STEEL AND WELDMENT . 3-1. . . . . . . . . . . . . . . . .
3-13.1. Procedure . . . . . . . . . . . . . . . . . . . . . .
3.1.1. Date Base Materials 3-1. . . . . . . . . . . . . .
3.1.2. Experimental Methods 3-4. . . . . . . . . . . . . .
3.2. Experimental Results 3-4. . . . . . . . . . . . . . . . . .
3-43.2.1. KIm- and Kla-Measurements . . . . . . . . . . .
3.2.2. Statistical Analysis 3-10. . . . . . . . . . . . . .
3.2.3. Comparison of KIm Values From the Two SpecimenDesigns 3-16. . . . . . . . . . . . . . . . . . . .
3-163.2.4. Effect of Crack Jump Length on K p and KIai. . .
3.2.5. Fractography . 3-18. . . . . . . . . . . . . . . . .
3. 3. Application to ORNL Intermediate Vessel Test, ITV-8 3-32. .
3.4. Discussion . 3-37. . . . . . . . . . . . . . . .......
3.5. Conclusions 3-39. . . . . . . . . . . . . . . .......
4. CRACK ARREST TOUGilNESS MEASUREMENTS ON QUENC11ED-ONLY A508STEEL . 4-1. . . . . . . . . . . . . . . . . . . . . .......
4.1. Procedures 4-1. . . . . . . . . . . . . . . . . . . . . .
4.2. Results 4-2. . . . . . . . . . . . . . . . . .......
. . . . . . . . . . . . . 4-104.3. Discussion and Conclusions .
5. CRACK ARREST TOUGilNESS MEASUREMENTS ON IRRADIATED A508 IIIGilCOPPER WELUMENT . 5-1. . . . . . . . . . . . . . . . . . . . . . .
5.1. Material Investigated 5-1. . . . . . . . . . . . . . . . .
5.2. Specimen Design 5-3. . . . . . . . . . . . . . . . . . . .
5.3. Specimen Fabrication . 5-9. . . . . . . . . . . . . . . . .
5.4. Nuclear and Thermal Mockup Experiment 5-15. . . . . . . . .
5.5. Irradiation of Specimens 5-15. . . . . . . . . . . . . . . .
6. PRELIMINARY REPORT OF Tile ASTM COOPERATIVE TEST PROGRAM ONCRACK ARREST TOUGilNESS MEASUREMENT 6-1. . . . . . . . . . . . . .
6-16.1. Background . . . . . . . . . . . . . . . . . . . . . .
5.2. Crack Arrest Test Procedures 6-1. . . . . . . . . . . . . .
6.3. Cooperative Test Program Scope and Schedule 6-7. . . . . .
6.4. Description of the Common Plate of A533B Test Material . 6-8
6.5. Results of the Coogarative Test Program 6-8. . . . . . . .
6.6. Conclusions 6-28. . . . . . . . . . . . . . . . . . . . . .
! 2375 342'

ix
TABLE OF CONTENTS (Continued)
Page
7. REFERENCES . 7-1.. . . . . . . . . . . . . . . . . . ......
APPENDIX A - Program of the ASTM Sympsium on Crack ArrestMethodology and Applications, Philadelphia,November 6 and 7, 1978 A-1. . . . . . . . ......
APPENDIX B - Expressions for Terms in Dynamic Analysis ofCircumferential Crack in a Cylinder Derived
in Section 2.5 B-1. . . . . . . . . . . . ......
APPENDIX C - Characterization of Experimental Materials C-1. . . .
APPENDIX D - Tabulation of Crack Arrest Measurements for DataBase Materials of Section 3 . D-1. . . . . . . . . . .
APPENDIX E - Statistical Analysis of Data in Section 3 . E-1. . . .
APPENDIX F - Flux Dosimetry for Mockup Experiment at' Universityof Michigan Reactor . F-1. . . . . . . . . . . . . . .
2376 343

1-1
1. PROGRAM SUMMARY
1.1. Introduction
This report describes research performed during the 4th year--October 1977 to October 1978--of a continuing program on crack arrest. The
program consists of analytical and experimental studies and is designed todevelop a crack arrest methodology for heavy-walled pressure vessels andnuclear grades of steel.
In previous years the analytical efforts were devoted to one- andtwo-dimensional, dynamic fracture mechanics analyses of laboratory testpieces. This work has been completed and the dynamic analyses are now beingextended to frst fracture and arrest events in thick-walled cylinders sub-
jected to thermal shock. The experimental studies of the past two yearswere directed toward a crack arrest testing practice. This work has lead to
a vell-defined practice which will be the subject of a 30-laboratory cooper-ative testing program organized by ASTM. The current thrust of the experi-mental ;ork is the application of the testing practice to obtain a signifi-cant crack arrest data base for unirradiated and irradiated nuclear steelsand weldments.
The analytical work is being carried out by P. C. Gehlen,C. Popelarx, and M. F. Kanninen. Experimental studies are being led byR. G. Hoagland, together with A. R. Rosenfield, C. W. Marschall, andC. T. llahn. Overall program management responsibility rests with G. T. Ilahn.
S_ cope and Summary of Results1.2. c
The program consists of a project administra; ion task (Task 1)and four technical tasks. The main objectives of the technical tasks and theprogress made during the quarter are summarized in the following paragraphs.
* Professor C. Popelar of The Ohio State University is both a consultant andcontributor to the dynamic analysis tasks.
2376 544..,
+ t {
.
1-2
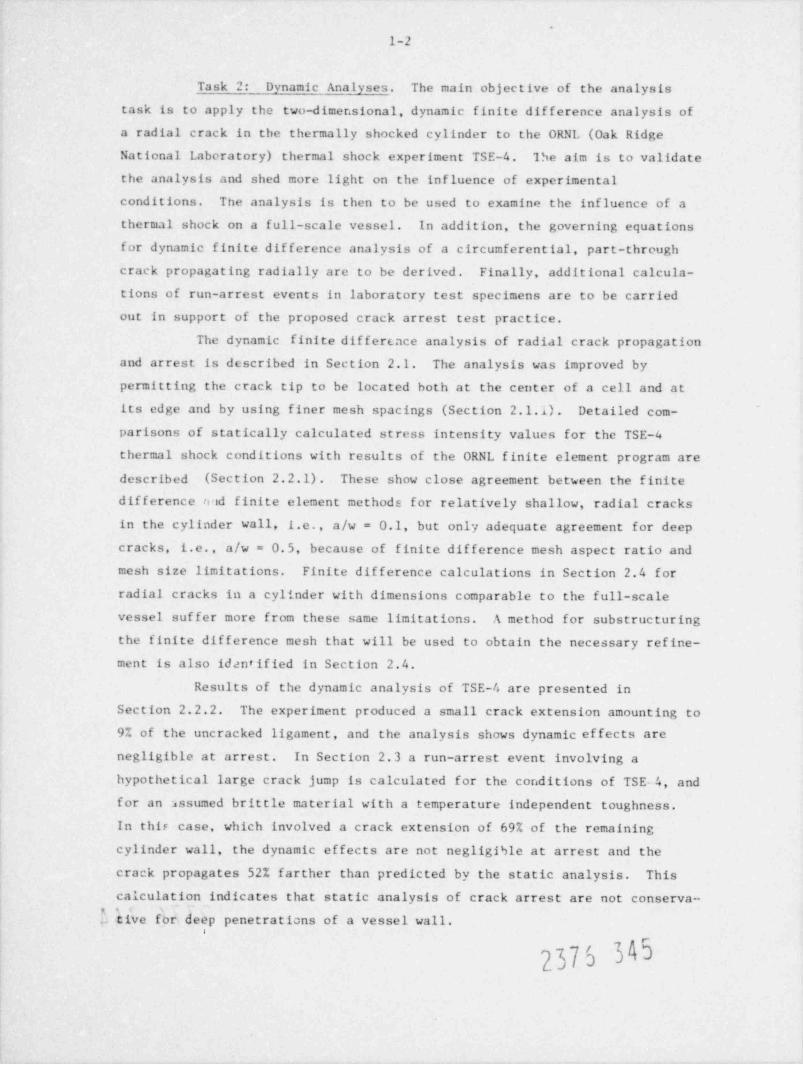
Task 2: Dynamic Analyses. The main objective of the analysistask is to apply the two-dimer.sional, dynamic finite difference analysis ofa radial crack in the thermally shocked cylinder to the ORNL (Oak RidgeNational Laboratory) thermal shock experiment TSE-4. The aim is to validate
the analysis and shed more light on the influence of experimentalconditions. The analysis is then to be used to examine the influence of a
thermal shock on a full-scale vessel. In addition, the governing equations
for dynamic finite difference analysis of a circumferential, part-throughcrack propagating radially are to be derived. Finally, additional calcula-
tions of run-arrest events in laboratory test specimens are to be carried
out in support of the proposed crack arrest test practice.
The dynamic finite dif ference analysis of radial crack propagationand arrest is described in Section 2.1. The analysis was improved by
permitting the crack tip to be located both at the center of a cell and at
its edge and by using finer mesh spacings (Section 2.1.1). Detailed com-'
parisons of statically calculated stress intensity values for the TSE-4
thermal shock conditions with results of the ORNL finite element program aredescribed (Section 2.2.1). These show close agreement between the finite
dif ference nod finite element methods for relatively shallow, radial cracksin the cylinder wall, i.e., a/w = 0.1, but only adequate agreement for deepcracks, i.e., a/w = 0.5, because of finite difference mesh aspect ratio andmesh size limitations. Finite difference calculations in Section 2.4 for
radial cracks in a cylinder with dimensions comparable to the full-scalevessel suffer more from these same limitations. A method for substructuringthe finite difference mesh that will be used to obtain the necessary refine-ment is also identified in Section 2.4.
Results of the dynamic analysis of TSE-4 are presented inSection 2.2.2. The experiment produced a small crack extension amounting to9% of the uncracked ligament, and the analysis shows dynamic ef fects arenegligible at arrest. In Section 2.3 a run-arrest event involving a
hypothetical large crack jump is calculated for the conditions of TSE- 4, andfor an assumed brittle material with a temperature independent toughness.In thir case, which involved a crack extension of 69% of the remainingcylinder wall, the dynamic effects are not negligible at arrest and the
crack propagates 52% farther than predicted by the static analysis. Thiscalculation indicates that static analysis of crack arrest are not conserva-
b hive f'br deep penetrations of a vessel wall.r
1-3
The equations for finite difference treatments of fast fracture
and arres'. of circumferential cracks are successfully worked out in
Section 2.5. Finally, the influence of a strong crack velocity dependenceof the toughness on the test practice reference curves is examined in
Section 2.6. The calculations examine the velocity dependences displayed by
Araldite B and Homalite 100, two polymeric materials that have been used tostudy the crack arrest phenomina. The calculations reveal that the velocitydependence does not interfete with the evaluation of the crack arrest
toughnesswiththeBattelleprocehure, but that estimates of crack velocity
can be in error.
Task 3: Standard Test Practice. The objective of this task is
to perform any additional tests and analysis in support of the developmentof a crack arrest test practice, and to organize and hold a second ASTM
Symposium. Arrangements for the symposium, on " Crack Arrest Methodology and
Applications" were completed during the first quarter of the program, andthe symposium was held on November 6 and 7, 1978, in conjunction with theASTM E-24 meetin_g in Philadelphia. The program attracted 86 participants
who heard papers and contributed very lively discussions. A list of the
papers which wi!1 be collected in an ASTM STP is given in Appendix A.Task 4: Data Base. One objective of this task is to complete
the work on a crack arrest data base for unirradiated A533B plate, A508
forging material, weldment, and the ORNL TSE quenched-onl material. The;
second objective is to irradiate to 1.10 nvt one capsule of crack
arrest specimens of a high copper weldment, to test these specimens and tofill and begin irradiating a second capsule. Basic properties of the data
base materials were reported in the Third Annual Reoort (BMI-1995) andadditional information is given in Appendix C.
A large body of crack arrest toughness measurements of unirradiatedtest pieces has been completed and is described in Section 3 and Appendix D.
These results have been subjected to a statistical analysis which is
summarized in Section 3.2.2. of this report. The analysis shows that both
of K and K values for the A533B and A508 heats fall significantly aboveIm g
the K cu m . WK values t in masa ana s am onIR Ia
average 32% sm-11er than the corresponding K v lues based on a dynamicIm
analysis of the test pieces. The variability of the data is smaller whenthe NDT is used as the indexing temperature as opposed to the RT
NDT ' y',3Standard deviations for K and K are comparable and about 16 MPam forg
2?75 346. .
. .
1-4
the base plates. Fractographic studies performed on some of the test
pieces are described in Section 3.2.5 of this report. These show that'
crack-arrest toughness values are connected with the fracture appearance;specifically, the formation of ligaments, and the (ductile) shear fracture
of the ligaments. Crack arrest toughness levels in the transition rangeare consistent with the amounts of cleavage and shear fracture area visible
on the surfaca.
An important finding of the study is that crack arrest toughnessvalues of the weldment (both K and Kg) are about 30% to 40% lower thangthe values for the base plates and straddle the K curve. s result isIRobtained when the toughness values are indexed with respect to NDT or RTeven though the conventional toughness values (K and Charpy) of the weld-gc
ment and base plates are essentially the same as indexed. The fractures of
the weldment are also much smoother and devoid of prominent ligaments con-sistent with their relatively low crack arrest toughness. The results for
the weld.nent have been used to analyze the run arrest event produced in therecent ORNL Intermediate Vessel Test ITV-8. The analysis shows that the
extent to the crack jump produced in this test is consistent with the value
of K and a modes; dynamic contribution anticipated on the basis of theg
dynamic analysis discussed in Section 2.3. However, the extent of the crack
jump is also consistent with the K values measured for the weldment, pro-Ia
vided a static analysis of the cylinder is appropriate.
Results of fracture toughness and crack arrest toughness measure-ments of A508 "ciuenched-only" material taken by Oak Ridge National Laboratory
from their Thermal Shock Vessel TSV-1 are described in Section 4. These
measurements were performed at temperatures corresponding to the onset offracture and crack arrest In TSE-4. The arrest toughness inferred from com-
~
pact tension specimens, %134 MPam ! at 126*C, and from a short jump experi-ment %139 MPam at 126 C, is very close to the statistically calculated stress '
intensity at arrest in the thermally shocked cylinder, K = 127 14 MPacy
at 131 ! 9'C. The agreement is entirely consistent with the finding of
the dynamic analysis of TSE-4 discussed in Section 2.2.2, that dynamiceffects are negligible in this case.
Specimens to investigate irradiation effects on the crack arrest
toughness of a high copper A508 weldment were prepared, encapsulated and
exposed to fast neutrons at 288*C to a total fluence of approximatelyI9
1 x 10 neutrons /cm . In addition to the four rectangular duplex-DCB
crack arrest toughness specimens, the capsule contained tensile, Charpy,
3:e. 237.6 347
1-5
0.5T compr.ct tension specimens of both the weldment and the 4340 starter
section material. At the end of September, the irradiation was complete,
and the capsule was ready to be returned to the Battelle Hot Laboratory
for documentary counting and testing. The test materials, specimens,
fabrication procedures, results of the mock up experiment, and the actual
temperature ranges experienced by the capsule for the entire exposure period
are given in Section 5.
Task 5: Cooperative Test Program. The objective of this task is(1) to plan and coordinate the ASTM Cooperative Test Program on Crack Arrest
Toughness Measurement, (ii) characterize the common test plate, (iii)prepare test pieces for the participants, and (iv) collect and analyze theresults at the November 6 and 7,1978, ASTM Symposium on Crack ArrestMethodology. Arrangements for the program were completed and communicated
to 81 laboratories in this country and abroad late in 1977. Of these, 30laboratories decided to participate in the program. The program schedulewas set back because of a 3-month delay in the arrival of the common testplate. The test plate was received in March; the task of fabricating 120duplex compact specimens was completed, and the test specimens were shipped to
the participants beginning in July. A preliminary report of incompleteresults from 14 laboratories is given in Section 6. The results appear to
be quite reproducibic. Crack arrest toughness values derived f rom the two
procedures with the static analysis agree closely, but values calculatedusing a dynamic analysis dif fer by about 50%.
2L375 348
.: :o 8
1-6
PUBLICATIONS AND REPORTS
Additional information on this report can be found in the follow-
ing reports and technical papers issued previously:
Fifteenth Quarterly Progress Report (Contract No. AT(49-24)-0293), BMI-2018,January, 1979.
Fourteenth Quarterly Progress Report (Contract No. AT(49-24)-029 3) , , BMI-2014, December, 1978.
Thirteenth Quarterly Progress Report (Contract No. AT(49-24)-0293), BMI-'
2010, October, 1978.
Third Annual Progress Report (Contract No. AT(49-24)-0293), FMI-1995,May, 1978.
Eleventh Quarterly Progress Report (Concract No. AT(49-24)-0293), BMI-1980, September, 1977.
Tenth Quarterly Progress Report (Contrac t No. AT(49-24)-0293) , BMI-1978,'ugust, 1977.
Ninth Quarterly Progress Report (Cont rac t No. AT(49-24)-029 3) , BMI-19 70,July, 1977.
- Eighth Quart <rly Progress Report (Contract No. AT(49-24)-0293), BMI-1966February, 1977.
Second Annual Progress Report (Task Agreement No. 62, Contract No. W-7405-eng-92), BMI-1959, October, 1976.
Sixth Quarterly Progress Report (Task Agreement No. 62. C ntract No.W 7405-eng-92), BMI-1951, July, 1976.
Fifth Quarterly Progress Repart (Task Agreement No. 62, Contract No.W-7405-eng-92), BMI-1944, March 1976.
Fcurth Quarterly Progress Report (Task Agreement No. 62, Cont ract No.W-7405-eng-92), BMI-19 39, November, 1975.
First Annual Progress Report (Task Agreement No. 62, Contract No.W-7405-eng-92), BMI-1937, August, 1975.
Second Quarterly Progress Report (Task Agreement No. 62, Contract No.W-7405-eng-92), BMI-1934, May, 1975.
First Quarterly Progress Report (Task Agreement No. 62, Contract No.W-7405-eng-92), January, 1975.
,
2376 349
1-7
Topical Report: R. G. Hoagland, M. F. Kanninen, A. R. Rosenfield, G. T.llahn, " Rectangular-DCB Specimen for Fast Fracture and Crack ArrestMeasurements", BMI-1933, December, 1974.
" Dynamic Analysis of Crack Propagation and Arrest in DCB Test Specimen",M. F. Kanninen, C. Popelar, and P. C. Gehlen, " Fast Fracture and CrackArrest", ASTM-STP 627 (1977), pp. 19- 38.
"A Crack Arrest Measuring Procedure for KIm> KID, and Kla Properties",R. G. Hoagland, A. R. Rosenfiel'd,'P. C. Gehlen, and G. T. Hahn, " FastFracture and Crack Arrest' , ASTM-STP 627 (1977), pp. 177-202.
" Fast Fracture Toughness of Steels", .. T. Hahn, R. G. Iloagland, and"
A. R. Rosenfield, " Dynamic Fracture Toughness", The Welding Institute(Ab ington, U.K.) (1976), pp. 237-247.
" Crack Branching in A533B Steel", G. T llahn, R. G. Hoagland, and A. R.Rosenfield, " Fracture 1977", University of Waterloo Press (1977), pp.1333-1338.
" Crack Arrest and Its Relation to Propagating Crack Toughness, Kp", tobe pul.11shed by AIME.
" Rapid Fracture and Crack Arrest in Rectangular Specimens", C . II . Popelar,and P. C. Gehlen, submitted to Int. J. of Fracture Mech.
" Dynamic Crack Propagation in DCB Specimens: A Comparison of Theory andExperiment", P. C. Gehlen, C.11. Popelar and M. F. Kanninen, submittedto Ir*. J. of Fracture Mech.
"A Method of Extracting Dynamic Fracture Toughness from CT Tests", P. C.Gehlen, R. G. Hoagland, and C. H. Popelar, submitted to Int. J. ofFracture Mech.
" Analysis of Crack Arrest in Reactor Pressure Vessels", R. G. lloagland,P. C. C-alen, A. R. Rosenfield, and G. T. Hahn, presented at the JointASME/CbME Pressure Vessels and Piping Conference, Montreal, Canada,June 25-30, 19/8.
"A Cooperative Program for Evaluating Crack-Arrest Testing Methods", G. T.Ilahn, R. G. Iloagland, A. R. Rosenfield, and C. R. Barnes, presented at theASTM Symposium on Crack Arrest Methodology and Applications, Philadelphia,November, l978.
~
" Application of Crack Arrest Theory to a Thermal Shock Experiment", R. D.Cheverton, P. C. Gehlen, G. T. llahn, and S. K. Iskander, presented at theASTM Symposium on Crack Arrest Methodology and Applications, Philadelphia,November, 1978.
"A Dynamic Viscoelastic Analysis of Crack Propagation and Crack Arrestin a DCB Test Specimen", M. F. Kanninen, and C. 11. Popelar, presented atthe ASTM Symposium on Crack Arrest Methodology and Applications, Philadelphia,November, 1978.
23''a/ ;507/

1-8
" Fast Fracture Toughness and Crack Arrest Toughness of Reactor PressureVessel Steel" C. T. Ilahn, R. G. Iloagle.ed, J. Lereim, A. J. Markworth,and A. R. Rosenfield, presented at the ASTM Symposium on Crack ArrestMethodology and Applications, Philadelphia, November, 1978.
2375 351
.. . .
>4 ,j - ,

2-1
2. DYNAMIC FRACTURE MECIIANICS ANALYSIS
.
In this section, the dynamic, finite difference analysis is
applied to propagating cracks in cylinders, and is used to examine condi-
tions relevant to the question of crack arrest in reactor pressure vessels.
The met hodology and some further refinements are described in Section 2.1.
In Section 2.2, the analysis is applied to a shallow, axial crack which
propagates radially in a thick-walled cylinder. These calculations
examine the conditions of the ORNL thermal shock experiment TSE-4. They
show that the response of the crack is consistant with tne measurements of
crack arrest toughness, which are described later in Section 4 Although
the dynamic effects are negligible for .he relativelf small extension (9% of
the remaining wall) involved in this case, anothe- ca_culation in Section 2.3
illustrates that dynamic effects can be i mpor t ur.t for a large crack jump
amounting to 69% of the remaining wall. Progress in extending the finite
difference analysis to cylinders with a geometry comparable to full-scale
reactor vessels is described in Section 2.4. In Section 2.5, the formalism
needed to analyze the propagation of circumferential cracks is developed.
The last part of this chapter, Section 2.6, examines the generality of the
test practice reference curves with reference to the crack velocity depend-
ence of toughness.
2.1. Formulation for the Dynamic Propagation of a RadialCrack in a Thick-Walled Cylinder
.
A finite difference scheme capable of simulating the dynamicpropagation of a crack emanating from the inner wall of a thick-walled
circular cylind r and advancing radially towards its outer surface has
been described in the Third Annual Progress Report to NRC (NUREC/CR-0057).
In this model, the driving force of the crack is presumed to bedue to a radial thermal stress gradient and/or internal pressure.
Both the length of the cylinder and the length of the crack in the axial
direction are assumed to be much greater than the mean radius of the
cylinder. Furthermore, the plane containing the crack is taken to be a
plane of symmetry and no variation of the dependent variables in the
axial direction is assumed. Inelastic deformations except those permittedi
'
2376 352
2-2
within the confines of linear elastic fracture mechanics in the immediate
neighborhood of the crack tip are expressly neglected. In this manner the
behavior of the cylinder and crack
equations of plane strain theory of elasticity. The influence of the
advancing crack tip on the temperature field is neglected.
The finite difference method which has proven to be useful in
previous analyses of propagating cracks is used to integrate the
equations of motion. In the finite difference method, the specimen is
overlaid with a two-dimensional net as shown in Figure 2.1, i.e., the
system is discretized. The displacements at the nodal points become thedependent variables .hst can be determined for a given nodal load andtemperature.
The fracture criterion is based upon a balance between the energy
released, #, through the crack tip and the energy absorbed, R, at the cracktip during the fracture process. Consequently the only source of loss of
energy is at the crack tip. The governing equations of motion reflect this
characteristic. An entirely consistent formulation can be obtained by
using an energy principle, such as Hamilton's from which Lagrange'sequations follow, to arrive at the governing ecuations for the nodal dis-
placements.,
At this time, the computer algorithms required by this scheme
are completely debugged and yield results that are in good agreement with
the ORNL thermal shock experiments (TSE-4) (Cheverton and Bolt, 1977) and
also with their finite element computations on static configurations.
The previous disagreements between our predicted results and the
ORNL observations were circumvented by altering our algorithms in the
following two ways. Firstly, the crack tip is now allowed to be located
both in the center of a cell and at its edge, while previously it was
always located at the edge or a cell. Secondly, the agreement is further
improved by using finer mesh spacings, both in the radial and circum.-ferential directions. Two benefits are obtained from this refinement. In
the static configuration it allows for better agreement between the experi-
mental and nodal crack tip positions, in the dynamic computations the
ef fects of the excess energy released when a bond is abruptly ruptured are
miilmized since now the crack propagates only half as far as it propagated
.n the earlier algorithms (i.e., from center to edge, from edge to center,
2376 5537

. . ,
Plane of symmetry
,-
-
r
P+1, QP+i,Q-i
6r
. P,0 ~
P Q-I~ r
ar t
E_of
,
\
Crack I+1,J+II,J+1 A
R I
--
5%*% <
I,J 1+;,g 7
Ns,i s -,
I,t'
o
/ 1
(
k 2375 354'
,
,t
FIGURE 2.1. A FINITE DIFFERENCE NET FOR A CRACKED THICK WALLED CYLINDER

2-4
ate.). When the crack tip is at the center of a cell, the following changes
must t,c brought to the equations given in the Third Annual Report.Equations 2.55 for node P,Q+1 (the labels of the nodes are defined
in Figure 2.2) are replaced by
u (t+At) = 2u (t) - u (t-At) + ( A +C +V +Wp p p p p p p
and (2.1)
v (t+ At) = 2v (t) - vp g (t-At) + E +G +X +p p p p p
As in the earlier report the left-hand sides of these equations give the
nodal displacements in the radial and circumferential directions respec-
tively at a time t+At as a function of these displacements at times t and
At. The quantity at is the time step used in the integration scheme, o
the material density, p, the pressure on the inside wall of the cylindet ;r, the <11 stance of node P,j from the center of the cylinder and A4, thep
angula' specing between any two nodes i, j and 1, j+1 (see Figure 2.2).
^PQ rl' PQ+1' PQ+1' PQtl PQ+1#" ae en y qu ns A-1, A4,
A-5, A-7, and A-18 in Appendix A of the Third Annual Report, while
(A+2GJf"P+1Q+1"PQ+1\#4 _ "P+1Q+1-# +1Q "P+10+1 P+1~
P+1 A P,
PQtl 4 \ Ar / Ar 4 A4r r Arg ppy
C( A+G)["P+1Q+1 "PQ+1 _ (3A+2G) O ,yg,7 r +1~
p p(2.2a)
A+2G \ Ar / Ar 4 Ar
# #
~ G(3A+2G) " PQ+1 5P P AP P
2(A+2G) 4 4(A+2G) Ar
and (2.2b)
,, c p+1Q+1 "P+1Q-
bQ1"4 AQ r- P+1Qt1 , P+1Q*1 - PQtl
P+1 , Wp,
4 r ,y Ar Mg1 p ,
2375 355
2-5
,
P +1,0 +1 P+1,0p,g + t , N ,0p
P
P,Q+1 P, OP -1,0 +1 P-1,02
(a) (b)
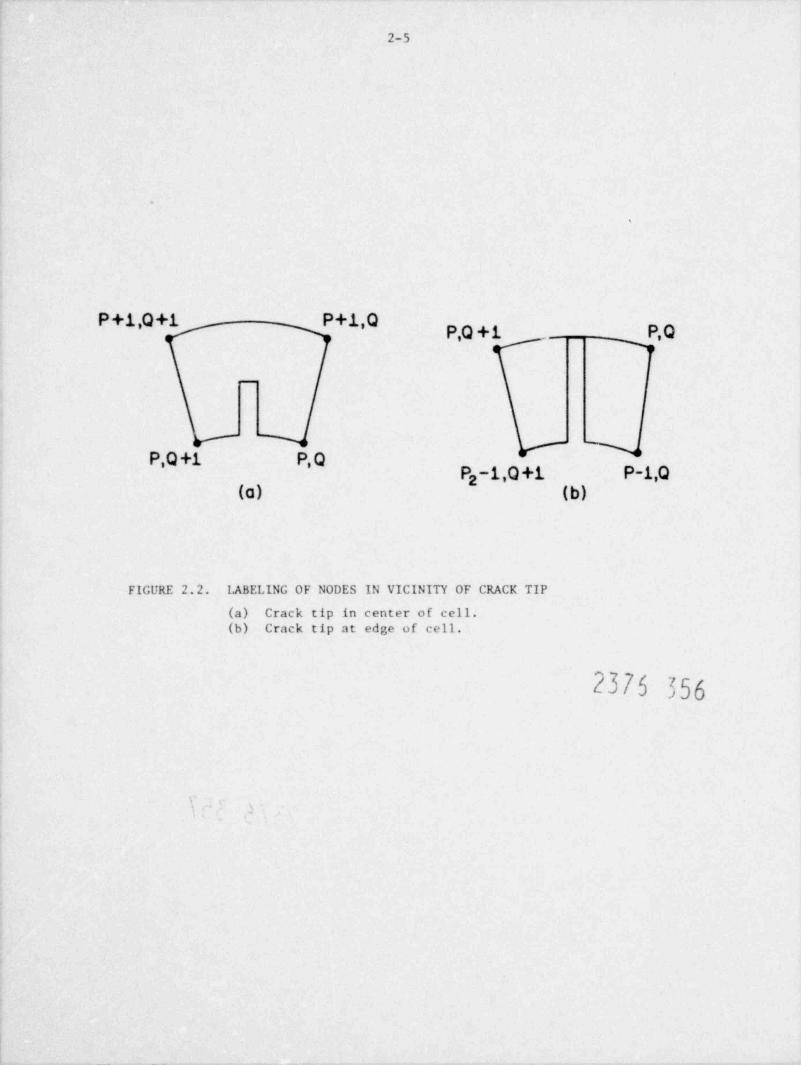
FIGURE 2.2. LABELING OF NODES IN VICINITY OF CRACK TIP
(a) Crack tip in center of cell.(b) Crack tip at edge of cell.
2376 356
'
. :

2-6
where A is Lame's constant, G is the shear modulus, Ar the q> acing between
nodes in any radial direction, cm the coefficient of thermal expansion, and
0 the temperature at node ij.
When the crack tip is at the edge of a cell node P+1, Q&1 is an
internal node, whose equations of motion are given by Equations 2.50 inthe Third Annual Report, while 'eith the tip at center-cell its equations of
motion are as follows: 4
/u (t+At) = 2u (t) - u , (t-At) + (At) A + Bp p p g pq
+P+1Q+1 + P+1Q&1
and (2. 3)
gy 1(t+At) = 2v (t) - v (t-At) + (At) [pg ( P+1Q+1 +v p pg pr P+1Q+1
+P+1Q+1 + P+1Q&1
B and F , are given by Equations A-2 and A-6 respectively ofpg p
the Third Annual Report and
._G P+1, G( AH;) #P["P+1Q+1 ~ "PO&l\ G.
#
2fP+1Q+1 ~ "P+1Q.y +1Q&lP 2 Ar A+2G Ar \ Ar / 4 _\ A$r ,1,
p ,
\ # ~#
_f#P+1Q&l + #P+1Q P+1Q+1 PQ+1 + #P+1Q ~ "PQ l
r ,1 / Ar A4\ p_
2376 357
2-7
,G P+1Q+1 ~ "P+1Q "P+1Q+1 ,A "P+1Q+1 ~ "PQ&l#
4 ar2 A$r rg g j_
"P+1Q+1 P+1Q + "P+1Q+1!# +1 Ap P~V P
Atr r Ar 4(A+2G) Eg g
(3A+2G) a 0 +1Q+11+1 ( "0+4 P Ar 2(A+2G) PQ+1 or
(2.4)and
.. - -
=E O
Z +1Q+1 4 A$r ,y- + -1
or Arr ,1
_ _ _P p_
p
_ (A+2G) 2 P+10+1 ~ P+1Q "P+1Q+1 + "P+1Q 1# 0@
_( 0*# +1 / P+1 _P
A "P+1Q+1 ~ "PQ+1 + "P+1Q ~ "PO (3A+2G)a P+1Q+1 + P+1Q4 Ar A4 4 A4 j
j
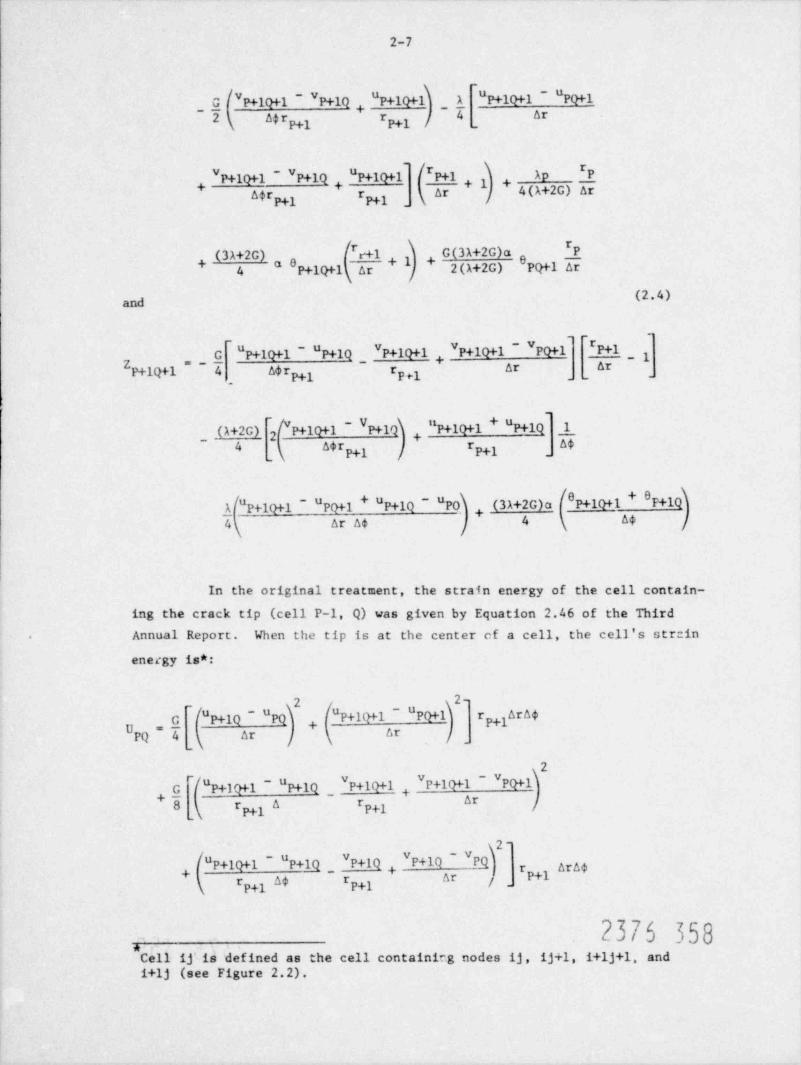
In the original treatment, the strain energy of the cell contain-
ing the crack tip (cell P-1, Q) was given by Equation 2.46 of the Third
Annual Report. When the tip is at the center cf a cell, the cell's strcin-
enecgy is*:
- 2 2-+ P+1 '=E l +U
PQ 4 Ar Arj _
2
G_"P+1Q+1 ~ "MlQ _ P+1Q+1 , "P+1Q+1 ~ "PQ&l
_( P+1 P+1 /O #
2-~#
f"P+1Q+1 ~ "P+13 _ P+1Q . P+1QPQ r MA$# 0# '
( P+1 P+1 / -
2375 358,Cell ij' is defined as the cell containirg nodes ij , ij+1, i+1j+1, andi+1j (see Figure 2.2).
2-8
"I I2 f 12~#G_ P+1Q+1 P+1Q "PFlQ+1 # +1Q+1 P+1Q "P+1Q
~#P
# +1 I .k0 # 04_A P+1 # 0# #P P+1 P+1 A-
I i2A "P+10+1 ~ PQ+1 ,#P+1QF1 ~ P+1Q "P+1Q+10 k 0# #
P+1 A$ P+1 1
I 12~"P+1Q ~ "PQ P+1Q+1 ~ P+1Q "P+1Q4 , ara 40" #( "P+1 A4 P+1 1.
-
f I_ (3A+2G)a %@l ~DW+EW ~ hM , NW
g +1Q+14 P Ar r A$ r ,7.
pg p
1 )~"P+1Q ~ "PQ +P+1Q+1 ~ #P+1Q + "P+1QO +1Q
+P Ar A$ r ,7 P+1A$Arr ,7
_p p
+ ( G)a Op47Q+1 + O ,7q r +y $Arap p
'I I2 I 123-
2G(A+C) "P+1Q+1 - "PQ+1 "P+1Q ~ "PQ4(A+2G) Ar_; j i Ar P;
-
1 7 t'
~ 2G(3A+2G)a "P+1Q&l - "PQ+1 "P+1Q ~ "PQj PQ+1 + ;
r ora $4(A+2G) Ar Ar jPQ, p
2G(3A+2G)u 2 2 p+ O4(A+2G) PQ&1 * 0PQ P O#0+ + 4(A+2G) Par$
1 I
Pu 2Ar p pAra $ 4(A+2G)
O- PVppi T - 4 P
I I
Ap "P+1Q+1 ~ "PQ+1 p(3A+2G)a, 4(A+2G) Ar 0 Ara $rP; 4(A+2G) PQ+1 P
e,,+ ,
" ''
2376 559
2-9
a 2pq $arpua r. p+ pv W 2G) # ara $PQ 2 4 P
1 \~#AP P+1Q PQ r A W + P(3A+2G)cx 0 ara $r (2.5)_ 4(A+2G) ar p 4(A+2G) PQ pj
The strain energies of the remaining cells remain unchanged. No changes arerequired in the equation for the kinetic energy, however the expression for
the strain energy release rate, G (see Equation 2.57 in Third Annual Report)should be replaced by one of the following two expressions:
G=h(U -U ) (2.6a)p
when the crack tip is at the lower edge of the cell, i.e. the boundary
containing nodes PQ and PQ+1 in Figure 2.2a, and,
G=h(U -U ) (2.6b)q
-
when the crack tip is at the center of cell PQ. In these expressions Up
isgivenbyEquation2.43andUhgisgivenbyEquation2.46(ThirdAnnualReport) with p replaced by P. U is given by 2.5 above.
2.2 Application of Dynamic Radial Crack Analysis to theORNL Thermal Shock Experiment TSE-4
Our initial computations were performed for a thick-walled cylinder
modeling the ORNL most recent thermal shock experiment (TSE-4, Cheverton
and 11olt, 1977) as closely as possible. Relevant dimensions and elastic
properties are listed in Table 2.1. As in the experiment, the cylinder was
not internally pressurized and the driving force of the crack was provided
by the radial thermal gradient shown in Figure 2.3. This temperature dis-
tribution is for a time of 150 seconds after the start of TSE-4 and was
oMained by interpolation between data obtained at 122 and 160 seconds after
the expe:riment'was started.'
2375 360

2-10
TABLE 2.1. TEST CONDITIONS AND MATERIAL PROPERTIES FOR TSE-4
Test specimen dimensions, m (in.)
OD 0.53 (21)ID 0.24 (9.5)Length 0.91 (36)
Test specimen material A508, class 2
lleat treatment Quench only from 871*C (1600*F)Flaw Long Axial Crack
Initial depth, mm (in.) 11 1 1 (0.44 i 0.03)Final (arrested ) depth mm (in.) 23 i 2 (0.91 1 0.09)
Temperatures,"C (*F)
Wall (initial) 291 (555)Sink (initial) -25 (-13)
Coolant 40 wt % methyl alcohol60 wt % water
Material properties--
Young's modulus 0.19305 MNmm'
Poisson's ratio 0.3Bar wave speed 5000 m/sec
Coefficient of thermal 11.7 10-6*C-expansion
Density 7.86 gr/cmFinite Difference Mesh
Initial flaw depth am (in.) 11.68 (0.46)Distance between nodes in radial 2.32 (0.09)
direction mm (in.)Angular distance between nodes 25.714*
2 )f J
-t b *

2-11
:'
280 -
_
240 -
_
200 -
P
f iso -
-
E8. -
E
120 -
_
80 -
.
_
40
' ' ! ' I ' ! ' ! ' ' !o120 14 0 16 0 18 0 200 220 240 260
Distance From Center of Cylinder, mm
FIGURE 2.3. TEMPERATURE DISTRIBUTION INSIDE CYLINDER WALL USED WITilSIMULATION OF TSE-4
This gradient, for a time of 150 seconds after thebeginning of the experiment, was obtair.ed by interpolat-ing between data obtained at 122 and 162 seconds afterthe experiment was started (Cheverton, (1977)).
'
2377 001''
g, .
.

2-12
2.2.1. Static Analysis of Stress IntensityParameters for TSE-4
Tle configuration of the cylinder for t he temperature gradient at
the onset o! crack extension was obtained using the finite difference pro-cedure and the energy quench method discussed in the Second Annual Report toNRC (BMI-NUREG-1959). The stress intensity factor corresponding to this
-!internal stress state is found to be K 112.25 MNm Despite the=.
3
relatively coarse grid spacing used in the circumf erent ial direction, this
114 MNm- computedvalue is in excellent agreement with the value of K =
7
by Cheverton and Bolt (1977) with a finite element model. An effort was
also made to check the accuracy of the finite difference calculation for a
case where the crack tip has penetrated to a position mid way across the
wall, i.e., a = 0.5. From the finite element computation performed by
Cheverton and Bolt (1977), the stress intensity as a function of time
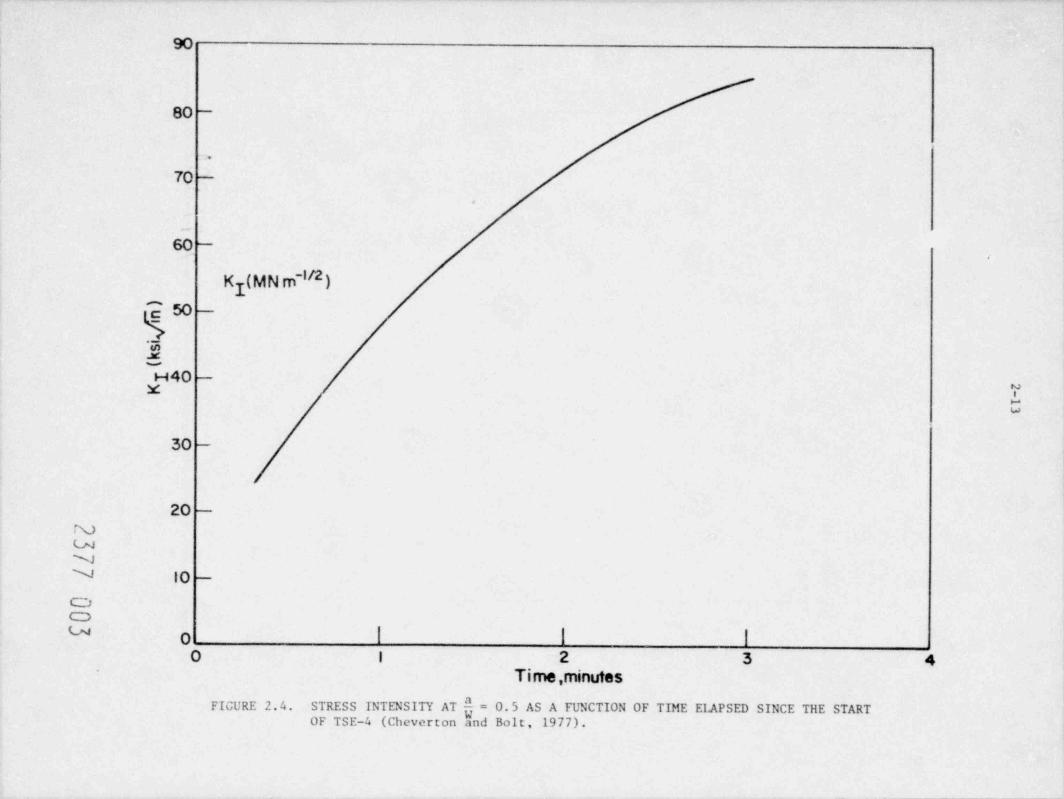
elapsed since the beginning of TSE-4 could be plotted (Figure 2.4). Since
the temperature distributint used in the model corresponds to a time of
150 seconds cur computed K should be compared to the ORNL value of7
-1/279.75 MNm A first computation performed with the nodal spacings.
listed in Table 2.1 however yielded a value of only 31.77 MNm- .
One possible source of this discrepancy is the dependency of the,
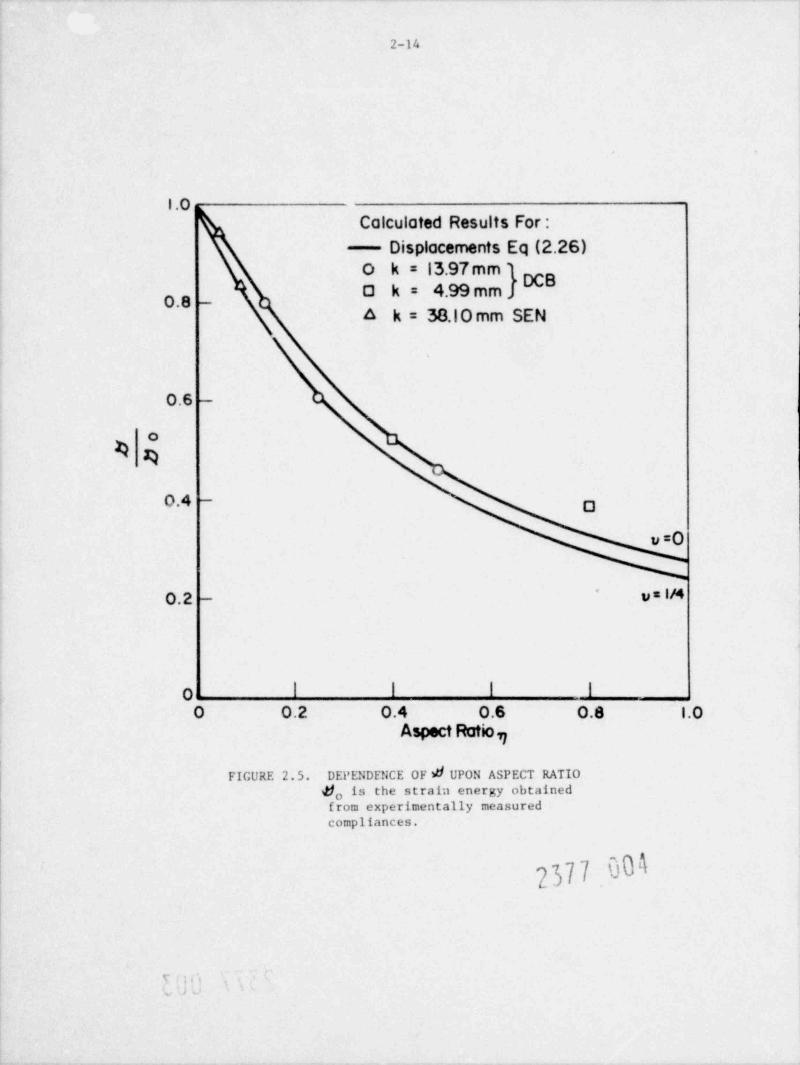
stress intensity factor on the mesh aspect ratio *, For SEN and DCB specimens,
the computed value of d (or K) was found to be sensitive to this ratio(BMI-NUREG-1959). The dependence of 2)on the aspect ratio, r1, in these
cases is closely approximated by predictions obtained in closed form for
a center crack plate ( B MI-NUREG- 19 59 ) . These results, which are reproduced
in Figure 2.5, hold for specimens of various shapes. For this reason, we
assume that these curves may also be used to estimate the ef fects of aspectratio in thick-walled cylinders. Thus, in the present case an aspect ratio
of 0.034 yields a correction f actor of 0.96, which in turn yields a correctedc rrvalue of K , K = 33.1, st ill f ar below the ORNL value.
7 7
*For the case of a polar mesh, the aspect ratio is defined as the ratio ofthe spacing between two consecutive nodes in the radial direction dividedby the same spacing in a circumferential direction. Since the latterspacing is a function of the d! stance from the center of the cylinder, itis arbitrarily evaluated at the depth where the crack tip is located,
, , . \m .
i& v' '
2377 002>-
90
80 -
.
70 -
.
.-
60 -
.
K (MN m-it2)y
2 50 -
5m5H40 -
* mLw
30 -
20 -
NuNN IO -
oOu I I IO
O I 2 3 4Time, minutes
STRESSINTENSITYATh=dBoltFIGURE 2.4. 0.5 AS A FUNCTION OF TIME ELAPSED SINCE THE START
OF TSE-4 (Cheverton an , 1977).
2-14
1.0Calculated Results For:
Displacements Eq (2.26)o k = 13.97 mm
DCBO k = 4.99 mm0.8 -
a k = 38.lO mm SEN
0.6 -
o
4
0.4 -
O
v=0
0.2 - v = 1/4'
0 | I I I
O 0.2 0.4 0.6 0.8 1.0
Aspect Ratio.9
FIGURE 2.5. DEPENDENCE OF d UPON ASPECT RATIOd is the strain energy obtainedofrom experimentally measuredcompliances.
2377 0o'\~
s- ...,>0

2-15
A second possible source of error is that the angular spacingbetween nodes is too large to model the strains that occur near the crack
tip accurately. The ORNL computations indicate that for cracks deep within
the wall, bending of the elements occurs near the crack tip (S. K. Iskander,1978). This is exemplified in Figure 2.6 where hypothetical radial displace-ments for points situated along curve A' A B are shown. Since the model
assumes that the strains vary linearly between nodal points, the real dis-placements shown by the solid curve are approximated by the dotted lines,thus introducing considerable errors near the crack tip. The only way tocircumvent this difficulty is to reduce the angular spacing between nodes.Several computations with different angular spacings between nodes andvarious aspect ratios were performed. The results are shown in Table 2.2
and also in Figure 2.7. As can be seen K increases as A$ decreases.7
However as A4 decreases, the aspect ratio increases, thus requiring a largercorrection factor on K . This accounts for the bending over of the7
uncorrected curve. After K is corrected for aspect ratio effects, a smoothg
curve through these points easily extrapolates to the ORNL value (K =
79.75 MNm-1/2) or else to a slightly higher value isolid line). The latter
is in agreement with Iskander's view (1978) that the ORNL value is an#underestimate.
Past experience has shown that the computed K should be withinapproximately 107. of the experimentally observed value to generate reliabledynamic results. In this case a model K of about 70 MNm' ! wotdd bey
acceptable. For at = 2.5*, the solid curve in Figure 2.7 yields K ' " =y
-1/2 "I79 MNm . If the aspect ratio is 0.134, = 0.88 and the expectedconK
Imodel value is K = 69.52 MNm-1/'.'
Such a computation requires 144 nodes in a7
circumf erential direction (74 after symmetry considerations are taken into
account) and 130 in a radial direction for a total of 9620 nodes. A compu-
tation of this magnitude can be accommodated on our computer with onl- minormodification" to the existing algorithms.
2.2.2. Dynamic Analysis of Fast Fractureand Arrest in TSE-4
The model aescribed above has been used to analyze the thermalshock experiment performed by Cheverton and Bolt (1977). The dimensions
,
e'2'
2377 005
4#h).$,b)*' k+k
'
<> ---TEST TARGET (MT-3)
|.0 W M U LA
y @ E4I.I [fa EE
I.8
'l.25 1.4 1.6
< 6" =
MICROCOPY RESOLUTION TEST CHART
#4 #+ 4%*%?h?' |%'4+fO%#
.
4. _. 2_ , _ . _ =_ . _ . :

2-16
7
i
A' A. . . . . . . , ...... .. m .............
'N
i B
i
d1
I
I
i
_.
FIGURE 2.6. IIYPOTHETICAL RADIAL DISPLACEMENTS (SOLID CURVE) FOR POINTSALONG ARC A'AB ARE APPROXIMATED BY DOTTED LINES IN OURMODEL WHICll ASSUMES THAT STRAINS VARY LINEARLY BETk'EENADJACENT MODEL POINTS (SUCll AS A AND B OR A' AND A)
.
2377606
> ,. ., , . , -,
Lo; \.,
t.

2-17
TABLE 2.2. VARIATION OF COMPUTED STATIC STRESSINTENSITY K WITH ANGULAR SPACING1
BETWEEN NODES AND ASPECT RATIO
Angular Aspect CorrectionSpacing Ratio Factor on K corrgBetween dr Obtained from I I
Nodes, A$ n= rd$ Figure 2.5 From Modal
25.71 0.034 0.96 31.77 33.1
25.71 0.016 0.98 30.54 31.1
12.86 0.0672 0.94 56.11 59.7
6.43 0.2688 0.77 55.57 72.2
6.43 0.1344 0.88 62.58 71.1
6.43 0.075 0.91 62.09 68.2
2377 007
.'p...y
2-18
90
ORNL value obtained using finite elements80* s
N
70o
NN
$ 60 -*N
% NE NN9Z2 N:A \\32 - *gE \
\E \H\
$ 40e5 s
30
'
,
.,
20 -
10
! !0O 5 10 15 20 25 30
Angular Spacing Between Nodes,A$(degrees)
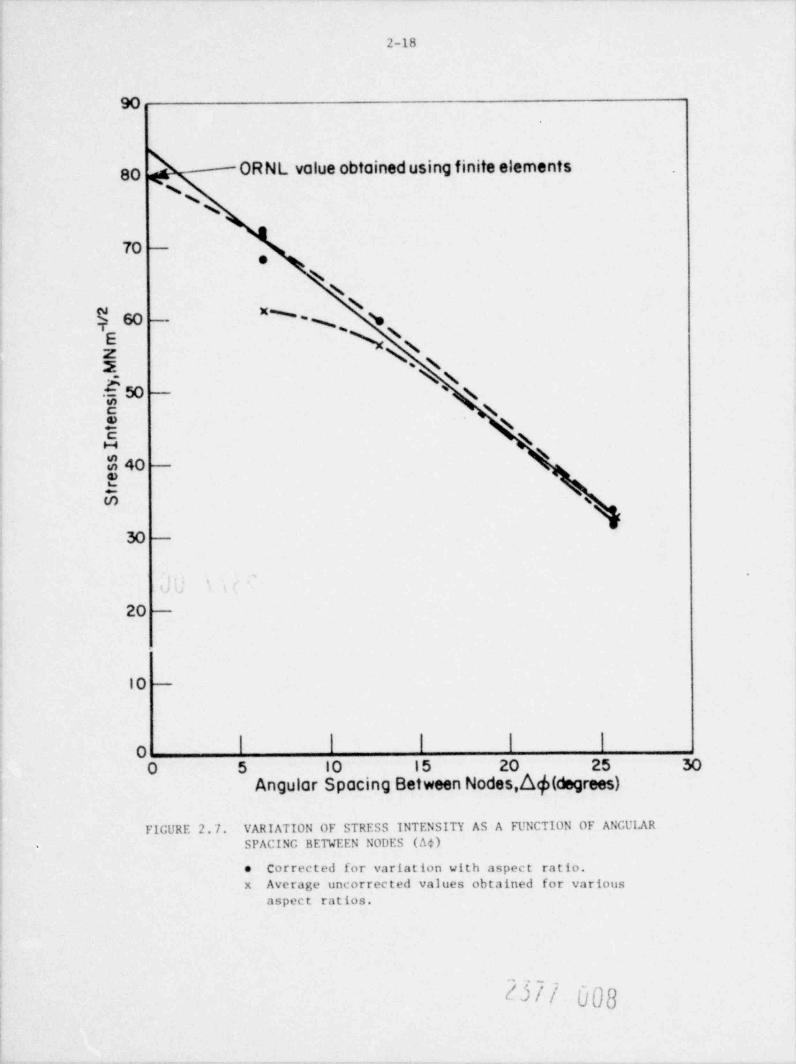
FIGURE 2.7. VARIATION OF STRESS INTENSITY AS A FUNCTION OF ANGULARSPACING BEWEEN NODES (A1)-
e Corrected for variation with aspect ratio.x Average uncorrected values obtained for various
aspect ratios.
*) i ; ;
!! b
2-19
and elastic properties used at ORNL are given in Table 2.1. The material,
A508 steel in an "as-quenched" condition, simulates strength and toughnessproperties of irradiated pressure vessel steel. In TSE-4, the flawed
cylinder was heated to 550*F, and rapidly cooled by pumping a methylalcohal-water mixture cooled to -25 C, through the interior cavity.
Instrumentation monitoring the originally 11 mm long axial flaw revealed thecrack propagated after 150 seconds of cooling, and subsequent trepanningshowed the crack penetrated an additional 11 mm during the run-arrest event.
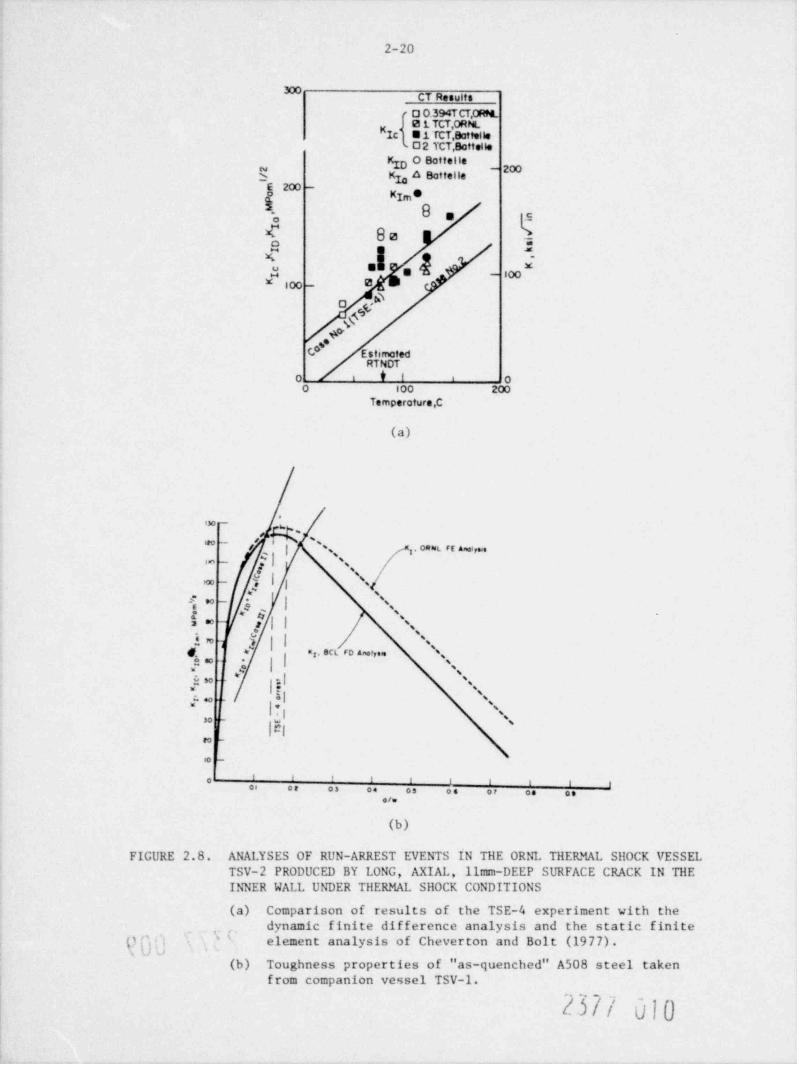
The temperature distribution inserted in the model is shown in
Figure 2.3 and the variation of K with temperature in Figure 2.8a. Theg
finite difference grid was constructed by dividing the circumference into14 segments and the wall thickness into 50 segments. As was mentioned in thepreceding section, this grid size yields excellent agreement between themodel and finite element calculations for short crack lengths.
Several dynamic calculations pertaining to TSE-4 were made. For
each case the initial crack depth and the stress intensity factor at thetime of initiation (K ) were taken to be 11 mm and 112 MNm-q , respectively;
it was assumed that K / f( ), and thus K =K (Other applicable dataID g ID.are given in Table 1.) For the first calculation and as a first approxima-tion, it was further assumed that K was
Im nly slightly less thatn K atgthe initiation temperature, and the K vs temperature curve was approximatedg
by the linear relation identified as Case 1 in Figure 2.8a. Results of this
calculation indicated a crack jump of 6 mm compared to the actual jump of12 mm. As shown in Figure 28b, the dynamic stress intensity factor at theinstant of arrest is nearly equal to the static value, indicating thatdynamic ef fects for a 6 mm crack jump in TSE-4 are small; the time of propa-gation for this crack jump was 125 ps.
The calculated crack jump can be increased by decreasing K and7m,thus for the second calculation the K
Im in Figure 2.8a (Case I) wascurve
shifted to the right an arbitrary amount (%58 C); this K versus temperaturegcurve is referred to as Case II. The result of this calculation was a crackjump of 19 mm with a propagation time of 130 us. Once agin, as shown in
Figure 2.8b, the dynamic stress intensity factor at the instant of arrest is
nearly equal to the static value, ind fcating small dynamic ef f ec t s for the19 mm j ump a s well .
2377 009
s7 ., . ,
a ~''
2-20
*CT Results
u O.394TCT,0RfC0 L TCT,ORNL
KIC E i TCT,Bottelle02 TCT,Botteile
K O Bottelleg3 K A Bottelleya
f KIm '2- 8
'-c
O
E BB -
a :w -
a xa n00.00 _ ex
9@ Estimated
RTNDTI I ' OO i
O 100 200Temperature,C
(a)
ISO -
88 0 -
e ,| |%
, ,, o==t n aw,..,*,,- -- .
a - || ',..--i " - 3 | \,
s ~, -i ~~ >|\ ~,
3 ',[m - |a -
'm , act ro a i,.. 's ,*
a
,2 " *j || ',,
& s0 ,I ',
| 's=
-l ',.s .o -
Il,',
30 - w g
e9 -|Cl
s0 -
' ' '0 ' I l ! I l 108 02 03 04 03 Os OP 00 09.i.
(b)
FIGURE 2.8. ANALYSES OF RUN-ARREST EVENTS IN Tile ORNL TilERMAL Sil0CK VESSELTSV-2 PRODUCED BY LONG, AXIAL, llmm-DEEP SURFACE CRACK IN TileINNER WALL UNDER TilERMAL S110CK CONDITIONS
(a) Comparison of results of the TSE-4 experiment with thedynamic finite difference analysis and the static finite, ,.
' '
() { g element analysis of Cheverton and Bolt (1977).
(b) Toughness properties of "as-quenched" A508 steel takenfrom companion vessel TSV-1.
2371 010
2-21
The results of these two calculations show that the actual crackj um r- mm had essentially no dynamic effect associated with it, and thusK is nearly equal to the static value of K at arrest calculated for TSE-4Im
7
For the given set of assumptions mentioned above, the value of K at 131*Cgrequired for a dynamically calculated crack jump of 12 mm is 124 MPam1/ '' .
The small dif ference between this value and the value of K at arrest calcu-g
lated by Cheverton and Bolt (1977) using a finite element analysis (K, =
127 MPam1/2) is attributed to dif ferences in the degree of refinement of the'
mesh (see Section 2.1.1) rather than to dynamic effects, with the finiteelement value the more reliable of the two.
The crack arrest theory, i.e., K7_Kg, tested by comparingis
the calculated value of K with measurements of K the crack arrest tough-7 g,ness measured independently on small laboratory specimens of the TSE-4
material at the temperature at the point of arrest. Such measurenents havebeen performed at.d are discussed in Section 4 The estimate of crack arrest
* h 134 MPam /2' 1toughness obtained K agrees with the calculated value K =
127 MPam /21
within the uncertaint'les that must be attached to both numbers.Figure 2.8b illustrates that a finite difference analysis employing K =
134 MPam /2g1
would predict a c m k extension of about 9 mm for the TSE-4,again in reasonable agreement with the experimental result of 12 mm.
The important conclusion to be drawn is that the analyses andmeasurements support the predictive capability of LEFM for crack arrest ina cylinder under thermal shock conditions.
2.3. Dynamic Calculation of a 1.ong RadialCrack Jump in TSE-4
The negligable dynamic ef fects associated with the relativelysmall crack extensions in TSE-4 (Aa 0.08) do not preclude significant=
wdynamic ef fects for circumstances producing a large crack extension. To
examine this possibility another analysis was perf ormed, this time assumingthat the toughness was not only independent of crack speed (as was the casein the first computations) but also of temperature. Furthermore, the value
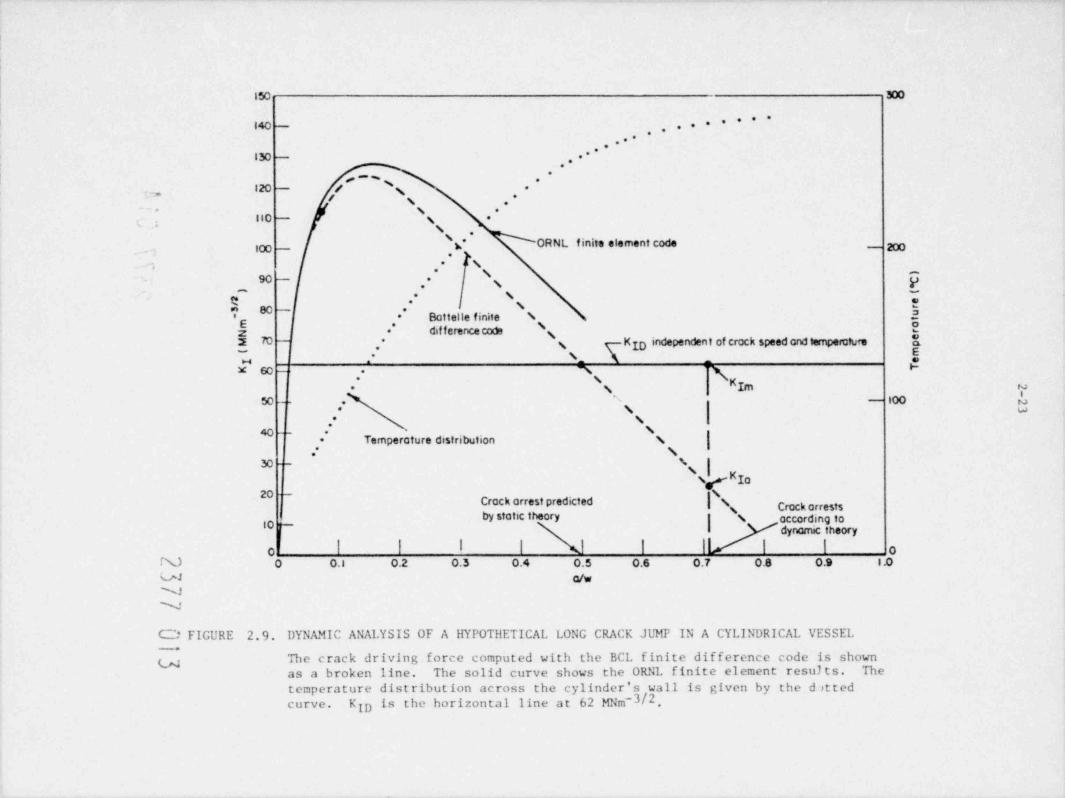
of K ~ ~ =ID Im Ic was se ec M s d that accoding to the
static theory the crack would arrest at a/w = 0.5 (see Figure 2.9). The
temperature gradient across the cylinder's wall was the same as the one usedin the t.revious computations and corresponded to a time of 150 secs aftercooling started.
2377 011.
3:c.
.c.
2-22
As was pointed out in Section 2.1.1, increasingly larger bending
moments accompanied by rapidly varying str: lins, occur near the crack tip asthe lat ter penet rat es t he cylinder 's wall . As a result, the local strainsare poorly modeled resulting in errors in the computed values of the strainenergy release rate.
However, these errors should not affect the outcome of the issue
under consideration. Indeed, the fine details of the K versus a/w are notg
expected to have a noticeable effect on the presence or absence of dynamiceffects in a long jump event. The only effect on t he computation is thatthe crack driving force as a function of a/w of the model test piece isshown by the dashed curve in Figure 2.9 rather than by the solid curveobtained from the ORNL finite element computation.
The growth of the crack as a function of time is shown inFigure 2.10. The total event lasted 400 microseconds. At this ie , the
crack arrested af ter having propagated 93 mm, starting from an initial flaw11 mm long. As shown in Figure 2.9, according to the static theory, the
crack should have arrested at a/w = 0.5 or after a propagation of 62 mm.
Thus, the static theory underpredicts the crack jump distance by 50%. Also
notice from the figure that at the point of arrest K :s approximatelyI"
-3/' -3/'920 MNm ' while K is 62 MNm . Both these observations illustrate that
Imin this particular case, and for deep penetrations in general, the dynamiceffects can make important contributions to the cract arrest condition.
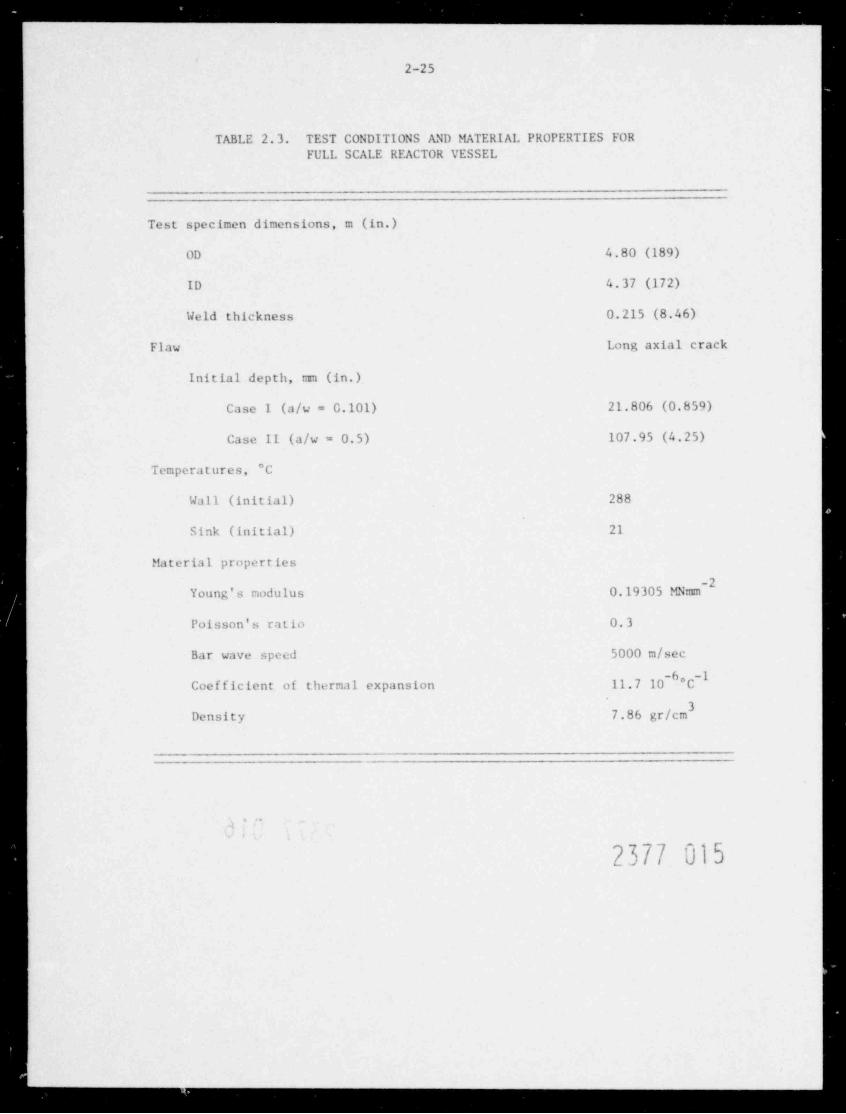
2.4. Application of Dynamic Radial Crack Analys s to Full-ScaleVessel-Type Cylinder Geometry
Preliminary calculations have been performed for a radiallycracked cylinder having dimensions comparable to a full-scale reactorpressure vessel in an effort to examine the mesh size andmesh aspect ratio requirements for this geometry. The dimensions andelastic properties of the cylinder are listed in Table 2.3. Since no
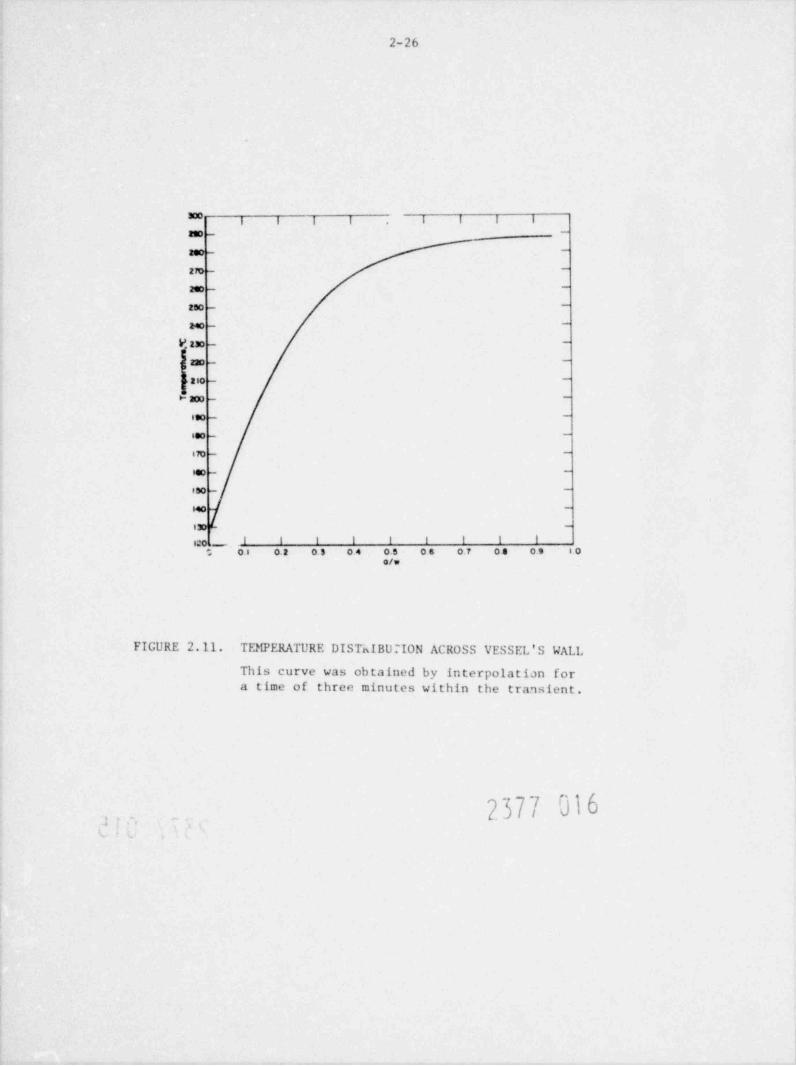
experiments have been performed on full-scale vessels, an arbitrary time ofthree minutes within the transient was selected to perform our static
computations. The estimated temperature distribution across the cylinder'swall at that time was obtained by interpola tion f rom data furnished byR. D. Cheverton (1978) and is shown in Figure 2.11. The same dimensions and
[ ' t',<
,
O
2 , ., 7 0121 1
3//
150 300
.*****'140 - ,,
**130 - ,.
,
*p=~* .
120 - / g *_ , ,
# N .*
gio -\ **
.gN' ORNL finits element code100 - .h - 200
\*,
\ y90 - . g,
."-
N.
~
Battelle finite N*
h \ E*
difference cos* g2 70 ID ndependent of crack speed and temperctureiK. g,
s . \_ \*e~m xx so .
.' KIm Ns'50 -. . - 100 w
N we
\**
N40 __ .
|Temperature distribution N.
.- s|
30 -- N
N Kya20 -
Crack arrest predicted |N Crock arrestsby static theory \ occording to
10 F dynamic theory
| | | | | | | | | 0oN O O.1 0.2 0.3 0.4 0.5 0.6 0.7 0.8 0.9 1.0VJ o/wNJN
O FIGURE 2.9. DYNAMIC ANALYSIS OF A HYPOTHETICAL LONG CRACK JUMP IN A CYLINDRICAL VESSEL-.
The crack driving force computed with the BCL finite difference code is shownuas a broken line. The solid curve shows the ORNL finite element results. Thetemperature distribution across the cylinder's wall is given by the dsttedcurve. K is the horizontal line at 62 MNm-3/2,
ID

2-24
110
100 -
/ '
90 - ..
V =320 m/sec .7V=50 mhec *
,
00 -t. * /
/
)- s70 - ,
V=l000E m/secE,
j 60 -
e io ,sX48 50 - 1
0 *.-
40 -
30
20 -
|4,
10 p ;
0 i | | 1 I I I0 50 100 150 200 250 300 350 400
Time.p-SFIGURE 2.10. CRACK CROWTil VERSUS TIME FOR llYPOTilETICAL LONG CRACK JtWP IN
CYLINDRICAL VESSELS.. . * *
,
s ').
d' *
. . . . - - , . - - . - -
2-25
TABLE 2.3. TEST CONDITIONS AND MATERIAL PROPERTIES FORFULL SCALE REACTOR VESSEL
Test specimen dimensions, m (in.)
OD 4.80 (189)
ID 4.37 (172)
Weld thickness 0.215 (8.46)
Flaw Long axial crack
Initial depth, mm (in.)
Case 1 (a/w = 0.101) 21.806 (0.859)
Case II (a/w = 0.5) 107.95 (4.25)
Temperatures, 'C
Wall (initial) 288
Sink (initial) 21
tuterial properties
Young's nodulus 0.19305 MNmm'
Poisson's ratio 0.3
Bar wave speed 5000 m/see
Coefficient of thermal expansion 11.7 10~-*C
Density 7.86 gr/cm
. .
^
l
2377 015
---
_ . _ . . . .
2-26
I I I i | |
ano --
goo- -
270- -
200 --
tso --
240 --
Pam --
zio __-
ano --
$ 200 --
soo --
loo --
470 - -
leo - -
ISO- -
64 0 -
130 -
go ,_ . I I 1 1 I i i t i
O 06 0. 2 03 04 OS Os of og 09 toe/w
FIGURE 2.11. TEMPERATURE DISTh1BUTION ACROSS VESSEL'S WALL
This curve was obtained by interpolation fora time of three minutes within the tra'isient.
2377 016. .
% 3

2-27
gradient have been used by the ORNL group in their finite elementcomputations. Two static stress intensity factors were computed for thecrack tip positien at a/w = 0.101 and at 0.5. For these two positions, the
ORNL finite clement code yielded K values of 94 and 160 MNm- ,
7
respectively See Figure 2.12).
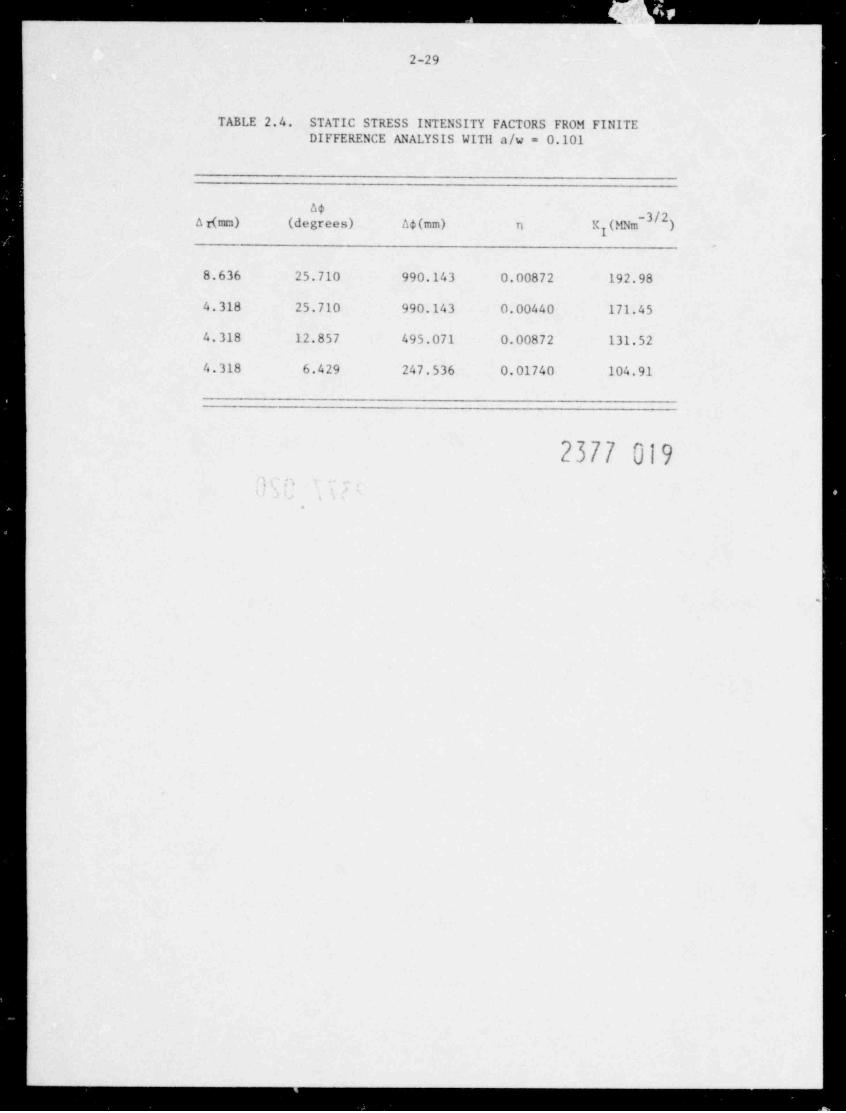
Our results for a/w = 0.101 are presented in Table 2.4. From this
table it can be seeh that agreement with the finite element value of
!94 MNm" improves as the angular spacing between nodes in a circumferentialdirection, A?, decreases. Notice that the computation with the smallest A?
yields the best agreement with the ORNL value, despite the fact that it hasthe largest aspect ratio of the four computations that were performed. Thisobservation clearly indicates that the error introduced by not accountingproperly for the bending near the crack tip overshadows the error introducedby an inappropriate aspect ratio. It is also interesting to note that the
stress intensities computed with Ge finite difference scheme are largerthan those obtained with the finite element codes, since in all previous
computations it was found that as a result of the use of inadequate aspect
ratios, computed values were smaller than other reliable values. This leadsus to believe that even an angular spacing of 6.5* is inadequate to model
the bending effect correctly.
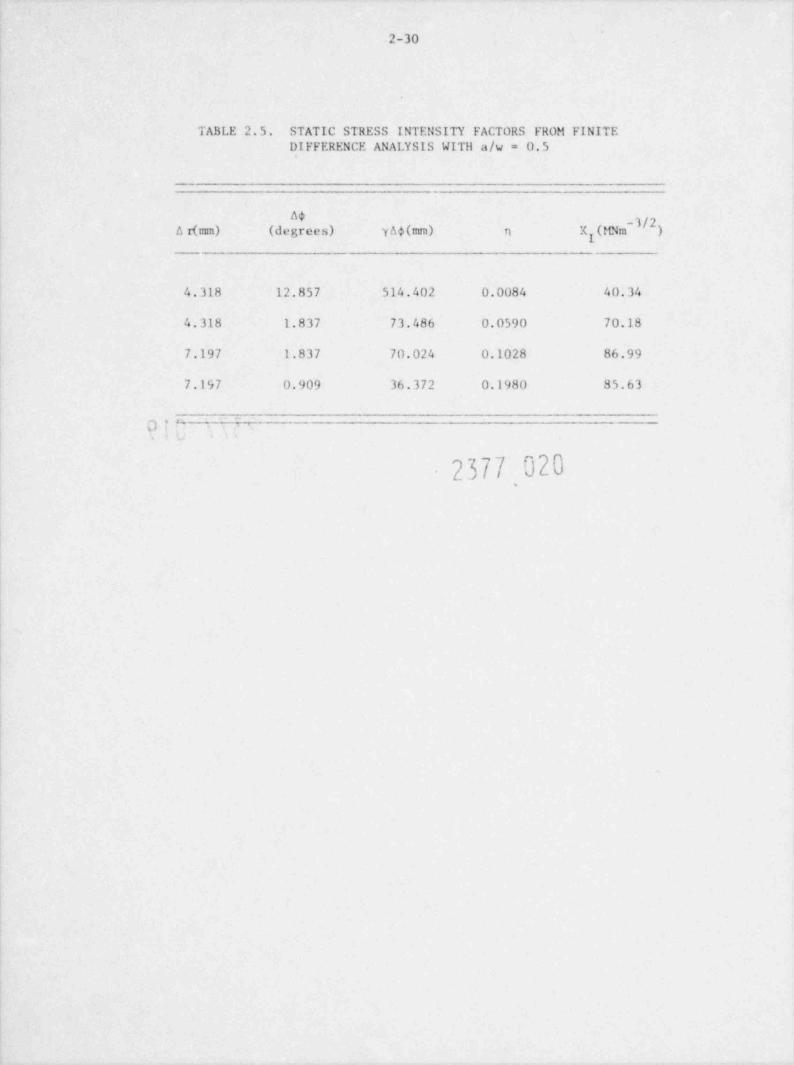
Similar results obtained at a/w = 0.5 are shown in Table 2.5.The agreement with the ORNL value of 160 MNm- is poor even for the
smallest at of less than 10, Indicating that a further reduction in At willbe required. Ilowever, since the laut computation already required nearly12,000 nodes, it is now clear that variable nodal spacings will have to be
used in the future. Assuming that a At = 0.5* is adequate near the crack
tip--say for the first 5* -- while elsewhere a A; = 10* is appropriate, atotal of 30 nodal radials would be required. If an aspect ratio of 0.06 is
required, the spacing between nodes along each radial must be less than1.20 mm, i.e., 180 nodes will be required along each radial, thus bringing
the total number of nodes required by the computation to 5400, i.e., less
than half the number required formerly. Even if an angular spacing of
0.25 degrees should be required near the crack tip, no more than 14,000nodes. would be required by the model. The equations required to accommodate
variable grid spacing have already been worked out and are currently being
programmed.
2377 017

2-28
240| I I I I
a/w = 0.5220|
-_
l200 -
i -
|
180 1 --
|160 -
-
,N;;; 140 1 -
-
'I
E 12 0 I --
j a/w =0.101100-
I --
*I
80| -
-
|60 -
g -
140 | -
-
|20 -
|-
0 I I I I I l l0 1 2 3 4 5 6 7 a
Time , minutes
FIGURE 2.12. STRESS INTENSITY FACTORS AS A FUNCTION OF TIME WITilIN TileTRANSI f.NT ORTAINED USING Tile ORNI. FINITE El.FMENT CODE
2377 018
.- -
s..! t
s
'~
___
_
2-29
TABLE 2.4. STATIC STRESS INTENSITY FACTORS FROM FINITEDIFFERENCE ANALYSIS WITH a/w = 0.101
AtAr(mm) (degrees) A4(mm) n K (MNm~ )
_
8.636 25.710 990.143 0.00872 192.98
4.318 25.710 990.143 0.00440 171.45
4.318 12.857 495.071 0.00872 131.52
4.318 6.429 247.536 0.01740 104.91
2377 019...
.
.
m
-
. - - . . .
2-30
TABLE 2.5. STATIC STRESS INTENSITY FACTORS FROM FINITEDIFFERENCE ANALYSIS WITil a/w = 0.5
___
A r(mm) (de rees) yA)(mm) r) X (MNm )
4.318 12.857 514.402 0.0084 40.34
4.318 1.837 73.486 0.0590 70.18
7.197 1.837 70.024 0.1028 86.99
7.Ir7 0.909 36.372 0.1980 85.63i
, 4.;-)
2377 020.

- - - - - - - - - . _ _ . _ . . , ___
2-31
2.5. Formulatior. for the Dynamic propagation of aCircuaferential Crack in the Wall of a Cylinder
In the following a numerical method is developed for the solution of
the problem of the dynamic propagation of a continuous circumferential (penny-shaped) crack emanating from the inner surface or a long hollow circular
cylinder and advancing through the wall toward the outer surface (see Figure2.13). In addition to a uniform internal pressure the cylinder is subjected
to an axisymmetric thermal shock which produces an adverse temperature gradientthat tends to cause the crack to extend. The plane of the crack is assumed to
be a plane of symmetry. Because of the axisymmetry of the loading the
circumferential displacement is zero and only spatial variations in the sxial
and radial directions are permissible. Inelastic deformations except those
permitted within the confines of linear elastic fracture mechanics in the
immediate neighborhocd of the crack tip are neglected. The influence of the
advancing crack tip on the temperature field is ignored. The development
presumes that the axisymmetric temperature distribution is known a priori
and that it does not change significantly during the fracture event.
2.5.1. The Equations of Motion
Because of the axisymmetry the radial displacement u and the axial
displacement w depend upon the radial coordinate r, axial coordinate z and
time t. As a consequence the nonzero strains are
b E bc =
rr 3r c$$= c =
r zz az
f I
h { + jj (2.7)c -.
rz
A l
The strain energy density U for a linear elastic isotropic reaterial reduces9
to
2L377 021
-.
- - - - - -
- - - - .

TO
\ f\ /
\ /s /
'% + -~ K
_ CA' R
~ C ,
s ' LA- N IT
/ N NE
/ \ R! \ E
FMUCRIC
SUOUN) I
_ _ T_ _ O
N
_ _C
A_ _ H
_ _TI
W_ _ R_ _ E
D_ _ N
I
_ _ LY
_ . C.I .
.
Rd Lp!1| |1l 13V AJ
_i1| || i13_ LU
_ C. R_ _ I
_ _ C \
_ _ .
3
_ _ 1z .
_ _ 2
_ _ ER
_ _ UG
_ _ I
F
_ __ _
, ,
_. -
NDNN ONNJ J

'
2-33
f(cG(c +c +c + 2c ) + +cg+c )U =
9
- (3A + 2G)a0(c +c +c )+ (3A + 2G)(ae)2 (2.8)
where G is the shear modulus and A is related to the modulus of elasticity
E and Poisson's ratio v by
("*(1+v 1-2v)
The change in temperature is denoted by 0 and a is the coefficient of thermal
expansion which is assumed to remain constant.
Vnen the finite difference method is used to integrate the govern-
ing equations, the cylinder is overlaid with a finite difference grid as
shown in Figare c.14 The nodal points become the dependent variables which
depend upon time. Because the only source of energy loss is through the
fracture process at the crack tip, it is imperative that the governing
equations exhibit this characteristic. Consequently, an entirely consistent
formulation is obtainable if Lagrange's equations are used to obtain the
equations of motion for the nodes, i.e.,
I \d 3L 3L
~ "v (2.10)dt 36 au +
( ij j ij
where
L T-U-W (2.11)=
in which T is the kinetic energy, U is the strain energy and W is the work
done by the applied loads. A superposed dot denotes differentiation with
respect to time.
,The strains of Equation (2.7) are replaced by the difference,
.,
expressions-
~2377 023

2-34
^Ro ,
&
R i >
:,, ,, ,, ,
i .,.'r ,, ,, ,, , ,, ,
Crack -r
:.10 ,PQ ,P+1Q ,, ,,,
ij + | i + 1j+1-c : ; , ;
1,, , ,, ,
r;
--,
ij i+1j__ . 1j --
,, , ,. N+1j.: : ,
n
Az ArOuter~
L Boundary: : : : : :, ,
iInner
Boundary11 21.
'' ' ' '' '' "
dZ2
Lower BoundaryAr ~T2
FIGlTRE 2.14 FINITE DIFFERENCE CRID FOR A CONTINL'0US CIRCIWFERENTI ALCRACK IN A CYLINDER
?377 024
,-.
. .
&

- . . . - . . _ _ - - - -_ _ _ _ _ _ _
2-35
i+11 ~ ij hg ,
rr or g&&,
rg
(2.12)
"ij+1 ~ "ij l_ "ij+1 ~ "ij , "i+ij ~ "ij, ,,zz Az rz 2 Az Ar j
When Equation (2.12) is substituted into Equation (2.8) which is integratedby the trapezoidal rule over the volume of a cell, then for an interior
cell having no exterior boundaries and not containing the crack faces thestrain energy is
e-
"f )2 I )2+ Il i+1j+1 ~ "ij +1
i + r +1)ArAzs EU = w(r +ij i 2 Ar Ar ; ~,
t
fu I fu I f Iu +13 fu +ij+1 I
,G 1 13+1 i i, , ,
# +1,( ij ( ij ( i+1 j ( 1 ; ,
~I )2 f )2~G_ "ij+1 ~ "ij "i+1]+1 ~ "i+ij
4 ._k
0* 0*A ( j
.
~f I2 f I2,G "ij+1 ~ "ij ,"i+1] ~ "ij "ij+1 ~ "ij . i+1]+1 ~ "ij +1"
,8 Az or_( ( Az Ar ;
I )2"i+1]+1 ~ "i+1j
."i+1j ~ "ij,
( Az or j
"i+1]+1 ~ "i+1] "i+1]+1 ~ "ij +1, ,Az Ar( j _
A_ "i+1] ~ "ij h "ij+1 ~ "ij,8 or r Az
_4 j
i+1] ~ "ij "i+1] "i+1 ] +1 ~ # +1]1, , ,0# # 0*
( 1+1 j
O : 2377 025
.
---
_ _ _ _ .
2-36
"i+1]+1 ~ "ij +1 "ij+1 "ij+1 - "ij, . .Ar r Az
( j
1 )2i+1]+1 ~ "ij +1 "i+1]+1 "i-lj +1 ~ "i+1]
4 , ,0# # 0*
( 1+1 1_
_ (3A + 2G)a "i+1] ~~"ij h, 1]+1 ~ ijg ,
4 ij Ar r Az ;
"i+1] ~ "ij "i+1] i+1]+1 ~ i+1]+ +Azi+1j Ar r ,y )g
"i+1]+1 ~ "ij +1 "ij+1 1]+1 ~ ij+
ij +1 Ar r Azg
+ O "i+1]+1 ~ "ij+1 "i+1]+1 i+1]+1 ~ i+1]gg , ,0# # Az
( 1+1 j_
7
+ (3A + 2C)a2 (g 2 + 0 +1j2,g 2 + g +13+1 ) (2 \ (2.13)
8 ij i ij +1 i
lJ
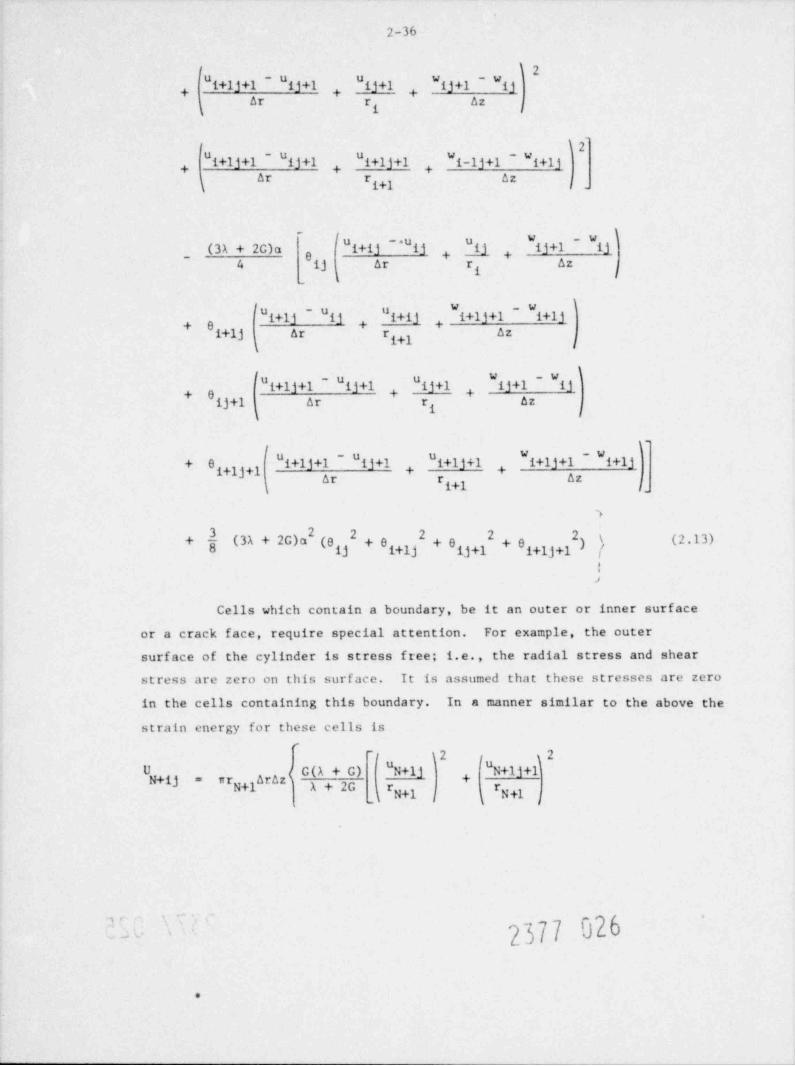
Cells which contain a boundary, be it an outer or inner surface
or a crack face, require special attention. For example, the outer
surface of the cylinder is stress free; i.e., the radial stress and shear
stress are zero on this surface. It is assumed that these stresses are zero
in the cells containing this boundary. In a manner similar to the above the
strain energy for these cells is-
2
"I"N+1])2 ;"N+1]+1U 4 c(A + c) ,,
+_( #N+1 j (#N +1 j
2377 026'
.
2-37
N+1j +1 - "N+1j GA "N+1j+1 ~ "N+1j "N+1j+1 + "N+1j+ 2 .
0* A + 2G Az r +1 4; (( j -r
N
_
_ G(3A + 2G)a "N+1j "N+1]+1g +1j , g
A + 2G N r N41]+1 r-
g g
\~("N+1]+1 - "N+1]
(g +1j ,g +1j+1),N N Az
( j-
N 3A + 2G)a 2 2'
( N+1j N+1j+1 } ( " '}+A + 2G
For a cell containing either the crack face or inner boundary but
not both or the lower boundary, the shear stress is assumed to be zero and
the normal stress to this boundary is taken to be a compressive stress equal
to the internal pressure p. The strain energies for these cells are
U n m / ( A + G) h "1]+1 \ lj +1 1j+ 2oj 1 \A+2G
=
r r Az
_( 1 l ( j k j -1
GA li + "lj +1 "lj+1 ~ ljA + 2G r Az
~
f )~_ G(3A + 2G)a 1
0 + 0 + (0lj + 0lj+1)A + 2G lj r lj+1 r Azy_
,
G(31 + 2G)a' 2 2
A + 2G lj lj+1 ), 0 0
*More precisely these expressions represent the potential energies becausethey include the negative of the work done by the pressure acting throughthe surface displacements.g:'''
2377 027-

. . _ _ . _ _ _ . . _ _ _ . ._
2-38
(
1+ 0 "1j + "1]+1p+ - P2(A + 2G) r 2Ar
"1] + "1j+1 j+l + 1jA_ + 2,
4(A + 2G) r A2y
,
-
+ G) ( lj + lj+1 2(A G)+ I) (' *
/ -.
~{ \2( + P+1Q PQ
w(r +r+1)ArAz(2(A+2G) 2U =
PQ P ArP (.
2'1 )2 f )21"P+1Q
12 q y
1" +1Q+1"P+1Q+1 ~ PQfl PQ+1 P+ 2 , + +I
1 IP} ( P+1 / ( P j ( P+1 1
~f ) I hh "p+1Q "p+1Q ~ "pQGA,
2(A + 2G) r r Ar( j
\~i"pQ+1 "p+1Q+1) 1"p+1Q&1 - "pQ+1, ,
0#(# # +1p 1 ( j _p
_
_ G(3A + 2G)a P+1Q PQ+10 + ,g
2(A + 2G) pQ r 0 +1Qp r pQ+1 r
_
P+1Q+1 " +1Q PQP 3+ (0pQ + 0 +1Q)g +1Q+1,
p Ar qp r
1 \'
P+1Q+1 PQ+1
+ (0PQ+1 + 0 +1Q+1)P Ar
G(3A + 2G)a 2+ 2 2+ 2 p
2(A + 2G) ( pQ p+1Q pQ+1 p+1Q+1 ) - 2(A + 2G)+
.2377 028'
- _ _ _ _ _ _ _ _ _ _ _ . . ..
.__ _ _ ,_
2-39
n "pQ "p+1Q ~ "pQ+1 - "p+1Q+1, 4(A + 2G) Ar
pA "p+1Q - "pQ,2 Az j
i )p+1Q+1 pQ+1 p+1Q PQ+1 p+1Qtl+ 2 , , , ,
0# #k 1 p # +1 #
p p # +1 .p
+ p(0pq + O +lQ + OpQ,7 + O ,1Q,y) ) ; I 5 p < P. (2.10x+g p p
.
Because of the pressure acting on the surfaces of the crack c .er
cell OQ, it is assumed that both normal stresses are compressive and eg ilto p. The strain (potential) energy for this cell is
Ff )2 f 12
OQ "I'0 + #1) Araz( - a0 + - a0U "y, 7Q r 1Q,); ,
s
- -
_ 4(A + G) _ E"10&l ~ "lQ "lQ "lQ&1p ,
2 Az or- .
Ap "lQ "lQ&l (3A + 2G)ap+ (07Q + 03Q,1) ) . (2.17)- 4(A + G) r 4(A + G)y
.
For the cell U containing the crack tip which is assumed to bep
in the center of the cell
'
ff j2 f )2 f 2
wr +1 Araz ( 2-+0 +1 1 1 +19U + +=
PQ P Ar ( Ar rpq,
2
f"P+1Qtl3r 3 2-
P+1Q+1 - "P+1Q, + 20*
( # +1 j ( j_
P'
,
2377 029
_ _ _ . . _ _ .
. . . . _ . _ _ _ _____
2-40
i2~f"P+1Q+1 ~ "P+1Q_"P+1Q ~ "M f"P+1Q+1- u +1QG. p, ,
4 AZ Ar} Az
"P+1Q+1 ~ "PQ+1Ar j ~
I
, A_ P+1Q ~ "PQ _"P+1Q "P+1Q+1 ~ "P+1Q4 .8 Ar *
r ,7 Az
I"P+1Q+1 ~ PQ+1"P+1Q+1 "P +1Q+1 ~ P+1Q1 2 ''
, , ,0# # 0*
A P+1 j ,
-
f f
_ (3A + 2G)a P+1Q ~ "PQ "P+1Q "P+1Q+1 ~ "P+1QO +1Q2 P Ar r Az jpq
1 )~"P+1Q+1 ~ "PQ&l "P+1Q+1 "P+1Q+1 ~ "P+1Q
0 +1Q+1 (+ , ,
P Ar r Azpy
,
I \,
3(3A + 2G)a' 2 2 ),g +1Q 0 +1Q+1 j
+4 P P
.~
"I"P+1Q}2 f f2-u u ,79,7 pq,7
-uG(A + G) pq p+ wr ArazP A + 2G Ar
( j Ar
Iu fe I, PQ } PQ+1
g j (#P P j_
CA "P+1Q ~ "PQ "PQ PflQ&l ~ "IQ+1 "lQ+1,A + 2G Ar r Ar rp ( p_
2377 030
ou ,
,
- - - -
_ _ . . . .

..----
2-41
~
I )_ G(3A + 2G)a "P+1Q ~ "PQ "PQg ,
A + 2G , PQ { PjAr r
.
"P+1Q+1 - "PQ+1 "PQ+1,g 4PQ+1 ar r
( P j,
> f \G(3A + 2G)a' 2+ 2 I )+ }D"A + 2G
( PQPQ+1 + 0
/ 4(A + 2G) PQ + 0PQ+1k l
1 ){ "PQ "PQ+1+ .g "PQ ~ "PQ+1
_ 4(A + 2G) r
pA2 oz j p
i+ "P+1Q ~ "PQ "P+1Q+1 ~ "PQ+1 )
tr (2.18)-
i_
In oider to establish the strain energies for the cells having thelower boundary as a side and to establish the equations of motion for thenodes neighboring this boundary, the boundary conditions for this surface arerequired. Because the specific application of this analysis is unknown atthis time, the particular boundary conditions for the lower boundary areuncertain. For example, the end conditions for a test specimen may not bethe same as for the reactor component. Nevertheless three easonable
types of support can be identified.
The first is referred to as the axially restrained boundary forwhich it is assumed that axial displacement w and the shear stress vanish.
That is, there is infinite restraint in the axial direction but none
in the radial direction. This boundary condition also coincides with
the case of an infinitely long cylinder with periodically spaced cir-
cumferenttal cracks where the lower boundary is the plane midway betweentwo crack planes.
The second type of support which permits no displacement in theradial and axial directions is referred to as the fixed H undary. Thethird type may be viewed as a uniformly stressed boundary in which the axial
'f
( %
2377 031
-
- __. _.
2-42
stress is some uniform, prescribed value and the shear stress is zero on
the lower boundary.
The strain (potential) energies for the axially restrained boundary
are presented in the following and those for the other two conditions of
support in Appendix B. Thm former can be obtained from the previous energy
expressions by viewing the lower boundary as a plane of symmetry and invokingthe symmetry conditions. For the axially reserained lower boundary cell
q )2 'f )2 1 )2"E b
U' w(r + r + ) Araz + +=
I 0#( j _( #1 ) (#i+1 ; _
~1 )2 1 ) 2' ~I \2"il "i+11 A_ "i+11 ~ "il "il "il, g , , , ,
O# # 0*_k 0* ( 0* 1 _ _( 1 A1
"i+11 - "il "i+11 "i+11, , ,Of # OZ
( 1+1 j _
~
1 )- (3A + 2G)a "i+11 ~ "il "il "il+
4 il Ar r Az ;
I I'+ O "i+11 ~ "il , "i+11 "i+11g ,
k # +1 az0#1 j,
-
2 I I( "+ O +O ); 15 i4N (2.19).g gy
N i.
For the axially restrained inner lower boundary cell
-f "ll 12 (11 3 2- 2AG ll "11UC(A + c)nam + 4U
00 i A + 2G r Az + A + 2G=r Azy y
(
2377 032
p.; -
.
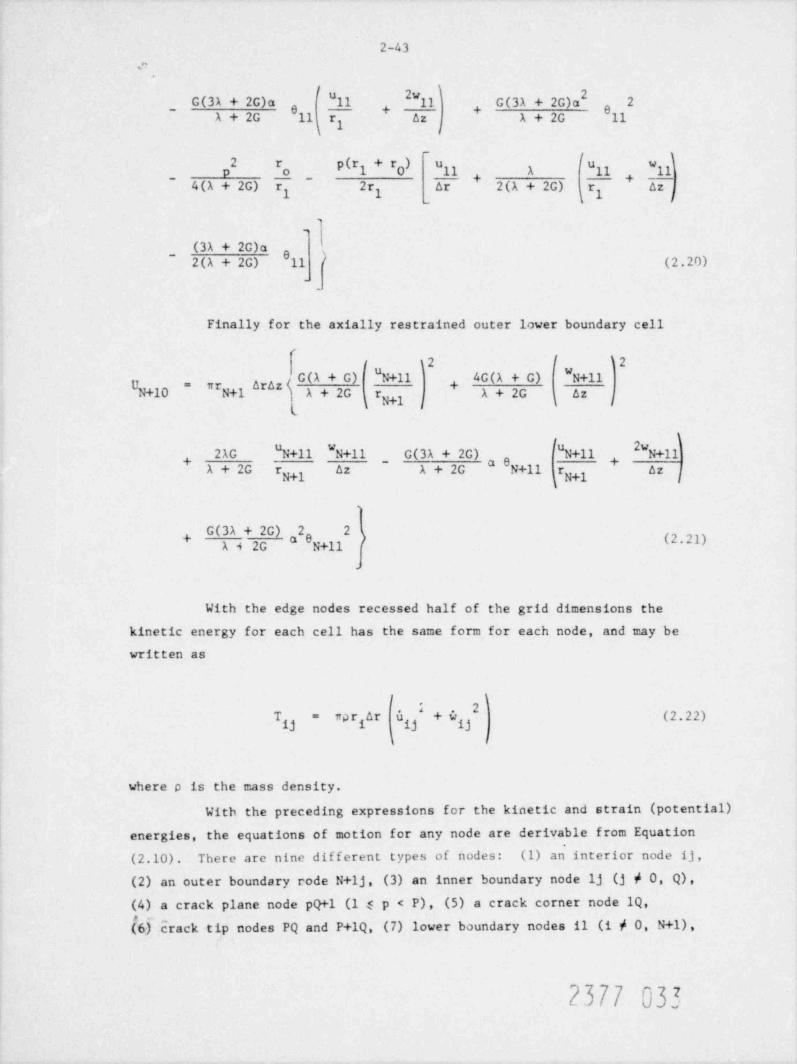
2-43e
2
~ G(3A + 2G)a "11 "11 G(3A + 2G)a 2+ +
A + 2G 11 r Az A + 2G 11y
# p(ry+r0 "11 A "11 "11p o , 44(A + 2G) r 2r Ar 2(A + 2G) r Azy
,
-
(3A + 2G)s0 ) (2.20)_ 2(A + 2G) 11
'
-
Finally for the axially restrained outer lower boundary cell
-
r 12 ( 12+ "+
nr +1 Araz ( +U +10
=
N N A + 2G r A + 2G Azg j
2AG "N+11 "N+11, _ G(3A + 2G) +a 0 +11 0*
+A + 2G z A + 2G N rr +1 NM jN
,
G(3A + 2G) 2 2
0 +11 (2 m )A4 2G N
-
With the edge nodes recessed half of the grid dimensions the
kinetic energy for each cell has the same form for each node, and may be
written as
f 1,
rpr Ar 6 '+4 (2.22)T =
k I
where o is the mass density.
With the preceding expressions for the kinetic and strain (potential)energies, the equations of motion for any node are derivable from Equation
(2.10). There are nine different types of nodes: (1) an interior node ij,
(2) an outer boundary rode N+1j, (3) an inner boundary node lj (j / 0, Q),(4) a crack plane node pQi-1 (15 p < P), (5) a crack corner node lQ,(6) crack tip nodes PQ and P+1Q, (7) lower boundary nodes il (i / 0, N+1),
2377 03?
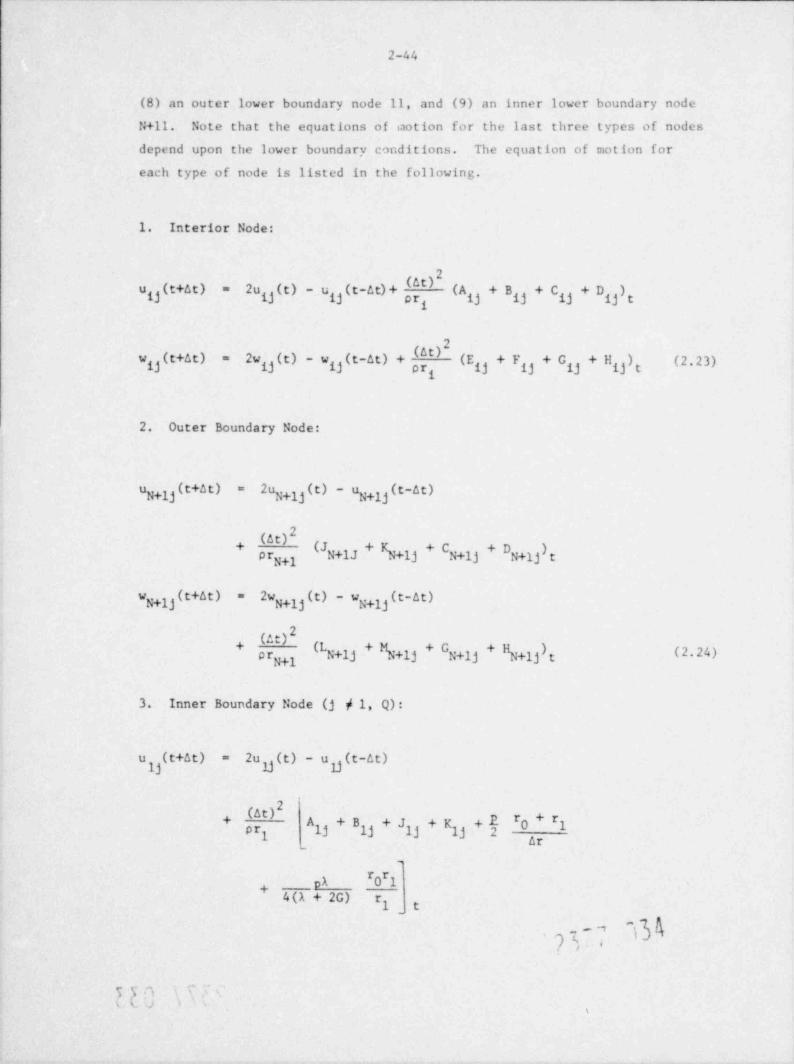
2-44
(8) an outer lower boundary node 11, and (9) an inner lower boundary nodeN+11. Note that the equations of iaotion for the last three types of nodes
depend upon the lower boundary conditions. The equation of motion for
each type of node is listed in the following.
1. Interior Node:
q(t+at) 2u (t) - u ( t-a t) + (A +B +C +D )u =
,
(t) - w )(t-at) + (0 (E, +F +G + 11w )(t+at) 2w gj)t 2.23)=g f r
2. Outer Boundary Node:
u +1j(t+at) (t) - u +U (E-U*)2u=
N N
N+1J + b+1j + N+1j + N+1j tpr,
w +1j ( +at) 2w +1j(* ~ "N+1j( ~ }=N N
(at)( N+1j + b +1j + N+1j + b+1j t (2.24)prpy
3. Inner Boundary Node (j / 1, Q):
u (t+at) 2u (t) - ug(t-at)=
*2+f#0+#1+ A +B +J +K
_ar
,
##pA 01
4(A + 2G) r y
7 ~5 }^b~
cs :. c,1 , . -
s

. . . - . . . - - y
2-45
ij(t+at) 2wyj(t) - wg(t-at)w =
+ (Eyj + F +L +M ) (2.25)
4. Crack Plane Node (1 < p < P):
2
PQ(t) - upQ(t-at) + (0 }P (t+at) = 2wu(BpQ + Dpq + Spq + VpQ)tprp
2wp (t) - wp (t-at) + (at)pq(t+at) (p + gi , p) (2.26)w =
P
5. Crack Corner Node:
yq(t-at) + (0u (t+At) 2u (t) - u B +P +s=
7q q_
\f )~ G(3A + 2G) f "IQ ~
IQ r
(r0+r}O+#1 gT
1+8(A + 2G) r 4 ory ;
Ap 0+#1#,
8(A + G) r y-t
I2 / pr
2w (t) - w (t-at) + (0 F +R -Iyq(t+at)w i g ,-m=
k A t
6. Crack Tip Nodes:
p (t+at) - 2up (t) - upq(t-at) + (0' +v + ii )(Bpq + Du
p p p
pq(t+at) 2wp (t) - wpq(t-at)w =
....,
p+rP-1 (2.28)r(At) y ,y, 7PQ ,gPQ PQ 4 azpr
p j
2377 035.
_ _ _ .
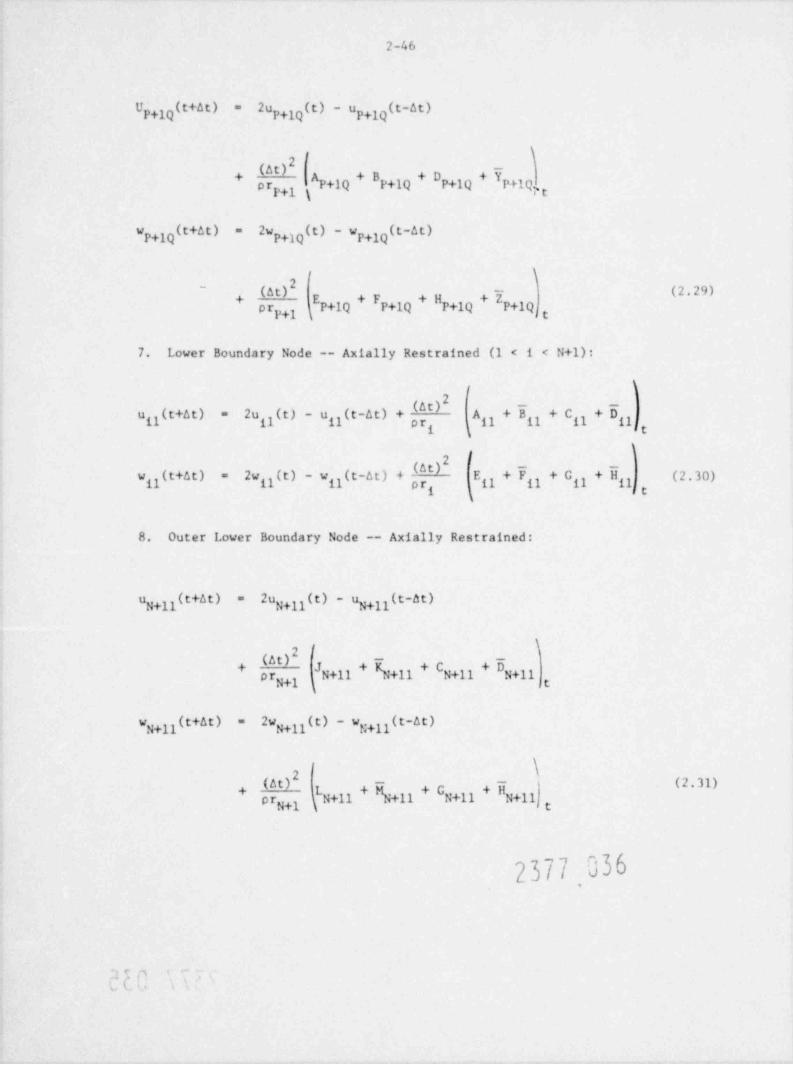
2-46
pgq(t+At) 2u ,yq(t) - upgq(t-at)U =p
\'2
A +1Q + B ,19 + D ,lQ + ippyQ+P p p
w ,19(t+At) pg q(t) - w ,79(t-at)2w=p p
\',~
(at)' (2.29)
(P+1Q+F+1Q+H+1Q+7+1QE,
P P Pp r +1 itP
7. Lower Boundary Node -- Axially Restrained (1 < 1 < N+1):
f )
y(t+at) 2u y(t) g(t-at) + ( gy + Bg+C y+DAu = -u
i t
I
2w y(t) - wg (t-at) + (g+Fg+Gg + iI (2.30)il(t+at) Ew = gi lt
8. Outer Lower Boundary Node -- Axially Restrained:
u +11( +0 } "N+11( } ~ "N+11( ~0 }"
N
(at)pr N+11 b+11 N+11 N+11
*NH
W +11(E*0E "N+11( } ~ "N+11( ~~
N
(at)2 (2.31)pr +1 N+11 , b +11 ,g +11 , g +11,+
N NN
2377 036
. .,
% k

2-47
9. Inner I.ower Boundary Node -- Axially Restrained
a
g(t+4t) 2uyy(t) - ug (t-At) + Ag+Bg+Jg+Kgu =
_
p(r r # #y0+ + PA 01
2Ar 4(A + 2G) r1 (2.32)
t
1 )
yy(t+4t) 2wyy(t) - wil(t-at) + (g+FE +Lg+Mgw =.y
1 lt
Expressions for terms in the right members of Equations (2.23) - (2.32) cetnbe found.in Appendix g. In addition the equations of motion for the lower
boundary nodes for a fixed and uniformly stressed lower boundary can alsobe found there.
2.5.2. The Energy Release Rate,
Based upon the energy-balance criterion for crack growth, the crack
tip will advance when G , the rate of energy released through the crack tipper unit of crack extension, is just equal to R, the energy absorption rateof the material, i.e.,
R(V,0) (2.33)G =
The latter is a material property which may be a function of crack speed Vas well as temperature. Woen the extension of the crack is modeled as the
instantaneous advance of the tip from the center of one cell to the center
of the adjacent one, the er.crgy release rate can be shown to be
(UPQ + U +1Q)b - (UPQ + U +1Q)aP P_3 ),
W>r(rp+rp47)
where the subscripts a and b are csed to denote the criant it ies af t er and
'before extension of the crack. The strain energies of cells PQ and P+1Qbefore advance of the tip are given by Equations (2.18) and (2.13).
respectively. The same quantities after advance of the tip can be deduced
from Equations (2.1(1) and (2.19), respectively.
2377 037.
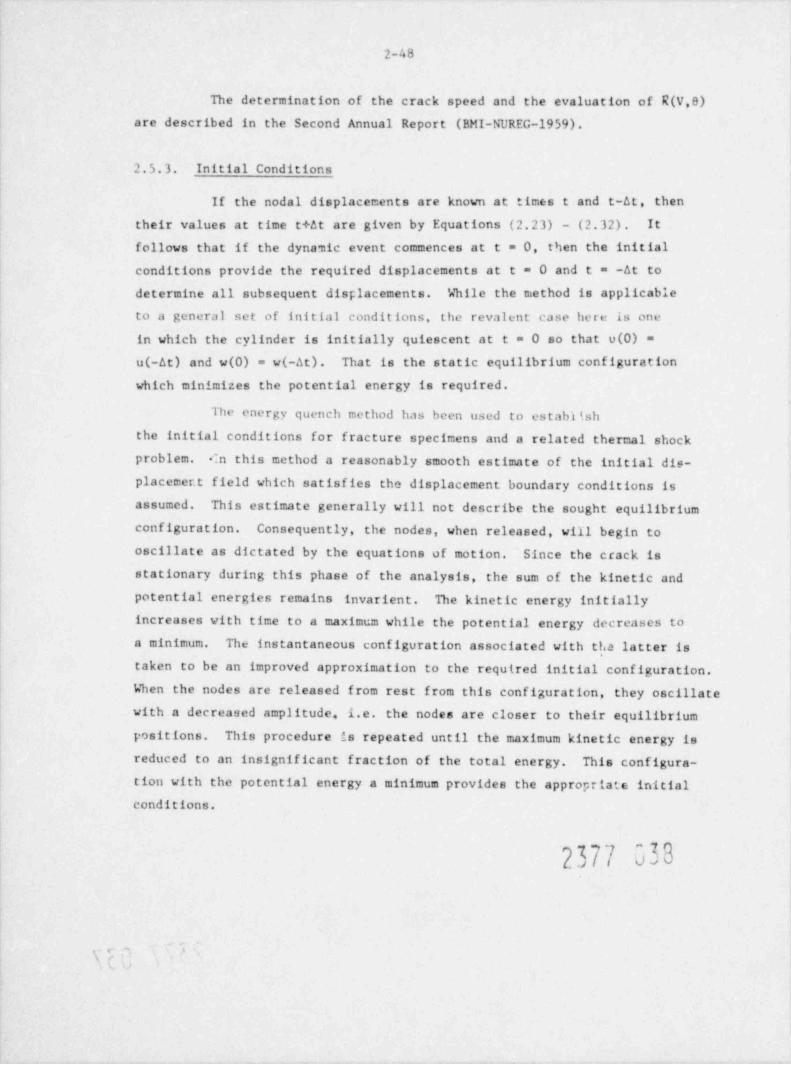
2-48
The determination of the crack speed and the evaluation of R(V,0)
are described in the Second Annual Report (BMI-NUREG-1959).
2.5.3. Initial Conditions
If the nodal displacements are known at times t and t-at, then
their values at time t+at are given by Equations (2.23) - (2.32). It
follows that if the dynamic event commences at t = 0, then the initial
conditions provide the required displacements at t = 0 and t = -At to
determine all subsequent displacements. While the method is applicable
to a general set of initial conditions, the revalent case here is one
in which the cylinder is initially quiescent at t = 0 so that u(0) =
u(-At) and w(0) - w(-At). That is the static equilibrium configuration
which minimizes the potential energy is required.
The energy quench method has been used to estabitsh
the initial conditions for fracture specimens and a related thermal shockproblem. :n this method a reasonably smooth estimate of the initial dis-placemer.t field which satisfies the displacement boundary conditions isassumed. This estimate generally will not describe the sought equilibriumconfiguration. Consequently, the nodes, when released, will begin tooscillate as dictated by the equations of motion. Since the crack isstationary during this phase of the analysis, the sum of the kinetic andpotential energies remains invarient. The kinetic energy initiallyincreases with time to a maximum while the potential energy decreases toa minimum. The instantaneous configuration associated with the latter is
taken to be an improved approximation to the required initial configuration.When the nodes are released from rest from this configuration, they oscillatewith a decreased amplitude, i.e. the nodes are closer to their equilibriumpositions. This procedure is repeated until the maximum kinetic energy isreduced to an insignificant fraction of the total energy. This configura-tion with the potential energy a minimum provides the appropriate initialconditions.
2377 038
. , ,
N
t
2-49
2.6. INFLUENCE OF Tile K -CMAC VELOCITY DEPENDENCE ONTHETESTPRACTfbEREFERENCECURVES
A proposed test procedure to determine fast fracture and crack-
arrest toughnesses has been submitted to ASTM, Dynamic Initiation-Crack
Arrest Task Group E24.01.06 (Hoagland, et al., 1977). This procedure is
valid for DCB and CT specimens and requires the experimental measurement of
the crack extension distance, aa, and the pin displacement at onset of
fracture. The stress intensity at initiation, K , is deduced from theglatter. The fast fracture toughness, K "" " * "E" '#"' " " " Y1D'is then obtained f rom two reference curves generated by our dynamic linear
analysis. The first one relates th. ratio K '" 0"' " "E ""ID Iaone gives the ratio between the a'.erage crack speed and the bar wave speed
as a function of Aa.
All curves were generated from computat ions in which K w"IDassumed to be independent of velocity. In actual materials it is unlikely
that this assumption is satisffed. However, experimenta1 observation shows
that this assumption does not lead to large errors in the K ID " """ "#"
velocity relation if (i) K is a s1 wly varying function of crack speed,IDand, (ii) the scatter of the experimental crack speed around an averagespeed is small. If these conditions are met, only a small portion of the
K v rsus velocity curve is sampled during a given event and it is reason-IDable to assume that for that pa icular event K is independent of crackgspeed. In the vast majority of all fast fracture events where velocities
have been experimentally measured, the second condition has been met. At
least in the case of steel, eatirely consistent results have been obtained,
indicating that the first condition is also met. ;,
Recently, however, it has been pointed out that in some plastics,
specifically Homalite 100 (Kobayashi, A. S., et al., 1977; Kobayashi, T.,
et al., 1977) and Araldite M (Kalthoff, et al., 1977), K varies rapidlyIDwith crack speed. Eventually, at a crack velocity of about MO m/sec, K
IDbecomes so large that the crack cannot propagate beyond t' . s limiting speed.
Ca the basis of this behavior, Fourney and Kobayashi (1978) have suggested
that our reference curves may have to be revised since, in their view, our
existing curves do not accurately reflect the rapid changes in K withID
ok 2377 039.
2-50
crack velocity. In light of their comments, a series of calculations were
perf ormed f or both lionalite 100 and Araldite. Figures 2.15a and 2.15b show
the re sult s obtained for Homalite 100. The solid curves are our originala o
reference curves for a DCh specimen with - 1.2, where a is the original11 o
crack length and 11 is the half-height of the specimtn. Two versions of the
one-dimensional analysis were used, one with a generalized f oundat ion, the
other one with the torsional springs removed, i.e., a kinkler foundation
(Gehlen, Popelar, and Kanninen, 1979). The original rtference curves wereobtained using the niulel with a generalized foundation and assuning that K IDis independent of crack velocity. Result s obtained using the same model but
with the elastic constants describing Ilomalite 100 are shown in the figures.
'l he excellent agreement between the t wo computat ions c learly ir : cates that
the referen e curves are not wnsi t ive to the elastic properties of the
material, Results obtained wit h the generalized foundation model and with
versuo crack speed relation furnished by Fourney (1978) and shownthe y gin Figure 2.16, iall on the original curve for small crack speeds and
slightly below that curve at higher speeds, as ebown in Figure 2.15h. Good
agreement is obtained everywhere for the Kg/K versus t.a curve (seeFigure 2.15a). Experimental points for llomallte 100 (Irwin, et al., 1977)
approximate this last curve closely.
ComputeJ points using the model with a Winkler foundation fall
considerably belew the previous crack speed versus Aa curves, however note
that point s obtained wit h a model that assumes that K * '" P"" "" "ID
crack speed and wit h a mode l using Fourney's K versus velocity relattong
fall on the same curve. Again, the K /K versus '.a /a is not sensitive toID Q o
the c ha n ge s brought to the model.
Figure .' .17 shows similar results ;or .raldite B. It can be seen
that when t he K versus crack speed relation given by Kaltboff, et al.g
(1977) is used, the computed points fall somewhat below t he original refer-
ence enrve. When a Winkler foundation is used the difference is consider-
able at high crack speeds $nd even at low velocities the two curves aresomewhat different.
As was the case with llomalite 100, Xalthoff's (1977) experimental
points and the result obtained with the two-dimensional analysis (Popelar
and Gehlen, 1979) fall on the curve generated with the model having a
generalized foundatlen. Also the K I" """ C YID Q"*""^""#""""
2377 040o -
. .

_ . . .
_
1.0 0.2
/.
AO.8 - X WE /,,'
_
A /'e}|g/ *|0.6x e /,
V- XD 8) 0.1 X O
x 0.4 -s'o
soH - -
M A iU u
O.2 -"
O I I O I I
O O.5 I l.5 2 O O.5 1 1.5 2
A5/c A5/ao o
(a) (b)NU FIGURE 2.15. REFERENCE CURVES FOR ORDINARY RECTANGULAR-DCB TEST SPECIMENS Sil0 WING Tile RELATIONS BETWEEN AI/a"N AND: (a) K IE AND (b) V/CID QN
The original reference curves (Hoagland, et al., 1977) are shown as nolid lines. Results from.
o analysis of Homalite 100:
X Use model with generalized foundation and Kyp independent of crack speed.A Same as above, but K is a function of crack speed -- see Figure 2.4 (Fourney, 1977).79I Use model with Winkler foundation and Kip independent of crack speed.e Same as above, but KID is function of crack speed -- see Figure 2.4.
Experimental data (Irwin, et al., 1977).o
.
. . . - - - .-
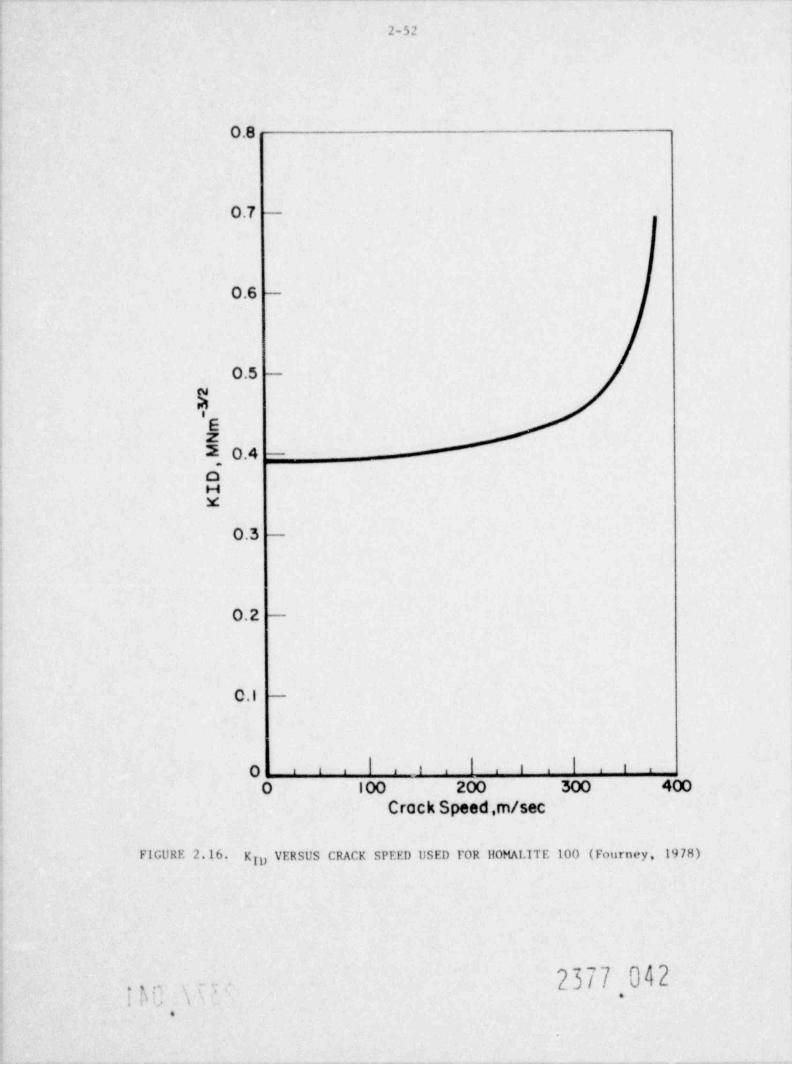
2-52
0.8
0.7 -
0.6 -
0.5 -
N,Ez% 0.4 -
OHM
O.3 -
0.2 -
0.1 -
| , ,
' m|| '''O i i , , '
g0 100 2MCrack Speed,m/sec
FIGURE 2.16. Kyp VERSUS CRACK SPEED USED POR 110MALITE 100 (Fourney, 1973)
i t' E i '~2377 042
.
.
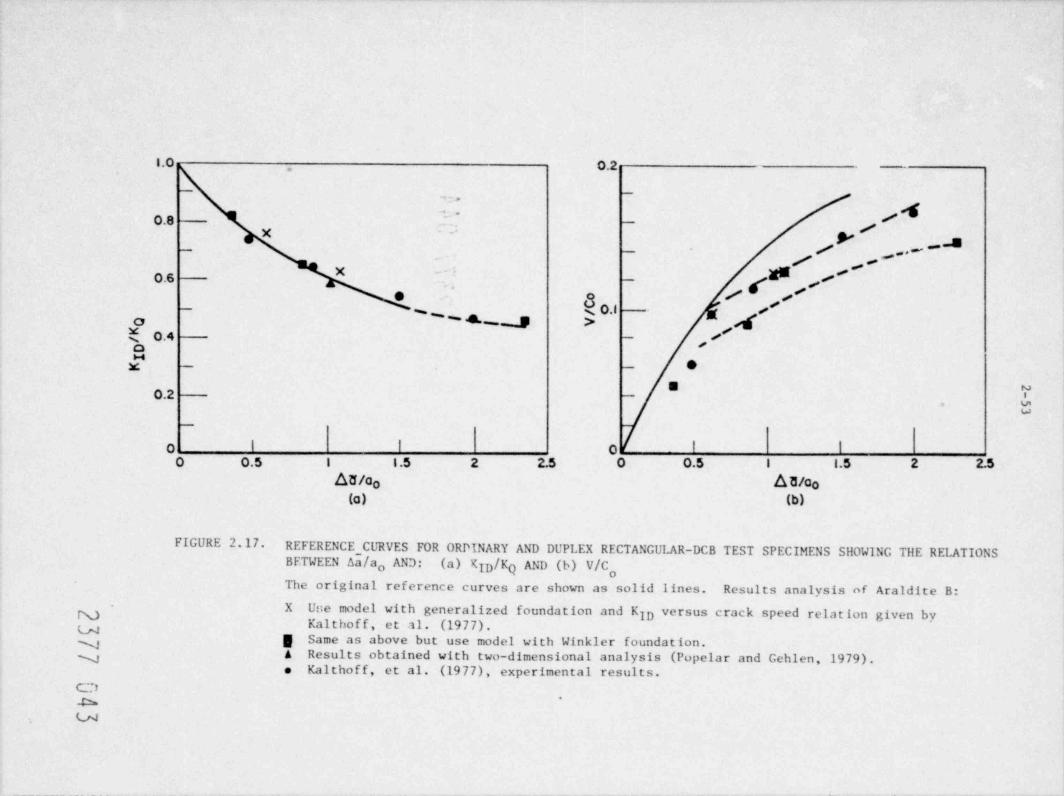
I.O O.2.
- -..,
,4.
0.8 - pX p A- - / , . -
./ #* '
O.6 ', - /g /e
-g e,ss 0.1
o ' ' 4 -J >N O.4 - ''d
,Oy _ ._
5 NO.2 -
&,
w_
0 I I O I I
o 0.5 I i.5 2 2.5 0 0.5 1 1.5 2 2.5Atf/c AU/co o
(a) (b)
FIGURE 2.17.REFERENCE CURVES FOR ORPINARY AND DUPLEX RECTANGULAR-DCB TEST SPECIMENS SHOWING THE RELATIONSBETWEEN Aa/a AND: (a) K79/Kg AND (b) V/Co
The original reference curves are shown as solid lines. Results analysis of Araldite B:
X Une model with generalized foundation and KID versus crack speed relation given byKalthoff, et al. (1977).
g Same as above but use model with Winkler foundation.A Results obtained with two-dimensional analysis (Popelar and Gehlen, 1979).ye Kalthoff, et al. (1977), experimental results.
C)'b
Cr4
. _ _ _
2-54
the use of either of the two matels and by the choice of KID " """ '#"
speed relation (sce Figure 2.17b).
In conclusion, it can be said that in both cases analyzed here,the model using a generalized fcundation approximates the experimental datamuch better than the model using a Winkl( foundation. A comparison
between Fliures 2.15b and 2.17b indicates that the deviations between theoriginal reference curve and the curves obtained when K is a function ofggvelocity are largest in the case of Araldite B. This can be attributed to
the fact that in the latter case the limiting velocity is 340 m/sec while
for Homalite 100 it is 380 m/sec. Of course, as this sneed becomes smaller,
larger deviations can be expected between the two curves. For such situa-
tions new reference curves would have to be generated for each individual
case * otherwise it appears that the published curves may be used.Finally, it should be pointed out that the most relevant quantity
that the reference curves yield is K the .einimum in the KIm, ID " """ .
velocity curve. Since the Kg/Kg curve is not altered when the various
models described above are used, the original reference curves with Homalite100 and Araldite B merely " expand" the K m sus v locity mlation alongIDthe velocity axis. Thus the minimum would occur at a higher speed but thevalue of the minimum, or K wou e the same as if the appropriatelyIm,
modified reference curves had been used.
2377 044
. .
s
j , % %
( )
. . _ _ _ _ . _ _ .
3-1
3. CRACK ARREST DATA BASE FOR UNIRRADIATEDNUCLEAR PRESSURE VESSEL STEEL
AND WELDMENT
This section presents the arrest toughness values of six heats of
the nuclear pressure vessel grades of steels A533B and A508 and a submerged-a rc weldment , in the unirradiated condition. These measurements provide aK and K data base representative of reactor-pressure-vessel materials.
7 7
The results given here have been obtained with the procedures described inAppendix B of Report BMI-1995. The measurements reveal that the crackarrest toughness values of the base plates are significantly greater than
the toughness levels defined by the K -curve. The values for the weldmentIRare 30%-40% lower, and in the case of K ,, straddle the K -curve.7 IR The K ,g
and K values for the weldment are shown to be consistent with the runarrest event observed in the recent ORNL intermediate pressure vessel test,
ITV-8.
3.1. Procedure
3.1.1. Data Base Materials
Four plates of A533B steel, two plates of A508-2 steel, and a sub-merged-arc weldment were received from various sources. Mechanical propert-ies, mostly provided by the suppliers, are given in Table 3.1. The K
7cvalues were derived unir.g either J or equivalent energy, while the other7cdata are obtained from standardized tests. Chemical analyses, heat treat-
ments, and more mechanical property data of the A533B heats and the weldment
are given in the Third Annual Report of this program (G. T. Hahn, et al.,
1978). Results for the A533B (heat CTP) and the A508 grade are given inAppendix C of this report. With the erception of a low Cr content in heat
BCL all of the chemical contents are within specification. The heat
treatments are all based on commercial practice. Figure 3.1 shows the
available static fracture toughness levels of these heats. Most of the
values above 200 MPam are suspect since they are obtained using the
equivalent energy method (F. J. Witt, 1971), and are only reported for
completeness.
2377 045
,- , .
-
_ _ . . . _ . . . .

'
", TABLE 3.1. DATA BASE MATERIALS
_
Reference Plane StrainNil-Ductility Nil-Ductility Yield Strength FractureTemperature Temeprature at NDT Toughness, K Charpy Shelf
Alloy Heat (NDT), C (RT (" # " ** " #87'NDT ' '
A533B (BCL) -12 -12 453 120 182
A533B (CBI) -29 -12 >438 <160 N125
A533B (CE) -12 -12 471 102 160Y
A533B (CTP) -40 -20 497 -- 102 ' ' '
A508 (B&W/B) -7 -7 >488 170 163<528
A508 (B&W/D) 4 4 >454 122 201498
SA Weldment (CEW) -57 -57 576 130 176
N)LANN
C)b&

. . . . _ . . . . _
s-s
'A EL O
O CBI
O CE400 _ _
O CE-Weld ,
VWD
_ _
8
300 _V
_
A-
R _ V~
E VE2-
o OH 200 - -
O
-
O-
10 0 - -
O
b^,,, /
~
I lo i .i i
-50 0 50 100( T- NDT ),'C
FIGURE 3.1. TEMPERATURE DEPENDENCE OF PLANE STRAIN FRACTURE TOUGHNESS OF SOMEREACTOR PRESSURE VESSEL STEELS AND A SUBMERCED-ARC WELDMENT
t-, ,
,
2377 047'
-- _ _ _ _ _ _ _
34
3.1.2. Experiraental Methods
All tests were performed using duplex specimens with stiff wedgeloading. The procedures have been reported previously (lloagland, et al.,1978; lloagland, et al., 1977), and will not be repeated in detail here.
Briefly, t.he specimen consists of a starter section of high-strength low-toughnens steel which is electron-beam welded to a block of the material
being tested. The two specirnen designs and sizes are given in Figure 3.2along with the transverse wedge loading arrangement currently being used.In the earlier parts of this research the double antilever beam specimenwas used. More recently the compact specimen has been adopted. The formerdesign has better crack-arrestin s capability, while the latter does not
reed deep side grooves. The starter section contains a blunt notch sothat excess strain energy is stored in the specimen and is used to drivethe crack once it is initiated. The load point displacement and cracklength at arrest are measured. These quantities are then used to calculatepropagating-crack toughness with the aid of reference curves derived from
finite dif f erence comput at ions. These computations also allow one to deter-
mine crack velocity. While the K values reported are actually KID ""I""*'g
lit t1e error is introduced since the K /v 1 city curve has a broad flatIDminimum (Hoagland, et al., 1978) and our data lie in this range. It should
also be pointed out that the K data are obtained using the load pointgdisplacement at initiation while K me surement inv Ives displacementIaafter crack arrest.
3.2. Exper! mental Results
3.2.1. Kim- "Ud Ela-Measurements
The results of the crack arrest touc,'nness evaluations for the dif-
ferent heats of A533B, A508, and the weldnunt are summarized in Figures 3.3to 3.6. Detailed tabulation of these da.a are provided in Appendix D. The
graphs make use of two common indexing temperatures: the RTNDT ""(Welding Research Counc il, 1972) to facilitate comparisons for the differentmaterials on a single graph. The spread in the data therefore reflects:
(1) material variability from specimen-to-specimen within a heat, (ii) heat-to-heat variability, (iii) variability arising from the approximate nature
c the concept of a single indexing temperature (e.g. NDT or RTNDT), and
2377 048u. -
, ,iI i
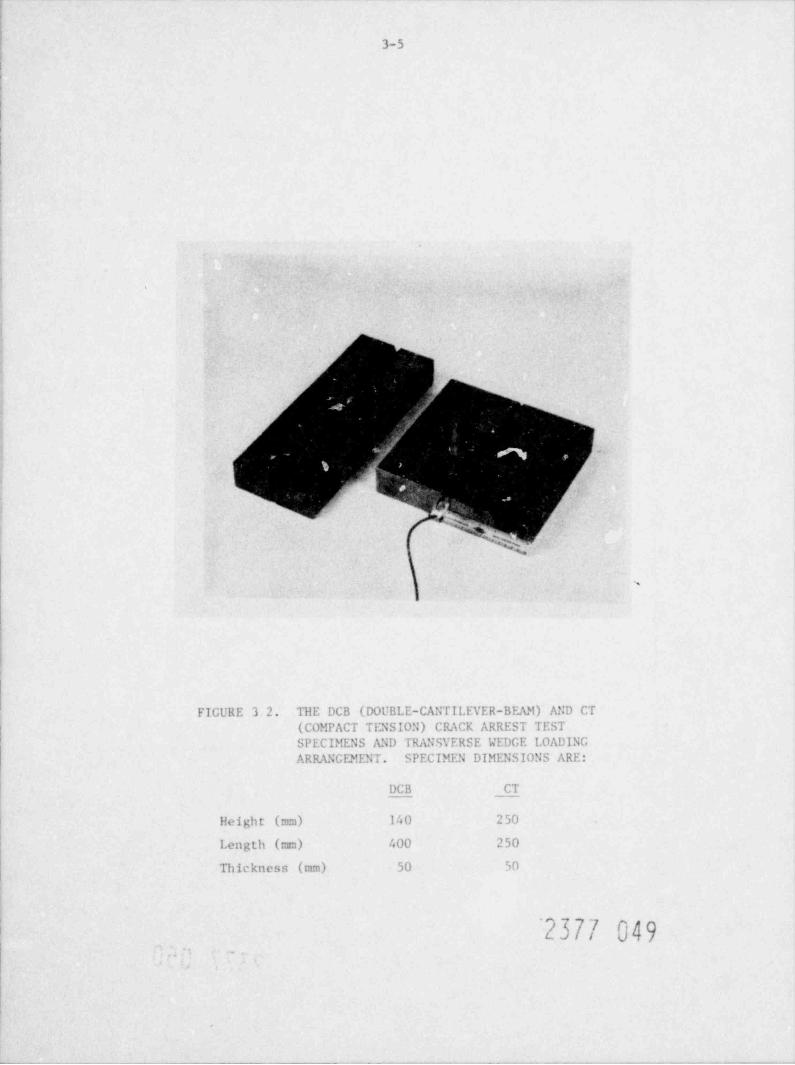
3-5
4
.
s
FIGURE 3.2. THE DCB (DOUBLE-CANTILEVER-BEAM) AND CT(COMPACT TENSION) CRACK ARREST TESTSPECIMENS AND TRANSVERSE WEDGE LOADINGARRANGEMENT. SPECIMEN DIMENSIONS ARE:
DCB CT
Height (mm) 140 250
Length (mm) 400 250
Thickness (mm) 50 50
'2377 049_
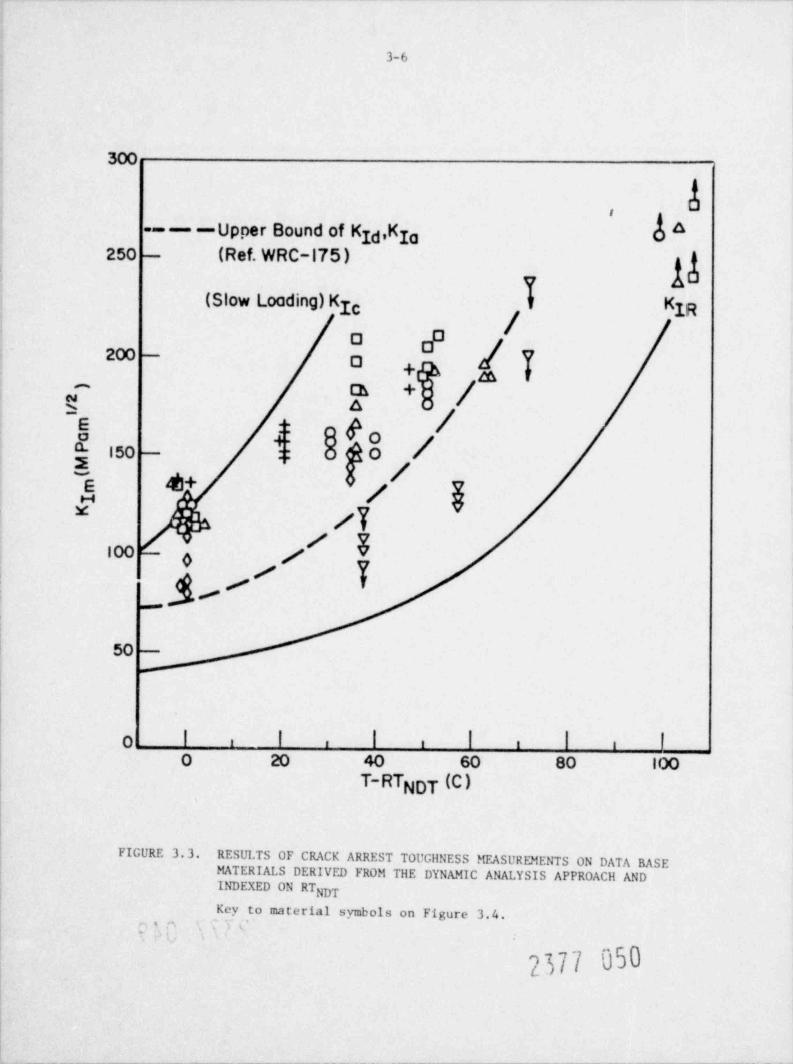
3-6
300
1
----Upper Bound of kid,Kya o a250 (Ref. WRC-175 )-
g
vi a(Slow Loading) KIc y KIR
/o a200 "-
O + m F
as +^
t' as :: A /
~
o 4. v O' 150 :: 0-
? / h/$
' 6iw o /
L '- T_..
50 -
0 I I I i I ii , i i iO 20 40 60 80 ifX)
T-RTNDT (C)
FIGURE 3.3.RESUI.TS OF CRACK ARREST TOUGilNESS MEASUREMENTS ON DATA BASEMATERIALS DERIVED FROM THE DYNAMIC ANALYSIS APPROACH ANDINDEXED ON RTNDT
- . = ,~ Key to material symbols on Figure 3.4.
; s'u a
2377 050
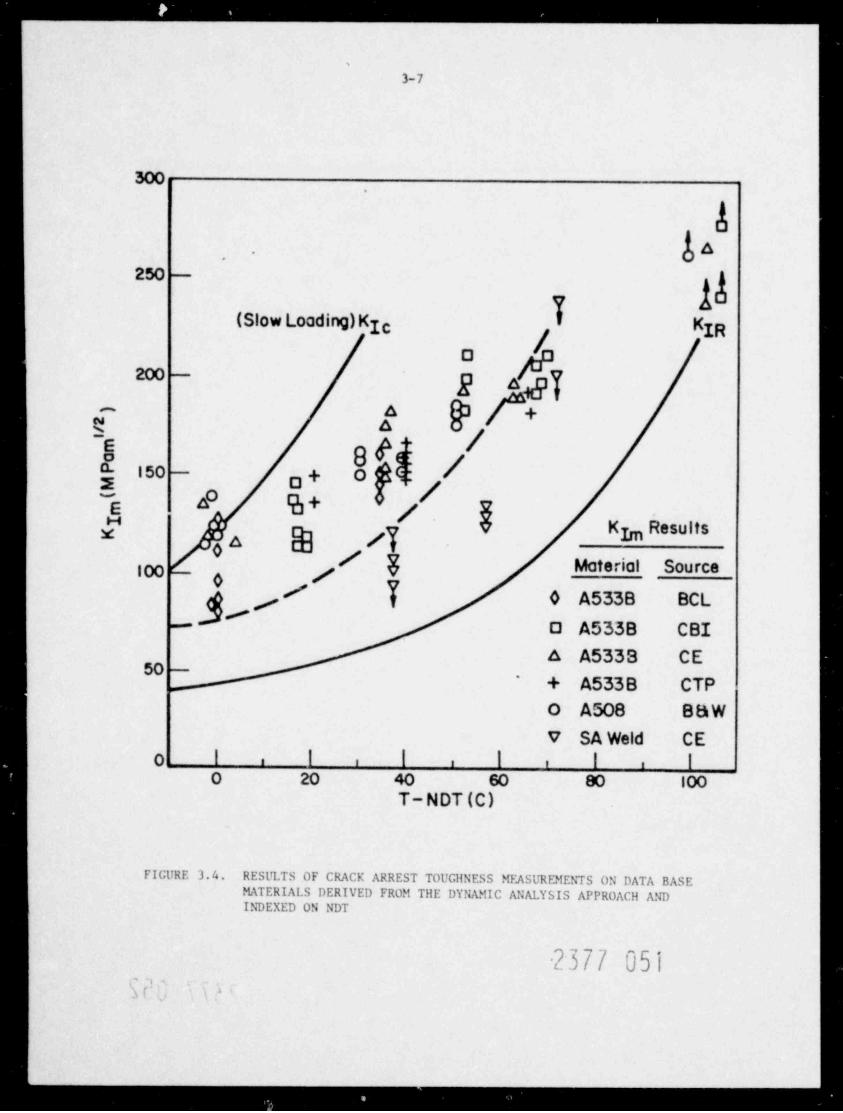
_ _ . _ _ . _ .
_ _ _
%
3-7
*.
fa.,
2= 4-
a(Slow Loading)KIe KIR
/O200 vp-
{ f @/+
-
g ..
8 e ro !g 150 a+ 0
E|-
~
e a 'b+ gy K Resultsj h
[fS Material Sourcetoo# 0 A5338 BCLp
0 A533B CBI-
^50 -
' + A533B CTPO Ar48 BBWv SA Weld CE
o I I I I I I, , , , ,
o 20 40 so 80 iooT- NDT (C)
FIGURE 3.4. RESULTS OF CRACK ARREST TOUGHNESS MEASURDIENTS ON DATA BASEMATERIALS DERIVED FROM THE DYNAMIC ANALYSIS APPROACH ANDIh3 EXED ON NDT
2377 051g, .
.
_ _ _ . . -
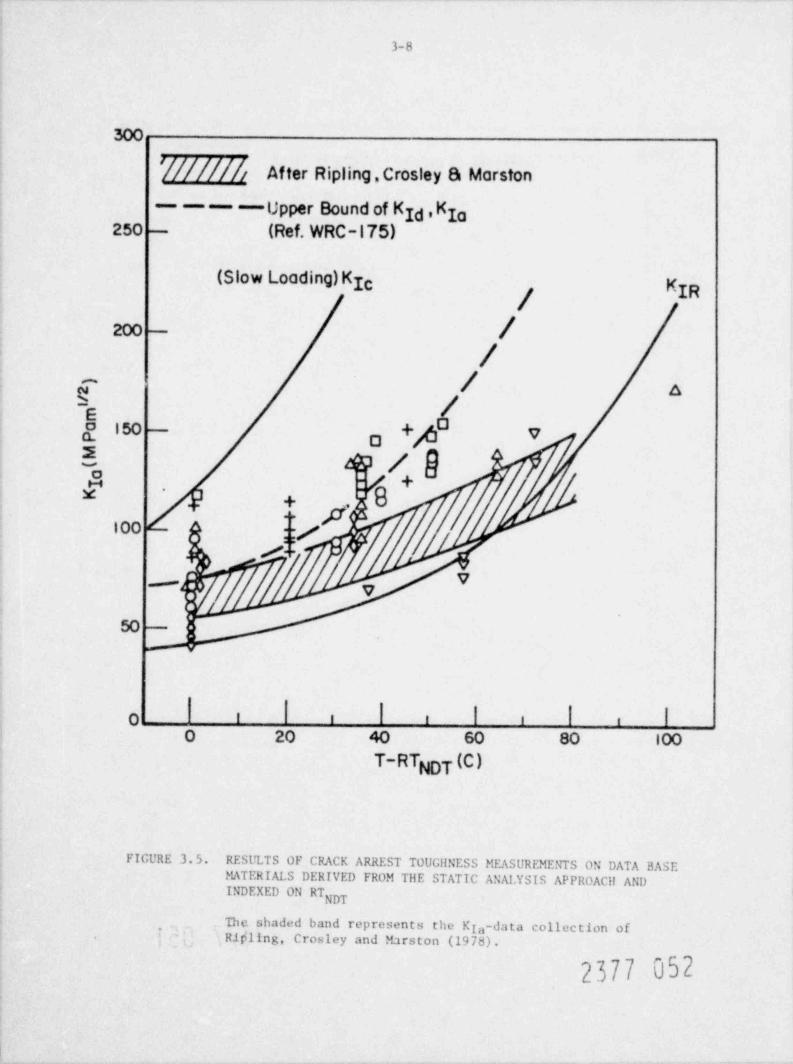
3-8
300
'[/////// Af ter Ripling.Crosley & Marston
----Upper Bound of kid,KIa250 (Ref. WRC-175)-
(Slow Loading)KIcKIR
2@ /-
/c / ah /ee Iw +f ,a3
9+@@/
f /.
p..
100 y-
/
f 7
2 :
I | |O I I I I i
0 20 40 60 80 100
T-RTNDT (C)
FIGURE 3.5.RESULTS OF CRACK ARREST TOUGilNESS MEASUREMENTS ON DATA BASEMATERIALS DERIVED FROM Tile STATIC ANALYSIS APPROACll ANDINDEXED ON RT
NDT
The shaded band represents the KIa-data collection of,
.Ripling, Crosley and Marston (1978).*
2377 052

. . _ _ _ .
3-9
300
250 -
(Slow Loading)KycK IR
!2T -
/e / a -
/*e6' 150 /0 tv3 4/C g'vM KIa Results0, /@
100 / Material Source
#+ b 0 A5338 BCLjV O A533B CBI- y
o A533B CE50
+ A533B CTPo A508 BBWv SA Weld CE
|'
O I I I i i.
0 20 40 60 80 100
T-NDT (C)
FIGURE 3.6. RESULTS OF CRACK ARREST TOUGilNESS MEASUREMENTS ON DATA BASEMATERIALS DERIVED FROM Tile STATIC ANALYSIS APPROACll ANDINDEXED ON NDT
2377 053r ,: . :
- -
_ . _ . . _ .
3-10
(iv) possibility of variability arising from use of differing specimen
designs. Of t hese, materials variability is tnost pronounced and the
heat-to-heat variability is influenced by the choice of indexing t erape ra t u re .
These four variabilities are not dif ferent iated in the s t.it i s t ica l
analysis discussed in the next- section. 'l h e crack arrest toughnes, v a l u e:,
are in each case compared with (a) the average trend of (slow loading)
K -values for these heats (see Figure 3.1), (b) the K -curve, and (c) the7 g
upper bound of the original K -K data set which was used to estahlishId b
the K -curve (Welding Research Council, 1972).gThe K -values for the plate and forging naterials in the rangeg
g, t o RlhT + 70 C gen" rally tall in the band between K and the upperRT g
bound of the original K -K set, well above the K -curve. 1he K -g g gg g
values are about equal to K at the RT " "" "" Y " P""k NDT
ent than K above RT The K -values for the submerged are weldment..g gare 30%-407 lower than the plate and forgings. They fall in the band
between the K -curve and the upper bound of the K -K set, but above theg Id bK -curve. The K -values for the weldment st raddle t he K -curve.g g g
The K -values obtained from the same test pieces are on averageg12! smaller than the corresponding K -values. For the base materials,
hthe K -values tend to fall into the .nd between the K -curvo .md the upper*
7g
bound of the K set. They also display less temperature dependence thang
" -values in tk wWaent st M le t h K;g-cu ne, neKh, o r KIR* la
present K -neasu rement s a re compared with the data collection for A533Bg
plate recently reported by Ripling, Crosley, and Starst on (1978) which is
represented by the shaded band in Figure 3.5. The Ripling, et a,1 valuesdisplay essentially the same t emperat ure dependence but are approximately
2 0 ~' lower than the present results.
3.2.2. Statistical Analysis
Results of linear regression analyses of the results f or the A508*
and A533B base materials are summarized in Table 3.2 and in Figures 3.7 to
1.10. The results f or the weldment were not included because the data
clearly represent a different population. As discussed below the different
fracture surface morphology of the weldment supports this exclision. Flore
information about the statistical analysis is presented in Appendix E. Note,
r. . a t to, thes extent the data are normally distributed about the regression-th,i si ,
\ , I, \ '
2377 054
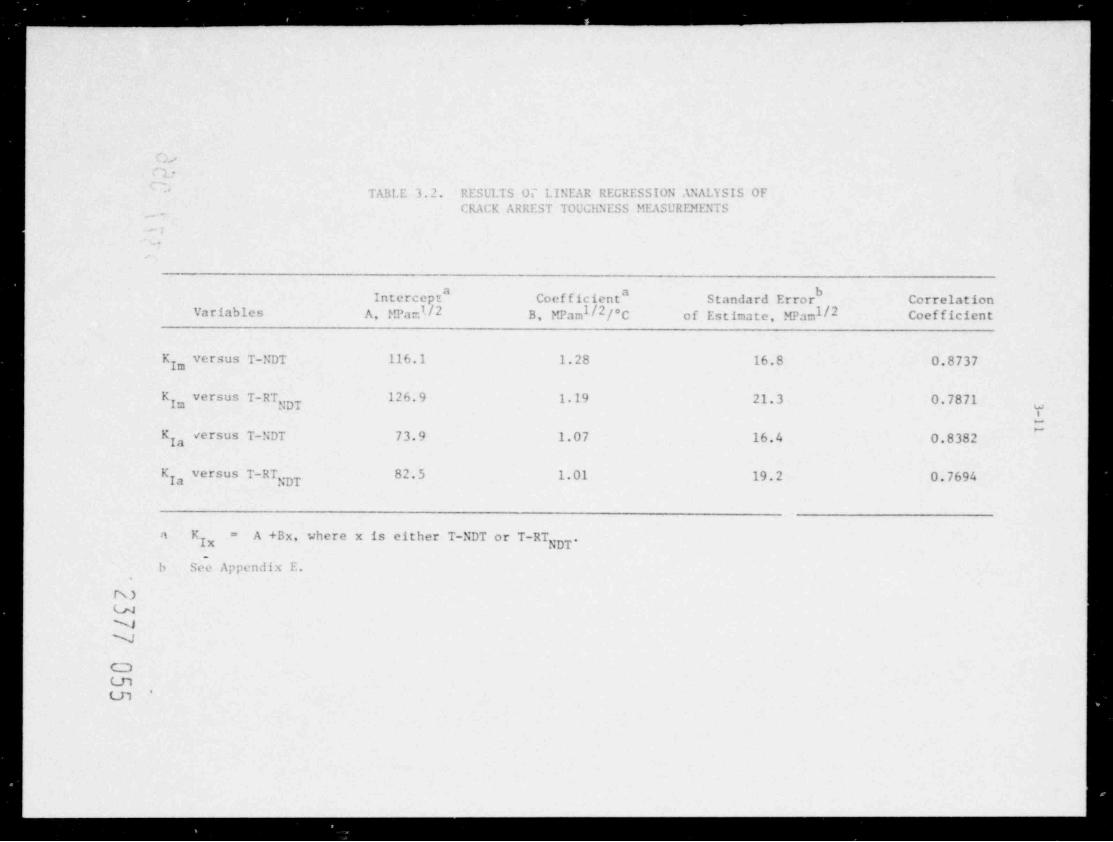
- ' ' -
_ _ _
'. -~.
TAh!.E 3. 2. RESULTS OT LINEAR REGRESSION ANAL' ISIS OF'
, , , ,CRACK ARREST TOUCliNESS MEASUREMENTS
.- ;
.
Intercept" Coefficlent" Standard Error CorrelationVariables A, MPaI/2 B, FTam /2 oC of Estimate, MPam /2 Coefficient- 1 f l
K versus T-NDT 116.1 1.28 16.8 0.8737g
K versus T-RT,,DT 126.9 1.19 21.3 0.7871m y..
-~
K versus T-NDT 73.9 1.07 16.4 0.8382g
K versus T-RT 82.5 1.01 19.2 0.7694NDT
a K A +Bx, where x is either T-NDT or T-RT=
7x NDT"
b Se Appentlix E.
N)UNN
CDCn
'LM
.. ... .__.____..______ _ __

3-12
.
300
/Best Fit /2 sy -and 3 sy ,/ A--
A250 7/ 2 sy
/ KIR,'
/0 0 / y7 0 4200 y a + 2sy /m
/ 01 / /- y
5 / A 3sy / /E / /--
,
bO /150 -
F!! / pE d+ / fp
M // |/|00 o ,,- /
H /9 /y
50 -
0 -! I I I I |
0 20 40 60 80 100
T-RTNDT(C)
FIGURE 3.7. RESULTS OF LINEAR REGRESSION ANALYSIS OF CRACK ARREST TOUGHNESSMEASUREMENTS ON DATA BASE R\TERIALS DERIVED FROM Tile DYNAMIC
ANALYSIS APPROACli AND INDEXED ON RT .DT
2377uS6-
x- ; c,-
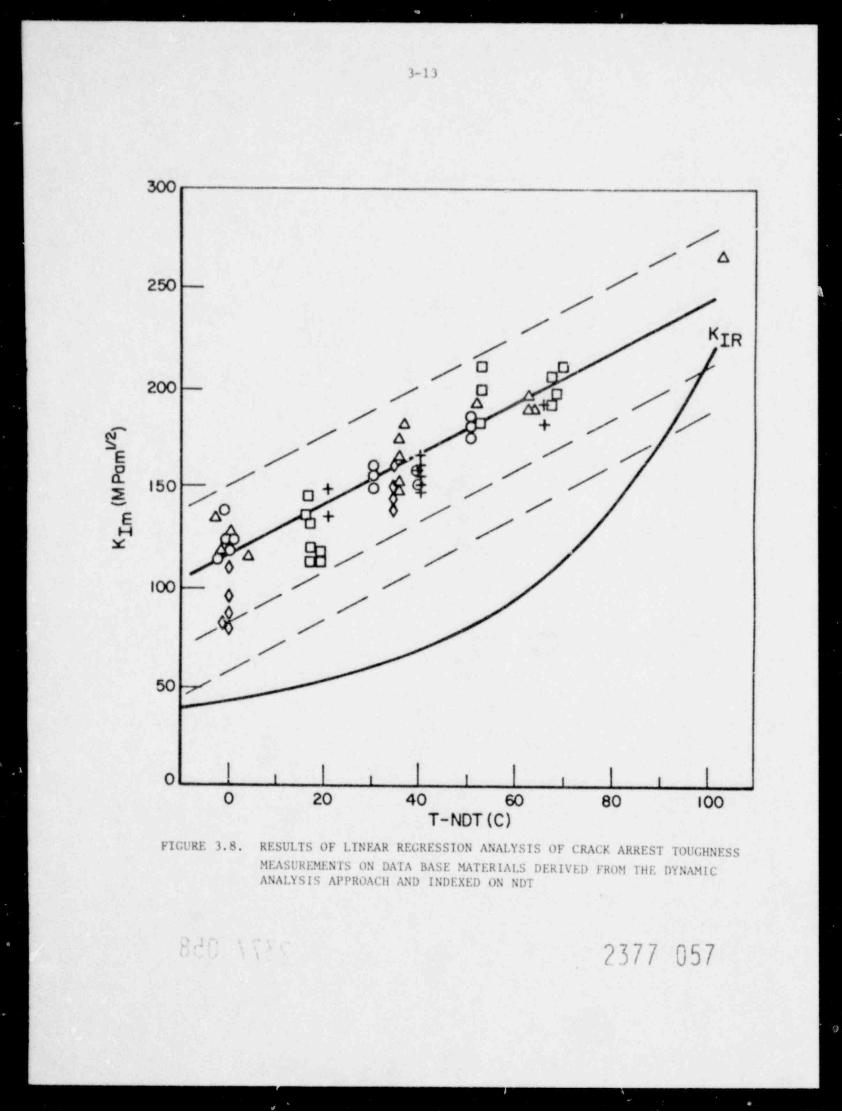
_ _ . _ . .
_ _ _
3-13
300
// a
250 //
/KIR7
/D200 y g ,g 7
-
/a + / /-
g / a/ /e / .-:
| iso /ofI/ /p a+ /~0 /e 6 +
f / |83 / ./n
o100 / /
0 / /f //
/50 7
I I |o i i i i i
0 20 40 60 80 100T-NDT(C)
FIGURE 3. 8. RESULTS OF LINEAR REGRESSION ANALYSIS OF CRACK ARREST TOUGHNESS
MEASUREMENIS ON DATA BASE MATERIALS DERIVED FROM Tile DYNAMICANALYSIS APPROACil AND INDEXED ON NDT
''"2377 0571
- _ _ _ _ _ _ _ _ _ _ _ _ _ _ _ _ _ . . . . . . . .

3-14
300
250 -
Ky IR/
y200 --
//
N |n,
s /-
S' 15 0 / + 0 /o2 / y
/ dD"n / // /* / 43 +
Of / /+v / ./100 ;; gp / /-
/ / /O / //
50 / //
//
0 I i i i i
0 20 40 60 80 100
T-RTNDT (C)
FIGURE 3.9. RESULTS OF LINEAR RFCRESFION ANALYSIS OF CRACK ARREST TOUGilNESSMEASUREMENTS ON DATA BASE MATERI Al.S DERIVED FROM Tile ETATICANALYSIS APPROACll AND INDEXED ON RTET
7577 999x.+ >:
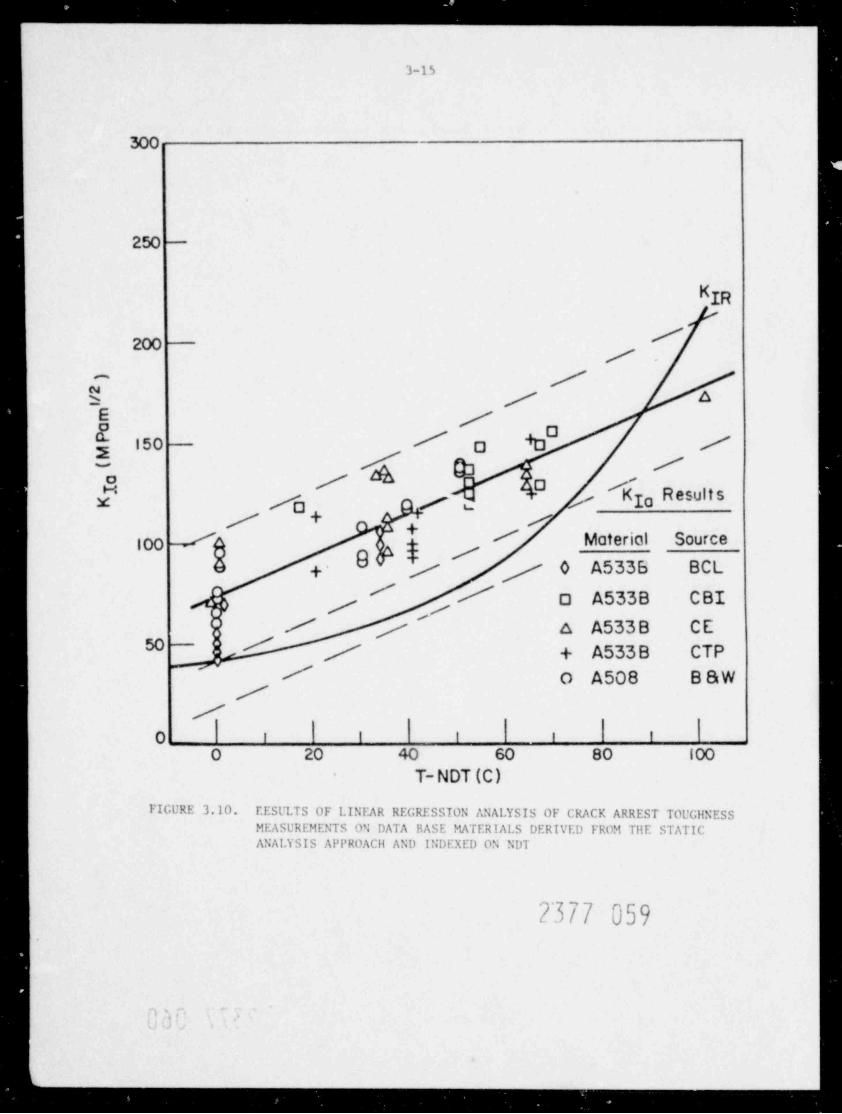
--._ ---- -
3-15
300
250 -
KIR
200/ -
/^
5 / b
5 /$ 150 / /O
f Go /~
* / O /[' / KIa R esult s/ y
0+/ /4--
/ Material Source100 29 = '
+- / / 0 A5336 BCL' / O A533B CBI/ '/
/ / A A5338 CE50 / / + A533B CTP
~ ' / O A508 BBW/
/o i i i i i
0 20 40 60 80 100
T- NDT (C)-
FIGURE 3.10. EESL'LTS OF LINEAR REGRESSION ANALYSIS OF CRACK ARREST TOUGHNESSMEASUREMENTS ON DATA BASE MATERIALS DERIVED FROM Tile STATICANALYSIS APPROACil AND INDEXED ON NDT
2377 059
:p
- - - -
. - - - - - - .
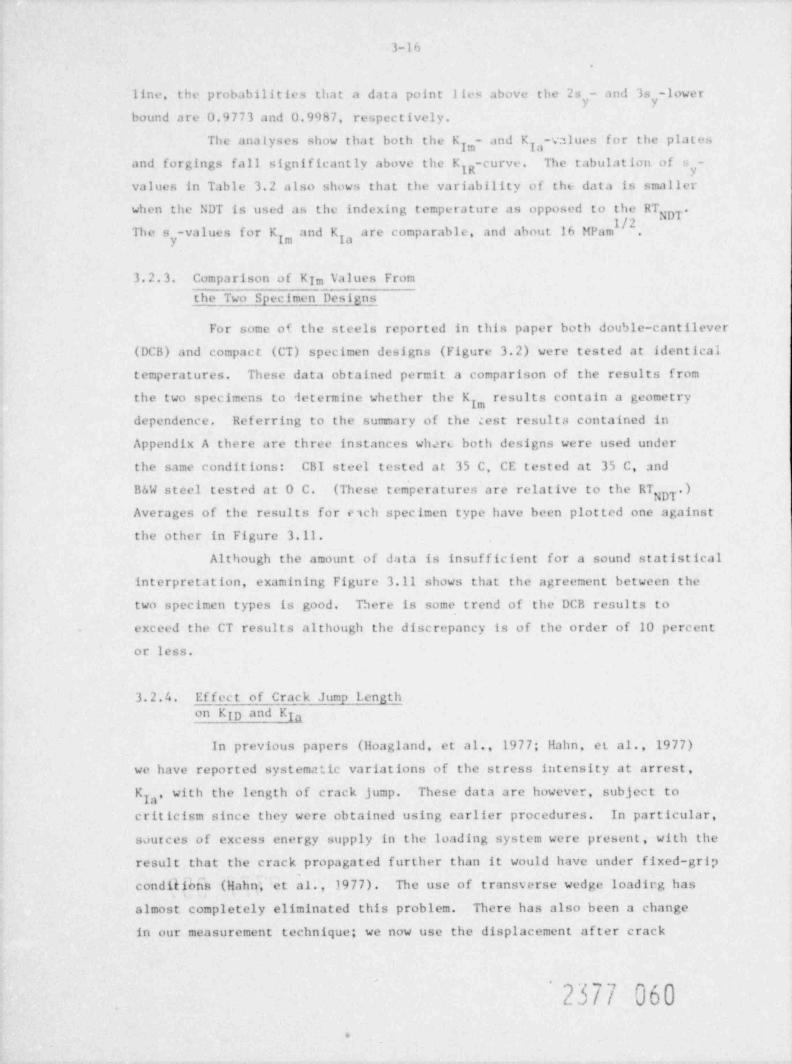
3-16
data point lies above the is - and 3s -lowerline, the p robab il i t ie s that ay v
bound are 0.9773 and 0.9987, respectively.
The analyses show that both the K - and K -values for the plateag g
and forgings fall significantly above the K -curve. The tabulation of . -IR yvalues in Table 3.2 also shows that the variability of the data is smaller
when the NDT is used as the indexing temperature as opposed to the RTNDT'The s -values for K and K are comparable, and about 16 MPam /''.1
y Im la
3.2.3. Comparison of K m Values FromIthe Two Specimen Designs
For some of the steels reported in this paper both double-cantilever
(DCB) and compact (CT) specimen designs (Figure 3.2) were tested at identicaltemperatures. These data obtained permit a comparison of the results from
to determine whether the K , results contain a geometrythe two specimensg
dependence. Referring to the summary of the test resulta contained in
Appendix A there are three instances whart both designs were used under
the same conditions: CBI steel tested at 35 C, CE tested at 35 C, and
B&W steel tested at 0 C. (These temperatures are relative to the RTNDT*
Averages of the results for each spec imen type have been plot ted one against
the other in Figure 3.11.
Although the amount of data is insufficient for a sound statistical
interpretation, examining Figure 3.11 shows that the agreement between the
two specimen types is good. There is some trend of the DCB results to
exceed the CT results although the discrepancy is of the order of 10 percent
or less.
3.2.4. Effeet of Crack Jump 1ength
on Kyp and Kig
In previous papers (floagland, et al., 1977; llahn, et al., 1977)
we have reported systematic variations of the stress intensity at arrest,
K ,, with the length of crack jump. These data are however, subject to7
crit icism since they were obtained using earlier procedures. In particular,
sources of excess energy supply in the loading system were present, with the
result that the crack propagated further than it would have under fixed-grip
condit ions (Hahn- et al., 1977). The use of transverse wedge loadirg has,
almost completely eliminated this problem. There has also been a changein our measurement technique; we now use the displacement after crack
'
23/,/ 60,, ,
,

...._ .. .. _ - -_ _ _ _ _ _
3-17
200/D
93,1
(5,l/ /*e / /
(2,3)! !-
h /* |/8 ,/+ 10 %
g 100 / /-
/-10%>
a // Mot'l , _ Source/v
s / O A533B CBI
//"g 50 A A5338 CE
o A508 BBW//
o
/0 l I
.
O 50 100 150 200Compact Tension KIm,MN m"
RESULTS CBTAINED FROM COMPACT TENSIONFIGURE 3.11. A COMPARISON OF KImAND DCB TEST SPECIMENS
Each point represents an average of one or more resultsfrom each specimen type at the same temperature. Thenumber of specimens involved it. .he average is identifiedin parentheses, the first being the number of DCB specimens,and the second number of compact tension specimens.
: .
2377 061
- - _.
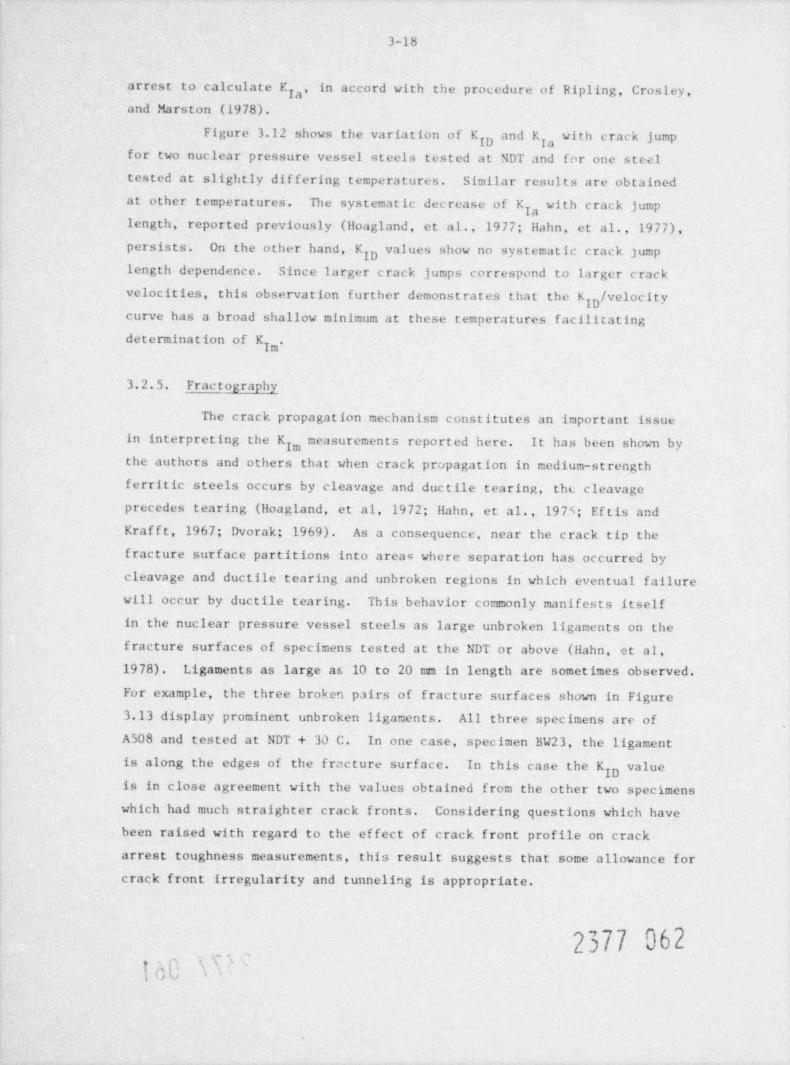
3-18
to calculate K ,, in accord with the procedure of Ripling, Crosley,arresty
and Marston (1978).Figure 3.12 shows the variation of K "d K with crack jumpID Ia
for two nuclear pressure vessel steels tested at NDT and for one steeltested at slightly differing temperatures. Similar results are obtained
at other temperatures. The systematic decrease of K with crack jumpglength, reported previously (Hoagland, et al., 1977; Hahn, et al., 1977),
persists. On the other hand, K v lu s show no systematic na d jumpIDlength dependence. Since larger crack jumps correspond to larger crackvelocities, this observation further demonstrates that the K w cityIDcurve has a broad shallow minimunt at these temperatures facilitatingdetermination of K g.
3.2.5. Fractography
The crack propagation mechanism constitutes an important issuein interpreting the K measurements reported here. It has been shown byg
the authors and others that when crack propagation in medium-strengthferritic steels occurs by cleavage and ductile tearing, the cleavageprecedes tearing (Hoagland, et al, 1972; Hahn, et al., 197s; Eftis and
Krafft, 1967; Dvorak; 1969). As a consequence, near the crack tip thefracture surface partitions into arcac where separation has occurred bycleavage and ductile tearing and unbroken regions in which eventual failurewill occur by ductile tearing. This behavior commonly manifests itselfin the nuclear pressure vessel steels as large unbroken ligaments on thef racture surfaces of specimens tested at the NDT or above (Hahn, et al,1978). Ligaments as large as 10 to 20 mm in length are sometimes observed.
For example, the three broken pairs of fracture surfaces shown in Figure3.13 display prominent unbroken ligaments. All three specimens are of
,
A508 and tested at NDT + 30 C. In one case, specimen BW23, the ligamentis along the edges of the fracture surface. In this case the KID " I"is in close agreement with the values obtained from the other two specimenswhich had much straighter crack fronts. Considering questions which havebeen raised with regard to the effect of crack front profile on crackarrest toughness measurements, this result suggests that some allowance forcrack front irregularity and tunneling is appropriate.
2377 062o-, c s
( () '
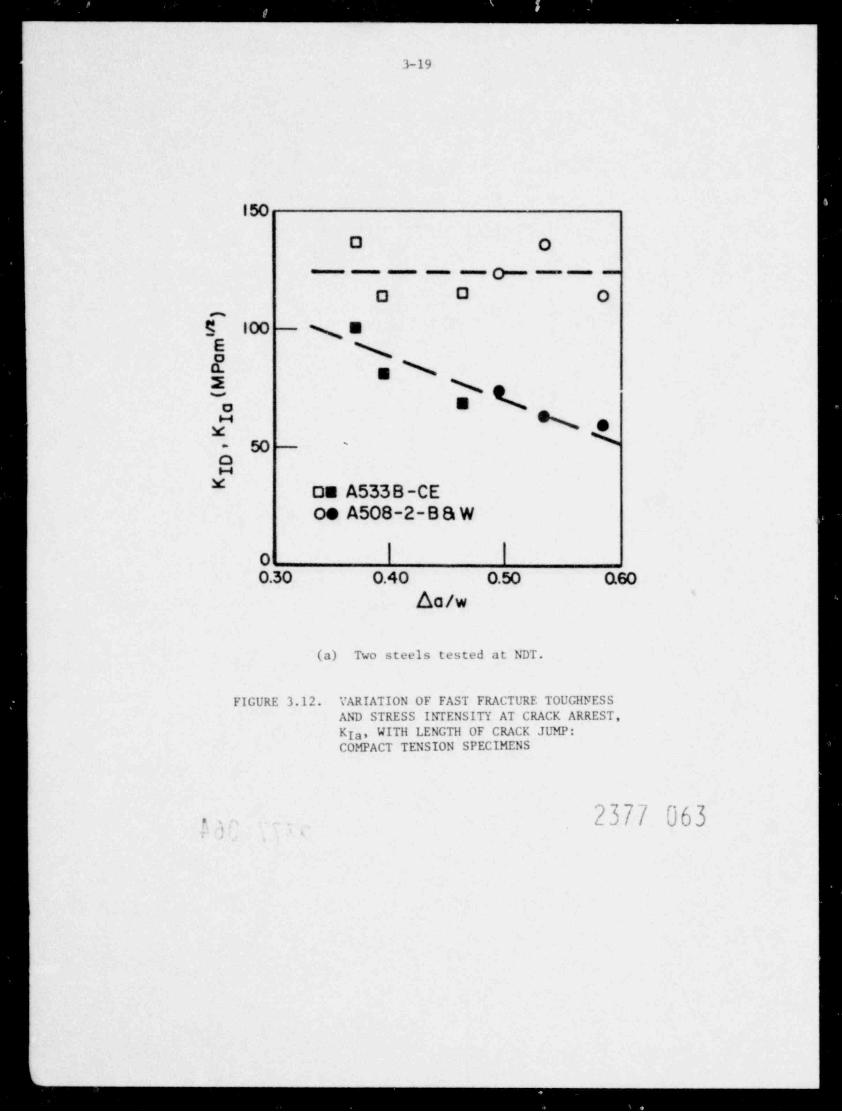
... .. .--.- -.- - -- -__
3-19
I50
0 0
__o___-
O O on
5 100 Nmb \a. , s.2 N %~
aaN.-
x \50 '.
oH* On A5338-CE
o. A508-2-BB W
00.30 0.40 0.50 0.60
da/w
(a) Two steels tested at NDT.
FIGURE 3.12. VARIATION OF FAST FRACTURE TOUGHNESSAND STRESS INTENSITY AT CRACK ARREST,KIa, WITH LENGTH OF CRACK JUMP:COMPACT TENSION SPECIMENS
2377 063ty ,,
_ _ _ . ..
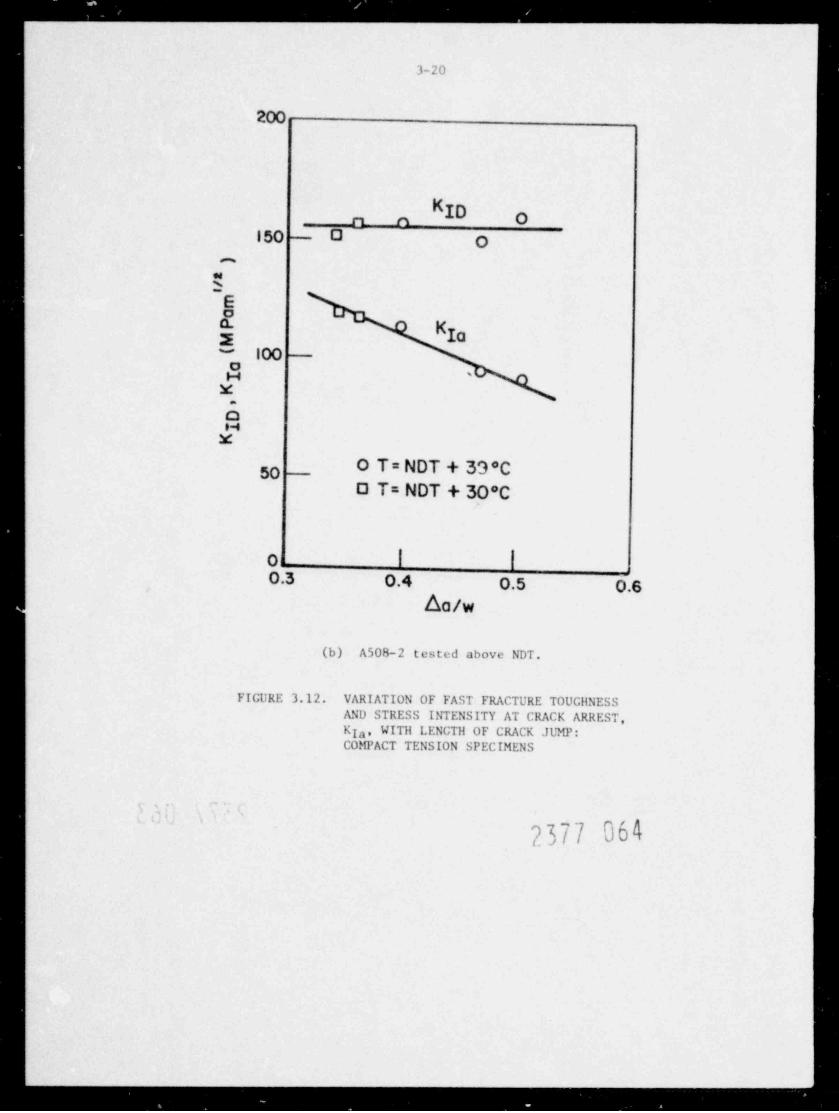
. . _ _ _ _ _ _ _ _ __ _ _
3-20
200
KIDn n o150 O - O-
n
R..
EO1 Ks Ia
100-
N ~
xOH
M
50 0 T= NDT + 39'CO T= NDT + 30*C
Oi | |0.3 0.4 0.5 0.6
da/w
(b) A508-2 tested above NDT.
FIGURE 3.12. VARIATION OF FAST FRACTURE TOUCllNESSAND STRESS INTENSITY AT CRACK ARREST,Kla, WITil LENGTil 0F CRACK JUMP;COMPACT TENSION SPECIMENS
T . ' ,''. '
2377 064
--
_ _ _ _ _ _ _ _ .
i--ii------
3-21
f ~
?~^
g",%;~~. :, -. .y 7% npn wg, ,
e y .w~y s |q -<& * f.
' |= G * 3 ", ,f.,
f * |.j}}=;, *k '?
' -~ ?!! ' } ,f, r'$ a: :a my;rw.. . t. , , A w
- w.-
.W:.? .
g3 , ; v'' ''
,
Q [ ~ Od = 3 0 H.sc s,;pd ,f.3 ye .
< -- -
[ . d h' . U''
(.,,..,p.,4 g? Q
'744'' + @f|)$i' C4'
h(yn,4 , s-
V | b*
e x . .+ e M
ha?hih,kf;$$\k 1? ~ ~ - $-
uiN-.
-,(q %:e~ :as :>~ .t* , :y < .,
->p+ .
..
k ',..s ~- --
g, -, ~
, 3-4 .e
sx>d ty
e '.'s+%c .~ r4Q;j*+ 'W. Mg,x s. -
f~ 5-b t s; V 0 /'
a O, , , ,5ty , };Jt'M . e,.. <,7
_
.' P %g- +,~r
,^ ~ 7 L,d L. -. y'c vt-: ,n,n %e ~.
r, ,
Okj''y}*'d'# A; !,, ,4 y ,Q g g, 1,
:-
QQT.h'1,. T fW$M [i
,:a' eu u," 'm cTh| * .W. |L' :Q .
~ f' .h ,'' k v': \
g! -Qtk|m 7:g yphfM~,
a N.
'-;
- , - \ ,,
~;f ~ h - ,N !v5A % , a;,i ( '. C,$
f
' f c- r
'cd ys p'
,
's- ;~ -m
{ = - Mig.p.f;g:. j".
4- w; a, .- a=wA
-i2
.
,-yc.m.:, :. z..i
(a ' b ,,st y}g- 4 s
/s , ' kW . ' )
,n. .a*ff ;s
17 ' ,2 ,.
, u .. ~ a.. % as .s _,
,T' / 'e T '. ,
_a'< :f %,4)"' #5,2 4
QE,l 1 *s s p' N I; -r "r j ?,s' + s u* ' . , y S ~*s', hy n y,-w
pk %cu t 4..)N [ s W(g * .,
ntut . < , u
Y .'j -i[i .[ *, "'s,
4 @ h1 id[S[h D[t b,7f' A17.h mh4 0 %tc'%. 4 g,
Jw, ,
M 4 k 4 ' (Q S h _r h _ D$$$ $y$1O,&.s.4r?A .N.
4.- .
. :q ;k??, .''::.,
h sIfSff)di,. Y'dd% # M{bY "9 :
t w < w!'dE
Se;%&.M|2s w'xw w$ eg n w .n. v et.m.e ; Jun.ag}~ ?m!;R
.t. m .~
+ Q Np, h%.'.Yt * -) A,b,[Gi~z-
.y. gh'Q)*!1 a c , %. JD, 4 ,.g, w,% , .m . J t.. ,,, x.may^
O^ . a s <% %Vf m
.Q ec.,? y.w.4 m at ,A~m > e*w s.' -
9 s g w,:,. . ,
- -f ' '' d |d g'a h thy 5,~<. y[ yg A. s ~ m' s 95 u(s, m. w . q. .e[: g, ; w ;, ,, ,y.r:
,Lh'Jf, a cyr.e .
-
-
. .; z.., n.m 4.o . . v m .a ......c ~. ~.
,N f ' ^' -_
om M5'
-
_

3-22
Smaller ligaments visible to the naked eye are always observed.Under microscopic examination, areas of ductile dimples can be observed ina spectrum of sizes. Typical examples of this fracture appearance showingthe ductile areas interspersed with cleavage in these steels are providedin Figure 3.14. A portion of these ligaments which failed in a ductile
fashion, did so before crack arrest. Indeed the authors have shown thatthe total areal density of unbroken ligaments is greatest near the arrested
crack tip and decreases gradually away from the crack tip with larger
ligaments surviving farther back from the crack tip than the smaller ones(Hoagland, et al., 1972).
There is evidence that a substantial part of the energy dissipateddurmg crack propagation in these steels is consumed by the plastic deforma-tion and rupture of the ductile ligaments. In Figure 3.15, for example,
very large shear strains are visible adjacent to the failed ligament which
joined two noncoplanar sheets of cleavage. The distortion of the micro-
structure suggests strains of the order of 2 to 3 in a band approximately
50 to 100 pm on either side of the failure plane. The eventual f ailure of
the l i g;ame n t is brought about by the formation of and linking of voidsoriginating on cemetite particles (cf. Figure 3.14).
The shear walls of the size shown in Figure 3.15 tend to beoriented nearly perpendicular to the crack plane. Fur the rmo r.? the length
of the walls generally is much greater than their heignt with their lengthoriented parallel to the direction of crack propagation. These characteristics
give rise to the familiar river pattern which always points back to the
fracture origin. The schematic in Figure 3.16 shows in a simplific.>d way howcertain ligaments and shear walls are believed to form as a results of
uncoordinated extension of the crack front by cleavage. This uncoordinated
c rack ext ension leads to noncoplanar sheets of cleaved areas which eventuallyjoin by shear of the connecting li; ament.t
Because of the nearly perpendicular orientation of the shear walls
an observation of the fracture surface in a view looking normal to the
c rack plane may tend to create the impression that the total areal fraction
of ductile rupture is considerably less than the true value. In Figure 3.17,
for example, two areas are shown with one view normal to the surface and
another with the crack plane tilted 26 degrees. From the change in the
projected width of the shear wall due to tilt we estimate that the shear
.-2 .$ 7 ~/ U 6 0
= 7 m /
?. - ~.

. . . . . . . . _ _ _ - .
3-23
*1s ;; ,
.tx ,, e.. ... .
,
19 . .. ;g,
s ! y. g ;;;wg|r -y g, .
;. e.+ m n,, .
.$. , g -,. .. $ fs , 3:^' +
.l. .q.-. g ,., , u
: n . ,. u ".:x, n.., ..u. <, .. ..
. ,.' |% ' hy
, ' ' k.. . _y.r . b.? || ;.
.J R . . $ - R;! .s.L t.1~
b *
.
.s. . ~ .
. . . .. .. ,
?
.''. . , Y. . . . . g
f ' :A
.
8 22."
: baa w-
a me>
.~', f f'' .
'
.
eu ays sq, . , , ,
ejeq y 3u'.
7,
S ''k ,N $h, -
i qw',u .
<a ;-
ir . ~;&. $ h.'
<
.g4.{b >
> u ., a v
2u a br-
od ux!-
..
1 g m 8 .s ,,a W m '.: 3
,,&,o,y#. 3,ea ae' i am 8:_
- eun-
<u s 1:
> a e ~a r
'] Q u | t;. . :.
4 5 S 'j'
f .,' ,9 g-p
,j , ,5 b. 48 4e'
,,
. _ , . , ; ....., _;.
',s. j. ',
,r4,,
{# ' t, ,' ' mny , s. - '/'. .-
,
* ( y- &, {i Y I' *1 '
. g g .>
> ., . ~
s.
s ..
8,s. 2377 067.
,
_ _ - - . . .

3-24
E
u%, pun. f.'MF
n;;%.vQ $>tXV h$Pr,ts *A
TQs,.. r 2R 3 .3wq .. n ,s, u # s. u'.u,% sg
h p?&'W.%.. & W ;,'a m .,. gae
3 TD9 "tkN ,dy%p *M.J,_}.W%. w;.L,'. ,9,,[a''r''. ,k ~
i
yI, . .d, a ifp c,,u
fy|fri(fg;j /y$.d,
(''3[ffm4;Q.f(gtj't %++- w-=
.
t y;4
' % gt: kt i p,tG,&..w.<?g|2(fh;),up,; : -- c
< gh g$yp:; gq/g. .Jm 3.,1 . na.n ,
$ $? W . 3f b;Y }c|..s. n # ,C.v. .a . : >. ,y g
Q*%w[~hhQ k h h*N&<
U "O , .? '{d.d.d|r-;' .
N%t ip - Q(|4MMWMU,3'
mmu.Nhi hhNn m< n a.n...:as v :;. .w '- L
..w* :@ INY)i'$ %Y;p m> %:w~gpta x
p)Uil(q . ,
t fe &f %dMk. @, . m .t'a.j@@:(tu,4,e
. r,
p - Q q-| 1 W .g|L Q m. m enas e.-4ym
1 =; < v . g
e- ,, f,,:5J,n %, % .m&ci,%qw n.v. ;r s ng
4 xs . /' . , Qt tff:y- . :
,7- };" yj;r.h,4 ,- ,-
p: p[yr,., es. . u _/, m4.-,.,gs . < gt g
, h .~-
i .
a 4;r & ;@n%y.:- r'd, s(M;p;:;s CMI.%}*g,j.' 4MN v j g.g qNr yy.- , . .. . m 3,,wLs ,_ , y y nq
,,p,s A 14|J .4....+i.m s. w ' ,2-
b 4 hy)(; %;m..:sp'$;, y ~ ,3 ;
. A ;A.A' $ wM;a B' Vn.An -N f
t . A es . wi j yn.3, *g. X'g r-a
w -
,e > - % fx j" a .
. yhgR-
- 4*|*: .it 7 ? g;ju M4J.i OkFG * .; :-"'m
y ; p{ Yge.,e *h;f|',-=
S1y -- 2 .w 4 4
MQ@kyN'h$hkhNM*; [[
. Q. ' M;.'i p4.h ",?DI^,] Q.~
' '
, ,
,, Wy;k s;g'g% yig %ep-t . - t kan .
k;?.Lk;;ifN$p$h,\iS!% m& ?Cj'h,@'f]maY?fkbn RT6?M M,
I+ gTehAu A.Mrs gre w/%$hy,M;9,5 #f3 4dtS :(SFQhw.4 6# a
rc Q k?&,.'% , r4!Mjjh;&Q,J Y'V)|Ni.Vi8dss &y- s "b4%.f: , W s; O W m - .% Vt:
it,[3M-Qv[K-,.WQ M >, ~% M i~''h":w?N'
.,Q-
i! 4 AM d..-. s & +' M
nJm,.r%covp , .4-- --
s
p %y* $Y ~w-M - q;
Ot ,:3,
MMt . .s
w.4 <jya'
fbhQ;$dNI. . 500 Y ,
h ' ,, s12MR%murenes
FIGURE 3.15. A SilEAR WALL IN A SECTION PERPEF.MULAR TO Tile CRACK PLANEOF AN AS33B (Cill) SPECIMEN
D''"~ 2377 068,
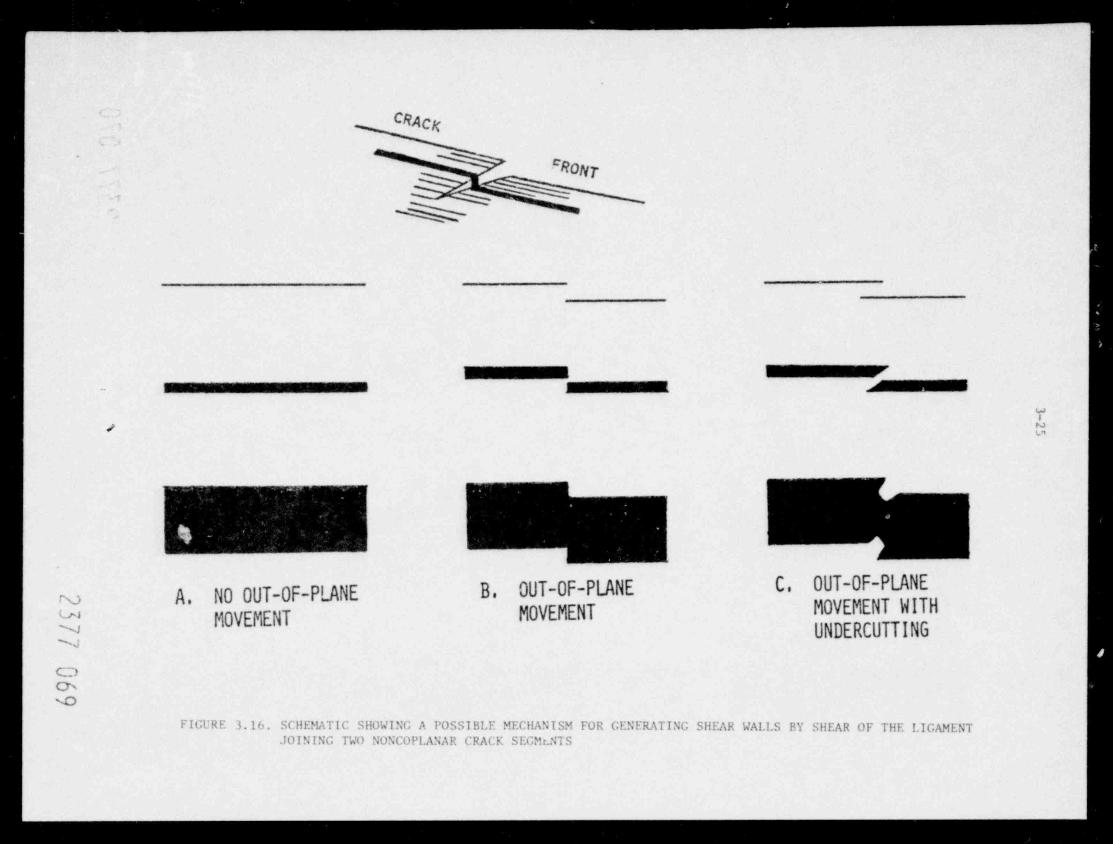
_ _ .
CRAC
'RONy
- %
ammuummut -- - ammmmmmmmt -
Y/ U
. .
N A. NO OUT-0F-PLANE B. DUT-0F-PLANE C. OUT-0F-PLANE
"'MOVEMENT MOVEMENT MOVEMENT WITH
N UNDERCUTTINGN
OChC
FIGURE 3.16. SCIIEMATIC SHOWING A POSSIBLE MECIIANISM FOR GENERATING SilEAR WALLS BY SHEAR OF THE LIGAMENTJOINING TWO NONCOPLANAR CRACK SECMr.NTS
. . . . . . . . . . . . . _ . . _ _ _ . _ _ . . _ _--.
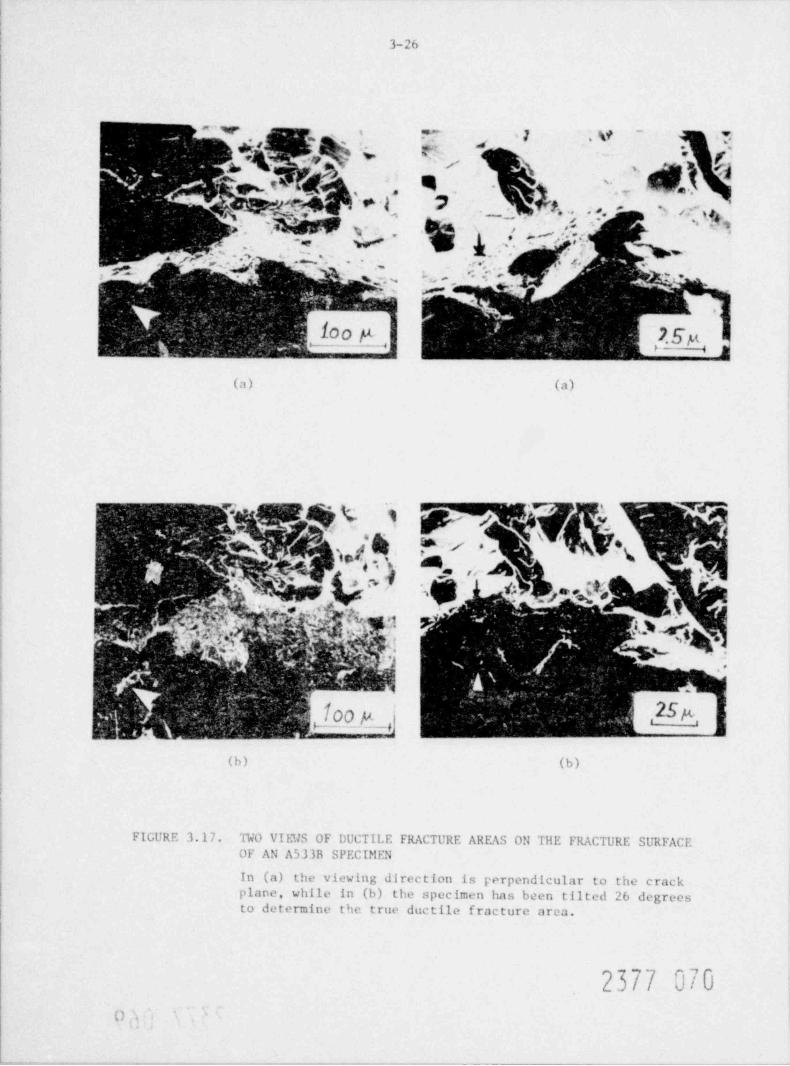
3-26
^
f #
idE M,.,,o,(a) (a)
IfE ~
*..
e .j
?
~ 00 y ,J 25n.1 .
(b) (b)
FIGURE 3.17. TWO VIINS OF DUCTILE FRACTURE AREAS ON Tile FRACTURE SURFACEOF AN A533B SPECIMEN
In (a) the viewing direction is perpendicular to the crackplane, while in (b) the specimen has been tilted 26 degreesto determine the true ductile fracture area.
2377 070
N

. . . . . _ . . - . - -
3-27
walls evident in these two views are tilted approximately 70 degrees withrespect to the crack plane. In this case a normal view understates theareal fraction of ductile rupture by a factor of three. It is also note-
worthy that upon tilting the specimen in the microscope new areas ofductile rupture are observed. It should also be noted that the not-uncommon observations of the dependence of the areal fraction of cleavageon temperature f rom normal-view, microscopic observation of fracture surfacesprobably over-estimate the amount of cleavage.
It is possible to estimate the amount of energy dissipated in theplastic deformation and rupture of the ligaments per unit area of fracturesurface. This in turn provides an estimate of the contribution of ductile
rupture processes to the K measurements. The work done in the plastic7
deformation of an element of volume to failure is approximately
'f
W__ _
ode - oc=
P f
o
where o is an average flow stress consistent with the strain range, constraintand strain hardening occurring in the element and c is the plastic strain at
7
failure. At room temperature the yield strengths of the nuclear pressurevessel steels in this study are typically 450 MPa with ultimate strengthson the order of 620 MPa. For the average stress in a ligament we estimate
*750 MPa If the average strain in the ligament at fracture is taken as.
32, the plastic work done per unit volume is 1500 FU/m .
In order to gain an estinate of the thickness of the deformed regionadjacent to the shear walls a number of sections perpendicular to the crackplane was examined quantitatively. Figure 3.15 is a section of this typeon a broken A533B steel specimen. From a series of sections on broken A508steel specimens the thickness of recognizable deformation was found to
correlate with the height of the shear wall as shown in Figure 3.18. The
average shear wall height in these sections was found to be in the range of*
Reasonable estimates of the strain rates in a ligament during crack propaga-3 4 -I. According to Hahn, et al (1969)tion are in the range of 10 to 10 sec
these strain rates would elevate the yield stress by at least 280 MPa. In
addition, the deformation of the ligament is likely to occur under primarilyplane strain conditions which accounts for an additional 15 percent elevationof ithe yield strength. The contribution due to strain hardening is uncertainand'therefore an average increment in flow stress of 300 MPa above the con -ventional uniaxial tensile yield strength should be conservative.
2377 071
...._ _ -

3-28
.
e1000 -
-
800 -
E:1. _
25O
j 600 e-
EE -
,ji Cleavage
y 400 Y-,
x2t-
Cleavage200 -
_
e00 100 200 300 400 500
2t -Thickness of Deformed Zone,ym
-
FIGURE 3.18. RESULTS OF MEASUREMENTS FROM CROSS SECTION OFFRACTURE SURFACES OF A508 STEEL SPECIMENSCORREI.ATING Tile ilEIGliT OF THE SilEAR WALL, H,WITil Tile TilICKNESS OF RECOGNIZABLE DEFORMATION,2t
92bil 'di--
.

. . . . . . . . _ _ - _ -
3-29
the deformed zone bounding the shear walls will, on average, be of theorder of 100 pm.
Table 3. 3 summarizes a set of measurements of the areal fractionof ductile fracture on A508 specimens tested at -7 C , 22 C, and 43 C. These
measurements were taken f rom several photomicrographs of the f racture sur-
faces viewed perpendicular to the crack plane. In accordance with the mea-
surements described above this areal fraction was corrected by a factor ., f
three to approximate the true areal fraction of ductile fracture and then
further multiplied by 100 pm to provide the volume of plastica 11y deformedmaterial in the shear walls per unit of projected crack area.
We can arrive at a value for K if we assign a value to they
toughness of the cleavage portion of the fracture surface of approximately
35 MPam ! This value is consistent # th the toughness of this class of.
steels at very low temperatures where the fracture is nearly 100 percent
cleavage (Hoagland, et al., 1972; Wessel, et al., 1969; Hoagland, 1967).
The plastic work term together with the cleavage toughness give the crackarrest toughness calues at each of the three test temperatures in Table 3.3.
The agreement between the calculated toughness and measured tough-ness val 4s is surprisingly good, in view of the approximations involved.
Nevertheless, the results indicate that the formation of ligaments and
their eventual failure to fc.m shear walls is the dominant energy dis-
sipating mechanism during crack propagation. A further, indirect, although
confirmation of this point appears when the fracture surfaces of the
weldment material are compared with the base materials as in Figure 3.19.
In contrast to the A508 steel, the weldment displays a much smoother sur-
face with little macroscopic evidence of unbroken ligaments or shear walls.
This is consistent with the low K levels of the weldment. The increasing7
K with increasing temperature also correlates reasonably well with theg
areal percentage of ductile fracture. Extrapolating these estimates to
fully ductile fracture (taking the true area to be three times the projected
area, as before) a crack arrest toughness of 320 MPam is predicted. This
would correspond to a K value for a running crack expected at upper shelf.y
It is interesting to note that the highest base plate vlues of KIc
(Figure 3.1) are on this order. For the dimpled rupture mechanism KIm
is likel'y to occur at zero crack velocity and is likely to equal KIc
(Hahn, et al., 1976). However the K values in that Figure were mostlyy
obtained by an approximate method and a more thorough investigation of this
point is required. -
2377 073
_ _ _ _ _ _ _ _ _ _ . _ _ _ _ _ _ _ _ _ _ _ _ _ _ _ _ _ _ _ _ _ _.

S-30
TABLE 3.3. SUMMARY OF FRACT0 GRAPHIC ANALYSES OF A508
SPECIMENS AND THE IMPLICATION TO KIm
Test Temperature, C -7 22 43
Areal Fraction of Ductile Fracture (a) 0.14 0.17 0.22
True Areal Fraction (b) ,A 0.42 0.51 0.66T
Volume of Plastic Material per Unit Projected 0.042 0.051 0.066Crack Area (c), y
Plastic Work per Unit Projected Crack Area 63 76 98kJ/m (d), W v2
p
() , MPam /2 123 139 157lEstimated KIm
Measured KIm, MPam 124 157 174
(a) Determined from SEM fractographs with projected crack area perpendicularto the viewing direction.
(b) Per unit of projected crack area and assuming the true ductile fracturearea is three times the projected area on the fractography.
(c) Assuming average thickness of deformation adjacent to the shear wallsis 100 pm.
3(d) For Wp = 1500 MJ/m ,
(e) Based on a cleavage toughness of KIm (cleav) = 35 MPam and computing
~1/2-
EW V2 pT
Im Im (cleav) + (1-y,)K K=
-
.
2377 'J I 4-
:- :,i

{[,C + 4 - ,. , - _.y~4 d* ;; * se ~ 7 .. % + x sp , c - T ,. " r ( < ' . _i ''
, - -:
_-
#. . .s...<-
- -- n ~;- - x -. k.#- f y 4
i ,y,.- g -
(,, g. , : e ,
.g,,.,. :, . .. . -, ,
,,
s-
,;o e '
L. . . &., < + ' * M"
A,c
', ,=
. . , . *. . .. * 'r . ', , ' ,. , . x, g. *, , 4
<
y, ( N
u. : _*. .t - .
+n !
,9K * & .$ / f. *. + s., +
- -
.;-g
. . . . . %,
.
.3
S 4. .',^f- -
-
;#, %.. . g.
m .
1 x. - -
ta * +.
', * . " . - -.. ,- r -[M. .
=v,
: . .a - , na 1,
b.9' , u. 4 ,.7*
. . ....: ve . ~(' '
' ,,' '
I*g .,
; -ap
.
{# ~ fi . 4 y. . 4 * '" ^,, ss
' . ! '' , %
'~ ~*
' ~L. n
' *# g g ,
h . ,s.,,' ,
*. .- - -
,. , 7 '. ,,3 (* 7 %? , 'f. T,' ..
., . x . *s -' y~ + e' J .n'*q . %,.-n.u , . . ~. ",, r= "
.e |= . $, $,*# ,? E# W. :v .4% '"' :. r, "
?ugr . a,
}- ,
* - , ( *.*.- V- " . . , %_4 1. - , ".,n- . ; . ,.,
s **.
,$ % , ' 's . , u .sju , ^ ) . _ ' ~''f rgj % g , ,4 sQ7 p;.f; , . . . W + * . , . .: . - - . y. > ,< - t ~ g% . r
-- ;1
;4y g ggg g pg , ..} ;; 1 ~; .a
v.y A y~ i,
..
g. -+4+ ,,, % - %~ : , w ..o..
, Ap. h .x . 3.y .,g c,-, . . . =.n n , %, . ..
'
m y } h,- - ~g.
, 77:~.w: ?.q h.am- 4
.., 1
. e Q. w., x4 x ;4 g y 8eg,,.- m., ,s =n 2
. . - :e,
' % .* ,
w . mg.;t1 a ~ : * ;% s %
, 3. .
4 eg.+ '. *n %v% .w:2;. < - 5 >>
\j( , ' . k -
, ' g e p '^ 4
b ,s. ++ i av 4 -
.. 2-
[!- v * 2% | t~ i'5.). ..4 1,
+f . (.i '
, . , - *. :g (. :.7 % y d*,'' ,j -
.s & U' ~ i . L *
.
- ,
_ _. . .[ M,SMikih ,eI.4rt 3 [ Mk A. [ 1[ . . i. [ ~ , [ ., , _ . _. _ . -- - --
--- -m
n. .~
' :|^ ^ V,
. ' . * ,1 s . '- g*m m? '. . -, m
, ' ,
,'e a y' - T ~ ,, .j^% E,,
., @p. <% ,w. t - 4. .- , .
,n.a R,_e
-
-
, _- 5 e ' s s..y c-4 .t. ,
, r3 1..-
,t .
+, c < ,: r i,>w . :s - ..g p ;. -
., , : . . . a
t ,
& . + eQ8Ntlp(t yp Q" YQ h f;*+* Qf|.~. On 4:^ .|i * w 2 %|f,. |h.;_' '?+ L hy ' O 'N " , g_ t, 3 y,. .ep -g y, g. . j: ,a.
* '* - * JM - k, {
[.p ( %,:.,i ;j.1- -
y . y ,;. ,a }fKp.3: h - e * ~
*d- J? Q | $4.?..;.g
gg...+- --
u .y ., , y~- . -k . p . m..4.;
,4, j ~ % :;q .
^yy *
y y :,
e .>4 ; ..m, . ...
.,~
j%*Q%. ? " h ;. gf ['|.'),{ R|:, j!i%, i| ^
f .&$f;NhS%*
V. W ' . s ;. 9 . ~ # _ _ ;ym . M W i,.,, ;..v.h,% I:a :-
t;9~g*$,,*~*$%_ .
..Y4m %.. R .'v G [ 7g3 f .,6.:q_.y .a% .. w,/ -
_
<s. ~
<n. . . . , 9.. . . . .n * - . .e"% 2;MtPMMgn-mem w aky _._.. Mb:MMCw1MKTT: . .v. t . c ,. 17 4 - n i e.<?
-
R~- -w ( .. . . . . 4; ema .: - .- - . - . .. . ;
C MF""~',~m,.~~~2: a,cg,, @mQi,e4, ,.>w,N .
N .
FIGURE 3.19. APPEARANCE OF FAST FRACTURE SURFACE OF (top) A508 TESTED AT RTg + 30 C AND (bottom)OSA-WELDEMENT TESTED AT RT + 57 CN NDT '
Im = 127 MPam /'91
157 MPam /21Ln For the weldment K and for the A508 K =
Im
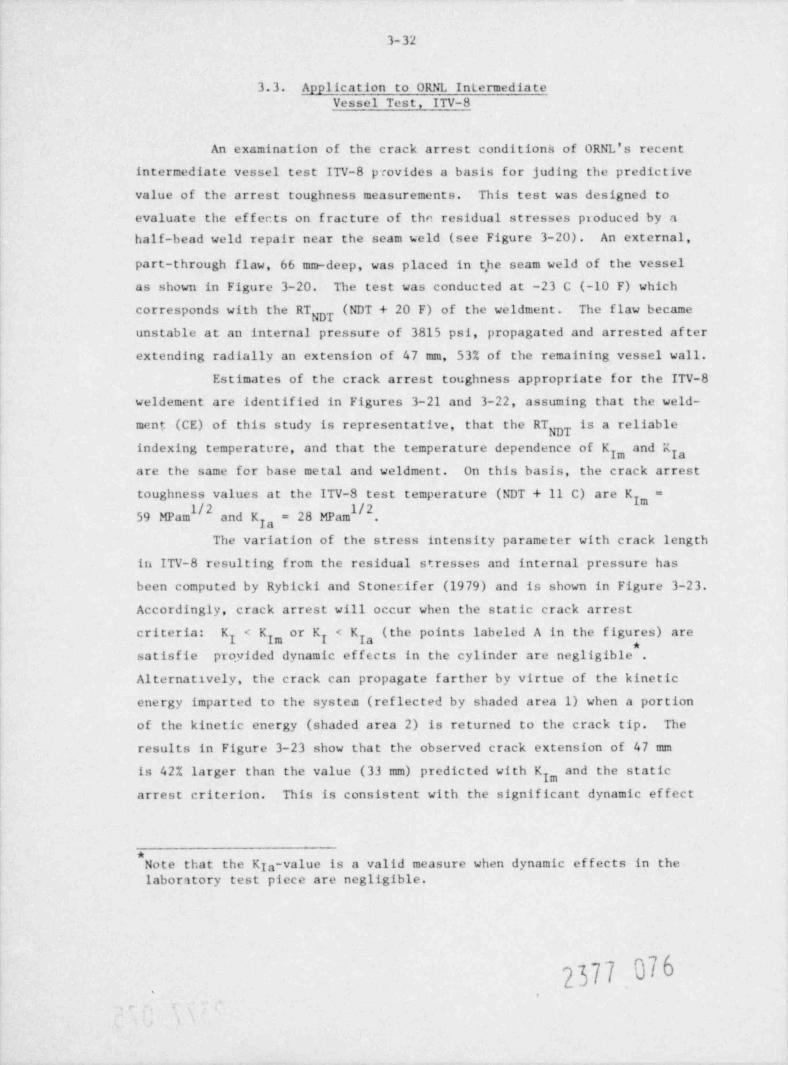
3-32
3.3. Application to ORNL IntermediateVessel Test, ITV-8
An examination of the crack arrest conditions of ORNL's recentintermediate vessel test ITV-8 provides a basis for juding the predictive
value of the arrest toughness measurements. This test was designed to
evaluate the effects on fracture of the residual stresses produced by a
half-head weld repair near the seam weld (see Figure 3-20). An external,
Part-through flaw, 66 mm-deep, was placed in t,he seam weld of the vesselas shown in Figure 3-20. The test was conducted at -23 C (-10 F) whichcorresponds with the RT w men . aw ecame
NDT
unstable at an internal pressure of 3815 psi, propagated and arrested after
extending radially an extension of 47 mm, 53% of the remaining vessel wall.
Estimates of the crack arrest toughness appropriate for the ITV-8
weldement are identified in Figures 3-21 and 3-22, assuming that the weld-
ment (CE) of this study is representative, that the RT s a reliableNDT
indexing temperature, and that the temperature dependence of K ,and K77
are the same for base metal and weldment. On this basis, the crack arrest
toughness values at the ITV-8 test temperature (NDT + 11 C) are K =
7
59 MPam /2 and K = 28 MPam /21 1.
Ia
The variation of the stress intensity parameter with crack length
in ITV-8 resulting from the residual stresses and internal pressure has
been computed by Rybicki and Stonecifer (1979) and is shown in Figure 3-23.
Accordingly, crack arrest will occur when the static crack arrest
7 < K , (the points labeled A in the figures) arecriteria: K < K , or K7 7 7
satisfie proyided dynamic effects in the cylinder are negligible .
Alternatively, the crack can propagate farther by virtue of the kinetic
energy imparted to the system (reflected by shaded area 1) when a portion
of the kinetic energy (shaded area 2) is returned to the crack tip. The
results in Figure 3-23 show that the observed crack extension of 47 mm
is 42% larger than the value (33 mm) predicted with K ,and the static7
arrest criterion. This is consistent with the significant dynamic effect
*the K a-value is a valid measure when dynamic effects in theNote that l
laboratory test piece are negligible.
2377 07-
,
w
I
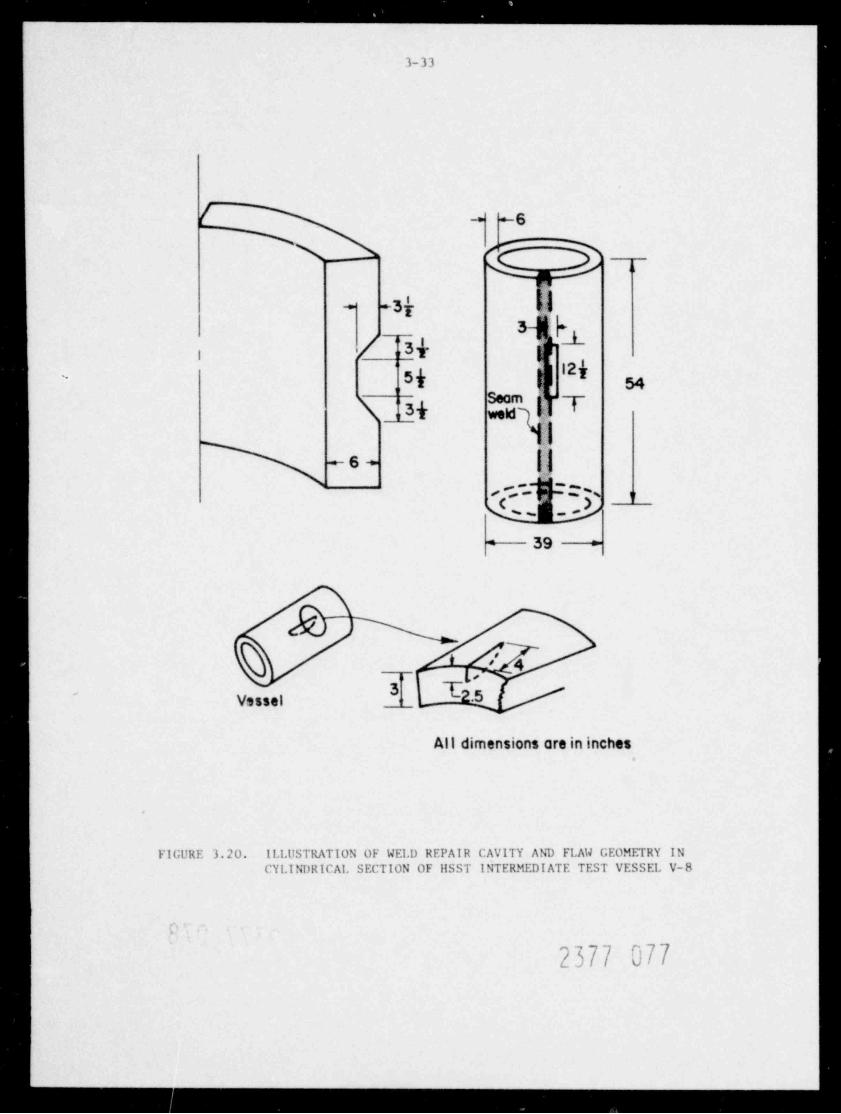
. - . - - - . -_ _ _ _ _ _
3-33
-6-
fE_hh"%m
+3 l+
31 h/ ||3i gIi
5g 12 i,~
54
!'\ ||3Yweld \::.
T]|j+6+
by-- = ~ v
~
+-- 3 9 ---*
' 41- L,o
'
Vsssel L 2
All dimensions are in inches.
FIGURE 3.20. ILLUSTRATION OF WELD REPAIR CAVITY AND FLAW GEOMETRY INCYLINDRICAL SECTION OF llSST INTERMEDIATE TEST VESSEL V-8
,7i
2377 077
- __
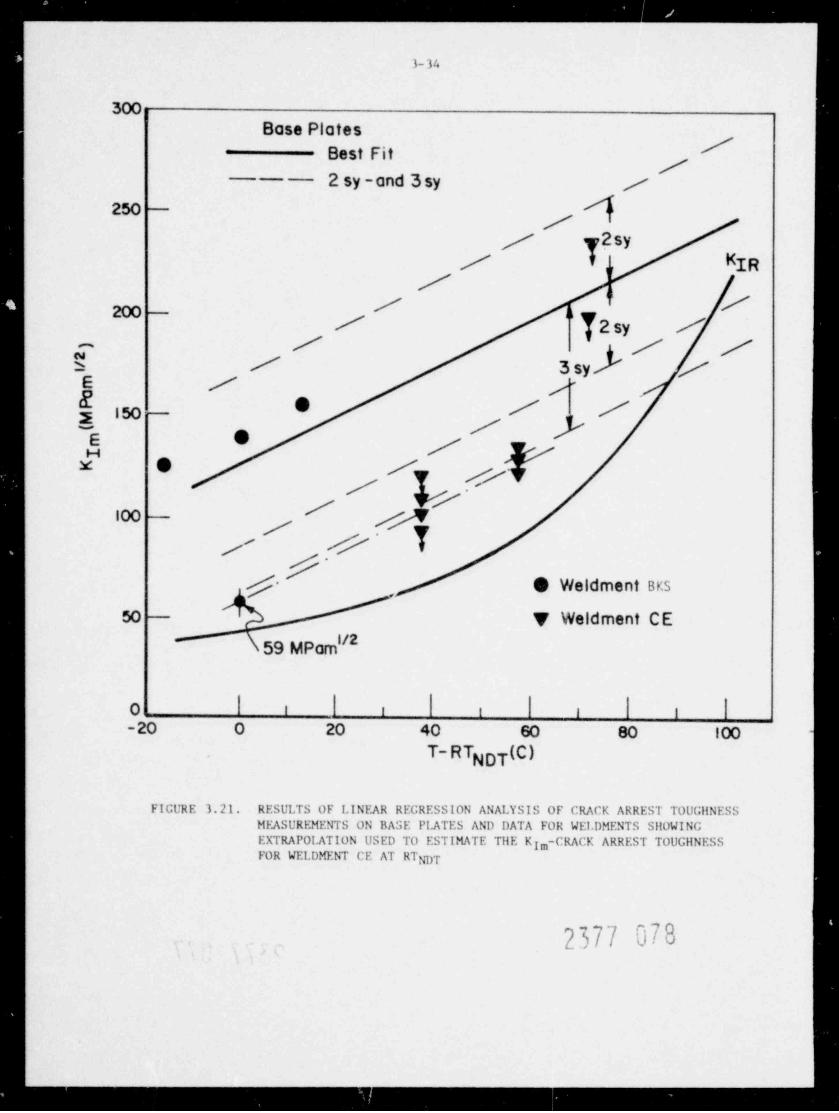
. _ _ _ . . . . . . _ _ _ _ _ _ _ _ _ _ _ _ _ _ _ _ _ _ _ _ _ _ . _ _ _ _ _
3-34
300Base Plates
Best Fit/
2 sy -and 3 sy /250 d
/ 2sy/ KIRp
| //200 h/ J2sy // / /S
5 / 3 sy /E / -,
* / )/ /5 |50/*5 /
x e //
''% //,,_/ '//
/f S Weldment BKS
,
J50 V Weldment CE
u259 MPom
0 i i i
-20 0 20 40 60 80 100 -
T- RTNDT(C)
FIGURE 3.21. RESULTS OF LINEAR REGRESSION ANALYSIS OF CRACK ARREST TOUGilNESSMEASUREMENTS ON BASE PLATES AND DATA FOR WELDMENTS S!!OWING
EXTRAPOI.ATION USED TO ESTIMATE Tile KIm-CRACK ARREST TOUGIINESSFOR WELDMENT CE AT RTNDT
2377 078.
- - _ . . . . . .
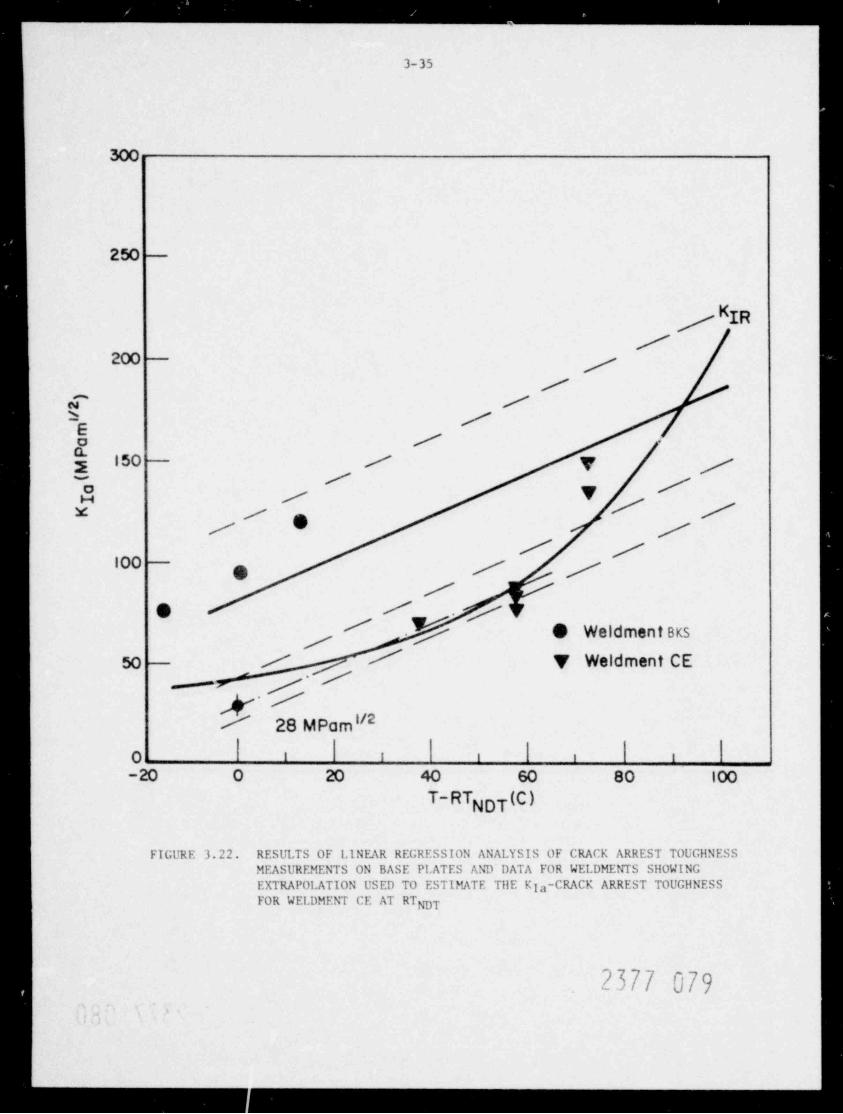
. . . . . . _ . . . . _ _ _
__
3-35
300
250
Kf IR/
200 y/
C /D
Eo / -
n.150 / y y2 '~
o /H / Y
/ /x // /
/ /'00 / /e/
e // V ,/
p y 9 Weldment bks
50 / / V Weldment CEf' /-
N/ 28 MPam /2i
!0 i i i i i
-20 0 20 40 60 80 100
T-RTNDT(C)
FIGURE 3.22. RESULTS OF LINEAR REGRESSION ANALYSIS OF CRACK ARREST TOUGHNESSMEASUREMENTS ON BASE Pl.ATES AND DATA FOR WELDMENTS SHOWING
EXTRAPOLATION USED TO ESTIMATE THE Kla-CRACK ARREST TOUGHNESSFOR WELDMENT CE AT RT NDT
2377 079.
,
-
- - - - - . .
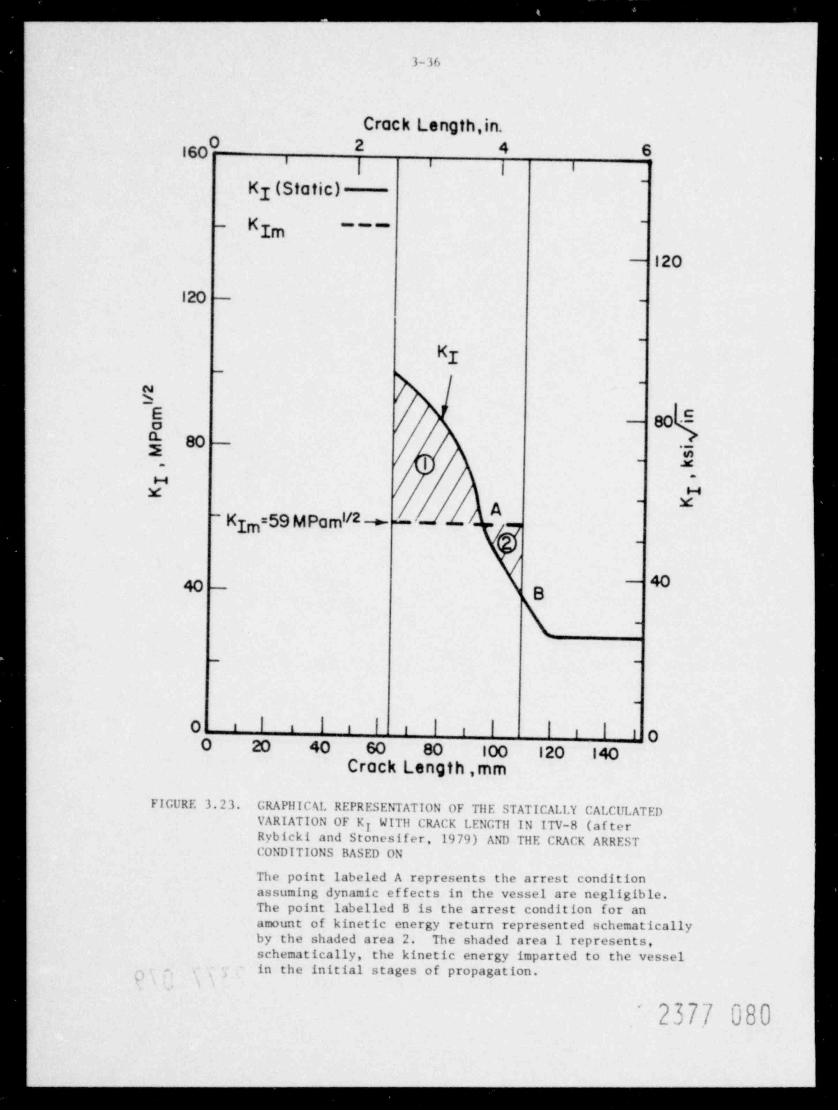
. . . . . _ _
3-36
Crack Length,in.2 4 6160 '| | i8
Ky (Sta tic) --
- KIm~~~~
- 120
120 - _
_
Ky_
N-
h
5 - 80 Eg 80 -
.g|
- x-
-sM H
A- *
KIm=59 M Pa m /2_._l _.
_
e - eg_
_
_ _
_
o i l li i l i I I I, , i oo 20 40 Go 80 100 120 i4oCrack Length ,mm
FIGURE 3.23. GRAPillCAL REPRESENTATION OF Tile STATICALLY CALCULATEDVARIATION OF K WITil CRACK LENGTil IN ITV-8 (af tery
Rybicki and Stonesifer, 1979) AND THE CRACK ARRESTCONDITIONS BASED ON
The point labeled A represents the arrest conditionassuming dynamic effects in the vessel are negligible.The point labelled B is the arrest condition for an
amount of kinetic energy return represented schematicallyby the shaded area 2. The shaded area 1 represents,schematically, the kinetic energy imparted to the vesselin the initial stages of propagation.n . . ,
e 3
~ 237.7 080
. . . . _ - _ _
3-37
encountered for a large crack jump in a cylinder as discussed in Section*
2.3 . The results in Figure 3.23 also show that the crack extension pre-
dicted by K , together with the static arrest criterion is 55 mm or 17%7
larger than the observed value. Consequently, both the K ,- and KIa-crack7
arrest toughness values of weldment CE (when coupled with a dynamic and
static analysis respectively) are in agreement with the response of the
crack in ITV-8, considering the uncertainties in the extrapolation. How-'
ever, the significance of this agreement is placed into question by
preliminary values for weldment BKS, which is examined in Section 5. As
shown in Figures 3.21 and 3.22, the toughness values for this second
weloment are much higher, and they suggest weldments display a higher
degree of variability than the base plates. Since the crack arrest tough-
ness of the actual ITV-8 weldment is, thus, very poorly defined, the only
cenclusion that can be drawn is that the crack arrest toughness values
for weldment CE are consistent with 1TV-8, while those for BKS are not.
3.4. Discussion
As pointed out in Appendix E, part of the scatter in the data is
probably due to heat-to-heat variations in dynamic toughness. The metallo-
graphic results suggest that the reason for such variation may lie in
differing tendencies for ligament formation and shear wall rupture and also
provide a physical basis for dynamic fracture toughness. The most important
implication of these fractographic observations and toughness estimates is
that K as" derived by the BCL test procedure, represents a real physical,g
quantity: the toughness associated with rapid extension by complex mix of
crack propagation mechanisms. The crack tip extends rapidly by cleavage
but is retarded by the rupture of intervening ligaments. These rupture
processes eventually absorb most of the fracture energy after the crack
has traveled some distance and the cleavage path has generated the ligaments.
In fracture toughness testing, the standard methods enploy a sharp, flat,
fatigue crack as a crack starter. Crack initiation is the instability due
TDyr. ".c calculations presented in Section 2.2.2 and 2.3 of this reportfor a smaller cylinder subjected to thermal stress show that dynamiceffects are negligible for small crack extensions of 9% and 14% of theremaining wall. However, the dynamic effects are not negligible for alarge crack extension amounting to 69% of the remaining wall. In this
case, the dynamically calculated crack jump exceeds the value given bythe static arrest criterion !y 53%. Since the crack extension ITV-8 isalso relatively large (537 o. the remaining wall) a significant returnof kinetic energy is also to La anticipated.
2377 081-
_ _ _ _ _ _ _ _ ..
3-38
to the onset of cleavage propagation. At this point ligaments probably
play a lesser role in determining the local conditions which trigger the
instability. It is currently believed, therefore, that K -values reflectIm
conditions and mechanisms not reproduced by slow or rapidly loaded Kgtests.
In contrast to K the physical basis for K I"" ""Ilg Ia
established. Indeed, the crack-jump dependence of K suggests that it isgdif ficult to specify a unique value of this parameter other than the one
approached as the crack jump length is reduced to a sufficiently small value,
i.e. a value close to Kg (see Figure 3.12). The K -values currently beinggmeasured are connected with a rectangular specimen size and other con-
straints, and will be relatively constant when the specimen-to-specimen
difference in jump length is small. The results of this study show that
such K -values are on average 32% smaller than K ,. Consequently, if Kg g la
is a less accurate measure of arrest toughness than K it is certainlyg,more conservative. Furthermore, the conservatism inherent in applying a
static analysis to a test program compensates, more or less, for the non-
conservatism involved in neglecting kinetic energy return in a structural
component. The errors just compensate whe" the relative amounts of kinetic
energy return in the test piece and structural component are comparable.
This built in configuration probably accounts for the precision of the
K -> se pr ction for N 8 noted W re in kc t ion 3. 3. Howev n , beauseIa
of limitations on the size of the crack jump in the test specimen, the
dynamic cont ribution here is relatively invariant. On the other hand, the
kinetic energy action can be expected to increase with increasing crack
extensions in the vessel. It follows that K -based predictions will beIa
non-conservative for crack extensions larger than the one obtained in
ITV-8. For this reason, it seems likely that dynamic effects in the vessel
will have to be accounted for specifically even if the more conservative
K -parameter is adopted as a measure of crack arrest toughness. Figureg
3.23b Illustrates the risk involved. The K -value taken together with ag
modest kinetic energy return would f all to predict crack arrest in this
case.
With regard to the K ~E'C "#""' " " ""NE"" " '"IRprobably a more reliable indexing temperature than the RT Further, theg.K C""" "* " "EE"# " ' "# '" C" E "" " " E"" "C" #IR
7377 082-
8 i
: 0 t, ,,
. . . . _ _
3-39
base plate and forgings, being too flat at lower temperatures and too steepat higher temperatures. As a result, the K -curve is a highly conservativeIRrepresentation of the lower bound of K -crack arrest toughness and forgingsg
at intermediate temperatures in the transition range, i.e., between NDT + 20 Cto NDT + 70 C. The degree of conservatism is reduced both at lower and
higher relative temperatures, and is further diminished when K is regardedgas the crack arrest toughness. This is especially noticeable for the K -
values of weldment (CE), which straddle the K -curve. In this case theIRK -curve does not serve as a conservative lower bound of the K -crackIR garrest t o ugh .ie s s . Figures 3.21 and 3.22, which contain results for weldment(CE) and '.ne high copper veldment (BKS) discussed in Section 5 show that
the cra;k arrest toughness values of weldments may display more variabilitythan chose for the base plates. For this reason a separate K -C""" "YIRhavo to be defined for weldment.
3.5. Conclusions
(1) Within the temperature range examined, NDT to NDT + 100 C,the crack arrest toughness parameters K and K increase linearly withg Iatemperature.
(ii) The K ,-values for the four heats of A533B steel and twog
heats of A508 fall significantly above the K -curve, over the entireIRtemperature range. Because the temperature Jependence of the K -cune
IRdoes not correspond with that of the crack arrest toughness values, it is
a particularly conservative representation of the lower bound for KIm ^'intermediate temperatures in the transition range, i.e. NDT + 20 C to
NDT + 70 C.
(iii) The K -values are on average 327. lower than the K -g
values for the materials t e s u -l . The K values fr the four heats. ofIa
A533B and two heats of A508 steel fall above the K -curve belew aboutIRNDT + 80 C.
(vi) The K - and Kg I a %-lu s for tlu' submerged are weldment
are from 307. to 407. Iower than the values for the base plates and forging.The K -values for the weldment still fall above the K -ane, but t b'g IRK -values f r the weldment st raddle the K -cune. As a result, the Kla IR g p,-
2377 083
---
- _ _. .

3-40
curve does not serve as a conservative lower bound of the K -crack arrestla
toughness for the weldment.
(v) The conventional toughness values, K and Charpy V do not7
differentiate the two distinct crack arrest toughness levels of the base
plate and the weldment. For this reason, a separate K -curve for weldmentIR
may he required.
(vi) The NDT is a more reliable indexing temperature for crack
arrest toughness values than the RTET *
(vii) Fractographic studies of the surfaces produced by fast-
fracture and at arrest in the transition range reveal that the crack
extension mechanism involves both cleavage, ligament format ion and shear
rupture. Correlations between K and fractographic parameters supportgthe view that K is a real physical quantity and represents the toughnessImassociated with rapid extension by a complex mix of crack propagationmechanisms.
(viii) Both the K - and K -values for the weldment, reportedg ghere, couples with dynamic and static analvses, respectively, are consistent
with the run arrest event observed in the recent ORNL intermediate pressurevessel test ITV-8.
2377 084
.
.
*
. . _ _ _ _ _ _ __
4-1
4. CRACK ARREST TOl'GilNESS MEASUREMENTS ONQUENCllED-ONI.Y A508 STEEL
This section describes fracture toughness and crack arrest tough-ness measurements performed on A508 steel samples taken from a cylinderemployed by ORNL (Oak Rid >;e National Laboratory) in its series of thermal
shock experiments (Cheverton, Iskander and Bolt, 1978; Cheverton and Bolt,1977; and Cheverton, 1976). The measurements were performed as part of thedata base study both to facilitate static and dynamic analysis of crackarrest in the thermally shocked cylinders, and to permit critical evaluationsof analytical procedures. Early efforts to conduct crack arrest toughnessmeasurements on this steel were not successful (Third Annual Report, IM11 -1995) because a relatively tough, heat affected zone near the weld line
prevented the cracks from penetrating into the test sections of the duplexspecimens. This problem wan overcome and five additional crack arresttoughnet' tests have been conducted.
Convent ional K) measurements were
also perforned to confirm that the properties of the A508 steel were u itaffected by postweld heat treatnent> The mea surement s have been used toevaluate static and dynamic analysis of thermal shock experiment TSE-4 (weSection /.2, liaanland, et al., 1978; and Cheverton, 1skander, Gehlen, andlla h n , 1978}
'4 . l . ProcedI1res
The A508 specimenu were cut frou a pie-snaped section taken fremORNL test c ylinder ISV-1 lhe cylinder is in a " quenched-only" heattreated condition produced by water quenching from 870 C The results of
both Charpy and fracture toughn. , tests indicate no significant differencesbetween TSV-1 and a companion cylinder TSV-2 or an a functien of radialposition in the cylinder wall. Duplex rec t angular-DCB crack art e ,t
spec imens (140 mm-wide, 400 mm-long, and 50. 5 mm-t hick) were fabricated bs
elec tron beam welding quenched-and-tempered 4 340 steel starter sections tothe tert material. In add ition to the results for the tour duplex-DCBspecimens reported here, a single test was per f ormed en an ord inar y *-DCBspecimen (OR-9 in Table 4..') to nake it possible to produce a smaller crack
* A DCE' nnec inen without a 4 340 steel starter section.~
2U/ 085
-
_-
4-2
jump with a lower crack velocity During welding the duplex spec in. ens were
given a post-weld temper at 388'C with the intent of minimizing cracking of
the weld. This heat treatment may have induced seme microstructural changes
in the A508, but the effect is believed to be slight as there is no
detectible change in the naterial's hardness after welding. Fracture tough-
ness measurements en IT compact tension specimens performed at 79 C also
show no significant effects of the heating (see Table 4.1).
Details of the crack arrest test procedure have been reported
(llea g la nd , et al., 1977; lleagland, Rosenfield, Gehlen, and Hahn, 19 Tl) . To
enhance the prospects for penetrating the test section, the normally 00
percent deep side grooves wtre deepened to 80 perc,nt over a 10-na long
section straddline, the weld none The rcoval of this material reduces
the amount of fracture energy which can be extracted by this region during
crack propagation, and in eftect, reduces it toughnes> Photographs of two
broken and heat-treated crack arrest vpecimens illustrating the side groove
configuration are shown in Firure 4.1.
4.2. Resulty
The fracture toughness and et ac. <rrest t oo;;hness neasurement s are
summarized in Table 4.1 and 4.2 and in Ficures 4.2 and 4.3. Note that the,
test temperature s correspond ( neminally) with the temperature at the crack
tip at the onset of crack extensien (77'C) and at arrest (131 C) in the
TSE-4 experiment. The fracture toughness measurements agree with values
reported by Cheverten, Iskander, and Bolt (1978), but show considerable
scatter. Scanning electron nicrographs (SEM) of two I3CL compact tension
specimens are shown in Figure 4.4a and 4.4b for test temperatures of 93 C
and 126*C, respectively. These SEM'c reveal that the onset or crack exten-
sion proceeds by the cleavage mode at temperatures _ 93 C and by the ductile,void-nuc leation-and-growth mode at 126#C.
The measurements performed en the duplex-DCB specimens make it
possible to evr.luate KID (the fast fracture toughness) at essentially one-1
velocity, 700 ms at each of the two test temperatures. The one ordinary
DCB specimen offers a value of K at 470 ns- 127 C. As shownatg
schematically in Figure 4.3a and 4.3b, the crack arrest toughness, K is,
defined as the minimum in the variation of K with crack celocity. Whileg
2377 086n' c,.
\.b\ ' r ^.
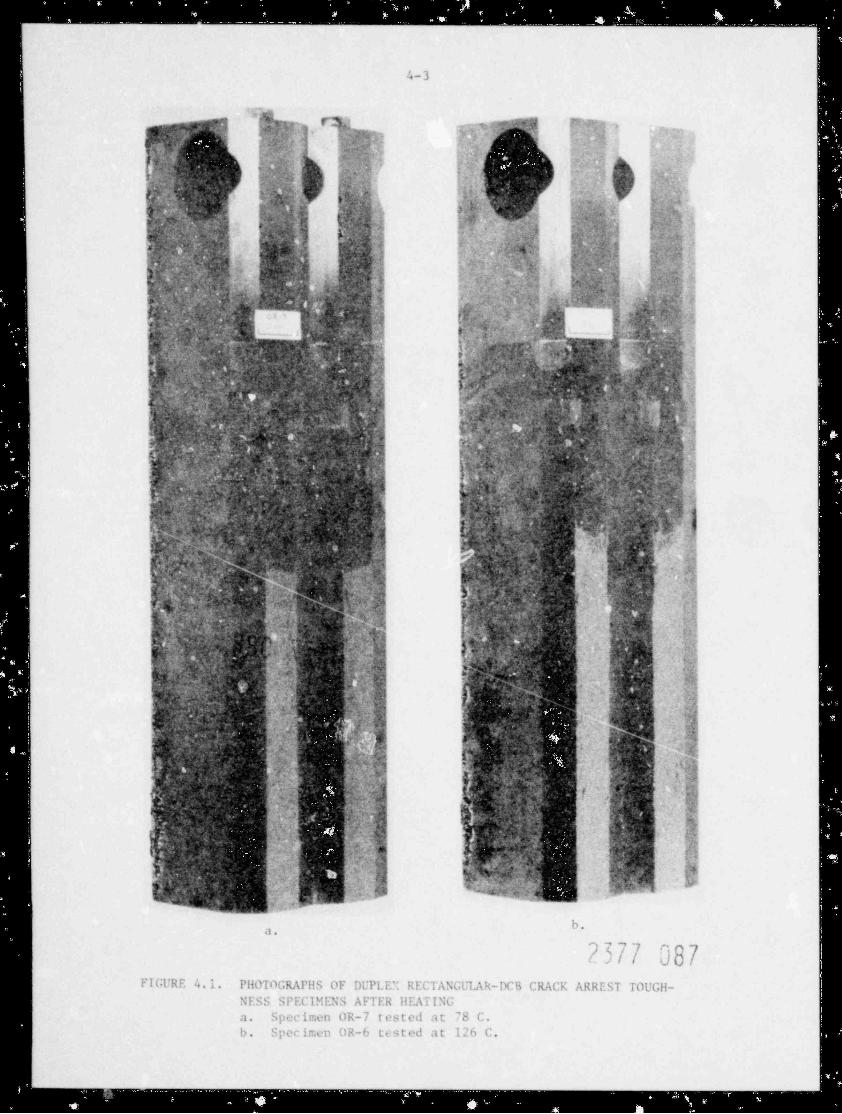
. - . - . . _ , . . . . , -__
4-3
,
[t , . f7.!~v s ~. -, e 'N P'ka +*''l$ w, - ->
:< .s- 'e ~ ~ , ,gv,,y ."
fi'*
t -
*.
. .,' Y{ g Q''' O{~,..-(
|
fe Ns a
|a
p* ' ')e t (pepene ' <) -'
s,
rf,y*. .! i { t? 7 a
4 e ,.g.e s -, , . ,
g/4 ,s
L. f' "<. 's H. g g, pqt 1 ?- t , +,,
N{ i,4 * , ,1, '
-
)' ,'4[et*' , ' ~g;4. re j , 4 +
.-
7%s -
f('.i, A , ,rr f i s ., , -3
L ') \i,,y|-h ! ,- o|| ' *,eN:*.
r
, +> 7> <
ff. .--1 , ., , s m .,a . 3 . s , a ;.r,, . x, .<< . p~ j _
'
.
p; m,"f f 30Y h | |?,', ,?,
$*( f ''| ,,~a O ,i'
k I'
g,.>* < .p...,,,_ _ L( W,n'.V .c.;ny', m.. 5t :, y e g t <-
.
: : s, , . . ..e o. _
k, s ', , -. 5,A $ r Y1$,%$,1, Y. '. D. f< ".A') L'.f,4 w,0, ? N 'w , > . m ,s ,
'5; ,4
p%.,y.< | ;h, .%u M Q .. .g'; T '," .:)- +m sTh. y ,,, , q;V,z,<:: ,' f,'7.f|. f.
. .
h ,
, r e ~.fs? 3s -.,.s _.
w:m%-- a , -~, 3, .:y qgs. _: v s, ' ' .:< p
["@' ", L Mg h ,~b' f+'' d"'.;;4.? ; tu ,,/t9 'y)a
3D, ) %,g ;g,.,':L e, A, t;,f e') "' ' ''- D ' , 4 p ", c . i.) ;
'(*. 4 A ri r
.; ; .. , n ,9 d t.,:
41 .e.
, , . s ;, s #s,g y+.> m.. 3,g A - a*.- y- ;. A L ,$ n, ~.
%1r o ' p%.m, H Q
_
. ysyn' ag''p " ,y >*; Ls : t n >c, n ' A' t +-'
f| N'Y W W *G. R N; C f | W) g'7: "?Y~:,$: b s<* ' , > q
Q,'M ',Y,$5I JUN - ,
[$l'i [. N(- f. ' .c' ,'r '' h' y " :,[ '' 7 '- N % .'y o 4. ..
h!
! . - 6 , , pd 'a 4 .*1- f'3%',.y'.s* hi
,* !. i 4' 'e .Ma * 4;
*Yk; |*;?|,|y, Y '^ -
v#.. h., ' Wk< i:b' N'
. ,- a s . _. s ;. s
M i ~ %' #'at]Q %( <|;* f ^j#;[y ' <r' : e <- n e
., M - } p:# ; i . e#$. '/ ),21,b[X,[Ih :,N
2 m, i
*h,[Oa ,'-< .
: e ,
~f ., ;5c ^ 3,g|N0&c4,'
n
q Lg;h- s h. . . v-|L.: .; - ,,
t .e a -gr .s -
I k, .I. ,,;
('t rf <$5f'd|.U'h'e ' #[|, p ". j4
Q: ? 4 :*;;'
Lp +( ,$., L;| 39* Ye s .A . - y , :t - 4
g J:I" 'r .&fT i,,-:***''i1
. '.. .*@t2'E@h,|;o . '
> 4
...h&$.;gQ , 41 , . * . ;+ <,
6ty: v%'z.s. ,m.
-j'( Q:il 'fO' W~ ?*
4ew: .9m i., ,c |
, --,, . .
i 'e . ' i. [c>,' s* b - % .,
a .x ;. .
- o ; ,, .M a .M6 ,
4 .. **5 I
f,,y , ;4*y s- , a , .,
-A ,% i -
~ ~.;1g ,4 J,o; .:, t.,
,'
,
,. & y 2'y1 f L i ss 4 ,- **s G 4. ,
*
~M y <
. '~rj 6 37 y y 4j,
;< 't4; , ~ , . , . , , s ,,,z4.. -,
~ .-J W f ,d d,,.
'. = w.d 7 9d' td ,-
< * ., O,k ,$x$G A i '*
'? w'J L o g"'
. ~w. ,L '(y,yn ' , ,,,
>
e5 'r,r
'
) W,;.t i..- i*- g
' , ' t. i:v.s y.,fi + = . s- - .;.. .
k 'O '' k "'
%- fj ** .m .- _. g
Q. .
W,
-,
b.a,
23// U87,,7
FIGl'RE 4.1. P110TOGRAPHS OF Dl'PLE': RECTANGL'LAR-DCB CRACK ARREST TOUGH-NESS SPECIMENS AFTFR HEATINGa. Specirien OR-7 tested at '8 C.b. Spec ir.en OR-6 tosted at 126 C.
- -- -- _ _ _ . _ . ..
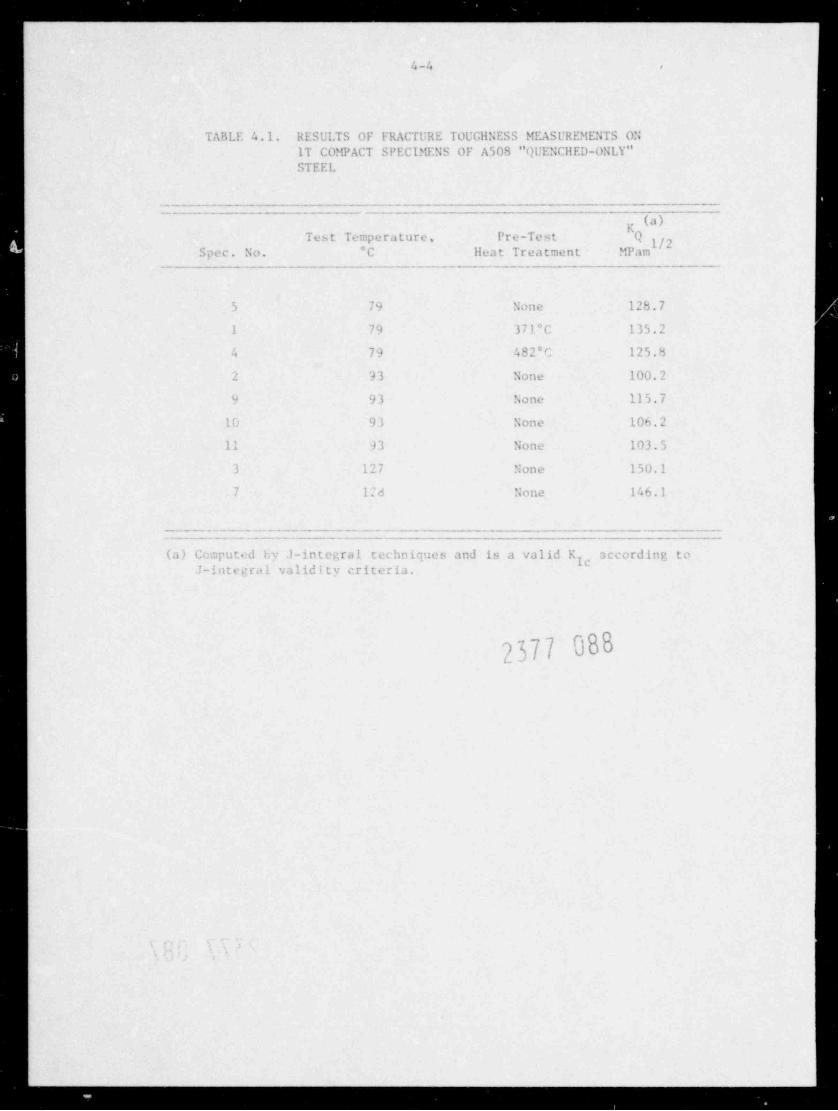
.. . . . . _
4-4 <
TABLE 4.1. RESULTS OF FRACTURE TOUGilNESS MEASL'REMENTS ONIT COMPACT SPECIMENS OF A508 "QL'ENCllED-ONLY"STEEL
__
_ _ _ . _ _
hTest Temperature, Pre-Test Q g p'
Spec. No. C llea t Treatment MPan
5 79 None 128.7
1 79 371 C 135.2
:. 79 482 C 125.8
2 93 None 100.2
93 hone 115.7u
LO 93 None 106.2
11 93 None 103.5
3 127 None 150.1
7 12d None 146.1
_ _ . _ _ _ _ _ _ _ _ _ . _ _
- - - - - - . _ _ _ _ _ . .
(a) Co.put d by J-integral techniques and is a valid K according togJ-int e,: ca l valid i t y cri t er ia.
2377 088
, ,

_. .
__
TABLE 4.2. RESULTS OF CRACK ARREST TOUGHNESS l'EASUREMENTSON " QUENCHED-ONLY" A508 STEEL
# # 6 6Specimen Test o a i a Q Ia ID EstimatedNumber Temp., *C (mm) (mm) (mm) (mm) MPam MPam MPam /2 Velocity (m/s)
g j ~, 7 7 ~,
.s
OR-5* 12 6~ ~ 84.5 168.3 2.78 2.81 264.7 122 172 670
OR-6* 126 ~ 83.7 175.4 3.01 3.02 289.0 125 173 700
OR-7* 78 83.4 172.1 2.90 12.90 281.0 106 157 780
OR-8* 78 84.7 181.7 2.51 2.51 240.6 100 149 715
OR-9** 127 80.1 123.6 1.42 1.42 188.1 113 139 470
Iv
* Duplex-DCB specimen, 140 mm wide, 400 mm long, and 50.5 mm thick.** Ordinary-DC3 (no starter section) 140 mm wide, 212 mm long, and 50.5 mm thick.
NLA's)~~q
C- >Co4
. . - - - . . , - . _
~

. . . _ . _ _ . _ . _ _ _ ____.
4-6
CaNL-D*G 78 - 564i
(ts. A)(vN m-l'8)
O ORNL 15v t AS RECEIVED PCC,
200 - 0 ORNL Tsv t 550*F FOR 2 4 hr O.394TCTd CRNL T5v t $50* F FCR 24 he 1TCT
~
d ORNL T SV-l StO* F FOR 24 hr 2TCT
9 ORNL T SV-2 550* F FOR 24 hr O.394 TCT
150 - W ORNL TSV-2 550*F FOR 24 hr 1TCT gd
15o - d cRNL Tsv-2 tso r FOR 2 4 he 2 TCT gda sui Tsv-t sto*r Fon 24 >< tTcr 3 g
#5h,4_, , . $-4v" tisE 4)54
ioo -
d'W lS100 -
#O
00o50 -
3n _
I f f f f f f '- 0
(*C) -250 -200 -tSO -100 -50 0 50 900 150
1 I I I I I I I
tar) -400 -300 -200 -too o too 200 50 0
TEMPE R ATURE
FIGURE 4.2. K VERSUS TEMPERATURE FOR TSV-1 AND7cTSV-2 A508 QUENCll ONLY MATERIALAfter Cheverton, Iskander, Gehlen,and Hahn, 1978.
2377 090
m '
- -
_ _ _ . . _ . . . . _ . . . _ . . . . . _ . . . . .

. . . _ _ . _ _ _ _ _ . _
n-1
2001 I , ,
__
K ID KID
g 100 H |00g
KICq +KIC = KIm 8
KIm- __ __ __
0 I I O 1 1
0 400 800 0 400 800Crack Velocity Crack Velocity
(a) (b)
200 200; ; ,
/K
(Y , IC /g6.2.- 4 /# ~~-_kK-- Im
$R '-g 4 (-*-- KIC ~ KIm E
-
E 1002 100 ---
2 2
78 C 126 C
O Ductile mode
9 Cleavage mode
0 I I O I i
0 400 800 0 400 800Crack Velocity,ms-' Crack Velocity,ms-'
(c) (d)'h'IGURE % |3|, , KID-CRACK VELOCITY RELATIONS: (a) AND (b) SCHEMATIC, 'c) AND;
'
(d) QUENCHED ONLY A508 STEEL AT 78*C and 126'C
2377 091- - - -
_ __ ..
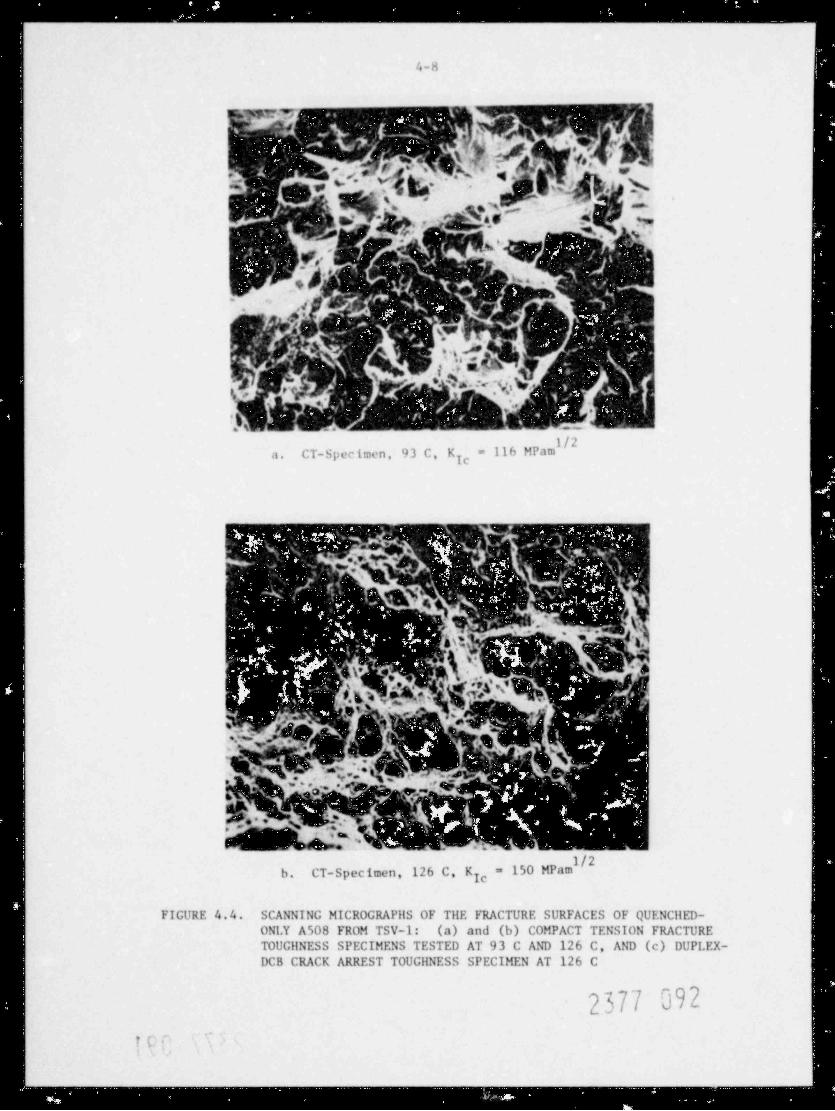
. .
4-8
.n, v.g(teys.,
,;.
.?, '., .
|.-
a. CT-Spec traen , 93 C, K = I M Mam7c
i
1
'
. .;-
'.
wc. _ . .
% _.
|;%
,. , , 'N ' -
,,
.
f., , W:.
4!>= '
M0 Wamb. CT-Specimen, 126 C, K =7c
FIGURE 4.4. SCANNING MICROGRAPilS OF Tile FRACTURE SURFACES OF QUENCllED-ONLY A508 FROM TSV-1: (a) and (b) COMPACT TENSION FRACTURETOUCilNESS SPECIMENS TESTED AT 93 C AND 126 C, AND (c) DUPLEX-DCB CRACK ARREST TOUGIINESS SPECIMEN AT 126 C
2377 092
tcc
. _ ___
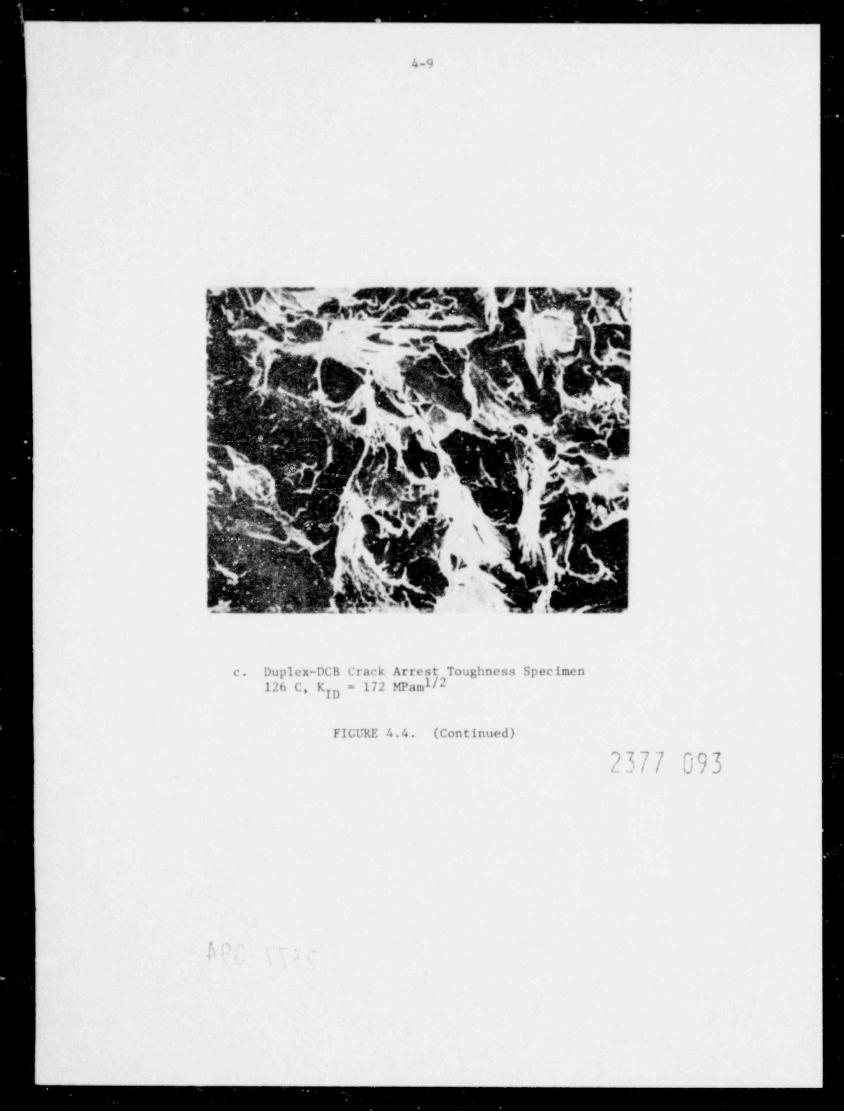
. ._.____ _
4-9
7e' . I*
i .
I. ^ ^ ~ = " 3- -
~
s*9
e ,. ,
''.- g:, ,
''.$ .
'2, a r
., ,
., , ,
%
c. Duplex-DCB Crack Arrest Toughness Specimen. amW126 C, K =
ID
FIGURE 4.4. (Continued)
2377 093
!.
- - -
_ _ _ _ _ .

___ . . - . - - - - . _ __
4-10
K values represent resistance to crack extension at very low, essentfallyzero crack velocity, they can only be regarded as estimates of K ""
imfracture proceeds by the duct ile fiberous mechanism (Figure 4.3a); Kgvalues fall below K for cleavage (lla hn , Hoagland, Lereim, ria rkwo r t h, andg
Ros"nfield, 1978). The fractographic observations in Figure 4.4 show thatthe f ast f racture and arrest in the DCB specimen proceeded by cleavage.Thus, K -- the minimum resistance to cleavage -- could be below the valueof K , as shown schemat ically in Figure 4.3h. This conclusion is surported
by the value of K derived from specimen OR-9 which corresponds withID-1470 ms and does, in fact, fall below KIc.
Rough estimates of K were deduced from run-arrest events (pop-ins) which proceeded by cleavage in two IT-compact specimens tested at 93*C(see Figure 4.'+a). These two pop-ins involved 3.8 mm and 5 mm crack
extensions along a broad f ront accompanied by drops in load. The values
K : 94 MPam 95 MPan the stress intensity f actors at arrestID " Im , ,
(at 93*C) are obtained assuming crack extension at constant load linedisplacement and negligible dynamic ef f ects for the small crack extensions(Aa = 0.08, 0.10). Estimates of the corresponding values at 77*C and 126*C:"
= 77 MPam /', 1% Wam /21' 1K , are oMained by applying the Unear tempera-7nture coefficient: 1.19 MPam /2 per *C reported for this material but for a1
different heat treated condition in Table 3.2 of this report. The resultingK crack velocity curves, Figure 3.7c and 3.7d are similar to one reportedIDby Bilek (1978) for a quenched and tempered steel which involves propagationby cleavage.
4.3. Discussion and Conclusions
134 MPam /2 126*C, obtained here is1The estimate: K : at"
, consistentsvith K = 127 t 14 MPam /1at 131 t 9 C, the stress intensityy
at ar' rest reported for the ORNL Thermal Shock experiment TSE-4 (Cheverton,'
Iskander, and Bolt, 1978). This is discussed more fully in Section 2.2.The present work therefore provides a measure of support of the analyticalprocedures used to assess crack arrest in the thermally shocked cylinder.
2377 094
_ _ _ _ . _ - . - . . ..

_____. _ _ _
5-1
5. CRACK ARREST TOUGHNESS MEASUREMENTS ONIRRADIATED A508 HIGH COPPER WELDMENT
During the past year, specimens to investigate irradiation effectswere prepared from a high copper A508 weldment. These specimens, consisting
of tensile, Charpy V-notch, 0.5T compact tension, and duplex double-cantilever-beam specimens, were exposed to fast neutrons (E > 1 MeV) at288'C to a total fluence of approximately 1 x 10 neutrons /cm . At theend of the reporting period, the specimens were ready to be returned fromthe irradiation site to the Battelle Hot Laboratory for dosimetry counting
and testing. Shipment and opening of the irradiated capsule were expectedto occur during November 1978.
5.1. Material Investigated
Two quarter-sections of an A508 Class 2 steel pressure vesselnozzle cutout containing a submerged arc weld were furnished to Battelleby Babcock and Wilcox in November 1977. The weldment was typical of those
employed in some of the early light water reactors, i.e., it contained a
high percentage of copper and exhibited a relatively low Charpy uppershelf energy, the latter resulting f rom the use of Linde 80 flux. Figure
5.' is an illustration of the fusion zone as revealed by etching and the
cutting pattern used to make specimen blanks.
Mass spectrographic analysis revealed that the average coppercontent of the submerged arc weld metal is 0.29 pct and the average
phosphorus content is 0.013 pet. The copper and phosphorus contents of
the twenty individual specimen blanks were used to predict the shift of19 9
l irradiation to a fluence of 10 n/cm~ at 288*CRTNDT
""C*P"'2Y "8-
(550*F), based on NRC Regulatory Guide 1.99. Fourteen of the blanks
were estimated to exhibit a shift in RT '
NDT
while the renmining 6 slabs were estimated to exhibit either larger or
smaller shifts. Specimens to be irradiated were prepared from the 14slabs that were expected to behave similarly.
The mechanical properties of the specific weldment furnished byBabcock and Wilcox were not available at the time of specimen fabrication.
2377 095
-
_ _ _ _ .
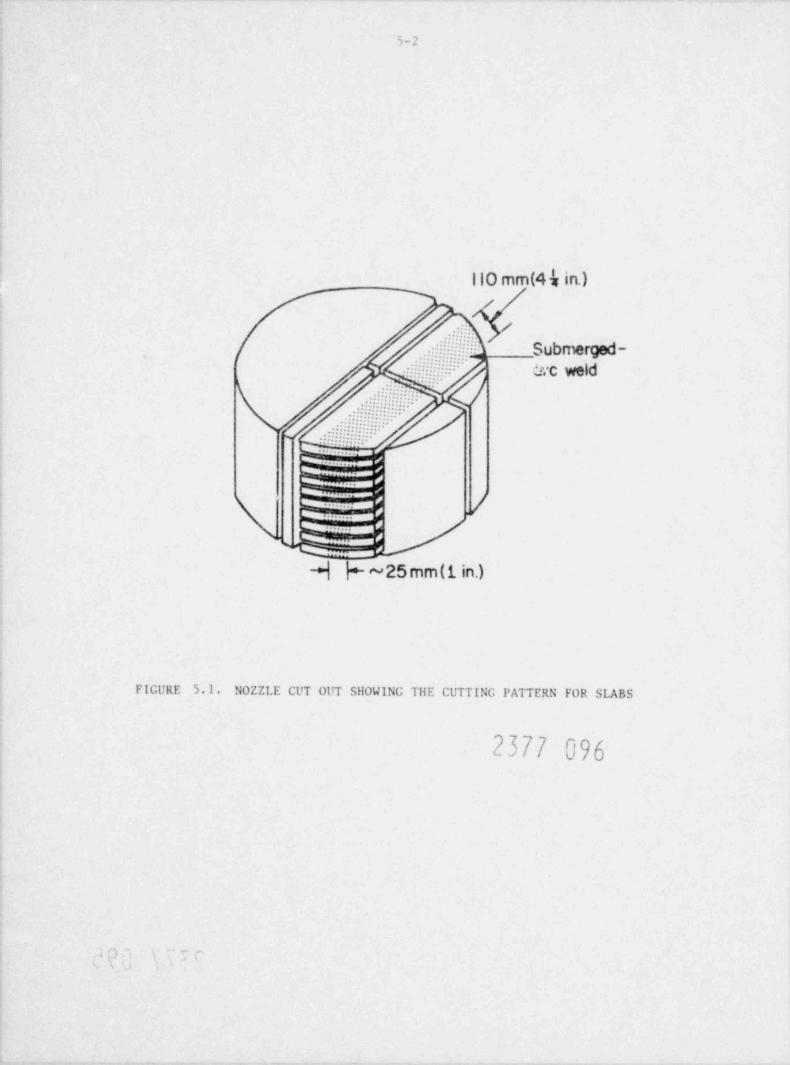
5-2
110 mm(44 in.)
~
Submerged-ucc weld
s
'
\- H: -
w }H H ~25mm(1. in.)
FIGURE 5.1. N0ZZLE CUT OUT SHOWING Tile CUTTING PATTERN FOR SLABS
2377 096
, _.
3
_ _ _ _ _ _ _ _ _ _ _ _ _ _
5-3
To assist us in design of crack arrest and fracture toughness specimens,mechanical properties were estimated on the basis of results reported byBabcock and Wilcox (1976) for a similar A508 submerged arc weld. Table 5.I
shows estimated properties of the A508 weldment both before and afterirradiation.
5.2. Specimen Design
Four types of specimen are being used in this program to investigateirradiation effects: tensile, Charpy V-notch, 0.5T-compact tension (CT), and
duplex double-cant ilever-beam (DCB) crack arrest specimens. Flat tensile
rpecimens, illustrated in Figure 5.2, were selected for erficiency ofpacking in the irradiation capsule. Charpy V-notch specimens were ofstanoard design as described in ASTM E23, Notched Bar Impact Test ir g ofMetallic Materials. The design of the CT and DCB specimens depended enthe properties of the ruiterial. As noted previously, the properties were
not available at the time of specimen preparation but reasonable estimatescould be made (Table 5.1).
Fracture toughness specimens designed according to ASTM E399,Methad of Test for Plane Stra in Frac t ure Toughness Testing, would havebeen prohibitively large for irradiation, thicknesses would have exceeded
125 nm (5 in). Accordingly, specimen design was based on recommendcd
procedures for J-integral testing, for which smaller dimensions are
permissible. Current recommendations indicate that dimensions a, b, and
B (c rack length, uncracked 1igament, and thickness, respectivoly) must
equal or exceed the quantity 12 J /c y, where g is the average of yieldand u l t ima t e strengths and J ~
' I'' ~IC ICspecimens, illustrr.ted in Fi r;u re ;. 3, we re sel ec t ed f or f rac ture toughnessr:ea suremen t s In addition to meeting the recommended size requirementsfor l testing, they are of a +i;< convenient for testing and otcuw onlylCa re lat ive l y smal l volume in the irradiation capsule.-
Selection af a duple: rather than an ordinary DCB specinen for
crack arrest t est ing was based on estimates of K and yield strength atgupper shel f t empera t ures 'otlowing i r rad i a t ion (Table 3.1). If no hardened
crack-starter section had been ustd, the maximum toughness measurable
would be dictated by the vield st rength of the irradiated weldment at the
M 77 097~.
--
_ _ _ - . . . . . -
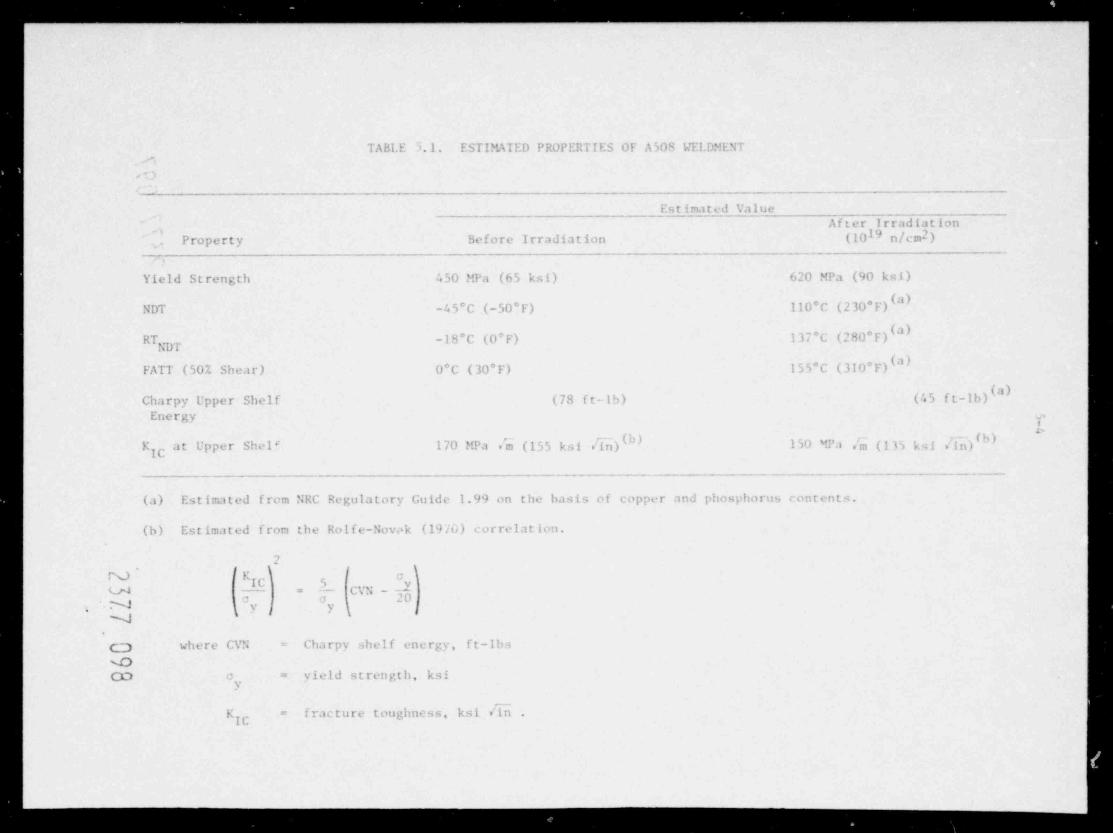
__ _ . _ _ _ _ _ . . . . _ . . . . .
TABI.E i ,1. ESTIMAIED PROPERTIES Of A 509 k'EI.DMENT.-
-
__
Estimated ValueAfter Irradiation
l9 n/cm )2_
Property Before Irradiation (10
Yield Strength 450 MPa (65 ksi) 620 MPa (90 kst)"
NDT -45 C (-50 F) 110*C (230*F)
RT, .D.I, -18 C (0*F) 137 C (280*F)(a)a
"'FATT (50% Shear) 0*C (30 F) 155 C (310*F)
Charpy Upper Shelf (78 ft-lb) (45 ft-lb) "Energy p
e
150 MPa .m (1 h ksi .In)(b)K at Upper Shel' 170 MPa em (155 ksi .' i n ) ( b )--- r--
___ _ _ . __ _ _ _ _
(a) Estimated from NRC Regulatory Guide 1.99 on the basis of copper and phosphorus contents.
(b) Estimated from the Rolfe-Novsk (19/u) orrelation.e
,
M IKIL, Y I k.:5_ .
CVN"u =
(y j "y ( j.N,
N
Charpy shelf energy, f t-lbso where CVN =
@CD o, = yield strength, ksi
fracture toughness, ksi [iiiK =
. _ _ _ .

. . . . . . _ _ . . _ -_.
5-s
e-- - - o.
1+16
a
2 0.250 .
-+__ Dimensions in inches.
To convert to mm,
[ multiply by 25.4
5 '
IEIII3h
o.250u .-
t
d+} +i $$1/2
I E'
-d HO.125
F l f,l'RE 5. 2. Fl.AT TENS il.E SPF.C IMI NS
2377 099.
'" / 4 ..
- - -
_ _ _ _ _ _ _ _ _ _ _ _ . .. ._
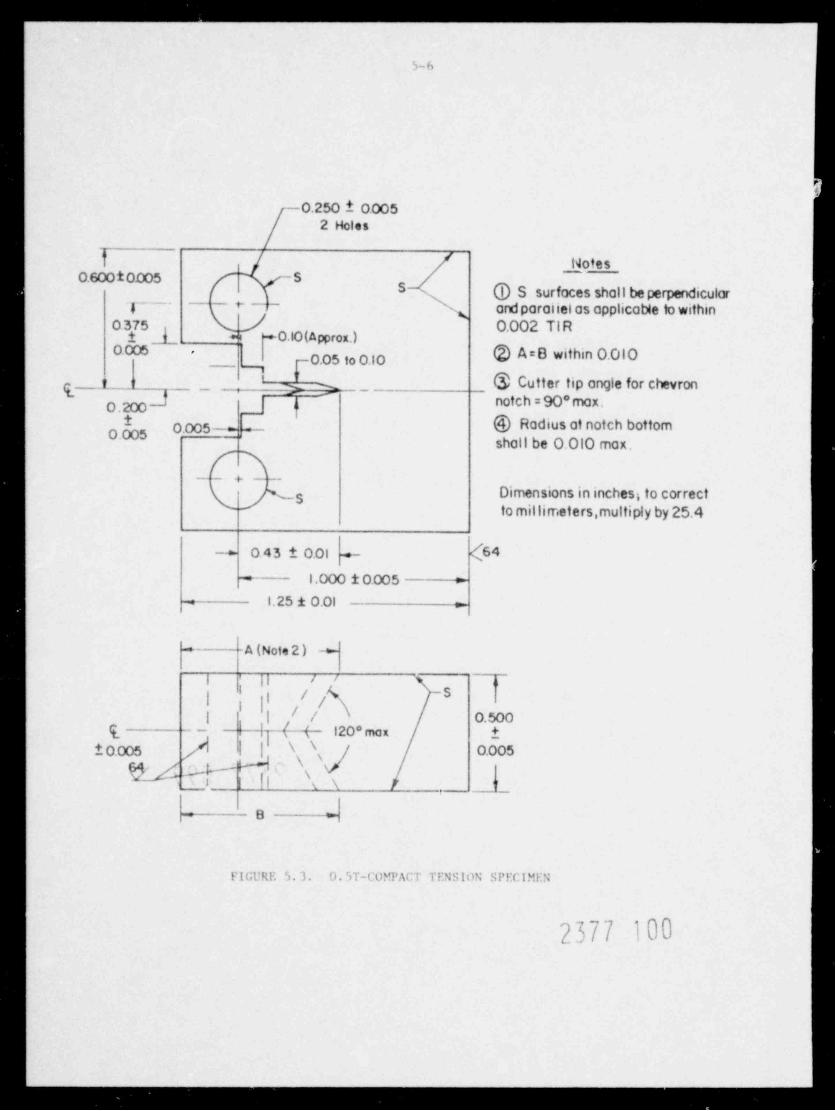
-.. _.-.--__ _.__----_._ _ _ _. ..
s-6
0.250 i 00052 Holes
i JotesO.600 t 0.005 S
S
@ond paratiel as applicable to withinS surfaces shall be perpendicular
\T- - -- t- - -
0375 j 0.002 TIR1 } -+ 0.lO (A pprox.)+<
0.005 i A=B within 0.010,
-0.05 to 0.10i Js @ Cutter tip ongle for chevron'p
0.200 | __.|ntch= W m
O.OOS -L @ Radius at notch bottomi0.005
shall be 0.010 max.
- - + - --
m3 Dimensions in inches; to correctto millimeters, multiply by 25.4
0 43 i O.01 -. (64--
1.000 iO.005= z
1.25 i O.014 z_
A (Note 2)+- +
| 11 / ''
o
| | /
|I ( (/1 O.5009.
- ! 1 120* ma x i
1 0.005 / l \ \
H| . \ 'u/O.005
gw!I Il s \
_,
B ==
FIGURE 5.3. 0.5T-COMPACT TENSION SPECIMEN
2377 100

. . . ...--. - -____
e
5-7
selected test temperature (probably near 200*C). Using the relation
( 11 / 2 ) 1 / 2= o(max) y
where 11 is specimen height, and assuming 11 = 50 mm (based on space avail-able in the irradiation capsule) and a 620 MPa, K would be=
approximately 100 MPa 6n and the maximum mearurable K would be aboutg75 to 80 MPa /m . Based on the upper shelf K estimate of 0 Mpa E,ICit is expected that K at the upper shelf will be greater than 75-80 MPa /mg
and, hence, will require use of a duplex specimen containing a hardenedsteel crack starter sectfon.
The crack arrest specimen used in this investigation is shown inFigure 5.4. Assuming that o of the irradiated weldment lies in the rangeof 500 to 700 MPa, maximum measurable K values for B = 25 mm are 14 5 t og205 MPa [m' , respectively, ha. sed on the relation
(B/0. 3) 1/~'K (max)= a
D y
Maximum K values f o r 11 = 50 mm a re approxim.itely 0.16 o of the startersection (in SI units). For duplex DCB's using AISI 4340 steel at a yieldstrength ranging from about 1150 to 1400 MPa, K will range from
about 185 to 225 MPa /m .
Despite the significant size advantage of duplex over ordinaryDCB spec imens, some uncertainties are associated with their use. These
include-
(a) Elect ron beam welding of t he 4340 to the A508 weld metal
may produce excessive po ros i t y in the fusion zone and,hence, DCB specimens of poor quality.
(b) At test temperatures near 200 C, the toughness of 4 340
may be raised sufficiently to render c rack initia' ion
difficult without exceed . . g the maximum allowable Kg,whose value is reduced by virtue of the fact that yield
strength diminishes with increasing temperature.
2377 101
--
_ __ _._._ _
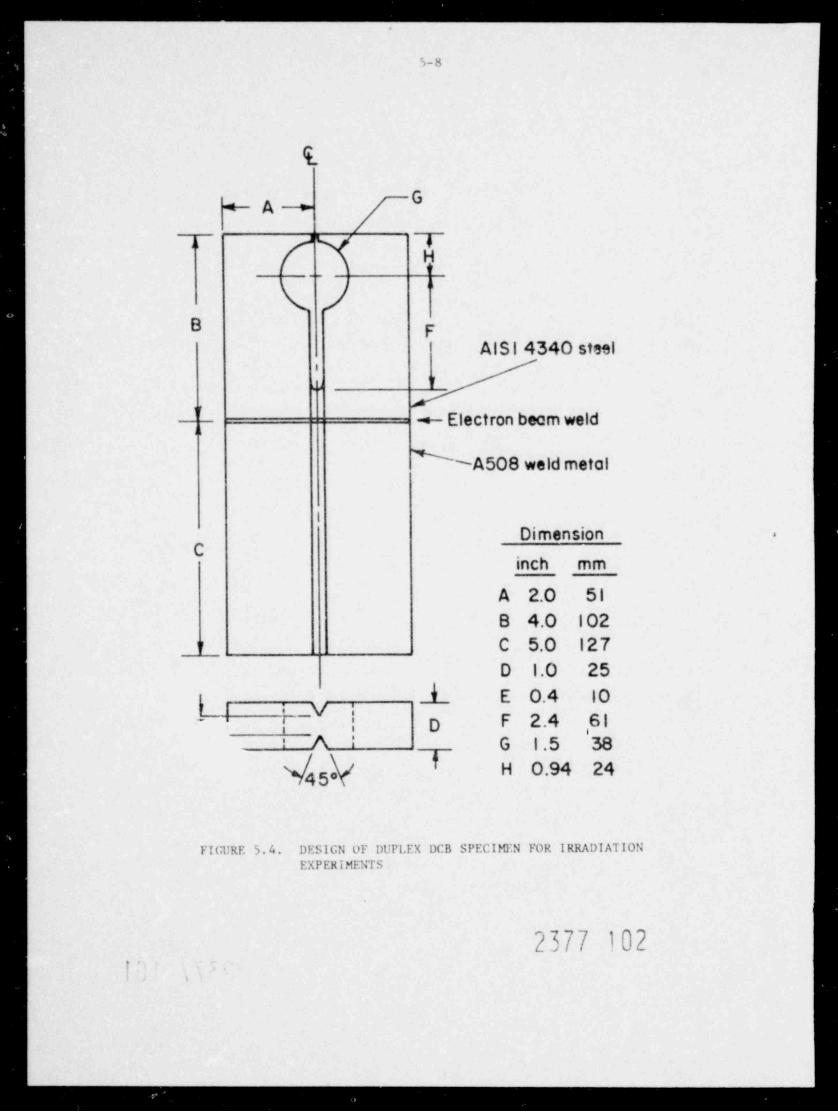
. .. . ..; _ __
5-8
1
G+ A -*
_
a
B pAISI 4340 steel
1
'
to
'-*- Electron beam weld
~A508 weld metal
i
Dimension -
Cinch mm
A 2.0 51
8 4.0 102y C 5.0 127
D I .0 25I E O.4 10
rV !'
D F 2.4 ,61.
: A | G I.5 38I H 0.94 24'
45
FIGURE 5.4. DESIGN OF DUPLEX DCB SPECIMEN FOR IRRADIATIONEXPERIMENTS
2377 102i
>
_ _ _ _ . _ _ . . . . . . . . _ . . . . . . . _ . _ . . . . . . . . .
_ _ _ . _ _ _ _ _ . . - - - - -
5-9
(c) The effects of exposure to irradiation at 290'C on the
toughness and yield strength of the 4 340 starter section
are not well documented.
The first two uncertainties were largely resolved prior to specimenfabrication. The problems anticipated with electron beam welding turnedout to be real but a pretreatment of the A508 weld metal faces to be
joined to the 4340 described in our 14th Quarterly Report, appeared tobe succesaful in overcoming this dif ficulty.
The question of increased toughness of 4340 at temperatures near200 C was answered by conducting K tests o m a range of temperatures.ICAs shown in Figure 5.5, K f 4340 at 200 C is less than 10 pct greaterk
than at room temperature. This suggests that excessive notch-tip plasticitywill not occur during crack arrest tests at elevated temperatures. Thisresult was confirmed by an actual crack arrest experiment at 205'C wherea rapid crack war successfully initiated from a blunt notch in a 4340steel starter section of a K of about 180 Mpa E.
3e third-listed uncertainty in using duplex DCB specimens, namely,irradiation effects on 4340 steel, will not be cleared up until tests arecompleted on irradiated tensile, Charpy V-notch, and fracture toughnessspecimens during the coming year. However, it is expected that irradiation
ef fects on both yield strength and toughness of 4340 steel will be > elativelysmall.
5. 3. Specimen Fabrication
Test specimens were machined from slabs cut from the A508 sub-merged are veldment (Figure 5.1). The orientat ion of the various types ofspecimens is illustrated in Figure 3.6.
In addition to the A508 weldment specimens, tensile, Charpy V-not ch, and 0. 5T-CT spec imens were machined f rom AISI 4 340 st eel that hadbeen quenched and tempered at 370*C (700 F).
The numbers and types of specimens prepared are listed in Table5.2.
f
2377 103
-
_ _ _ _ _ .

._
5-10
Test Temperature ,*F100 200 300 400 500 600
- 80
80 -
g 70
70 g
so50 .s
50
h .E.%40 - M'
M xx 30
30
20
10 -10
0 00 100 200 300
Test Temperature, C
FIGURE 5.5. EFFECT OF TEST TDfPERATURE ON FRACTURE TOUGilNESS OFAISI 4 3'.0 STEEL., QUENCilED AND TDtPERED AT 370"C ( 700*F)
2377 104
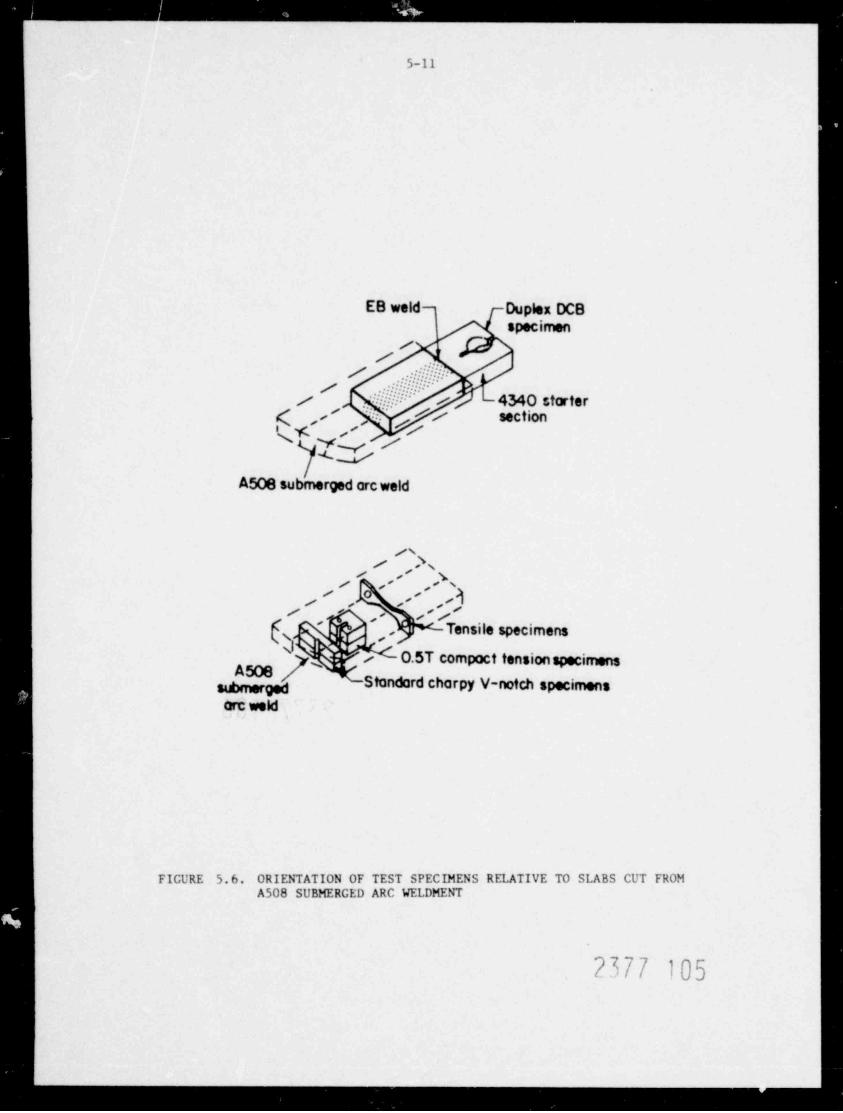
. . . . _ _ _ . _ _ _ _ _ . __
5-11
EB weld Duplex DCBspecimen
'u,-
//
/ .e -4340 starter(%,/ // section'\ / ,,/,
Yv/AJA508 submerged arc weld
/s
,/,
,/ O' ,/ ,,
- , /-.
{' Tensile specimens,
0.5T compoct tensionspecirnens-
UStandard charpy V-notch specimensare weld
FICURE 5.6. ORIENTATION OF TEST SPECIMENS RELATIVE TO SLABS CUT FROMA508 SUBMERCED ARC WELDMENT
2377 105
_____.
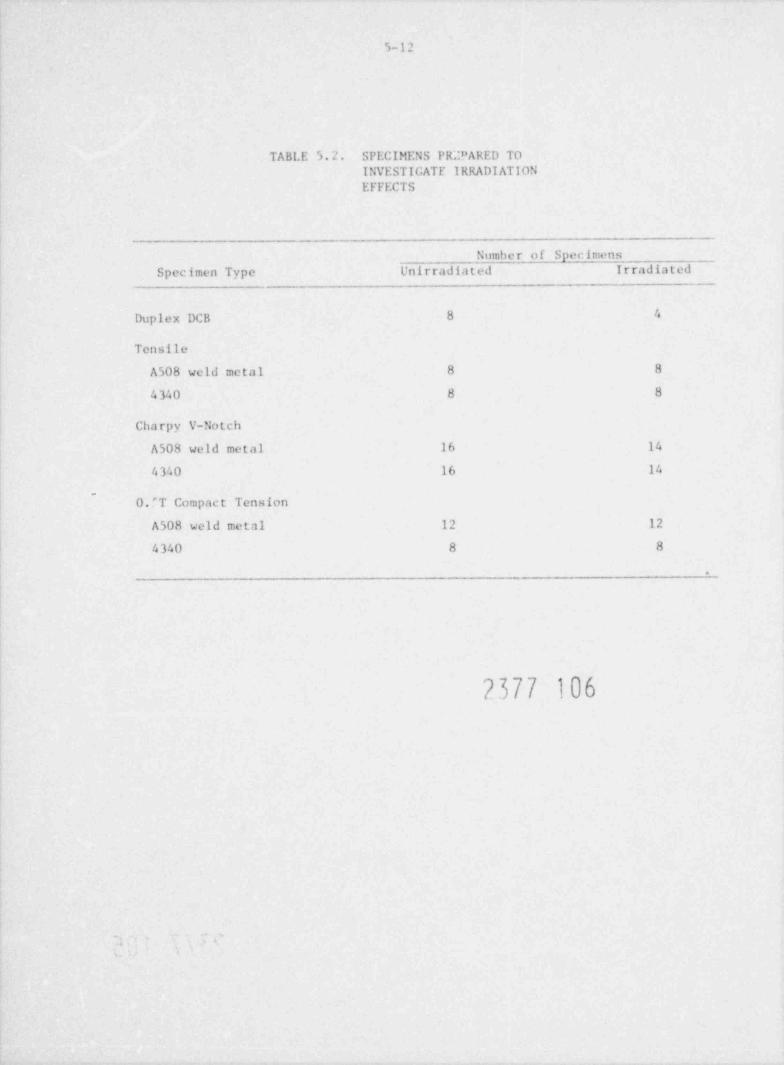
5-12
T A B L E 5. '.' . SPECIMENS PIC!'ARED TOINVESTIGATE IRRADIATIONEFFECTS
Number of SpecimensSpecimen Type Unirradiated Irradiated
Duplex DCB 8 4
Tensile
A508 weld metal 8 8
4340 8 8
Charpy V-Notch
A508 weld metal 16 14
4340 16 14
-
0."T Compact Tension
A508 weld metal 12 12
4340 8 8
2377 106
.
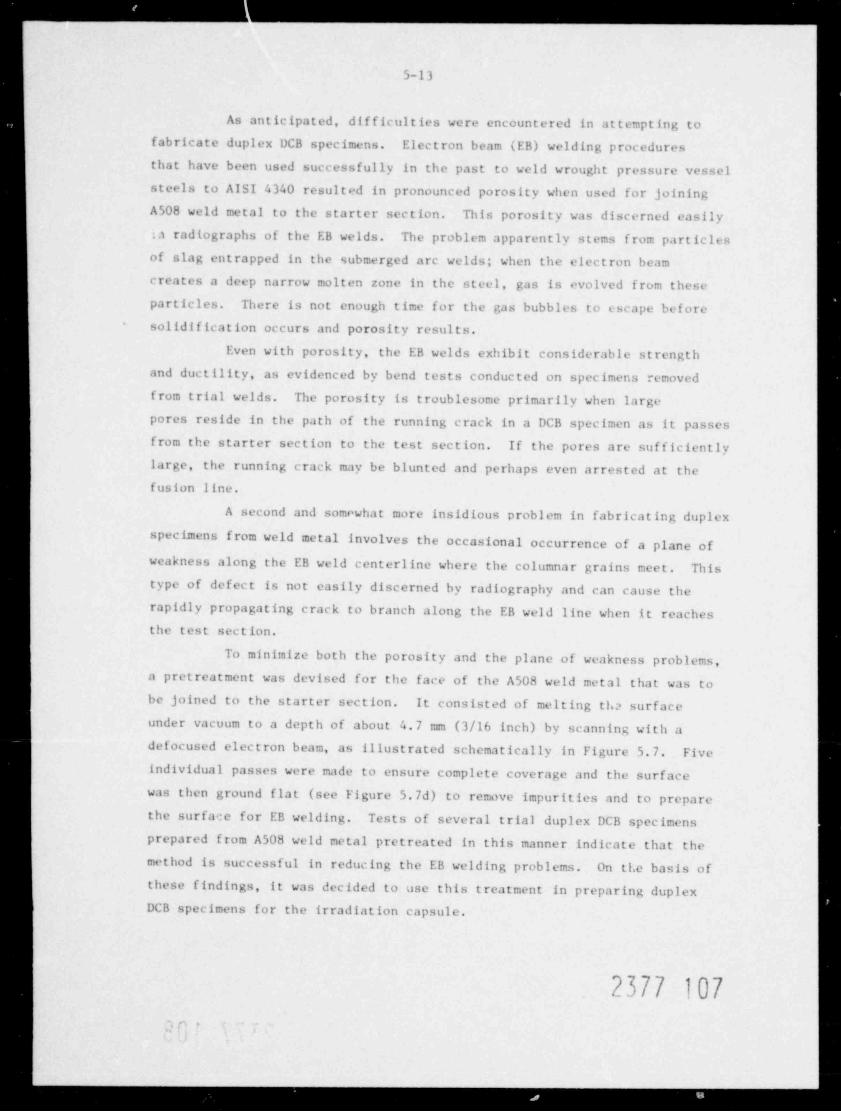
., ,_ -- -
5-13
As anticipated, dif ficulties were encountered in at tempt ing tofabricate duplex DCB specimens. Electron beam (EB) welding proceduresthat have been used successfully in the past to weld wrought pressure vesselsteels to AISI 4340 resulted in pronounced porosity when used for joiningA508 weld metal t o the starter section. This porosity was discerned easily;a radiographs of the EB welds. The problem apparently stems from particlesof slag entrapped in the submerged arc welds; when the electron beam
creates a deep narrow molten zone in the steel, gas is evolved from theseparticles. There is not enough time for the gas bubbles to escape beforesolidification occurs and porosity results.
Even with porosity, the EB welds exhibit considerable strengthand ductility, as evidenced by bend tests conducted on specimens removedfrom trial welds. The porosity is troublesome primarily when largepores reside in the path of the running crack in a DCB specimen as it passesfrom the starter section to the test section. If the pores are sufficiently
large, the running crack may be blunted and perhaps even arrested at thefusion line.
A second and somewhat more insidious problem in fabricat ing duplex
s pec imens from weld metal involves the occasional occurrence of a plane ofweakness along the EB weld centerline where the columnar grains meet. This
type of defect is not easily discerned by radiography and can cause therapidly propagating crack to branch along the EB weld line when it reachesthe test section.
To minimize both the porosity and the plane of weakness problems,a pretreatment was devised for the face of the A508 weld metal that was to
be joined to the starter section. It consisted of melting tha surface
under vacuum to a depth of about 4.7 mm (3/16 inch) by scanning with adefocused electron beam, illustrated schematically in Figure 5.7. Fiveas
individual passes were made to ensure complete coverage and the surface
was then ground flat (see Figure 5.7d) to remove impurities and to preparethe surface for EB welding. Tests of several trial duplex DCB specimensprepared from A508 weld metal pretreated in this manner indicate that themethod is successful in reducing the EB welding problems. On the basis of
these findings, it was decided to use this treatment in preparing duplexDCB specimens for the irradiation capsule.
2377 107,e
( l
.
. _ _ .. . _
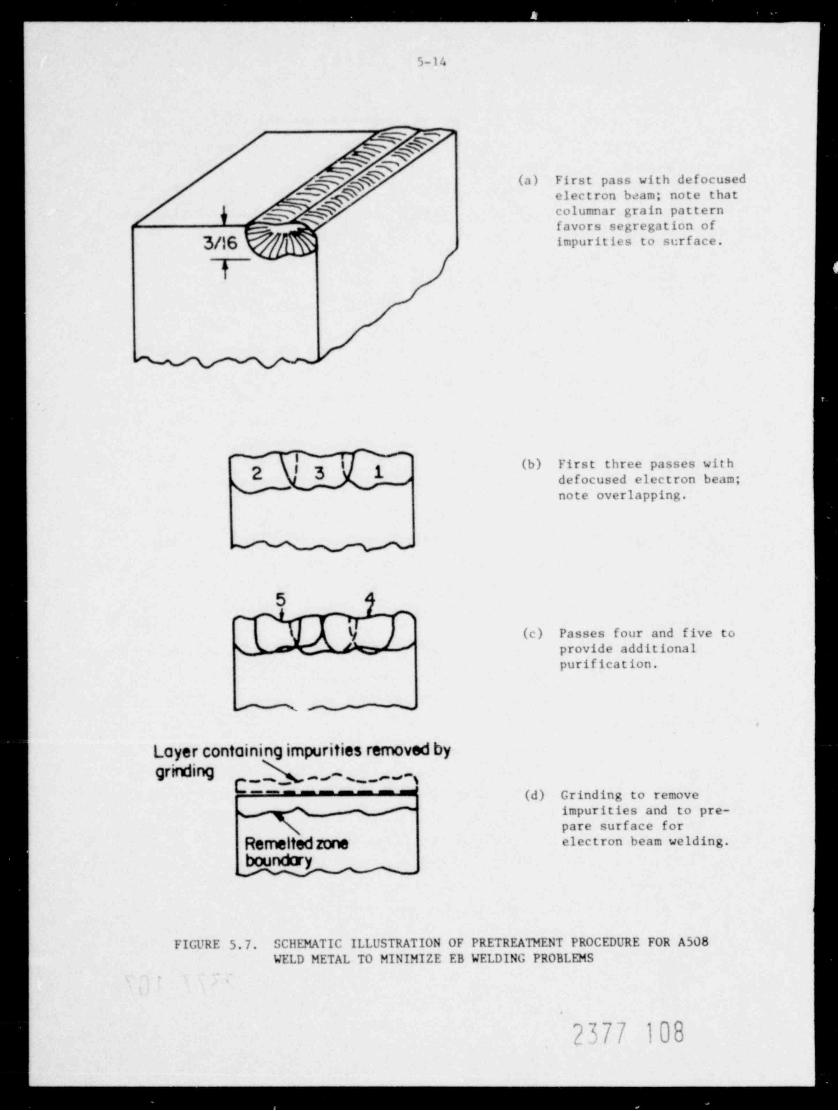
. . . _
5-14
q -.
k- eR (a) First pass with defocusedg
C electron beam; note that
j _p q columnar grain patternfavors segregation of
3/16 impurities to surface.
t
e
g |3 (b) First three passes with' 1 defocused electron beam;
note overlapping.
5m
y (c) Passes four and five toLM ' >(_ provide additionalpurification.
n ~_>
Layer containing impurities removed bygrinding h_, ,
~ ~ - - - - ~ ~ (d) Grinding to removeimpurities and to pre-
N pare surface for
Remeltedzone electron beam welding.
FIGURE 5.7. SCllEMATIC ILLUSTRATION OF PRETREATMENT PROCEDURE FOR A508WELD METAL TO MINIMIZE EB WELDING PROBLEMS
.
2377 108

. . . . . _ _ . - -____
5-15
5.4. Nuclear and Thermal Mockup Experiment
After selecting the irradiation facility (Ford Nuclear Reactor at
the University of Michigan) and the dimensions of the irradiation capsule(approximately 73 x 23 x 4-1/2 cm), a mockup experiment was conducted todetermine both the neutron flux and specimen temperature distribution.
Several types of dosimeters were placed in a 1020 steel mockup plate of 25 mmthickness at the seven locations shown in Figure 5.8. At each of the seven
locations, iron, nickel, copper, and titanium wirei were contained in analuminum capsule which was inserted in holes drilled in the mockup plate.At 1: cations 1, 2, 3, and 4, three additional fluence monitors (U-238,
Ny-237, and S-32) were used in individual cadmium capsules. In addition,
eleven thermocouples were located at various positions in the mockup plateto measure temperatures.
The aluminum capsule containing the mockup plate was positioned atthe reactor core face as shown in Figure 5.9 and exposed at the full reactor
power of 2 Mw for slightly more than 1 hour on October 12, 1977.The specific activities of each dosimeter used in the mockup
experiment were determined at Batte11e's llot Laboratory by gamma spectrometry,with the exception of p-32, which was beta-counted.
The determined specific activitiec for the seven monitor locations
are shown in Table '.3 and Figure 5.10. The full power flux and the fluence
at various locations in the steel mockup plate were then calculated basedon dosimeter activation analysis using the dosimeter activity data and the
ANISN computer program. A detailed description of the procedures employedand the results obtained is presented in Appendix F.
Figure 5.11 shows the flux distribution in the long dimension ofthe capsule and the variation from the front to the back face of a 25 mm(1-inc, thick steel specimen. The flux values shown were obtained from
the nickel dosimeter wires. A much smaller variation in flux was observedacross the capsule width, as indicated by the individual data points ateach position in Figure 5.11
5.5. Irradiation of Specimens
The, duplex DCB, Charpy V-notch, tensile, and 0.5T-CT specimenswere positioned in a specially designed capsule in preparation for irradiation
7,"/7 109
-
- . _ - . .
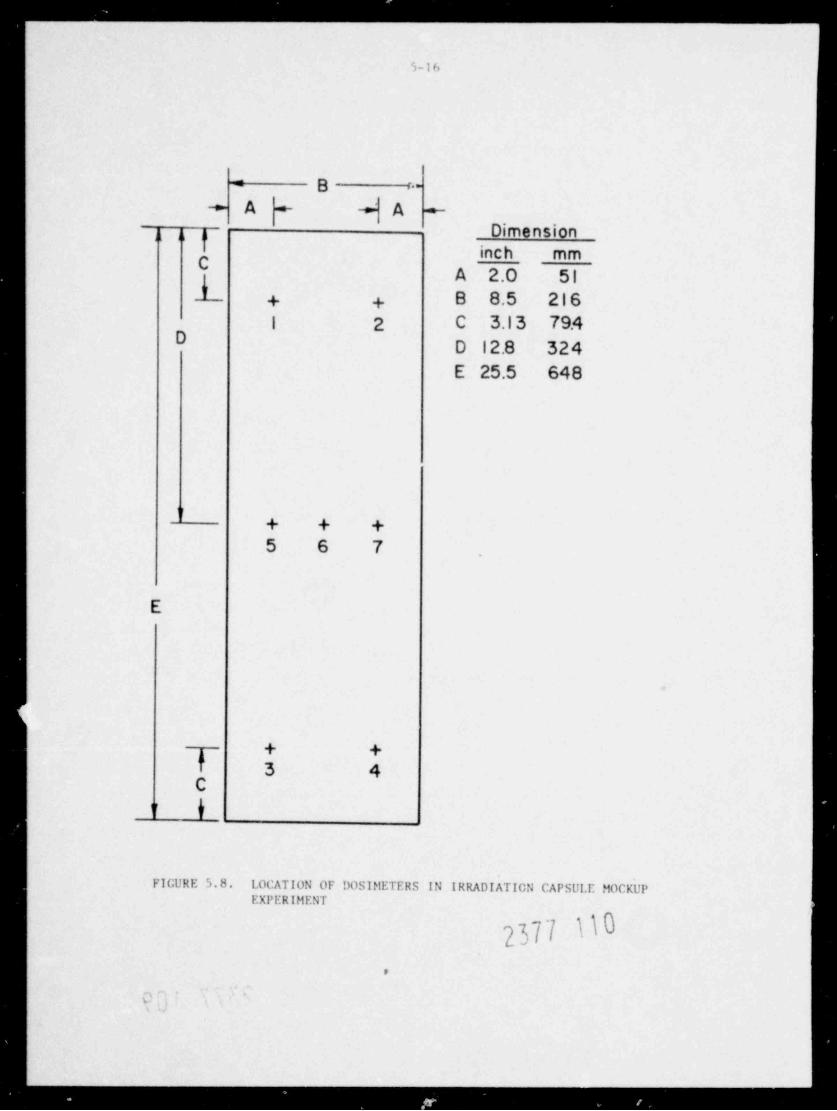
._____ _ _ _ __ _ _
s - i ,,
' B :-
A A+ + + +
n 3 Dimension3
inch mmC
A 2.0 51'I B 8.5 216+ +
1 2 C 3.13 79.4D D 12.8 324
E 25.5 648
'
f
+ + +5 6 7
E
+ +<"
3 4C
'I h
FIGURE 5.8. LOCATION OF DOSIt!ETERS IN IRRADIATION CAPSUI.E MOCKUPEXPERIMENT
2377 110
,
s
_ _ _ _ _ _ _ - - _ _ . . - _ _
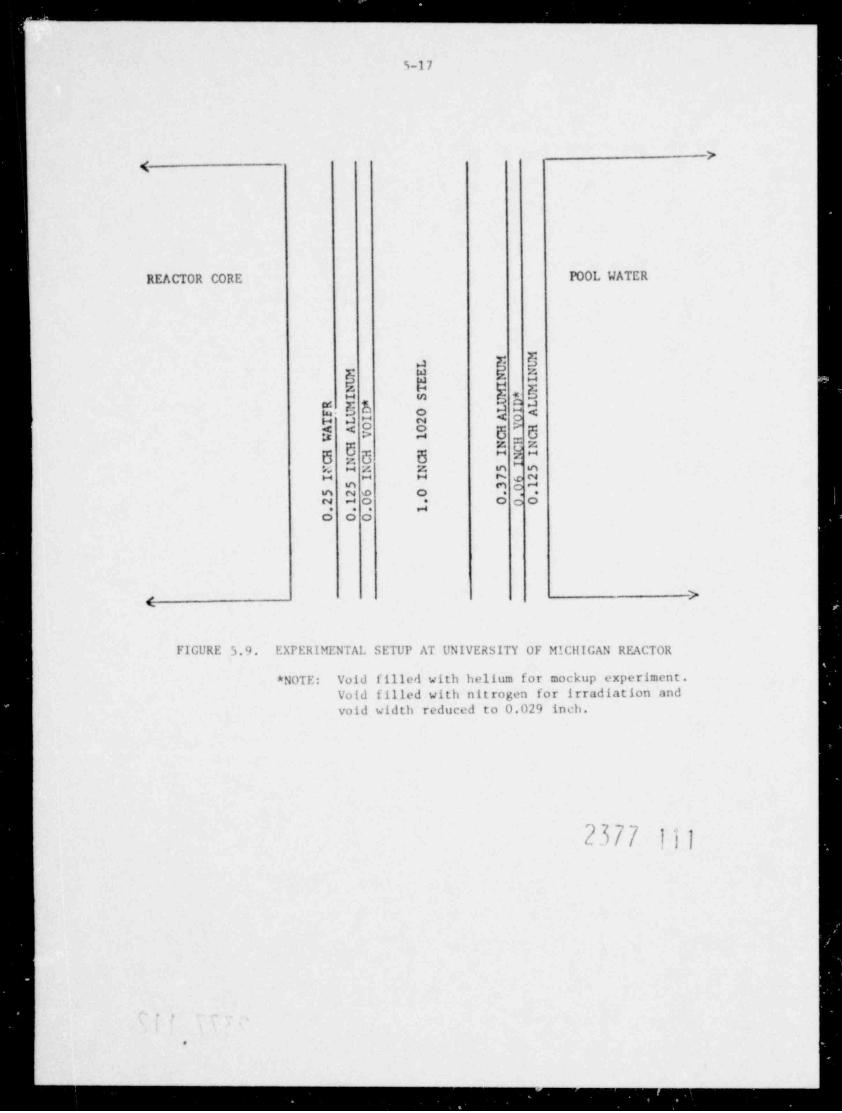
_ . - _ _
.
5-17
><
REACTOR CORE POOL WATER
a T 5d 5F w
d HF- E
5. 5 L d +SiH m
o < pe a - ~8 S 5 : 5g 4
z c "zg5 5 5 E
"a
> H z z n nH H H r*- c N
9 9 1*n o o
R J o *" ".
o o o
><
FIGURE 5.9 EXPERIMENTAL SETUP AT UNIVERSITY OF MICHIGAN REACTOR
* NOTE: Void filled with helium for mockup experiment.Void filled with nitrogen for irradiation and
void width reduced to 0.029 inch.
2';7"'// 111
. .
G
- -
_ - - - . , , . , .

_. _ _ _ _ _ _ . . _ _ _ _ _ . . . _ _ . . . .
~~
TABLE 5.3. NRC MULTIPLE FLUX MONITOR SPECIFIC ACTIVITIES, CPM /MG
Position NumberDosimeter 1 2 5 6 7 3 4
Fe + Mn 30.5 34.7 88.5 86.3 88.7 60.4 67.2
Ni + Co 135 151 362 389 372 252 277
Ti + Sc 1.14 1.28 3.27 3.34 3.25 2.36 2.44
Cu + Cc 0.469 0.487 0.520w1-237Np + 140La, cpm /mg Np0 14.3 16.2 23.5 24.1 *
2
Np + Zr, cpm /mg Np0 12.5 13.4 19.3 18.82
U+ La, cpm /mg U 2.35 2.53 4.88 4.77
U+ Zr, cpm /mg U 1.61 1.76 3.54 3.49rNJ
S + 32P, cpm /g (NH )2SO xDF 197 347 370L/44 4N
N.
M
_-A
N *
. _ _ _
_
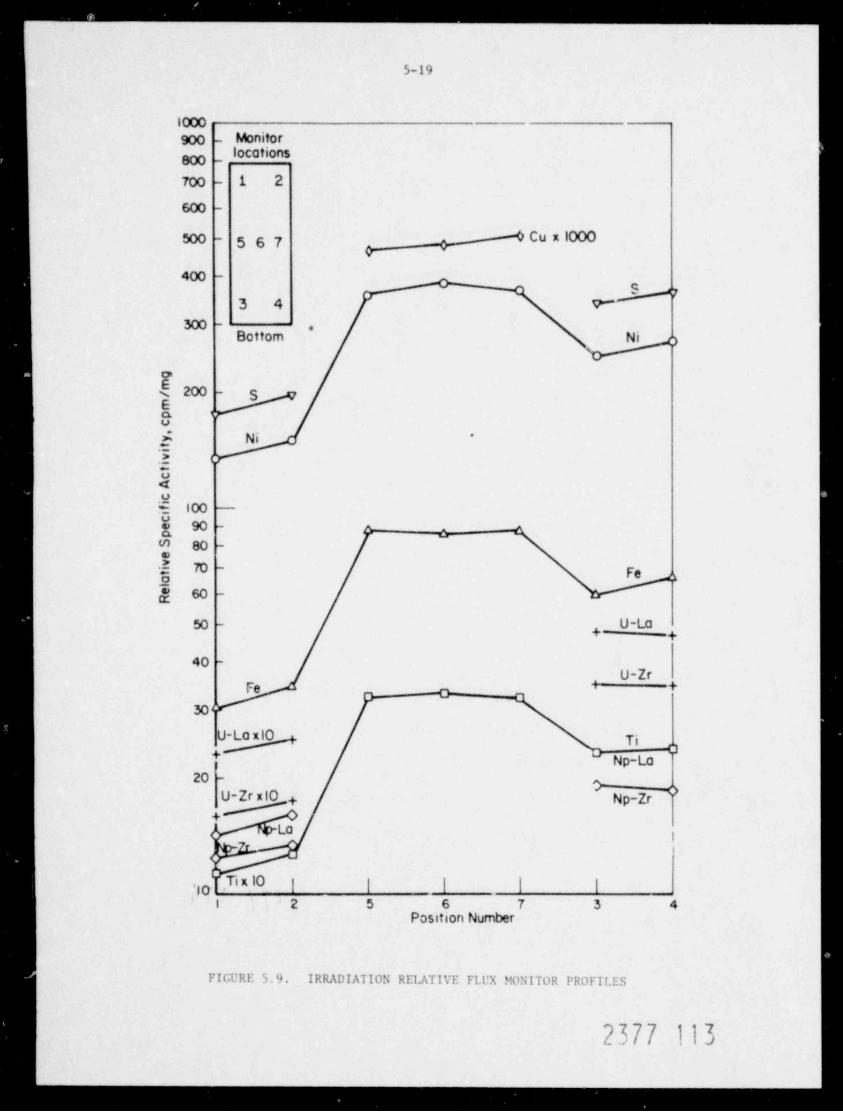
. . . _ _ _
__
5-19
1000900 - Monitor
_ locotionsg
700 - 1 2
600 -
Cu x 1000500 - 567 .
v--
400 -
3 4 7
300 -.
Bottom Ni )
oE
l' Wv
.i_ Ni *
.j (
3oE 100
-
aM 80 -
a3
$M -
Fe s
[ 60 -
50 - ,__ U-Lo
40 -
Fe ; +#30
']
i Np-Lo20 -
&'
U + Np-Zr
La;
'io " * 'O I I I I
I 2 5 6 7 3 4Position Number
FIGURE 5.9. IRRADIATION RELATIVE FLUX MONITOR PROFILES
2377 113
-
. . . .
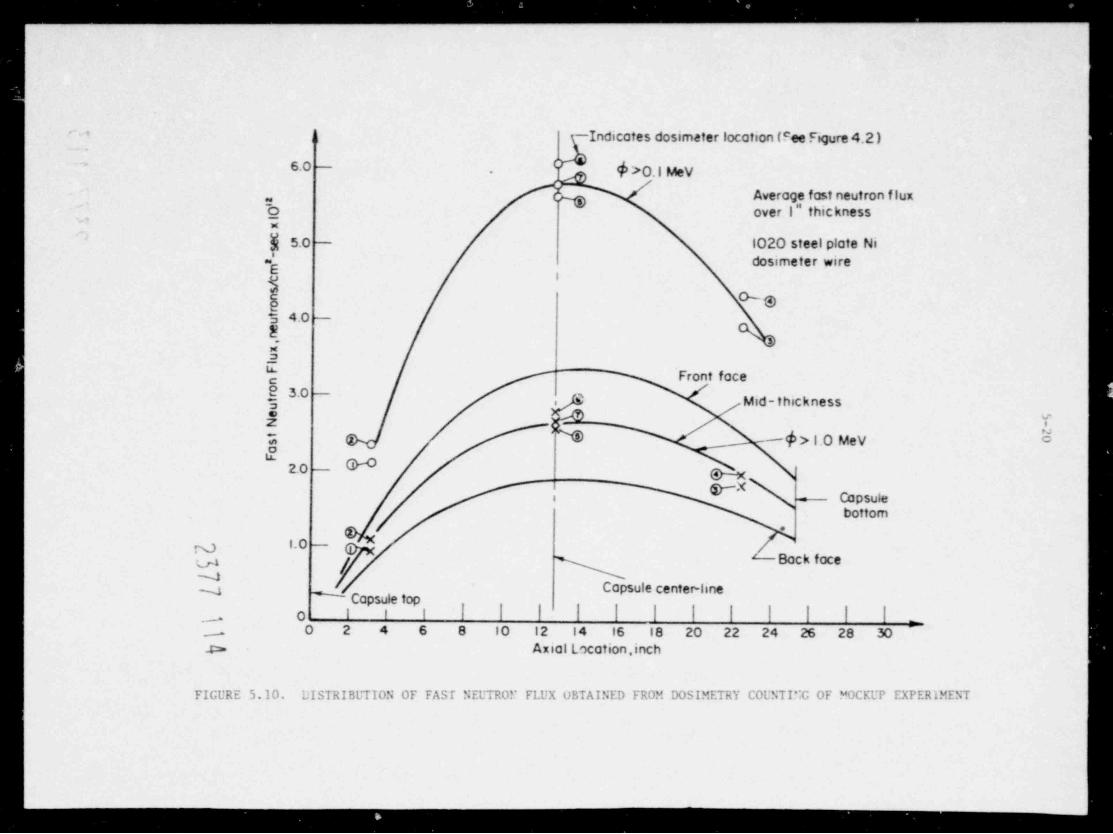
_ _ _ _ . _ _ _ . . _ . . . .
-Indicates dosimeter location (eee Figure 4.2)' *o
6.0 - @>O.1MeV+
3 Averoge fast neutron flux.
,
o over I_ thicknessM
N 5.0 - 1020 steel plate Ni
ah dosimeter wire'
sg "es 4.0 -
E*-
.-2
$ Front face
k .OMid-thickness
( E5-@>l.OMeVj c
2.0 M g
Capsulei ~
bottom.
g 1.0' Back face-
7y Capsule center-line
Capsule topO I I I | | | | | | | | | | | _._.0 2 4 6 8 10 12 14 16 18 20 22 24 26 28 30 '-
.s > Axial Location , inch
FIGURE 5.10. DISTRIBUTION OF FAST NEUTR0r FLUX USTAINED FROM DOSIMETRY COUNTI!:G OF MOCKUP EXPERlMENT
__

. .. . ..
5-21
exposure. The capsule was constructed of aluminum and contained auxiliary
electric resistance heaters embedded ir, a plate on the backside of thespecimens (the side away from the reactor core) to maintain the specimensat a temperature of 288 ! 15*C (550 t 25'F) during exposure to irradiation.
Gas filled gaps were maintained between the specimen and the capsule walls
to minimize heat loss to the reactor pool. Mockup experiment temperature
results were employed to finalize the dimensions of these gaps.
The locations of the specimens and of the thermocouples used to
monitor temperatures within the capsule are shown in Figure 5.12. This
arrangement was based on the flux distribution shown in Figure 5.11. By
placing a filler block at the top of the capsule and by placing the duplex
DCB specimens so that their starter sections were in the regions of lowest
flux, the flux graident was effectively minimized. Table 5.4 shows the
estimated flux distribution in each type of test specimen and the average6
fluence of fast neutrons in 1,6 x 10 seconds (42 days) of exposure in the
capsule. Figure 5.13 shows the estimated temperature distribution within
the capsule, based on a steady state heat transfer analysis of the mockup
experiment employing the TRUMP program.
Dosimeters to measure neutron fluence, not shown in Figure 5.12,
were placed in the face grooves of the four DCB specimens. These consisted
of 9-mil iron wire and 30-ml1 copper wire, wrapped together with aluminum
foil. Approximately 15 inches of the two kinds of wire were used for each
DCB specimen to nonitor the fluence on both faces. Following irradiation,
these wires will be cut into short lengths for dosimeter counting to provide
a quantitative picture of fluence gradients.
The irradiation capsule was transported to the For Nuclear
Reactor at the University of Michigan on May 22, 1978. During a brief
exposure to full reactor power on May 24, it was found that the desired
temperature level of 288*C could not. be reached, even with the auxiliaryheaters. Modifications to overcome this problem included increasing the
pressure in nitrogen gas in the capsule from subatmospheric to near atmospheric
(to increase the gas gap width and thereby minimize heat loss to the reactor
pool) and increasing the capacity of the elect rical supply, to the heaters.
A second inpile run on June 8 showed the modification to be
effective. Iloweve r, it became evident during the course of this seven-
hour run that both horizontal and vertical temperature gradients in the
capsule were larger than predicted from thermal analysis of the mockup
- 2377 115
- - -
, . . . . . .
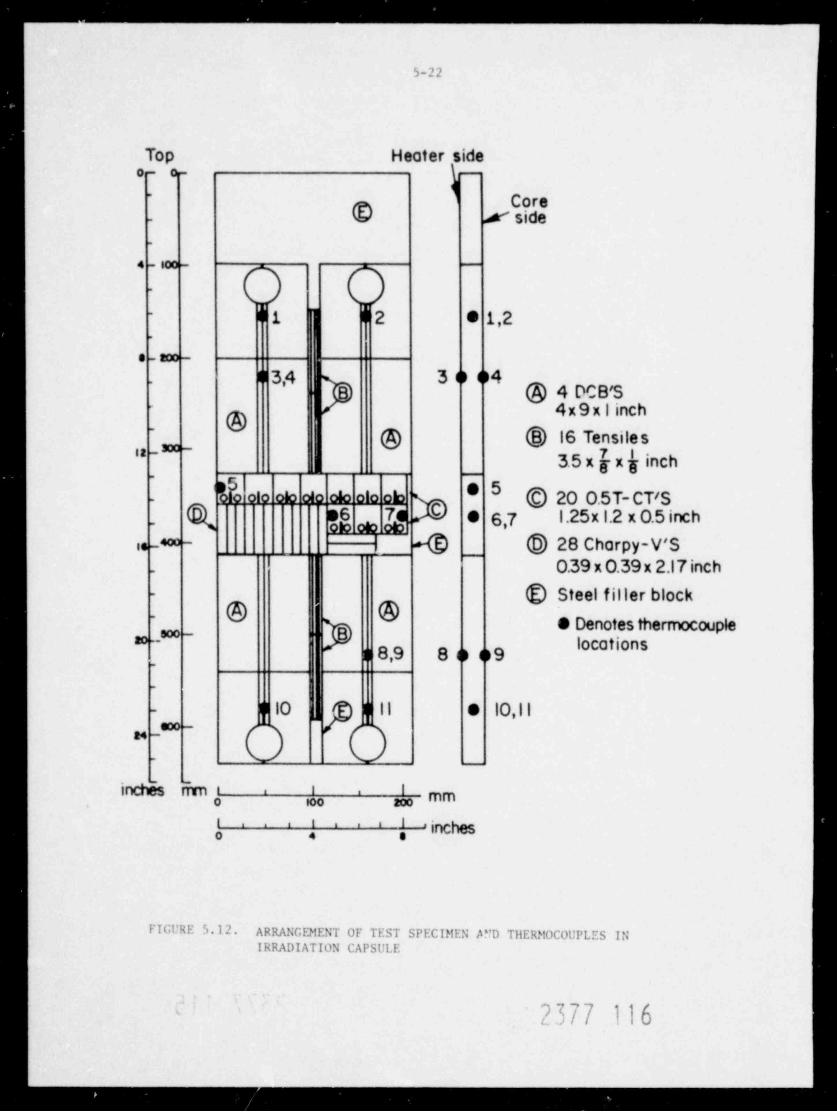
._ . _ _ _ _ _ _ _ _ _ _ _ _ _ _ _ _ _ _ _ _ _ _ _ _ . _
5-22
Top Heater sideo- o-
Core- @ # side-
4 - ico-
O O-
|| 1 | | 2 e 1,2
e - 200-
~ 11 3,4 3 o 04
@ 4x9x| inch4 DCB'S
~ @*~ @ @ 16 Tensiles
''
3.5 x h x h inch
No e 5olo ob ob olo olo ob @ 20 0.5T-CT'S_ Q g g a s,7 1.25x 1.2 x 0.5 inch
4 @ 28 Chorpy-V'Si._4=- ,
_l 0.39 x 0.39 x 2.17 inch
@ Steel filler block@ @ e Denotes thermocouple
B~soo - '. '
I coHonsil 8,9 8 o 09
.
.
r@|| 11- | | 10 e 10,11
,
_soo-y
-
inchis ihm i I. . mm0 too 2o0
.. i I . i1I . jgg
FIGl'RE 5.12. ARRANGEMENT OF TEST SPECIMEN M'D THERMOCOUPLES INIRRADIATION CAPSULE
2377 116'
_ _ _ _ .
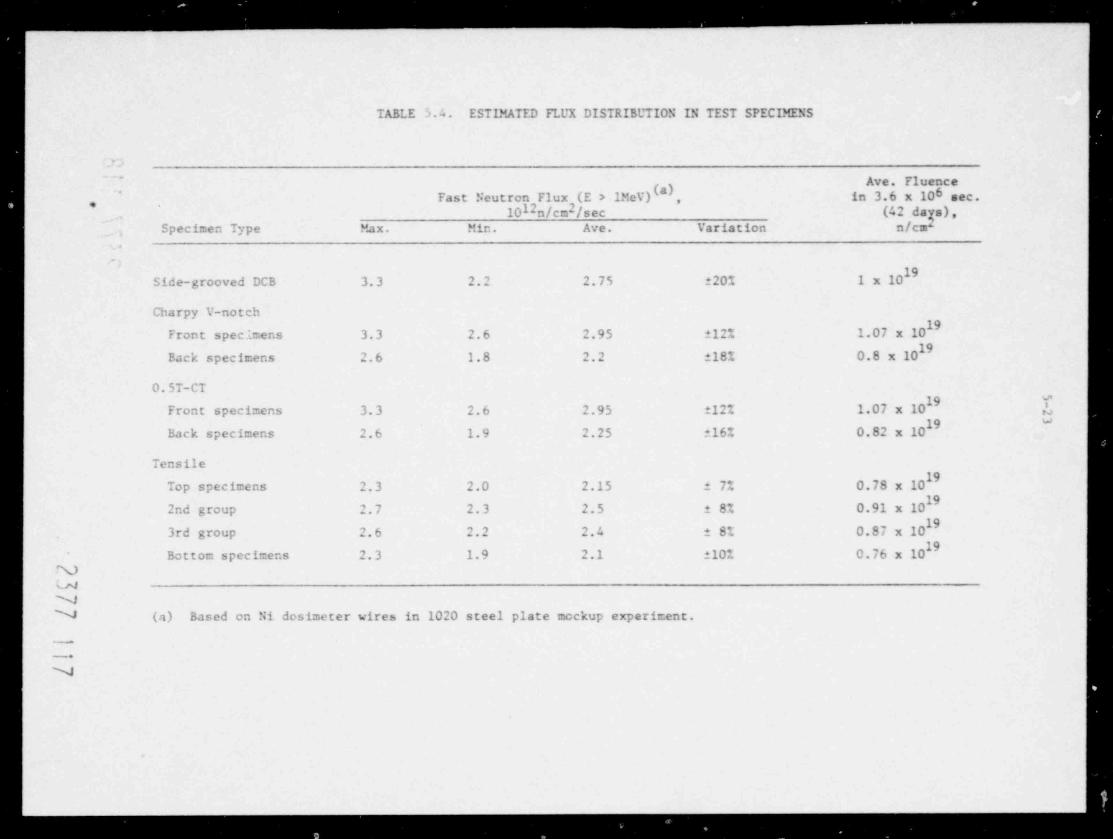
_ _ _
TABLE 5.4 ESTIESTED FLUX DISTRIBUTION IN TEST SPECIMENS
* Ave. FluenceFast Neutron Flux (E > IMeV)(* , in 3.6 x 10⁶ sec.
* 210123/cn /sec (42 days),Specimen Type Max. Min. Ave. Variation n/cm'
Side-grooved DCB 3.3 2.2 2.75 !20% 1 x 10 '1
Charpy V-notch
Front specimens 3.3 2.6 2.95 !12% 1.07 x 101
Back specimens 2.6 1.8 2.2 18% 0.8 x 10
0.5T-CT'19
Front specimens 3.3 2.6 2.95 t12% 1.07 x 10 /a
Back specimens 2.6 1.9 2.25 e16% 0.82 x 10 '
Tensile
Top specimens 2.3 2.0 2.15 2 7% 0.78 x 101
2nd grcup 2.7 2.3 2.5 8% 0.91 x 10
3rd group 2.6 2.2 2.4 8% 0.87 x 10 '19
Bottom specimens 2.3 1.9 2.1 210% 0.76 x 10NunNN (a) Based on Ni dosimeter wires in 1020 steel plate ecckup experiment.
-
we
, . , ,
'-
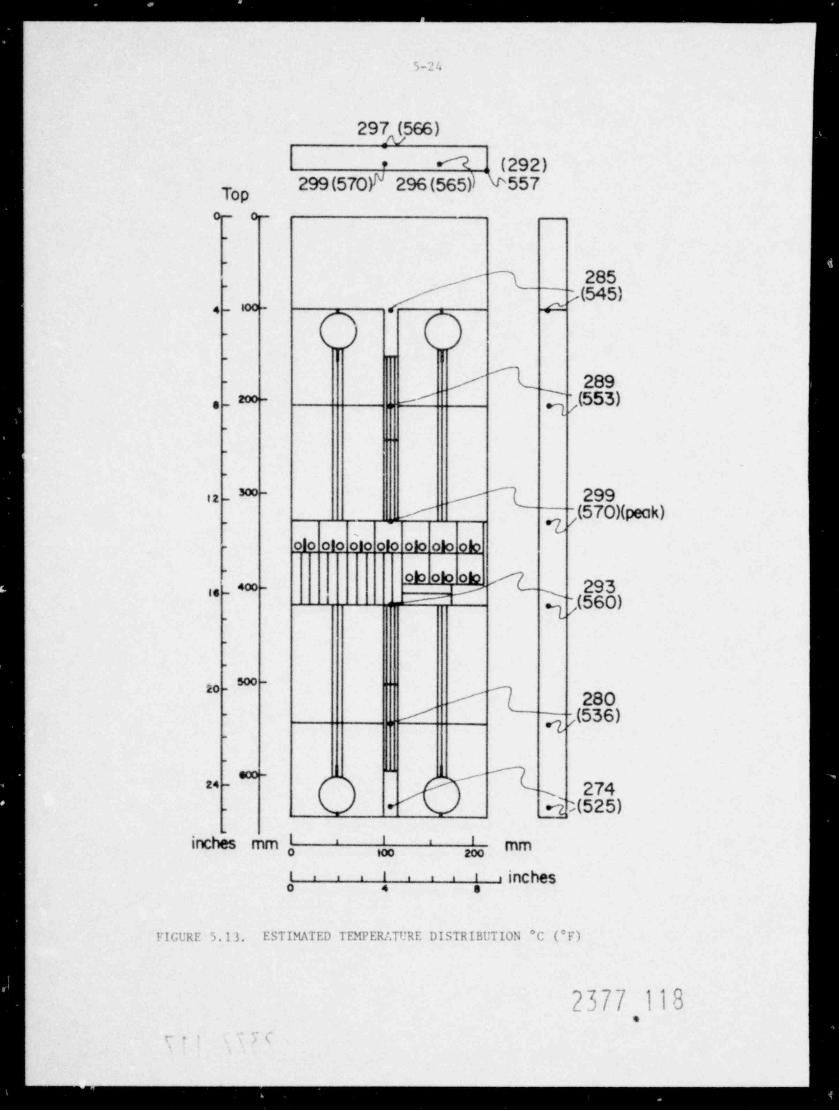
. . . . _ . _ _ _ _ _ _ _ _ _ _ _ _ _ _
5-24
297f566)W (292)
299(570) 296(565)) 4 557TopO- 0-
.
.
>(285_ 1
545)'
a4 - ioc_
O O-
.
- / 1 289 .
])(553)_ z*- '. ,,
.
.
'
.
iz _* / Q 299'(570)(peak)/
Tolo olo olo olo olo ob olo
~
b ob ob 4 293'' ~ 4oo_
Q)560).
.
* ~m -
1 2807- /.
g,(536),,
.
?( 5)-
IDCb mm ' ' mm, ,
* ''l * inchesI ' ''I
FIGURE 5.13. ESTIMATED TEMPER /.TURE DISTRIBUTION C (*F)
2377 118.
c. . .
- - _ _ _ _ _ _ . _ _ _ . _ _ _ . . _ . . _ . . . . . . . . _ . . . _ _ _ _ .

. . . . . . _ _ . _
5-25
experiment. As a result, the range of temperatures within the capsule is
1 20 to 25*C about some midrange value, rather than the t- 15*C rangepredicted. Much of this greater range stems directly from unexplainablylow readings at TC No. 5 (see Figure 5.12). If these readings are dis-
counted and only those regions between the EB weld lines of the duplexDCB specimens are considered, the temperature range is only about 17*Cfrom a middle value.
Exposure to radiation was begun on July 6 and was terminated on
September 21, 1978. Estimated fluence levels of fast neutron exposure for
the crack arr'st specimens are shown in Table 5. 5 The po s t-i r rad ia t. ion
dosimeter analysis will provide actual exposures at both faces of the specimengrooves.
Within the irradiation period, the reactor operating schedule was
apcroximately 10 days at full power of 2Mw and 4 days down for maintenance.
During each startup, the auxiliary heaters were powered at prearranged
settings as the reactor control rods were withdrawn. During maintenance
shutdown, power to the auxiliary heaters was turned off and the capsulewas moved out-of-pile.
During operation at full reactor power, the output of each of
the 11 thermocouples was monitored continuously on a multipoint recorder
and periodic m@or ' pow r^aci ustments were made for the electrical heaterst
as required. The output of a neutron detector also was monitored con-
tinuously to measure neutron flux with time and to estimate the total
exposure period required to achieve the desired fluence level. The neutron
detetors had been calibrated in the nuclear mockup experiment.At the time of initiation of the exposure in July, a decialon was
made to maintain the temperature of the DCB specimens near the lower endof the desired range of 274 to 302 C (525 to 575 F) rather than in the
middle of the range. This decision was in response to the observation that
the Charpy V-notch and 0.5T-CT specimen locat ed in the midregion of thecapsule were appreciably warmer than the DCB specimens. Some temperature
difference was anticipated on the basis of greater neutron flux in the
midregions; the unexpectedly high gradients may have been due in partto poor heat transfer among the many small spec imens in this region.Additionally, thermocouples J- the midregion of the capsule were embedded
in holes drilled in the spec aens whereas thermecouples monitoringt h e- temperatures of t he DCB specimens were spring loaded against the surfacesof the side grooves. Thus, the actual gradient from top to bottom may be
*
some hat less than indicated by the thermocouple readings.
2377 119
_ _ _ -____ _ ____ _ _ . .
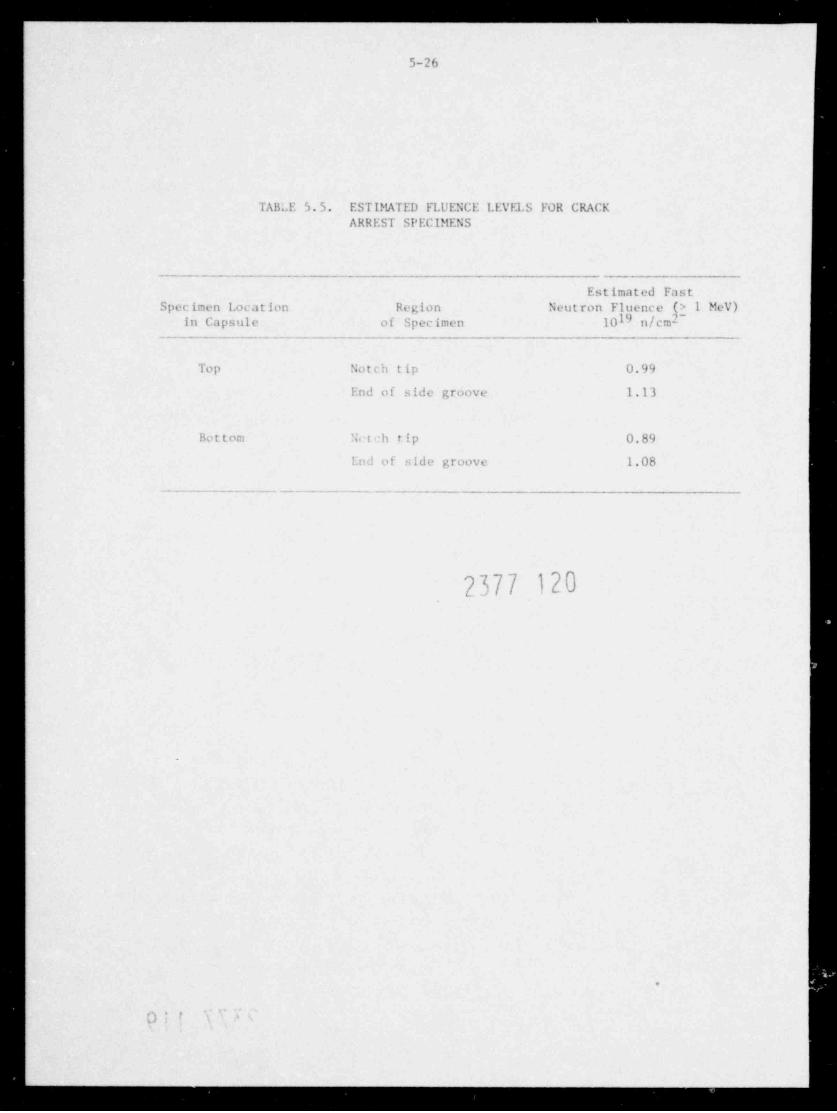
.. .. _ . . . . . . . _ _ . _ . _ _ _
5-26
TABLE 5.5. ESTIMATED FLUENCE LEVELS FOR CRACKARREST SPECIMENS
_
Estimated FastSpecimen 1.ocation Region Neutron Fluence (> 1 MeV)
in Capsule of Specimen 1019 n/cm2~
Top Notch tip 0.99
End of side groove 1.13
Bottom ', etch rip 0.89
Ind of side groove 1.08
-_ _ _ _ _ _ _ _ _ __
2377 120
.
9
I 4g
-- _ _ . . . . . . . . . . . .

. . . . _ - - . ._
5-27
Measured temperatures within the irradiation capsule over theentire exposure period from July 6 to September 21, 1978 are shown inFigure 5,14 The data points represent time averages for the entireradiation period while the vertical bars represent temperature extremesresulting from various sources, including fluctuations in reactor powerand changes in reactor pool temperature.
The data in Figure 5.14 along with the thermocouple locationshown in Figure 5.12 indicate that the test sections of the four DCBspecimens (TC's No. 3, 4, 8, and 9) experienced average temperatures ofabout 275'C (525'F).* The small specimens located near TC No. 6 displayedan average temperature of 308'C (586*F), which is slightly above the desiredrange. One of the thermocouples located in the middle region but near
one edge (TC No. 5) gave temperature readings that were appreciably lowerthan those at other locations. This may reflect high heat loss to thereactor pool at this location or possibly dislodging of the thermocouple.An attempt will be made to check the positioning of this thermocouple whenthe capsule is disassembled.
At the end of the reporting period, the capsule was awaitingshipment from the Ford Nuclear Reactor to the Battelle Hot Laboratory.Shipment was expected to take place early in November, 1978.
Scheduling during the first quarter of FY 79 is as follows:
November 1978 - Open capsule and clean specimens.December 1978 - Ship irradiated 0.5T-CT specimens to'NRL;
begin testing of irradiated Charpy V-notchand tension specimens.
January 1979 - Complete testing of irradiated Charpy V-notch and tension specimens; begin testingof irradiated DCB crack arrest specimens.
9777f||L JI /
~
,
*
As noted earlier, actual temperature may have been slightly greater thanthis because the thermocouples were not embedded in the specimens.
----
_._ _ _____ __ __ .. _.___._ .

.. .. _ _ _ - - - __
i-28
TemperatureC 'F
320600 -
-
_ _ _ _ _ _ _ _ _ _ _ _ _ _ _ - - - - - -d300 -
__
- Desired _ _
Temperature- --
Range~ ~"- ~~
280 - o T -- --
__ _ _ _ _ q)_ _6 _ __ y -- ----o--____ --
--
-- O..
--
__ __
260 - 500 ---
__ __
--
240 -
_
Data points denote average temperatures and the vertical bars~
denote temperature extremes_
220 -
_
~
400 I I I I I I I I I I i
200 _ l 2 3 4 5 6 7 8 9 10 11
Thermocouple Number (See Fig.5.12)
FIGURE 5.14' MEASURED TEMPERATURES WITilIN Tile IRRADIATION CAPSULE OVER Tile*
ENTIRE EXPOSURE PERIOD FROM JULY 6, 1978 TO SEPTEMBER 21, 19781, ,
?377 122
>
_ _ _ _ _ . . . . . . . . .

._ .._ _ __
6-1
6. PRELIMINARY REPORT OF THE ASTM COOPERATIVETEST PROGRAM ON CRACK ARREST TOUGHNESS
MEASUREMENT
6. L. Background
The details of two new tests for measuring the crack arrest tough-ness were presented by Crosley and Ripling (1977) and Hoagland, et al. (1977)on March 23, 1977 at the meeting of the ASTM Dynamic Initiation-Crack ArrestTest Group (now E-24.01.06). Following discussions, the Task Group approveda suggestion by W. F. Brown, Jr., to carry out a multilaboratory cooperative
testing program designed to acquaint potential users with the two test pro-cedures. Representatives of 9 U. S. laboratories at the meeting expressedinterest in participating, and C. T. Hahn agreed to serve as the program'scoordinator. Further, T. U. Marston on behalf of EPRI (Electric PowerResearch Institute) offered to supply a large piece of A533B steel to serveas the common test material. Additional .tpport was subsequently providedby both EPRI and NRC (U. S. Nuclear Regulatory Commission). Since that meet-
lag, the program has grown into a multinational effort, involving the 30'aboratories listed in Table 6.1. Test pieces have been produced from theccmmon plate, distributed, and testing has begun. This section of the report
describes the program and presents early but incomplete findings which areencouraging. They show that the measurements themselves are reproducibleand identify a number of questions about their interpretation that remainto be resolved.
6.2. Crack Arrest Test Procedures
The aim of the cooperative test program is to examine the two
test procedures for measuring the crack arrest toughness. This quantityis regaydedr as the. minimum in the variation of the fast fracture with crackvelocity (Hahn and Kanninen, 1977) and is designated K The two proceduresg.are very similar. They both employ specimens, shown in Figures 6.1 and 6.2,adapted from the compact tension specimen design of E-399. Both specimens
incorporate a blunt starter slot and a starter section to facilitate crackinitiation. The overall dimensions are not very dif f erent: W = 169 mm
2377 123
- _ _ _ _ _ _ _ _ .

. . _ _ ...___ _ ___
6-2
TABLE 6.1. PARTICIPANTS IN COOPERATIVE PROGRAMON CRACK ARREST TOUGHNESSMEASUREMENTS
United States It aly
Babcock and Wilcox Centro Sperimentale Meta 11urgicoBattelleCombustion Engineering JapanGeneral Electric 7gyMaterials Research Laboratory Kawasaki SteelNaval Research Laboratory Mitsubishi Heavy IndustriesOak Ridge National Laboratory
N PPon KokanU.S. Army Material and MechanicsResearch Center The Netherlands
University of MarylandWestinghouse Electric Corp. Koninklike/Shell-Laboratories
Metals Research Institute (TNO)Denmark
" "" YRISO National Laboratory
Norsk Veritas
-FinlandSouth Africa
Technical Research Centre ofFinland Atomic Energy Board
France Sweden
Centre de' Etude de Bruybre le Royal Institute of TechnologyChatel of Commissariat hl'Energie Atomique United Kingdom
British Welding InstituteGermany Central Electricity Generating
Bundesanstalt Filr Materialprufung BoardInstitut Flir Festkorpermechanik U.K. Atomic Energy Authority
Kraftwerk Union51aatlichen Material Prilfungsanstalt
2377 124
.
\
- - - - _ _ _ . _ _ _ _ _ _ _ . _ . _ . . . . . . _ . . .
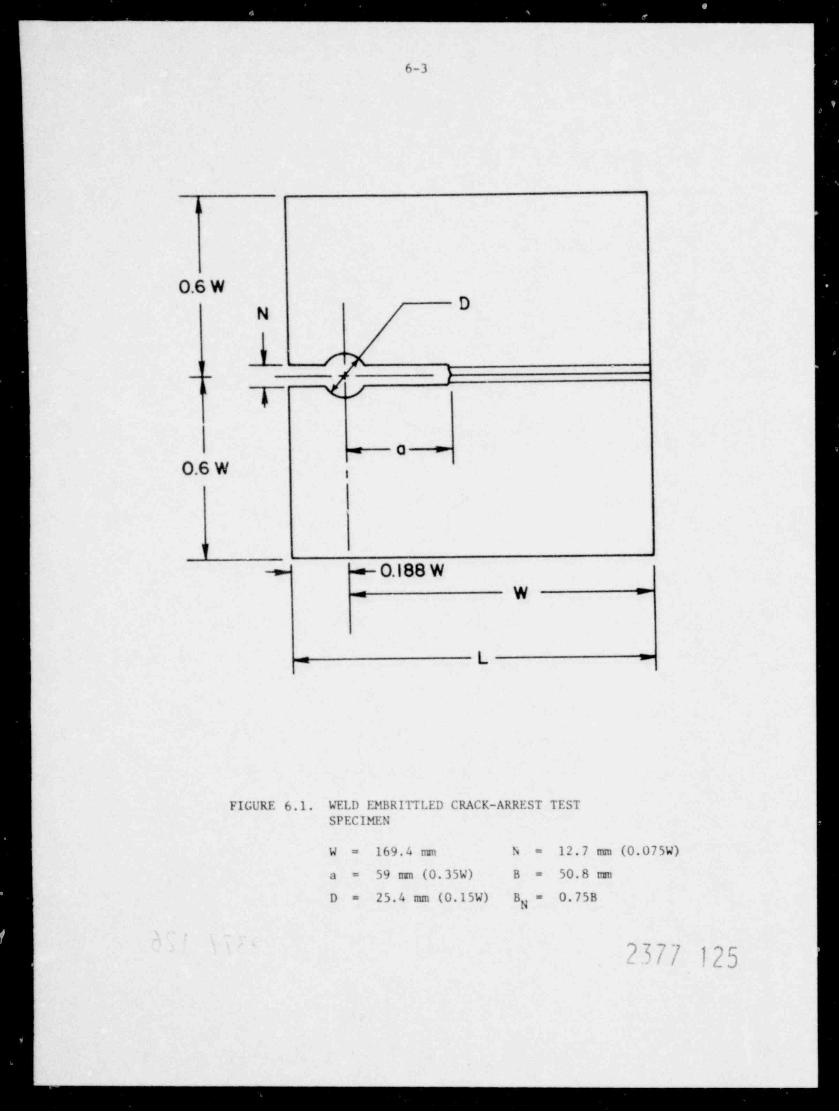
. . . . . . - . . - - - -_ _ _
6-3
h
O.6 WD
N
1 /y,
ag ./
.e--- 0 -0.6 W i
y
-+- O. I 88 W+
W =a
L -a
FIGURE 6.1. WELD EMBRITTLED CRACK-ARREST TESTSPECIMEN
12.7 m (0.075W)169.4 m 5W ==
59 m (0. 35W) B 50.8 m=a =
25.4 m (0.15W) B 0.75BD ==N
s
2377 125
_________ _______ ______ ..
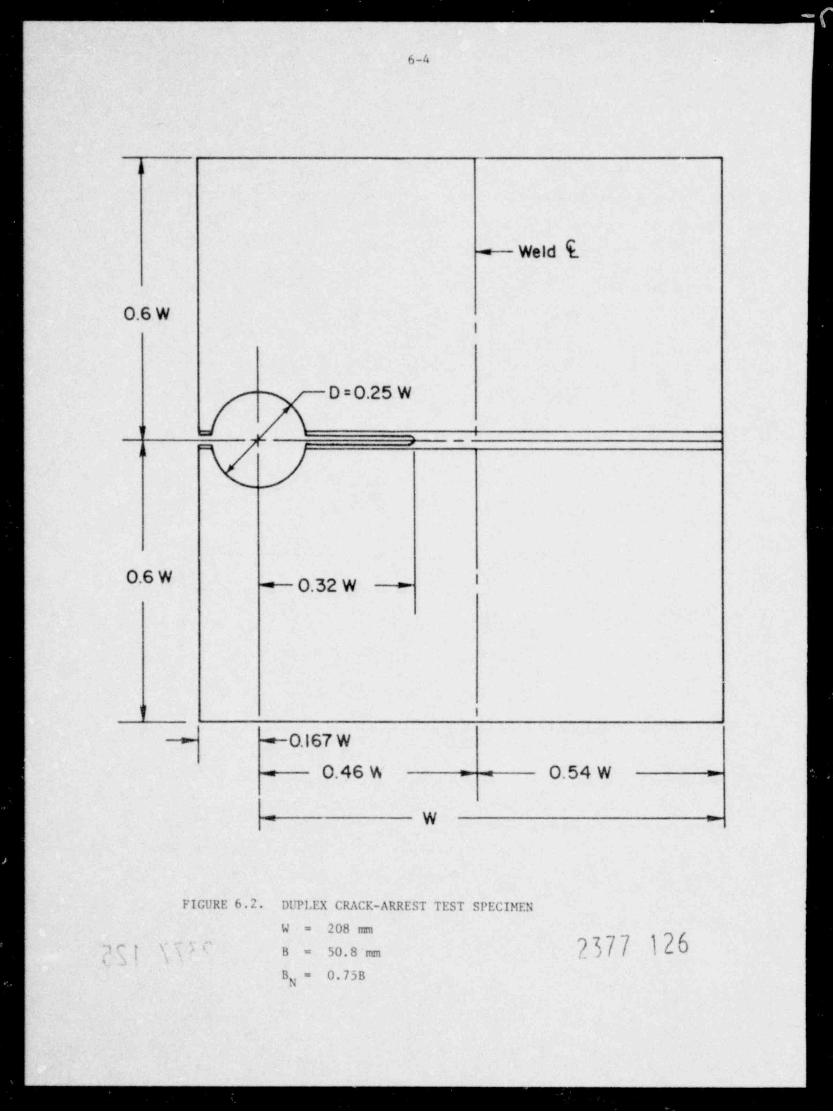
_._______ _ _ _ _.
6-4
d
- Weld E
0.6 Wl
D = 0.25 W
U |_
-
n
O.6 W '~ 0.32 W -
u i
0.167 W
0.46 % 0.54 W= = a =
W= =
FIGURE 6.2. DUPLEX CRACK-ARREST TEST SPECIMEN
208 mW =
2377 i2b;F i N''' n 30.8 m-
B,= 0.75B
- - - - - - - _ _ _ _ _ . _ . . . _ _ _ _ _ . . - . _ _ _ _ . _ . . . . . .

. _ _ _ . _ __.__
o6-5
for the Crosley and Ripling design, W = 208 mm for the other. The specimen
thickness is 51 mm in both cases. Both pc*ccedures load the specimen by
relatively slow, transverse wedge loading illustrated in Figure 6.3. The
two basic measurements called for are also nestly the same. One measurement,
the crack length at arrest, is common to both procedures. The other measure-ment seeks to e~aluate the load line displacement, and while this is doneat 2 different stages (at the onset of fracture (!!oagland, et al., 1977) and
after arrest in the other (Crosley and Ripling, 1977) the results obtainedshould be nearly the same because fracture proceeds with almost constantload line displacement for stiff wedge loading.
The two procedures do differ in several respects:
(1) Starter Section. To facilitate initiation of a run-arrest
event in relatively tough steels, Crosley and Ripling
3 mm layer of brittle weld bead at thedeposit a thin, %
tip of the wide starter slot. In contrast, the Hoagland,
et al., specimen employs a massive, hardened AISI-4340
steel starter section which is electron beam welded to thetest section. In this case, the narrow slot is cut into
the 4340 steel after welding. The two specimen types are
referred to as the " weld embrittled" specimen and the
" duplex" specimen in this section.
(ii) Initiation of Run-Arrest Event. To facilitate initiation
of the fracture, a high compressive preload of about 450 KN
is applied to the weld embrittled specimen before it isloaded in tension. Initiation in the duplex specimen is
controlled by adjusting the slot root radius and by load
cycling: unloading and reloading the specimen in the event
it falls to break at the desired K -level.g
(iii) Jnstrumentation. The displacement gage in the weld embrittledspet iran is located near the crack mouth a distance of 0.25Wfrom the load line. The load line displacement is then
inferred from a correlation reported by Roberts (1969).
In the duplex specimen the displacement is measured directlyat the load line.
O' 7'
,
L \,
?377 127
_ _ _ _ _ _ _ _ . _ . _ _ . . .
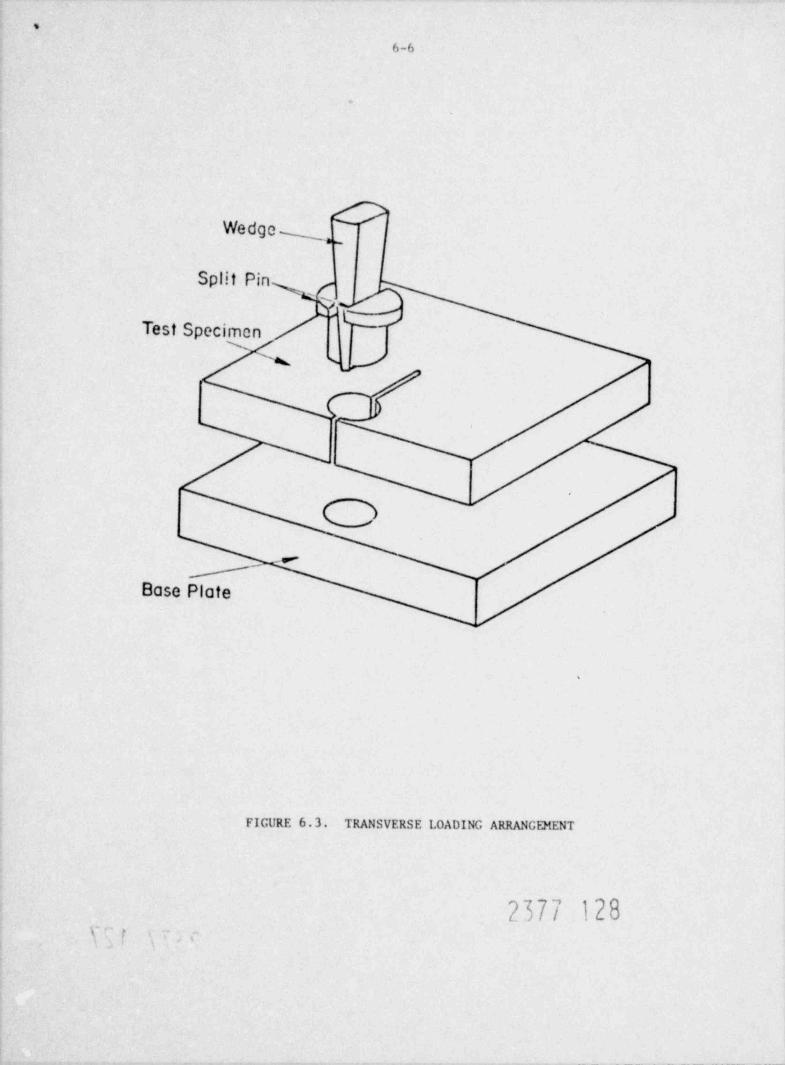
.
6-6
.
Wedoe ~ .I -
Split PinN~C~
Test Specimen /
%dk
I
o-
pBase Plate
.
FIGURE 6.3. TRANSVERSE LOADING ARRANGEMENT
2377 128y i ..
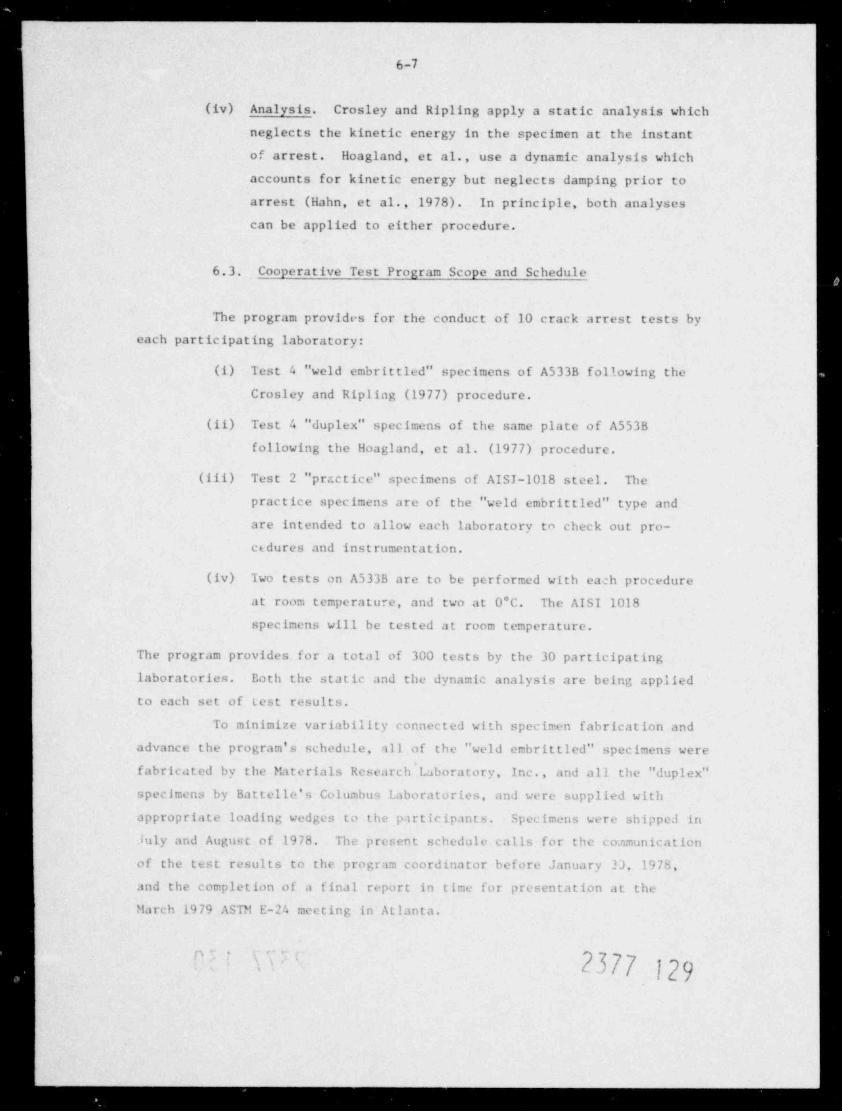
- . . . - . . . . . - . -- -
6-7
(iv) Analysis. Crosley and Ripling apply a static analysis whichneglects the kinetic energy in the specimen at the instant
of arrest. Hoagland, et al., use a dynamic analysis whichaccounts for kinetic energy but neglects damping prior toarrest (Hahn, et al., 1978). In principle, both analyses
can be applied to either procedure.
6.3. _ Cooperative Test Program Scope and Schedule
The program provides for the conduct of 10 crack arrest tests byeach participating laboratory:
(i) Test 4 " weld embrittled" specimens of A533B following theCrosley and Ripling (1977) procedure.
(ii) Test 4 " duplex" specimens of the same plate of A553Bfollowing the Hoagland, et al. (1977) procedure.
(iii) Test 2 "prcctice" specimens of AISI-1018 steel. The
practice specimens are of the " weld embrittled" type and,
are intended to allow each laboratory to check out pro-
cedures and instrumentation.
(iv) Two tests on A533B are to be performed with each procedureat room temperature, and two at 0*C. The AISI 1018
specimens will be tested at room temperature.
The program provides for a total of 300 tests by the 30 participatinglaboratories. Both the static and the dynamic analysis are being e.ppliedto each set of test results.
To minimize variability connected with specimen fabrication and
advance the program's schedule, all of the " weld embrittled" specimens werefabricated by the Materials Research Laboratory, Inc., and all the " duplex"specimens by Battelle's Columbus Laboratories, and were supplied withappropriate loading wedges to the participants. Specimens were shipped in
July and August of 1978. The present schedule calls for the co.nmunicat ion
of the test results to the program coordinator before January 23, 1978,
and the completion of a final report in time for presentation at the
March 1979 ASTM E-24 meeting in Atlanta.
f f[]ii
--
- - - - . . - . - -
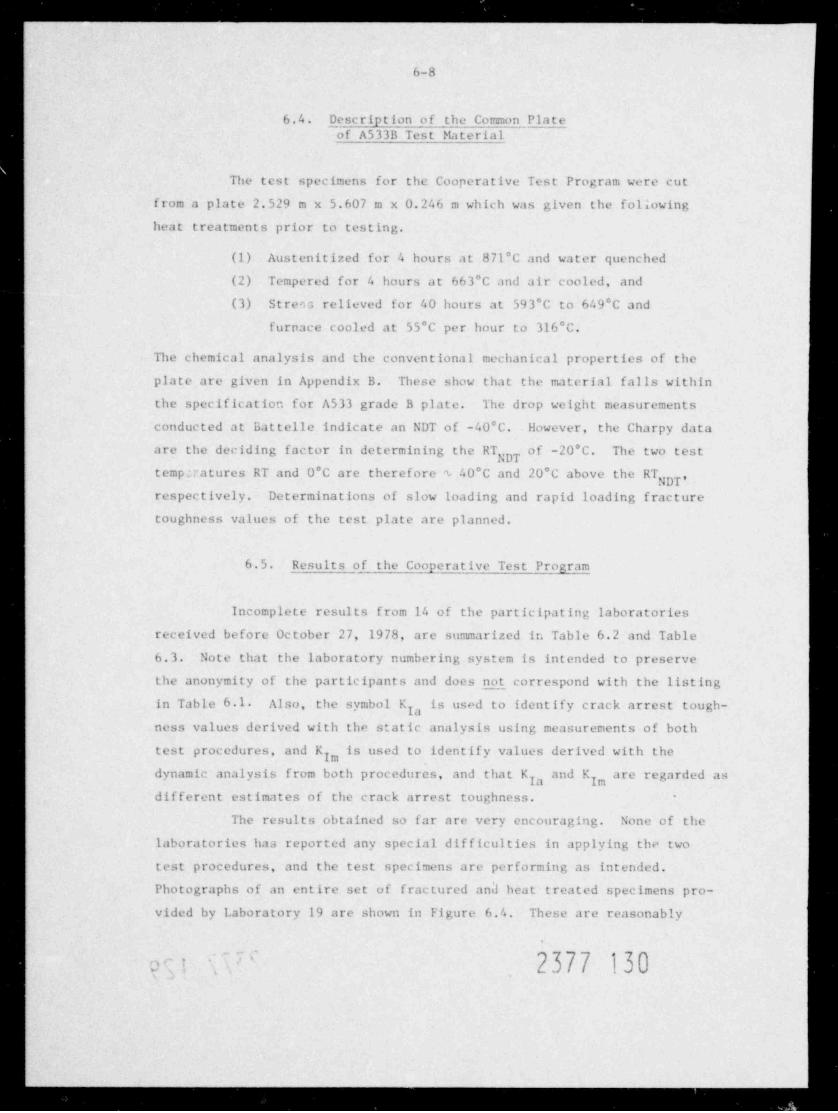
_ _ _ _ _ _ _ __
6-8
6.4. Description of the Common Plateof A533B Test Material
The test specimens for the Cooperative Test Program were cut
from a plate 2.529 m x 5.607 m x 0.246 m which was given the following
heat treatments prior to testing.
(1) Austenitized for 4 hours at 871 C and water quenched
(2) Tempered for 4 hours at 663*C and air cooled, and
(3) Strea relieved for 40 hours at 593*C to 649*C andfurnace cooled at 55*C per hour to 316 C.
The chemical analysis and the conventional mechanical properties of the
plate are given in Appendix B. These show that the material falls within
the specification for A533 grade B plate. The drop weight measurements
conducted at Battelle indicate an NDT of -40*C. However, the Charpy dataare the deciding factor in determining the RT ~
~ " *"NDT
temp;ratures RT and 0*C are therefore % 40 C and 20 C above the RTNDT'
respectively. Determinations of slow loading and rapid loading fracture
toughness values of the test plate are planned.
6.5. Results of the Cooperative Test Program
Incomplete results from 14 of the participating laboratories
received before October 27, 1978, are summarized in Table 6.2 and Table
6.3. Note that the laboratory numbering system is intended to preserve
the anonymity of the participants and does not correspond with the listing
in Table 6.1. Also, the symbol K is used to identify crack arrest tough-Ia
ness values derived with the static analysis using; measurements of both
test procedures, and K is used to identify values derived with thegdynamic analysis from both procedures, and that K and K are regarded as
Ia gdifferent estimates of the crack arrest toughness.
The results obtained so far are very encouraging. None of the
laboratories haa reported any special difficulties in applying the two
test procedures, and the test specimens are performing as intended.
Photographs of an entire set of fractured and heat treated specimens pro-
vided by Laboratory 19 are shown in Figure 6.4. These are reasonably
m:i J' 2377 130
- _ _ _ _ _ _ _ _ _ _ _ _ _ _ _ _ _ _ _ _ _ _ _ _ _ _ _ _ _ . ..

__
6-9
TABLE 6.2. SUMMARY OF CRACK ARREST TOUGleiESS VALUESDERIVED WITH Tile STATIC ANALYSIS USINGMEASUREMENTS OBTAINED FROM BOTil TESTPROCEDURES
._
K . MPamg
WELDEMBRITTLED SPECIMESS" DUPLEX SPECIMEN 3h
1018 A533BLaboratory
RT RT 0*C RT 0*C
2 84 101 118 103 110 115
120 1133 86 93 104 12;
7 84 82 117 113 84 91
8 98 93 102 119 94 86
9 92 82 104 96 77 94
10 72* 81* 130 131 112 124
14 73 58 83/108 99/120 122 105
16 95 95 103 121 114 108
17 98 92 115
19 87 73 110 109 93 89 92 130 100 95
23 50 92 107 109 83 83
24 92 86 88 153 126 100 107
115* 124* 94* 85*26 96* 85* 119* 105* 97* 88*
27 81/67 97 106 89 113
(a) Weld embrittled specimens tested following the Crosley and Riplingprocedure.
(b) Duplex specimens tested followir.g the lloagland, et al procedure.
*Received too late to be included in the craohical presentation.
: :: < 2377 131"* -
,
- - - - -
- - - - , .
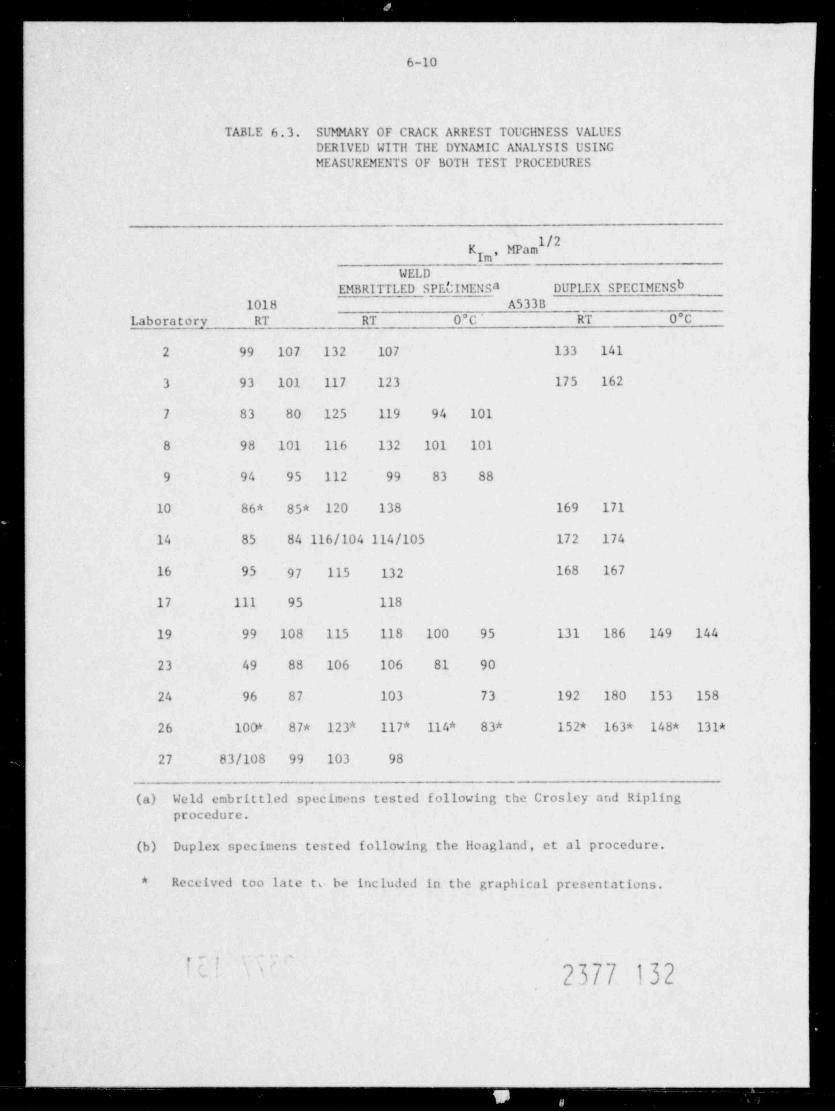
. . . . . _ . .
6-10
TABLE 6.3. SUMMARY OF CRACK ARREST TOUGHNESS VALUESDERIVED WITil THE DYNAMIC ANALYSIS USINGMEASUREMENTS OF BOTil TEST PROCEDURES
K , MPam7
WELDEMBRITTLED SPEUIMENSa DUPLEX SPECIMENSb
1018 A533BLaboratory RT RT 0*C' RT 0*C
2 99 107 132 107 133 141
3 93 101 117 123 175 162
7 83 80 125 119 94 101
8 98 101 116 132 101 101
9 94 95 112 99 83 88
10 86* 85* 120 138 169 171
14 85 84 116/104 114/105 172 174
16 95 97 115 132 168 167
17 111 95 118
19 99 108 115 118 100 95 131 186 149 144
23 49 88 106 106 81 90
24 96 87 103 73 192 180 153 158
26 100* 87* 123* 117* 114* 83* 152* 163* 148* 131*
27 83/108 99 103 98
(a) Weld embrittled specimens tested following the Crosley arid Riplingprocedure.
(b) Duplex specimens tested following the licagland, et al procedure.
* Received too late te be included in the graphical presentations.
.. .
- 2377 132' '
_. .
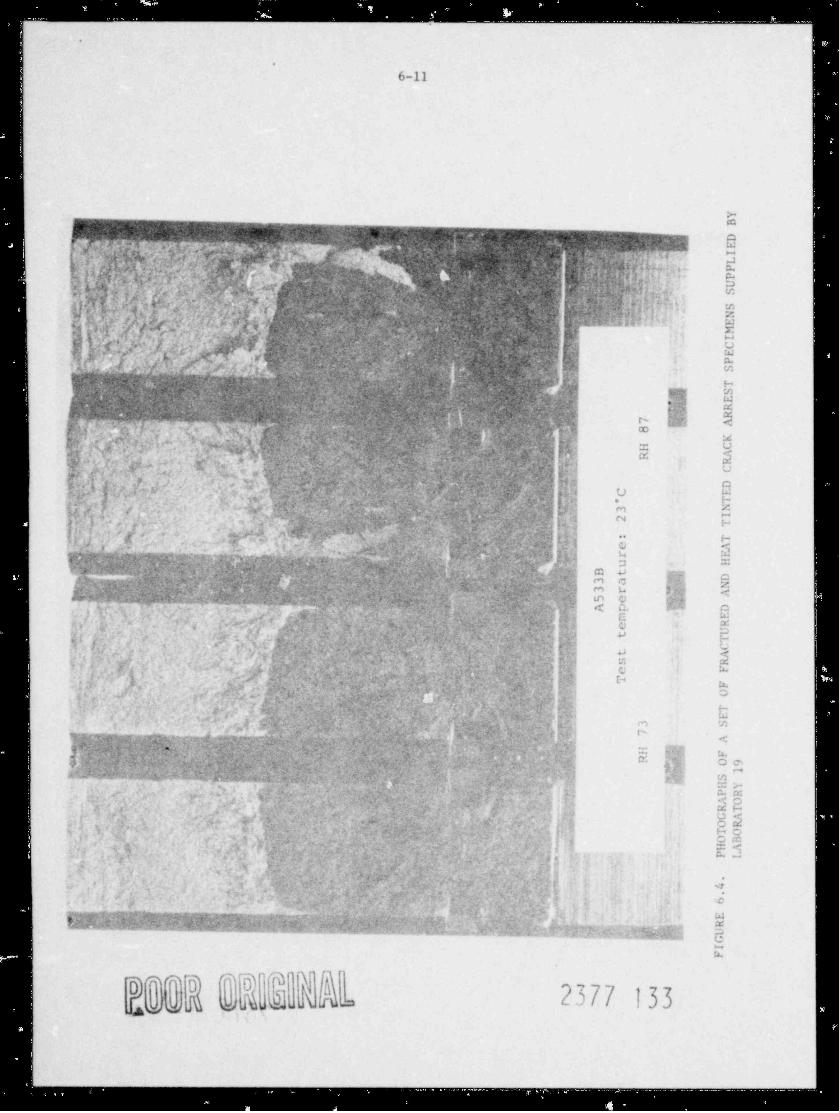
w,
-- i m -- - -amii----
@
6-11
:--
h f f _|_ _&~j.__ 5 [ 'Y'W""Tf***R*f WM, , ygf"yygs;py, y,sQ
7. , t . .. - ma~ - ., ,, _
.vr#Q. m *. . .s a . *y ,. ,in,e**3 .f...,_ .~, y, , e s
> - ( , )~.y aa
g -$, f, r" , ,%f- t_ m sr u | .#j * s - k ' [. w' . , .a ,, % } ~.s.
W o.'- tfjo o 3 .> . -> , mY Y g + jv * ?t '. , Th
,,#-i
, | 'k |} ( } v ? I.
f{~**'$\p,''L, , y ' % v& ^1
.- i * .. , <+ y v't ,,n,e<,4 j. ,, '/,> , e a,. m. .'s,
-- 'x - _g 1
4 - , , < <- .I '.
*, . U',',,
*>-
AtP 4 - -5 ,
, , ,
J' # g a E j6" ykj g ( )t
e
A "* 4
c s 1 * ' s[m * M's, ,
4 . , u',?~ ,E*~~ s
)| s ,
* ''
6|1 ~ "*US3 s e
; i
fi " v } n ,-_ , s 5 + { *)( .
, ., " . a . , f y |':-- '
t e fz n ~y
,h%,y ," ~vv , s s .r''. $*v ; L' ','w\. . + , , ::
,. < .r . - ,q :-
~~ n., '.
2 _f.* . . &p a j 'f- S ., 4 ,.
u:''
I',h'.j',,,
"
~\' ,,,-# 3
+ - 'I A ? - ^ 2'i* - ( 1; C;, ;
. , .- >,
6 *.] * ;
1,
k'f | [* ,' | gE
* *, wIN't,* y[
1 , * # P ., *-,5
e Y * 5$' , J1 ,g " "'I + , J *, '% - ,
.g, . y 'y 6 '' e f 4r 4
* , ,a (1 , , . > . ,, * * ***,g T
L 4 0,4( et~ %|
_ Fv + +7, g
(" ',,
'''__|gJ'> ' > *
, * - ~~
*, g, " % h |% %'eJe >r p . f fR p
t-
, .1 , , ..
-- -
, , - ~4
. . _ c s4 gm ms . . ' .- ,*
,, - . , * t 4 47 ,-..~ - p *;
, , 4 w. , ,cc< 1 _ , y-
- 6' ' ' , ~ 7A.' ,/,v / N. ~ K t;' ,' ' ' ' y,
b [ f, <0'
,,*
, . y1
+
'l, '4 , ,n . .' '''-*W
s
Dy+ * d j3 - ,- 4
,
* < #' ,', @.'
'8 / . q. ,3,. ,
7, ? ,
, " , T 4g9 c ,+ g +. 4m ' ,
* g se 3
1 -' ;ff, -
*'''*
a.
. ,f1. r , i * j
t s! ' -* r -i Z'"
4 # d.,',' y.
1. ~ , < y 1
! , , ,#. , 4
;; s *:,
b* + ' ' ,
n , e * -iTM ,,,%I
> -,,, O
, w : ,, < c ,Q*,r ,
e t 3r j u.. , C,
'' ,
' ,* ,,,4
' e ;4 () M
4** { .* ' + '- ,t t 5
s~ ,,,'' , ' ' j 9
, , ' *), , .
- -, - ,+ -. Hi. .y-
, * s.* er , | m n4 r \ 'b ,+., # 4-
"$.
'
e+7 , [ < r* r m} N,
;-~r
> .,s J I. -g*
u > -
3 %,, ' .J , ' (1s ,
fa <[,j Af* - #'
. . -dg 1,
** Haj,
-ei,,~ r
. o *;e, % e W -
+g 9 , t 3- ,-. , , - a .. , -,
- c
,
- , n , ,n y , u ~.* y 7 =
,
,
* 2 *) ** ' ~, 3 f Q 4.
r . ., .ns ,3
,- -s , >J~ w7 s .
,
' , y ,
t M C ,e,
1 m L )#- s
_ ' ', = < < i sW w 3 +I,
g, r.
, 4'
**#,* --44- 4J' E+ + , 1 A : - )t *
,
*O Qi i4
,
a *, .T'
. T C w' *v i< % ,
,a , n''" g* , +
' ss- Q -gw
A; yH,)
-5A >
|g- , , - s ,r - *i -t 5
y* *- ,, +r.
,( E., , 1 4J <,
8
. > . g <4 , ' " 'I C Ma- + +
,* '; C w
'-g<
- - ' , - y, s . ,'' h|g 4, ,
+, , ,-
s-
e.
-
f,,e c3t <, ; .* ', _. , H
,
~'
Is s
., r' E**
., 4,, ; 3- m ',0
g
h y [ A* -w y - ++ s *
3,a*
.,,,4 s. . , . , . * ***.
% /s-. -
, , ,
I F*
m
.-) - . * . <" 'CL Oet
y ge ~. . - > , a n. > i n &,w u < y ~ r , ~
'
2, ,N
) +
#(
_ m.g a,z ~
<i M> ~
4' ZH, g -# !'
u*
, . w OM,,e ~ > . , . $, HC
. ' hk' '
- (<
_
4 -- ne
,. ma
$-
,
-
- ,.
g b y
b ' ,*
aN~
o e4 &+
.
'' , ''" '' \ 'f ** ''J- A &. mag 4 4g s ,, y- F
~ *- - - x_+k < .. 4 - -e ,- ., , , , $,
-
% % t u g_ m.nd
s
m
MqQ AI A
2377 1333')I
1 o
__ _ ______ .
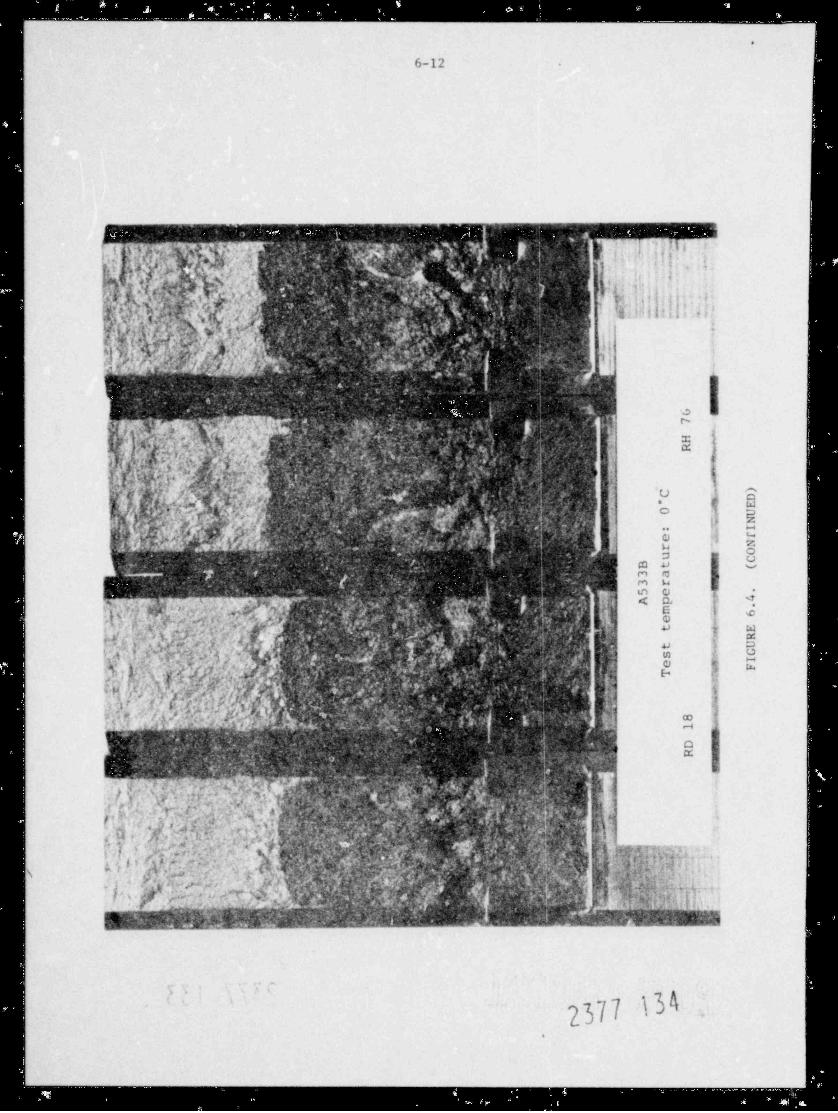
. - - - - - . . - - - - - - u_--_.
O
6-12
;D 5 c E -?.; il ,
1.' I%$.N h " ["Y - [k3 |- ~ './f' If. k i,\ h bi'
j .f.
gn<3;hj$e4S$ ?, ''j{ ;
4 g. .a % ,p r; .$s. ;} $.3 .gfr$$61 .pi ,;j>- .;-
f I I!! *''
imon* Q*T&u.hi 'hh- t
s .z n'
,
- e{-
$*;?%($r;';:,||mu|j'b::' ,,f ,Q$ i
|Y,In;;;;|h':8;} y. *
*) y?,i,2 Wt
^%a : -
.. .
'4 >-L, . ;. '.
.-g
%_ _ . ,*15. 7)! -- !._
|~
\ ,
h0
Q.<'n % %rIA . f4 -
--
9 o
g '; - pf . nbc 7:tpf A .a ::ggQ,-
(|&4
gy|0 ycs% ic,nfgp @;p{tx ic '
e L " L!; ,
, dip}t. h|'kl-0'$.|mp' $p'-'Ny,: i n;
SQ$ .
kW h h.'
| | 'o t 8 !
&'Y']$@;||.>3%j$..;f!}'?N;f2}$.,~fn%ei i li
"
,s . d };p. * n 1 i {g
Ij!a s.p w :P T r4 L
.-. , , ,.,
a : 8e o a -i m d j*
m L4 yw a -
?.'
* gh.>t. n^ jdv',t',|'Q : w ,'h Fo{ p..?_ ? <* kf|{ ~
u q%p s_-m[Q[p$fh.g a , o i, , . .
bih F% ; D T U"
o s n s: - . ' <- y{
, o 1 w
W 'n,ji,'p|J:|# 1 Sd-
ge[
\- w :f- +, * *,4 A ..y t "
$Q ||-? ;n 3,'%yjlo,'i
h,
-
Pf; f b ;e,
*4 M . -a?*g
' ~*r
@NO_f'g</;_$$$1,Qpifg< .d..f3 p,g
*t p g- I& y.-,.
4 )ap m
* ' Y; e.' C ' | (k?' ?, th _ 4 y%hf$?$ s *
k.
G Ia
h!$h$hkh Jh !
+s n . n w ,e ga>ws_.,;29 + n e.u. ,~ m, ,e. .xx nw&..em,.x, mgr ,
gj #[n #~"+Ffkh$QW[. o r'''''y''"$"$@$d.; ty)4g$" b+h. c
. .
$ %. p$ $., $3 % @$
- - ~
Mi s%n e@hj !QWh @'
smmmmmadab ma
-
'' '
2377 I30'
.
_: - . - _ - - - - - _ _ - - , , , - . - , - , . , - . , , . , ,
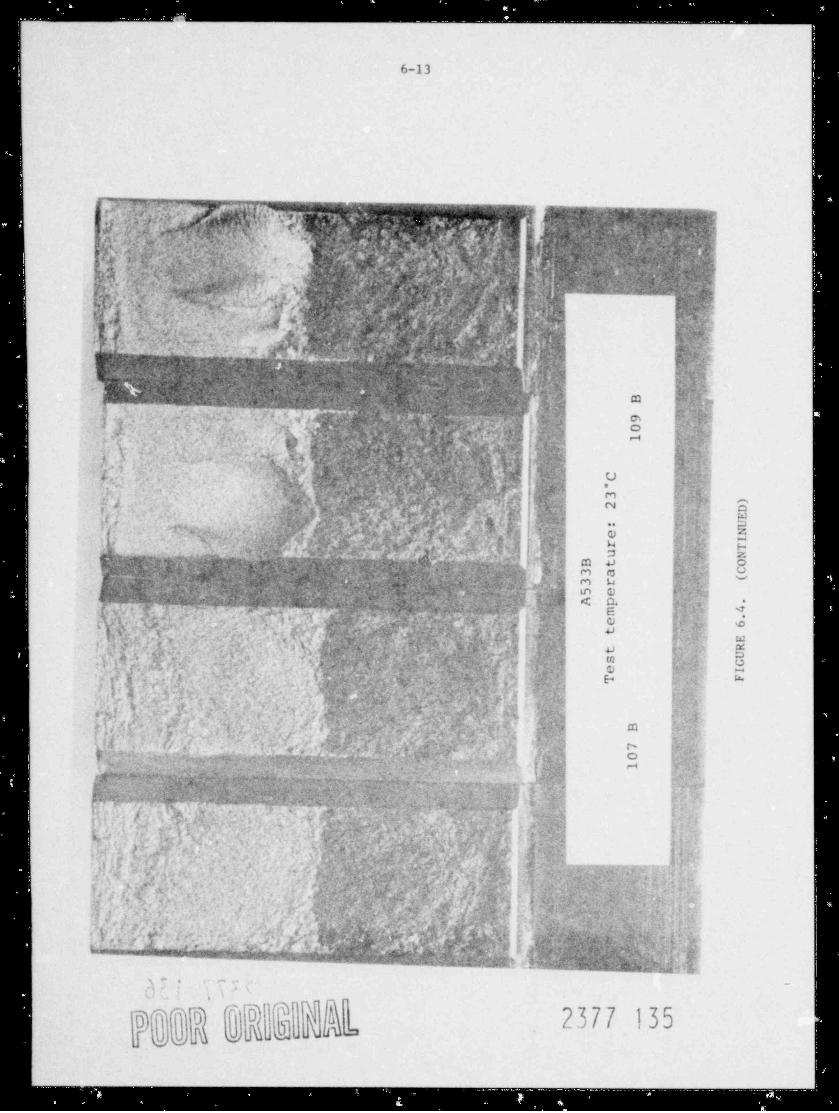
-- - - . . _ . - - - . -
6-13
,
> , , fh-})f,<afm e*^'" '%w| m,.'l . .TY,), *' {@ EU J , 't.* T 7 ') ''E 's "I~
y &I ;b, 9-<
. " ""'r? - - - > * n m,; .
3%-((g h N>~ . - n .
Gi. . f. %*<? t i .*,h,** .r,2 . s ,'. o$,k .' I ' .s,4 3 , ,
. - .. . . ..,,
l - 1: ,},.'!f q g'Q -dU .''
t, s< ,) , g
v' *,- . < ,L * * E, s
y,+7.}!,,,- i,4}'4 ]J ''y p'''| g/*Ep o,qR, ~< : , j ?@g;) f ,;t ~
*
e. f. 2 . ,N * * ,L s,+ *gt e s
'g * 'i v ,, ,
s', 3 t *i s.
- ' . 4 = %da n.e M&;.<.
p/4,%,4,+>e.x,"'',
j}T' t' f ei- e. g ,g p - a .' - ,, = ..w+=,, 4
* er, e- s >-
9| s 2 *ya
k y w n| }. n y'Q. off3 N. ~. -* ? *f . , , j y ," . , | .' % ' L* * * u
*
,'\jr' A I-U f, 9 j .
4..,
,
** p ,s ,.;, ,c. <,.,>g 4, r ,.# r . $. m .
-
s,
*4,Y ve
,ye _ ,. y
r p ,, sm .#,yn ,. ., , , .
** * ,s 7.{!' . ,#
g > i} -\ (s'4,,9,.,y'. E ,>.s
. , e .g- + e, g ya ea t4.,
*' rp' m m,
,t . .'
: - *r . '.. , * f**oe*+p.,s .- . 4--
s . . ~- - q fy . [< tn 3, ,e .w ~ a ,
.* .-a ,,j % . ' - 2 - * ,a|5 ? 4"'*?4
,
,4 %. , ,a +
, - * t47;g N,% %v 5 - 4
_
'x 5 /
-
st<" <s ,. i s - -
t.,-' >O c
~
{Wv$yd-f\L % ns',6 ;<g o w %.4,,p %.>- *< s
,,., ''
,
* N h 's4 s' s*Y-
,, y <-
,,./t- _6-,,j
* -* '4 , ; 5> . 9- 4
> $ J -4p~' '4 . >t. p ,
I" 4, 3
-e -
J ~ t {, . s ,
,
4 O.
J ;w , ,
,' 3. 4,
Oi j 1,s 3; *'
3, - - eQ>, ',. s ' g, ,m,4 '
? Q , ' *j m j| e p v ;- H L<.<. . .
~ f$ |j| , b$': ' - ''
j.-* # tg ,3, . . , ,
~ * . - 2.,., ., , u *g %.
*,g..a t ,s . *e . ,, yt 5. wg*
, y', + s i
. 5 a* * '' p , ~s .,3.*.,$ v ,y g
*
* a .A, W " t'r- *,- p 4
F. -~ists> v- - .s. , , m, , *~s > , 'j-+ ts
* s j # '. . % <~ 'f 2 ~ ~~ s1, ~, ,s>.A -
.c-: ),
, : *~
, ,m Qc-'&..s, ,s m
eg r
.!} '| N+g*,
7, > gd.^3;Q %t /* 4 p' 6
*g ',, .. -1g,
,i 'm ,7 |4,*
g Q 4, > 1 ., M + s. . .,,c r,
,f 4*t
, 4-.,ss}/ W g*,
g * 7 _ -y 3 p; .v'-'s 'tr-] * ' d +
t[~j
'
,, ,, ,,, sg M ' q -, , g 7
s ,
{'< -%'-- n. -_s
% f.< , , y' , s 3 , . - . -$ t' d 4 b O!. g
- s ', w* a , m g ;. O~2 jq - i m .
, ' .
*5- >
l''9 e"s
-g<
-, , , P O,p 43 '., - -
',
' '' [ , ",,j.$, v,
* _t( D w
,fr j m O v 43 ' 1 w *ps y , ,
- * i .
f.. c.
- r -.M,(* d 4 Q. s .,
~*,c ./ . . , ,4'' $
'' *, s
g n ,.. + ~ , , . 4 , , , . ,.,s,. c- - -s<
., .. -._,, - , -
i s- 4 g
, s, .{, , , } '$, z . ' #
.' ' *s e .I &*
,- .
.
. , . . ' a g , '. ++, {I #. , w
' -* " ' .# . , , -' ,5 4
,I
y" ' 'i I g y- Sdag
| D,,'.,k,,
* *j, a i e* _ ,
',l-* - .'.[,'* -
g* O
,
.t1- ),1 A + a , ,
s.
- *- *a. v .a ,i Q %~* 1$a # h Ij$ p
(-5 I
i 7 1 r 3> e < +'
>
<1',7~
sg'4 6, ,* - , .g- -e *
ft%,,. p '.
, .' .s3 ;. '" <f ,, , .<
), ~ , . ..,N = *
s % q#. ,4f 4* ii ~
jy
is a s ,& 5
'tP \ ,' / i,f , +,
- *;~ +x'+, &- * *
$,' ^ -,
t 8 , >$./
, ; 'c' t
A +,i 4a g.
e f. ,
I ' / b f
} " , .' '
_f' ' '' g p~ #f 8
'. , . . w - J o {
+,
i , H-
,
1 - ~-r - - u ., . ,,.Ts
:.
,-e-.
,, . ,. .
e, <
, * . md. ~ ''..'O 7' . ,
|> . in, qw , ; ,~' * * - ~ s s,1+ y
~
q ,.,.y[ *g , , * ;
g',Ifi
- . &*
v i
b s ee'
,,;j* *'f 4
#
' [ i.>
* '
t .h .. hI[ ,
+o' 4> ( -"
_. ( ',, 'i .s ,.f '' ; , y y C, . ;- I
6 <
}' D '(r *w 4,
}4r
,*. + } '
q:* ,,-
,
d[ >s .
f, g ' | , ,,*f*.,,,
'# +,
.,-
,' - W ,' ) g.- > 'i
* ?,*,
,
4 f, - - 1 ' f . 4.,
'p ' u ),-
.
''*n
d, ,.-
,
-
* '4 j3 t s *
f t g,
t ? <s [l $ s , bVO e,' /4*,
9*4
,p,s, +- , " . , < *,, ~ v, . ,!
-,
. :< ,
k , i: f ># ,) kk_, , r[] e N . Q t ?e* ' .' '(
'N 4
M*"y** WS.AEE::Nif:$ ( M d'/- S o i W ( ' M '',''* ' ;<
,,. ~ ,, ~ . - ...-a _ - +~.%...v . ,. . .
.,6 % g a . ,
** e a_",
\ * %
e
i
--h---n-.lEYHMurtft . . - . - - . . . . . ..

- -ium iei miei- - - - ei m -m.m.mm m--
6-14
. y'*'%"'?t#3~" O'?|Q -~ ' m W| T f fm + w e wr w%;ww:m, an~ ?Q f ij ; \ , < A - n
%'5?-,&nwu 2'A .p ~. ;/m
. __ m f s: W-b *
,. -
;z mL r :,
-L~.., w,,,, m.3 x a w bm_5. A
% a g A r ;- e a. > e .3 1 _ , _- 3,
m w c.,.. .. ,, ..
t. , ..- s,- bg s ;f,o , s Wm s ; > >, ;r
< 4%u,,- . , ,> ? m. e
tes % fct; c ' e ,a 7 7,?,'M v q |,ra . 5, J,gl' n, .- II
2 ,s ,
Jg"A, ', *64k , &< u$8~ ~ ;#,#'-
d.' s. s.
,.,g .
< A "{<M. 4 }. *' p 'r<4's.:
,*r 444'
'} 3 4% e, ** ai"'g'->.-
*s5, 4 / ,5 - % ' -- -v 7 w.r~4s . tt r <, '- a-
**'
g ''c'. ", t' t j ,> "< 'w% .un%%A' c% ,* . 4-) - p.e f s4 - , 4' - #t r -
y* ' , * ', - 4< : . t * A f4-
t."++u.- '
- &
. p ;, ,gy' y, *s \ p' , e<
.,&e-
q+1,n4
- - c . + < . ,- s A,p e p4. g,. .(,_ e -4 6 , b ,'. <+
y% F
'y, .,.~ D'r,' %.) >
,# ,4 g,=e1%e- , tr > - - ; ;n . sy ~ V -e J-
v m-,.
{9 c y,
t. r +g,tr h,,,*' r . - ,. u , ~ftff - ,[% ~p.
*31
.s <+
}p g .| ('.g . -
e > . *<"j,
S / s c ..y,
, 'I-
% .'-- ,, .< .
Jw #4j < 3 #,$ > 'de g, t *k
& ,*# +j3 ,4s..,.<i++ r i 4 J y .
igr y '{*s.,tv%
, N(.t. p- -Q4 tt . > , s t f,% *
- < -'y t t 3 f 2 ,.
.
cr.s ; , s u, - i. .f t p ,
n[ . .k (',
a. , - s .c ,c ,,, ..~~~~y - r . -$$ ] .\M~. hh $r! 7A , # s.'" ',, [ '- 7 Q.', a ' n IY t , , ,*
. - g ,, q I , , n.> (
,,.,,.c .~~-o - , 1
y--
-x> -
,
-? ,' - r: , - y L,4? < .n,- N - , - ',
~_ y 4, y;s
, p -- +- Le, p ;>,2a t. .
e #. . ; = ,
> :. . . m a g i
-: _- . _ . m..;m . w. . . , _ ~ v, , .., .2, o. <$,, , res 4 .
a , ,1 Q 3-- .% ,&e s * .I} . a 6
y* d , ,r " ,- ~. 1
* $ ,+ : , , i a O '
. ,G ,c < ir ,s u- y e gs. 7 *- u>
2 rs 3- ,I &a g4
-
T.3 2% , -
- .<s 3 ,+
Y' T , # i " J ~/ % %
* 4 $b 3"p 'y
.
*)\" 4 / j
(' t ; #4 y \,| (#= {A / f
I *g , $. 4' ', . .g
* /*|4.
,5>' f{ . ' , t*, %.j
,f
V {* ,
e}g f#
, , 'y w { f D j k % , t , -> p 4M
- 4-y , ,. .+.p ' " I y( - s - pi
.
,,#, . >. ( je[
y 6,, . > >~,p' J gt
e t. .' , ,,si .r g,e
|.,.
< s-i ' . - *
- 7, _,
| %. ) , ", 'e s.'(> . s * t <[ ' ,/ '' i'~^/,< ,, , ?, ., . p
,.* e
C V. - )'s g > , 'g 3
c c ,. m i,".I t q j. J*7 g g,s-- - .a
e'+ 7(e-~,,r, f
' -, w
> . . >3 o ,, g< y. , ~ .e a.n .
-
1-
,4 h/ ,1 C 3y, ,
3' )/ /g' , ;[ [t*;
^ - f
r , ' ;;<7,t('', gs y1 '"j
' 5 ai -j y , -C4 ',. ,. ,('
s"b- , i s,*#.{ ,. 'e
- c.t[ ; .' ' -) -t W k -'** ' m 4>' >>'#a"
b ,- ,-er.cz ,, , , i -
Ie
@" *a < ,, , , ,
e <,
., . fg *4 * - Q psYJ, - y, t 1* ,' 'q ,A . W~ - q*' - m n f*'-*:<*-+ W" s' -
,, ; . m ,
4 m W ve - . . -
+%
Kr gj , ( *b., h 44Xey - y , , 4
i +-
. - s , s , . ', < C.+ ', ,j E -
e.<
,asd. :- . c- ,, , . . , , , , , , s
>f
... ?, , ~) 0+ , . . ' , t>n+..
s ,,s, - r - ,:- p , c,
,
J r i"
s'-- s
) ,, s% .' ; ."t
.
[# , -s. ,,t .
.s , s > p w, " : # x,' >
g '$esa- , t s
' ', LO.,, ' . ' ,' % i,, ' _,
# #' s g ,
pt, ;* ' ,
, . V4
, 4''y /pT. & d
a
h.I I
W1,
*,,6 s - s c, ; - e. ,;o. e,- , - < , ,, 1, ,
t*,ir s,a e
r r - r * rf', ~
k s.* '
,
q ,o .
2 . -.,e -nf' 11.,
1, s , 8.pipi g
= 4 , +r,s, -
,, >N ., F g )4
i 'I Y I'" '
|.,) Q ' *t< r ' *
, ' . ' ,' < . L>.m y
i < ,i .- , ,CO $s ' , < * ~*y*,'
r. yW
9
ss , , > .
i (,, pt ,-
% '' * p .- A p44*( tn Lv .' {{,,.. - - - , . ,. | . - >*
t
,- y , >
- < 'ct, . .
,,. s... + e,.
,. > , , , , , , -- -- - s '~ ,
%
h'' gg as4*' d g ,, +s8- V U % 5 #* F#
g-. I
fg ,AM - y
^,
r *.4 .'s a
_ r,*,
,s ! <
g 4
q g g g w ' , j*
9
%%
<J t' - jr a- s ; ,.$ e 7 ,> - s
4*
e*
t, , -
xvs' s
e a ,x sc5 '% ~e vi,f
jy 9 1 ,Y ** h8 - r
f
'',
f
bg / hgj .
%$g -l < L % k , t !- -9 -.?i|>s,
g
' '~,
T, , ^
*., |,, , , z -s
e . g , 4& as ' 7*
,
[ , ,1 ' % 2 % 6.,
. y -g, i
t *y
s' . 0 . -y"*
-
% *g ,M J , . $
s
/ # (h yd' s $ a
1*''
%
," - s, - i e
' #''') *
g,, 8 -.a ?
s *", ,t 7,
a t- _ . . ' , - -_
no,. a #%r , J . ' ,1e,4+ 4 - e -,
-
2377 136. - .
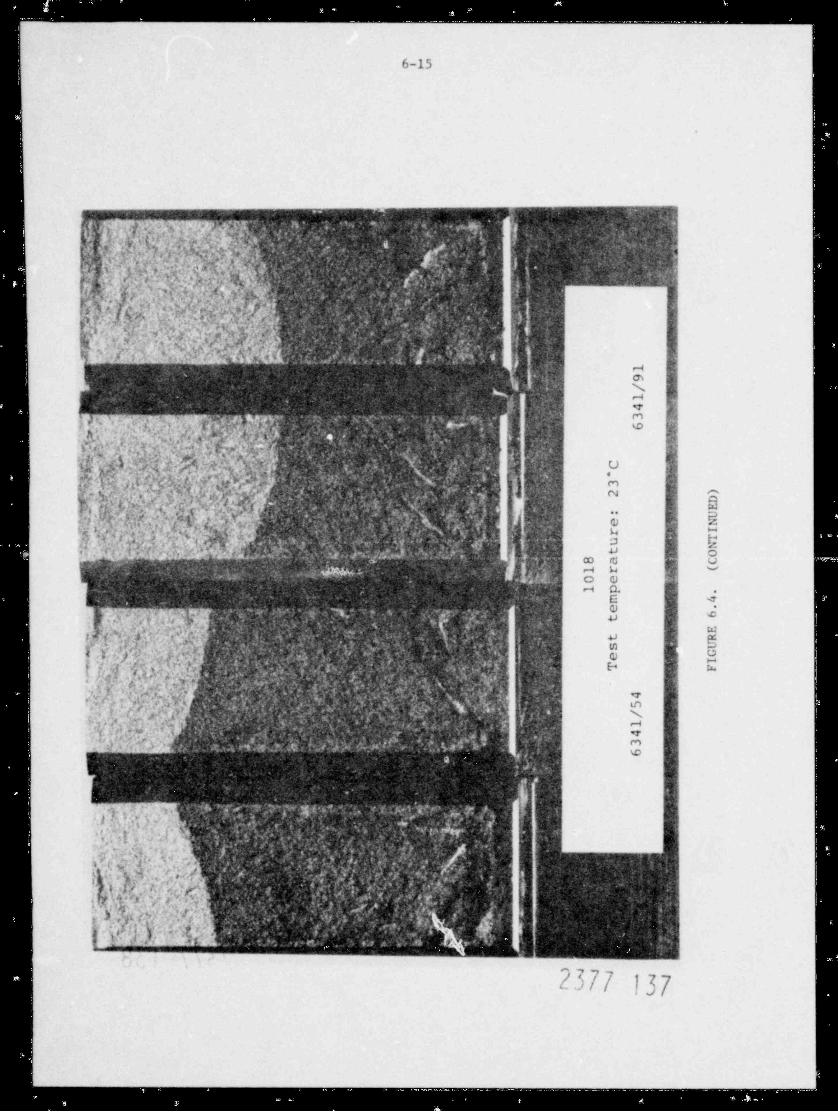
.. . . . - . - - - - - . - .
6-15
,
Y" wpi--,,y. ,p ---- - Ly - 'uvs==-_
.$1- ,,,? '
';,)
($pSygMsg$fh h h k h h h k) ek k N h b }}
"g7 '
h
6.,'&MWM,.n.sj?Q1 g;IgBLee!%s&d.| J. !!.
>p%.. , p y% W ; 7 .i v; m q ua .j %Nyy 4tp, g.j#a v -
?g Bi( <b s g;m c <:
fi6 ;h.- # e
:. g , mt- -f:
-
. . g..j N /
{W ? - Fi
e=nn x,.
y" "o yJiw '~ p? W; mjQpn vHBr
%MA M Ws!P@m% xMh tfWj$$p L,yn& w,L;p<.,g%pg 9
r -
d @2L: u
.o d
'
-g-r e gyng 4Away -
y a. 4pg e y- e=
w. s -. c e
4-a3 ,.3 e
b.~
n(,. m#el
f .w A; e. w, .- .
p . m . m pp u $ $ kh~.,~ qJ
-: - .> nc a
Ef3p5an>mh 6% HM. ] y,iW. , ,1 54 oa ws.-
{ :V .f ! 1M;. %g [.</,I ,j!;/ 4 .:;,D 4 pp,f'NQ .. }:
v N 4'. A g p- f3' ., g,jv -
D. ,.f,.,' &,= a ( f.rif E q / s q M;7 |*
x 7@ 'i.;m %)q
r<: g.,va n:i 9 D3~. , "Mk i@ g g M *gi '' V@- -d
y ' * gfl%g y\. ;m. ;>;p , ,ytye,. w#?:|e),e* +wym .
* , ,,. c. : .i . c.
h
muW,.,s - y?y%p%,$im;g~.MF,. %,g.,*1,Xy$$$43 m.,et 6 6" 7W , ;f ry- f '
. : .s .s'> s
t . ,., . ,~ s y,
m .
44 Me 3 3
M,m u.#, -:
sn. %a .
--
-.
s ,
.. u -
e
' I} Tj
h:d
.,, ,
-
.. t . ax
n<S . .w. 7,
- c.
. ,. ,. ,
men 8.
'-
I-- , .-.-
.. ." ' ,
k}fTW.,{..q',WME ~ I ',
f
p,.,
?,
, >Mr:m . ,
n y,y:J pf. /y r;,'
J'<
{- J .. . e , . . i
'
, ~ |,
--d,77 137
- = _ _ _ _ _ _ _ _ _ . _ _ . . . . . . . .
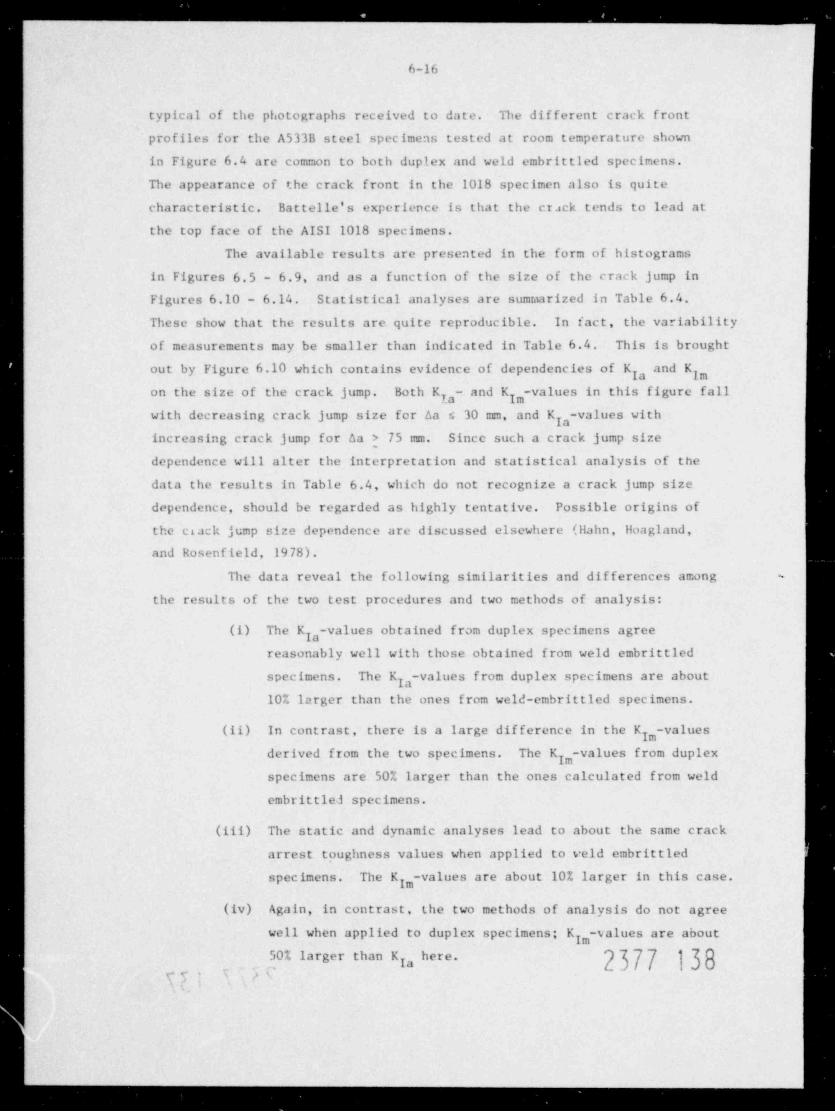
. . . _ _ _
_ _ _ _
6-16
typical of the photographs received to date. The different crack front
profiles for the A533B steel specimens tested at room temperature shown
in Figure 6.4 are common to both duplex and weld embrittled specimens.
The appearance of the crack front in the 1018 specimen also is quite
characteristic. Batte11e's experience is that the crack tends to lead at
the top face of the AISI 1018 specimens.
The available results are presented in the form of histograms
in Figures 6.5 - 6.9, and as a function of the size of the crack jump in
Figures 6.10 - 6.14 Statistical analyses are sumtaarized in Table 6.4
These show that the results are quite reproducible. In fact, the variability
of measurements may be smaller than indicated in Table 6.4 This is brought
out by Figure 6.10 which contains evidence of dependencies of K , and Kg7
on the size of the crack jump. Both K - and K -values in this figure fallg g
with decreasing crack jump size for Aa s 30 mm, and K -values withg
increasing crack jump for Aa > 75 mm. Since such a crack jump size
dependence will alter the interpretation and statistical analysis of the
data the results in Table 6.4, which do not recognize a crack jump size
dependence, should be regarded as highly tentative. Possible origins of
the crack jump size dependence are discussed elsewhere (Hahn, Hoagland,and Rosenfield, 1978).
The data reveal the following similarities and differences among -
the results of the two test procedures and two methods of analysis:
(i) The K -valu s btained from duplex specimens agreela
reasonably well with those obtained from weld embrittled
specimens. The K -valu s from duplex specimens are aboutla
10% larger than the ones from weld-embrittled specimens.
(ii) In contrast, there is a large difference in the K -valuesg
derived from the two specimens. The K -values fr m duplexhspecimens are 50% larger than the ones calculated from weld
embrittle3 specimens.
(iii) The static and dynamic analyses lead to about the same crack
arrest toughness values when applied to veld embrittled
The K ,-values are about 10% larger in this case.spec imens .g
(iv) Again, in contrast, the two methods of analysis do not agree
well when applied to duplex specimens; K ,-salues are about7
2377 13850% larger than KIa " -
77- s, 4
_ . , - - -

. . . - - -
6-17
10| I
1018, RT*m
@Og5 -
.oEoz
o | Il0 50 100 150 200
KIa(MPam /2 )l
10
1018,RT*m
@Og5 -
.oE$
00 50 100 150 200
Im (M Pom /2 )i
K
FIGURE 6.5. IIIST0 GRAMS OF-CRACK ARREST TOUGliNESS VALUES OF COLD WORKED1018 STEEL DERIVED FROM WELD EFBRITTLED SPECIMENS AT ROOMTEMPERATURE
2377 139
,. . -
;!
.
O
- - - '
. - . . . . . , , .

. . . . . . . . _ .... _...._ _ _ _ _ _
6-18
20| l
A533B Steel, RT
Weld embrittled specimens
[ Duplex specimens2EH |0 _
'oeoEaz
1r945+34*
me
'_
'O - E e0 50 100 150 200 250
KIa (M Pam /2 )i .
,
FIGURE 6.6. IIISTOGRAMS OF CRACK ARREST TOUCIINESS VALUES FROM TileSTATIC ANALYSIS FOR A533B STEEL SPECIMENS TESTED AT
?'
' ROOM TEMPERATURE,
2377 140,
e
. - . . _ . . _ . . . . . . . . .

_ . . _ . . . . _ . , _ . . ... .,____
6-19
20
A5338 Steel,RTWeld embrittled specimens
] Duplex specimens
e@
@'o 10boE$
|
$m, ,
*'
y .
00 50 100 150 200 250
K N N* IIm
FIGURE 6.7. IIIST0 GRAMS OF CRACK ARREST TOUGHNESS VALUES FROMTile DYNAMIC ANALYSES FOR A533B STEEL TESTED ATROOM TEMPERATURE
2377 141.
_ _ _ _.
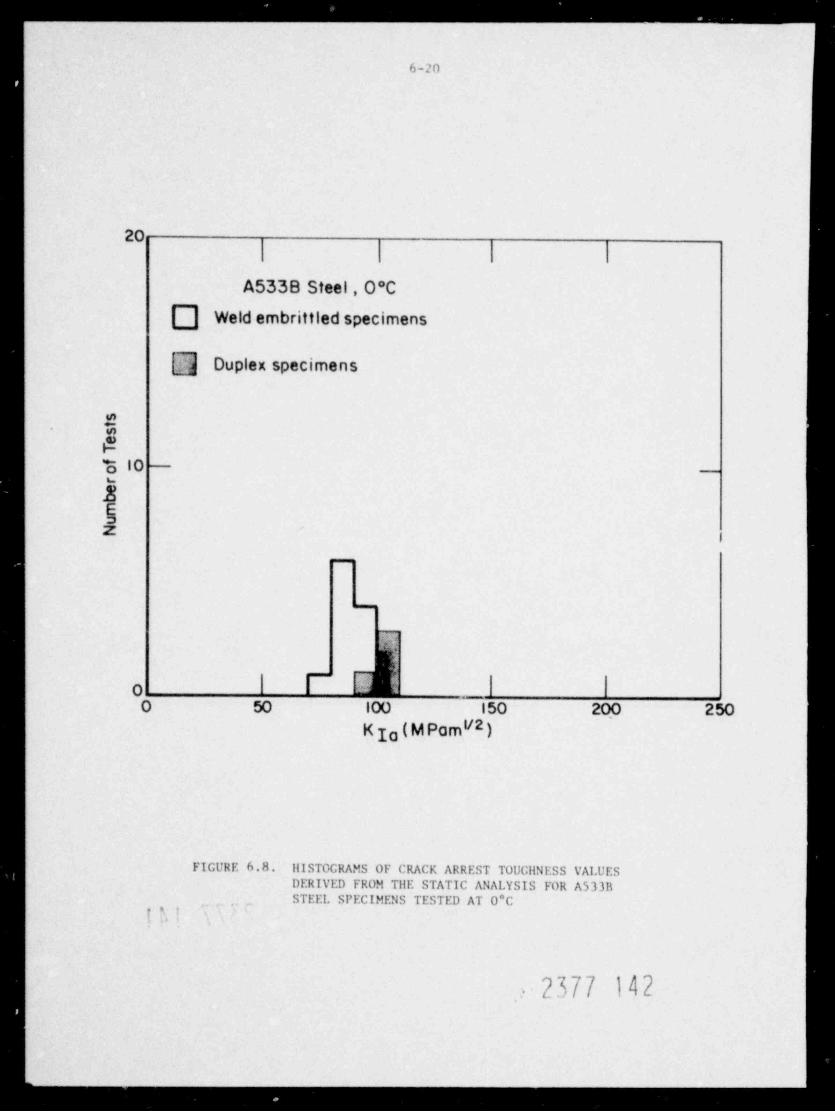
- _ _ _ _ _ _ _ _ _ _ _ _ _ _ _ -
6-20
20
A533B Steel, O C
Weld embrittled specimens
.-
:; Duplex specimens
2n@-o io __
u
.8
1
00 50 100 150 200 250
K Io ( M Pamv2)
FIGURE 6.8. IIISTOCRAMS OF CRACK ARREST TOUGilNESS VALUESDERIVED FROM Tile STATIC ANALYSIS FOR A53311STEEL SI'ECIMENS TESTED AT 0*C
[ ,i
2377 142.
_ _ . . . _ _ . . .
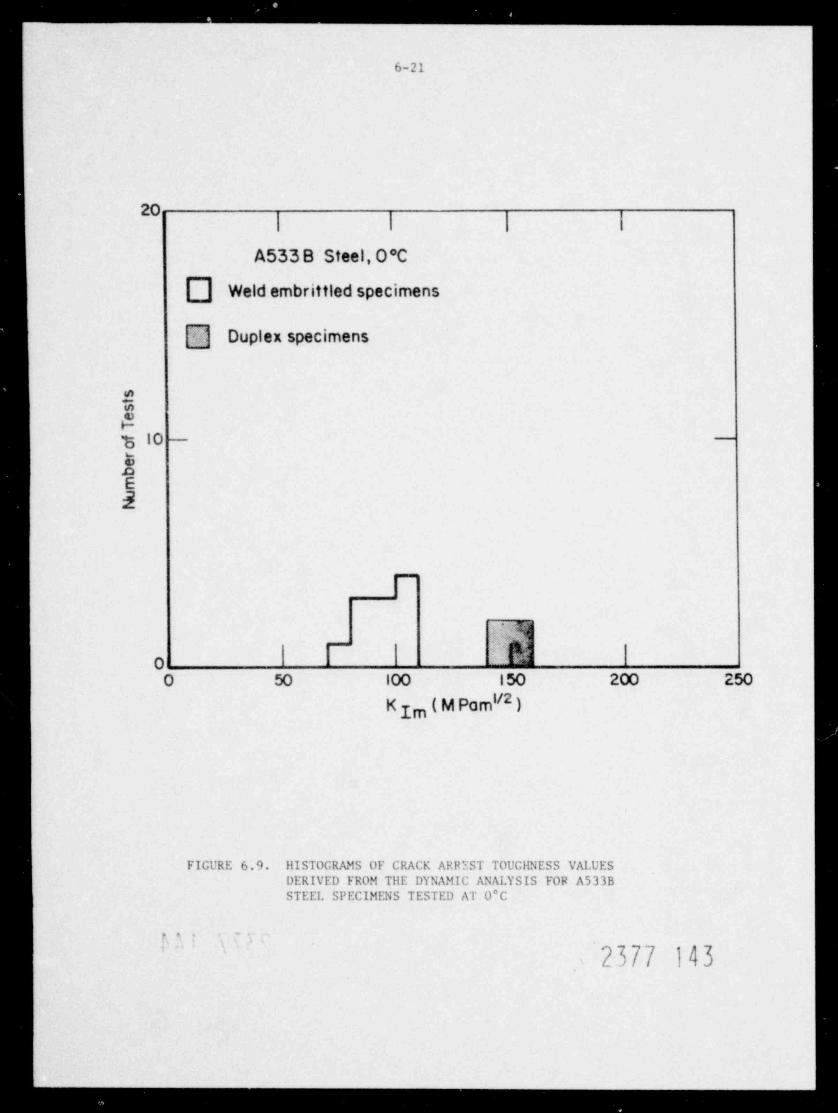
-- . . . .. . . . . . . . _ . . - . - - -_ _ _ _ _
6-21
20I I
A533B Steel,0 C
Weld embrittled specimens
'
Duplex specimens
2EF-t 10aaE:E
%oO 50 100 150 200 250
K Im ( M Pam /2 )i
FIGURE 6.9. HISTOGRAMS OF CRACK ARREST TOUGHNESS VALUESDERIVED FROM THE DYNAMIC ANALYSIS FOR A533BSTEEL SPECIMENS TESTED AT 0"C
r. -
.
2377 143'
_ _.
__
- - - - - - . . .
125I I I !
...
OO O
O
IM m g eO OeO$O 9 oTe
G e* Os# .e-
R 75 e e-g8 e2~
E eHx T
50 $ ;3-
0H
X
Weld embrittled specimens25 1018 steel, RT
Nva eKIaNy O KIm
A O IA O 25 50 75 100 125 150
80, mm
FIGURE 6.10. VARIATION WITil THE SIZE OF THE CRACK JDiP OF Kla 'AND KIm-VALI'ES DERIVED FROMTHE WEl.D-EMBRITTLED 1018 PRACTICE SPECIMENS
-_
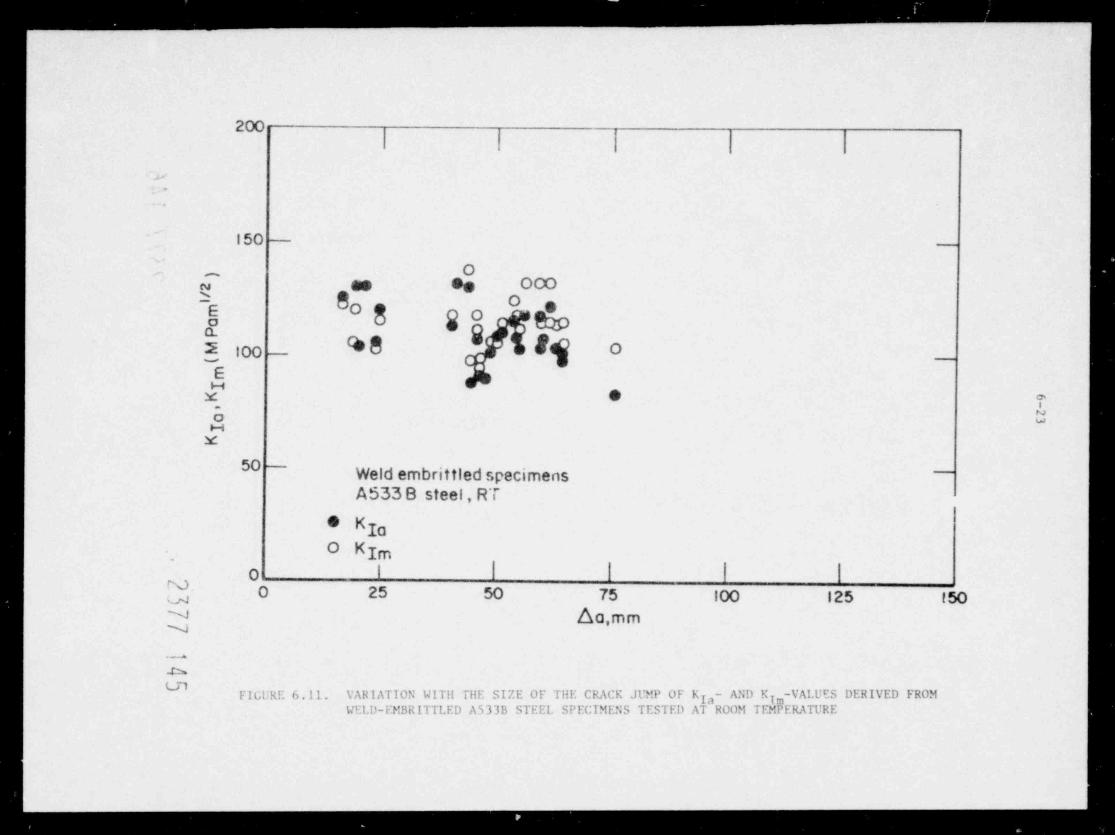
^
_
200
-
.
150
O-
n se De 000h 8 O5 8 go &
8a48 8$2 300 O
_
EHx e m
i-
0x
50 Weld embrittled specimensA633 B steel, RT
# K Ia
O KImO l | |rvj O 25 50 75 100 125 150
do,mmNN
--
b
FIGl:RE 6.11. VARIATION WITil THE SIZE OF THE CRACK JUMP OF K - AND K -VALUES DERIVED FROMyg TmWEl.D-EMBisITTLED A533B STEEL SPECIMENS TESTED AT ROOM TEMPERATURE
- - . . - - - . -

. _ _ _ _ _ _ _ _ _ _ _ _ _ _ _ _ _ _ _ _ _ _ _ _ _ _ . . . . . . . . .
200 i ;!
,
O I e.
.. OO
OgO$
O- e
150
Ge-
s *5$ I * *e*3 100
*5
W' T.
o ZHX
50 Duplex specimensA533B,RT
. eK Ia
N O KImuN O"
O 25 50 75 100 125 150
Aa,mm---
a@
FIGURE 6.12. VARIATION WITH TIIE SIZE OF THE CRACK JUMP OF K - AND KIra-VAIXES DERIVED FROMy3DUPLEX SPECIMENS OF A">33B STEEL TESTED AT ROOM TDfPERATURE
__

'
-- -
200I I I I
.
150
-
R~EE3 100
0. .O OO O
e ..H O . .
gO Tx& * U
y".
50 -
Weld embrittled specimensA533 B ,0 *C
. KIaO KmI
o i
O 25 50 75 100 125 150da,mmy
LA
NN
FIGURE 6.13. VARI ATION WITil TliE SIZE OF TifE CRACK JUtiP OF Kla- AND Kim-VAll'ES DERIVED FROMWELD EMBRITTLED SPECIMENS OF A533B STEEL TESTED AT 0*C~"
bN
. . . . . . . . . . _ _

. . . . . . . . . . . _ _ . . . . . . . . . . _ _ _ _ _ _ _ _ _ _ _ _ _ _ _ _ _ _ . _ _ _ _ . _ _ . . . . . . . . .
AF.
200I
.
OO
150 0 On
R__EO1 ob 100 09
8Esx.
? ?x 7
50 Duplex specimensA5333,0 C
# KloN O KImaNN O
O 25 50 75 100 125 150
2 do,mmcc
FIGUr; 6.14 VARI ATION WITH THE SI.'E OF T!!E CRACK JDtP OF K ,,- AND K7n-VALUES DERIVED FROM7
DUPLEX SI'ECIMENS OF A533S STI EL TESTED AT 0*C
.
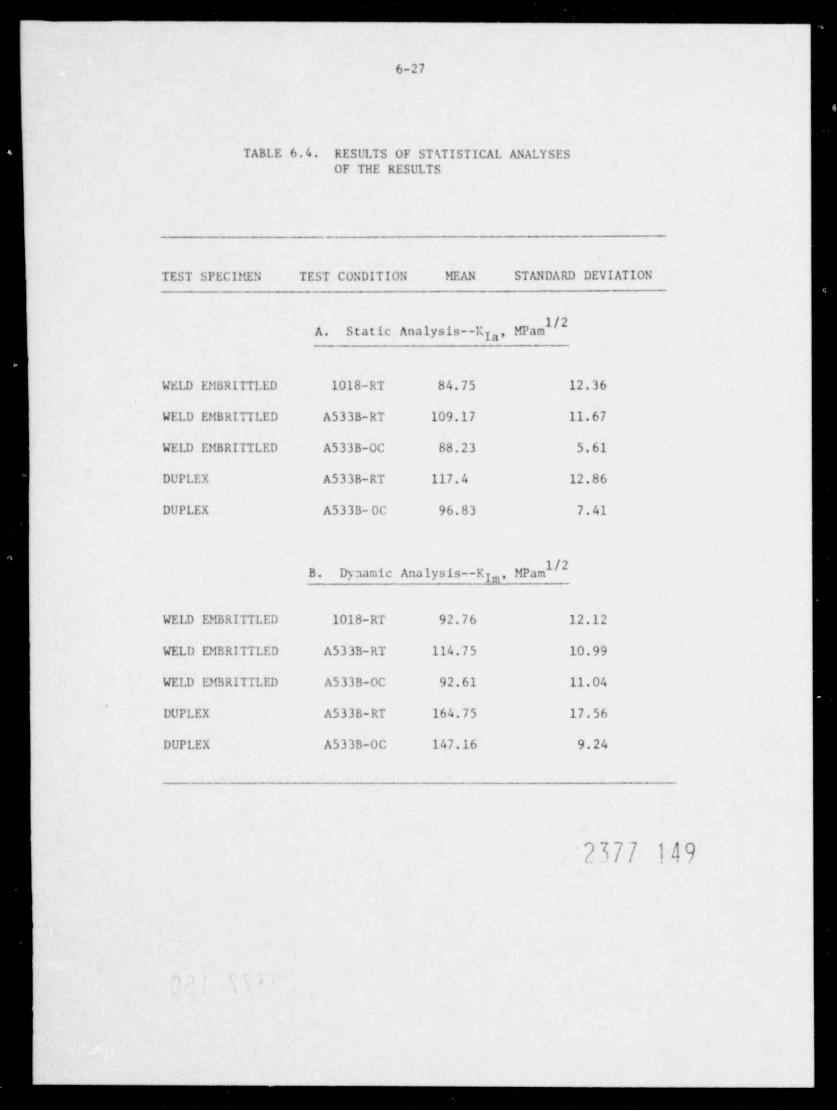
- ___. . . .._. _ _ ___ __
6-27
TABLE 6.4. RESULTS OF ST4TISTICAL ANALYSESOF THE RESULTS
TEST SPECI!EN TEST CONDITION MEAN STANDARD DEVIATION
A. Stat ic Analysis--!'Ia' #8"
WELD EMBRITTLED 1018-RT 84.75 12.36
WELD EMBRITTLED A533B-RT 109.17 11.67
WELD DBRITTLED A533B-0C 88.23 5.61
DUPLEX A533B-RT 117.4 12.86
DUPLEX A533 B- 0C 96.83 7.41
B. Dy namic Analysis--Kyn, Wan
WELD EMBRITTLED 1018-RT 92.76 12.12
WELD EMBRITTLED A53 33-RT 114.75 10.99
WELD EMBRITTLED A533B-0C 92.61 11.04
DUPLEX A533B-RT 164.75 17.56
DUPLEX A533B-0 C 147.16 9.24
~2377 149
-- _.
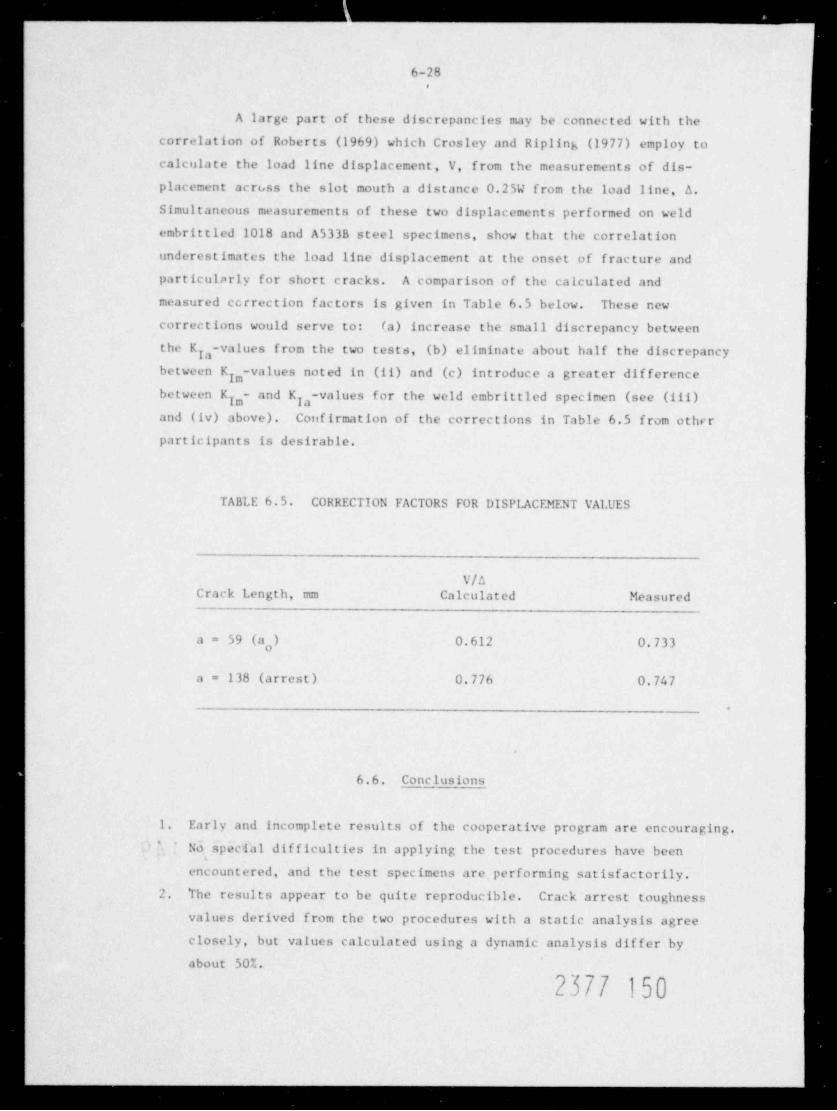
.. . . . . _ - , _ , . - . . - -._
6-28,
A large part of these discrepancies may be connected with thecorrelation of Roberts (1969) which Crosley and Ripling (1977) employ tocalculate the load line displacement, V, from the measurements of dis-placement across the slot mouth a distance 0.25W from the load line, A.Simultaneous measurements of these two displacements performed on weldembrit tled 1018 and A533B steel specimens, show that the correlationunderestimates the load line displacement at the onset of fracture andparticularly for short cracks. A comparison of the calculated and
measured ccrrection factors is given in Table 6.5 below. These new
corrections would serve to: (a) increase the small discrepancy betweenthe K -values fr m the two tests, (b) eliminate about half the discrepancyIabetween K -values noted in (11) and (c) introduce a greater difference
7
between K - and K -values for the weld embrittled specimen (see (iii)7 73
and (iv) above). Confirmation of the corrections in Table 6.5 from otherparticipants is desirable.
TABLE 6.5. CORRECTION FACTORS FOR DISPLACEMENT VALUES
V/ACrack Length, mm Calculated Measured
a = 59 (ag) 0.612 0.733
a= 138 (arrest) 0.776 0.747
.
6.6. Conclusions
1. Early and incomplete results of the cooperative program are encouraging.' No special dif ficult ies in applying the test procedures have been
encountered, and the test specimens are. performing satisfactorily.2. The results appear to be quite reproducible. Crack arrest toughness
values derived from the two procedures with a static analysis agreeclosely, but values calculated using a dynamic analysis dif fer byabout 307..
2377 150
_____ _ __ _

_ . . _ _ _ . - . - - . - . - -.
6-29
3. The correlation between load line displacement and crack mouth dis-placement is identified as one possible source of the discrepancy.Confirma t ion f rom other participants is desirable.
4. The statistical analysis of the variability may be complicated by asystematic dependence of certain arrest toughness values on the sizeof the_ crack jump. This should become clearer when more results areavailable.
2377 151.
+
, , _ _ . . _
_ _ _ _ _ . . . . . _ . . . . - - _ _ . . . . -
7-1.
7. REFERENCES
Bilek, Z., 1978, "Some Comments on Dynamic Crack Propagation in HighStrength Steel". ASTM Symposium on Crack Arrest Methodology and Applica-tions, Philadelphia, Pa., to be published.
Cheverton, R. D., private communication, 1978.
Cheverton, R. D., Iskander, S. K., and Bolt, S. E., 1978, " Applicabilityof LEFM to the Analysis of PWR Vessels Under LOCA-ECC Thereal ShockConditions", NUREB/CR-0107, ORNL/NUREG-40.
Cheverton, R. D., Iskander, S. K., Gehlen, P. C., and Hahn, G. T., 1978," Application of Crack Arrest Theory in a Thermal Shock Experiment", ASTMSymposium on Crack Arrest Methodology and Applications, Philadelphia, Pa.,to be published.
Cheverton, R. D., and Bolt, S. E., 1977, " Pressure Vessel Fracture StudiesPertaining to a PWR LOCA-ECC Thermal Shock: Experiments TSE-3 and TSE-4,and Update of TSE-1 and TSE-2 Analysis", ORNL/NUREG-22.
Cheverton, R. D., 1976, " Pressure Vessel Fracture Studies Pertaining to aPWR-LOCA-ECC Thermal Shock: Experiments TSE-1, and TSE-2", ORNL/NUREG/TM-31.
Crosley, P. B.. and Ripling, E. J., 1977, " Guidelines for Measuring KIawith a Compact Specimen", presented to the ASTM Dynamic Initiation CrackArrest Task Group.
Dvorak, J., 1969, " Motion of Cracks in Brittle Fracture", Fracture 1969,P. L. Pratt, et al., eds., Chapman and Hall, London (1969), pp. 338-349.
Eftis, J., and Krafft, J. M., 1967, "A Comparison of the Initiation with theRapid Propag: tion of a Crack in a Mild Steel Plate", Trans. ASME, 87,p. 525.
Fourney, W. L., and Kobayashi, T., 1978, " Critical Examination of BattelleColumbus Laboratory Crack Arrest Toughness Measurement Procedure", ASTMSymposium on Crack Arrest Methodology and Applications, Philadelphia, Pa. ,to be published.
Fourney, W. L. ,1978, private communication -- the numerical representationof the KID versus velocity furnished by Fourney closely approximates theexperimentally observed relationship given by Kobayashi, T. (1977).
Gehlen, P. C., Popelar, C. H., and Kanninen, M. F., 1979, "Modeling ofDynamic Crack Propagation: I. Validation of the One-Dimensional Analysis",Int. J. of Fracture Mechanics, in press.
Gilliam, D. M., et al., (1977), " Reference and Standard Benchmark FieldConsenous Fission Yields for U. S. Reactor", Dosimetry Programs, NBS.
2377 152.
-
_ _ . - _ . . .-.
. . . . . . _ _ . . . _ _ _ . _ . _ _ . _ . _ _ . _ _ _ _ . . . _ _ _ _
7-2
flahn, G. T., Hoagland, R. G., Lereim, J., Markworth, A. J., and Rosenfield,A. R., 1978, " Fast Fractt'e Toughness and Crack Arrest Toughness of ReactorPressure Vessel Steel", ASi? Symposium on Crack Arrest Methodology andApplications, Philadelphia, Pa., to be published.
Hahn, G. T., lloagland, R. G., and Rosenfield, A. R., 1978, " Effects of
Residual Stresses on the Weld-Embrittled Crack Arrest Test Specimen",ASTM Symposium on Crack Arrest Methodology and Applications, Philadelphia,Pa., to be published.
llahn, G. T., Gehlen, P. C., lloagland, R. G., Lereim, J. , Kanninen, M. F.,
Popelar, C., Marschall, C. W., and Rosenfield, A. R., 1978, NRC ReportBMI-2014, Battelle, Columbus Laboratories.
Ilahn, G. T., Gehlen, P. C., lloagland, R. G., Kanninen, M. F., Marschall,C. W., Popelar, C., and Rosenfield, A. R., 1978, NRC Report BMI-2010,Battelle, Columbus Laboratories.
Hahn, G. T., Corten, H. T., Debel, C. P., Gehlen, P. C., Hoagland, R. G.,
Kanninen, M. F., Kim, K. S., Marschall, C. W., Popelar, C., Rosenfield,A. R., and Simon, R., 1978, NRC Report BMI-1995, Battelle, ColumbusLaboratories.
llahn , G. T., and Kanninen, M. F., 1977, " Summary, Fast Fracture and CrackArrest", ASTM STP 627, p. 413-414.
lla hn , G. T., Rosenfield, A. R., Marschall, C. W., Hoagland, R. G., Gehlen,P. C., and Kanninen, M. F., 1978, " Crack Arrest Concepts and Applications".Fracture Mechanics, N. Perrone, et al., eds., University of Virginia(Charlottesville), pp. 205-227.
Ilahn, G. T., et al., 1977, " Critical Experiments, Measurements, and Analysesto Establish a Crack Arrest Methodology for Nuclear Pressure Vessel Steels",Third Annual Progress Report, NUREG/CR-0057, BMI-1995.
Ila hn , G. T., lioagland , R. G. , and Rosenfield, A. R., 1977, "A FractureMechanics Practice for Crack Arrest", SMIRT-4 Proceedings, Paper Gl/6.
Hahn, G. T., et al., 1976, " Critical Fxperimtnes, Measurements andAnalysis to Establish a Crack Arrest Methodlogy for Nuclear Pressure VesselSteels", Second Annual Progress Report to NRC, BMI-NUREG-1959.
Ilahn, G. T., lloagland, R. G., and Rose. teld, A. R., " Influence ofMetallurgical Factors on the Fast Fracture Energy Absorption Rates", Metal.Trans., Li, pp. 49-54.
Ila hn , G. T., Gehlen, P. C., lloagland, R. G., Kanninen, M. F., Popelar, C.,
Rosenfield, A. R., and de Campos, V. S., 1975, " Critical Experiments,Measurements, and Analyses to Establish a Crack Arrest Methodology forNuclear Pressure Vessel Steels", First Annual Report to U.S. NuclearRegulatory Commission, BMI-1937.
Ilahn, G. T., Kanninen, M. F., and Rosenfield, A. R., 1969, " Discussion;
Paper 6", Fracture 1969, P. L. Pratt, et al., eds., Chapman and Hall,London (1969), pp. 905-906.
,

__ .. . . - -
7-3
lloagla nd , R. G., Gehlen, P. C., Rosenfield, A. R., and Hahn, G. T., 1978," Analysis of Crack Arrest in Reactor Pressure Vessels", ASME Paper 78-Mat-16.
iloa gland , R. C., Rosenfield, A. h., Gehlen, P. C., and Hahn, G. T., 1977,"A Crack Arrest Measuring Procedure for K ,K " # EU '"" ' ^ID' laATP 627, pp. 177-202.
Hoagland, R. C., Gehlen, P. C., Rosenfield, A. R., Kanninen, M. F., andllahn, G. T., presented March 1977, revised October 1977, " ProposedTentative Method of Test for Fast Fracture Toughness and Crack ArrestToughness", presented to ASTM E24.03.04
Hoagland, R. G., Rosenfield, A. R., and Hahn, G. T., 1972, " Mechanisms ofFast Fracture and Crack Arrest in Steel", Met. Trans., 3, p. 121.
lioagland, R. G., 1967, "On the Use of the Double Cantilever Beam Specimenfor Determining the Plane Strain Fracture Toughness of Metals", Trans. ASME,89D, pp. 525-532.
Irwin, G. R., Dally, J. M., Kobayashi, T., Fourney, W. L., and Etheridge,J. M., 1977, Report 0072 to the U. S. Nuclear Regulatory Commission.
Iskander, S. K., 1978, private communication.
Kalthoff, J. F., Beinert, J., nnd'Winkler, S., 1977, " Measurements ofDynamic Stress Intesity Factors for Fast Running and Arresting Cracksin Double-Can t ileve r-Beam Spec imens", ASTM Special Technical Publication627, pp. 161.
Kobayashi, A. S., Emery, A. F. , and Mall, S. , 1977, " Dynamic FiniteElement and Dynamic Photoelastic Analyses of Crack Arrest in Homalite-100 Plates", ASTM Special Technical Publication 627, p. 95.
Kobayashi, T., and Dally, J. W., 1977, " Relation Between Crack Velocityand Stress Intensity Factor in Birefringent Polymers", ASTM SpecialTechnical Publication 625, p. 2' 7
Kobayashi, A. S., Polvanich, N., Emergy, A. F., and Lowe, W. J., 1975," Computational Fracture Mechanics", ASM publication, Rybicki and Benzley,eds.
Popelar, C. ii . , and Gehlen, P. C., 1979, "Modeling of Dynamic CrackPropagation: II. Validation of Two-Dimensional Analysis", Int. J. ofFracture Mechanics, in press.
Ripling, E. J., Crosley, P. B., and Marston, T. U., 1978, " Dynamic and CrackArrest Toughness Measurement of SA 533 Grade B Class 1 Steel", presented atJoint ASME/CSME Pressure Vessels and Piping Conference. Montreal, Canada.
Roberts, E. , J r. , 1969 " Elastic Crack-Edge Displacements for the CompactTension Specimen, Fbterials Research and Standards", MTRSA, Vol. 9,p. 27.
Rolfe, S. R., and Novak, S. R., " Slow-Bend K e Testing of Medium-StrengthI
liigh-Toughness St eels", ASTM STP 463, American Society for Testing andMaterials, 124-159, 1970.
2377 154
. - - - - . - - .
__
l
7-4
Rybicki, E. F. , and Stone sif er, R. B., 1979, "An LEFM Analysis for theEf fects of Weld Repair Induced Residual Stresses on the Fracture of the HSSTITV-8 Vessel", to be presented at the 3rd U.S. National Congress on PressureVessels and Piping (June 25-29, 1979), San Francisco, California.
Simons, R. L., and McElroy, W. N., (1970), BNWL-13120.
Van Der Sluys, W. A., Seeley, R. R., Schwabe, J. E., Lowe, A. L., andAyres, P. S., 1976, " Determining Fracture Properties of Reactor VesselForging Materials, Weldments and Bolting Materials", EPRI NP-122.
Welding Research Council, 1972, "PVRC Recommendations on Toughness Require-ments for Ferritic buterials", Bulletin 175.
Wessel, E. T., Clark, Jr., W. G., and Pryle, W. H., 1969, " Fracture
Mechanics Technology Applied to Heavy Steel Structures", Fracture 1969,P. L. Pratt, et al., eds., Chapman and Hall, London (1969), pp. 825-850.
Witt, F. J., 1971, "A Procedure for Determining Bounding Values on FractureToughness K at Any Temperature". Heavy Section Steel Technology Program,5thAnnualkEformationMeeting,PaperNo. 13.
2377 155
-
_ . _ _ _ _ . . . . . . . _ _ ._ _ _ _
APPENDIX A
PROGRAM OF Tile ASTM SYMPOSIUM ON CRACK ARREST METHODOLOGYAND APPLICATIONS, PHILADELPHIA,
NOVEMBER 6 AND 7, 1978
2377 156
,
- - -
_ _ _ _ _ _ . _ . . .

_ _ _ _ _ _ . _ _ . . _ . . _ _ _ _
A-1
APPENDIX A
PROGRAM OF Tile ASIN SYMPOSIUM ON CRACK ARREST METil0DOLOGYAND APPLICATIONS, PillLADELPilIA,
NOVEMBER 6 AND 7, 1978,
SESSION I -- COMPUTATIONAL AND EXPERIMENTAL METHODS FOR THE ANALYSIS OFDYNAMIC CRACK PROPAGATION AND ARREST
A Dynamic Viscoelastic Analysis of Crack Propagation andCrack Arrest in DCB Test Specimen - C. H. Popelar andM. F. Kanninen, Battelle Columbus Laboratories
A Model for Dynamic Crack Propagation in a DoubleTorsion Fracture Specimen - C. H. Popelar, Ohio StateUniversity
Effect of Material Nonhomogeneity on the Velocity ofCrack Propagation - G. C. Sih and E. P. Chen, Lehigh
University
Finite Element Simulations of Fundamental Fast FractureProblems - J. F. Malluck, Inckheed-Georgia Co. andW. W. King, Cecrgia Institute of Technology
The SMF2D Code for Proper Simulation of Crack Propagation -M. Shmuely and M. Perl, Israel Institute of Technology
Analyses of Dynamic Tear Test Specimen - S. Mall,University of Maine, A. S. Kobayashi, University ofWashington and F. J. Loss, Naval Research Laboratories
SESSION II -- FUNDAMENTAL ISSUES IN DYNAMIC CRACK PROPAGATION AND CRACKARREST ANALYSIS
The Influence of Specimen Geometry on Crack Propagationand Arrest Toughness - L. Dahlberg, B. Brickstad and
F. Nilsson, Royal Institute of Technology (Sweden)
Experimental Analysis of Dynamic Effects in DifferentCrack Arrest Specimens - J. P. Kalthoff, J. Beinert andS. Winkler, Institut Flier Festkurper Mechanik (Germany)
2377 157
--
- - . _ _ _
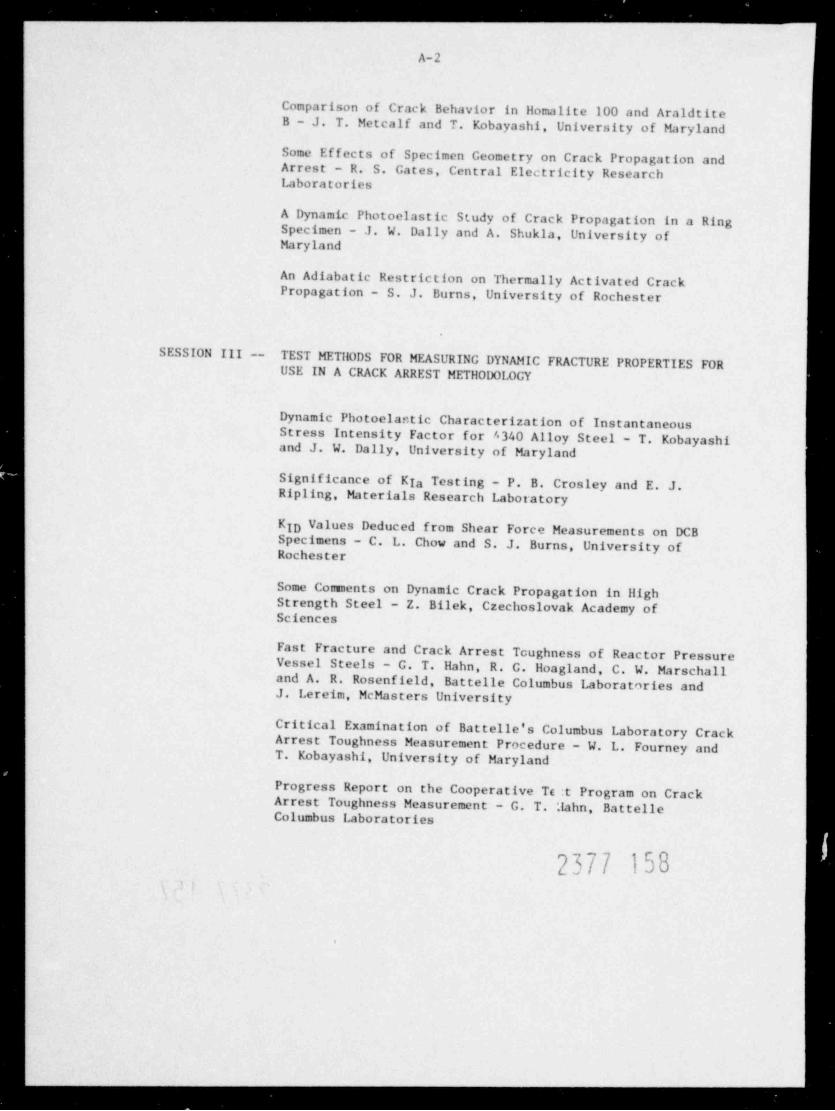
_..__ _ _ _ _ _ ___
A-2
Comparison of Crack Behavior in Homalite 100 and AraldtiteB-J. T. Metcalf and T. Kobayashi, University of Maryland
Some Effects of Specimen Geometry on Crack Propagation andArrest - R. S. Cates, Central Electricity ResearchLaboratories
A Dynamic Photoelastic Study of Crack Propagation in a RingSpecimen - J. W. Dally and A. Shukla, University ofMaryland
An Adiabatic Restriction on Thermally Activated CrackPropagation - S. J. Burns, University of Rochester
SESSION III --TEST METHODS FOR MEASURING DYNAMIC FRACTURE PROPERTIES FORUSE IN A CRACK ARREST METHODOLOGY
Dynamic Photoelar. tic Characterization of InstantaneousStress Intensity Factor for 4340 Alloy Steel - T. Kobayashiand J. W. Dally, University of Maryland
Significance of KIa Testing - P. B. Crosley and E. J.Ripling, Materials Research Laboratory
KID Values Deduced from Shear Force Measurements on DCBSpecimens - C. L. Chow and S. J. Burns, University ofRochester
Some Comments on Dynamic Crack Propagation in HighStrength Steel - Z. Bilek, Czechoslovak Academy ofSciences
Fast Fracture and Crack Arrest Toughness of Reactor PressureVessel Steels - C. T. Hahn, R. G. Hoagland, C. W. Marschalland A. R. Rosenfield, Battelle Columbus Laboratories andJ. Lereim, McMasters University
Critical Examination of Battelle's Columbus Laboratory CrackArrest Toughness Measurement Procedure - W. L. Fourney andT. Kobayashi, University of Maryland
Progress Report on the Cooperative Te :t Program on CrackArrest Toughness Measurement - G. T. 'lahn , Battelle.
Columbus Laboratories
2377 158.
I
- _ _ _ _ _ _ _ . . ._ _. .. . . . _ . . . . . , , . .
_ __ . . . . . . _ . _ ___
A-3
SESSION IV -- APPLICATION OF DYNAMIC FRACTURE MECHANICS TO CRACK PROPAGA-TION AND ARREST IN PRESSURE VESSELS AND PIPELINES
A Theoretical Model for Crack Propagation and Crack Arrestin Pressurized Pipelines - P. A. McGuire, S. G. Sampth
and M. F. Kann inen, Battelle Columbus Laboratories andC. H. Popelar, Ohio State University
Analytical Interpretation of Running Ductile FractureExperiments in Gas Pressurized Lin> Pipe - L. B. Freund,Brown University and D. M. Parks, Yale University
The Analysis of the Dynamic Propagation of Brittle andDuctile Circumferential Cracks in Pressurized Pipes -
A. F. Emery, A. S. Kobayashi and W. J. Love, Universityof Washington
Application of a Dynamic Method of Analysis for CrackArrest to a Thermal Shock Experiment - R. D. Cheverton,S. K. Iskander, Oak Ridge National Laboratory andP. C. Gehlen, Battelle Columbus Laboratories
Crack Arrest in Water Cooled Reactor Pressure VesselDuring LOCA Conditions - T. U. Marston, Electric PowerResearch Institute and E. Snith, University of Manchester
2377 159
- - - - . .
. . . . . . . . - - -__
APPENDIX B
EXPRESSIONS FOR TER?tS IN DYNAMIC ANALYSIS OFCIRCUMFERENTIAL CRACK IN A CYLINDER
DERIVED IN SECTION 2.5
2377 160
- - -
_ _ _ .

__ . . . . . . _ __ _ _
B-1
APPENDIX B
B.1. EXPRESSIONS FOR TERMS IN DYNAMIC ANALYSIS OFCIRCUMFERENTIAL CRACK IN A CYLINDER
DERIVED IN SECTION 2.5
' i(A + 2G) "i+1] ~ "ij 1+#1+1= _ (A + 2G) h#1+#1+1
#
Aij 4 ( ar ar 8 r r
f
,~
I )G Il+1 Il i+1]+1 ij +1 + "i+1] ~ "ij 1 + # +1#
1, - 2 +8 az or Az
,
u +1] (#1 + # +12uA_ "i+1]+1 ~ "i+1] + "ij+1 ~ "ij gj u ,7jf i 1, . _
8 az r r r or_ f g
1 + # +1A "ij+1 - "ij #i
_ 8 Az r(
. -
- (3A + 20)a ij + Offyj ~ 0}_i(#1 + # +1
i*
8 Ar r 1_
i_
f i
= , (A + 2G) h#1 + # +1( + 2G) "i+1j ~ "ij g r +1 1Bij 4 ( ar ar 8 r rj
h
_
8-
~ f "Ij ~ "i3~l I+13 " Id I+Il-1 I3-1 I+ I+1G2 +
az ar azj_
A_ "i+1] ~ "i+1j-1 + "ij ~ "ij-1 "ij "i+1]_
"i+1j 1 + r ,7#i, , .
8 Az r r r arg
_1 "ij ~ "1[-l 1+#1+1#
8 az rj
(3A + 2G)a ij + O ,yji(# # +1 (B.2)8 or r 1 i
( i1
2377 161
- - - _ _

.. . . . . . . . . _ . _ . . . . . . . . . . __ _ _ .
B-2
ij 4 or Ar, (A + 2G) h#1-1 + #1# #
(A + 2G) "ij ~ "i-lj 1-1 1C =-
8 r r
~
1 )"ij+1 "i-lj "ij ~ "i-]j + "ij+1 - "i-lj+1 1-1 + #1#,G 2 ,
8 Az Ar Az- I L .
- -
A "ij+1 - "ij + "i-lj +1 ~ "i-lj "ij "1-1],
"i-lj 1-1 + #1#, ,, 8 Az r r Arr _f g _g
_g
A "ij+1 + "ij 1-1 + #1#
_ 8 Az r g
(3A + 2G)a 1-lj ij (r ,y + r ) (B.3), +g
( ij
ij- (A + 2G) "ij ~ "i-lj 1-1 + #1 _ A + 2G h#1-1 + i#
D =
4 Ar Ar 8 r rg
, G_ "ij ~ "ij -1 "ij -1 ~ "i-lj-1 + "ij ~ "i-1] 1-1 + #1#.
8 Az Ar Azt
_ \ l -
r--
A "1-lj ~ "i-lj -1 + "ij ~ "ij-1 "ij "i-lj _ "i-lj 1-1 + #1#
+ +~ 8 Az r r r Arg g g _
1-1 + #1#_ A_
"ij ~ "ij-1
8 Az rf
(3A + 2G)a 1-lj ij, , , )k ij
2377 162
(::''
.

- , . , , . . - - -. ___
B-3
f + r +1 G_ "i+1] - "ijij
-(A + 2G) "ij+1 - "ij riE ,,= ,
4 Az Az 8 Ar'
j
"i+11+1 ~ "i+1] + "ij+1 - "ij 1 + r ,1#g,
Az ar,
_
--
A "i+1]+1 ~ "ij +1 + "i+1j ~ "ij "ij + "ij+1 1 + r ,1#i, .
8 Ar r Azg ,
- (3A + 2G)a ij + Ogj ,1(ri + r ,y) (B.5)8 gg ij
g + r +1 G i+1j ij
ij, (A + 2G) "ij ~ "ij -1 r
iy , . - 24 az az 8 Ar j
"i+13 ~ "i+1j-1 + "ij - "ij -1 1 + r ,y#+ g
Az ar,
- -
A_ i+1] ~ "ij + "i+1j-1 - "ij-1 "11-1 + "ij 1+#1+1#,
_ 8 Ar r azg
O13A + 2G)a ij + Ogj _7
.az i i+1 (B.6)8 (
(A + 2C) 1]+1 ~ ij 1-1 + i G ij - i-ljG =
ij 4 ( az Az 8 ar
"ij+1 ~ "ij + "i-lj +1 - "i-lj 1-1 + ri#,
az ar.
- -
A_ "ij +1 ~ "i-1]+1 + "ij ~ "i-lj "ij + "ij+1 r _1 + rfg4 .
8 Ar r az-
_ (3A + 2G)n 1]+1 + ij (r _y + r ) (B.7)g8 az(
2377 163.
3..
_
_ _ . _ .

. . . . . . . . . . . . . . _ _ _ _ _ . _ . - - -
B-4
f }# ~f I
ij_ (A + 2G) "ij "ij-1 1-1 + #1 ,G i~lj
2(ijg ,
4 Az az 8 ar j
-
"ij ~ "1j -1 "i-lj ~ "i-lj-1 1-1 + i#,
a: ar.
- ,
1-1 + #1_ A_
"ij - "i-l j + "ij -1 ~ "i-lj-1 "ij-1 + "ij #,
8 Ar r a:i
- .
(3A + 2G)a ij-1 + ij (B.8)az 1-1 + i+ #
8k l
_ C(A + C) "N+1j AG "N+1j+1 - "N+1],
N+1j A + 2G , 2(A + 2G) Azr +1N
G(3A + 2G)a (B.9)0 +1j
,2(A + 2G) N
b+1j ~ G(A + G) "N+1] AG N+1] - "N+1j-1#
~
A + 2G 0*r +1N
G(3A + 2G)s0 +1j (B.10),
2(A + 2G) N
2G(A + G) "N+1]+1 - "N+1] N+1 AG "N+1j+1 + "N+1]#, ,
N+1j A + 2G az az 2(A + 2G) Azj
_ G(3A + 2G)a N+13 + N+1jf-r +1 (B.ll)N2(A + 2G) ( jaz
AG "N+1) "N+1j-1~ ~ 2G(A + G) "N+1] ' "N+1j-1 N+1
- 2(A + 2G) Azbi+1j A + 2G Az az; j
C(3A + 2G)a N+1j-1 N+11( "i }*
2(A + 2G) Az N+1
(
2377 144
__ ______. . . .

_ _ . _ _ . . . _ .. _ ____
B-5
~ l )#~
+ # +1 ~h#G(A + G) "p+1Q ~ "pQ p + # +1p p pg g,
PQ 2(A + 2G) or Ar r r- 5 A P P .
, ~
"p+1Q p p+1-+ 8(A + 2G) p+1AG pQ pA 2
(r + r +1)4(A + 2G) Ar r ,y r p pp p
O~ C(3A + 2G) pQ + O ,1Q ~
( p + # +1} ( }p
4(A + 2G) Ar r p*
PA
1 \ -
#( + C) PQ ~ p-lQ p-l p sh #p-l p#
V 2 ,=-
PQ 2(A + 2G) or Ar r rk A P P _
u ,yQ r ,7 + r pA (2u
AG pQ p p p 1
r 8(A + 2G) p+ (r ,7 + r )+_ 4(A + 2G) or r _1 p pp
G(3A + 2G)a pQ O ,7Qp+ + ( p-l + # ( * ')4(A + 2G) or rk P/
p
\I"P+1Q ~ "PQ t"P+1Q&l ~ "P+1Q + "P+1Q)# +1# +1 Ag (A + 2G) P P,
PQ 4 or Ar 4 Az r orj p
\~
r )r1"P+1Q ~ "PQI _ "PQG(A + G) AG "PQ - u ,yQp, ,
(A + 2G) Ar Ar r2(A + 2G) ( Arj p_ j
O_ (3A + 2G)a P Q rpg
I ) 1 )# #~ G(3A + 2G)a 0 P pA P9 E~I, 8(A + 2G)
+ (B.15)k i k p}2(A + 2G)
f"P+1Q+1 ~ "P+1Q"P+1Q ~ "PQ P+1i
#+ ~ ghG
(B.16)X 4 Az Ar Ar 4 Azpg g j
2377 165p' -
___
. _ _ . _ _ . . . - ..
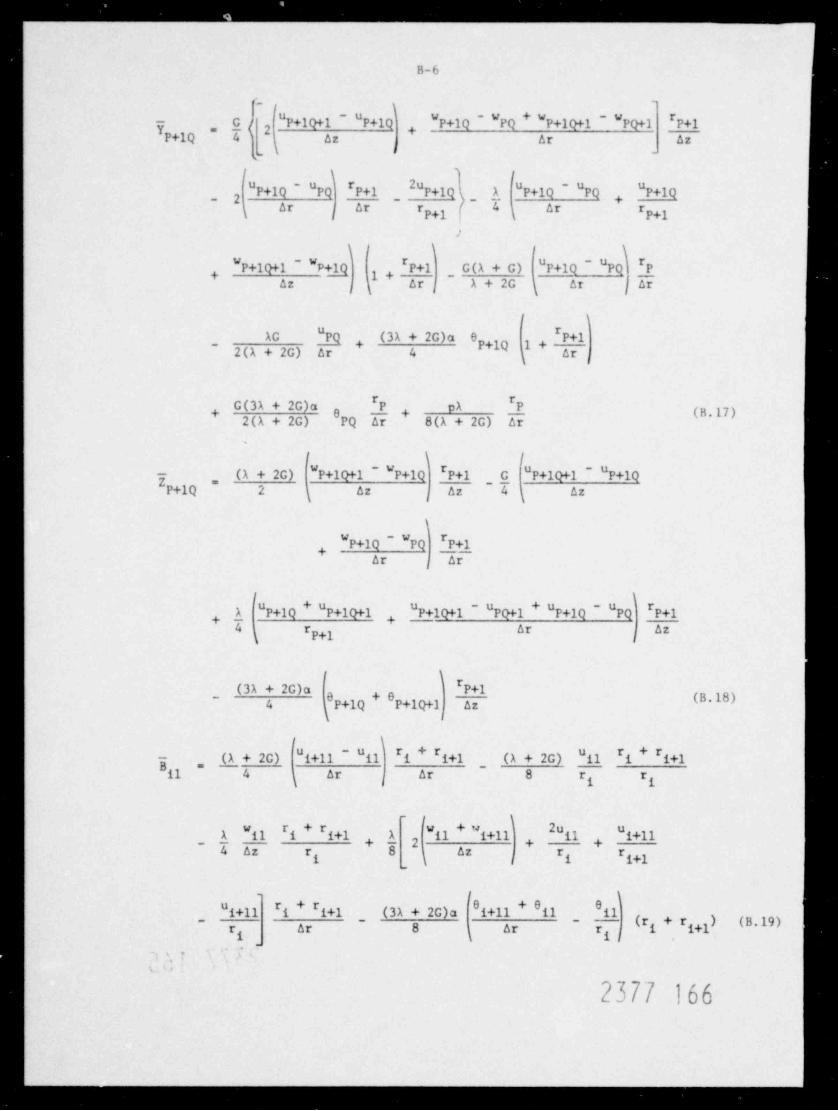
, - - - - - - . - . . . . .. - , . . . - , - - . . . . - -
B-6
~ f )G_ "P+1Q+1 ~ "P+1Q "P+1Q ~ "PQ + "P+1Q&1 ~ "PQ+1 P+1
#
7 +1Q,,, '
P 4 Az ar Az,_
-
f ) f
- 2 ,"P+1Q
_"P+1Q ~ "PQ "P+1QP+1Q ' "PQ P+1 A
0# 0# 0# ## +1 ( P+1\ j P ,
:
hI ) I \"P+1Q&1 ~ "P+lq P+1 _ G(A + G) "P+1Q ~"PQlI#
_l, ( , ar j f arA + 2G ( ataz ;
1 )AC "PQ (3A + 2G)a O P+1
#
(1, p
_ 2(A + 2G) or 4 ar j
G(3A + 2G)a "+ 0 + (B.17)2(A + 2G) PQ ar 8(A + 2G) ar.
- (A + 2G) "P+1Q&1 - "P+1Q\r +1 I"P+1Q&1 ~ "P+1QI
P _ G,,
P+1Q 2 az az 4( j ( az
\"P+1Q ~ "PQ h+1,
Ar ; ar
A "P+1Q "P+1Q&l "P+1Q&1 - "PQ&1 "P+1Q ~ "PQ P+1#
, ,4 r ,y or azp j
I \_ (3A + 2G)a P+1
0 +1Q + 0 +1Q&1 (B*18)4 P P az
I \1+#1+1 (A + 2G) "il 1 + # +1g (A + 2G) "i+11 - "il # #
i,
il 4 ar or 8 r r( ;
1 + # +1 A I1 + "I+11 II 1+11#
A_ "il 1
_ 4 az r 8-2 + +4
Az r rg f g_
f i1 + # +1 0
~ ~ (3A + 2G)s i+11 + 11 ~ 11#"i+11 1
(#1 + # +1) (B.19)r or 8 ar r 1i ( ij: '.
4
2377 166
_ ____ - . .
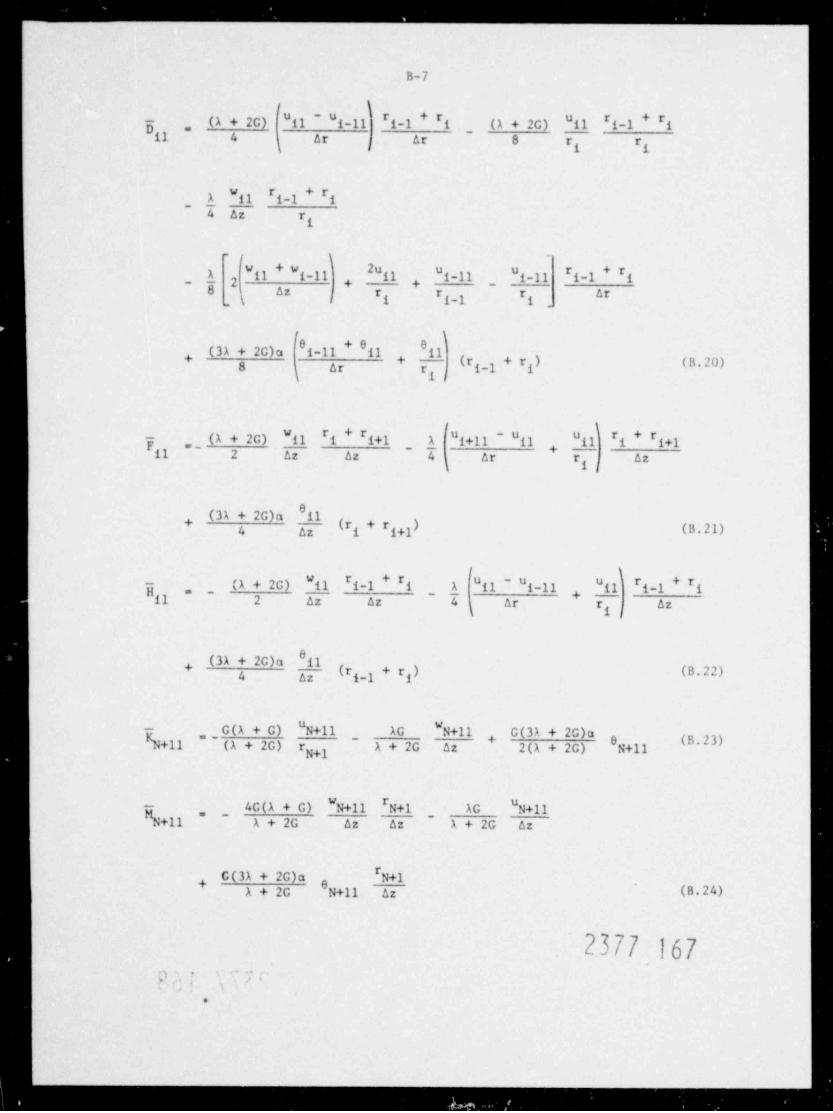
-- . . . . - - -_ _ _ _
B-7
f I
3 (A + 2G) il ~ "i-11 1-1 + #1 ~ (A + 2G) gg r _y + ri# ui,,
il 4 or Ar 8 r rj
A "il 1-1 + #1, 4 Az r g
~ f )A II + I-11 II I-11 - i-Il 1-1 + I2 + +_ 8 Az r r arr _1 g __( j g g
0(3A + 2G)a 1-11 + 11 11+ +
(#1-1 + #1 (B.20)8 Ar rN 1i
1 + # +1 A "i+11 - "il "ily (A + 2G) "il#
1 + # +1#1 1,_ ,
11 2 Az Az , 4 Ar r Az
(31 + 2G)a il+ (ri + r ,7) (B.21)4 az i
1-1 + #1 A gyil
_ (A + 2G) "il# r _1 + riu - u _yy gyup g g,
, 4 .2 Az Az Ar r 42( g
(3A + 2G)a il+(#1-1 + #1) (B.22)4 Az
G(A + C) "N+11~~ ~AG "N+11 G(3A + 2G)a
-bi+11 (A + 2G) r A + 2G Az 2(A + 2G) N+11+
g
-b+11~ 4G(A + C) "N+11 # +1 AG "N+11N~
- A + 2G AzA + 2G Az Az
# +1G(3A + 2G)a NA + 2G N+11 Az (B.24)
2377 167p -
,
-
- \
e
--
_ . .
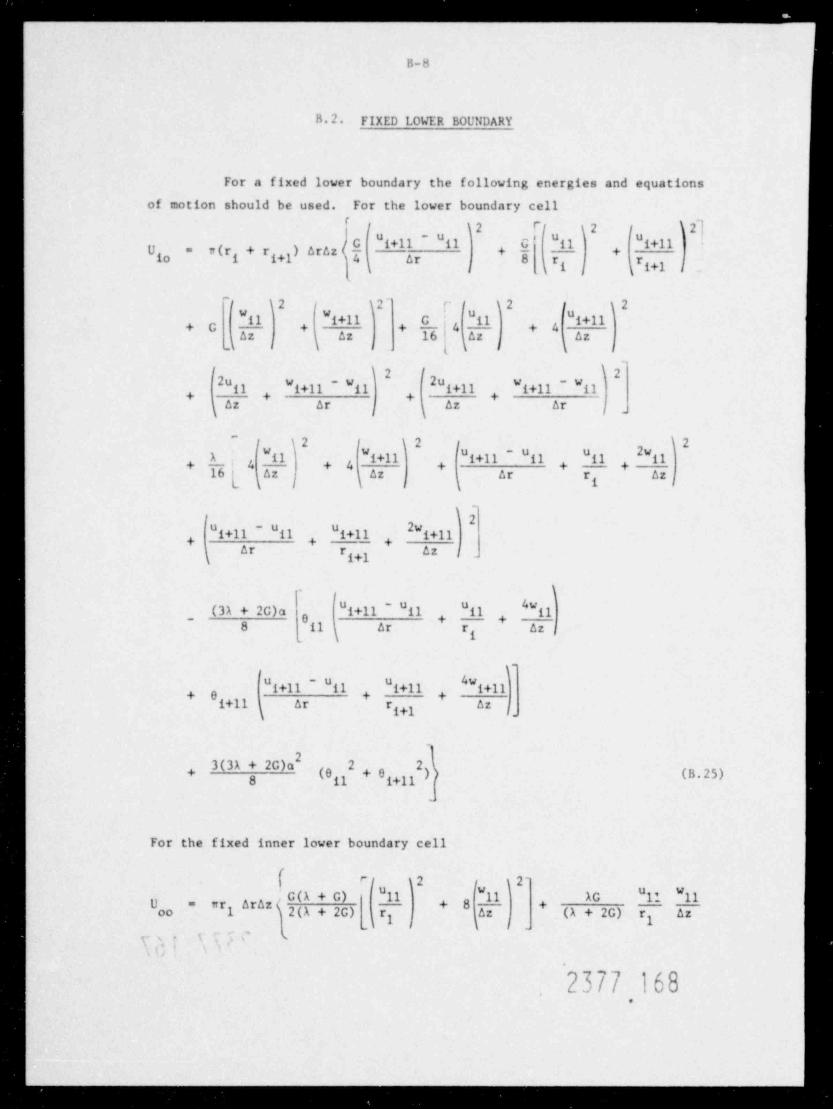
_.
B-8
B 2. FIXED LOWER BOUNDARY
For a fixed lower boundary the following energies and equationsof motion should be used. For the lower boundary cell
1 21F( )2 I "il j2 ["i+11g +11 ~ N1 ,E !
w(ri + r +1) ArAzU ,=
10 i 4 Ar 8 r rg g j
~
1 )2 i+l1 ) 2 'f )2 1
I+l1 ) 21 ''
G II+ G + + '4 + 4*
_( } k 1 ( l ( 1
"il "i+11 ~ "il "i+11 "i+11 ~ "il, , . ,
( AzAr Az Arj j ,
2wA "il "i+11 "i+11 ~ "il "il g1, 4 , 4 . .16 i Az Az Ar r Az j
2w ,yy \2f
"i+11 ~ "il "i+11 g, , .Ar r Az j( g
1 \~ (3A + 2G)a "i+11 ~ "il "il 4"11+ +
8 il Ar r Az j
1+11 ~ "il "i+11 "i+110 +11 Ar
+ , ,i Azr ,1 {g
( + "+ (0 + 0 +11 ) (B.25)8 11 i
-
For the fixed inner lower boundary cell
( P( }2 23~[ II AC 11 11+U = wr Araz + 8 +
oo 1 2(A + 2G) r Az (A + 2G) r Azy y
, ;...
1:
2377 168,

_ _ _ _ _ _ _ ... ___ _
B-9
C(3A + 2G)a "11 11 ,E 11 A 11 "11g . , ,,
2(A + 2G) 11 r 42 4 ar 2(A + 2G) ry y Az j
,
.
(3A + 2C) 0+#1 Gj3A + 2G) ,20 2) (B.26)0 ,
, 2(A + 2G) 11 r A + 2G 11y.
For the fixed outer lower boundary cell
'
~7"N+11 322-
7
G(A + G) "++ 8,
N+10 N+1 2(A + 2G) *r +1 j ( j _N
AG "N+11 "N+11 G(3A +2G)a . "N+11 "N+11+ A + 2G * * *
r +1 ( N+1 jN
,
G(3A + 2G) ,20 +11 ) (B.27),A + 2G N
.
The equations of motion for the fixed lower boundary node are
given by Equation (2,30) where here and In the following 5 , Dgy, Ey gg
andII assume the new definitions:g
iy 8 Ar or- ~(A + 2G) "il _i + # +11 + # +1 1
##- (A + 20) "i+11 - "il 1B =
16 r rg
G "il i+ i+1 G i+11 ~ il i+ i+1- 2 az Az - 5 ar Azj
2u u +11 i+11x ii i + r ,y 3 iyW rig
. . _
- 5 az r 16 r rr ,y ggi
g_
1 + # +1"f1 + "i+11 #1
_Az Ar,
iI e
- (31 + 2G)a il + e +11_
11ei
(ri + r +1) (B.28)i16 Ar r
g
2377 169
- _ _ _ _ _ . . _ . .

. . . . . _ . . _ _ _ . . . . - . _ _ . - . __
B-lO
I"il "i-11h 1-1 + #1#3 (A + 2G) r ,7 + ri., - (A + 2G) "il iil 8 ar ; Ar 16 r r( i i i
1-1 + #1 C "il i-11 1-1 + #1G "11 # -W #
_ 2 az Az - 5 ar azN l
~
2u1-1 + r1 y gyA_ "il# u _yy u _yyg i._ 8 az r 16 r
-
r _1 yrg g.
1-11 + 11 1-1 + #1+ 2Az ar
}.
0 0(3A + 2G)a il + 01-11 ,J(ri-1 + r ) (B.29)+
16 ar r i;
fu ,77 - u u Ig + r ,y yy , _ (A + 2G) "ilr
g gy iy i + r +1rgi
il 2 az Az - i ar r Az( ij
f \G_ "il + "i+11 "i+11 - "il g + r ,yr
g, .8 az ar( j ar
,QA + 2G)a 1 + r ,y#g, g
4 il az (B.30)
1-1 + #1 A gyp (A + 2G) "il# u r _y + ri- u _yy i1
ug g,, +il 2 az az - i ar r az
( ij
_ G "1-11 + "il "il - "i-11 1-1 + #1#
8 az Ar or(
1-1 + #1(3A + 2G)a' #
0 (B.31)4 11 z
2377 170
.; ;.
--
_ _ _ . _ _ _ _ _ . . . . . . _ _ , . . . . . . . . .

r
-.
B-11
The equations of motion for the fixed outer lower boundary node
are:
u +11(E+0E "N+11( } ~ "N+11( ~0 }' "
N
-.~
-12.,
(At) J +11 + N+11 + N+11 + H+11+ NEor +1
-N
N+11( +At) 2w +11(*) ~ "N+11( ~0 } +W =
N pr +1N
1
2_
(0*) ( ''6 +11 N+11 N+11 N+11N+P# ~U
N+1 _
where now
- 4G(A + C) "N+11 N+1, 2(A + 2G) Az
AG "N+11"
N+11 ~ A + 2G Az Az
, G(3A + 2G)a +0 +11 Az (B*33)NA + 2G
g For the fixed inner lower boundary node the equations of motion
P are:.
~
2uyy(t)-uyy(t-At) +ty(t+At) A y+Byy yy + Kyy+J=u1
'
_
-
# (#0+#13g 1 3A p+
8 r 16(A + 2G) r~
t
.
2377 171 ,
t, _ _ - - - - -
. - -
. .
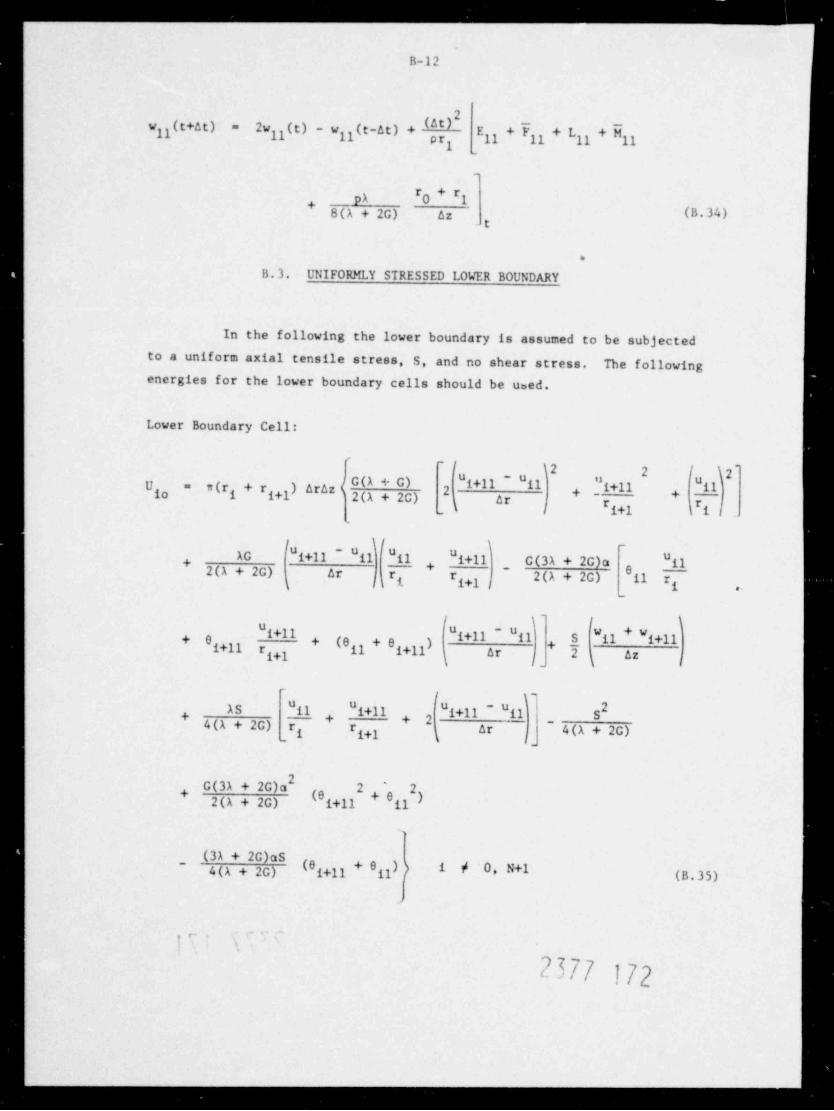
.. . - - - - - _ _
B-12
0*)2"11(t+4t) 2w IE) ~ "11(t-at) +=
11 E11 + F11 + L11 + M11pry
_
_
PA 0+#1#+
8(A + 2G) az (B 34)t
.
B.3. UNIFORMLY STRESSED LOWER BOUNDARY
In the following the lower boundary is assumed to be subjected
to a uniform axial tensile stress, S, and no shear stress. The followingenergies for the lower boundary cells should be used.
Lower Boundary Cell:
~f 12 2 l 2'( + O) "i+11 ~ "ilw(ri + r +1) Araz 2 + -"i+11 il
uU =io +i 2(A + 2G) - ( ar
r +1 ii/r/ i
.
if \~
f"i+11 -u uu +11AG
2(A + 2G) ar r r~ G(3A + 2G)a "il
gy gy i+ + 02(A + 2G) 11 rgj f ,
{ \ ^ f )I+11 i+11 ~ il S 11 + i+11
0 +11+ + (0 +
r +1 il + e +11)i i ar 2j ( azi ;
~
f y'AS 11 "i+11 "i+11 ~ "il S
2+ , . ,
~ 4(A + 2G)4(A + 2G) r r ar'
g gy (
2G(3A + 2G)a
(0 +112 + 'O2
i iy )2(A + 2G)
~ (31 + 2G)as(0g477 + Oi1) p i p 0, N+14(A + 2G) (B.35)
>
?
'
9,,<$/7 172
-
_ _ _ _ .
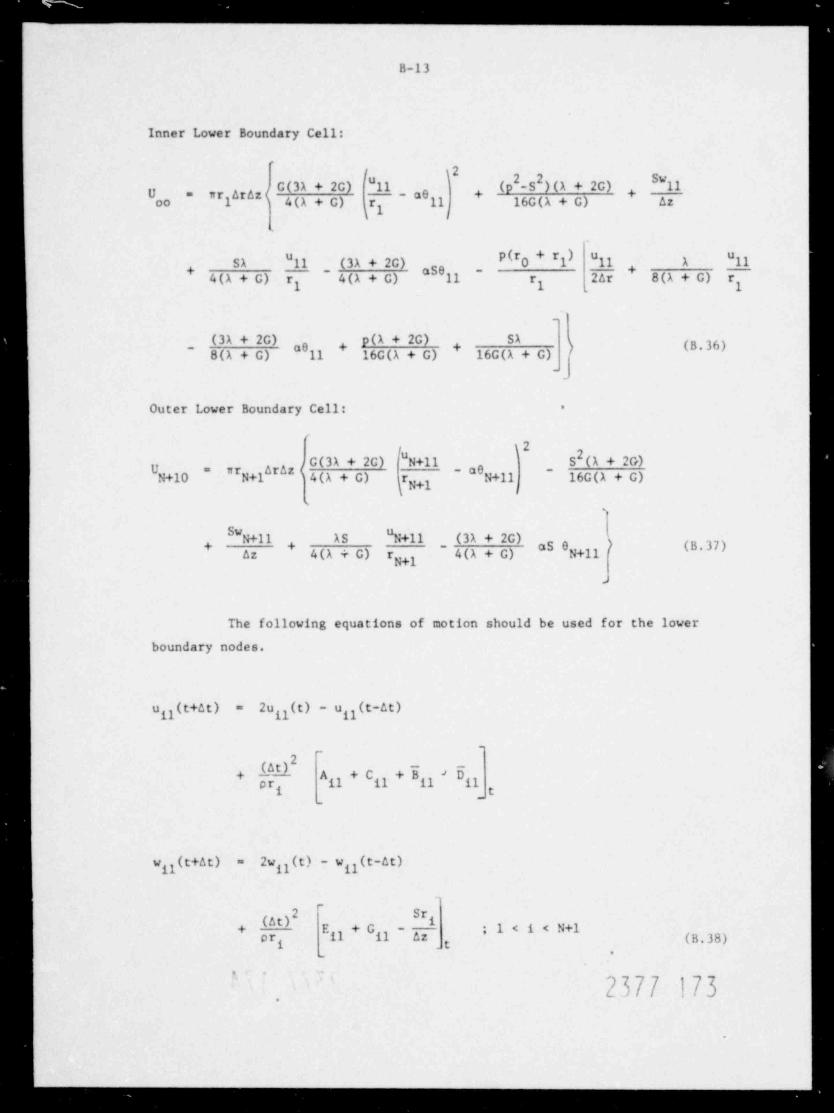
. . _ . . . . . . _ _
B-13
Inner Lower Boundary Cell:
"11 (p -S )(A + 2G) "110#0*<G(3A+2G) - " 11 16G(A + G) Az
+" ##oo 1 4(A + C) ry
P(r+
- 4(A + G) 11 -0+#1 "11 A "11SA "11 (3A + 2G)
4(A + G) r r 2Ar 8(A + G) ry y
(3A + 2G) p(A + 2G) SA,g , , ) (B.36)_ 8(A + G) 11 16C(A + G) 16G(A + G)-
-
Outer Lower Boundary Cell: *
,
G(3A + 2G) "N+110 +11
- S ( A + 2G), -
N 16G(A + C)N+10 N+1 4(A + G) r +1N
"N+11 AS "N+11 , (3A + 2G), oS 0 ) (B.37)Az 4(A + G) r +1N
-
The following equations of clotion should be used for the lower
boundary nodes,
2u 1(E) - "H(t-At)gy(t+At) =u
0+ Ag+Cg+Bg d D
i t_
2wgy(t) - wg(t-At)g(t+At) =w
_
(6t)* Eiy + Giy -i ;1<i<M
pr z (B.38)1 _
-
'
2377 !?3.
.
~~
_ . - . . . . .
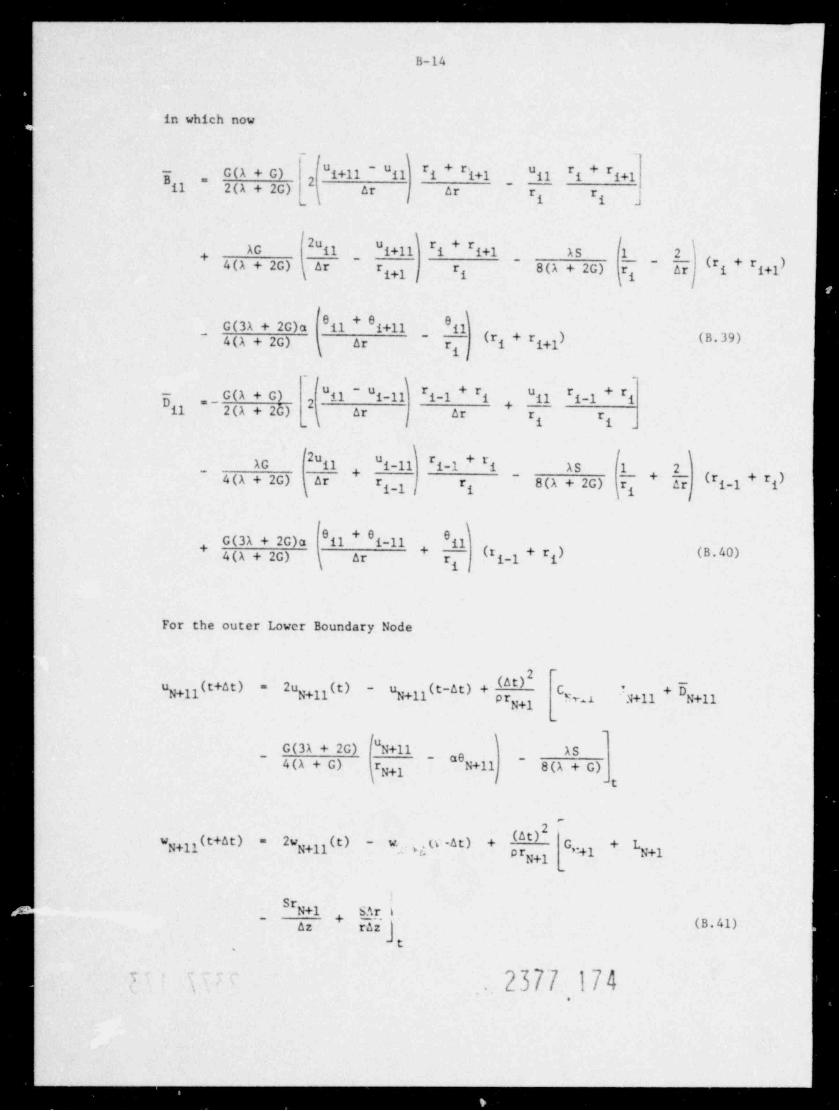
_
B-14
in which now
g G(A + G) "i+11 ~ "il 1 #'i+1_
il 1 + # +1# " #
i,
il 2(A + 2G) or ar r rj g f
Ir I2ui g + r ,y 3g l 2u ,71AG gg g
(#4(A + 2G) or r r 8(A + 2G) r Ar 1 # +11g g gY r
C(3A + 2G)a 11 + 0 ,71 O I0g gy
(#1 + # +14(A + 2G) Ar r*
i
'f \g ,,G(A + G) il ~ "i-11 1-1 + #1 "il
# # 1-1 + #12 ,il 2(A + 2C) ar or r r
f
AG "il "i-ll 1-1 + *i AS 1 2#
+ +~ 4(A + 2G) ar r 8(A + 2G) r 5 ( i-1 + i}r _y j g g
G(3A + 2C)a il + O _yy Og II. (r1-1 + r ) (B.40)4(A + 2G) ( gar r i
For the outer Lower Boundary Node
u +11( "N+11( } ~ "N+11( - } + p(at) N+11 + -"
Nr +1 %1 N+11N
~
,
~ G(3A + 2G) "N+11 AS
4(A + G) r N+11 ~ 8(A + G)NMk ) -t
~
2
w +11(t+at) 2w +11(') ~ "'. *s "'0*} + C +=N N . pr 91 N+1
1:-- + -
(B.41)
2377 174,
,
-,
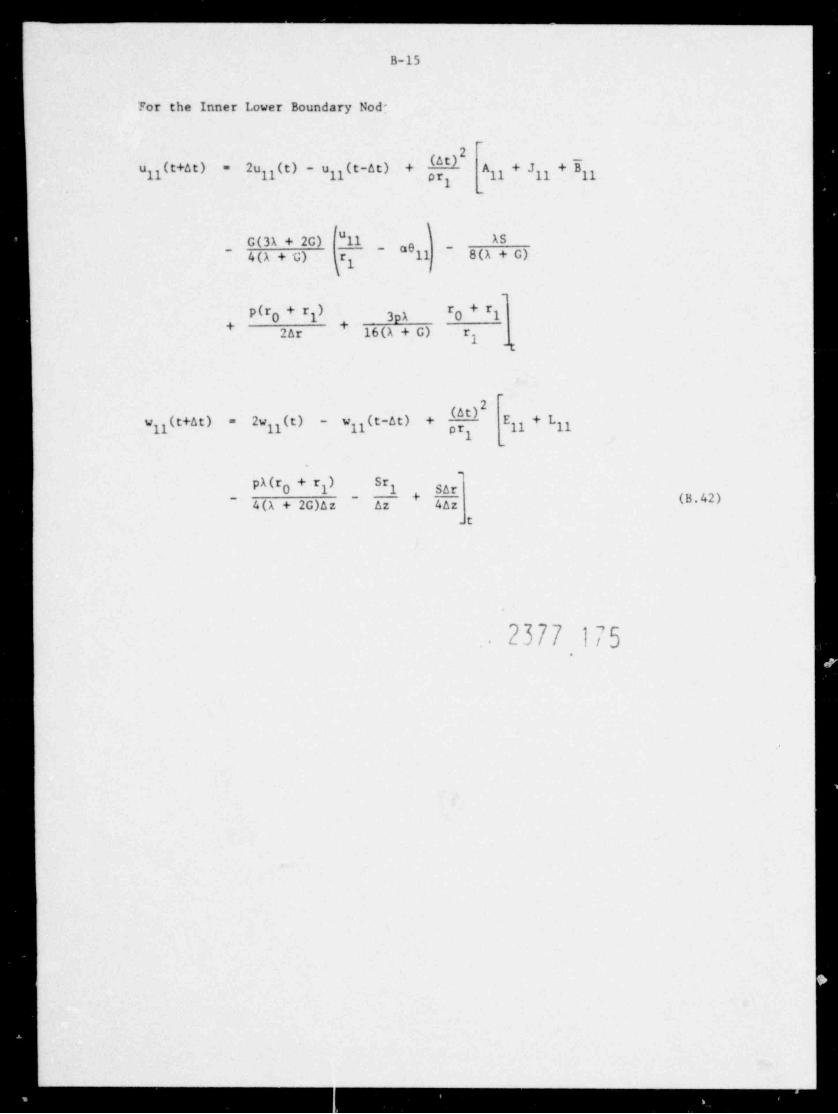
B-15.
For the Inner Lower Boundary Nod:
~
2 -
0yy(t+At) 2uyy(t) - uyy(t-At) + A y+J y+Bgu =
.
- C(3A + 2G) "11- bl ~ @+O
AS'
4(A + G) r y,
_
P(r0+fl 3pA 0 1# #
+ +2Ar 16(A + G) r y
t
~
2
il('~0')2wyy(t) - w + Eyy + Lyyg(t+At) =vr
1-
.
pA(r0 + 'l 1 SAr#
(B.42)~ 4(A + 2G)Az - Az 4Az_t
2377 175.
.
.,
D
.
S Pg

_ - - - - - - _ _ _ _ _ .
APPENDIX C
CilARACTERIZATION OF EXPERIMENTAL MATERIALS
2377 176
--
_.

, _ _ _ _ , . . . _ -- -
C-1
APPENDIX C
CHARACTERIZATION OF EXPERIMENTAL MATERIALS
This section summarizes the compositions, heat treatments, and
mechanical property data for the A508-2 steel (lot BWB and BWD) and the
submerged arc weldment (BKS) whose crack arrest properties are examined inSection 3, as well as the composition and properties of the common test
plate of A533B of the cooperative test program discussed in Section 6.
C.1. Characterization of A508-2 Steel(Lot BWB and BWD)
General pieces of two lots of A508 steel were received. Two of
there were used to make compact specimens for K determination. Composition,
heat treatment, yield strength, Charpy impact energy, and fracture toughness.
are given in Tables C-1, C-2, and C-3. Both pieces are within chemical
specifications although there is a minor compositional dif ference with
respect to vanadium. In addition, the evidence on ductile / brittle
transition temperature is ambiguous. Heat BWD has a lower transition
temperature based on Charpy energy but appears to also have a lower K value
at NDT (see Figure C.1 and C.2). All other properties are virtually
identical.
C.2. Characterization of SubmergedArc Weldment BKS
Inf ormation on the welding parameters, chemical analyses, andmechanical properties of weldment BKS are given in Tables C.4 and C.5 and
,
in Figures C.3'to'C.7 taken from Van der Sluys, et al (1976).
C.3. Cog erative Test Program CommonTest Plate of A533B Steel
The chemical analysis of the A333B steel, tensile propertles, and
NDT data are given in Tables C.6 to C.8. Charpy data are sunmarized in
Figures C.8 and C.9.
2377 177
--
- . . __
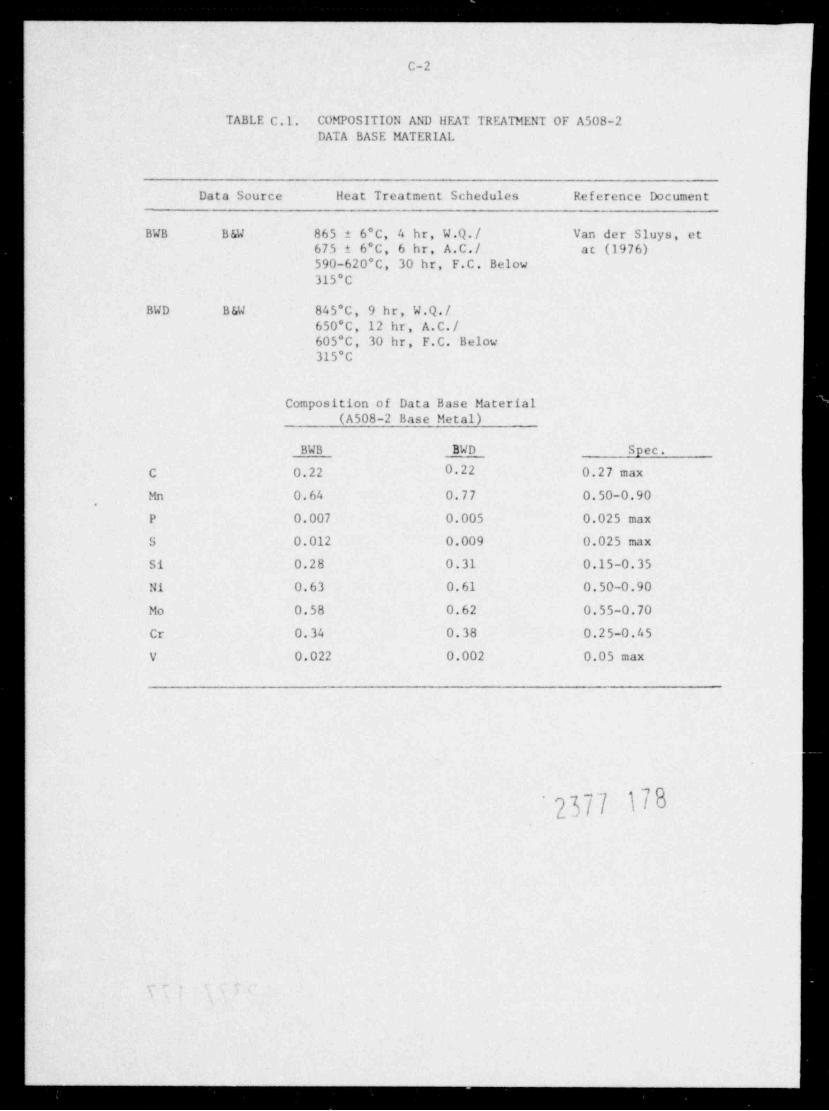
- _ , _ . . _ _ . -
C-2
TABLE C. l . COMPOSITION AND HEAT TREATMENT OF A508-2DATA BASE MATERIAL
Data Source Heat Treatment Schedules Ref erence Document
BWB B &W 865 ! 6*C, 4 hr, W.Q./ Van der Sluys, et675 6*C, 6 hr, A.C./ at (1976)590-620*C, 30 hr, F.C. Below315*C
BWD B SW 845'C, 9 hr, W.Q./650*C, 12 hr, A.C./605*C, 30 hr, F.C. Below315'C
Composition of Data Base Material
(A508-2 Base Metal)
BWB BWD Spec.
C 0.22 0.22 0.27 max
Mn 0.64 0.77 0.50-0.90.
P 0.007 0.005 0.025 max
S 0.012 0.009 0.025 max
Si 0.28 0.31 0.15-0.35Ni 0.63 0.61 0.50-0.90
Mo 0.58 0.62 0.55-0.70
Cr 0.34 0.38 0.25-0.45
V 0.022 0.002 0.05 max
2377 178
.
---
- - - - - -
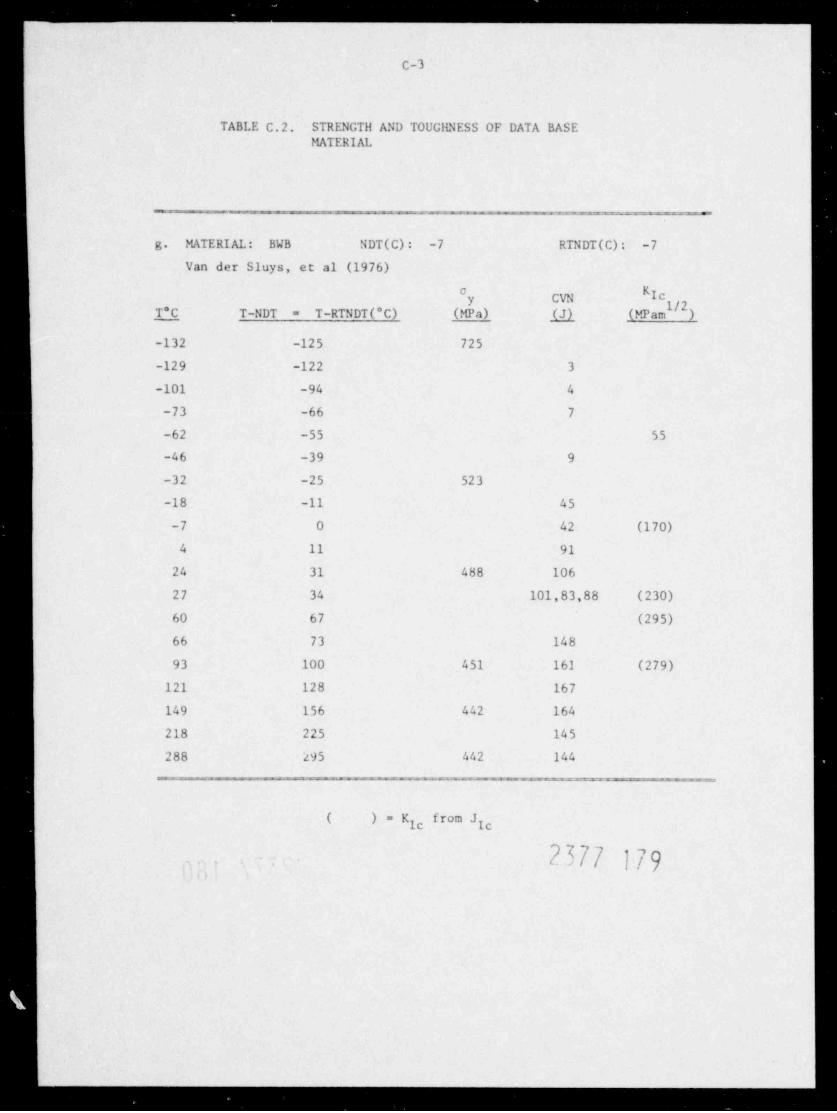
~
.
. _ . . _ . .
C-3
TABLE C.2. STRENGTH AND TOUGHNESS OF DATA BASEMATERIAL
g. MATERIAL: BWB NDT(C): -7 RTNDT(C): -7
Van der Sluys, et al (1976)
Ey CVN lc
T*C T-NDT T-RTNDT(*C) (MPa) (J) (MPam )=
-132 -125 725
-129 -122 3
-101 -94 4
-73 -66 7
-62 -55 55
-46 -39 9
-32 -25 523
-18 -11 45
-7 0 42 (170)4 11 91
24 31 488 106
27 34 101,83,88 (230)60 67 (295)66 73 148
93 100 451 161 (279)121 128 167
149 156 442 164
218 225 145
288 295 442 144 .
( )=K from Jg 7
2377 179.
\
.-
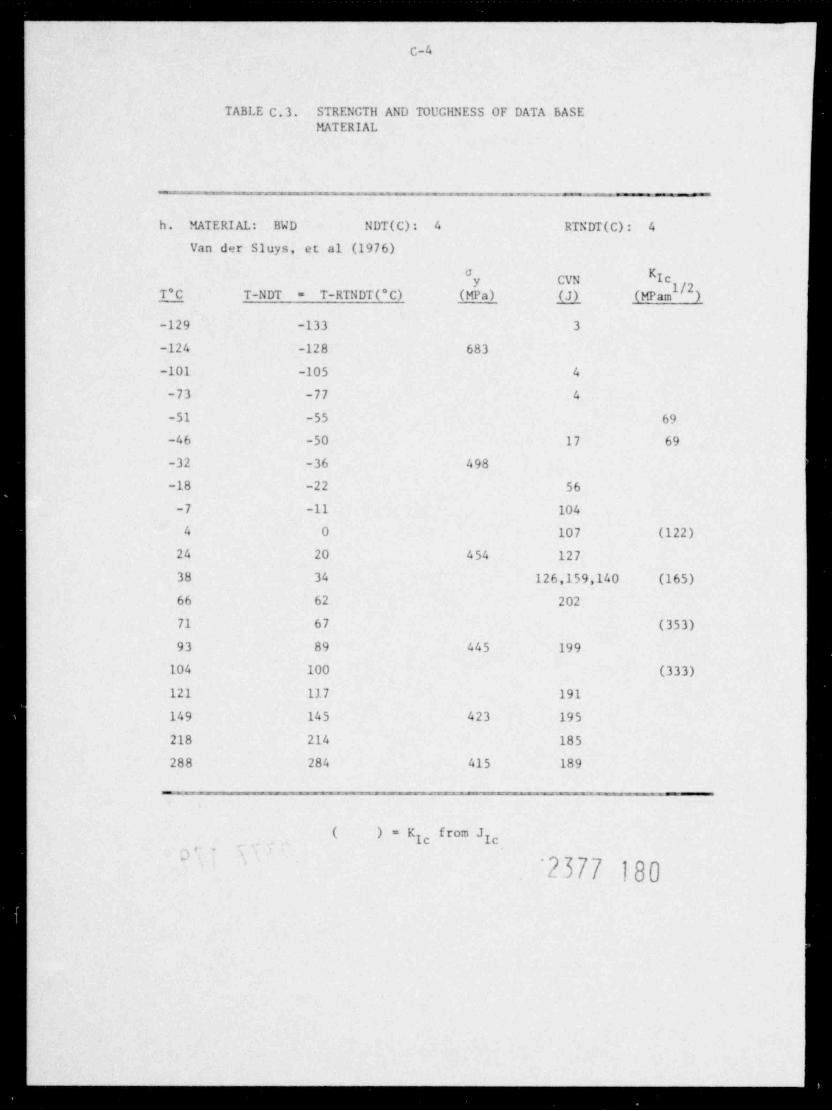
_......__._________._____.__ _ _ _ .
C-4
TABLE C.3. STRENGTil AND TOUCilNESS OF DATA BASEMATERIAL
-.__-__ - - __ ___ _ _ _
h. MATERIAL: BWD NDT(C): 4 RTNDT(C) : 4Van der Sluys, et al (1976)
Ey CVN Ic
T*C T-NDT T-RTNDT(*C) (MPa) (J) (MPam )=
-129 -133 3
-124 -128 683
-101 -105 4
-73 -77 4
-51 -55 69
-46 -50 17 69
-32 -36 498
-18 -22 56
-7 -11 104
4 0 107 (122)24 20 454 127
38 34 126,159,140 (165)66 62 202
71 67 (353)93 89 445 199
104 100 (333)
121 117 191
149 145 423 195
218 214 185
288 284 415 189
( )=K f# *JIc Ic
'\'' ',
2377 180~
_ _ _ . _ . . . . . . .

. _ _ .. . . _ _
__
C-5
800,
_
600 -
E~
v oao _
>.b -
200 -
'
Lot BWD_
I0 i i i-300 -200 -10 0 0 100 200 300 400
T-RTNDT,'C
1500 o
_
q 100 -
E 88 -
50 -
)
_
0 li i
-300 -200 -100 O 100 200 300 400T- RTN DT, "C
300 xX
" 200 -
E
E3 iOO -
x
0 I l. i i
- 300 - 200 -10 0 0 100 200 300 400T- R T N DT,'C
2377 181
FIGURE C.I. STRENGTH AND TOUGHNESS OF DATA BASEMATERIALS
GC'
-----
. . . . _ _ _ . .
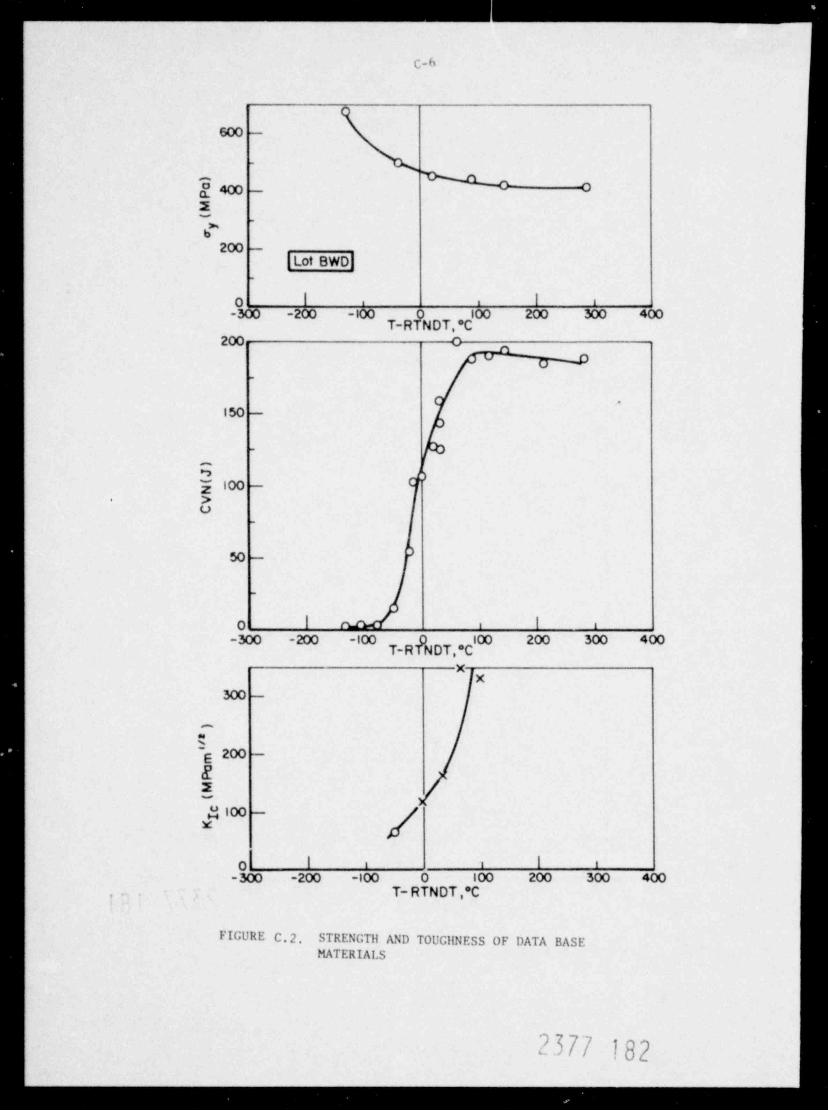
. . . . . . . . . . _ . _ _ _
C6
600 -
_
'B 400 - oa2-
_
*b
200 -
Lot BWD
O I l ie i
-300 -200 -10 0 0 100 200 300 400T-RTN DT, *C
200 0
W_
.
150 -
_
)E 100 -
>.
U_
50 -
-
0 I Ie
-300 -200 -tT-RfNDT,*C *
XX
300 -
.-.
O~ 200 -
EE2-
M100 -
g/x
0 I i ' '-300 -200 -100 0 100 200 300 400
T- RTN DT ,'C,,
FIGURE C.2. STRENGTH AND TOUGilNESS OF DATA BASEMATERIALS
2377 182._ .. .. .
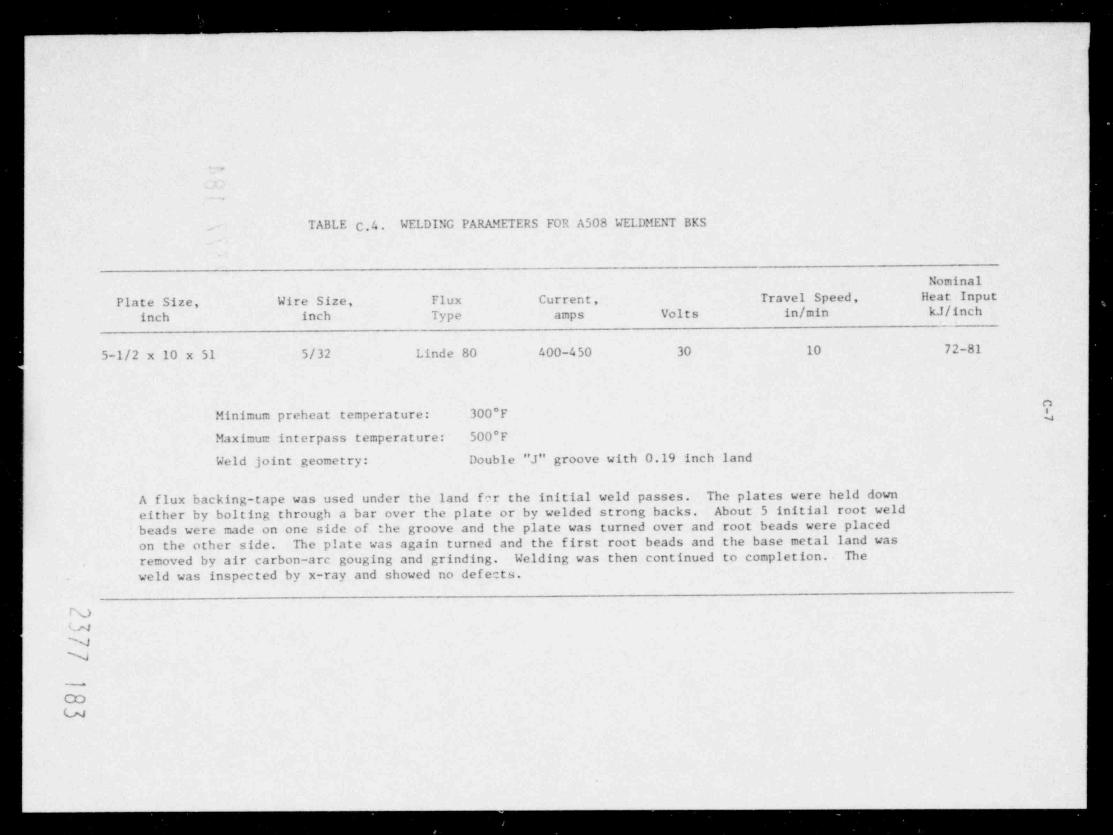
'
.
- TABLE C.4. WELDING PARAMETERS FOR A508 WELDMENT BKS
NominalPlate Size, Wire Size, Flux Current, Travel Speed, Heat Input
inch inch Type amps Volts in/ min kJ/ inch
5-1/2 x 10 x 51 5/32 Linde 80 400-450 30 10 72-81
Minimum preheat temperature: 300*F [Maximum interpass temperature: 500 F
Weld joint geometry: Double "J" groove with 0.19 inch land
A flux backing-tape was used under the land fer the initial weld passes. The plates were held downeither by bolting through a bar over the plate or by welded strong backs. About 5 initial root weldbeads were made on one side of the groove and the plate was turned over and root beads were placedon the other side. The plate was again turned and the first root beads and the base metal land wasremoved by air carbon-arc gouging and grinding. Welding was then continued to completion. Theweld was inspected by x-ray and showed no defects.
rxyv1
NJN
-
V
.. . _ _
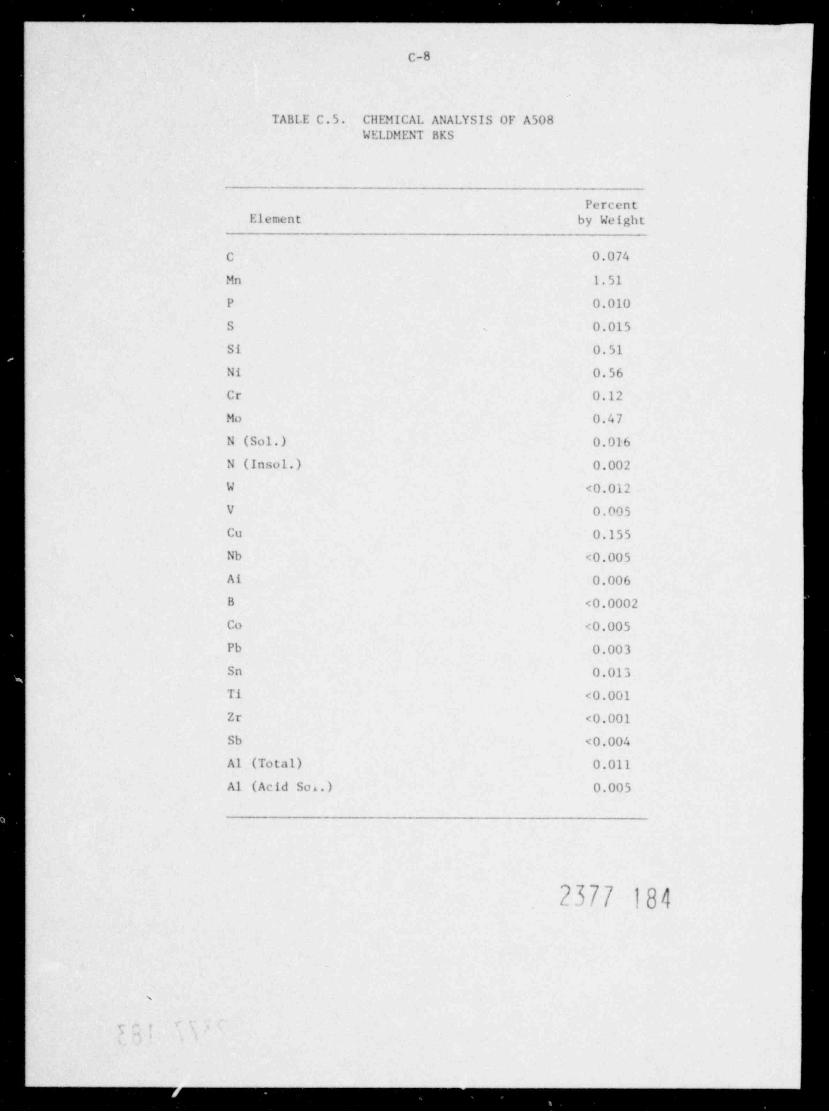
. . . _ _ _ _ _ _ _ _ _ _ _
C-8
TABLE C.S. CllEMICAL ANALYSIS OF A508WELDMENT BKS
PercentElement by Weight
C 0.074
Mn 1.51
P 0.010
S 0.015s
Si 0.51
Ni 0.56
Cr 0.12
Mo 0.47
N (Sol.) 0.016
N (Insol.) 0.002W <0.012
V 0.005Cu 0.155
Nb <0.005
Ai 0.006
B <0.0002
Co <0.005
Pb 0.003
Sn 0.013
Ti <0.001
Zr <0.001
Sb <0.004
A1 (Total) 0.011
A1 (Acid Soi.) 0.005
2377 184
,
m
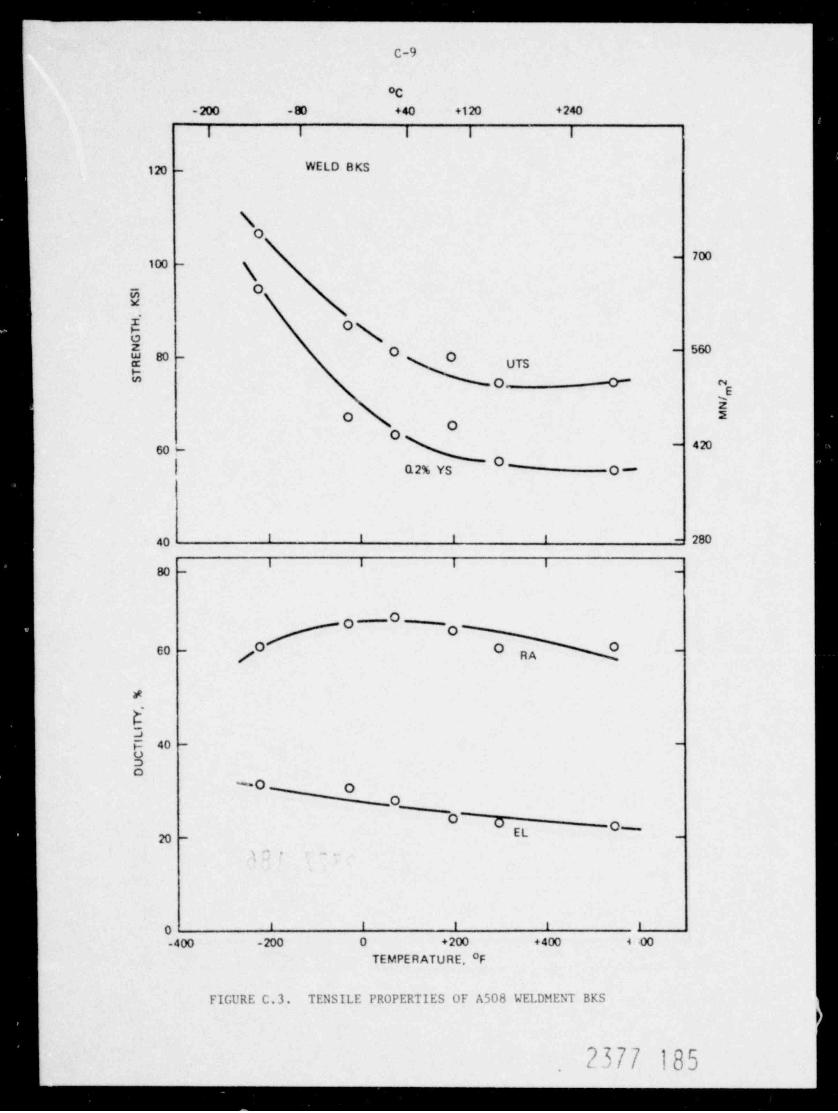
, . . . _ . . . _
_ _ _ _ _
C-9
OC
-200 -80 +40 +120 +240
| I I i
120 - WELD BKS
\O
7=-
sw _
G Ow
$ N5m _ O - 52
Og UTS* O- P c*
Es
OO
42060 w
| Q2% YS'
O-
1 I I I - 28040
' ' '80 - -
O O ______
f-0 060 -
7 RA~
#
D.~3
F 40 - -
So
~~~ O
O_'O ' o - O-EL20 -
g.. ..
' ' ' ' '0400 -200 0 +200 +400 4 00
TEMPERATURE, OF
FIGURE C.3. TENSILE PROPERTIES OF A508 WELDMENT BKS
2377 185-
_ _ _ .

. .. . . . . . . . . . - . . - . . - . . . - _
C-10
S3700r
Q ? 8 g gI I I I I
O8 _
7
a.-
.
O
8 -- $
+y
0m
Hu. - E 5O
+ go
d"
6 - O g 3+ z co
> 0C <u O E o'- mo +
. o
Uo - 5
N Dwo- ag -- 8s u
+-
7W 20 5
@ >-
00 @ k@
O n "
D - o
Jr Jg -
O @ +-' wse
O- be
O
B.- N > 9. 7 18 6- < a g
9 'w3
C
y1 I I I
g g s a s e o-
01-1d *ADU3N3 IOVdWI
m .
)
_ . . . _ . . .
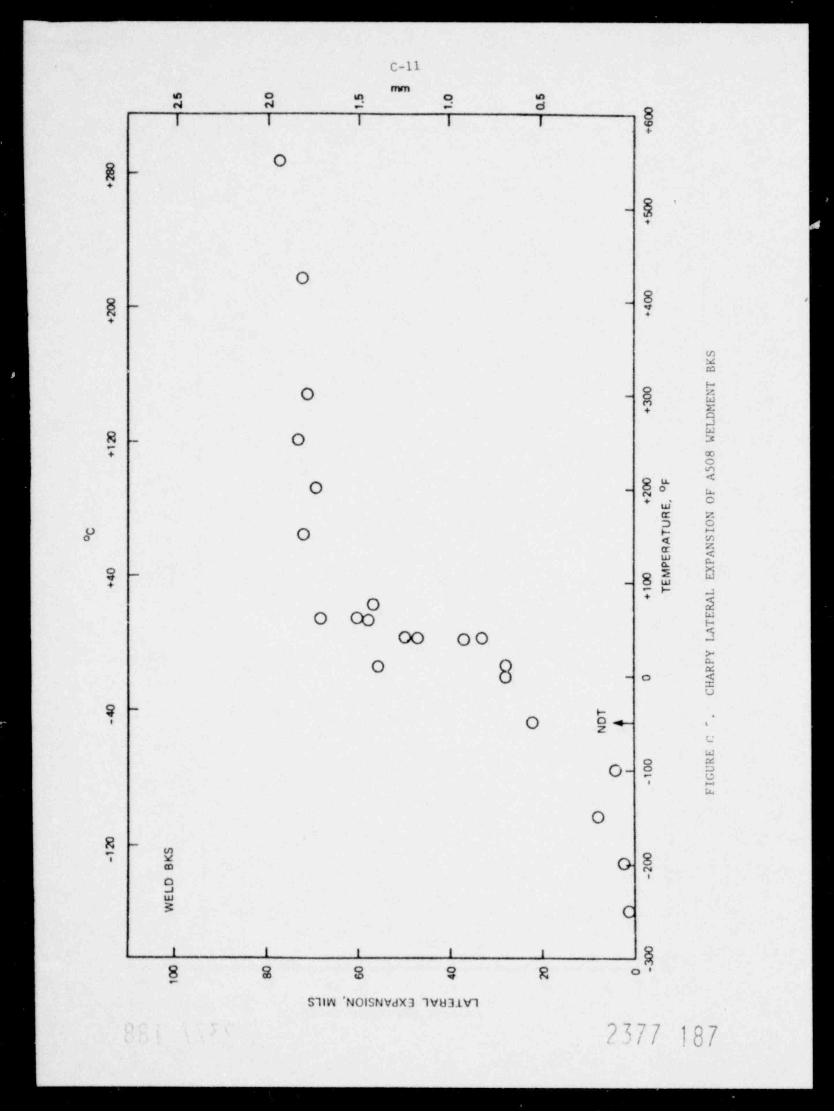
_ _ _ _ . . _ _ _ _---
C-ll
"e o m o ee4 e4 : a 6
8I I I I I e.
og _
.
- @'
.
O
g _- @
-
.
=m
HO -
@ $+ E
em
$ - O 3+ 00
m<
O - @P w. c
e Z3 O
e O y ;ze
e 2
?.- gs b
- -g ,*
O 2O CD s
00 OO 5:-
O O kO - o 5
G
h.~ F .
O g+ ,
uW
O MO- 9 8
- c
O
6 ~
ms o a'
'9m5 C
gi i i i
g a s e a o-
S11W 'NOISNVdXJ 7VU31V7
2377 187'
--
_ _ _ .
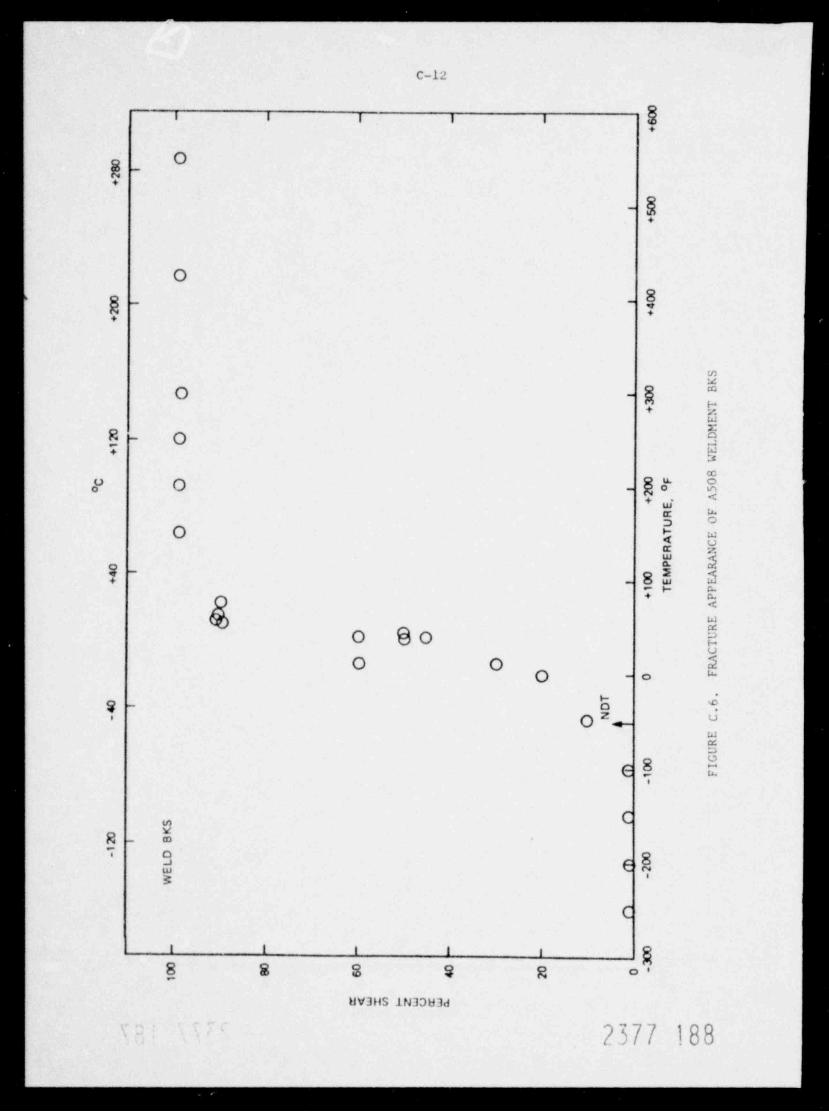
- --. ..
c-12
$.I I I
og _
.
- a.
O-
g _ - @+
.
=0 - $
*
u+mZ
5 - O SLj+
m? O - $.t ?
-E N3 O
O - m5 NEO - 8' d7 -
T- t<
=O @O E
U
O O 2O - o "
S - 5 kOz "'
+
d8
e B, t
Cmva _ m
7 9 8e- ~m 's
C
i i , , , gg a e 3 a e-
UV3HS IN3383d
'2377 188
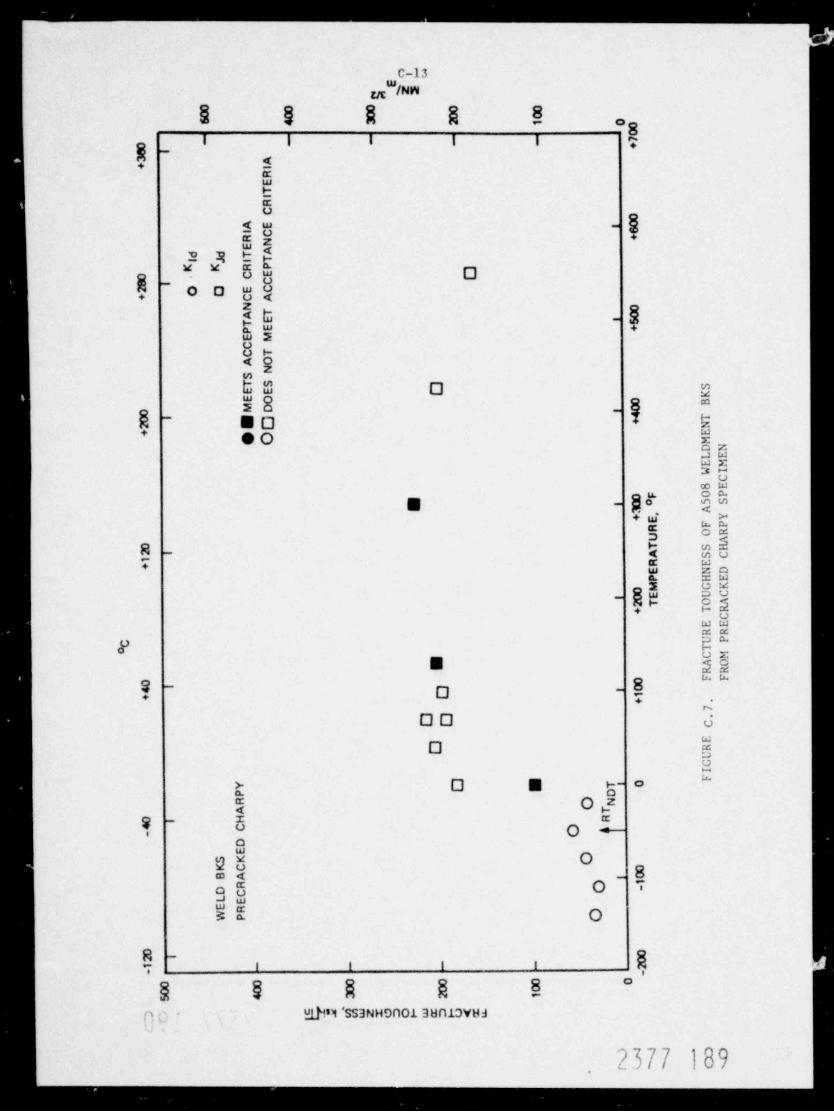
-
--
otu,g
0 0n
0 00 0 0 06 4 2 1 O 0
0- - - - - 7
'
0 +6 I
3 A+ I
RETIRC
0E 0'
C 6+N
Ay Td
Ki K PO0 ' E
C8 i
2 O O C+ A
0T 0E ' 5p E +
MTONS O SE KO 0 BD 00 4 T
'
0 i
O + N2E+ O MD NLEE MWI
C8 E
= I0 F 0 P0O 5 S3 A, Y+ E F PR O RU \
2 iT S E0A S C
1 R E+ E N DP H EM G K0 U C0 EI
2T O A+ T R
CE ER RU PC To C M
E A OR R
0 F F0
O ' 041+ + .
7
aO .
C
EO R
UGI
FY O E TI 0P D
_R ONA TH R0 i
C O4-
D _ES K O
_K C 0B A 1 0
R o 1
-.D C .
_L EE R _
WP O.
_
__..
.
0 0g2 0- - 21
- -0 0 0 0
M0 0 03 2 1
:. ywE w"3uIu.E
] ' :
)ONN .D4J
.
.h C-
_
_

.. ______
C-14
C.6. CllEMICAL ANALYSIS OF COOP. A533B STEEL
A533B SpecificationBasic Requirement Residuals * Actual
C (max) 0.25 -- 0.22
Mn 1.06-1.62 -- 1.56
P (max) 0.035 0.015 0.011
S (max) 0.040 0.018 0.011
Si 0.13-0.32 -- 0.26
Mo 0.41-0.64 -- 0.54Ni 0.37-0.73 -- 0.60
Cu (max) -- 0.12 0.111
V (max) -- 0.06 0.009Sn -- -- 0.011Cr -- -- 0.099A1 -- -- 0.024Nb -- -- 0.009Zr -- -- 0.003Ti -- -- 0.002B -- -- 0.0003Co -- -- 0.019W -- -- 0.003
*
Nuclear Reactor Beltline Considerations (paragraph X2 of A533B).
C.7. TENSILE PROPERTIES OF COOP. A533B STEEL
Test Temperature Yield Strength Tensile Strength % Reduction(*C) MPa (ksi) MPa (ksi) Jn Area
23 473 (68.6) 628 (91.2) 55.1
-18 486 (70.5) 646 (93.8) 54.3
-40 497 (72.2) 663 (96.2) 56.9
2377 1900
- - - _ _ _ _ _ _ _ _ . . _ _ . _ . _ . . . . ..
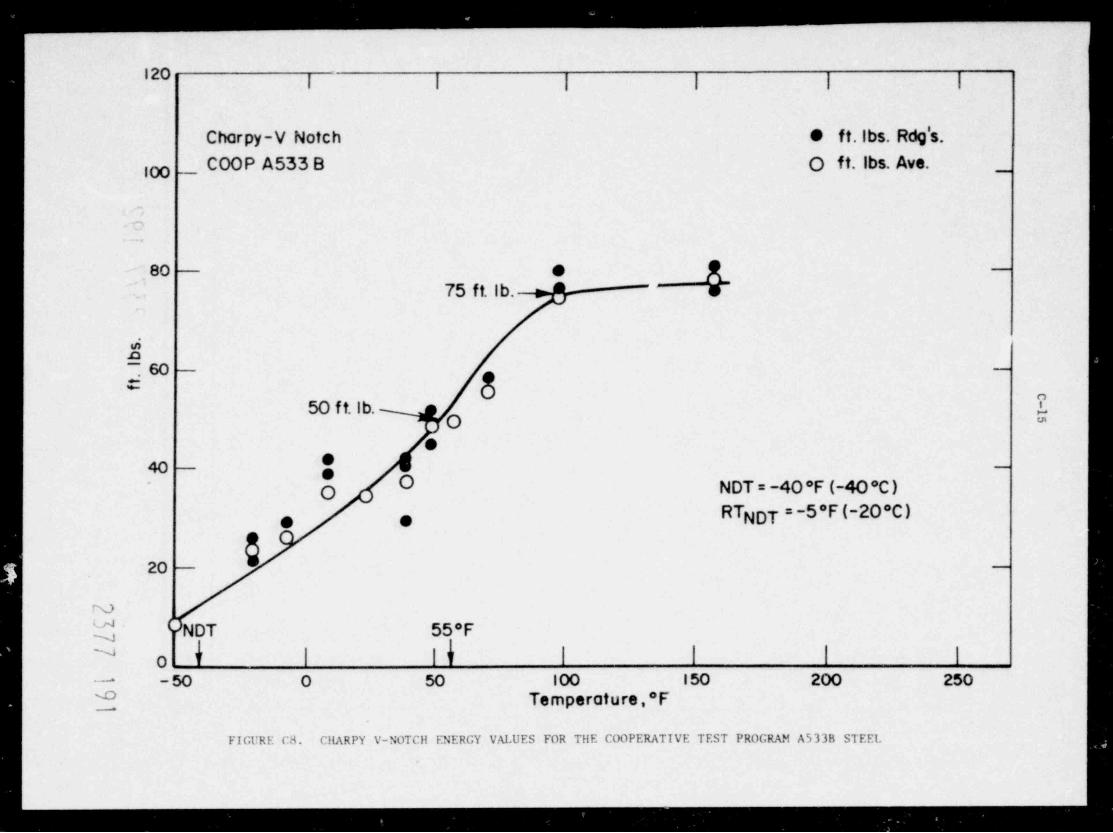
-
-
'*I I I I I |
Charpy-V Notch 9 f t. Ibs. Rdg's.
COOP A533 8 O f t. Ibs. Ave.100
_
-,.
w
{80 e75 f t. Ib. =a ,
$so _
b50 f t. Ib. "L,
O =
e$ -@
Oo NDT = -40 *F (-40 *C )
RTNDT = -5*F (-20*C), ,
20 -
N
'd (NDT 55*F
o v 1 9 I I I~
-50 0 50 100 150 200 250~
$ Temperature , *F
FIGURE C8. CHARPY V-NOTCH ENERGY VALUES FOR THE COOPERATIVE TEST PROGRAM A533B STEEL
. . . . . . _ -
-

,h
-
0| I 5
2.
s'g e
.
d vRAn no oiis s Mn n Aaa R
Gp p 0 Ox x I 0 REE . 2 P.
l l Ta a S
Eii
Tr r .
e e Et t
a a VI
LL TARA#A 0 PE
| 5 OO1
CF* R
, OFe
r Su Et Ua Lr Ae Vp N0
| 0m OI
1 e ST N
_ A. P. X.. E_ LA_ A_ R_ E
T
_ AL
_ j 0 H5 C
_ OTOLNE
_- E
F VTS*A Y
04' PBR3
h 2 A3
_ l 5c lCABt
o
_j N 3 0 .
3 9
V5 "5 C
- A 3 E-
0 RypP A U
G0raO I
Fh O
_ CC
_ - 05
2 0 8 s 4 2 O-1 1 0 o. 0 00 0 0 0 0 0
_ 85s.ioERY a_tBJO.
3Nw mru_ ~
*
_
_
__
_
_

_ _ _ . - _ . _ _ __ _ _ _ _
APPENDIX D
TABULATION OF CRACK ARREST MEASUREMENTSFOR DATA BASE MATERIALS OF SECTION 3
2377 193
/
- - - - - - - - . . -

.'
...__ _ _ _ _
D-1
/
APPENDIX D
TABULATION OF CRACK ARREST MEASUREMENTSFOR DATA BASE MATERI ALS OF SECTION 3
The following tables give the detailed experimental results.Symbols are defined in Appendix G.
2377 194
.
F
A.
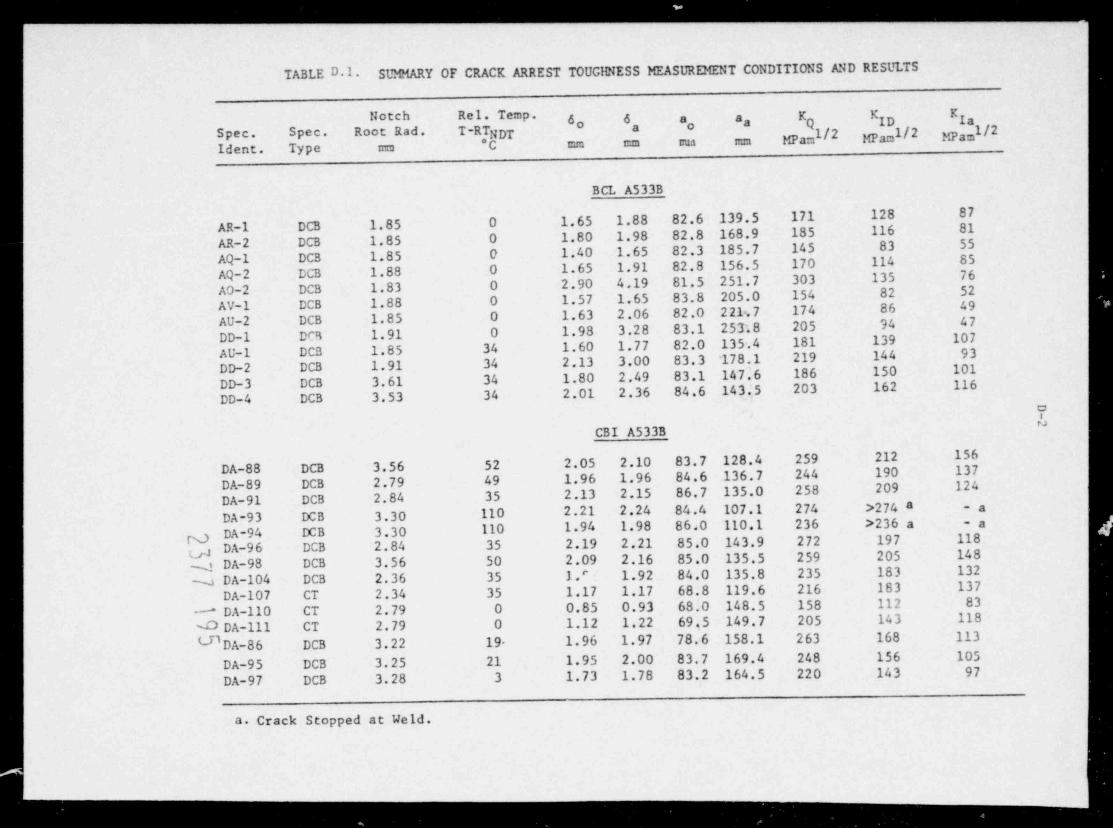
_ _ _ .
_ _ . _ . _ . . . . . . .
TABLE D.l. SUMMARY OF CRACK ARREST TOUGINESS MEASUREMENT CONDITIONS AND RESULTS
Notch Rel. Temp. 6 6 a a, K K Kg ip Iao "Spec. Spec. Root Rad. T-R,T DT MPam /2 MPam /2 MPam /21 l l
emIdent. Type mm
BCL A533B
AR-1 DCB 1.85 0 1.65 1.88 82.6 139.5 171 128 87
AR-2 DCB 1.85 0 1.80 1.98 82.8 168.9 185 116 81
AQ-1 DCB 1.85 0 1.40 1.65 82.3 185.7 145 83 55
AQ-2 DCB 1.88 0 1.65 1.91 82.8 156.5 170 114 85
AO-2 DCB 1.83 0 2.90 4.19 81.5 251.7 303 135 76
AV-1 DCB 1.88 0 1.57 1.65 83.8 205.0 154 82 52
AU-2 DCB 1.85 0 1.63 2.06 82.0 221.7 174 86 49
D D-1 DC8 1.91 0 1.98 3.28 83.1 253'.8 205 94 47
AU-1 DCB 1.85 34 1.60 1.77 82.0 135.4 181 139 107
D D-2 DCB 1.91 34 2.13 3.00 83.3 '178.1 219 144 93
D D-3 DCB 3.61 34 1.80 2.49 83.1 147.6 186 150 101
DD-4 DCB 3.53 34 2.01 2.36 84.6 143.'5 203 162 116
eb
CBI A533B
DA-88 DCB 3.56 52 2.05 2.10 83.7 128.4 259 212 156
DA-89 DCB 2.79 49 1.96 1.96 84.6 136.7 244 190 137
DA-91 DCB 2.84 35 2.13 2.15 86.7 135.0 258 209 124
DA-93 DCB 3.30 110 2.21 2.24 84.4 107.1 274 >274 a -a
DA-94 DCB 3.30 110 1.94 1.98 86.0 110.1 236 >236 a -a
DA-96 DCB 2.84 35 2.19 2.21 85.0 143.9 272 197 118psyt,a,a DA-98 DCB 3.56 50 2.09 2.16 85.0 135.5 259 205 148
sa DA-104 DCB 2.36 35 1." 1.92 84.0 135.8 235 183 132
DA-107 CT 2.34 35 1.17 1.17 68.8 119.6 216 183 137
* DA-110 CT 2.79 0 0.85 0.93 68.0 148.5 158 112 83
'f)DA-111 CT 2.79 0 1.12 1.22 69.5 149.7 205 143 118
LI'DA-86 DCB 3.22 19- 1.96 1.97 78.6 158.1 263 168 113
DA-95 DCB 3.25 21 1.95 2.00 83.7 169.4 248 156 105
DA-97 DCB 3.28 3 1.73 1.78 83.2 164.5 220 143 97
a. Crack Stopped at Weld.
__
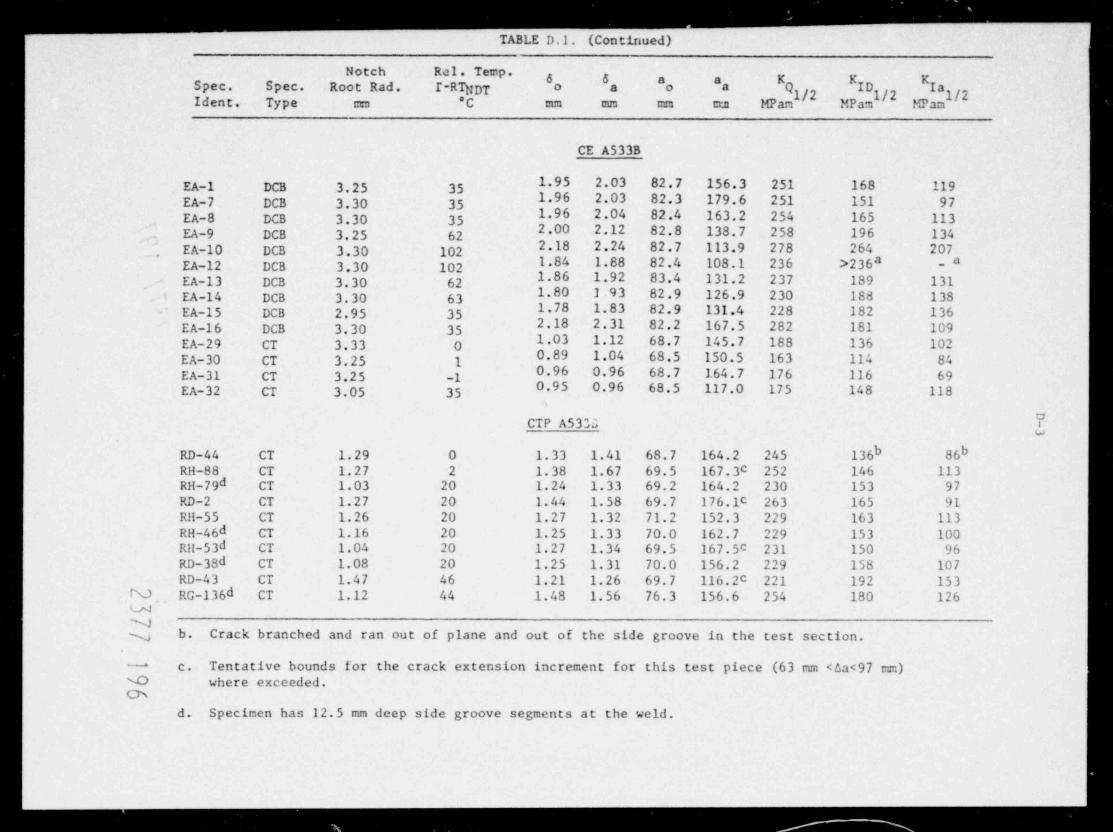
..
~
_
TABLE D.I. (Continued)
Notch Rel. Temp.6 6 a a K K KSpec. Spec. Root Rad. I-RTNDT o a o a Q ID Iag
Ident. Type m 'C mm mm m etn MPan MPam MPan
CE A533B
1.95 2.03 82.7 156.3 251 168 119EA-1 DCB 3.25 35 1.96 2.03 82.3 179.6 251 151 97EA-7 DCB 3.30 35 1.96 2.04 82.4 163.2 254 165 113EA-8 DCB 3.30 35 2.00 2.12 82.8 138.7 258 196 134. EA-9 DCB 3.25 622.18 2.24 82.7 113.9 278 264 207EA-10 DCB 3.30 102.
1.84 1.88 82.4 108.1 236 >236a _aEA-12 DCB 3.30 102 1.86 1.92 83.4 131.2 237 189 131EA-13 DCB 3.30 621.80 1 93 82.9 126.9 230 188 1383 EA-14 DCB 3.30 631.78 1.83 82.9 131.4 228 182 136EA-15 DCB 2.95 35 2.18 2.31 82.2 167.5 282 181 109EA-16 DCB 3.30 351.03 1.12 68.7 145.7 188 136 102EA-29 CT 3.33 00.89 1.04 68.5 150.5 163 114 84EA-30 CT 3.25 1 0.96 0.96 68.7 164.7 176 116 69EA-31 CT 3.25 -10.95 0.96 68.5 117.0 175 148 118EA-32 CT 3.05 35
[CTP A5335
b 86bRD-44 CT 1.29 0 1.33 1.41 68.7 164.2 245 136RH-88 CT 1.27 2 1.38 1.67 69.5 167.3C 252 146 113RH-79d CT 1.03 20 1.24 1.33 69.2 164.2 230 153 97RD-2 CT 1.27 20 1.44 1.58 69.7 176.lc 263 165 91RH-55 CT 1.26 20 1.27 1.32 71.2 152.3 229 163 113RH-46d CT 1.16 20 1.25 1.33 70.0 162.7 229 153 100RH-53d CT 1.04 20 1.27 1.34 69.5 167.5C 231 150 96RD-38d CT 1.08 20 1.25 1.31 70.0 156.2 229 158 107RD-43 CT 1.47 46 1.21 1.26 69.7 116.2C 221 192 153
N RG-136d CT 1.12 44 1.48 1.56 76.3 156.6 254 180 126vJ
Ny b. Crack branched and ran out of plane and out of the side groove in the test section.
c. Tentative bounds for the crack extension increment for this test piece (63 mm <t,a<97 cc:)-
W where exceeded.Ch
d. Specimen has 12.5 mm deep side groove segments at the weld.
_
- - -

_ _ _ _ _ _ _ _ . _ _ _ . _ . _ . . . . . . . .
TABLE D.1. (Continued)
'
K K KNotch Rel. Temp. 6 6 a a, ip Ia1/2 19am /2 gp, 1/2lSpec. Spec. Root Rad. T-RT DT m em em MPa
Ident. Type em
B&W A508
BW-11 DCB 3.15 0 1.63 1.68 81.7 155.3 210 141 96
BW-12 DCB 3.20 0 1.78 1.83 84.2 204.1 229 123 71
BW-15 CT 3.18 39 1.09 1.21 66.7 138.6 205 151 119
, BW-16 CT 3.28 39 1.17 1.25 67.7 143.1 115 157 118
BW-18 CT 3.40 98 1.41 1.46 67.6 95.0 261 >261 ,aa
BW-19 CT 3.30 50 1.27 1.42 67.7 140.1 236 174 138 -
BW-20 CT 3.18 50 1.31 1.38 67.8 '36.7 241 181 138.
BW-21 CT 3.38 50 1.38 1,43 69.2 142.1 247 185 135
BW-22 CT 2.82 0 1.24 1.35 70.2 181.5 225 137 64
BW-23 CT 2.92 30 1.24 1.36 70.7 154.1 225 157 114
BW-24 CT 2.90 0 1.06 1.17 68.0 171.3 196 124 72 o#'
BW-26 CT 2.92 30 1.28 1.41 70.7 168.5 231 150 95
BW-27 CT 2.92 0 1.07 1.33 66.9 188.6 196 114 60
BW-28 CT 3.20 30 1.37 1.49 67.7 172.3 253 160 92
Is) CE Weldment(-y
e'N1 230 <122 -c70.5s; EP-6 CT 1.40 37 1.27 -- cs
EP-9 CT 1.52 37 0.98 1.58 69.7 194 180 <103 -c#
70.7 - 173 < 90 -cEP-10 CT 1.02 37 0.96 ----
'4) EP-12 CT 1.96 57 1.08 1.13 71.5 161.1 200 136 85
'NJ EP-14 CT 1.02 37 0.89 0.94 66.7 162.6 167 110 70
EP-19 CT 1.88 57 1.04 1.22 70.7 172.3 187 120 77
EP-20 CT 1.78 57 1.00 1.05 67.4 154.6 186 127 87
EP-22 CT 3.61 71 1.38 1.52 72.3 148.5 248 <201e 136
EP-25 CT 3.68 71 1.37 1.46 73.5 132.5 242 <231* 152
c. Arrested Crack Front not Straight.

..
.
APPENDIX E
STATISTICAL ANALYSIS OF DATA IN SECTION 3
2377 198
.
t

..
E-1
.
APPENDIX E. STATISTICAL ANALYSIS OF DATA IN SECTION 3
A statistical analysis of the data for K and K as functionsg
of T-NDT or T-RT was can u using r g ss n-ana y s uc M @ s.NDT
Reasons for conducting this analysis were the following: (1) to determine
functional relations between the dependent variables (K ,, KIa) and7,
each of the independent variables (T-NDT, T-RTNDT ; stimate an
approximate lower limit for each of the dependent variables as functions
of each of the independent variables.
Before discussing results obtained from the statistical studies,
attention must be drawn to an important point, namely, that the Icast-.
squares analysis we have carried out is based on the following assumptions:,
(1) Data for the independent variable are known exactly. (2) Data for
the dependent variable are normally distributed, for any given value of
the independent variable the standard deviation of this normal distri-,
bution remaining constant as the independent variable changes. However,
consideration of the data being analyzed indicates that, not only are
values for the independent variable not precisely known* but in addition,
values for the dependent variable are not normally distributed as postu-
lated. For example, the data gathered f rom the various dif ferent heats
appear generally to be members of dif ferent data populations, instead of
the same population. We did analyze one subset of data (the K datag
for -1*C 1 T - RT 1 "" " " "E "NDT
obtained to either a normal or a log-normal distribution; but this is
really a moot point in view of the fact that the data contained within
the subset represent different populationn. Nevertheless, with ths"
facts in mind, we proceeded to carry out regression-analysis studies
* NDT is itself a statistical quantity determined by an approximate
2casitivity analysis.2377 199
. s

. . . . . _ _ .-. .
E-2
using a procedure by which the sum of squares of deviations of the
data from the regression curve, measured along the ordinate axis,
was minimized. In this sense, the functional relations thus obtained
do represent "best fits" to the data; but interpretations based on ca?cu-
lated values for " standard errors", associated with measurement of the
dependent variable, must be view,d with caution.
Data were initially fitted to a quadratic equation of the form
y = a + bx + cx , where y and x are, respectively, the dependent and
independent variable, and a, b, and c are the regression coefficients to
be calculated. Ilowever, it was found that the term which was quadratic
in x contributed only to a relatively small extent, i.e., the statistically
predicted variation of y with x was predominantly linear. Consequently,
the analyses were repeated with the quadratic term deleted, so that y
was taken to have a purely linear dependence upon x. All results des-
cribed herein are based on that assumed linear dependence.
The approximate lower limit for the dependent variable was
calculated, as a function of the independent variable, using a parameter
known as the " standard error of the estimate", sy, which, for a linearfit to the data of the form y = a+bx, is given by
1/2
=(-3sN-2y
where S is the sum of squares of deviations (measured along the ordinate
axis) in the data from the regression line and N is the number of data points
(60 in this case). If the data were normally distributed about the regres-
sion line, the estimated probability, P , that a data point lies abovesy
y-ns , where y is the value calculated from the regression equation for a
given value of x, is as indicated in Table B-I for selected values of n.
2377 200x
--

__ __._.__ _ _ __
E-3
TABLE B-1. VARIATION OF P WIT 11 ngy
" nsy
1 0.84134472 0.97724993 0.99865014 0.9999683
Provided the assumptions used in the analyses do not introduce significant
c"rors in Figures 7-10 the -2s lines represent the lower limit of toughness
for all but S 2.28% of plates while the -3s lines lie below all but m 0.13%
of the total population. It should be recalled, however, that the data under
analysis here, were not members of a single, normally distributed population
along the y-axis' for given values of x, and also, values for the independent
variable x were not precisely known for these data. Consequently, values
calculate <1 for P using these data should be regarded only as rough,nsy
estimates.
2377 201
_ _ _ _ _ _ _ _ . . _ .
/ . .. _ _ _ _ _
.
a
.
APPENDIX F
FLUX DOSIMETRY FOR MOCKUP EXPERIMENT ATUNIVERSITY OF MICHIGAN REACTOR
_
2377 202
,
w
'
s
t

-- , . . . - , - -
F-1
APPENDIX F
~FLl:X iMSIMETRY FOR MOCKl'P EXPERIMENT ATUNIVERSITY OF MICHIGAN REACTOR
The flux or integrated neutron fluence can be determined from the
radioactivity induced in irradiated detector materials. A known amount of
an element to be activated is placed in the neutron flux. Atoms of the
dosimeter material interact with the neutron flux producing a radioactive
product. After exposure the gamma radiation from the dosimeter is measured
and used to calculate the flux required to produce this level of activity.
The fluence is then calculated from the integrated power output of the
reactor during the exposure interval.
The activity A induced into an element irradiated for a time t
in a constant neutron flux is given by
c.
N a (E)4(E) dE (1-e~ ) (F-1)A =j
.J o
where
c(E) the differential cross section for the activation reaction=
4(E) the neutron differential flux=
the atom density of the target nuclei (at T.s/g)N =
the decay constant of tite product atom (sec~I).\ =
If the sample is permitted to decay for a time t between exposure and
counting, then the activity when counted is
- (wN o (E)t(E) dE (1-e- tg) ca tw (F-2)A = ,
bo
A " spectrum-averaged cross section" may be defined as
c(E)4(E)dE6o (F-3)g ,,
5s O,cE)aE 2377 203
-
_ . _ .
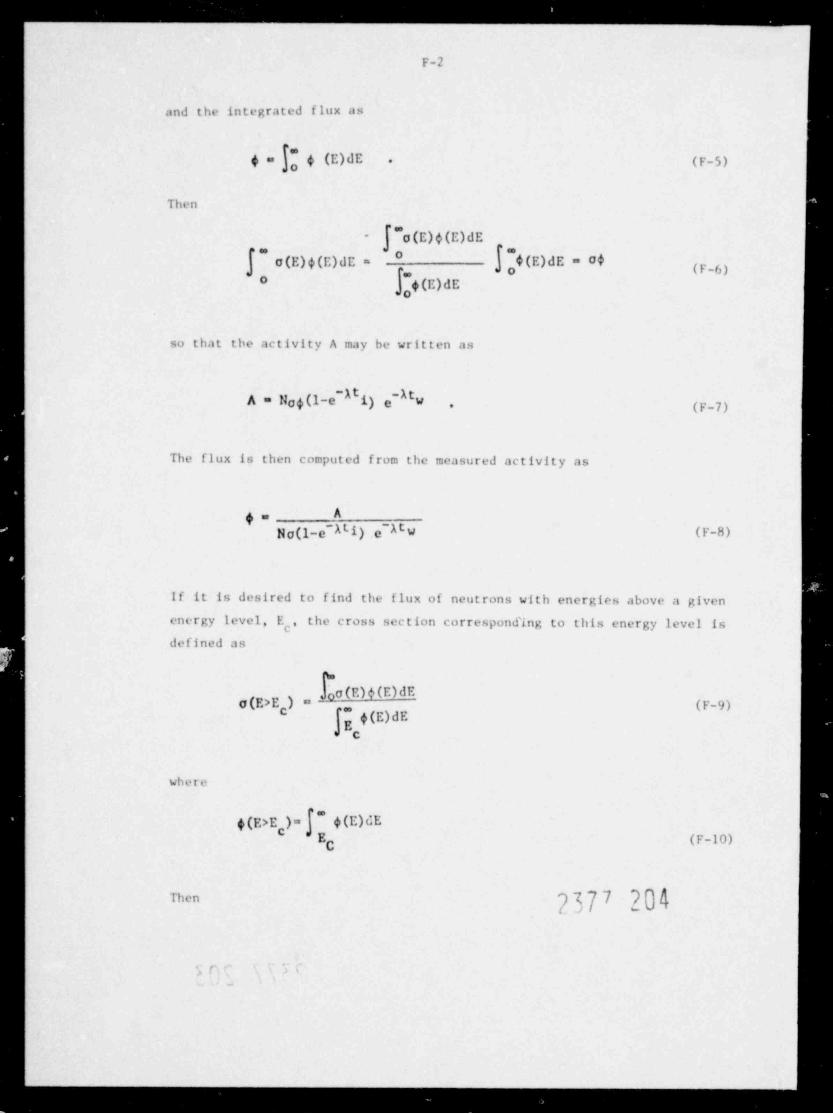
.
. _
F-2
and the integrated flux as
$ " j{m 4 (E)dE (F-5).o
*Then
"o(E)4(E)dE'
- !
p... .
d o (E)dE = c& (F-6)4c(E)4(E)dC = '.
0.o (E)dE'4
so that the activity A may be written as
~AA = No4(1-c i) e-At" (F-7)*
< The flux is then computed from the measured activity as
.
A4
No(1-e~Ali).c~AC W (F-8)
e
If it is desired to find the flux of neutrons with energies above a givenenergy level, E , the cross section correspond'ing to this energy level iscdefined as -
:)
|%e
o(E)4(E)dEa(E>E } " go (F-9)c 'a
E -
' C
where=
" 4(E)dE4(E>E )= .E
'
c . (F-10)C
77]7 ')] kThen<> -
'> I' s
.
_ . _ . _ _ _
N
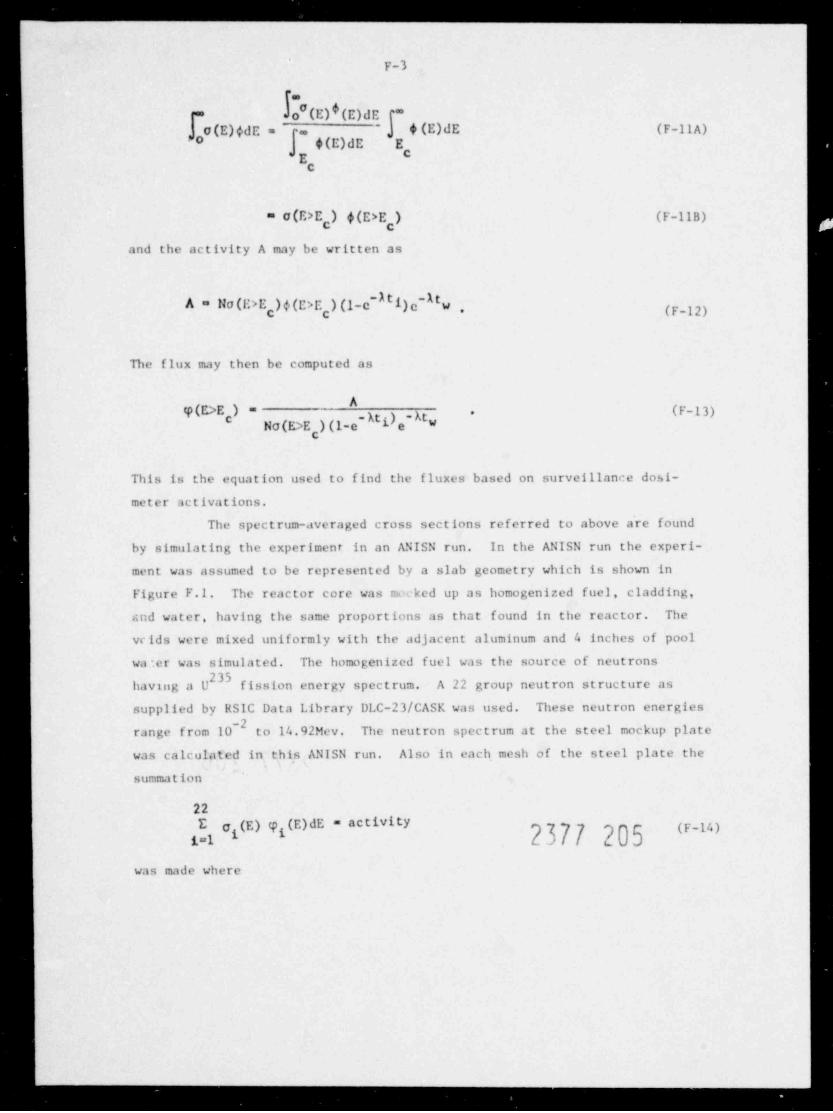
-. . . . - . . - - -___
'
F-3
F-Jo"(E)f(E)dE F".*
.. g $(E)dE (F-llA)c(E)(dC =*
'O $(E)dE Ec=E
C
= c(E>E ) $(E>E ) (F-11B)
and the activity A may be written as
A = No(E>E )f(E>E )(1-c" E )c~ Ew, (F-12)I
.The flux may then be computed as
A9 (E>E ) = (F-13)
No(E>E )(1-e i)e- At.
-A WC
This is the equation used to find the fluxes based on surveillance dosi-
meter activations.
The spectrum-averaged cross sections referred to above are foundby simulating the experiment in an ANISN run. In the ANISN run the experi-
ment was assumed to be represented by a slab geometry which is shown in
Figure F.1. The reactor core was m.wked up as homogenized fuel, cladding,
and water, having the same proportions as that found in the reactor. The
vc ids were mixed uniformly with the adjacent aluminum and 4 inches of poolwa:er was simulated. The homogenized fuel was the source of neutrons
having a U fission energy spectrum. A 22 group neutron structure as
supplied by RSIC Data Library DLC-23/ CASK was used. These neutron energies
range from 10~ to 14.92Mev. The neutron spectrum at the steel mockup plate
was calculated in this ANISN run. Also in each. mesh of the steel plate the
summation
22E o (E) g (E)dE = activity (p_y4)g
was made where
. _ . . .
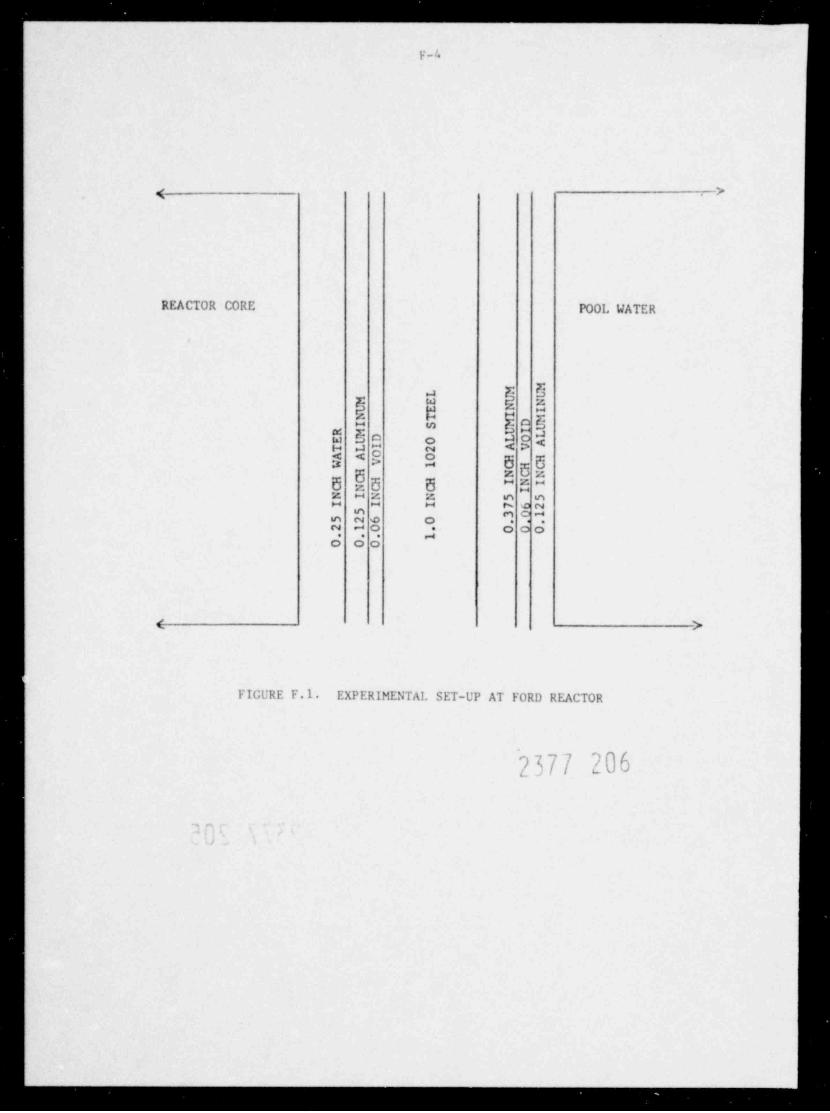
. _ . . _ . . _ . _._
F-4
4 >
REACTOR CORE POOL WATER
a r nd zF w
e s g-W e- mb O O OW
s a - < >~s a 5 5a <
5g z z5 5 5 5- ~zz - z z e mH M - N c N
O N o O 1 ." ". R J o oO O O
(. >
FIGURE F.1. EXPERIMENTAL SET-UP AT FORD REACTOR
2377 206
.
.)
-
_ _ _ _ _ _ _ _ .
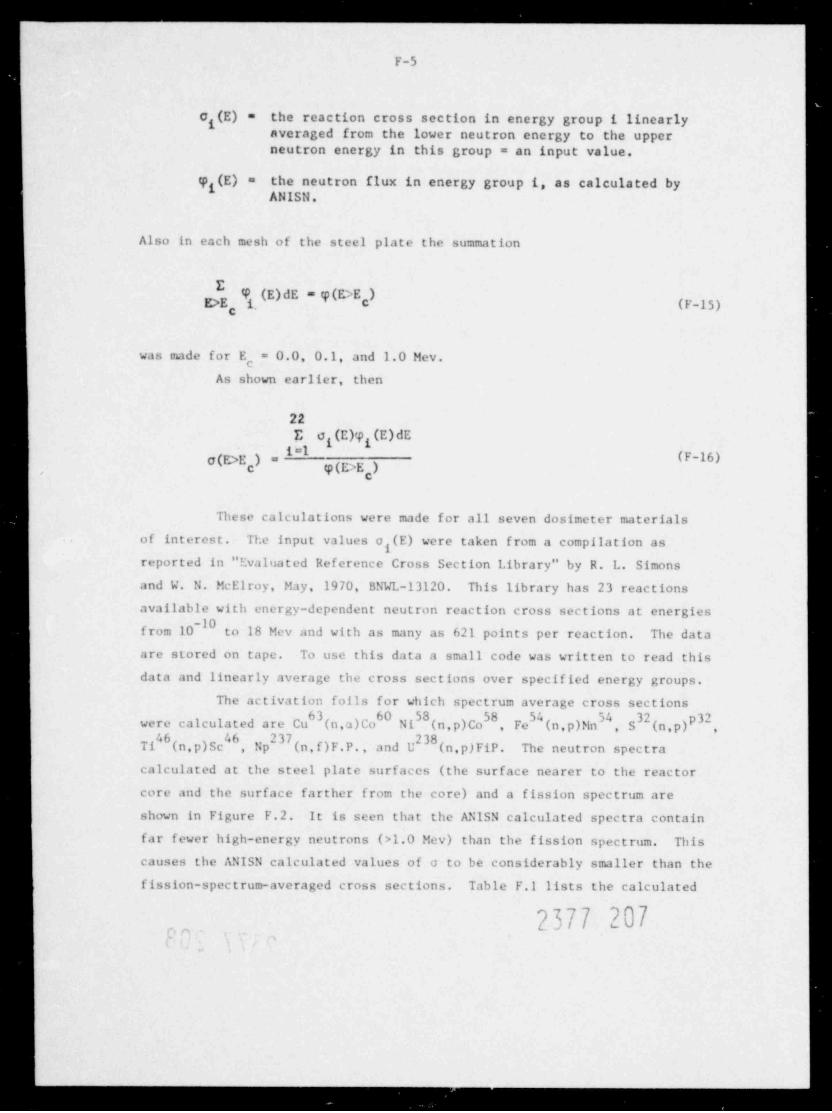
, _ _ , , . . . - - .__
F-5
o (E) = the reaction cross section in energy group i linearlygaveraged from the lower neutron energy to the upperneutron energy in this group = an input value.
g (E) = the neutron flux in energy group i, as calculated bygANISN.
Also in each mesh of the steel plate the summation
E (E)dE = g(E>E )E>E *
c (F-15)c
was made for E = 0.0, 0.1, and 1.0 Mev.
As shown earlier, then
22
E o (E)? (E)dEg i
o(E>E ) = i I (F-16)c g(E>E ),
These calculations were made for all seven dosimeter materialsof interest. The input values a (E) were taken from a compilation asreported in " Evaluated Reference Cross Section Library" by R. L. Simonsand W. N. McElroy, May, 1970, BNWL-13120. This library has 23 reactionsavailable with energy-dependent neutron reaction cross sections at energies
-Ofrom 10 to 18 Mev and with as many as 621 points per reaction. The dataare stored on tape. To use this data a small code was written to read thisdata and linearly average the cross sections over specified energy groups.
The activation fofis for which spectrum average cross sections(n p)P32were calculated are Cu (n,a)Co Ni (n,p)Co , Fe (n,p)Mn S, ,
Ti (n.p)Sc , Np (n,f)F.P., and U (n,p)FiP. The neutron spectra
calculated at the steel plate surfaces (the surface nearer to the reactor
core and the surface farther from the core) and a fission spectrum areshown in Figure F.2. It is seen that the ANISN calculated spectra contain
far fewer high-energy neutrons (>1.0 Mev) than the fission spectrum. Thiscauses the ANISN calculated values of a to be considerably smaller than thefission-spect rum-averaged cross sections. Table F.1 lists the calculated
. 2377 207u-(
__.... _ --
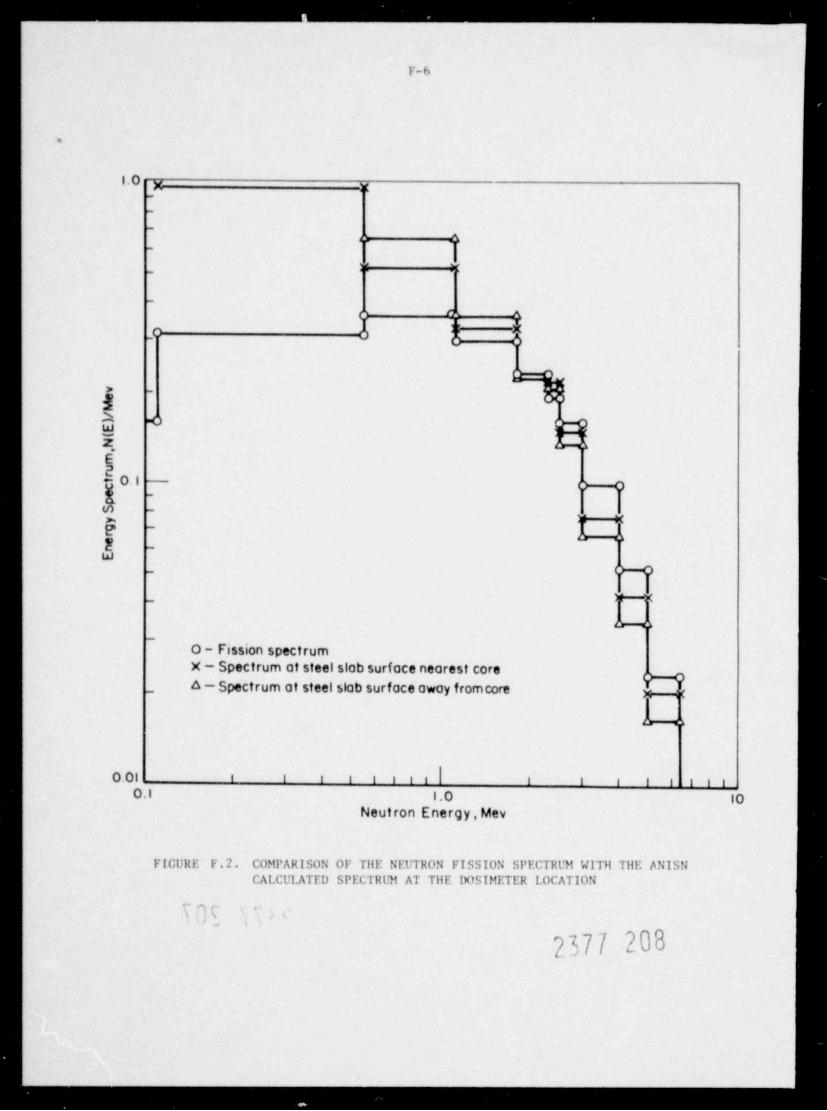
. . . . . _ _ _ _ _ . _ ___
F-6
.
l.0 y_ ;g_
_
-
_
_
s
~
.
$ ~
2h 4W!.
z,E2g01 : oe
_
-
E - UEW
-
_ )H-
_
o - Fission spectrumX - Spectrum at steel slab surf ace nearest core
.
_ o - Spectrum at steel slab surf ace away fromcorec
s
0.01 i i i i i i i i , , , , , , , ,0.1 i,o 10
Neutron Energy,Mev
FIGURE F.2. COMPARISON OF Tile NEUTRON FISSION SPECTRD1 WIT}i Tile ANISNCAI.CUI.ATED SPECTRUM AT Tile DOSIMETER I.0 CATION
'{ S ( -
'a ,
2377 208
- _ _ _ _ _ _ _ _ _ _ . .. .. .
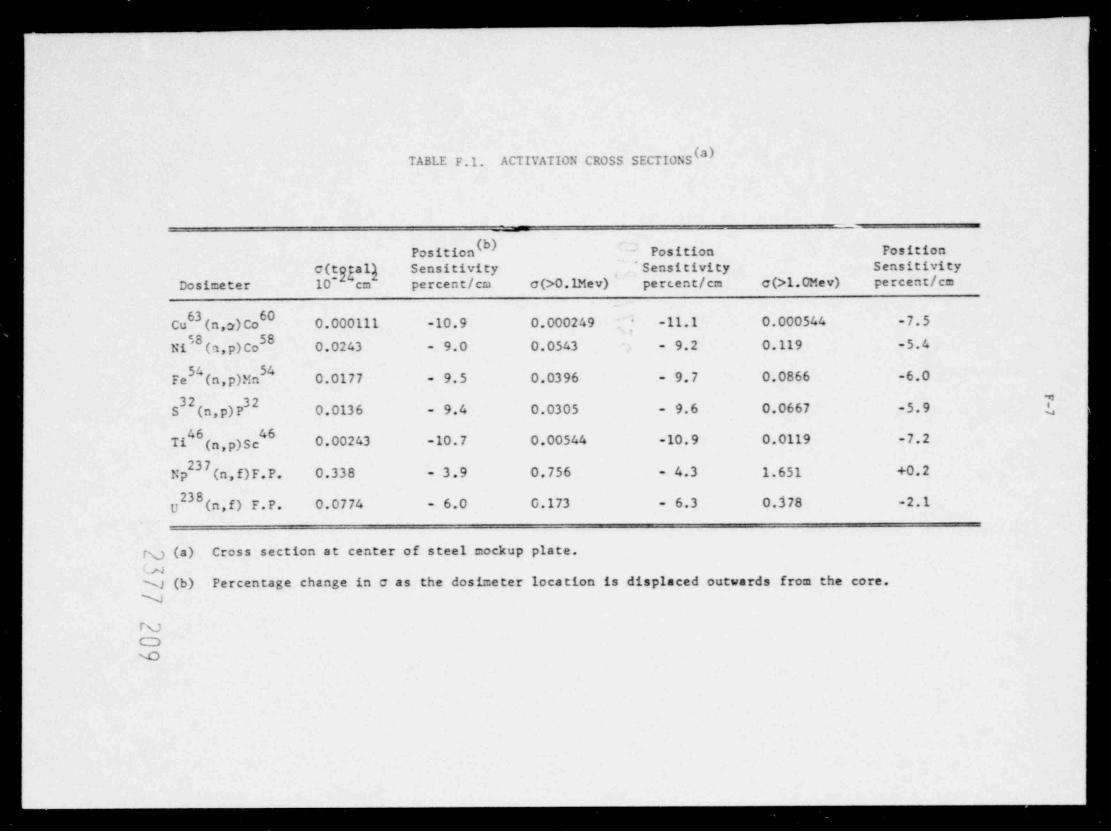
-
TABLE F.1. ACTIVATION CROSS SECTIONS
Position ( - Position Fosition
c(tgal} Sensitivity ' Sensitivity Sensitivity
Dosimeter 10~ cm pe rcent /cra c(>0.1Mev) percent /cm c(>1.0Me v) percent /cm
Cu (n ,::r) Co 0.000111 -10.9 0.000249 -11.1 0.000544 -7.5-
S8Ni (a , p) Co 0.0243 - 9.0 0.0543 - 9.2 0.119 -5.4
Fe (n,p)Mn 0.0177 - 9.5 0.0396 - 9.7 0.0866 -6.0
S (n , p) P 0.0136 - 9.4 0.0305 - 9.6 0.0667 -5.9 [
Ti (n , p) S c 0.00243 -10.7 0.00544 -10.9 0.0119 -7.2
Np (n , f) F. P. 0.338 - 3.9 0.756 - 4.3 1.651 +0.2
U (n,f) F.P. 0.0774 - 6.0 0.173 - 6.3 0.378 -2.1
N (a) Cross section at center of steel cockup plate.vaN (b) Percentage change in e as the dosimeter location is displaced outwards from the core.N
rvC3<
. . . . _ . . _ .
_ __
F-8
reaction cross sections. Table F.1 also indicates the sensitivity of the
neutron spectrum and, hence, cross section to the dosimeter location. It
is seen that a position uncertainty of 1.0 cm may introduce an error in oof several percent.
Table F.2 lists the dosimeter materials and gives the constantsused in calculating the neutron fluxes. Tables F.3, F.4, and F.5 give the |
calculated neutron fluxes at the seven irradiation positions for neutronswith energy greater than 1.0 Mev, greater than 0.1 Mev, and greater than0.0 Mev, respectively. Time at full power was taken as 61.6 minutes fromthe strip chart records of two reactor power monitors operated during theirradiation experiment.
')'i77 210L '
o;'
sw

_. ...
TABLE F.2. CONSTANTS USED IN DOSIMETRY CALCULATIONS
RadiationIsotopic Product Counted Yield Fission
Reaction Target Abundance (*) Half-Life (Mev) (*4) Yield
Fe (n ,'p)Mn 99.865Fe 5.82 312.6d 0.835 100 --
Ni (n,p)Co 99.997Ni 67.77 71.2d 0.810 99 --
Cu (n .or) Co 99.998Cu 69.17 5.27y 1.332 100 --
S (n p)F 99.99(NH )2SO 95.0 14.3d 1.7(B) 100 --
4 4
Ti (n.p)Sc 99.888Ti 7.93 83.9d 1.121 100 --
Np (n, f) Zr 99.20Np 0 100.0 64.4d 0.724 44.2 5.93(2
Np (n , f)La 99.20Np 0 100.0 12.79d 1.596 95.33 5.74( )2
23 8 (n , f) Zr 99.576U 100.0 64.4d 0.724 44.2 5.19( )95 238(2)U
f)U (n f)La 99.576U 100.0 12.79d 1.596 95.33 6.00
N 237u (1) Np 299.99w/oN 238 235N (2) U depleted to 378pp=U .
N (3) Gilliam, D.M. et al, " Reference and Standard Benchmark Field Ceasensus Fission Yields for] U.S. Reactor (Dosimetry Programs, NBS) 1977.
. . . . . . . . _ _ _ , ._
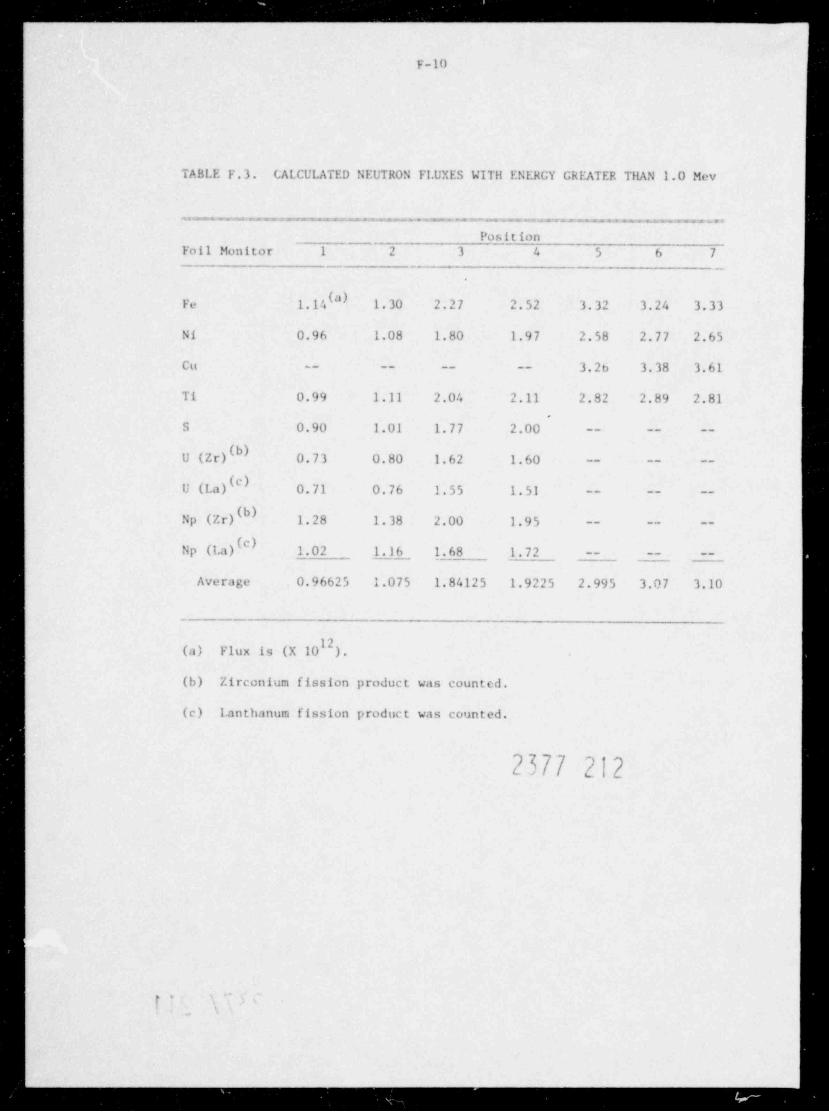
.. _ _ _ _
F-10
TABLE F.3. CALCULATED NEUTRON Fl.UXES WITH ENERGY GREATER TilAN 1.0 Mev
. - . -~.. m m . m . . _ ,m., _ _ _ _ _ _....., _ _ .. ,__ _ .,_ _,,. _ ,.
PositionFoil Monitor 1 2 3 4 5 6 7-- --- -
,
Fe 1.14 "I 1.30 2.27 2.52 3.32 3.24 3.33
Ni 0.96 1.08 1.80 1.97 2.58 2.77 2.65
Cu -- -- -- -- 3.26 3.38 3.61
Ti 0.99 1.11 2.04 2.11 2.82 2.89 2.81
S 0.90 1.01 1.77 2.00 -- -- --
U (Zr) 0.73 0.80 1.62 1.60 -- -- --
U (La)(''} 0.71 0.76 1.55 1.51 -- -- --
Np (Zr) 1.28 1.38 2.00 1.95 -- -- --
Np (La)("} 1.02 1.16 1.68 1.72 -- -- --
Average 0.96625 1.075 1,84125 1.9225 2.995 3.07 3.10
l'(a) Flux is (X 10 ').(b) Zirconium fission product was counted.
(c) lanthanum fission product was counted.
2377 212
t-~
..
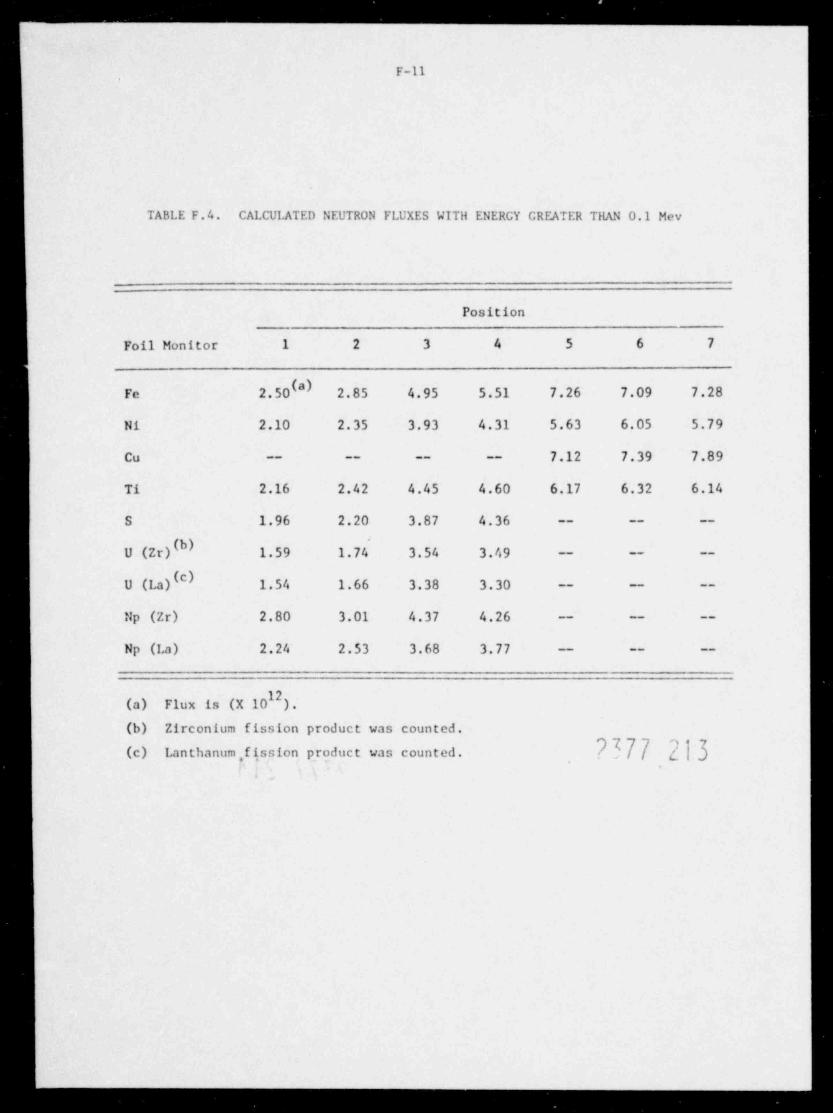
- . . . . _ . _ _ _ _ _ _
_ _ _ _
F-11
TABLE F.4. CALCULATED NEUTRON FLUXES WITH ENERGY GREATER THAN 0.1 Mev
Position
Foil Monitor 1 2 3 4 5 6 7
Fe 2.50(a) 2.85 4.95 5.51 7.26 7.09 7.28
Ni 2.10 2.35 3.93 4.31 5.63 6.05 5.79
-- -- -- -- 7.12 7.39 7.89Cu
Ti 2.16 2.42 4.45 4.60 6.17 6.32 6.14
S 1.96 2.20 3.87 4.36 -- -- --
U (Zr)(b) 1.59 1.74 3.54 3.49 - -- --
U (La)( ) 1.54 1.66 3.38 3.30 -- - --
Np (Zr) 2.80 3.01 4.37 4.26 -- -- --
Np (La) 2.24 2.53 3.68 3.77 -- -- --
(a) Flux is (X 10 ).(b) Zirconium fission product was counted.
n7// c' | )7> n< ,
(c) Lanthanum, fission product was counted. /,
.
- ,--_-_..

. . . . . - _ _ _
F-12
TABLE F.5. CALCULATED NEUTRON FLUXES WITil ENERGY GREATER TRAN 0.0 Mev
__
Position
Foil Monitor 1 2 3 4 5 6 7
Fe 0.56(^) 0.64 1.11 1.23 1.63 1.59 1.63
Ni 0.47 0.53 0.88 0.97 1.26 1.36 1.30
Cu -- -- -- -- 1.59 1.66 1.77
Ti 0.48 0. 5 '< 1.00 1.03 1.38 1.41 1.38
S 0.44 0.49 0.87 0.98 -- -- --
U (Zr)(b) 0.36 0.39 0.79 0.78 -- -- --,
U (La)(') 0.34 0.37 0.76 0.74 -- -- --
Np (Zr) 0.63 0.67 0.98 0.95 -- -- --
Np (La) 0.50 0.57 0.82 0.84 -- -- --
(a) Flux is (X 10 ).(b) Zirconium fission product was counted.(c) Lanthanum fission product was counted.
2377 214
._ . . ..

_ _ . . . . _ . _ _
__
APPENDIX G
LIST OF SYMBOLS
2377 215,
_ _...

. . . . . _ _ _ _
G-1
SYMBOLS
a crack length
a crack length at arrest
a crack length at initiationg
A true areal fraction of ductile fracture
II height of shear wall
J p th-independent integral associated with crack initiationIc
K static stress intensity f 110 wing crack arrestIa
K plane strain fracture toughness
K propagating crack toughnessID
K dynamic loading value of Kg
K crack arrest toughness, minimum fast fracture toughnessg
K ref erence tou@ ness curvegg
NDT nil-ductility temperature (ASTM E-208)
RT reference nil-ductility temperatureNDT
S standard error of estimateY
t extent of heavy slip in vicinity of shear wall
V volume of plastic material per unit projected crack area
w dimension from center line of loading pin to the far end ofc ompac t specimen
W plastic work per unit volume
6, load-line displacement at crack arrest
6 load-line displacement at crack initiationg
23[[ 2}(c fracture strain associated with a shear wallf
_.
flow stressa
-
_ _ _ . _ . . .
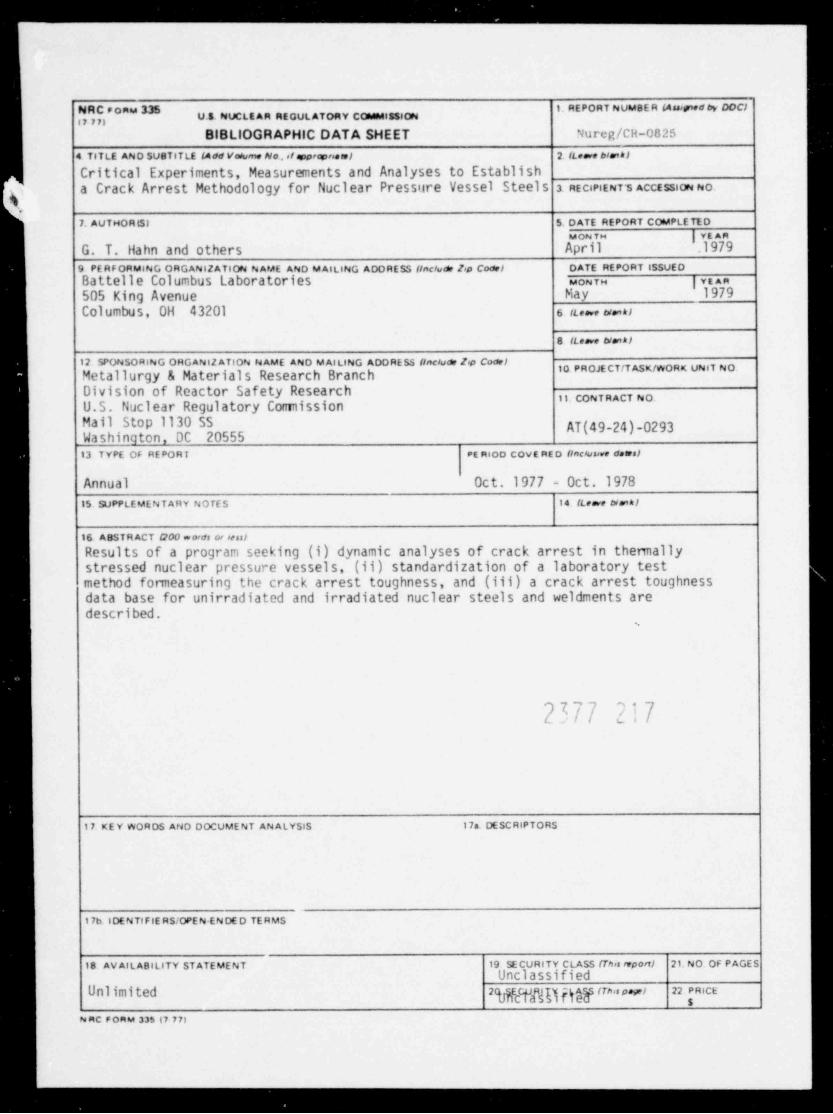
_ . - _ _ _ _ _ _
""U.S. NUCLE AR REGUL ATORY COMMIS$10Ny
BIBLIOGRAPHIC DATA SHEET Nureg/cR-08254 TITLE AND SUBTITLE (Add Vo4me No, ## appropreamt 2. (Leave biet*J
Critical Experiments, Measurements and Analyses to Establisha Crack Arrest Methodology for Nuclear Pressitre Vessel Steels 3. RECIPIENT'S ACCESSION NO.
7. AUTHORIS) 5. DATE REPORT COMPLE TED
|VEARMONTH
G. T. Hahn and others April .1979
9 PE RF ORMING ORGANIZATION N AME AND M AILING ADORESS (tacium Isa Codel DATE REPORT ISSUEOBattelle Columbus Laboratories uourn |vEma505 King Avenue May 1979Columbus, OH 43201 s (te.ve u.eas
8 (Leave uank)
12 SPONSORING OHGAN12 ATION N AME AND M AILING ADDRESS (include la Co*)10. PROJECT / TASK / WORK UNIT NOMetallurgy & Materials Research Branch
Division of Reactor Safety ResearchIt CONTRACT NO.U.S. Nuclear Regulatory Conmssion
Mail Stop 1130 SS AT(49-24)-0293Washington, DC 2055513 TYPE OF HE POR T PE RIOD COVE RE D (inclusere daars)
Annual Oct.1977 - Oct.197815 SUPPLEMENT ARY NO TE S 14 (Leave We' Al
16 ABSTR ACT 000 evords or sess)
Results of a progran seeking (i) dynamic analyses of crack arrest in thennallystressed nuclear pressure vessels, (ii) standardization of a laboratory testmethod formeasuring the crack arrest toughness, and (iii) a crack arrest toughnessdata base for unirradiated and irradiated nuclear steels and weldments aredescribed.
2777 217
17 KE Y WORDS AND DOCUMENT AN ALYSIS 17s. DESCRIPTORS
17b IDENTIFIE RS/OPEN ENDE D TERMS
18 AV AILABILITY STATEMENT 19 SECURITY CLASS (This typort) 21. NO OF PAGESUnclassified
Unlimited 2gEcgRg pgsg (ra,s p.,1 22 Pricec
NMC FORM 33S (7 77)
_ _ _ _ .
isNt fi U ST Af t $ f ]*s t ; t L I A e* M f (',i s t A T n R y ( G uu r'.s e r j aa
W A 5 etiN t , T i}N O C 705 %Post aGa amo P e a g paso
--
u s muCLa mm na Gu6a Tony08 F 'CI A L BuMNis5
C O M M '55'OM -
Pt N ALT y 7 OR PRIV A YE U$t $300
L J
s
12G ';5 50 316 31 2 At415
L UdLll J L,; 0 ME NI RCOMbu NC H Git I E Ftis T LOBBYW A SH I f.G T U.1 0t- 20555
.
&, @/ . * i yL, / u 4
.
k
e