Planning Experiments
61
Experimentation and Statistics in Tropical Agriculture: Planning Experiments Clarice G.B. Dem´ etrio, Cristian Villegas, Renata A. Sermarini ESALQ/USP, Piracicaba, Brazil [email protected] Summer School on Tropical Bio-based Production Systems July 2019 Clarice, Cristian, Renata (ESALQ/USP) Planning Experiments July 2019 1 / 61
-
Upload
khangminh22 -
Category
Documents
-
view
4 -
download
0
Transcript of Planning Experiments

Experimentation and Statistics in TropicalAgriculture: Planning Experiments
Clarice G.B. Demetrio, Cristian Villegas, RenataA. Sermarini
ESALQ/USP, Piracicaba, [email protected]
Summer School on Tropical Bio-based Production Systems
July 2019
Clarice, Cristian, Renata (ESALQ/USP) Planning Experiments July 2019 1 / 61

Summary
General considerations.
Some history.
The experimental method.
Three techniques of experimental designs.
Standard types of designs.
Experimental validity
Clarice, Cristian, Renata (ESALQ/USP) Planning Experiments July 2019 2 / 61

Variability
Variability is a characteristicof biological material.
Clarice, Cristian, Renata (ESALQ/USP) Planning Experiments July 2019 3 / 61

General considerations
Experimentsinvolve researchers manipulating situations, by applying treatments, inan effort to draw conclusions about what their manipulations havecaused;represent a very important technique in the acquisition of scientificknowledge.
Surveys and observational studies merely observe some aspect(s)of the world as is.
From the left: unknown,W.G. Cochran, unknown,C.R. Rao, Irvin, G. Rasch,S.C. Pearce, R.A. Fisher,visiting the CampinasAgronomic Institute,1955.
Clarice, Cristian, Renata (ESALQ/USP) Planning Experiments July 2019 4 / 61

Some history
The Hoosfieldlong-term experimenton spring barley atRothamsted Researchstarted in 1852. Springbarley has been growncontinuously since then.It tests nitrogen, minerals,farmyard manure ( FYM)and sodium silicate.
Clarice, Cristian, Renata (ESALQ/USP) Planning Experiments July 2019 5 / 61

Some history
The Park Grass(Broadbalk) experimentwas established in 1856 atRothamsted Research.Designed to measure theeffects of fertilisers onyields of permanent grasscut for hay. It is nowregarded as the foremostlong-term ecologicalexperiment in the world.
Clarice, Cristian, Renata (ESALQ/USP) Planning Experiments July 2019 6 / 61

Some history - Fisher
Fisher introduced the subdivision of sums ofsquares now known as an analysis of variance(anova) table (1923),
derived the exact distribution of the (log ofthe) ratio of two independent chi-squaredvariates (1924),
introduced the principles of randomization and blocking: thecompletely radomized (CRD) the randomized complete block(RCBD), Latin square (LSD), and split-plot (SPLD) experiments(1925),promoted factorial experiments, and the notion of confounding(1926).He quickly transformed agricultural experimentation in GreatBritain and more widely.These ideas have remained the statistical basis of agriculturalexperimentation.
Clarice, Cristian, Renata (ESALQ/USP) Planning Experiments July 2019 7 / 61
Basic purposes of experimentation
To provide valid comparison of the effects of treatments.
To provide valid information about the relationship between variablesof interest.
Famous phrases
It is easy to conduct an experiment in such a way that no usefulinference can be made. William Cochran & Gertrude Cox
And so it that . . . borne upon me that very often, when the mostelaborate statistics refinements possible could increase the precisionby only a few percent, yet a different design involving little or noadditional experimental labour might increase the precision two-fold,or five-fold, or even more. Ronald Fisher
Clarice, Cristian, Renata (ESALQ/USP) Planning Experiments July 2019 8 / 61

Basic requirements
The experimental conditions should represent the situationalconditions of the problem of interest.
The comparison of treatments should be free from other possibleexplanations due to the presence of other variables. (confounding)
The treatment comparison should be made with as little influence ofrandom variation as possible.
The level of uncertainty in the conclusions should be assessable.
The experiment should be as simple as we can make it.
The data analysis should follow the planning.
Clarice, Cristian, Renata (ESALQ/USP) Planning Experiments July 2019 9 / 61

The experimental method (Brien, 2010)
Clarice, Cristian, Renata (ESALQ/USP) Planning Experiments July 2019 10 / 61
The experimental method (cont.)
PlanningNeeds to be a result of a collaboration between aScientist and a Statistician.
Ideally, this happens in plenty of time before theexperiment.
The Scientist does not come with statisticallyprecise questions and the Statistician has to asklots of questions.
A clear understanding of the problem being studied and theobjectives for the experiment. Why is the experiment being done?To answer specific questions:
to estimate something (how much heavier are pigs on diet A than ondiet B?) – we want unbiased estimators with small variance;
to test a hypothesis (that there is no difference between organic andinorganic fertilizers) – we want high power.
Clarice, Cristian, Renata (ESALQ/USP) Planning Experiments July 2019 11 / 61

The experimental method (cont.)
Identification of the variables of interest including the response(dependent) variable, the explanatory (independent) variable (orfactor) to be studied and the other variables to be controlled.
Identification of the experimental environment and how this is tobe controlled (representative farmer’s fields or a well-controlledstation?).
Identification of the experimental/observational units (number,shape, . . . ) to be used and the sampling that is to be done to obtainthe observational units taking into account the need to controlnatural variation (in many experiments the observational andexperimental units are the same).
Identification of the treatments to be applied and the protocol forestablishing and applying them (Which treatments? What quantities?What combinations?)
Clarice, Cristian, Renata (ESALQ/USP) Planning Experiments July 2019 12 / 61

The experimental method (cont.)
Allocating the treatments to the experimental units through anexperimental design, using blocking to overcome any major variationin the experimental units..
Identification of the measurement process to be used andcontrolling the key sources of variation that might affect themeasurement process.
Constraints
Costs.
Availability of treatments (for example, not many seeds of a newvariety).
Availability of experimental units (e.g. plots in fields, people totest equipment, time . . . ).
Natural “blocks” or divisions among the experimental units.
Other constraints imposed by management.
Clarice, Cristian, Renata (ESALQ/USP) Planning Experiments July 2019 13 / 61

The experimental method (cont.)
Implementation
Carrying out the experiment.
Collecting the data, implementing any control protocols recognizedas necessary for this step and paying attention to any unusual aspectsof this step.
In collaboration with the Scientist, design a paper for collecting data(or an electronic equivalent, data-logger).
Pig Farm Feed . . . Weigth at . . . in kg . . . empty columns
1 1 A . . . . . .2 1 B . . . . . .3 1 C . . . . . . refused to eat4 2 A . . . . . .
Encourage the Scientist to record all the relevant data as soon aspossible, with NO copying, NO changing the order, NOintermediate calculations, NO leaving to juniors.
Clarice, Cristian, Renata (ESALQ/USP) Planning Experiments July 2019 14 / 61
The experimental method (cont.)
Analysing the dataLook over the data sheets for obvious anomalies and ask the Scientistto explain any dubious data, before he forgets.
should be planned at the design stage, but can be modified in the lightof unforeseen circumstances.
in principle, we should know how to do this by hand (using acalculator) but in practice we use suitable software.
Drawing conclusions and acting on them in relation to the originalproblem.
ANOVA tables, tables of means and standard errors, p-values may notmean much to the Scientist.
the Statistician must explain what this means in the Scientist’s context.
Clarice, Cristian, Renata (ESALQ/USP) Planning Experiments July 2019 15 / 61
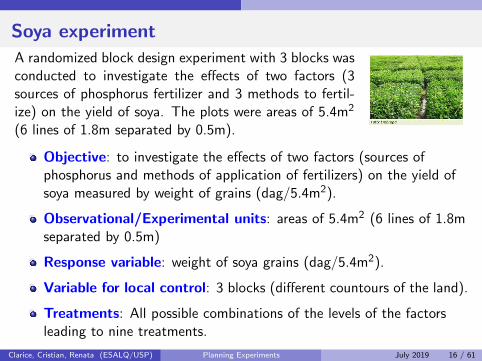
Soya experiment
A randomized block design experiment with 3 blocks wasconducted to investigate the effects of two factors (3sources of phosphorus fertilizer and 3 methods to fertil-ize) on the yield of soya. The plots were areas of 5.4m2
(6 lines of 1.8m separated by 0.5m).
Objective: to investigate the effects of two factors (sources ofphosphorus and methods of application of fertilizers) on the yield ofsoya measured by weight of grains (dag/5.4m2).
Observational/Experimental units: areas of 5.4m2 (6 lines of 1.8mseparated by 0.5m)
Response variable: weight of soya grains (dag/5.4m2).
Variable for local control: 3 blocks (different countours of the land).
Treatments: All possible combinations of the levels of the factorsleading to nine treatments.
Clarice, Cristian, Renata (ESALQ/USP) Planning Experiments July 2019 16 / 61

Soya experiment (cont.)
Explanatory variables (factors): There were two treatment factorsin this experiment and each factor was tested at three different levels.The treatment factors and their levels were:
sources of phosphorus: Superfosfato (90kg/ha of P2O5), Fosfato deOlinda (90kg/ha of P2O5), Superfosfato + Cloreto de Potassio(90kg/ha of P2O5 + 90kg/ha of K2O);
methods to fertilize: spreading the fertilizer, in the row by the seed, inthe row near the seed.
Experimental design: A randomized block design with 3 blocks and9 treatments.Measurement process: yield of soya measured by weight of grains(dag/5.4m2).Analysis: by graphical analysis and analysis of variance.Conclusions: A number of conclusions are drawn about the effect ofthe sources of phosphorus, the methods to fertilize and theirinteraction on the yield of soya.
Clarice, Cristian, Renata (ESALQ/USP) Planning Experiments July 2019 17 / 61

Definition of some key terms
Factor: the explanatory variable(s) manipulated or set by theexperimenter; can be quantitative and qualitative.
Levels of a Factor: the values that an individual factor takes.
Treatment: the complete description of what will be applied to anexperimental unit; a combination of one of the levels from each of thefactors and this combination is applied to particular experimentalunits.
Soya experiment: two factors with three levels each, resulting in ninetreatments
Sources of phosphorus: Superfosfato (90kg/ha of P2O5), Fosfato deOlinda (90kg/ha of P2O5), Superfosfato + Cloreto de Potassio(90kg/ha of P2O5 + 90kg/ha of K2O).
Methods to fertilize: spreading the fertilizer, in the row by the seed,in the row near the seed.
Clarice, Cristian, Renata (ESALQ/USP) Planning Experiments July 2019 18 / 61

Definition of some key terms (cont.)
Experimental unit: the smallest unit to which a single treatmentcould be randomly allocated.
Observational unit: the native physical entity that yields a singlevalue of the response variable (the smallest unit on which a responsewill be measured). In our case it is a plot since it produces a singlevalue of each of the response variable – the total weight of grains.
Note 1: In many experiments, the observational and experimentalunits are the same.
Note 2: An Experimental unit can give rise to manyObservational units.
Soya experiment:
Observational/Experimental units: areas of 5.4m2 (6 lines of 1.8mseparated by 0.5m).
Clarice, Cristian, Renata (ESALQ/USP) Planning Experiments July 2019 19 / 61

Examples of Experimental units
a plot in a land;
a vase with one plant or three plants, or a group ofvases;
a Petri dish with ten seeds;
a patient in a hospital (called a subject);
a lump of dough;
an animal or a group of animals in a pen;
a specific run on a machine with given conditions;
a batch of raw material.
Clarice, Cristian, Renata (ESALQ/USP) Planning Experiments July 2019 20 / 61
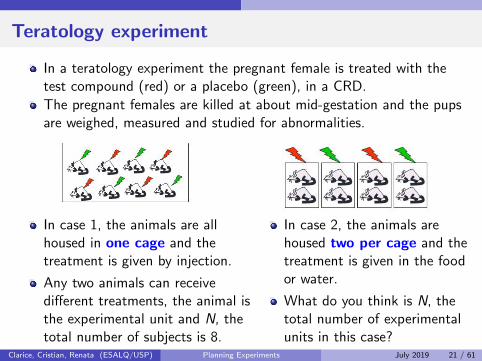
Teratology experiment
In a teratology experiment the pregnant female is treated with thetest compound (red) or a placebo (green), in a CRD.
The pregnant females are killed at about mid-gestation and the pupsare weighed, measured and studied for abnormalities.
In case 1, the animals are allhoused in one cage and thetreatment is given by injection.
Any two animals can receivedifferent treatments, the animal isthe experimental unit and N, thetotal number of subjects is 8.
In case 2, the animals arehoused two per cage and thetreatment is given in the foodor water.
What do you think is N, thetotal number of experimentalunits in this case?
Clarice, Cristian, Renata (ESALQ/USP) Planning Experiments July 2019 21 / 61

Border and core-plot or net plot
In some types of experiments it isnecessary to have borders or ’guardareas’.
If borders are necessary the plotconsists of a core-plot (surrounded bythe border) and the total-plot, whichincludes the border.
There may be additional uncropped pathways between the plots foraccess.
The plot yield can be measured as the sum of the individual plants inthe core-plot or as the total yield of the core-plot without separatingindividual plants.
In some circumstances measuring the yield of the total-plot may alsouseful to assess the effect the border had on the research design.
Clarice, Cristian, Renata (ESALQ/USP) Planning Experiments July 2019 22 / 61
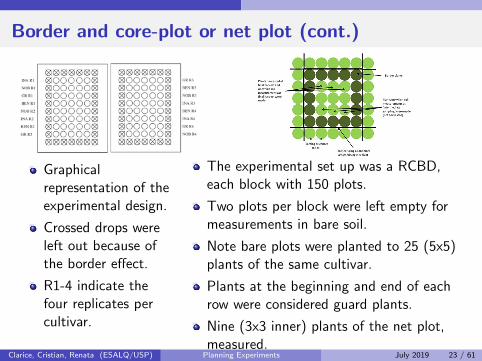
Border and core-plot or net plot (cont.)
Graphicalrepresentation of theexperimental design.
Crossed drops wereleft out because ofthe border effect.
R1-4 indicate thefour replicates percultivar.
The experimental set up was a RCBD,each block with 150 plots.
Two plots per block were left empty formeasurements in bare soil.
Note bare plots were planted to 25 (5x5)plants of the same cultivar.
Plants at the beginning and end of eachrow were considered guard plants.
Nine (3x3 inner) plants of the net plot,measured.
Clarice, Cristian, Renata (ESALQ/USP) Planning Experiments July 2019 23 / 61

Definition of some key terms (cont.)
Replications: the number of times that each treatment is tested.
Soya experiment: three replicates (three blocks).Teratology experiment: four (case 1) and two (case 2) replicates.
Local control (blocking): dividing up the experimental units intoblocks of alike units.
Soya experiment: three blocks (different countours of the land).Teratology experiment: no local control (CRD).
Response variable: what is measured, can be quantitative(continuous, discrete), qualitative or semi-quantitative.
Soya experiment: weight of soya grains (dag/5.4m2).Teratology experiment: weight, measures for abnormality.
Clarice, Cristian, Renata (ESALQ/USP) Planning Experiments July 2019 24 / 61

Three key techniques of experimental design
The three key basic principles, introduced byFisher in 1935, are:
replication,
randomization,
blocking.
Why use statistical principles in the design of experiments?
The short answer is: because of the uncontrolled variation.
Uncontrolled variation is the variation between units treated as similarlyas possible that arises from all the minor differences which we are unableto control.
Clarice, Cristian, Renata (ESALQ/USP) Planning Experiments July 2019 25 / 61

Uncontrolled variation
Uncontrolled variation is the variation between units treated as similarlyas possible that arises from all the minor differences which we are unableto control.
Soya experiment: The differences can likely be caused by a large numberof small uncontrollable differences, viz. slight differences in
environment - ambient temperature, soil conditions (fertility, acidity,humidity etc), pests, diseases etc;
raw materials - slight differences in seed (seedling) condition;
management regimes.
Teratology experiment: slight differences in initial weight, geneticbackground, health condition of the animals.
Clarice, Cristian, Renata (ESALQ/USP) Planning Experiments July 2019 26 / 61

Confounding
Two effects are said to be confounded when it is not possible toseparately estimate them.
The problem of the confounding of treatment effects withuncontrolled variation is widespread in the biological, physical andsocial sciences.
How does one overcome it?
Teratology experiment: the Treatment effect is confounded with animaleffect.
Answer: Use statistical principles: Replication, Randomization andBlocking, in the design of the experiment.
Note: We do not eliminate uncontrolled variation, rather we adoptstrategies that enable us to live with it.
Clarice, Cristian, Renata (ESALQ/USP) Planning Experiments July 2019 27 / 61

Replication
Replication
provides a measure of uncontrolled variation;
it is the application of each treatment several times, i.e., to severalexperimental units.
Note:
The spread in the replicate observations provides a measure ofuncontrolled variation.
Compare total spread with spread from uncontrolled variation aloneto decide if treatment has an effect.
Clarice, Cristian, Renata (ESALQ/USP) Planning Experiments July 2019 28 / 61
Randomization
Problem: While a measure of uncontrolled variability can beobtained, the observed treatment difference might be caused bysystematic effects.
To overcome systematic effects - Randomization.
Randomizationis the assignment of treatments to experimental units so that everyunit has the same probability of receiving each treatment.
results in an arrangement with no particular pattern.
The simplest statistical design involving randomization is theCompletely Randomized Design (CRD).
Clarice, Cristian, Renata (ESALQ/USP) Planning Experiments July 2019 29 / 61

CRD Vineyard experiment
A CRD with four replicates of a single treatment (yellow lines) and acontrol (blue lines) in (A) a small and (C) a mid-size vineyard block.Note: Both examples show buffer rows between treatments.Sometimes the same treatment may end up in adjacent rows.Schematic diagrams of the trials shown in A and C are shown in Band D, respectively.
Clarice, Cristian, Renata (ESALQ/USP) Planning Experiments July 2019 30 / 61

Why to randomize?
to overcome systematic effects – e.g. an engineering PhD studenttested all replicates of Machine 1 in January (Winter!), then he testedall replicates of Machine 2 in March (Spring!);
to avoid selection bias – e.g. a doctor selects the most healthypatients to receive his favorite treatment;
to avoid accidental bias – e.g. the technician takes rates from thecage one by one and gives the first treatment to the first six rats;
to stop experimenter cheating (for good or bad) – sometimes anexperimenter wants to make easier for the technician or thestatistician;
to force the experimenter to tell the truth – statistician andexperimenter agree on a design; statistician randomizes, gives to theexperimenter; experimenter says “I cannot do that because . . . ”
Clarice, Cristian, Renata (ESALQ/USP) Planning Experiments July 2019 31 / 61

Completely randomized design (CRD)
A completely randomized design is one in which each treatmentoccurs a specified, possibly unequal, number of times.
Suppose that there are t treatments and that treatment i is appliedto ri plots (is replicated ri times). Then
∑ti=1 ri = n.
If there is no need to group the plots into blocks the treatmentsshould be applied to the plots at random.
(i) Number the plots 1, 2, . . . , n(ii) Write down a systematic design:
put treatment 1 on plots 1, 2, . . . , r1put treatment 2 on plots r1 + 1, r2 + 2, . . . , r1 + r2, . . .
(iii) Choose a random permutation of 1,2, . . . , n and apply it to the design.
Clarice, Cristian, Renata (ESALQ/USP) Planning Experiments July 2019 32 / 61

CRD potato experiment
Consider five varieties with three, five, three, three and four replicates,respectively, to be randomized to 18 plots.Using library dae (Brien, 2018) from R, the result might be as follows.
Systematic design and permutation:St. O. 1 2 3 4 5 6 7 8 9 10 11 12 13 14 15 16 17 18Perm. 2 7 17 6 9 11 14 18 4 10 12 3 5 16 1 8 13 15Var. A A A B B B B B C C C D D D E E E E
Plan or layout (give to the Scientist)Plots 1 2 3 4 5 6 7 8 9 10 11 12 13 14 15 16 17 18Varieties E A D C D B A E B C B C E B E D A B
A layout in the field
The resulting arrangement isone with no particular pattern.
EE
E
E
EE
E
E
EE
E
E
EE
E
EA
AAA
AAA
AA
DD
D
DD
D
DD
DC C
C
C C
C
C C
CB BB B
BB BB B
BB BB B
BB BB B
BB BB B
BClarice, Cristian, Renata (ESALQ/USP) Planning Experiments July 2019 33 / 61

CRD
Unrandomized factor: Plots
1 2 3 4
5 6 7 8
9 10 11 12
A layout in the field, after randomization of treatments (randomizedfactor) to plots
A C A C
B A C A
B C B B
ANOVA Table
Source df SSq MSq F
Plots n − 1Treatments t − 1Residual n − t
Clarice, Cristian, Renata (ESALQ/USP) Planning Experiments July 2019 34 / 61
Blocking (local control)
If the plots are not all reasonably similar, we should group them intoblocks in such a way that plots within each block are reasonablysimilar, in order to improve the experiment by reducing amount ofvariability affecting the treatment differences.
Not absolutely necessary but very important because it allows somecontrol of uncontrolled variation.
Blocking is the grouping of experimental units into groups called Blocks,the units within a group being as similar as possible.
If possible1 blocks should have the same size;
2 blocks should be big enough to have each treatment at least once.
Clarice, Cristian, Renata (ESALQ/USP) Planning Experiments July 2019 35 / 61

Types of blocks
(i) Natural discrete divisionsyoung animals – litters;
people or animal – sex;
plots in a rice – paddy – irrigation groups;
industrial process – batches of chemical (of rawmaterial);
consumer experiment – tester, week;
lab experiment – technician, day, bench.
(ii) Continuous gradient of change – can choose boundaries forhomogeneity
plots in a field – small compact areas;
people or animals – age or weight or size;
clinical trial – severity of a disease;
long-term trial – time, periods.
Clarice, Cristian, Renata (ESALQ/USP) Planning Experiments July 2019 36 / 61

Types of blocks (cont.)
(iii) Blocking for managing the experiment
clinical trial – doctor or a nurse;
agricultural field trial – long thin area for tractor operation.
Important:
Everything (sowing, spraying, sampling, harvesting, measuring,injecting) done during the experiment needs to be doneblock-by-block, in case of interruptions, replacement of staff,improvements in technique etc.
Sometimes you may need more than one sort of block.
Clarice, Cristian, Renata (ESALQ/USP) Planning Experiments July 2019 37 / 61

RCBD Vineyard experiment
RCBD with three replicates of two treatments and one control.
The black frames in A and C represent the grouping of different zonesthat was done to account for variability due to slope.
In this design, the treatments and control (red, blue, and yellow lines)are randomized within each zone.
In the smaller field design (A), two to three vines in a single rowmight be the replicate unit.
In a larger design (C), three to five vines across multiple rows mightserve as the replicate unit.
Schematic diagrams of the trials shown in A and C are shown in Band D, respectively, where individual cells represent a single vine.
Photos and illustrations by Hemant Gohil.
Clarice, Cristian, Renata (ESALQ/USP) Planning Experiments July 2019 38 / 61
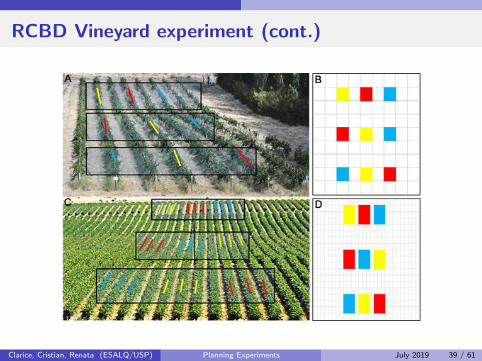
RCBD Vineyard experiment (cont.)
Clarice, Cristian, Renata (ESALQ/USP) Planning Experiments July 2019 39 / 61

Obtaining a layout for an RCBD in R
To obtain randomized layouts we need to:(1) Apply the treatments to the plots in Block 1, and randomize, just asfor a completely randomized design.(2) Repeat for each block, using a fresh randomization every time.
Potato RCBD experiment: The effects of three varieties (A, B and C)of potato are to be investigated. The experiment will be conducted using4 blocks (different areas) with 3 plots and randomizing the 3 varieties tothe 3 plots in each block.
A layout in the field, using pack-age dae (Brien, 2018)
The blocks are columns.
C
C
C
C
C
C
C
C
C
C
C
C
C
C
C
CA A
AAA A
AAA A
AAA A
AA
B
BB
B
B
BB
B
B
BB
B
B
BB
B
Clarice, Cristian, Renata (ESALQ/USP) Planning Experiments July 2019 40 / 61

RCBD
Unrandomized factors:Blocks, Plots (Plots nestedwithin Blocks)
Block 1 1 2 3
Block 2 1 2 3
Block 3 1 2 3
A layout in the field, after random-ization of treatments (randomizedfactor) to plots within blocks
Block 1 B C A
Block 2 C A B
Block 3 C B A
ANOVA Table
Source df SSq MSq F Prob
Blocks (r − 1)Plots[Blocks] r(t − 1)
Treat t − 1Residual (r-1)(t-1)
Clarice, Cristian, Renata (ESALQ/USP) Planning Experiments July 2019 41 / 61
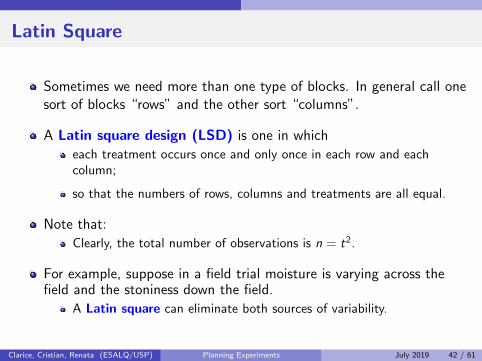
Latin Square
Sometimes we need more than one type of blocks. In general call onesort of blocks “rows” and the other sort “columns”.
A Latin square design (LSD) is one in which
each treatment occurs once and only once in each row and eachcolumn;
so that the numbers of rows, columns and treatments are all equal.
Note that:
Clearly, the total number of observations is n = t2.
For example, suppose in a field trial moisture is varying across thefield and the stoniness down the field.
A Latin square can eliminate both sources of variability.
Clarice, Cristian, Renata (ESALQ/USP) Planning Experiments July 2019 42 / 61

LS tree species experiment
The first field experiment in the world to use a randomized experimentaldesign established by the Forestry Commission in March 1929, on a hillsidenear Beddgelert Forest, designed by Fisher. ( c© The Forestry Commission)
Clarice, Cristian, Renata (ESALQ/USP) Planning Experiments July 2019 43 / 61
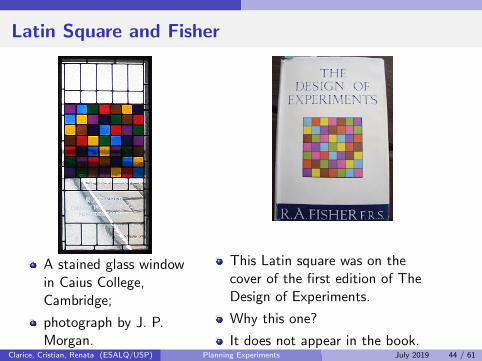
Latin Square and Fisher
A stained glass windowin Caius College,Cambridge;
photograph by J. P.Morgan.
This Latin square was on thecover of the first edition of TheDesign of Experiments.
Why this one?
It does not appear in the book.It does not match any knownexperiment designed by Fisher.
Why is it called “Latin”?
Clarice, Cristian, Renata (ESALQ/USP) Planning Experiments July 2019 44 / 61

Obtaining a layout for an LS in R
randomly select one of the systematic LS designs for a value of t;
randomly permute the rows and then the columns;
randomly assign letters to treatments.
A layout in the field, usingpackage dae (Brien, 2018)
B
B
B
B
B
B
B
B
B
B
B
B
B
B
B
B
B
B
B
B
B
B
B
B
B
D
D
D
D
D
D
D
D
D
D
D
D
D
D
D
D
D
D
D
D
D
D
D
D
D
A
A
A
A
A
A
A
A
A
A
A
A
A
A
A
A
A
A
A
A
A
A
A
A
A
C
C
C
C
C
C
C
C
C
C
C
C
C
C
C
C
C
C
C
C
C
C
C
C
C
E
E
E
E
E
E
E
E
E
E
E
E
E
E
E
E
E
E
E
E
E
E
E
E
E
Clarice, Cristian, Renata (ESALQ/USP) Planning Experiments July 2019 45 / 61

LS
Unrandomized factors: Rows, Columns (Rows, Columns crossed)
5× 5 Latin Square
Column Less
1 2 3 4 5 stony of
I I,1 I,2 I,3 I,4 I,5 field
II II,1 II,2 II,3 II,4 II,5 ⇓Row III III,1 III,2 III,3 III,4 III,5 ⇓
IV IV,1 IV,2 IV,3 IV,4 IV,5 ⇓V V,1 V,2 V,3 V,4 V,5 Stonier
end of
field
Less More
moisture ⇒⇒⇒ moisture
Varieties
A, B, C, D, E
Clarice, Cristian, Renata (ESALQ/USP) Planning Experiments July 2019 46 / 61

LS
A layout in the field, after randomization
5× 5 Latin Square
Column Less
1 2 3 4 5 stony of
I A D C E B field
II C A E B D ⇓Row III B E D A C ⇓
IV E C B D A ⇓V D B A C E Stonier
end of
field
Less More
moisture ⇒⇒⇒ moisture
Varieties
A, B, C, D, E
Clarice, Cristian, Renata (ESALQ/USP) Planning Experiments July 2019 47 / 61
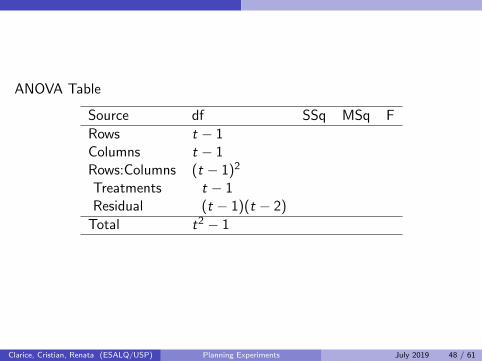
ANOVA Table
Source df SSq MSq F
Rows t − 1Columns t − 1Rows:Columns (t − 1)2
Treatments t − 1Residual (t − 1)(t − 2)
Total t2 − 1
Clarice, Cristian, Renata (ESALQ/USP) Planning Experiments July 2019 48 / 61

6x6 Latin Square at Rothamsted
Clarice, Cristian, Renata (ESALQ/USP) Planning Experiments July 2019 49 / 61

Design of factorial experiments
Often, the experimenter is interested in more than one factor.
Experiments that involve more than one randomized or treatmentfactor are called factorial experiments.
In general, the number of treatments in a factorial experiment is theproduct of the numbers of levels of the treatment factors.
The disadvantage of this is that the number of treatments increasesvery quickly.
Given the number of treatments, the experiment could be laid out as
a Completely Randomized Design,a Randomized Complete Block Design ora Latin Square with that number of treatments.
The incomplete block designs, such as BIBDs or Youden Squares arenot suitable for factorial experiments.
Clarice, Cristian, Renata (ESALQ/USP) Planning Experiments July 2019 50 / 61

Advantages of factorial experiments
Relative to one-factor-at-a-time experiments, factorial experimentshave the advantages that:
if the factors interact, factorial experiments allow this to be detectedand estimates of the interaction effect can be obtained, and
if the factors are independent, factorial experiments result in theestimation of the main effects with greater precision.
Clarice, Cristian, Renata (ESALQ/USP) Planning Experiments July 2019 51 / 61

Design of split-plot experiments (SPLD)
Designs in which main effects confounded with more variable unitssuch as large plots.
Their defining attribute is that there is randomization to two differentphysical entities such that some main effects are randomized to themore variable entities.
The standard split-plot design is one in which two factors, say Aand B with a and b levels, respectively are assigned as follows:
one of the factors, A say, is randomized according to a RCBD with sayr blocks andeach of its ra plots, called the main plots, is split into b subplots (orsplit-plots) and levels of B randomized independently in each subplot.Altogether the experiment involves n = rab subplots.
That is, the generic factor names for this design are Blocks,MainPlots, SubPlots, A and B.
Clarice, Cristian, Renata (ESALQ/USP) Planning Experiments July 2019 52 / 61

Split-plot principle
Very flexible principle that can be used to generate a large number ofdifferent types of experiments.
For example, the main plots could be arranged in any of a CRD, RCBD,Latin square, balanced incomplete bock design (BIBD), Youden Square
each plot of the design is subdivided into subplots.
The subplots may utilize more complicated designs as well.
For example, the main plots may be arranged in a RCBD each of whichare subdivided in such a way as to allow a Latin Square to be placed ineach main plot.
Also, subplots can be split into subsubplots and subsubplots into ...
Nor is one restricted to applying just one factor to each type of unit.
More than one factor can be randomized to main plots, more than oneto subplots and so on.
The standard split-plot design is nearly the simplest possibility; only a CRDin the main plots would be simpler.
Clarice, Cristian, Renata (ESALQ/USP) Planning Experiments July 2019 53 / 61

When to use a split-plot design
1. When the physical attributes of a factor require the use of larger unitsof experimental material than other factors.
For example, land preparation treatments usually require to beperformed on larger areas of land than do the sowing of differentvarieties (due to the different pieces of equipment).
Temperature control for storage purposes involves the use of relativelylarge chambers in which several samples can usually be stored.
Different processing runs are often of a minimum size such that theirproduce can be readily subdivided for the application of furthertreatments.
Also, some factors are relatively hard to change. For example, thetemperature of a production operation is often difficult to change sothat it might be better to change it less often by making it a main-plotfactor.
Clarice, Cristian, Renata (ESALQ/USP) Planning Experiments July 2019 54 / 61

When to use a split-plot design (cont.)
2. When it is desired to incorporate an additional factor into anexperiment.
3. When it is expected that differences amongst the levels of certainfactors are larger than amongst those of other factors.
The levels of the factors with larger differences are randomized to mainplots.
One effect of this may be to increase the precision of comparisonsbetween the levels of the other factors.
4. When it is desired to ensure greater precision between some factorsthan others.
Irrespective of the size of the differences between the main plottreatment factors, it is desired to increase the precision of some factorsby assigning them to subplots.
One may be less interested in main effects of some factors. A particularexample of such factors is “noise” factors.
Clarice, Cristian, Renata (ESALQ/USP) Planning Experiments July 2019 55 / 61

Designing a standard split-plot experiment
In the standard split-plot, the main-plot treatment factor, A, israndomized to main plots and the subplot treatment factor, B, israndomized to subplots.
Production rate experiment
Suppose that one is interested in comparing 3 methods of workorganization and 3 sources of raw material on the production rate of acertain product.
Decided that four factories are to be used in the experiment and thateach factory is to be divided into three areas.
The methods of work organization are to be assigned at random toareas.
Each area is to be subdivided into 3 parts and the source of rawmaterial for each part is obtained by randomizing the three sources tothe three parts.
Clarice, Cristian, Renata (ESALQ/USP) Planning Experiments July 2019 56 / 61
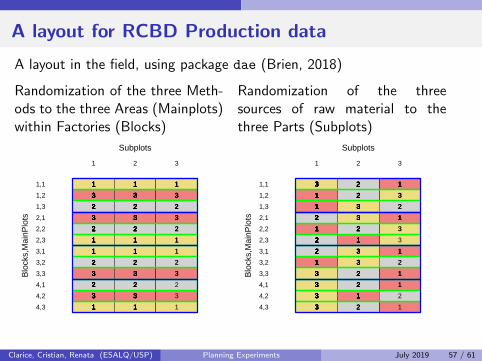
A layout for RCBD Production data
A layout in the field, using package dae (Brien, 2018)
Randomization of the three Meth-ods to the three Areas (Mainplots)within Factories (Blocks)
1,1
1,2
1,3
2,1
2,2
2,3
3,1
3,2
3,3
4,1
4,2
4,3
Blo
cks,
Mai
nPlo
ts
Subplots
1 2 3
1
1
1
1
1
1
1
1
1
1
1
1
1
1
1
1
1
1
1
1
1
1
1
1
1
1
1
1
1
1
1
1
1
1
1
1
1
1
1
1
1
1
1
1
1
1
1
1
1
1
1
1
1
1
1
1
1
1
1
1
1
1
1
1
1
1
1
1
1
1
1
1
1
1
1
1
1
1
1
1
1
1
1
1
1
1
1
1
1
1
1
1
1
1
1
1
1
1
1
1
1
1
1
1
1
1
1
1
1
1
1
1
1
1
1
1
1
1
1
1
1
1
1
1
1
1
1
1
1
1
1
1
1
1
1
1
1
1
1
1
1
1
1
1
3
3
3
3
3
3
3
3
3
3
3
3
3
3
3
3
3
3
3
3
3
3
3
3
3
3
3
3
3
3
3
3
3
3
3
3
3
3
3
3
3
3
3
3
3
3
3
3
3
3
3
3
3
3
3
3
3
3
3
3
3
3
3
3
3
3
3
3
3
3
3
3
3
3
3
3
3
3
3
3
3
3
3
3
3
3
3
3
3
3
3
3
3
3
3
3
3
3
3
3
3
3
3
3
3
3
3
3
3
3
3
3
3
3
3
3
3
3
3
3
3
3
3
3
3
3
3
3
3
3
3
3
3
3
3
3
3
3
3
3
3
3
3
3
2
2
2
2
2
2
2
2
2
2
2
2
2
2
2
2
2
2
2
2
2
2
2
2
2
2
2
2
2
2
2
2
2
2
2
2
2
2
2
2
2
2
2
2
2
2
2
2
2
2
2
2
2
2
2
2
2
2
2
2
2
2
2
2
2
2
2
2
2
2
2
2
2
2
2
2
2
2
2
2
2
2
2
2
2
2
2
2
2
2
2
2
2
2
2
2
2
2
2
2
2
2
2
2
2
2
2
2
2
2
2
2
2
2
2
2
2
2
2
2
2
2
2
2
2
2
2
2
2
2
2
2
2
2
2
2
2
2
2
2
2
2
2
2
Randomization of the threesources of raw material to thethree Parts (Subplots)
1,1
1,2
1,3
2,1
2,2
2,3
3,1
3,2
3,3
4,1
4,2
4,3
Blo
cks,
Mai
nPlo
ts
Subplots
1 2 3
3
3
3
3
3
3
3
3
3
3
3
3
3
3
3
3
3
3
3
3
3
3
3
3
3
3
3
3
3
3
3
3
3
3
3
3
3
3
3
3
3
3
3
3
3
3
3
3
3
3
3
3
3
3
3
3
3
3
3
3
3
3
3
3
3
3
3
3
3
3
3
3
3
3
3
3
3
3
3
3
3
3
3
3
3
3
3
3
3
3
3
3
3
3
3
3
3
3
3
3
3
3
3
3
3
3
3
3
3
3
3
3
3
3
3
3
3
3
3
3
3
3
3
3
3
3
3
3
3
3
3
3
3
3
3
3
3
3
3
3
3
3
3
3
1
1
1
1
1
1
1
1
1
1
1
1
1
1
1
1
1
1
1
1
1
1
1
1
1
1
1
1
1
1
1
1
1
1
1
1
1
1
1
1
1
1
1
1
1
1
1
1
1
1
1
1
1
1
1
1
1
1
1
1
1
1
1
1
1
1
1
1
1
1
1
1
1
1
1
1
1
1
1
1
1
1
1
1
1
1
1
1
1
1
1
1
1
1
1
1
1
1
1
1
1
1
1
1
1
1
1
1
1
1
1
1
1
1
1
1
1
1
1
1
1
1
1
1
1
1
1
1
1
1
1
1
1
1
1
1
1
1
1
1
1
1
1
1
2
2
2
2
2
2
2
2
2
2
2
2
2
2
2
2
2
2
2
2
2
2
2
2
2
2
2
2
2
2
2
2
2
2
2
2
2
2
2
2
2
2
2
2
2
2
2
2
2
2
2
2
2
2
2
2
2
2
2
2
2
2
2
2
2
2
2
2
2
2
2
2
2
2
2
2
2
2
2
2
2
2
2
2
2
2
2
2
2
2
2
2
2
2
2
2
2
2
2
2
2
2
2
2
2
2
2
2
2
2
2
2
2
2
2
2
2
2
2
2
2
2
2
2
2
2
2
2
2
2
2
2
2
2
2
2
2
2
2
2
2
2
2
2
Clarice, Cristian, Renata (ESALQ/USP) Planning Experiments July 2019 57 / 61

Experimental validity
The assessment of the quality of an experimental design requiresknowledge of the factors that influence or cause variation in themeasured outcomes.
With the potato experiment, what factors affect yield and what canwe do about these factors in the design of the experiment?
Two concepts help with this:
Internal validity: conclusions can be appropriately drawn from withinthis experiment about the relationship between the independent anddependent variable.
External validity: conclusions from the experiment can beappropriately generalised to a wider situation of interest.
Clarice, Cristian, Renata (ESALQ/USP) Planning Experiments July 2019 58 / 61

Data analysis
DataContinuous Discrete
Counts ProportionsNormality Non-normality
ANOVA Regression
TransformationNon-parametric
tests
Continuous GLM(gama, inverse-Gaussian)
Diagnostics(residual, qqplots)
Adding other explanotoryvariables
Hypothesis tests
Multiple comparison Contrasts Tests of treatment effects (F, χ2) Likelihood ratio tests
OverdispersionQuasi-PoissonNegative binomialZero-inflated modelsPoisson-normalMixture models
OverdispersionQuasi-binomialBetabinomialZero-inflated modelsLogistic-normalMixture models
GLM Poisson GLM binomial
Clarice, Cristian, Renata (ESALQ/USP) Planning Experiments July 2019 59 / 61

Final remarks
Get statistical thinking involved early when you are preparing todesign an experiment!
Getting well into an experiment before you have considered theseimplications can be disastrous.
Think and experiment sequentially.
Experimentation is a process where what you know informs the designof the next experiment, and what you learn from it becomes theknowledge base to design the next.
To call in the statistician after the experiment is done may be nomore than asking him to perform a post-mortem examination: hemay be able to say what the experiment died of!
’Presidential Address by Professor R. A. Fisher, Sc.D., F.R.S. Sankhya:The Indian Journal of Statistics (1933-1960), 4: 14-17, 1938’.
Clarice, Cristian, Renata (ESALQ/USP) Planning Experiments July 2019 60 / 61

References
Brien, C.J. (2010) Design and randomization-based analysis ofexperiments in R. URL: http://chris.brien.name/ee2.
Brien, C.J. (2018). dae: Functions Useful in the Design and ANOVA ofExperiments. R package version 3.0-23.https://CRAN.R-project.org/package=dae
Fisher, R.A. (1926) The Arrangement of Field Experiments. J. Minist.Agric. 33: 53-513.
Fisher, R.A. (1935). The Design of Experiments. Oliver and Boyd,Edinburgh.
Clarice, Cristian, Renata (ESALQ/USP) Planning Experiments July 2019 61 / 61