Solid-State NMR Correlation Experiments and Distance Measurements in Paramagnetic Metalorganics...
7
DOI: 10.1002/cphc.201300119 Solid-State NMR Correlation Experiments and Distance Measurements in Paramagnetic Metalorganics Exemplified by Cu-Cyclam Shashi K. Kumara Swamy, [a] Agnieszka Karczmarska, [a] Malgorzata Makowska-Janusik, [b] Abdelhadi Kassiba, [a] and Jens Dittmer* [a] 1. Introduction Metalorganic and organometallic complexes can be found in many natural systems and their applications reach from provid- ing reactive sites in pharmacy and biology to catalysts in or- ganic chemistry. One important method used for their charac- terization is nuclear magnetic resonance (NMR) spectroscopy. However, if the metal complex is paramagnetic, NMR charac- terization is hindered by the hyperfine interaction of the nucle- ar spin with the unpaired electron spin. Methodological prog- ress in NMR led to solutions how to deal with other interac- tions that are small perturbations of the Zeeman interaction such as the chemical shift, J-, dipolar, and quadrupolar cou- pling. Particularly for solutions of biological macromolecules, methods have been developed to deal with the hyperfine in- teraction, which has been exploited to obtain structural infor- mation, for example, in the form of distances (by measuring nuclear relaxation), [1] angles (by measuring pseudocontact shifts), [2] or immersion into a membrane (by measuring relaxa- tion). [3] Recently, these methods have been extended to bio- molecules in the solid phase. [4] However, in solid samples with relatively small structural units, and thus short distances of the nuclei to the paramagnetic center, NMR analysis is often inhib- ited. The hyperfine shift superimposes the chemical shift and renders signal assignment by comparison with chemical shift tables impossible. The contact shift [5] is generally dominating for distances below 10 , while dipolar coupling between an unpaired electron and a nucleus [5] rather becomes manifest in line broadening through relaxation or through its anisotropy. In this article, we focus on this short distance range. As a model system, we chose the complex of the macrocyclic ligand cyclam coordinating a Cu(II) ion in a crystalline phase with Cl - anions. The Cu-cyclam complex shows various configu- rations in solution and has a stable trans-III configuration in the solid phase. [6] Metal-cyclam complexes have potential ap- plications in pharmaceutical industries, for example, as raw ma- terial for anti-HIV and anti-cancer drugs. [6] They can also be used as active groups in mesoporous structures, thereby func- tional materials with applications in electronics and optics, [7] or in chemical sensing with high sensitivity. [8] The distances to the central ion are between 2.0 for the ligating nitrogens and 4.4 for two of the equatorial hydrogens. In this distance range, electron–nuclear dipolar coupling can cause an extremely fast relaxation which not only introduces additional line broadening, but also renders the conventional NMR experiments developed for solids unusable. The excited coherences relax already during the application of the pulse sequence before the acquisition of the time signal (FID). Pulse sequences for such systems must therefore not exceed a few hundred microseconds in the best case. The magnitude of nu- clear relaxation covers a wide range. It depends on the elec- tronic spin, electronic spin relaxation, and the distance to the paramagnetic center. Cu 2 + ions have an effective electronic spin of S e = 1 = 2 , and represent examples for which the perturba- tion by hyperfine interactions is not too extreme. [9] For such [a] S. K. Kumara Swamy, A. Karczmarska, Prof. A. Kassiba, Prof. J. Dittmer Institut des MolØcules et MatØriaux du Mans (IMMM) UMR CNRS 6283, LUNAM, UniversitØ du Maine Avenue Olivier Messiaen, 72085 Le Mans (France) Fax: (+ 33)2 43 83 3518 E-mail : [email protected] [b] Prof. M. Makowska-Janusik Insitute of Physics, Jan Dlugosz University Al. Armii. Krajowej 13/15, 42-200 Czestochowa (Poland) Supporting information for this article is available on the WWW under http://dx.doi.org/10.1002/cphc.201300119. We show how to record and analyze solid-state NMR spectra of organic paramagnetic complexes with moderate hyperfine interactions using the Cu-cyclam complex as an example. As- signment of the 13 C signals was performed with the help of density functional theory (DFT) calculations. An initial assign- ment of the 1 H signals was done by means of 1 H– 13 C correla- tion spectra. The possibility of recording a dipolar HSQC spec- trum with the advantage of direct 1 H acquisition is discussed. Owing to the paramagnetic shifting the resolution of such par- amagnetic 1 H spectra is generally better than for diamagnetic solid samples, and we exploit this advantage by recording 1 H– 1 H correlation spectra with a simple and short pulse sequence. This experiment, along with a Karplus relation, allowed for the completion of the 1 H signal assignment. On the basis of these data, we measured the distances of the carbon atoms to the copper center in Cu-cyclam by means of 13 C R 2 relaxation ex- periments combined with the electronic relaxation determined by EPR. # 2013 Wiley-VCH Verlag GmbH & Co. KGaA, Weinheim ChemPhysChem 2013, 14, 1864 – 1870 1864 CHEMPHYSCHEM ARTICLES
Transcript of Solid-State NMR Correlation Experiments and Distance Measurements in Paramagnetic Metalorganics...

DOI: 10.1002/cphc.201300119
Solid-State NMR Correlation Experiments and DistanceMeasurements in Paramagnetic Metalorganics Exemplifiedby Cu-CyclamShashi K. Kumara Swamy,[a] Agnieszka Karczmarska,[a] Malgorzata Makowska-Janusik,[b]
Abdelhadi Kassiba,[a] and Jens Dittmer*[a]
1. Introduction
Metalorganic and organometallic complexes can be found inmany natural systems and their applications reach from provid-ing reactive sites in pharmacy and biology to catalysts in or-ganic chemistry. One important method used for their charac-terization is nuclear magnetic resonance (NMR) spectroscopy.However, if the metal complex is paramagnetic, NMR charac-terization is hindered by the hyperfine interaction of the nucle-ar spin with the unpaired electron spin. Methodological prog-ress in NMR led to solutions how to deal with other interac-tions that are small perturbations of the Zeeman interactionsuch as the chemical shift, J-, dipolar, and quadrupolar cou-pling. Particularly for solutions of biological macromolecules,methods have been developed to deal with the hyperfine in-teraction, which has been exploited to obtain structural infor-mation, for example, in the form of distances (by measuringnuclear relaxation),[1] angles (by measuring pseudocontactshifts),[2] or immersion into a membrane (by measuring relaxa-tion).[3] Recently, these methods have been extended to bio-molecules in the solid phase.[4] However, in solid samples withrelatively small structural units, and thus short distances of thenuclei to the paramagnetic center, NMR analysis is often inhib-
ited. The hyperfine shift superimposes the chemical shift andrenders signal assignment by comparison with chemical shifttables impossible. The contact shift[5] is generally dominatingfor distances below 10 �, while dipolar coupling between anunpaired electron and a nucleus[5] rather becomes manifest inline broadening through relaxation or through its anisotropy.
In this article, we focus on this short distance range. Asa model system, we chose the complex of the macrocyclicligand cyclam coordinating a Cu(II) ion in a crystalline phasewith Cl- anions. The Cu-cyclam complex shows various configu-rations in solution and has a stable trans-III configuration inthe solid phase.[6] Metal-cyclam complexes have potential ap-plications in pharmaceutical industries, for example, as raw ma-terial for anti-HIV and anti-cancer drugs.[6] They can also beused as active groups in mesoporous structures, thereby func-tional materials with applications in electronics and optics,[7] orin chemical sensing with high sensitivity.[8] The distances to thecentral ion are between 2.0 � for the ligating nitrogens and4.4 � for two of the equatorial hydrogens.
In this distance range, electron–nuclear dipolar coupling cancause an extremely fast relaxation which not only introducesadditional line broadening, but also renders the conventionalNMR experiments developed for solids unusable. The excitedcoherences relax already during the application of the pulsesequence before the acquisition of the time signal (FID). Pulsesequences for such systems must therefore not exceed a fewhundred microseconds in the best case. The magnitude of nu-clear relaxation covers a wide range. It depends on the elec-tronic spin, electronic spin relaxation, and the distance to theparamagnetic center. Cu2+ ions have an effective electronicspin of Se = 1=2, and represent examples for which the perturba-tion by hyperfine interactions is not too extreme.[9] For such
[a] S. K. Kumara Swamy, A. Karczmarska, Prof. A. Kassiba, Prof. J. DittmerInstitut des Mol�cules et Mat�riaux du Mans (IMMM)UMR CNRS 6283, LUNAM, Universit� du MaineAvenue Olivier Messiaen, 72085 Le Mans (France)Fax: (+ 33) 2 43 83 3518E-mail : [email protected]
[b] Prof. M. Makowska-JanusikInsitute of Physics, Jan Dlugosz UniversityAl. Armii. Krajowej 13/15, 42-200 Czestochowa (Poland)
Supporting information for this article is available on the WWW underhttp://dx.doi.org/10.1002/cphc.201300119.
We show how to record and analyze solid-state NMR spectraof organic paramagnetic complexes with moderate hyperfineinteractions using the Cu-cyclam complex as an example. As-signment of the 13C signals was performed with the help ofdensity functional theory (DFT) calculations. An initial assign-ment of the 1H signals was done by means of 1H–13C correla-tion spectra. The possibility of recording a dipolar HSQC spec-trum with the advantage of direct 1H acquisition is discussed.Owing to the paramagnetic shifting the resolution of such par-
amagnetic 1H spectra is generally better than for diamagneticsolid samples, and we exploit this advantage by recording 1H–1H correlation spectra with a simple and short pulse sequence.This experiment, along with a Karplus relation, allowed for thecompletion of the 1H signal assignment. On the basis of thesedata, we measured the distances of the carbon atoms to thecopper center in Cu-cyclam by means of 13C R2 relaxation ex-periments combined with the electronic relaxation determinedby EPR.
� 2013 Wiley-VCH Verlag GmbH & Co. KGaA, Weinheim ChemPhysChem 2013, 14, 1864 – 1870 1864
CHEMPHYSCHEMARTICLES

systems, hyperfine interactions cause even certain benefits, inparticular for metalorganic complexes. In 2003 and 2005 Ishiiand co-workers found that under very fast magic-angle spin-ning, typically well beyond 20 kHz, 13C and 1H signals, respec-tively, arise.[10, 11] This discovery meant a breakthrough in solid-state NMR of paramagnetic metalorganic systems. Under suchspinning conditions decoupling of the 1H–1H dipolar networkis facilitated by the larger differences in resonance frequenciesdue to the hyperfine shifts. In addition, the resolution benefitsfrom the dispersion of the signals over a much larger range ofshifts, which in many cases overcompensates for the additionalbroadening.[9] The range of 1H NMR spectra is some hundredppm for paramagnetic systems compared to 15 ppm for dia-magnetic ones. Thus, even direct 1H spectroscopy is possiblefor solid paramagnetic systems where it is impossible for anal-ogous diamagnetic ones. In addition, the extremely fast longi-tudinal relaxation due to paramagnetic interaction allows forthe experiment to be repeated orders of magnitudes moreoften within a given period of time than in the diamagneticcase.[10] This compensates partially for the signal loss throughrelaxation, in particular in 13C experiments. Nevertheless, thepulse sequences have to be adapted to the rapid relaxationconditions. For example, Kervern et al.[12] have shown that a 1H–13C polarization transfer by a TEDOR or INEPT type of sequenceis often superior to cross-polarization (CP). In 1H–13C correlationexperiments the CP block is therefore replaced accordingly.[12]
One goal of the present work is the extension of such correla-tion experiments. From the 1H–13C correlation spectra, one candeduce some of the proton resonances, once the carbon reso-nance is known. However, the correlations are not always com-plete; in particular, cross peaks to 1H signals that are shiftedvery far tend to be missing. Moreover, there is ambiguity in allcases where more than one proton is bonded to a carbon. InNMR experiments of diamagnetic solutions one applies 1H–1Hcorrelation experiments, but in the case of solids poor 1H reso-lution usually inhibits viable spectra. In this paper we explorethe possibilities of exploiting the better spectral resolution ofparamagnetic solids in order to obtain 1H–1H correlation ex-periments that give the missing information for 1H signal as-signment. As for all interactions in NMR, hyperfine couplingdoes not only mean perturbation, complicating the experi-ment; it also contains useful information. The electron–nucleardipolar interaction depends on the average distance of theelectron to the nucleus. Herein, we investigate whether, andwith what precision, one can determine copper–carbon distan-ces by measuring the relaxation of 13C magnetization that is in-duced by this very interaction.
2. Results1H and 13C One-Dimensional Solid-State NMR, Spin Densities,and 13C Assignment
Spinning the sample faster than 25 kHz results in relativelywell-resolved 1H signals (Figure 1 A), as has been discovered byWickramasinghe et al. for Cu-alanine.[11] The hyperfine couplingnot only improves spectral resolution by better dispersing the
signals, but also helps to partially decouple the proton–protondipolar network.[9, 11] Only peak Hd1 is already sharp at low spin-ning rates and is therefore assigned to diamagnetic cyclamunits without copper center. Sidebands were distinguishedfrom isotropic peaks by comparing spectra of different spin-ning speeds. Recording 13C NMR spectra by applying a simpleecho pulse sequence without cross-polarization or 1H decou-pling but very fast repetition[10] (48 ms interscan delay) yieldsthree principal peaks, one in the normal chemical shift rangeand two shifted up-field, one of which being split and theother one relatively broad (Figure 1 B). The chemical structureof cyclam (Figure 1 C) contains likewise three different principalcarbon sites.
The contact shifts dfc depend on the electronic spin densi-ties 1 at the positions of the nuclei ~r, as defined in Equation(1):
dfc ¼ Se þ 1ð Þ g2m2Bm0
9 kBT1ð~rÞ ð1Þ
where dfc is given as relative frequency, Se denotes the totalelectronic spin, g the electronic spin g-factor, and the othervariables have their usual meaning.[13] In order to assign the
Figure 1. 1D 1H (A) and 13C (B) spectra of the Cu-cyclam complex (C). Starsdenote spinning side bands.
� 2013 Wiley-VCH Verlag GmbH & Co. KGaA, Weinheim ChemPhysChem 2013, 14, 1864 – 1870 1865
CHEMPHYSCHEMARTICLES www.chemphyschem.org

carbon signals, the spin densities were calculated by means ofdensity functional theory (DFT). They are shown in Table 1 forall carbon nuclei together with the corresponding contactshifts dfc. The contact shifts were added to the calculatedchemical shifts. The total theoretical shifts allowed for an un-ambiguous assignment of the three 13C principal peaks. The b-carbons in the six-membered rings are furthest away from theCu center and have a very small spin density, so that thechemical shift is dominating (C1). The signal between �150and �200 ppm is assigned to the four a-carbons, and the cal-culations even reproduce its splitting which is caused by anasymmetry between the two six-membered rings in chair con-formation.[14] This allows for a tentative assignment of the twosub-peaks (C2a, C2b in Figure 1 B and C). However, one must ac-knowledge that doped cyclam is a flexible molecule existing indifferent conformations possessing more than one localenergy minimum. Other computational approaches yield a con-formation where the diagonal opposite a-carbons have similardistances to Cu.[15] In all cases an asymmetry is obtained dueto the binding of cyclam to only one Cl�ion. The four carbonsin the two five-membered rings also group to two sub-sites inthe calculations. In the spectrum, however, they merge toa single broad peak C3.
Overall, the calculations of the contact shifts allow for an un-ambiguous assignment that matches the expectations. Due tooverlap and the number of signals, the assignment of the hy-drogen spectrum by DFT would not be so easy to assess. DFT-calculated shifts can reproduce the experimental ones well, asit was the case above, but there can also be tremendous dis-crepancies.[16] We therefore try to assign the 1H signals by NMRtechniques and compare the assignment in the end with theshifts obtained by DFT calculations.
13C–1H Correlation Experiments for 1H Assignment
The basis of the assignment of the 1H signals was the transferof the 13C assignment by correlation experiments. Most infor-mation stems from a refocused dipolar INEPT experimentwhich is similar to the TEDOR version of Kervern et al.[12] (Fig-ure 2 A). As the fundamental obstacle for 1H NMR of solids—the loss of resolution due to large line widths—is overcome
for paramagnetic systems, one could envisage the perfor-mance of correlation experiments by 1H acquisition, optimallyas a dipolar version of the HSQC.[17] One would, as in liquid-state NMR, benefit from the higher sensitivity of 1H signal de-tection. Figure 2 C shows a dipolar HSQC of the H1/C1 signals.In comparison to a conventional HSQC in liquid-state NMR,which exploits J-coupling, the transfer times are only one rotorperiod (33.3 ms), which is thus shorter by two orders of magni-tude, and the 13C p pulses are omitted in order to allow fora recoupling of the (1 � wr) modulated term of the dipolarHamiltonian (Figure 2 B). This experiment however suffers froma stochastic breakthrough of signals from hydrogens attachedto 12C, so that the theoretical advantage in sensitivity couldnot be achieved. In contrary, a high number of repetitions wasnecessary to observe cross peaks of the two H1 signals, whileother signals could not be observed at all.
The correlation spectra allow for an attribution of two hy-drogen signals to signal C1 and one each to C2a, C2b, and C3.The far-shifted signal at 177 ppm and the signal at 6.4 ppm donot correlate with any of the carbon signals. The latter, show-ing no correlation signals in any experiment, is identified asyet another diamagnetic signal from non-coordinating cyclamunits (Hd2). There is a different hyperfine shift expected foraxial and equatorial protons, as the hyperfine coupling followsa Karplus-type dependence of the dihedral angle q defined bythe dihedron Cu�N�C�H [Eq. (2)]:[18, 19]
dfc ¼ a cos2 q þ b cos q þ c ð2Þ
As coefficient a @ b and c, equatorial hydrogen atomsshould in general display a stronger hyperfine shift. We there-fore assign the signal at �18 ppm to the equatorial hydrogenof C1 and the signal at �11 ppm to the axial one. C2a, C2b, and
Figure 2. A) Dipolar INEPT spectrum correlating 1H and 13C hyperfine shifts.B) and C) Dipolar HSQC sequence (acquisition on 1H) and spectrum of thecorrelations to C1.
Table 1. Spin densities at the carbon nucleus, hyperfine and chemicalshifts calculated by DFT and compared to experimental shifts.
1
[10�3 au]dcalc
fc
[ppm]dcalc
dia
[ppm]dcalc
tot
[ppm]dexpt
[ppm]
a �0.06 �6 25C1 31 25
b �0.03 �3 28
a �1.84 �196 �141 �142C2 55
b �2.50 �266 �212 �173
a �3.32 �354 �301C3 54 �324
b �3.80 �405 �350
� 2013 Wiley-VCH Verlag GmbH & Co. KGaA, Weinheim ChemPhysChem 2013, 14, 1864 – 1870 1866
CHEMPHYSCHEMARTICLES www.chemphyschem.org

C3 each correlate with only one 1H signal rather than two. Fur-thermore, there is the amine HN. Thus, there are four more 1Hsignals expected whereas only one 1H signal is completely un-assigned (177 ppm).
Completion of 1H Assignment by 1H–1H Correlation
In liquid-state NMR, 1H–1H correlation spectra, such as COSY,TOCSY and NOESY are the most frequently applied 2D experi-ments. In solid-state NMR such spectroscopy is rarely possibledue to signal broadening. With the better 1H signal resolutionin paramagnetic NMR, correlation spectra by means of strongdipolar coupling should be possible as long as relaxation is nottoo fast with respect to the 1H–1H magnetization transfer. Weapplied a simple 2D sequence without any recoupling fora transfer by the strong homonuclear dipolar couplings, fol-lowed by a rotor synchronized echo sequence (Figure 3 B). Dia-magnetic signals are diminished by saturation through weakcontinuous irradiation during interscan delay and mixing. Fig-ure 3 A shows the spectrum for a mixing time of tmix = 140 ms.In order to avoid too much overlap by spectral aliasing, the t1
increments are reduced to one quarter of the rotation time(spectral width 120 kHz). The spectrum is dominated by diago-nal and secondary diagonal peaks (due to spinning sidebands), but there are several cross peaks visible: axH2b corre-lates with eqH1, but not with axH1, and axH2a correlates with axH3.Most interesting is the strong cross peak of the so far unas-signed 177 ppm signal to H3, indicating that it stems from theequatorial H3. Cross peaks between axH1 and eqH1, confirmingthat they are attached to the same carbon, are manifestedonly as shoulders of the diagonal peaks. There is however noindication of a cross peak between the signals of the two axH2,even at longer mixing times. Although reaching the limit ofresolution, one would at least expect a sign in the form ofa broadening if the two different C2a and C2b were bonded tothe same C1, as the distances between two axial H2 would beabout 2.5 �. Its absence means that H2a and H2b are relativelyfar from each other, that is, in different six-membered rings, asalready concluded from the DFT calculations of the hyperfineshifts. When increasing the mixing time towards 1 ms, spin dif-fusion leads to mutual cross peaks of all signals except for thediamagnetic Hd1 and Hd2. Figure 3 C concludes the dipolar con-nectivities (without symmetrical redundancies). The lacking 1Hsignals for eqH2 and HN could be found among the spinningside bands by a stepwise variation of the temperature down to281 K. As the contact shift is inverse proportional to the tem-perature (Curie’s law), signals with strong contact coupling canbe distinguished from spinning side bands by their strongtemperature dependence (see the Supporting Information).Two further signals were found this way, one at 370 and oneat �240 ppm (at 58 8C). According to Equation (2), eqH2 is notto be expected to have negative shifts if axH2 is positive, andthus the signal at 370 ppm is assigned to this proton (withoutany distinction of sites a and b), whereas the signal at�240 ppm is assigned to HN. This is confirmed by DFT calcula-tions (listed in Table 2) showing a negative spin density at HN
due to spin polarization. Comparison of the other calculated
shifts with the NMR assignment in general shows a goodagreement. The discrimination of the sub-sites a and b couldhowever be reproduced in only one case. The HN of site b isprobably too much covered by side bands.
Figure 3. A) 1H–1H correlation spectrum obtained with the pulse sequenceshown in (B) with a mixing time of 140 ms (cross-peaks of axH1 to eqH1 are su-perimposed by the diagonal peaks and not visible in this representation).C) Conclusion of the correlations/vicinities observed by the 1H–1H experi-ment.
Table 2. Spin densities at the hydrogen nucleus, hyperfine and chemicalshifts calculated by DFT compared to experimental shifts.
1
[10�3 au]dcalc
fc
[ppm]dcalc
dia
[ppm]dcalc
tot
[ppm]dexpt
[ppm]
axH1 �0.09 �10 1.5 �8.5 -11eqH1 �0.18 �19 2.0 �17 -18axH2 0.47/0.58[a] 50/62[a] 3.0 53/65[a] 54/58[a]
eqH2 2.97/3.58[a] 316/381[a] 3.2 319/384[a] 370axH3 0.14 15 2.9 18 15eqH3 1.69/1.94[a] 180/206[a] 2.9 183/209[a] 176HN �1.90/�0.94[a] �202/�100[a] 2.2 �200/�98[a] �240
[a] Site a/b.
� 2013 Wiley-VCH Verlag GmbH & Co. KGaA, Weinheim ChemPhysChem 2013, 14, 1864 – 1870 1867
CHEMPHYSCHEMARTICLES www.chemphyschem.org
Copper–Carbon Distances Measured by R2 Relaxation
Dipolar relaxation rates of nuclei close to a paramagneticcenter depend in first approximation (point-dipole approxima-tion) on the distance r between nucleus and central atom andtherefore should allow for a measurement of this distance. Inthe following we test the suitability of this approach with thetransverse relaxation rates R2 of the carbon nuclei. The contri-bution of the dipolar coupling between unpaired electron andnucleus to the transverse relaxation rate in a rigid solid isshown in Equation (3):[18, 20]
R2 ¼1
15m0
4p
� �2m2
Bg2g2SeðSe þ 1Þ 1r6 4tc þ
3tc
1þ w2nt2
c
þ 13tc
1þ w2et2
c
� �
ð3Þ
where wn and we are the Larmor frequencies of the nucleusand the electron. The rate depends on two external parame-ters, the distance to the central atom and the correlation timetc of the fluctuation of the electron–nuclear dipolar interaction.For most metal ions in solids, the dominating process causingfluctuations of the interaction is the flipping of the spin orien-tation of the electron, described by the relaxation time(s), withthe approximation tc�T e
1 .[18, 21, 22] We tentatively set T e1 �T e
2
which we estimated from the line width DB of the electronparamagnetic resonance (EPR) signal according to Equa-tion (4):[23]
ðT e2 Þ�1 ¼
ffiffiffi3p
2mB
�hg DB ð4Þ
We find DB = 100 G and the average Land� g factor [Eq. (5)]:
g_ ¼ gII þ 2g?ð Þ=3 ¼ 2:180þ 2� 2:055ð Þ=3 ¼ 2:10 ð5Þ
thus tc�T e2 = 0.6 ns.
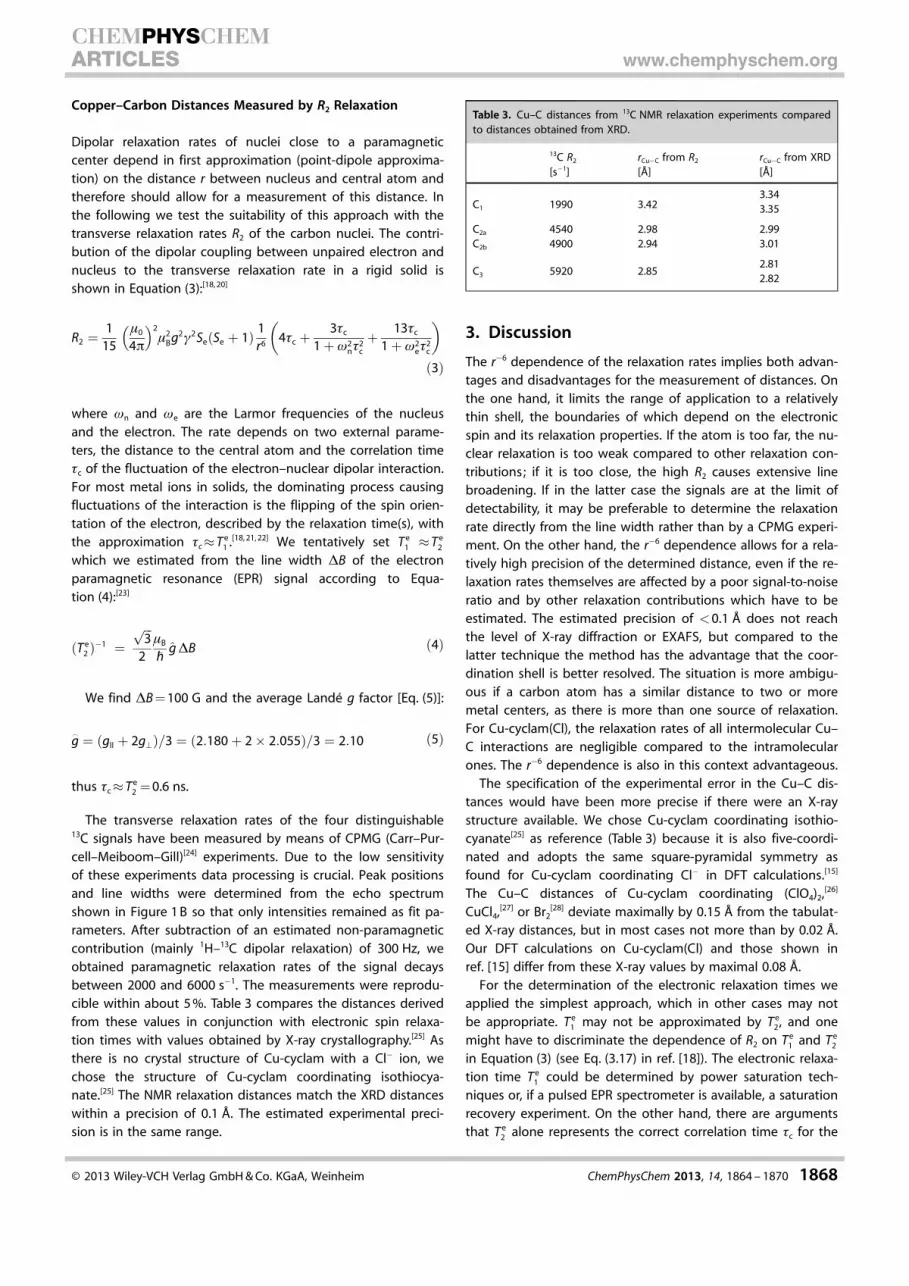
The transverse relaxation rates of the four distinguishable13C signals have been measured by means of CPMG (Carr–Pur-cell–Meiboom–Gill)[24] experiments. Due to the low sensitivityof these experiments data processing is crucial. Peak positionsand line widths were determined from the echo spectrumshown in Figure 1 B so that only intensities remained as fit pa-rameters. After subtraction of an estimated non-paramagneticcontribution (mainly 1H–13C dipolar relaxation) of 300 Hz, weobtained paramagnetic relaxation rates of the signal decaysbetween 2000 and 6000 s�1. The measurements were reprodu-cible within about 5 %. Table 3 compares the distances derivedfrom these values in conjunction with electronic spin relaxa-tion times with values obtained by X-ray crystallography.[25] Asthere is no crystal structure of Cu-cyclam with a Cl� ion, wechose the structure of Cu-cyclam coordinating isothiocya-nate.[25] The NMR relaxation distances match the XRD distanceswithin a precision of 0.1 �. The estimated experimental preci-sion is in the same range.
3. Discussion
The r�6 dependence of the relaxation rates implies both advan-tages and disadvantages for the measurement of distances. Onthe one hand, it limits the range of application to a relativelythin shell, the boundaries of which depend on the electronicspin and its relaxation properties. If the atom is too far, the nu-clear relaxation is too weak compared to other relaxation con-tributions; if it is too close, the high R2 causes extensive linebroadening. If in the latter case the signals are at the limit ofdetectability, it may be preferable to determine the relaxationrate directly from the line width rather than by a CPMG experi-ment. On the other hand, the r�6 dependence allows for a rela-tively high precision of the determined distance, even if the re-laxation rates themselves are affected by a poor signal-to-noiseratio and by other relaxation contributions which have to beestimated. The estimated precision of <0.1 � does not reachthe level of X-ray diffraction or EXAFS, but compared to thelatter technique the method has the advantage that the coor-dination shell is better resolved. The situation is more ambigu-ous if a carbon atom has a similar distance to two or moremetal centers, as there is more than one source of relaxation.For Cu-cyclam(Cl), the relaxation rates of all intermolecular Cu–C interactions are negligible compared to the intramolecularones. The r�6 dependence is also in this context advantageous.
The specification of the experimental error in the Cu–C dis-tances would have been more precise if there were an X-raystructure available. We chose Cu-cyclam coordinating isothio-cyanate[25] as reference (Table 3) because it is also five-coordi-nated and adopts the same square-pyramidal symmetry asfound for Cu-cyclam coordinating Cl� in DFT calculations.[15]
The Cu–C distances of Cu-cyclam coordinating (ClO4)2,[26]
CuCl4,[27] or Br2[28] deviate maximally by 0.15 � from the tabulat-
ed X-ray distances, but in most cases not more than by 0.02 �.Our DFT calculations on Cu-cyclam(Cl) and those shown inref. [15] differ from these X-ray values by maximal 0.08 �.
For the determination of the electronic relaxation times weapplied the simplest approach, which in other cases may notbe appropriate. T e
1 may not be approximated by T e2, and one
might have to discriminate the dependence of R2 on T e1 and T e
2
in Equation (3) (see Eq. (3.17) in ref. [18]). The electronic relaxa-tion time T e
1 could be determined by power saturation tech-niques or, if a pulsed EPR spectrometer is available, a saturationrecovery experiment. On the other hand, there are argumentsthat T e
2 alone represents the correct correlation time tc for the
Table 3. Cu–C distances from 13C NMR relaxation experiments comparedto distances obtained from XRD.
13C R2
[s�1]rCu�C from R2
[�]rCu�C from XRD[�]
C1 1990 3.423.343.35
C2a 4540 2.98 2.99C2b 4900 2.94 3.01
C3 5920 2.852.812.82
� 2013 Wiley-VCH Verlag GmbH & Co. KGaA, Weinheim ChemPhysChem 2013, 14, 1864 – 1870 1868
CHEMPHYSCHEMARTICLES www.chemphyschem.org

fluctuation of the dipolar interaction.[22] Wickramasingheet al.[29] compared the electronic correlation time determinedfrom nuclear relaxation with the coupling between electronicspins of the metal centers of different molecular units. Further-more, the EPR line width can contain other contributions thanthe actual relaxation T e
2 . Inhomogeneous broadening and ex-perimental artifacts as saturation would lead to an underesti-mation of T e
2 .The procedure for the determination of the Cu–C distances
implies several approximations: the model uses the point-dipole approximation, averaging the positions of the delocal-ized electrons to the metal nucleus. The electronic relaxation ismeasured at a lower magnetic field typical for EPR experi-ments. The electronic relaxation time was measured by theEPR linewidth, and, as outlined above, it was assumed thattransverse and longitudinal electronic relaxations are similar.Furthermore, relaxation by Fermi contact interaction whichcould become significant for high-spin densities was neglected(its correlation time is not necessarily the same as that for thedipolar relaxation). The good precision of the distances deter-mined by R2 relaxation rates might appear surprising in thisregard; moreover, as a similar approach using longitudinal (R1)relaxation was not successful. The determination of the Cu–Cdistances by means of transverse relaxation rates R2 ratherthan longitudinal relaxation rates R1 might appear inconven-ient. For other related purposes, such as so-called paramagnet-ic relaxation enhancement (PRE) experiments typically appliedto biological macromolecules,[1, 3, 4] an R1 experiment is used. Itis technically easier and normally less prone to artifacts. Theseexperiments however usually measure longer distances bysmall rate increases which are usually interpreted in a semi-quantitative way yielding relative distance information. Forshorter distances, the longitudinal relaxation should as thetransverse one be dominated by electron–nuclear dipolar cou-plings, and the R1 rate depends in a similar way on the dis-tance [Eq. (6)]:[18, 20]
R1 ¼2
15m0
4p
� �2m2
B g2g2 SeðSe þ 1Þ 1r6
3tc
1þ w2nt2
c
þ 7tc
1þ w2et2
c
� �
ð6Þ
We determined these rates for the four 13C signals by meansof saturation recovery and inversion recovery experiments.However, they are in the average about one order of magni-tudes too low compared to the theory. The fact that the exper-imental rates are too low (rather than too high) excludes thepossibility that the discrepancy is due to additional relaxationcontributions such as inter-nuclear dipolar or Fermi contact in-teraction. Interestingly, the rates appear to be consistent withthe rates found by Wickramasinghe et al.[30] on Cu(DL-Ala)2,a comparable system. The authors of this study did not directlydetermine the distances by Equation (6), but calibrated themwith one single distance determined by X-ray diffraction. Areason for the unexpected rates might lie in using the point-dipole approximation[20] rather than integrating the inversesixth power of the nuclear distances to the unpaired electronover space, weighted by the spin densities.[31] But even withthis procedure one would expect that the corrected calcula-
tions predict higher rather than lower rates. The low ratesrather indicate an ambiguity in the correlation times of thefluctuation of the hyperfine interaction that induces a certainrelaxation.
4. Conclusions
We have shown how to reach a nearly complete assignment of1H signals of a solid paramagnetic metalorganic system bymeans of 1H–13C dipolar INEPT and a 1H–1H correlation experi-ments. Furthermore, the general feasibility of a dipolar HSQCexperiment was demonstrated. The bottleneck for NMR analy-sis of paramagnetic systems is the need for DFT calculationsfor the prior assignment of the 13C signals. The metal–carbondistances could be measured with a precision of 0.1 � bymeans of transverse relaxation (R2) experiments. It remains tobe understood why the more common R1 experiments giverates that are by far too low compared to the theory.
Experimental Section
Sample Preparation
The copper-cyclam complex chloro-1,4,8,11-tetraazacyclotetrade-cane copper (II) was prepared as previously described.[15] The com-plexation of cyclam by copper was achieved in an ethanolic solu-tion containing CuCl2. Heating the solution, filtering, and ethanolwashing of the final reaction purified the product from excess ofcopper and ensured the metal location inside the cyclam rings.The fraction of cyclam molecules that did not chelate a copper ionwas estimated by means of a one pulse 1H NMR spectrum witha long interscan delay to 5–10 % (data not shown). A room-temper-ature powder X-ray diffractogram was acquired; its sharp signalsare characteristic of a well-crystallized phase.
Solid-State NMR Spectroscopy
Solid-state NMR spectra were acquired on a Bruker Avance III300 MHz spectrometer equipped with a double-resonance 2.5 mmVTN probe. All experiments were performed under MAS with a fre-quency of 30 kHz at room temperature. The sample temperaturewas 58 8C due to friction. The spectra were referenced to tetrame-thylsilane (TMS). Both 1H and 13C one-dimensional (1D) spectrawere acquired by means of a Hahn echo experiment with hardpulses with nutation frequencies of 136 kHz for 1H and 143 kHz for13C (excitation pulse p90 = 1.84 ms for 1H and 1.75 ms for 13C). For allexperiments an interscan delay between 40 and 55 ms was set. Nodecoupling was applied during the indirect evolution or during theacquisition period of any 1D or 2D experiment. 13C transverse relax-ation rates (R2) were measured by means of the CPMG[24] experi-ment. For 2D 1H–13C correlation, a variation of dipolar INEPT orTEDOR[12, 32, 33] was applied with a mixing time of two rotor periods(66.7 ms). Pulse sequences for dipolar HSQC and 1H–1H correlationare described in Section 2. For 1D 1H and 13C spectra 128 K and1024 K scans were accumulated, respectively, for the 13C relaxationspectra 128 K scans, for the dipolar INEPT 64 complex data pointswith 32 K scans each, incremented by 16.67 ms, for the dipolarHSQC 16 complex data points with 16 K scans, incremented by33.33 ms, and for the 1H-1H correlation experiment 148 incrementswith 512 scans, incremented by 8.33 ms. For all 2D experiments,the States-TPPI quadrature detection scheme was applied.
� 2013 Wiley-VCH Verlag GmbH & Co. KGaA, Weinheim ChemPhysChem 2013, 14, 1864 – 1870 1869
CHEMPHYSCHEMARTICLES www.chemphyschem.org

EPR Spectroscopy
Continuous-wave (CW)-EPR experiments were performed ona Bruker EMX spectrometer working with X-band (9.5 GHz). Thespectra were recorded at room temperature by using low micro-wave power (20 mW), a modulation field of 5 G, and 100 kHz asa standard modulation frequency. The spectral parameters (g-tensor, line width) were determined with the Bruker software Sim-Fonia.
DFT Calculations
The calculations of Fermi contact shifts and diamagnetic chemicalshifts of Cu-cyclam monochloride were performed with DFT usingthe generalized gradient approximation (GGA) applying the hybridpotential implemented in the program Gaussian 09.[34] Two Opter-on 2.3 GHz processors with 16 GB RAM of a Beowulf-type parallelcomputing facility were used. An initial X-ray structure of the Cu-cyclam complex was obtained from ref. [25]. The structure wasadapted (SCN� was replaced by Cl�) manually by means of theprogram GaussView 5.0. A full geometry optimization of this struc-ture was performed with the unrestricted Hartree–Fock method(UHF) at the B3LYP[35] level of theory with the 6–311G basis set. Theself-consistent field (SCF) convergence was equal to 10�6 Hartreeor up to 64 iterations. The vibration frequencies showed no imagi-nary modes. Upon calculations in the UHF approximation, Gaussi-an 09 generates a list of unpaired electron spin densities and Fermicontact couplings at the positions of all nuclei of NMR interest, outof which the Fermi contact shifts were determined. The optimizedstructure of Cu-cyclam was furthermore used for the calculation ofthe (diamagnetic) chemical shifts with the 6–311 + G(2d,p) basisset. These shifts were referenced to TMS (calculated with the sametheory and basis set) and added to the hyperfine shifts.
Acknowledgements
The authors acknowledge the Region Pays de la Loire for finan-cial support (Convention No. 2007–11860). We would like tothank Prof. Ahmad Mehdi for the Cu-cyclam sample, Dr. UdayRavella for the X-ray crystallography test, and Ms. Ren�e Du-quette, Dr. Morwenna Pearson-Long, and Dr. Cindie Kehlet forcritically revising the manuscript.
Keywords: density functional calculations · nuclear magneticresonance spectroscopy · hyperfine coupling · metalorganics ·solid state
[1] a) P. A. Kosen, Methods Enzymol. 1989, 177, 86 – 121; b) L. Banci, C. Lu-chinat, Inorg. Chim. Acta 1998, 275, 373 – 379.
[2] L. Banci, I. Bertini, K. L. Bren, M. A. Cremonini, H. B. Gray, C. Luchinat, P.Turano, J. Biol. Inorg. Chem. 1996, 1, 117 – 126.
[3] a) M. Respondek, T. Madl, C. Gçbl, R. Golser, K. Zangger, J. Am. Chem.Soc. 2007, 129, 5228 – 5234; b) J. Dittmer, L. Thøgersen, J. Underhaug, K.Bertelsen, T. Vosegaard, J. M. Pedersen, B. Schiøtt, E. Tajkhorshid, T.Skrydstrup, N. C. Nielsen, J. Phys. Chem. B 2009, 113, 6928 – 6937.
[4] R. Linser, U. Fink, B. Reif, J. Am. Chem. Soc. 2009, 131, 13703 – 13708.[5] a) N. Bloembergen, W. C. Dickinson, Phys. Rev. 1950, 79, 179 – 180;
b) H. M. McConnell, R. E. Robertson, J. Chem. Phys. 1958, 29, 1361 –1365; c) A. Nayeem, J. P. Yesinowski, J. Chem. Phys. 1988, 89, 4600 –4608.
[6] M. Liang, M. Weish�upl, J. A. Parkinson, S. Parsons, P. A. McGregor, P. J.Sadler, Chem. Eur. J. 2003, 9, 4709 – 4717.
[7] A. Kassiba, M. Makowska-Janusik, J. Aluzun, W. Kafrouni, A. Mehdi, C.Rey�, R. J. Corriu, A. Gibaud, J. Phys. Chem. Solids 2006, 67, 875 – 881.
[8] P. Xu, H. Yu, X. Li, Anal. Chem. 2011, 83, 3448 – 3454.[9] K. Liu, D. Ryan, K. Nakanishi, A. McDermott, J. Am. Chem. Soc. 1995, 117,
6897 – 6906.[10] Y. Ishii, N. P. Wickramasinghe, S. Chimon, J. Am. Chem. Soc. 2003, 125,
3438 – 3439.[11] N. P. Wickramasinghe, M. Shaibat, Y. Ishii, J. Am. Chem. Soc. 2005, 127,
5796 – 5797.[12] G. Kervern, G. Pintacuda, Y. Zhang, E. Oldfield, C. Roukoss, E. Kuntz, E.
Herdtweck, J. M. Basset, S. Cadars, A. Lesage, C. Cop�ret, L. Emsley, J.Am. Chem. Soc. 2006, 128, 13545 – 13552.
[13] a) I. Bertini, C. Luchinat, NMR of Paramagnetic Molecules in BiologicalSystems, Benjamin Cummings, MenloPark, CA, 1986 ; b) S. J. Wilkens, B.Xia, F. Weinhold, J. L. Markley, W. M. Westler, J. Am. Chem. Soc. 1998,120, 4806 – 4814; c) J. Mao, Y. Zhang, E. Oldfield, J. Am. Chem. Soc. 2002,124, 13911 – 13920.
[14] A. Dei, Inorg. Chem. 1979, 18, 891 – 894.[15] M. Makowska-Janusik, A. Kassiba, N. Errien, A. Mehdi, J. Inorg. Organo-
met. Polym. 2010, 20, 761 – 773.[16] F. Rastrelli, A. Bagno, Chem. Eur. J. 2009, 15, 7990 – 8004.[17] a) G. Bodenhausen, D. J. Ruben, Chem. Phys. Lett. 1980, 69, 185 – 189;
b) I. Schnell, B. Langer, S. H. M. Sçntjens, M. H. P. van Genderen, R. P. Sij-besma, H. W. Spiess, J. Magn. Reson. 2001, 150, 57 – 70.
[18] I. Bertini, C. Luchinat, Coord. Chem. Rev. 1996, 150, 1 – 296.[19] M. Karplus, J. Am. Chem. Soc. 1963, 85, 2870 – 2871.[20] a) I. Solomon, Phys. Rev. 1955, 99, 559 – 565; b) N. Bloembergen, L. O.
Morgan, J. Chem. Phys. 1961, 34, 842 – 850.[21] R. E. Connick, D. Fiat, J. Chem. Phys. 1966, 44, 4103 – 4107.[22] J. Reuben, G. H. Reed, M. Cohn, J. Chem. Phys. 1970, 52, 1617 – 1618.[23] M. D. Kemple, H. J. Stapleton, Phys. Rev. B 1972, 5, 1668 – 1675.[24] a) H. Y. Carr, E. M. Purcell, Phys. Rev. 1954, 94, 630 – 638; b) S. Meiboom,
D. Gill, Rev. Sci. Instrum. 1958, 29, 688 – 691.[25] T. H. Lu, T. H. Tahirov, Y. L. Liu, C. S. Chung, C. C. Huang, Y. S. Hong, Acta
Crystallogr. C 1996, 52, 1093 – 1095.[26] P. A. Tasker, L. Sklar, J. Cryst. Mol. Struct. 1975, 5, 329 – 344.[27] Z. Wang, R. D. Willett, S. Molnar, K. J. Brewer, Acta Crystallogr. Section C
1996, 52, 581 – 583.[28] X. Chen, G. Long, R. D. Willett, T. Hawks, S. Molnar, K. Brewer, Acta Crys-
tallogr. Section C 1996, 52, 1924 – 1928.[29] N. P. Wickramasinghe, M. A. Shaibat, C. R. Jones, B. L. Casabianca, A. C.
de Dios, J. S. Harwood, Y. Ishii, J. Chem. Phys. 2008, 128, 052210 –052215.
[30] N. P. Wickramasinghe, M. A. Shaibat, Y. Ishii, J. Phys. Chem. B 2007, 111,9693 – 9696.
[31] a) H. P. W. Gottlieb, M. Barfield, D. M. Doddrell, J. Chem. Phys. 1977, 67,3785 – 3794; b) D. F. Hansen, J. J. Led, Proc. Natl. Acad. Sci. USA 2006,103, 1738 – 1743; c) D. F. Hansen, W. M. Westler, M. B. Kunze, J. L. Mark-ley, F. Weinhold, J. J. Led, J. Am. Chem. Soc. 2012, 134, 4670 – 4682.
[32] N. P. Wickramasinghe, Y. Ishii, J. Magn. Reson. 2006, 181, 233 – 243.[33] A. W. Hing, S. Vega, J. Schaefer, J. Magn. Reson. 1992, 96, 205 – 209.[34] Gaussian 09 (Revision A.1), M. J. Frisch, G. W. Trucks, H. B. Schlegel, G. E.
Scuseria, M. A. Robb, J. R. Cheeseman, G. Scalmani, V. Barone, B. Men-nucci, G. A. Petersson, H. Nakatsuji, M. Caricato, X. Li, H. P. Hratchian,A. F. Izmaylov, J. Bloino, G. Zheng, J. L. Sonnenberg, M. Hada, M. Ehara,K. Toyota, R. Fukuda, J. Hasegawa, M. Ishida, T. Nakajima, Y. Honda, O.Kitao, H. Nakai, T. Vreven, J. A. Montgomery, Jr. , J. E. Peralta, F. Ogliaro,M. Bearpark, J. J. Heyd, E. Brothers, K. N. Kudin, V. N. Staroverov, R. Ko-bayashi, J. Normand, K. Raghavachari, A. Rendell, J. C. Burant, S. S. Iyen-gar, J. Tomasi, M. Cossi, N. Rega, J. M. Millam, M. Klene, J. E. Knox, J. B.Cross, V. Bakken, C. Adamo, J. Jaramillo, R. Gomperts, R. E. Stratmann,O. Yazyev, A. J. Austin, R. Cammi, C. Pomelli, J. W. Ochterski, R. L. Martin,K. Morokuma, V. G. Zakrzewski, G. A. Voth, P. Salvador, J. J. Dannenberg,S. Dapprich, A. D. Daniels, O. Farkas, J. B. Foresman, J. V. Ortiz, J. Cio-slowski, D. J. Fox, Gaussian, Inc. , Wallingford, CT, 2009.
[35] a) A. D. Becke, Phys. Rev. A 1988, 38, 3098 – 3100; b) A. D. Becke, J.Chem. Phys. 1993, 98, 5648 – 5652.
Received: February 4, 2013
� 2013 Wiley-VCH Verlag GmbH & Co. KGaA, Weinheim ChemPhysChem 2013, 14, 1864 – 1870 1870
CHEMPHYSCHEMARTICLES www.chemphyschem.org