Bulk magnetic susceptibility shifts in nmr studies of compartmentalized samples: use of paramagnetic...
24
MAGNETIC RESONANCE IN MEDICINE 13,239-262 ( 1990) Bulk Magnetic Susceptibility Shifts in NMR Studies of Compartmentalized Samples: Use of Paramagnetic Reagents * SIMON C.-K. CHU, YAN Xu, JAMES A. BALSCHI, AND CHARLES S. SPRINGER, JR Department of Chemist y, State University ofNew York, Stony Brook, New York I 1794-3400 Received November 16, 1988;revised March 6, 1989 The bulk magnetic susceptibility (BMS) shift of a nuclear resonance frequency caused by a paramagneticcompound is of importance in in vivo NMR, both magnetic resonance spectroscopyand magnetic resonance imaging. However, since it is a rather complicated phenomenon, it has been the source of many misinterpretations in the literature. We have reworked and organized the theory of the BMS shift. This includes accounting for the important effects oflocal susceptibility.We have conducted experiments on phantom samples in order to illustratethe principles involved. Our phantoms consist of capillaries and coaxial cylinders. They simulate the situations of blood vessels oriented parallel and perpendicular to the magnetic field and the interstitial spacessurrounding them. In most of our experiments, the paramagnetic compound was one of several different hyperfine shift reagents for cation resonances. These were chosen to cover a range of potencies, in both magnitude and sign, of the shifts they produce. However, we also used a reagent which was incapable of inducing a hyperfine shift and thus could cause only a BMS shift. Although we report only 23Na spectra in this paper, the latter samples simulate the cases where one observes the water 'H resonance in experiments employing hyperfine shift reagents for cations. There have been a number of such investigations recently reported in the literature. The principles considered in this paper allow us to offer new interpre- tations for the results of several experiments published in the last few years. o 1990 Aca- demic Press, Inc. INTRODUCTION Paramagnetic compounds can induce shifts in nuclear spin resonance frequencies, increases in nuclear spin relaxation rate constants, or, usually, both. In the former capacity, such compounds are often called shift reagents ( SRs) and in the latter, relax- ation (or shift-less)reagents ( RRs). In medical NMR, paramagnetic compounds are used as contrast reagents (CRs) in magnetic resonance imaging (MRI) and as dis- crimination reagents (DRs) in magnetic resonance spectroscopy (MRS) . For the most part, contrast reagents have been compounds used in their capacities as RRs (I) while discrimination reagents are compounds which are acting as SRs (2-5). However, in a number of instances, relaxation reagents have been used as DRs in * Taken, in part, from the Ph.D. dissertation of S. C.-K. Chu, State University of New York, Stony Brook, NY, 1986. Presented, in part, at the 28th Experimental NMR Conference, Asilomar, CA, 8 April, 1987; the 6th Annual Meeting of the Society of Magnetic Resonance in Medicine, New York, NY, 17 August, 1987; and the 2nd European Congressof NMR in Medicine and Biology, Berlin, 23 June, 1988. 239 0740-3194190 $3.00 Copyright 0 1990 by Academic Press, Inc. All rights of reproduction in any form reserved.
-
Upload
hms-harvard -
Category
Documents
-
view
1 -
download
0
Transcript of Bulk magnetic susceptibility shifts in nmr studies of compartmentalized samples: use of paramagnetic...
MAGNETIC RESONANCE IN MEDICINE 13,239-262 ( 1990)
Bulk Magnetic Susceptibility Shifts in NMR Studies of Compartmentalized Samples: Use of Paramagnetic Reagents *
SIMON C.-K. CHU, YAN Xu, JAMES A. BALSCHI, AND CHARLES S. SPRINGER, JR
Department of Chemist y, State University ofNew York, Stony Brook, New York I 1794-3400
Received November 16, 1988; revised March 6, 1989
The bulk magnetic susceptibility (BMS) shift of a nuclear resonance frequency caused by a paramagnetic compound is of importance in in vivo NMR, both magnetic resonance spectroscopy and magnetic resonance imaging. However, since it is a rather complicated phenomenon, it has been the source of many misinterpretations in the literature. We have reworked and organized the theory of the BMS shift. This includes accounting for the important effects oflocal susceptibility. We have conducted experiments on phantom samples in order to illustrate the principles involved. Our phantoms consist of capillaries and coaxial cylinders. They simulate the situations of blood vessels oriented parallel and perpendicular to the magnetic field and the interstitial spaces surrounding them. In most of our experiments, the paramagnetic compound was one of several different hyperfine shift reagents for cation resonances. These were chosen to cover a range of potencies, in both magnitude and sign, of the shifts they produce. However, we also used a reagent which was incapable of inducing a hyperfine shift and thus could cause only a BMS shift. Although we report only 23Na spectra in this paper, the latter samples simulate the cases where one observes the water 'H resonance in experiments employing hyperfine shift reagents for cations. There have been a number of such investigations recently reported in the literature. The principles considered in this paper allow us to offer new interpre- tations for the results of several experiments published in the last few years. o 1990 Aca- demic Press, Inc.
INTRODUCTION
Paramagnetic compounds can induce shifts in nuclear spin resonance frequencies, increases in nuclear spin relaxation rate constants, or, usually, both. In the former capacity, such compounds are often called shift reagents ( SRs) and in the latter, relax- ation (or shift-less) reagents ( RRs). In medical NMR, paramagnetic compounds are used as contrast reagents (CRs) in magnetic resonance imaging (MRI) and as dis- crimination reagents (DRs) in magnetic resonance spectroscopy (MRS) . For the most part, contrast reagents have been compounds used in their capacities as RRs (I) while discrimination reagents are compounds which are acting as SRs (2-5). However, in a number of instances, relaxation reagents have been used as DRs in
* Taken, in part, from the Ph.D. dissertation of S. C.-K. Chu, State University of New York, Stony Brook, NY, 1986. Presented, in part, at the 28th Experimental NMR Conference, Asilomar, CA, 8 April, 1987; the 6th Annual Meeting of the Society of Magnetic Resonance in Medicine, New York, NY, 17 August, 1987; and the 2nd European Congress of NMR in Medicine and Biology, Berlin, 23 June, 1988.
239 0740-3194190 $3.00 Copyright 0 1990 by Academic Press, Inc. All rights of reproduction in any form reserved.
240 CHU ET AL.
biological MRS (6-13). Also, it has recently been demonstrated how a shift reagent can be used as a CR in a combined spectroscopy imaging (CSI) 23Na experiment ( 14). In this paper, we focus only on the resonance frequency shift.
The paramagnetism of a compound can cause a shift of the resonance frequency of a nuclear spin by one or both of two general mechanisms-the hyperfine shift ( 1 5 ) and the bulk magnetic susceptibility (BMS) shift ( 16)-the effects of which are additive. The former requires chemical interaction between the host molecule bear- ing the nuclear spin and the paramagnetic compound and has itself two distinct addi- tive subdivisions: the contact contribution and the dipolar (or pseudocontact) contri- bution. The susceptibility mechanism affects the BMS of the entire sample and has a homogeneous and an inhomogeneous component ( 17,123).
In MRI, artifacts due to BMS shifts caused by Paramagnetic (or ferromagnetic) compounds have been reviewed, calculated, and shown ( 19-22). Others have dem- onstrated ways of actually imaging the BMS of an object by encoding the BMS shift into phase (23) or frequency (24) information. Indeed, the possibilities have been considered for using the inhomogeneous component of the BMS shift, caused by the addition of a paramagnetic compound, as the source of the field gradients required for MRI (25, 26) and as the source of reduction of relaxation times (27), and thus enhanced contrast in MRI (28). In MRS, BMS shifts have long been used to measure susceptibility (vide infra ) .
Notwithstanding all of this activity, the BMS shift seems to have been an elusive property in many MRI and MRS studies. This has been manifest in two general ways: the complete neglect of the BMS shift or the neglect of the significant local susceptibility effects in the evaluation of the BMS shift. Although some of the former has occurred in studies involving combinations of host molecules and paramagnetic compounds which are also subject to significant hyperfine shifts (29,30) , some has occurred with systems in which the BMS effect is the only contribution to the shift (29-32). Neglect of local susceptibility effects has occurred in recent important papers (19, 26). All of these omissions can lead to serious misinterpretations, but especially those where the BMS mechanism is the only one contributing to the observed shift. Thus, we were prompted to conduct phantom sample experiments in order to illustrate the principles involved.
Since the infusion into living animals of hyperfine SRs for metal cation NMR is showing increasing practicability (30, 33-35), we decided to use them in our phan- toms. The latter were made to simulate the cases of vessels running either parallel to or perpendicular to the Zeeman magnetic field and the environments of the interstitial spaces just outside these vessels. There has also been an increase in the use of these SRs while the water 'H resonance is observed (30-32). This is a case where there is no significant hyperfine shift. We simulated this situation by observing the 23Na cation resonance in the presence of the paramagnetic Dy3+ aquo cation in our phantoms.
THEORY
In any given compartment, the chemical shift of a nucleus, 6, has contributions from host molecule electronic shielding effects, Sb, from solvent electronic shielding effects, a,, and from BMS effects, 6,. These are expressed in
BULK MAGNETIC SUSCEPTIBILITY SHIFTS 24 1
6 = 6 , + 6 , + 6 , , [I1
where the 6 values are in parts per million (ppm) of resonance frequency (vide infra) . The change in the chemical shift of a nucleus induced by the introduction of a para- magnetic compound into the same compartment, A, is usually defined as
A = 6 - 6(0), [21
where 6 and 6( 0) are the chemical shifts in the presence and absence of the paramag- netic (or any nondiamagnetic) compound, respectively, the rest of the system re- maining unchanged. The solvent electronic effects should be effectively cancelled by the subtraction in [2]. By Eq. [2], A is positive for a shift to higher resonance fre- quency (downfield) (vide infra).
The change in shift A can be expressed as the sum of three contributions,
A 1 A,, + Ah 4- A,, t 31
where Acf is the complex formation shift, Ah is the hyperfine shift (Acf + A,, = 6, - 6,(0)), and Ax is the BMS shift caused by the paramagnetic compound (6, - 6,(0)). The complex formation shift is that due to any chemical interaction be- tween the host molecule and the paramagnetic molecule which would occur even if the latter were diamagnetic (36). Since most systems of interest are in fast exchange, Acf = fbA% wherefb is the fraction of the host molecules which are bound to para- magnetic molecules and AEf is the limiting complex formation shift (if it is single- valued). The hyperfine shift is due to the direct interaction of the nuclear magnetic moment with that of the unpaired electron (s) occumng during chemical interaction between the host molecule and the paramagnetic molecule. As above, Ah = fhAg, where A; is the limiting hyperfine shift and is itself given by A; = A: + A:. The symbol A: is the limiting contact contribution due to any unpaired electron density present at the resonant nucleus: this requires covalent bonding. The symbol A: is the limiting dipolar (pseudocontact) contribution which occurs through space and which requires a nonspherical magnetic susceptibility tensor for the paramagnetic molecule and that the host molecule bind at a specific site or sites ( 1 5 ) . We have enumerated the factors which determine fb and A: elsewhere ( 35, 3 7). The BMS shift Ax is due to the partial alignment of the magnetic moments of the paramag- netic molecules by the magnetic field.
A defining expression for the BMS term in [ 11 is
x 106, Bj - Bo
[41
where vj and vo are Larmor resonance frequencies and can be replaced by the magnetic inductions (flux densities), Bi and Bo, via the Larmor equation, v = I y( 2?r)-'B 1 , in which y is the magnetogyric ratio of the nucleus. The magnetic induction Bj is that actually sensed by the nucleus in compartment i which is caused by BMS effects in compartment i and any relevant compartments nearby. The mag- netic induction Bo is that which would be sensed by the molecule in a compartment

242 CHU ET AL.
TABLE 1
Theoretical Contributions to the Bulk Magnetic Susceptibility Shift
D
Sample compartment
Sphere
In 6 ni te cylinder ( II Bo)
Infinite cylinder (LBO)
Infinite coaxial cylinder ( II Bo)
Infinite coaxial cylinder (LBO)
First approximation, neglecting the First
i sphere of Lorentz Exact approximation I
Internal ( x , + 2 x , ) / 3 X J 3 0 X e + X ~ X , 3 + 2xe + XI (i = i)
External X . X J 3 xel3 Nonzero (i = e)
Internal (i) Xi XI13 x , / 3 0 External (e) X . X J 3 x J 3 0
( ~ e / 2 ) - ( x i / 6 ) 0 3x, - xi + 2XeXi
6 + 3xe + 3xj Internal (i) ( x e + xi ) / 2
External (e) X e X J 3 X e / 3 Nonzero
Inner (1) - x1 /3 XI 13 0 Annular ( 3 ) - x d 3 x3/3 0 External ( 5 , e) - X J 3 x,13 0
Inner (1) - Complicated ( x e / 2 ) - ( x l 16) 0 Annular ( 3 ) - Complicated ( x e / 2 ) - ( x s / 6 ) Nonzero External ( 5 , e) - xe /3 x , / 3 Nonzero
with no BMS effects (i.e., a vacuum). Recall that host molecule and solvent effects are collected in other terms. The quantity 6, is expressed in ppm in Eq. [ 41.
In general, we can express Bi as in Eq. [ 5 1 , where Di represents the
B;= ( 1 +Di}Bo+I; P I homogeneous BMS component and depends on the volume magnetic susceptibility of the medium inside the compartment, xi, that outside the compartment, x e , the shape of the compartment wall, and its orientation relative to the direction of the field produced by the NMR magnet, Bo. The symbol I; represents the inhomogeneous BMS component which depends not only on xi, xe, and the shape and onentation of the compartment wall, but also on the spatial position of the nucleus in the com- partment (I 7, 18) and on Bo. This is because, in general, gradients of B are set up near boundaries where Bi is not equal to the magnetic induction in the wall or the adjacent compartment, Be ( 19, 25, 26, 38) . For all but the simplest compartments, Ii is much more important than Di. It should be noted that [l], [4], and [5] are absolute and apply even when there are only diamagnetic species present. This gener- ality holds for the remainder of the Theory section (and Table 1 ).
Solving for Di and Ii requires the proper application of the Maxwell equations to determine the macroscopic flux density inside the compartment but also including
BULK MAGNETIC SUSCEPTIBILITY SHIFTS 243
an approach for dealing with local susceptibility effects. The terms Dj and Ii can be expressed analytically only for compartments with highly symmetric shapes and cer- tain orientations in Bo. Well-known results for some of these are given in Table 1, where i has become a compartment index. For the entries in Table 1 , the compart- ment walls were assumed to be infinitely thin, and the external compartment was taken to be filled by a continuous homogeneous medium (of susceptibility x,) which was of infinite extent. The dimensionless rationalized ( 3 9 ) SI susceptibilities xi and xe are expressed in ppm in Table 1.
The third column of Table 1 presents the values for D which would be obtained (to the first approximation) if one applies the Maxwell equations for a structureless medium and neglects the effects of the conceptual sphere of Lorentz. This is a local susceptibility construct used to account for the fact that the large susceptibility shift effects due to the host molecule and the nearest solvent shells effectively cancel. The resonant nucleus is imagined to diffuse about the compartment in a hypothetical spherical bubble (the “sphere of Lorentz”) of zero magnetic susceptibility. The me- dium then produces an effect on the surface of this sphere (the cavity field). The effect on D in Table 1 is always -2x/3, where x is the susceptibility of the medium. Although this construct was common in the early literature (16, 18, 40-44), it has been neglected in more recent papers (19 ,26 ,45 ) . As we will see shortly, this neglect can have significant consequences.
The fourth column of Table 1 gives the exact expressions for D resulting from the inclusion of the concept of the sphere of Lorentz with the application of the Maxwell equations. The fifth column gives expressions for D correct to the first approximation (i.e., dropping all terms second (or higher) order in susceptibility). This is usually more than sufficient for NMR experiments.
Comparing columns three and five, we can see significant theoretical local suscepti- bility effects. For the inside of a spherical sample compartment, the value of D is actually independent of the magnitude of xi, to a good level of approximation. If the sphere is suspended in a vacuum ( xe = 0), the value of D is effectively zero. For infinite cylinders suspended in a vacuum, the values of Di have opposite signs for parallel and perpendicular orientations ( 2xi/6 and - xi/6, respectively). Neither of these conclusions would be reached if one neglected the sphere of Lorentz.
The sixth column of Table 1 gives the status of the inhomogeneous term, I , for these highly symmetric compartments. One would be correct in surmising that the value of I is always zero for the diamagnetic or paramagnetic inner space of a simple ellipsoid of revolution, which has only concave surfaces. In general, however, I is nonzero and very complicated, as we shall see below.
No biological sample would comprise compartments as simple as those at the top of Table 1 although we will show one illustrative spectrum from such a phantom. For most of the spectra in this paper, we have employed a more complicated phantom which is still, nonetheless, overly simple. The concentric tube arrangement used here consists actually of five compartments: ( 1 ) the inner compartment, (2) the glass wall of the inner tube, (3) the annular compartment, (4) the glass wall of the outer tube, and ( 5 ) the NMR-sensitive volume external to the outer tube ( 17, 18) . Resonant nuclei are detectably present only in compartments 1 and 3 in the present work. Two

244 CHU ET AL.
orientations were studied: the long axis of the tubes parallel to the NMR magnetic field and the long axis of the tubes perpendicular to the field. In both cases, expres- sions for the terms in Eq. [ 5 ] can, and have been, derived ( Z7, 18) . We give them in our own notation in [ 6 ] through [ 9 1, and in Table 1. These were derived assuming that compartments 2 and 4 are infinitely thin. The result given in Eq. [ 71 is that taken at the level of the first approximation ( see Table 1 ) :
(D, ) , , = xi/3; i = 1,3 [61
(I,),, = 0; i = 1,3 [81
(0,)~ = ( - ~ i / 6 ) + ( x J 2 ) ; i = 1,3 171
(1l)l = 0. [91 For i = 3, (13)1 is a complicated inhomogeneous expression due to the convex
nature of the outer surface of the inner tube. For sample containers of highly symmet- ric shapes, the magnitude of I, is linearly proportional to the external field. This is shown for the present coaxial tube sample container, when perpendicular to BO,
[lo1 (11)1= C , . ~ { ~ 0 ~ 2 8 1 , , + s i n 2 8 1 , } ; BO i = 1-5,
where C, is a still complicated function of susceptibilities and geometric parameters, r is the radial distance from a nucleus to the axis of the tubes, and 8 is the angle between r and the Zeeman field direction. The vectors l,, and lL have unit lengths parallel and perpendicular to BO, respectively. It can be shown that the contribution to the energy, and therefore frequency, from the component of I, perpendicular to the field is exactly zero. It is sufficient, therefore, to write only the component of I, parallel to the external field:
It is important to realize that the expression in [ 1 11 describes a function which is symmetric about zero (i.e., (( Ii ) l ) = 0 when the average is taken over all values of 0) ( Z7-19,46). The value of C, is zero. The explicit expression for C3 has been calcu- lated and is, to first order,
c 3 = -( 1 (X3/3))[a:(X2 - X I ) a:(X3 - X2)1/2, [ I21 where al and a2 are the inner and outer radii of the inner tube, respectively. In Eq. [ 121, it is clear that the finite thickness of wall 2 has been accounted for.
EXPERIMENTAL
NMR Spectroscopy
Two spectrometers were used for these experiments: an NT-300 (SB) (General Electric) instrument with a 7.03-T vertical superconducting magnet and an XL- 100 (Varian) spectrometer with a 2.35-T horizontal iron-core electromagnet. The 23Na

BULK MAGNETIC SUSCEPTIBILITY SHIFTS 245
resonant frequencies for these two instruments were 79.37 and 26.46 MHz, respec- tively. Commercial probes were employed. That for the NT-300 was fitted with a saddle-shaped coil while that for the XL-100 contained a solenoidal coil. Standard pulse and acquisition parameters were employed. All 23Na spectra reported in this paper are of the extreme narrowed type (47). The sample temperature was 3 1 “C.
Sample Phantoms
One phantom consisted of two lengths of 1-mm (id.) glass capillary tubing ori- ented inside a 10 mm (0.d.) glass tube (Wilmad Part No. 5 13-5pp). One length was cut to be exactly equal to the i.d. of the 1 0-mm tube and was thus inserted perpendicu- lar to the tube’s long axis. The other length of capillary (ca. 1.5 cm) was mounted in a piece of cork and oriented to be colinear with the tube’s long axis. The perpendicular capillary and much of the parallel capillary were situated within the sensitive volume of the NT-300 transceiver coil. The coaxial phantom consisted of a 5-mm (0.d.) glass tube (Wilmad Part No. 527pp) concentrically placed within a 10-mm (0.d.) glass tube. The inner tube was held by two movable Teflon spacers which had been preci- sion bored to give maximum concentricity. The lower spacer was positioned about 1 cm above the sensitive volume of the transceiver coil. The dimensions of the inner and outer tubes were taken from the manufacturer’s specifications. They are given as follows: inner tube, i.d. = 2al = 4.20 * 0.013 mm, 0.d. = 2a2 = 5.00 k 0.013 mm; outertube, id . = 2a3 = 8.96 ? 0.013 mm, 0.d. = 2a4 = 10.00 f 0.013 mm.
Samples Three different hyperfine shift reagents for cationic resonances, of different shift
potencies (i.e., magnitudes and signs of Ah), were prepared according to methods we have described elsewhere. The three were Li7Dy( PPP)2. 3LiC1, where PPP5- represents the tripolyphosphate anion ( P30:i) (48 ) ; Li6Dy( CA)3, where CA3- represents the chelidamate anion (4-hydroxypyridine-2,6-dicarboxylate) ( 3 7 ) ; and Li3 DyTTHA, where TTHA6- represents triethylenetetraminehexaacetate (48) . Six solutions were prepared: a solution which contained 5 M NaC1; a solution which contained 50 m M NaC1; three solutions which each contained 1 50 m M NaCl and 20 m M Li,Dy( PPP)2 - 3LiC1, Li6Dy( CLI)~, or Li3DyTTHA; and a solution which contained 150 m M NaCl and 20 m M DyC13. All of the solutions (except the 5 M NaCl) contained 30% ( v / v ) D20 so that the spectrometers could be field-frequency locked on the ’H resonance. Of course, since there were two solution-containing compartments in each sample, there were two 2H signals. These could be resolved by the NT-300 spectrometer and either one was chosen as the lock signal. These were not resolved by the XL-100 spectrometer and the single 2H resonance was used for locking purposes.
The rationalized SI volume magnetic susceptibilities (in ppm) of the six solutions can be well estimated using
x = 4* 2 C k ’ X M , k x lo6, ~ 3 1 k
where k is the species index, c k is the concentration of k in mol ( CrnP3, and X M , k is
246 CHU ET AL.
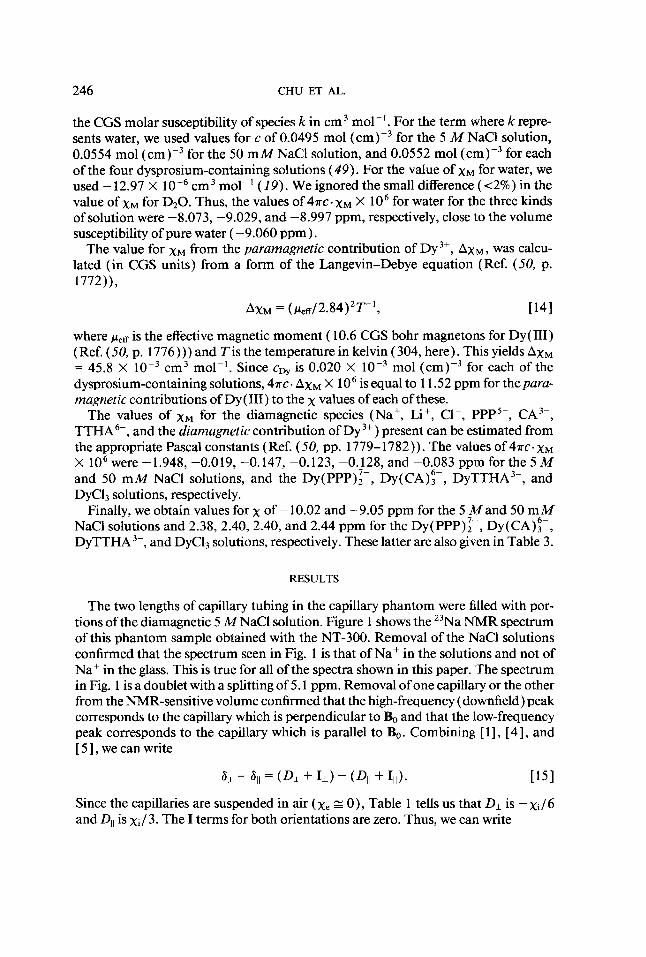
the CGS molar susceptibility of species k in cm3 mol-'. For the term where k repre- sents water, we used values for c of 0.0495 mol ( ~ m ) - ~ for the 5 M NaCl solution, 0.0554 mol ( ~ m ) - ~ for the 50 m M NaCl solution, and 0.0552 mol ( ~ m ) - ~ for each of the four dysprosium-containing solutions (49). For the value of xM for water, we used -12.97 X cm3 mol-' (19). We ignored the small difference ( ~ 2 % ) in the value of xM for DzO. Thus, the values of 47rc. xM X lo6 for water for the three kinds of solution were -8.073, -9.029, and -8.997 ppm, respectively, close to the volume susceptibility of pure water (-9.060 ppm).
The value for xM from the paramagnetic contribution of Dy3+, AxM , was calcu- lated (in CGS units) from a form of the Langevin-Debye equation (Ref. (50, p. 1772)),
AxM = (~~R/2 .84)~T- ' , ~ 4 1
where peff is the effective magnetic moment ( 10.6 CGS bohr magnetons for Dy(II1) (Ref. (50, p. 1776))) and Tis the temperature in kelvin (304, here). This yields AxM = 45.8 X cm3 mol-'. Since cDY is 0.020 X mol ( ~ m ) - ~ for each of the dysprosium-containing solutions, 47rc. AxM X lo6 is equal to 1 1.52 ppm for thepara- magnetic contributions of Dy( 111) to the x values of each of these.
The values of xM for the diamagnetic species (Na+, Lif, C1-, PPP5-, CA3-, TTHA6-, and the diamagnetic contribution of Dy3+) present can be estimated from the appropriate Pascal constants (Ref. (50, pp. 1779-1782)). The values of 47rc. xM X lo6 were -1.948, -0.019, -0.147, -0.123, -0.128, and -0.083 ppm for the 5 M and 50 m M NaCl solutions, and the Dy(PPP)i-, Dy(CA);-, DyTTHA3-, and DyC13 solutions, respectively.
Finally, we obtain values for x of - 10.02 and -9.05 ppm for the 5 M and 50 m M NaCl solutions and 2.38,2.40,2.40, and 2.44 ppm for the Dy(PPP):-, Dy(CA);-, DyTTHA3-, and DyC13 solutions, respectively. These latter are also given in Table 3.
RESULTS
The two lengths of capillary tubing in the capillary phantom were filled with por- tions of the diamagnetic 5 MNaCl solution. Figure 1 shows the 23Na NMR spectrum of this phantom sample obtained with the NT-300. Removal of the NaCl solutions confirmed that the spectrum seen in Fig. 1 is that of Na+ in the solutions and not of Na+ in the glass. This is true for all of the spectra shown in this paper. The spectrum in Fig. 1 is a doublet with a splitting of 5.1 ppm. Removal of one capillary or the other from the NMR-sensitive volume confirmed that the high-frequency (downfield) peak corresponds to the capillary which is perpendicular to Bo and that the low-frequency peak corresponds to the capillary which is parallel to Bo. Combining [ 11, [4], and [ 51, we can write
61 - 61, = (Dl + 1,) - (01, + I l l ) . [151
Since the capillaries are suspended in air (x, E 0), Table 1 tells us that D, is -xi/6 and D,, is xi/3. The I terms for both orientations are zero. Thus, we can write

BULK MAGNETIC SUSCEPTIBILITY SHIFTS 247
30 20 10 0 -10 -20 -30 -40 PPM
uo P
FIG. 1 . The 23Na NMR (79.4 MHz) spectrum of the stationary capillary phantom sample with 5 M NaCl present in each capillary.
61 - 61, = -xi/2. [I61 Under Experimental, we estimated x for the 5 M NaCl solution to be - 10.02 ppm. The splitting observed in Fig. 1 is in excellent agreement with this. The indication of a zero frequency position is tantamount to equating the 6, and 6, quantities of Eq. [ I ] each with zero. However, the absolute position of this reference would depend on the existence of local susceptibility effects. The local susceptibility causes the shifts to be in opposite directions (Dl = - xi/6 and D,, = xi/ 3, Table 1 ). Thus the position of zero is between the two peaks, as we have placed it in Fig. I. If one ignored local susceptibility, the splitting would be the same ( D , = xi/2 and Dll = xi, Table 1 ), but the position of zero would be at higher frequency (downfield) than either peak. This spectrum in itself does not allow discrimination between these two possibilities. How- ever, our experiments with compartmentalized paramagnetic species in the coaxial phantom confirm the existence of local susceptibility effects ( vide infa). Also, we confirmed this by filling the perpendicular capillary with a solution which was 17.5 mM in DyC13 in addition to 5 M NaCl. Such a solution has a A,, of zero ( vide infra) and a x value of ca. zero. The downfield peak moved to the zero position of Fig. 1, not 5 ppm further downfield as would be the case in the absence of local susceptibility effects. The upfield resonance from the parallel capillary remained at the same position.
Since the BMS affects the resonance frequencies of all magnetic nuclei present in the compartment equally, it is important to note that the water 'H NMR spectrum

248 CHU ET AL.
I I -
4 0 -4 -8 -12 -16 -20 -24
-% (pprn)
FIG. 2. The "Na NMR spectra (26.5 MHz) of the stationary coaxial tube phantom samples with the Dy( 111)-containing solutions in the inner ( I ) compartments. The axis of the tubes is perpendicular to the magnetic field direction.
of the capillary phantom would be the same as the 23Na spectrum seen in Fig. 1. Also, Table 1 tells us that if we filled the 1 0-mm tube with the same solution as that present in the capillaries (so that xe = xi), we would see only one resonance and it would appear at the lower frequency (upfield) position of the two seen in Fig. 1.
Each coaxial tube sample consisted of a portion of the 50 mA4 NaCl solution in one compartment and a portion of one of the NaCl solutions containing either a hyperfine SR or DyC13 in the other compartment. Thus, there were four pairs of solutions. Since there are two compartments in the coaxial phantom-the inner ( 1 ) and the annular (3)-there were eight different samples. Since the 23Na spectrum of each sample was obtained in each of the two spectrometers, there were 16 spectra. The eight XL- 100 spectra (perpendicular orientation) were also each obtained at several different sample spinning rates. Some of these spectra are shown in the follow- ing figures.
Figure 2 depicts the four spectra obtained with the NaCl solution in the annular compartment (3) (and thus Dy3+ in compartment 1 ), with the cylinder axis perpen- dicular to the magnetic field, and with no spinning. The annular signals are easily assigned because they exhibit the inhomogeneous patterns predicted by Eq. [ 1 11.
BULK MAGNETIC SUSCEPTIBILITY SHIFTS 249
4 0 -4 -8 -12 -16 -20 -24 - 3 (ppm)
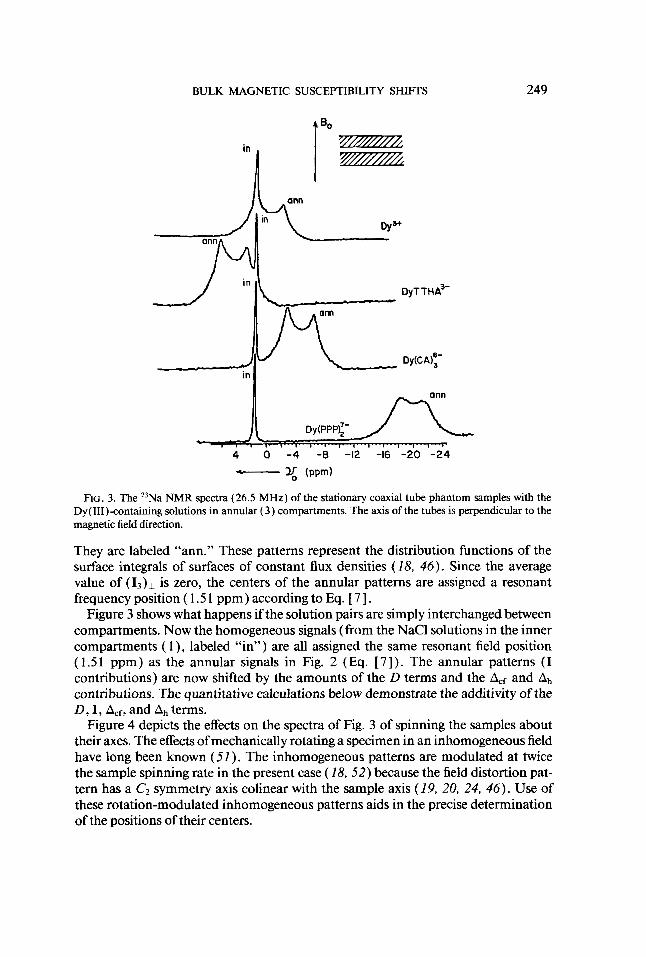
FIG. 3. The ”Na NMR spectra (26.5 MHz) of the stationary coaxial tube phantom samples with the Dy(II1)-containing solutions in annular ( 3 ) compartments. The axis of the tubes is perpendicular to the magnetic field direction.
They are labeled “ann.” These patterns represent the distribution functions of the surface integrals of surfaces of constant flux densities (18, 46). Since the average value of (13)1 is zero, the centers of the annular patterns are assigned a resonant frequency position ( 1.5 1 ppm) according to Eq. [ 71.
Figure 3 shows what happens if the solution pairs are simply interchanged between compartments. Now the homogeneous signals (from the NaCl solutions in the inner compartments ( 1 ), labeled “in”) are all assigned the same resonant field position (1 .51 ppm) as the annular signals in Fig. 2 (Eq. [ 7 ] ) . The annular patterns (I contributions) are now shifted by the amounts of the D terms and the Acf and Ah contributions. The quantitative calculations below demonstrate the additivity of the D, I, Acf, and Ah terms.
Figure 4 depicts the effects on the spectra of Fig. 3 of spinning the samples about their axes. The effects of mechanically rotating a specimen in an inhomogeneous field have long been known (51 ) . The inhomogeneous patterns are modulated at twice the sample spinning rate in the present case ( 18.52) because the field distortion pat- tern has a C2 symmetry axis colinear with the sample axis (19, 20, 24, 46). Use of these rotation-modulated inhomogeneous patterns aids in the precise determination of the positions of their centers.

250 CHU ET AL.
8 4 0 -4 -8
0 Hr JI/"L DY(CA$-
8 4 0 -4 -8 - % (pprn)
FIG. 4. The effect of spinning, about the axis of the tubes, on the spectra of Fig. 3. Each spectrum is shown with two different spin rates.
Figure 5 shows the spectra obtained if the four samples of Fig. 2 are oriented with their axes parallel to the magnetic field. Since the I3 terms are now zero (Eq. [ 8] ) , the assignments of annular and inner peaks are now not so obvious. They were con- firmed by the introduction of additional Na+ into one compartment or the other. Also, the annular volume is three times the inner volume. The annular peaks have all been assigned a resonant frequency position ( -3.02 ppm) according to Eq. [ 61. Also, since both the I, and I3 terms are zero, spinning about the tubes' axis (not shown) had little effect on the spectra.
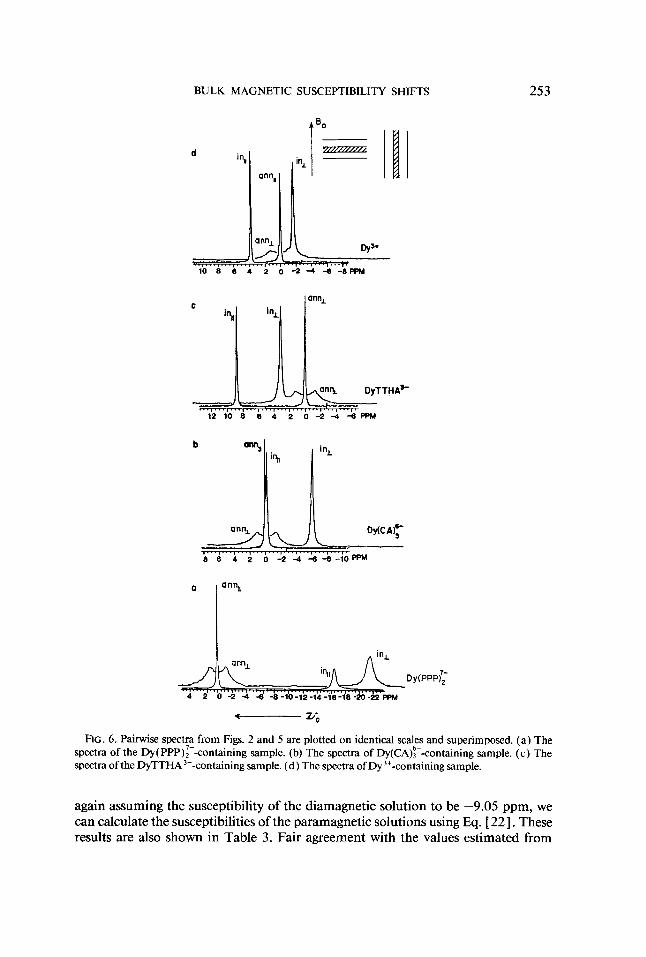
To emphasize the effects of orientation, Fig. 6a shows the superimposed spectra of the Dy( PPP):--containing sample from Figs. 2 and 5 where the Dy3+-containing
BULK MAGNETIC SUSCEPTIBILITY SHIFTS 25 1
ts, ' Ill i(r Dy3+ * DYT TH A ~ -
JL Dy(PPP)Z- " " ~ l " " l ~ ' " " ' ' l " ' " " ' ' ~ 5 0 -5 -10 -15 -20 -25 - (ppm)
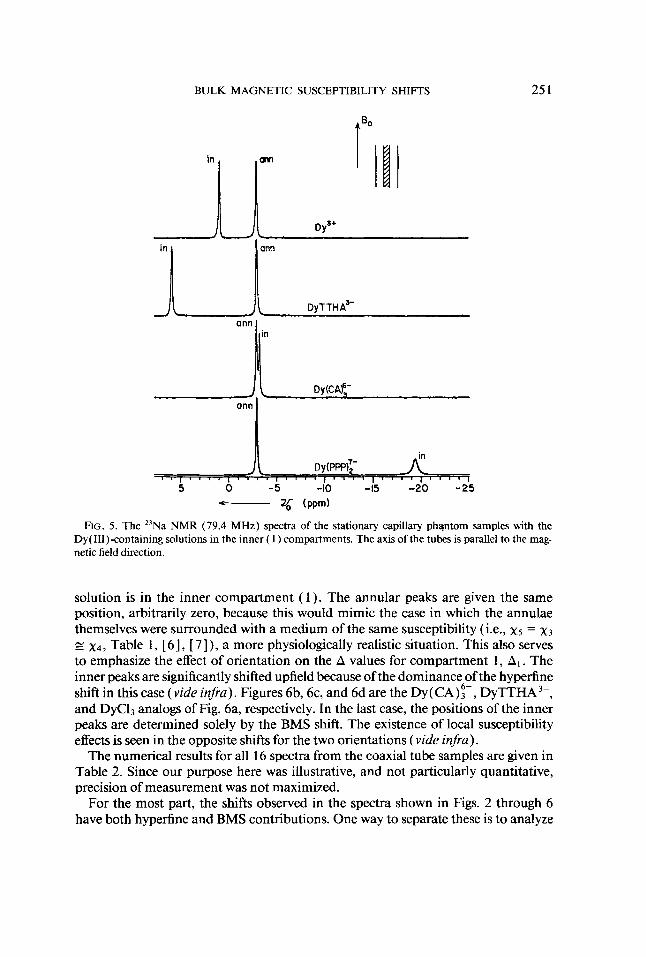
FIG. 5. The 23Na NMR (79.4 MHz) spectra of the stationary capillary phantom samples with the Dy(II1)-containing solutions in the inner ( 1 ) compartments. The axis of the tubes is parallel to the mag- netic field direction.
solution is in the inner compartment ( 1 ). The annular peaks are given the same position, arbitrarily zero, because this would mimic the case in which the annulae themselves were surrounded with a medium of the same susceptibility (i.e., x5 = x 3 z x4, Table 1, [6], [ 7]), a more physiologically realistic situation. This also serves to emphasize the effect of orientation on the A values for compartment 1, A,. The inner peaks are significantly shifted upfield because of the dominance of the hyperfine shift in this case (vide infra). Figures 6b, 6c, and 6d are the Dy(CA)!-, DyTTHA3-, and DyCI3 analogs of Fig. 6a, respectively. In the last case, the positions of the inner peaks are determined solely by the BMS shift. The existence of local susceptibility effects is seen in the opposite shifts for the two orientations (vide infra) .
The numerical results for all 16 spectra from the coaxial tube samples are given in Table 2. Since our purpose here was illustrative, and not particularly quantitative, precision of measurement was not maximized.
For the most part, the shifts observed in the spectra shown in Figs. 2 through 6 have both hyperfine and BMS contributions. One way to separate these is to analyze
252 CHU ET AL.
for the susceptibility terms by using observed shifts or splittings in combinations such that the complex formation and hyperfine contributions are either zero or canceled. Several methods for doing this have been suggested in the literature. We will refer to them in the names of the authors who first proposed them.
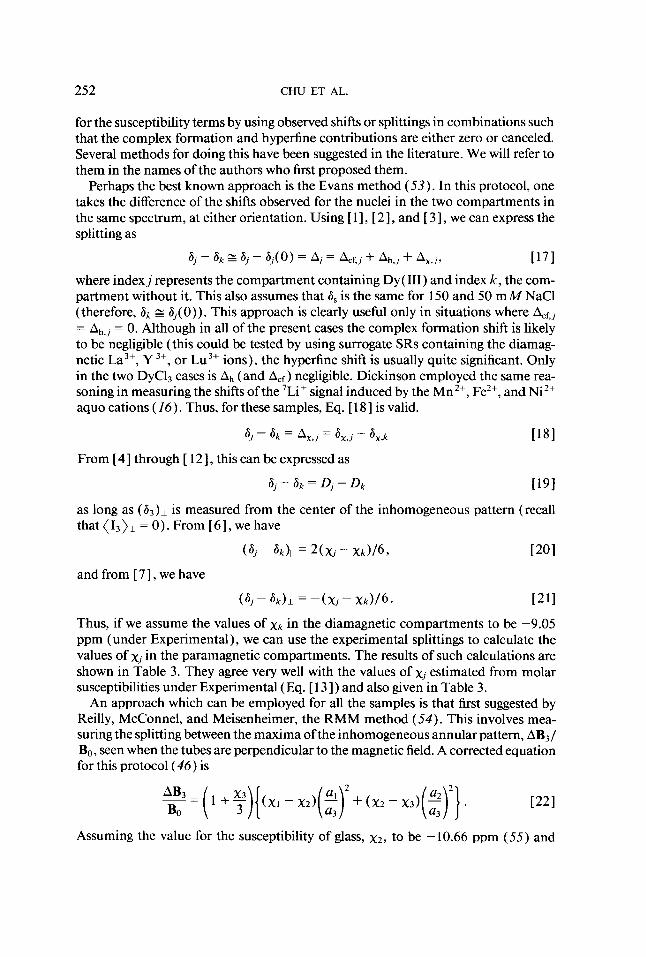
Perhaps the best known approach is the Evans method (53). In this protocol, one takes the difference of the shifts observed for the nuclei in the two compartments in the same spectrum, at either orientation. Using [ 11, [ 21, and [ 31, we can express the splitting as
6, - 6k E S, - 6,(0) = A, = ACf,, + Ah,, + A,,,, ~ 1 7 1 where index j represents the compartment containing Dy( 111) and index k , the com- partment without it. This also assumes that 6, is the same for 150 and 50 m M NaCl (therefore, 6k z 6,(0)). This approach is clearly useful only in situations where Act, = Ah,, = 0. Although in all of the present cases the complex formation shift is likely to be negligible (this could be tested by using surrogate SRs containing the diamag- netic La3+, Y 3+, or Lu3+ ions), the hyperfine shift is usually quite significant. Only in the two DyC13 cases is A,, (and A,,-) negligible. Dickinson employed the same rea- soning in measuring the shifts of the 'Lif signal induced by the Mn2+, Fez+, and Ni2+ aquo cations ( 1 6 ) . Thus, for these samples, Eq. [ 181 is valid.
Sj - 6 k = Ax,j = 6,,j - bx,k
From [4 ] through [ 121, this can be expressed as
6j- Sk = Dj- Dk
as long as ( 63)1 is measured from the center of the inhomogeneous pattern (recall that ( 13) I = 0). From [ 61, we have
(Sj-6k)ll=2(xj-~k)/6, 1201
(Sj- 8 k ) l = - ( X i - ~ k ) / 6 . [211
and from [ 71, we have
Thus, if we assume the values of Xk in the diamagnetic compartments to be -9.05 ppm (under Experimental), we can use the experimental splittings to calculate the values of xj in the paramagnetic compartments. The results of such calculations are shown in Table 3. They agree very well with the values of xj estimated from molar susceptibilities under Experimental (Eq. [ 131) and also given in Table 3.
An approach which can be employed for all the samples is that first suggested by Reilly, McConnel, and Meisenheimer, the RMM method ( 5 4 ) . This involves mea- suring the splitting between the maxima ofthe inhomogeneous annular pattern, AB3/ Bo, seen when the tubes are perpendicular to the magnetic field. A corrected equation for this protocol ( 4 6 ) is
Assuming the value for the susceptibility of glass, x2, to be - 10.66 ppm ( 5 5 ) and
BULK MAGNETIC SUSCEPTIBILITY SHIFTS
inL '5
253
t f I - I I
A Dy3+
10 8 6 4 2 0 -2 -4 -6 -8PPM
FIG. 6. Painvise spectra from Figs. 2 and 5 are plotted on identical scales and superimposed. (a) The spectra of the Dy( PPP):--containing sample. (b) The spectra of Dy(CA):--containing sample. (c) The spectra ofthe DyTTHA'--containing sample. (d) The spectra of Dy'+-containing sample.
again assuming the susceptibility of the diamagnetic solution to be -9.05 ppm, we can calculate the susceptibilities of the paramagnetic solutions using Eq. [ 221. These results are also shown in Table 3. Fair agreement with the values estimated from

254 CHU ET AL.
TABLE 2
Experimental Results for the 23Na NMR Shifts in the Coaxial Phantom Samples ~~
Species in" ('J - 'k ) l l
Compartment 1 Compartment 3 (PPW
Dy(PPP):- - -16.4 DY(CA)~- - -0.3 DyTTHA3- - 8.8 Dy 3+ - 3.8 - Dy(PPP):- -16.3 - DY(CA)$- -0.3 - DyTTHA3- 8.9 - Dv3+ 3.8
-22.0 -6.0
3.1 -1.9
-2 1.9 -6.0
3.2 -1.9
2.4 2.4 2.4 2.4
-3.4 -3.7 -3.1 -3.6
In addition to Na', Li', and C1-. Downfield shifts are positive;j = 1, k = 3 for the first four entries,j = 3, k = 1 for the last four. AB3/Bo is the splitting of the maxima of the inhomogeneous pattern.
molar susceptibilities (under Experimental, Eq. [ 131) is noted. This approach is very sensitive while, at the same time, it is hard to measure AB3/Bo accurately (even when the annular peak is not overlapping with the inner peak, as occurs in some of the spectra of Figs. 2 and 3). This is why it has been suggested that, for precise work, one monitor the change in splitting with concentration of the paramagnetic species ( 5 5 ) .
Another approach which can be used for all the samples is the Live-Chan method (44). This involves taking the difference of the compartmental splittings observed for the same sample at the two different orientations. Equations [ 11, [ 21, and [ 31 yield
TABLE 3
Comparison of Theoretical and Measured Paramagnetic Susceptibilities for the Coaxial Phantom Samples
Evans method RMM Live-Chan method method
Eq. P O I Eq. I2 11 Eq. [221 Eq. P61 XI x3
Eq.[131 Eq.[131 X I ~3 X I ~3 X I ~3 X I ~3
Compartment 1 Compartment 3 (ppm) (ppm) (ppm) (ppm) (ppm) (ppm) (ppm) (ppm) (ppm) (ppm)
2.5 2.2 a Dy(PPP):- - 2.38 a
2.5 2.4 DY(CA)~- - 2.40 a
_ - - _ 2.5 ' 2.4 DyTTHA3- - 2.40 Dy3+ - 2.44 2.4 a 2.4 a 2.5 a 2.4
- - - - _ _ _ _
- Dy( PPP):- 2.38 - - - - a 1.5 a 2.2 2.40 - - - - 2.2 2.4 2.40 - - - - 2.2 a 2.4
- Dy '+ 2.44 2.4 2.4 a 2.1 a 2.4
- DY(CA)!- - D ~ T T H A ~ -
x assumed to be -9.05 ppm (Eq. [ 131).
BULK MAGNETIC SUSCEPTIBILITY SHIFTS 255
(6, - 6k)ll - (6, - 6 k ) ~ g (&f,, + Ah,] + A,,,)[I - (Ad,, + Ah,, + Ax,j) l [ 2 3 ]
('J - ' k ) , , - ('1 - 6 k ) l (AX,,)ll - (AX,J)L. ~ 4 1 The same conditions which allowed us to derive [ 201 and [ 2 11 allow us to express Eq. [24] as
(6, - 6k)11 - (6, - 6 k L = ( X J / ~ ) - (Xk/3) - ( - ( ~ , / 6 ) + ( ~ k / 6 ) ) [ 2 5 ]
(6, - 6k)ll - (6, - 6 k ) l = ( X I - Xk)/2* [261 Again assuming the susceptibilities of the diamagnetic compartments ( xk), we can use [ 261 to calculate the susceptibilities of the paramagnetic compartments ( x,) . These are also shown in Table 3 and again give good results except for the two Dy( PPP):- samples. We have found no obvious explanation for the latter.
Another approach is to combine observed splittings such that the susceptibility contributions are canceled, leaving only the complex formation and hyperfine shifts. Thus, from [ 11, [ 21, and [ 31 one can obtain
(6, - 6k)ll + 2(6, - 6 k ) l g (A, , , + Ah,, + A,,,),, + 2(Acf,j + + Ax,,)l* [27i From [ 18 1, [ 19 1 , and the entries in Table 1 , we can write
The success of this approach is shown in the next section.
DISCUSSION
Given the general good agreement between theory and experiment seen in the last section, we can be confident in making reasonable estimates of A, values from suscep- tibility dzflerences by using only the AxM (Eq. [ 141) term of [ 131 as expressed in
xj - x k = 4 ~ . cDY - AxM X l o 6 . ~ 9 1 (Young et al. ( 2 3 ) incorrectly refer to the RHS of [ 291 as a molar susceptibility: it is a volume susceptibility.) We can then determine Ah values from A - A, (assuming A,, to be negligible). We can also determine Ah values experimentally, via Eq. [ 281. Values of A,, the BMS shift, Ah, the hyperfine shift, and their ratio for the various compartments of the coaxial samples are compared in Table 4. We have enumerated the factors determining the magnitude of Ah elsewhere (35, 37). The fact that the Ah values for a given SR-containing solution are quite constant, irrespective of compart- ment or orientation, indicates the correct absolute nature of these calculations. The spectra in Fig. 6 and the ratio values in Table 4 indicate that the A values induced by Dy( PPP)i- are dominated by the Ah contribution. The A, contribution is never more than -0.19 of Ah for the Dy( PPP):- samples studied here. This was to be expected (48). Unfortunately, Dy( PPP):- is quite toxic to living organisms (5 , 30). The spec- tra in Fig. 6 and the ratio values in Table 4 show that in the parallel orientation, the upfield Ah shift induced by Dy( CA):- is, fortuitously, almost exactly canceled by the A, term (the two values of the ratio Ax/ Ah in Table 4 are both -0.93). The spectra in Fig. 6 and the ratio values in Table 4 show that DyTTHA3-, a nontoxic SR, is

256 CHU ET AL.
TABLE 4
Comparison of BMS and Hyperfine 23Na NMR Shifts in the Paramagnetic ComDartments of the Coaxial Phantom SamDles“
A - A x A,,+Ah (Ax., ) w ( A X . , L
Compart- Compart- Eq. [20] Eq. [21] (Ah,,)) (&,,)I Eq. [28] ment 1 ment 3 (ppm) (ppm) (ppm) (ppm) ( P P ~ ) (Ax,, /Ah,, )H (4, /Ah,, 11
Dy(PPP):- - 3.81 -1.90 -20.2 -20.1 -20.1 -0.19 0.09 DY(CAE - 3.82 -1.91 -4.1 -4.1 -4.1 -0.93 0.47 DyTTHA3- - 3.82 -1.91 5.0 5.0 5 .O 0.76 -0.38
3.83 -1.92 0.0 0.0 0.0
- DY(CA)? 3.82 -1.91 -4.1 -4.1 -4.1 -0.93 0.47
h h Dy 3+ - - Dy(PPP):- 3.81 -1.90 -20.1 -20.0 -20.0 -0.19 0.10
- DyTTHA3- 3.82 -1.91 5.1 5.1 5.1 0.75 -0.37 Dy 3+ 3.83 -1.92 0.0 0.0 0.0 h 0 -
a J = 1 for the first four entries;j = 3 for the last four entries. Undefined.
much more effective when the sample phantom used here is oriented parallel to the spectrometer magnetic field. In this case, A, and Ah are in the same (downfield) direc- tion (A,/& = 0.76 and 0.75). For the spectra of the DyC13-containing samples shown in Fig. 6 there is no Ah contribution. The splittings observed, downfeld by ca. 3.8 ppm for the parallel orientation, upfeld by ca. 1.9 ppm for the perpendicular orientation, and the calculated A, values (Table 4) clearly show the effectiveness of local susceptibility effects. These are accounted for here by the consideration of the “sphere of Lorentz.”
BMS shifts are of importance in many kinds of experiments. In our own work, they appear to limit the resolution of skeletal muscle intra- and extracellular 23Na resonances induced by the infusion of DyTTHA3- in vivo (34). We have also ob- served inhomogeneous extracellular ( 5 ) and intracellular ( 5 6 ) 23Na resonances from myocardium which is perfused with an extracellular paramagnetic SR. These are most likely due to unresolved BMS shifts of both resonances. Treating muscle cells as cylinders embedded in an extracellular phase which is 6 mMin DyTTHA3- in the skeletal case ( 3 4 ) and 5.7 mMin a Dy-containing SR in a myocardial case (Ref. ( 5 6 ) incorrectly reports the concentration to be 7 mM), we can estimate values for xi and x e . Using the expressions for (Dl)II and (Di) l in Table 1, we can estimate the inhomogeneous linewidths of the intracellular resonances to be 1.7 and 1.6 ppm in the former and latter cases, respectively. The resolution in the myocardial spectrum is good enough to reveal that this is almost exactly the width of the intracellular peak ( 5 6 ) .
The shift effects of bulk magnetic susceptibility seem often to be the subjects of misinterpretation. Such problems seem to occur in two general ways: the complete neglect of the A, contribution or the neglect of local susceptibility effects in calculat- ing the value of A,. We will mention just a few important examples.
BULK MAGNETIC SUSCEPTIBILITY SHIFTS 257
In a paper by Brown, Stenzel, Ribeiro, Drayer, and Spicer (BSRDS), the authors think it unexpected that the Gd( 111) complexes they studied (GdEDTA-, Gd( PPP):-, and GdDTPA2-, where EDTA4- represents ethylenediaminetetraace- tate and DTPA ’- represents diethylenetriaminepentaacetate) could induce down- field shifts of the 23Na signal (29 ) . This might be considered surprising because, to first order, A: should be zero for Gd( 111) ( 3 6 ) (A: and AFf are expected to be small for the interaction of Na+ with any lanthanide complex). However, BSRDS failed to take into account the A, terms which would arise in their phantom samples which consisted of a coaxial tube system with its axis parallel to the magnetic field and the Gd3+ complexes present in the annular space. The authors report ( a3 - a,),, values of 1.07, 1.42, and 1.47 ppm for the three complexes, respectively. Using Eq. [14] to calculate AxM ( peE is 7.94 CGS bohr magnetons for Gd( 111) (Ref. (50, p. 1776))), we calculate A, to be 1.1 ppm for 10 mMGd(II1) at 291 K (Eqs. [20] and [29]). The small discrepancies for the latter two complexes could be due to small nonzero A: values in those cases ( 5 7 ) . The authors quote Malloy et a/. (BSRDS Ref. ( 6 ) ) (58) as having reported a shift induced by GdEDTA-. However, we had already suggested (BSRDS Ref. (28)) ( 3 7 ) that this was due to BMS effects by referring to GdEDTA- as a “susceptibility shift reagent.” The authors also quote Bryden et a/. (BSRDS Ref. ( 7 ) ) as having reported nonzero Ad values induced by Gd( 111) com- plexes. However, Reilley and co-workers ( 5 9 ) did not actually state this. BSRDS have possibly misread the legends of Figs. 5-8 of the Reilley paper (“measured” does not modify “dipolar”). The small shifts (average, 0.25 ppm) reported by Bryden et a/. ( 5 9 ) could also arise from small nonzero A: values.
The lack of consideration of the BMS shift also led BSRDS astray in the interpreta- tion of the shifts induced by the Dy(II1) analogs of the above complexes in their system. They observe a 1.99 ppm downfield shift induced by 10 m M DyEDTA- (29 ) . The value of A,, calculated as above, is 2.0 ppm. The value BSRDS report for (6, - S,),,, 1.34 ppm, induced by 10 m M DyDTPA2-, however, is smaller than A, because the small (Ah + 4f) induced by DyDTPA2- is actually up$eld (J. Szklaruk and W. D. Rooney, unpublished results) and partially cancels the downfield BMS shift in this sample configuration.
Naritomi, Kanashiro, Sasaki, Kuribayashi, and Sawada (NKSKS) recently re- ported 2.5 ppm downfield shifts of parts of the in vivo water ‘H signals from the leg muscles and brains of gerbils infused with an amount of DyTTHA3- sufficient to produce discrete peaks (30 ) . Their infusion solution had an extraordinarily high ideal osmolality of 3.0. They attributed these shifts to the Ah contribution in compartments entered by DyTTHA3-. However, the molar ratio of DyTTHA3- to water in these compartments likely never rose above 3 X (35). The value offb for water could hardly have ever been much larger than this. The Dy( 111) in DyTTHA’- is almost certainly coordinatively saturated with the TTHA6- ligand ( I ) . Even if it were not, the value of A: for water directly bound to Dy( 111) is unlikely to be greater than 5 X lo2 ppm downfield (60, 61). Thus, the value of Ah for the H20 ‘H (or ’H) reso- nance in aqueous solutions of DyTTHA3- may be negligible ( vide infra). This is why we have always field-frequency locked on the 2H resonance in single compartmental determinations of the values of A,, for the 23Na resonance (37, 48,62). The value of

258 CHU ET AL.
A, for 'H is the same as that for 23Na in these cases and is effectively canceled by the field-frequency locking.
The shifts observed by NKSKS must surely be due to the A, contribution because every water 'H nucleus in a given compartment experiences this effect. In a collabora- tion with Balaban published earlier ( 6 3 ) , we reported water 'H shifts induced by DyTTHA3- and TmTTHA3- in a frog skin preparation. We attributed these to the Ax contributions. The misattribution of NKSKS led them to incorrectly interpret their results. They suggested using the relative areas of the shifted and unshifted water 'H signals for an in vivo determination of the relative extra- and intracellular vol- umes-a very desirable capability-since DyTTHA 3- likely enters all extracellular spaces (except possibly the brain interstitium ( 1 , 35)) . However, as we have seen above, BMS shifts depend not only on the susceptibility of the compartment in which the nucleus resides but also on the susceptibilities of adjacent compartments as well as the shapes and orientations of the compartments. Thus, some of the shifted water 'H signal may correspond to intracellular water while some of the unshifted signal must correspond to extracellular water. A confirmation of this can be obtained by multiplying the ratios ( u N ~ , ~ / u N ~ , ~ ) . ( U ~ , ~ / U ~ , ~ ) , where ax,o represents the area of the shifted Xresonance and ax,i represents the area of the unshifted X resonance. If these areas were strictly proportional to the number of nuclei in the extra- and intracellular spaces, respectively, the ratio product would be the ratio of the concentrations of extra- and intracellular Na'. We have enlarged the 'H and 23Na spectra of NKSKS and integrated the shifted and unshifted peaks by planimetry. We obtain values for the product ratio of 6.4 for the leg muscle and 5.9 for the brain. The correct value for this ratio should be ca. 30 (35) . If the intracellular Na' signal was suffering a greater degree of NMR invisibility (3 , 47) than the extracellular Naf signal, this would be serving to only raise the value of the product ratio!
Wikman-Coffelt and co-workers have recently reported observations, similar to those of NKSKS, of the water 'H spectrum of isolated hamster hearts (31 ) and rat hearts (32) perfused with DyTTHA '-. Again, no mention of BMS effects is made in either paper. In the earlier paper, it is noted that the introduction of 10 m M DyTTHA3- induced a 1.7 ppm downfield shift of the water 'H signal of the perfusing buffer solution present at 35°C in a cylindrical tube, oriented parallel to the Zeeman magnetic field, in the absence of a heart. This is in good agreement with the value of 1.9 ppm calculated by combining [ 141, [ 201, and [ 291. It seems unlikely that the 0.2 ppm upjield discrepancy is due to Ah because Ah for the aquo Dy( 111) ion is downjield (60, 61 ). Thus, there is a negligible Ah contribution to the value of A induced in the water 'H resonance by DyTTHA3-. We have confirmed this by observing the spec- trum of the water 'H resonance of a DyTTHA3- solution in our capillary phantom.
The 'H spectrum of the healthy hamster heart perfused with DyTTHA3- shows a small portion of the water resonance to be shifted upfield by ca. 1.4 ppm to produce a discrete peak (31 ). Interestingly, this is not observed for the cardiomyopathic ham- ster heart. The rat heart spectra show that a portion of the signal which is shifted downfield by ca. one ppm is noticeably enhanced to become a discrete peak by perfu- sion with 4% alcohol (32) .
BULK MAGNETIC SUSCEPTIBILITY SHIFTS 259
Clearly, the shifts of the water 'H resonances induced by DyTTHA3- which are reported by NKSKS and Wikman-Coffelt and co-workers are due to BMS effects. We have seen that the BMS shift depends not only on the susceptibility of the compart- ment occupied by the host molecule but also on the shape of the compartment and its orientation in the magnetic field. However, before proceeding to analyze these effects, one must also consider the dynamical interchange of host molecules between different compartments during the course of the NMR signal acquisition. There are three general mechanisms for these dynamics. The first is the net Jlow of blood or perfusing fluid through the tissue's vessels. This carries host molecules from one envi- ronment to another as the vessel changes shape or orientation further downstream. A second mechanism is the dzflusiunal interchange of host molecules between the vasculature and the interstitium and throughout the interstitium. There may also be a small lymphatic flow in the interstitium. The third mechanism is the permeational interchange of host molecules across the cytoplasmic membrane between the intersti- tium and the cytoplasm. There are also, of course, intracellular environmental inter- changes. Interchange between different spectral environments ( say, regions with different A and/or A, values) can cause averaging of the spectral properties. What is important in this regard is the mean residence time of a host molecule in a given environment. This depends not only on the magnitude of the intrinsic kinetics for the mechanism of interchange (flow, diffusion, or permeation) but also on the size of the compartment corresponding to that environment ( 6 4 ) . The larger the com- partment, the longer the mean residence time. For the types of studies discussed in this paper, the H 2 0 and Na' host molecules share large intrinsic kinetics for the first two mechanisms: flow through the vessels and diffusion from vessels to interstitium and throughout the interstitium. However, while H20 permeation across the cy- toplasmic membrane is also fast, that of Na+ is slow. In any case, the observation of a discrete peak in a water 'H spectrum indicates that the mean residence times of water molecules in a certain kind of compartment is long on the chemical shift NMR time scale.
Because of the general nonanalytical nature of the BMS shift for all but the simplest compartment shapes and the complicated averaging effects of dynamical inter- change, one has slight hope of calculating the compartments giving rise to the shifted water 'H signals reported by NKSKS or Wikman-Coffelt and co-workers. Given the results seen in Fig. 6d and Table 4, we can, however, surmise that the most downfield shifted discrete peak corresponds to H20 in the largest vessels running parallel to the spectrometer magnetic field (perhaps the descending branches of the great cardiac vessels in the isolated, perfused heart ( 6 5 ) ) . The most upfield shifted water 'H signal may correspond to the largest vessels oriented perpendicular to Bo (say, the coronary sinus in the isolated, perfused heart ( 6 5 ) ) .
However, a great advantage of MRI is that one does not have to just surmise! A chemical-shift-selected image (one form of CSI) of tissue based on only one of the shifted discrete peaks, or of a limited spectral region, should be a relatively distortion- free picture of only those compartments experiencing that shift. In this regard, DyDTPA2- might be better than DyTTHA3- because of its lower osmolality ( 1 ) and HoDTPA2- may work just as well because Ho(II1) shares the largest value of p e ~

260 CHU ET AL.
with Dy( 111) (Ref. (50, p. 1776)). This would involve using DyDTPA2- as a shift- based CR rather than as a relaxation-based CR as has been reported by the Brady group (28). Solutions of the Dy(II1) and Ho(II1) chelates of DOTA4- ( 1,4,7,10- tetraazacyclododecane-N,N‘,N”, W-tetraacetate (59, 66)), NOTA3- ( 1,4,7-triaza- cyclononane-N,N’,N”-triacetate ( 5 9 ) ) , and D03A 3- ( 1,4,7,1 O-tetraazacyclododec- ane-N’,N’,N”-triacetate (67)) may be just as effective and will have even lower osmo- lalities. Some intravascular reagents-proteins or polymers ( I ) or liposomes ( 6 8 ) which have been multiply-labeled with paramagnetic metal ions, and superparamag- netic (33, 69) or ferromagnetic (69, 70) particles-have much higher effective mag- netic moments and may be even better, provided their T2 relaxivities are not too great. We have conducted exploratory tests of such CSI experiments ( 71 ) .
As stated above, the other major problem related to the interpretation of BMS shifts in the literature is the neglect of local susceptibility effects. In an extensive recent paper on BMS artifacts in MRI, Ludeke, Roschmann, and Tischler (LRT) make this error when they predict D terms analogous to those of the third column of Table 1 for a sphere and a cylinder perpendicular to the magnetic field (19 ) . A nonzero D term means a frequency shift and therefore a position shift in a normal NMR image. Thus, LRT predict a position shift for the intensities of pixels representing the inside of a sphere which depends on the susceptibility of the medium inside the sphere. As the fifth column of Table 1 shows, this is not to be expected. For the same reason, LRT predict the wrong direction for the position shift for the intensities of pixels representing the inside of a perpendicular cyliner. Likewise, their values for the out- side D terms are also incorrect. Edmonds and Wormald have recently offered a very lucid theoretical treatise on the use of the Maxwell equations which, however, ne- glected local susceptibility effects (26).
ACKNOWLEDGMENTS
We thank Professors Jerry Ackerman, Gerry Harbison, Paul Lauterbur, Bob Lenkinski, Dave Lloyd, and Bob Shulman, and Drs. Truman Brown and Dave Yarmush for stimulating discussions. Professor Ackerman first put us onto Ref. (51 ); Professor Lauterbur, Ref. (18); and Professor Lenkinski, Ref. (19). Dr. Yarmush was the first to observe an inhomogeneous annular 23Na pattern in our laboratories ( 72) and to put us onto Ref. (46). Dr. Stu Rosenblum helped us with the sample spinning experiments. We thank Ms. Marie Dippolito for word processing this manuscript, and we thank the National Science Foundation (Grants PCM-8 104630, PCM-8408339, and DMB-87 19852) and the National Institutes ofHealth (Grant ROl-GM32125) for support ofthis work.
REFERENCES
1. R. B. LAUFFER, Chem. Rev. 87,901 ( 1987). 2. T. J. WENZEL, “NMR Shift Reagents,” CRC Press, Boca Raton, FL, 1987. 3. C. S. SPRINGER, Annu. Rev. Biophys. Biophys. Chem. 16,375 ( 1987). 4. C. S . SPRINGER, Ann. N . Y. Acad. Sci. 508,130 ( 1987). 5. C. S. SPRINGER, in “NMR Techniques in the Study of Cardiovascular Structure and Function” (M.
6. P. DEA, S . I. CHAN, AND F. J. DEA, Science 175,206 ( 1972). 7. T. CONLON AND R. OUTHRED, Biochim. Biophys. Acta 288,354 ( 1972). 8. R. OUTHRED AND T. CONLON, Biochim. Biophys. Acta318,446 ( 1973). 9. M. E. FABRY AND M. EISENSTADT, Biochem. J. 15,1101 ( 1975).
Osbakken and J. C. Haselgrove, Eds.), Chap. 14, p. 289, Futura Pub. Co., Mt. Kisco, NY, 1988.
BULK MAGNETIC SUSCEPTIBILITY SHIFTS 26 1
10. T. CONLON AND R. OUTHRED, Biochim. Biophys. Acta 511,408 ( 1978). 11. H. DEGANI AND G. A. ELGAVISH, FEBS Lett. 90,357 ( 1978). 12. K. M. BRINDLE, F. F. BROWN, I. D. CAMPBELL, C. GRATHWOHL, AND P. W. KUCHEL, Biochem. J.
13. F. F. BROWN, J. Magn. Reson. 54,385 (1983). 14. C. T. W. MOONEN, S. E. ANDERSON, AND S. UNGER, Magn. Reson. Med. 5,296 ( 1987). 15. H. M. MCCONNELLAND R. E. ROBERTSON, J. Chem. Phys. 29,1361 (1958). 16. W.C. D I C K I N S O N , P ~ ~ ~ . Rev. 81,717( 1951). 17. M. G. MORIN, G. PAULETT, ANDM. E. HOBBS, J. Phys. Chem. 60,1594( 1956). 18. J. R. ZIMMERMAN AND M. R. FOSTER, J. Phys. Chem. 61,282 ( 1957). 19. K. M. LUDEKE, P. ROSCHMANN, AND R. TISCHLER, Magn. Reson. Imaging3,329 (1985). 20. G. MCKINNON, P. ROSCHMANN, AND R. TISCHER, Magn. Reson. Imaging 3,4 17 ( 1985). 21. F. W. SMITH AND G. A. CROSHER, Magn. Reson. Imaging3,287 ( 1985). 22. P. C. LAUTERBUR, M. L. BERNARDO, AND M. H. MENDONCA DIAS, “Abstracts, Fifth Annual Mtg.
23. I. R. YOUNG, S. KHENIA, D. G. T. THOMAS, C. H. DAVIS, D. G. GADIAN, I. J. COX, B. D. Ross, AND
24. R. E. WENDT, M. R. WILLCOTT, W. NITZ, P. H. MURPHY, AND R. N. BRYAN, Radiology 168,837
25. D. T. EDMONDS, R. J. P. WILLIAMS, AND M. R. WORMALD, J. Inorg. Biockem. 28,381 (1986). 26. D. T. EDMONDS AND M. R. WORMALD, J. Magn. Reson. 77,223 ( 1988). 27. K. J. PACKER, J. Magn. Reson. 9,438 (1973). 28. A. VILLRINGER, B. R. ROSEN, J. W. BELLIVEAU, J. L. ACKERMAN, R. B. LAUFFER, R. B. BUXTON,
29. M. A. BROWN, T. T. STENZEL, A. A. RIBEIRO, B. P. DRAYER, AND L. D. SPICER, Magn. Reson. Med.
30. H. NARITOMI, M. KANASHIRO, M. SASAKI, Y. KURIBAYASHI, AND T. SAWADA, Biophys. J. 52,611
31. A. BOUCHARD, T. A. WATTERS, S. Wu, W. W. PARMLEY, R. D. STONE, E. BOTVINICK, R. SIEVERS,
180,37 (1979).
SOC. Magn. Reson. Med.,” p. 229, WIP, SOC. Magn. Reson. Med., Berkeley, CA, 1986.
G. M. BYDDER, J. Comput. Assist. Tomogr. 11,2 ( 1987).
(1988).
Y.-S. CHAO, V. J. WEEDEN, AND T. J. BRADY, Magn. Reson. Med. 6, 164 ( 1988).
3,289 ( 1986).
(1987).
G. JASMIN, AND J. WIKMAN-COFFELT, J. MO/. cellCardio/. 19, 101 1 ( 1987). 32. W. AUFFERMANN, A. CAMACHO, S. WU, L. LITT, W. W. PARMLEY, C. B. HIGGINS, AND J. WIKMAN-
COFFELT, Magn. Reson. Med. 8,58 ( 1988). 33. P. F. RENSHAW, H. BLUM, AND J. S. LEIGH, J. Magn. Reson. 69,523 ( 1986). 34. J. A. BALSCHI, S. J, KOHLER, J. A. BIITL, C. S. SPRINGER, AND J. S. INGWALL, J. Magn. Reson. 83,
35. J. A. BALSCHI, J. A. BITTL, C. S. SPRINGER, AND J. S. INGWALL, submitted for publication. 36. F. INAGAKI AND T. MIYAZAWA, Prog. NMR Spectrosc. 14,67 ( 198 1 ). 37. M. M. PIKE, D. M. YARMUSH, J. A. BALSCHI, R. E. LENKINSKI, AND C. S. SPRINGER, Inorg. Chem.
38. J. A. GLASEL AND K. H. LEE, J. Amer. Chem. SOC. 96,970 ( 1974). 39. R. J. MEYERS, “Molecular Magnetism and Magnetic Resonance Spectroscopy,” p. 230, Prentice-Hall,
40. A. D. BUCKINGHAM, T. SCHAEFER, AND W. G. SCHNEIDER, J. Chem. P h p . 32,1227 ( 1960). 41. C. LUSSAN, J. Chim. Phys. 61,462 ( 1964). 42. D. J. FROSTANDG. E. HALL,Mo/. Phys. 10,191 (1966). 43. J. K. BECCONSALL, Mo/. Phys. 15,129 ( 1968). 44. D. H. LIVE AND S. I. CHAN, Anal. Chem. 42,791 ( 1970). 45. G. R. A. HUNT AND L. R. H. TIPPING, J. Inorg. Biochem. 12, 17 ( 1980). 46. K. G. ORRELLAND V. SIK, Anal. Chem. 52,567 ( 1980). 47. W. D. ROONEY, T. M. BARBARA, AND C. S. SPRINGER, J. Amer. Chem. Soc. 110,674 ( 1988). 48. S. C. CHU, M. M. PIKE, E. T. FOSSEL, T. W. SMITH, J. A. BALSCHI, AND C. s. SPRINGER, J. Magn.
49. “Handbook of Chemistry and Physics” (R. C. Weast, Ed.), 64th ed., p. D-257, CRC Press, Boca
138 ( 1989).
22,2388 (1983).
Englewood Cliffs, NJ, 1973.
Reson. 56,33 (1984).
Raton, F’L, 1984.
262 CHU ET AL.
50. L. N. MULAY, “Magnetic Susceptibility,” Interscience, New York, 1963. 51. M. M. MARICQAND J. S. WAUGH, J. Chem. Phys. 70,3300 (1979). 52. R. F. SPANIER, T. VLADIMIROFF, AND E. R. MALINOWSKI, J. Chem. Phys. 45,4355 ( 1966). 53. D. F. EVANS, J. Chem. Soc., 2003 (1959). 54. C. A. REILLY, H. M. MCCONNEL, ANDR. G. MEISENHEIMER, Phys. Rev. 98,264 (1955). 55. R. ENGEL, D. HALPERN, AND S. BIENENFELD, Anal. Chem. 45,367 ( 1973). 56. J. SZKLARUK, K. CLARKE, J. F. MARECEK, A. L. SPRINGER, J. A. BALSCHI, T. W. SMITH, J. S. ING-
WALL, AND C. S. SPRINGER, “Abstracts, Seventh Annual Mtg. SOC. Magn. Reson. Med.,” p. 273, SOC. Magn. Reson. Med., Berkeley, CA, 1988.
57. S. M. ANSON, R. B. HOMER, AND P. S. BELTON, Znorg. Chim. Acfu 138,241 ( 1987). 58. C. R. MALLOY, T. W. SMITH, J. L. DELAYRE, AND E. T. FOSSEL, “Abstracts, 22nd Experimental
NMR Conference,” Asilomar, CA, April ( 198 1 ). 59. C. C. BRYDEN, C. N. REILLEY, AND J. F. DESREUX, Anal. Chem. 53,1418 ( 198 1 ). 60. J. REUBENANDD. FIAT, J. Chem. Phys. 51,4909 (1969). 61. W. DEW. HORROCKS AND J. P. SIPE, J. Amer. Chem. SOC. 93,6800 ( 197 1 ). 62. M. M. PIKEANDC. S. SPRINGER, J. Magn. Reson. 46,348 (1982). 63. R. S. BALABAN, in “Physical Methods in the Study of Epithelia” (M. A. Dinno, A. B. Callahan, and
T. C. Rozzell, Eds.), p. 73, Alan R. Liss, New York, 1983. 64. S.-T. CHEN AND C. S. SPRINGER, Biophys. Chem. 14,375 ( 198 1 ). 65. R. M. BERNE AND M. N. LEVY, in “Physiology” (R. M. Berne and M. N. Levy, Eds.), p. 597, C. V.
66. M. F. TWEEDLE, G. T. GAUGHAN, J. J. HAGAN, P. W. WEDEKING, P. SIBLEY, L. J. WILSON, AND
67. M. F. TWEEDLE, G. T. GAUGHAN, C. A. CHANG, AND J. J. HAGAN, “Abstracts, Seventh Annual Mtg.
68. G. W. KABALKA, E. BUONOCORE, K. HUBNER, M. DAVIS, AND L. HUANG, Mugn. Reson. Med. 8,89
69. P. GILLIS AND S. H. KOENIG, Mugn. Reson. Med. 5,323 ( 1987). 70. P. F. RENSHAW, C. S. OWEN, A. C. MCLAUGHLIN, T. G. FREY, AND J. S. LEIGH, Mugn. Reson. Med.
71. Y . Xu, J. A. BALSCHI, AND C. S. SPRINGER, M u p Reson. Med., in press. 72. D. M. YARMUSH, Ph.D. dissertation, State University of New York, Stony Brook, NY, 1983.
Mosby Co., St. Louis, 1983.
D. W. LEE, Nucl. Med. Biol. 15,31 ( 1988).
SOC. Magn. Reson. Med.,” p. 788, SOC. Magn. Reson. Med., Berkeley, CA, 1988.
(1988).
3 ,2 17 ( 1986).