Exemplified by a Mind map Application. By Steinar J Dra - CORE
156
Development of a Synchronous, Distributed and Agent-supported Framework: Exemplified by a Mind map Application. By Steinar J Dragsnes Thesis Submitted in Partial Fulfillment of the Requirements for the Degree of Candidatus rerum politicarum Department of Information Science University of Bergen November 2003
-
Upload
khangminh22 -
Category
Documents
-
view
0 -
download
0
Transcript of Exemplified by a Mind map Application. By Steinar J Dra - CORE

Development of a Synchronous, Distributed and Agent-supported
Framework:
Exemplified by a Mind map Application.
By
Steinar J Dragsnes
Thesis
Submitted in Partial Fulfillment
of the Requirements
for the Degree of
Candidatus rerum politicarum
Department of Information Science
University of Bergen
November 2003

1
Acknowledgements
There are several persons who have made this work possible. First of all I would like to thank
my supervisor Anders Mørch for guiding me in my work and in the writing of this thesis. I
also want to thank Rune Baggetun, Henrik Schalnbusch, Barbara Wasson and Weiqin Chen
for supporiting this work and helping me out in many ways. Further, I would like to
acknowledge the participants of the DoCTA NSS project and all at InterMedia for creating
such a nice environment to conduct research. The thesis has partially been funded by the
Norwegian Ministry of Education and Research Affairs (UFD) under their Information
Technology in Education (ITU) Program.
Last, but not least, I thank my family and my girlfriend for supporting me.
Steinar J Dragsnes
Bergen, November 2003

2
Contents
1 INTRODUCTION ................................................................................................................................................. 4
1.1 BACKGROUND.......................................................................................................................................... 5 1.2 THE STRUCTURE OF THIS THESIS.............................................................................................................. 7
2 CONTEXT AND PROBLEM IDENTIFICATION .......................................................................................... 8
2.1 RESEARCH QUESTION ..................................................................................................................................... 10
3 THEORIES AND MODELS.............................................................................................................................. 12
3.1 COMPUTER SUPPORTED COOPERATIVE WORK................................................................................................ 12 3.2 COMPUTER SUPPORTED COLLABORATIVE LEARNING..................................................................................... 13 3.3 SPECIFIC THEORETICAL UNDERPINNINGS ....................................................................................................... 15
3.3.1 Genuine interdependence ...................................................................................................................... 15 3.3.2 Awareness, articulation work and coordination theory ....................................................................... 16 3.3.3 Collaboration patterns .......................................................................................................................... 18
3.4 METHODOLOGICAL SURVEY: HOW TO BUILD MIND MAPS IN GROUPS. .......................................................... 19 3.4.1 What is a mind map? ............................................................................................................................. 19 3.4.2 The difference between mind mapping and brainstorming. ................................................................. 20 3.4.4 Benefits with a computer based mind map............................................................................................ 22
4 DESIGNING THE FRAMEWORK AND THE MINDMAP......................................................................... 24
4.1 TECHNICAL REQUIREMENTS........................................................................................................................... 24 4.1.1 Rationale for building our own system ................................................................................................. 24 4.1.2 Technical requirements for the framework (and the Mindmap)........................................................... 25
4.2 THE MINDMAP APPLICATION.......................................................................................................................... 27 4.2.1 Logging on to the Mindmap .................................................................................................................. 28 4.2.2 The hallway............................................................................................................................................ 30 4.2.3 Joining a session or creating a new one ............................................................................................... 31 4.2.4 Diagram functionalities......................................................................................................................... 34 4.2.5 Sharing the private workspace area...................................................................................................... 49 4.2.6 The pop-up menu ................................................................................................................................... 52 4.2.7 Representations...................................................................................................................................... 55
4.3 CONCURRENCY CONTROL .............................................................................................................................. 57
5 THE IMPLEMENTATION OF A PEDAGOGICAL COORDINATION AGENT ................................... 60
5.1 WHAT IS AN AGENT ........................................................................................................................................ 60 5.2 ANOTHER APPROACH TO DESIGNING PEDAGOGICAL AGENTS ........................................................................ 62
5.2.1 The complexity of distribution............................................................................................................... 63 5.2.2 The complexities of interaction ............................................................................................................. 64
5.3 DESIGN IDEAS FOR LESS INTRUSIVE AGENTS.................................................................................................. 65

3
5.4 USER–AGENT INTERACTIONS IN THE MINDMAP............................................................................................. 72 5.5 ADVANTAGES OF SUCH AN APPROACH........................................................................................................... 75
6 METHOD ............................................................................................................................................................. 76
6.1 PROGRAMMING AS METHOD........................................................................................................................... 76 6.2 METHODOLOGIES IN CSCW AND CSCL........................................................................................................ 77 6.3 CHOOSING A METHOD..................................................................................................................................... 79 6.4 FORMATIVE USABILITY METHODS.................................................................................................................. 80 6.5 METHOD TRIANGULATION.............................................................................................................................. 82 6.6 SCENARIOS ..................................................................................................................................................... 82
6.6.1 The Adapt-It morning meetings............................................................................................................. 83 6.6.2 The DoCTA scenario ............................................................................................................................. 83 6.6.3 The “Intelligent System’s” scenario ..................................................................................................... 83
7 FINDINGS............................................................................................................................................................ 87
7.1 THE ADAPT-IT TEST-CASES............................................................................................................................ 87 7.1.1 Interesting observations during the Adapt-It testing ............................................................................ 88
7.2 THE DOCTA SCENARIO. ................................................................................................................................ 91 7.2.1 Technical findings from the DoCTA scenario....................................................................................... 91
7.3 THE IFI FIELD-EXPERIMENT........................................................................................................................... 93 7.3.1 Findings from the IFI field trial ............................................................................................................ 94
8 DISCUSSION..................................................................................................................................................... 102
8.1 MIND MAPPING SOFTWARE........................................................................................................................... 102 8.1.1 Visual Mind 5.0.................................................................................................................................... 103 8.1.2 Freemind .............................................................................................................................................. 106 8.1.3 MindManager ...................................................................................................................................... 109 8.1.4 Comparisons to the Mindmap ............................................................................................................. 112
9 CONCLUSIONS AND FUTURE WORK...................................................................................................... 114
9.1 FUTURE WORK.............................................................................................................................................. 116
10.0 REFERENCES ............................................................................................................................................. 119
APPENDIXES....................................................................................................................................................... 127

4
1 Introduction
The use of network technology has increased dramatically since the emergence of the World
Wide Web in the mid 90-ties. Web pages soon became a popular way of conveying
information. Researchers, teachers and several business companies saw the opportunity to
develop applications exploiting the new information and communication technology (ICT) to
coordinate and enhance their everyday work. Direct benefits from these efforts could be
savings both in time and of economical proportions due to less travelling, while enabling
people to work together regardless of time constraints and geographical locations.
As companies started to build networked systems to support the new collaboration
opportunities, researchers saw the necessity to investigate how the new technology would
impact and change how people work and learn. Such research would also prove beneficial in
trying to understand how to better design collaborative systems. The research paradigms
Computer Supported Collaborative Work (CSCW) and Computer Supported Collaborative
Learning (CSCL) focus on understanding these issues. More precisely, the main concern
within these fields is on the various impacts that ICT have on social interaction, through
learning and working in groups.
This thesis will be situated in conjunction of the two research paradigms mentioned above,
with a special focus on how to support distributed users. I introduce and describe different
techniques implemented to provide means for facilitating the interdependencies among
collaborating peers. For this purpose I have developed a mind map program, where users can
interact and draw conceptual maps of different problems at hand. To exemplify how to better
facilitate the collaboration-process taking place between distributed users, I have further
developed a prototype of a pedagogical agent1. Special care has been given to the architectural
design of the program. During implementation, I saw the possibility to make all kinds of
diagram editors based on the code I was writing and had already written. Thus I extracted the
general functionality from the special classes and put it into general classes. These classes
have now become a framework for developing other diagram editors. This is beneficial for
1 Pedagogical agent is a broad term that covers several types of agent roles such as tutors, facilitators, helpers, instructors and coordinators. In this thesis I use some of these terms interchangeably, but mostly I use the term coordinator or facilitator. This is done to explicitly emphasize the role of the agent.
5
future students who want to make diagram editor programs for specific application domains.
Too few students seem to be willing to develop programs. One of several reasons could be
that students lack a framework to position them selves within and starting from scratch often
involves much extra work. The framework presented within the mind map program is
designed to provide a working context for students to implement future diagrams such as
UML, ER, dataflow or other diagrams.
1.1 Background
I was invited to participate in the DoCTA (Design and use of Collaborative Telelearning
Artifacts) research project by Anders Mørch. At that point, DoCTA had entered its second
face called DoCTA NSS, with research focus on Natural Science Studios. The main, long
term research objectives within the project is how to design and use shared artefacts in
collaborative telelearning environments by:
• taking a socio-cultural perspective on learning-activity focusing on the interpersonal,
social interaction.
• contributing to the collaborative telelearning knowledge about the pedagogical design
of learning scenarios, the technological design of the learning environment to support
these learning scenarios, and the organisational design for management of such
learning environments, including reflection on teacher and learner roles.
• studying and evaluating the social and cultural aspects of distributed collaborative
telelearning environments.
(Adapted from the Project DoCTA report, Wasson, Guribye & Mørch, 2000).
By applying these research objectives in field-studies, the project seeks to improve the
understanding of learning activities occurring in telelearning scenarios. This will again lead to
better design, management and affordances2 (Gibson, 1986; Laurillard, 1987; Norman, 1990;
Erickson et al, 2000) in on-line learning environments.
2 See footnote 49, page 91 for a description of the concept affordances.

6
As an approach to design better systems to support telelearning scenarios, the DoCTA project
has been interested in agent technology and how agents should be implemented to support
students in solving collaborative learning tasks. In the design of the VisArt scenario, special
preparations were made to conduct a Wizard of Oz study. The researchers in DoCTA wanted
to gather information about possible agent behaviours, capabilities and functionality. This pre-
study was achieved by having humans to simulate pedagogical software agents (Jondahl,
2001). The Wizard of Oz methodology was chosen because it is easy to arrange, cost efficient
and a convenient way of simulating artificial intelligent behaviour. “Even though the human
agents were given a list of predefined rules for user – agent interaction, human cognition can
interpret situations and phrase feedback in natural language suiting the context at hand“
(Jondahl, ibid. p.35). The findings derived from this study suggested various roles a
pedagogical agent can take in a distributed collaborative setting, but give few answers for how
the simulated functionality should be implemented (how to code human behaviour!).
In the second phase of the DoCTA project, goals were set out to implement working agent
prototypes by applying some of the findings from the Wizard of Oz study and from the
DoCTA I study in general. Jan Dolonen had already started implementing a pedagogical agent
for the Future Learning Environment 2 (FLE 2) when I joined the project (Dolonen, 2002).
Since FLE is an asynchronous environment, my supervisor Anders Mørch wanted me to
implement a pedagogical agent for a synchronous environment. After some discussion, I
proposed to create a mind map program where users can collaborate in real time across a
network. The domain of mind maps was chosen basically because everyone can learn to
create and understand mind maps without extensive training and introduction to theories and
methodologies (this is a claim maintained by Tony Buzan (1993), the inventor of the mind
map and its’ methodologies and practises).
Another important factor was that mind maps could be an area for joint meaning making
when applied in knowledge building scenarios. Research on how students construct
knowledge in groups is a central theme in the DoCTA project. The chosen groupware
application FLE reflects this focus. FLE contains a knowledge-building module that integrates
the pedagogy of progressive inquiry-based learning (Muukkonen, Hakkarinen & Leinonen,
2000). The main idea behind this pedagogy is to activate students in the learning process by
letting them imitate scientific research methods. They progressively post their “research”
questions and answers into the system to gain deeper knowledge. As the students contribute to

7
each other’s postings, a joint understanding and construction of knowledge will emerge, and a
visualization of this process will be available through FLE. However, FLE does not support
synchronous communication. Most group activities run into situations where they need
synchronous interaction to overcome obstacles. Especially in early stages of the collaboration
process, when ideas must be created and elaborated, decisions taken and workload divided.
Solving problems, reaching agreements and making decisions are difficult and time-
consuming through the asynchronous FLE environment. Thus designing a web-based
meeting-place for groups, supporting these synchronous needs was seen as important in the
project. This was the starting-point for the design requirements; it should support
brainstorming and/or mind mapping for groups. Thus the Mindmap3 can be used both in
conjunction with other groupware programs, or alone, depending on the learning scenario at
hand.
1.2 The structure of this thesis
In the next chapter I will start with explicitly situating my work within the DoCTA research
goals, before I describe my exploratory research approach. In chapter 3 I will describe my
theoretical framework by presenting different theories and models that make up the
foundations for this thesis. Then in chapter 4 I will present the requirements for the
framework and describe the Mindmap program in general (explain the implemented
functionality (tools for use) including the various ideas behind these tools). In chapter 5 I will
present the design ideas for a pedagogical coordination agent, and illustrate the architecture of
an implemented prototype. Then I chapter 6 will introduce the methodologies used for testing
the system while chapter 7 will present interesting findings from the arranged test scenarios
and field studies, and these findings will be discussed as they are emerged. Chapter 8 will
present a discussion where the Mindmap will be compared to some other mind mapping
software products. Here I will focus on differences between the applications and how well
they support collaboration. Finally, chapter 9 will sum up my thesis and suggest a few
improvements for the future.
3 I use the term mind map when talking about mind maps in general, while the term Mindmap is the name given to the program I have developed.

8
2 Context and problem identification
When I first started to work on this thesis, my main goal was to design and implement a
pedagogical agent. Early in the design process I understood that much general architectural
work must be done before the agent implementation could start. The agent must have a
context and an environment to be situated within. Thus I started to design and implement a
networked, web-based environment for drawing mind maps. This work has proved to be both
difficult and time-consuming, forcing me to modify my original design goal of implementing
a pedagogical agent. My new goals became to:
- deliver a meeting place where creative group processes could take place,
- where distributed users could collaborate,
- where the workload between user – machine – user could be altered to leave the users
with more focus on their work and less focus on computer coordination issues.
In this process, I also designed a framework for instantiating different types of diagram
editors (e.g. ER, UML) where the Mindmap can bee seen as example of how to create such
instances.
Modelling is an important activity and is done to better understand some domain of the world.
With computers and especially graphical user-interfaces, modelling has become much more
efficient4 and several modelling languages have thus been developed and computerised.
Models use different rules and concepts to visualise and explain relationships within a given
domain, this meta information is often described as diagram notations. For instance, when
drawing an Entity-Relationship diagram to model the logic in a database, the entities and
relations co-exist based on a set of rules described by the Standard Querying Language. Such
domain specific rules can be programmed so that an agent can validate the model against
these rules. Users may not always be aware of all the rules in a specific domain. In such
situations, it could be helpful to have pedagogical agents to advertise best practises, avoiding
unfortunate implications, and illegal states in the model. Being aware of these possibilities, I
decided to implement a working agent prototype5 to exemplify how agent technology can be
integrated in the application framework. As the domain of mind maps does not have strict
4 Easier to restructure and change the model. 5 Also, I did not want to abandon my original design goal of implementing a pedagogical agent.

9
rules for modelling, I chose to focus on supporting general group processes instead. A
detailed description of the theoretical underpinnings for the design can be found in chapter 3
while chapter 4 describes the implemented functionality. Chapter 5 introduces the design
ideas and show how these have been implemented as the architecture is explained.
As mentioned earlier, one of the aims for DoCTA NSS is to design and implement working
agent prototypes. Based on research by Bourdeau and Wasson (1997), The ITU – Program
Application for 2000 until 2003, proposes three different roles that a pedagogical agent can
serve:
• collaboration and coordination agents
• discussion agents
• subject – matter agents
The collaboration and coordination agents’ responsibility will be to monitor how students
collaborate according to identified collaboration patterns (Wasson and Mørch, 2000) and
Salomon’s (1992) notion of genuine interdependence and give feedback when student are not
fulfilling these principals. The collaboration and coordination agents play the role of
someone “watching behind your shoulder”, as a kind of virtual facilitator (from the ITU –
Program Application, 2000, pp. 7). The agent can also do articulation work and coordinate
users by providing contextual information about the actions of other users. It is this
description of a facilitating agent I have based my design upon. The agent prototype
implemented tries to fulfil the roles outlined above.
I have not looked into the complexities of the discussion agents6 or subject – matter agents7.
This is mainly because mind maps are domain-independent (no subject – matter). Even
though discussions take place in a synchronous chat, no effort to interpret and analyse the
postings in the chat takes place. I do admit that such extensions, if incorporated into the agent
6 Discussion agents can act like coaches in Belvedere. Such agents have no subject – matter knowledge, but have an internal mapping about the relationship between discussion nodes. Simple reactive mechanisms will be triggered if a discussion tree is unbalanced, implying that students only argue either for or against the problem starting the discussion thread. Other constraints could also be added, like how many posting there should be in a balanced discussion tree and etc. 7 The aim for subject – matter agents’ is to implement a mapping between application interface and the functionality they provide about the subject – matter being discussed or modelled in the application. Whereas these agents will not be able to parse complete sentences typed by users, the agent will be able to detect keywords appropriate for an application area. An example of a subject matter agent is Janus, an agent for kitchen design. Domain concepts are kitchen appliances, such as sink and stove and depicted as graphical nodes, and rules define relationships between the appliances (such as stove should not be in front of a window). Every time a relationship is violated the agent informs the users about this in a separate message window (Fischer, McCall and Morch, 1989).

10
system, would provide a richer context (giving more information) about what is happening in
the environment. This would in turn enhance the agent’s capabilities to produce precise and
adaptive interactions, especially from an AI – perspective.
2.1 Research question
In distributed settings, where collaborating users cannot meet face to face to solve their
problems, the amount of articulation work8 will often increase. I therefore see a need for
various awareness mechanisms to bring contextual information about what other users are
doing in the system, to give meaningful context for a single user to do his/her needed work. In
addition, solving problems often involve discussion, sharing knowledge, contributions and a
division of labour among the participants. To accommodate these needs, I have constructed a
mind map application where participants can meet, discuss and make decisions about how to
solve a joint problem. Into this program I have embedded various mechanisms for
coordinating users. One such mechanism is the prototype of a pedagogical coordination agent.
The coordination agent is concerned about how users interact with each other through the
system. The goal is to indirectly convey how users are supposed to work when jointly creating
mind maps. These practises are described by Tony Buzan (1993), and explained thoroughly at
the end of chapter 3. Even though much of the focus is on group collaboration processes, the
most important part is the engaging role the agent takes when trying to facilitate genuine
interdependence among the users (students).
I decided to take an exploratory research approach when investigating if and how the
developed application enabled distributed, collaborating users to create mind maps. This is
natural, as the Mindmap has been tested at different stages of the development, with a
different focus in each experiment. The initial research question I have formulated as the
starting point and guide in this explorative research is:
”Can the Mindmap program (more specifically, the implemented awareness mechanisms together with the prototype of a coordination agent) enable collaborating users in their work of solving a joint problem?”
8 See chapter 3 for a definition of articulation work.

11
To address the research question, I have conducted three different kinds of field experiments.
The first test focused only on functionality and usability, while the second test (a part in the
DoCTA scenario) was supposed to focus on the agent part as well. Technical problems forced
me to conduct a third field experiment to gain information about the agent prototype. In the
last experiment I conducted a formative usability test of the application, looking at the
usability of the program in general with special interest in the agent prototype. After the
experiment, I interviewed the participating students. Interesting findings from the three field
experiments will be presented in chapter 7.

12
3 Theories and models
There are several, wellestablished theories based upon research in the fields of CSCW and
CSCL on how to facilitate distributed users in learning and work environments. It is therefore
useful to look into some of these theories when designing support mechanisms for the
Mindmap. In addition to presenting briefly the research fields of CSCW and CSCL, I will
introduce a relevant method describing how to create mind maps in groups (Buzan, 1993).
But first I will give a short description of the main research fields this thesis is situated within.
I will not focus so much on the differences,9 but rather pool on what these two fields have in
common. Then I will go into detail about the specific theories I have used in the design and
implementation of the mind map application.
3.1 Computer supported cooperative work
In the mid-1960s, successful mainframe systems coordinating tasks such as airplane
reservation and payroll automation had been developed. In the mid-1970s, microcomputers
promised to support groups and organisations in more sophisticated, interactive ways, and the
notion of Office Automation (OA) was borne. OA tried to extend and integrate single-user
applications, such as word-processors and spreadsheets, to support groups and departments in
large organisations (Grudin, 1994). But OA designers and developers failed to emphasize the
importance of studying peoples’ work-practices in organisations. Consequently, many
systems failed to fulfil requirements for accomplishing the various tasks at hand, and by 1984
OA had run out of steam (Grudin, 1994). OA practitioners needed to learn more about how
people work in groups and organisations and understand how technology affects their
behaviour. Thus CSCW emerged as an effort by computer scientists to learn from
anthropologists, organizational theorists, educators, social psychologists, economists and
anyone else who could shed light on group activity.
9 If you are interested in a nice overview of the differences between the CSCW and CSCL research fields, you can read Guribye, Andreassen & Wasson’s (2003) article published in the CSCL 2003 proceedings.

13
Today, CSCW has grown into a large research paradigm incorporating many kinds of
research interests. As a consequence, there is an ongoing debate about what the central
research issues in CSCW are. According to Carstensen and Schmidt (1999), an accepted
definition has not yet been established. Thus, several types of applications designed to support
users are considered to qualify as groupware. Some argue that even e-mail, telephones and
shared-file systems can be considered as groupware systems. Others have a narrower
definition and claim that only integrated systems10 like Lotus Notes can be called groupware.
According to Bannon and Schmidt (1991), groupware systems should be built upon the
understanding of cooperative work aspects. By emphasizing ethnographical system
requirements and designs, focusing on everyday practices such as Workaday World (Moran
and Anderson, 1990), they argue that simple e-mail and telephone technology do not take
work-practices and roles into consideration and thus cannot be classified as CSCW systems11.
By applying this view, e-mail and other “general-purpose” communication and coordination
systems are just enabling technologies for cooperative work. Wilson’s (1991) definition of
CSCW merges the technical design of enabling technologies with the understanding of work-
practices in organisations and groups. In his view, CSCW is “… a generic term which
combines the understanding of the way people work in groups with the enabling technologies
of computer networking, and associated hardware, software, services and techniques”.
3.2 Computer supported collaborative learning
CSCL has one of its roots founded on established research in CSCW. In addition it draws on
core disciplines like Pedagogy and deducted theories such as Activity Theory, Situated
Learning, Distributed Cognition and Constructivism. As in CSCW, there does not exist a
coherent agreement upon the definition of the central research issues in the field. However,
one general definition of collaborative learning, given by Cowie and Ruddock (1998),
characterise collaborative learning as an “opportunity to learn through expression and
10 By the term integrated systems I mean various tools such as email, group-policies, discussion forums, various degrees of file sharing, synchronous and asynchronous tools for collaborating on shared artefacts, are all embedded within the same environment. 11 They also “…reject the equation of Groupware with CSCW because of its technological focus and its narrowness in the face of multiplicity of social forms of cooperative work manifest in the world” (Bannon and Schmidt, 1991, p.52).

14
exploration of diverse ideas and experiences in cooperative company…[]…it is not about
competing with fellow members of the group and winning, but about using the diverse
resources available in the group to deepen understanding, sharpen judgment and extend
knowledge” (p.13). In the opening introduction of the CSCL’2002 proceedings, Koschmann
(2002) offers this definition for the CSCL domain: “CSCL is a field of study centrally
concerned with meaning and the practices of meaning-making in the context of joint activity,
and the ways in which these practices are mediated through designed artefacts” (p.1). But as
pointed out by Gerry Stahl, this definition is very broad since “all human activity is meaning-
making and everything in our physical, intellectual and cultural world can be considered an
artefact” (p.2). And so the discussion continues.
According to Koschmann (1996), there are three fundamental theories behind the CSCL
paradigm:
• Social Constructivism focuses on the construction of knowledge and not the
reproduction of knowledge. Individuals construct their own knowledge and give their
knowledge meaning as the level of experience increases (Jonassen et al, 1995). The
main focus of this theory is on understanding the social context in which learning
occurs, and how the context influences the learning process.
• Socio-cultural theories have been developed by psychologists (e.g. Leont’ev, 1978;
Vygtosky, 1978; Davydov, 1995) from the former Soviet Union. Vygotsky developed
the concept of “Zone of Proximal Development” ZPD. The basic assumption behind
this concept is that humans can perform complex tasks, seemingly beyond their level
of understanding, through help and supervision from more experienced humans (peers
or advisors).
• Situated Cognition emphasizes that meaningful learning occurs within the social and
physical environment in which the knowledge will be applied (Suchman, 1987; Lave,
1988; Mantovani, 1996). A central aspect is the concept of ”apprenticeship learning”
implying that a learner learns from someone who possesses greater experience within
a community of practice. Learning does not only occur in a social context, but also in
a practical context, where the learner observes a master solving the task. Gradually,
observation replaces doing as the learner gains deeper knowledge. In the end, the
learner will be capable of performing the task independently without any help (Lave,
1996).

15
Together these perspectives provide the intellectual heritage from which CSCL has emerged
as a new paradigm for research on instructional technology (Koshmann, 1996).
3.3 Specific theoretical underpinnings
As for this brief theoretical introduction of the CSCW and CSCL research fields, I will now
present some deducted theories from the presented fields in more detail. In the design and
implementation of the Mindmap, the theories of genuine interdependence, awareness,
articulation work, coordination theory and collaboration patterns have played a central role. I
will now explain these theories in detail and exemplify how I have used them in my thesis
while implementing the Mindmap.
3.3.1 Genuine interdependence
The concept of genuine interdependence was introduced by Salomon (1992, 1995). He states
that mindful engagement and personal responsibility of the individual learner is important for
fostering (inter-) dependencies among collaborating learners. Salomon found that the degree
of interdependencies would be reflected in the outcome of the collaboration process, where
stronger interdependencies gave better outcomes than weaker ones. Genuine inter-
dependencies is characterized by Salomon (1992) as:
• the necessity to share information, meanings, conceptions and conclusions;
• a division of labour where the roles of the team members complement one another in a
joint endeavour and where the end product requires this pooling of different roles;
• and the need for joint thinking in explicit terms that can be examined changed and
elaborated upon by peers.
The goal of the mind map program is to give users (students) an environment in which they
can collaborate mindfully together. However, there is no guarantee that people are interested
in doing this. I have tried to solve this problem by implementing a pedagogical agent with
encouraging roles. The intention is that the participants might choose to collaborate if

16
encouraged to participate, share information, think jointly, reach agreements and divide
workload when it is necessary.
3.3.2 Awareness, articulation work and coordination theory
When designing and implementing functionality to support coordination, theories of
awareness, articulation work and coordination are central and can give useful input on how
to go about doing this work. I have put these theories under the same paragraph (umbrella) as
I see a relationship between them. Below I will mainly define the various theories and at the
end give a few examples to how a union of them have influenced the design of the various
awareness mechanisms in the Mindmap.
3.3.2.1 Awareness
Dourish and Bellotti define awareness as “… an understanding of the activities of others,
which provides a context for your own activity” (Dourish and Bellotti, 1992, p.107).
Awareness can be understood as an automated mechanism for information sharing, noticing
users in a system about other peoples’ actions (current and past) in the environment. Such
information can be useful for users when trying to jointly accomplish a collaborative task.
Further, Dourish and Bellotti claim that such knowledge is a critical success factor for the
quality of the group work, implying that Groupware must support awareness for successfully
accomplishing its design goals. However, an important limitation is that awareness gives
information about what tasks or actions other users are doing/have done in a system, but not
the actual content of the action/event.
3.3.2.2 Articulation work
If the users themselves were to exchange all the information needed for coordination, they
would be imposed with an extra workload of enormous complexity (Guribye, Andreassen &
Wasson, 2003). This extra workload is often called “work about work” and Strauss and
colleagues have labelled this articulation work (Strauss et al., 1985; Gerson and Star, 1986;
Strauss 1988). Strauss discusses articulation work at different levels, from individual level up
to organisational level, before he extends the concept to include the articulation process. “The
overall process of putting all the work elements together and keeping them together
represents a more inclusive set of actions than the acts of articulation work” (Strauss, 1988;

17
p.164). This implies that articulated information must be coordinated against a larger context
for it to make sense.
3.3.2.3 Coordination theory
Coordination theory is about how to manage articulation work and is a part of what Malone
and Crowston (1994) call Coordination Science. Based on their studies of coordination
problems in several different types of organisations, they defined a set of dependency types
between activities and identified ways to manage them. From this work, a definition of
coordination became, “Coordination is managing dependencies between activities”. Three
basic types of dependencies have been identified (Crowston, 1991; Zlotkin, 1995) between
activities and resources:
• Flow: One activity produce an output (resource) that another activity requires as
an input.
• Sharing: Two or more activities share the same resource.
• Fit: More than one activity contributes in the production of an output (resource).
This definition, taken from the CSCW community, was the starting point when Bourdeau and
Wasson (1997) modelled interdependencies in a set of telelearning scenarios. Their empirical
findings led to the identification of explicit interdependencies in learning scenarios. In
contrast to CSCW environments, CSCL settings requires special concern – not to only
manage the dependencies between activities, but to also include the support for (inter-)
dependencies among all actors (students, teachers, facilitators, etc.). They concluded with a
set of interdependencies that need to be supported in collaborative telelearning settings:
- share goals to complete activities
- share activities to achieve goals
- share resources to complete activities
- share activities to produce resources
These findings laid the foundation for an extension to Malone and Crowston’s (1994)
definition of coordination to “coordination as managing dependencies between activities and
supporting (inter) dependencies among actors” (Bourdeau and Wasson, 1997).
Providing awareness to the users will lessen the amount of articulation work required,
allowing the participants to focus on the important dependencies in their collaborative

18
process. Providing even seemingly insignificant information about the doings of ones
participants might accomplish this. For instance, when solving problems via instant
messaging, it is very useful to gain awareness about whether the other person is responding to
a message or not. In the Mindmap I can use colour codes, changing of colours and textual
descriptions to convey such contextual information about what is happening in the
environment. As an example, selected, locked and moving nodes will all have different
colours to represent their various states. This suggests another extension to the definition of
coordination to also include the management of jointly produced artefacts.
3.3.3 Collaboration patterns
In the VisArt scenario of DoCTA I, researchers identified four different collaboration patterns
(Wasson & Mørch, 2000; Baggetun & Mørch, 2000):
- Adaptation – describes how students gradually adapted to each other’s practices when
working together to solve a common problem.
- Coordinated de-synchronisation – describes how coordination of activities between
team members changes after they have identified a common goal. Synchronous
interaction was gradually replaced by asynchronous interaction.
- Constructive commenting – describes commenting behaviour. Comments that are
neutral (e.g., just to the point) are perceived to be less useful than comments that are
also constructive (e.g., suggesting what to do next) or supportive (e.g., encouraging).
- Informal Language – describes how interaction often starts in a formalistic style and
gradually becomes more informal as team members get to know each other. Frequent
use of slang words or dialects local to the community working together is common in
instances of this pattern.
These patterns occurred in a scenario using TeamWave™ Workplace. It is not clear if the
same patterns would reoccur if the scenario was to be repeated, or in another scenario using a
different environment. Nevertheless, these findings are interesting in the sense that
behavioural patterns often arise when students are collaborating with each other mediated by
tools. These patterns are often different from the behavioural patterns co-located collaborators
would exhibit. Investigating these collaboration patterns can bring forth ideas for further
support of distributed group-dynamic processes. As an example for how to apply some of

19
these findings into the Mindmap, the pedagogical coordination agent can expand its
encouraging roles to also include encouraging behaviour (e.g. give constructive comments or
encourage participants to encourage each other etc.). In chapter 7 findings of this nature will
be discussed.
3.4 Methodological survey: How to build mind maps in groups.
Mind Maps™, developed by Tony Buzan (1993), are an effective method of note taking and
useful for generating ideas by association. Together with the mind map, Buzan have
developed a description, suggesting how to best use this technique. Before I start describing
the main ideas behind mind maps and different mind mapping techniques, it is important to
emphasize that mind maps are not based upon theories from the research fields of CSCW or
CSCL. Rather, Buzan’s suggestions on how to use mind maps are based on his cognitive
research on how the brain functions.
3.4.1 What is a mind map?
The human brain is very different from a computer. Whereas a computer works in a linear
fashion, the brain works associatively as well as linearly - comparing, integrating and
synthesising as it goes. Association plays a dominant role in nearly every mental function, and
words themselves are no exception (words are abstractions). Every single word, and idea has
numerous links attaching it to other ideas and concepts (Buzan, 1993). To make a mind map,
one starts in the centre of the page with the main idea, and works outward in all directions,
producing a growing and organised structure composed of associated keywords and images.
As a consequence, Buzan is convinced that mind maps are taking the same structures as
memory itself. He further claims that once a mind map is drawn, it seldom needs to be
referred to again, thus mind maps is a good way to organise information (Buzan, 1993).

20
3.4.2 The difference between mind mapping and brainstorming.
Often people confuse mind mapping with brainstorming and use the words interchangeably.
Buzan argues that mind mapping, especially when involving more than one person, is quite
different from brainstorming. To better understand the difference, it is useful to explain what
brainstorming is and how brainstorming as an individual technique is incorporated into the
process of building group mind maps.
3.4.2.1 Brainstorming
The term brainstorming was invented by Alex Osborn in the 1930s and described in his book
"Your Creative Power" (1948, republished in 1991). Other authors have also explained
brainstorming such as Michael Morgan in the book “Creative Workforce Innovation” (1993),
and Edward de Bono in “Serious Creativity” (1992). Nowadays, brainstorming has become a
commonly used word in the English language as a generic term for creative thinking in early
stages of concept-formation. The basis of brainstorming is the generation of ideas in a group
situation based on the principle of suspended judgment. When exercising the principal of
suspended judgement, the phase in which participants generate ideas is separated from the
phase in which the group judge the various ideas.
Thinking as a group, using brainstorming techniques, can certainly produce ideas, but they
can also limit the potential output. de Bono (1992) believes that individuals are better at
generating ideas in new directions, whereas a group may be better able to develop an idea and
take it in more mature directions than the originator can. If a greater diversity of ideas is the
main aim, then mind mapping techniques are better for this purpose (Buzan, 1993).
3.4.2.2 Mind mapping as a group activity
Creating a mind map in a group context uses a brainstorming phase with suspended
judgement in another way. For mind maps, all participants are supposed to have their own
brainstorming session first, before assembling their generated ideas into an organised chart.
Then the group gathers to have a decision and judgement phase afterwards. In detail, Buzan
suggests seven major stages in the group mind mapping process:
1. Define the subject: The topic should be clear to all partners taking part in the process.
Discussion is the best way to achieve this goal.

21
2. Individual brainstorming: Each member should spend time (from at least ten minutes
to several hours, according to time constraints and etc.) trying to quick-fire ideas and
construct their own mind maps. This method contrasts very markedly with traditional
brainstorming in which one individual leads the group, noting the key-word ideas as
they appear. Buzan (1993) claims that “… traditional brainstorming techniques can
be counter productive because each word or concept publicly announced might create
mental eddies and currents that will draw all members in the same direction”.
3. Small group discussion: The group now divides into groups of three to five. In each
small group the members exchange their ideas and add other ideas into their own mind
maps. During this process it is essential that a totally positive and accepting attitude be
maintained. Whatever idea is mention by a group member should be supported and
accepted by all members.
4. Creating the first multiple mind map: This can be done on a gigantic screen or wall-
sized sheet of paper, which is used to record the basic structure of the map. People
then shortly discuss and draw their contributions on the joint map. A scribe or one
good “mind-mapper” can also be chosen to do the drawing. Colour and form codes
should be agreed on in order to ensure clarity of thought and focus.
5. Incubation: As in individual mind mapping, it is important to let the group mind map
“sink in”. It is therefore advisable for the group to take breaks and meet later.
6. Second reconstruction and revision: After incubation, the group needs to repeat stages
2, 3 and 4 in order to capture the results of the newly considered and integrated
thoughts.
7. Analysis and decision-making: At this stage the group must make critical decisions,
clarify objectives, devise plans and edit the mind map.
When designing the mind map program I have tried to support these seven steps with
computer technology. However, there are some constraints that make it hard to recreate the
flexibility and freedom one might experience in a real world face to face meeting room. I will
now list up some of the modifications I have made to Buzans methodology and explain why
these modifications were made:
• Dual coding: I do not directly support dual coding in the mind map. When representing
a concept, I have chosen only to present it as a rectangular box. Inside the centre of the
box I present the concept name. The main reason for this adaptation is based upon the

22
constraints in size and actual the workspace required for modelling the map, compared
to the size of a computer screen.
• Node represented as a drawing or picture: When building a mind map by hand on a
piece of paper, you have the freedom to draw pictures, or attach photographs to a
node. I have prevented this functionality because of the same reasons already
explained above under “Dual coding”. If all nodes were to be represented as images
varying in size, not many concepts would fit on the screen simultaneously. Therefore I
decided to hide the graphical representation of a node in a drop-down menu available
by “right-clicking” the node in question.
• Node colour: Nodes will automatically be presented with different colours according to
a pre-defined colour scheme reflecting the level of the node. At any point in time, the
colour of a node may be changed to suit the users’ need. This also support step 4
although the participants did not come up with this colour scheme themselves.
• The number of participants in a mind map session: How many people should be
collaborating in the mind map simultaneously, before the collaboration would become
over-complex, confusing and even chaotic? In the real world such constraints seldom
exists, since they are defined by meeting room size, number of people in a project,
department and etc. On a computer, screen dimensions, resolution and workspace will
physically reduce the number of participants a user can be aware of simultaneously.
Also, the lack of peripheral awareness, (such as intonation, body language cues, noise,
(smell?), and feelings), reduces the advisable number of persons a user can keep track
of. Thus I will recommend that all groups keep to Buzan’s definition of a small group
consisting of 5 members (+/- no more than 2 persons)12.
3.4.4 Benefits with a computer based mind map
Some see the adaptation of Buzan’s methodology as a drawback, but a computer based mind
map will also have several advantages over paper. It is, for instance, much easier to
restructure a computer map, edit nodes, move nodes and trees of nodes. It can be possible to
12 This is not a system constraint, as I have tested out the application with over 50 users.

23
(un)fold trees, hide13 detailed information inside a node and it is very convenient to distribute
and publish a mind map in a variety of formats. For quickly creating new ideas and ordering
them into meaningful structures, I believe computer mind maps are competitive with or even
better than the equivalent on paper.
13 Being brief and using single words is the key to a good mind map, but sometimes you need to write detailed explanations. A computer mind map allows you to do this and in addition keep the extra information hidden until it is needed. This can be effectively used for learning, “[…] you should be able to recite the 'comment' information without looking at it, when you can do this you have 'learned' the contents of the mind map and only need the key words to bring it back (Buzan, 1993).

24
4 Designing the framework and the Mindmap.
In this chapter I will present the framework and the Mindmap application that I have
implemented. Firstly, I will discuss some of the technical requirements that formed the basis
for developing the framework. Then I will present many of the graphical interfaces,
describing their use and explaining their design rationale.
4.1 Technical requirements
Lessons learned from the first DoCTA field trial and the DoCTA NSS pilot study, laid the
basis for the framework’s technical requirements. Experiences from these scenarios involved
groupware such as TeamWaveTM and FLE. TeamWave and FLE demonstrated their
usefulness through several well-designed features and tools. Kurt Rysjedal (2000) undertook a
usability study of TeamWave and he found that the groupware (TeamWave) was most
frequently used for synchronous collaboration (and communication), even though it supports
asynchronous activities as well. Because of the students’ tendency to use it as a synchronous
meeting place, Rysjedal suggests that the environment could support communication in more
efficient ways and also improve on workspace awareness. FLE is the groupware that was used
during the two DoCTA NSS scenarios. It is an asynchronous environment designed for
reflection upon the process of building knowledge in groups. From DoCTA’s perspective, a
learning scenario should allow for both synchronous and asynchronous collaboration. If a
groupware supports only one of the two working-styles, another system should be
supplemented to levitate the drawback. It is important that participants can utilise different
working styles such as meaning-making and negotiation processes (synchronous activities)
but also work independently on assigned tasks when they feel like it (asynchronous activities).
4.1.1 Rationale for building our own system
The starting point for the DoCTA NSS project was our desire to enhance the FLE groupware
with agent technology for coordinating and helping users to understand and practice the

25
theory of knowledge building. We also wanted to supplement FLE by using other
synchronous groupware to encourage real-time virtual meetings in which coordination,
negotiation and other group-oriented processes could take place. However, when we were
about to start modifying the FLE groupware we experienced difficulties getting hold of all the
source code (even when the groupware was supposed to be open-sourced for research and
educational organisations). Finally, once the source code was available, we found out that it
was poorly documented. Although there are many advantages by reuse compared to building
a system from scratch, these experiences demonstrated that it can sometimes be difficult (and
even inconvenient) to cooperate and depend on other actors (projects and companies with
their own personal agendas) to complete your own work. In addition, there is always a risk
that what we strive to develop, could subsequently be used for commercial purposes by
others. By building our own system, such administrative issues could easily be solved.
4.1.2 Technical requirements for the framework (and the Mindmap)
Once the decision to build our own system had been taken, there were several technical
concerns that we wanted to satisfy. For instance, it should be possible to use the application
from any location in the world with a minimum of hardware and software requirements. If a
user could get connected to the Internet and already had a web browser installed (with Java
support, or Java already being installed in the operating system), it should be possible to use
the program. The aim was to be as independent as possible of technological constraints, but a
set of minimum constraints had to be defined:
- Platform independence: One of the main goals was platform independence. When
building a networked application it would be “ignorant” to assume that all potential users
run the same operating system. By choosing Java as the programming language and
avoiding the use of special platform-dependent APIs (Application Programming
Interface), the program would be platform-independent.
- Stand-alone functionality: All functionality should reside on the server, so that when a
client wants to log onto the system, all required files (one jar-file) will be downloaded
automatically and run in memory. There should be no need to download and install any
files to run the application.
- No requirement for read/write rights: Since it should not be necessary to download and
install software to run the application, there is no need to have read/write rights to the

26
hard drive. Relying on such rights could exclude users at various data-labs, who do not
have privileged access to the hard drive.
- Backward compatibility: By avoiding the use of the Swing libraries, there is no need for
Swing plug-ins, and it is easier to ensure backward compatibility with Java 1.1. By being
backwardly compatible, potential users (who run on older systems) will not be excluded
from using the application. Experiences from field studies have revealed that schools
usually have old and outdated computer equipment. Being compatible with Java 1.1 has
required me to use only standard API and create various lightweight components for the
AWT (Abstract Windowing Toolkit) library. This work has been both difficult and time
consuming.
- Module based: By designing a framework of general classes that can be reused when
designing other types of diagrams, it becomes easier to extend the framework with new
functionality. This design is also applicable for plugging in agents, although more work
needs to be done on domain-specific rules.
- Client requirements:14 Even though the design of the framework has focused on being
light-weight, Java requires a certain amount of memory. Java needs at least 32 MB of
RAM to run at all. Therefore, the minimum amount of memory required would be twice
as much, but I would recommend at least 128MB RAM for clients logging onto the
framework to start the Mindmap. The CPU should also have sufficient speed to process
the translation from byte code to machine code. I would recommend CPUs with a speed
of at least 166MHZ.
While programming the framework and the Mindmap, these technical constraints have been
the main drivers behind the development process. Also, many classes in the framework were
in part derived (refactoring15 processes) from the Mindmap as functionalities were seen to be
useful after completion and thus made general at a later point in time. The main guiding
development pattern throughout the development process has been the Model – View –
Controller (MVC) pattern. “MVC is a design pattern originating from Smalltalk which has
been modified a number of times and, as an architectural principle, has to be seen as a
standard” (Oestereich, 1999, p. 114). The basic idea is the separation of domain-specific
14 These requirements are realistic for schools. All schools will have to upgrade their computer parks as the government develops web-based national testing, the prototype to be used already in spring 2004. For more information, check out the BiTE-IT web pages: http://bite.intermedia.uib.no 15 Refactoring is defined by Wake as: “… the process of improving code without affecting its external behaviour” (Wake, 2002, p. 23). The purpose is to keep the code as simple, maintainable and readable as possible by removing duplications, unnecessary strong dependencies, long classes, long methods, “struct” classes, switch statements if polymorphism could be used etc.

27
semantics from the presentation-logic used to display the information. This is obtained by
type abstractions and extending subclasses fully implementing the contracted communication
interfaces they inherit. The beneficial result is the flexibility to change models and still be
able to present them in existing views or keep the model but choose to present it differently,
in different views. A presentation of the frameworks MVC core classes is given below:
Figure 4.1 An UML-class diagram explaining the relationship between the core classes. Only the most important classes have been included in the diagram, as there are too many classes in the framework to show all in a single figure.
All classes displayed in figure 4.1 are either abstract classes or interfaces, making
relationships between fully implemented subclasses transparent. The transparency is the
beauty as view-components and controllers (here rules16 and action17 classes) do not know
what model they communicate with (whether it is a distributed (server communication) or a
local model). The same flexibility and transparency apply for other future domain-specific
extensions by following the patterns established by the framework18.
4.2 The Mindmap application
When trying to create a computerised tool based upon existing technology, it is important to
reflect on the strengths and weaknesses such a transformation would create. For instance,
16 The rules contain small logical pieces of information about what should happen to the diagram elements when certain situations arise affecting both view and model. 17 Action classes are useful for implementing small logical operations that is very general and is not dependent on either view or model. Such operations are typical application functions like save, load and print.

28
when creating a paper-based mind map, I have the freedom to sketch, draw, write, glue etc.
whatever I want, wherever I like on a piece of paper. It is rather hard to recreate this freedom
in a computerised mind map. But as I created paper mind maps, I realised that it would also
be great to be able to easily restructure the map, have the possibility to collaborate with
distributed partners, exchange mind maps (through emails), etc. These are all possibilities in a
computerised mind map. Before I started the construction work, I studied and practised
Buzan’s methodology (drawing mind maps on paper) to reflect on how I could design similar
functionality for the computer. This work led to writing of a functional requirements’
document, describing rules for functionality and situations that may occur in a computerised
mind map. For instance, what should happen if one concept in the diagram is situated on top
of another? Rules for solving such problems are described in detail in appendix A, and some
of those rules will be presented as I explain the various user interfaces.
The next sections will present various screenshots of the system, depicting the functionality
they represent. The screenshots will be presented in semi chronological order, as some
operations must be executed before the Mindmap program can start. Such operations include
creating a socket connection to the server, initialising the server by creating a session etc.
While most pictures account for the Mindmap, they indirectly describe the framework as well.
The framework19 becomes invisible, as it is a collection of more or less general, abstract and
interface classes. Most screenshots are from the stable build compiled in the middle of May.
4.2.1 Logging on to the Mindmap
Since I wanted the Mindmap to be available from the Internet, I have utilised applet
technology20. By typing this link21 into the browser, you will be taken to the page depicted in
figure 4.1 on the next page.
18 Not to mention the savings in time and implementation work by reusing existing and tested code defined in the framework. 19 See appendix E, F, G for packages, classes and some code illustrations. 20 When I started implementing the system in August 2001, Java Web Start had not yet been released. Web Start was released in September 2001. 21 http://cvs.intermedia.uib.no/javaProjects/mindmap.html

29
Figure 4.1. Screenshot showing the log on page, and the information that users should provide for the system.
The user fills in information that will be valid throughout the session. In the host text field
users can specify that they wish to connect to another host if the detected host is down. If
users do not provide their name, the alias unknown will be generated. There is a one-to-one
mapping between clients and aliases, this means that only one person can be the owner of an
alias at one time. Thus, if a second person logs on with the same alias, the system will modify
the last alias to, for instance, alias2, alias3 etc. The email field is for sending emails to
oneselves or others. This functionality should be modified in future. A database function
should be added to manage users and validate usernames and passwords. This would increase
security and reduce possible abuse of the email client within the framework.

30
4.2.2 The hallway
After having pressed the start button in the previous figure, the user will be taken to the
“hallway”. I have used a room metaphor (Greenberg & Roseman, 1998) here, as the hallway
represents an entrance to the rest of the application. In the hallway, a user can chat with all the
other users who have recently logged in.
Figure 4.2. A screenshot depicting the entrance window (also called the hallway) seen by users once they have logged onto the system. This window comprises a chat panel, a user list and diagram choices.
This entrance point lets persons choose what type of diagram they want to create. As the
screenshot shows, there are two possibilities, ER-diagram (currently being developed by
Kristin Eide, in preparation) and mind map diagram22. The hallway is designed as a
coordination space for users who have recently logged onto the system. Here, they can chat
and negotiate about who will create a new session or which session they should join etc.
22 Soon there will also be the possibility to choose UML diagram, as two students have begun reusing the framework to develop the UML-class diagram and UML-UseCase diagram.
Buttons to choose between the various diagram types.
The chat board displays user conversations, here in the predefined chat room called the hallway.
The user list provides information about who is in the current chat
Diagram menu.

31
4.2.3 Joining a session or creating a new one
After having pressed the “Start Mindmapping Session” button in the figure above, the
“diagram menu” will be replaced by a session selection panel. The server will provide
information about ongoing mind map sessions and who is attending the various sessions.
Figure 4.3. Here you see how the system looks from Henrik’s point of view. There is only one session in the session list. By pressing that session, Henrik can obtain information about who created the session and who is currently working in it.
The idea behind this functionality is that users can log onto the system at different times.
Users should then have the option of joining their teammates, or be able to create a new
session. By applying the room metaphor (Greenberg & Roseman, 1998), each session
becomes like a small room. Each session will thus have boundaries, and users in one session
will not be aware of users in another.
If there are no ongoing sessions, the user will have to create a new session. A new session is
prepared when the user presses the “New Session” button. The interface will change from the
“Join Session” panel to the panel displayed in figure 4.4. This panel contains two lists; the list
A list of sessions
Information area. Displaying information about the selected session.

32
on the left contains information about logged-on users who have not yet joined a session
(users in the hallway), while the list on the right shows which users have been invited into the
new session. The arrowed buttons between the lists will let the creator decide who is to be
invited in and who not. Also, by pressing the name of one of the persons in (any of) the lists,
the user data in the information area at the bottom right of the screenshot will be updated.
Figure 4.4. A screenshot of the “New Session” panel; here the creator must specify the session name and can also invite other users, although this is not necessary to create the session.
To complete figure 4.4, at least the session name23 must be specified. Next, the creator must
choose whether he wants the session to be supported by a pedagogical agent or not.
Figure 4.5. Here the creator can choose to let the session be supported by a coordination agent.
23 Two sessions cannot have the same name, the server will modify the session name of the most recent session to session2, session3, etc.
List of
online
users
List of invited users
Information
about the user
selected in one

33
As you can see from the screenshot above the predefined value is "yes". By pressing the next
button once more, the creator accepts that a pedagogical agent will support this session. When
this decision has been made, the user can choose if he wants to specify the main node in the
new session, or if he wants to load an old session from the server.
Figure 4.6. The user can choose whether he wants to continue with an already saved session (by loading it) or start from scratch by defining the main node in the new session.
If the user chooses to start from scratch, the main, centre node must be specified. This node
defines the theme24 for the mind map, and is the root in the hierarchical tree. Look at figure
4.7 to see the graphical interface the user must go through.
Figure 4.7. The clip shows the creator specifying the name of the main node in the new session.
Otherwise, the user can choose to load an old mind map diagram into the new session. You
can look at the file selection dialog displayed in figure 4.8 to see how this works.
Figure 4.8. Figure presents a file-chooser dialog used to select loaded sessions. Users select
24 In current version the main concept can be deleted. I have considered whether this option should be removed, or otherwise impaired somehow (for instance, all participants having to concur to allow the deletion of the main concept). A coordination agent can also deal with these issues since Buzan does not make a clear statement about whether or not a main concept has to exist in a mind map.
34
session with a timestamp from the list, and the session name will be presented in the information area to the right.
This enables several sessions to load the same saved diagram, modify it and save it again
without overwriting the original session. Each time a session is saved, a time stamp will be
generated to avoid deleting sessions by accident. The timestamp is added at the end of the
session name. By looking closely at figure 4.8 you can see that the session “Stable_Build”
was saved at 23:07.4 on the 14 May. By pressing the “Load Session” button, the selected
session will be loaded into the session.
So far, I have only described how to log on and create a session. I have been quite detailed
about these procedures, as they are rather complex and probably not something potential users
do every day. Still, the rationale behind this functionality is to create a way to allow multiple
teams of users to work simultaneously, without even knowing about each other. Sessions
becomes like private rooms with boundaries. Experience proves that most users need to be
helped and guided through the steps of creating a new session (if they have never done it
before). Maybe this is a sign of bad design choices on my part, but once they get into the
diagram users seem to grasp the tools with ease.
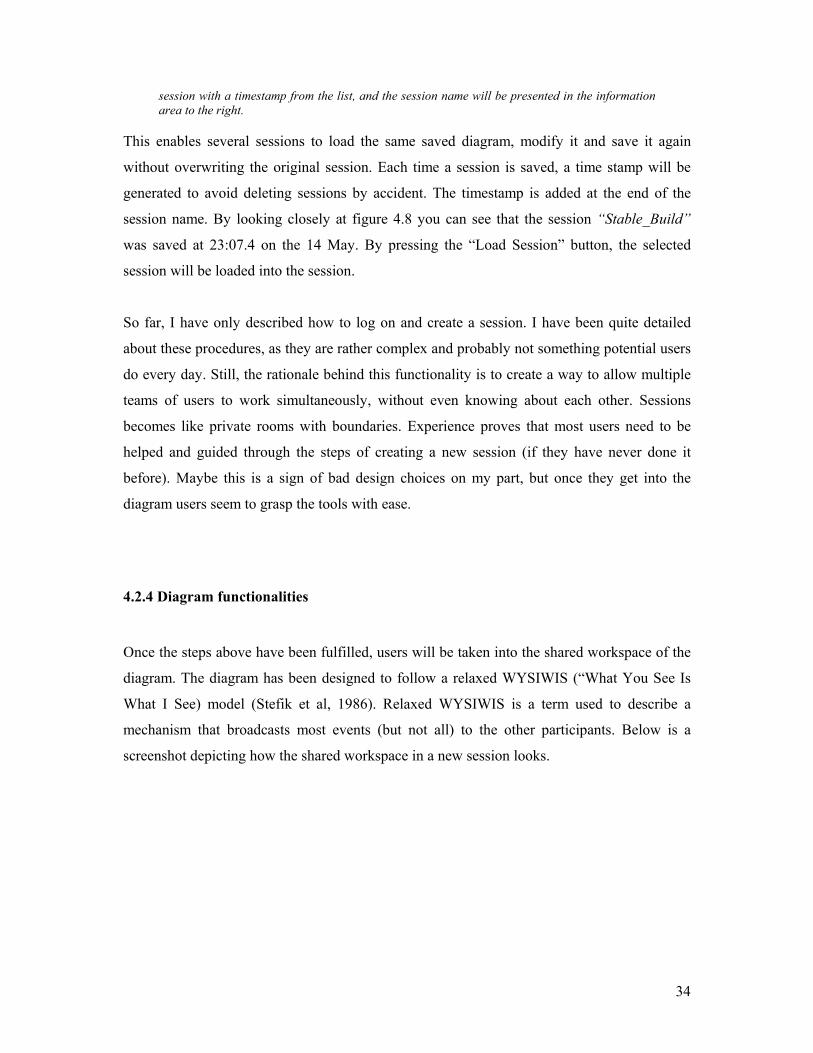
4.2.4 Diagram functionalities
Once the steps above have been fulfilled, users will be taken into the shared workspace of the
diagram. The diagram has been designed to follow a relaxed WYSIWIS (“What You See Is
What I See) model (Stefik et al, 1986). Relaxed WYSIWIS is a term used to describe a
mechanism that broadcasts most events (but not all) to the other participants. Below is a
screenshot depicting how the shared workspace in a new session looks.

35
Figure 4.9. This is how a newly created session looks like. Since the creator (Steinar) has left the hallway and entered the “Stable_Build” session, he is the only person in this session. New components in the interface are the workspace buttons to the bottom right and the toolbar to the middle left in the frame.
Comparing the screenshot presented in figure 4.9 with earlier screenshots, it can be observed
that three more components have been added to the application. The biggest contribution is
the mind map diagram itself. This panel contains all diagram elements (nodes, links and
relation boxes), where the elements can be added, deleted, selected, dragged and otherwise
manipulated. Then there is the toolbar on the left and the workspace buttons at the bottom
right. Below I will explain in detail the functionality provided by the various tools.
The toolbar is divided into two parts; the upper part contains more general actions such as
Save, Print and Email, while the lower part contains diagram-specific operations such as
Select, Add, Delete, Show relationship names and Default relationship shape. The
implementation of these operations is diagram-specific and context-oriented25. I will now
explain the toolbar before I present the workspace buttons and the corresponding workspaces.
25 Implying that the same type of functionality (e.g. add, select, delete etc.), in various diagrams (ER, UML etc.), will work differently if other business rules (to better fit the context) are applied.
Select a node
Add a node
Delete a node
Show relation name
Select connection shape
Print diagram
Send email
Shared workspace
Save diagram

36
4.2.4.2 Explaining the upper part of the Mindmap toolbar
The upper part of the Mindmap toolbar contains general functionality (not dependent on the
context) such as Save, Print and Email. These options are also available in the File menu (or
menu bar) in the application window as users running on resolutions less then 1024x768
might not have room for all the buttons in the toolbar. Once the window initializes (after a
diagram type has been chosen, see figure 4.2), a layout mechanism detects the client's screen
resolution, and decides whether there is room for the general functionality buttons in the
toolbar. If there are no room for these thee buttons, these functionalities will be available
through the file menu.
The save function is very intuitive. It writes the diagram elements to a file. To be more
specific, the node tree structure is referenced in a java.util.Hashtable which is the only object
needed to be serialized to store the diagram. The serialized object will be written to a file
stored in a directory on the server.
The email function is a rewritten example from the book Core JavaTM Volume II – Advanced
Features, by Cay. S. Horstamnn and Gary Cornell (2000), and was done by Weiqin Chen. I
have further adapted this bean (removing swing references, changing the attachment logic
etc.) to make it work within the framework. A picture of the email application is given below:
Figure 4.22. This figure shows the modified email programme plugged into the framework. The Browse button will only allow the user to attach the current diagram as a jpeg picture.
If no exceptions occur, the user will be notified that the email (from the systems point of
view) appears to have been successfully sent.

37
Figure 4.23. The email frame gives feedback to the user and the option of sending a new message
or exiting the email frame.
The print function is also very intuitive, although the implementation had to be made in a
special way to escape the security model of an applet. As one of the core technical
requirements is that users should not be required to access resources outside the “sand-box26”
model, this implies having no privileges to read or write from any local physical disk (e.g.
hard drive, floppy disk). Thus printing has to go through the html-page that initialised the
applet (printing requires access to resources and devices outside the barriers of the dedicated
memory of the sand-box). Users will be given a message to go back to the page that started
the Mindmap frame and use the browsers inbuilt printer functionality.
Figure 4.24 displays how the browser presents the printable diagram to the user. Here the user
can manipulate an image of the diagram, set the margins, set the orientation from portrait to
landscape and preview the different pages (if the diagram has to be printed on several pages).
Figure 4.25 shows how the toolbar and other tools are removed from the printable component
when the mouse-pointer is outside of the applet in the html-page. Defining a Java applet
policy or signing the jar-file(s) will give the applet direct access to the clients’ resources. For
more information about the java applet security model, check these web pages:
http://www.securingjava.com/chapter-two/
26 The “sand-box” model is the amount of memory dedicated for the execution of a Java applet. The applet has no permissions to use (read/write to) any other means than this memory for storing and executing data, except for the document base (where the code resides on the server).

38
Another option is to use Java Web-Start (http://java.sun.com/products/javawebstart/)
technology, whereby the user grants or declines rights, as the privilege is required.
Figure 4.24. This screenshot shows how the applet in the html-file lets the user manipulate the generated picture of the diagram (margins can be adjusted by pulling the red handles, the orientation of the diagram can be landscape or portrait etc.).
Figure 4.25. Once the user has finished manipulating how the diagram should be presented on the printable paper, the user should press the browser's print button. You will see that all buttons and margins are removed as the mouse pointer leaves the component (as buttons and margins should not be printed).

39
4.2.4.1 Explaining the lower part of the Mindmap toolbar
As already mentioned, the lower part of the Mindmap toolbar contains the context-dependent
tools. The functionality of these tools will vary from domain to domain. The first button in the
lower part of the toolbar is the Select button. The button is used to select diagram elements by
clicking within their borders. Links can also be selected by right-clicking or double-clicking
within the relation symbol (the black rectangle attached to each link). The next toolbar button
is the Add functionality. Below is an image showing how new concepts can be added:
Figure 4.10. Screenshot displays the creation of a node that will be added to the diagram.
By looking at the toolbar on the left, you can see the Add button is toggled down. The node
will be created at the location chosen by the user (indicated by the mouse pointer where the
mouse is pressed), and then this creation dialog will appear. The upper left corner of this
dialog becomes the upper left corner of the new node (while node length and width is not
similar to the dialog box). The result of this functionality can be seen in figure 4.11. Here you
can see the node OSX located a little above the node Platforms.
Figure 4.11. Image shows the newly created node named OSX concept (up and right in the figure).

40
Also, in figure 4.11 the colour of the new node is turquoise, while the other nodes are either
red or orange. The turquoise colour indicates that a node is detached and thus a non-level
node. The colour choices for nodes follow a predefined colour palette. The central concept
will be red (unless one of the users changes it to another colour), second-level nodes are
orange, third-level nodes are yellow and so on. This predefined colour palette is a requirement
I have defined in the requirements document (see appendix A). This requirement is based on
Buzan’s (1993) suggestion of using different colours for different types of concepts. Also, it is
easier to view and understand the mind map if the concepts are colour-coded.
Next, a user might want to connect the new concept to another node. For instance, the concept
OSX defines an operating system or a special platform, and thus this node naturally belongs to
the concept Platforms. To create a relationship between the nodes OSX and Platform, the user
needs to select the unconnected node, and drag it towards the node it should be connected to.
This action is shown in the figure below.
Figure 4.12. Here the user Steinar dragges the node OSX. As this screenshot was taken, the dragged node was within the private area of the node Platforms, and a suggestion for an association between the two concepts are presented by the appearance of a grey link.
By looking closely at figure 4.12, it is possible to see that the node OSX has a light-pink
colour around its borders. This border colour provides awareness to the participants,
indicating that this node has been selected. Other users cannot select this node while the node
remains selected. This rule is also defined in the requirement document (see appendix A), and
implies that concurrency control must be implemented to handle simultaneous events (on
shared artefacts). For a closer description of how concurrency control works for shared
artefacts, see chapter 4.3. In the same figure, it is possible to see the selected node being
moved by a user (Steinar). When moving, the border colour becomes grey, while the node
itself turns transparent with the name of the “mover” inside it. I have called moving nodes
shadow nodes, as they pass like shadows across the screen. Around all nodes there is an
invisible private area. When an unconnected node enters the private area of a connected node,
a grey link is formed between the nodes. This link indicates that releasing the unconnected
node at this location will create a relationship between the two nodes expressed by the link.
The connected node becomes the parent node while the unconnected node becomes the child

41
node. Then the child will slide off and move outside the private area of the parent node. This
has just happened in the screenshot below.
Figure 4.13. The concept OSX has just been connected (becoming the child) to the concept Platforms (becoming the parent) and has moved outside of the parent nodes private area.
Once the concept OSX is connected to the concept Platforms, the node’s background colour
changes to yellow. This takes place according to the predefined colour palette mentioned
earlier, and reflects the node’s level. Also, the distances between the concepts in the map are
based on a rule defined in the requirements document. The figure below displays the
minimum length between nodes of varying levels.
Figure 4.14. Figure visualising the lengths between the various concepts based on their internal level. Red equals level 0, orange level 2, yellow level 3, light green level 4, and so forth. Level 1 is the base level for unattached nodes indicated by the colour turquoise.
As can be observed in the figure above, central concepts have a larger private area around
them then less important concepts. Usually, in a mind map tree, the number of nodes
increases as we move down the branch. Thus it becomes easier to position the nodes if the
central concepts have more space between them than the more peripheral concepts. This way
of controlling the layout of the diagram is supposed to help users maintain a good overview
and enhance the readability of the mind map.
In chapter 3 I discussed how Salomon (1992, 1995) encouraged information sharing, division
of labour and a shared understanding of the involved artefacts (acquired through joint
thinking) to contribute to forming genuine interdependence between participants in a team.
Similar values are also reflected in Buzan's methodology, though not expressed explicitly,
when he encourages open mindedness, expressing a totally positive and accepting attitude
towards all ideas from any participant (to stimulate creativity). Therefore it is important to

42
restrict dominant users in executing functionality that may hamper the collaboration. When
designing the delete operation in the diagram editor, these guidelines have been taken into
consideration. Both adding and deleting are actions that change the mind map. Adding or
creation is not necessarily limited in any way (but van be regulated through regulating
participation level, see chapter 5,) while deletions could be dangerous in the way that it
removes potential agreed upon material. It is therefore necessary to implement a mechanism
to avoid some users exhibiting dominant behaviour. One such mechanism is displayed below:
Figure 4.15. The screenshot displays a modal “decision-maker” dialog informing the other users that Henrik wants to delete the link Platforms:Stability. Each user has thirty seconds to cast his/her vote. If all users have voted within the time limit, the dialog will disappear and the action the majority voted for will be executed.
When it comes to delete operations, users may only request that a diagram element be deleted.
Based on such requests, decision-making dialogs, like the one illustrated in figure 4.15, will
be launched to inform participants about the deletion request. This dialog is built around a
voting mechanism (implemented on the server) to track the votes and execute an action in
favour of the majority. When deleting a node or a link (like the example in figure 4.15), the
attached children will be affected, for instance by no longer being connected to the tree of
concepts anymore. This can be seen in the figure below, where the link between Platforms
and Stability has been deleted.

43
Figure 4.16. The concepts Platforms and OSX have been detached from the main tree of concepts. This has led to an adjustment of the detached nodes level, reflected in a change of colours.
To track changes in the states of the various concepts, a recursive mechanism has been
implemented to modify the levels of all affected nodes (starting at the top of each node and
going recursively down through the hierarchy). In figure 4.16 this algorithm has detected that
the node Platforms has no parent relation and thus is a non-level concept. By moving down
the hierarchy of nodes (from Platforms), the level of all children nodes will also be modified.
The same process takes place if the top concept (Platforms) is connected to a node in the main
tree again, but now with a different result as seen in figure 4.17.
Figure 4.17. The concepts Platforms and OSX have been connected to the node Server Architecture, and their internal level has been changed again, as indicated by the new node colours.
The fourth button in the lower part of the toolbar displays the relationship names between
concepts (the name given to a link). This is an independent toggle button (as it can be toggled
on/off without affecting the other toggle buttons: Select, Add, Delete) allowing users to
manage the amount of information displayed in the diagram.

44
Figure 4.18. The concepts Platforms and OSX have been detached from the main tree of concepts. This has led to an adjustment of the detached nodes level, reflected in a change of colours.
Usually users keep the button toggled off, to hide information and to reduce complexity. This
makes the diagram easier to read, view and comprehend.
The last button in the context-oriented toolbar is “Relationship-shapes” button. This button
defines the default relationship-shape of an association when it is created. By default the
relationship-shape, or the symbol of a link, has the box shape. All possible relationship-shapes
are presented in figure 4.19.
Figure 4.19. This figure presents the seven relationship shapes that a link can have. Users can set the default relationship shape before associations are formed, or modify the symbol of an existing relationship.
In figure 4.20 you can see the result of setting the default relationship-shape (from the
predefined box) to fork. Existing links (associations) are not affected by this change in the
toolbar, as associations are only affected while they are being created.
The Relationship labels button toggled on (depressed) to display the relationship names.

45
Figure 4.20. The default Relationship-shape has been changed from box to fork in the toolbar.
A new node has also been added to the diagram depicted in figure 4.20. To demonstrate how
the setting of default relationship shapes work, we connect the node IP_comm to Server
Architecture as presented in the figure below:
Figure 4.21. Because the default relationship shape was set to fork, the newly formed association
between Server Architecture and IP_comm will be symbolised by a fork.
4.2.4.3 Explaining the workspace buttons
The third expansion is located to the bottom right of the frame (besides the user list and the
chat-board). Here, three different toggle buttons represent the three different workspaces
The box shape has been set to fork in the toolbar.

46
available for the Mindmap application. By default, users will enter the shared workspace and
the “shared workspace” button will therefore be toggled on (pressed). The shared workspace
is where most of the activity in a mind map session will occur. Here users must discuss,
negotiate and make decisions about what the mind map should look like and which concepts
to include and exclude, and come to an agreement on how to solve their joint problem. Figure
4.26 shows the shared workspace of a mind map diagram, in which three users are interacting.
Figure 4.26. This figure displays the shared workspace where most activity occurs. Here participants will also see what the other participants are doing. The toggle button with three figures around a computer (the button at the bottom right of the window) indicates that pressing this button will take the user to the shared workspace.
The first button in the workspace button group shows a single person in front of a computer.
By pressing this button, the user will be taken to his private workspace area. The private
workspace looks almost identical to the shared workspace area. But one important difference
is that the private area will not broadcast any awareness information about what the user or
the user’s teammates are doing. I have included the private workspace to support Buzan’s
mind mapping methodology. Buzan emphasises that users should work both individually and
together on a shared diagram. Further, users should spend some time brainstorming around a
problem individually, before they build their own private mind maps. Later, users bring their

47
private maps together and negotiate and discuss the meaning of the various concepts until
they agree on a joint solution to the problem (often involving a mix of the various personal
mind maps). Figure 4.27 displays a screenshot of a private workspace area.
Figure 4.27. This is the private workspace area where users brainstorm around a problem to come up with an individual approach to a solution. On the basis of their personal mind maps users will try to build a new mind map together.
By right clicking on a node in the private workspace, a pop-up menu will appear and display
several choices. One of these choices will allow the user to export the node to the shared
workspace. This way the information contained in a node can be serialized across the network
to all clients.
Finally, the middle button provides a combination of the shared and the private workspaces,
where a user can see both the shared and his (own) private workspace. I have called this
functionality split view, as the screen is split in two while showing both areas. Users have
reported this functionality to be very useful during discussions as they can see both diagrams
simultaneously. The split mode view has two buttons at the very top of the window. These
two buttons activate the different workspaces. The inactive workspace is grey while the active
workspace will contain its normal looks. I have chosen to present two figures displaying the
The private
workspace button

48
workspaces in active and inactive mode. In the second figure, where the private workspace is
active, I will right-click a node to present the export functionality in the pop-up menu.
Figure 4.28. Figure showing what the application looks like when a user is in split view mode. In this screenshot the shared workspace is active while the private workspace (grey) is inactive.
Figure 4.29 Here, the private workspace has been activated and the user has right-clicked the concept “RMI?” and has chosen the “Export node to Shared Map” option from the pop-up menu.
The split-view
workspace btton

49
4.2.5 Sharing the private workspace area
Another interesting functionality that has been implemented is the possibility of viewing other
participants' private maps. This functionality was not originally included in the Mindmap, but
as users started to test and use the program several of them enquired about the possibility of
broadcasting their private maps to other participants. In the beginning, the idea conflicted
somewhat with the mind mapping methodology. Buzan encourages participants to create their
own (private) mind maps so people will generate ideas independently of each other. It also
facilitates reflection, preparing participants for the ensuing discussion. But most of all, it is
important for engaging shy and otherwise inhibited and reserved people, who might not
contribute to the creation of a shared mind map if they were not assured that what they draw
and create is totally private. Of course, I do not want to violate this principle, on reflection, I
realised that users can click on a person in the list and ask to see that person’s private
workspace. This has just happened in the figure below.
Figure 4.30. Here, the user Rune has clicked on the user Steinar and is about to click on the button “Ask to see person’s private map”.
Asking for another person’s private map will generate a similar screenshot for that user, see
next figure:

50
Figure 4.31. The screenshot displays Steinar’s point of view as Rune asks to see his private map. The dialog gives Steinar a chance to decline or approve Rune’s request.
If Steinar declines the request, Rune will be notified in a message saying: “User Steinar
declined your request to view his/her private map”. If Steinar approves the request, Rune’s
screen will change and display the screenshot in the figure below.
Figure 4.32. Now we are back on Rune’s computer. The screenshot displays Steinar’s private mind
The diagram is displayed in
a tabbed pane I have written
for the AWT library.

51
map in a lightweight (AWT) tabbed pane component. The diagram can be modiefied, as Rune has
obtained a copy of the map. A screenshot of Steinar’s private map can be found in figures 4.28 and
4.29.
In figure 4.32 Rune has received a copy of Steinar’s private mind map. Since this is a copy,
Rune can do whatever he likes with the mind map without affecting the original private mind
map residing on Steinar’s computer. Below, Rune has added a new concept called Rune’s
modification to test the functionality.
An unimplemented idea is that a user may import (load from the server) old diagrams into the
private map. This is useful for reusing maps a user has spent much time designing or adapting
and the user wants to share the diagram with the rest of the group. The current implementation
does not allow for such functionality in the private area (old diagrams can only be loaded into
the shared workspace), as this might impair27 Buzan’s (1993) mind mapping methodology.
The current implementation forces the users to either start from scratch or copy of one of the
other’s private map into their own private area. By looking at the next figure, Rune has just
started modifying the obtained copy of Steinar’s private mind map. Later he may want to
share his extension of Steinar’s private map to other users in the session.
Figure 4.33. The screenshot shows user Rune working on a copy of Steinar’s private mind map.
While Rune is modifying the copied map, Steinar might be continuing work on his private
mind map. At any time Rune might want to request another copy of Steinar’s private mind
27 Users may search for finished solutions without brainstorming around the problem themselves.

52
map to see what he has done since last time, or just to compare his own elaboration with
Steinar’s latest work.
Figure 4.34 A second copy of Steinar’s private workspace, also specified by the tabs above the
Mindmap toolbar, below the file-menu bar.
As can be seen on the tabs in figure 4.34, a user may request several copies of a person’s
private workspace and modify all of them. The name of the tab is the identifier, and thus two
tabs cannot have the same string name. If such a situation should occur, a counter will
increment the number of equal tabs to create a unique identifier for each tab. This can be seen
in front of the user name in the tab in figure 4.34. Similar, information sharing ideas has been
implemented by Gerry Stahl (1999) in his WebGuide system. Being able to look at other
peoples’ work, modify it and change it to suit ones own needs is an interesting way of
constructing knowledge, and is a part of learning to understand the work of others. This is
useful for the overall goal in the program, where the participants should achieve a shared
understanding of the problem.
4.2.6 The pop-up menu
Another important feature in the Mindmap is the possibility of right-clicking (or double-
clicking, since some Macs only have one mouse button). Such actions will cause a pop-up

53
menu to appear if the mouse pointer is within the bounds of a diagram element. View next
figure to see the pop-up menu appearing after a right-click has occurred:
Figure 4.35. The user has right-clicked or double-clicked within the borders of the concept Platforms and a menu has popped up.
This menu provides the user functionality to change the colour (figure 4.36) or the name
(figure 4.37) of the selected diagram element.
Figure 4.36. Colour changer. Figure 4.37. Name changer. Figure 4.38. Add or edit URLs.
By selecting the “view/edit URL” from the pop-up menu displayed in figure 4.35, figure 4.38
will be displayed. Here a user may attach web-pages relevant to this element. The moods
option enables the user to notify the facilitating agent about the attitude the user has towards a
node. This will be further explained in chapter 5. It is also possible to give a further

54
explanation of concepts by describing (figure 4.39) them (in detail) and the context they relate
to and should be understood in.
Figure 4.39. Users can give an explanation and/or description of a concept or association to increase the shared understanding of modelled artefacts. This functionality can be extended to contain discussion threads about the meaning of the diagram element.
Lastly, users can choose the create drawing option from the pop-up menu displayed in figure
4.35. This option changes the diagram into a whiteboard (figure 4.40) with simple drawing
tools.
Figure 4.40. A simple whiteboard implemented to exemplify how easy it is to create new diagrams based on the framework. In the screenshot, Henrik is drawing inside the concept Platforms.

55
Here users may draw images to help explain elements. It is also possible for users to draw
simultaneously together. Each participant in the whiteboard will see the others drawing in real
time. Drawings on shared artefacts are stored on the server, so other users can go in and view
the drawings later.
If a node has been through all these operations, small icons will appear, making the other
users aware that the node has some additional, hidden information.
Figure 4.41. Here, three small icons have been added to the concept Platforms, indicating that more information is contained inside the node. The upper-left symbol is the letter E and means that an explanation or description has been added to this concept. The symbol on the upper right is a palette, indicating that there is a whiteboard drawing inside this node. The last icon (bottom left) is the letter W symbolising that the node contains a URL pointing to a page on the World Wide Web.
4.2.7 Representations
Mind maps are created to externalise cognitive representations and ideas. Sometimes (as
observed when conducting field experiments) users choose to create top-down hierarchical
representations of the mind map, instead of the more natural, circular map that will evolve
when using the normal layout. Others have experienced that users might organise the ideas
into topics, lists and other structures as well (Schaathun, 96). Thus, it occurred to me that the
mind map could be expressed in various ways. By entering the Representations menu (in the
menu bar), users can choose to represent the diagram in a normal, circular or hierarchical
manner.

56
Figure 4.42. Screenshot showing the three alternative ways of representing a diagram. In future it should be possible to manipulate the various diagrams in other modes than the normal mode.
Figure 4.43. The circular layout arranges the nodes in the diagram in a big circle. The user must use the scrollbar to view all parts of the diagram. The algorithm for arranging the nodes is not perfect, as the distances between the nodes could have been calculated based upon the number of children and children on the same level. This can be a modification for the future, as the functionality works well enough.
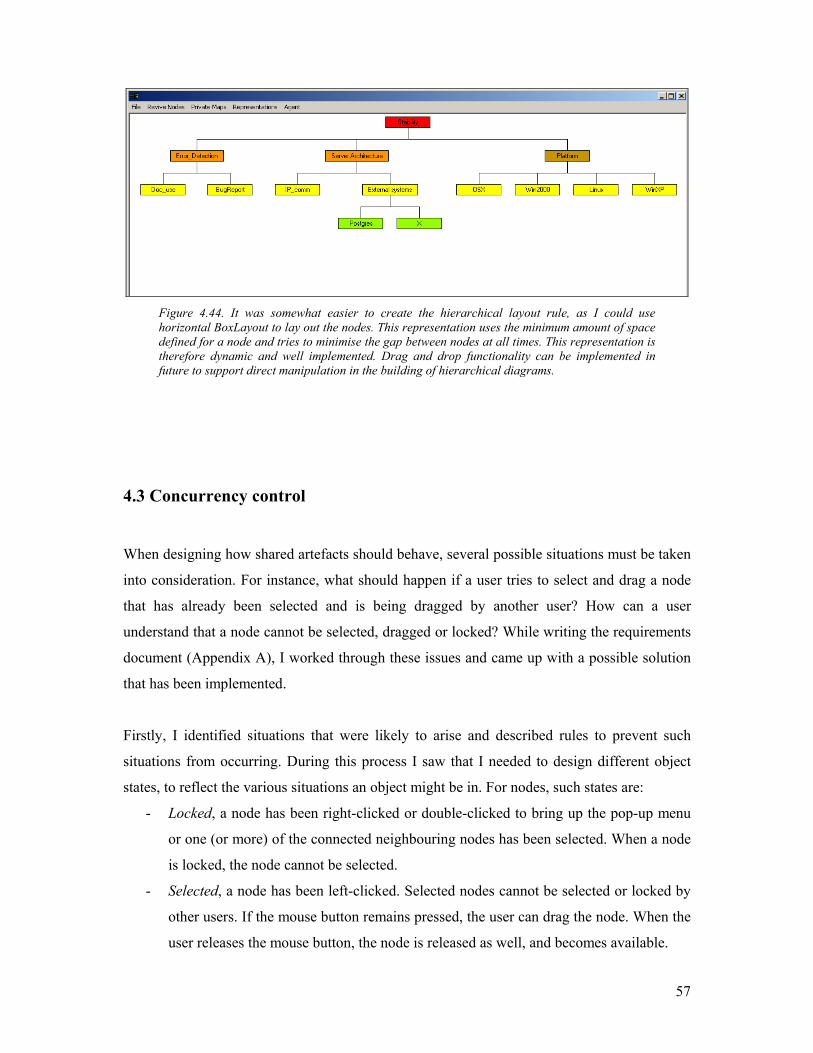
57
Figure 4.44. It was somewhat easier to create the hierarchical layout rule, as I could use horizontal BoxLayout to lay out the nodes. This representation uses the minimum amount of space defined for a node and tries to minimise the gap between nodes at all times. This representation is therefore dynamic and well implemented. Drag and drop functionality can be implemented in future to support direct manipulation in the building of hierarchical diagrams.
4.3 Concurrency control
When designing how shared artefacts should behave, several possible situations must be taken
into consideration. For instance, what should happen if a user tries to select and drag a node
that has already been selected and is being dragged by another user? How can a user
understand that a node cannot be selected, dragged or locked? While writing the requirements
document (Appendix A), I worked through these issues and came up with a possible solution
that has been implemented.
Firstly, I identified situations that were likely to arise and described rules to prevent such
situations from occurring. During this process I saw that I needed to design different object
states, to reflect the various situations an object might be in. For nodes, such states are:
- Locked, a node has been right-clicked or double-clicked to bring up the pop-up menu
or one (or more) of the connected neighbouring nodes has been selected. When a node
is locked, the node cannot be selected.
- Selected, a node has been left-clicked. Selected nodes cannot be selected or locked by
other users. If the mouse button remains pressed, the user can drag the node. When the
user releases the mouse button, the node is released as well, and becomes available.

58
- Available, an available node is neither locked nor selected. Available nodes are ready
for operations and can be either locked or selected depending on events in the
environment.
These three states (among others a node can have) define the hierarchy of element control.
When a node is available, no one controls the node, and the node is ready to receive
operations. While the node is locked, one or more users may manipulate the node. This is an
intermediate level of control, where simultaneous none-conflicting events can occur. If, for
instance, two persons are changing the name of a node almost simultaneously, both name
changes will be registered but only the last change executed will remain. Therefore, it is
indifferent to the system if the name (or colour) of a node is changed twice within two
milliseconds or within one minute. It is impossible for more than one colour or name change
to occur concurrently, as the logic for executing these operations uses the reserved keyword
synchronized (Oaks & Wong, 2000). This keyword ensures that only one thread of control at a
time can execute a method. Only when the first thread leaves the method body, can the next
one enter.
Figure 4.46. In this screenshot you can see that the node Platforms has been selected (denoted by the orange colour on the node border). This selection automatically locks the surrounding nodes (locked nodes are indicated by a pink border colour).
By selecting a node (or any other diagram elements), the selector will gain control over the
node while prohibiting other users from executing operations on this node. In addition,
children and parent nodes will also become locked. This is mainly to ensure that the links
between the nodes stay intact. A link needs both the start position and end position to be

59
drawn. If it were possible to move both nodes defining a link simultaneously, the link would
break (because of the lack of defined start and end positions). To make sure such situations
never occur, only one node in an association may move at a time. The node selection-locking
algorithm makes sure that surrounding nodes will be locked when a node is selected. This can
be seen in figure 4.46 by a change in the border-colour of the affected nodes.
I have been through most of the functionality in the Mindmap and showed many of the
different screenshots. The reader should by now have a pretty fair understanding of how the
Mindmap works and what are the ideas behind the various tools. Now I will turn my attention
to some of the mechanisms that has been specially designed to help people collaborate in the
application. The most comprehensive of the various mechanisms will be presented in the next
chapter.

60
5 The implementation of a pedagogical coordination agent
The previous chapter provided an overview of the requirements and foundations for the
framework and a description of the functionality within the Mindmap. In that sense, this
chapter can be seen as an extension of the previous one, where focus is on the complexity in
collaborative telelearning scenarios and how collaboration can be facilitated to reduce the
complexities in joint learning and work endeavours. More precisely, how a pedagogical agent
can do some of the articulation work necessary while collaborating to construct mind maps.
This chapter is divided into three parts. First I will start by presenting a summary of a
literature study investigating the term software agents. Three students in the DoCTA project,
including myself, undertook this literature study. This part will culminate in a project
definition (for my implementation work) of what an agent is. The next part will delve into
complexities concerned with user–agent interaction. Different user contexts will be presented,
with a particular focus on contexts involving a heavy workload (to learn). Finally, some
design ideas for how human–agent interaction can facilitate users in such contexts will be
presented, and comparisons with my implementation work will be made.
5.1 What is an agent
Collaborative telelearning emphasizes the collaborative interaction in online learning
communities between students and between students and facilitators. Following Salomon’s
(1992) recommendations, collaborative learning environments should be designed to
encourage mindful engagement (voluntary expenditure of task-related mental effort) among
the participants through genuine interdependence28. In such settings it is necessary to monitor
and facilitate this kind of pedagogy (Wasson, 1998).
28 Genuine interdependence is, by Salomon, characterized as the necessity to share information, a division of labour and the need for joint thinking, and a more detailed description can be found in chapter 3.3.1, p16.

61
The term software agent has been used to describe a wide variety of concepts and
phenomenon in many disciplines. Some like to prefix the term with “intelligent” while others
use the term soft robot and agent interchangeably. As agents of many varieties have
proliferated, there has been an explosion in the use of the term without a corresponding
consensus on what it means (Bradshaw, 1997). Some researchers define agents by identifying
a list of attributes or capabilities it possesses (Etzioni & Weld, 1995), while others have a
"three-line definition" containing more or less abstract features such as goals, autonomy,
communication, and means for knowledge representation (Gilbert et al., 1995). Others try to
build larger classification schemes (Nwana, 1996; Franklin & Graesser, 1996; Woolridge &
Jennings, 1995) and theories of agent architectures (Muller, 1998). One such scheme is
proposed by Nwana (1996), who creates a taxonomy of four types of agents based on their
ability to cooperate, learn, and act autonomously. Autonomy refers to the principle that agents
can operate without human interference, cooperation is the ability an agent has to
communicate with the user or with other agents, while agent learning refers to an agent’s
capability of changing its behaviour over time, hopefully providing better output.
Figure 5.1. The three primary constraints necessary for an agent. (Adapted from Nwana, 1996.)
These four types are neither mutually exclusive nor do they represent an exhaustive list of all
possible variations of agents, but they nicely represent the plurality fiund in agent literature.
One driving “force” behind research on agent technology is the artificial intelligence (AI)
research community. In this field, researchers often distinguish agents by labelling them as
strong or weak, depending on their capabilities of explicit mental or emotional qualities
(Shoham, 1997; Wooldridge & Jennings, 1995). Finally, some see mobile agents as a category
of their own. Mobile agents can transmit themselves across a network and recommence
execution on remote sites. Mobile agents can be judged by their degree of mobility (Gilbert et
al., 1995).
Cooperate Learn
Autonomous
Smart
Agents
Interface
Agents
Collaborative
Agents
Collaborative
Learning Agents

62
While there are as many ways of classifying agent software as there are researchers working
in the field, this study identified some common denominators that software agents possess:
• some degree of autonomous execution,
• the ability to communicate with other agents or users,
• responsibility for monitoring and reacting to the state of its environment,
• an adaptable internal representation of its working environment,
• some degree of mobility.
(Summary taken from Baggetun, Dolonen & Dragsnes, 2001).
In my case, the implemented agent possesses all the characteristics identified above except the
ability to be mobile. Despite all the efforts in the different agent research fields, I would like
to emphasize the importance of designing agents based on a set of principles, pedagogical
theories, coordination theory and, when possible, empirical findings, rather than trying to
fulfil a set of system attributes or conform to a taxonomy or software architecture.
5.2 Another approach to designing pedagogical agents
I use the term pedagogical agents to refer to agents that are designed to support human
learning and interact with students in order to facilitate their learning. Pedagogical agent
research builds upon previous research on intelligent tutoring systems (ITS) and artificial
intelligence (AI). Much of the research and development done in this field has focused on
agents that interact with co-located students in real time. This includes agents guiding and
presenting additional information to the user as part of the task interface (Boy, 1997) and
work on animated pedagogical agents as separated user interface modules (FitzGerald et al
1997; Johnson, Rickel & Lester, 2000). The above authors do not address distribution as a
separate element of a learning environment. This is important (for us in DoCTA), and an
element that will add an increased amount of complexity to the orchestration. Another
complex concern is how agents should interact with users. This fundamental problem has
been addressed and generated much interest, especially among researchers in the field of
animated pedagogical agents. Research in this field is occupied with capabilities such as eye
movements, hand gestures, body language cues and user-agent conversations. In these
settings, agents tend to be a crucial part of the interface, and interacting with the agent can be

63
time consuming. These two concerns will be discussed in more detail in 5.2.1 and 5.2.2, as
they must be taken into consideration when designing agents for CSCW and CSCL systems.
5.2.1 The complexity of distribution
Generally, the complexity in collaborative telelearning scenarios can be seen from two
different points of view. First, from the instructor's viewpoint collaborative telelearning is
hard to monitor and facilitate. It is difficult to notice when a point of genuine activity occurs
(e.g. when the students are online working or not) and progression is often not streamlined
due to different timetables and the individual students’ personal preferences (Goodyear,
1999). Second, seen from a student's perspective, it is difficult to coordinate and align joint
collaborate activities due to many of the same reasons. The problems of coordinating the
distributed learning activities often require a “tremendous” effort on the students’ and the
facilitators’. The challenge is to move some of this “burden” from humans to computer-based
artefacts (such as agents).
By utilizing concepts taken from coordination theory (Malone & Crowston, 1994), Bourdeau
and Wasson (1997) identified and modelled interdependencies found in a set of telelearning
scenarios. These empirical investigations laid the foundations for an extension of Malone &
Crowston's (1994) definition of coordination, which I presented in chapter 3.3 (p.18). By
analysing the dependencies between actors in three collaborative telelearning scenarios,
Wasson (1997) suggests two types of coordination agents: coordination managers29 and
coordination facilitators30. These agent roles mentioned above have been further elaborated by
Wasson (1998), but she emphasizes that they are speculative and are not meant to be an
exhaustive list, but rather to stimulate thinking about the roles coordination agents can play
(Wasson, 1998). For the Mindmap, I have used this theory and advice to address the
complexity of distribution while implementing an agent with the responsibilities of a
coordination facilitator as described above.
29 Coordination managers mediate administrative aspects of collaboration for both individual actors and groups/teams. 30 Coordination facilitators support students involved in collaborative learning activities by mediating their processes.

64
5.2.2 The complexities of interaction
Agents such as Gracile (Ayala, 1995), Rea (Cassell, 2001), Herman the Bug (Lester, Stone &
Stelling 1999), Cosmo (Lester et al. 1999a), WhizLow (Lester et al. 1999b), Steve and Adele
(Johnson, 1997), can all be categorised as animated pedagogical agents. Such agents try to
resemble living or fictional characters that interact with learners in a virtual environment to
foster and encourage learning. Most of the time they aim to improve specific educational and
training applications. In order to meet this goal they are designed to interact in a natural way
with users. This interaction is closely modelled on the behaviour of human tutors, including a
combination of verbal communication (text and speech) and non-verbal body language cues
(e.g. gestures and signs). These agents try to incorporate thoughts and emotions, which are
viewed as important qualities for human teachers to posess, in order to convey characteristics
such as enthusiasm and empathy. The agents are also to some extent knowledgeable about the
subject–matter being learned, about pedagogical methods, and with knowledge about how to
find and filter information from available resources such as the World Wide Web (Johnson &
Rickel, 2000). Such agents are characteristically distinct interface entities displayed as
human-like characters within the learning environment. They move often or constantly
(animated) between the foreground and/or the background of the main task/application. In this
way, they easily attract the user's attention and thus are a part of the application and cannot be
ignored. It is important to understand that this is also the intention behind designing these
kinds of agents. Their main purpose is to make the user interact with the agent, which in turn
guides and leads the learner through his or her tasks. Such agents can be designated tutors or
guides, as the interaction is not user-user centred, but rather agent-user centred.
5.2.2.1 Agents as facilitators
Complaints about agents being intrusive, disruptive and disturbing to users as they try to do
their work are a commonly reported problem. In a distributed work and learning setting, this
could be even more irritating. Users in a distributed environment spend much of their
attention monitoring what other users are doing (this is one of my findings, and will be
described in chapter 7), often while they are chatting simultaneously. For such applications, I
believe it is important to strive for carefulness when designing how the agent should interact
with the users. The focus is not so much on how to create human-like animated agents that
show emotions and interact with the users in a more face-to-face fashion, but rather on how to
facilitate collaboration and productive interactions. One important difference here is that the

65
objective is learner-learner interaction, and NOT learner-agent interaction (Dragsnes, Chen,
Baggetun, 2002). Also, by examining research on how to support learning through the design
of agents within the CSCL domain (Dillenbourg et al., 1997; Lund et al., 1996; Constantino-
Gonzales & Suthers, 2000; Wasson, 1999) some systems with similar focus can be found.
These research efforts have created agents that possess the characteristics of what can be
called a facilitator. Such characteristics are:
• Monitoring: Monitor progress, collaboration, participation and time consumption.
Detect misunderstandings and/or disagreement.
• Group dynamics: Responsible for making the users follow an outlined scenario or
method, directing users to activities that arise at certain stages in the collaboration.
• Clarifications: Encourage discussion when/if disagreements are detected by the
monitoring responsibilities.
• Direct manipulations: Initiate breakdown when/if the collaborative processes have
ended in a deadlock.
• Change behaviour: Observe the learners' (re-)actions31 as a possible result of the
interaction, thus enabling the agent to judge and adapt its behaviour. (Hmelo-Silver,
2002).
5.3 Design ideas for less intrusive agents
My goal has been to design an architecture that takes agent intrusiveness into consideration
and controls how the agent interacts with users. The agent should be able to present
information along a scale of intrusiveness (see figure 7.8, p.101). Some messages should be
less intrusive, while others should be more annoying and disturbing. Intrusive interactions can
be reduced and will only be permitted to occur if a situation meets a set of criteria, with the
aim of creating breakdown situations. Breakdown situations can be viewed upon as
opportunities for learning (Fischer, 1994; Winograd & Flores, 86), and could prove fruitful
when it comes to clearing up misunderstandings and disagreements. In this chapter I will
explain my design ideas and show how they can be implemented based on the Mindmap
application.
31 Meaning both actions and reactions.

66
The ideas for how to design less intrusive agents have sprung out of the former work
presented earlier in this chapter. This includes a theoretical literature study on agents32,
empirical findings, pedagogy and research on CSCL. The requirements for behaviour, which
determine the degree of intrusiveness, do not describe how the agent architecture should be
implemented. When I describe the agent architecture, it is important to bear in mind that it is a
prototype and has evolved as the implementation work has tried to fulfil the agent’s roles. The
overall goal of this work is to help users reach a common understanding of the concepts in
their joint mind mapping process. For this purpose, the agent uses two different behavioural
approaches:
1. Facilitate users according to Salomon’s notion of genuine interdependence
(Salomon, 1992, 1995) to prompt collaborative learning.
2. Facilitate users according to Buzan’s mind mapping methodology, helping a group
of users through the various stages described by Buzan (1993) in their joint effort
to build a shared mind map.
These two approaches will thus require responsibilities such as monitoring user actions,
activity levels, contributions and requests for certain clarifying actions33, urging users to
thoroughly discuss their concepts, trying to initiate discussions and encouraging users to reach
common ground when misunderstandings or disagreements are detected.
A facilitator with the responsibilities and goals described above, will naturally need rules for
its behaviour. My design contribution in this context is to apply different sets of rules for
different sets of information storages (pools). The fundamental part in this architecture is the
registration of events. I define an event:
as an action on an object executed by an actor (user).
As users do something in the user interface, the system model will generate an event object
based on the action. This event will contain information about the source (the user), the target
(the element being manipulated) and about what type (deletion, addition, disagreement, etc)
the action belongs to. The event will be sent from the viewer component (the diagram) into
the model and passed to the threaded agent architecture. Simultaneously, the diagram model
will perform operations on the attribute-values of the elements viewed in the diagram. A
32 Cumulating in an agent definition for the project and the implemention work. 33 Such as inviting users into a concept’s whiteboard to draw an explanation, add pictures, links or further description to a node. By right-clicking the node in question, a user can specify these actions.

67
diagram update will be triggered, telling the viewer that it must repaint itself, and the rules
will intervene and determine how the data elements residing in the model should be presented
(MVC, see figure 5.2 below).
Figure 5.2. The figure shows an overview of the system architecture (similar to figure 4.1, p. 28) including the relationship of how the agent architecture is plugged into the framework. This architecture is presented as a black box here, but will be presented in more detail in figures 5.3 and 5.4.
Roughly, in the agent architecture the event will be passed to different information storages
(the pools) and different algorithm comparison’s data will run against the pools34. The results
of these comparisons create the rationale behind an agent interaction, and must meet a set of
rule-defined criteria in order to be presented as an output to the user(s).
Figure 5.3. A collaboration diagram visualising how instances of class-candidates would interact. I have used a collaboration diagram to convey the logic of the architecture in a more abstract and readable way then an actual realised interaction diagram would depict. For the class realisation of this diagram, see figure 5.4 displaying a class diagram for the agent architecture.
34 I use the metaphor pool to depict a physical container where information may be floating around. Thus no sequential data is stored.

68
Some of the rules are eventrelated and apply to specific types of events, while others are pool-
related and apply to all events passing through the pool-filters. Each information pool can be
understood as a separate module with distinct responsibilities. Together, these modules aim to
provide better control over the agent, to reduce the amount of unnecessary user–agent
interactions. The intention is to leave the learners with as much time as possible to do required
collaborative work. Thus, one of the main ideas behind the agent architecture is to separate
the architecture into different modules with distinct responsibilities:
• Contextual output pool
• Sequential output storage
• Stored output pool
• Dynamic importance rating
• Rules for form selection
• Rules for message selection and generation (message content)
Wheras the system architecture overview in figure 5.2 presented the agent architecture as a
black box, the rest of this chapter will open up the black box and explain what takes place
within it. A detailed graphical representation is presented in figure 5.4.
Figure 5.4. Class diagram depicting the realised classes derived from the collaboration diagram by using a variety of patterns to ensure specialisation and MVC. Green classes are interfaces while yellow classes are abstract classes. Open-ended arrows signify anonymous aggregation or passing of anonymous objects. A detailed class-diagram can be found in Appendix C.

69
As already mentioned, events are generated by user actions and are transmitted to the agent
architecture. There, the event will be registered in the “contextual output pool” (see sequence
3 and 4 of figure 5.2). The process of registering the event will automatically store it in
several sorted ways, for instance according to type (rules will define the appropriate
category), according to frequency and according to most frequent executor. Based on its
category, every action is assigned a default importance rating35. This rating will increase and
decrease (dynamic) in value based on how frequently the action occurs.
The “contextual output pool” will contain an aggregation of all registered user actions at any
given time and will constitute the contextual state. The next step is to analyse this information
storage. Here rules will access the “contextual output pool” on the basis of frequency of
actions, as a category, actions occurring on the same object or executed by the same user or
both, as well as user activity frequency in general. Sometimes the algorithms will be a
combination of each other, where the findings of the first one is used in the second (the
findings of the second used in the third) and so on.
/** * This method returns a SmartPersonCounter containing information about the most * frequent user to add nodes and how many times this person has done this action. */ public SmartPersonCounter getMostFrequentAdder() { int highest = 0; SmartPersonCounter spc = null; Enumeration enum = frequentUserMap.elements(); while(enum.hasMoreElements()) { SmartPersonCounter temp = (SmartPersonCounter)enum.nextElement(); if(highest < temp.getOccurance()) { highest = temp.getOccurance(); spc = temp; } } return spc; }
Figure 5.5. Code excerpt from class AddNode that extends UserAction. A search algorithm is searching in a java.util.Hashtable for the most frequent executer of the node-addition action. The returning object SmartPersonCounter stores values that can be used together with rules to estimate participation level and regulate participation (encouraging passive users and trying to change the behaviour of very active users). See appendix G for the source covering important key classes for the agent architecture. Only a few classes have been presented as the framework consists of a total of 620 classes and each class have about 200-400 lines of code.
In any case, the different rules will use various algorithms independently and present all
findings as potential output objects. Then the potential outputs will be sorted by their internal
importance value, and the most important output object will win the contest to become a
candidate for agent output.
35 All categories have their own default importance rating. The values of these ratings vary for the various forms of output an event may take.

70
Once an event has qualified for output, it will be compared with the entries in the sequential
output storage.
Figure 5.6. Zoom in from figure 5.3 to isolate the processing of the sequential output storage.
Here, a set of frequency rules will compare the potential output object with earlier given
outputs in reversed order (time: t-1, t-2, t-3 and etc.). Since the other pools only contains an
aggregate of registered events and are not able to keep track of the sequence (due to the data
structure (java.util.Hashtable vs. java.jutil.Vector)) in which these events took place, a
sequential pool can be created to supplement this information36.
/* * A potentail output info object has now been generated and won * the contest for output. I will now compare it to the previous given * output-objects to see if they are similar or not. */ int simCount = 0; for(int k=0; k<lastActions.size(); k++) { OutputInfo opi = (OutputInfo)lastActions.elementAt(k); if((opi.getSoidt().getId() == outputInfo.getSoidt().getId())) { if(opi.getSpc().getPerson().getPersonName().equals( outputInfo.getSpc().getPerson().getPersonName())) { if(opi.getUserAction().getClass().getName().equals(
outputInfo.getUserAction().getClass().getName())) { simCount++; } } } }
Figure 5.7. An excerpt of the code in MemAgent2 concerning the search for reoccurring actions. The value of the variable simCount will determine if the chosen event with current status “potentia”l will change status to “actual” and continue to determine the character of the output.
The rules applied to the result of this algorithm form a filter and decide whether the potential
output object should pass the filter (this may also include manipulating the importance rating
of the object), or else be trashed (and picked up by the Garbage Collector). The usefulness of
this mechanism is that it prevents important events (which have already received a number of
outputs) from overproducing agent interactions. In any case, if the event passes the sequential
output storage, it will result in an output. First, a rule will reset the importance rating for the
event object stored in the contextual output pool. This is also done to prevent the same event
from winning the next contest for output.
36 At the cost of a little more memory consumption, but also increased efficiency as the sequential pool will always be sorted.

71
Then the content of the message must be decided and selected. In the message content
generation (process), rules will explore the Stored output pool. This memory storage contains
information about all previous given outputs and what message IDs they were generated from.
An algorithm will build a list, sorted by frequency, containing all possible messages (for a
type of action). Message generation rules will select the least used message suited to the
current event. This happens in stage 7 and 8 in the collaboration diagram.
Figure 5.8. An information storage keeping track of previously given messages will be examined, and the least used messages will be selected and form the message.
Sometimes, combinations of sentences will be put together, following the same logic. In this
way, outputs will vary every time they are given, provided there are possible combinations of
and/or different messages to choose from. The algorithm for this functionality is presented in
figure 5.9. All possible messages are stored in an XML-file and parsed through a XSLT script
produces the HTML file presented in appendix B. /** Method that returns the ID of the least frequent message. */ public int getLeastFrequentExtensionMessage() { int lowest = 0; int position = 0; for(int i=0; i<range.length; i++) { int value = range[i]; if(i == 0) { lowest = value; position = i; } else { if(lowest > value) { lowest = value; position = i; } else if(lowest == value) { int chance = Math.abs(random.nextInt()) %2; if(chance != 1) { lowest = value; position = i; } } } } ++range[position]; return position+constant; }
Figure 5.9. Algorithm finds the message ID with the lowest hit-rate. The random logic in the last if-statement applies when two IDs have the same amount of hits. There is a 1/2 chance of selection.

72
When the content of the message has been put together, it is time to select what presentation
form the message will take. This takes place at the end of stage 8 presented in figure 5.8. By
comparing the importance rating value stored in the generated message object (that has been
modified several times by other rules) with the sequence output filter and for similar outputs
saved in the stored output pool, the presentation form will be decided. The important thing
here is variation in forms and that forms defined by rules as being less intrusive will have a
higher probability of being chosen. The importance rating of the event must be very high to
override all these modifiers. A variable that may strongly affect the selection of form is the
event’s category (events defined as reactive will never be assigned the more intrusive
presentation forms). In the Mindmap, the algorithm will only choose between pop-up forms or
fixed output forms. Additional forms can be created and added in future. Also, for other types
of applications involving asynchronous as well as synchronous collaboration, presentation
forms such as emails and even SMS could be useful.
Finally, before the generated output is sent to the user interface, it must update two of the
information storages. The sequential output storage must contain information about the event
and place it in front of the other previous events, while the stored output pool must add
information about which message composition(s) has gained output.
5.4 User–agent interactions in the Mindmap
How agents are designed to interact with users can also be categorised by their degree of
autonomy. Some agents interact with users without being asked for advice and such agent
systems can be designated active systems. Other agents interact with users in a deterministic
way based on simple rules, these systems can be labelled reactive, as the agent reacts to
certain types of actions. A third category is passive agents, who never interact with users
without first being approached. Such are typical help systems, where users ask for help and
the agent responds by giving an answer (or animated guidance). The prototype agent in the
Mindmap can be called a hybrid agent as it offers both active, reactive and passive
interactions (Jondal, 2001). For examples of interactions based on the various degrees of
autonomy, see screenshots 5.10, 5.11 and 512.

73
Figure 5.10. The agent being active in cases of participation regulation. The agent autonomously decides to interact with one or more users in the collaboration.
Monitored events belonging to a certain category might be subject to interaction on the basis
of several different and changing variables in the environment. Deciding when the criteria for
producing interactions are met is an important task and is done independently by a module in
the architecture. For such events, the agent is granted a greater degree of autonomy, as it
decides itself whether it is necessary and appropriate to interact.
Events in another category, such as events defining attitudes towards shared artefacts, are
typically used to signal user feelings and understanding explicitly to the agent. Users,
indicating their attitude towards shared artefacts, often expect agent feedback of some sort
(see chapter 7) as verification. Often, they also expect the collaborating participants to receive
notification about their mood. A screenshot illustrating how users can assign moods towards a
shared artefact is given in figure 5.11.

74
Figure 5.11. The agent being reactive in cases where users require direct feedback, but decide whether the orginiator and/or the group should be addressed as well.
Thus, moods or expressing attitudes have been defined as reactive events that the agent should
respond to deterministicly. An exception here is when such events may produce too many
interactions and may become a disturbance. Rules in the sequence output storage will take
care of such situations (see description of the sequential output storage, page 70). As most
events in the Mindmap belongs to the active or reactive category, the only functionality where
the agent has a passive approach and which will never be initiated without a user activating it,
is when users select the start scenario option.
Figure 5.12. Demonstrating the only way to start the mind map scenario by activating the agent.

75
When this happens, the agent will assume that users want to start a mind map scenario
following Buzan’s (1993) methodology (see chapter 3, pages 19–22, for a description of the
supported phases). Furthermore, the passive mode will change to active, as the agent will
monitor the activity and decide what phases the collaboration should be in and move to.
User–agent interactions can take place in the three ways described. In the first way, the agent
decides to interact on the basis of what users are doing in the environment (exluding situations
when users make direct contact). The second means to create interactions is by direct
manipulation of shared artefacts of a special character, which the agent spend little or no time
to evaluate. The third and last way is by explicitly activating the agent, asking the agent to
start behaving according to a predefined mind map scenario where users collaborate to create
a joint mind map.
5.5 Advantages of such an approach
The aim of this way of organising the agent architecture is to provide good control of how
(presentation form) and when the agent interacts with whom (the responsibilities of the three
pools) and with what kind of content composition (message). By separating the evaluation of
when, how, whom and what from each other, the same event can take any of the available
forms and vary in content every time it is displayed. For instance, if a message that has been
classified as important receives a certain amount of output, its output form will be changed to
take a less disruptive form. Moreover, the content of the message will vary to avoid producing
identical messages. The above steps are measures that can be taken to avoid creating a static
and annoying agent system. This coincides to a certain extent with Norman’s views on agents.
He argues that a good measure for evaluating agents is their degree of transparency in the
environment (Norman, 1998).
There is still considerable work to be done to successfully fine-tune the different thresholds in
the system. Since the first user test of the agent, several important enhancements have been
made. A better generation of message content has been contrived and adding the sequence
output storage has to gain increased insight into the contextual states of previous messages. In
addition, several user interface changes concerning agent presentations have been carried out
(on the basis of the formative evaluation) to enhance the system.

76
6 Method
In this chapter I will describe the methods I have used while developing and testing the
Mindmap application. First I will emphasize the importance of recognising programming as a
method, where the coder(s) experiments through trial and error to achieve a satisfactory result.
Secondly, I will present some of the most common research methodologies applied for
examining computer supported collaborative systems (CSCW- and CSCL-systems), and a
rationale for choosing a set of methodologies for gathering data when conducting field trials.
6.1 Programming as method
Programming can be seen as a method in itself, where people exhibit experimental behaviour
while using a tool (the programming language) to solve a design problem. Solutions are not
always at hand and in the process of reaching working, acceptable results, new problems and
conflicts may arise. The detected problems (through testing and/or prototyping) give feedback
about what must be changed, but not necessarily how. Thus new design choices must be
made, impacting end users in ways, which at time of coding, might not be clear to the
developer(s) (Winograd, 1996). This creative behaviour of programming is inevitable, but can
be structured to some extent by applying well-known methods for developing computer
systems. One such method is called the Unified Process (UP) and developed by Booch,
Jackobsen and Rumbaugh (1999).37 Several other methods to solve specific programming
problems have been presented by experienced programmers as design patterns. Patterns are
idioms, or best practises for solving well-known problems. Recognising problems and
applying a suitable design pattern can reduce the time a developer spends experimenting
before reaching a satisfactory result. In the development of the Mindmap application, and
especially when defining the architecture of the underlying framework, I have used several
design patterns to guide me in my programming efforts. But then again, even the patterns did
37 The Unified Process (UP) present an approach for how programmers organise their work by dividing the project up into small mini-projects, focusing on implementing a small number of requirements at a time. Thus the requirements become the basis for the development of the application. This viewpoint is called use-case driven development. In addition, the UP also emphasizes the development of the architecture, which is the underlying structure or form that the requirements are dependent upon. The architecture will be implemented simultaneously with the use-case being realised. In this way, there will be interplay between the various use-cases and the architecture, both parts influencing each other (Booch, Jackobsen & Rumbaugh, 1999).

77
not prevent me from redesigning some of the functionality I implemented in the various
releases. The design patterns I have used most frequently are:
• Singleton pattern to create service classes.
• Facade pattern to reduce class visibility and hide subsystems.
• Polymorphism pattern to cover specific class behaviour.
• Controller to make general user triggered-events reusable.
These patterns suggest how to split, specialise, hide and isolate logic to ensure a Model –
View – Controller (MVC) division of labour among classes38. This is very important for
reusability, and especially for the framework. The framework contains general diagram
classes that must be extended and reused to create new instances of specific applications, i.e.
Entity – Relationship diagrams or any other type of diagram.
Programming is a way to solve a set of problems through iterative and incremental analysis –
design – implementation – testing – integration, and testing again, not only the logic of the
functionality but also how end users react to the realised requirements (Larman, 2002). This
way of solving problems resemble the general way researchers learn about the world, and
with such a perspective, programming can be seen as a methodology.
6.2 Methodologies in CSCW and CSCL
As already mentioned in chapter 3, the CSCW and CSCL communities are both multi-
disciplinary, involving researchers from computer science, sociology, anthropology,
psychology, cognitive science and education, among many other fields (Bannon, 1989). Our
understanding of these two communities is drawn from all these areas, but most especially
from the area of social science. Within the field of social science both qualitative and
quantitative methods are used frequently, while qualitative methods are more common in the
fields of CSCW and CSCL. “Qualitative approaches such as interviews, focussed observation,
and ethnography in particular, seem imminently suitable for wicked problems39 because they
38 See explanation of design patterns on the bottom of page 27. 39 Rittel and Webber (1973) define wicked problems as something that arise in the social realm, where “the aim is not to find the truth, but to improve some characteristics of the world where people live (p. 167). Wicked problems are bounded in the sense that no perfect solution can be found, but each solution can be qualitatively judged, and people will settle for a “good enough” solution. Rittel and Webber utilize the concept of bounded rationality developed by Herbert Simon (1960).

78
do not seek to control the complexity of the domain to produce simplified rationalist accounts
of complex phenomena” (Fitzpatrick, 1998, p. 15). Based on this assumption, Fitzpatrick
identifies four common qualitative methodologies for investigating collaborative computer
systems; ethnography, grounded theory, evaluation of systems in use, and meta-analysis.
These four methodologies are explained in more detail below:
• Ethnography is a qualitative and interpretative technique for collecting data about
peoples’ everyday life, over a longer period of time. Usually, this involves different kinds
of observation techniques and various degrees of participation with the subjects being
studied (Hammersley and Atkinson, 1995). Analysed data is often presented in a narrative
form, sometimes almost like a novel, giving the reader rich descriptions of the studied
phenomena or culture. There can be some problems applying this traditionally description
of ethnography to modern, distributed computer-based learning and work settings. To meet
some of these challenges, Guribye and Wasson (2002) suggest additional data gathering
techniques more suitable for the virtual space given by groupware.
• Grounded theory, developed by Glaser and Strauss (1967), is a methodology for working
closely with data40 to produce conceptual categories and theories. This can be done
iteratively, simultaneously as the ethnographical study is being carried out. Grounded
theory is based on the idea that theory is “indispensable for deeper knowledge of a social
phenomena” (Strauss, 1987, p. 6), but this theory must be “developed in intimate
relationship with the data” (Strauss, 1987, p. 6). Thus the developed theory must be
grounded in the data it tries to explain.
• Evaluation of systems in use can be carried out in several ways through adapting
ethnography (see Patton, 1987, or Guribye and Wasson, 2002), various usability
experiments (Patton, 1987, Booth, 1989), quantitative studies such as network analysis (see
e.g. Wellmann, 1996), or by analysing automatically generated system logs. The most
common methods are either summative or formative usability evaluations. Hewett (1986)
explains that a summative evaluation “involves assessing the impact, usability and
effectiveness of the system – the overall performance of user and system” (Hewett, in
Booth, 1989, p. 119). This performance is typically measured in mathematical values,
rating the score of a system against a predefined scale. In contrast, a formative evaluation
is used to help designer(s) identify what parts of a system that needs to be improved and
40 Usually, descriptive ethnographic data sets.

79
what changes that should be made (Booth, 1989). Thus formative evaluations require more
qualitative data.
• Meta-analysis is a method that can be used to examining existing studies and reports, done
by other researchers, with the aim of deriving generalisations and common themes from
the original data. The most common form of meta-analysis is literature reviews and
detailed studies of ethnographical data sets.
There are different theoretical perspectives that can be applied to the four approaches
described above, such as ethnomethodology, symbolic interactionism, activity theory, and
distributed cognition (see e.g. Koschmann, 1996). These theoretical perspectives can
influence how data is gathered and analysed as each of them emphasis particular interests and
insights of the concept under study (Fitzpatrick, 1998).
6.3 Choosing a method
While developing the Mindmap application, user testing happened frequently, at least on a
daily basis. This form for testing was strictly functional, explaining the theoretical idea behind
a certain tool before testing it together with users41. Similar testing was also conducted in
various morning meetings by a research project called Adapt-It, using the program to
coordinate with others and to visualise work plans for the rest of the day or the week.
Considering the resources I as a student had available, functional testing was conducted quite
extensively.
The next step was to arrange an experiment with real students, who never had heard of the
application and was unknown to or inexperienced with Buzan’s methodology. As outlined in
the previous chapter (5.2), the CSCW and CSCL communities use qualitative methods more
frequently then quantitative methods. Thus, it became natural for me to choose a qualitative
approach to gain information about the students collaborating in the Mindmap application. I
chose to use a formative usability evaluation method, as my working hypothesis and problem
41 There are several people working at InterMedia which I used as test users at various times, but there are two persons who have tested all of the functionality in the Mindmap application. Together, these two persons became an informal test team, suggesting enhancements and changes in every prototype.

80
identification in general sought to unravel how the students reacted to the various mechanisms
in the application.
6.4 Formative usability methods
A formative usability evaluation helps the designer evaluate and refine the functionality of the
application to better fit the requirements of end users (Booth, 1989). Different evaluation
techniques can be used to pinpoint what needs to be refined, and for formative evaluation
these are:
- Errors that occur in the user interface are potentially one of the most useful
sources of information about what is wrong in the design. Different techniques,
both quantitatively (counting number of errors, compare them across user
experience, e.g. novice vs. expert) and qualitatively (a closer study of the user’s
interaction with the application to understand why the user’s problem) can be
applied to assess why the errors occur. Here the focus is on user errors, not
software bugs.
- Verbal protocols are written descriptions of what a user said while doing a task.
The statements can be written down concurrently or retrospectively. The
advantages of using concurrent verbal protocols are that they will more likely
better document data about a task, while a retrospective protocol will probably not
uncover so much task specific information. The advantage of using a retrospective
verbal protocol lies in the minimal of influence the researcher will have upon the
studied subject, while distortions in the protocol might occur as the user only
remember parts of the actions performed to accomplish the task.
- Visual protocols are used to document user behaviour both within a system, and
physical reactions. Distortions in behaviour might arise as users may behave
differently when they know they are being filmed by camera. Experience show that
users will adapt to filming over time, expressing their true behaviour after some
days. The physical presence of a video camera might be one of the reasons for the
changed behaviour.
- Attitude measures are techniques relying on other qualitative methodologies such
as questionnaires or interviews to uncover a wide range of user attitudes towards

81
the system. Typical themes are users’ opinions about “the learnability of a system,
the ease with which the system could be used, and whether the system adequately
performed the task” (Booth, 1989, p. 123). Other types of questions can focus on
the users feeling of being in control of the task and situation, frustration and other
relevant concerns.
Even though a formative usability method use all four qualitative techniques described above,
I adapted the scheme to fit my scenario (the scenario will be described in chapter 5.6), ending
up with only using three of the four techniques. First of all, I chose to utilise the technology of
ScreenCam to capture how the user(s) interact(s) with the system instead of using video
camera (as described under visual protocols above). This was done out of convenience, as I
would have needed four video cameras operating in different places (and someone operating
them) for filming the collaborating students. In a scenario lasting for about three hours, there
is low probability that the students would have adapted to the presence of a video camera, and
thus not exhibiting their natural behaviour. Screen cams are not visible to the users, and it is
easy to forget that events will be recorded as they pass on the screen. Consequently, as a
negative effect, I was not able to capture spoken interactions, body language and other
physical reactions as they happened. On the other hand, this was to some extent compensated
for as I could go between two of the computer-labs and observe three of the collaborating
students.
Secondly, I chose to preclude the technique of investigating errors. This technique described
in the literature (Booth, 1989) focuses on why users misunderstand how to use certain tools.
Consequently addressing how these tools can be redesigned to better mediate their purpose.
Such a focus was not relevant for me, as I view all tools as potential resources, enabling
collaborating students to do their work, one way or the other. Simultaneously, there is no
correct way to draw mind maps, and how this is done is very much up to the group itself. I
believe freedom in doing work is better than restricting users to use tools in only one way.
Thus collaborating groups can adapt the tool usage to their own context and needs.

82
6.5 Method triangulation
In addition to focusing on how the users reacted to the mind map application in general and
what they suggested could be changed, I was also interested in gathering data about the
students’ interaction with the pedagogical agent prototype. More specifically I was interested
in discovering how the subjects felt about the agent, the various awareness mechanisms, and
the information sharing functionalities. Another topic of interest was the assessment of
whether the collaborating students were able to follow Buzan’s recommendations for creating
mind maps in groups.
To gather information about all these interests, I wanted to use some exploratory methods
with ethnographical flavour, where interesting findings could be found based on my working
hypothesis. Combining different methods is known as method triangulation (Frankfort-
Nachmias, 1996), and is frequently used to view a specific phenomenon from various angles.
This ensures a varied set of data for analysis. The methods I combined with a formative
evaluation are; observations, analysis of chat logs, automated screen dumps and interviews.
6.6 Scenarios
The Mindmap has been used in three quite different scenarios. The first was in the Adapt-It
morning meetings. In the second scenario, the Mindmap was included in a larger field trial
called Gen-etikk, conducted by the DoCTA project42. Because of the events in this scenario, I
decided to conduct a third scenario. The third scenario was a small-scale experiment
conducted within the boundaries43 of the University of Bergen. The rest of this chapter will
explain how these three scenarios were conducted and what methods I chose to use.
42 Design and Use of Collaborative Telelearning Artefacts (DoCTA), see Chapter 1 for a description of the project. 43 More specifically, the scenario was undertaken in a setting where one student collaborated in one computer lab, two student in another, while the fourth participant collaborated in another building in his own office. This was done to recreate a distributed setting.

83
6.6.1 The Adapt-It morning meetings
Instead of calling the Adapt-It morning meetings a scenario, I would rather use the term test-
case or test session. This term contrasts the classic scenario, as I did not design how the tool
was to be used, which actors to participate, what problems to be discussed etc. In a scenario,
such variables have been well thought through and carefully chosen and designed to fit
together. Also, I was employed as a developer in Adapt-It, therefore I had a double role as a
researcher and a developer when attending the morning meetings. Thus, my main method was
overt participatory observation, as all users participating in the five morning meetings were
informed about my role as a researcher. Due to agreements with the project leader I did not
interview the various participants, but each participant was to report to me about features and
usability. In addition, I kept a logbook to document valuable events as they happened. The
observations, reports and screenshots are my main data sources from the Adapt-It morning
meetings. Findings from the five test-cases will be presented in chapter 7.
6.6.2 The DoCTA scenario
Due to technical problems when deploying the Mindmap in this scenario, we decided to take
out the program, as it’s unstable behaviour could jeopardise the project. Even though the
application was taken out of the scenario and I did not get a chance to gather any data, the
experience was still valuable. It gave me some technical insights about vulnerable parts in the
architecture. These technical findings will be discussed in Chapter 7.
6.6.3 The “Intelligent System’s” scenario
The last scenario was conducted approximately two months later, on Thursday the 21 of
November 2002. The participants in this scenario are three students who had just completed a
course in artificial intelligence44 and the fourth subject is an employee at InterMedia. The
scenario was designed to make the students brainstorm around an Intelligent System that they
44 Weiqin Chen, who was the lecturer for the AI course, helped me find voluntary students to participate in the testing of the Mind map application. She also read through and commented on the scenario description I had written. She proposed to focus on Intelligent Systems instead of specifically focusing on agents, as was my original idea. I chose to follow her advice as she maintained that the students would have more knowledge in the first domain than in the latter.
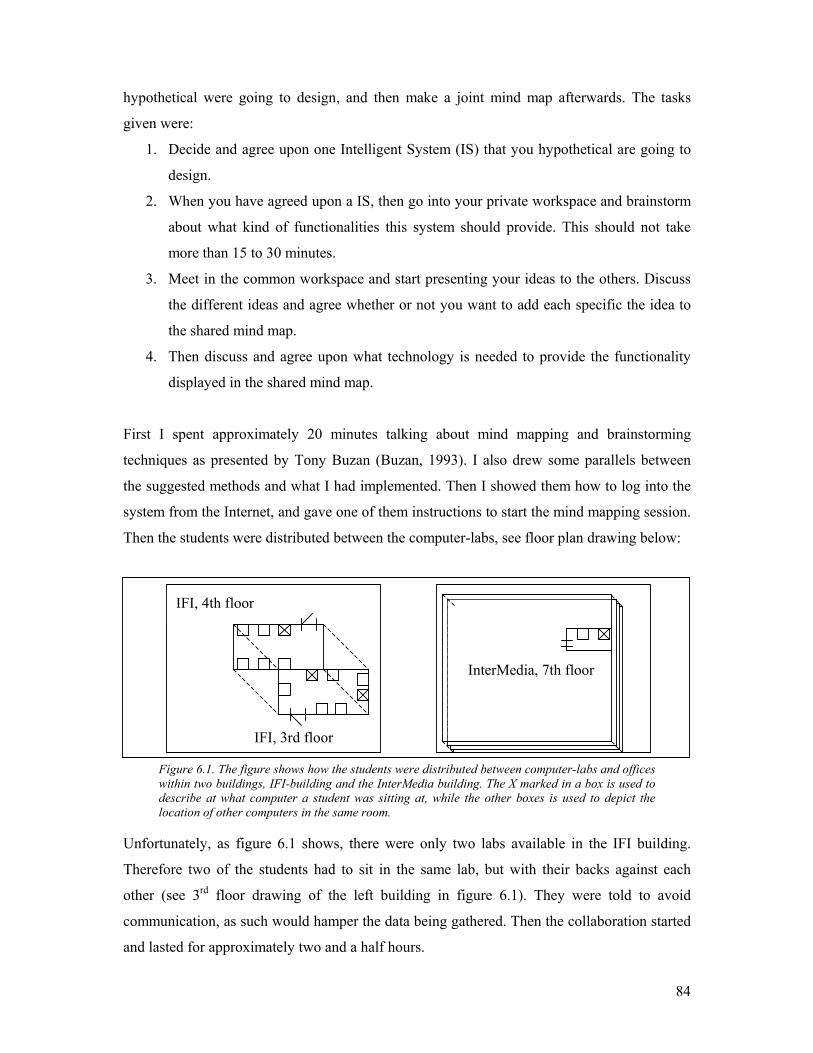
84
hypothetical were going to design, and then make a joint mind map afterwards. The tasks
given were:
1. Decide and agree upon one Intelligent System (IS) that you hypothetical are going to
design.
2. When you have agreed upon a IS, then go into your private workspace and brainstorm
about what kind of functionalities this system should provide. This should not take
more than 15 to 30 minutes.
3. Meet in the common workspace and start presenting your ideas to the others. Discuss
the different ideas and agree whether or not you want to add each specific the idea to
the shared mind map.
4. Then discuss and agree upon what technology is needed to provide the functionality
displayed in the shared mind map.
First I spent approximately 20 minutes talking about mind mapping and brainstorming
techniques as presented by Tony Buzan (Buzan, 1993). I also drew some parallels between
the suggested methods and what I had implemented. Then I showed them how to log into the
system from the Internet, and gave one of them instructions to start the mind mapping session.
Then the students were distributed between the computer-labs, see floor plan drawing below:
Figure 6.1. The figure shows how the students were distributed between computer-labs and offices within two buildings, IFI-building and the InterMedia building. The X marked in a box is used to describe at what computer a student was sitting at, while the other boxes is used to depict the location of other computers in the same room.
Unfortunately, as figure 6.1 shows, there were only two labs available in the IFI building.
Therefore two of the students had to sit in the same lab, but with their backs against each
other (see 3rd floor drawing of the left building in figure 6.1). They were told to avoid
communication, as such would hamper the data being gathered. Then the collaboration started
and lasted for approximately two and a half hours.
InterMedia, 7th floor
IFI, 4th floor
IFI, 3rd floor

85
6.6.3.1 Observation, screen cam and automated screen dumps
Since this was an artificial field trial, my role as an observer automatically became overt, and
the subjects under study knew and agreed to being studied. I also decided to take a non-
participatory approach, as I wanted to avoid affecting the students’ behaviour. As I had
planned to deploy an experiment simulating a distributed setting, I naturally had the students
sit in different labs. As already mentioned, because of lack of space, two of the students had
to sit in the same lab (away from each other). Consequently, I chose to spend 90% of the time
available in this lab, as it had the most students and increased the chances for observing
interesting behaviour. While sitting and observing them, I took some notes of their body
language and spoken reactions, together with a timestamp of the interesting events. This was
done to ease the process of finding interesting points of collaboration and interaction (when at
a later time I would be comparing the various data sources).
Even though I had chosen a non-participatory approach, my mere presence (in the computer
lab I spent the most time) resulted in the students approaching me with various questions.
These questions were mostly technical, concerning functionality in the application. But as the
students started to engage more in the collaboration (they started discussing their approach to
solve the design problem), they seemed to ignore my presence45. Thus my observation role
changed and became more like I wanted it to be, non-participatory, although my presence
might have influenced them to behave differently. I agree that information about their first
time reactions without my presence would have been very interesting, but might have posed
me with an ethical dilemma, because I would probably have been forced to conduct a covert,
non-participatory observation to achieve no distortion in the data.
In addition to observation, I chose to use screen cam recordings to observe and record what
happened inside the program. Screen cams record everything happening on a user’s screen
(including mouse pointer movements indicating eye focus on the screen) and save this into a
movie file. This file can be played back for later analysis, giving rich information about what
happened in the program. Also, you get a pretty good idea of what the other participants are
experiencing as I implemented a relaxed WISIWYS46 (What I See Is What You See)
45 In time, I was most approached during the first 10 to 15 minutes. 46 It is only agent output to users that may vary among the users.

86
awareness mechanisms in the workspace (Stefik, 1986). Together with the observations
conducted, this proved to be a rich data-source, as I could compare the behaviour I had
observed with what they had reacted to in detail. Screenshots were also taken, in the form of
auto-generated snapshots of the Mindmap for each time a new concept was added. This
enables me to play back the building of the mind map to see how the shared mind map was
constructed. This automated tool is very useful if screen cams for some reason are not
available (due to access restrictions in schools, computer labs and etc.), but no substitute as
screen cams provide a much richer source of information.
6.6.3.2 Interviews and chat logs
My experiment had a rather short time horizon, thus giving room for only one type of
interview. The type of interview I chose can be characterised as in-depth, open-ended, with a
mixture of formal and informal questions and dialogs. “In depth interviewing involves asking
open-ended questions, listening to, and recording the answers, and then follow up with
additional relevant questions…[]… Depth interviewing probes beneath the surface, soliciting
detail and provide a holistic understanding of the interviewee’s point of view” (Patton, 1987,
p. 109). Patton also emphasize the importance of combining observation with interviews, “…
we also interview to learn about things we cannot directly observe. We cannot observe
everything. We cannot observe how people have organized the world and the meanings they
attach to what goes on in the world” (p. 109). As already pointed out by Patton, interviews
could give me additional information that would probably not be covered by observation,
especially in a distributed setting where all participants could not be observed at once. The
interviews were recorded using the Dictaphone in my digital camera and transcriptions of the
most interesting passages are discussed in the findings chapter (See chapter 7).
Usually, concurrent verbal protocols reflect spoken interactions among users. In a distributed
setting, verbal group communication may not be possible (and was not possible for the
distributed users in this experiment) and is also hard to obtain. Since the Mindmap program
automatically saves the chat-log of a session to a file, the chat log can offer some of that
information (but not so rich and spontaneous as natural language) that could have been
gathered though concurrent verbal protocols. Thus the chat (Appendix D) log also gave me
valuable information, which I could use to confirm (triangulate) findings from other types of
data sources.

87
7 Findings
The Mindmap program has been continually tested (mainly functional testing) throughout the
implementation phase. Even though functional testing is efficient in detecting malfunctions
and logical flaws, more problems and inconvenient solutions will be revealed as people use
the program (which is different from testing it). To supplement the functional testing three
additional “test-cases47” or scenarios were conducted at different stages in the development.
These cases focused on a variety of aspects ranging from the purely technical to usability. The
three “test-cases” are; the Adapt-It morning meetings, the DoCTA scenario and the field
experiment conducted at IFI. This chapter will describe the findings from these experiments.
7.1 The Adapt-It test-cases
The Adapt-It project was first to use the Mindmap program. Adapt-It48 is an interdisciplinary
research project in which various persons at different institutions in Norway, Sweden,
Luxembourg, Netherlands and Italy worked on developing an online training analysis and
design application (De Croock, Paas, Schlanbusch, & Van Merriënboer, 2002). The
distributed nature of Adapt-It, both in time and location, led to a lot of coordination work. The
software development leader could not, due to both financial and time constraints, travel
across Europe or be at various locations at the same time. Thus, telephone meetings,
videoconferences and other forms of virtual meetings were organised. The participants in
Adapt-It were used to participating in virtual distributed meetings. Before I present the
findings from this “test-case” there is an important point to bear in mind: All participants at
the morning meetings were experienced software developers. Such expert users will probably
not experience the same bugs and have the same problems as inexperienced or novice users.
Expert users understand intuitively how tools are to be used, why and how problems may
arise, and possible workarounds to solve bug problems.
47 I use the term “test-cases” to refer to a test session where I have not designed how the tool is to be used, which actors are to participate, what problems are to be discussed etc. This term is in contrast to a scenario, in which such variables have been thought through, carefully chosen and designed to fit together. 48 The Adapt-It project ended in March 2003. For more information see http://www.adaptit.org/

88
During a period of three weeks, Adapt-It used the program to conduct five morning meetings
to coordinate their development work. In the first morning meeting, I briefly explained the
purpose of the Mindmap and how I thought it could be used to coordinate work and clear up
misunderstandings. I did not give them any directions or impose any constraints on how to
use the Mindmap other than this introduction. My goal was to give them the tool, and see how
they used it, how they adopted it to accomplish their task. Afterwards, I received feedback
about technical features as well as reports on how they experienced the usability of various
functionalities. In this way, the persons attending the morning meetings became a valuable
source of information.
7.1.1 Interesting observations during the Adapt-It testing
The first interesting observation was how the participants used the tool. They did not use the
tool to draw mind maps by following Buzan’s methodology. Rather, they used the tool to
create something similar to a to-do list for work related tasks. Below is a screenshot depicting
such a to-do list:
Figure 7.1. Three distributed persons having an online meeting in the Mindmap program.
One plausible reason for this use (not following Buzan’s methodology for creating mind
maps) could be that the users were working in a semi-commercial project, where time is a
limited resource, and they wanted meetings to be conducted efficiently. The to-do list would
effectively visualise what each person had to do or planned to do during the next few days.

89
I also observed the development of some collaboration patterns (Wasson & Mørch, 2000) for
organising the division of labour and explicitly visualising each person's responsibility. For
instance, I observed that the project leader would initiate the mind map, creating the first main
concept (main concepts often indicate the topic of the mind map). The project leader would
also comment on and discuss the concepts as the to-do list evolved. This role could be
compared to that of a coordinator, directing the agenda. Communication patterns could be
described as turn taking. The project leader and/or the task owner would answer questions
posed by the other members. Also, on closer examination of the screenshot taken from one of
the meetings, the participants seemed to be organising the to-do list in a special way.
Figure 7.2. Geographically distributed persons having a morning meeting. Figure shows how the participants choose to organise their to-do lists. Each person put his/her concepts into own branches to better depict work responsibilities.
The various participants would organise their own tasks into separate branches (if you see the
to-do list as a tree, where the root of the tree is the central red node), even when they were
working on related tasks. Later, I specifically asked them why and how this organisational
pattern had arisen. The participants answered that it happened as a consequence of the need to
clearly communicate each person's work responsibility. In the screenshot on the previous

90
page, this pattern has been exemplified by drawing a circle around the various persons’
responsibilities for the next three days.
The participants in the morning meetings gave some positive feedback on mechanisms with
which they were happy. For instance, they all reported that it was very easy to intuitively
understand how to add concepts, connect concepts and to see what other persons were doing
in the system. But most of the feedback regarded bugs, as I had expressed the importance of
discovering error so I can correct them. An example of reported bugs is the discovery of a bug
in figure 7.2. By looking closely at the participation list in the bottom right corner of the
Mindmap, you can see that the user Henrik has logged on twice. At this point in the
development process, the projcet had not implemented detection mechanisms that would
update the participation list. By deploying the program in the morning meetings, several “hard
to find” bugs were detected and reported. Going through the bug reports enabled me to correct
many of the errors and enhance the usability of the application.
It is difficult to formulate precise findings from the first “test-case”. The identified and
repeated collaboration patterns are very interesting. They can to a certain extent form the basis
for a hypothesis about how users go about using new tools. For instance, the morning
meetings were carried out in a similar manner to how a traditional face-to-face meeting would
have been organised. Often, face-to-face meetings have a chairperson setting the agenda,
organising turn-taking and plenum discussion. Such a role could be described as a meeting
coordinator, and was very similar to the role the Adapt-It development leader exhibited in the
morning meetings. Also, how the participants organised the to-do list into branches can be
compared to how a list of responsibilities could have been drawn and organised on a
whiteboard in a meeting room. These similarities can give rise to a tentative collaboration
pattern:
People introduced to new technologies will, if possible, use these technologies according to established practices to do their work.
People bring knowledge, habits and expectations about how work should be carried out. This
work experience may influence how tools are interpreted and used. According to Engeström
(1990), a “tool always implies more possible uses than the original operations that gave birth
to it” (p. 174). The Adapt-It morning meetings described above could be one such example

91
where the Mindmap afforded49 other types of usage then envisaged by me (as a designer and
implementer). A similar finding is reported by Arnseth et al (2001) in the context of
TeamWave Workplace, where he studies the use of Post-It notes (an asynchronous tool used
as a synchronous chat board) within the environment.
7.2 The DoCTA scenario.
As the Mindmap program worked well during the morning meetings, although affording
unexpected usages, I wanted to make the tool available to students (more normally skilled
users) in their everyday learning and work settings. This is also one of the aims of the DoCTA
research project, testing out software and how the chosen software support learning in
authentic environments. Since the very beginning (when deciding upon the technical
requirements), the Mindmap has been designed to work on old computers, with out-of-date
java support and little available memory. This part of the chapter will examine some of the
technical problems I experienced as I tried to deploy the Mindmap in the DoCTA scenario.
7.2.1 Technical findings from the DoCTA scenario
One week before the scenario started, I visited the school labs to test out how the Mindmap
worked on site. Some minor problems were discovered50 and after some changes the program
seemed to be working fine. But during the first two days of the scenario, the Mindmap
application showed unstable behaviour and crashed several times. On the critical third day,
the students were supposed to meet synchronously in the Mindmap and agree about a starting
problem for their group work. Due to the importance of this meeting, we chose (after having
arranged a telephone meeting between Oslo and Bergen) to remove the program, as it could
jeopardise the project. Very much time had been spent on coordinating the schools' strict
49 The term “affordances” was invented by Gibson (1986) and adopted and appropriated into the HCI (Human Computer Interaction) community by Norman (1989, 1995) and further by Erickson et al (2000) when talking about mediated human – human interaction. Erickson extends the concept of “affordances” to human – human interaction and calls it social “affordances”. 50 Such problems were low screen resolution (forcing me to rewrite parts of the program to detect and adapt the resolution to fit the screen), slow processors etc.

92
timetables, so they would have synchronous classes when needed. This was a complicated
process, and the teachers involved in the process had to switch classes with other teachers and
computer labs had to be ordered in advance” (Baggetun & Rysjedal, 2003).
Even though the application was taken out of the scenario, and I did not get an opportunity to
gather data about how students used the program, it still gave me some valuable insights
about what technical problems and constraints I had to deal with. The observed behaviour
seemed serendipitous and involved too many unknown variables to pinpoint. Based upon
prior experiences in arranging field experiments, we knew that unforeseen technical problems
would arise. Thus the DoCTA project had several researchers on site to observe and fix
technical problems. Based on information (about what they observed) I have been able to
identify some problem areas:
- A complex server architecture could be the root of several problems. For instance, the
agent system was stored in a Postgres database. This forced the system to access
another resource outside the java virtual machine on the server. For each external
system the Mindmap server relies on, the chance of potential breakdowns increases51.
Next, we have removed the database to store the needed objects in memory instead,
and persistently only after the session ends. This approach is more efficient, leading to
more rapid agent response times.
- Another potential and error-prone functionality offered by the server, is the possibility
of emailing images of the mind map. If the Linux server had not opened its X
(graphic) system, the Mindmap server would halt, stopping all processes. The
functionality required to send the attachment back to oneself should be based on
detection of whether or not the X system has been opened. I have tried to implement a
workaround for this problem, but I have not succeeded, as a Java program does not
permit the use of Unix commands in a shell. In addition, opening the X-environment
represents a security hazard, as it is easy for external users to run programs on the
server.
- Another problem was the technical equipment of the computer labs at the school in
Bergen. Most client machines had only 32 MB of RAM. This is the minimum amount
of RAM needed to run java. Also, the CPUs were old and slow, causing the Mindmap
51 To utilise the Postgres database, I had to start the Postgres server manually. At least one of the seven Mindmap crashes was caused by me having forgotten to start the Postgres database server.

93
to run correspondingly slowly. Malfunctions in the java language can occur as a result
of the memory and processing capabilities of the clients, resulting in invalid states in
the server. Such illegal states might force the server to execute illegal commands and
terminate. This suspicion was confirmed when I talked to the person with technical
responsibility in Oslo. At the school in Oslo (Hovseter), the students had new
computers with over two hundred megabytes of RAM. They “did not experience any
trouble while using the Mindamp until the pupils from Bergen started to log on. Then
the server halted” (my translation of a telephone conversation with Jan Dolonen,
technical tester in Olso).
I have done some work on the server to isolate and correct some of these errors. Especially
with respect to how the agent is integrated into the server (removing the Postgres database).
During the last sequences of testing, the Mindmap server has been more reliable. But I still
cannot guarantee that all of the problems mentioned above will not occur again if the
Mindmap was to be launched in another school experiment.
7.3 The IFI field-experiment
As already mentioned, employees and students at InterMedia and IFI (UiB) have tested the
Mindmap iteratively during development. Through the two previously described scenarios,
valuable information was retrieved with respect to the usability of the system. But testing of
the prototype agent was not the focus of these sessions. Therefore I wanted to conduct another
field experiment to get more hands-on data about how the agent prototype would work in a
distributed collaborative setting. More precisely, I wanted to investigate how students used
the system and responded to agent feedbacks, without giving them any prior knowledge of the
Mindmap or the agent prototype. I therefore (with help from some other researchers in
DoCTA) conducted a formative usability test using techniques such as observation,
concurrent verbal protocols52 and interviews (Booth, 1995) to gather more data. The whole
experiment lasted for about four hours.
52 Usually this reflects the verbal messages users communicate to each other. In a distributed setting, verbal group communication cannot be obtained that easily. The concurrent verbal protocols are thus the chat logs of the user conversations saved by the system.
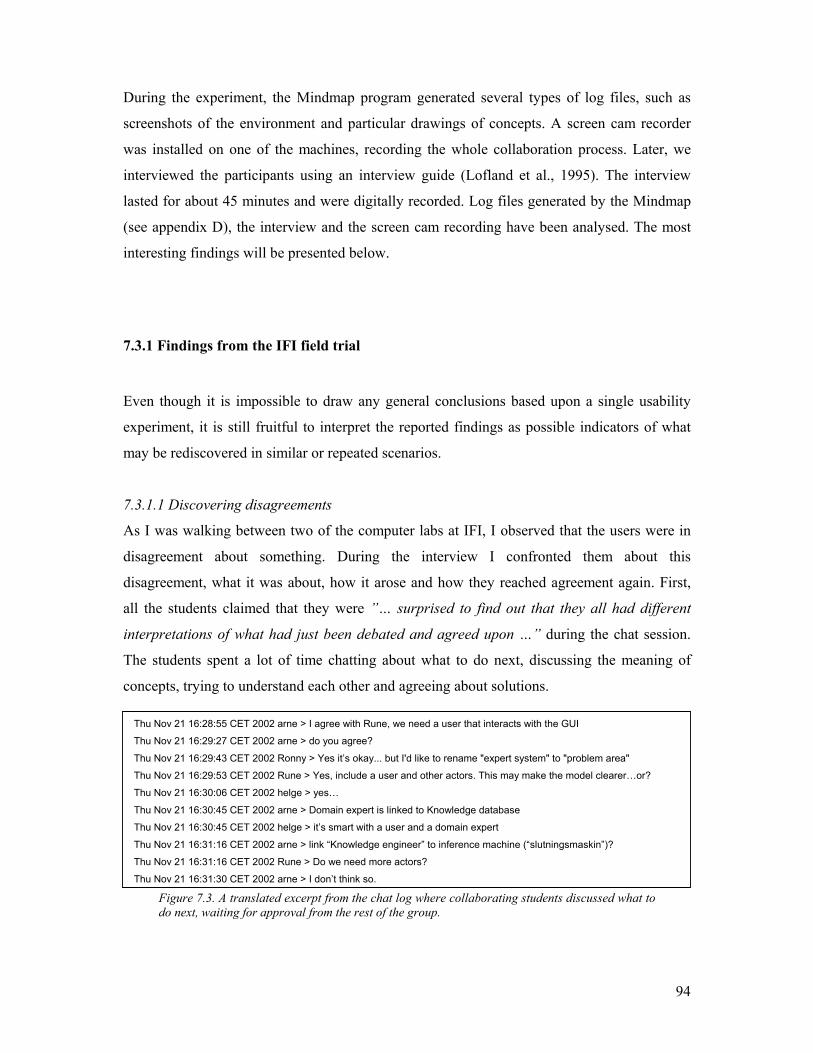
94
During the experiment, the Mindmap program generated several types of log files, such as
screenshots of the environment and particular drawings of concepts. A screen cam recorder
was installed on one of the machines, recording the whole collaboration process. Later, we
interviewed the participants using an interview guide (Lofland et al., 1995). The interview
lasted for about 45 minutes and were digitally recorded. Log files generated by the Mindmap
(see appendix D), the interview and the screen cam recording have been analysed. The most
interesting findings will be presented below.
7.3.1 Findings from the IFI field trial
Even though it is impossible to draw any general conclusions based upon a single usability
experiment, it is still fruitful to interpret the reported findings as possible indicators of what
may be rediscovered in similar or repeated scenarios.
7.3.1.1 Discovering disagreements
As I was walking between two of the computer labs at IFI, I observed that the users were in
disagreement about something. During the interview I confronted them about this
disagreement, what it was about, how it arose and how they reached agreement again. First,
all the students claimed that they were ”… surprised to find out that they all had different
interpretations of what had just been debated and agreed upon …” during the chat session.
The students spent a lot of time chatting about what to do next, discussing the meaning of
concepts, trying to understand each other and agreeing about solutions.
Thu Nov 21 16:28:55 CET 2002 arne > I agree with Rune, we need a user that interacts with the GUI
Thu Nov 21 16:29:27 CET 2002 arne > do you agree?
Thu Nov 21 16:29:43 CET 2002 Ronny > Yes it’s okay... but I'd like to rename "expert system" to "problem area"
Thu Nov 21 16:29:53 CET 2002 Rune > Yes, include a user and other actors. This may make the model clearer…or?
Thu Nov 21 16:30:06 CET 2002 helge > yes…
Thu Nov 21 16:30:45 CET 2002 arne > Domain expert is linked to Knowledge database
Thu Nov 21 16:30:45 CET 2002 helge > it’s smart with a user and a domain expert
Thu Nov 21 16:31:16 CET 2002 arne > link “Knowledge engineer” to inference machine (“slutningsmaskin”)?
Thu Nov 21 16:31:16 CET 2002 Rune > Do we need more actors?
Thu Nov 21 16:31:30 CET 2002 arne > I don’t think so. Figure 7.3. A translated excerpt from the chat log where collaborating students discussed what to do next, waiting for approval from the rest of the group.

95
This behaviour was observed throughout the whole scenario, and can also be seen in the
excerpt presented in figure 7.3 above. At this point, the students seemed to approve and agree
about the concepts in the mind map. I believe this agreement is based upon the high level of
abstraction that chat functionality often offers. In the chat, meanings are communicated
through sentences in a context. Because words and sentences are ambiguous the context of the
communication helps people understand each other. But sill, misunderstandings may occur
due to different interpretations of the context and lack of details in the discussion.
In Considering an Organization’s Memory, by Ackerman and Halverson (1998), memories
(both stored in Knowledge Management Systems and as knowledge among employees) are
seen as boundary objects53 that need to be reinterpreted both by the originating and the
receiving parties. They describe how problems within an organisation loose contextual
information as they are communicated (both through artefacts and speech) between different
persons54 (in same and different departments) in the process of being solved. “... boundary
objects in an organisation work because they necessarily contain sufficient detail to be
understandable by different parties involved, but at the same time, neither party must
understand the full context of use by the others” (Ackerman & Halverson, 1998, page 46).
By applying a similar usage of the term boundary objects (as Ackerman & Halverson),
concepts mediated through both the chat and the mind map can bee seen as boundary objects.
If we look at the figure 6.4 on the next page, the concepts Domain Expert (Domene Ekspert)
and Knowledge Engineer (Kunnskaps ingeniør) have become boundary objects. This
corresponds to the findings, where the students seemed to agree with each other because they
discussed the meaning of a concept on a high level of abstraction. This level of abstraction
permitted the students to maintain different interpretations and understandings of what were
being communicated. Below is a screenshot (figure 7.4) depicting the state of the mind map at
the time when the discussions in the excerpt presented in the previous figure (7.3):
53 According to Star, a boundary object “is an object which lives in multiple social worlds and which has different identities in each” (Star and Griesemer 1989:409; Star, 1989). This implies that meaning is not embedded in the boundary object, as every social world or actor has his or her own interpretation, understanding and practice attached to the object. 54 Implying that asymmetry in information and knowledge exists between people.

96
Figure 7.4. A screenshot of the mind map all students agreed upon, the shot is taken at the same time as the excerpt presented in figure 6.3.
At this point in the collaboration, one student started to connect the unconnected concept
Knowledge Engineer (the node “Kunnskaps ingeniør” depicted to the upper right corner in
figure 7.4) to another node in the mind map. This event resulted in a connection between
Expert System and Domain Expert, illustrated by the dotted rectangle in the screenshot below.
Figure 7.5. In the dotted rectangle is the resultant connection between the main node: Expert System, and the second level node: Knowledge Engineer.
After the connection of the two concepts highlighted in figure 7.5, one student strongly
disagreed about how the concept Knowledge Engineer should be understood. He informed the
agent about his mood towards the node. This resulted in an agent interaction in a pop-up
dialogue, informing the other participants about the student’s disagreement (this specific
event will be discussed later in paragraph 7.3.1.3). Thus, the other team members became
aware of the disagreement and understood that different interpretations of the mind map
existed. The action of connecting the two nodes, together with the agent interaction, made this
understanding among the other students explicit and became the source of their disagreement.
Following this discovery, the students began discussing how the concept Knowledge Engineer
should relate to the other nodes in the mind map, negotiating its’ meaning and what node it
should be connected to (other than the main node, Expert System). This can be exemplified
with the excerpt from the chat log:
Thu Nov 21 16:31:56 CET 2002 arne > that is the Knowledge engineer
Thu Nov 21 16:32:01 CET 2002 helge > the knowledge engineer is responsible for everything...
Thu Nov 21 16:32:15 CET 2002 arne > really?
Thu Nov 21 16:32:34 CET 2002 Rune > No, it may be possible that he’s responsible for creating e.g. rules based on

97
information from the Domain Expert. Thu Nov 21 16:32:41 CET 2002 helge > shouldn’t the Domain Expert also try to tell the Knowledge engineer something
Thu Nov 21 16:32:48 CET 2002 arne > I suppose the Domain Expert is just linked to the Knowledge database
(”kunskapsdatabasen”)?
Thu Nov 21 16:33:41 CET 2002 Ronny > I still disagree with the concept "expert system", the mind map seems unclear, at
least to me
Figure 7.6. Another translated excerpt from the chat log, showing a point in the collaboration process where the participating students start to discuss their interpretation of the concept Knowledge Engineer and Domain Expert.
This suggests that utilising chatting alone to solve complex problems in distributed settings
might not always be a good enough tool for communication. As already pointed out, the
students did not realise that they had different interpretations of the concepts they had
discussed and agreed upon until an event in the mind map made these differences explicit.
The participants spent approximately 10 more minutes discussing the relationship between the
involved nodes. They utilised other resources, such as their textbook, the Internet and other
information sources. In the end they all seemed to agree that the Knowledge Engineer should
be connected to the Domain Expert and the Knowledge Database (except for the student who
initially had argued that the Knowledge Engineer is responsible for the whole system).
7.3.1.2 Reported experiences about fixed agent outputs
During the collaboration, the agent generated awareness information about events in the
environment. Such information was presented in the fixed agent area output at the top of the
application window. During the interview, I asked the students how they experienced the
agent output in the fixed area. To my surprise, all students reported that they thought the agent
had been too discreet. Making agents discreet and non-intrusive was one of the main design
goals (see chapter 4.), so this reaction was unexpected. Furthermore, the students said they
usually did not notice what the agent suggested when output was given in the fixed agent area.
One student said he “… did not notice the agent and paid little attention to the upper part of
the interface until halfway through the collaboration process”. Since one of the premises for
the scenario, was to investigate usage by first time users, it is natural to assume that much of
their attention was spent on understanding how to use the Mindmap. As a follow-up question
I asked them if they thought that they would pay more attention to the agent if they were to
use the program again. They all responded that they thought they would do so. Some of the
students also gave a second reason for not paying more attention to the agent. They said it was
very unfortunate that the fixed agent output was positioned at the very top of the frame, while
the Mindmap chat area was at the bottom. “We spent most of the time discussing what to do,
and did not really direct our attention to the top of the screen to see if the agent said

98
anything”, said another. To illustrate the distance gap between the fixed agent output area and
the chat, I have frozen a frame from the screen cam recorded scenario:
Figure 7.7. The figure explicitly illustrates the gap between the agent (fixed output) area and the chat.
Another unfortunate effect of having a fixed output area for the agent is that information
presented in this area becomes decontextualised. If a user reads the agent output one minute
after it was produced, the situation on which the output commented might have changed
totally. This can lead to further misunderstandings, or simply ignoring the agent, as obtained
information does not seem to fit the current context. During the interview, the students
suggested that the agent should give standard output in the chat area instead, and that the fixed
output area should be removed. I agree that such a solution would reduce the problem of
decontextualised55 agent information, as information presented in the chat area would be
connected to the current discussion. One student proposed: “It would be easier to remember
55 In Considering an Organization’s Memory, Ackerman and Halverson (1998) use the term decontextualised information to explain the creation of boundary objects for persistent memory. Boundary objects contain enough contextual information to be reused in other contexts, but each person's understanding of the object relies on social settings and experience (Star, 1989). When creating boundary objects, it is a problem to determine how much information should be omitted and whether the decontextualised product would still be reusable by others. I use the term to stress the discovery that agent outputs in the fixed output area might become too decontextualised if users do not notice them before the context changes.
Agent area
Chat area
Focus gap

99
and understand what the agent commented on or suggested if we knew when the agent
presented the output. In the chat area, such suggestions would be relative to our own
postings, thus easier to remember when and what went on at that moment. The way it was, the
messages became somewhat ambiguous as we did not always notice that new outputs were
being produced in the fixed agent output area”. A negative effect of moving the agent output
to the chat area could be possible breakdown situations. The agent can then easier interrupt
and cause shifts in focus. I have already modified the design of the interface so that the agent
provides its output in the chat area, but the effect of this new implementation has not been
investigated.
7.3.1.3 Reports regarding agent pop-up interactions
After examining why the students did not notice the agent when output was given in the fixed
area, I wanted to find out if they noticed the agent when output was given in the form of pop-
up dialogues. They answered that they noticed the agent when outputs came as pop-ups. Also,
they all stated that they found this irritating and disturbing. This is very interesting and
somewhat contradictory to their earlier statements.
First they complained about fixed agent outputs being delivered too discreetly. Next, when
something important happened56, the agent chose to display a message to the participants in a
pop-up dialogue box whereupon all group members reported that they felt this was disruptive.
The frequency of delivered dialogue messages was very low. Only four such messages were
given while the collaboration lasted. The screenshot below illustrates one of the pop-up
messages given by the agent prototype, informing participants that one of them disagrees with
something in the mind map. This finding points toward there being a fine balance between the
design of presentation form and content. When designing the agent response logic, I have
wanted very important messages to be presented as pop-ups and less important messages in
the standard (fixed) agent area. This design can be illustrated along this dimension:
Figure 7.8. A dimensional representation of the output form and the grade of importance the content is considered to have.
56 Triggered by a student explicitly telling the agent that he/she disagrees with a certain element.
Importance
Treat as awareness Treat as fixed agent outputs Treat as agent pop-ups

100
The students seldom complained about the appropriateness of the messages given, especially
not those given as pop-up dialogues. But I do not put much emphasis on this, as the users
stated earlier that they did not notice all of the agent output, particularly at the beginning of
the test.
Figure 7.9. The screenshot shows a pop-up message from the agent, informing the other users explicitly that one of the users (Arne) disagrees with the node Knowledge Engineer (“Kunnskaps ingeniør”). Then the agent encourages the participants to discuss and explain the disagreement regarding this concept.
With respect to agent output frequency, the participants complained that the agent gave too
much awareness information. They would like to have filtered out some of the reactive
awareness information and presented such data in an awareness area. That way, only
important information would be presented in the fixed agent output, making it easier to
classify information as more or less important. Some students reported that they explicitly had
to express their attitudes towards an element several times before the agent reacted.
Figure 7.10. Another screenshot depicting how users can expresses their moods towards an element in the mind map.
An agent message presented
in a pop-up dialogue.

101
Also, they would have liked some sort of feedback from the agent, for instance a message
telling them that their mood towards an element in the mind map had been recorded. For such
situations the participants wanted shorter response times from the agent and suggested a more
reactive approach for certain user actions in the agent architecture.
So far, I have mainly presented and focused on the criticism that I received. It is also
important to mention that all the participants liked the Mindmap and wished to use it more.
They managed to collaborate and use it successfully without any training or introduction to
mind mapping techniques. They all liked the awareness information given at all times in the
program. They also said that the agent was good at suggesting ways of representing
knowledge when inconsistencies were revealed. If these findings were enhanced and fixed,
they all believed that the agent prototype would be helpful in some of their articulation work.

102
8 Discussion
This thesis has generated an application providing an online meeting-place where users, co-
located or distributed, may gather to do collaborative work. Here work is meant in a broader
sense to include creative processes57 and problem-solving tasks that involve acquiring,
structuring and use of knowledge. Even though the software has been designed for mind
mapping, findings discussed in chapter 7 revealed that it also supports different58 usages as
well. As other uses and practises may be applied to the software (tool), other kinds of similar
programs may provide different means for collaborative problem solving, learning and work.
In this chapter I will introduce some commonly available mind mapping programs. I will
focus on what functionality they provide and discuss how they enable collaboration among
users. The functionality will be compared to the functionality that is offered in my Mindmap
application and I will focus more on differences than on similarities. In the end of this chapter
I will present some features that I believe is special for my application, and that few general-
purpose programs include.
8.1 Mind mapping software
A quick google search on the Internet introduced me to four different mind map programs. I
have chosen to describe three of the four, since the fourth was pretty similar to the two of the
programs I evaluated (the fourth is MindMapper 3.5 and can be downloaded here:
http://www.mindmapper.com/). Three out of the four are commercial products, and I have
received temporary licenses (maximum 30 days until they expire, and for some only 21), but
all of the programs offer the opportunity to purchase a new license through the Internet. Most
probably, this means that I already have got the whole and complete applications ready for
evaluation. One of the four mind mapping programs is open sourced and are available for
free. I am especially interested in comparing my endeavour to this alternative, as I (a lone
developer) have scarce resources compared with commercial software companies (often
57 Examples are mind mapping, brainstorming. 58 See chapter 7.1.1 Interesting observations during the Adapt-It testing, page 85.

103
employing several programmers) in creating an application. My design ideas are not based
upon any existing mind mapping software that I am aware of, rather implemented ideas that
have evolved through practising Buzan’s methodology (1993) and reflection on how
computer-mediated group mind-mapping could be contrived.
8.1.1 Visual Mind 5.0
The Visual Mind software (http://www.visual-mind.com/) is shown in the figure below.
Figure 8.1. The screenshot explains the interface of the Visual Mind 5.0. The program starts with this predefined help map to explain the uses of the program and how to build mind maps with this tool.
Visual Mind is a commercial product that costs 129$ for a licence and there is an additional
fee for upgrades. Downloading and installing the program is very intuitive and easy. The
program uses icons conveying well-known metaphors to explain available functionality. For
Accessible levels
counted from the
selected node
Include reference to
Microsoft documents
Usual load, save
print functionality
Icons to insert into a
node box. See this
node
Textfield describing a
node.
Publish map on Internet

104
instance, the standard icons for open, save, print and new document are all provided and
similar to the icons used by Microsoft products. Creating the first mind map went also
smoothly. By first selecting the parent node followed by typing on the keyboard will
automatically launch the dialog depicted in figure 8.2 to specify the properties to the new
node:
Figure 8.2. I decided that I should depict all three tabs within the dialog. This dialog is used in the process of creating a new node in the mind map. The third tab is used to indicate how children are to be depicted in the diagram. The dialog is also available any time a user wants to modify a branch’s property.
Every node has a “+” or “–“ sign in front of it’s label. These icons are used to fold or unfold
the tree structure of the node. Other symbols that can be attached in front of the label can be
found in the toolbar to the right in figure 8.1. These symbols do not necessarily have any
specific meaning, but the meaning of each node is subject to negotiation and adapted
practices. In addition, images, files, URLs and folder icons can be added and point to a
resources on the Internet or on the local hard disk. Still, this application does not offer much
that cannot be done by using Microsoft’s PowerPoint. One advantage is the graphical mind
map (tree) structure that will always be retained. In PowerPoint, moving and rearranging the
tree could be time-consuming, compared to this application. Another smart feature is the
“publish on Internet” function. This tool creates an interactive web page where the user can
view the mind map, unfold the trees etc., but not modify it. A similar feature called “make
independent map” saves the mind map to the file system as an executable file. In the help
functionality of the Visual Map, this feature is described as ideal for sharing a private mind
map with other users through mail or by other means. Since the generated output is an
executable file, anyone can open the map and interact with it in the same manner as the web
publishing functionality, without owning a copy of the software.
An unfortunate discovery was the finding of a bug in the tree hierarchy layout structure. If
you look at the figure 8.3, you will see that expanding trees eventually will overlap each
other.

105
Figure 8.3. The children nodes in the branch Features in Visual Mind seem to overwrite the children nodes in the branch Uses. This cannot be a designed feature, but a bug.
Also, Visual Mind does not support synchronous collaboration among distributed users. To
obtain some sort of collaboration users must exchange saved maps and each own a copy of
the program (or else they will just be able to view an interactive presentation of the mind
map). These copies will always be out of synchronisation, as a change in one copy will not be
transmitted into the next. This contrast drastically to my design and implementation
philosophies, were users should be able to work concurrently regardless of distance issues, on
the same mind map.
I also discovered that concepts (nodes) expand horizontally to fit the text label within them. I
wonder why the designers have not implemented a line break algorithm to avoid the problem
of one node filling the whole screen horizontally. This is unfortunate, as computer resolution
and screen often vary in size, something that looks small on one configuration may very well
look large on another. Also, the designers should consider how much space a diagram element
The branches seem
to be tangled on
top of each other.

106
should occupy in the viewable workspace59. If components are allowed to grow
uncontrollable large, a consequence might become that only small amounts of information can
be viewed simultaneously. A common workaround is to implement a zoom function that
zooms in/out the whole workspace. Another solution would be to supply a line break
algorithm that globally defines the maximum width for nodes. This could be combined with
the option to individually specify the size of a node to override the global (predefined) size.
Even though the software was easy to use, I cannot see that it offers much functionality that
the Mindmap application does not allow for. In this comparison, only single user aspects have
been taken into consideration. The Mindmap offers a variety of features to support
synchronous collaboration as well. (These have already been presented in chapter 4, 5 and
some in chapter 7.)
8.1.2 Freemind
The Freemind (http://freemind.sourceforge.net/) software is an open sourced project released
under the GPL (GNU60 General Public License) license, and the developer’s aim is to evolve
it into a general editor and viewer for tree structured data (Rissner C., 2003)61. Actually, I
discovered this aim after I had tested out the application, and coincidently, it was the tree
structure that impressed me the most. The graphical representation of the tree structure in this
diagram editor is far smoother then the commercial Visual Mind editor. Here, the nodes’ size
is generally made smaller (unfortunately, a long node name will not be interrupted by line
breaks and can therefore take up much horizontal space), that leaves the user with more
workspace for the mind map.
59 I define viewable workspace as the amount of workspace that can fit on a screen without the use of scrollbars. 60 GNU is a recursive acronym for "GNU's Not Unix"; it is pronounced "guh-NEW". For more information, please check out the official GNU web site: http://www.gnu.org/ 61 Christoph Rissner published his seminar lecture on mind maps held at ICCM (http://courses.iicm.edu), March 3, 2003.

107
Figure 8.4. The screenshot depicts a mind map I built while examining the functionality offered by the various tools in FreeMind.
Another smart feature incorporated into the toolbar is the zoom functionality that makes it
easy to get an overview over the expanded tree (also mentioned in the discussion of the Visual
Mind software). Otherwise, I found the application very similar to the Visual Mind
application. Among the differences worth to mention, the tree layout in FreeMind works
better than the equivalent feature in Visual Mind. But again, the Visual Mind compensates
with enabling use of various symbols and images, something that is not possible in the
FreeMind. Another useful feature that resembles the publish map on Internet function in
Visual Mind can be found in this software as well. Here it is called export to HTML and the
exported result looks more like a structured text document, put could still be fairly useful.

108
Figure 8.5. The screenshot shows the exported mind map depicted in figure 8.4 as it would appear in an html file.
Unfortunately, also this application has been created for single use only. As in the previous,
users must exchange mind map documents to be able to collaborate. Comparing the FreeMind
with my application does not give me any new insights (not revealed by the latter) on how to
offer features for visualisation, knowledge construction and collaboration. But for the
functionality that can be compared, it is clear that the horizontal tree layout (east and west) is
far better implemented in FreeMind then my vertical tree representation (see figure 4.44, page
57). I have rather emphasized interactivity and flexibility for collaborating users than a rigid
tree layout. But this is currently under development and will be implemented in the future.
Over all, I think my Mindmap application will work just as well for users accustomed to the
FreeMind, especially when considering the advantages that synchronous collaboration
affords. Also, both applications are available for free.

109
8.1.3 MindManager
The MindManager can also be downloaded from the web at: http://www.mindjet.com/. It has
a shorter trial period than the other tools and version X5 Pro costs 299 USD. The first
impression of this application is very good. There are more tools available, the interface looks
better, and offers a better integration with the Microsoft Office package than the previous
examined tools.
Figure 8.6. The MindManager interface is easy to understand and use. I developed this mind map (first time use) while trying out the functionality. The toolbar offers standard functionality similar to the previous maps (save, load, print, edit etc) in addition to the export functions (to Word and PowerPoint).
The structuring of the diagram follows the same rules as the previous programs. It maintains a
good layout, but makes it also quite static. The software provides several general tools and a
variety of symbols that can be added to a node/concept (see the lowest row of icons in the
toolbar in figure 8.6) and a feature to specify four different border styles (see the border styles

110
assigned the nodes to the lower-left in figure 8.6). All functions are well implemented and I
did not discover any bugs while using the application.
I was pleased to discover that MindManager offered a feature called conference. This function
enables a user to log onto a server for online collaboration. On the server users can create a
new conference or join an ongoing conference. The creator of the conference will become the
conference chair. The chair has authority to modify the participants’ roles and access to the
diagram. The assigned roles will be visualised in the participant list by various symbols in
front of the name. A screenshot from a conference is depicted in figure 8.7.
Figure 8.7. The MindManager works in the same way when collaborating in a conference as when a single user is working privately on his own computer. Some tools have been added to coordinate the collaboration: a queue (where users “line up” for the privilege to edit the diagram), a participants’ list (showing who is collaborating in the conference) and an event list (showing which person did what in the diagram).
The participants’ list mediates information about who is currently in the conference, and what
role the various participants may have. In addition, the list will keep track of who is currently
in control of the shared map as well as whom is to receive the control. By looking at the
participants list in the figure above, it is easy to see that Mona has gained control (indicated

111
by the appearance of a pencil next to her name) and that she has the privilege to manipulate
the diagram. In figure 8.8 below, she has selected the concept Collaboration and she is about
to add a new child concept to the diagram.
Figure 8.8. Mona has formed the sub-node Enter Sub-topic that is connected to the previous selected node Collaboration. It is marked red to indicate that Mona is in the process of manipulating the object. Also, by looking at the participants list to the right, Mona has a lock icon in front of her name. This symbolises that she will have control until she is finished editing the artefact, or explicitly releases the control.
As the figures exemplify, the concurrency mechanism locks the whole diagram while a user
edits it. Having one user completely occuping the workspace is known as floor control
constraint and is a result of shortcomings in system transparency design (Beaudouin-Lafon &
Karsenty, A., 1992). This way of controlling and coordinating use of the shared map has been
done to reduce the server architecture complexity. Such an approach is known as pessimistic
concurrency control (Prakash et al, 1999). This design results in a semi-synchronous
conference, as all participants will be updated after the construction of an object has occurred
on a client. The opposite solution is to let all clients receive the changes simultaneously from
the server, including the client who was the source of the event (replication pattern, Nelson
1999). Semi-synchronous architectures are in deed asynchronous, but updated often by the
server to appear fairly synchronous. Such solutions could in worst cases lead to less efficient
collaboration due to updating the shared workspace containing discussions, manipulations,
and decisions.
Due to the coarse-meshed locking mechanisms, the developers have obviously not prioritised
the production of workspace awareness (Gutwin, 1995). I found the lack of system feedback
somewhat annoying, as I had no idea what my peer was doing until she had done it. For
instance, implementing a relaxed WYSIWIS (Stefik, 1986, 1988) would have solved this
problem. Another functionality that should have been incorporated is a simple chat tool. It is
unfortunate to give up screen-space (and reduce the viewable workspace) because the user
must launch an external instant messaging tool to be able to communicate with the other
peers. Segerstad and Ljungstrand (2002) found a correlation between the content of messages

112
and the awareness the system provided (e.g. user status, activity and other system features in
general affecting the generation of messages). Incorporating support for instant messaging
between online users in a conference could in light of these findings prove fruitful for the
joint efforts to solve a problem or agree upon the content of a shared mind map.
Even though this application offers the possibility to collaborate across a network, I still feel
that MindManager’s main target group is single users creating personal mind maps. The
MindManager appears to be a good single-user application, supporting MS Office integration
and more graphical symbols and tools then any other of the tested mind maps. Based on such
criterias the MindManager will outperform the Mindmap.
8.1.4 Comparisons to the Mindmap
Comparing the described mind mapping applications to my Mindmap program, gives me
some ideas for future enhancements, like better horizontal layout support and have selection
of well known symbols presented as small icons available in a toolbar. But I have also
designed some features that the other investigated applications do not support and that might
be rather unique for my application. This can be reflected on my development focus, where
requirements has been designed to offer a redistribution of the workload between user –
machine – user, so collaborating users may focus more on their joint tasks and less on
coordination work.
The Mindmap offers real-time synchronous collaboration among users with a relaxed
WYSIWIS. Additional awareness mechanisms notifies the state of diagram objects and also if
users are working inside them. Minimal concurrency locking is enabled to allow all
participants to simultaneously do useful work, as well as an incorporated chat tool. Two
different workspaces have been created, to offer both private and shared mind mapping,
supporting the group mind mapping methodology described by Buzan (1993). Information
exchanging mechanisms enable users to share, exchange and modify each other private maps.
Other co-ordination features such as voting mechanisms and support for a facilitator to
regulate participation level among the users have been included. These are all features that are
not found in the other examined mind map applications.

113
Below is a scheme created to depict main branches of features, and which of the compared
applications that have support for the categorised features.
Feature support Visual Mind FreeMind MindManager Mindmap
(Jemue)
Free software X X
Open sourced X Not decided
Single application X X X X
Multi-user support X X
Real-time support X
Semi-synchronous X
Asynchronous X X X X
Awareness X X
Agent technology X
MS Office integration X X
Save map to XML X X
Export map functionality X X X X
Save map X X X X
Platform independent X X
Figure 8.9. The table presents a list of attributes supported by one or more of the tested mind maps. It is interesting to find that only MindManager supported networked communication among users, and that this functionality seemed to be little elaborated.

114
9 Conclusions and Future Work
This study is a part of the DoCTA research project, whos main concern is designing learning
scenarios for distributed students. Situated within such a context, it is natural to adopt some of
the project’s broader research interests while specialising in others. One broad issue I have
adopted and discussed throughout this thesis is mechanisms supporting coordination in
distributed and synchronous meeting places. During the development of the Mindmap
application and the framework, I have tried to operationalise these concepts. I have considered
how transparent the workspace should be, what kind of awareness should be supported, what
tools should be implemented to enable various forms of information sharing etc. These issues
have been narrowed down by demonstrating and discussing how awareness mechanisms
implemented in the Mindmap work and may levitate articulation work. Many of these
mechanisms convey information that aid users in the management of jointly produced
artefacts. This is a critical success factor, in addition to the need for awareness about
participating users62, in a groupware system.
In addition to awareness mechanisms, an experimental implementation of a pedagogical
agent63 has tried to demonstrate how (more) adaptive support can be provided in an ICT
supported learning and working environment. The design work has focused on how the agent
architecture can be separated into small independent modules (with own rules) aimed at
controlling the frequency of agent interactions. Experience from the use of other agent-
enabled systems (often single user systems) and a survey of theliterature on agents, have
shown that pedagogical agents are often guiding, showing the users how or what to do in the
task interface. These agents tend to take up a lot of workspace and interacting with them is
often considered time-consuming. To successfully foster collaborative learning, a necessity
for rich interactions and genuine interdependence must be established and sustained
(Baggetun, 2002). Spending a lot of time on user–agent interactions might not be the best way
to achieve this goal. Such a design approach might not be suitable for collaborative learning
and work settings, and it would be preferable to consider using a less intrusive agents’
62 Dourish and Belloti (1992, p.1) claim that: “Awareness of individual and group activities is critical to successful collaboration and is commonly supported in CSCW systems by active, information generation mechanisms separate from the shared workspace”. 63 Being concerned with coordination issues and streamlining users following Buzan’s (1993) mind mapping methodology

115
appraoch. An important difference here is that our objective is learner-learner interaction, and
NOT learner-agent interaction (Dragsnes, Chen & Baggetun, 2002; Baggetun & Dragsnes,
2003; Chen & Wasson, 2003).
Findings reported (chapter 7) include users’ appreciation, how useful they regarded the tools
provided and their functionality as well as how they felt about the pedagogical agent
interacting in the environment. Reports from the first scenario, the Adapt-IT test cases, show
how the unfinished tool was still useful and how (in this case of expert) users found other
usages of the tool to fit their context than I (the designer) had anticipated. They used the tool
in a manner similar to how they would use a whiteboard/blackboard in a traditional meeting
room. This gives rise to a tentative collaboration pattern and may belong as a special case to
the identified adaptation pattern:
People introduced to new technologies will, if possible, use these technologies according to established practices to do their work.
Even though the Mindmap affords different usages for different purposes, the users still
reported that they found it useful, they liked it and that they said that it would be a good tool
for actually doing mind mapping (something they never did).
The IFI-field trial focused more on the awareness features and the pedagogical agent
mechanism, but general attention was also given to how the students liked the Mindmap and
how they felt about using it. I planned the scenario by designing a shared problem, giving a
short presentation of the project and some instructions on how Buzan’s mind map
methodology should be applied. The students constructed private maps and later merged their
different private ideas into a shared map. In the process of joint problem solving and
negotiation of meaning, they seemed to form boundary objects, that would later give rise to
heated discussions about meaning, understanding and interpretation. The students reported
that the way they could notify the agent about their attitude towards shared artefacts was
useful for making misconceptions among the group explicit (by creating a breakdown
situation). Overall, they reported that the awareness mechanisms (concerning persons and
shared artefacts) were very useful information sources and helped to create context and
increase understanding (and others’ understanding) of shared artefacts, and that they felt that
the application managed to lessen their articulation work.

116
When asked specifically about agent interactions, the students found the agent to be generally
too discrete/anonymous. Further, this finding made me aware of the unfortunate design of
positioning the fixed agent output-area at the top of the task interface. This area seldom had
the students’ attention, as the students concentrated their attention on the activity in the chat
area and the diagram. Thus they seemed to miss the agent output provided in the fixed area.
Another important point is that of contextualisation. When the students noticed the output
given in the fixed area, it was hard for them to determine when these messages had arrived (if
they had not seen them arrive). This led to the students just ignoring the fixed output area as
the information, when finally noticed, often seemed not to fit the current context. This has
now been changed, and the agent will now produce output in the chat-tool.
Agent interaction in the form of pop-up windows was said to be annoying. This type of
interaction did not happen often (only four times)64, and was usually triggered by another user
in the environment. This finding is important, as pop-up interaction has been defined as
something that should be intrusive, and aimed at creating a breakdown situation in the
collaboration. Usually, the agent reports about user misunderstandings, disagreements or
otherwise tries to adjust participation in some way or other. At such stages in the
collaboration, the recipient(s) should reflect on what he/she is doing (and what the others are
doing, trying to do). Thus such situations may help users become aware of misunderstandings,
disagreements etc, and thus induce learning and problem solving.
In general I would like to emphasize that work on the agent is not yet completed. Many of the
values of the thresholds defining the behaviour of the agent are based on insufficient
assumptions, and should be thoroughly adjusted based on trial and error by conducting field
experiments. I consider the current values assigned to the many thresholds as a starting-point
for such research activities.
9.1 Future work
While constructing the Mindmap, I have invested considerable effort in refactoring to ensure
a high degree of reusability for classes constituting the framework. Now, it has created spin-
64 This simply reinforces the suspicion that users do not like to be disturbed when they are doing work.

117
off results, as three master students have joined the project. They are reusing the general
diagram-classes within the framework to create other types of diagrams. For instance, one
student is creating an Entity-Relationship diagram, (Eide, in preparation) while two others are
creating different UML diagrams (Pedersen, in preparation; Pettersen, in preparation).
Figure 9.1. Eide’s ER-diagram constructed by reusing a lot of functionality within the framework.
By comparing Eide’s visual composition of the user interface with my Mindmap application,
it is easy to see the resemblance. The chat component at the bottom of the task interface is
plugged into the application without modification. Eide has also chosen to offer users the
flexibility to work between shared and private workspaces. Her work will probably generate
new assignments, as the domain of Entity Relationship (ER) diagrams can be facilitated by a
subject-matter agent, in addition to an agent concerned with group dynamics and levels of
participation.
The two students constructing different UML diagrams are currently collaborating on the
creation of an UML-class diagram. Pedersen and Pettersen have decided to also include the

118
support of subject-matter agents to help and guide users in their task of modelling the
relationship between classes. Their implementation efforts so far can be seen in figure 9.2.
Figure 9.2. Pedersen’s and Pettersen’s preliminary UML-class diagram, showing an inheritance relationship between a super class and two subclasses.
Since this compilation is of an early stage of the development, they have not yet plugged it
into the main frame of the application, but they are still reusing much functionality.
Relationship links and symbols have not yet been extended and included, but the
implementation work for successfully creating a shared UML-editor is dramatically reduced
by the code provided in the framework.
In addition to these extensions, several other assignments could be undertaken to improve the
project in general. For instance, a student could be dedicated to enhance the client–server
architecture. Another possibility is to arrange several experiments to fine tune agent
interactions, or conduct experiments to investigate how distributed users collaborate to work
and learn, and how an agent might impact on their interaction. Thus, it is possible to do much
more work within this project, and I understand now why programming projects have a
tendency to never end.

119
10.0 References
Arnseth, H. C., Ludvigsen, S., Wasson, B., & Mørch, A. (2001). Collaboration and Problem Solving in
Distributed Collaborative Learning. In: Dillenbourg, P.; Eurelings, A. & Hakkarainen, K., red. European Perspectives on Computer-Supported Collaborative Learning. Maastricht, Nederland: Maastricht McLuhan Institute; s. 75-82 EuroCSCL 2001.
Ackerman, M.S. & Halvorsen, C. (1998). Considering an Organization’s Memory. Proceedings CSCW’98,
Seattle WA, ACM Press, 39-48. Ayala, G. & Yano, Y. (1995). GRACILE: A Framework for Collaborative Intelligent Learning Environments,
Journal of the Japanese Society of Artificial Intelligence, Vol.10. No. 6. Pages 156-170. Baggetun, R. & Mørch, A. (2000). Coordination as Resource in Collaborative Telelearning. Proceedings of the
23rd Information System Research Seminar in Scandinavia (IRIS 23), Uddevalla Sweden. Baggetun, R., Dolonen, J. & Dragsnes, S. (2001). “Designing Pedagogical Agents for Collaborative
Telelearning Scenarios” in proceedings of IRIS24, Rica Brakanes Hotel, Ulvik in Hardanger, Norway, 11-14 August 2001.
Baggetun, R. (2002). Coordination Work in Collaborative Telelearning, master thesis (hovedfagsoppgave),
Institute of Information Science, University of Bergen. Baggetun, R. & Dragsnes, S. (2003). Designing Pedagogical Agents for CSCL. In proceesings of CSCL 2003,
June 14-19, Bergen, Norway, published by Kluwer Academic Publishers, AA Dordrechtm, Netherlands. Pp.151-155.
Baggetun R., & Rysjedal, K. H. (2003). Infrastructural Issues in Design of Technology Enhanced Learning
Environments. Submitted to the Psychology Journal. Bannon, J. L. (1989). Issues in Computer Supported Collaborative Learning. Chapter in Proceedings of NATO
Advanced Workshop on Computer_Supported Collaborative Learning. Claire O’Malley (Ed.) Held in Maratea, Italy Sept. 1989. Available at http://www.ul.ie/~idc/library
Bannon L. J. & Schmidt, K. (1991) CSCW: Four characters in search of a context, in J. M. Bowers and S. F.
Benford (eds), Studies in Computer Supported Cooperative Work: Theory, Practice and Design. North-Holland, pp. 3-16.
Beaudouin-Lafon, M. & Karsenty, A. (1992). Transparency and awareness in a real-time groupware system. In:
Proceedings of the ACM Symposium on User Interface Software and Technology, pages 171-180. de Bono, E. (1992). Serious Creativity: Using the Power of Lateral Thinking to Create New Ideas. ISBN:
0887306357. Publisher: Harper Business. Bourdeau, J. & Wasson, B. (1997). Orchestrating collaboration in collaborative telelearning. In Proceedings of
the 8th World Conference On Artificial Intelligence in Education, 565-567. Amsterdam: IOS Press.
120
Booch, G., Jacobsen, I., & Rumbaugh J. (1999). The Unified Software Development Process, ISBN 0-201-57169-2, Addison Wesley Longman, Inc. Massachusetts, US.
Booth, P. (1989). An introduction to human-computer interaction. Lawrence Erlbaum Associates, Hillsdale, NJ. Boy, G. A. (1997). Software Agents for Cooperative Learning. In Software Agents. Menlo Park, CA:AAAI
Press. Bradshaw, J. M. (1997). Software Agents. Pages. 3-46, Chapter 1. AAAI Press. Mento Parle, CA, USA. Buzan, T. (1993). The Mind Map Book, ISBN: 0563863738, Penguin Books, NY, USA Inc. Carstensen, P. H. & Schmidt, K. (1999). Computer supported cooperative work: New challenges to systems
design. In K. Itoh (Ed.), Handbook of human factors, 1999. Cassell, J. (2001). Embodied Conversational Agents: Representation and Intelligence in User Interface. AI
Magazine, Winter 2001. Chen, W. & Wasson, B. (2003). Coordinating Collaborative Knowledge Building. In: International Journal of
Computers and Applications, Vol. 25, No. 1, 2003. Constantino-González, M. and Suthers, D. (2000). A Coached Collaborative Learning Environment for Entity-
Relationship Modeling. In Intelligent Tutoring Systems, Proceedings of the 5th International Conference (ITS 2000), Gauthier G., Frasson C., & VanLehn K. (Eds.), pp. 325-333. Berlin: Springer-Verlag.
Cowie, H. & Rudduck, J. (1998). Learning together, working together. BP Educational. Crowston, K. G. (1991). Towards a Coordination Cookbook: Recipes for Multi-Agent Action. PhD thesis, Sloan
School of Management, MIT. Davydov, V. V. (1995). The influence of L.S. Vygotsky on education theory, research and practice. In
Educational Researcher, 24 (3), pp.12-21 De Croock, M. B. M., Paas, F. G. W. C., Schlanbusch, H., & Van Merriënboer, J. J. G. (2002). ADAPTIT: Tools
for training design and evaluation. In: Educational Technology, Research & Development, 50(4), pp.47-58.
Dillenbourg, P., Jermann, P., Schneider, D., Traum, D., Buiu, C. (1997). The Design of MOO Agents:
Implications from an Empirical CSCW Study. In proceedings of AIED (Artificial Intelligence in Education), Kobe Japan.
Dolonen, J. A. (2002). The Development of a Pedagogical Agent System for Computer Supported Collaborative
Learning, master thesis (hovedfagsoppgave), Institute of Information Science, University of Bergen. Dourish, P & Bellotti, V. (1992). Awareness and coordination in Shared Workspaces. Proceedings of CSCW’92.
ACM Press, pp. 107-114. Dragsnes, S. J., Chen, W., Baggetun, R. (2002). A Design approach for Agents in Distributed Work and
Learning Environments. Proc. of ICCE2002, Auckland, New Zealand. 3-6 Dec, p.60-65.

121
Eide, K. (forthcoming) Tittel, master thesis (hovedfagsoppgave), Institute of Information Science, University of Bergen.
Engeström, Y. (1990). Learning, working and imagining. Twelve studies in activity theory. Helsinki: Orienta-
konsultit. Erickson, T. & Kellogg W. A. (2000). Social Translucence: An Approach to Designing Systems That Support
Social Processes. In: ACM Transactions on Computer-Human Interaction, Vol. 7, No. 1, March 2000, Pages 59-83.
Etzioni, O. & Weld, D. S. (1995). Intelligent Agents on the Internet: Fact, Fiction, and Forecast. IEEE Expert
10 (4): Pages 44-49. Fischer, G., McCall, R. & Morch, A. (1989). Design Environments for Constructive and Argumentative Design.
Proceedings of Conference on Human Factors in Computing Systems (CHI'89), pp. 269-275. Fischer, G. (1994). Turning Breakdowns into Opportunities for Creativity. Knowledge-Based Systems, Special
Issue on "Creativity and Cognition", Butterworth-Heinemann, Vol. 7, No. 4, 1994, pp. 221-232. FitzGerald, P. & Lester, J. (1997). Knowledge-Based Learning Environments: A Vision for the 21st Century.In
Interactive Technologies and the Social Sciences. Emerging Issues and Applications, P. Martorella (Ed.), pp. 111-127, SUNY Press, New York.
Fitzpatrick, G. A. (1998). The Locales Framework: Understanding and Designing for Cooperative Work. Phd.
Thesis. Available at http://archive.dstc.edu.au/TU/wOrlds/Papers/ Frankfort-Nachmias, C., & Nachmias, D. (1996). Research Methods in the Social Sciences, London: Arnold. Franklin, S. & Graesser, A. (1996). Is it an Agent or just a Program ? A taxonomy for autonomous Agents. In
Proceeding of the Third International Workshop on Agent theories, Architectures, and Language. New York: Springer-Verlag.
Gibson, J. J. (1986). The Ecological Approach to Visual Perception. ISBN 0-89859-X, Lawrence Erlbaum
Associates, Inc., Hillsdale, NJ., originally published in 1979. Gilbert, D., Aparcicio, M., Atkinson, B., Brady, S., Ciccarino, J., Grosof, B., O´Connor, P., Osisek, D., Pritko,
S., Spagna, R., & Wilson, L. (1995). IBM Intelligent Agent Strategy, IBM Corporation. Glaser, B. and Strauss, A. (1967). The Discovery of grounded Theory. Aldine Publishing Co., Chicago. Goodyear, P. (1999). Educational technology, virtual learning environments and architectural practice.
Proceeding at the Conference on Instructional Design -Integrating Technology. Integrated and Holistic Perspectives on Learning, Instruction and Technology. University of Bergen, Norway.
Greenberg, S., & Roseman, M. (1998). Using a room metaphor to ease transitions in groupware. Research
Report 98/611/02, Department of Computer Science, University of Calgary, Canada. Grudin, J. (1994). Computer-supported cooperative work: A book of readings. Sam Mateo, CA, Morgan
Kaufmann Publishers Inc.

122
Guribye, F. & Wasson, B. (2002). The ethnography of distributed collaborative learning. In G. Stahl (Ed.) Proceedings of CSCL 2002, Computer Support for Collaborative Learning: Foundations for a CSCL Community, pp. 637–638, Lawrence Erlbaum.
Guribye, F., Andreassen, E. & Wasson, B. (2003) The organisation of interaction in distributed collaborative
learning. In proceesings of CSCL 2003, June 14-19, Bergen, Norway, published by Kluwer Academic Publishers, AA Dordrechtm, Netherlands. Pp. 385-394.
Gutwin, C., Stark, G. and Greenberg, S. (1995). Support for Workspace Awareness in Educational Groupware.
In Proceedings of the ACM Conference on Computer Supported Collaborative Learning 147-156. Hillsdale NJ: Lawrence Erlbaum Associates.
Hammersley, M. & Atkinson, P. (1995). Ethnography: Principles in Practice. ISBN:0415086647. TAYLOR &
FRANCIS BOOKS LTD. Hewett, T. T. (1986) The role of iterative evaluation in designing systems for usability. In: Harrison, M.D. &
Monk, A.F. (Eds.). People and Computers: Designing for Usability. Cambridge: Cambridge University Press; pp. 196-214.
Hmelo-Silver, C.E. (2002). Collaborative Ways of Knowing: Issues in Facilitation. Proceedings of CSCL 2002.
Horstamnn, C. S., & Cornell G. (2000) Core JavaTM Volume II – Advanced Features, ISBN 0-13-092738-6,
Prentice Hall PTR, NJ. Jonassen, D. et al. (1995) "Constructivism and Computer-Mediated Communication in Distance Education". In:
The American Journal of Distance Education. Vol. 9, No. 2. Johnson, W. L. and Shaw, E. (1997). Using Agents to Overcome Difficulties in Web-Based Courseware. AI-
ED'97 Workshop on Intelligent Educational Systems on the World Wide Web, August. Johnson, W. L & Rickel, J. (2000). Pedagogical agents on the Web. In: Proceedings of the third annual
conference on Autonomous Agents table of contents. Seattle, Washington, US. pp.283-290. Johnson, W. L., Rickel, J. W., & Lester, J. C. (2000). Animated Pedagogical Agents: Face-to-Face Interaction
in Interactive Learning Environments. International Journal of Artificial Intelligence in Education 11:47-78.
Johnsen, W. L. (2000), Pedagogical Agents, invited paper at the International Conference on Computers in
Education. Also to appear in the in the Italian AI Society Magazine. Jondahl, S. (2001). Simulering av pedagogiske agentar i eit virtuelt læremiljø ved bruk av Wizard of Oz
teknikken, master thesis (hovedfagsoppgave), Institute of Information Science, University of Bergen. Koschman, T (Ed.). (1996). CSCL: Theory and Practice of an Emerging Paradigm. NJ: Lawrence Erlbaum
Associates. Koschmann, T. (2002). Dewey's contribution to the foundations of CSCL research. Keynote at CSCL 2002,
Boulder, CO. In G. Stahl (Ed.), Computer support for collaborative learning: Foundations for a CSCL community (pp. 17-22). Mahwah, NJ: Lawrence Erlbaum Associates.

123
Larman, C. (2002). Applying UML and Patterns (An Introduction to Object-Oriented Analysis and Design and the Unified Process). ISBN 0-13-092569-1. Prentice Hall PTR, NJ, USA.
Laurillard, D. (1987). Computers and the Emancipation of Students - Giving Control to the learner. In:
Instructional Science, 16(1), 3-18. Lave, J. (1988). Cognition in Practice. Cambridge University Press. Lave, Jean. (1996). Teaching, as Learning in Practice in Mind. Culture and Activity, volume 3; No. 3. Leont’ev, A. N. (1978). Activity, Consciousness, Personality. Englewood Cliffs, NJ: Prentice Hall. Lester, J. C., Stone, B. A., & Stelling, G. D. (1999). Lifelike pedagogical agents for mixed-initiative problem
solving in constructivist learning environments. User Modeling and User-Adapted Interaction 9:1-44. Lester, J. C., Voerman, J. L.j Towns, S. G.j & Callaway, C. B. (1999). Deictic believability: Coordinating
gesture, locomotion, and speech in lifelike pedagogical agents. Applied Articial Intelligence 13:383-414. Lester, J. C., Zettlemoyer, L. S., Gregoire, J., & Bares, W. H. (1999). Explanatory lifelike avatars: Performing
user-designed tasks in 3d learning environments. In Proceedings of the Third International Conference on Autonomous Agents.
Lofland, J., & Lofland, L. H. (1995). Analyzing Social Settings -- A Guide to Qualitative Observation and
Analysis. ISBN 0-5342-4780-6, CA, Belmont, 3 rd ed., pp. 267. Lund K., Baker M. & Baron M. (1996). Modelling Dialogue and Beliefs as a Basis for Generating Guidance in
a CSCL Environment. Intelligent Tutoring Systems. Pages 206-214. Malone, T.W. And Crowston, K.G. (1994). Toward an interdiciplinary theory of coordination (Technical report
#120). Cambridg, MA: Massachusetts Institute of Technology, Center for Coordination Science. Mantovani (1996). New Communication Environments: From Everyday to Virtual. London: Taylor & Francis. Moran T. & Anderson R. (1990). The Workaday World as a Paradigm for CSCW Design. In proceedings of
CSCW `90, Los Angeles California, ACM press, 1990. Morgan, M. (1993). Creating Workforce Innovation: Turning Individual Creativity into Organizational
Innovation. ISBN: 1875680020. Publisher: Business and Professional Publishing. Muller, J. P.(1998). Architectures and applications of intelligent agents: A survey. The knowledge Engineering
Review, Vol. 13:4, 1998, 353-380. Printed in the United Kingdom. Cambridge University Press. Muukkonen, H., Hakkarainen K. & Leinonen T. (2000). Introduction to Fle2 Pedagogy, in UIAH Media Lab,
University of Art and Design, Helsinki, Finland. Nelson, J. (1999). Programming Mobile Objects with Java. ISBN: 0-471-25406-1. Published by John Wiley &
Sons, Inc. Norman, D.A. (1989). Cognitive artifacts. Paper presented at the: Kittle House Workshop on Psychological
Theory and User Interface Design, Chappaqua, NY., 19-22 June. To appear in an edited proceedings w/lume.

124
Norman, D.A. (1990). The design of everyday things. New York: Doubleday. Norman, D. A. (1995) Things that make us smart. Defending Huna, Attributes In Ghe Age Of The Machine. A
William Patrick Book. PERSUS BOOKS. Reading, Massachusetts. Norman, D. A. (1998). The Invisible Computer. The MIT Press, Cambridge, Massachusetts. Nwana H. S. (1996). "Software agents: An overview". From: Knowledge Engineering Review, Vol. 11, No 3, pp.
1-40, Spet. 1996, Cambridge University Press, 1996. Oaks, S. & Wong, H. (2000). JavaTM Threads, Second Edition, ISBN 1-56592-418-5, O’Reilly & Associates,
Inc. CA, US. Oestereich, B. (1999). Developing Software with UML: Object-Oriented Analysis and Design in Practice, ISBN
0-201-39826-5, Addison-Wesley, US. Osborn, A. (1948). Your Creative Power. Orginally in NY: Charles Scribner's Sons, 1948. Republished in 1991,
by publisher: Schaumburg, Illinois: Motorola University Press. Prakash, A., Shim, H.S. & Lee J.H. (1999). Issues and Tradeoffs in CSCW Systems. In: IEEE Transactions on
Data and Knowledge Engineering , Jan.-Feb. 1999, Vol. 11,Issue 1, pp. 213-227. Patton, M., Q. (1987). How to use Qualitative Methods in Evaluation. ISBN: 0803931298. Pedersen, R. (in prep.) Tittel, master thesis (hovedfagsoppgave), Institute of Information Science, University of
Bergen. Pettersen, Ø. (in prep.) Tittel, master thesis (hovedfagsoppgave), Institute of Information Science, University of
Bergen. Rittel, H., W., J. & Webber, M., M. (1973) Dilemmas in general theory of planning. Policy Sciences, 4:155-169. Rysjedal, K (2000). Usability Evaluation of a Groupware System. Hovedfagsoppgave, Dept. of Information
Science, University of Bergen. Salomon, G. (1992). What does the design of effective CSCL require and how do we study its effects? SIGCUE
Outlook, Special Issue on CSCL, 21(3), 62-68. Salomon, G. (1995). What does the design of effective CSCL require and how do we study its effects? CSCL’95
Conference, Indiana University, Bloomington, USA. Schaathun, A. (1996). Tankekart og andre spatiale læringsteknikker. Hovedfagsoppgave i psykologi, AVH,
Psykologisk Institutt. NTNU. Schmidt, K. & Bannon, L. (1992): Taking CSCW Seriously: Supporting Articulation Work, CSCW. Vol. 1, no. 1-
2, pp. 7-40. Segerstad, Y. H. & Ljungstrand, P. (2002). Instant messaging with WebWho. In: International Journal of Human-
Computer Studies (2002) 56, pp. 147-171.

125
Simon, A., H. (1960) The New Science of Management Decision. Harper & Row, NY. Shoham, Y. (1997). An overview of Agent-oriented Programming. In Software Agents, ed. J.M. Bradshaw.
Menlo Park, Calif.: AAAI Press. Stahl, G. (1999) WebGuide: Guiding collaborative learning on the Web with perspectives, Annual conference of
the American Educational Research Association (AERA '99), Montreal, Canada. Available at: http://www.cs.colorado.edu/~gerry/publications/conferences/1999/aera99/index.html. Stahl, G. (2002). Rediscovering CSCL. In T. Koschmann, R. Hall, & N. Miyake (Eds.), CSCL2: Carrying
Forward the Conversation, Lawrence Erlbaum Associates, Hillsdale, NJ. Available at: http://orgwis.gmd.de/~gerry/publications/journals/cscl2/cscl2.pdf
Stahl, G. (2002). Contributions to a theoretical framework for CSCL. In: Proceedings of Computer Supported
Collaborative Learning (CSCL 2002), Boulder, CO, pp. 62-71. Available at: http://orgwis.gmd.de/~gerry/publications/conferences/2002/cscl2002/cscl2002.pdf.
Stahl, G. (2002). Introduction: Foundations For A CSCL Community. In: Proceedings of Computer Supported
Collaborative Learning (CSCL 2002), Boulder, CO, pp. 1-2. Star, S. L. (1989) The structure of ill-structured solutions: Boundary objects and heterogeneous distributed
problem solving. In Les Gasser and Michael Huhns, editors, Distributed Artificial Intelligence, volume 2, chapter 2, pages 37–54. Pitman, London.
Star, S.L., & Griesemer J., R. (1989). "Institutional Ecology, 'Translations', and Boundary Objects: Amateurs
and Professionals in Berkeley's Museum of Vertebrate Zoology 1907-39", Social Studies of Science, Vol. 19.
Stefik, M., Bobrow, D. G., Tanning, S., & Tatar D. (1986), WYSIWIS REVISED: Early Experiences with Multi-
User Interfaces. Pages: 276-290, Austin, Texas: Proceedings of CSCW’86. Stefik, M., Foster, G., Bobrow, D. G., Kahn, K., Lanning, S., & Suchman L. (1988) Beyond the Chalkboard:
Computer Support for Collaboration and Problem Solving in Meetings, in I. Grief (ed.), Computer Supported Cooperative Work: A Book of Readings, Morgan Kaufman, pp. 335-366.
Strauss, A. (1985). Work and the Divition of Labour. In:The Sociological Quarterly, vol 26, no. 1-19. Strauss, A. (1987). Qualitative Analysis for Social Scientists. Cambridge University Press, Cambridge, 1987. Strauss, A. (1988) The Articulation of Project Work: An Organizational Process. The Sociological Quarterly,
vol. 29, no. 2. p. 162-178. Suchman, L. A. (1987). Plans and situated actions: the problem of human-machine communication, Cambridge
University Press, New York, NY. Vygotsky, L.S. (1978). Mind in Society. Cole, M., John-Steiner, V., Scribner, S., & Souberman, E. (Eds.).
Harvard University Press, Cambridge, MA Wake, C. W., (2002). Extreme Programming Explored, ISBN 0-201-73397-8, Addison-Wesley, NJ.
126
Wasson, B. (1997). Advanced educational technologies: The learning environment. Computers in Human Behaviour, 13(4), 571-594.
Wasson, B. (1998). Identifying Coordination Agents for Collaborative Telelearning, International Journal of
Artificial Intelligence in Education, 9, 275-299. Wasson, B. & Mørch, A. (2000). Identifying Collaboration Patterns in Collaborative tellearning Scenarios.
Educational Technology & Society, Vol. 3, No. 3. Wasson, B., Guribye, F. & Mørch, A. (2000). Project DoCTA. Skriftserie for FORSKNINGS- OG
KOMPETANSENETTVERK FOR IT I UTDANNING UNIVERSITETET I OSLO. Unipub forlag. Wasson, B. et al (2000). ITU – Program Application 2000-2003. Application describing the DoCTA NSS
research project submitted to ITU, Oslo, Norway. Wellmann, Barry. (1996). For a social network analysis of computer networks. A sociological Persepctive on
Collaborative Work and Virtual Community. SIGCPR/SIGMIS '96. Denver Colorado USA. 1996 ACM 0-89791-782-0/96/04
Wilson, P. (1991). Computer Supported Cooperative Work, Oxford, UK: Intellect Books, 1991. Winograd, T. & Flores, F. (1986). Understanding Computers and Cognition: A New Foundation for Design.
Ablex Publishing Corporation, Norwood, NJ, USA. Winograd, T. (1996). Bringing Design to Software. Stanford University and Interval Research Corporation with
John Bennett, Laura De Young, & Bradley Hartfield. ISBN: 0-201-85491-0. 310 pp. Addison-Wesley. Wooldridge, M. J. & Jennings, N. R. (1995). Agent Theories, Architecture, and Languages: A survey. In
Intelligent agents: ECAI-94 Workshop on Agent Theories, Architecture, and Language, eds. M. J. Wooldridge and N. R. Jennings, 1-39. Berlin: Springer-Verlag.
Zlotkin, G. (1995). Coordinating resource based dependencies. MIT Center for Coordination Science
Unpublished Working Paper. MIT, Cambridge, MA.

127
Appendixes
Appendix A ............................................................................................................................................... 128
Appendix B................................................................................................................................................ 131
Appendix C ............................................................................................................................................... 133
Appendix D ............................................................................................................................................... 134
Appendix E................................................................................................................................................ 138
Appendix F................................................................................................................................................ 139
Appendix G............................................................................................................................................... 145

128
Appendix A
Appendix A concerns the functional requirements of the Mindmap. It lists the early visions of
what tools and features the Mindmap should contain.
Diagram Elements:
• The Mindmap should offer diagram elements in the form of concepts, nodes and links
between them. The links define the relationship between the concepts/nodes.
• Relationships should be visualised by various symbols like fork, box or arrow.
• It should be possible to assign a name or identifier to all diagram elements. It should
also be possible to change colours and border-colours.
• Diagram elements should be defined with a certain distance between them, so that the
central conceot will not get entangeled into less important concepts.
• For nodes/concepts, they should follow a predefined colourscheme to ease readability
between levels in the mind map tree.
o Main Concept: Red
o First level concept: Orange
o Third level concept: Yellow
o Fourth level concept: Light Green
o Fith level concept: Dark Green
o Six level concept: Lighter Blue
o Rest: Dark Blue
Concept movement:
• Concepts cannot overlap each other. The distance between the concepts in the
map/diagram should be set to the distance between concepts of a certain level as
designated in the picture above.
• A concept has a private hot area around itself. This area can be convenient to notify
users when a node is moving or coming close to another node.

129
• The hot area should be invisible.
• If someone drops a concept over an existing concept, it should be considered an
illeagal move
• By moving an unattached concept within the hot area of another concept, a symbolic
link will appear to symbolise that dropping the node at this location will make the
moving node a child node of the node it is moving within.
• Child concepts cannot move father concepts.
• If moved, a father concept will move all children and grandchildren to the selected
position if possible.
• If move is not possible, concept will slide back to original position.
Information sharing:
• The Mindmap should enable information sharing through a shared workspace
implementing a relaxed “WhatYouSeeIsWhatISee” functionality.
• Information sharing from the private workspace should occur by exporting nodes to
the shared workspace.
• A split mode should be enabled so users can view both the private and shared
workspace simultaneously.
• Awareness mechanisms should be implemented to convey information about what the
other users do in the environment.
Concurrency control: To achieve concurrency control, I define states for the diagram elements in the mind map.
• Locked, a node has been right-clicked or double-clicked to bring up the pop-up menu
or one (or more) of the connected neighbouring nodes has been selected. When a node
is locked, the node cannot be selected.
• Selected, a node has been left-clicked. Selected nodes cannot be selected or locked by
other users. If the mouse button remains pressed, the user can drag the node. When the
user releases the mouse button, the node is released as well, and becomes available.
• Available, an available node is neither locked nor selected. Available nodes are ready
for operations and can be either locked or selected depending on events in the
environment.

130
Locked nodes can be manipulated by several uers simultaneously because the operations
allowed will not damage the integrity of the mind map in any way. Allowed actions are,
colour changes, label/name changes, edit description and create drawings among others. A
selected node cannot be manipulated by anyone, as it is in a state that could impar the
integrity of the mind map. Typical situations where a node would be selected are for moving
an element in the diagram. It is important that connected nodes become locked while the
concept in question is being moved to avoid breaking the link. A node is available when
nothing users are not manipulating it in any way and have been released.
Deleting concepts:
• Removal of concepts should be resolved through voting-mechanisms, where majority
rules.

131
Appendix B
Possible agent outputs:
Type ID Description
Idle 1 You have been idle for some time now. Maybe you should share some of your thoughts with your fellow
participants.
Idle 2 Please try to involve the idle user in the concept building process.
Share 3 I see you have some personal concepts in your private map that you have not added to the shared map.
Please add your contribution aswell and discuss your ideas with the rest of the group.
Share 4
You have not added any of your private concepts into the shared workspace. Please choose one of your
concepts and add it. It is important that everyone contributes in the building process and agrees about the
concepts in the map.
Discussion Agree 5 Participants seem to agree about the node:
Discussion Disagree 6 Participants seem to disagree about the node:
Discussion Dislike 7 Your team members do not like the node:
Discussion Like 8 Your team members like the node:
Intermediate Dislike 9 do not like the node:
Intermediate Disagree 10 disagrees about the node:
Intermediate Unsatisfied 11 are not satisfied with the node:
Intermediate Misunderstand 12 do not understand the node:
Intermediate Unclear 13 points thinks there are some unclear parts about the meaning of node:
Intermediate Relevance 14 questions the relevance of node:
Mood Encouragements
Explaining 15
Maybe you should write a description in the node. You can do that by right cliking inside the node and
choose 'edit description'.
Mood Encouragements
Explaining 16
Maybe you should create a drawing inside the node. You can do that by right-cliking the node and
choose 'create drawing'.
Mood Encouragements
Explaining 17
To explain the element further you can reference a URL-page, gving the element a broader context base.
You can do this by right-clicking the element and choose 'view/edit URL'.
Mood Encouragements
Explaining 18
To explain the element further you can associate an image with the element, please right-click the
element and choose 'associate picture'
Mood Encouragements
Explaining 19 I would like you to discuss and explain the meaning of the element in this context.
Mood Encouragements
Disagree and Relevance 20 I would like you all to discuss and consider wether this element is appropriate in this element.
Mood Encouragements
Disagree and Relevance 21 I would like to stress that it is very important that you all can reach an agreement.
Participate Add 22 added the node:
Participate Delete 23 requested to delete the node:
Participate Color 24 is changing the color of node:

132
Participate Name 25 is changing the name of node:
Participate Edit 26 is editing the description of node:
Participate Draw 27 is drawing inside node:
Participate Picture 28 is adding a picture in node:
Participate View 29 is viewing a picture associated with node:
Participate URL 30 is adding\viewing\editing an URL to node:
Participate Private 31 is working in private space:
Tip 32 You have to press the select toggle button in the toolbar to the left to select a node.
Tip 33 You have to press the trash-can toggle button to be able to delete a node. After pressing the button, select
the node you want to delete by left-clicking a diagram-element.
Tip 34 You can choose what connection shape to be the default representation of a link in the relationship
between two nodes. The default connetcion shape is set to Box. Click the button to change it.
Tip 35 Did you know that you can email the mindmap diagram back to yourself as an image? Just click the
email button or go into the file menu and choose email.
Tip 36
Did you know that you can save the state a the mindmap at any time, but you can only load one of the
saved map right after creating a new session. To save, either press the save button or go into the file
menu and choose save.
Overload Add 37 You have added more nodes then anyone else. Maybe you should encourage others to add some of their
ideas as well?
Overload Delete 38 You have tried to remove the same node more than three times, and you have been voted down all three
times by your team members. Please stop sabotaging the collaboration.
Underload Add> 39 Maybe you should add some of your ideas into the mind map and encourage others to discuss them?
Underload Encourage 40 Maybe you should encourage the more passive group members to post some of their ideas into the mind
map?
Balanced Participation 41 Keep up the good work, and maybe encourage some discussion in the chat if you like.
Warning Deletion 42
You should be careful about asking for deletion requests on nodes. Discuss whether you all would keep
the node or not before requesting the deletion. Too many reuquests might end with you being ignored by
the system.

133
Appendix C
A detailed class-diagram visualising how the agent-architecture is plugged into the server.

134
Appendix D
The generated chat log: Thu Nov 21 15:33:11 CET 2002 arne > Ordre: les oppgave teksten. Thu Nov 21 15:33:16 CET 2002 helge > ok Thu Nov 21 15:33:23 CET 2002 Ronny Jordalen > hola! Thu Nov 21 15:34:18 CET 2002 Rune > ok Thu Nov 21 15:38:27 CET 2002 arne > ferdig Thu Nov 21 15:38:45 CET 2002 arne > noen gode forslag? Thu Nov 21 15:38:45 CET 2002 helge > Siden vi skal ha eksamen i AI til mandag... kanskje vi skal lage ett eller annet AI-
system ? Thu Nov 21 15:38:56 CET 2002 arne > enig med helge Thu Nov 21 15:39:30 CET 2002 Ronny Jordalen > ok Thu Nov 21 15:39:37 CET 2002 arne > Her lukter det ekspert system lang vei... Thu Nov 21 15:40:25 CET 2002 helge > hehe... det var noe i den retningen jeg tenkte på. Synest ES er greit. Thu Nov 21 15:40:34 CET 2002 arne > kanskje vi skal lage et ekspertsystem som kan bistå med å gi karakter på en
muntlig eksamen i AI. Thu Nov 21 15:40:38 CET 2002 helge > Hva synest du rune? Thu Nov 21 15:40:42 CET 2002 Rune > ES i hvilket domene ? Thu Nov 21 15:41:10 CET 2002 arne > Jeg har kommet med et forslag. Thu Nov 21 15:41:15 CET 2002 helge > Reparere en bil... Thu Nov 21 15:41:38 CET 2002 Ronny Jordalen > reparere karakterer på muntlig eksamen, kanskje? Thu Nov 21 15:42:02 CET 2002 Ronny Jordalen > men kan vi ikke ta utgangspunkt i å reparere en bil? finne feil? vi har jo
eksempel fra tekstboken å jobbe ut i fra Thu Nov 21 15:42:14 CET 2002 arne > reparere en bil er kanskje enklere å sette seg inn i - ganske typisk ES eksempel. Thu Nov 21 15:42:22 CET 2002 Ronny Jordalen > enig Thu Nov 21 15:42:56 CET 2002 helge > OK, skal vi ta ekspertsystem, som skal reparere en bil. Alle enige? Thu Nov 21 15:42:57 CET 2002 Rune > Ok, men da mangler eg tekstboken, men det går nok bra. Thu Nov 21 15:43:14 CET 2002 arne > Forslår at systemet skal finne ut hva som kan være galt med bilen gjennom
goaldriven reasoning. Thu Nov 21 15:43:14 CET 2002 Ronny Jordalen > enig, helge Thu Nov 21 15:43:23 CET 2002 arne > enig Thu Nov 21 15:43:39 CET 2002 Rune > Ok Thu Nov 21 15:43:43 CET 2002 helge > Rune, du trenger ikke tekstboken, eksempelet er ganske enkelt. Thu Nov 21 15:43:45 CET 2002 arne > Tror alle mangler tekstboka Thu Nov 21 15:44:04 CET 2002 Rune > OK, forklar meg kort hva goaldriven reasoning er . Thu Nov 21 15:44:21 CET 2002 Rune > Så kan vi starte med den individuelle delen. Thu Nov 21 15:45:05 CET 2002 Rune > Ingen som kan pensum :-) Thu Nov 21 15:45:47 CET 2002 helge > Goaldriven er når du startet med et mulig mål. Så ser du på reglene du har. Så går
du oppover i treet og lager deg submål. Dersom ikke systemet selv greier å finne ut at submålet kan det spørre, f.eks. får forgasseren bensin...
Thu Nov 21 15:45:58 CET 2002 arne > Goaldriven reasoning går ut på at ES begynner med målet(for eks. motoren starter ikke) og resonerer seg frem til målet.
Thu Nov 21 15:46:41 CET 2002 arne > De fleste ES er goaldriven+ Thu Nov 21 15:46:43 CET 2002 Rune > OK, skjønner Thu Nov 21 15:46:54 CET 2002 helge > Er alle på privaten og lager sitt system nå eller ? Thu Nov 21 15:47:01 CET 2002 arne > nei Thu Nov 21 15:47:01 CET 2002 Ronny Jordalen > er her jeg Thu Nov 21 15:47:15 CET 2002 Rune > Begynner nå Thu Nov 21 15:47:22 CET 2002 Rune > .......på privaten Thu Nov 21 15:48:21 CET 2002 arne > jeg får ikke til å tegne... Thu Nov 21 15:48:36 CET 2002 arne > kan noen hjelpe Thu Nov 21 15:48:48 CET 2002 Rune > Tegne ? Thu Nov 21 15:48:59 CET 2002 Rune > Skal du ikke legge til noder ? Thu Nov 21 15:49:16 CET 2002 arne > modellerer Thu Nov 21 15:50:07 CET 2002 Ronny Jordalen > Enkleste er å bruke add-funksjonen... og så select (pila) sammen med
høgre museknapp Thu Nov 21 15:50:18 CET 2002 Ronny Jordalen > farger, tekst etc kan da endres Thu Nov 21 15:50:54 CET 2002 Ronny Jordalen > Hvis vi skal lage dette nodebasert.. Begynner vi med navnet på
ekspertsystemet og deler opp i ulike problemområder? Thu Nov 21 15:51:02 CET 2002 Ronny Jordalen > eller hvordan har dere tenkt? Thu Nov 21 15:51:27 CET 2002 Ronny Jordalen > og hvor spesifikk er vi: bare motor? Thu Nov 21 15:52:11 CET 2002 Rune > Ok, kanskje vi skal enige om abstraksjonsnivå. Thu Nov 21 15:52:19 CET 2002 helge > Jeg har begynt å modellere komponentene i expert systemet, hva må til for at
dette skal funke. Thu Nov 21 15:52:51 CET 2002 helge > Rune har helt sikkert et poeng der :) Thu Nov 21 15:52:58 CET 2002 Ronny Jordalen > Jeg tenker: "Motoren starter ikke" - "Hjulene går ikke rundt" -
"Vindusviskerne virker ikke" etc etc Thu Nov 21 15:53:30 CET 2002 Ronny Jordalen > Dette bør jo være relatert til feilsøking i bil, men bryr vi oss om annet
enn selve motoren? Det er kanskje det enkleste for dette eksempelet Thu Nov 21 15:53:51 CET 2002 helge > ronny. Det tenker jeg også på igrunnen, men begynte å modellere på et helt annet
abstraksjonsnivå, nemlig komponentene i systemet.

135
Thu Nov 21 15:56:00 CET 2002 Rune > Vi kan gjøre begge deler Thu Nov 21 15:56:49 CET 2002 Rune > Lage et hierarki med det mest abstrakte på top. Eller det abstrakte konseptet som
'superklasse' til mer konkrete komponenter. Thu Nov 21 15:57:37 CET 2002 Ronny Jordalen > Uhm... jeg tegna litt, og nå er det kommet en pil fra en boks til en
annen.. hvordan fjerner jeg den? Thu Nov 21 15:59:20 CET 2002 Rune > Klikk på søppelkassa i menyen Thu Nov 21 15:59:30 CET 2002 arne > trykk på søppelbøtta deretter på objektet du vil slette Thu Nov 21 15:59:52 CET 2002 arne > noen som får til å tegne flere enn en pil til et objekt. Thu Nov 21 16:00:34 CET 2002 helge > Jeg kan ikke se for meg de to abstraksjonsnivåene i ett og samme diagram.... Thu Nov 21 16:01:28 CET 2002 helge > ... men det kan vi jo diskutere etterhvert :) Thu Nov 21 16:02:17 CET 2002 arne > jeg har merket et objekt slik at det er lilla, hvordan fjerner jeg dette? Thu Nov 21 16:02:33 CET 2002 Rune > Høgreklikk ? Thu Nov 21 16:03:00 CET 2002 arne > takk Thu Nov 21 16:05:07 CET 2002 arne > jeg har et forslag. Vil noen se på det? Thu Nov 21 16:08:44 CET 2002 helge > går det an å lage kardinalitet på forbindelsene/linkene Thu Nov 21 16:09:46 CET 2002 helge > ? Thu Nov 21 16:12:31 CET 2002 Ronny Jordalen > kanskje viss du kan endre beskrivelsen på linken? Thu Nov 21 16:15:53 CET 2002 Rune > Skal vi sette en deadline på når vi skal være ferdig med den private delen ? Thu Nov 21 16:16:17 CET 2002 Rune > 1 min fra nå ? Thu Nov 21 16:16:36 CET 2002 arne > enig Thu Nov 21 16:17:48 CET 2002 Ronny Jordalen > oki, ferdig (DET er jo ei løgn!) Thu Nov 21 16:17:58 CET 2002 Ronny Jordalen > skal vi vise hva vi tenker? Thu Nov 21 16:18:10 CET 2002 Rune > ok Thu Nov 21 16:18:11 CET 2002 Ronny Jordalen > hvordan gjør vi det? Thu Nov 21 16:18:15 CET 2002 arne > Er dere klare: helge, rune? Thu Nov 21 16:18:21 CET 2002 Rune > Klar Thu Nov 21 16:18:29 CET 2002 Ronny Jordalen > vi begynner å tegne i shared map, riktig? Thu Nov 21 16:18:40 CET 2002 Rune > Vi må vel klikke på den i midten da. Thu Nov 21 16:18:43 CET 2002 helge > Jeg er klar, tror jeg har gjordt nok brainstorming. Thu Nov 21 16:19:31 CET 2002 arne > enig i at vi trenger et grensesnitt av den grafiske sorten? Thu Nov 21 16:19:49 CET 2002 Rune > Ja, vi må ha et GUI Thu Nov 21 16:19:53 CET 2002 arne > her er vi litt uenige ja... Thu Nov 21 16:19:55 CET 2002 helge > GUI må til Thu Nov 21 16:19:56 CET 2002 Ronny Jordalen > hehe Thu Nov 21 16:19:59 CET 2002 Ronny Jordalen > gui er jo fint Thu Nov 21 16:20:06 CET 2002 Ronny Jordalen > men må jo ha en motor i bunn :) Thu Nov 21 16:20:12 CET 2002 Ronny Jordalen > og denne starter ikke Thu Nov 21 16:20:18 CET 2002 arne > Tror vi skal satse på et litt mer abstrakt nivå enn - motoren virker ikke Thu Nov 21 16:20:28 CET 2002 helge > Da har vi begynt å moddellere komponentene på et ganske høyt abstraksjonsnivå Thu Nov 21 16:20:44 CET 2002 Rune > 'Motoren starter ikke' kan vi slette (kanskje vi trenger den senere) ? Thu Nov 21 16:20:50 CET 2002 arne > ta å så fjern den motoren Thu Nov 21 16:21:00 CET 2002 Ronny Jordalen > vil dere ikke ha den med?? Thu Nov 21 16:21:11 CET 2002 arne > uuuuttttt!!! Thu Nov 21 16:21:13 CET 2002 Rune > Nei Thu Nov 21 16:21:24 CET 2002 Ronny Jordalen > hva skal vi med et ekspertsystem som ikke tar seg av problemet? Thu Nov 21 16:21:33 CET 2002 helge > Motoren starter ikke vil vel bli en regel i "knowledge base" Thu Nov 21 16:21:54 CET 2002 arne > Da tar vi med knowledge base. Thu Nov 21 16:22:16 CET 2002 Ronny Jordalen > Oki, da endrer vi navn på "motoren starter ikke" til "knowledge base" Thu Nov 21 16:22:20 CET 2002 Ronny Jordalen > ? Thu Nov 21 16:22:25 CET 2002 Ronny Jordalen > eller gjør vi som arne gjorde? Thu Nov 21 16:23:36 CET 2002 arne > greit rune Thu Nov 21 16:23:43 CET 2002 Ronny Jordalen > agenten kommer jo med noen lure forslag etterhvert Thu Nov 21 16:23:47 CET 2002 helge > Skal bi ta motoren starter ikke som en subklasse til kunnsdapsdatabasen ? Thu Nov 21 16:24:30 CET 2002 Ronny Jordalen > bra helge Thu Nov 21 16:24:39 CET 2002 Rune > Høres mer riktig ut Thu Nov 21 16:24:40 CET 2002 helge > Eller jeg har egentlig den ideen om at vi tar en generell subklasse til
kunnskapsdatabasen som heter regler. Så blir det en til mangeforbindelse mellom kunnskapsdatabase og regler
Thu Nov 21 16:25:31 CET 2002 helge > :) jeg tror det er abstraksjonsnivået vi ikke er enig med Thu Nov 21 16:25:44 CET 2002 arne > helt enig Thu Nov 21 16:26:05 CET 2002 Rune > Det er nok det........ Thu Nov 21 16:26:11 CET 2002 arne > har noen et norsk navn for inference engine Thu Nov 21 16:26:23 CET 2002 Ronny Jordalen > slutnings-ett-eller-annet Thu Nov 21 16:26:34 CET 2002 Rune > Ja, skreiv noe i min privat........vent litt Thu Nov 21 16:26:50 CET 2002 Rune > Resonnerings-modul Thu Nov 21 16:26:51 CET 2002 arne > venter Thu Nov 21 16:27:02 CET 2002 Rune > ......hadde eg i min privat Thu Nov 21 16:27:12 CET 2002 helge > inference-engine - utledningsmaskin, slutningsmaskin? Thu Nov 21 16:27:41 CET 2002 arne > slutningsmaskin er ok Thu Nov 21 16:27:46 CET 2002 arne > enige Thu Nov 21 16:27:49 CET 2002 helge > Er ikke helt enig i betegnelsen på linkene her Thu Nov 21 16:27:50 CET 2002 arne > ? Thu Nov 21 16:27:54 CET 2002 Rune > Skal vi ta med de eksterne objektene til systemet også ?Thu Nov 21 16:28:14 CET
2002 Rune > Domene ekspert, bruker, kunnskapsingeniør osv. ? Thu Nov 21 16:28:24 CET 2002 Rune > Aktører blir vel det. Thu Nov 21 16:28:26 CET 2002 Ronny Jordalen > egentlig blir dette litt feil... ekspertsystemet er jo hele greiene, ikke

136
"midtpunktet" Thu Nov 21 16:28:55 CET 2002 arne > Enig med rune at vi kan ta med bruker- han har kontakt med GUIet Thu Nov 21 16:29:27 CET 2002 arne > er dere enig? Thu Nov 21 16:29:43 CET 2002 Ronny Jordalen > det er greitt... men jeg vil ha "problemområde" som navn på "expert
system" Thu Nov 21 16:29:53 CET 2002 Rune > Ja, ta med bruker og andre aktører. Dette kan gjøre modelllen klarere....eller ? Thu Nov 21 16:30:06 CET 2002 helge > ja.. Thu Nov 21 16:30:45 CET 2002 arne > domene ekspert er linket opp mot kunskapdb Thu Nov 21 16:30:45 CET 2002 helge > bra med bruker og domeneekspert Thu Nov 21 16:31:16 CET 2002 arne > kunskapsingeniør mot slutningsmaskin? Thu Nov 21 16:31:16 CET 2002 Rune > Trenger vi flere aktører ? Thu Nov 21 16:31:30 CET 2002 arne > Tror ikke det.. Thu Nov 21 16:31:31 CET 2002 Ronny Jordalen > programmerer evt Thu Nov 21 16:31:47 CET 2002 Rune > Ja, kI mot både kunnskapsDB og SM. Thu Nov 21 16:31:56 CET 2002 arne > kunskapsingenøren det:::::::: Thu Nov 21 16:32:01 CET 2002 helge > kunnskapsingeniøren står for hele greia... Thu Nov 21 16:32:15 CET 2002 arne > tja Thu Nov 21 16:32:34 CET 2002 Rune > Nei, det er godt mulig han bare står for å lage f.eks regler ut fra Dome eksperten. Thu Nov 21 16:32:41 CET 2002 helge > domeneeksperten skal vel også prøve å fortelle kunnskapsingeniøren noe Thu Nov 21 16:32:48 CET 2002 arne > domene eksperten er vel bare linket opp til kunskapsdatabasen? Thu Nov 21 16:33:41 CET 2002 Ronny Jordalen > jeg er fortsatt uenig i "expert system"... tegningen slik den står nå er litt
uklar for meg Thu Nov 21 16:33:55 CET 2002 Ronny Jordalen > hva legger dere inn der slik det står nå? Thu Nov 21 16:34:04 CET 2002 Rune > Domene eksperten er vel kanskje linket til systemet gjennom KI ? Thu Nov 21 16:34:26 CET 2002 arne > Jeg er litt uenig i plasseringen av kunnskapsingeniøren... Thu Nov 21 16:35:09 CET 2002 Ronny Jordalen > enig, arne Thu Nov 21 16:35:14 CET 2002 helge > Ok, arne. Det jeg tenkte på var at kunnskapsingeniøren har ansvaret for å
utarbeide hele systemet. Thu Nov 21 16:35:18 CET 2002 Ronny Jordalen > den bør kobles til domeneeksperten Thu Nov 21 16:35:28 CET 2002 Rune > Se på URL om ekspertsystem i Expert System. Thu Nov 21 16:37:30 CET 2002 Rune > Det virker som om vi hadde trengt en annen type linker her inne. En som ikke sa
noe om relasjonen. Thu Nov 21 16:37:55 CET 2002 Ronny Jordalen > helge, du overdriver litt når ki skal ha ansvaret for hele systemet.. det
kommer jo an på størrelse etc... men han er ansvarlig for å få domene-eksperten sin kunnskap inn i es, og dermed mener jeg han bør kobles til DE
Thu Nov 21 16:38:47 CET 2002 Rune > Enig med Ronny..........fant lignende figur på nettet akkurat nå. Der er KI og DE linket.
Thu Nov 21 16:38:54 CET 2002 helge > Ronny. Boken er ganske kjekk der..... kunnskapsingenøren gjør alt. (høres enkelt ut)
Thu Nov 21 16:39:23 CET 2002 helge > Det er jo ikke sikkkert det er riktig, de urlene dere har funnet. Thu Nov 21 16:39:24 CET 2002 arne new > Jeg er tilbake! Thu Nov 21 16:39:43 CET 2002 arne new > Holder meg til pensumboka vår jeg... Thu Nov 21 16:40:12 CET 2002 helge > Vi skal ikke gå ut på nettet og finne fasit. Noe av vitsen er vel at vi finner ut av noe
selv. Blir enige. Thu Nov 21 16:40:18 CET 2002 Ronny Jordalen > det er forsåvidt ikke poenget Thu Nov 21 16:40:25 CET 2002 Ronny Jordalen > men er vi enige om at KI og DE bør linkes? Thu Nov 21 16:40:46 CET 2002 Rune > JA Thu Nov 21 16:40:51 CET 2002 Ronny Jordalen > og at det er KI som kobles til KDB, og ikke DE? Thu Nov 21 16:40:52 CET 2002 helge > Tror vi har noe å diskutere når det gjelder modelleringen. Hva betyr hva... som jeg
så rune var inne på ovenfor Thu Nov 21 16:41:24 CET 2002 Rune > KI mot KDB, eller hva ? Thu Nov 21 16:41:31 CET 2002 arne new > jeg er enig ronny! Thu Nov 21 16:41:32 CET 2002 Ronny Jordalen > enig, rune Thu Nov 21 16:41:37 CET 2002 Rune > Enig Thu Nov 21 16:42:00 CET 2002 Ronny Jordalen > DE -> KI -> KDB? Thu Nov 21 16:42:07 CET 2002 Rune > Enig Thu Nov 21 16:42:10 CET 2002 helge > Hvem har valgt kunnskapsingeniøren ? Thu Nov 21 16:42:23 CET 2002 Ronny Jordalen > arne old? ;:) Thu Nov 21 16:42:35 CET 2002 helge > Gjør forandringene dere er enige om. det er greit ! :) Thu Nov 21 16:43:34 CET 2002 Ronny Jordalen > får det ikke til Thu Nov 21 16:44:01 CET 2002 Ronny Jordalen > klipp bort linken mellom DE og KDB noen Thu Nov 21 16:44:03 CET 2002 arne new > hvem har merket alle nodene slik at de ikke kan flyttes (høyreklikk please) Thu Nov 21 16:44:42 CET 2002 arne new > hvem har høyreklikket på
bruker??????????????????????????????????????+ Thu Nov 21 16:45:06 CET 2002 Ronny Jordalen > det er moi Thu Nov 21 16:45:24 CET 2002 Ronny Jordalen > ikke nå lenger Thu Nov 21 16:45:25 CET 2002 arne new > kan du åpne den igjen? Thu Nov 21 16:45:26 CET 2002 helge > Rune, kan du deselecte slutningsmaskinen Thu Nov 21 16:47:19 CET 2002 Ronny Jordalen > får noen til å klippe bort linker mellom bokser? Thu Nov 21 16:47:37 CET 2002 Rune > Nei Thu Nov 21 16:47:41 CET 2002 arne new > nei vi kan ikke slette. Thu Nov 21 16:47:47 CET 2002 Rune > Fikk det til i sted Thu Nov 21 16:48:02 CET 2002 Rune > Valgte trash can fra menyen Thu Nov 21 16:48:03 CET 2002 arne new > på privaten? Thu Nov 21 16:48:08 CET 2002 Ronny Jordalen > jeg også Thu Nov 21 16:48:12 CET 2002 Ronny Jordalen > forsøkte nettopp å slette alt
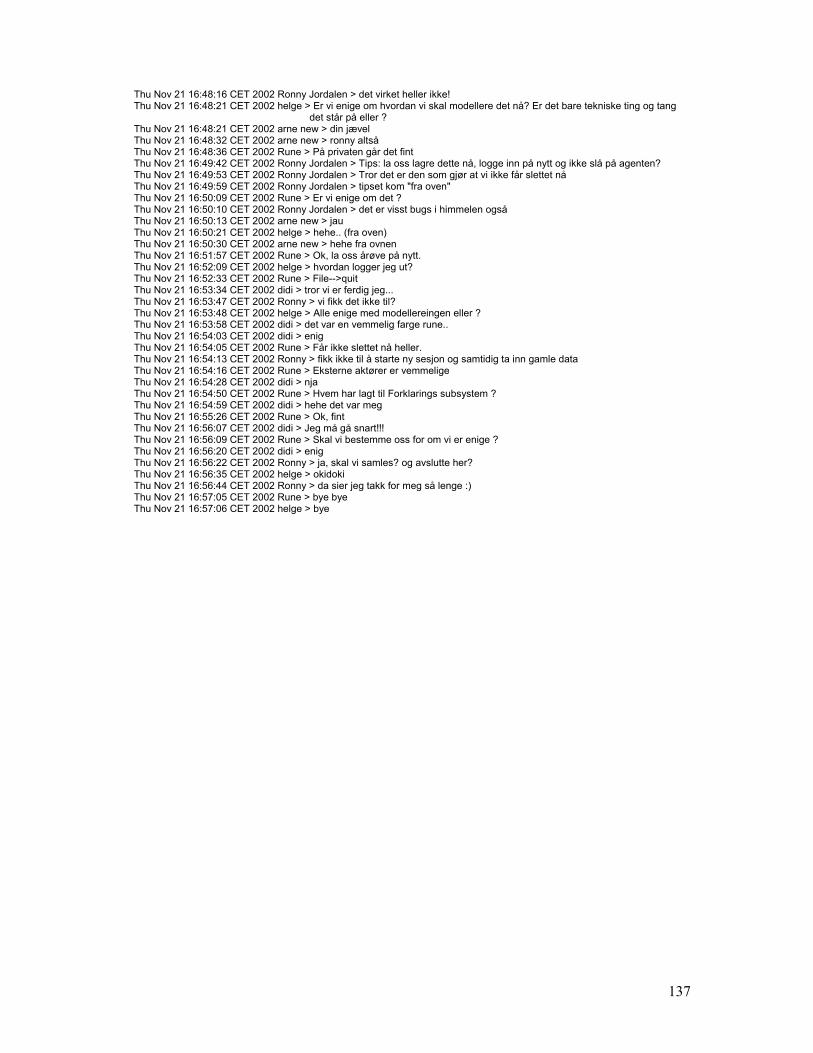
137
Thu Nov 21 16:48:16 CET 2002 Ronny Jordalen > det virket heller ikke! Thu Nov 21 16:48:21 CET 2002 helge > Er vi enige om hvordan vi skal modellere det nå? Er det bare tekniske ting og tang
det står på eller ? Thu Nov 21 16:48:21 CET 2002 arne new > din jævel Thu Nov 21 16:48:32 CET 2002 arne new > ronny altså Thu Nov 21 16:48:36 CET 2002 Rune > På privaten går det fint Thu Nov 21 16:49:42 CET 2002 Ronny Jordalen > Tips: la oss lagre dette nå, logge inn på nytt og ikke slå på agenten? Thu Nov 21 16:49:53 CET 2002 Ronny Jordalen > Tror det er den som gjør at vi ikke får slettet nå Thu Nov 21 16:49:59 CET 2002 Ronny Jordalen > tipset kom "fra oven" Thu Nov 21 16:50:09 CET 2002 Rune > Er vi enige om det ? Thu Nov 21 16:50:10 CET 2002 Ronny Jordalen > det er visst bugs i himmelen også Thu Nov 21 16:50:13 CET 2002 arne new > jau Thu Nov 21 16:50:21 CET 2002 helge > hehe.. (fra oven) Thu Nov 21 16:50:30 CET 2002 arne new > hehe fra ovnen Thu Nov 21 16:51:57 CET 2002 Rune > Ok, la oss årøve på nytt. Thu Nov 21 16:52:09 CET 2002 helge > hvordan logger jeg ut? Thu Nov 21 16:52:33 CET 2002 Rune > File-->quit Thu Nov 21 16:53:34 CET 2002 didi > tror vi er ferdig jeg... Thu Nov 21 16:53:47 CET 2002 Ronny > vi fikk det ikke til? Thu Nov 21 16:53:48 CET 2002 helge > Alle enige med modellereingen eller ? Thu Nov 21 16:53:58 CET 2002 didi > det var en vemmelig farge rune.. Thu Nov 21 16:54:03 CET 2002 didi > enig Thu Nov 21 16:54:05 CET 2002 Rune > Får ikke slettet nå heller. Thu Nov 21 16:54:13 CET 2002 Ronny > fikk ikke til å starte ny sesjon og samtidig ta inn gamle data Thu Nov 21 16:54:16 CET 2002 Rune > Eksterne aktører er vemmelige Thu Nov 21 16:54:28 CET 2002 didi > nja Thu Nov 21 16:54:50 CET 2002 Rune > Hvem har lagt til Forklarings subsystem ? Thu Nov 21 16:54:59 CET 2002 didi > hehe det var meg Thu Nov 21 16:55:26 CET 2002 Rune > Ok, fint Thu Nov 21 16:56:07 CET 2002 didi > Jeg må gå snart!!! Thu Nov 21 16:56:09 CET 2002 Rune > Skal vi bestemme oss for om vi er enige ? Thu Nov 21 16:56:20 CET 2002 didi > enig Thu Nov 21 16:56:22 CET 2002 Ronny > ja, skal vi samles? og avslutte her? Thu Nov 21 16:56:35 CET 2002 helge > okidoki Thu Nov 21 16:56:44 CET 2002 Ronny > da sier jeg takk for meg så lenge :) Thu Nov 21 16:57:05 CET 2002 Rune > bye bye Thu Nov 21 16:57:06 CET 2002 helge > bye

138
Appendix E
All packages in the framework, to give an overview: The complete API can be found at http://tordenskrall.intermedia.uib.no/jemue/index.html
Packages javaProjects.actions javaProjects.actions.er_actions javaProjects.actions.mindmap_actions javaProjects.actions.uml_actions javaProjects.agent javaProjects.agent.runningdb javaProjects.agent.runningmem javaProjects.chat javaProjects.diagrams javaProjects.diagrams.compbased javaProjects.diagrams.erdiagram javaProjects.diagrams.erdiagram.model javaProjects.diagrams.erdiagram.popupMenu javaProjects.diagrams.erdiagram.rules javaProjects.diagrams.mindmap javaProjects.diagrams.mindmap.model javaProjects.diagrams.mindmap.popupmenus javaProjects.diagrams.mindmap.popupmenus.dialogs javaProjects.diagrams.mindmap.rules javaProjects.diagrams.mindmap.rules.move javaProjects.diagrams.uml javaProjects.diagrams.uml.model javaProjects.diagrams.whiteboard javaProjects.email javaProjects.generaldiagramrules javaProjects.init javaProjects.lang javaProjects.lwguicomponents javaProjects.lwguicomponents.layout javaProjects.output javaProjects.output.actions javaProjects.output.actions.attitudes javaProjects.print javaProjects.server javaProjects.server.agent javaProjects.server.communication javaProjects.server.communication.erdiagram javaProjects.server.communication.mindmap javaProjects.server.communication.mutification javaProjects.server.session javaProjects.server.session.guiclasses javaProjects.server.session.guiclasses.absolute

139
Appendix F
All classes in the framework, to illustrate the workload of this project: AbsoluteAgentInfoPane
AbsoluteInvitePane
AbsoluteJoinSessionCenterPane
AbsoluteList
AbsoluteSessionControllers
AbsoluteSessionInfo
AbsoluteSessionList
AbstractAction
AbstractComponentClassdef
AbstractDiagram
AbstractDiagramContainer
AbstractDiagramElementAction
AbstractLink
AbstractMacroContainer
AbstractMicroContainer
Action
ActionAdd
ActionAddERElement
ActionAddERLink
ActionAddERSession
ActionAddMainConcept
ActionAddMindmapConcept
ActionAddUmlElement
ActionCircleView
ActionDeleteDiagramElement
ActionDeleteMindmapDiagramElement
ActionDeleteUmlDiagramElement
ActionHierarcyView
ActionLoadSession
ActionMoveDiagramElement
ActionMoveUmlElement
ActionNormalView
ActionPrintDiagram
ActionRemoveERElement
ActionSaveSession
ActionSelectDefaultMindmapLinkShape
ActionSelectERElement
ActionSelectMindmapElement
ActionSendEmail
ActionShowLinkNames
ActionShowMindmapLinkNames
ActionShowSavedSessions
ActionStartErMapping
ActionStartMindMapping
ActionStartUmlMapping
AddAgrument
AdditionalRulesHandler
AddNode
AddWhiteboardShape
AgentAlgorithms
AgentImagePanel
AgentOutput
AgentOutputMessages
AgentPanel
AgentPanelFromLeftToRight
AgentPopupDialog
AgentScenario
AgentStandardOutPanel
AgentSupportPanel
Agree
ApostelPanel
AreaDetectionRule
AssociateURL
AttitudeChat
AutoMovement
Awareness
AwarenessBar
AWTBoxedLayout
AWTPrint
AwtPropertyChangeSupport
AWTSizeRequirements
AWTSourceView
BooleanDecision
BooleanVote
BufferedByteArray
CardinalityPoint
CardinalityShapesSelected
ChangeColor
ChangeName
ChatServer
ChatServerHandler
ChatSessionServerHandler
ChosenSession
CircleNodePane
CirclePane
ClickableLink
CloseConnection
ColourRange

140
ComboBox
ComponentBorder
ComponentClass
ComponentDefsMinimized
ComponentDiagram
ComponentFields
ComponentHierarchyWrapper
ComponentMethods
ComponentNode
ComponentOrientation
Config
ConnectionArch
ConnectionArrowhead
ConnectionBox
ConnectionElement
ConnectionFork
ConnectionOval
ConnectionPoint
ConnectionRhomb
ConnectionShape
ConnectionShapeSelected
ConnectionTriangle
ContextDB
ContextualOutput
CopyFile
Countdown
CreateNewChatroom
DBAgentEngine
DecisionMakerDialog
DecliningRequest
DefaultConnectionShape
DefineMainConceptPanel
DeleteNode
DiagramElement
DiagramModel
DiagramModelImpl
DiagramModelListener
DiagramPopupMenu
DialogBox
DirectionalBorderLayout
Disagree
Dislike
DistributedErDiagramModel
DistributedMindmapDiagramModel
DistributedUmlModel
DoNotUnderstand
DrawPage
DummyLayout
DynamicPreviewPanel
EastPanel
EditAgentAdvices
EmailFrame
EmailInfo
EmailMessage
EndVotingSession
EntityConnectionRule
ERAttributes
ERBinaryConnection
ERDiagram
ERDiagramContainer
ERDiagramModel
ERDialog
ERNode
ERNodeConnection
ErPopupMenu
ERPopupsAndDowns
ErSessionHandler
ERToolbar
ERTools
EvaluateUserAction
ExecuteDeletionInfo
ExecutePopDown
ExecutePopUp
ExecutePopupsAndDowns
ExportedNode
ExtendedButton
Facilitator
FacilitatorListener
FileBrowserDialog
FindTopContainer
FlowPane
FormLayout
FormPanel
FrameInterface
FreeHand
GChatClient
GeneralAgentPanel
GeneralDialog
GeneralMessage
GetPopupOutput
GuiClassComponent
GuiClassComponentEvent
GuiClassComponentListener
GuiClassContainer
GuiComponentEvent
GuiHierarchyWrapper
GuiMethods
GuiUmlNodePane
HierarchyPane
HorizontalHierarchyPane

141
HotAreaRule
Icon
ImagePrint
Importance
InsetFrame
InsetsPane
InterfaceChooseSession
InterfaceLayoutManager2
InterfaceWhiteboardContainer
Intro
Introduction
InvertedBorderLayout
InvTest
Irrelevant
JoinChatroom
JoinSessionPanel
JPGAttachment
LightWeightButtons
LightWeightIconButton
LightWeightIconToggleButton
LightWeightToggleButtons
Like
LinkAdditionInfo
LinkHasExtendedInformation
LinkToBeDeselected
LinkToBeLocked
LinkToBeRemoved
LinkToBeSelected
LinkToBeUnlocked
LoadAllSessionsInfo
LoadSelectedSessionInfo
LoginPanel
LogOnMessage
Look
LWAbstractButton
LWConnectionButton
LWConnectionShapeButton
LWGeneralButton
LWLabel
LWRelationButton
LWRelationNamesButton
LWTabbedPane
LWTabCloser
MacroErContainer
MacroModel
MacroUmlContainer
MainCardPane
MainGuiFrame
MainMenuBar
ManatoryManyConnection
ManatoryOneConnection
Margins
MemAgent
MemAgent2
MemoryWatcher
Message
MessageBar
MessageBar
MessageBox
MessageComponent
MessageComponent
MessageEmbracer
MessageMappedToAction
MessageSortAlgorithm
MicroErContainer
MicroModel
MicroUmlContainer
MindmapApplet
MindmapClickableLink
MindmapContainer
MindmapDiagram
MindmapDiagramModel
MindmapDiagramModelInterface
MindmapImagePane
MindmapLayout
MindmapLayoutRule
MindmapNode
MindmapNodeConnection
MindmapNodeHierarchyConnectionRule
MindmapNodeTreeStructure
MindmapPopupMenu
MindmapPopupsAndDowns
MindmapSessionHandler
MindmapToolbar
MindmapTools
MLTest
ModifyColor
ModifyConnectionShape
ModifyDescription
ModifyDescription
ModifyDrawing
ModifyName
ModifyPicture
ModifyURL
Mood
MovedShadow
MoveNode
MoveNodeBackToStartPosition
MoveNodeEast
MoveNodeNorth

142
MoveNodeNorthEast
MoveNodeNorthWest
MoveNodes
MoveNodeSouth
MoveNodeSouthEast
MoveNodeSouthWest
MoveNodeWest
MovingNeighbourNodes
MovingNodes
MyExample
MyFrame2
NetworkNodeList
NetworkServerSocket
NewSessionCreated
NewSessionInfo
NewSessionPanel
NewTopicSuggestion
Node
NodeAddedToServerMap
NodeAdditionInfo
NodeConnection
NodeDeletionInfo
NodeDeselectionInfo
NodeHasExtendedInformation
NodeInfoMove
NodeLevelToBeChanged
NodeLockingInfo
NodeMovementInfo
NodePane
NodesConnectedServerUpdate
NodeSelectionInfo
NodeTable
NodeUnlockingInfo
NodeUpdate
NorthPanel
NorthPanelStep2
NorthPanelStep3
OpaquePanel
OptionalManyConnection
OptionalOneConnection
OutputInfo
OutputMessage
PartImage
Person
PFCmUnit
PFDocument
PFFrame
PFImage
PFInchUnit
PFLine
PFMacro
PFPage
PFPageFormat
PFPageSetupDialog
PFParagraph
PFPoint
PFPrintMindmapNodes
PFPrintObject
PFPrintPreview
PFRectangle
PFSize
PFUnit
PFVisualComponent
PopupExample
PreviewCard
PrintBox
PrintPanel
PropertyChangeEvent
PropertyChangeListener
RangedIndexMapping
ReadOutputMessage
RemoveDiagramElement
RemoveSelectedShadow
RequestPrivateMap
Revive
Rule
ScreenPlay
SelectedShadow
SendingPrivateMap
SerializedImage
Session
SessionChooser
SessionChooserDialog
SessionChooserPane
SessionChoosingComponent
SessionEmbracer
SessionHandler
SessionInfo
SessionSavedInfo
ShadowInfo
ShadowLinkRule
ShadowMoveInfo
ShadowNode
ShadowReleaseInfo
ShadowTable
SharingPersonalNodes
ShowRelationshipNames
SmartInteger
SmartObjectIDTracker
SmartPersonCounter

143
SolidPanel
SortTest
SouthGraphicButtonPanel
SpinFilter
SplitModeButton
SplitModeView
StartERExample
StartERSessionPanel
StartUmlExample
StoredOutputMessages
StoreOldOutputMessages
SubComponent
TeleViewButtons
Test
TestAction
TestCircularLayout
TestData
TestGuiUmlNodePane
TestLWGeneralButton
TestOutPut
TestTabbedPane
TestTheHierarchy
TextAreaPane
Toolbar
ToolBarListener
Tools
TopicChange
TopicDecision
TopicVote
TransferMindmapNode
TransparentPane
TreeLayout
TurnedBorderLayout
UmlDiagram
UmlDiagramContainer
UmlDialog
UmlModel
UmlNode
UmlToolbar
UmlTools
Unclear
Unsatisfied
UpdateAborted
UpdateAllClients
UpdateAutomovements
UpdateColor
UpdateDescription
UpdateDiagramElement
UpdateDiscussion
UpdateDrawing
UpdateLabel
UpdateLinkAdded
UpdateLinkOrientation
UpdateMindmapNodeSequenceHierarchy
UpdatePicture
UpdateShape
UpdateURLs
UpdateWhiteboardShape
UploadPicture
UserAction
UserPopupFeedback
Vote
Whisper
Whiteboard
WhiteboardContainer
WhiteboardDrawings
WhiteboardEnded
WhiteboardFilledOval
WhiteboardFilledRect
WhiteboardLine
WhiteboardModel
WhiteboardModelListener
WhiteboardObject
WhiteboardOval
WhiteboardPoint
WhiteboardRect
WhiteboardSessionStarted
WhiteboardShape
WhiteboardToggleButton
WhiteboardTools
WorkDiagram
XYpositions

144

145
Appendix G
The sourcode for the agent architecture, including only key classes such as: Importance: The class defining the categories for events and their initial
importance rating.
UserAction: An abstract super class for all actions. Included to illustrate how elegant polimorphism can be as the pools will work on the abstract UserAction, and will never know of what type it is.
ActionAdd: Subclass inheriting and implementing the UserAction class, included to exemplify how this is done.
SmartPersonCounter: Included to exemplify how information about objects can be tracked.
SmartObjectIDTracker: Included to exemplify how information about objects can be tracked.
OutputInfo: The object containing the smart objects for each category
ContextualOutput: One of the pools containing all possible outputs in the form of OutputInfo objects.
package javaProjects.output; /** * * @author Steinar Dragsnes * * This class maintains a mapping for all importance-levels any rule for output can have. */ public class Importance { /** * The event occuring is rated as EXTREMELY_HIGH, * containing corresponding values in the int[] array. */ public static final int[] REACTIVE = { 10, 10, 10 }; /** * The event occuring is rated as EXTREMELY_HIGH, * containing corresponding values in the int[] array. */ public static final int[] EXTREMELY_HIGH = { 10, 11, 12 };//10, 11, 12 /** * The event occuring is rated as VERY_HIGH, * containing corresponding values in the int[] array. */ public static final int[] VERY_HIGH = { 10, 11, 13 };//10, 11, 13 /** * The event occuring is rated as HIGH, * containing corresponding values in the int[] array. */ public static final int[] HIGH = { 10, 12, 13 };//10, 12, 13 /** * The event occuring is rated as NORMAL, * containing corresponding values in the int[] array. */ public static final int[] NORMAL = { 9, 12, 14 };//9, 12, 14 /** * The event occuring is rated as BELOW_NORMAL, * containing corresponding values in the int[] array. */ public static final int[] BELOW_NORMAL = { 9, 12, 15 };//9, 12, 15 /** * The event occuring is rated as LESS, * containing corresponding values in the int[] array. */ public static final int[] LESS = { 9, 13, 17 };//9, 13, 17 /** * The event occuring is rated as LOW, * containing corresponding values in the int[] array. */

146
public static final int[] LOW = { 9, 14, 9999 };//9, 14, 9999 /** * The event occuring is rated as VERY_LOW, * containing corresponding values in the int[] array. */ public static final int[] VERY_LOW = { 9, 15, 9999 };//9, 15 /** * The event occuring is rated as EXTREMELY_HIGH, * containing corresponding values in the int[] array. */ public static final int[] EXTREMELY_LOW = { 9, 25, 9999 };//9, 25 /** Creates a new instance of RankMapping */ public Importance() {} } /* * UserAction.java * * Created on 17. oktober 2002, 12:17 */ package javaProjects.output; import javaProjects.chat.Person; import java.util.*; /** * Copyright: Copyright (c) 2002 * @author Steinar Dragsnes * @version 1.0 * * This abstract class ensures that all classes extending this class will * implement the (abstract) methods declared below. These classes will be used * to give contextual informaiton to the agent. */ public abstract class UserAction { /** * Variable diagramElements is the datastructor of type Hashtable storing * all information on which element an action occurred. */ private Hashtable diagramElements = new Hashtable(); /** Variable occ of type int keeps track of number of occurances of an action.*/ private int occ = 0; /** Array initialRank contains object-persistant information about initial rank, output and popup. */ private int[] initialRank = null; /** Accessor method to register needed data: Object id and Person. */ public void registerObjectAndExecutor(Object id, Person p) { //System.out.println(this); if(diagramElements.containsKey(id)) { SmartObjectIDTracker soidt = (SmartObjectIDTracker)diagramElements.get(id); soidt.registerActionExecutor(p); soidt.registerObjectOccurance(); } else { SmartObjectIDTracker soidt = new SmartObjectIDTracker(id, p, initialRank); diagramElements.put(id, soidt); } registerActionOccurance(); } /** This method register the total number of occurances of the action. */ public void registerActionOccurance() { occ++; } /** This method returns the total number of times a certain action has occurred */ public int getActionOccurance() { return occ; } /** This method returns the value of property diagramElements */ public Hashtable getDiagramElements() { return diagramElements; } /**

147
* This method sets the value of the parameter currentRank to the * object's rate. Unimportant objects get low values while important * objects get high values. */ public void setInitializeRank(int[] rank) { initialRank = rank; } /** * This method returns the value of the parameter INITIAL_RANK. */ public int[] getInitialRank() { return initialRank; } } /* * AddNode.java * * Created on 17. oktober 2002, 12:21 */ package javaProjects.output.actions; import javaProjects.chat.Person; import javaProjects.output.*; import java.util.*; /** * Copyright: Copyright (c) 2002 * @author Steinar Dragsnes * @version 1.0 * * This class contain contextual information about the action AddNode. By gaining * access to various methods to its superclass, this class will provide contextual * information about events and actions to the agent. */ public class AddNode extends UserAction { public static AddNode getNewInstance() { return new AddNode(); } /**Hashtable containing the most frequent users.*/ private Hashtable frequentUserMap = new Hashtable(); /** Creates a new instance of AddNode */ private AddNode() { setInitializeRank(Importance.HIGH); } /** * Accessor method to register needed data: Object id and Person. * This is the exact logic of the method as given by the super class. * Becuase this action will behave differently for the various objects, * quite obviously since nodes can only be created once, we need to * overwrite the method in this subclass and expand the functionality. * * More specific, what has been done: * Store users that create nodes in another hashtable for instance.... * SmartPersonCounter on several levels. */ public void registerObjectAndExecutor(Object id, Person p) { super.registerObjectAndExecutor(id, p); updateFrequentUserMap(p); } /** * This method will keep track of the most frequent user by adding old and * new users to the Hashtable containing information about their frequence * of executing the add node action. */ public void updateFrequentUserMap(Person p) { if(frequentUserMap.containsKey(p.getPersonName())) { ((SmartPersonCounter)frequentUserMap.get(p.getPersonName())).registerOccurance(); } else { SmartPersonCounter spc= new SmartPersonCounter(p, super.getInitialRank()); frequentUserMap.put(p.getPersonName(), spc); } } /**

148
* This method returns a vector containing information about the most frequent * user to add a node and how many times this person has done this action. */ public SmartPersonCounter getMostFrequentAdder() { int highest = 0; SmartPersonCounter spc = null; Enumeration enum = frequentUserMap.elements(); while(enum.hasMoreElements()) { SmartPersonCounter temp = (SmartPersonCounter)enum.nextElement(); if(highest < temp.getOccurance()) { highest = temp.getOccurance(); spc = temp; } } return spc; } /** * This method returns a vector containing information about the most frequent * user to add a node and how many times this person has done this action. */ public int getTheNumberOfTimesASpecificPersonHasAddedNodes(SmartPersonCounter spc) { int added = 0; if(frequentUserMap.containsKey(spc.getPerson().getPersonName())) { SmartPersonCounter temp = (SmartPersonCounter)frequentUserMap.get(spc.getPerson().getPersonName()); added = temp.getOccurance(); } return added; } } /* * SmartPersonCounter.java * * Created on 17. oktober 2002, 12:57 */ package javaProjects.output; import javaProjects.chat.Person; /** * Copyright: Copyright (c) 2002 * @author Steinar Dragsnes * @version 1.0 * * This class is a smart class in the way that it registers metadata about * the object itself. By using this class together with other classes, * the agent can extract meaningful information about events happened in * the user interface. */ public class SmartPersonCounter { private Person p; private int occ = 0; private int currentRank = 0; private int[] initialRank = null; private int numberOfResets = 0; /** Creates a new instance of SmartPersonCounter */ public SmartPersonCounter(Person p, int[] initialRank) { this.p = p; registerOccurance(); this.initialRank = initialRank; resetCurrentRank(); } /** * This method reset the value of the current rank to it's predefiend * value given by the INITIAL_RANK array. */ public void resetCurrentRank() { currentRank = initialRank[0]; numberOfResets++; } /** * This method returns the value of the parameter currentRank. */ public int getCurrentRank() { return currentRank; }

149
/** * This method returns the adjustedCurrentRankForFeedback. * The parameter int index determines wether it is seeking for * a normal output or a disturbing popup feedback. */ public int getCurrentRankAdjustedForFeedback(int index) { return initialRank[index] - currentRank; } /** * This method registers how many times a person does a specific thing * in the user interface. */ public void registerOccurance() { occ++; currentRank++; } /** Returns the number of times a person has done something */ public int getOccurance() { return occ; } /** Returns the current person registered for an occurance */ public Person getPerson() { return p; } /** Returns the number of times a message has been reset */ public int getNumberOfResets() { return numberOfResets; } } /* * SmartObjectIDTracker.java * * Created on 19. oktober 2002, 17:34 */ package javaProjects.output; import javaProjects.chat.Person; import java.util.*; /** * Copyright: Copyright (c) 2002 * @author Steinar Dragsnes * @version 1.0 * * This class tracks the object ids for actions that will be stored * in the contextual memory base. Persons will also be stored, since * a person needs to be connected to an action. */ public class SmartObjectIDTracker { private Object id = null; private Hashtable actionExecutors = new Hashtable(); private int occ = 0; private int[] initialRank = null; /** Creates a new instance of SmartObjectIDTracker */ public SmartObjectIDTracker(Object id, Person p, int[] initialRank) { this.id = id; this.initialRank = initialRank; registerObjectOccurance(); registerActionExecutor(p); } /** This method register the person executing the AddNode action */ public void registerActionExecutor(Person p) { System.out.println("Registrating executor: "+p.getPersonName()); if(actionExecutors.containsKey(p.getPersonName())) ((SmartPersonCounter)actionExecutors.get(p.getPersonName())).registerOccurance(); else { SmartPersonCounter spc= new SmartPersonCounter(p, initialRank); actionExecutors.put(p.getPersonName(), spc); } } /** This method keeps track of how many times an action have occured on this object. */ public void registerObjectOccurance() { occ++; }

150
public int getObjectOccurance() { return occ; } /** * For each action recorded, the contextual information storage records what * kind of action that occured, on what diagram element this action occured * and by whom the action was triggered. To get any useful information out * of this information storage, we need to sort the information, staring at * the bottom with the persons trigging events on an object for a special * action. * * This method returns an array containing all persons who qualify for a * feedback, either standard output or in poup. The parameter index which is * sent into this method decides wether it is searching for output or popups. * * This array will be retunred to the object sorter, which sorts which diagram * elements qho qualify for feedback for the chosen action. */ public SmartPersonCounter[] getDiagramElementsSortByFrequency(int index) { Vector v = new Vector(); Enumeration enum = actionExecutors.elements(); while(enum.hasMoreElements()) { SmartPersonCounter spc = (SmartPersonCounter)enum.nextElement(); if(spc.getCurrentRankAdjustedForFeedback(index) <= 0) { v.addElement(spc); } } if(!v.isEmpty()) { //Creating the array with the correct size, with atleast size = 1. SmartPersonCounter[] spcs = new SmartPersonCounter[v.size()]; for(int i=0; i<v.size(); i++) { spcs[i] = (SmartPersonCounter)v.elementAt(i); } //Selection sort int min; SmartPersonCounter temp; for(int i=0; i<spcs.length-1; i++) { min = i; for(int scan=i+1; scan<spcs.length; scan++) { if(spcs[scan].getCurrentRankAdjustedForFeedback(index) < spcs[min].getCurrentRankAdjustedForFeedback(index)) min=scan; } //swap values temp = spcs[min]; spcs[min] = spcs[i]; spcs[i] = temp; } return spcs; } else return null; } /** * This method returns a SmartPersonCounter object for the person who qualify * the most for feedback. */ public SmartPersonCounter getPersonWhoShouldGetFeedback(int index) { SmartPersonCounter temp = null; int value = 1; Enumeration enum = actionExecutors.elements(); while(enum.hasMoreElements()) { SmartPersonCounter spc = (SmartPersonCounter)enum.nextElement(); if(value > spc.getCurrentRankAdjustedForFeedback(index)) { value = spc.getCurrentRankAdjustedForFeedback(index); temp = spc; } } if(value < 1) return temp; else return null; } /** This method returns the avarege action occurance for this action */ public int getAvaregeActionOccuranceAmongParticipatingPersons() { if(!actionExecutors.isEmpty()) { Enumeration enum = actionExecutors.elements(); float frequence=0; while(enum.hasMoreElements()) { frequence = frequence+((SmartPersonCounter)enum.nextElement()).getOccurance(); } float totalNumberOfParticipants = actionExecutors.size();

151
float avarage = frequence/totalNumberOfParticipants; return (int)avarage; } else return 0; } /** This method returns the most frequent user for this action */ public SmartPersonCounter getMostFrequentUserForThisAction() { Enumeration enum = actionExecutors.elements(); SmartPersonCounter frequentSPC = null; while(enum.hasMoreElements()) { SmartPersonCounter spc=(SmartPersonCounter)enum.nextElement(); if(frequentSPC != null) { if(frequentSPC.getOccurance() < spc.getOccurance()) frequentSPC = spc; } else frequentSPC = spc; } return frequentSPC; } /** This method returns the least frequent user for this action */ public SmartPersonCounter getLeastFrequentUserForThisAction(){ Enumeration enum = actionExecutors.elements(); SmartPersonCounter frequentSPC = null; while(enum.hasMoreElements()) { SmartPersonCounter spc=(SmartPersonCounter)enum.nextElement(); if(frequentSPC != null) { if(frequentSPC.getOccurance() > spc.getOccurance()) frequentSPC = spc; } else frequentSPC = spc; } return frequentSPC; } /** This method returns the SmartPersonCounter of a special person. */ public SmartPersonCounter getSpecificPerson(Person p) { if(actionExecutors.containsKey(p.getPersonName())) { return (SmartPersonCounter)actionExecutors.get(p.getPersonName()); } else return null; } /** This method returns the value of property actionExecutors */ public java.util.Hashtable getActionExecutors() { return actionExecutors; } /** This method sets a new value for the property actionExecutors */ public void setActionExecutors(java.util.Hashtable actionExecutors) { this.actionExecutors = actionExecutors; } /** Getter for property id. * @return Value of property id. */ public java.lang.Object getId() { return id; } /** Setter for property id. * @param id New value of property id. */ public void setId(java.lang.Object id) { this.id = id; } }

152
/* * OutputInfo.java * * Created on 23. oktober 2002, 15:55 */ package javaProjects.output; /** * * @author Steinar Dragsnes * Version 1.0 * * This class contain information about one candidate for output. */ public class OutputInfo implements java.io.Serializable { private UserAction userAction; private SmartObjectIDTracker soidt; private SmartPersonCounter spc; /** Creates a new instance of OutputInfo * Receiving parameters: * @param UserAction userAction * @param SmartObjectIDTracker soidt * @param SmartPersonCounter spc */ public OutputInfo(UserAction userAction, SmartObjectIDTracker soidt, SmartPersonCounter spc) { this.userAction = userAction; this.soidt = soidt; this.spc = spc; } /** Getter for property userAction. * @return Value of property userAction. */ public UserAction getUserAction() { return userAction; } /** Setter for property userAction. * @param userAction New value of property userAction. */ public void setUserAction(UserAction userAction) { this.userAction = userAction; } /** Getter for property soidt. * @return Value of property soidt. */ public SmartObjectIDTracker getSoidt() { return soidt; } /** Setter for property soidt. * @param soidt New value of property soidt. */ public void setSoidt(SmartObjectIDTracker soidt) { this.soidt = soidt; } /** Getter for property spc. * @return Value of property spc. */ public SmartPersonCounter getSpc() { return spc; } /** Setter for property spc. * @param spc New value of property spc. */ public void setSpc(SmartPersonCounter spc) { this.spc = spc; } }

153
/* * ContextualOutput.java * * Created on 17. oktober 2002, 11:56 */ package javaProjects.output; import javaProjects.chat.Person; import javaProjects.output.actions.*; import javaProjects.output.actions.attitudes.*; import javaProjects.diagrams.mindmap.model.*; import javaProjects.agent.runningmem.*; import java.util.*; /** * Copyright: Copyright (c) 2002 * @author Steinar Dragsnes * @version 1.0 * * This class stores all events happening for this session. Whenever something * happens in the user interface, this will trigger a request from the server * and the agent will take this request, extract information about who it comes * from and what the request is. Based on this information the agent will create * a corresponding action object and fill in the required contextual information * for later execution. */ public class ContextualOutput { private Hashtable actions = new Hashtable(); private UserAction currentUserAction = null; private Object currentObjectID = null; private Person currentPerson = null; private StoredOutputMessages contextHistory = null; /** * Constructor creates a new instance of ContextualOutput and * initialize all the neccessary actions that the agent context * will monitor. * */ public ContextualOutput() { AddNode addNode = AddNode.getNewInstance(); actions.put("addNode", addNode); AttitudeChat attitudeChat = AttitudeChat.getNewInstance(); actions.put("attitudeChat", attitudeChat); Agree agree = Agree.getNewInstance(); actions.put("agree", agree); Disagree disagree = Disagree.getNewInstance(); actions.put("disagree", disagree); Dislike dislike = Dislike.getNewInstance(); actions.put("dislike", dislike); DoNotUnderstand doNotUnderstand = DoNotUnderstand.getNewInstance(); actions.put("doNotUnderstand", doNotUnderstand); Irrelevant irrelevant = Irrelevant.getNewInstance(); actions.put("irrelevant", irrelevant); Like like = Like.getNewInstance(); actions.put("like", like); Unclear unclear = Unclear.getNewInstance(); actions.put("unclear", unclear); Unsatisfied unsatisfied = Unsatisfied.getNewInstance(); actions.put("unsatisfied", unsatisfied); DeleteNode deleteNode = DeleteNode.getNewInstance(); actions.put("deleteNode", deleteNode); ModifyColor modifyColor = ModifyColor.getNewInstance(); actions.put("modifyColor", modifyColor); ModifyConnectionShape modifyConnectionShape = ModifyConnectionShape.getNewInstance(); actions.put("modifyConnectionShape", modifyConnectionShape); ModifyDescription modifyDescription = ModifyDescription.getNewInstance(); actions.put("modifyDescription", modifyDescription); ModifyDrawing modifyDrawing = ModifyDrawing.getNewInstance(); actions.put("modifyDrawing", modifyDrawing); ModifyName modifyName = ModifyName.getNewInstance(); actions.put("modifyName", modifyName);

154
ModifyURL modifyURL = ModifyURL.getNewInstance(); actions.put("modifyURL", modifyURL); SharingPersonalNodes sharingPersonalNodes = SharingPersonalNodes.getNewInstance(); actions.put("sharingPersonalNodes", sharingPersonalNodes); TopicChange topicChange = TopicChange.getNewInstance(); actions.put("topicChange", topicChange); contextHistory = new StoredOutputMessages(); } /** * Parameter type: int; value index, specify wether this algorithm will be * searching for possible outputs or popups or not, where index value = 1 * equals a search for output, while index value = 2 specifies a search for * popups. * * The vector will containg information about: * UserAction * SmartObjectIDTracker * SmartPersonCounter * * This vector will be returned to the specific place the search was requested. * The agent will then decide wether the result qualify for an output or not. */ public OutputInfo getUserActionReadyForOutput(int index) { UserAction action = null; SmartObjectIDTracker soidt = null; SmartPersonCounter spc = null; Enumeration enum = actions.elements(); int counter = 10000; while(enum.hasMoreElements()) { UserAction ua = (UserAction)enum.nextElement(); //System.out.println("found action; "+ua); /*if(ua instanceof AddNode) { AddNode an = (AddNode)ua; SmartPersonCounter tspc = an.getMostFrequentAdder(); System.out.println("***Info about ContectualOutput object. Values found: ***"); System.out.println("Hva er action: "+an); System.out.println("Hva er person: "+tspc); System.out.println("----------------------------------------------------------"); double occ = tspc.getOccurance(); double out = tspc.getNumberOfResets(); if(out > 0) { if(occ > 6) { if(0 < counter) { counter = 0; action = an; soidt = null; spc = tspc; } } } else if((out/occ) > 6) { if(0 < counter) { counter = 0; action = an; soidt = null; spc = tspc; } } } else */if(!ua.getDiagramElements().isEmpty()) { Enumeration enum2 = ua.getDiagramElements().elements(); while(enum2.hasMoreElements()) { SmartObjectIDTracker sot = (SmartObjectIDTracker)enum2.nextElement(); Enumeration enum3 = sot.getActionExecutors().elements(); while(enum3.hasMoreElements()) { SmartPersonCounter temp = (SmartPersonCounter)enum3.nextElement(); //System.out.println("counter: "+counter); //System.out.println("temp: "+temp.getCurrentRankAdjustedForFeedback(index)); int test = temp.getCurrentRankAdjustedForFeedback(index); if(test < counter) { //System.out.println("reset"); counter = test; action = ua; soidt = sot; spc = temp; //System.out.println("***Info about ContectualOutput object. Values found: ***"); //System.out.println("Hva er action: "+action); //System.out.println("Hva er object: "+soidt); //System.out.println("Hva er person: "+spc);

155
//System.out.println("----------------------------------------------------------"); } } } } } if(action != null && spc != null) { OutputInfo outputInfo = new OutputInfo(action, soidt, spc); return outputInfo; } else return null; } /** Getter for property actions. * @return Value of property actions. * */ public java.util.Hashtable getActions() { return actions; } /** Setter for property actions. * @param actions New value of property actions. * */ public void setActions(java.util.Hashtable actions) { this.actions = actions; } /** * Method return parameter value for property contextualHistoty. * Infomration contained in object is used to validate current user * actions to prior triggered agent outputs. This is especially * useful for cases where the agent generates output. */ public StoredOutputMessages getContextualHistory() { return contextHistory; } }


![Uspomene na dra. Franja Liszta [Recollections of dr. Franz Liszt]](https://static.fdokumen.com/doc/165x107/63176dfce88f2a90c80127c4/uspomene-na-dra-franja-liszta-recollections-of-dr-franz-liszt.jpg)