A socio-technical study of water consumption and water conservation in Brazilian dwellings
402
A socio-technical study of water consumption and water conservation in Brazilian dwellings Daniel Richard Sant’Ana Oxford Institute for Sustainable Development School of the Built Environment Oxford Brookes University A thesis is submitted in partial fulfillment of the requirements for the award of Doctor of Philosophy Oxford January 2011
Transcript of A socio-technical study of water consumption and water conservation in Brazilian dwellings

A socio-technical study of water consumption
and water conservation in Brazilian dwellings
Daniel Richard Sant’Ana
Oxford Institute for Sustainable Development School of the Built Environment
Oxford Brookes University
A thesis is submitted in partial fulfillment of the requirements for the award of
Doctor of Philosophy
Oxford
January 2011

i
Abstract
This research arose from the need to reduce domestic water consumption in the Federal
District in a viable and cost-effective manner, so as to avoid water stress and promote
sustainable development through water demand management. The overall aim of this
research is to provide specific information regarding domestic water consumption in
order to adequately assess the feasibility of domestic water conservation measures for
Brazilian dwellings, with special attention to the different income ranges and dwelling
typologies in the Federal District. To address the hypothesis that variables such as
household income, dwelling typology and occupant behaviour affects the way water is
used, this research incorporated both quantitative and qualitative methodological
approaches to collect primary data on domestic water consumption in the Federal
District. Based on average values of primary data collected on public opinion,
awareness and acceptance of water conservation strategies, water end-use consumption
and dwelling characteristics; representative models were composed, and different
assessment techniques for the evaluation of water conservation measures were brought
together in order to identify feasible water conservation measures in terms of their
applicability, water savings and financial benefits for the different income ranges and
residential typologies of the Federal District. Findings from the study revealed that
variables of dwelling characteristics, income and occupant behaviour are directly related
and affect both indoor and outdoor water consumption patterns, and therefore, should be
considered for adequate water demand predictions, reuse system design dimensioning
and quantifying potential water-savings from conservation measures. It is also realised
that although water reuse systems are capable of promoting higher water savings than
water efficient strategies, water efficient strategies proved to be the most feasible water
conservation measures in terms of applicability and financial benefits, independent of
income level and dwelling typology.

ii
Acknowledgements
First of all, I would like to thank my director of studies Dr Rajat Gupta for his guidance,
kind advice and constant support throughout my research, which was determinant for
the accomplishment of the work presented in this thesis. It has been a real privilege and
an honour to have worked with him. My appreciation also goes to my supervisor
Professor Fergus Nicol, whose experience and constructive suggestions provided a firm
basis for the research. I would also like to express my most sincere gratitude to my co-
supervisor Dr Cláudia Amorim from the University of Brasília for her kind support and
for providing wonderful opportunities beyond the PhD for which I am truly grateful. I
have also been fortunate to have had the support and guidance from Professor Sue Roaf
in the initial stages of this work, whose words of wisdom have oriented the path of this
thesis.
Living between two countries can be difficult for a number of reasons, but it is also very
rewarding. My thanks also go to all my colleagues and friends I have made in these past
years in England and in Brazil. I would like to thank Maita Kessler and Harvey Brown
for some comforting thoughts of wisdom. I am also grateful to Stefan Preuss, Laura
Novo, Tim Jones, Nando Sigona, Andrew Inch and Martha, for some of unforgettable
moments in Oxford. I would also like to thank my closer friends from Brazil, to the
brothers, Túlio and Leandro Guimarães, Thiago Rigoletto and Nirceu Werneck; I
express my gratitude for their unconditional friendship throughout these years.
Last, but not least, I would like to express my eternal gratitude to my family, without
which I would not have come this far. I am incredibly grateful to my parents José and
Malú, my sister Tania and my wonderful niece Caroline for their constant support and
encouragement. But most of all, it is to my wife, Carol, who has been there for me at all
times; for her unconditional love, understanding and support for the pursuit of this goal.

iii
Table of Contents
1. Introduction ............................................................................................... 2
1.1 Background .......................................................................................................................... 2
1.2 Context of the research .................................................................................................... 3
1.3 Aim and objectives............................................................................................................. 5
1.4 Thesis structure .................................................................................................................. 6
1.4.1 Chapter 2: Domestic water consumption ........................................................ 6
1.4.2 Chapter 3: Domestic water conservation ......................................................... 6
1.4.3 Chapter 4: Methodology ......................................................................................... 6
1.4.4 Chapter 5: Baseline domestic water consumption ....................................... 7
1.4.5 Chapter 6: Evaluation of domestic water conservation measures ......... 7
1.4.6 Chapter 7: Conclusions and recommendations ............................................. 7
2. Domestic Water Consumption ............................................................. 9
2.1 Introduction ......................................................................................................................... 9
2.2 Water demand and supply ............................................................................................. 9
2.2.1 Global water outlook ................................................................................................ 9
2.2.2 Water in Brazil .......................................................................................................... 12
2.2.3 Water in the Federal District .............................................................................. 16
2.3 Variables of domestic water consumption ............................................................. 21
2.3.1 Cost of water ............................................................................................................. 21
2.3.2 Income ......................................................................................................................... 22
2.3.3 Household size.......................................................................................................... 23
2.3.4 Dwelling characteristics ....................................................................................... 24
2.3.5 Climate ......................................................................................................................... 25
2.3.6 Behaviour and perception ................................................................................... 26
2.3.6.1 Situational influences .................................................................................... 27
2.3.6.2 Unreasoned influences ................................................................................. 28
2.3.6.3 Reasoned influences ...................................................................................... 29
2.3.6.4 Awareness stimuli .......................................................................................... 29
2.4 Domestic water end-use consumption .................................................................... 30

iv
2.4.1 Building typology .................................................................................................... 35
2.4.2 Household income................................................................................................... 35
2.5 Water end-use frequencies and activities .............................................................. 38
2.5.1 Frequencies of water usage ................................................................................. 38
2.5.2 Water-consuming activities ................................................................................ 40
2.6 Conclusion ........................................................................................................................... 41
3. Domestic Water Conservation .......................................................... 44
3.1 Introduction ....................................................................................................................... 44
3.2 Water efficient strategies .............................................................................................. 44
3.2.1 Toilets .......................................................................................................................... 45
3.2.1.1 Waterless toilets.............................................................................................. 45
3.2.1.2 Low-flush toilets ............................................................................................. 46
3.2.1.3 Dual flush toilets ............................................................................................. 47
3.2.2 Water faucets ............................................................................................................ 48
3.2.2.1 Automatic faucets ........................................................................................... 48
3.2.2.2 Sensor faucets .................................................................................................. 49
3.2.3 Low-flow showerheads ......................................................................................... 50
3.2.4 Flow regulators ........................................................................................................ 51
3.2.5 High-efficiency washing machines ................................................................... 52
3.2.6 Pressure washers .................................................................................................... 54
3.2.7 Automatic shut-off nozzles .................................................................................. 55
3.2.8 Automatic irrigation systems ............................................................................. 56
3.2.9 Water leakage repair .............................................................................................. 57
3.3 Water reuse systems ....................................................................................................... 58
3.3.1 Rainwater harvesting systems ........................................................................... 62
3.3.1.1 Rainwater quality ........................................................................................... 63
3.3.1.2 System components and design ................................................................ 64
3.3.2 Grey water recycling systems ............................................................................. 70
3.3.2.1 Grey water quality .......................................................................................... 71
3.3.2.2 System components and design ................................................................ 71
3.3.3 Wastewater reclamation systems ..................................................................... 76

v
3.3.3.1 Wastewater quality ........................................................................................ 76
3.3.3.2 System components and design ................................................................ 76
3.4 Conclusion ........................................................................................................................... 78
4. Methodological Approach .................................................................. 81
4.1 Introduction ....................................................................................................................... 81
4.2 Case study site selection ................................................................................................ 85
4.2.1 Administrative region selection ........................................................................ 85
4.2.1.1 The Federal District ....................................................................................... 85
4.2.1.2 Geo-demographic indicators ...................................................................... 86
4.2.1.3 Socio-economic indicators .......................................................................... 88
4.2.1.4 Dwelling typology ........................................................................................... 91
4.2.1.5 Selected administrative regions................................................................ 93
4.3 Primary data collection .................................................................................................. 95
4.3.1 Questionnaire survey ............................................................................................. 95
4.3.2 Domestic water auditing ...................................................................................... 96
4.4 Primary data analysis ..................................................................................................... 99
4.4.1 Baseline water consumption .............................................................................. 99
4.4.2 Statistical analysis ................................................................................................ 101
4.4.2.1 Drivers of domestic water consumption function .............................. 102
4.4.2.2 Price of water ................................................................................................ 103
4.4.2.3 Household income ....................................................................................... 104
4.4.2.4 Household size .............................................................................................. 105
4.4.2.5 Dwelling Characteristics ........................................................................... 105
4.4.2.6 Climate ............................................................................................................. 107
4.5 Evaluation of water conservation measures ...................................................... 108
4.5.1 Domestic water reductions .............................................................................. 108
4.5.1.1 Water efficient fittings, fixtures and appliances .............................. 109
4.5.1.2 Rainwater harvesting systems ............................................................... 110
4.5.1.3 Greywater recycling systems .................................................................. 111
4.5.1.4 Wastewater reclamation systems ......................................................... 112
4.5.1.5 Water reduction index ............................................................................... 113

vi
4.5.1.6 Water consumption scenarios ................................................................ 113
4.5.2 Applicability ........................................................................................................... 113
4.5.3 Cost-benefit analyses .......................................................................................... 114
4.5.3.1 Simple payback period .............................................................................. 114
4.5.3.2 Life cycle cost-benefit analysis ............................................................... 115
4.5.3.3 Average incremental cost-benefit analysis ........................................ 118
4.6 Conclusion ........................................................................................................................ 119
5. Domestic Water Baseline Consumption ...................................... 124
5.1 Introduction .................................................................................................................... 124
5.2 Primary data collection ............................................................................................... 124
5.3 Dwelling characteristics ............................................................................................. 125
5.3.1 Income ...................................................................................................................... 125
5.3.2 Household size....................................................................................................... 127
5.3.3 Tenure ....................................................................................................................... 127
5.3.4 Residential typology and amenity characteristics................................... 128
5.3.4.1 Lago Norte and Lago Sul: High income dwellings ........................... 128
5.3.4.2 Brasília and Águas Claras: Mid-high income dwellings ................ 129
5.3.4.3 Taguatinga and Candangolândia: Mid-low income dwellings .... 131
5.3.4.4 Ceilândia and Samambaia: Low income dwellings ......................... 131
5.3.5 Water fixtures and appliances in the home ............................................... 132
5.3.5.1 Bathroom fixtures ....................................................................................... 133
5.3.5.2 Kitchen fixtures and appliances ............................................................. 134
5.3.5.3 Utility fixtures and appliances ................................................................ 134
5.3.5.4 External taps .................................................................................................. 134
5.4 Domestic water consumption .................................................................................. 135
5.4.1 Annual water consumption .............................................................................. 135
5.4.2 Monthly water consumption ............................................................................ 136
5.4.3 Weekly water consumption ............................................................................. 138
5.4.4 Daily water consumption .................................................................................. 139
5.4.4.1 Water consumption per dwelling .......................................................... 139

vii
5.4.4.2 Water consumption per capita ............................................................... 140
5.4.5 End-use consumption ......................................................................................... 142
5.4.5.1 Indoor water consumption ...................................................................... 143
5.4.5.2 Outdoor water consumption ................................................................... 145
5.5 Water end-use frequencies and activities ........................................................... 148
5.5.1 Frequencies of water usage .............................................................................. 148
5.5.2 Water-consuming activities ............................................................................. 150
5.5.2.1 Dish washing ................................................................................................. 150
5.5.2.2 Clothes washing ........................................................................................... 151
5.5.2.3 Vehicle washing ............................................................................................ 151
5.5.2.4 Floor washing ................................................................................................ 152
5.5.2.5 Garden irrigation ......................................................................................... 152
5.5.2.6 Water reuse .................................................................................................... 153
5.6 Water-saving attitudes in the home ...................................................................... 155
5.7 Statistical evidence of water consumption ......................................................... 158
5.8 Conclusion ........................................................................................................................ 166
6. Evaluation of Domestic Water Conservation Measures ......... 169
6.1 Introduction .................................................................................................................... 169
6.2 Public Opinion, Awareness and Acceptance ....................................................... 169
6.2.1 Mains Water Metering and Tariff ................................................................... 169
6.2.2 Monthly Water Bill ............................................................................................... 170
6.2.3 Efficient Water Fittings, Fixtures and Appliances ................................... 174
6.2.4 Water Reuse Systems .......................................................................................... 176
6.2.4.1 Rainwater Harvesting Systems .............................................................. 176
6.2.4.2 Greywater Reuse Systems ........................................................................ 178
6.2.4.3 Wastewater Reuse Systems ..................................................................... 179
6.2.5 Dwelling Retrofit and Willingness-to-Pay .................................................. 180
6.2.6 Water Conservation Principals ....................................................................... 183
6.3 Domestic Water Efficiency ........................................................................................ 184
6.3.1 Building Adaptation............................................................................................. 184
6.3.2 Domestic Water Reductions ............................................................................. 185

viii
6.3.3 Cost-Benefit Analyses ......................................................................................... 196
6.4 Rainwater Harvesting Systems ................................................................................ 208
6.4.1 Building Adaptation............................................................................................. 209
6.4.2 Domestic Water Reductions ............................................................................. 211
6.4.3 Cost-Benefit Analyses ......................................................................................... 217
6.5 Greywater Recycling Systems .................................................................................. 229
6.5.1 Building Adaptation............................................................................................. 229
6.5.2 Domestic Water Reductions ............................................................................. 233
6.5.3 Cost-Benefit Analyses ......................................................................................... 238
6.6 Wastewater Reclamation Systems ......................................................................... 244
6.6.1 Building Adaptation............................................................................................. 244
6.6.2 Domestic Water Reductions ............................................................................. 245
6.6.3 Cost-Benefit Analyses ......................................................................................... 246
6.7 Summary and Conclusions ........................................................................................ 251
7. Conclusions and Recommendations ............................................. 255
7.1 Introduction .................................................................................................................... 255
7.2 Domestic water consumption .................................................................................. 255
7.3 Evaluation of domestic water conservation measures .................................. 258
7.4 Contribution to knowledge ....................................................................................... 262
7.5 Limitations of the study .............................................................................................. 264
7.6 Scope for further research ......................................................................................... 265
7.7 Implications of the findings ....................................................................................... 266
References 268
Appendices 280
Appendix A: House Survey Questionnaire 281
Appendix B: Flat Survey Questionnaire 286
Appendix C: House Water Audit Questionnaire 291
Appendix D: Flat Water Audit Questionnaire 297
Appendix E: Residential Building Block Survey 301
Appendix G: Diary-Tracking Cards 305
Appendix G: Diary-Tracking Summary Card 307

ix
Appendix H: Water Audit Inventory Form 309
Appendix I: Capital Costs of Automatic Irrigation System 313
Appendix J: Performance of Rainwater Harvesting Systems for High Income Dwellings 315
Appendix K: Performance of Rainwater Harvesting Systems for Mid-High Income Dwellings 321
Appendix L: Performance of Rainwater Harvesting Systems for Mid-Low Income Dwellings 327
Appendix M: Performance of Rainwater Harvesting Systems for Low Income Dwellings 333
Appendix N: Costs of Rainwater Harvesting Systems 338
Appendix O: Costs of Greywater Recycling Systems 363
Appendix P: Costs of Wastewater Reclamation Systems 377

i
List of Figures
Figure 2.1 Per capita domestic water consumption projections for 2025. .................... 10
Figure 2.2 Change in water stress from 1995 to 2025 under a business as usual
scenario. .......................................................................................................................... 11
Figure 2.3 Brazil’s twelve hydrographic regions. .......................................................... 13
Figure 2.4 Population density (a) and surface water discharge rate (b) by hydrographic
regions in Brazil. ............................................................................................................. 14
Figure 2.5 Water availability per capita by hydrographic region. ................................ 14
Figure 2.6 Distribution of water demands in Brazil. ..................................................... 15
Figure 2.7 Hydrological sub-basins of the Federal District. ......................................... 17
Figure 2.8 Water supply systems of the Federal District. .............................................. 17
Figure 2.9 Deep wells used for ground water extraction in the Federal District. ......... 18
Figure 2.10 Projections of population growth for the Federal District. ........................ 19
Figure 2.11 Historical water consumption per capita in the Federal District. ............. 20
Figure 2.12 Average domestic water end-use consumption results of previous research.
......................................................................................................................................... 34
Figure 2.13 Per capita water consumption and social groups in the United Kingdom . 36
Figure 2.14 Monthly water consumption per income range in China ........................... 36
Figure 2.15 Average monthly water consumption by dwelling type and income range in
Australia .......................................................................................................................... 37
Figure 3.1 Tankless high-pressure flush valve toilet. ..................................................... 46
Figure 3.2 Dual flushing mechanisms for tank-style toilets (a) and tankless toilets (b) 47
Figure 3.3 Automatic bathroom faucet ........................................................................... 48
Figure 3.4 Sensor faucet operation ................................................................................ 49
Figure 3.5 Low-flow showerhead ................................................................................... 50
Figure 3.6 Wall-mounted (a) and terminally-fitted (b) flow regulators ......................... 51
Figure 3.7 Operating design and relative water levels of top-load, vertical-axis washing
machines (a) and front-load, horizontal-axis washing machines (b). ............................ 52
Figure 3.8 Washing machine with programmed settings to facilitate grey water reuse 53
Figure 3.9 Domestic pressure washer ............................................................................ 54
Figure 3.10 Automatic shut-off nozzle with multiple spray patterns .............................. 55
Figure 3.11 Automatic flow control device (a) and soil moisture sensor (b) ................. 57

ii
Figure 3.12 Conceptual flow diagram of water reuse system composition ................... 60
Figure 3.13 Potable and non-potable water header tank configuration ........................ 62
Figure 3.14 Generic composition of a rainwater harvesting system ............................. 65
Figure 3.15 Example of downpipe (a), subsurface (b) and floating (c) rainwater filters
......................................................................................................................................... 66
Figure 3.16 Gravity-fed grey water diversion system for sub-surface irrigation. ......... 73
Figure 3.17 Detailed cross-section of irrigation trench for sub-surface irrigation ....... 73
Figure 3.18 Generic composition of a GRW system....................................................... 74
Figure 3.19 Grey water reuse toilet and lavatory appliance unit .................................. 75
Figure 3.20 Small-scale treatment unit for wastewater reclamation ............................. 77
Figure 4.1 Flow diagram of the methodological approach ........................................... 84
Figure 4.2 Administrative Regions of the Federal District. ........................................... 86
Figure 4.3 Average domestic water consumption per capita (litres/person/day) .......... 88
Figure 4.4 Average dwelling monthly income in minimum wages ................................. 90
Figure 4.5 Relationship between income and water consumption ................................. 90
Figure 4.6 Relationship between built area and income ................................................ 92
Figure 4.7 Relationship between built area and water consumption ............................. 93
Figure 5.1 Income ranges of dwellings ........................................................................ 125
Figure 5.2 Dwelling income range per administrative regions. .................................. 126
Figure 5.3 Tenure of dwelling property by income group............................................ 128
Figure 5.4 Aerial view of high income houses in Lago Sul. ......................................... 129
Figure 5.5 Aerial view of mid-high income residential buildings in Brasília. ............. 130
Figure 5.6 Mid-high income residential buildings in Águas Claras. ........................... 130
Figure 5.7 Aerial view of mid-low income houses in Taguatinga ................................ 131
Figure 5.8 Aerial view of low income houses in Samambaia ....................................... 132
Figure 5.9 Average annual water consumption per dwelling ...................................... 135
Figure 5.10 Average monthly water consumption and precipitation ........................... 136
Figure 5.11 Average monthly water consumption and relative humidity .................... 137
Figure 5.12 Average monthly water consumption per income range .......................... 137
Figure 5.13 Average weekly water consumption patterns............................................ 138
Figure 5.14 Average weekly water consumption patterns per income range .............. 139
Figure 5.15 Scatter diagram of average daily water consumption per dwelling ......... 140
Figure 5.16 Scatter diagram of average daily water consumption per capita ............. 141
Figure 5.17 Average daily water consumption per capita by income range................ 141

iii
Figure 5.18 Average domestic water end-use consumption pattern at its simplest form
....................................................................................................................................... 142
Figure 6.1 Average dwelling monthly water bill per income group............................. 170
Figure 6.2 Resident’s opinion on the costs of mains water .......................................... 171
Figure 6.3 Incentive for water consumption reductions through progressive tariff .... 172
Figure 6.4 Resident’s opinion for charging an extra tariff for dwellings with
consumption above average .......................................................................................... 172
Figure 6.5 Residents’ opinion for providing discounts for dwellings with consumption
below average. .............................................................................................................. 173
Figure 6.6 Public opinion on additional water tariff destined towards investments on
water conservation practices and policies .................................................................... 174
Figure 6.7 Water efficient fittings fixtures or appliances within dwellings ................. 174
Figure 6.8 Public awareness of the existence of water efficient equipment ................. 175
Figure 6.9 Public acceptance over the use of water efficient equipment in the dwelling
....................................................................................................................................... 176
Figure 6.10 Public awareness of domestic rainwater harvesting systems ................... 177
Figure 6.11 Level of acceptance over the reuse of rainwater at home. ....................... 177
Figure 6.12 Public awareness of domestic greywater recycling systems ................... 178
Figure 6.13 Level of acceptance over the reuse of treated greywater at home............ 179
Figure 6.14 Public awareness of domestic wastewater reuse systems ......................... 179
Figure 6.15 Level of acceptance over the reuse of treated wastewater at home......... 180
Figure 6.16 Residents willing to adapt their home for water conservation ................. 181
Figure 6.17 Level of monthly investment for dwelling retrofit ..................................... 181
Figure 6.18 Duration of monthly investment for dwelling retrofit ............................... 182
Figure 6.19 Expected payback period of investments on dwelling retrofit .................. 183
Figure 6.20 Level of concern over the future of water resources ................................ 183
Figure 6.21 Level of importance to conserve water on a daily basis ........................... 184
Figure 6.22 Domestic water reductions per water efficient strategies for high income
dwellings ....................................................................................................................... 186
Figure 6.23 Domestic water reductions per water efficient strategies for mid-high
income dwellings ........................................................................................................... 187
Figure 6.24 Domestic water reductions per water efficient strategies for mid-low
income dwellings ........................................................................................................... 188

iv
Figure 6.25 Domestic water reductions per water efficient strategies for low income
dwellings ....................................................................................................................... 189
Figure 6.26 Life cycle cost benefit analysis of feasible water efficient strategies for high
income dwellings ........................................................................................................... 198
Figure 6.27 Life cycle cost benefit analysis of feasible water efficient strategies for mid-
high income dwellings ................................................................................................... 199
Figure 6.28 Life cycle cost benefit analysis of feasible water efficient strategies for mid-
low income dwellings .................................................................................................... 199
Figure 6.29 Life cycle cost benefit analysis of feasible water efficient strategies for low
income dwellings ........................................................................................................... 200
Figure 6.30 Average incremental cost benefit analysis of feasible water efficient
strategies for high income dwellings ............................................................................ 201
Figure 6.31 Average incremental cost benefit analysis of feasible water efficient
strategies for mid-high income dwellings ..................................................................... 202
Figure 6.32 Average incremental cost benefit analysis of feasible water efficient
strategies for mid-low income dwellings....................................................................... 202
Figure 6.33 Average incremental cost benefit analysis of feasible water efficient
strategies for low income dwellings .............................................................................. 203
Figure 6.34 Annual water savings per rainwater storage volumes for high income
dwellings ....................................................................................................................... 212
Figure 6.35 Annual water savings per rainwater storage volumes for mid-high income
dwellings ....................................................................................................................... 213
Figure 6.36 Annual water savings per rainwater storage volumes for mid-low income
dwellings ....................................................................................................................... 213
Figure 6.37 Annual water savings per rainwater storage volumes for low income
dwellings ....................................................................................................................... 214
Figure 6.38 Life cycle cost benefit analysis of feasible rainwater harvesting systems for
high income dwellings ................................................................................................... 219
Figure 6.39 Life cycle cost benefit analysis of feasible rainwater harvesting systems for
mid-high income dwellings ........................................................................................... 219
Figure 6.40 Average incremental cost of feasible rainwater harvesting systems for high
income dwellings ........................................................................................................... 220
Figure 6.41 Average incremental cost of feasible rainwater harvesting systems for mid-
high income dwellings ................................................................................................... 221
v
List of Tables
Table 2.1 Average urban water consumption per capita by regions in Brazil for 2008.
......................................................................................................................................... 16
Table 2.2 Comparison of domestic water end-use data from different studies in the
world (% of total consumption). ..................................................................................... 32
Table 2.3 Comparison of indoor water end-use frequencies of previous studies .......... 39
Table 3.1 Estimated water loss from visible leaks ......................................................... 57
Table 3.2 Run-off coefficients relative to roof types....................................................... 65
Table 3.3 Water conservation measures considered for analysis .................................. 79
Table 4.1 Geo-demographic indicators .......................................................................... 87
Table 4.2 Socio-economic indicators ............................................................................. 89
Table 4.3 Dwelling Typologies in the Federal District .................................................. 92
Table 4.4 Summary of selected Administrative Regions for analysis ............................. 94
Table 4.5 Estimated life expectancies used for water efficient strategies. ................... 117
Table 4.6 Estimated life expectancies used for water reuse system components. ........ 117
Table 4.7 Methodological techniques for data collection and evaluation of water
conservation measures .................................................................................................. 119
Table 5.1 Average income per administrative regions ................................................. 126
Table 5.2 Number of residents per dwelling by income group .................................... 127
Table 5.3 Typological characteristics .......................................................................... 128
Table 5.4 Average flow rates and number of water fixtures and appliances ............... 133
Table 5.5 Indoor water end-use consumption per income range ................................. 147
Table 5.6 Outdoor water end-use consumption per income range .............................. 147
Table 5.7 End-use water consumption frequency per income range ........................... 148
Table 5.8 Actions taken in the last years to conserve water per income group ........... 157
Table 5.9 Actions residents are willing to take in order to reduce water consumption
....................................................................................................................................... 158
Table 5.10 Matrix of simple correlations ..................................................................... 160
Table 6.1 Domestic water tariffs per consumption ranges........................................... 170
Table 6.2 Potential water reductions per water efficient product for high income
dwellings ....................................................................................................................... 191

vi
Table 6.3 Potential water reductions per water efficient product for mid-high income
dwellings ....................................................................................................................... 192
Table 6.4 Potential water reductions per water efficient product for mid-low income
dwellings ....................................................................................................................... 193
Table 6.5 Potential water reductions per water efficient product for low income
dwellings ....................................................................................................................... 194
Table 6.6 Baseline water end-uses, and reduced water end-uses through water efficient
strategies applied to the different income dwellings ..................................................... 195
Table 6.7 Cost-benefit analyses of water efficient strategies for high income dwellings
....................................................................................................................................... 204
Table 6.8 Cost-benefit analyses of water efficient strategies for mid-high income
dwellings ....................................................................................................................... 205
Table 6.9 Cost-benefit analyses of water efficient strategies for mid-low income
dwellings ....................................................................................................................... 206
Table 6.10 Cost-benefit analyses of water efficient strategies for low income dwellings
....................................................................................................................................... 207
Table 6.11 Domestic water reductions promoted by rainwater harvesting systems for
high income dwellings in baseline and reduced water end-use consumption scenarios
....................................................................................................................................... 214
Table 6.12 Domestic water reductions promoted by rainwater harvesting systems for
mid-high income dwellings in baseline and reduced water end-use consumption
scenarios ....................................................................................................................... 215
Table 6.13 Domestic water reductions promoted by rainwater harvesting systems for
mid-low income dwellings in baseline and reduced water end-use consumption
scenarios ....................................................................................................................... 215
Table 6.14 Domestic water reductions promoted by rainwater harvesting systems for
low income dwellings in baseline and reduced water end-use consumption scenarios 216
Table 6.15 Cost-benefit analyses of rainwater harvesting systems on a baseline water
end-use scenario for high income dwellings ................................................................. 222
Table 6.16 Cost-benefit analyses of rainwater harvesting systems on a reduced water
end-use scenario for high income dwellings ................................................................. 223
Table 6.17 Cost-benefit analyses of rainwater harvesting systems on a baseline water
end-use scenario for mid-high income dwellings.......................................................... 224

vii
Table 6.18 Cost-benefit analyses of rainwater harvesting systems on a reduced water
end-use scenario for mid-high income dwellings.......................................................... 224
Table 6.19 Cost-benefit analyses of rainwater harvesting systems on a baseline water
end-use scenario for mid-low income dwellings ........................................................... 225
Table 6.20 Cost-benefit analyses of rainwater harvesting systems on a reduced water
end-use scenario for mid-low income dwellings ........................................................... 226
Table 6.21 Cost-benefit analyses of rainwater harvesting systems on a baseline water
end-use scenario for low income dwellings .................................................................. 227
Table 6.22 Cost-benefit analyses of rainwater harvesting systems on a reduced water
end-use scenario for low income dwellings .................................................................. 228
Table 6.23 Baseline water end-use consumption scenario for greywater demand and
supply according to different types of reuse ................................................................. 235
Table 6.24 Reduced water end-use consumption scenario for greywater demand and
supply according to different types of reuse ................................................................. 235
Table 6.25 Annual domestic water savings promoted by greywater recycling systems
for different income typologies in baseline and reduced water end-use consumption
scenarios ....................................................................................................................... 236
Table 6.26 Cost-benefit analyses of greywater recycling systems on a baseline water
end-use scenario for high income dwellings ................................................................. 240
Table 6.27 Cost-benefit analyses of greywater recycling systems on a reduced water
end-use scenario for high income dwellings ................................................................. 240
Table 6.28 Cost-benefit analyses of greywater recycling systems on a baseline water
end-use scenario for mid-high income dwellings.......................................................... 241
Table 6.29 Cost-benefit analyses of greywater recycling systems on a reduced water
end-use scenario for mid-high income dwellings.......................................................... 241
Table 6.30 Cost-benefit analyses of greywater recycling systems on a baseline water
end-use scenario for mid-low income dwellings ........................................................... 242
Table 6.31 Cost-benefit analyses of greywater recycling systems on a reduced water
end-use scenario for mid-low income dwellings ........................................................... 242
Table 6.32 Cost-benefit analyses of greywater recycling systems on a baseline water
end-use scenario for low income dwellings .................................................................. 243
Table 6.33 Cost-benefit analyses of greywater recycling systems on a reduced water
end-use scenario for low income dwellings .................................................................. 243

viii
Table 6.34 Domestic water reductions promoted by wastewater reclamation systems for
different income typologies in baseline and reduced water end-use consumption
scenarios ....................................................................................................................... 245
Table 6.35 Cost-benefit analyses of wastewater reclamation systems on a baseline
water end-use scenario for high income dwellings ....................................................... 248
Table 6.36 Cost-benefit analyses of wastewater reclamation systems on a reduced
water end-use scenario for high income dwellings ....................................................... 248
Table 6.37 Cost-benefit analyses of wastewater reclamation systems on a baseline
water end-use scenario for mid-high income dwellings ............................................... 248
Table 6.38 Cost-benefit analyses of wastewater reclamation systems on a reduced
water end-use scenario for mid-high income dwellings ............................................... 249
Table 6.39 Cost-benefit analyses of wastewater reclamation systems on a baseline
water end-use scenario for mid-low income dwellings ................................................. 249
Table 6.40 Cost-benefit analyses of wastewater reclamation systems on a reduced
water end-use scenario for mid-low income dwellings ................................................. 249
Table 6.41 Cost-benefit analyses of wastewater reclamation systems on a baseline
water end-use scenario for low income dwellings ........................................................ 250
Table 6.42 Cost-benefit analyses of wastewater reclamation systems on a reduced
water end-use scenario for low income dwellings ........................................................ 250
Table 6.43 Feasible water conservation measures for the different income ranges .... 253

Chapter 1 Introduction

Introduction
2
1. Introduction
1.1 Background
“Water is essential for life” (Annan, 2005). It is the foundation of every life form in this
planet; to sustain water, is to sustain life. Our planet contains a limited amount of
accessible freshwater, of which only 0.01% of all water on Earth is useable for
ecological systems and humans (Shiklomanov, 1993). Freshwater provides mankind not
only with drinking water and sanitation, but also food, energy, transportation, recreation
and industrialized goods (Bidlack et al., 2004). However, as global population
increases, so does the demand for freshwater.
The rapid urbanization and expansion of industry and agriculture has led to the
overexploitation of freshwater reserves from natural systems (UN-Water, 2006; UNEP,
2006a). Traditionally, water bodies have been used as receptacles for waste disposal
(Kjellén and McGranahan, 1997) and as a result, freshwater supplies are being reduced
by pollution (UN/WWAP, 2003). Although it is still difficult to predict the exact impact
of climate change over the world’s freshwater supplies (IPCC, 2001), it has been
estimated that global warming will cause a 20% increase in global water scarcity
(UN/WWAP, 2003). Evidently, both quantitative and qualitative natures of global
freshwater reserves are being affected by human overexploitation, pollution and
climatic factors such as global warming.
Although Brazil contains the biggest freshwater reserve in the world, with an abundant
availability equivalent to 33,000 cubic meters per habitant per year (m3/hab/yr), this
resource is unequally distributed throughout the country (ANA, 2007). Seventy percent
of the country’s freshwater resources are located within the Amazon region, whose
population represents only 7% of the nation, while thirty percent of the available
freshwater, is destined to supply the remaining 93% of the population (Machado, 2003).
The Federal District has already started to present signs of water stress. A region is said
to experience water stress when water supplies are below 1,700 m3/hab/yr (Falkenmark
and Lindh (1976), cited in IPCC (2001), and according to Tundsi (2005), the Federal
District has reached a water availability index equivalent to 1,555 m3/hab/yr. As the
population increases (IBGE, 2009) and per capita water consumption grows (CAESB,

Introduction
3
2002; CAESB, 2004; CAESB, 2006; CAESB, 2008), the Federal District’s capacity to
supply potable water has diminished, and new freshwater resources are having to be
drawn from far away. Clearly, this is a sign that water is running out, or at least
becoming less plentiful (Rijsberman and Cosgrove, 2000).
It seems that the Federal District’s water resource management is being merely focused
on a supply-driven approach, through the production of new water supply systems
according to public demand. However, to achieve a sustainable water management and
meet the needs of the present without compromising the ability of future generations to
meet their own needs (UN, 1987), it is crucial to understand what lies behind water
consumption and to be aware of how water is being used to adequately manage demand
through an integrated approach, including both demand-side and supply-side water
conservation measures.
1.2 Context of the research
As opposed to supply management, whose main strategy is to increase water supply to
meet demand, water demand management focuses in the control of water consumption
through educational, economic, regulatory and water conservation measures, to
postpone or avoid the need to develop new water supply systems (Butler and Memon,
2006). The use of decentralized supply-side and demand-side water conservation
measures in buildings have been reported to promote water reductions through
efficiency and reuse (EA, 2008b; Griggs et al., 1998; Vickers, 2001; Waterwise, 2008).
Water efficient fittings, fixtures and appliances are capable of promoting water
conservation through the improved effectiveness of water usage (Grant, 2006; Griggs
and Burns, 2009; Heinrich, 2007; Schmidt, 2004). Water reuse systems, on the other
hand, make use of alternative sources of water supply such as rainwater, greywater and
wastewater, for non-potable end-uses such as irrigation, toilet flushing and washing of
floors, vehicles and clothes (ANA et al., 2005; Asano et al., 1986; Gaulke, 2006;
Leggett et al., 2001a).
However, in order to adequately evaluate potential water savings of both demand-side
and supply-side water conservation measures, firstly, it is important to quantify the

Introduction
4
volume of water consumed by each major points of water usage, and understand how
water is being used by occupants (De Oreo et al., 1996; Jorgensen et al., 2009).
Previous studies have shown that domestic water consumption varies according to a
series of factors, including dwelling characteristics1, socio-economic factors, climate
and occupant behaviour (i.e. Arbués et al., 2003; Dziegielewski et al., 1993; Jorgensen
et al., 2009; Troy and Randolph, 2005). Such elements can vary from place-to-place,
leading to differences in water consumption patterns. For example, countries with
different national income are most likely to contain distinct patterns of domestic water
consumption. Although numerous studies have fully analysed domestic water
consumption in developed countries, little research has been carried out within
developing economies (see Potter and Darmame, 2010; Sivakumaran and Aramaki,
2010; Zhang and Brown, 2005).
Moreover, no study has explored the variations of domestic water consumption in case
of high difference in household2 income, especially within the Brazilian context, where
social inequality is high. To date, there have been very few rigorous studies concerning
domestic water end-use consumption in Brazil, and no generalizable data has been
produced. Research carried out so far, has been limited to two houses and three multi-
storey buildings in Southern Brazil (Ghisi and Ferreira, 2007; Ghisi and Oliveira, 2007)
and one flat and seven houses in São Paulo (Barreto, 2008; Rocha et al., 1998). In short,
in Brazil there is currently insufficient information regarding domestic water end-use
consumption for different income ranges and dwelling typologies in order to adequately
assess the performance of domestic water conservation measures.
The characterization of domestic water end-use consumption has led to a series of
investigations that have evaluated the potential water savings (Brewer et al., 2001;
Griggs et al., 1998; Maddaus, 1984; Mayer et al., 2003) and the economics of a range of
domestic water conservation measures in developed nations (Arpke and Strong, 2006;
EA, 2003; EA et al., 2007; Marshallsay et al., 2007; Rahman et al., 2010; Roebuck et
al., 2010; Waterwise, 2008). These countries, however, present a socio-economic reality
different from that found in developing countries.
1 This study refers to the term dwelling as a unit of the home, a house or flat. 2 The term household is referred to as a group of people, often a family, who live together.

Introduction
5
Little is known about the feasibility of domestic water conservation measures in
developing economies. In Brazil, the few studies on water conservation that have been
carried out, were for specific strategies (ANA et al., 2005; Ghisi, 2006; Ghisi et al.,
2007; Ghisi and Ferreira, 2007; Ghisi and Oliveira, 2007; Oliveira, 2002; Vimieiro and
Pádua, 2005). Furthermore, only one work has looked into the financial benefits of
rainwater harvesting systems in Brazil (Júnior et al., 2008). These studies fail to
evaluate the potential water savings and financial benefits for both supply-side and
demand-side water conservation measures according to household income and dwelling
typology.
Further work is needed to evaluate the feasibility of domestic water conservation
measures in terms of their applicability, water savings and financial benefits, according
to household income and building typology.
1.3 Aim and objectives
With these issues in mind, the overall aim of this research is to provide specific
information regarding domestic water consumption in order to adequately assess the
feasibility of domestic water conservation measures for Brazilian dwellings, with a
special attention to the different income ranges and dwelling typologies in the Federal
District. Therefore, the main objectives of this research are:
1. To measure current domestic water consumption and understand how water is
being used by residents of different income ranges and dwelling typologies in
the Federal District; and
2. To assess water end-use patterns for the different income ranges and dwelling
typologies; and
3. To identify and evaluate the feasibility of domestic water conservation measures
in terms of their applicability, water savings and financial benefits for different
income ranges and residential typologies.

Introduction
6
1.4 Thesis structure
The structure of the thesis reflects the stated aim and objectives, and logically
progresses through the steps required to meet them. The following sections provide a
brief description of each chapter (excluding Chapter 1).
1.4.1 Chapter 2: Domestic water consumption
The thesis starts out with a global review of water demand and supply, funnelling into
the Federal District’s freshwater availability and demand, and appraising its current
water resource management and future demand predictions. This chapter reviews the
main variables of domestic water consumption, including the cost of water, income,
household size, dwelling characteristics, climate and behaviour and perception. A
comparative review of previous studies was carried out and factors such as building
typology, household income and water end-use frequencies and activities examined.
1.4.2 Chapter 3: Domestic water conservation
Chapter 3 consists of a detailed review of the state of the art demand-side and supply-
side water conservation technologies for residential buildings3 available in the Brazilian
market. A range of water efficient products are identified and their reduced flow rates
and potential water reductions addressed. Furthermore, an overview of commercially
available rainwater harvesting, greywater recycling and wastewater reclamation systems
is carried out providing a description of their components and system design.
1.4.3 Chapter 4: Methodology
Chapter 4 provides a full description of the methodological approach applied to assess
current domestic water consumption and identify water end-use patterns for the
different income ranges and dwelling typologies in the Federal District. This chapter
describes the case study selection, primary data collection and analysis, as well as the
methods and equations used to identify feasible water conservation measures in terms of
applicability, water savings and financial benefits.
3 Residential buildings are referred in this study as the construction composed of one or more dwellings.

Introduction
7
1.4.4 Chapter 5: Baseline domestic water consumption
Chapter 5 addresses the first objective. It analyses results obtained from fieldwork and
evaluates domestic water consumption and water end-use patterns for different
residential building types of high, mid-high, mid-low and low income dwellings,
exploring the way occupant behaviour has a direct influence over the way water is used
at home. Based on a set of explanatory variables, multiple regression analysis is carried
out and indoor and outdoor water demand functions are estimated.
1.4.5 Chapter 6: Evaluation of domestic water conservation measures
Addressing the second objective, Chapter 6 builds on the information presented in
Chapter 3 and applies the primary data from Chapter 5 in order to identify feasible
domestic water conservation measures in terms of their applicability, water savings and
financial benefits taking into account for public opinion, awareness and acceptance of
water conservation strategies, water end-use consumption and dwelling characteristics
for the different income ranges and residential typologies of the Federal District.
1.4.6 Chapter 7: Conclusions and recommendations
Chapter Seven summarises the investigation undertaken, draws some conclusions,
outlines the contributions to knowledge, highlights the potential for further work and
states the implications of the findings.

Chapter 2 Domestic Water Consumption

Domestic Water Consumption
9
2. Domestic Water Consumption
2.1 Introduction
As a starting point, this chapter provides a global outlook of water demand and
examines the issues affecting world water supplies. It goes over Brazil’s natural
freshwater reserves and reviews the country’s water uses, focusing on domestic water
demand. Then, it evaluates the Federal District’s water availability and appraises current
management of water resources for future water demand. This chapter reviews the main
drivers of domestic water consumption such as the cost of water, household income,
dwelling characteristics, climate and occupant behaviour, in order to understand what
lies behind domestic water consumption. Finally, a comparative review of previous
domestic water end-use studies was carried out and factors such as building typology,
household income and water end-use frequencies and activities were examined.
2.2 Water demand and supply
Water is a key element that provides society with an in-stream of benefits such as food
production, energy production, consumer goods, drinking water, hygiene, sanitation,
etc. The overuse of freshwater resources linked with global factors as climate change
and pollution have been affecting both quantity and quality of water supply. This
section examines freshwater reserves and appraises demand from global to regional
perspectives.
2.2.1 Global water outlook
For years human beings have been exacerbating fresh water supplies as an inexhaustible
resource, strongly depending upon its regenerative capacity offered by the hydrological
cycle. However, it is important to remind ourselves that our planet contains a finite
quantity of water, where 97.5% of the supply can be found within the oceans in the
form of saltwater and only 2.5% is fresh. Most of this fresh water is of difficult access,
in the form of ice within the Polar Regions and mountains or groundwater including soil
moisture, swamp water and permafrost. Only 0.01% of all water on Earth is useable for
eco-systems and humans (Shiklomanov, 1993).

Domestic Water Consumption
10
To meet the needs of society, freshwater extracted from natural resources is used to
supply water for agriculture, industry, commercial and domestic uses, providing an in-
stream of benefits such as food production, energy production, consumer goods,
drinking water, hygiene, sanitation, recreation, among others (Bidlack et al., 2004).
However, as global population increases, so does the demand for water. The trend
towards the rapid urbanization, the expansion of industry and irrigated agriculture has
led to increased extractions of freshwater for a demand that now exceeds supply in
many countries in the world, leading to excessive pressure on the environment (UN-
Water, 2006; UNEP, 2006b).
In 1995 the world withdrew the equivalent of 3,906 km3 of freshwater, and according to
Rosegrant et al. (2002), water withdrawal is projected to increase by at least 50% more
by 2025. The authors highlight the fact that a rapid population growth will lead to an
increase of total domestic water consumption per capita by 71%, of which more than
90% will be in developing countries (Figure 2.1).
Figure 2.1 Per capita domestic water consumption projections for 2025.
Source: Rosegrant et al. (2002)
UN-Water (2006) reports that while global water consumption has been growing at
more than twice the rate of population growth, freshwater availability is being affected
by pollutant charges of effluents from the expanding urban, industrial and agricultural
uses. Traditionally, rivers, lakes and coastal waters have been used as receptacles for
diluting and dispersing wastes (Kjellén and McGranahan, 1997), however, water bodies
have a limited capacity to process pollutant charges. According to the UN’s World

Domestic Water Consumption
11
Water Development Report (UN/WWAP, 2003), freshwater supplies are being reduced
by pollution. The report indicates that an estimated 2 million tons of waste are disposed
of within water bodies on a daily basis, affecting the equivalent of 12,000 km3 of
freshwater worldwide.
There is undeniable evidence that climate change will have an impact over the
hydrological cycle, and consequently, over freshwater supplies (IPCC, 2001). Although
it is difficult to predict future changes in precipitation patterns, projected climate change
impacts include the increased frequency of heavy rainfall, which may lead to floods in
many areas of the world, and extreme droughts in semi-arid and arid regions of the
world (IPCC, 2007). It has been estimated that climate change will account for about
20% of the increase in global water scarcity (UN/WWAP, 2003).
It is evident that the overuse of freshwater resources linked with global factors as
climate change and pollution are affecting both quantity and quality of water supply.
Predictions point out that many of today’s developing economies in Latin America,
Africa and Asia, will experience increasing pressure on water resources (Figure 2.2).
Furthermore, under a business as usual scenario, many countries will face water deficit
(Rijsberman and Cosgrove, 2000).
Figure 2.2 Change in water stress from 1995 to 2025 under a business as usual scenario.
Source: Rijsberman and Cosgrove (2000)

Domestic Water Consumption
12
Climate change will also affect domestic water consumption. The impact of climate
change on domestic water consumption depends upon the consumer’s behaviour and
regulatory changes. Downing et al. (2003) suggest that the annual additional impact of
climate change on domestic demand of eight regions of England and Wales is an
increase of about 1.0 - 1.5% for the 2020’s and 1.5 – 3.0% by 2050’s. They conclude
that the main components of water consumption sensitive to climatic changes are
personal wash, garden watering and car washing.
2.2.2 Water in Brazil
In Brazil, current pressure upon national water resources is a product of population and
economic growth, expressed in high rates of urban expansion and worrisome levels of
water pollution, together with growing episodes of floods and droughts, affecting both
quantity and quality of available freshwater supplies (ANA, 2002). In order to face the
challenge of solving such issues related to the increase of water demand for urban,
industrial and agricultural uses, water stress caused by supply vs. demand, and of
environmental degradation of freshwater resources in Brazil, the Agência Nacional das
Águas - ANA (National Water Agency), was created in 2000, as a means to manage
Brazil’s water basins and to advert an impending water crisis (ANA, 2002).
To manage Brazil’s natural water resources, the country was divided into twelve
hydrographic regions, each composed according to a water basin or group of contiguous
water basins within its national territory (Figure 2.3). A ratio between mean surface
water discharge rates (renewable water supply) and population (water demand) is often
used by the United Nations as an indicator for benchmarking water availability, and in
this sense, Brazil presents an abundant freshwater availability equivalent to 33,000
cubic meters per habitant per year (ANA, 2007).
But, although Brazil contains the biggest freshwater reserve in the world, with a total
renewable water resource equivalent to 5,418 km3 (UN/WWAP, 2003), this reserve is
unequally distributed throughout the country. According to Machado (2003), seventy
percent of Brazil’s freshwater supply is situated within the Amazon water basin, whose
population represents only 7% of the country’s total population, whilst the remaining
thirty percent of freshwater available, is destined to supply the other 93% of the
population.

Domestic Water Consumption
13
Figure 2.3 Brazil’s twelve hydrographic regions.
Source: ANA (2007)
Figure 2.4(a), illustrates population density per hydrographic region, and in general, low
population densities can be found within the Amazon, Tocantins/Araguaia and Paraguay
hydrographic regions (ANA, 2002). High population densities are found in the coastal
regions of Northeast and Southeast Brazil. Figure 2.4(b), shows us that the average
surface water discharge rate per hydrographic region is bigger in Northern and Southern
Brazil, while North-eastern Brazil and the Paraguay water basin presents the lowest
discharge rates.
By cross-referencing population density and surface water discharge rates, water
availability indicators for each hydrographic region is found in Figure 2.5 (ANA, 2002).
Spatial variations of water availability per capita can be observed, and overall, low rates
of water availability are associated with high population density and poor levels of
surface water resource. In one hand, the highest water availability rates are located in
the North region of Brazil, within the Amazon water basin, where the number of
habitants is low and surface water discharge is high. Poor levels of water availability
rates are found within coastal regions of North-eastern Brazil where population

Domestic Water Consumption
14
densities are high, and water resources are low. In particular, specific regions of São
Paulo and Rio de Janeiro presented poor levels of water availability per capita.
Although these regions present medium rates of surface water discharge, urban densities
within these regions are extremely high, leading to high demands of freshwater for
domestic, industrial, agricultural and livestock uses.
Figure 2.4 Population density (a) and surface water discharge rate (b) by hydrographic regions in Brazil.
(a) (b)
Source: ANA (2002)
Figure 2.5 Water availability per capita by hydrographic region.
Source: ANA (2002)

Domestic Water Consumption
15
Figure 2.6 shows the distribution of water uses in Brazil (ANA, 2007). Although the
major demand of freshwater is for agriculture (46%), noticeably, domestic water
consumption represents the second largest demand (26%), followed by industrial (18%)
and livestock (7%) water uses.
Figure 2.6 Distribution of water demands in Brazil.
Table 2.1 on the next page shows the average urban water consumption per capita for
the five regions of Brazil for 2008 (SNSA, 2010). Through a cross-regional comparison
of domestic water per capita demand, the state of Alagoas presents the lowest
consumption rate with 89 litres per person per day (l/p/d), followed by Pernambuco,
with 90 l/p/d, and Paraíba with 92 l/p/d. The state of Rio de Janeiro has the highest
rate of domestic water consumption per capita equivalent to 236 litres per person per
day, followed by São Paulo and the Federal District, both with 176 l/p/d.
Agricultural46%
Domestic29%
Industrial18%
Livestock7%
Source: ANA (2007)

Domestic Water Consumption
16
Table 2.1 Average urban water consumption per capita by regions in Brazil for 2008.
Region / State Per Capita
Consumption Region / State
Per Capita
Consumption
No
rth
Acre 144 l/p/d
No
rth
-Ea
st
Alagoas 89 l/p/d
Amazonas 134 l/p/d Bahia 122 l/p/d
Amapá 161 l/p/d Ceará 131 l/p/d
Pará 147 l/p/d Maranhão 104 l/p/d
Rondônia 107 l/p/d Paraíba 92 l/p/d
Roraima 134 l/p/d Pernambuco 90 l/p/d
Tocantins 123 l/p/d Piauí 110 l/p/d
So
uth
-Ea
st Espírito Santo 85 l/p/d R. Grande do Norte 116 l/p/d
Minas Gerais 138 l/p/d Sergipe 118 l/p/d
Rio de Janeiro 236 l/p/d
Ce
ntr
al-
We
st
Federal District 176 l/p/d
São Paulo 176 l/p/d Goiás 126 l/p/d
So
uth
Paraná 128 l/p/d Mato Grosso do Sul 126 l/p/d
Rio Grande do Sul 145 l/p/d Mato Grosso 166 l/p/d
Santa Catarina 141 l/p/d BRAZIL 151 l/p/d
Source: SNSA (2010)
2.2.3 Water in the Federal District
The Federal District lies within the dividing boarders of the Paraná,
Tocantins/Araguaia and São Francisco hydrographic regions. Figure 2.7 on the next
Page illustrates the Federal District’s hydrological sub-basins: (i) LagoParanoá, (ii) Rio
Corumbá, (iii) Rio Descoberto, (iv) Rio Maranhão, (v) Rio Preto, (vi) Rio São
Bartolomeu and (vii) Rio São Marcos. Both surface and ground water resources from
these sub-basins are used to supply potable water to the existing population.
The Companhia de Sabeamento Ambiental do Distrito Federal-CAESB (Environmental
Sanitation Company of the Federal District) is responsible for public water supply and
sewage treatment within the territory, and operates five main surface water supply
systems: (i) Descoberto, (ii) Torto-Santa Maria, (iii) Planaltina-Sobradinho, (iv)
Brazlândia and (v) São Sebastião (Figure 2.8).

Figure 2.7 Hydrological sub
Figure 2.8 Water supply systems of the Federal District.
Domestic Water Consumption
Hydrological sub-basins of the Federal District.
Source: ANA (n.d.)
Water supply systems of the Federal District.
Source: CAESB (2006)
Domestic Water Consumption
17

Domestic Water Consumption
18
However, the available surface water supplies reached their maximum capacity of
extraction for potable water production to the constant-growing population of the
Federal District. The discovery of high-yield aquifers within the region, allied with the
need to raise productivity and the saturation of existing surface water resources, the
water facility company embraced a new concept of ground water extraction through the
use of deep water wells, and in 2003 the company initiated the process of incorporating
ground water extraction to the supply system (CAESB, 2008).
Today, there are a total of 109 deep wells located throughout the Federal District
(Figure 2.9) composing eight supply sub-systems: Água Quente (in purple); São
Sebastião (in green); Sobradinho (in yellow); INCRA-08 (in blue); Papuda (in cyan);
Jardim Botânico (in red); Itapoão (in light green) and Arapoanga (in bright purple).
Figure 2.9 Deep wells used for ground water extraction in the Federal District.
Source: CAESB (2008)
Although industrial activities within the Federal District are insignificant to water
demand, irrigation levels are growing within the region. From the existing 121,761.72
hectares of cultivated land, 14% is being irrigated for agricultural production
(EMATER, 2004). With a water consumption rate equivalent to 7,174 litres per second
per day (CAESB, 2008), domestic water consumption has been raising proportionally
with the growing population.

Figure 2.10 Projections of population growth
Source: CAESB and MEL (2004); IBGE as cited by Generino
Figure 2.10 shows the evolution of population growth in the Federal District from 1957
to 2010 and projectio
as cited by Generino, 2006). According to IBGE
District is 2,606,885 inhabitants, and estimates indicate a high annual growth rate of
2.51% a year (RIPSA, 2010)
Per capita water consumption figures indicate a constant raise in water demand in the
last years (Figure 2.11). Historical water consumption figures available
2008, indicate an increase from 207 l/p/d to 301 l/p/d, a growth rate of 13.4 l/p/d per
year, in the Federal District
2008).
Clearly, the Federal Distr
resources and water stress levels are being breached. Today, the Federal District’s sub
basins provide a total renewable surface water discharge rate of an estimated 2
litres/sec/km2 (CAESB, 2008; CODEPLAN, 2007)
availability indicator is equivalent to 1,555 m
Falkenmark and Lindh (1976), as cited in IPCC
experience water stress when water supplies are below 1,700
Domestic Water Consumption
Projections of population growth for the Federal District.
Source: CAESB and MEL (2004); IBGE as cited by Generino (2006)
Figure 2.10 shows the evolution of population growth in the Federal District from 1957
to 2010 and projections for the years 2020 and 2030 (CAESB and MEL (2004); IBGE
as cited by Generino, 2006). According to IBGE (2009) the population of the Federal
District is 2,606,885 inhabitants, and estimates indicate a high annual growth rate of
(RIPSA, 2010).
Per capita water consumption figures indicate a constant raise in water demand in the
last years (Figure 2.11). Historical water consumption figures available
2008, indicate an increase from 207 l/p/d to 301 l/p/d, a growth rate of 13.4 l/p/d per
year, in the Federal District (CAESB, 2002; CAESB, 2004; CAESB, 2006; CAESB,
Clearly, the Federal District’s population is putting pressure upon its natural water
resources and water stress levels are being breached. Today, the Federal District’s sub
basins provide a total renewable surface water discharge rate of an estimated 2
(CAESB, 2008; CODEPLAN, 2007). The Federal District’s water
availability indicator is equivalent to 1,555 m3/inh/yr (Tundisi, 2005)
Falkenmark and Lindh (1976), as cited in IPCC (2001), a country or region is said to
experience water stress when water supplies are below 1,700 m3/inh/yr.
Domestic Water Consumption
19
for the Federal District.
(2006)
Figure 2.10 shows the evolution of population growth in the Federal District from 1957
ns for the years 2020 and 2030 (CAESB and MEL (2004); IBGE
the population of the Federal
District is 2,606,885 inhabitants, and estimates indicate a high annual growth rate of
Per capita water consumption figures indicate a constant raise in water demand in the
last years (Figure 2.11). Historical water consumption figures available from 2002 to
2008, indicate an increase from 207 l/p/d to 301 l/p/d, a growth rate of 13.4 l/p/d per
(CAESB, 2002; CAESB, 2004; CAESB, 2006; CAESB,
ict’s population is putting pressure upon its natural water
resources and water stress levels are being breached. Today, the Federal District’s sub-
basins provide a total renewable surface water discharge rate of an estimated 2
. The Federal District’s water
(Tundisi, 2005). According to
, a country or region is said to
/inh/yr.

Domestic Water Consumption
20
Figure 2.11 Historical water consumption per capita in the Federal District.
Data obtained from (CAESB, 2002; CAESB, 2004; CAESB, 2006; CAESB, 2008)
Future projections estimate that by 2020, domestic water demand in the Federal District
will raise to 13,800 litres of water per second per day (l/s/d), and by the year 2030, this
demand will reach 16,600 l/s/d (CAESB and MEL, 2004). However, the available
freshwater systems are limited to supply water at a total discharge rate of 11,809 l/s/d
(CAESB, 2008). Evidently, the population growth and high per capita demand in the
Federal District will have a great impact upon the total demand for freshwater in a
business-as-usual scenario.
To meet the needs of such excessive water demand forecasts, the water facility company
intends to use freshwater resources from Ribeirão do Bananal, Lake Paranoá and
Corumbá IV, and has obtained environmental permission to deploy three new water
supply systems in the coming years (CAESB, 2008). Lake Paranoá is an artificial
landmark, part of UNESCO’s world heritage sites, created during Brasilia’s
construction as means of achieving environmental comfort by raising the levels of
relative humidity in the air and to serve as a place for recreation (Santos, 2008), not for
public water supply. Corumbá IV is a hydroelectric power plant recently built within the
state of Goiás, 122 km from the Federal District (Corumbá-Concessões, 2010), and this
will imply in high costs for water transportation.
There are clear indications that, owning to the high increasing demand for water, the
Federal District has seen its capacity for generating its own resources diminished and
207
249
283301
0
50
100
150
200
250
300
350
2002 2004 2006 2008
litres per person per day

Domestic Water Consumption
21
new freshwater resources have to be drawn from far away. This is a sign that water is
running out, or at least becoming less plentiful in places where population and per
capita water consumption grow, damaging the ecosystems from which it is drawn
(Rijsberman and Cosgrove (2000). It is evident that water resource management is
being focused exclusively on an engineering supply-side approach through the
redistribution of freshwater to where and when people want it for their use and the
demand side strategy has been ignored. In order to achieve a sustainable water
management in the Federal District, we need to understand what lies behind water
consumption and be aware of how water is being used to adequately manage existing
natural resources within an integrated framework, including both supply-side and
demand-side water conservation measures.
2.3 Variables of domestic water consumption
This section aims to understand what lies behind domestic water consumption and
review the main drivers of domestic water consumption. Numerous studies have
demonstrated that variables such as the cost of water, household income, climate,
dwelling characteristics, and occupant behaviour affect the way water is used and
should therefore be considered for water demand predictions.
2.3.1 Cost of water
A great deal of economic research has been carried out over pricing policies as a
mechanism for managing domestic water consumption. The essential logic behind the
theory is that the higher the cost of water, the lower domestic water consumption is
(Shaw, 2005). This makes sense if water is considered as a pure economic good,
however, according to Savenije (2002), water is not a normal economic good. It
contains a number of characteristics which makes it unique. Liu et al. (2003) argues that
the different uses of water, have different levels of economic values. For example, in an
extreme case, water, as a basic human need for survival, ceases to be an economic good.
On the other hand, once basic needs have been satisfied, surplus water can be
considered an economic good.
Numerous studies have shown that domestic water consumption tends to be price-
inelastic, and the decrease in consumption is lower than the increase in cost (see
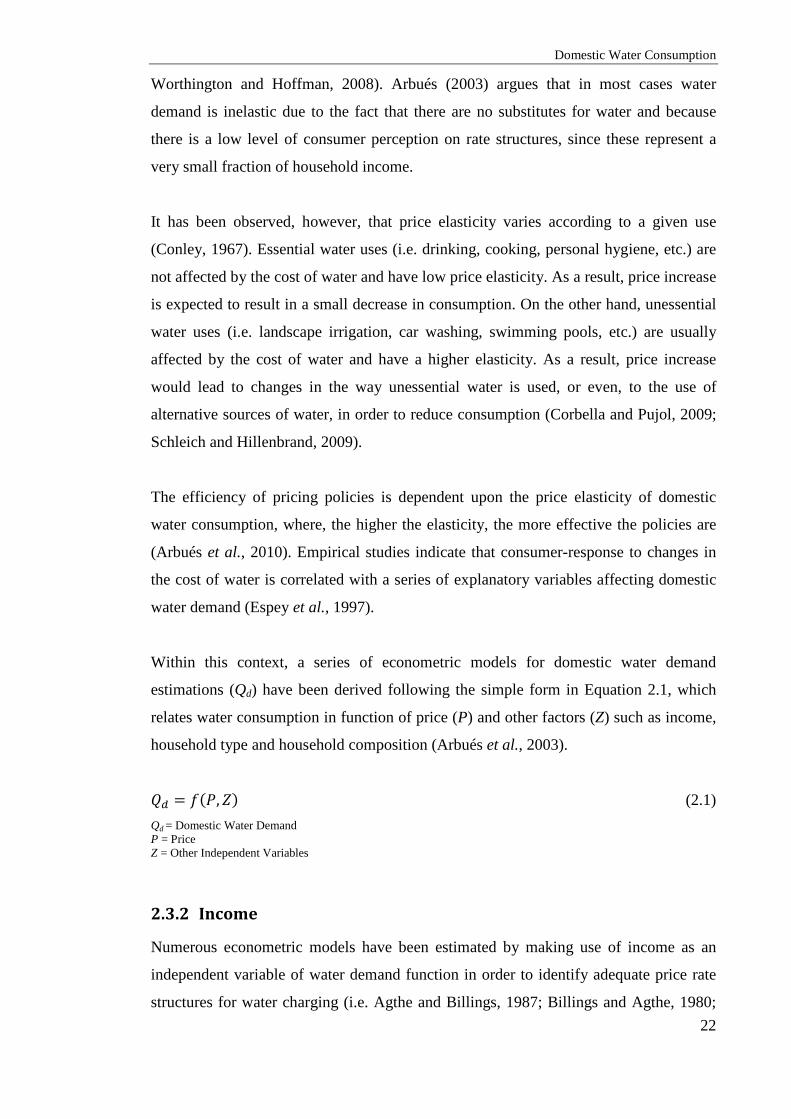
Domestic Water Consumption
22
Worthington and Hoffman, 2008). Arbués (2003) argues that in most cases water
demand is inelastic due to the fact that there are no substitutes for water and because
there is a low level of consumer perception on rate structures, since these represent a
very small fraction of household income.
It has been observed, however, that price elasticity varies according to a given use
(Conley, 1967). Essential water uses (i.e. drinking, cooking, personal hygiene, etc.) are
not affected by the cost of water and have low price elasticity. As a result, price increase
is expected to result in a small decrease in consumption. On the other hand, unessential
water uses (i.e. landscape irrigation, car washing, swimming pools, etc.) are usually
affected by the cost of water and have a higher elasticity. As a result, price increase
would lead to changes in the way unessential water is used, or even, to the use of
alternative sources of water, in order to reduce consumption (Corbella and Pujol, 2009;
Schleich and Hillenbrand, 2009).
The efficiency of pricing policies is dependent upon the price elasticity of domestic
water consumption, where, the higher the elasticity, the more effective the policies are
(Arbués et al., 2010). Empirical studies indicate that consumer-response to changes in
the cost of water is correlated with a series of explanatory variables affecting domestic
water demand (Espey et al., 1997).
Within this context, a series of econometric models for domestic water demand
estimations (Qd) have been derived following the simple form in Equation 2.1, which
relates water consumption in function of price (P) and other factors (Z) such as income,
household type and household composition (Arbués et al., 2003).
�� = ���, � (2.1)
Qd = Domestic Water Demand P = Price Z = Other Independent Variables
2.3.2 Income
Numerous econometric models have been estimated by making use of income as an
independent variable of water demand function in order to identify adequate price rate
structures for water charging (i.e. Agthe and Billings, 1987; Billings and Agthe, 1980;

Domestic Water Consumption
23
Dalhuisen et al., 2003; Hewitt and Hanemann, 1995; Niewswiadomy and Molina,
1989). Per capita income is commonly applied to models which make use of aggregated
water consumption data at the neighbourhood level, however, at the household-scale,
property value can be used as a substitute of household income because of their high
correlation (Dandy et al., 1997).
Generally, income is a measure of purchase power and is commonly associated with
living standards and level of education. Income can have an effect over the perception
of water cost. High income households might not be as responsive to water pricing as
low income households (Agthe and Billings, 1987). Living standards and property
characteristics is also affected by income. The basic premise is that the higher the
income, the higher the number of water-consuming features in the household. Wealth
can be associated with the presence of a higher number of water fixtures and appliances,
larger gardens and swimming pool, affecting the way water is used (Corbella and Pujol,
2009). On the other hand, income has a positive correlation with education, and
therefore might be responsive to water conservation measures taken by residents
through the purchase of water-saving equipment and adopting water drought-tolerant
garden vegetation (Worthington and Hoffman, 2008).
Worthington and Hoffman (2008) point out that estimates of income elasticity in the
literature indicate that domestic water consumption is income inelastic and small in
magnitude. Although results are consistent with income inelasticity, sample bias might
have a role to play. The authors argue that most studies were carried out in populations
with similar household income, and that domestic water demand might prove to be
income-elastic in an income-diverse situation, such as those found in developing
economies.
2.3.3 Household size
Daily per capita consumption (litres per person per day) is a common performance
indicator used to benchmark and forecast domestic water consumption (Wong and Mui,
2008). If domestic water consumption is measured at the household level, the number of
residents should have a positive association with water use, since occupancy has a direct
influence on water consumption. Studies demonstrate that household size is correlated

Domestic Water Consumption
24
with domestic water consumption (i.e. Arbués et al., 2010; Barrett and Wallace, 2009;
Schleich and Hillenbrand, 2009).
It is expected that, the larger the number of residents in a household, the bigger the
consumption will be. However, it has been found that the increase in domestic water
consumption is less than proportional to the increase in household size (Arbués et al.,
2003; Worthington and Hoffman, 2008).
Research focused on household size and domestic water consumption indicated that
domestic water consumption per capita is inversely related to the number of residents in
a dwelling (Arbués et al., 2010). Such aggregated statistical analysis of household size
and domestic water consumption per capita suggests that the greater the number of
residents in a dwelling, the lower the rate of per capita consumption. This indicates that
domestic water consumption is not only associated with the number of persons in a
household, but also with other communal uses (i.e. irrigation, cleaning, washing,
swimming pool, etc.).
2.3.4 Dwelling characteristics
Dwelling characteristics such as building typology, built area, garden area and water-
using facilities might influence the way water is used, and therefore affect the amount of
water consumed in a household.
A series of studies indicate that domestic water consumption varies according to
residential building typology (i.e. Fox et al., 2009; Loh and Coghlan, 2003; Russac et
al., 1991; Thackray et al., 1978; Troy and Holloway, 2004; Zhang and Brown, 2005).
Some findings suggests that water consumption rates between the different dwelling
typologies are not significantly different from each other (Troy and Holloway, 2004;
Zhang and Brown, 2005). However, according to Fox et al.(2009) a significant
relationship between physical property characteristics and domestic water consumption
can be found. An investigation carried out by Russac et al. (1991) found that water
consumption was higher in detached houses and lower in flats.

Domestic Water Consumption
25
A study focusing on indoor and outdoor domestic water usage for single and multi-
storey and dwellings found that multi-storey dwellings used less water than single
residential dwellings (Loh and Coghlan, 2003). This might be attributed to the
typological characteristics of residential multi-storey buildings, since flat dwellings
contain communal garden areas, and therefore can have a lower water consumption rate
on outdoor activities than house dwellings with individual gardens.
In most water use studies, outdoor water use is exclusively allocated to irrigation and
swimming pool consumption (Mayer et al., 1999). However, as far as the literature
goes, no study has analysed the influence of patios and verandas towards outdoor water
consumption. In Brazil, it is a common practice to wash patio and veranda floors
periodically and therefore, these outdoor spaces should be taken into consideration
during domestic water consumption analysis.
Another aspect of domestic water consumption to be taken into consideration is the fact
that water demand might be linked to built area, since the greater the floor area, the
higher the number of residents and water-using equipment (Memon and Butler, 2006).
According to Troy and Randolph (2005) the presence of water-using equipment can
influence the way water is used should be considered when studying behavioural
patterns of domestic water consumption. Rajala and Katko (2004) point out that
although domestic water consumption does not vary much according to built age of a
dwelling, the age of the water-using equipment has a more influential factor for
domestic water consumption.
2.3.5 Climate
Domestic water consumption can be divided into seasonal and non-seasonal uses. The
first is related with activities such as irrigation and cooling, which are weather
correlated. The latter, is related with water-consuming activities that are not weather
correlated, such as toilet flushing and dishwashing.
Seasonal water uses are commonly associated with outdoor water consumption and non-
seasonal water uses with indoor water consumption. Although this assumption might be
considered imprecise because some indoor water-consuming activities such as

Domestic Water Consumption
26
evaporative cooling can be seasonal and some outdoor uses such as car washing can be
non-seasonal, it has been reported the major portion of seasonal water use within the
residential sector is attributed to irrigation (Dziegielewski et al., 1993).
Precipitation regimes usually affect outdoor water consumption for garden irrigation.
Sources of water required to maintain garden plants generally comes from a
combination of rainfall and supplementary irrigation water during dry spells (Foster and
Beattie, 1979). Consequently, the lack of precipitation induces consumers to apply
supplementary water in or to meet the requirements to maintain garden vegetation.
Evapotranspiration is related to the water loss from soil surface and plant transpiration.
It has been reported that net evapotranspiration can be used to measure outdoor water
use for garden irrigation (Mayer et al., 1999). The basic premise is that as
evapotranspiration raises, outdoor water demand for irrigation increases; however, as
humidity rises, outdoor water demand for irrigation decreases.
Although several water demand models have included different climatic parameters
such as temperature, precipitation and evapotranspiration (i.e. Billings, 1982; Hoffmann
et al., 2006; Mayer et al., 1999; Niewswiadomy and Molina, 1989), none of them seem
to have addressed relative humidity as a factor for outdoor water consumption for
garden irrigation.
Relative humidity is a measure of the amount of water vapour in the air and has a direct
relationship with precipitation and solar radiation. Relative humidity not only indicates
the likelihood of precipitation, but also is necessary for cloud formation. Therefore, low
levels of humidity implies in higher solar radiation, as clouds tend to decrease solar
intensity. Low relative humidity associated with high solar gain leads to high levels of
evapotranspiration, therefore increasing outdoor water demand for irrigation.
2.3.6 Behaviour and perception
Corral-Verdugo et al. (2002) argues that human behaviour is the major cause of
environmental deterioration, and that there is no evidence of a change in human
tendency to deplete natural resources. Occupant behaviour is perhaps the most

Domestic Water Consumption
27
influential factor of domestic water consumption, and according to Jorgensen et al.
(2009), the success of domestic water conservation is dependent on the understanding of
how water is used and perceived by residents.
According to Gregory and Di Leo (2003), domestic water consumption behaviour is a
product of situational influences (i.e. household income, household size, dwelling
characteristics, and climate), unreasoned influences (i.e. habits and routines), reasoned
influences (i.e. attitudes, intentions and involvement) and stimuli (i.e. factual
information, knowledge and environmental awareness).
2.3.6.1 Situational influences
Situational determinants such as cost of water, household income, household size,
dwelling characteristics and climate, have been discussed above as variables that affect
domestic water consumption and therefore suggest a relationship with water
consumption behaviour.
According to Dziegielewski et al. (1993) income measures the ability of residents to
pay for water, whereas the cost of water influences the amount of water residents are
willing to purchase. Both variables are capable of affecting domestic water consumption
behaviour. On one hand, low income linked with high water costs might cause residents
to modify their behaviour by reducing water irrigation, number of laundry loads, taking
shorter showers, making use of alternative water supplies, etc. On the other hand, high
income linked with low water costs might lead to a water-spending behaviour.
As previously discussed, domestic water consumption is inversely related to household
size; therefore, the greater the number of residents in a household, the lower the per
capita water consumption. According to Arbués et al. (2010), such scaling economy is
associated with common household uses such as clothes washing. Households with a
higher number of family members have a greater need to form a conservationist
behaviour such as saving clothes to form full loads, using economy settings and avoid
unnecessary rinse cycles (Gregory and Di Leo, 2003).

Domestic Water Consumption
28
Randolph and Troy (2008) explore variables of dwelling characteristics in Australia as
means to evaluate occupant behaviour towards domestic water consumption. According
to the authors, the ability to use water is dependent upon the range of water-using
facilities available in different residential building typologies. The number of water-
using facilities helps to explain how residents use their water and explain the differences
in water consumption behaviour. For example, flat dwellings tend to have a smaller
built area with fewer bathrooms, no gardens and swimming pools when compared to
house dwellings, thus limiting their potential to consume water, and therefore affecting
their behaviour towards domestic water consumption.
Climatic factors can also influence domestic water consumption behaviour. High
temperatures can lead to changes in behaviour for cooling by increasing the frequency
of showers. Also, low levels of precipitation affect garden plants, and to maintain the
garden, occupant behaviour changes in order to provide supplement water for non-
native vegetation.
2.3.6.2 Unreasoned influences
Unreasoned influences are associated with habitual “mindless” patterns of behaviour
that occur automatically. According to Aarts et al. (1998) behaviour is frequently
exhibited in the same physical and social environment and usually acquires a habitual
character. Such habitual behaviour proceeds in an efficient, effortless and unconscious
manner performed on a regular basis.
Domestic water consumption habits such as brushing teeth, shaving, bathing, washing
clothes, dishes and watering lawn are repetitive and frequent. According to Gregory and
Di Leo (2003), such habits tend to reduce cognition and it can either reflect routine, or it
can represent important constancies which are deliberate and intentional in nature.
Aarts et al. (1998) points out that habits tend to be goal-directed and are automatically
triggered by a certain stimuli. Also, the author argues that “satisfactory experiences
enhance the tendency to repeat the same course of action because the instrumental
action becomes more strongly associated with the goal one initially wished to attain”

Domestic Water Consumption
29
(p.1358). For example, dry turf grass can trigger a habitual behaviour for periodic
irrigation in order to maintain the satisfactory experience of having a green garden.
2.3.6.3 Reasoned influences
Based on cognitive processes, reasoned influences can be associated with intentional
behavioural attitudes and personal involvement. According to Fishbein and Ajzen’s
(1975) theory of reasoned action, behaviour intentions are measured according people’s
attitudes towards expected outcomes and by their subjective norms.
Fishbein and Ajzen (1975) define attitude as a learned predisposition to respond to a
given stimulus, and although Gregory and Di Leo (2003) point out that attitude is an
important link between stimulus and response to water consumption, the authors claim
that the level of personal involvement is another factor that can affect daily activities of
water usage. For example, if residents become aware of a security of supply issue, the
need to conserve water becomes personally relevant, and they might take actions to
conserve water in the household.
2.3.6.4 Awareness stimuli
Stimuli are external influences that can trigger effects upon human behaviour. Stimulus
such as environmental awareness can trigger conscious pro-environmental water
consumption behaviours in a household. Awareness is the ability to be conscious of
determined objects, situation or action, through the processing of informational cues.
It has been reported that environmental knowledge is found to be consistently and
positively related to pro-environmental attitudes (Arcury, 1990; Arcury and Johnson,
1987). Therefore, environmental knowledge regarding human impacts on natural water
resources can lead to reasoned influences over domestic water consumption behaviour,
and attempts to change unreasoned influences might be carried out in order to save
water and reduce domestic water consumption.
According to Gregory and Di Leo (2003), awareness can be seen as the application of
knowledge to a specific situation. Situational influences such as water efficient fixtures,
appliances and water reuse systems at home, can affect the way water is used, and

Domestic Water Consumption
30
therefore the lack of knowledge of such water-saving technologies could pose a
limitation to conscious actions (behavioural intentions) to saving water.
2.4 Domestic water end-use consumption
Domestic water consumption is defined by a sum of water-using activities originating
from different water fixtures and appliances inside and outside the home. According to
Memon and Butler (2006), these activities can be divided into two main categories:
personal and communal water usage. Personal water usage includes activities related to
hygiene (such as taking a bath, brushing teeth, washing face, using the toilet, etc.) and
communal water uses can be related to activities such as washing clothes, cooking, dish
washing, watering the lawn, etc.
Such water-using activities take place within determined spaces of the home, where
sources of water can be obtained from water fixtures and appliances. Mayer et al. (1999,
p.1) defines the end-uses of water as “all the places where water is used...”, including
toilets, showers, faucets, washing machines, etc. This study considers the term
‘domestic water end-use consumption’ as the amount of water consumed per fixture or
appliance inside and outside a household.
It is agreed amongst researchers that a clear understanding of domestic water end-use
consumption patterns make way to both demand predictions and to the development and
evaluation of water conservation measures (White and Fane, 2002). According to
Hobson et al. (2004) the study of domestic water end-use consumption is crucial to
achieve a more accurate forecast of water demand. The understanding of how much
water is consumed and where it is being put to use in the home is crucial to the design
and evaluation of water conservation programs (De Oreo et al., 1996). Furthermore, a
clear understanding of domestic water end-use consumption can help identify optimal
water conservation measures for an improved efficiency and effective water demand
management (Memon and Butler, 2006).
Numerous studies have characterized domestic water end-use consumption. Table 2.2
compares the results of domestic water end-use consumption data between different

Domestic Water Consumption
31
countries in the world. Domestic water end-use values refer to the percentage of the
total domestic water consumption per person per day.
While some of the studies reported their findings according to the activities related to
domestic water consumption (i.e. bathing, shaving, drinking, cooking, clothes washing,
etc.), others focused their results according to water-using components of dwellings (i.e.
bath tubs, wash closets, washing machines, kitchen sink, etc.). Furthermore, while some
studies disaggregated water consumption values as much as possible, other studies
aggregated results using different terms to represent water uses in the home. For
example, some studies aggregated their water consumption data from wash basins with
that of kitchen sinks (internal faucets), while others aggregated such results with
showers and baths (personal hygiene).

Domestic Water Consumption
32
Table 2.2 Comparison of domestic water end-use data from different studies in the world (% of total consumption).
Developed Countries Developing Countries
GB GB GB GB PT NL DK FI DE AT US US AU AU NZ BR BR BR BR CN TH LK
Thac
kray
et
al.
(1
97
8)
Hal
l et
al.
(1
98
8)
Bal
l et
al.
(2
00
3)
Ofw
at (
20
07
)
Vie
ira
et
al.
(2
00
7)
Geu
den
s (2
00
8)
Seth
(n
.d.)
,
as c
ited
in E
A (
20
08
c)
Etel
ämäk
i (1
99
9),
as
cite
d in
EA
(2
00
8c)
Um
wel
tbu
nd
esam
t (2
00
7),
as c
ited
in E
A (
20
08
c)
BM
LFU
W (
20
06
),
as c
ited
in E
A (
20
08
c)
DeO
reo
et
al.
(1
99
6)
May
er e
t a
l. (
19
99
)
Loh
an
d C
ogh
lan
(2
00
3)
Ro
ber
ts (
20
05
)
Hei
nri
ch (
20
07
)
Ro
cha
et
al.
(1
99
8)
Gh
isi a
nd
Fer
reir
a (2
00
7)
Gh
isi a
nd
Oliv
eira
(2
00
7)
Bar
reto
(2
00
8)
Zhan
g an
d B
row
n(2
00
5)
Ota
ki e
t a
l. (
20
08
)
Siva
kum
aran
an
d A
ram
aki
(20
10
)
Sample Size (No. of Dwellings) 853 1863 250 N.A. 43 N.A. N.A. N.A. N.A. N.A. 16 1188 1017 93 12 1 49 2 7 806 63 9
Indoor Use (Indoor Taps) 35 --- 23 --- 29 --- --- --- --- --- 16 --- 18 12 14 --- --- --- --- --- --- --- Personal Hygiene (Shower & Bath) --- --- --- 22 36 --- 37 49 36 41 --- --- 33 --- --- --- --- --- --- --- --- --- Wash Basin (Bathroom Faucet) --- --- --- --- --- 4 --- --- --- --- --- 16 --- --- --- 8 11 4 4 13 --- 5 Shower 1 2 8 --- --- 39 --- --- --- --- 17 17 --- 22 27 55 16 38 14 14 --- --- Bath 15 13 16 --- --- 2 --- --- --- --- 1.7 2 --- 2 3 --- --- --- --- 14 25 27 Toilet Flushing 32 29 30 34 21 29 23 14 32 22 25 27 19 13 19 6 33 27 6 14 19 14 Kitchen Sink --- --- --- 42 --- 6 17 20 9 9 --- --- --- --- --- 18 34 24 12 --- 19 19 Waste Disposal Unit 0.3 2 --- --- --- --- --- --- --- --- --- --- --- --- --- --- --- --- --- --- --- --- Dishwasher 0.3 2 2 --- 3 2 --- --- --- --- 3 1 --- 1 1 --- --- --- --- 17 --- --- Clothes Washing (Utility Faucet) 3 --- --- --- --- 1 --- --- --- --- --- --- --- --- --- 3 2 --- 5 --- 23 15 Washing Machine 9 11 14 --- 11 12 19 14 14 17 24 22 27 19 24 11 2 7 28 14 --- ---
Outdoor Use (External Taps) --- 3 4 2 --- --- 4 --- 9 --- --- --- --- 25 8 --- --- --- --- --- --- --- Garden Irrigation 3 --- --- --- --- --- --- --- --- --- --- --- --- --- --- --- --- --- --- --- --- 7 Car Washing 0.4 --- --- --- --- --- --- --- --- --- --- --- --- --- --- --- --- --- --- --- --- 14 Swimming Pool --- --- --- --- --- --- --- --- --- --- --- --- --- --- --- --- --- --- --- --- --- ---
Leaks and Losses --- --- 2 --- --- --- --- --- --- --- 12 14 --- 6 4 --- --- --- --- --- --- --- Other --- 39 2 --- --- 4 --- 3 --- 11 --- 2 3 --- 0.4 --- --- --- 31 14 --- ---
Per Capita Consumption (l/p/d) 98 130 N.A. 150 134 128 131 115 115 135 225 262 161 178 147 109 179 175 263 113 77 118

Domestic Water Consumption
33
In order to clearly present results and to avoid confusion surrounding domestic water
end-uses, this research has presented disaggregated results according to water fixtures
and fittings inside and outside the home. This way, water-using activities can be
analysed and if necessary aggregated, according to fixture or appliance. Water fixtures
and appliances exist in the home for a determined use, and since water-using activities
originate from these sources, it made sense to categorize domestic water consumption
according to fixture and appliance. Furthermore, if domestic water end-use consumption
data is to be used for demand predictions to evaluate water conservation measures such
as water efficient fittings, fixtures and appliances and water reuse systems, it makes
sense to present water end-use consumption data at a disaggregated level of water
fixture and appliance.
Although studies reported their results in a different manner, it was possible to compare
their findings by aggregating domestic water end-use consumption at its simplest form:
(i) potable uses (internal faucets, personal hygiene, wash basin, shower, bath, kitchen
sink and dishwasher), (ii) laundry (washing clothes and washing machine), (iii) toilet
flushing and (iv) outdoor uses (car washing, garden irrigation and swimming pool).
‘Other’ end-uses were not included for comparison, as well as leaks, since not every
study reported water loss or had unaccounted end-uses in their homes.
Overall, average results from previous studies indicate that most of the water used in the
analysed homes was for potable uses (51%), followed by toilet flushing (21%), laundry
(17%) and outdoor uses (11%).
Evidently, a diversity of domestic water end-use consumption patterns between the
different studies in Table 2.2 can be found. According to Vieira et al. (2007, p.193),
domestic water usage can significantly vary from “country to country, region to region
and even from one residence to another...” , hence the importance of obtaining specific
information on how water consumption is affected by a series of independent variables
(as seen in the previous section).
Although a diversity of domestic water end-use consumption patterns between the
different studies can be found, the average values of potable and laundry are similar in
developed and developing countries; toilet flushing and outdoor water uses, however,

Domestic Water Consumption
34
are different (Figure 2.12). Developed countries present a greater consumption trend for
toilet flushing, while developing countries contained a higher proportion for outdoor
uses. Overall, results obtained from this research (see Chapter 5, Section 5.4.5,Figure
5.18), presented similar proportions to those of developing countries, varying slightly in
laundry uses.
Figure 2.12 Average domestic water end-use consumption results of previous research.
Results of outdoor water uses from previous studies carried out in developed countries
were mainly accounted for in garden irrigation and car washing. Only two studies
carried out in Australia presented results for water consumption in swimming pools
(Loh and Coghlan, 2003; Roberts, 2005).
It is crucial to point out the fact that from the reviewed literature on water end-use
studies carried out in developing nations, only Sivakumaran and Aramaki (2010)
measured outdoor water usage for nine dwellings.
As far as the literature goes, this research represents the first attempt to understand
outdoor water uses in Brazilian dwellings (see Chapter 5, Section 5.4.5), since no
domestic water end-use study in Brazil has evaluated outdoor water end-use
consumption.
Potable Uses51%
Laundry15%
Toilet Flushing
26%
Outdoor Uses8%
Potable Uses51%
Laundry16%
Toilet Flushing
17%
Outdoor Uses16%
Developed Countries Developing Countries

Domestic Water Consumption
35
2.4.1 Building typology
Although the great majority of the domestic water end-use studies carried out in
developed countries collected data solely for house dwellings, a few studies collected
domestic water end-use consumption data for both house and flat dwellings.
Although Thackray et al. (1978) demonstrated the average domestic water consumption
per capita according to building typology (detached, semi-detached, terraced, bungalow
and flat/maisonette), domestic water end-use consumption data was represented
according to sampled sites (Malvern and Mansfield).
Loh and Coghlan (2003) on the other hand, compared domestic water end-use
consumption according to houses and multi-storey flat dwellings. Results from their
study indicated that even though there were no significant variations between indoor
water end-use consumption between both dwelling typologies, house dwellings
contained outdoor water consumption 45% greater than multi-storey flat dwellings (as
seen in Figure 2.13).
In developing countries, water end-use studies were either focused in house dwellings
(Ghisi and Oliveira, 2007; Otaki et al., 2008; Sivakumaran and Aramaki, 2010), or flat
dwellings (Barreto, 2008; Ghisi and Ferreira, 2007; Rocha et al., 1998; Zhang and
Brown, 2005). This research, on the other hand, has evaluated domestic water end-use
consumption for both dwelling typologies in the Federal District (see Chapter 5).
2.4.2 Household income
From the reviewed literature, very little research has been carried out regarding the
socio-economic aspects of domestic water end-use consumption.
An early study in the United Kingdom, compared the average domestic water
consumption per capita according to different social groups in the cities of Malvern and
Mansfield (Thackray et al., 1978). Although income data was not included, the authors
evaluated domestic water consumption according to social grade classifications from the
20th century (professional, managerial, clerical, skilled and unskilled social groups).
Since such social grade classifications were indicators of household income, the average

Domestic Water Consumption
36
values of domestic water consumption per capita, gathered from their findings in
Malvern and Mansfield, were plotted out in a graph to verify the differences in water
consumption according to such social groups (Figure 2.13). There were clear indications
regarding a direct relationship between social group and domestic water consumption in
the United Kingdom.
Figure 2.13 Per capita water consumption and social groups in the United Kingdom
Source: Thackray et al. (1978)
Figure 2.14 Monthly water consumption per income range in China
Source: Zhang and Brown (2005)
In developing countries, Zhang and Brown (2005) compared average monthly indoor
water consumption with different income levels of residential flat dwellings for the
0
20
40
60
80
100
120
140
160
Professional Managerial Clerical Skilled Unskilled Unclassified
Do
me
stic
Wa
ter
Co
nsu
mp
tio
n
(lit
res/
per
son
/day
)
Social Group
0
2
4
6
8
10
12
14
16
0 - 10,000 11,000 - 30,000 31,000 - 40,000 41,000 - 50,000 > 50,000
Do
me
stic
Wa
ter
Co
nsu
mp
tio
n(m
3 /d
wel
ling/
mo
nth
)
Income Range (RMB/dwelling/month)

Domestic Water Consumption
37
cities of Beijing and Tianjin, China. The authors reported that a higher household
income results in a higher level of domestic water use and consumption. The average
values of monthly water consumption per dwelling and dwelling income range obtained
from the authors’ findings in Beijing and Tianjin were plotted out in a graph (Figure
2.14). Overall, Zhang and Brown’s results indicated that the constant increase in
monthly water consumption per dwelling was somewhat proportional to the increase in
household income range.
Loh and Coghlan (2003) on the other hand, provided a more in-depth analysis by
comparing average monthly and daily water consumption for high, middle and low
income dwellings in Perth, Australia. Their findings suggest that household income had
a significant effect upon outdoor water usage.
Figure 2.15 Average monthly water consumption by dwelling type and income range in Australia
Source: Loh and Coghlan (2003)
Figure 2.15 illustrates Loh and Coghlan’s findings. Noticeably, there was very little
variance of average domestic water consumption between high, middle and low income
dwellings from April-99 to October-99, however, significant changes in water
consumption between the different income ranges could be observed during dry spells,
from October-99 to May-00. The authors reported a decrease in outdoor water usage in

Domestic Water Consumption
38
January-00, due to unseasonal rainfall. Noticeably, changes in water consumption were
proportional to income range; furthermore, these changes were equally distributed
throughout the summer.
The authors found a relationship between outdoor water consumption and the use of
automatic irrigation systems, comparing outdoor water consumption of dwellings with
automatic irrigation systems and dwellings without automatic irrigation systems.
However, no correlations with dwelling characteristics such as garden size and
swimming pool volume were made.
Furthermore, no domestic water end-use consumption data for the low, middle and high
income ranges were presented for analysis. This study on the other hand, has filled this
gap in knowledge by comparing domestic water end-use consumption between the
different income ranges in the Federal District (see Chapter 5).
2.5 Water end-use frequencies and activities
As previously seen in Section 2.3.6, unreasoned influences of domestic water
consumption is commonly associated with resident’s habits and routines. Previous
research suggest that one way of understanding the behavioural patterns of domestic
water usage is through the comprehension of the activities related to water consumption,
how equipments are used and the frequency of usage.
2.5.1 Frequencies of water usage
Although a few studies have evaluated water-using frequencies mostly as a basis for
water demand predictions (Ghisi and Ferreira, 2007; Ghisi and Oliveira, 2007; Heinrich,
2007; Mayer et al., 1999; Roberts, 2005; Vieira et al., 2007), they provide some
valuable information regarding the daily habits of residents. The frequency of appliance
and fixture use is directly linked to occupant behaviour, for example, the number of
times the average resident flushes the toilet in one day, the duration of a shower, how
often a load of clothes is washed, etc.
Table 2.3 on the next page shows indoor water end-use frequencies obtained by the
studies above in a comparable format. According to Mayer et al. (1999), frequencies of

Domestic Water Consumption
39
appliances such as toilets, washing machines and dishwashers are best evaluated
according to the number of uses per day. Furthermore, the author argues that it is more
instructive to examine tap-opening fixtures according to the duration of usage per day.
Having this in mind, data from previous studies were used to obtain comparable
frequency rates according to number of uses (toilet flushing, washing machine and
dishwasher) and duration of usage (tap-opening fixtures) per person per day.
Table 2.3 Comparison of indoor water end-use frequencies of previous studies
Developed Country Developing Countries
New Zealand USA Australia Portugal Brazil Brazil
Heinrich (2007)
Mayer et al. (1999)
Roberts (2005)
Vieira et al. (2007)
Ghisi and Ferreira (2006)
Ghisi and Oliveira (2007)
Indoor Faucets 6 min/p/d 8.1 min/p/d 8.0 min/p/d --- --- --- Bathroom Faucet --- --- --- 0.8 min/p/d 1.3 min/p/d 4.0 min/p/d Shower 7.8 min/p/d 8.2 min/p/d 5.1 min/p/d 5.7 min/p/d 11.8 min/p/d 8.6 min/p/d Bath Faucet --- --- --- 6.7 min/p/d --- --- Toilet Flushing 5 f/p/d 5 f/p/d 4 f/p/d 9 f/p/d 4 f/p/d 6 f/p/d Kitchen Sink --- --- --- 1.5 min/p/d 2.3 min/p/d 1.6 min/p/d Dishwasher --- 0.1 load/p/d 0.2 load/p/d 0.5 load/p/d --- --- Utility Faucet --- --- --- --- 1.9 min/p/d --- Washing Machine 0.3 load/p/d 0.4 load/p/d 0.3 load/p/d 0.6 load/p/d 0.1 load/p/d 0.1 load/p/d
In order to compare results, wash basin, bath, kitchen and utility faucet frequencies were
aggregated according to indoor faucet use. Previous studies indicate that, in average,
frequency rates for indoor faucets run for 7.3 minutes per person per day (min/p/d).
Furthermore, results from previous studies indicate that the average duration of a
shower is equivalent to 6.7 min/p/d, toilets are flushed at a frequency of 6 flushes per
person per day (f/p/d), dishwashers are used in an average rate of 0.3 load per person
per day (load/p/d) and washing machines are used to wash clothes at a rate of 0.3
load/p/d. Only one study in Brazil presented results for the frequency of usage in utility
faucets (1.9 min/p/d).
Clearly, disaggregated results from previous studies varied significantly, however some
assumptions regarding water use frequency between developed countries and Brazil
could be made. Overall, developed countries presented higher average frequency rates
than Brazil. In average, the duration of indoor faucet usage in developed countries (7.3
min/p/d) was almost twice as high as in Brazil (4.6 min/p/d). Previous findings suggest
that while the average resident in developed countries uses the toilets six times a day at

Domestic Water Consumption
40
home, the average resident in Brazil, flushes the toilet in average five times a day.
Previous studies also suggest that Brazilian households wash fewer clothes with the
washing machine (0.1 load/p/day) than developed countries (0.4 load/p/day). One
reason for this might be explained through the use of the utility sinks to wash part of the
laundry (1.9 min/p/d).
2.5.2 Water-consuming activities
Although frequency of water usage provides data regarding the number of uses of water
appliances and the duration of tap-opening fixture events, they fail to provide
information regarding the activities related to water consumption. Even though previous
research have focused in evaluating water-using frequencies, Randolph and Troy
(2008) has set out to understand the activities which lie behind domestic water
consumption in Australia, through an evaluation of key water using facilities inside and
outside the home. The authors argue that understanding the different approaches of
water-using behaviour is very important, especially when attempting to encourage
households to reduce water consumption, and in trying to understand the attitudes being
taken by residents in order to promote water conservation in their home.
In their study, Randolph and Troy (2008) report that most residents in Australia washed
their dishes by hand daily, using a plugged sink to rinse their dishes. Three quarters of
the respondents rinsed their dishes before, during or after washing. Although
approximately half of the dwellings sampled possessed a dishwasher, only 10% of those
who had a dishwasher never used it. This survey in Australia found that on average,
residents washed their clothes around four times a week. Although a small portion of
residents washed their clothes by hands, almost every household used a washing
machine at home using economy settings on the machine. According to Randolph and
Troy (2008), about half of the respondents washed their cars at home using a bucket.
From those who washed their cars at home, said they only did so every six months or
less. Furthermore, the study indicated that most of the interviewed properties with a
lawn never watered it. Dwellings with garden beds, however, were more likely to water
their plants once or twice a week.

Domestic Water Consumption
41
As seen in Section 2.3.6, water consumption behaviour can be affected by
environmental knowledge or other external influences. In their research, Randolph and
Troy (2008) report that water restrictions had clearly prompted some changes in the way
water was used in Australian homes. Amongst different water-saving attitudes, their
findings indicated that the most common action taken to promote water conservation
was to reduce garden watering, take shorter showers and reduce car washing. The most
popular water-saving actions to be taken by residents were to control the bathroom
faucet while brushing teeth, fill the washing machine with clothes before use and use
economy settings. The authors report that a lack of interest to reuse water in the homes
was mostly related to high costs and impracticality.
2.6 Conclusion
This chapter has reviewed the literature regarding water demand and supply in a global,
country and regional scale, evaluating the Federal District’s fresh water availability and
water demand predictions. Clearly, water stress levels have been reached due to
population growth linked with a constant raise in per capita water consumption, and
because of this, new freshwater resources have to be drawn from far away. It is evident
that water resource management in the Federal District is being solely focused in an
engineering supply-side approach, feeding consumption as necessary, exacerbating local
resources, rather than controlling it through sustainable water demand management
programs.
In order to achieve a sustainable water demand management through water conservation
measures, it is crucial to understand what lies behind water consumption. This chapter
has reviewed the main drivers of domestic water consumption, such as the cost of water,
income, household size, dwelling characteristics, climate and even occupant behaviour.
It is evident that a clear understanding of the amount of water consumed per fixture or
appliance inside and outside a household is crucial to accurately predict domestic water
demand and evaluate the effectiveness of water conservation measures. Overall,
previous research indicates that domestic water end-use consumption can vary
according to building typology and household income. Furthermore, results from
previous studies suggest that water end-use frequencies within developed countries
might be higher than in developing countries.

Domestic Water Consumption
42
Although numerous studies have characterized domestic water end-use consumption in
developed countries, little research has been carried out in developing nations. Variables
such as the cost of water, income, household size, dwelling characteristics, climate and
occupant behaviour can vary from place to place. In Brazil, research in domestic water
end-use consumption is still in its infancy. The literature indicates that no study has
evaluated outdoor water end-use consumption, nor compared the water end-use
consumption patterns between different income ranges and building typologies.
Furthermore, due to their limited sample size generalizable data has not yet been
produced. Clearly, there is a gap in knowledge towards the understanding of domestic
water end-use consumption for low, medium and high income households, for the
different residential building typologies and occupant behaviour within the Brazilian
context.

43
Chapter3 Domestic Water Conservation

Domestic Water Conservation
44
3. Domestic Water Conservation
3.1 Introduction
As seen in the previous chapter, the constant raise in per capita water consumption and
population growth is putting pressure upon the Federal District’s local water supplies,
and to feed this growing demand, new freshwater resources are being drawn from far
away. The concept of water demand management, which focuses in controlling water
consumption to postpone or avoid the need to develop new water supply systems
through educational, economic, regulatory and water conservation measures (Butler and
Memon, 2006), has been ignored by the Federal District government. Clearly, water
resource management in the Federal District is merely supply-driven, rather than being
integrated with a water demand management approach to sustain existing water supplies
and secure new freshwater resources for future generations.
According to Vickers (2001, p.5), water conservation measures include “specific tools
(technologies) and practices (behaviour changes)... that result in more efficient water
use...”. The author argues that water conservation technologies are generally more
reliable in achieving long-term water savings. With this in mind, this chapter reviews
the state of the art demand-side (water efficient strategies) and supply-side (water reuse
systems) water conservation technologies for residential buildings available in the
Brazilian market.
3.2 Water efficient strategies
Grant (2006, p.83) defines water efficiency as the ability of “doing more with less”.
Water efficient technologies are capable of reducing water consumption through the
improved effectiveness in the use of water, without any necessary changes in water-
consuming habits and routines. This section reviews the state-of-the-art water efficient
technologies available in the Brazilian market and provides water use data gathered
from manufacturers’ specifications for water efficient toilets, faucets, showerheads,
flow regulators, washing machines, washing equipments and irrigation systems.

Domestic Water Conservation
45
3.2.1 Toilets
There are two basic types of toilets: (i) waterless toilets, and (ii) flush toilets. Waterless
toilets require no water for flushing and waste is commonly stored or treated on-site.
Flush toilets on the other hand, rely on water to discharge waste down the drainpipe,
and usually, transports it to another location for treatment.
3.2.1.1 Waterless toilets
According to Vickers (2001) waterless toilets include composting, incinerator, vacuum,
oil-flush and chemical toilet units. Composting toilets convert human waste into humus
and require a vented, drained chamber with adequate access for a periodic removal of
the compost (Grant et al., 2005). Composting toilets are not a suitable option within
urban areas, but can be an excellent solution for permaculture and remote sites without
reliable water supply or piped sanitary system (EA, 2007). Incinerator toilets use
electricity or butane to burn wastes, leaving an innocuous fine ash by-product, and are
commonly used in boats or remote locations where plumbed or composting toilets are
not practical (Vickers, 2001). Vacuum toilets use negative atmospheric pressure created
by a pumping station, to suck human waste into a sewage collection or treatment
chamber. Vacuum toilets are common in ships, trains and airplanes. In buildings,
however, such technology requires a vacuum sewage collection system and is mainly
applicable on sites with high water tables, unstable soil or restricted building conditions
(TIGRE, 2005). Oil recirculating toilets use mineral oil rather than water to flush the
toilet. Human wastes washed out by the oil medium, which is filtered and reused in the
toilet, are separated and contained in a holding tank for adequate disposal (EPA, 2000).
Oil-flush toilets are not widely used, but can be an option for remotely located, water
scarce areas. Chemical toilets are another way of storing human waste using chemicals
to disinfect and deodorize waste. Chemical toilets are portable toilets often used on
construction sites, outdoor gatherings and in caravans (Grant et al., 2005). Waterless
toilets are commonly used in public transports or remote sites with inadequate water
supply and piped sanitary system. Clearly, the use of waterless toilets in urban
residential homes is an unconventional practice. Therefore, this research has focused in
the use of water-flushing toilets for Brazilian dwellings.

Domestic Water Conservation
46
3.2.1.2 Low-flush toilets
In Brazil, there are two types of flush toilets: (i) tank-style toilets and (ii) tankless
toilets. Tank-style toilets use a cistern to hold the correct amount of water required to
flush the toilet bowl. In case of low-flush toilets, a 6 litre cistern is used (i.e. Astra,
2009; Hervy, 2010; Roca, 2008). Tankless toilets are operated by a high pressure flush
valve which allows gravity-driven mains water from a loft water tank to flow directly
into the toilet bowl for flushing waste (Figure 3.1). Since they have no cistern, tankless
toilets have zero recharge time. Traditionally, high-pressure flush valves have been
associated with water wastage since they allow mains water to run freely while the flush
valve is being pressed (Schmidt, 2004).
Figure 3.1 Tankless high-pressure flush valve toilet.
Source: Adapted from (Docol, 2010b)
In recent years however, low-flow high pressure flush valves have been introduced into
the Brazilian market, limiting their flush volume to 6 litres, by allowing only a specific
amount of water to pass from the supply line into the toilet whilst the flush valve is
being pressed (Fabrimar, 2010; Hydra, 2007). It is crucial, however, to express the fact
that low-flush toilets require 6 litre per flush (lpf) toilet bowl designs in order to activate
the siphon effect for flushing waste. Results from a previous study carried out with

Domestic Water Conservation
47
Brazilian toilets indicated that conventional 12 lpf toilet bowls, failed to discharge waste
using 6 litre flushing mechanisms (Santos et al. (1998) quoted by Junior (2002).
3.2.1.3 Dual flush toilets
Dual flush toilets use 6 lpf toilet bowl designs integrated with a flushing mechanism
which provides users the option of flushing toilets with 3 or 6 litres of water. Since
liquid waste require less water for discharge, a 3 litre flush volume can be used for a
minimal flush. Solid waste on the other hand, requires a full 6 litre flush in order to
completely remove the waste from the toilet bowl.
Figure 3.2 Dual flushing mechanisms for tank-style toilets (a) and tankless toilets (b)
(a) Cistern dual flush mechanism (b) Wall-mounted dual flush valve
Sources: Deca (2003) and Hydra (2007), respectively.
Two different types of dual flushing mechanisms can be found in the Brazilian market:
(i) cistern dual flush and (ii) dual flush high-pressure valves. Cistern dual flush
mechanisms are used on tank-style toilets and can be used as a retro-fitting device for
existing low-flush toilets with 6 litre cisterns and toilet bowls (Deca, 2003; Roca, 2008).
Dual flush high-pressure valves are used on tankless toilets and they can also be used as
retrofitting devices with low-volume toilet bowls (Docol, 2010a; Fabrimar, 2010;
Hydra, 2007).

Domestic Water Conservation
48
3.2.2 Water faucets
Water faucet fixtures operate as valves to control the release and flow of water for
determined indoor and outdoor water-using activities (Schmidt, 2004). Water faucets
are commonly found in bathrooms, kitchens and utility rooms for indoor activities
related to personal hygiene, cooking, drinking and washing. Outdoor faucets, or external
taps, are generally used for garden irrigation and floor washing. Automatic faucets and
sensor faucets prevent water wastage and flooding where faucets can be left running
(EA, 2007). Although these fixtures are commonly used in public buildings, they can
also be applied to residential dwellings.
3.2.2.1 Automatic faucets
Automatic self-closing faucets use a hydro-mechanical valve to limit the flow of water
for a preset period (Deca, 2010; Docol, 2010a; Fabrimar, 2010). When the user presses
the button to deliver water flow, the faucet automatically closes after a delay period.
Generally, 7 second delay periods are often used, and according to Brazilian Standards
the operating time of automatic faucets should not be greater than 15 seconds (ABNT,
1996). When compared to standard faucets, automatic faucets use 20% less water
(SABESP, 1996).
Figure 3.3 Automatic bathroom faucet
Source: Docol (2010a)
Although automatic faucets are ideal for public washrooms, the Brazilian market has
recently introduced a new version for residential bathrooms (Docol, 2010a). Figure 3.3

Domestic Water Conservation
49
shows an automatic bathroom faucet designed for residential purposes. A previous
study carried out in Brazil, installed automatic bathroom faucets in 13 low income
dwellings to evaluate their applicability (Vimieiro and Pádua, 2005). Results indicated
that, apart from one dwelling, most residents did not feel that the use of automatic
faucets in bathrooms was inconvenient to them. Hence, this study has included
automatic bathroom faucets for analysis.
3.2.2.2 Sensor faucets
Sensor faucets make use of an infrared sensor mechanism connected to a solenoid valve
that controls water flow (Gonçalves et al., 1999). The sensor is composed of an infrared
transmitter and a receiver. The transmitter emits a continuous infrared signal (a) and
once the presence of hands is detected by the receiver, the solenoid valve is activated,
releasing water for use (b). The solenoid valve terminates the flow of water (c), once the
hands are removed from the sensor range (Figure 3.4).
Figure 3.4 Sensor faucet operation
(a) (b) (c)
Source: Schmidt (2004)
Sensor faucets can be powered by a low voltage transformer or set of alkaline batteries.
Battery-driven sensor faucets avoid the need of an electrical source of mains electric
power supply, and can easily replace existing faucets. Some models are equipped with
both mains supply and set of batteries. In this case, the batteries act as auxiliary power
when there is a lack of mains supply (Gonçalves et al., 1999).
When compared to standard faucets, sensor faucets use up to 70% less water by
effectively reducing the time of water flow (Deca, 2010; Draco, 2010c). Although

Domestic Water Conservation
50
sensor faucets are commonly applied to public bathrooms they can be easily applied to
domestic bathrooms. Furthermore, a new sensor faucet for kitchen use has emerged in
the market, containing an articulate spout with adequate distance and height for kitchen
sinks (Draco, 2010d).
3.2.3 Low-flow showerheads
Low-flow showerheads improve water use efficiency through the use of devices which
reduce water flow rates without losing effectiveness and the feeling of satisfaction by
users (figure 3.5). Low-flow shower heads can reduce water consumption by
modulating the flow rapidly or by aeration (Griggs and Burns, 2009).
Figure 3.5 Low-flow showerhead
Source: Fabrimar (2010)
Low-flow showerheads commonly contain an embedded flow regulator to reduce water
consumption. Some low-flow showerheads mix air with water to provide a larger spray
area to create a sensation of ample water, yet at reduced volumes (i.e. Draco, 2010a).
Other low-flow showerheads provide a narrower spray area without losing pressure to
the reduced flow rate (i.e. Fabrimar, 2010). Independent of the spray pattern, reduced
flow rates from showerheads can reach to a minimum 4.5 litres per minute (Draco,
2010a).

Domestic Water Conservation
51
3.2.4 Flow regulators
Flow regulators are fittings capable of limiting the flow rate of faucets and
showerheads. In Brazil, flow regulators can be terminally-fitted in fixtures or wall
mounted (Figure 3.6).
Figure 3.6 Wall-mounted (a) and terminally-fitted (b) flow regulators
(a) (b)
Source: Fabrimar (2010)
Wall-mounted flow regulators are commonly installed at the feeding point of the water
supply pip (Docol, 2010a; Fabrimar, 2010). These devices act as a flow-restricting valve
providing a physical constriction that controls water flow. The water flow rate is
adjusted using a screw-driver. In multi-storey buildings, gradual adjustments according
to floor level can avoid extreme water pressure on lower floor levels and inadequate
water pressure on high floor levels. Furthermore, wall-mounted flow regulators can act
as an isolation valve, facilitating individual fixture repair and maintenance.
It is important however, to consider the fact that DIY adjustments are made ‘visually’
without obtaining precise water flow rates. Moreover, users could change efficient
settings to increased flow rates so that the water pressure ‘feels’ right. The use of
terminally-fitted flow regulators inside fixtures avoids these problems.
Overall, terminally-fitted flow regulators are a cheaper option and can be simply fitted
or screwed in faucets or showers. These devices can be purchased with different flow
rates and outlets. Commercially available flow rates for showers range from 3 to 18

Domestic Water Conservation
52
litres per minute and faucets, from 1.8 to 7.5 litres per minute, depending on the type of
outlet used (Deca, 2010; Docol, 2010a; Draco, 2010b; Fabrimar, 2010). Faucet aeration
outlets (also known as aerators) reduce water flow rates by inserting air in the water as it
is being used. However, aeration outlets are only capable of aerating water above a
determined flow rate and pressure, spray outlets on the other hand, can function at much
lower flow rates (Griggs and Burns, 2009).
Although flow regulators are simple retrofit devices, it is crucial, to firstly measure
existing flow rates from fixtures to verify if the measured flow rate is not less than or
equal to the specified rates from flow regulators.
3.2.5 High-efficiency washing machines
In Brazil, the capacity of clothes washing machines ranges from 5kg to 15kg, and as a
general rule, the higher the capacity of the washing machine, the more water it uses
(Brastemp, 2008; Consul, 2010; Eletrolux, 2010b). Another factor which affects the
volume of water usage by washing machines is age. Older washing machines have a
tendency to use more water to wash clothes since the efficiency of washing machines
has been increasing in the last years (Vickers, 2001).
Figure 3.7 Operating design and relative water levels of top-load, vertical-axis washing
machines (a) and front-load, horizontal-axis washing machines (b).
(a) (b)
Source: Vickers (2001)

Domestic Water Conservation
53
There are two main types of washing machines available in the Brazilian market: (i)
top-load and (ii) front-load models. Top-load washing machines contain a vertical-axis
tub to wash clothes using a central agitator to clean and rinse clothes (Figure 3.7a).
Front-load washing machines on the other hand contain horizontal-axis tubs to wash
clothes through a tumbling motion for cleaning and rinsing (Figure 3.7b). Due to their
operating design, front-load washing machines require lower levels of water than top-
load washing machines, hence, promoting a higher efficiency in water usage (Vickers,
2001). Although top-load washing machines are the most common model available in
the Brazilian market, some front-load washing machine models can be found (Eletrolux,
2010b; LG, 2010).
The type of washing programme and water level settings used for washing clothes can
have an influence over the amount of water used in a washing machine. In general,
different levels of water settings can be selected according to the amount of clothes to
be washed. While some recent models automatically set water levels according to the
quantity of clothes put inside the tub (Brastemp, 2008; LG, 2010), others contain water
level indications which allow the user to identify the most appropriate setting for the
amount of clothes to be washed (Consul, 2010; Eletrolux, 2010b). Although water usage
of standard washing machines can reach up to a maximum 300 litres per load
(Brastemp, 2008), high efficiency washing machines use a maximum of 74 litres per
load (Eletrolux, 2007).
Figure 3.8 Washing machine with programmed settings to facilitate grey water reuse
Source: Eletrolux (2010a)

Domestic Water Conservation
54
Another recent feature added to Brazilian washing machines, are programmes which
promotes the reuse of grey water (Eletrolux, 2010a). Some people store grey water from
washing machines in buckets, butts or plugged utility basins for reuse (see Chapter 5,
Section 5.5.2 and Section 3.3.2 from this chapter), and to facilitate this activity, some
new washing machines contain a ‘water reuse’ programme that can pause the washing
operation allowing the user to place its flexible discharge hose at a bucket, butt or
plugged utility basin for later reuse (Figure 3.8).
3.2.6 Pressure washers
Pressure washers are mechanically-driven appliances that use high-pressure water to
clean and remove dirt from surfaces and objects (Figure 3.9). Pressure washers are
available in different powers and flow rates, ranging from domestic to commercial
purposes. Pressure washers for domestic applications, such as floor and vehicle
washing, produce a high-pressure stream of water ranging from 100 to 140 Bar with a
restricted water flow rate from 5.5 to 7.7 litres per minute (Black&Decker, 2008;
Karcher, 2010).
Figure 3.9 Domestic pressure washer
Source: Karcher (2010)
Pressure washers use air-assisted nozzle guns that control water flow and can be
adjusted from wide fan spray to single jet spray (Bosch, 2010). Furthermore, some

Domestic Water Conservation
55
pressure washers are designed to include additional accessories and cleaning agents to
enhance performance and increase the effectiveness of the cleaning process, hence
reducing time and avoiding water wastage.
Generally, pressure washers are connected to mains water supply, and in order to
achieve water savings, it is crucial to use a pressure washer whose flow rate is lower
than those from external taps. Since pressure washers contain high-pressure water
pumps, they can also be connected to treated rainwater or grey water tanks or butts to
assist water reuse.
3.2.7 Automatic shut-off nozzles
In Brazil, hand-held hose pipes are typically used for floor washing, vehicle washing
and garden irrigation. Their misuse, however, can lead to high rates of water wastage.
Unattended hose pipes with running water during a water-consuming activity are
common scenes of water wastage in Brazilian dwellings. The use of automatic shut-off
nozzles in the end line of hose pipes, however, are capable of providing a more efficient
use of water, by controlling flow according to user operation (Vickers, 2001).
Figure 3.10 Automatic shut-off nozzle with multiple spray patterns
Source: Aquacraft (2008)
Some automatic shut-off nozzles are available in multiple spray patterns which allow
users to choose the most appropriate pattern to effectively direct water where is needed
(EA, 2007). An example of an automatic shut-off nozzle with multiple spray patterns is

Domestic Water Conservation
56
shown in Figure 3.10. According to Vickers (2001), the use of automatic shut-off
nozzles are expected to save 5 to10% of water used in hose pipes.
3.2.8 Automatic irrigation systems
Garden areas can be irrigated manually, or through the use of automatic irrigation
systems. In Brazil, manual irrigation is usually done through the use of hand-held hose
pipes and portable sprinklers placed on the lawn. Hand-held hose pipes are commonly
used on small turf areas and plant beds, while sprinklers and perforated hoses are
generally applied to larger gardens.
Water efficient irrigation equipments and practices are capable of promoting water
reductions by ensuring that water is only applied when, and where it is needed (Vickers,
2001). Manually-driven irrigation can lead to an uncontrolled and ineffective usage of
water. Equipments such as hose pipes and sprinklers, can lead to significant water losses
if left unattended. According to Vickers (2001) soil becomes saturated after being
watered for 10 to 15 minutes and he argues that in order to irrigate hard-to-reach areas,
residents often place manually operated sprinklers in ways that the spray pattern
overlaps the irrigable area.
Automatic irrigation systems on the other hand, make use of devices to increase
effectiveness and promote water efficiency. According to QWC (2009), water efficient
irrigation systems contain a network of permanent piping connected to effective
watering devices installed to water specific plants or landscape area. Efficient sprinklers
with variable spray patterns and angles are commonly used for watering turf areas by
applying water uniformly across the garden and effectively watering hard-to-reach
areas, while soaker hoses can be used for drip-irrigation at the foot of trees, shrubs and
flowers (Bilderback and Powell, 1996).
Efficient irrigation also involves scheduling effective watering periods based on plant
needs. Flow control devices (Figure 3.11a) are capable of providing an automated
irrigation schedule according to specified duration and frequency settings. Soil moisture
sensors (Figure 3.11b) connected to flow control devices are capable of managing the

Domestic Water Conservation
57
irrigation system according to soil moisture level, boosting efficiency and saving water
(Gardena, 2010).
Figure 3.11 Automatic flow control device (a) and soil moisture sensor (b)
(a) (b)
Source: Gardena (2010)
3.2.9 Water leakage repair
Water leakage reduces system efficiency, leads to water wastage and increases water
consumption and costs. Even slow continuous flows of water leakage can lead to
significant amounts of water loss if not fixed promptly (EA, 2007). Table 3.1 shows the
estimated water loss rates from common visible leaks at water fixtures and appliances
inside the home (Sautchuk et al., 2005).
Table 3.1 Estimated water loss from visible leaks
Water Fixture/Appliance Leakage Flow Rate Estimated Water Loss
Faucets and External Taps
Slow dripping leakage 6 to 10 litres/day
Medium dripping leakage 10 to 20 litres/day
Fast dripping leakage 20 to 32 litres/day
Fast-flow dripping leakage > 32 litres/day
2mm stream > 144 litres/day
4mm stream > 333 litres/day
Leakage at supply line 0.86 litres/day
Toilets
Visible leak (ripple effect in toilet bowl) 144 litres/day
Leakage at supply line 144 litres/day
Stuck high-pressure flush valve 1.6 litres per second
Showers Leakage at shower valve 0.86 litres/day
Leakage at supply line 0.86 litres/day Source: ANA et al. (2005, p.34)

Domestic Water Conservation
58
Overall, visible leaks can be avoided through simple maintenance or easily repaired
through the replacement of worn parts. Water losses in toilets generally occur within the
flushing mechanism, and are commonly caused by worn or deteriorated valve fittings
and poorly sized replacement parts and adjustments (Vickers, 2001) . The author also
points out that faucet leak repairs and adjustments include the replacement of worn
washers, tightening of faucet stem or base and replacement of packing nut. Shower
leakage generally occur at their valves due to worn out washers or valve seat grinders,
however, leakage at showerhead connections should also be taken into consideration
(ANA et al., 2005).
Invisible leaks can occur within the mains water supply pipe, pipes inside walls or loft
header tanks (SABESP, 2010). Overall, invisible leaks are difficult to detect and to
estimate water loss. Invisible leakage repair within supply or distribution pipework
might require digging-up the ground or breaking walls in order to fix the problem.
Leakage repair at loft header tank can be done by regulating or replacing float valves.
3.3 Water reuse systems
Domestic water reuse systems are supply-driven water conservation measures which
make use of alternative sources of water for non-potable end-uses such as irrigation,
toilet flushing, floor, vehicle and clothes washing. Supply-side water conservation
measures are based on the concept of identifying alternative sources of water to
substitute the use of potable water in activities which do not require such high standards
of water quality (Alegre et al., 2004; Kim et al., 2007; Sakellari et al., 2005).
Alternative sources of water for domestic water reuse systems include rainwater, grey
water and wastewater (Diaper et al., 2001; Wilson and Navaro, 2008; Winward et al.,
2009). This section provides an overview of commercially available rainwater
harvesting (RWH), grey water recycling (GWR) and wastewater reclamation (WWR)
systems for non-potable domestic water reuse in residential buildings in Brazil.
According to Kim et al. (2007) the level of water quality for reclaimed water, should
correspond to its intended application. Brazilian water supply regulations NBR 5626
(ABNT, 1998) allows the use of reclaimed water for non-potable end-uses which are not
required to meet the potable standards established by the Ordinance no 518 of the

Domestic Water Conservation
59
Ministry of Health in Brazil (Saúde, 2004). However, NBR 5626 requires that should be
no cross-connections between potable reclaimed water pipework and there is back-flow
protection to avoid mains water contamination.
In other words, the use of alternative sources of water in buildings implies ‘water
production’, and therefore, specific care must be taken in order to guarantee a minimum
standard of water quality. Although the installation of water reuse systems in residential
buildings in Brazil is not prohibited, the National Water Agency (ANA) provides
detailed water quality standards based on aesthetic, microbiological, chemical and
physical parameters regarding reclaimed water quality for non-potable end-uses. The
necessary water quality standard to be met depends on specific categories of non-
potable water end-uses (ANA et al., 2005):
• Reclaimed water for garden irrigation or floor washing
- Should be odourless;
- Should not contain components which might damage plants or promote
micro-organisms growth;
- Should not be abrasive or stain surfaces;
- Should be free of microbial infection or contamination harmful to human
health.
• Reclaimed water for vehicle washing
- Should be odourless;
- Should not be abrasive or stain surfaces;
- Should be free of dissolved solids;
- Should be free of microbial infection or contamination harmful to human
health.
• Reclaimed water for toilet flushing
- Should be odourless;
- Should not be abrasive, stain surfaces or deteriorate water fittings and
fixtures;
- Should be free of microbial infection or contamination harmful to human
health.
• Reclaimed water for clothes washing
- Should be colourless, odourless and free of turbidity;

Domestic Water Conservation
60
- Should not be abrasive, stain surfaces, or deteriorate water fittings and
appliances;
- Should be free of dissolved solids, metals and algae;
- Should be free of microbial infection or contamination harmful to human
health.
It should be noted, however, that this study focuses in the use of commercially available
water treatment units to avoid issues related with water quality and meet the standards
described above, according to the specified categories of domestic water end-uses.
Although water reuse systems come in different arrangements, overall, they contain
similar processes and components, based on (Leggett et al., 2001a) Sant’Ana and
Amorim (2007) provide a conceptual description of the composition of water reuse
systems installations within the Brazilian perspective (Figure 3.12).
Figure 3.12 Conceptual flow diagram of water reuse system composition
Source: Sant’Ana and Amorim (2007)
In general, a network of collection pipes is used to collect and deliver alternative
sources of water (such as rainwater, grey water or wastewater) to a collection tank or, in
some cases, directly to points of use (Leggett et al., 2001a).

Domestic Water Conservation
61
The level of treatment, be it through biological, chemical or physical processes, varies
according to the initial quality of the reclaimed water and its desired final quality, to be
met according to specific categories of water reuse (Tchobanoglous et al., 2003).
After treatment, reclaimed water can then be stored inside a collection tank, whose
design generally includes a manhole for maintenance and cleaning, an overflow
mechanism for excess water as well as a backflow prevention device, and whose
dimensions are estimated according to reclaimed water supply and demand rates
(ABNT, 1994; ABNT, 2007).
Water pumps can be operated manually to transport reclaimed water directly to points
of use (i.e. irrigation, floor and vehicle washing), or they can be operated by level
switches to feed a non-potable water distribution header tank at building loft level for
gravity-fed indoor end-uses such as toilet flushing and clothes washing. Water pumps
should be adequately dimensioned to supply water according to the required header tank
height and they must be protected from dry running (ABNT, 1992).
Non-potable water distribution header tanks should be connected to mains water supply
in case of system malfunction or lack of adequate quantity of reclaimed water to meet
demand (Sant'Ana and Amorim, 2007). Figure 3.13 provides an example of potable and
non-potable water header tank configuration.
High and low level switches can be used to activate and deactivate the water pump to
supply reclaimed water to the non-potable water header tank. A solenoid valve controlled
by a level switch located inside the non-potable water header tank starts and stops the mains
top-up function, ensuring that a minimum amount of water is available to supply the non-
potable end-uses at all times.
To comply with Brazilian water supply regulations, the header tanks should be covered,
contain an overflow/warning pipe and a cleaning outlet (ABNT, 1998). Furthermore, an
air gap arrangement should be provided with an adequate distance between mains water
inlet and non-potable water feeding in order to prevent mains contamination. The air
gap must be greater than or equal to, two times the sum of the inlet pipe diameters.

Domestic Water Conservation
62
Figure 3.13 Potable and non-potable water header tank configuration
Non-potable water distribution pipework should be installed as a separate water supply
system from mains water pipework and dimensioned according to demand (ABNT,
1998). Non-potable water pipework should be colour coded for identification and points
of non-potable water consumption should contain graphical signs fitted with the words
‘non-potable water’ (ABNT, 2007).
3.3.1 Rainwater harvesting systems
Rainwater harvesting (RWH) systems collect rain through an impervious surface and,
rather than allowing storm water to drain away, runoff is treated and stored for later use
(Fewkes, 2006). Harvesting rainwater is a simple concept that might promote self-
sufficiency, saves mains water and is capable of minimising erosion, sedimentation and
flooding caused by urban runoff (Woods-Ballard et al., 2007). Historically, the
collection, storage and reuse of rainwater has been employed by different civilisations
throughout the world (Gould and Nissen-Petersen, 1999) and has evolved drastically in
the past years to state-of-the-art, commercially available rainwater reuse products
(Herrmann and Schmida, 1999).
Previous works indicate that treated rainwater can be safely used for irrigation, toilet
flushing and washing (i.e. Fewkes, 1999; Jones and Hunt, 2010; Li et al., 2010;
Villarreal and Dixon, 2005), and if adequately sterilized, rainwater can even be used for
potable purposes (i.e. Amin and Han, 2009; Helmreich and Horn, 2009; Peter-Varbanets

Domestic Water Conservation
63
et al., 2009). However, Brazilian water supply regulation NBR 5626 does not allow the
application of reclaimed water sources of water for potable end-uses (ABNT, 1998).
According to the norm (ABNT, 1998, p.8), “the supply of potable water should only be
carried out by the public mains water facility company”. Concessions for the use of
alternative sources of water for potable end-uses might be obtained for specific cases
where mains water is not supplied, as long as potable water standards are achieved and
controlled in accordance to the Ordinance no. 518 of the Ministry of Health, under the
responsibility of the public mains water facility company (Saúde, 2004).
Since this study deals with the urban setting of the Federal District, where mains water
supply is readily available, this research has focused on rainwater harvesting systems
for non-potable water end-uses.
3.3.1.1 Rainwater quality
Rainwater is relatively pure and low in contaminants. However, the water quality of
collected rainwater can be affected by atmospheric pollutants during precipitation and
by physical, chemical and microbiological contaminants during run-off (Evans et al.,
2006; Lye, 2009; Spinks et al., 2003). According to Leggett and Shaffer (2002), the
main contaminants of harvested rainwater include:
• bird droppings
• leaves and other organic matter
• dust and grit
• airborne chemical pollutants; these usually occur near to their source (e.g. local
industry) and, as such, should not represent an additional health threat
• where rainwater is collected from paved areas at ground level, it may be
contaminated by dirt, silt, plant debris, animal faeces
Previous studies indicate that the water quality of harvested rainwater is directly linked
to system design and material selection (Lye, 2009). Ward et al.(2010) outline the
importance of appropriate rainwater harvesting system design and material selection to
optimise the quality of harvested rainwater.

Domestic Water Conservation
64
3.3.1.2 System components and design
The design and installation of rainwater harvesting systems in Brazil should comply
with the Brazilian rainwater reuse regulation NBR 15527 (ABNT, 2007) in order to
guarantee the safe reuse of harvested rainwater from roof areas in urban areas for non-
potable end-uses.
The simplest form of a rainwater harvesting system can be obtained by simply
connecting a water butt or tank to a downpipe for external end-uses of non-potable
water (Woods-Ballard et al., 2007). The extraction of the stored rainwater can be done
manually, or through the aid of a water pump. More complex RWH systems store larger
quantities of rainwater and supply water for use within buildings. Leggett et al. (2001a)
categorizes RWH systems according to the way rainwater is supplied to points of use:
(i) directly pumped, (ii) indirectly pumped and (iii) gravity fed systems.
Since mains water is indirectly fed to points of use through a loft header tank, indirectly
pumped rainwater harvesting systems has been considered as the more appropriate
design for Brazilian buildings. Figure 3.14 on the next page illustrates a generic
composition of an indirectly pumped RWH system (Sant'Ana and Amorim, 2007).
Although rainwater can be harvested from roofs and other surfaces around the
buildings, such as paved areas and car parks, ground catchment surfaces are more likely
to contain higher levels of pollutants such as oil and faecal material which can
significantly affect the quality of the harvested rainwater (EA, 2008b). Therefore, to
reduce the level of treatment required for reuse and avoid potential health hazards to
occupants, the Brazilian norm NBR 15527 has limited the collection of rainwater run-
off only from roof-tops (ABNT, 2007).
The volume of rainwater collected is estimated according to the product of the
horizontal plan area of the roof and local average rainfall data (Fewkes and Warm,
2000). However, not all of the rain falling on roof areas can be collected, as some of the
run-off is lost due to processes such as depression storage and evaporation (Gould and
Nissen-Petersen, 1999). Such losses are quantified using a run-off coefficient that
represents the portion of rainwater collected from the roof in comparison to an idealised
catchment from which no losses occur (Fewkes and Warm, 2000). In order to account

Domestic Water Conservation
65
for losses during run-off, the effective volume of rainwater collected can be determined
by multiplying the run-off coefficient to the volume of rainwater collected. Leggett et
al. (2001a) provides run-off coefficients relative to roof types (Table 3.2).
Figure 3.14 Generic composition of a rainwater harvesting system
(a) Catchment Area (b) Collection Pipework (c) Filter (d) Rainwater Cistern (e) Calmed Inlet (f) Overflow (g) Suction Pipe with
Floating Filter (h) Water Pump (i) Distribution Pipework (j) Header Tank (k) Potable Water Feed (l) Solenoide Valve
Source: Sant’Ana and Amorim (2007)
Table 3.2 Run-off coefficients relative to roof types
Roof Type Run-off Coefficient
Pitched roof tiles 0.75 – 0.9
Flat roof smooth surface 0.5
Flat roof with gravel layer or thin turf 0.4 – 0.5 Source: Leggett et al. (2001)
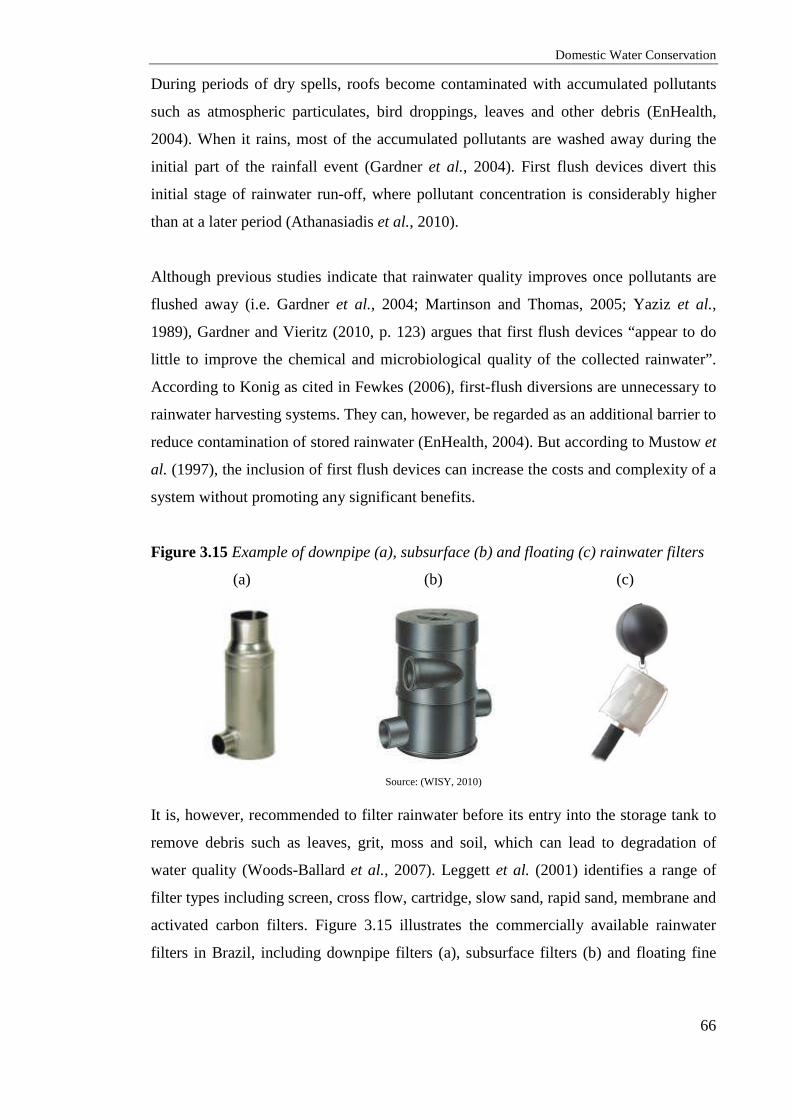
Domestic Water Conservation
66
During periods of dry spells, roofs become contaminated with accumulated pollutants
such as atmospheric particulates, bird droppings, leaves and other debris (EnHealth,
2004). When it rains, most of the accumulated pollutants are washed away during the
initial part of the rainfall event (Gardner et al., 2004). First flush devices divert this
initial stage of rainwater run-off, where pollutant concentration is considerably higher
than at a later period (Athanasiadis et al., 2010).
Although previous studies indicate that rainwater quality improves once pollutants are
flushed away (i.e. Gardner et al., 2004; Martinson and Thomas, 2005; Yaziz et al.,
1989), Gardner and Vieritz (2010, p. 123) argues that first flush devices “appear to do
little to improve the chemical and microbiological quality of the collected rainwater”.
According to Konig as cited in Fewkes (2006), first-flush diversions are unnecessary to
rainwater harvesting systems. They can, however, be regarded as an additional barrier to
reduce contamination of stored rainwater (EnHealth, 2004). But according to Mustow et
al. (1997), the inclusion of first flush devices can increase the costs and complexity of a
system without promoting any significant benefits.
Figure 3.15 Example of downpipe (a), subsurface (b) and floating (c) rainwater filters
(a) (b) (c)
Source: (WISY, 2010)
It is, however, recommended to filter rainwater before its entry into the storage tank to
remove debris such as leaves, grit, moss and soil, which can lead to degradation of
water quality (Woods-Ballard et al., 2007). Leggett et al. (2001) identifies a range of
filter types including screen, cross flow, cartridge, slow sand, rapid sand, membrane and
activated carbon filters. Figure 3.15 illustrates the commercially available rainwater
filters in Brazil, including downpipe filters (a), subsurface filters (b) and floating fine

Domestic Water Conservation
67
filters (c) attached to the extraction hose pipe inside the rainwater cistern (3P-Technik,
2010; WISY, 2010).
The purpose of filtration is to remove impurities from the rainwater before its storage
and extraction. Commercially available self-cleaning rainwater filters are selected
according to their capacity to filter rainwater, which is estimated according to the roof
area used for rainwater collection (3P-Technik, 2010; WISY, 2010). During the process
of filtration, some rainwater is lost while removing debris to a soakaway or run-off
drain. To account for this loss, Leggett et al. (2001) suggests the application of a filter
coefficient for the calculation of the effective volume of rainwater collected. The filter
coefficient is determined according to the efficiency of the filter used. In average,
commercially available self-cleaning rainwater filters are 90% efficient, in other words,
they contain a filter coefficient of 0.9 (3P-Technik, 2010; WISY, 2010).
A rainwater collection tank (or cistern) is required to store rainwater because rainfall
events occur more erratically than demand (Fewkes, 2006). Rainwater cisterns can be
constructed from a variety of materials such as fibreglass, polypropylene, wood, metal,
concrete and fibrocement (TWDB, 2005). In Brazil, commercially available rainwater
cisterns can be found in 3, 5 and 10 m3 modular volumes, composed of high-density
polyethylene designed to be placed below the ground (Acqualimp, 2010; Fortlev,
2010). Apart from aesthetics and space-savings, the main advantage of installing
rainwater cisterns underground, is that it protects the tank from daylight and helps to
regulate the temperature of the water inside the tank, limiting algal and bacterial growth
(EA, 2008b).
According to Fewkes (2006), in addition to filtration, further treatment of the collected
rainwater occurs inside the rainwater cistern through sedimentation and floatation.
When filtered rainwater enters the collection tank, fine particulates can still be found in
the water. Particles which are denser than water settle to the bottom of the tank, where a
beneficial biofilm composed of aerobic bacteria can develop, adding an additional stage
of biological treatment. In order to avoid the disturbance of this sedimentation as
rainwater is fed inside the tank, a calmed inlet is used to maintain the quality of the
filtered rainwater. Particles that are less dense than water float to the surface, and

Domestic Water Conservation
68
therefore, a floating suction pipe is used to extract rainwater at its cleanest point, just
below the surface. Floating filters connected to the suction pipe can also be used as a
fine mesh filter to improve water quality. The cistern should be designed to overflow at
least twice a year for the removal of these particles.
The performance of a rainwater harvesting system is related to the storage capacity of
the rainwater cistern and the balance between rainwater supply and demand. According
to Fewkes and Butler (2000), the storage capacity of the rainwater tank is important
both economically and operationally since the storage capacity will influence:
• the volume of mains water conserved;
• the installation costs of the system;
• the length of time rainwater is retained, which affects the final quality of the
water supplied;
• the frequency of system overflow, which affects the rate of removal of surface
pollutants;
• the volume of water overflowing into the surface water drain or soakaway.
Fewkes (2006, p.40) defines a rainwater cistern as “a reservoir, which receives
stochastic inflows (rainwater) over time and is sized to satisfy the demand on the
system”. Two main techniques for sizing reservoirs have been identified by McMahon
and Mein (1978): (i) Moran related methods and (ii) critical period methods.
Moran related methods are a development of Moran’s theory of reservoir storage, where
a system of simultaneous equations is used to relate reservoir capacity, demand and
supply, and the analysis is based upon queuing theory (Fewkes and Butler, 2000).
However, according to Fewkes (2006), by using this approach, solutions are only
possible for idealized conditions. Furthermore, this method has not been widely applied
to rainwater collectors. They are primarily used for predicting the probability of failure
of a reservoir with a given capacity (i.e. Ragab et al., 2001). This approach was
considered irrelevant, since it is not the intention of this study to assess the failure rates
from rainwater cisterns.

Domestic Water Conservation
69
Critical period can be defined as a period during which a reservoir goes from a full
condition to an empty condition (McMahon and Mein, 1978). Critical period methods
determine storage capacity through the use of sequences of flows derived from historic
data, where demand exceeds supply (Fewkes and Butler, 2000). Fewkes (2006)
subdivides these methods into two categories: (i) mass curve and (ii) behavioural
analysis.
The mass curve method, developed by Rippl in 1883, involves the identification of an
ideal storage capacity based on the critical periods of the data using the maximum
cumulative difference of a variable inflow (rainwater supply) and a constant outflow
(demand). With regards to a rainwater harvesting system, a cistern will perform
adequately provided the relationship shown in Equation 3.1 is satisfied (Fewkes, 2006).
≥ � � � � ��� − �������
��� (3.1)
C = Storage Capacity Qt = Demand during time interval, t St = Supply during time interval, t
Although mass curve is a simple method that identifies the ideal rainwater storage
volume, it is not possible to compute mains water savings for different storage volumes.
Behavioural analysis on the other hand, is capable of simulating the performance of a
number of storage capacities.
Behavioural analysis simulates the operation of a reservoir with time. Here, the changes
in storage content of a finite reservoir are calculated using Equation 3.2 (McMahon and
Mein, 1978).
0� = 0�12 + �� − �� − ∆5� − 6� (3.2)
Subject to 0 ≤ Vt-1 ≤ C Vt = Storage volume at time interval, t Vt-1 = Storage volume at time interval, t-1 St = Supply during time interval, t Qt = Demand during time interval, t ΔEt = Net evaporation loss during time interval, t Lt = Other losses during time interval, t �i.e. seepage C = Storage Capacity

Domestic Water Conservation
70
However, commercially available rainwater cisterns in Brazil are essentially water tight
and designed to be used underground, protected from daylight. Therefore, net
evaporation loss (∆E), and other losses (L) such as seepage can both be ignored.
The volume of rainwater at the end of a determined time interval (Vt) is therefore equal
to the volume of rainwater from the previous interval (Vt-1) plus the additional rainwater
being supplied (St), minus the demand (Qt) from the time period. Provided, that is, the
computed volume in store does not exceed the storage capacity (C).
3.3.2 Grey water recycling systems
Eriksson et al. (2002), defines grey water as wastewater without any waste input from
toilets and bidets (black water). Some authors classify grey water as used washwater
from showers, baths, washbasins, washing machines, kitchen sinks and dishwashers (i.e.
Jefferson et al., 2000; Ottoson and Stenstrom, 2003; Pidou et al., 2008), while others
exclude grey water sources from kitchen sinks and dishwashers because they normally
contain high levels of contamination from detergents, fats and food waste (i.e. Al-
Jayyousi, 2003; Donner et al., 2010; Nolde, 2000).
Although there still seems to be no consensus towards what defines grey water (Gross et
al., 2007), Leggett and Shaffer (2002) argue that the majority of commercially available
grey water treatment units are not designed to include wastewater from kitchen sink or
dishwasher. Moreover, these authors state that the additional volume generated from
kitchen sinks and dishwashers is unlikely to justify the additional costs related to their
treatment. Therefore, this investigation has focused in grey water sources that do not
include wastewater from kitchen sinks and washing machines.
Treated grey water can be safely used for non-potable domestic water end-uses such as
irrigation, toilet flushing and washing (i.e. Christova-Boal et al., 1996; Kim et al., 2009;
Lu and Leung, 2003). Previous works also indicate that untreated grey water can be
safely used for direct reuse in sub-surface irrigation or manual bucketing (DHWA,
2002; EA, 2008a; NSW, 2008a; SA-Health, 2008). Intermediate storage without
treatment and disinfection is not recommended as grey water quality can deteriorate and
pose a potential hazard to human health.

Domestic Water Conservation
71
3.3.2.1 Grey water quality
The water quality of grey water is dependent upon the types of contaminants it picks up
during water use (Leggett and Shaffer, 2002), and varies according to the number of
occupants, age distribution, lifestyle, health status and water usage patterns of the
household (DHWA, 2002). Overall, grey water contains a range of impurities such as
skin, hair, soaps and detergents used for washing and bathing, surface cleansers and
anything else that may be casually poured down the drain (Leggett et al., 2001a).
The most significant risk from untreated grey water is exposure from micro-organisms
derived from faecal contamination. Grey water from showers, baths and washbasins
might contain traces of human intestinal bacteria (i.e. urine, faeces, vomit, etc.) and
viruses. As such, reuse of untreated grey water should be carried out in a manner that
avoids human infection through ingestion or skin contact, and treated grey water should
follow the non-potable water quality standards established by the National Water
Authority (ANA) in Brazil.
To date, there are no specific norms for grey water recycling in Brazil, however,
Brazilian septic tank regulations NBR 13969 (ABNT, 1997), allows the reuse of treated
wastewater on non-potable end-uses such as irrigation, floor washing, car washing,
toilet flushing, etc.
3.3.2.2 System components and design
Grey water recycling (GWR) systems collect the used wash water before it reaches the
sewer or septic tank system, and makes it available for reuse elsewhere, where the water
required does not have to be of potable quality (EA, 2000).
The simplest form of grey water reuse is through manual bucketing. Manual bucketing
has become a commonly used method of untreated grey water reuse for landscape
irrigation in Australia (Misra and Sivongxay, 2009). Recent Australian government
regulations and guidelines provide initiatives for grey water reuse, using particularly
laundry and bathroom grey water for garden irrigation (DHWA, 2002; NSW, 2008a;
SA-Health, 2008). The Australian government considers manual bucketing of grey
water to be a low risk activity for the following reasons (NSW, 2008a: p.22):

Domestic Water Conservation
72
• Manual bucketing reuses low volumes of grey water. Accordingly, only low
quantities of contaminants will be applied to the soil and there is a limited ability
for runoff to neighbouring properties or waterways.
• It is unlikely that manual bucketing will occur during wet weather, reducing the
risk of over-watering or runoff.
In Brazil, manual bucketing of laundry grey water is a common practice in some
households. Although there is a lack of literature regarding manual bucketing of grey
water in Brazil, this study has shown that a considerable number of low and mid-low
income dwellings made use of laundry grey water stored in water butts, mainly for floor
washing (see Chapter 5, Section 5.5.2).
Grey water diversion systems use simple mechanisms to redirect untreated bathroom
and/or laundry grey water via a sub-surface irrigation distribution pipework. According
to NSW (2008a), diversion systems incorporate the following features:
• a hand-activated valve;
• a switch or tap which is fitted to the outlet of the plumbing fixture;
• a coarse filter for screening out solids and oils/greases;
• non-storage surge attenuation;
• an overflow device;
• a garden irrigation or distribution system.
The Australian Government provides guidelines regarding the distribution of grey water
via sub-surface irrigation distribution pipework (NSW, 2008b). Gravity diversion
systems allow diverted grey water to be directly fed to sub-surface irrigation areas for
the distribution of grey water (Figure 3.16). If necessary, grey water diversion systems
can incorporate water pumps to aid in the distribution of grey water.

Domestic Water Conservation
73
Figure 3.16 Gravity-fed grey water diversion system for sub-surface irrigation.
Source: NSW (2008b)
According to the Australian guidelines, the sub-surface irrigation distribution pipework
should be buried at least 10 cm below surface level, with at least one meter distance
from each other, boundaries, buildings, swimming pools or underground potable water
tanks. Although Brazilian septic tank regulations NBR 13969 (ABNT, 1997) provides
some design guidelines for the distribution of drainage trenches, these are specified for
on-site wastewater disposal, not reuse. Grey water diversion is for productive use in
landscape irrigation, not the disposal of wastewater.
Figure 3.17 Detailed cross-section of irrigation trench for sub-surface irrigation
Source: (DHWA, 2002)
Although sub-surface irrigation distribution pipework can be composed of perforated
piped trenches, drip lines, irrigation domes or drippers, perforated pipes are cheaper and
easily available in the Brazilian market and therefore, piped trenches were considered as

Domestic Water Conservation
74
the best option for analysis. Figure 3.17 on the next page provides a detailed cross-
section of an irrigation trench for sub-surface irrigation using perforated pipes for the
distribution of untreated grey water.
Grey water to be reused for surface irrigation, toilet flushing, floor, vehicle and clothes
washing require adequate treatment. Commercially available grey water treatment units
available in the Brazilian market are sold in pre-determined sizes, according to the
estimated volume of grey water to be treated (Alpina, 2010; Fito, 2010; Mizumo, 2010).
Figure 3.18 Generic composition of a GRW system
(a) Collection Pipework (b) Coarse Filter (c) Biological Treatment (d) Sediment Disposal (e) Fine Filtration/Activated Carbon
(f) Disinfection/Collection Tank (g) Overflow (h) Water Pump (i) Safety Control Unit (j) Header Tank (k) Solenoid Valve (l) Potable Water Feed (m) Distribution Pipework
Source: Sant’Ana and Amorim (2007)
Overall, these technologies include physical, chemical and/or biological treatment
processes for grey water treatment. According to Li et al. (2010), most of these
technologies are preceded by coarse filtration to avoid the subsequent clogging of the

Domestic Water Conservation
75
system, and are followed by disinfection to meet the microbiological requirements. A
control unit can be used as a fail-safe mechanism to shut-off supply in case of
inadequate levels water treatment or system malfunction. Figure 3.18 illustrates a
generic composition of an indirectly pumped GWR system (Sant'Ana and Amorim,
2007)
Recently, a grey water reuse toilet and lavatory appliance unit has emerged in the
Brazilian market (Roca, 2010). Such appliance reuses grey water from the washbasin
for toilet flushing (Figure 3.19). Grey water from the washbasin passes through a
selective filtering system before it is fed into a small treatment tank for disinfection, and
hence, the grey water reuse unit requires periodic feed of 500 ml of bleach (5%
chlorine) for treatment. The equipment includes a bleach storage receptacle that releases
the bleach to the stored grey water according to its usage. Potable water can be fed into
the water closet cistern in case demand exceeds supply, and when not using for a long
period, the manufacturer suggests the extraction of grey water from the holding tank
through flushing. The equipment allows the user to select the use of grey water or
potable water for toilet flushing.
Figure 3.19 Grey water reuse toilet and lavatory appliance unit
Source: (Roca, 2010)

Domestic Water Conservation
76
3.3.3 Wastewater reclamation systems
According to Winward et al. (2009) domestic wastewater is composed of all in-building
effluent streams, including toilet waste. Apart from rainwater and grey water, Winward
et al. (2009) argues that another urban water source available for non-potable reuse is
wastewater. Although uncommon, an increasing number of buildings are using
wastewater reclamation systems to treat domestic effluents on-site, producing non-
potable water for reuse (Wilson and Navaro, 2008).
Previous studies have shown that, provided with adequate treatment, wastewater can be
safely reused for non-potable domestic end-uses such as irrigation, toilet flushing, floor
and vehicle washing (i.e. Asano et al., 1986; Gaulke, 2006; Neal, 1996; Yokomizo,
1994).
3.3.3.1 Wastewater quality
Domestic wastewater effluents contain pollutant contributions from both grey water and
blackwater. Previous study has shown that toilet discharge contains the highest pollutant
contribution load to wastewater in five out of six determinants, for the exception of
nitrate, whose major contribution comes from kitchen sink discharge (Almeida et al.,
1999).
According to Asano et al. (1996) the most critical factor concerning wastewater reuse is
the protection of public health from pathogenic microorganisms. It is therefore crucial
that reclaimed wastewater meets the criteria established by ANA of non-potable water
quality standards so that it obtains adequate water quality characteristics and is not
aesthetically objectionable.
3.3.3.2 System components and design
On-site wastewater reclamation (WWR) systems collect domestic sewage effluents for
non-potable end-uses after adequate water treatment. This can take place using two
schemes: (i) constructed wetlands, or (ii) treatment units.
Constructed wetlands act as a natural biological and physical treatment system capable
of removing both nutrients and pathogens from domestic wastewater, providing a water
quality suitable for reuse (Greenway, 2005; House et al., 1999). However, one of the

Domestic Water Conservation
77
main problems in adopting constructed wetlands for water reuse in hot climate
countries, is that the high evapotranspiration rate can lead to significant water losses
during treatment (Masi and Martinuzzi, 2007). Furthermore, constructed wetlands
require space, and are more suitable in sites which require large volumes of water to be
treated.
Since this study deals with commercially available products that guarantee adequate
water quality levels for non-potable reuse to avoid health-related issues to residents, it
seemed prudent not to include constructed wetlands in the analysis.
Overall, wastewater treatment units consist of a combination of physical, chemical and
biological processes to remove suspended, settled and dissolved solids, organic matter,
metals, nutrients and pathogens from wastewater (Mujariego and Asano, 1999). The
Brazilian market offers small-scale treatment units for wastewater reclamation, which
are sold in pre-determined sizes, according to the estimated volume of effluent to be
treated (Alpina, 2010; Mizumo, 2010).
Figure 3.20 Small-scale treatment unit for wastewater reclamation
(1) Wastewater Inflow (2) Anaerobic Sedimentation Chamber (3) Anaerobic Filter Chamber (4) Aerobic Treatment Chamber (5) Sedimentation and Disinfection Chamber (6) Reclaimed Water Outflow
Source: (Mizumo, 2010)
Grease traps are often installed on kitchen sink discharge pipes in order to remove
grease and oils from kitchen wastewater to avoid the clogging of the system. Safety
control units are necessary to provide a visual alarm and shut down reclaimed water

Domestic Water Conservation
78
supply in case of system malfunction. Figure 3.20 illustrates a small-scale treatment unit
for wastewater reclamation.
3.4 Conclusion
This chapter provided an overview of the state-of-the art domestic water conservation
measures for Brazilian dwellings. Overall, domestic water conservation measures are
capable of promoting the preservation of natural fresh water resources by reducing
water demand through efficiency and reuse.
Water efficient strategies are demand-side water conservation measures capable of
reducing water consumption through the improved effectiveness of water usage. A
range of commercially available water efficient technologies were identified and their
reduced flow rates or potential to reduce domestic water consumption addressed. The
main water efficient strategies selected for analysis included low flush and dual flush
toilets, automatic and sensor faucets, low-flow showerheads, flow regulators, high
efficiency washing machines, pressure washers, automatic shut-off nozzles, automatic
irrigation systems and leakage repair.
Water reuse systems on the other hand, are supply-side water conservation measures
which make use of alternative sources of water such as rainwater, grey water and
wastewater for non-potable reuse. Brazilian building regulations allow the use of
reclaimed water for non-potable domestic end-uses, as long as the necessary precautions
are taken to avoid mains water contamination and adequate treatment for reclaimed
water is provided, according to specific categories of non-potable water end-uses such
as garden irrigation, toilet flushing, floor, vehicle and clothes washing.
A range of commercially available water reuse systems in Brazil were identified,
ranging from simple manually operated water-butts to complex treatment units,
addressing water quality issues and system components and design. Table 3.3 on the
next page lists the water conservation measures that will be considered in the following
chapters for analysis.

Domestic Water Conservation
79
Table 3.3 Water conservation measures considered for analysis
Water Conservation Measures
Water Efficient Strategies
Bathroom faucet flow regulator (1.8 l/min)
Automatic bathroom faucet
Bathroom sensor faucets
Low flow shower head (4.5 l/min)
Low-flush toilet (6 lpf)
Dual flush toilet (3/6 lpf)
Kitchen sensor faucet
Kitchen faucet flow regulator (1.8 l/min)
Utility faucet flow regulator (6 l/min)
High-efficiency washing machine
Automatic shut-off hose nozzle
Pressure washer
Automatic irrigation sprinkler system
Leakage repair
Water Reuse Systems
Rainwater harvesting system
Grey water recycling system
Wastewater reclamation system

Chapter 4 Methodological Approach

Methodological Approach
81
4. Methodological Approach
4.1 Introduction
There is a growing public awareness of water scarcity and its economic value. However,
quantifying potential savings from an array of water conservation strategies and demand
management practices for Brazilian dwellings can be difficult due to the lack of specific
and generalizable domestic water end-use consumption data. In order to evaluate the
effectiveness of demand-side and supply-side water conservation measures and identify
viable solutions to reduce domestic water consumption, it is crucial to quantify how
much water is consumed by each major domestic water fixtures and appliances and
understand how water is being consumed by residents in the household (De Oreo et al.,
1996; Jorgensen et al., 2009).
It is agreed among researchers that domestic water consumption varies according to a
series of variables, mostly based on dwelling characteristics (Loh and Coghlan, 2003;
Russac et al., 1991; Thackray et al., 1978; Troy and Randolph, 2005), social and
economic factors (Agthe and Billings, 1987; Conley, 1967; Dalhuisen et al., 2003;
Savenije, 2002; Schleich and Hillenbrand, 2009; Worthington and Hoffman, 2008),
climate (Billings, 1982; Dziegielewski et al., 1993; Foster and Beattie, 1979; Hoffmann
et al., 2006; Mayer et al., 1999) and occupant behaviour (Gregory and Di Leo, 2003;
Jorgensen et al., 2009; Randolph and Troy, 2008).
These explanations can vary from place-to-place leading to differences in the patterns of
water consumption. Countries with different national income are most likely to present
distinct patterns of domestic water consumption. Although numerous studies have fully
analysed domestic water consumption in developed countries, little research has been
carried out within developing economies (Potter and Darmame, 2010; Sivakumaran and
Aramaki, 2010; Zhang and Brown, 2005).
In Brazil, research on domestic water end-use consumption is still in its infancy, and
generalizable data has not yet been produced. Research carried out so far, has been
limited to two houses in Palhoça (Ghisi and Oliveira, 2007), three multi-storey
buildings in southern Brazil (Ghisi and Ferreira, 2007), one flat and seven houses in São

Methodological Approach
82
Paulo (Barreto, 2008; Rocha et al., 1998). In Brazil, there is a lack of specific domestic
water end-use consumption data of low, medium and high income dwellings, for the
different residential building typologies and their behavioural water usage. Furthermore,
as far as the literature goes, no study has analysed the impact of high differences in
household income on domestic water consumption, especially within the Brazilian
context, where social inequality is high
Having these issues in mind, the main objectives of this investigation are:
1. To measure domestic water consumption and understand how water is being
used by residents for the different income ranges and dwelling typologies in the
Federal District; and
2. To assess water end-use patterns between the different income ranges and
dwelling typologies in the Federal District.
The characterisation of domestic water end-use consumption has led to a series of
investigations to verify potential water savings from an array of water conservation
measures (i.e. Brewer et al., 2001; Griggs et al., 1998; Maddaus, 1984; Mayer et al.,
2003). While demand-side water conservation measures have been acknowledged to
promote water reductions through the use of water efficient strategies in residential
buildings (ANA et al., 2005; EA, 2007; Grant, 2006; Vairavamoorthy and Mansoor,
2006; Vickers, 2001), supply-side measures such as water reuse systems, make use of
alternative sources of water supply for non-potable end-uses such as garden irrigation,
toilet flushing, floor, vehicle and clothes washing to reduce domestic water
consumption (Ahn et al., 1998; EA, 2008a; EA, 2008b; Leggett et al., 2001a; Leggett et
al., 2001b; Tchobanoglous et al., 2003).
In Brazil, water conservation studies have focused in estimating the reductions
promoted by leakage repair (Oliveira, 2002) and use of flow regulators (ANA et al.,
2005) in multi-storey residential buildings, through the installation of water efficient
fittings, fixtures and appliances in low income houses (Vimieiro and Pádua, 2005), and
rainwater harvesting and greywater recycling systems in southern Brazil (Ghisi, 2006;
Ghisi et al., 2007; Ghisi and Ferreira, 2007; Ghisi et al., 2006; Ghisi and Oliveira,

Methodological Approach
83
2007). However, they fail to depict a comparative study of the potential water savings
obtained for both demand-side and supply-side water conservation measures according
to dwelling income range and building typology.
A number of studies have evaluated the economics of domestic water conservation
measures in developed countries (Arpke and Strong, 2006; EA, 2003; EA et al., 2007;
Marshallsay et al., 2007; Rahman et al., 2010; Roebuck et al., 2010; Waterwise, 2008),
however, these countries contain an improved economic setting, different from that of
developing countries. Little is known about the feasibility of the use of water
conservation measures within developing economies. Only one work has looked into
the cost-benefits of rainwater harvesting systems in Brazil (Júnior et al., 2008).
Therefore, further research is required in order to evaluate the feasibility of water
conservation measures in terms of their applicability and cost-benefits according to
building typology and household income.
In order to fill these gaps in knowledge, a third research objective is derived:
3. To identify and evaluate the feasibility of domestic water conservation measures
in terms of their applicability, water savings and financial benefits for different
income ranges and residential typologies.
Based on the hypothesis that variables such as household income, building typology and
occupant behaviour affect the way water is consumed, a methodology was designed to
address the aims of this study and to provide a generalizable tool for future research
capable of providing meaningful data over domestic water end-use consumption and
identifying feasible water conservation measures for the different income ranges and
building typologies. Figure 4.1 on the next page illustrates the overall methodological
approach designed to address the aims of the study.

Figure 4.1 Flow diagram of the methodological approachFlow diagram of the methodological approach
Methodological Approach
84

Methodological Approach
85
4.2 Case study site selection
The best approach to assess domestic water consumption and identify the feasibility of a
range of water conservation measures was through the use of statistically representative
sites and residential typologies of high, middle and low income dwellings. As a starting
point, this investigation has set out to understand and compare domestic water
consumption by cross referencing geo-demographic and socio-economic indicators as
well as secondary data of dwelling typology in the Federal District in order to point out
statistically representative regions for analysis.
4.2.1 Administrative region selection
The Federal District is currently composed of 29 administrative regions (AR). However,
data for the region as a whole was available only for 19 AR's. Using secondary sources
of statistical data obtained from the Federal District’s Water and Sewage Company
(Companhia de Saneamento Ambiental do Distrito Federal - CAESB, 2004) and the
Government’s District Household Survey (Pesquisa Distrital de Amostra por
Domicílios - PDAD, 2004), aggregate data for water consumption, household income
and dwelling typology were obtained for the 19 administrative regions (Table 4.1).
Eight administrative regions were selected for primary data collection on dwelling
characteristics, household income, water consumption, and occupant water use
behaviour through the use of questionnaire survey and water auditing.
4.2.1.1 The Federal District
Brasília was conceived by the urban planner Lúcio Costa, having its major buildings
designed by Oscar Niemeyer. The construction for Brazil’s new capital city started in
1956, and was inaugurated in April 21, 1960 by President Juscelino Kubitchek. Initially
planned for only 500,000 inhabitants, Brasília has seen its population grow much more
than expected. In order to accommodate such demand, new neighbourhoods and
satellite cities were created around Brasília. All together, the satellite cities, Brasilia and
its surrounding neighbourhoods compose the Federal District. Today, the Federal
District’s total population is now over 2,500,000 inhabitants. Originally, the Federal
District was undivided, and the entire region was administrated as a whole, but in 1964
it was split, for the first time, into 8 administrative regions (AR). Today, the Federal
District is currently divided into 29 administrative regions (Figure 4.1).

Methodological Approach
86
Figure 4.2 Administrative Regions of the Federal District.
Source: CODEPLAN (2006)
4.2.1.2 Geo-demographic indicators
Secondary data of monthly water consumption for the 19 administrative regions of the
Federal District were obtained from the water company (CAESB, 2005). Table 4.1
shows monthly water consumption for 19 administrative regions of the Federal District.
Overall, Brasília administrative region has the highest average monthly water
consumption and Candangolândia, the lowest.
Population figures obtained from (PDAD, 2004) were taken into consideration in order
to obtain a more reliable indicator for benchmarking water consumption. Although
Candangolândia presented a low volume of supplied mains water, it did not have the
lowest consumption rate. Ceilândia contained the highest number of inhabitants in the
Federal District and its monthly water consumption was less than half of Brasilia’s
domestic consumption.

Methodological Approach
87
Table 4.1 Geo-demographic indicators
Administrative
Region Total
Population
Av. Monthly Water
Consumption (m
3/month)
Av. Consumption Per
Capita (litres/person/day)
Brasília 198,906 2,841,440 476
Gama 112,019 597,771 178
Taguatinga 223,452 1,377,748 206
Brazlândia 48,958 169,439 115
Sobradinho 61,290 367,209 200
Planaltina 141,097 429,679 102
Paranoá 39,630 196,091 165
Núcleo Bandeirante 22,688 296,034 435
Ceilândia 332,455 1,301,646 131
Guará 112,989 819,746 242
Cruzeiro 40,934 596,943 486
Samambaia 147,907 625,343 141
Santa Maria 89,721 362,740 135
São Sebastião 69,469 166,077 80
Recanto das Emas 102,271 321,281 105
Lago Sul 24,406 498,348 681
Riacho Fundo 26,093 206,858 264
Lago Norte 23,000 299,217 434
Candangolândia 13,660 68,247 167
Federal District 2,096,534 11,541,857 184 Sources: PDAD (2004) and CAESB (2004)
Domestic water consumption per capita figures were obtained by cross-referencing
statistical water consumption data from CAESB (2005) with statistical population
survey from PDAD (2004).
Overall, the Federal District had an average domestic water consumption rate per capita
of 184 litres per person per day (l/p/d), Lago Sul administrative region contained the
highest water consumption rate of 681 l/p/d, and São Sebastião the lowest, only 80
l/p/d. Figure 4.2 on the following page presents the domestic water consumption rates
per capita for the 19 administrative regions. It is interesting to note that the regions of
highest income show water consumption greater than 434 litres per capita per day.

Methodological Approach
88
Figure 4.3 Average domestic water consumption per capita (litres/person/day)
Source: CAESB (2004)
4.2.1.3 Socio-economic indicators
Statistical figures of average monthly income rates for the administrative regions were
obtained from PDAD (2004) and are shown in Table 4.2. Following the Brazilian
Institute for Geography and Statistics standards for household income subdivision
(IBGE, 2000), the average monthly income data of dwellings was divided into 5 income
classes:
• Poor: Less than 1 minimum wage
• Low income: From 1 to 5 minimum wages
• Mid-low income: From 5 to 10 minimum wages
• Mid-high income: From 10 to 20 minimum wages
• High income: Above 20 minimum wages
The minimum wage in Brazil, during 2007, was equal to 380.00 Brazilian Reais per
month (R$/month), equivalent to 95.00 British Pounds. Table 4.2 shows the number of
minimum wage for each administrative region.
681486
476435434
264242
206200
178167165
141135131
115105102
80
0 100 200 300 400 500 600 700 800
Lago SulCruzeiro
BrasíliaNúcleo Bandeirante
Lago NorteRiacho Fundo
GuaráTaguatingaSobradinho
Gama Candangolândia
ParanoáSamambaiaSanta Maria
CeilândiaBrazlândia
Recanto das EmasPlanaltina
São Sebastião

Methodological Approach
89
Table 4.2 Socio-economic indicators
Administrative
Region
Average Dwelling Monthly Income
Average Income (R$/month)
No. of Minimum
Wages Income Range
Brasília 5,026 19.3 Mid-high Income
Gama 1,558 6.0 Mid-low Income
Taguatinga 2,493 9.6 Mid-low Income
Brazlândia 885 3.4 Low Income
Sobradinho 2,401 9.2 Mid-low Income
Planaltina 825 3.2 Low Income
Paranoá 1,361 5.2 Mid-low Income
Núcleo Bandeirante 2,157 8.3 Mid-low Income
Ceilândia 1,211 4.7 Low Income
Guará 3,186 12.3 Mid-high Income
Cruzeiro 3,155 12.1 Mid-high Income
Samambaia 1,039 4.0 Low Income
Santa Maria 962 3.7 Low Income
São Sebastião 1,362 5.2 Mid-low Income
Recanto das Emas 1,013 3.9 Low Income
Lago Sul 11,276 43.4 High Income
Riacho Fundo 1,535 5.9 Mid-low Income
Lago Norte 8,922 34.3 High Income
Candangolândia 2,150 8.3 Mid-low Income
Federal District 2,332 9.0 Mid-low Income Source: PDAD (2004)
The Federal District presented an average monthly income equivalent to 9 minimum
wages. Lago Sul and Lago Norte administrative regions had the highest income rate of
the Federal District, 43 and 34 minimum wages per month respectively, and were
classified as high-income administrative regions. Brasília, Guará and Cruzeiro were
classified as mid-high income administrative regions, whilst most of the administrative
regions of the Federal District belong to a mid-low income range. Ceilândia,
Samambaia, Recanto das Emas, Santa Maria, Brazlândia and Planaltina were low
income administrative regions, with average monthly income ranging between 1 and 5
minimum wages. Figure 4.4 shows the average monthly income rates (number of
minimum wages) from low to high-income classes for each administrative region.

Methodological Approach
90
Figure 4.4 Average dwelling monthly income in minimum wages
Source: PDAD (2004)
Figure 4.5 Relationship between income and water consumption
Source: PDAD (2004); CAESB (2004)
By cross-examining the average monthly water consumption rate for each
administrative region of the Federal District and their average monthly income rate, a
direct relationship between consumption and income could be noticed. Overall, high-
43.4
34.3
19.3
12.3
12.1
9.6
9.2
8.3
8.3
6.0
5.9
5.2
5.2
4.7
4.0
3.9
3.7
3.4
3.2
0.0 5.0 10.0 15.0 20.0 25.0 30.0 35.0 40.0 45.0 50.0
Lago Sul
Lago Norte
Brasília
Guará
Cruzeiro
Taguatinga
Sobradinho
Núcleo Bandeirante
Candangolândia
Gama
Riacho Fundo
São Sebastião
Paranoá
Ceilândia
Samambaia
Recanto das Emas
Santa Maria
Brazlândia
Planaltina
1
10
100
1,000
10,000
100,000
Bra
sília
Gam
a
Tagu
atin
ga
Bra
zlân
dia
Sob
rad
inh
o
Pla
nal
tin
a
Par
ano
á
N. B
and
eira
nte
Cei
lân
dia
Gu
ará
Cru
zeir
o
Sam
amb
aia
San
ta M
aria
São
Seb
asti
ão
R. d
as E
mas
Lago
Su
l
Ria
cho
Fu
nd
o
Lago
No
rte
Can
dan
golâ
nd
ia
Av. Domestic Water Consumption (l/p/d) Av.Dwelling Monthly Income (R$/month)

Methodological Approach
91
income administrative regions presented a high level of water consumption per capita,
whereas low-income administrative regions presented a low level of water consumption
per capita. Figure 4.4 presents this relationship for the 19 administrative regions,
indicating that, the higher the income, the higher water consumption tends to be and, the
lower the income, the lower the consumption rate.
Such relationship between income and water consumption might be explained through
behavioural aspects of water consumption between the income classes. High-income
families might increase their water consumption because they are easily capable of
paying for their water bills, and therefore squander water. On the other hand, low-
income families need to control their water consumption through behavioural actions
due to their limited monthly budget.
Another aspect to be taken into consideration would be dwelling typology. Such
relationship between water consumption and income can be explained by dwelling
characteristics such as built area, garden/yard area and even the number of water-
consuming features. For example, high-income dwellings tend to have a greater number
of fixtures and appliances, bigger garden area to irrigate, larger external floor area to
wash, and even a swimming pool. Low-income dwellings, on the other hand, tend to
have only the minimal number of fixtures and appliances, a small garden or yard, and
no swimming pool.
4.2.1.4 Dwelling typology
There are two types of dwellings in the Federal District: (i) houses and (ii) flats.
According to statistical figures of PDAD (2004), 78% of the residential dwellings in the
Federal District are houses, and the remaining 22% consist of flats. Table 4.3 shows the
number of houses and flats for each administrative region as well as their dominant
average dwelling size.
Lago Sul and Lago Norte administrative regions’ main dwelling typology consisted of
houses with an average built area ranging between 221m2 and 400m2. Ninety percent of
Brasilia’s residential stock consisted of flats, with most of them ranging between 61m2
to 120m2 of built area. Almost half of Núcleo Bandeirante and Cruzeiro administrative

Methodological Approach
92
regions were composed of flats with the average built area ranging from 61m2 to 120m2.
The remaining dwelling stock was mostly composed of houses between 41m2 and 90m2.
Table 4.3 Dwelling Typologies in the Federal District
Administrative
Region
Dwelling Typology Average Size (m
2) Houses Flats
Brasília 6,907 63,942 61 - 120
Gama 24,761 3,882 61 - 120
Taguatinga 47,383 11,721 61 - 120
Brazlândia 11,959 171 61 - 120
Sobradinho 13,580 2,231 Less than 60
Planaltina 32,965 806 61 - 120
Paranoá 8,772 159 Less than 60
Núcleo Bandeirante 3,034 3,147 61 - 120
Ceilândia 85,359 2,694 Less than 60
Guará 24,124 6,003 61 - 120
Cruzeiro 5,697 4,695 61 - 120
Samambaia 33,676 2,267 Less than 60
Santa Maria 21,726 994 61 - 120
São Sebastião 17,622 504 Less than 60
Recanto das Emas 23,692 392 Less than 60
Lago Sul 6,018 19 221 - 400
Riacho Fundo 5,541 998 Less than 60
Lago Norte 5,200 0 221 - 400
Candangolândia 3,432 209 61 - 120
Federal District 433,436 125,795 61 - 120 Source: PDAD (2004)
Figure 4.6 Relationship between built area and income
Source: PDAD (2004); CAESB (2004)
1.0
10.0
100.0
1000.0
Bra
sília
Gam
a
Tagu
atin
ga
Bra
zlân
dia
Sob
rad
inh
o
Pla
nal
tin
a
Par
ano
á
N. B
and
eira
nte
Cei
lân
dia
Gu
ará
Cru
zeir
o
Sam
amb
aia
San
ta M
aria
São
Seb
asti
ão
R. d
as E
mas
Lago
Su
l
Ria
cho
Fu
nd
o
Lago
No
rte
Can
dan
golâ
nd
ia
Av. Monthly Income (m.w.) Av. Built Area (m2)
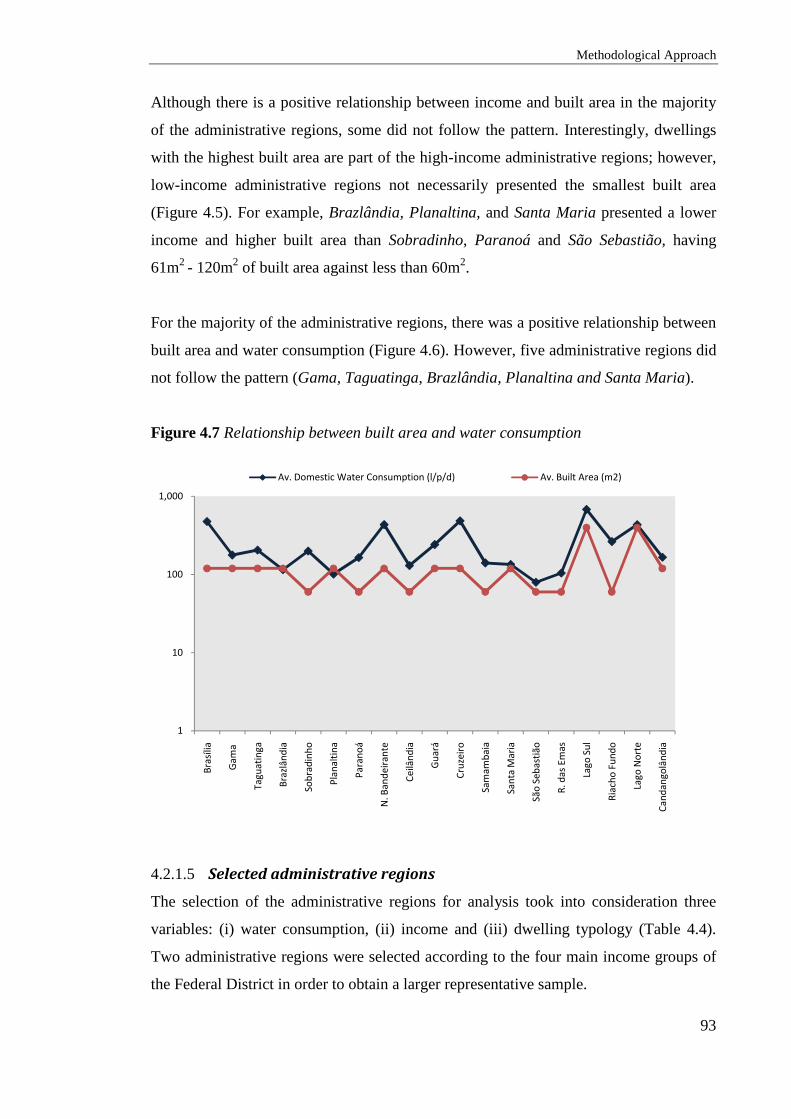
Methodological Approach
93
Although there is a positive relationship between income and built area in the majority
of the administrative regions, some did not follow the pattern. Interestingly, dwellings
with the highest built area are part of the high-income administrative regions; however,
low-income administrative regions not necessarily presented the smallest built area
(Figure 4.5). For example, Brazlândia, Planaltina, and Santa Maria presented a lower
income and higher built area than Sobradinho, Paranoá and São Sebastião, having
61m2 - 120m2 of built area against less than 60m2.
For the majority of the administrative regions, there was a positive relationship between
built area and water consumption (Figure 4.6). However, five administrative regions did
not follow the pattern (Gama, Taguatinga, Brazlândia, Planaltina and Santa Maria).
Figure 4.7 Relationship between built area and water consumption
4.2.1.5 Selected administrative regions
The selection of the administrative regions for analysis took into consideration three
variables: (i) water consumption, (ii) income and (iii) dwelling typology (Table 4.4).
Two administrative regions were selected according to the four main income groups of
the Federal District in order to obtain a larger representative sample.
1
10
100
1,000
Bra
sília
Gam
a
Tagu
atin
ga
Bra
zlân
dia
Sob
rad
inh
o
Pla
nal
tin
a
Par
ano
á
N. B
and
eira
nte
Cei
lân
dia
Gu
ará
Cru
zeir
o
Sam
amb
aia
San
ta M
aria
São
Seb
asti
ão
R. d
as E
mas
Lago
Su
l
Ria
cho
Fu
nd
o
Lago
No
rte
Can
dan
golâ
nd
ia
Av. Domestic Water Consumption (l/p/d) Av. Built Area (m2)

Methodological Approach
94
Table 4.4 Summary of selected Administrative Regions for analysis
Administrative
Region Income Group
Domestic Water
Consumption
(l/p/d)
Dwelling Typology
Built Type Built Area (m2)
Lago Sul High 681 House 221 – 400
Lago Norte High 434 House 221 – 400
Brasília Mid-High 476 Flat 61 – 120
Cruzeiro Mid-High 486 Flat 61 – 120
Taguatinga Mid-low 206 House 61 – 120
Candangolândia Mid-low 167 House 61 – 120
Ceilândia Low 131 House Less than 60
Samambaia Low 141 House Less than 60
Source: PDAD (2004)
• Lago Sul and Lago Norte: Lago Sul and Lago Norte AR’s were selected for
analysis due to their similar typological profile of houses ranging from 221m2 to
400 m2, highest average water consumption ranging from 430 l/p/d to 680 l/p/d,
and mean household monthly income (R$9,000 – R$11,000).
• Brasília and Águas Claras: Brasília was selected for analysis because there is
a significant amount of habitants residing in flat dwellings in the Federal District
and it contains the largest number of flats (from 61m2 to 120m2 ) and household
income of R$ 5,000. Águas Claras is a new region in the Federal District and
has recently become an AR. Although aggregate statistical figures for this region
were not available, this AR was selected due to its large number of high-rise flat
dwellings and its large and fast growing population.
• Taguatinga and Candangolândia: Taguatinga and Candangolândia
administrative regions were selected mainly because their dominant dwelling
typology of houses range between 61 and 120m2 and because their water
consumption rate represent the average water consumption per capita of the mid-
low income group.
• Ceilândia and Samambaia: Celiândia and Samambaia contained the highest
number of habitants and were therefore capable of providing a significant
representative sample size for analysis, with a dominant house dwelling
typology of below 60 m2 and a household low monthly income of (R$ 1,000 –
R$ 1,200).

Methodological Approach
95
4.3 Primary data collection
In order to explore the relationship between domestic water consumption and three
variables: (i) residential dwelling typology, (ii) household income and (iii) occupant
water use behaviour; this research incorporated both quantitative and qualitative
methodological approaches. The first, involved a face-to-face questionnaire survey that
gathered primary data over socio-economic aspects of domestic water consumption and
dwelling characteristics over a stratified random sample size of 481 dwellings. The
second involved an in-depth analysis of end-use domestic water consumption with an
interview designed to understand resident water-consuming habits, and through a water
auditing technique developed, to measure, for seven days, domestic water end-use
consumption for 125 dwellings.
4.3.1 Questionnaire survey
The investigation made use of two types of questionnaires: a face-to-face questionnaire
and in-depth questionnaire. The face-to-face questionnaires were applied to house and
flat residents (Appendix A and Appendix B) in order to collect quantitative data on
dwelling characteristics (such as household size, income, tenure, monthly water
expenses, number of water-consuming equipments and features and existence of water
efficient fittings, fixtures or appliances) as well as public opinion (on mains water and
sewage tariffs, the importance of saving water and concern with future water resources),
awareness (of the existence of a range of water conservation measures) and acceptance
of water conservation measures (use of water conservation measures, dwelling retrofit
and willingness to pay). The in-depth questionnaires (Appendix C and Appendix D) on
the other hand, were used as part of the domestic water audit on houses and flats to
collect qualitative data on habits of water consuming activities at home (dish washing,
clothes washing, vehicle washing, floor washing, garden irrigation and water reuse), the
equipments used and water-saving attitudes in the home.
A distinction between the house and flat dwelling questionnaire was necessary mainly
due to typological differences in the way domestic water is metered, and in the way
outdoor water is used. Although every house in the Federal District is individually
metered, flats shared a common water meter. The great majority of residential multi-
storey buildings in the Federal District have one water meter to measure the domestic

Methodological Approach
96
water consumption for the entire building block. The water and sewage bill is divided
equally between the flats, and is commonly included as part of the condominium bills.
Although both built-types had similar indoor water-using amenities, residential building
blocks contained communal grounds and gardens which led to a distinct pattern of
outdoor water consumption. In order to collect primary data of building characteristics
(such as number of flats per floor, water metering and water bills), and to fully
understand habits of communal water consumption (floor washing and irrigation) and
the equipments used, it was necessary to create a different questionnaire directed to
building managers (Appendix E).
Face-to-face questionnaires were directed to 481 randomly selected dwellings of the
eight statistically selected AR’s of the Federal District, two of each AR representing an
income group: (i) high income, (ii) mid-high income, (iii) mid-low income and (iv) low
income. The face-to-face questionnaire was used to identify dwellings willing to take
part on a water audit to measure their water end-use consumption and an interview
designed to understand resident-consuming habits of water usage within dwellings. For
an in-depth understanding of domestic water end-use consumption, 125 questionnaires
were used as part of the domestic water audits.
4.3.2 Domestic water auditing
Residential water audits are capable of identifying domestic water end-use consumption
patterns. They make use of techniques which evaluate the processes in which water is
used, obtaining a balance of water input to, and output from a building, by measuring
the end-uses of domestic water consumption. In order to assess domestic water
consumption, this research created a simple, low budget method capable of measuring a
significant sample size of domestic water end-use consumption from different dwelling
types by adapting existing water auditing techniques of water measurements and
resident interviews.
To collect a significant sample size of primary data for domestic water end-use
consumption from different socio-economic profiles and dwelling typologies, 125 water
audits on residential dwellings were carried out (at least 30 audits per income range / 15
audits per Administrative Region). In order to obtain a set of reliable data, such in-depth

Methodological Approach
97
analysis consisted in measuring domestic water end-use consumption from dwellings
for a period of seven days, followed by a questionnaire designed to understand domestic
water-consuming activities and identify what equipments are being used during these
activities.
Dwellings willing to take part on the in-depth analysis of domestic water consumption
were identified through the use of the face-to-face questionnaire. Before the domestic
water audit started, it was crucial to fully explain the procedures to all family members
to engage them in recording their water consumption every day, for a period of seven
days. Residents were under no obligation to participate, and it was made clear that they
could withdraw from the survey at any time. Although the majority of family members
demonstrated a good level of participation, some participants felt that recording their
water consumption at all times became a bit tiresome towards the last day or two of the
auditing period. Three dwellings withdrew from the survey before the end of the water
auditing period, and therefore were not included in analysis.
In order to measure domestic water end-use consumption, one stop-watch was fixed
next to each tap-opening water fixture so that residents could easily register the time
water was used at each fixture, by simply pressing a button to start and pause the timer.
This stop-watch technique proved to be an effective, low-budget method for time-
tracking water use events, and it was capable of storing the timed data at each stop-
watch.
Due to the fact that toilets, washing machines and dishwashers contain a fixed-rate of
water consumption per use, diary-tracking cards were used to register the number of
times these appliances were used (Appendix F). For a seven day period, residents were
asked to record the number of toilets flushed daily by using diary cards fixed to the wall
next to each toilet. For washing machines and dishwashers, residents were asked to
record the day, number of uses and type of programme selected.
In order to obtain daily domestic water end-use consumption data, one resident was
asked to enter the number of ticks from toilet flushing, clothes washing, dish washing
and register the accumulated consumption time for every fixture at a summary card
(Appendix G), and reset all stop-watches for the next day. By using the number of water

Methodological Approach
98
fixtures and appliances obtained from the face-to-face questionnaire, it was possible to
identify the number of bathrooms and other water-using amenities from a dwelling, to
prepare the diary-tracking summary card before site visit.
A full inventory of appliances, fixtures and other water-consuming features was carried
out in order to identify sources of water usage, quantify their flow rates and detect any
visible leaks. The flow rate of every tap-opening fixture (such as kitchen sink faucets,
wash basin faucets, showers, utility sink faucets, external taps, etc.) was identified by
measuring the time it took to fill up a one litre container by opening the tap half a turn
in order to obtain the average flow of a tap, thus obtaining its flow rate (litres per
second). The above data was registered on a water audit inventory form (Appendix H).
Prior measurements of these flow rates, residents were asked to demonstrate how they
usually operated every tap-opening fixture in order to obtain a more precise flow rate
measurement, according to their individual tap-opening habits. However, when
residents were not present, or unwilling to participate during inventory, tap-opening
fixtures were opened in a single wrist turn (equivalent to half a turn) in order to obtain
an average flow of water.
Flow rates of toilets were estimated according to the toilet cistern’s flushing volume (6,
9 or 12 litres). Water usage from washing machines and dishwashers could be obtained
from manufacturers' data sheets according to programme settings. The flow rates of
detected visible leaks were measured using a small measured container by recording the
time it took to fill up 1 ml, or estimated by using data on Table 3.1 (see Chapter 3,
Section 3.2.9) provided by ANA et al. (2005).
The water audit inventory was also used to collect background information about the
dwelling (built type, built area, garden/yard area, roof area, number of residents and
swimming pool volume) and to register the dates and meter readings before and after
the water audit.
After a full inventory of the water fixtures and appliances, and having set up the stop-
watches and diary-tracking cards next to each point of water use, residents were asked
for a recent water bill. The water bill shows data of monthly water consumption for the

Methodological Approach
99
dwelling from the past 12 months as well as information on the water and sewage tariff
charged per consumption ranges. The data on the water bill was either written down on
the water audit inventory form, or photocopied and later returned to the residents at the
last day of the water audit.
4.4 Primary data analysis
The primary data collected from the in-depth questionnaire survey and domestic water
audits were used to assess domestic water consumption for the different socio-economic
dwelling typologies and identify their water end-use patterns. Baseline consumption
data of annual, monthly, weekly, daily and end-use water consumption benchmarks
were obtained and their water-consuming activities and habits analysed. The data
collected from both quantitative and qualitative approaches were used to compose
representative models for each of the different socio-economic dwelling typologies of
the Federal District based on a primary data set of dwelling characteristics, baseline
water consumption and resident opinion, awareness and acceptance. These models were
used to evaluate a range of water conservation measures in terms of their applicability,
water reductions and cost-benefits.
4.4.1 Baseline water consumption
Based on the measured fixture flow rates and the timed data of water end-uses collected
during domestic water auditing, it was possible to identify the volume of water
consumed daily per tap-opening fixture (Equation 4.1.). However, in order to obtain
daily water consumption figures from appliances such as toilets, washing machines and
dishwashers, appliance consumption rates per use were multiplied by the number of
uses recorded by residents during the domestic water audits (Equation 4.2).
�F = ��ℎH × 3600 + �LMN × 60 + OPQ� × RF (4.1)
Qf = Water Consumption per Fixture (litre) qf = Fixture Flow Rate (litre/second)
�S = T × RS (4.2)
Qa = Water Consumption per Appliance (litre) N = Number of Uses qa = Appliance Consumption Rate per Use (litre/use)

Methodological Approach
100
Dealing with large data sets of timed and recorded consumption from fixtures and
appliances, an Excel model was created based on Equations (4.1) and (4.2) in order to
automate water end-use consumption calculations and simplify data analysis.
In order to validate the estimated domestic water end-use consumption an analysis using
metered data was carried out. Mains readings from each of the analysed house dwellings
were written down before starting the residential water audit and after its conclusion, in
order to obtain precise values of the total water consumption during the one-week
period of measurements. It was possible to compare the results from the total estimated
water consumption obtained from diary tracking with the total measured water
consumption from metered readings.
Dwellings that contained a discrepancy above or below 20% between estimated and
measured water consumption were discarded from analysis. Furthermore, the water bill
was collected in order to obtain not only the household’s annual water consumption, but
also to obtain its average monthly water consumption. With this, it was possible to
compare the dwelling’s metered consumption with its average consumption. Flats in the
Federal District were not individually metered. Residential building blocks used only
one mains water meter, and the bill equally shared between the flats. In this case, it was
impossible to use metered data for comparison.
Equation 4.3 shows that the average water consumption frequencies for tap-opening
fixtures were estimated by dividing their average daily water consumption (Qf) by their
measured flow rates (qf), whilst Equation 4.4 demonstrates how water consumption
frequencies for toilets, washing machines and dishwashers were estimated by dividing
their average daily water consumption (Qa) by their consumption rate per usage (qa).
UF = �FRF (4.3)
Ff = Fixture Frequency (min/day) Qf = Fixture Water Consumption (litre/day) qf = Fixture Flow Rate (litre/min)

Methodological Approach
101
US = �SRS (4.4)
Fa = Appliance Frequency (uses/day) Qa = Appliance Water Consumption (litre/day) qa = Appliance Flow Rate (litre/use)
Average values obtained from measured domestic water end-uses were categorized
according to indoor and outdoor water consumption for benchmarking comparisons
between the different income dwellings. Water consumption per capita parameter of
litres per person per day (l/p/d) was used to benchmark the different sources of water
usage inside dwellings; however, in order to compare outdoor uses between different
residential typologies, a litre per area per day (l/m2/d) parameter was applied. Such
disaggregated values for both indoor and outdoor water end-use consumption were
aggregated into daily average figures of domestic water consumption per dwelling
(litres/dwelling/day) and per person (litres/person/day) for assessment.
In one hand, weekly water consumption figures, obtained from daily water consumption
averages, allowed an analysis of weekly variations in water consumption during
weekdays and weekends. On the other hand, mean monthly values of dwelling water
consumption obtained from historic billing records, allowed an evaluation of seasonal
variations in domestic water consumption by cross-referencing secondary climatic data
of precipitation and relative humidity.
4.4.2 Statistical analysis
In order to identify what lies behind domestic water consumption in dwellings with
different socioeconomic backgrounds and typological characteristics, a multivariate
statistical analysis was performed based on both sets of primary data collected from the
questionnaire survey and the domestic water audits, to explore the relationship between
independent variables of domestic water consumption and evaluate their level of
significance to model a domestic water demand function for the Federal District.
A descriptive analysis using mean values from variables related to dwelling income,
household size, residential typology and the number of water-consuming fixtures and

Methodological Approach
102
appliances in the home was carried out for a better understanding on the composition of
dwellings with different built types and household income.
A correlation analysis between a series of variables related to domestic water
consumption, household composition and dwelling characteristics was performed and
their relationship measured using Pearson’s coefficient.
Coefficients which indicated a predictive relationship between variables of indoor and
outdoor water consumption were reported and used in a regression analysis to estimate
the domestic water consumption function. Multiple regressions allowed the
development of indoor and outdoor water consumption models generating a prediction
tool for domestic water consumption based on a set of explanatory variables.
Although results from domestic water auditing offered reliable domestic water
consumption data for domestic water end-use consumption according to income and
dwelling typology, it fails to provide and in-depth understanding of occupant behaviour
towards domestic water consumption, and perception of water conservation strategies.
A descriptive analysis of key water-consuming activities such as dish washing, clothes
washing, vehicle washing, floor washing and garden irrigation, as well as occupant
perceptions of water saving attitudes in the home were carried out according to dwelling
typology and dwelling income.
A descriptive analysis of resident’s opinion, awareness and acceptance of domestic
water conservation strategies provided a basis for understanding the level of concern
towards environmental issues and to identify how much occupant’s are willing to invest
in order to adapt their dwellings to reduce their consumption and promote water
conservation.
4.4.2.1 Drivers of domestic water consumption function
This section aims to understand what lies behind domestic water consumption and
review the main drivers of domestic water consumption. Numerous studies have
demonstrated that variables such as the cost of water, household income, climate,
dwelling characteristics, and occupant behaviour affect the way water is used and
should therefore be considered for water demand predictions.

Methodological Approach
103
Empirical studies indicate that domestic water consumption is correlated with a series of
explanatory variables affecting domestic water demand (Espey et al., 1997). A series of
econometric models for domestic water demand estimations (Qd) have been derived
following the simple form in Equation 2.1, which relates water consumption in function
of price (P) and other factors (Z) such as income, household type and household
composition (Arbués et al., 2003).
�� = ���, � (4.5)
Qd = Domestic Water Demand P = Price Z = Other Independent Variables
4.4.2.2 Price of water
A great deal of economic research has been carried out over pricing policies as a
mechanism for managing domestic water consumption. The essential logic behind the
theory is that the higher the cost of water, the lower domestic water consumption is
(Shaw, 2005). This makes sense if water is considered as a pure economic good,
however, according to Savenije (2002), water is not a normal economic good. It
contains a number of characteristics, which makes it unique. Liu et al. (2003) argues
that the different uses of water, have different levels of economic values. For example,
in an extreme case, water, as a basic human need for survival, ceases to be an economic
good. On the other hand, once basic needs have been satisfied, surplus water can be
considered an economic good.
Numerous studies have shown that domestic water consumption tends to be price-
inelastic, that is, the decrease in consumption is lower than the increase in cost (see
Worthington and Hoffman, 2008). Arbués (2003) argues that in most cases water
demand is inelastic due to the fact that there are no substitutes for water and because
there is a low level of consumer perception on rate structures, since these represent a
very small fraction of household income.
It has been observed, however, that price elasticity varies according to a given use
(Conley, 1967). Essential water uses (i.e. drinking, cooking, personal hygiene, etc.) are
not affected by the cost of water and have low price elasticity. As a result, price increase
is expected to result in a small decrease in consumption. On the other hand, unessential

Methodological Approach
104
water uses (i.e. landscape irrigation, car washing, swimming pools, etc.) are usually
affected by the cost of water and have a higher elasticity. As a result, price increase
would lead to changes in the way unessential water is used, or even, to the use of
alternative sources of water, in order to reduce consumption (Corbella and Pujol, 2009;
Schleich and Hillenbrand, 2009).
4.4.2.3 Household income
Numerous econometric models have been estimated using income as an independent
variable of water demand function (i.e. Agthe and Billings, 1987; Billings and Agthe,
1980; Dalhuisen et al., 2003; Hewitt and Hanemann, 1995; Niewswiadomy and Molina,
1989). Per capita income is commonly applied to models which make use of aggregated
water consumption data at the neighbourhood level, however, at the household-scale,
property value has been used as a substitute for household income because of their high
correlation (Dandy et al., 1997).
According to Dziegielewski et al. (1993) income measures the ability of residents to
pay for water, whereas the cost of water influences the amount of water residents are
willing to purchase. Both variables are capable of affecting domestic water consumption
behaviour. On one hand, low income linked with high water costs might cause residents
to modify their behaviour by reducing water irrigation, number of laundry loads, taking
shorter showers, making use of alternative water supplies, etc. On the other hand, high
income linked with low water costs might lead to a water-spending behaviour.
Generally, income is a measure of purchase power and is commonly associated with
living standards and level of education. Income can have an effect over the perception
of water cost. High income households might not be as responsive to water pricing as
low income households (Agthe and Billings, 1987). Living standards and property
characteristics are also affected by income. The basic premise is that the higher the
income, the higher the number of water consuming features in the household. Wealth
can be associated with the presence of a higher number of water fixtures and appliances,
larger gardens and swimming pool, affecting the way water is used (Corbella and Pujol,
2009). On the other hand, income has a positive correlation with education, and
therefore might be responsive to water conservation measures taken by residents

Methodological Approach
105
through the purchase of water-saving equipment and adopting water drought-tolerant
garden vegetation (Worthington and Hoffman, 2008).
Worthington and Hoffman (2008) point out that estimates of income elasticity in the
literature indicate that domestic water consumption is income inelastic and small in
magnitude. Although results are consistent with income inelasticity, sample bias might
have a role to play. The authors argue that most studies were carried out in populations
with similar household income, and that domestic water demand might prove to be
income-elastic in an income-diverse situation, such as those found in developing
economies.
4.4.2.4 Household size
Daily per capita consumption (litres per person per day) is a common performance
indicator used to benchmark and forecast domestic water consumption (Wong and Mui,
2008). If domestic water consumption is measured at the household level, the number of
residents should have a positive association with water use, since occupancy has a direct
influence on water consumption. Studies demonstrate that household size is correlated
with domestic water consumption (i.e. Arbués et al., 2010; Barrett and Wallace, 2009;
Schleich and Hillenbrand, 2009).
It is expected that, the larger the number of residents in a household, the bigger the
consumption will be, however, it has been found that the increase in domestic water
consumption is less than proportional to the increase in household size (Arbués et al.,
2003; Worthington and Hoffman, 2008).
4.4.2.5 Dwelling Characteristics
Dwelling characteristics such as building typology, built area, garden area and water-
using facilities might influence the way water is used, and therefore affects the amount
of water consumed in a household. A series of studies indicate that domestic water
consumption varies according to residential building typology (i.e. Loh and Coghlan,
2003; Russac et al., 1991; Thackray et al., 1978; Troy and Holloway, 2004; Zhang and
Brown, 2005). Research carried out suggests that water consumption rates between the
different dwelling typologies are not significantly different from each other (Troy and

Methodological Approach
106
Holloway, 2004; Zhang and Brown, 2005). However, an investigation carried out by
Russac et al. (1991) found that water consumption was higher in detached houses and
lower in flats.
Randolph and Troy (2008) explore variables of dwelling characteristics in Australia as
means to evaluate occupant behaviour towards domestic water consumption. According
to the authors, the ability to use water is dependent upon the range of water-using
facilities available in different residential building typologies. The number of water-
using facilities helps to explain how residents use their water and explain the differences
in water consumption behaviour. For example, flat dwellings tend to have a smaller
built area with fewer bathrooms, no gardens and swimming pools when compared to
house dwellings, thus limiting their potential to consume water, and therefore affecting
their behaviour towards domestic water consumption.
Another aspect of domestic water consumption to be taken into consideration is the fact
that water demand might be linked to built area, since the greater the floor area, the
higher the number of residents and water-using equipment (Memon and Butler, 2006).
According to Troy and Randolph (2005) the presence of water-using equipment can
influence the way water is used should be considered when studying behavioural
patterns of domestic water consumption. Rajala and Katko (2004) point out that
although domestic water consumption does not vary much according to built age of a
dwelling, the age of the water-using equipment has a more influential factor for
domestic water consumption.
A study focusing on indoor and outdoor domestic water usage for single and multi-
storey dwellings found that multi-storey dwellings used less water than single
residential dwellings (Loh and Coghlan, 2003). This might be attributed to the
typological characteristics of residential multi-storey buildings, since flat dwellings
contain communal garden areas, and therefore can have a lower water consumption rate
on outdoor activities than house dwellings with individual gardens.

Methodological Approach
107
4.4.2.6 Climate
Domestic water consumption can be divided into seasonal and non-seasonal uses. The
first is related with activities such as irrigation and cooling, which are weather
correlated. The latter, is related with water-consuming activities that are not weather
correlated, such as toilet flushing and dishwashing (Dziegielewski et al., 1993).
Climatic factors can also influence domestic water consumption behaviour. High
temperatures can lead to changes in behaviour for cooling by increasing the frequency
of showers. Also, low levels of precipitation affect garden plants, and to maintain the
garden, occupant behaviour changes in order to provide supplement water for non-
native vegetation.
Precipitation regimes usually affect outdoor water consumption for garden irrigation.
Sources of water required to maintain garden plants generally comes from a
combination of rainfall and supplementary irrigation water during dry spells (Foster and
Beattie, 1979). Consequently, the lack of precipitation leads to an increase in water
consumption.
Although several water demand models have included different climatic parameters
such as temperature, precipitation and evapotranspiration (i.e. Billings, 1982; Hoffmann
et al., 2006; Mayer et al., 1999; Niewswiadomy and Molina, 1989), none of them seem
to have addressed relative humidity as a factor for outdoor water consumption for
garden irrigation.
Relative humidity is a measure of the amount of water vapour in the air and has a direct
relationship with precipitation and solar radiation. Relative humidity not only indicates
the likelihood of precipitation, but also is necessary for cloud formation. Therefore, low
levels of humidity imply in higher solar radiation, as clouds tend to decrease solar
intensity. Low relative humidity associated with high solar gain leads to high levels of
evapotranspiration, therefore increasing outdoor water demand for irrigation.

Methodological Approach
108
4.5 Evaluation of water conservation measures
In order to identify feasible water conservation measures in terms of their applicability,
water savings and financial benefits for the different income ranges and residential
building typologies, four representative models were composed, one for each income
range, to represent: (i) high income dwellings, (ii) mid-high income dwellings, (iii) mid-
low income dwellings, and (iv) low income dwellings. Each representative model was
created according to the average values of primary data collected from the questionnaire
survey and domestic water audits for each income range.
Input data such as baseline water end-use consumption, number of residents, built area,
garden/yard area, roof area, number of fixtures and appliances and their measured flow
rates, were used to calculate domestic water reductions of water efficient technologies
and water reuse systems for the different income ranges and their residential typologies.
The representative models were also used as a basis to estimate capital costs and
evaluate the applicability of water conservation measures in terms of building
adaptation. Therefore, typological characteristics of dwellings (built area, plot size,
water-using amenities and typical plumbing installations) were considered for analysis.
Input data regarding public opinion towards the use and application of water efficient
technologies and water reuse systems, as well as the level of acceptance for dwelling
retrofit and the willingness-to-pay for water conservation strategies, were also applied to
the models in order to evaluate their applicability.
4.5.1 Domestic water reductions
The potential water savings of domestic water conservation measures are directly
related with a strategy’s capacity to reduce mains water consumption. Overall, domestic
water reductions (Qred) were obtained by the difference between baseline water
consumption (Qbase) and the estimated potential water savings (σw) for a determined
water conservation strategy (Equation 4.6).

Methodological Approach
109
�VW� = �XSYW − Z[ (4.6)
Qred = Reduced Water Consumption (m3) Qbase = Baseline Water Consumption (m3)
σw = Water Savings (m3)
4.5.1.1 Water efficient fittings, fixtures and appliances
Water efficient fittings, fixtures and appliances are capable of promoting water savings
in dwellings. For this study, only commercially available water efficient equipments in
Brazil were considered for analysis. These included, flow regulators for lavatory,
kitchen and utility faucets, automatic lavatory faucet, lavatory sensor faucet, kitchen
sensor faucet, low-flow shower head, low-flush toilet, dual-flush toilet, high-efficiency
washing machine, automatic shut-off hose nozzle, pressure washer and automatic
irrigation system. Overall, the water savings (σw) for these strategies were determined
according to their potential water reductions (φr) (Equation 4.7).
Z[ = �XSYW − \�XSYW × ] ^V100_` (4.7)
σw = Water Savings (m3) Qbase = Baseline Water Consumption (m3) φr = Potential Reductions (%)
Potential reductions (φr) for low-flow rate water efficient fittings and fixtures were
obtained by dividing the average measured fixture flow rate (qf) with efficient fixture
flow rates (qef) gathered from manufacturer’s specifications (Equation 4.8).
^V = 100 − ab RFRWFc × 100d (4.8)
φr = Potential Reductions (%) qf = Fixture Flow Rate (litre/min) qef = Water Efficient Fixture Flow Rate (litre/min)
Potential reductions (φr) from water efficient appliances were obtained by dividing the
average appliance rate of consumption per use (qa) with the reduced water consumption
rates per usage (qea) gathered from manufacturer’s specifications (Equation 4.9).

Methodological Approach
110
^V = 100 − ef RSRWSg × 100h (4.9)
φr = Potential Reductions (%) qa = Appliance Consumption Rate per Use (litre/min) qea = Water Efficient Appliance Consumption Rate per Use (litre/min)
Potential reductions for water efficient equipment such as the automatic faucet, sensor
faucet, automatic shut-off hose nozzle and automatic irrigation system were obtained
from secondary sources based in previous studies. Due to their characteristics, these
water efficient strategies promote water reductions by controlling the frequency of
water usage. Equation 4.10 was used in order to estimate their reduced frequency (Fred).
UVW� = UXSYW − \UXSYW × ]^VW�100 _` (4.10)
Fred = Reduced Frequency (min) Fbase= Baseline Frequency (min) φr = Potential Reductions (%)
4.5.1.2 Rainwater harvesting systems
Reports on rainwater harvesting systems demonstrate that collecting rainwater from
rooftops is a simple concept that promotes self-sufficiency and saves mains water
because it can be used safely on non-potable end-uses such as irrigation, floor washing,
toilet flushing, clothes washing. In order to analyse the potential water savings from
rainwater harvesting systems, three types of rainwater demands were considered for
analysis:
• Reuse 1: Irrigation and floor washing
• Reuse 2: Irrigation, floor washing and toilet flushing
• Reuse 3: Irrigation, floor washing, toilet flushing and clothes washing
Although the different types of rainwater reuse described above have an effect on the
overall cost in plumbing installation and building adaptation, the main expenditure of
rainwater harvesting system lies within the rainwater tank size. Therefore, for each of
the above rainwater reuse types, simulations based on monthly time intervals using
Equation 4.11 for a series of storage volumes was carried out in order to identify water
savings for each storage volume.

Methodological Approach
111
0� = 0�12 + �� − �� (4.11)
Subject to 0 ≤ Vt-1 ≤ C Vt = Volume in Store �m3 during time interval, t Vt-1 = Volume in Store �m3 during time interval, t-1 St = Rainwater Supply �m3 during time interval, t Qt = Rainwater Consumption �m3 during time interval, t C = Rainwater Storage Capacity
The average monthly rainwater supply (St) was obtained through the product of the
Federal District’s average historic monthly rainfall data (Rt) and dwelling average roof
area (A), considering the losses during runoff (Cr) and Filtration (Cf) (Equation 4.12).
�� = k� × l × V × F (4.12)
St = Rainwater Supply (litres) during time interval, t Rt = Average Rainfall (mm) during time interval, t A = Roof Area (m2) Cr = Runoff Coefficient Cf = Filter Coefficient
4.5.1.3 Greywater recycling systems
Greywater generated from bathroom (lavatory, shower and bath) and laundry (washing
machines and utility wash basins) can be reused for non-potable end-uses such as
irrigation, floor washing, toilet flushing and clothes washing. Four different types of
greywater systems were analysed. The first consisted in simply storing greywater from
the washing machine in a 300 litre greywater butt for irrigation and floor washing via
manual bucketing. The second system consisted of diverting greywater generated by the
premises for gravity fed sub-surface irrigation. The third, consisted of a commercially
available state-of-the-art greywater recycling apparatus composed of a single wash
basin and toilet unit linked together to treat greywater produced at the lavatory for toilet
flushing. The last, made use of commercially available greywater treatment units for
three types of greywater demands:
• Reuse 1: Irrigation and floor washing
• Reuse 2: Irrigation, floor washing and toilet flushing
• Reuse 3: Irrigation, floor washing, toilet flushing and clothes washing

Methodological Approach
112
Since greywater reuse systems are dimensioned according to the volume of greywater to
be supplied in a daily basis for reuse, sources of greywater were selected according to
the volume generated from bathroom and laundry in order to promote efficiency in the
greywater collection pipework retrofit and treatment. The collection of greywater in
existing residential buildings requires the interception of greywater outlets before they
reach the wastewater network. As result, the greater the numbers of interceptions, the
higher the costs involved in building adaptation. Furthermore, commercially available
greywater treatment systems are designed according to the volume of daily greywater
generated. For these reasons, an attempt to equalise the volume of greywater available
for treatment with the volume of greywater required to meet demand was sought
balance greywater demand and supply for the different types of reuses.
4.5.1.4 Wastewater reclamation systems
Traditionally, wastewater reclamation for non-potable reuse has been primarily been
done by centralized systems controlled by municipal water companies, however, in
recent years, commercially available small scale decentralized wastewater reclamation
systems have emerged in the Brazilian market. According to manufacturer’s,
wastewater reclamation systems are capable of providing adequate treatment and
disinfection to domestic wastewater for non-potable reuse in irrigation, floor washing
and toilet flushing. Hence, two types of domestic wastewater reuse were considered for
analysis:
• Reuse 1: Irrigation and floor washing
• Reuse 2: Irrigation, floor washing and toilet flushing
Although collection pipework for wastewater reclamation systems require little or no
intervention to existing sanitary pipework installations, commercially available
wastewater treatment systems can be onerous. Although potable water savings from
wastewater reclamation systems were equivalent to reclaimed wastewater demand,
reclamation systems were dimensioned according to the total volume of wastewater
generated daily, given that commercially available wastewater treatment systems are
designed according to the volume of daily discharge of domestic wastewater.

Methodological Approach
113
4.5.1.5 Water reduction index
In order to carry out an adequate evaluation of a comprehensive range of water
conservation measures, a water reduction index (WRI) was used as an indicator to
compare the level of potable water reductions promoted by different types of water-
saving strategies individually or in combination (Equation 4.13).
mkn = f�XSYW − �VW��XSYW g × 100 (4.13)
WRI = Water Reduction Index (%) Qred = Reduced Water Consumption (m3) Qbase = Baseline Water Consumption (m3)
4.5.1.6 Water consumption scenarios
Although water efficient strategies were evaluated individually, water reuse systems
were evaluated individually and in combination with water efficient strategies. Since
water efficient strategies reduce domestic water consumption, thus affecting water reuse
system dimensioning by decreasing water demand, and greywater and wastewater
supply. Hence, two scenarios were created to evaluate water reuse strategies. The first
scenario considered baseline water end-use consumption figures, and the second,
considered reduced water end-use consumption figures from a set of water efficient
strategies selected to promote maximum efficiency.
4.5.2 Applicability
The applicability of water conservation measures was determined according to (i)
public opinion, awareness and acceptance, and (ii) building adaptation. The average
values from the primary data collected from the questionnaire survey regarding public
opinion, awareness and acceptance of water conservation measures that served as input
data for the representative models, were used as a basis for evaluating the applicability
of a range of water conservation strategies. These were capable of measuring resident’s
awareness of existing water conservation strategies, acceptance over the use of water
efficient and water reuse strategies. Most importantly, these were able to evaluate if
residents were compliant to retrofit their homes, and pinpoint how much they would be
willing to pay to adapt their dwelling for water conservation, featuring both
environmental and financial benefits.

Methodological Approach
114
Typological characteristics of built form, built area, plot size and typical plumbing
installations, from each representative model were used as a basis to evaluate the
applicability of water conservation measures in terms of building adaptation. Such
information served mainly as a basis for water reuse system composition, dimensioning
and details of collection, drainage and distribution pipework, water tanks and equipment
installations, thus aiding in the estimation of their capital costs (including system cost
and installation costs) and operational costs (including energy consumption and
maintenance costs).
4.5.3 Cost-benefit analyses
Water conservation measures must answer two questions: (i) what are their costs? And
(ii) are they cost-effective? Their financial benefits were measured using three different
cost-benefit methods: (i) simple payback period, (ii) life cycle cost-benefit analysis and
(iii) average incremental costs.
4.5.3.1 Simple payback period
According to Herrington (2006), the simple payback period method identifies the length
of time, usually measured in years, it takes for an investment to generate enough
financial savings to repay the capital and other incurred costs of a determined water
conservation measure. Or, how long does it take for incoming return to cover its cost?
The main advantage of the payback period method is that it provides an easily
understood estimate of the benefits generated by a determined water conservation
measure from a customer point of view. Shorter payback period is considered the better
investment.
Assuming that, for the general public, the main incentive for investing in water
conservation measures is to save money, a simple payback period analysis was carried
out in order to verify which water conservation measures were most likely to be
invested by the general public. Primary data regarding the willingness-to-pay for water
conservation measures gathered from the questionnaires was used as a decision tool in
order to identify which measures were most likely to be invested by high, mid-high,
mid-low and low income residents.

Methodological Approach
115
To determine the payback period of a water-saving measure, its cost (Cm) and
installation expenses (Ci) were divided by the sum of the product of monthly water
savings (σw) and monthly costs of water (Cw) for the period of one year, subtracted by
the operational costs (Co) involved (Equation 4.14).
��o = p + q�∑ �Z[ × [2s2 � − t (4.14)
SPB= Simple Payback (yr) Cm = Cost of Measure (R$) Ci = Installation Cost (R$) σw = Water Savings (m3/month) Cw = Water Cost (R$/m3/month) Co = Operational Costs (R$/m3/yr)
Cost estimates for the above equipments, components and treatment systems were based
on the lowest price from at least three quotations obtained from local suppliers. Labour
costs were obtained according to the estimated number of labourer’s and days necessary
for commissioning, multiplied by the average daily rate of construction labour per
person in the Federal District. Annual energy consumption for electrical equipment was
estimated by the product of the equipment’s electric power by its total annual frequency
of usage.
The payback period does not take into account the distribution of costs and savings over
time and ignores the total savings generated over the lifetime of the equipment.
Furthermore, it does not provide a simple decision-rule of acceptance or rejection of the
equipment.
4.5.3.2 Life cycle cost-benefit analysis
Since the simple payback method offers no data regarding the financial benefits of a
determined investment over the useful lifetime of a water conservation measure, a life
cycle cost benefit analysis was carried out in order to take into account all the benefits
and relevant costs during a measure’s lifespan, including the adjustment for time value
of money. Life cycle cost analysis is an economic evaluation technique that determines
the total cost of owning and operating a facility over a period of time.

Methodological Approach
116
The life cycle cost-benefit analysis compares the total benefits generated by the
different water conservation measures during their useful lifespan, using the annual
discount rate to summarize findings into a measure of net present value (NPV) as
described in Equation 4.15.
T�0 = −uv + w o� − ��1 + H�x
�yv (4.15)
NPV = Net Present Value (R$) K0 = Capital Costs in year zero (R$) Ct = Costs in year t (R$/yr) Bt = Benefits in year t (R$/yr) r = Annual Discount Rate (%) n = Useful lifespan (yr)
The annual discount rate reflects time preference, i.e., people prefer experiencing
benefits sooner than later and facing costs later than sooner. Through discount rate the
present value of a benefit arising in the future is estimated in present value terms.
Basically, the discount rate is the interest rate that would make an investor indifferent as
to whether receive a payment now or a greater payment in the future.
Negative figures of net present value indicates that the costs of a determined water
conservation measure is greater than the benefits generated during the measure’s life
time, and thus, is considered unviable. Positive values on the other hand, indicates that
the benefits generated by a measure during its useful life is greater than the costs, and
consequently, the highest NPV figures are the preferred option as these indicate the
level of financial gains promoted by a water conservation measure.
A discount rate of 3% per annum was used for discounting future costs back to
equivalent present values. This rate is an average of the two most used interest rates in
Brazil: TR (referential rate of return, in Portuguese), which is used on loans, deferred
payment and general insurance, and TJLP (long run interest rate, in Portuguese), which
is the rate of return used on government bonds and popular savings.
The 3% discount rate was estimated according to the average values of reference
interest rates and long term interest rates from June 2009 to June 2010, obtained from
Brazil’s Central Bank (Brasil, 2010).

Methodological Approach
117
The average life expectancy for each water conservation measure, was estimated
according to secondary sources, or obtained from manufacturers (Tables 4.5 and 4.6).
Although water reuse systems were estimated to contain a useful life of 30 years, mostly
due to the indicative life expectancies of the PVC pipework, water tanks and treatment
units, the life cycle cost-benefit analysis considered the costs for component
replacement during their lifespan.
Due to the fact that a state-of-the-art greywater reuse toilet and lavatory unit has been
recently introduced in the market, no life cycle data could be estimated. However,
considering the fact that such apparatus is composed of a one-piece ceramic toilet and
wash basin appliance, the same indicative life cycle of average 23 years for toilets was
considered for analysis.
Table 4.5 Estimated life expectancies used for water efficient strategies.
Water Efficient Strategy Indicative
Life Expectancy
Estimated
Life Expectancy
Bathroom Faucet Flow Regulator Aerator 10 - 30 yrsb 20 yrs
Automatic Bathrom Faucet 10 - 30 yrsb 20 yrs
Bathroom Sensor Faucets 10 - 30 yrsb 20 yrs
Low Flow Shower Head 5 yrsa 5 yrs
Low-Flush Toilet (6 lpf) 15 - 30 yrsa 23 yrs
Dual Flush Toilet (3/6 lpf) 15 - 30 yrsa 23 yrs
Kitchen Sensor Faucet 10 - 30 yrsb 20 yrs
Kitchen Faucet Flow Regulator Aerator 10 - 30 yrsb 20 yrs
Utility Faucet Flow Regulator 10 - 30 yrsb 20 yrs
High-Efficiency Washing Machine 10 yrsa 10 yrs
Automatic Shut-off Hose Nozzle 5 yrsc 5 yrs
Pressure Washer 5 yrsd 5 yrs
Automatic Irrigation Sprinkler System 5 - 10 yrsc 7.5 yrs
Leakage Repair 10 – 50 yrs 30 yrs
a. Environment Agency (2003); b. Fernando Saibro from Fabrimar p.c. July 2010; c. GARDENA Manufacturing GmbH p.c. July 2010; d. Fernanda Mosquiar from Karcher Brasil p.c. July 2010
Table 4.6 Estimated life expectancies used for water reuse system components.
Water Reuse System Components Indicative
Life Expectancy
Estimated
Life Expectancy
Pipework (PVC) Over 20 yrsa 30 yrs
Pumps 5-10 yrsa 7.5 yrs
Filters (self-cleaning) 10-15 yrsa 12.5 yrs
Solenoid Valves 5-10 yrsa 7.5 yrs
Float Valves 10-15 yrsa 12.5 yrs
Level Switches 10-15 yrsa 12.5 yrs
Rainwater Tank Over 20 yrsa
30 yrs
Greywater Treatment Unit 10-50 yrsb 30 yrs
Wastewater Treatment Unit 10-50 yrsb 30 yrs
a. Leggett et al. (2001b); b. Rafael Souza from EcoCasa p.c. July 2010

Methodological Approach
118
4.5.3.3 Average incremental cost-benefit analysis
Surely, when comparing results for the life cycle cost-benefit analysis, the higher the net
present value, the bigger the financial benefits for a determined water conservation
measure. However, it might be difficult to appraise different types of water conservation
strategies, of different scales and lifespan. Therefore, an average incremental cost-
benefit analysis was used in order to compare the cost effectiveness of large initiatives
with that of smaller ones by scaling NPV results as a rate of financial benefit per
volume of water saved within the same time horizon.
The average incremental cost (AIC) of a water conservation measure could be identified
as the net present value of a series of incurred future capital and operational costs of a
measure to provide a service, divided by the incremental output of total water saved
during a determined time horizon (Equation 4.16). This has allowed a comparison
between different water conservation measures in terms of their cost per cubic meter of
water saved (R$/m3).
ln = − eu − o + tZ[ h (4.16)
AIC= Average Incremental Cost (R$/m3) K = NPV of Capital Costs (R$) B = NPV of Benefits (R$) Co = NPV of Operational Costs (R$) σw = Total Water Savings (m3)
Given the fact that water reuse systems contained the oldest average life expectancy
equivalent to thirty years, a time horizon of 30 years was used level out the different life
cycles of the varied water conservation measures. Capital costs related to the
replacement of fittings, fixtures, appliances and the main equipments related to the
proper functioning of a determined water conservation measure once they reached their
average life expectancies was incurred during the thirty-year analysis (see Tables 4.5
and 4.6).
The three methods above were used as a filtering criterion to identify economically
viable water conservation measures. Initially, the simple payback method was used to
quickly eliminate unrealistic options which contained periods of financial return above a
measure’s lifespan, or demonstrated higher annual operational costs than annual

Methodological Approach
119
financial benefits. Then, a life cycle cost-benefit analysis was used to rule out any water
conservation measure with costs greater than their financial benefits generated during
the measure’s life expectancy. Lastly, results from average incremental cost-benefit
analysis were presented on a comparable level of cost per unit of water saved, which
allowed us to rank and compare the benefits generated from the remaining water
conservation measures in a 30 year time horizon.
4.6 Conclusion
This chapter has described the methods used to (i) measure domestic water end-use
consumption for the different socio-economic dwellings in the Federal District, (ii)
evaluate the feasibility of a range of water conservation measures according to income
and residential typology, and (iii) to understand the way water is used and to review the
main drivers of domestic water consumption. Table 4.7 summarises the methodological
techniques used for data collection and the evaluation of water conservation measures.
By cross-referencing geo-demographic and socio-economic secondary data, the
selection of the administrative regions for analysis took into consideration water
consumption, income and dwelling typology. Two administrative regions were selected
for each of the 4 main income groups of the Federal District:
• High Income: Lago Sul and Lago Norte Administrative Regions
• Mid-High Income: Brasília and Águas Claras Administrative Regions
• Mid-Low Income: Taguatinga and Candangolândia Administrative Regions
• Low Income: Ceilândia and Samambaia Administrative Regions
Table 4.7 Methodological techniques for data collection and evaluation of water
conservation measures
Primary Data Collection methods and key parameters
Questionnaire Survey
Face-to-face questionnaire
- Dwelling characteristics (household size, income, tenure, estimated monthly water expenses, number of water-consuming equipments and features and existence of water efficient fittings, fixtures or appliances).
- Public opinion (on mains water and sewage tariffs, individual water
metering, the importance of saving water and concern with future water resources).
Continues on the next page

Methodological Approach
120
- Awareness of the existence of a range of water conservation measures. - Acceptance (of water conservation measures, dwelling retrofit and
willingness to pay.
In-depth questionnaire
- Habits of water-consuming activities (dish washing, clothes washing, vehicle washing, floor washing, garden irrigation and water reuse).
- Equipments used during water-consuming activities. - Water-saving attitudes.
Domestic Water Auditing
Water audit inventory
- Dwelling characteristics (built type, built area, garden/yard area and roof area).
- Type and number of water fixtures and appliances. - Volume of swimming pool and other water-consuming features. - Alternative sources of water (groundwater, rainwater and greywater). - Fixture flow rate (litres/second). - Appliance consumption rate per use (litre/use). - Detection of visible leaks and estimation of water loss.
Stop-watch technique - Daily timed water use events of tap-opening fixtures.
Diary-tracking technique - Daily registered water use events of toilet flushing, washing machine
and dishwasher appliances.
Mains water metering - Weekly measured water readings prior audit outset and after audit
closure.
Water and sewage bill - Monthly water consumption for the last 12 months. - Water and sewage tariff charged per consumption range.
Evaluation of water conservation measures
Domestic water reductions
Water efficient fittings, fixtures and appliances
- Water savings from low flow fittings and fixtures determined according to reduced flow rates obtained from manufacturer’s specifications.
- Water savings from water efficient appliances determined according to
reduced consumption rates per use obtained from manufacturer’s specifications.
- Water savings from automatic equipment determined using secondary
sources. Rainwater harvesting systems
- Water savings from three different demands determined using behavioural simulation for the operation of varied storage capacities.
Greywater recycling systems
- Water savings for four different types of greywater systems determined according to the balance of greywater supply and demand.
Wastewater reclamation systems
- Water savings determined according to reclaimed wastewater demand.
Water reduction index - Compares the level of water potable water reductions promoted by different types of water conservation measures individually or in combination.
Scenarios - Baseline scenario (water savings estimated according to current
domestic water end-use consumption). - Reduced scenario (water savings estimated for water reuse systems
according to the highest level of achievable water efficiency in domestic water end-use consumption).
Continues on the next page

Methodological Approach
121
Financial benefits
Simple payback period - Verifies which water conservation measure is most likely to be invested by residents, considering public opinion and willingness-to-pay.
- Eliminates unrealistic options (periods of financial return greater than
the measure’s lifespan, or operational costs are higher than financial benefits).
Life cycle cost-benefit analysis
- Compares the total benefits generated by different water conservation measures during their useful lifespan using net present value at a 3% discount rate.
- Negative values indicate that the costs of a water conservation measure
are greater than the benefits generated during the measure’s life time, thus, unviable.
Average incremental cost-benefit analysis
- Compares the cost effectiveness of large initiatives with that of small ones by scaling results as a rate of financial benefit per volume of water saved within a 30 year time horizon.
Applicability
Public acceptance - Verifies acceptance over the use of water efficient fittings, fixtures and appliances, rainwater harvesting systems, greywater recycling systems and wastewater reclamation systems at home.
- Verifies acceptance of dwelling retrofit and level of willingness-to-pay.
Building adaptation - Verifies physical constraints and extreme costs related to building refurbishment and plumbing installations.
In order to explore the extent to which dwelling typology, socio-economic
characteristics and occupant behaviour influence domestic water consumption, this
research incorporated both qualitative and quantitative and qualitative data collection
methods. The former involved a large-scale questionnaire survey directed to residents
for the above selected administrative regions, and the latter approach implicated in
conducting an in-depth analysis inside the dwellings, through the use of water auditing
techniques of water consumption measurements and resident interviews.
The primary data collected from the in-depth questionnaire survey and domestic water
audits were used to assess the domestic water consumption of the different socio-
economic dwelling typologies in terms of their annual, monthly, weekly, daily and end-
use water consumption, as well as to understand water-consuming activities and habits
in the home.

Methodological Approach
122
Based on the data collected for dwelling characteristics, baseline water consumption,
and resident opinion, awareness and acceptance collected from both qualitative and
quantitative approaches were used to compose a representative model for each of the
different socio-economic dwelling typologies. These representative models were used to
identify feasible water conservation measures in terms of their applicability, water
reductions and cost-benefits.
Three different methods were used to measure the financial benefits of water
conservation measures: (i) payback period (number of years to pay back initial costs),
(ii) life-cycle analysis (present value of future savings), and (iii) average incremental
cost analysis (cost per cubic meter of water saved).
Correlation and regression analysis were carried out in order to estimate the demand
function for indoor water as a function of number of residents, dwelling income, cost of
water, and built area. A demand for outdoor water, as a function of cost of water and
garden area, was estimated.

Chapter 5 Domestic Water Baseline Consumption

Domestic Water Baseline Consumption
124
5. Domestic Water Baseline Consumption
5.1 Introduction
As seen in chapter 4, occupant behaviour is the most important factor in determining
domestic water consumption, which is a function of (i) situational influences (household
income, number of residents, cost of water); (ii) unreasoned influences (habits and
routines); (iii) reasoned influences (attitudes); and (iv) stimulus (governmental
subsidies, environmental knowledge).
Based on the hypothesis that variables such as dwelling income, building typology and
occupant behaviour affect the way water is consumed, this chapter describes the results
obtained from fieldwork and discusses domestic water consumption and its end-uses for
different residential building types of high, mid-high, mid-low and low income
dwellings in the Federal District; exploring the way occupant behaviour has a direct
influence over the way water is used at home.
An econometric model and correlation analysis, using primary data collected in field
work, have been estimated for the demand function of domestic water in order to
understand what lies behind domestic water consumption in the Federal District.
5.2 Primary data collection
In order to assess the current domestic water consumption for the high, mid-high, mid-
low and low income dwellings of the Federal District, this research incorporated both
quantitative and qualitative methodological approaches. The first, involved a face-to-
face questionnaire survey that gathered primary data over socioeconomic aspects of
domestic water consumption such as dwelling characteristics, public awareness and
acceptance of water conservation strategies over a stratified random sample size of 481
dwellings. The second involved an in-depth analysis of domestic water end-use
consumption with a questionnaire designed to understand resident water-consuming
habits, and through a water auditing technique developed by the author to measure, for
seven days, end-use consumption for 117 dwellings. Primary data collection was
undertaken during the period of January 2008 to December 2008.

Domestic Water Baseline Consumption
125
5.3 Dwelling characteristics
Dwelling characteristics for the high, mid-high, mid-low and low household income
were obtained from both quantitative and qualitative methodological approaches.
Parameters such as income, number of residents, tenure, built type, built area, garden
and roof areas, number of water fixtures and appliances, swimming pool and water bill
were analysed and their findings discussed.
5.3.1 Income
Through a face-to-face questionnaire, 481 residents were asked to inform their
dwelling’s gross income. In total, 12% of the respondents did not know or refused to
provide the dwelling’s gross monthly income. From those who did answer, 2% of the
dwellings were rated as poor (less than R$ 400 monthly), 23% presented a low income
(between R$400 and R$2,000 per month), 20% had a mid-low income (between
R$2,001 and R$4,000), 18% with mid-high income (between R$4,001 and R$8,000)
and 26% of the dwellings presented a high income (above R$8,000 per month) (Figure
5.1).
Figure 5.1 Income ranges of dwellings
In line with the statistical figures published by PDAD (2004), Lago Norte and Lago Sul
dwellings presented a high average income range of more than R$8,000 per month,
Brasília and Águas Claras dwellings with an average mid-high monthly income range
between R$4,001 – R$8,000, while Taguatinga and Candangolândia dwellings had a
mid-low monthly income average of R$2,001 – R$4,000 and most of Ceilândia and
Samambaia dwellings had a monthly low income of R$400 – R$2,000 (Figure 5.2).
0%
5%
10%
15%
20%
25%
30%
Less than R$400
R$400 -R$2000
R$2001 -R$4000
R$4001 -R$8000
More than R$8000
Don't Know

Domestic Water Baseline Consumption
126
Figure 5.2 Dwelling income range per administrative regions.
Table 5.1 shows the average income per administrative region obtained from the face-
to-face questionnaire survey. The administrative regions of Ceilândia and Samambaia
had the lowest average monthly income per dwelling of R$3,200 (£914) and an average
income per capita of R$800 (£229) per person per month. Taguatinga and
Candangolândia had an average monthly income of R$4,000 (£1,143) and an average
R$1,200 per capita (£343 per person per month).
Table 5.1 Average income per administrative regions
Administrative Regions Av. Income per Dwelling Av. Income per Capita
m.m.w. R$/month £/month m.m.w R$/month £/month
Lago Norte / Lago Sul 24 9,600 2,743 6 2,400 686
Brasília / Águas Claras 19 7,600 2,171 7 2,800 800
Taguatinga / Candangolândia 10 4,000 1,143 3 1,200 343
Ceilândia / Samambaia 8 3,200 914 2 800 229
m.m.w: monthly minimum wage
The average monthly income of Lago Norte and Lago Sul dwellings was R$ 9,600
(£2,743) and a monthly income per capita of R$2,400 (£686), while Brasília and Águas
Claras presented an average income per dwelling, of R$ 7,600 (£2,172), and a monthly
income per capita of R$2,800 (£800). The household income varies form an equivalent
to 24 minimum wage to 8 minimum wage. The income of Lago Norte/Lago Sul region
0%
10%
20%
30%
40%
50%
60%
70%
80%
Less than R$400
R$401 -R$2000
R$2001 -R$4000
R$4001 -R$8000
More than R$8000
Don't Know
Lago Norte / Lago Sul Brasília / Águas Claras
Taguatinga / Candangolândia Ceilândia / Samambaia
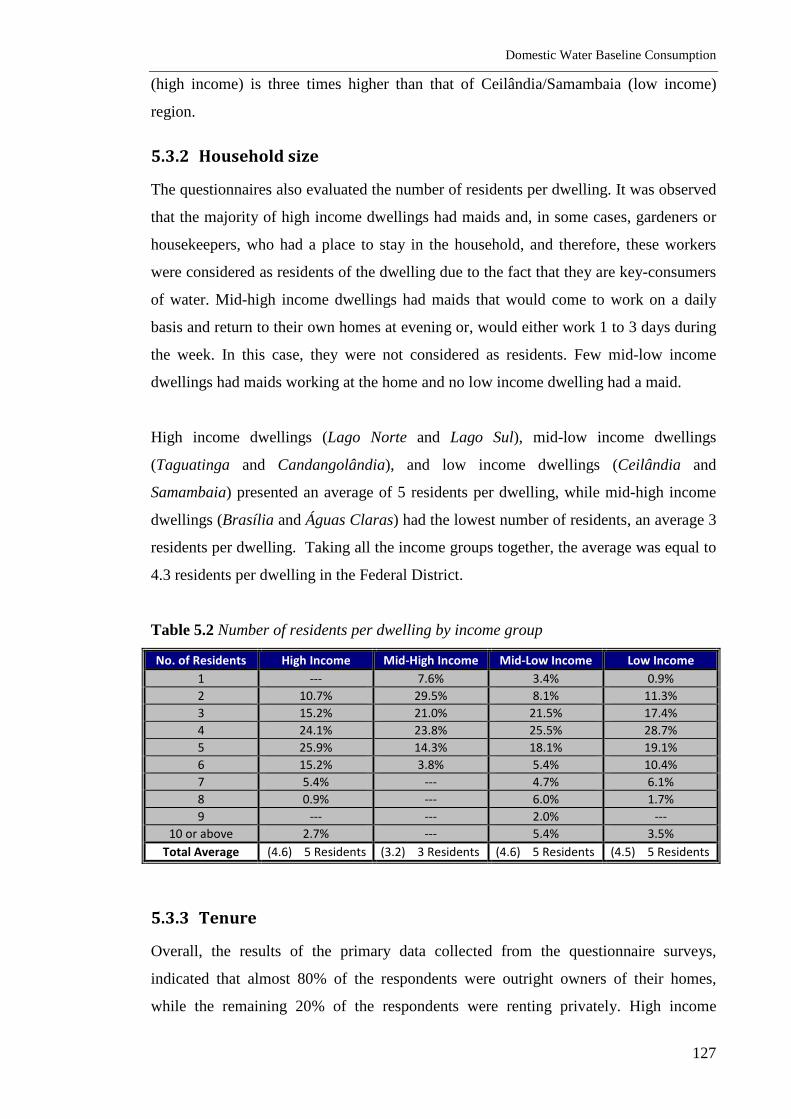
Domestic Water Baseline Consumption
127
(high income) is three times higher than that of Ceilândia/Samambaia (low income)
region.
5.3.2 Household size
The questionnaires also evaluated the number of residents per dwelling. It was observed
that the majority of high income dwellings had maids and, in some cases, gardeners or
housekeepers, who had a place to stay in the household, and therefore, these workers
were considered as residents of the dwelling due to the fact that they are key-consumers
of water. Mid-high income dwellings had maids that would come to work on a daily
basis and return to their own homes at evening or, would either work 1 to 3 days during
the week. In this case, they were not considered as residents. Few mid-low income
dwellings had maids working at the home and no low income dwelling had a maid.
High income dwellings (Lago Norte and Lago Sul), mid-low income dwellings
(Taguatinga and Candangolândia), and low income dwellings (Ceilândia and
Samambaia) presented an average of 5 residents per dwelling, while mid-high income
dwellings (Brasília and Águas Claras) had the lowest number of residents, an average 3
residents per dwelling. Taking all the income groups together, the average was equal to
4.3 residents per dwelling in the Federal District.
Table 5.2 Number of residents per dwelling by income group
No. of Residents High Income Mid-High Income Mid-Low Income Low Income
1 --- 7.6% 3.4% 0.9%
2 10.7% 29.5% 8.1% 11.3%
3 15.2% 21.0% 21.5% 17.4%
4 24.1% 23.8% 25.5% 28.7%
5 25.9% 14.3% 18.1% 19.1%
6 15.2% 3.8% 5.4% 10.4%
7 5.4% --- 4.7% 6.1%
8 0.9% --- 6.0% 1.7%
9 --- --- 2.0% ---
10 or above 2.7% --- 5.4% 3.5%
Total Average (4.6) 5 Residents (3.2) 3 Residents (4.6) 5 Residents (4.5) 5 Residents
5.3.3 Tenure
Overall, the results of the primary data collected from the questionnaire surveys,
indicated that almost 80% of the respondents were outright owners of their homes,
while the remaining 20% of the respondents were renting privately. High income

Domestic Water Baseline Consumption
128
dwellings had the lowest number of rented dwellings (12%) whilst mid-high income
dwellings presented the highest number of rented dwellings (29%) (Figure 5.3).
Figure 5.3 Tenure of dwelling property by income group
5.3.4 Residential typology and amenity characteristics
Typological characteristics are determinants for water use within homes, and therefore,
through an in-depth analysis of 117 dwellings, primary data regarding the home’s built
type, built area, roof area, garden/yard size, swimming pool and other water features
were collected according to administrative regions (Table 5.3). Due to the Federal
District’s urban planning laws, a distinct pattern of typological characteristics per
administrative region could be found.
Table 5.3 Typological characteristics
Typological Parameters High Income Mid-High
Income
Mid-Low
Income Low Income
Built Area (m2): 427 91 141 110
Garden / Yard Area (m2): 1,364 --- 80 74
Roof Area (m2): 373 765 130 97
Swimming Pool Volume (m3): 53 --- 35 ---
5.3.4.1 Lago Norte and Lago Sul: High income dwellings
Lago Norte and Lago Sul dwellings were either ground floor bungalow houses (65%) or
one story detached houses (35%) with an average total built area of 427m2. Due to strict
0%
10%
20%
30%
40%
50%
60%
70%
80%
90%
100%
High Income Mid-High Income Mid-Low Income Low Income
Owned Rented

Domestic Water Baseline Consumption
129
local land use planning laws, the constructible area within an average 1,738m2 plots are
limited, and therefore contain average roof projections of 373m2 and extensive
vegetated gardens of 1,364m2. Almost every home had an extension with a barbeque
area next to a swimming pool (average volume of 53m3). (Figure 5.4).
Figure 5.4 Aerial view of high income houses in Lago Sul.
Source: http://www.infobrasilia.com.br
5.3.4.2 Brasília and Águas Claras: Mid-high income dwellings
All of Brasília and Águas Claras dwellings were flats, with an average built area of
91m2. Having different urban planning laws, Brasilia and Águas Claras residential
building blocks differed in size and built form.
Due to Brasilia’s urban planning, the residential building stock consisted of dominantly
horizontal high rise buildings with 4 or 6 storey high rise buildings (Figure 5.5). With
an average roof area of 1,095m2, the number of flats per floor varied from 8 to 16.

Domestic Water Baseline Consumption
130
Figure 5.5 Aerial view of mid-high income residential buildings in Brasília.
Source: http://www.infobrasilia.com.br
Águas Claras’ residential building stock on the other hand, had a dominant vertically
shaped high rise buildings ranging from 12 to 25 storey high (Figure 5.6). Most
residential buildings contained 4 flats per floor, having an average roof area of 434m2.
Figure 5.6 Mid-high income residential buildings in Águas Claras.
Source: http://pt.wikipedia.org/wiki/Ficheiro:Aguas_Claras_2007.JPG

Domestic Water Baseline Consumption
131
Flat dwellings from both Brasília and Águas Claras, did not have individual gardens,
these were commonly found within communal grounds surrounding the residential
building blocks. From the analyzed sample, no swimming pools were found, however,
some recently built residential buildings contain communal pools, and a few penthouses
have an individual pool.
5.3.4.3 Taguatinga and Candangolândia: Mid-low income dwellings
The majority of the dwellings from Taguatinga and Candangolândia were ground floor
bungalow houses (86%) the remaining were one story detached houses (14%). With an
average dwelling built area of 141 m2, the houses had an average roof area of 130m2.
These homes did not have a vegetated garden, instead, they had cemented yards of an
average 80m2 (Figure 5.7). Few of Taguatinga and Candangolândia dwellings did have
a swimming pool (3.5%), with an average volume of 35m3. No water features were
found within the dwellings.
Figure 5.7 Aerial view of mid-low income houses in Taguatinga
Source: Google Earth
5.3.4.4 Ceilândia and Samambaia: Low income dwellings
Dwellings from Ceilândia and Samambaia were either ground floor bungalow houses
(85%) or one storey terraced houses (15%) with an average built area of 110m2. Having
an average roof area of 97 m2, most dwellings analysed had cemented yards with an
average 74m2 area (Figure 5.8). No swimming pools or water features were found.

Domestic Water Baseline Consumption
132
Figure 5.8 Aerial view of low income houses in Samambaia
Source: Google Earth
5.3.5 Water fixtures and appliances in the home
Details over a number of water using fixtures and appliances used within dwellings
were gathered. These are major pieces of water using equipment within water
consuming areas of the home, and therefore, indicate water using activities per dwelling
amenity, as well as the capacity of a home to use water on a regular basis.
The number of water fixtures and appliances was collected through the use of the
quantitative face-to-face questionnaire survey, whilst their flow-rates were measured
during the in-depth water auditing approach. Table 5.4 summarizes the average number
and flow rates of water fixtures and appliances for the different levels of income.
Results from the questionnaires and water audit inventories also demonstrated that the
quantity and quality of these equipments are directly related to household income and
dwelling typology. High income dwellings contained the highest number of water
fixtures and appliances, while low income dwellings had the lowest number of water
using equipment. It was observed that the higher the income, the higher the quality of
water fixtures and appliances were within dwellings. The quality and quantity of water
fixtures and appliances were evaluated according to water using amenities within a
dwelling.

Domestic Water Baseline Consumption
133
Overall, mid-high income dwellings presented higher flow rates within their fixtures.
This was probably due to its multi-storey typological characteristic, where water was
indirectly fed to flats through a mains water tank positioned above the building’s last
floor, causing an increase in water pressure while supplying water to the different
floors, resulting in slightly higher fixture flow rate figures.
On the other hand, low income dwellings demonstrated lower flow rate figures within
their water fixtures. This might be explained by the way in which low income residents
operated their water fixtures. Some low income residents which took part in the flow
rate measurements during the water audit inventory demonstrated a low consumption
tap-opening habit. When they were asked to demonstrate how they usually operated a
tap-opening fixture, these residents opened their taps by less than a half turn, resulting
in lower flow rate averages.
Table 5.4 Average flow rates and number of water fixtures and appliances
Water End-Uses High Income Mid-High Income Mid-Low Income Low Income
No. Flow Rate No. Flow Rate No. Flow Rate No. Flow Rate
Lavatory Faucet 6 4.8 l/min 3 6.7 l/min 3 5.1 l/min 2 4.9 l/min
Shower Head 5 5.4 l/min 3 5.7 l/min 2 5.2 l/min 2 4.0 l/min
Bath Faucet 1 8.3 l/min 0 --- 0 --- 0 ---
Bidet / Hand Douche 4 4.2 l/min 2 7.2 l/min 1 4.4 l/min 1 10.2 l/min
Toilet 6 9 l/flush 3 9 l/flush 3 9 l/flush 2 9 l/flush
Kitchen Faucet 2 6.0 l/min 1 6.8 l/min 1 5.4 l/min 1 4.7 l/min
Water Filter 1 2.4 l/min 1 2.2 l/min 1 2.5 l/min 1 2.5 l/min
Dishwasher 1 10.0 l/load 1 12.6 l/load 0 --- 0 ---
Laundry Sink Faucet 2 7.2 l/min 1 7.4 l/min 2 6.4 l/min 2 5.4 l/min
Washing Machine 1 141 l/load 1 164 l/load 1 155 l/load 1 164 l/load
External Tap 3 16.8 l/min 3 16.8 l/min 1 9.6 l/min 1 8.9 l/min
Swimming Pool Valve 1 16.8 l/min 0 --- 0 --- 0 ---
Swimming Shower Head 1 16.8 l/min 0 --- 0 --- 0 ---
5.3.5.1 Bathroom fixtures
Low income dwellings had in average 2 bathrooms per dwelling containing only the
necessary bathroom fixtures (toilet, shower head and lavatory faucet), while high
income dwellings had an average of 6 bathrooms per dwelling, containing extra
bathroom fixtures such as bath faucets and bidets or hand douches. Whilst most low
income dwellings contained plastic lavatory faucets with low budget toilets and shower
heads, high income dwellings had high standard bathroom fixtures, and some presented
state-of-the-art bathroom fixtures.

Domestic Water Baseline Consumption
134
5.3.5.2 Kitchen fixtures and appliances
The majority of the high income dwellings had two kitchen faucets; one in the kitchen,
and another outside, within a barbeque area. Overall, the remaining income dwellings
did not have a barbeque area, and therefore, contained in average, one kitchen faucet per
home. From low budget plastic kitchen faucets to state-of-the-art equipments, it was
observed that the higher the dwelling income, the better the quality of fixtures and
appliances was. Many dwellings had water filter appliances in their home. Low income
households however, did not have such appliances.
5.3.5.3 Utility fixtures and appliances
Water using equipments such as the laundry sink, sink washers and washing machines
are commonly found in utility rooms. The laundry sink is generally used to hand-wash
floor cloths and delicate clothing by hand. Sink washers can be described as
mechanically driven laundry sinks. These non-automatic washing machines are low
budget laundry appliances used to pre-wash clothes. Different from washing machines,
the sink washer has to be drained manually after use.
While in average, high and mid-high income dwellings had one washing machine per
home and no sink washer most middle and low income dwellings had none. Over half
of mid-low and low income dwellings (55%), had both sink washer and washing
machine at their homes. In some cases, sink washers were used to pre-wash clothes
prior washing machine, but in others, the home simply updated from sink washers to
washing machines and kept both appliances.
Although it was quite common to find only one laundry sink per home, overall, house
dwellings demonstrated to contain two laundry sink faucets. The use of two laundry
sinks per dwelling might be explained through behavioural attitudes towards washing
clothes; while one laundry sink is filled with water for soaking clothes, the other is free
to be used. On the other hand, most of the interviewed flat dwellings, demonstrated to
have had only one laundry sink faucet due to lack of space.
5.3.5.4 External taps
Every house dwelling had at least one external tap for garden irrigation and floor
washing. High income dwellings contain larger garden areas, and therefore, presented a
larger number of external taps for irrigation. The majority of high income dwellings had

Domestic Water Baseline Consumption
135
a swimming pool, and therefore, contained a pool shower head. It was uncommon to
find a swimming pool at the remaining income houses. Due to their built type, mid-
high income dwellings from Brasília and Águas Claras had no external taps or pool
shower heads. External taps were found within communal grounds of their residential
high-rise buildings, and no pool shower heads were found. Due to their typological
characteristics, the average flow rate and number of external taps considered for
analysis was for the entire residential building block.
5.4 Domestic water consumption
Primary data on baseline water consumption for the high, mid-high, mid-low and low
income dwellings were collected through the water auditing technique developed to
measure domestic water consumption using a technical survey linked with diary log
sheets and metered measurements in order to obtain annual, monthly, weekly and daily
consumption indicators as well as to understand water end-use consumption. Results
were analysed and performance evaluated.
5.4.1 Annual water consumption
Annual water consumption data for 117 dwellings, gathered from historic billing
records during the water auditing period, ranged from a minimum 36m3 per dwelling
per year to a maximum 732m3 per dwelling per year, and a mean 282m3 per dwelling
per year.
Figure 5.9 Average annual water consumption per dwelling
481
243216
180
0
100
200
300
400
500
600
High Income Mid-High Income Mid-Low Income Low Income
(m3 /
dw
ellin
g)

Domestic Water Baseline Consumption
136
It was observed that the higher the income, the higher the average annual water
consumption. Overall, high income house dwellings from Lago Norte and Lago Sul
presented the highest annual rate of consumption with an average 481m3 per annum.
Mid-high income flat dwellings from Brasília and Águas Claras presented an average
water consumption rate of 243m3/year, mid-low income house dwellings from
Taguatinga and Candangolândia 216m3/year and low income house dwellings from
Ceilândia and Samambaia 180m3/year (Figure 5.9).
5.4.2 Monthly water consumption
Monthly variations of mean water consumption throughout the year were analysed by
cross-referencing climatic data of monthly precipitation and relative humidity
(METEOTEST, 1999) with the historic billing data of the 117 dwellings studied. It was
observed that monthly water consumption had a direct relationship with monthly
precipitation and relative humidity, where the lower the precipitation and relative
humidity, the higher the water consumption, and the higher the precipitation and
relative humidity, the lower water consumption (Figures 5.10 and 5.11). This tendency
might be explained due to the Federal District’s intense dry season (from April to
September), which raises the demand of water for garden irrigation.
Figure 5.10 Average monthly water consumption and precipitation
0
50
100
150
200
250
300
0
5
10
15
20
25
30
Jan Feb Mar Apr May Jun Jul Aug Sep Oct Nov Dec
Av. Monthly Water Consumption (m3) Monthly Precipitation (mm)

Domestic Water Baseline Consumption
137
Figure 5.11 Average monthly water consumption and relative humidity
Figure 5.12 Average monthly water consumption per income range
Figure 5.12 shows seasonal mean water consumption patterns per income range for the
analysed dwellings. A distinct high monthly water consumption pattern for high income
dwellings could be observed. Due to the fact that high income dwellings from Lago
Norte and Lago Sul contain large non-native vegetated garden areas (see Section 5.3.4),
they require higher amounts of water for irrigation during the Federal District’s dry
season. On the other hand, little seasonal variations of water consumption for mid-high,
mid-low and low income dwellings were observed. Brasília, Águas Claras, Taguatinga,
Candangolândia, Ceilândia and Samambaia dwellings require little or no water for
irrigation due to their typological characteristics.
0
10
20
30
40
50
60
70
80
90
0
5
10
15
20
25
30
Jan Feb Mar Apr May Jun Jul Aug Sep Oct Nov Dec
Av. Monthly Water Consumption (m3) Relative Humidity (%)
0
5
10
15
20
25
30
35
40
45
50
Jan Feb Mar Apr May Jun Jul Aug Sep Oct Nov Dec
(m3 /
dw
ellin
g)
High Income Mid-High Income Mid-Low Income Low Income

Domestic Water Baseline Consumption
138
5.4.3 Weekly water consumption
Weekly water consumption trends were obtained through daily monitoring of water
usage for the 117 audited dwellings during a seven day period. The average weekly
consumption for all of the studied sites ranged from a minimum 854 litres per dwelling
per week to a maximum 32,393 litres per dwelling per week, with a mean 5,191 litres
per dwelling per week.
Overall, high income house dwellings from Lago Norte and Lago Sul presented the
highest rate of weekly water consumption with an average 8,978 litres per week. Mid-
high income flat dwellings from Brasília and Águas Claras presented an average water
consumption rate of 4,412 litres per week, mid-low income house dwellings from
Taguatinga and Candangolândia 4,384 litres per week and low income house dwellings
from Ceilândia and Samambaia 3,378 litres per week.
Figure 5.13 summarises the weekly water consumption patterns for all audited
dwellings. The highest rates of consumption were during weekdays, ranging from 842
to 719 litres per dwelling per day, while water consumption on weekends ranged
between 687 and 637 litres per dwelling per day.
Figure 5.13 Average weekly water consumption patterns
Figure 5.14 shows weekly water consumption variations between the different income
dwellings. High, mid-low and low income house dwellings consumed higher amounts
of water during weekdays, while mid-high income flat dwellings consumed higher
amounts of water during the weekend.
0
100
200
300
400
500
600
700
800
900
Mon Tue Wed Thu Fri Sat Sun
(lit
res/
dw
ellin
g)

Domestic Water Baseline Consumption
139
High income dwellings form Lago Norte and Lago Sul presented great variations of
daily water consumption during the week in comparison to other income ranges, with
higher consumption patterns during weekdays (mean 1,403 litres/day) and lower
consumption pattern during the weekend (mean 981 litres/day). This trend can be
explained by the oscillating number of residents at the dwelling during weekdays and
weekend. It is important to remember that most high income dwellings had gardeners
and housekeepers living at the household during weekdays; in the weekends, these
workers would return to their own homes, therefore playing a major influence over
water consumption.
Daily water consumption monitoring indicated that peak consumption during the week
was directly related with house cleaning. It was observed that during days on which
clothes and floors were washed, dwelling water consumption raised significantly.
Figure 5.14 Average weekly water consumption patterns per income range
5.4.4 Daily water consumption
Average daily water consumption was obtained from daily readings during water
auditing for each of the 117 analysed dwellings.
5.4.4.1 Water consumption per dwelling
Figure 5.15 shows that most dwellings consumed less than 1,000 litres per day, with a
mean daily consumption of 742 litres per dwelling per day. Mean daily water
0
200
400
600
800
1000
1200
1400
1600
1800
Mon Tue Wed Thu Fri Sat Sun
(lit
res/
dw
ellin
g)
High Income Mid-High Income Mid-Low Income Low Income

Domestic Water Baseline Consumption
140
consumption for most dwellings (42.2%) ranged between 501 – 1,000 litres/day, while
36.2% of the analysed dwellings consumed up to 500 litres/day and the remaining
21.6% presented an average daily consumption of over 1,000 litres/day.
Figure 5.15 Scatter diagram of average daily water consumption per dwelling
Overall, high income house dwellings from Lago Norte and Lago Sul presented the
highest rate of daily water consumption with an average 1,283 litres per day. Mid-high
income flat dwellings from Brasília and Águas Claras presented an average water
consumption rate of 630 litres per day, mid-low income house dwellings from
Taguatinga and Candangolândia 625 litres per day and low income house dwellings
from Ceilândia and Samambaia 483 litres per day.
5.4.4.2 Water consumption per capita
Figure 5.16 shows a scatter diagram of the water consumption per person per day for
the 117 audited dwellings. With a mean consumption of 196 litres per person per day,
most dwellings consumed less than 200 litres per person per day. Average per capita
water consumption for the majority of the analysed dwellings ranged between 101 – 200
litres per person per day (45.7%), while a small portion of the observations consumed
above 300 litres per person per day (8.6%), 18.1% consumed up to 100 litres per person
per day, and the mean per capita consumption for 27.6% of dwellings ranged between
201 – 300 litres.
0
500
1000
1500
2000
2500
3000
3500
4000
4500
5000
0 20 40 60 80 100 120
Av
. D
ail
y C
on
sum
pti
on
(li
tre
s/d
ay
)
Observations (n=117)

Domestic Water Baseline Consumption
141
Figure 5.16 Scatter diagram of average daily water consumption per capita
Figure 5.17 clearly shows the direct relationship between water consumption per capita
and dwelling income range. With the highest per capita water consumption, high
income house dwellings from Lago Norte and Lago Sul consumed in average 321 litres
per person per day, mid-high income flat dwellings from Brasília and Águas Claras
mean water consumption rate was 205 litres per person per day, while mid-low income
house dwellings from Taguatinga and Candangolândia consumed an average 146 litres
per person per day, and with the lowest consumption rate, low income house dwellings
from Ceilândia and Samambaia per capita consumption was an average 112 litres per
person per day.
Figure 5.17 Average daily water consumption per capita by income range
0
200
400
600
800
1000
1200
0 20 40 60 80 100 120
Av
. C
on
sum
pti
on
pe
r C
ap
ita
(lit
res/
pe
rso
n/d
ay
)
Observations (n=117)
321
205
146
112
0
50
100
150
200
250
300
350
High Income Mid-High Income Mid-Low Income Low Income
(lit
res/
per
son
/day
)

Domestic Water Baseline Consumption
142
Previous studies (Loh and Coghlan, 2003; Thackray et al., 1978; Zhang and Brown,
2005) have indicated that the raise in domestic water consumption is constant and
proportional to the household income (see Chapter 2). Although the overall findings
were in-line with previous research, this study has shown that, not only domestic water
consumption increases proportionally to the increase in income, but also there was a
significant contrast of domestic water consumption for high income dwellings in the
Federal District. In short, there is an outstanding difference in water consumption of
high income dwellings when compared to lower income ranges (Figures 5.9; 5.12; and
5.17).
5.4.5 End-use consumption
End-use water consumption patterns for the 117 analysed dwellings were obtained
through daily measurements of end-use water usage during a seven day period. Figure
5.18 illustrates the average domestic water end-use consumption pattern for the Federal
District at its simplest form, including potable, laundry, toilet flush and outdoor uses.
Figure 5.18 Average domestic water end-use consumption pattern at its simplest form
To be able to compare the end-use results of this research with that of previous studies,
leaks and losses were not accounted. Swimming pool water end-use consumption was
also not included for comparison for two main reasons. The first, was that apart from
two studies (Loh and Coghlan, 2003; Roberts, 2005), the great majority of analysed
dwellings in previous research, did not have swimming pools. The second reason was
Potable Uses47%
Laundry25%
Toilet Flush15%
Outdoor uses13%

Domestic Water Baseline Consumption
143
that a very small sample size of dwellings in the Federal District used water for topping-
up swimming pools (Table 5.6).
Although overall results from this study presented similar proportions of water end-use
consumption from previous studies carried out in developing countries (as seen in
Chapter 2, Section 2.4, Figure 2.12), the Federal District presented a slightly higher
trend in laundry water use. Such disparity might be related to differences in water-using
habits and utility fixtures and appliances. For a more in-depth analysis, disaggregated
results of domestic water end-use consumption were categorized according to indoor
water consumption and outdoor water consumption.
5.4.5.1 Indoor water consumption
With a total mean indoor consumption of 182 litres per person per day, in average,
indoor water-consuming activities from shower heads (20.6%), washing machines
(17.2%), toilet flushes (16.8%) and kitchen faucets (16.6%) had the highest rates of
daily water consumption per person, while water filters (1,4%), bidet/hand douches
(1,4%) and dishwashers (1,5%) contained the lowest rates of daily consumption per
person (Figure 5.19).
Figure 5.9 Average indoor water end-use consumption per capita
Although each individual dwelling demonstrated unique patterns of indoor water
consumption, similar trends were observed between the varied income groups and built
types. Table 5.5 summarises the results for the indoor water end-use consumption,
demonstrating a high consumption trend at the kitchen faucet, shower head and toilet
flush, and a low consumption trend at the water filter and bidet/hand douche for high,
Bathroom Faucet8.6%
Shower Head20.6%
Bidet / Hand Douche
1.5%Toilet Flush
16.8%Kitchen Faucet16.6%Water Filter
1.4%
Dishwasher1.8%
Utility Faucet9.5%
Washing Machine
17.2%
Leaks & Losses6.0%

Domestic Water Baseline Consumption
144
mid-high, mid-low and low income dwellings. Overall, high income dwellings
presented the highest water end-use consumption rates, while low income dwellings had
the lowest water end-use consumption rates.
With the highest total mean indoor water consumption of 227 l/p/d (litres per person per
day), high income dwellings presented an end-use water consumption rate of 42 l/p/d on
toilet flushes (18.5%), 36 l/p/d on shower heads (15.9%) and 35 l/p/d on the kitchen
faucet (15.4%). Overall, 25.3% of indoor water consumption was used for clothes
washing and cleansing on washing machines (34 l/p/d) and utility faucets (23 l/p/d),
posing a significant contribution towards indoor water consumption. The lowest end-use
water consumption rates were measured at bidet/hand douches (1.1%) with an average
consumption rate of 2.6 l/p/d, water filters (1.4%) with a mean rate of 3.2 l/p/d and
dishwashers (2.3%) with an average consumption of 5 l/p/d. One out of seven analysed
house dwellings presented water leakage (11.9%), with an average loss rate of 27 l/p/d.
With a total average indoor consumption of 221 l/p/d, mid-high income dwellings
obtained their highest end-use water consumption values on shower heads (23.9%) with
an average 53 l/p/d, washing machines (22.1%) with an estimated 49 litres/person/day,
toilet flushes (15.8%) with a mean 35 litres/person/day and kitchen faucets (15.5%)
with a mean rate of 34 l/p/d. Low end-use rates were measured on dishwashers (0.7%)
with a mean 1 l/p/d, water filter (1.3%) with an estimated 3 l/p/d and bidets / hand
douches (1.5%) with an average 3 l/p/d, indicated that such appliances and fixtures were
not commonly used. It was observed that, due to periodic maintenance of building
hydraulics, no visible leaks were detected on the analysed flat dwellings.
Mid-low income dwellings, on the other hand, had an average indoor water
consumption of 144 l/p/d. Their highest mean end-use water consumption rates were 33
l/p/d on shower heads (23.0%), 29 l/p/d on kitchen faucets (20.2%) and 27 l/p/d on
toilet flushes (19%) with low mean rates of 2 l/p/d on water filters (1.4%), 4 l/p/d on
bidet/hand douches (2.8%) and 10 l/p/d on bathroom faucets. From 28 analysed
dwellings, only 6 contained hand douches, and none of them presented a dishwasher.
Only one mid-low income house presented leakage of an estimated 0.5 l/p/d (0.3%).
Low-income dwellings presented the lowest indoor water consumption with an average
total of 118 litres per person per day. The highest rates were measured at shower heads

Domestic Water Baseline Consumption
145
(23.7%) with a mean 28 l/p/d, kitchen faucets (18.9%) with average 22 l /p /d and toilet
flushes (16.0%) at 19 l/p/d. The lowest end-use values were registered on bidets/hand
douches (0.8%) with a low rate of 1l/p/d, water filter (1.8%) with a low average of 2
l/p/d and utility faucets (8.8%) with a mean 10 l/p/d. From a total of 26 analysed
dwellings, only 3 low income dwellings had hand douches and none of them contained
a dishwasher. Five low income dwellings presented leaks (4.3%) with an average water
loss rate of 5 l/p/d.
5.4.5.2 Outdoor water consumption
Overall, water consumption from external taps consisted mainly of garden irrigation and
floor washing. Therefore, irrigable garden areas, as well as veranda, paved yards and
other washable floor areas were considered as a basis for parametrical comparison of
external water consumption. In this study, garden/floor area was equivalent to irrigable
garden areas and washable floor areas such as verandas and paved yards. These were
identified through resident interview and measured on site. Due to its building typology,
outdoor water consumption for high rise residential building blocks were performed
within communal grounds, and therefore considered for benchmarking consumption.
Both irrigation and floor washing water consumption were estimated as a whole, due to
the fact that both activities use the same water fixture or alternative source of water
supply.
Table 5.6 summarises the results of outdoor water consumption for garden irrigation
and floor washing. High income dwellings from Lago Norte and Lago Sul had the
highest water consumption rate of 2.2 litres per garden/floor area per day, while mid-
low and low income house dwellings had an average 0.7 l/m2/d. With the lowest water
consumption rate of 0.5 litres per garden/floor area per day (l/m2/d), high rise flat
buildings from Brasília and Águas Claras, consumed 42% less water than house
dwellings. Such results are compatible with findings presented by Loh and Coghlan
(2003), which indicated that multi-storey flat buildings consumed 55% less water
outdoors than house dwellings (see Chapter 2, section 2.4.1).
From twenty eight high income house dwellings with a swimming pool, only four
dwellings topped-up their swimming pools with mains water during water auditing.
Overall, swimming pools had a high water consumption rate (9 litres per swimming
pool area per day), and therefore, the great majority of dwellings avoided mains water

Domestic Water Baseline Consumption
146
top-ups or used a closed filtration system for water purification, avoiding water losses
for cleansing. During water auditing, no water consumption was measured from
swimming pool shower heads, therefore, it was not included for analysis.
Lago Norte and Lago Sul house dwellings situated near the lake normally have access to
groundwater. A small sample size of dwellings extracted groundwater from wells in
order to use on irrigation and floor washing (0.8 l/m2/d). The remaining administrative
regions did not have access to groundwater tables.
This study represents the first attempt to understand outdoor water end-uses in Brazilian
dwellings. Works carried out so far have focused in analysing indoor water end-use
consumption, and no attention has been given to outdoor end-uses such as irrigation,
floor washing and swimming pool top-up (see Chapter 2 Section 2.4).

Domestic Water Baseline Consumption
147
Table 5.5 Indoor water end-use consumption per income range
Indoor Water End-Uses High Income Mid-High Income Mid-Low Income Low Income
l/p/d*
sample size % l/p/d* sample size % l/p/d
* sample size % l/p/d
* sample size %
Bathroom Faucet 18 28 8.1 21 35 9.5 10 28 7.1 13 26 10.9
Shower Head 36 28 15.9 53 35 23.9 33 28 23.0 28 26 23.7
Bidet / Hand Douche 3 19 1.1 3 23 1.5 4 6 2.8 1 3 0,8
Toilet Flush 42 28 18.5 35 35 15.8 27 28 18.6 19 26 16.0
Kitchen Faucet 35 28 15.4 34 35 15.5 29 28 20.2 22 26 18.9
Water Filter 3 22 1.4 3 21 1.3 2 14 1.4 2 8 1.8
Dishwasher 5 2 2.3 1 5 0.7 --- --- --- --- --- ---
Utility Faucet 23 28 10.2 22 33 9.8 14 28 9.7 10 23 8.8
Washing Machine 34 28 15.1 49 32 22.1 25 22 17.1 17 18 14.7
Leaks & Losses 27 4 11.9 --- --- --- 0.5 1 0.3 5 6 4.3
TOTAL 226 100.0 221 100.0 144 100.0 118 100.0 *litres per person per day
Table 5.6 Outdoor water end-use consumption per income range
Water Sources High Income Mid-High Income Mid-Low Income Low Income
l/m2/d
* sample size l/m
2/d
* sample size l/m
2/d
* sample size l/m
2/d
* sample size
External Tap 2.2 25 0.5 30 0.7 22 0.7 17
Swimming Pool Valve 9 4 --- --- --- --- --- ---
Water Well 0.8 2 --- --- --- --- --- ---
Water Reuse 1.3 1 --- --- 1.5 11 2.0 13 *litres per garden, floor or swimming pool area per day

Domestic Water Baseline Consumption
148
5.5 Water end-use frequencies and activities
In order to understand the behavioural aspects of domestic water usage for the different
income dwellings, primary data on resident’s frequencies of water usage per water
fixture and appliance, as well as their main water-consuming activities were collected
during the water auditing survey.
5.5.1 Frequencies of water usage
As seen in Chapter 4, end-use water consumption frequencies for tap-opening fixtures
were determined by dividing average daily water consumption with their average
measured flow rates, while water consumption frequencies for appliances were obtained
by the product of their average daily water consumption with their fixed water
consumption rate per usage. Average values of water consumption frequencies for the
various end-uses from high, mid-high, mid-low and low income dwellings were
obtained (Table 5.7).
Table 5.7 End-use water consumption frequency per income range
Water End-Uses High Income Mid-High
Income
Mid-Low
Income Low Income Average
Lavatory Faucet 3.8 min/p/d 3.1 min/p/d 2.0 min/p/d 2.6 min/p/d 2.9min/p/d
Shower Head 6.7 min/p/d 9.2 min/p/d 6.3 min/p/d 7.0 min/p/d 7.3 min/p/d
Bidet / Hand Douche 0.6 min/p/d 0.5 min/p/d 0.9 min/p/d 0.1 min/p/d 0.5 min/p/d
Toilet 5 f/p/d 4 f/p/d 3 f/p/d 2 f/p/d 4 f/p/d
Kitchen Faucet 5.8 min/p/d 5.1 min/p/d 5.4 min/p/d 4.7 min/p/d 5.2 min/p/d
Water Filter 1.3 min/p/d 1.2 min/p/d 0.8 min/p/d 0.9 min/p/d 1.1 min/p/d
Dishwasher 0.5 load/p/d --- --- --- --
Laundry Sink Faucet 3.2 min/p/d 2.9 min/p/d 2.2 min/p/d 1.9 min/p/d 2.6 min/p/d
Washing Machine 0.2 load/p/d 0.3 load/p/d 0.2 load/p/d 0.1 load/p/d 0.2load/p/d
External Tap 0.1 min/m2/d 0.03 min/m
2/d 0.1 min/m
2/d 0.08 min/m
2/d 0.1 min
2/d
Swimming Pool Valve 0.7 min/m2/d --- --- --- --
min/p/d – minutes per person per day f/p/d – flush per person per day load/p/d – load per person per day
Results indicated that, in average, lavatory faucets were used on a frequency of 2.9
minutes per person per day (min/p/d), daily showers lasted 7.3 minutes per person,
bidets or hand douches were used for only 0.5 min/p/d, toilets were flushed 3.5 times a
day per resident, the kitchen faucet was used for 5.2 min/p/d, the water filter was used
for 1.1 min/p/d for drinking purposes, the laundry sink faucet was used 2.6 min/p/d, 0.2
loads of dirty clothes were washed per day, and the external tap used to wash floors or
irrigate gardens for 0.1 minutes per garden/yard area per day (min/m2/d).

Domestic Water Baseline Consumption
149
Although the average results of water end-use frequencies were similar to the average
values obtained from previous studies (see Chapter 2, Section 2.4.3), some differences
in the patterns of water end-use frequencies could be observed.
Interestingly, the average results of indoor faucet frequency were similar to those
studies carried out in developed countries, rather than from previous findings in Brazil
(Ghisi and Ferreira, 2007; Ghisi and Oliveira, 2007). Although frequencies of bathroom
faucet usage were within range of previous findings in Brazil, the duration of kitchen
faucet usage frequency was almost twice as high. Such differences might be explained
through the methodological approach used by previous studies for estimating water end-
uses, or even, by their limited number of samples collected.
Mid-low and low income dwellings presented lower rates of toilet usage per capita than
those from previous studies. This might be related to resident occupancy patterns inside
the home, which in turn, could be related to employment patterns and working hours.
Clearly, as the dwelling income level rose, so did the number of toilet flushes per capita.
Although both high and mid-high income dwellings contained dishwashers in their
homes, only high income dwellings used it, at an estimated frequency of 0.5 loads per
person per day (load/p/d), during water auditing. High income dwellings also presented
an average water consumption frequency of 0.7 minutes per swimming pool area per
day (min/m2/d) at the swimming pool valve for water top-up.
The fact that no water consumption in bath faucets and swimming pool shower heads
was registered in high income dwellings during water auditing does not mean that these
fixtures are not used by residents. Their sole existence in dwellings indicates that some
usage must occur. However, results do indicate that these fixtures are rarely used and
they do not affect domestic water consumption.
In general, high income dwellings presented the highest frequency rates of water end-
uses, whilst low income dwellings had the lowest end-use water consumption frequency
rates. One hypothesis is that dwelling income and occupant perception on the cost of
water can influence water consumption frequencies through behavioural attitudes.

Domestic Water Baseline Consumption
150
Although the results above provided some useful information regarding domestic water
consumption behaviour for the different income dwellings, through patterns of water
consumption frequency for the different end-uses, it fails to provide a better
understanding on how water is used and what types of equipments are involved.
5.5.2 Water-consuming activities
An in-depth analysis of water-consuming activities inside 117 dwellings was carried out
in order to provide some understanding on the behavioural patterns of domestic water
usage for the different income dwellings. Key elements of water usage such as dish
washing, clothes washing, vehicle washing, floor washing, garden irrigation, water
reuse and water-saving attitudes were measured in order to point out behavioural trends
of water consumption according to dwelling income range and built type.
5.5.2.1 Dish washing
Residents were asked about their use of water for washing dishes. Overall, most
respondents washed their dishes at least twice a day (33.4%), 26.1% washed three times
a day, and some, more than three times a day (21.3%). The remaining 19.2% washed
their dishes less than twice a day. Mid-low income dwellings were more likely to wash
their dishes three times a day, while the other income groups usually washed their
dishes twice a day.
Most residents washed their dishes by hands, controlling the faucet (opening and
closing) while washing (83.5%). Some residents, however, washed their dishes with
running water at all times, with the faucet constantly opened (11.6%). No respondent
washed their dishes with a plugged sink, different from other findings, where a clear
majority of residents washed their dishes using a plugged sink (Randolph and Troy,
2008). Such behavioural differences in dish washing could be linked to cultural values,
custom and tradition.
A small number of respondents washed their dishes using a dishwasher (4.9%). Similar
findings were reported in Randolph and Troy (2008) indicating that those who have a
dishwasher, barely use them.
But for those residents which made use of dishwashers, few of them used economy
settings (14.5%), the great majority did not use economy settings (69.3%) and the

Domestic Water Baseline Consumption
151
remaining 16.3% did not have economy settings on their dishwashers. Low income
dwellings were less likely to use economy settings.
5.5.2.2 Clothes washing
Residents were asked about the use of water for washing clothes. High and mid-high
income dwellings washed their clothes more frequently than mid-low and low income
dwellings. With clothes washing frequencies reaching up to more than once a day, most
high income dwellings (27.3%) and mid-high income dwellings (28.1%) washed their
clothes in an average of three times a week. On the other hand, mid-low income
dwellings (35.0%) and low income dwellings (46.7%) were most likely to wash their
clothes only once a week.
The great majority of respondents (53.6%) washed part of their clothes by hands, the
remaining was machine-washed. While 25.3% of residents machine-washed their
clothes without pre-wash, 13.0% pre-washed their delicates and white clothes in the
washing machine. A few low-income dwellings washed their clothes by hands only
(11.1%), indicating that these families cannot afford a washing machine.
Findings suggest, however, that washing part of the clothes by hand or pre-washing
delicates is a common practice amongst Brazilian households. Once more, such
behavioural pattern might be linked to cultural values custom and tradition, since
previous findings in a developed country reported that almost all respondents only used
washing machines at home (Randolph and Troy, 2008).
Most respondents from high income dwellings (52.2%) and mid-high income dwellings
(34.8%) used economy settings to machine-wash their clothes, while most residents
from mid-low income dwellings (81.8%) and low income dwellings (50.0%), did not
use economy settings to machine-wash their clothes. In average, 9% of all respondents
did not have a washing machine or sink washer with economy settings.
5.5.2.3 Vehicle washing
Residents were asked if they washed their vehicles at home. Overall, the great majority
of residents did not wash their cars at home (51.2%). No mid-high income flat dwelling
resident washed their car at home, due to condominium rules, and therefore, residents
are not allowed to have access to external water taps on communal grounds for car
washing.

Domestic Water Baseline Consumption
152
Most of the 48.8% of respondents used a hand-held hose for vehicle-washing at home.
Some residents used an automatic shutoff nozzle at the end of the hose to control water
flow during vehicle-washing (46.5%), others did not (39.8%). A small percentage of
residents (13.7%) used water buckets to wash their vehicles. It was observed, however,
that almost no resident washed their vehicles during the one-week water auditing
period, indicating that this was not a frequent activity.
5.5.2.4 Floor washing
In Brazil, it is a common habit to clean external grounds of homes, such as verandas,
yards, pavements and any other external surrounding paved floor surface. House
dwelling residents and residential building block facilities managers were asked about
their water usage on floor washing.
Overall, high income house dwellings from Lago Norte and Lago Sul, wash the external
grounds of their homes once a week (54.2%), while mid-low income houses from
Taguatinga and Candangolândia, in average, wash their external grounds more than
once a week (65.2%) and low-income houses from Ceilândia and Samambaia wash
their external floors in an average once a week (47.4%).
Most house dwellings from Lago Norte and Lago Sul (30.4%) and mid-low income
dwellings from Taguatinga and Candangolândia (45.0%) used a hand-held hose
without a shutoff nozzle to clean their floors, while 55.6% of low income house
dwellings from Ceilândia and Samambaia used a bucket of water and mop to wash their
external grounds.
As for residential building blocks from Brasília and Águas Claras, communal floors
were washed, in an average, once a week (41.7%) using hand-held hoses with automatic
shutoff nozzles (37.1%).
5.5.2.5 Garden irrigation
House dwelling residents and residential building block facilities managers were asked
often lawns were irrigated during the dry season (April – September) and rainy season
(October – March) and the type of irrigation equipment was used.

Domestic Water Baseline Consumption
153
High income houses from Lago Norte and Lago Sul irrigated a small part of their lawn
(50.0%) more than once a week during the dry season (47.8%) using a hand-held hose
without a shutoff nozzle (47.1%). During the rainy season, the great majority of
residents did not irrigate their lawns (82.6%).
While 32.4 % of mid-high income residential building blocks from Brasília and Águas
Claras did not irrigate their communal gardens all year round, 38.2% irrigated their
lawns using a manual sprinkler system (52.2%). During the rainy season, 90.9% of the
communal gardens were rain-fed only.
While most mid-low income houses from Taguatinga and Candangolândia irrigated
their lawns during the dry season, one third of respondents did not use water to irrigate
their lawns all year round. In average, 33.3% of respondents watered their entire lawn
once a day during the dry season using a hand-held hose without a shutoff nozzle
(60.0%). During rainy season, most residents did not use water to irrigate their lawns
(62.5%).
Most low income house residents from Ceilândia and Samambaia irrigated their entire
lawn (75.0%), once a week during the dry season (46.2%), using a hand-held hose with
an automatic shutoff nozzle (41.7%). During the rainy season, 69.2% of respondents did
not water their lawns.
5.5.2.6 Water reuse
Residents were asked if they reused rainwater, greywater or wastewater in their homes.
From the analysed dwellings, 29.4% made use of rainwater and 36.8% made use of
greywater in their homes. No dwelling made use of reclaimed wastewater.
Three out of four low income residents used rainwater (40.0%) or greywater (60.0%) in
their homes for washing external floors. One in four dwellings made use of both
rainwater and greywater. Most dwellings used simple and low-budget directly fed,
untreated rainwater or greywater reuse systems. Most dwellings which made use of
rainwater, collected runoff from their rooftops and stored it on a 200 – 300 litres barrel
placed under gutters or downpipes for reuse on external floor washing. In one case, a
dwelling used rainwater for drinking purposes, by placing the collected rainwater into
the dwelling’s water filter. Most dwellings which made use of greywater, stored laundry

Domestic Water Baseline Consumption
154
water from washing machines on 200 – 300 litres butts, and was usually used on the
same day for washing the external floors of the house. Residents used the first rinse of
the washing machine (which contains a considerable amount of soap) to scrub the
external floors, and the second rinse (with a cleaner water) to wash away the soap.
One in six mid-low income houses used rainwater (28.6%) or greywater (45.5%) mainly
for washing external floors by using the same low-budget directly fed untreated
rainwater and greywater systems described above. In some cases, rainwater and
greywater from the washing machine were used for pre-washing clothes.
One in eight high income house residents used rainwater (21.7%) or greywater (4.3%)
in their homes using simple directly fed systems. With little investment, some houses
used a simple pipework to transport untreated rainwater directly to swimming pools,
other houses stored rainwater inside water tanks for later use on gravity fed, sub-surface
irrigation of gardens. Using the same principal, one refurbished dwelling adapted its
plumbing in order to transport greywater from showers and bathroom faucets via
gravity to a sub-surface irrigation system.
No analysed residential building blocks from Brasília and Águas Claras made use of a
water reuse system.
Rainwater and greywater reuse were commonly used in low income house dwellings
(2.0 l/m2/d ) and mid-low income house dwellings (1.5 l/m2/d), however only one high
income dwelling reused water for irrigation and floor washing (1.3 l/m2/d), suggesting
that the lower the income, the higher the rate of water reuse. This suggests that due to
the cost of mains water, mid-low and low income households searched for alternative
sources of water to reduce water bills.
These results indicate that there was a direct relationship between mains water
consumption and water reuse, where, water reuse was inversely proportional to mains
water consumption. The lower the household income, the lower mains water
consumption was, however, the higher the usage of alternative water supply such as
rainwater and greywater reuse.

Domestic Water Baseline Consumption
155
5.6 Water-saving attitudes in the home
In order to understand behavioural aspects of water-saving attitudes in the home,
residents were asked if they have taken any actions in the past to reduce water
consumption, and what actions they would be willing to take in order to promote water
conservation.
Figure 5.20 shows that although most high (63.6%), mid-high (58.4%) and low income
(60.0%) respondents had taken some type of water-saving action to reduce water
consumption in the last years, the majority of mid-low income residents took no actions
to conserve water (57.1%).
Figure 5.20 In the last years, has your dwelling taken any actions to conserve water?
Most of those residents, who, in the last years took actions to conserve water, made
changes in their water use habits (Figure 5.21). Personal water use habits such as taking
shorter showers or controlling water faucets while brushing teeth, shaving and washing
(29.7%), clothes washing (20.8%), dish washing and floor washing (16.8%) were the
most common actions taken by respondents.
0.0%
10.0%
20.0%
30.0%
40.0%
50.0%
60.0%
70.0%
High Income Mid-High Income Mid-Low Income Low Income
Yes No

Domestic Water Baseline Consumption
156
Figure 5.21 Actions residents have taken in the last years to conserve water at home.
More than 20% of residents of high income dwellings changed their habits regarding the
use of water. Considerable number of mid-high income residents changed their habits of
personal and dish washing water uses. Around 20% o mid-low and low income
residents changed their habits of personal and clothes washing water uses.
Regarding to actions taken to conserve water, a reasonable number of high income
dwellings had made changes in their habits of garden irrigation (25.0%), while the other
income dwellings had not (Table 5.8). In the last years, some high income residents
have made investments in water efficient fixtures, fittings or appliances (12.5%) and in
rainwater harvesting systems (16.7%), while little or no investments in this area have
been made for the other income dwellings. A great number of mid-high (21.2%) and
mid-low (16.7%) income residents repaired leakage in their homes, whilst only few
high (8.3%) and low (5.0%) income residents repaired water leaks in their homes.
Clearly, Figure 5.22 shows that most respondents willing to make changes in order to
reduce their domestic water consumption, are most likely to invest in water efficient
fittings, fixtures and appliances (47.5%), rainwater (39.6%) and greywater (27.7%)
reuse systems, as well as promoting changes in the habits of floor washing (26.7%) in
their homes.
0.0% 5.0% 10.0% 15.0% 20.0% 25.0% 30.0% 35.0%
Change in habits of personal water use
Change in habits of clothes washing
Change in habits of dish washing
Change in habits of vehicle washing
Change in habits of floor washing
Change in habits of garden irrigation
Water efficient equipment/tecniques for …
Leak repair
Installation of water efficient FFA
Installation of RWH system
Installation of GWR system
Installation of WWR system

Domestic Water Baseline Consumption
157
Table 5.8 Actions taken in the last years to conserve water per income group
Water-saving attitudes HI MHI MLI LI
Change in habits of personal water use 29.2% 45.5% 16.7% 20.0%
Change in habits of clothes washing 16.7% 18.2% 20.8% 30.0%
Change in habits of dish washing 20.8% 33.3% 8.3% 5.0%
Change in habits of vehicle washing 20.8% 6.1% 8.3% 5.0%
Change in habits of floor washing 16.7% 15.2% 16.7% 20.0%
Change in habits of garden irrigation 25.0% --- 0.0% 5.0%
Water efficient equipment/techniques for irrigation 8.3% --- 4.2% 0.0%
Leak repair 8.3% 21.2% 16.7% 5.0%
Installation of water efficient FFA 12.5% 3.0% 0.0% 5.0%
Installation of RWH system 16.7% --- 0.0% 0.0%
Installation of GWR system 4.2% --- 0.0% 0.0%
Installation of WWR system 0.0% --- 0.0% 0.0%
FFA – Fittings, fixtures and appliances RWH – Rainwater harvesting GWR – Greywater recycling WWR – Wastewater reclamation
Figure 5.22 Actions residents are willing to take in order to conserve water at home
Most low income residents would rather change their water-consuming habits than
invest on water-saving equipments, while mid-low income residents are not only willing
to change their habits of water consumption, but also invest on water efficient fittings
fixtures and appliances and rainwater and greywater reuse systems. High income
residents, on the other hand, are not only willing to invest on rainwater and greywater
reuse systems, but also willing to change indirect water-using habits from gardeners or
housekeepers such as of clothes washing, floor washing and garden irrigation (Table
5.9).
15.8%
23.8%
24.8%
17.8%
26.7%
12.9%
17.8%
14.9%
47.5%
39.6%
27.7%
14.9%
0% 5% 10% 15% 20% 25% 30% 35% 40% 45% 50%
Change in habits of personal water use
Change in habits of clothes washing
Change in habits of dish washing
Change in habits of vehicle washing
Change in habits of floor washing
Change in habits of garden irrigation
Water efficient equipment/tecniques for …
Leak repair
Installation of water efficient FFA
Installation of RWH system
Installation of GWR system
Installation of WWR system

Domestic Water Baseline Consumption
158
Table 5.9 Actions residents are willing to take in order to reduce water consumption
Water-saving attitudes HI MHI MLI LI
Change in habits of personal water use 4.2% 6.1% 29.2% 30.0%
Change in habits of clothes washing 33.3% 21.2% 16.7% 25.0%
Change in habits of dish washing 25.0% 24.2% 29.2% 20.0%
Change in habits of vehicle washing 20.8% 9.1% 25.0% 20.0%
Change in habits of floor washing 33.3% 21.2% 29.2% 25.0%
Change in habits of garden irrigation 25.0% --- 16.7% 15.0%
Water efficient equipment/techniques for irrigation 37.5% --- 29.2% 10.0%
Leak repair 29.2% 3.0% 16.7% 15.0%
Installation of water efficient FFA 58.3% 69.7% 33.3% 15.0%
Installation of RWH system 54.2% 48.5% 37.5% 10.0%
Installation of GWR system 29.2% 42.4% 25.0% 5.0%
Installation of WWR system 12.5% 30.3% 8.3% 0.0%
Interestingly, the great majority of mid-high income residents are most likely to invest
in water efficient equipments and water reuse systems, than to change their water-
consuming habits. A considerable number of flat residents would be willing to invest on
a communal wastewater reuse system (30.3%) whilst most house residents would be
unwilling to install such equipment in their homes. This might be due to the fact that
residential building blocks contain facility managers which can provide daily
inspections and periodic maintenance to wastewater reuse systems in order to avoid
health risks to residents, house dwellings on the other hand, do not.
In short, our research shows that not only a reasonable number of residents had taken
actions to change some habits of water use, but also they are willing to change another
habits and to install water efficient fittings and rain water and grey water systems.
5.7 Statistical evidence of water consumption
The scarcity of water resources is a crucial problem in the Federal District. Households
account for a great proportion of total water supply, and residential water demand has
become an important concern of policymakers. Demand for water increases due to: (i)
increase in population, (ii) economic growth, and (iii) life-style. The determination of
the variables that affect domestic water demand is an essential element for policy
makers decision.
As reviewed in Chapter 4, based on the hypothesis that domestic water consumption is a
function of dwelling income, number of residents, and building typology, a multivariate
statistical analysis was performed in order to explore the relationship between a series

Domestic Water Baseline Consumption
159
of variables, evaluate their level of significance and model a domestic water function for
the Federal District.
So as to simplify the domestic water consumption models, only independent variables
with accessible data from secondary sources were selected. To evaluate the strength of
statistical correlation between the variables of indoor water consumption, outdoor water
consumption, number of residents, dwelling income, cost of water, built area and
garden/yard area, a matrix of simple correlations was carried out using Pearson
coefficient (the value of correlation does not depend on the specific units used).
The correlation coefficient is a measure of linear association between two variables and
it varies between 1 and 0. A correlation coefficient of 1 indicates that two variables are
perfectly related in a positive or negative linear sense. A correlation coefficient of 0
indicates that there is no linear relationship between the two variables. The correlations
serve as empirical indications of possible relationships between variables and measure
the degree of linear association between two variables.
Results shown in Table 5.10 indicates that indoor water consumption had a very strong
relationship with water tariff (0.90) and dwelling built area (0.63), a substantial
relationship with dwelling income (0.49) and a moderate relationship with the number
of residents (0.37). Outdoor water consumption on the other hand, presented a strong
relationship with garden/yard area (0.49) and a moderate relationship with dwelling
income (0.32). Dwelling income also had a substantial relationship with dwelling built
area (0.47) and garden/yard area (0.42). These correlation coefficients are significant at
the 1% or 5% level, that is, they are statistically significantly different from zero at 99%
or 95% level of significance.

Domestic Water Baseline Consumption
160
Table 5.10 Matrix of simple correlations
Domestic Water
Consumption (m
3/month)
No. of Residents
Dwelling Income
(R$/month)
Cost of Water (R$/month)
Built Area (m
2)
Garden / Yard Area (m
2)
Outdoor Water Consumption (m
3/month)
Garden Water Cost
(R$/month)
Domestic Water Consumption (m
3/month)
Pearson Correlation 1 .365**
.489**
.905**
.632**
.190* .095 .132
Sig. (2-tailed) .000 .000 .000 .000 .048 .380 .220
N 119 119 111 119 117 108 88 88
No. of Residents
Pearson Correlation .365**
1 .032 .315**
.099 -.083 -.170 -.109
Sig. (2-tailed) .000 .742 .000 .289 .393 .114 .313
N 119 119 111 119 117 108 88 88
Dwelling Income (R$/month)
Pearson Correlation .489**
.032 1 .408**
.474**
.423**
.323**
.275*
Sig. (2-tailed) .000 .742 .000 .000 .000 .003 .011
N 111 111 111 111 109 103 84 84
Cost of Water (R$/month)
Pearson Correlation .905**
.315**
.408**
1 .475**
.184 .068 .081
Sig. (2-tailed) .000 .000 .000 .000 .057 .528 .452
N 119 119 111 119 117 108 88 88
Built Area (m
2)
Pearson Correlation .632**
.099 .474**
.475**
1 .326**
-.074 -.006
Sig. (2-tailed) .000 .289 .000 .000 .001 .495 .959
N 117 117 109 117 117 108 88 88
Garden / Yard Area (m
2)
Pearson Correlation .190* -.083 .423
** .184 .326
** 1 .491
** .357
**
Sig. (2-tailed) .048 .393 .000 .057 .001 .000 .001
N 108 108 103 108 108 108 87 87
Outdoor Water Consumption (m
3/month)
Pearson Correlation .095 -.170 .323**
.068 -.074 .491**
1 .937**
Sig. (2-tailed) .380 .114 .003 .528 .495 .000 .000
N 88 88 84 88 88 87 88 88
Garden Water Cost (R$/month)
Pearson Correlation .132 -.109 .275* .081 -.006 .357
** .937
** 1
Sig. (2-tailed) .220 .313 .011 .452 .959 .001 .000
N 88 88 84 88 88 87 88 88
**Correlation is significant at the 0.01 level (2-tailed).
*Correlation is significant at the 0.05 level (2-tailed).

Domestic Water Baseline Consumption
161
However, correlation (association) does not prove causation. The correlation
coefficients cannot be interpreted as establishing cause-and-effect relationships.
Correlation is necessary but no sufficient for causation. In other words correlation
makes no assumption as to whether domestic water consumption variable is dependent
on the others, and is not concerned with the relationship between them.
Knowing that these variables are strongly associated with domestic water consumption,
a regression analysis was carried out in order to describe the level of dependence of
domestic water consumption from a series of independent variables. The most
commonly used form of regression is linear regression, and the most common type of
linear regression is called ordinary least squares regression.
Multiple regressions allowed the development of indoor and outdoor water consumption
models generating a prediction tool for domestic water consumption based on a set of
explanatory variables. So, the hypothesized relationship between water consumption
and number of residents, household income, cost of water, and built area may be written
as:
�� = zv + z2TV + zsn� + z{[ + z|lX + } (5.1)
Qd = Domestic Water Consumption �m3/month Nr = Number of Residents �person Id = Dwelling Income �R$/month Cw = Cost of Water �R$/month Ab = Built Area �m2 ε = Error in predicting the value of Q
The regression model in Equation 5.1 denotes the monthly indoor water consumption
for dwellings in Federal District as a function of number of residents, household income
(R$/month), cost of water (R$/month), and built area (m2). Due to the different units of
measurement between variables, the magnitudes of unstandardized coefficients were
difficult to assess. Standardized coefficients on the other hand, had a greater effect upon
the dependent variable of outdoor water consumption in the multiple regression
analysis. The magnitudes of Beta coefficients indicated which variables had the greatest
effect on the predicted value of indoor water consumption.

Domestic Water Baseline Consumption
162
In multiple linear regression, the size of the coefficient for each independent variable
gives the size of the effect that variable is having on your dependent variable, and the
sign on the coefficient (positive or negative) gives the direction of the effect. The
coefficient tells how much the dependent variable is expected to increase when that
independent variable increases by one, holding all the other independent variables
constant.
The estimated regression (Equation 5.2) for indoor water consumption displayed a
relatively strong variation in function of number of residents, dwelling income, cost of
water and built area, with R2 = 0.881 p< 0.001. This value shows that 88.1% of the
variance in indoor water consumption can be predicted from the number of residents,
dwelling income, cost of water and built area.
F ratio is a test for statistical significance of the regression equation as a whole, i.e.
whether the equation as a whole is statistically significant in explaining water
consumption. The F statistics test the overall significance of the regression
model. Specifically, it tests the null hypothesis that all of the regression coefficients are
equal to zero.
Since F=192 is significant, the regression equation helps us to understand the
relationship between the water consumption and the other variables. Predictions from
this model are reliable and statistically significant at p=0.001 and F=192.446, with a
degree of freedom corresponding to 116. This provides evidence of existence of a linear
relationship between water consumption and the explanatory variables.
��x�ttV = 3.82 + 0.11TV + 0.09n� + 0.71[ + 0.24lX �5.2 �2.40 �3.19 �2.16 �5.79 �17.30 R2 = 0.88; F = 192.5 QIndoor = Indoor Water Consumption �m3/month Nr = Number of Residents �person Id = Dwelling Income �R$/month Cw = Cost of Water �R$/month Ab = Built Area �m2 In parenthesis, the value of t-statistics
The t-statistics is used to test the hypothesis that the true value of the coefficient is non-
zero. T-statistics is a measure of the likelihood that the actual value of the parameter is

Domestic Water Baseline Consumption
163
not zero. The larger the absolute value of t, the less likely that the actual value of the
parameter could be zero. The t-statistics for the above independent variables and their
associated 2-tailed p-values indicated a reliability of p<0.033. The indoor water
consumption model indicates a constant value equivalent to 3.82, which suggests that
dwellings consume a minimum amount of 3.82 m3 of water per month, regardless of the
dwelling’s income, number of residents, cost of water and built area.
Our result shows, like other studies (Arbués et al., 2003; Barrett and Wallace, 2009;
Schleich and Hillenbrand, 2009) that household size is positively correlated with
domestic water consumption. Water demand is predicted to rise 0.11 m3/month for
every additional resident per dwelling. The estimated equation shows that dwelling
income has an influence over indoor water consumption, where, the higher the income,
the greater the consumption at 0.09 m3/month for every R$/month of income.
Also, our results indicate that the larger the dwelling, the higher the consumption at 0.24
m3/month per built area. Result similar to a series of studies that show that domestic
water consumption varies accordingly to residential buildings typology (Loh and
Coghlam, 2003; Russac et al., 1991; Zhang and Brown, 2005).
Although the cost of water was expected to be negatively related to domestic water
consumption, where, the higher the cost of water, the lower the consumption, the
estimated model indicates a positive relationship. This positive relationship is found in
numerous studies for other countries; they have shown that domestic water consumption
is price-inelastic (that is, an increase in the price of water does not reduces its
consumption) (Worthington and Hoffman, 2008).
Nauges and Whittinghton (2010) review what is known and what is missing from that
literature thus far that uses data from household surveys to estimate household water
demand functions in less developed countries. The findings from the literature on the
main determinants of water demand in these countries suggest that, despite
heterogeneity in places and time periods studied, authors agree on the inelasticity of
water demand in less developed countries.

Domestic Water Baseline Consumption
164
This positive relationship might also be due to a low water tariff structure, where the
cost of water does not affect indoor water consumption negatively. Arbués et al. (2003)
argues that water demand is inelastic to water price since there are no substitutes for
water and because there is a low level of consumer perception on rate structures. On the
other hand, expenditure in water represents a very small fraction of household income
(Kostas and Chrisostomos, 2006 and Martinez, 2002).
The number of water facilities may help to explain the differences in water consumption
behaviour. Houses tend to have greater area, more bathrooms, gardens, and swimming
pool when compared to flat dwellings. So, we decided focus on outdoor domestic
consumption taking into account the garden and floor areas.
In most studies, outdoor water use is exclusively allocated to irrigation and swimming
pool consumption (Mayer et al., 1999). However, as far as the literature goes, no study
has analysed the influence of patios and verandas towards outdoor water consumption.
In Brazil, it is a common practice to wash patio and veranda floors periodically and
therefore, these outdoor spaces should be taken into consideration during domestic
water consumption analysis. This indicates that domestic water consumption is not only
associated with the number of persons in a household, but also with other communal
uses (i.e. irrigation, cleaning, washing, swimming pool, etc.).
Equation 5.3 presents the regression for monthly outdoor water consumption. The result
shows a near perfect relationship with garden/yard area and cost of water, with R2 =
0.906(116), p<0.001, indicating that 90.6% of the variance in outdoor water
consumption can be predicted from garden/yard area and cost of water. Predictions from
this model are reliable and statistically significant with p=0.000 and F=405.933, with a
degree of freedom corresponding to 116.
�����ttV = 1.21 + 0.87[ + 0.18l�F (5.2) �2.58 �24.24 �5.02 R2 = 0.90 F = 405.9 QOutdoor = Outdoor Water Consumption �m3/month Cw= Cost of Water �R$/month Ag = Garden/Floor Area �m2 In parenthesis, the value of t-statistics

Domestic Water Baseline Consumption
165
The result indicates that the cost of water has a greater effect on the predicted value of
outdoor water consumption than garden/floor area. T-statistics and their associated 2-
tailed p-values indicated a reliability of p<0.012.
The outdoor water consumption model indicates a constant value of 1.21, which
suggests that dwellings consume a minimum amount of 1.21 m3 of water per month for
garden irrigation and/or floor washing, regardless of the cost of water and garden/yard
area. The model also shows that outdoor water consumption is predicted to rise 0.18
m3/month for every m2 of garden/floor area. Although the cost of water was expected to
be negatively related to outdoor water consumption, our equation indicates that the
relationship is positive. This might be due to the fact that water tariff is low, and the
cost of water does not affect outdoor water consumption negatively, since water demand
is inelastic to water consumption. Moreover, there is no substitute for water, a low level
of consumer’s perception on water rates structure and the water tariff represents small
fraction of household income.
In order to verify the income inelasticity of water consumption hypothesis, residents
were asked to share their opinion over water tariffs. Although the great majority of
residents believed that the tariff charged by the water facility company was expensive,
their water-consuming behaviour indicated otherwise, especially with high income
dwellings. Such results indicate that resident’s perceived belief over the cost of water
was insufficient to modify water consumption behaviour.
Water demand in relatively price-inelastic, therefore price is an ineffective tool for
controlling its consumption. In this case non-price strategies would be more effective
for regulating water consumption like education campaigns (brochures and handouts,
television and radio, public broadcasting) and financial incentives to install water
efficient fittings, grey water reuse and rain water harvesting systems. These non-price
strategies intend to change behaviour since water does not appear on day-to-day agenda,
unless there is a crisis. Moreover, not only water is cheap but also there is a behavioural
inertia and an inability to modify residents behaviour.

Domestic Water Baseline Consumption
166
5.8 Conclusion
This chapter explores the relationship between domestic water consumption and
residential dwelling typology, household income and occupant water use behaviour.
Findings suggest that dwelling characteristics affect not only domestic water
consumption, but also occupant behaviour.
Domestic water consumption was analysed at different levels, and overall, a direct
relationship between dwelling income and water consumption could be observed,
where, the higher the income, the higher the water consumption rate. High income
dwellings presented an average of 481 m3 per year, mid-high income flat dwellings an
average of 243 m3, mid-low income dwellings an average of 216 m3 and low income
dwellings an average of 180 m3 per year.
Average water consumption per person per day obtained from questionnaires presented
a mean of 196 litres per person per day. The consumption for the majority of dwellings
ranged from 101 to 200 litres per person per day. While high income dwellings
consumed above 300 litres per person per day, low income dwellings consumed an
average of 112 litres per person per day.
The quality and quantity of water fixtures and appliances were evaluated according to
water using facilities within a dwelling. It was observed that as household income rose,
so did the quality and quantity of water fixtures and appliances within dwellings.
Although each individual dwelling demonstrated unique patterns of indoor water
consumption, similar trends were observed between the varied income groups and built
types. The highest rates of water consumption per person per day comes from shower
heads (21%), washing machines and toilet flushes (17% each), and kitchen faucets
(16.6%).
Key elements of water usage such as dish washing, clothes washing, vehicle washing,
floor washing, garden irrigation, water reuse and water-saving attitudes was measured
in order to point out behavioural trends of water consumption according to dwelling
income range and built type.

Domestic Water Baseline Consumption
167
The correlation analysis carried out shows a strong relationship between indoor water
consumption and built area (0.63), dwelling income (0.49), and number of residents
(0.37). Estimated water consumption function have shown a strong relationship between
dwelling income and built area. The coefficient of cost of water presented a positive
relationship showing that water demand is inelastic to water price due to the fact that
water tariff is low, there is no substitute for water, and water tariff represents a small
fraction of household income.
In order to verify the inelasticity of water of water consumption to its price, residents
were asked about their perception of water tariff. Although they believe that tariff is
high, observed water-consumption behaviour indicated otherwise. It seems that
resident’s opinion over water cost is insufficient to modify their behaviour. Our research
shows that the great majority of residents are most likely to invest in water efficient
equipments and water reuse systems rather than change their water-consuming
behaviour.

Chapter 6 Evaluation of Domestic
Water Conservation Measures

Evaluation of Domestic Water Conservation Measures
169
6. Evaluation of Domestic Water Conservation Measures
6.1 Introduction
In the previous chapter, primary data of household income, dwelling typology and
occupant behaviour was analysed and findings discussed. Based on such primary data,
this chapter sets out to identify feasible water conservation measures in terms of their
applicability, adaptability, water savings and cost-benefits, based on representative
models for the different income ranges and residential typologies of the Federal District.
6.2 Public Opinion, Awareness and Acceptance
In order to evaluate the applicability of water conservation measures for the different
income groups, 481 questionnaires were directed to residents, in order to understand
public opinion, awareness and acceptance over water conservation measures for the
varied income ranges.
6.2.1 Mains Water Metering and Tariff
Although every house contained an individual mains water meter, only few flats
dwellings were individually metered (11.1%). From those residential buildings which
were not sub-metered, 61.8% has plans to achieve sub-metering through plumbing
adaptation and building refurbishment. The great majority (90.4%) of residents were in
favour of installing individual mains meters in their flats.
Most of the residential flat buildings of Brasília and Águas Claras contained only one
mains water meter (88.9%), but one out of nine residential flat buildings had two mains
water meter; one shared between every flat dwelling, and the other for external use on
communal grounds. Due to the fact that external uses such as irrigation and floor
washing do not produce sewage to be collected and treated, water tariffs for external
uses were cheaper than for internal uses. However, few residential flat buildings
installed an extra water meter to measure external uses only in order to reduce water
cost.
In the Federal District, domestic water consumption is charged according to levels of
consumption, where, the higher the consumption range, the higher the water tariff per

Evaluation of Domestic Water Conservation Measures
170
m3 (Table 6.1). If a dwelling’s consumption is below 10m3/month, there is a minimum
monthly charge of R$14.30 (£4.08) for mains water supply maintenance and
administration, equivalent to 10m3 of mains water consumption. The facility company
also charges an extra tariff for sewage collection and treatment, with the same value of
water supply, doubling the cost of the water bill, arguing that the same volume of water
that comes in comes out as swage.
Table 6.1 Domestic water tariffs per consumption ranges
Consumption
Range (m3)
Range Volume (m
3)
Water Tariff Cost per Range Cumulative Cost
(R$/m3) (£/m
3) (R$) (£) (R$) (£)
0 to 10 10 1.45 0.41 14.30 4.09 14.30 4.09
11 to 15 5 2.66 0.76 13.30 3.80 27.60 7.89
16 to 25 10 3.39 0.97 33.90 9.69 61.50 17.58
26 to 35 10 5.47 1.56 54.70 15.63 117.20 33.21
36 to 50 15 6.04 1.73 90.60 25.89 206.80 59.10
More than 50 --- 6.61 1.89 --- --- --- ---
Source: Obtained from water consumption bills.
6.2.2 Monthly Water Bill
The questionnaires provided primary data over the average costs of monthly water bill.
Figure 6.1 shows that the higher the dwelling’s income, the higher the average monthly
water bill. Low income residents from Ceilândia and Samambaia paid, in average,
R$63.30 (£18.08) per month for their water consumption, while high income dwellings
from Lago Norte and Lago Sul paid, in average, R$213.72 (£61.06) per month.
Figure 6.1 Average dwelling monthly water bill per income group
R$ 213.72
R$ 105.05R$ 91.79
R$ 63.30
R$ 0.00
R$ 50.00
R$ 100.00
R$ 150.00
R$ 200.00
R$ 250.00
High Income Mid-High Income Mid-Low Income Low Income

Evaluation of Domestic Water Conservation Measures
171
Through the use of questionnaires, residents were asked to share their opinion over
water tariffs (Figure 6.2). Overall, the majority of high, mid-low and low income
residents believed that the tariff charged by the water facility company was expensive
(66.4%), while 29.5% agreed with the tariff charged, and only 4.1% thought that the
tariff being charged was cheap. Mid-high income, most of them flat residents, did not
share the same opinion. They believe that the water tariff charged by the facility
company is cheap (32.7%), while 20.2% think that it is expensive, and only 4.8% agree
with the tariff.
Figure 6.2 Resident’s opinion on the costs of mains water
Overall, the majority of high rise flat residents did not have access to the building’s
monthly water bills, and therefore, were unaware of how much water they consumed
and how much was being charged for their water.
The majority of mid-high, mid-low and low income residents believed that the
progressive tariff over consumption ranges encourage consumers to control their water
consumption; however, 54.1% of high-income residents believed that such strategy does
not work (Figure 6.3).
0.0%
10.0%
20.0%
30.0%
40.0%
50.0%
60.0%
70.0%
80.0%
High Income Mid-High Income Mid-Low Income Low Income
Expensive Fair Cheap Do not have acess to water bill

Evaluation of Domestic Water Conservation Measures
172
Figure 6.3 Incentive for water consumption reductions through progressive tariff
Apart from the progressive mains water tariff charges, residents were asked what they
thought about having an extra tariff charged for those dwellings whose water
consumption was way above average. Interestingly, although most respondents believed
water tariffs were high, the majority of the interviewed residents would agree to have an
extra tariff for high water usage as a way of promoting water conservation (Figure 6.4).
Figure 6.4 Resident’s opinion for charging an extra tariff for dwellings with
consumption above average
0.0%
10.0%
20.0%
30.0%
40.0%
50.0%
60.0%
70.0%
80.0%
High Income Mid-High Income Mid- Low Income Low Income
Yes No Don't Know
0.0%
10.0%
20.0%
30.0%
40.0%
50.0%
60.0%
70.0%
80.0%
90.0%
100.0%
High Income Mid-High Income Mid-Low Income Low Income
Yes No Don't Know

Evaluation of Domestic Water Conservation Measures
173
On the other hand, most respondents thought that it would be a good idea to have
financial incentives or bonuses for those dwellings whose water consumption was
below average (Figure 6.5). Residents whose water consumption was below
10m3/month, thought it was unfair to be charged the equivalent to 10m3 of mains water
consumption for their water bill. They believed that such charging does not incentive
residents to reduce their water consumption and to invest on water conservation
strategies.
Figure 6.5 Residents’ opinion for providing discounts for dwellings with consumption
below average.
Opinions were divided on the question whether an additional tariff destined towards
investments on water conservation practices and policies should be charged on water
bills. While most mid-high and low income dwellings agreed on an additional tariff
destined for water conservation improvements, high and mid-low income dwellings
disagreed (Figure 6.6).
Respondents, who disagreed to such additional cost over their water bills, believed that
the water tariff is already high enough for such investments to take place by the facility
company. From those who did agree with an additional water tariff to fund water
conservation practices and policies, 83.3% of respondents believed such additional cost
should not be more than 5% over their total monthly water bills.
0.0%
10.0%
20.0%
30.0%
40.0%
50.0%
60.0%
70.0%
80.0%
90.0%
100.0%
High Income Mid-High Income Mid-Low Income Low Income
Yes No Don't Know

Evaluation of Domestic Water Conservation Measures
174
Figure 6.6 Public opinion on additional water tariff destined towards investments on
water conservation practices and policies
6.2.3 Efficient Water Fittings, Fixtures and Appliances
Residents were asked if their dwelling contained at least one water efficient fitting,
fixture or appliance (Figure 6.7). Overall, few dwellings had water efficient fittings,
fixtures and appliances (19.1%). High income house dwellings had the highest number
of dwellings with water efficient equipment, while mid-high income flats contained the
lowest number of dwellings with water efficient equipment.
Figure 6.7 Water efficient fittings fixtures or appliances within dwellings
0.0%
10.0%
20.0%
30.0%
40.0%
50.0%
60.0%
70.0%
High Income Mid-High Income Mid-Low Income Low Income
Yes No Don't Know
0.0%
10.0%
20.0%
30.0%
40.0%
50.0%
60.0%
70.0%
80.0%
90.0%
High Income Mid-High Income Mid-Low Income Low Income
Yes No Don't Know

Evaluation of Domestic Water Conservation Measures
175
Residents were also asked if they were aware of the existence of water efficient fittings,
fixtures and appliances (Figure 6.8). Although most residents were aware of the
existence of such water efficient equipment, a considerable number demonstrated to be
unaware that such equipment was capable of promoting water savings (39.1%).
Figure 6.8 Public awareness of the existence of water efficient equipment
In order to understand public acceptance over the use of water efficient fittings, fixtures
and appliances residents were asked if they were willing to adapt their dwelling to
install water efficient equipment. Around 80% of them answered yes; only a small
percentage (14.7%) of residents did not agree to use such equipment (Figure 6.9). They
were afraid that might reduce the level of comfort due to their low water flow rate.
0.0%
10.0%
20.0%
30.0%
40.0%
50.0%
60.0%
70.0%
High Income Mid-High Income Mid-Low Income Low Income
Aware Unaware

Evaluation of Domestic Water Conservation Measures
176
Figure 6.9 Public acceptance over the use of water efficient equipment in the dwelling
In short, although the majority of the dwellings did not contain water efficient fittings,
fixtures and appliances (72.4%), most residents were aware that water efficient
equipments are capable of promoting water savings (61%) and would be willing to
install such low-flow devices within their homes (85.3%).
6.2.4 Water Reuse Systems
Public awareness over the existence of water reuse systems and the level of acceptance
towards the reuse of rainwater, greywater and wastewater within dwellings was
measured. Results indicated that residents were aware of water reuse systems, and that
they are capable of promoting water savings inside the home. The great majority of
home owners would be willing to make use of such systems in their dwellings. It was
observed that the reuse of rainwater had a higher rate of acceptance (96.4%) than
greywater (93.3%) and wastewater (78.5%). Detailed results for the different types of
reuse systems are discussed below.
6.2.4.1 Rainwater Harvesting Systems
Overall, almost every resident was aware that treated rainwater can be used for
irrigation, floor washing, vehicle washing, washing clothes and toilet flushing (Figure
6.10), only 6.8% of the interviewed population was unaware of such water reuse
system.
0.0%
10.0%
20.0%
30.0%
40.0%
50.0%
60.0%
70.0%
80.0%
90.0%
100.0%
High Income Mid-High Income Mid-Low Income Low Income
Yes No

Evaluation of Domestic Water Conservation Measures
177
Figure 6.10 Public awareness of domestic rainwater harvesting systems
The level of acceptance over the non-potable reuse of rainwater at home was high
(Figure 6.11). The majority of residents accepted the use of treated rainwater for non-
potable uses inside and outside their homes (88.1%), however, 8.3% of the interviewed
residents agreed to reuse rainwater only outside their homes to water plants, wash floors
and cars. Some people felt uncomfortable using rainwater for toilet flushing and
washing clothes, afraid that might cause plumbing malfunction and water supply issues
due to plumbing adaptations in their home.
Figure 6.11 Level of acceptance over the reuse of rainwater at home.
0.0%
10.0%
20.0%
30.0%
40.0%
50.0%
60.0%
70.0%
80.0%
90.0%
100.0%
High Income Mid-High Income Mid-Low Income Low Income
Aware Unaware
0.0%
10.0%
20.0%
30.0%
40.0%
50.0%
60.0%
70.0%
80.0%
90.0%
100.0%
High Income Mid-High Income Mid-Low Income Low Income
Yes Yes, partially No

Evaluation of Domestic Water Conservation Measures
178
6.2.4.2 Greywater Reuse Systems
Although most residents (87.8%) were aware that treated greywater can be used for
irrigation, external floor washing, vehicle washing, washing clothes and toilet flushing,
12.2% of the interviewed residents were unaware of the existence of greywater reuse
systems (Figure 6.12).
Figure 6.12 Public awareness of domestic greywater recycling systems
Although the level of acceptance for the reuse of greywater in a dwelling was not as
high as rainwater reuse, a considerable amount of residents would agree to use
greywater inside their homes (Figure 6.13). Most residents accepted the limited reuse of
greywater for non-potable purposes inside and outside their homes (84.1%), but 9.2% of
residents felt more comfortable by limiting its reuse for outdoor purposes such as floor
washing and garden irrigation only. Some people felt uncomfortable using greywater
for toilet flushing and washing clothes, afraid that might cause bad odors in the toilets
and clothes. Plumbing adaptation and eventual malfunction was also another concern,
due to sewage and water plumbing refurbishment.
0.0%
10.0%
20.0%
30.0%
40.0%
50.0%
60.0%
70.0%
80.0%
90.0%
100.0%
High Income Mid-High Income Mid-Low Income Low Income
Aware Unaware

Evaluation of Domestic Water Conservation Measures
179
Figure 6.13 Level of acceptance over the reuse of treated greywater at home
6.2.4.3 Wastewater Reuse Systems
Although the level of awareness over the existence of wastewater reuse systems were
not as high as those from rainwater and greywater, 67.5% of residents were aware that
properly treated and disinfected domestic wastewater can be used for irrigation, vehicle-
washing, external cleansing and flushing toilets (Figure 6.14).
Figure 6.14 Public awareness of domestic wastewater reuse systems
Although the level of acceptance for using properly treated and disinfected domestic
wastewater was not as high as rainwater and greywater reuse, 59.8% of the interviewed
0.0%
10.0%
20.0%
30.0%
40.0%
50.0%
60.0%
70.0%
80.0%
90.0%
100.0%
High Income Mid-High Income Mid-Low Income Low Income
Yes Yes, partially No
0.0%
10.0%
20.0%
30.0%
40.0%
50.0%
60.0%
70.0%
80.0%
90.0%
100.0%
High Income Mid-High Income Mid-Low Income Low Income
Aware Unaware

Evaluation of Domestic Water Conservation Measures
180
residents would agree to reuse wastewater in their homes for both internal and external
non-potable reuses, as long as the water quality of the treated wastewater reached
adequate levels for reuse (Figure 6.15). Not all residents agreed to use treated
wastewater inside their homes, 18.7% would only agree to reuse wastewater on sub-
surface irrigation to avoid any complications related towards water quality.
Figure 6.15 Level of acceptance over the reuse of treated wastewater at home
6.2.5 Dwelling Retrofit and Willingness-to-Pay
Through the use of questionnaires, residents were asked if they would be willing to
retrofit their homes in order to install water-saving features for both environmental and
financial benefits, at what cost, and payback period.
When asked if they would be willing to adapt their dwellings in order to install water-
saving equipments or reuse systems, in average, 74.4% of respondents would invest on
water-saving strategies in their homes, independent of their income range (Figure 6.16).
0.0%
10.0%
20.0%
30.0%
40.0%
50.0%
60.0%
70.0%
80.0%
High Income Mid-High Income Mid-Low Income Low Income
Yes Yes, partially No

Evaluation of Domestic Water Conservation Measures
181
Figure 6.16 Residents willing to adapt their home for water conservation
Those willing to retrofit their dwellings for water conservation, most were willing to
make a monthly investment ranging between R$11.00 and R$50.00 (£3.15 – £14.28).
Figure 6.17 shows that, while high income dwellings were willing to make higher
investments than the other income groups, low income dwellings preferred to limit their
investments only up to R$100.00 per month (£28.57).
Figure 6.17 Level of monthly investment for dwelling retrofit
When residents were asked for how long they would be willing to make such
investments, most responded that they would be willing to pay a fixed rate ranging from
0.0%
10.0%
20.0%
30.0%
40.0%
50.0%
60.0%
70.0%
80.0%
90.0%
High Income Mid-High Income Mid-Low Income Low Income
Willing Unwilling
0.0%
10.0%
20.0%
30.0%
40.0%
50.0%
60.0%
70.0%
Less than R$10
R$11 - R$50 R$51 -R$100
R$101 -R$250
R$251 -R$500
R$501 -R$1000
More than R$1000
High Income Mid-High Income Mid-Low Income Low Income

Evaluation of Domestic Water Conservation Measures
182
1 to 6 months (32.4%). In average, high income dwellings demonstrated to be willing to
invest on a fixed rate from 6 to 12 months (30.6%), and most mid-low income dwellings
would be willing to invest for only one month (32.0%), while the majority of mid-high
income dwellings (38.8%), and low income dwellings (45.8%) would rather pay a fixed
amount from 1 to 6 months (Figure 6.18).
Figure 6.18 Duration of monthly investment for dwelling retrofit
When asked for how long would they be willing to wait for the payback of their
investments on water conservation retrofit, and start receiving financial benefits over
water-saving strategies, most residents would expect a short-term payback period from
2 to 6 months only (29.7%). Most low income dwellings (40.5%) and mid-low income
dwellings (44.1%), expected a fast financial return for their investment for 1 month
only, while high income dwellings expected a payback period from 2 to 6 months
(32.9%). Mid-high income flat residents, on the other hand, would be willing to wait for
a financial return ranging from 1 to 2 years (31.8%) (Figure 6.19).
0.0%
5.0%
10.0%
15.0%
20.0%
25.0%
30.0%
35.0%
40.0%
45.0%
50.0%
1 month only 1 - 6 months 6 - 12 months 1 - 2 years 2 - 3 years More than 3 years
High Income Mid-High Income Mid-Low Income Low Income

Evaluation of Domestic Water Conservation Measures
183
Figure 6.19 Expected payback period of investments on dwelling retrofit
6.2.6 Water Conservation Principals
The quantitative questionnaires were also able to measure public concern towards the
future of Federal District’s water resources and importance to conserve water. A small
fraction of the interviewed population (4.6%) demonstrated not to be worried with the
future of water resources, however, 40.2% of the respondents were concerned, and most
were very concerned (55.2%) with the future of local water resources (Figure 6.20).
Figure 6.20 Level of concern over the future of water resources
0.0%
5.0%
10.0%
15.0%
20.0%
25.0%
30.0%
35.0%
40.0%
45.0%
50.0%
1 month only
2 - 6 months
6 - 12 months
1 - 2 years 2 - 3 years 3 - 5 years 5 - 10 years
More than 10 years
High Income Mid-High Income Mid-Low Income Low Income
0.0%
10.0%
20.0%
30.0%
40.0%
50.0%
60.0%
70.0%
High Income Mid-High Income Mid-Low Income Low Income
Not Concerned Concerned Very Concerned

Evaluation of Domestic Water Conservation Measures
184
Independent of the income range, almost every resident believed to be either important
(21.9%), or very important (77.8%) to conserve water on a daily basis in order to avoid
future water supply issues (Figure 6.21), however, an insignificant number of
respondents felt it was not important to save water on a regular basis (0.4%).
Figure 6.21 Level of importance to conserve water on a daily basis
6.3 Domestic Water Efficiency
The evaluation of water efficient strategies were based on four representative models,
one for each of the different socio-economic residential building typologies in study.
Composed of mean values of dwelling characteristics, baseline water end-use
consumption and public opinion, awareness and acceptance of water efficient strategies
collected from the questionnaire survey and water audits for each income building
typology, these models were used as a basis to evaluate building adaptation, identify
potential water savings and estimate the costs and benefits of water efficient strategies.
6.3.1 Building Adaptation
Overall, the existing water efficient equipments available in the Brazilian market are of
simple installation, rendering little or no refurbishment for their application. The
replacement of existing water faucets and shower heads require no refurbishment and
this can be easily done in a DIY basis. The installation of flow regulators also require no
0.0%
10.0%
20.0%
30.0%
40.0%
50.0%
60.0%
70.0%
80.0%
90.0%
High Income Mid-High Income Mid-Low Income Low Income
Not Important Important Very Important

Evaluation of Domestic Water Conservation Measures
185
refurbishment to the existing plumbing, such fittings can be easily installed without the
need of laboured workforce. Sensor faucets and low-flow toilets on the other hand,
might require laboured workforce and some refurbishment.
Sensor faucets are electrically operated, and consequently, require an electrical
connection or batteries for operation. Although battery operated sensor faucets are
easily adaptable because they require no refurbishment, periodic replacement of battery
is necessary. For residential purposes, electrically operated sensor faucets can be more
user-friendly; nevertheless, they must be connected to an electric outlet, thus, resulting
in the installation of an extra power socket.
Low flush toilet bowls are necessary for the proper functioning of dual flush toilets. As
previously seen, most dwellings presented a 9 litre flush bowl. Such toilet bowls were
designed to use 9 litres of water to activate the siphon effect for solid waste removal,
thus, the installation of dual flush valves in 9 litre toilet bowls would render in their
malfunction. Although the replacement of low flow toilets is relatively simple, this is
usually carried out by skilled labour.
In order to install individual water meters in flat dwellings, a high level of
refurbishment would be necessary. In Brazilian multi-storey buildings, mains water is
commonly supplied indirectly via a header water tank. Vertical individual distributing
pipes are used to feed determined bathrooms, kitchens and utility areas for every floor
level of the multi-storey building. In order to adapt existing buildings for individual
water metering, the existing distribution pipework would have to be disconnected and a
new distribution pipework remodelled in order to fix a water meter per flat dwelling.
Traditionally, Brazilian plumbing installations of every pipework is fitted inside brick
walls, therefore, such building adaptation would render in high costs associated with
labour, materials and redecoration. Such building retrofit was considered onerous, and
extremely inconvenient to residents, therefore it was not considered for analysis.
6.3.2 Domestic Water Reductions
Domestic water reductions for a series of water efficient strategies such as leakage
repair and commercially available water efficient fittings, fixtures and appliances, such
as flow regulators for bathroom, kitchen and utility faucets, automatic bathroom faucet,

Evaluation of Domestic Water Conservation Measures
186
bathroom sensor faucet, kitchen sensor faucet, low-flow shower head, low-flush toilet,
dual-flush toilet, high-efficiency washing machine, automatic shut-off hose nozzle,
pressure washer and automatic irrigation system, were calculated for the high (Table
6.2), mid-high (Table 6.3), mid-low (Table 6.4) and low (Table 6.5) income dwellings.
As previously seen in Chapter 4, their water savings were determined according to their
potential water reductions (Equation 4.7), using a water reduction index to compare
results (Equation 4.13).
Overall, high-efficiency washing machines proved to be the most effective water
efficient strategy, with an average rate of potable water savings equivalent to 58 m3 per
dwelling per year (m3/dw/yr). In other words, high-efficiency washing machines
promoted a reduction of 21.4% on total domestic water baseline consumption. Results
indicated that the least effective water efficient strategy was the automatic shut-off
nozzle, promoting potable water savings equivalent to an average 3.5 m3 per dwelling
per year, representing only 0.7% reduction over the annual domestic water baseline
consumption.
Figure 6.22 Domestic water reductions per water efficient strategies for high income
dwellings
Figure 6.22 shows that in one hand, the most effective water efficient strategies for high
income houses was the pressure washer with 10.4% water reductions (68 m3/dw/yr),
followed by repair of water leakage, representing a 7.4% reduction over baseline
consumption (39 m3/dw/yr ), and dual flush toilets with 6.9% reductions (17 m3/dw/yr).
10.4
7.4
6.9
4.4
3.9
3.8
3.5
3.2
2.9
2.0
1.7
1.2
1.1
1.0
0 2 4 6 8 10 12
Pressure Washer
Leakage Repair
Dual Flush Toilet
High-Efficiency Washing Machine
Low-Flush Toilet
Kitchen Sensor Faucet
Bathroom Sensor Faucets
Bathroom Faucet Flow Regulator Aerator
Kitchen Faucet Flow Regulator Aerator
Automatic Irrigation Sprinkler System
Low Flow Shower Head
Automatic Shut-off Hose Nozzle
Utility Faucet Flow Regulator
Automatic Bathrom Faucet
Water Reduction Index (%)

Evaluation of Domestic Water Conservation Measures
187
On the other hand, ineffective water efficient strategies for high income house dwellings
in the Federal District included the automatic bathroom faucet with a low average of
1.0% (5.4 m3/dw/yr), utility faucet flow regulator, representing a 1.1% reduction in
baseline consumption (5.6 m3/dw/yr), and the automatic shut-off hose nozzle, with a
low 1.2% reductions in domestic water consumption (8 m3/dw/yr).
Figure 6.23 Domestic water reductions per water efficient strategies for mid-high
income dwellings
The highest rates of domestic water reductions for mid-high income flat dwellings
included the high-efficiency washing machine, with an estimated 11.7% reduction in
water consumption (29 m3/dw/yr), use of dual flush toilets, with 9.0 % reductions (22
m3/dw/yr), and bathroom faucet flow regulators, with 6.9% reductions (17 m3/dw/yr).
Figure 6.23 shows us that the lowest rates of domestic water reductions for mid-high
income dwellings included the automatic irrigation system, with only 0.1% reduction in
domestic water consumption (0.3 m3/dw/yr), pressure washer, having an estimated 0.7%
reduction in baseline consumption (1.7 m3/dw/yr), and utility faucet flow regulator,
representing a mean 1.8% reduction (4.4 m3/dw/yr). Since most mid-high income
residential building typologies already make use of the automatic shut-off hose nozzles
(see Chapter 5), such strategy was not included in the analysis.
In mid-low income house dwellings, considerable water savings were obtained from the
use of high-efficiency washing machines, with an estimated 36.5% reduction in water
11.7
9.0
6.9
6.6
6.1
5.2
5.0
4.1
1.9
1.8
0.7
0.1
0.0 2.0 4.0 6.0 8.0 10.0 12.0 14.0
High-Efficiency Washing Machine
Dual Flush Toilet
Bathroom Faucet Flow Regulator Aerator
Bathroom Sensor Faucets
Kitchen Sensor Faucet
Low-Flush Toilet
Low Flow Shower Head
Kitchen Faucet Flow Regulator Aerator
Automatic Bathrom Faucet
Utility Faucet Flow Regulator
Pressure Washer
Automatic Irrigation Sprinkler System
Water Reduction Index (%)

Evaluation of Domestic Water Conservation Measures
188
consumption (103 m3/dw/yr), followed by dual flush toilets, representing a 9.7%
reduction in baseline water consumption (27 m3/dw/yr) and kitchen sensor faucets, with
7.5% reductions (21 m3/dw/yr). The least effective water efficient strategies for mid-low
income dwellings was water leakage repair, with a low 0.3% reduction in baseline
consumption (0.9 m3/dw/yr) and automatic bathroom faucet, having an estimated 1.3%
reduction in water consumption (3.7 m3/dw/yr) (Figure 6.24).
Figure 6.24 Domestic water reductions per water efficient strategies for mid-low
income dwellings
Figure 6.25 clearly illustrates that effective water efficient strategies for low income
house dwellings included the use of high-efficiency washing machine, with 33.1%
water reductions (77 m3/dw/yr), dual flush toilets, with an estimated 7.8% reduction on
baseline consumption (18 m3/dw/yr), followed by bathroom sensor faucets with 7.1%
reductions (15 m3/dw/yr). The lowest rates of domestic water reductions for low income
house dwellings were the automatic shut-off hose nozzle, representing a low 0.5% in
domestic water reductions (1.2 m3/dw/yr), automatic bathroom faucet, with an average
2.0% water reduction (4.7 m3/dw/yr) and pressure washer, with an estimated 2.2%
reduction in baseline consumption (5.1 m3/dw/yr). Due to the fact that the average
measured flow rates for the existing shower heads and utility faucets in low income
dwellings presented a lower flow rate than that of manufacturer’s reduced flow rate
specifications for low flow shower heads and utility faucet flow regulators, these proved
to be ineffective strategies.
36.5
9.7
7.5
6.3
5.7
4.6
4.3
2.9
2.6
1.3
0.6
0.5
0.3
0 5 10 15 20 25 30 35 40
High-Efficiency Washing Machine
Dual Flush Toilet
Kitchen Sensor Faucet
Kitchen Faucet Flow Regulator Aerator
Low-Flush Toilet
Bathroom Sensor Faucets
Bathroom Faucet Flow Regulator Aerator
Low Flow Shower Head
Pressure Washer
Automatic Bathrom Faucet
Utility Faucet Flow Regulator
Automatic Shut-off Hose Nozzle
Leakage Repair
Water Reduction Index (%)

Evaluation of Domestic Water Conservation Measures
189
Figure 6.25 Domestic water reductions per water efficient strategies for low income
dwellings
It should be noted that there were some limitations when comparing potential water
reductions of faucet flow regulators with automatic and sensor faucets. Firstly, the
methodology developed to identify potential reductions from water efficient flow
regulators was calculated by dividing the average measured fixture flow rate with the
efficient fixture flow rate gathered from manufacturer’s specifications. Secondly,
potential reductions for automatic and sensor faucets were obtained from secondary
sources based in previous studies. In other words, while potential reductions for faucet
flow regulators varied according to baseline flow rates, potential reductions for
automatic and sensor faucets remained stationary.
Although bathroom sensor faucets provided the highest rates in water reduction for
high, mid-low and low income dwellings, results indicated that the use of bathroom
faucet flow regulators in mid-high income dwellings were more effective than sensor
faucets. Estimated potential reductions for bathroom faucet flow regulators were
equivalent to 73%, when compared to the 70% potential reductions from sensor faucets.
In order to explore the upper limit of domestic water reductions that could be obtained
through the use of water efficient strategies for high, mid-high, mid-low and low
income dwellings in the Federal District, the study selected the most effective strategies
33.1
7.8
7.1
7.0
6.7
6.4
5.0
4.1
2.2
2.0
0.5
0 5 10 15 20 25 30 35
High-Efficiency Washing Machine
Dual Flush Toilet
Bathroom Sensor Faucets
Kitchen Sensor Faucet
Kitchen Faucet Flow Regulator Aerator
Bathroom Faucet Flow Regulator Aerator
Low-Flush Toilet
Leakage Repair
Pressure Washer
Automatic Bathrom Faucet
Automatic Shut-off Hose Nozzle
Water Reduction Index (%)

Evaluation of Domestic Water Conservation Measures
190
capable of obtaining the highest level of efficiency in domestic water end-use
consumption (Table 6.6).

Evaluation of Domestic Water Conservation Measures
191
Table 6.2 Potential water reductions per water efficient product for high income dwellings
Water Efficient Strategy Quantity Flow Rate Frequency Potential
Reduction (%)
Baseline
Consumption (m
3/dw/yr)
Reduced
Consumption (m
3/dw/yr)
Water Savings (m
3/dw/yr)
Water
Reduction
Index (%)
Bathroom Faucet Flow Regulator Aerator 6 1.8 l/min 3.8 min/p/d 63 * 27 10 17 3.2 Automatic Bathroom Faucet 6 4.8 l /min 3.1 min/p/d 20 ** 27 22 5 1.0 Bathroom Sensor Faucets (6w) 5 4.8 l/min 1.2 min/p/d 70 * 27 8 19 3.5 Low Flow Shower Head 5 4.5 l/min 6.7 min/p/d 17 * 53 44 9 1.7 Low-Flush Toilet 6 6 l/f 5 f/p/d 33 * 62 41 21 3.9 Dual Flush Toilet 6 3/6 l/f 5 f/p/d 60 * 62 25 37 6.9 Kitchen Sensor Faucet (6w) 2 5.8 l/min 3.5 min/p/d 40 * 51 31 20 3.8 Kitchen Faucet Flow Regulator Aerator 2 1.8 l/min 5.8 min/p/d 30 * 51 36 15 2.9 Utility Faucet Flow Regulator 2 6 l/min 3.2 min/p/d 17 * 34 28 6 1.1 High-Efficiency Washing Machine 1 76 l/load 0.2 load/p/d 46 * 205 27 23 4.4 Automatic Shut-off Hose Nozzle 3 16.8 l/min 15.9 min/dw/d 8 *** 106 80 6 1.2 Pressure Washer (1500w) 1 6 l/min 6.1 min/dw/d 64 * 106 31 55 10.4 Automatic Irrigation Sprinkler System (9V) 1 16.8 l/min 15.1 min/dw/d 12.5 *** 106 75 11 2.0 Leakage Repair --- --- --- 100 39 0 39 7.4
* Based on manufacturer’s specifications ** SABESP (1996) ***Vickers (2001)

Evaluation of Domestic Water Conservation Measures
192
Table 6.3 Potential water reductions per water efficient product for mid-high income dwellings
Water Efficient Strategy Quantity Flow Rate Frequency Potential
Reduction (%)
Baseline
Consumption (m
3/dw/yr)
Reduced
Consumption (m
3/dw/yr)
Water Savings (m
3/dw/yr)
Water
Reduction
Index (%)
Bathroom Faucet Flow Regulator Aerator 3 1.8 l/min 3.1 min/p/d 73 * 23 6 17 6.9 Automatic Bathroom Faucet 3 6.7 l /min 2.5 min/p/d 20 ** 23 18 5 1.9 Bathroom Sensor Faucets (6w) 2 6.7 l/min 0.9 min/p/d 70 * 23 7 16 6.6 Low Flow Shower Head 2 4.5 l/min 5.7 min/p/d 21 * 58 45 12 5.0 Low-Flush Toilet 3 6 l/f 4 f/p/d 33 * 38 25 13 5.2 Dual Flush Toilet 3 3/6 l/f 4 f/p/d 58 * 38 16 22 9.0 Kitchen Sensor Faucet (6w) 2 5.8 l/min 2.7 min/p/d 40 * 38 23 15 6.1 Kitchen Faucet Flow Regulator Aerator 2 1.8 l/min 4.6 min/p/d 27 * 38 28 10 4.1 Utility Faucet Flow Regulator 2 6 l/min 2.7 min/p/d 19 * 24 19 4 1.8 High-Efficiency Washing Machine 1 76 l/load 0.2 load/p/d 54 * 53 25 29 11.7 Pressure Washer (1500w) 1 6 l/min 6.1 min/dw/d 64 * 3 1 1.7 0.7 Automatic Irrigation Sprinkler System (9V) 1 16.8 l/min 15.1 min/dw/d 12.5 *** 3 2.3 0.33 0.1
* Based on manufacturer’s specifications ** SABESP (1996) ***Vickers (2001)

Evaluation of Domestic Water Conservation Measures
193
Table 6.4 Potential water reductions per water efficient product for mid-low income dwellings
Water Efficient Strategy Quantity Flow Rate Frequency Potential
Reduction (%)
Baseline
Consumption (m
3/dw/yr)
Reduced
Consumption (m
3/dw/yr)
Water Savings (m
3/dw/yr)
Water
Reduction
Index (%)
Bathroom Faucet Flow Regulator Aerator 3 1.8 l/min 2.2 min/p/d 63 * 19 7 12 4.3 Automatic Bathroom Faucet 3 5.1 l /min 1.8 min/p/d 20 ** 19 15 4 1.3 Bathroom Sensor Faucets (6w) 3 5.1 l/min 0.7 min/p/d 70 * 19 6 13 4.6 Low Flow Shower Head 2 4.5 l/min 7.0 min/p/d 17 * 60 52 8 2.9 Low-Flush Toilet 3 6 l/f 3 f/p/d 33 * 49 32 16 5.7 Dual Flush Toilet 3 3/6 l/f 3 f/p/d 60 * 49 21 27 9.7 Kitchen Sensor Faucet (6w) 1 5.4 l/min 3.6 min/p/d 40 * 53 32 21 7.5 Kitchen Faucet Flow Regulator Aerator 1 1.8 l/min 6.0 min/p/d 30 * 53 35 18 6.3 Utility Faucet Flow Regulator 2 6 l/min 2.4 min/p/d 17 * 25 24 2 0.6 High-Efficiency Washing Machine 1 76 l/load 0.2 load/p/d 46 * 201 99 103 36.5 Automatic Shut-off Hose Nozzle 1 9.6 l/min 5.1 min/dw/d 8 *** 19 18 1 0.5 Pressure Washer (1500w) 1 6 l/min 3.4 min/dw/d 64 * 19 12 7 2.6 Leakage Repair --- --- --- 100 1 0 1 0.3
* Based on manufacturer’s specifications ** SABESP (1996) ***Vickers (2001)

Evaluation of Domestic Water Conservation Measures
194
Table 6.5 Potential water reductions per water efficient product for low income dwellings
Water Efficient Strategy Quantity Flow Rate Frequency Potential
Reduction (%)
Baseline
Consumption (m
3/dw/yr)
Reduced
Consumption (m
3/dw/yr)
Water Savings (m
3/dw/yr)
Water
Reduction
Index (%)
Bathroom Faucet Flow Regulator Aerator 2 1.8 l/min 2.9 min/p/d 63 * 24 9 15 6.4 Automatic Bathroom Faucet 2 4.9 l /min 2.3 min/p/d 20 ** 24 19 5 2.0 Bathroom Sensor Faucets (6w) 2 4.9 l/min 0.9 min/p/d 70 * 24 7 17 7.1 Low Flow Shower Head 2 4.5 l/min 7.8 min/p/d 17 * 51 51 0 0 Low-Flush Toilet 2 6 l/f 2 f/p/d 33 * 34 23 11 5.0 Dual Flush Toilet 2 3/6 l/f 2 f/p/d 60 * 34 16 18 7.8
Kitchen Sensor Faucet (6w) 1 4.7 l/min 3.2 min/p/d 40 * 41 24 16 7.0
Kitchen Faucet Flow Regulator Aerator 1 1.8 l/min 5.3 min/p/d 30 * 41 25 16 6.7 Utility Faucet Flow Regulator 2 6 l/min 2.1 min/p/d 17 * 19 19 0 0 High-Efficiency Washing Machine 1 76 l/load 0.1 load/p/d 46 * 143 66 77 33.1 Automatic Shut-off Hose Nozzle 1 8.9 l/min 4.5 min/dw/d 8 *** 16 15 1 0.5 Pressure Washer (1500w) 1 6 l/min 3.3 min/dw/d 64 * 16 11 5 2.2 Leakage Repair --- --- --- 100 9 0 9 4.1
* Based on manufacturer’s specifications ** SABESP (1996) ***Vickers (2001)

Evaluation of Domestic Water Conservation Measures
195
Table 6.6 Baseline water end-uses, and reduced water end-uses through water efficient
strategies applied to the different income dwellings
Baseline Water End-Uses Reduced Water End-Uses
High Income Dwelling
Bathroom Faucet 18 l/p/d Bathroom Sensor Faucets 6 l/p/d Shower Head 36 l/p/d Low Flow Shower Head 30 l/p/d Bidet / Hand Douche 3 l/p/d Bidet / Hand Douche 3 l/p/d Toilet Flush 42 l/p/d Dual Flush Toilet 17 l/p/d Kitchen Faucet 35 l/p/d Kitchen Sensor Faucet 21 l/p/d Water Filter 3 l/p/d Water Filter 3 l/p/d Dishwasher 5 l/p/d Dishwasher 5 l/p/d Utility Faucet 23 l/p/d Utility Faucet with Flow Regulator 19 l/p/d Washing Machine 34 l/p/d High-Efficiency Washing Machine 19 l/p/d Leaks and Losses 27 l/p/d Leakage Repair 0 l/p/d External Tap 2.2 l/m
2/d Pressure Washer and Automatic Irrigation 0.5 l/m
2/d
Swimming Pool Valve 12 l/m2/d Swimming Pool Valve 12 l/m
2/d
Mid-High Income Dwelling
Bathroom Faucet 21 l/p/d Bathroom Faucet with Flow Regulator 6 l/p/d Shower Head 53 l/p/d Low Flow Shower Head 42 l/p/d Bidet / Hand Douche 3 l/p/d Bidet / Hand Douche 3 l/p/d Toilet Flush 35 l/p/d Dual Flush Toilet 15 l/p/d Kitchen Faucet 34 l/p/d Kitchen Sensor Faucet 21 l/p/d Water Filter 3 l/p/d Water Filter 3 l/p/d Dishwasher 1 l/p/d Dishwasher 1 l/p/d Utility Faucet 22 l/p/d Utility Faucet with Flow Regulator 18 l/p/d Washing Machine 49 l/p/d High-Efficiency Washing Machine 22 l/p/d External Tap 0.5 l/m
2/d Pressure Washer and Automatic Irrigation 0.1 l/m
2/d
Mid-Low Income Dwelling
Bathroom Faucet 10 l/p/d Bathroom Sensor Faucets 3 l/p/d Shower Head 33 l/p/d Low Flow Shower Head 26 l/p/d Bidet / Hand Douche 4 l/p/d Bidet / Hand Douche 4 l/p/d Toilet Flush 27 l/p/d Dual Flush Toilet 11 l/p/d Kitchen Faucet 29 l/p/d Kitchen Sensor Faucet 16 l/p/d Water Filter 2 l/p/d Water Filter 2 l/p/d Utility Faucet 14 l/p/d Utility Faucet with Flow Regulator 12 l/p/d Washing Machine 25 l/p/d High-Efficiency Washing Machine 11 l/p/d Leaks and Losses 0.5 l/p/d Leakage Repair 0 l/p/d External Tap 0.7 l/m
2/d Pressure Washer 0.4 l/m
2/d
Low Income Dwelling
Bathroom Faucet 13 l/p/d Bathroom Sensor Faucets 3 l/p/d Shower Head 28 l/p/d Low Flow Shower Head 25 l/p/d Bidet / Hand Douche 1 l/p/d Bidet / Hand Douche 1 l/p/d Toilet Flush 19 l/p/d Dual Flush Toilet 8 l/p/d Kitchen Faucet 22 l/p/d Kitchen Sensor Faucet 12 l/p/d Water Filter 2 l/p/d Water Filter 2 l/p/d Utility Faucet 10 l/p/d Utility Faucet with Flow Regulator 9 l/p/d Washing Machine 17 l/p/d High-Efficiency Washing Machine 7 l/p/d Leaks and Losses 5 l/p/d Leakage Repair 0 l/p/d External Tap 0.7 l/m
2/d Pressure Washer 0.5 l/m
2/d

Evaluation of Domestic Water Conservation Measures
196
6.3.3 Cost-Benefit Analyses
An economic assessment for the different water efficient strategies was carried out
using: (i) simple payback period; (ii) life cycle cost-benefit analysis and; (iii) average
incremental cost for the high, mid-high, mid-low and low income dwellings (see Tables
6.7, 6.8, 6.9 and 6.10 for a summary of the results).
In order to determine the capital costs of water efficient strategies for each of the
income building typologies, the average number of fixtures and appliances from the
representative model was multiplied by the equipment’s unit cost. This was based on
the assumption that resident’s who are willing to invest in water efficient strategies,
would retrofit the entire dwelling with a set of water-saving equipment. For example, in
order to obtain maximum water efficiency by using low flow toilets in a home, every
toilet in the dwelling would have to be changed.
Although some water efficient strategies included labour costs for their installation,
most were considered easy to install on a DIY basis. In order to work, three out of
thirteen water efficient strategies, required electric installation and consequently, annual
operational costs of energy consumption were estimated according to their individual
consumption frequency. During water auditing, the great majority of the analysed
dwellings presented visible leaks in tap-opening fixtures, therefore, an average capital
costs for leakage repair was estimated according to labour and material costs. The
estimate for the automatic irrigation system on the other hand, was based on the
irrigable garden area from high income dwellings (Appendix I).
Considering the fact that high income residents would be willing to invest an average
maximum of R$600.00 in a year, water efficient strategies such as the bathroom,
kitchen and utility faucet flow regulators, kitchen sensor faucet, low-flush toilets,
automatic shut-off hose, pressure washer and leakage repair, proved to be the options
most likely to be invested for water efficiency in their homes. However, if high income
residents expect a return of their financial investment within 6 months, the bathroom,
kitchen and utility faucet flow regulators, as well as the automatic shut-off hose nozzle,
pressure washer, and leakage repair would be the best alternatives for their investment.
Mid-high income residents, on the other hand, were willing to invest an average
maximum of R$300.00 in a year, therefore, water efficient strategies such as the

Evaluation of Domestic Water Conservation Measures
197
bathroom, kitchen and utility faucet flow regulator, low-flush toilets, pressure washer
and an automatic irrigation system proved to be the options that would most likely be
invested by residents. However considering the fact that most mid-high income
residents would rather obtain a financial return in 2 years maximum, strategies such as
the low-flush toilet and the automatic irrigation system would not be feasible choices of
investment.
As previously seen, mid-low income resident’s willingness-to-pay for water efficient
strategies was equivalent to an average maximum R$50.00 in a year, and therefore,
would most likely invest in bathroom, kitchen and utility faucet flow regulators,
automatic shut-off hose nozzle and leakage repair. But considering their preference in
obtaining financial return in only one month, only the kitchen faucet flow regulator
would be the best option.
Interestingly, the data collected demonstrated that low income dwellings would be
willing to invest more than mid-low income dwellings, with lower monthly payments
(R$10.00), but within a bigger time-frame (6 months), resulting in an average maximum
of R$50.00 in one year. Considering this, residents would most likely invest in
bathroom and kitchen flow regulators, automatic shut-off hose nozzle and repair
existing leaks, but if considering their desired payback period of only one month, no
strategies would be viable.
6.3.3.1 Simple payback period
The simple payback period shows how long it takes for financial savings to cover the
cost of an efficient water conservation measure. The economic assessment using
payback period has shown that automatic bathroom faucet, bathroom faucet, low flow
shower heads, high efficiency washing machine, and automatic irrigation sprinkler
present the highest payback period of around 20 years, turning them unfeasible.
Moreover, the payback period is higher than their average life expectancy. The other
efficient strategies are feasible taking into account the payback period analysis. Tables
6.7 to 6.10.
Using the simple payback period analysis we could say that 9 out of the 15 strategies
analysed are feasible. However, the payback period does not take into account the
savings generated over the lifetime of the equipment and it does not provide a simple

Evaluation of Domestic Water Conservation Measures
198
criteria for acceptance or rejection of one strategy. So, we proceed to calculate the life
cycle cost-benefit analysis.
6.3.3.2 Life cycle analysis
A life cycle cost-benefit analysis (LCCB) was capable of evaluating the financial
benefits generated by every water efficient strategy within their lifespan. Figure 6.26
shows that the repair of leaks in high income dwellings presented the highest financial
benefit equivalent to R$6,063.27, followed by dual flush toilets (R$3,153.29) and low-
flush toilets (R$2,236.41). On the other hand, automatic shut-off hose nozzle and faucet
flow regulator presented a very low benefit.
Figure 6.26 Life cycle cost benefit analysis of feasible water efficient strategies for high
income dwellings
For mid-high income dwellings, the bathroom faucet flow regulator proved to provide
the highest financial benefits during its lifespan (R$1,050.53), followed by the dual
(R$766.36) and low-flush (R$689.37) toilets and by kitchen faucet flow regulator
aerator (R$633.71) (Figure 6.27).
R$ 6.063.27
R$ 3.153.29
R$ 2.236.41
R$ 1.850.20
R$ 1.822.48
R$ 1.802.80
R$ 1.630.15
R$ 648.65
R$ 180.06
R$0 R$1,000 R$2,000 R$3,000 R$4,000 R$5,000 R$6,000 R$7,000
Leakage Repair
Dual Flush Toilet (3/6 lpf)
Low-Flush Toilet (6 lpf)
Bathroom Faucet Flow Regulator
Kitchen Sensor Faucet (6w)
Kitchen Faucet Flow Regulator
Pressure Washer
Utility Faucet Flow Regulator
Automatic Shut-off Hose Nozzle

Evaluation of Domestic Water Conservation Measures
199
Figure 6.27 Life cycle cost benefit analysis of feasible water efficient strategies for mid-
high income dwellings
Figure 6.28 shows us that the use of high-efficiency washing machines provided the
highest financial benefit (R$2,005.22) for mid-low income dwellings, followed by the
dual flush toilet (R$1,328.10) and the kitchen faucet flow regulator (R$1,243.56).
Kitchen sensor faucet and low-flush toilet also presented a high financial benefit.
Figure 6.28 Life cycle cost benefit analysis of feasible water efficient strategies for mid-
low income dwellings
R$ 1.050.53
R$ 766.36
R$ 689.37
R$ 633.71
R$ 377.96
R$ 271.76
R$ 34.38
R$ 4.03
R$0 R$200 R$400 R$600 R$800 R$1,000 R$1,200
Bathroom Faucet Flow Regulator Aerator
Dual Flush Toilet (3/6 lpf)
Low-Flush Toilet (6 lpf)
Kitchen Faucet Flow Regulator Aerator
Kitchen Sensor Faucet
Utility Faucet Flow Regulator
Pressure Washer
Automatic Irrigation Sprinkler System
R$ 2.005.22
R$ 1.328.10
R$ 1.243.56
R$ 1.197.45
R$ 1.044.07
R$ 811.32
R$ 94.65
R$ 13.04
R$0 R$500 R$1,000 R$1,500 R$2,000 R$2,500
High-Efficiency Washing Machine
Dual Flush Toilet (3/6 lpf)
Kitchen Faucet Flow Regulator
Kitchen Sensor Faucet
Low-Flush Toilet (6 lpf)
Bathroom Faucet Flow Regulator
Utility Faucet Flow Regulator
Automatic Shut-off Hose Nozzle

Evaluation of Domestic Water Conservation Measures
200
For low income dwellings, the kitchen faucet flow regulator (R$856.96) presented the
highest financial benefits during its lifespan, followed by the bathroom faucet flow
regulator (R$797.83) and leakage repair (R$654.74). Kitchen sensor faucet, dual flush
toilet and low flush toilet also presented a reasonable benefit (Figure 6.29).
Figure 6.29 Life cycle cost benefit analysis of feasible water efficient strategies for low
income dwellings
Using the life cycle cost-benefit analysis we could say that, except for automatic shut-
off hose nozzle, utility faucet flow regulators, pressure washer, the strategies analysed
provide reasonable financial benefit.
6.3.3.3 Average incremental cost-benefit analysis - AIC
In order to appraise different types of water efficient strategies with different life
expectancies, the average incremental cost-benefit analysis (AIC) was used in order to
compare the cost effectiveness of the feasible water efficient strategies using a time
horizon of 30 years. Overall, all the strategies analysed present the highest financial
return per cubic meter of water saved, for high income (between R$ 5.13 and R$ 3.24
per cubic meter) dwellings and the low financial return for the low income dwellings
(between R$0.04 and R$ 2.30 per cubic meter). Figures 6.30 to 6.33 rank the average
incremental cost of feasible water efficient strategies for the different income dwellings.
R$ 856.96
R$ 797.83
R$ 654.74
R$ 599.47
R$ 557.01
R$ 553.99
R$ 262.30
R$ 1.49
R$0 R$100 R$200 R$300 R$400 R$500 R$600 R$700 R$800 R$900
Kitchen Faucet Flow Regulator
Bathroom Faucet Flow Regulator
Leakage Repair
Kitchen Sensor Faucet
Dual Flush Toilet (3/6 lpf)
Low-Flush Toilet (6 lpf)
High-Efficiency Washing Machine
Automatic Shut-off Hose Nozzle

Evaluation of Domestic Water Conservation Measures
201
Estimates for high income dwellings shows that the kitchen faucet flow regulator
provided the highest rate of financial return of R$5.13 per cubic meter of water saved,
followed by the repair of leaks (5.13 R$/m3), and utility faucet flow regulator (4.99
R$/m3). The highest ranked water efficient strategy for mid-high income dwellings was
the pressure washer, with R$2.87 per m3 of water saved, followed by the kitchen faucet
flow regulator (2.75 R$/m3) and bathroom faucet flow regulator (R$/m3). For mid-low
income dwellings, the best alternatives for investment was the kitchen faucet flow
regulator (2.35 R$/m3), the bathroom faucet flow regulator (2.24 R$/m3) and the low-
flush toilet (2.15 R$/m3). The highest rates for financial return in low income dwellings
was the repair of leaks, at 2.30 R$/m3, followed by the kitchen faucet flow regulator
(1.83 R$/m3), and the use of bathroom faucet flow regulators (1.78 R$/m3).
Figure 6.30 Average incremental cost benefit analysis of feasible water efficient
strategies for high income dwellings
5.13
5.13
4.99
4.74
4.47
3.86
3.71
3.42
3.24
0.00 1.00 2.00 3.00 4.00 5.00 6.00
Kitchen Faucet Flow Regulator
Leakage Repair
Utility Faucet Flow Regulator
Bathroom Faucet Flow Regulator
Low-Flush Toilet (6 lpf)
Pressure Washer
Dual Flush Toilet (3/6 lpf)
Automatic Shut-off Hose Nozzle
Kitchen Sensor Faucet
30 year AIC (R$/m3)

Evaluation of Domestic Water Conservation Measures
202
Figure 6.31 Average incremental cost benefit analysis of feasible water efficient
strategies for mid-high income dwellings
Figure 6.32 Average incremental cost benefit analysis of feasible water efficient
strategies for mid-low income dwellings
R$ 2.87
R$ 2.75
R$ 2.69
R$ 2.60
R$ 1.68
R$ 0.57
R$ 0.37
R$ 0.20
0.00 0.50 1.00 1.50 2.00 2.50 3.00 3.50
Pressure Washer
Kitchen Faucet Flow Regulator
Bathroom Faucet Flow Regulator
Utility Faucet Flow Regulator
Low-Flush Toilet (6 lpf)
Automatic Irrigation Sprinkler System
Dual Flush Toilet (3/6 lpf)
Kitchen Sensor Faucet
30 year AIC (R$/m3)
2.35
2.24
2.15
1.99
1.89
1.61
1.30
0.65
0.30
0.00 0.50 1.00 1.50 2.00 2.50
Kitchen Faucet Flow Regulator
Bathroom Faucet Flow Regulator
Low-Flush Toilet (6 lpf)
Utility Faucet Flow Regulator
Kitchen Sensor Faucet
Dual Flush Toilet (3/6 lpf)
Leakage Repair
High-Efficiency Washing Machine
Automatic Shut-off Hose Nozzle
30 year AIC (R$/m3)

Evaluation of Domestic Water Conservation Measures
203
Figure 6.33 Average incremental cost benefit analysis of feasible water efficient
strategies for low income dwellings
2.30
1.83
1.78
1.61
1.23
1.03
0.11
0.04
0.00 0.50 1.00 1.50 2.00 2.50
Leakage Repair
Kitchen Faucet Flow Regulator
Bathroom Faucet Flow Regulator
Low-Flush Toilet (6 lpf)
Kitchen Sensor Faucet
Dual Flush Toilet (3/6 lpf)
High-Efficiency Washing Machine
Automatic Shut-off Hose Nozzle
30 year AIC (R$/m3)

Evaluation of Domestic Water Conservation Measures
204
Table 6.7 Cost-benefit analyses of water efficient strategies for high income dwellings
Water Efficient Strategies Water Savings
(m3/dw/yr)
Financial
Benefits (R$/dw/yr)
Capital Cost (R$/dw)
Operational
Cost (R$/dw/yr)
Simple
Payback (yr)
Average Life
Expectancy (yr)
LCCB (R$)
AIC (R$/m
3)
Bathroom Faucet Flow Regulator 17 134.14 93.00 0.00 0.7 20 1,850.20 4.74
Automatic Bathroom Faucet 5 42.93 900.00 0.00 21.0 20 -261.37 -5.94
Bathroom Sensor Faucets 19 150.24 2,900.00 0.50 19.4 20 -738.86 -5.19
Low Flow Shower Head 9 70.32 849.50 0.00 12.1 5 -2,214.25 -14.06
Low-Flush Toilet (6 lpf) 21 163.71 455,58 0.00 2.8 23 2,236.41 4.47
Dual Flush Toilet (3/6 lpf) 37 292.48 1,656.18 0.00 5.7 23 3,153.29 3.71
Kitchen Sensor Faucet 20 163.21 600.00 0.38 3.7 20 1,822.48 3.24
Kitchen Faucet Flow Regulator 15 122.41 18.34 0.00 0.1 20 1,802.80 5.13
Utility Faucet Flow Regulator 6 44.83 18.34 0.00 0.4 20 648.65 4.99
High-Efficiency Washing Machine 23 184.89 2,184.00 0.00 11.8 10 -606.82 -4.21
Automatic Shut-off Hose Nozzle 6 51.53 55.95 0.00 1.1 5 180.06 3.42
Pressure Washer 55 441.72 329.90 13.73 0.8 5 1,630.15 3.86
Automatic Irrigation Sprinkler System 11 85.89 1,445.81 9.90 19.0 7.5 -912.38 -13.06
Leakage Repair 39 314.45 100.00 0.00 0.3 30 6,063.27 5.13

Evaluation of Domestic Water Conservation Measures
205
Table 6.8 Cost-benefit analyses of water efficient strategies for mid-high income dwellings
Water Efficient Strategies Water Savings
(m3/dw/yr)
Financial
Benefits (R$/dw/yr)
Capital Cost (R$/dw)
Operational
Cost (R$/dw/yr)
Simple
Payback (yr)
Average Life
Expectancy (yr)
LCCB (R$)
AIC (R$/m
3)
Bathroom Faucet Flow Regulator 17 73.74 46.50 0.00 0.6 20 1,050.53 2.69
Automatic Bathroom Faucet 4.6 20.14 450.00 0.00 22.3 20 -150.32 -3.68
Bathroom Sensor Faucets 16 70.50 1,160.00 0.10 16.5 20 -112.58 -1.96
Low Flow Shower Head 12 54.04 339.80 0.00 6.3 5 -92.30 -2.66
Low-Flush Toilet (6 lpf) 13 55.78 227.79 0.00 4.1 23 689.37 1.68
Dual Flush Toilet (3/6 lpf) 22 96.96 828.09 0.00 8.5 23 766.36 0.37
Kitchen Sensor Faucet 15 66.03 600.00 0.30 9.1 20 377.96 0.20
Kitchen Faucet Flow Regulator 10 43.83 18.34 0.00 0.4 20 633.71 2.75
Utility Faucet Flow Regulator 4.4 19.50 18.34 0.00 0.9 20 271.76 2.60
High-Efficiency Washing Machine 29 126.00 2,184.00 0.00 17.3 10 -1,109.17 -7.29
Pressure Washer 1.7 7.51 0.01 0.00 0.0 5 34.38 2.87
Automatic Irrigation Sprinkler System 0.3 1.46 4.58 0.23 3.7 5 4.03 0.57

Evaluation of Domestic Water Conservation Measures
206
Table 6.9 Cost-benefit analyses of water efficient strategies for mid-low income dwellings
Water Efficient Strategies Water Savings
(m3/dw/yr)
Financial
Benefits (R$/dw/yr)
Capital Cost (R$/dw)
Operational
Cost (R$/dw/yr)
Simple
Payback (yr)
Average Life
Expectancy (yr)
LCCB (R$)
AIC (R$/m
3)
Bathroom Faucet Flow Regulator 12.1 57.66 46.50 0.00 0.8 20 811.32 2.24
Automatic Bathroom Faucet 3.7 17.82 450.00 0.00 25.2 20 -184.86 -1.65
Bathroom Sensor Faucets 13.0 62.38 1,740.00 0.33 28.0 20 -816.89 -2.09
Low Flow Shower Head 8.1 38.62 339.80 0.00 8.8 5 -162.92 -0.67
Low-Flush Toilet (6 lpf) 16.2 77.35 227.79 0.00 2.9 23 1,044.07 2.15
Dual Flush Toilet (3/6 lpf) 27.4 131.13 828.09 0.00 6.3 23 1,328.10 1.61
Kitchen Sensor Faucet 21.1 101.04 300.00 0.39 3.0 20 1,197.45 1.89
Kitchen Faucet Flow Regulator 17.6 84.20 9.17 0.00 0.1 20 1,243.56 2.35
Utility Faucet Flow Regulator 1.6 7.59 18.34 0.00 2.4 20 94.65 1.99
High-Efficiency Washing Machine 102.7 491.10 2,184.00 0.00 4.4 10 2,005.22 0.65
Automatic Shut-off Hose Nozzle 1.4 6.92 18.65 0.00 2.7 5 13.04 0.30
Pressure Washer 7.2 34.60 329.90 9.42 13.1 5 -214.60 -0.99
Leakage Repair 0.9 4.36 50.00 0.00 11.5 30 35.54 1.30

Evaluation of Domestic Water Conservation Measures
207
Table 6.10 Cost-benefit analyses of water efficient strategies for low income dwellings
Water Efficient Strategies Water Savings
(m3/dw/yr)
Financial
Benefits (R$/dw/yr)
Capital Cost (R$/dw)
Operational
Cost (R$/dw/yr)
Simple
Payback (yr)
Average Life
Expectancy (yr)
LCCB (R$)
AIC (R$/m
3)
Bathroom Faucet Flow Regulator 14.9 55.71 31.00 0.00 0.6 20 797.83 1.78
Automatic Bathroom Faucet 4.7 17.61 300.00 0.00 17.0 20 -37.98 -0.27
Bathroom Sensor Faucets 16.5 61.64 1,160.00 0.43 19.0 20 -249.38 -0.50
Low-Flush Toilet (6 lpf) 11.5 42.93 151.86 0.00 3.5 23 553.99 1.61
Dual Flush Toilet (3/6 lpf) 18.1 67.45 552.06 0.00 8.2 23 557.01 1.03
Kitchen Sensor Faucet 16.3 60.81 300.00 0.35 5.0 20 599.47 1.23
Kitchen Faucet Flow Regulator 15.6 58.22 9.17 0.00 0.2 20 856.96 1.83
High-Efficiency Washing Machine 76.8 286.78 2,184.00 0.00 7.6 10 262.30 0.11
Automatic Shut-off Hose Nozzle 1.2 4.40 18.65 0.00 4.2 5 1.49 0.04
Pressure Washer 5.1 19.10 329.90 8.92 32.4 5 -283.26 -1.85
Leakage Repair 9.5 35.45 40.00 0.00 1.1 30 654.74 2.30

Evaluation of Domestic Water Conservation Measures
208
6.4 Rainwater Harvesting Systems
Typological characteristics such as roof area, garden/yard area, plot size, built form and
typical plumbing installations were included to the four representative models created to
represent high, mid-high, mid-low and low income dwellings from the Federal District,
to evaluate the viability of rainwater harvesting systems in terms of their applicability
(through building adaptation and public acceptance), domestic water savings, system
costs, and benefits. Residential flat buildings were considered as an entire typological
unit. Although system composition, dimensioning and building adaptation of rainwater
harvesting systems were evaluated as a whole, domestic water reductions, and cost-
benefits were divided between the average numbers of flat dwellings in the building.
The average monthly rainwater supply was estimated according to mean values of roof
area collected during fieldwork (See Chapter 5, Table 5.3) and secondary historical data
for mean monthly precipitation from the Federal District (METEOTEST, 1999). Due to
the fact that most rooftops were composed of pitched ceramic tiles or fibre-cement
roofing sheets, a coefficient of 0.9 was used to consider rainwater losses during runoff
(Leggett et al., 2001a). Commercially available filters with 90% efficiency were also
considered as a basis for estimating collectable rainwater (WISY, 2010).
As previously seen in Chapter 4, three different types of rainwater demands were
derived for analysis:
• Reuse 1: Irrigation and floor washing
• Reuse 2: Irrigation, floor washing and toilet flushing
• Reuse 3: Irrigation, floor washing, toilet flushing and clothes washing
To evaluate rainwater harvesting systems, two scenarios were considered. The first
scenario consisted in analysing the performance of rainwater harvesting systems based
on baseline water end-use consumption. The second scenario analysed the performance
of rainwater harvesting systems in combination with water efficient strategies. Monthly
rainwater demands for the different types of reuse were estimated according to Table
6.6. Irrigation and floor washing rainwater demands were estimated together due to the
fact that both activities would make use of the same water fixture.

Evaluation of Domestic Water Conservation Measures
209
Due to the fact that the capacity of rainwater storage has a direct influence over the
costs of a rainwater harvesting system and the volume of mains water savings (Fewkes
and Butler, 2000), the performance of a series of rainwater storage volumes was
evaluated for the different rainwater demands described above using Equation 4.11.
6.4.1 Building Adaptation
The applicability of rainwater harvesting systems in terms of building adaptation was
evaluated according to the typological characteristics of built form, built area, plot size
and typical plumbing installations for the different income dwellings. Based on such
parameters, hypothetical configurations of rainwater harvesting systems were composed
for the high, mid-high, mid-low and low income dwelling representative models.
In one hand, the great majority of house dwellings from the studied regions did not
contain rainwater collection pipework or drainage system, hence, the installation of
gutters, downpipes, collection and drainage network would be necessary. The
composition of each rainwater collection pipework was determined according to the
minimum collection area necessary to supply demand, hence reducing unnecessary
installation costs and optimizing the rainwater harvesting systems. So as to simplify
installation, rainwater storage tanks were perceived to be located in the front yard of the
house, next to the urban drainage collection network, reducing installation costs for
rainwater drainage pipework.
On the other hand, due to their building scale, all residential flat buildings presented
both rainwater collection and drainage pipework, resulting in minor changes to the
existing system. In this case, the rainwater collection pipework was perceived to collect
the necessary rainwater to supply demand. Hypothetically, this would be done on
ground level, either by diverting a section of the existing collection pipes, or through the
use of a diversion chamber, to separate the necessary volume of rainwater to an
underground storage tank located in the proximity of the building. Surplus rainwater
from storage overflow or self-cleaning filter would be easily adapted to the existing
rainwater drainage network.
Since mains water distribution to outdoor end-uses in Brazil is commonly directly fed
from the incoming service pipe, treated rainwater distribution to outdoor end-uses such
as irrigation and floor washing proved to be a simple, low budget scheme that could be

Evaluation of Domestic Water Conservation Measures
210
either adapted to the existing pipework or be installed separately, avoiding cross-
connections between potable and non-potable water.
On the other hand, indoor water end-uses in Brazilian dwellings are indirectly fed via a
header water tank located at the building’s loft. Water from the header tank is usually
distributed through a branching network of header pipes located at the loft of the
building, which individually feed bathrooms, kitchen, utility and other water-consuming
spaces of a house or flats via a vertical distributing pipe. Usually, a single distribution
branch feeds more than one fixture or appliance within these ‘wet spaces’, however, it
was common to find dwellings containing high-pressure flush valves instead of tank-fill
flush valves. Typically, high-pressure flush valves contain a separate distribution
pipework designated solely for toilet flushing, while tank-fill flush valves are part of a
single distribution branch.
The installation of a new distribution pipework destined for non-potable end-uses would
require a high level of refurbishment to adapt the existing network and install a new
distribution branch separated from mains water. Due to the fact that pipes are commonly
located inside brick walls, it would be necessary to break part of the wall to have access
to the existing plumbing and to install the new pipework. Hence, this operation would
render in the redecoration of bathrooms and utility areas. Such retro-fitting option was
considered inefficient, onerous and extremely inconvenient to residents.
A simple and effective way of adapting existing dwellings for non-potable indoor water
reuse was derived by simply modifying the existing header pipework layout at loft
level. The existing vertical distributing pipes which only feed non-potable end-uses
could be used to supply treated rainwater to high pressure flush valves, utility faucets
and washing machines. Such retrofitting technique was considered a low cost method
for adapting existing buildings for water reuse because it requires little plumbing work
and excludes the need to redecorate ‘wet spaces’, as well as promoting little
inconvenience to residents.
The above technique of building adaptation via header pipework modification, however,
would only be made possible in situations where a single vertical distributing pipe was
solely designated to feed non-potable distribution branches. Buildings which contain a
single distribution branch feeding both potable and non-potable end-uses, requires the

Evaluation of Domestic Water Conservation Measures
211
installation of a separate distribution pipework for non-potable purposes. Considering
the fact that the installation of a new distribution pipework destined for non-potable
end-uses would be of high-cost and inconvenient to residents, such option was ruled out
of analysis and the study focused on a more realistic solution, through the adaptation of
existing buildings via header pipework modification at loft level.
6.4.2 Domestic Water Reductions
Domestic water reductions of different rainwater storage volumes for the four different
types of rainwater demands were estimated for the different dwelling income typologies
according to two scenarios: (i) Baseline water end-use consumption and (ii) Reduced
water end-use consumption. The first, considered current domestic water end-use
consumption, and the latter, considered the possibility of achieving high water
efficiency through the use of effective water efficient strategies in combination with
rainwater harvesting systems, resulting in a reduced rainwater demand and smaller
rainwater storage volumes.
Dealing with large storage volumes, this investigation concentrated on the use of
historical mean monthly precipitation values with mean monthly rainwater demand
figures of baseline and reduced end-uses to simulate the performance of different
rainwater storage volumes and obtain annual data of potable water savings for high
(Appendix J), mid-high (Appendix K), mid-low (Appendix L) and low (Appendix M)
income dwellings. As previously seen in Chapter 4, water savings for the different
storage volumes of commercially available rainwater cisterns were identified through
behavioural analysis simulation based on monthly time intervals using Equation 4.11.
Overall, results indicated that higher water savings were obtained for baseline water
end-use consumption than for reduced water end-use consumption when using the same
rainwater storage volume (Figures 6.34, 6.35, 6.36 and 6.37). It was observed that, at
first, annual water savings rose proportionally to the increase in rainwater storage
volume, however, water savings stagnated once the rainwater harvesting system
achieved its maximum capacity to promote domestic water reductions, independent of
the increase in storage volume.
The ideal storage capacity was defined as the lowest rainwater storage volume capable
of promoting the highest level of water savings. Hence, peak water savings were

Evaluation of Domestic Water Conservation Measures
212
achieved as soon as the rainwater harvesting system reached their ideal storage capacity,
and after this point, water savings stagnated, rendering larger rainwater storage volumes
unviable options.
On the whole, results indicated that houses contained the necessary roof area for
collecting rainwater throughout the year to supply demand. In particular, residential flat
buildings contained insufficient average roof area to collect enough rainwater
throughout the year to adequately supply most rainwater reuse demands. Results
indicated that residential flat buildings were capable of collecting enough rainwater
throughout the year to supply reduced rainwater end-use demands for garden irrigation,
floor washing and toilet flushing (Reuse 2), however, this would lead to spacious
rainwater storage volumes, which could lead to issues related to lack of area available
for the construction of the rainwater cisterns. Although the ideal storage capacity for
such reduced rainwater end-use demands would be equivalent to 420 m3, this
investigation analysed the possibility of installing smaller rainwater storage volumes,
and estimated their water savings. Rainwater harvesting systems destined to supply
communal outdoor end-uses (Reuse 1) proved to require much smaller rainwater storage
volumes, with an ideal storage capacity of 35 m3 for baseline water end-use
consumption and 15 m3 for reduced water end-use consumption.
Figure 6.34 Annual water savings per rainwater storage volumes for high income
dwellings
0
50
100
150
200
250
1 10 20 30 40 50 60 70 80 90 100 110 120
An
nu
al W
ate
r S
av
ing
s(m
3 /yr
)
Rainwater Storage Volume (m3)
Baseline Reuse 1 Reduced Reuse 1 Baseline Reuse 2
Reduced Reuse 2 Baseline Reuse 3 Reduced Reuse 3

Evaluation of Domestic Water Conservation Measures
213
Figure 6.35 Annual water savings per rainwater storage volumes for mid-high income
dwellings
Figure 6.36 Annual water savings per rainwater storage volumes for mid-low income
dwellings
0
100
200
300
400
500
600
700
800
900
1000
1 10 20 30 40 50 60 70 80 90 100 110 120
An
nu
al W
ate
r S
av
ing
s (m
3 /yr
)
Rainwater Storage Volume (m3)
Baseline Reuse 1 Reduced Reuse 1 Reduced Reuse 2
0
20
40
60
80
100
120
140
1 5 10 15 20 25 30 35 40 45 50 60 70 80 90 100 110 120
An
nu
al W
ate
r S
av
ing
s(m
3 /yr
)
Rainwater Storage Volume (m3)
Baseline Reuse 1 Reduced Reuse 1 Baseline Reuse 2
Reduced Reuse 2 Baseline Reuse 3 Reduced Reuse 3

Evaluation of Domestic Water Conservation Measures
214
Figure 6.37 Annual water savings per rainwater storage volumes for low income
dwellings
Table 6.11 Domestic water reductions promoted by rainwater harvesting systems for
high income dwellings in baseline and reduced water end-use consumption scenarios
Rainwater Harvesting
System Storage Volume
Baseline Scenario Reduced Scenario
Water Savings (m
3/dw/yr)
WRI (%)
Water Savings (m
3/dw/yr)
WRI (%)
Re
use
1 1m
3 Rainwater Cistern 59 11.0 15 65.9
5m3 Rainwater Cistern 63 11.8 19 66.7
10m3 Rainwater Cistern 68 12.7 20 66.9
15m3 Rainwater Cistern 73 13.7 --- ---
Re
use
2
5m3 Rainwater Cistern 103 19.4 35 69.7
10m3 Rainwater Cistern 108 20.3 40 70.6
15m3 Rainwater Cistern 113 21.2 44 71.5
20m3 Rainwater Cistern 118 22.2 --- ---
25m3 Rainwater Cistern 123 23.1 --- ---
30m3 Rainwater Cistern 128 24.1 --- ---
35m3 Rainwater Cistern 133 25.0 --- ---
40m3 Rainwater Cistern 138 25.9 --- ---
Re
use
3
10m3 Rainwater Cistern 163 30.6 70 76.4
20m3 Rainwater Cistern 173 32.5 76 77.4
30m3 Rainwater Cistern 183 34.4 81 78.3
40m3 Rainwater Cistern 193 36.2 86 79.3
50m3 Rainwater Cistern 203 38.1 91 80.2
60m3 Rainwater Cistern 213 40.0 96 81.1
70m3 Rainwater Cistern 223 41.9 99 81.7
80m3 Rainwater Cistern 229 43.0 --- ---
0
20
40
60
80
100
120
1 5 10 15 20 25 30 35 40 45 50 60 70 80 90 100 110 120
An
nu
al W
ate
r S
av
ing
s(m
3 /yr
)
Rainwater Storage Volume (m3)
Baseline Reuse 1 Reduced Reuse 1 Baseline Reuse 2
Reduced Reuse 2 Baseline Reuse 3 Reduced Reuse 3

Evaluation of Domestic Water Conservation Measures
215
Table 6.12 Domestic water reductions promoted by rainwater harvesting systems for
mid-high income dwellings in baseline and reduced water end-use consumption
scenarios
Rainwater Harvesting
System Storage Volume
Baseline Scenario Reduced Scenario
Water Savings (m
3/dw/yr)
WRI (%)
Water Savings (m
3/dw/yr)
WRI (%)
Re
use
1
1m3 Rainwater Cistern 1.7 0.7 0.4 42.7
5m3 Rainwater Cistern 1.9 0.8 0.5 42.7
10m3 Rainwater Cistern 2.0 0.8 0.5 42.8
15m3 Rainwater Cistern 2.1 0.9 --- ---
20m3 Rainwater Cistern 2.3 0.9 --- ---
25m3 Rainwater Cistern 2.4 1.0 --- ---
Re
use
2
50m3 Rainwater Cistern --- --- 11 53.6
100m3 Rainwater Cistern --- --- 12 54.3
150m3 Rainwater Cistern --- --- 13 55.0
200m3 Rainwater Cistern --- --- 13 55.7
250m3 Rainwater Cistern --- --- 14 56.4
300m3 Rainwater Cistern --- --- 15 57.1
350m3 Rainwater Cistern --- --- 16 57.8
400m3 Rainwater Cistern --- --- 16 58.5
450m3 Rainwater Cistern --- --- 16 58.6
Table 6.13 Domestic water reductions promoted by rainwater harvesting systems for
mid-low income dwellings in baseline and reduced water end-use consumption
scenarios
Rainwater Harvesting
System Storage Volume
Baseline Scenario Reduced Scenario
Water Savings (m
3/dw/yr)
WRI (%)
Water Savings (m
3/dw/yr)
WRI (%)
Re
use
1 1m
3 Rainwater Cistern 14 4.8 9 40.4
5m3 Rainwater Cistern 18 6.3 12 41.4
10m3 Rainwater Cistern 19 6.8 --- ---
15m3 Rainwater Cistern 19 6.8 --- ---
Re
use
2 5m
3 Rainwater Cistern 49 17.5 27 46.7
10m3 Rainwater Cistern 54 19.3 32 48.4
15m3 Rainwater Cistern 59 21.1 33 48.8
20m3 Rainwater Cistern 64 22.8 --- ---
Re
use
3
5m3 Rainwater Cistern 91 32.2 57 57.3
10m3 Rainwater Cistern 96 34.0 62 59.1
15m3 Rainwater Cistern 101 35.8 67 60.8
20m3 Rainwater Cistern 106 37.6 72 62.6
25m3 Rainwater Cistern 111 39.3 77 64.4
30m3 Rainwater Cistern 116 41.1 78 64.9
35m3 Rainwater Cistern 121 42.9 --- ---
40m3 Rainwater Cistern 122 43.5 --- ---
45m3 Rainwater Cistern 122 43.5 --- ---

Evaluation of Domestic Water Conservation Measures
216
Table 6.14 Domestic water reductions promoted by rainwater harvesting systems for
low income dwellings in baseline and reduced water end-use consumption scenarios
Rainwater Harvesting
System Storage Volume
Baseline Scenario Reduced Scenario
Water Savings (m
3/dw/yr)
WRI (%)
Water Savings (m
3/dw/yr)
WRI (%)
Re
use
1
1m3 Rainwater Tank 11 4.9 8 39.9
5m3 Rainwater Cistern 15 6.6 10 41.0
10m3 Rainwater Cistern 15 6.7 --- ---
Re
use
2
1m3 Rainwater Tank 34 14.5 19 44.5
5m3 Rainwater Cistern 38 16.3 23 46.2
10m3 Rainwater Cistern 43 18.4 27 48.0
15m3 Rainwater Cistern 48 20,6 --- ---
20m3 Rainwater Cistern 49 21.2 --- ---
Re
use
3
5m3 Rainwater Cistern 71 30.6 45 55.7
10m3 Rainwater Cistern 76 32.7 50 57.9
15m3 Rainwater Cistern 81 34.9 55 60.0
20m3 Rainwater Cistern 86 37.1 59 62.1
25m3 Rainwater Cistern 91 39.2 --- ---
30m3 Rainwater Cistern 96 41.4 --- ---
Tables 6.11, 6.12, 6.13 and 6.14, summarize the results of annual water savings per
dwelling of the varied rainwater harvesting systems for the different income dwellings,
and their water reduction index (WRI) achieved according to baseline and reduced end-
use consumption scenarios. Although the rainwater harvesting systems presented higher
annual water saving figures for the baseline water end-use consumption scenario for the
reduced water end-use consumption scenario, the water reduction indexes proved that
the use of water efficient strategies in combination with rainwater harvesting systems
resulted in potentially high domestic water reductions.
Domestic water savings for high income house dwellings ranged from 15 m3 per
dwelling per year (m3/dw/yr) to 229m3/dw/yr, depending on the rainwater harvesting
system storage volume and end-use water consumption scenario. Potentially, domestic
water reductions could reach to 100%, through the combination of water efficient
strategies and a rainwater harvesting system with a 70 m3 rainwater storage volume for
the reduced potable end-use water consumption of 223m3/dw/yr, hypothetically
achieving mains water independence.
The highest rate of domestic water savings for mid-high income flat dwellings was
equivalent to 16m3/dw/yr through a 450 m3 rainwater harvesting system for reduced
communal outdoor end-uses and toilet flushing (Reuse 2), with a water reduction index
equivalent to 59 %. Communal outdoor water end-uses required lower rainwater storage

Evaluation of Domestic Water Conservation Measures
217
volumes ranging from 1m3 to 25m3 with domestic water savings per dwelling ranging
from a low 0.4 m3/dw/yr at a reduced water consumption scenario to 1.0 m3/dw/yr at a
baseline water consumption scenario, with WRI’s ranging from 0.7% (baseline
scenario) to 42.8% (reduced scenario).
Domestic water savings from baseline water end-use consumption scenario for mid-low
income house dwellings ranged from 14m3/dw/yr to 122m3/dw/yr, while the reduced
scenario presented figures ranging from 9m3/dw/yr to 78m3/dw/yr. Since the reduced
water end-use scenario for mid-low dwellings allowed the application of a rainwater
harvesting system for potable end-uses, higher annual water savings could be achieved,
reaching up to 64.9% water reduction index.
Low income house dwellings presented domestic water reduction figures ranging from
11m3/dw/yr to 96m3/dw/yr for the baseline water consumption scenario and 8m3/dw/yr
to 59m3/dw/yr for a reduced water consumption scenario. Similarly to mid-low income
house dwellings, the reduced domestic water consumption rates for low-income house
dwellings allowed the application of a rainwater harvesting system for potable end-uses,
leading to higher annual water savings, with water reduction indexes reaching up to a
62.1%.
6.4.3 Cost-Benefit Analyses
In order to assess the economic benefits of rainwater harvesting systems for high, mid
high, mid-low and low income dwellings, simple payback period, life cycle cost-benefit
analysis and average incremental cost evaluation methods were applied to both baseline
and reduced water end-use consumption scenario’s (see Tables 6.15 to 6.22 for the
results).
Costs for rainwater harvesting systems included the unit costs of system components for
collection, drainage and distribution pipework, water tanks, treatment system and other
related equipments. Installation costs for water reuse systems were composed of site
preparation and labour. Operational costs included annual consumables, energy
consumption and labour cost for system maintenance (Appendix N).

Evaluation of Domestic Water Conservation Measures
218
Using the simple payback period analysis, in both baseline and reduced water end-use
consumption scenario’s, no rainwater harvesting system was considered as a viable
option for high, mid-low and low income dwellings because, excepting for the baseline
scenario for high income dwellings, the payback period proved to be higher than the life
expectancy of the equipment.
Moreover, these systems required an investment superior to the resident’s willingness-
to-pay. Most rainwater harvesting systems for mid-high income dwellings did not
achieve the minimum level of resident willingness-to-pay of R$300.00 in one year. But
due to the fact that mid-high income flat dwellings would have to share the costs related
to one rainwater harvesting system for outdoor end-uses within communal grounds of
their building typology, results indicated that residents would be willing to invest in a
rainwater harvesting system for baseline water consumption on garden irrigation and
floor washing with a storage capacity ranging from 1m3 to 25m3. However, if they
expect to receive a financial return of investment within two years, these would prove to
be unviable options.
The financial benefits obtained from rainwater harvesting systems during their useful
life expectancy was analysed for the different income dwellings, and overall, such water
conservation measure proved to be an unviable option for the reduced water end-use
consumption scenario due to the high capital costs related to the investment of water
efficient equipment, in addition to the rainwater harvesting system implementation
costs.
No rainwater harvesting system was found to be feasible for mid-low and low income
dwellings due to the high capital costs involved and the low water consumption rate
from these homes. However, due to the fact that high income dwellings presented an
average high water consumption rate, some rainwater harvesting systems for baseline
water end-use consumption scenario demonstrated to be viable options for investment.
With the highest financial benefit rainwater harvesting systems for irrigation, floor
washing, toilet flushing and clothes washing (Reuse 3), provided a financial return of
R$12,174.37 using a 10m3 rainwater cistern, R$7,992.06 with a 20m3 rainwater cistern
and R$6,213.55 from a 30m3 rainwater cistern (Figure 6.38).

Evaluation of Domestic Water Conservation Measures
219
Figure 6.38 Life cycle cost benefit analysis of feasible rainwater harvesting systems for
high income dwellings
Figure 6.39 Life cycle cost benefit analysis of feasible rainwater harvesting systems for
mid-high income dwellings
Due to the fact that multi-storey residential buildings were densely populated, with a
relatively small shared roof area for rainwater collection, rainwater reuse for non-
potable indoor end-uses for both baseline and reduced water consumption scenarios
proved to be an unviable option for investment. However, rainwater harvesting systems
for outdoor baseline water consumption end-uses on irrigation and floor washing (Reuse
R$ 12,174.37
R$ 7,992.06
R$ 6,213.55
R$ 5,134.42
R$ 3,025.23
R$ 1,716.01
R$ 1,546.09
R$ 1,042.07
R$ 497.33
R$0 R$4,000 R$8,000 R$12,000 R$16,000
10m3 Rainwater Cistern - Reuse 3
20m3 Rainwater Cistern - Reuse 3
30m3 Rainwater Cistern - Reuse 3
1m3 Rainwater Cistern - Reuse 1
40m3 Rainwater Cistern - Reuse 3
10m3 Rainwater Cistern - Reuse 1
5m3 Rainwater Cistern - Reuse1
10m3 Rainwater Cistern - Reuse 2
5m3 Rainwater Cistern - Reuse 2
R$ 57.87
R$ 31.33
R$ 27.22
R$ 6.29
R$0 R$10 R$20 R$30 R$40 R$50 R$60 R$70
1m3 Rainwater Cistern - Reuse 1
10m3 Rainwater Cistern - Reuse 1
5m3 Rainwater Cistern - Reuse 1
15m3 Rainwater Cistern - Reuse 1

Evaluation of Domestic Water Conservation Measures
220
1), proved to be feasible options for investment, due to the shared capital costs of
investment and relatively small communal garden/yard area per flats. Figure 6.39 shows
that the most feasible rainwater storage size for a rainwater harvesting system for
irrigation and floor washing was 1m3, with a financial return of R$57.87, followed by a
10m3 cistern (R$31.33) and a 5m3 cistern (R$27.22).
Figure 6.40 Average incremental cost of feasible rainwater harvesting systems for high
income dwellings
An average incremental cost-benefit analysis was used in order to compare the cost
effectiveness of the feasible rainwater harvesting systems within a time horizon of 30
years in terms of financial return per cubic meter of water saved (R$m3), for the high
(Figures 6.40) and mid-high (Figure 6.41) income dwellings. Overall, the highest rate of
financial return was obtained from the 1m3 rainwater cistern for irrigation and floor
washing in high income dwellings, followed by the 10m3 (2.49 R$/m3), and 30m3 (1.13
R$/m3) rainwater cisterns for baseline water end-use consumption in irrigation, floor
washing, toilet flushing and clothes washing. For mid-high income dwellings, the
highest rate of financial return was obtained by using a 1m3 rainwater cistern (1.11
R$/m3) followed by a 10m3 rainwater cistern (0.52 R$/m3) and a 5m3 rainwater cistern
(0.48 R$/m3), for baseline outdoor water end-use in irrigation and floor washing.
R$ 2.91
R$ 2.49
R$ 1.54
R$ 1.13
R$ 0.84
R$ 0.82
R$ 0.52
R$ 0.32
R$ 0.16
R$ 0.00 R$ 0.50 R$ 1.00 R$ 1.50 R$ 2.00 R$ 2.50 R$ 3.00 R$ 3.50
1m3 Rainwater Cistern - Reuse 1
10m3 Rainwater Cistern - Reuse 3
20m3 Rainwater Cistern - Reuse 3
30m3 Rainwater Cistern - Reuse 3
10m3 Rainwater Cistern- Reuse 1
5m3 Rainwater Cistern - Reuse 1
40m3 Rainwater Cistern - Reuse 3
10m3 Rainwater Cistern- Reuse 2
5m3 Rainwater Cistern - Reuse 2

Evaluation of Domestic Water Conservation Measures
221
Figure 6.41 Average incremental cost of feasible rainwater harvesting systems for mid-
high income dwellings
R$ 1.11
R$ 0.52
R$ 0.48
R$ 0.10
R$ 0.00 R$ 0.20 R$ 0.40 R$ 0.60 R$ 0.80 R$ 1.00 R$ 1.20
1m3 Rainwater Cistern - Reuse 1
10m3 Rainwater Cistern- Reuse 1
5m3 Rainwater Cistern - Reuse 1
15m3 Rainwater Cistern- Reuse 1

Evaluation of Domestic Water Conservation Measures
222
Table 6.15 Cost-benefit analyses of rainwater harvesting systems on a baseline water end-use scenario for high income dwellings
Rainwater Harvesting System Water Savings
(m3/dw/yr)
Financial
Benefits (R$/dw/yr)
Capital Cost (R$/dw)
Operational
Cost (R$/dw/yr)
Simple
Payback (yr)
Average Life
Expectancy (yr)
LCCB (R$)
AIC (R$/m
3)
Re
use
1 1m
3 Rainwater Cistern 59 468.57 1,846.85 14.18 4.1 30 5,134.42 2.91
5m3 Rainwater Cistern 63 500.48 5,521.65 14.18 11.4 30 1,546.09 0.82
10m3 Rainwater Cistern 68 540.36 6,087.65 14.18 11.6 30 1,716.01 0.84
15m3 Rainwater Cistern 73 580.25 8,752.65 14.18 15.5 30 -211.57 -0.10
Re
use
2
5m3 Rainwater Cistern 103 603.44 8,516.78 22.55 14.7 30 497.33 0.16
10m3 Rainwater Cistern 108 643.32 9,082.78 22.55 14.6 30 1,042.07 0.32
15m3 Rainwater Cistern 113 683.20 11,747.78 22.55 17.8 30 -841.18 -0.25
20m3 Rainwater Cistern 118 723.09 14,828.58 22.55 21.2 30 -3,140.24 -0.89
25m3 Rainwater Cistern 123 762.97 16,499.58 22.55 22.3 30 -4,029.50 -1.09
30m3 Rainwater Cistern 128 786.84 18,170.58 22.55 23.8 30 -5,232.63 -1.36
35m3 Rainwater Cistern 133 786.84 21,251.38 22.55 27.8 30 -8,313.43 -2.08
40m3 Rainwater Cistern 138 786.84 22,922.38 22.55 30.0 30 -9,984.43 -2.41
Re
use
3
10m3 Rainwater Cistern 163 1,298.41 10,144.00 38.75 8.1 30 12,174.37 2.49
20m3 Rainwater Cistern 173 1,378.18 15,889.80 38.75 11.9 30 7,992.06 1.54
30m3 Rainwater Cistern 183 1,457.94 19,231.80 38.75 13.6 30 6,213.55 1.13
40m3 Rainwater Cistern 193 1,537.71 23,983.60 38.75 16.0 30 3,025.23 0.52
50m3 Rainwater Cistern 203 1,617.48 33,091.00 38.75 21.0 30 -4,518.68 -0.74
60m3 Rainwater Cistern 213 1,697.25 38,411.00 38.75 23.2 30 -8,275.19 -1.30
70m3 Rainwater Cistern 223 1,777.02 43,731.00 38.75 25.2 30 -12,031.71 -1.80
80m3 Rainwater Cistern 229 1,823.00 49,051.00 38.75 27.5 30 -16,450.40 -2.40

Evaluation of Domestic Water Conservation Measures
223
Table 6.16 Cost-benefit analyses of rainwater harvesting systems on a reduced water end-use scenario for high income dwellings
Rainwater Harvesting System Water Savings
(m3/dw/yr)
Financial
Benefits (R$/dw/yr)
Capital Cost (R$/dw)
Operational
Cost (R$/dw/yr)
Simple
Payback (yr)
Average Life
Expectancy (yr)
LCCB (R$)
AIC (R$/m
3)
Re
use
1
1m3 Rainwater Cistern 15 116.17 11,325.48 14.18 111.0 30 -10,722.49 -24.54
5m3 Rainwater Cistern 19 148.07 15,270.48 14.18 114.0 30 -14,042.10 -25.22
10m3 Rainwater Cistern 20 159.26 15,836.48 14.18 109.2 30 -14,388.81 -24.02
Re
use
2
5m3 Rainwater Cistern 35 276.39 17,579.93 22.55 69.3 30 -13,760.58 -13.24
10m3 Rainwater Cistern 40 316.27 18,145.93 22.55 61.8 30 -13,544.84 -11.39
15m3 Rainwater Cistern 44 353.02 20,810.93 22.55 63.0 30 -15,489.51 -11.67
Re
use
3
5m3 Rainwater Cistern 70 559.90 18,118.73 38.75 34.8 30 -9,059.99 -4.30
10m3 Rainwater Cistern 76 603.44 18,684.73 38.75 33.1 30 -8,772.64 -3.87
15m3 Rainwater Cistern 81 643.32 21,349.73 38.75 35.3 30 -10,655.90 -4.40
20m3 Rainwater Cistern 86 683.20 24,430.53 38.75 37.9 30 -12,954.95 -5.04
25m3 Rainwater Cistern 91 723.09 26,101.53 38.75 38.1 30 -13,844.21 -5.09
30m3 Rainwater Cistern 96 762.97 27,772.53 38.75 38.3 30 -14,733.46 -5.13
35m3 Rainwater Cistern 99 786.84 30,853.33 38.75 41.2 30 -17,346.40 -5.86

Evaluation of Domestic Water Conservation Measures
224
Table 6.17 Cost-benefit analyses of rainwater harvesting systems on a baseline water end-use scenario for mid-high income dwellings
Rainwater Harvesting System Water
Savings (m
3/dw/yr)
Financial
Benefits (R$/dw/yr)
Capital Cost (R$/dw)
Operational
Cost (R$/dw/yr)
Simple
Payback (yr)
Average Life
Expectancy (yr)
LCCB (R$)
AIC (R$/m
3)
Re
use
1
1m3 Rainwater Cistern 1.7 7.62 40.23 0.36 5.5 30 57.87 1.11
5m3 Rainwater Cistern 1.9 8.23 82.86 0.36 10.5 30 27.22 0.48
10m3 Rainwater Cistern 2.0 8.84 90.72 0.36 10.7 30 31.33 0.52
15m3 Rainwater Cistern 2.1 9.45 127.73 0.36 14.0 30 6.29 0.10
20m3 Rainwater Cistern 2.3 10.06 170.52 0.36 17.6 30 -24.52 -0.36
25m3 Rainwater Cistern 2.4 10.67 193.73 0.36 18.8 30 -35.76 -0.49
Table 6.18 Cost-benefit analyses of rainwater harvesting systems on a reduced water end-use scenario for mid-high income dwellings
Rainwater Harvesting System Water Savings
(m3/dw/yr)
Financial
Benefits (R$/dw/yr)
Capital Cost (R$/dw)
Operational
Cost (R$/dw/yr)
Simple
Payback (yr)
Average Life
Expectancy (yr)
LCCB (R$)
AIC (R$/m
3)
Re
use
1
1m3 Rainwater Cistern 0.4 1.85 4,082.37 0.36 2729.5 30 -4,097.33 -324.39
5m3 Rainwater Cistern 0.5 2.10 4,124.99 0.36 2370.7 30 -4,135.16 -289.22
10m3 Rainwater Cistern 0.5 2.40 4,132.85 0.36 2020.5 30 -4,137.03 -252.55
Re
use
2
20m3 Rainwater Cistern 11.0 48.17 4,363.68 5.47 102.2 30 -3,587.51 -10.92
40m3 Rainwater Cistern 11.2 49.39 4,476.10 5.47 101.9 30 -3,675.97 -10.91
60m3 Rainwater Cistern 11.5 50.61 4,676.48 5.47 103.6 30 -3,852.41 -11.16
80m3 Rainwater Cistern 11.8 51.83 4,824.25 5.47 104.1 30 -3,976.24 -11.25
100m3 Rainwater Cistern 12.1 53.05 4,972.03 5.47 104.5 30 -4,100.07 -11.33

Evaluation of Domestic Water Conservation Measures
225
Table 6.19 Cost-benefit analyses of rainwater harvesting systems on a baseline water end-use scenario for mid-low income dwellings
Rainwater Harvesting System Water Savings
(m3/dw/yr)
Financial
Benefits (R$/dw/yr)
Capital Cost (R$/dw)
Operational
Cost (R$/dw/yr)
Simple
Payback (yr)
Average Life
Expectancy (yr)
LCCB (R$)
AIC (R$/m
3)
Re
use
1 1m
3 Rainwater Cistern 13.6 65.26 1,664.40 4.68 27.5 30 -2,072.92 -5.06
5m3 Rainwater Cistern 17.6 84.40 5,250.75 4.68 65.9 30 -5,284.29 -9.98
10m3 Rainwater Cistern 19.0 90.99 5,816.75 4.68 67.4 30 -5,721.02 -10.02
15m3 Rainwater Cistern 19.0 90.99 8,481.75 4.68 98.3 30 -8,386.02 -14.69
Re
use
2 5m
3 Rainwater Cistern 49.2 294.27 7,328.48 10.58 25.8 30 -3,810.52 -2.58
10m3 Rainwater Cistern 54.2 318.18 7,894.48 10.58 25.7 30 -3,907.79 -2.40
15m3 Rainwater Cistern 59.2 342.10 10,559.48 10.58 31.9 30 -6,104.06 -3.43
20m3 Rainwater Cistern 64.2 366.01 13,640.28 10.58 38.4 30 -8,716.13 -4.52
Re
use
3
5m3 Rainwater Cistern 90.7 433.82 7,516.37 19.90 18.2 30 -1,445.87 -0.53
10m3 Rainwater Cistern 95.7 457.73 8,082.37 19.90 18.5 30 -1,543.14 -0.54
15m3 Rainwater Cistern 100.7 481.65 10,747.37 19.90 23.3 30 -3,739.41 -1.24
20m3 Rainwater Cistern 105.7 505.56 13,828.17 19.90 28.5 30 -6,351.48 -2.00
25m3 Rainwater Cistern 110.7 529.48 15,499.17 19.90 30.4 30 -7,553.75 -2.27
30m3 Rainwater Cistern 115.7 553.39 17,170.17 19.90 32.2 30 -8,756.02 -2.52
35m3 Rainwater Cistern 120.7 577.30 20,250.97 19.90 36.3 30 -11,368.09 -3.14
40m3 Rainwater Cistern 122.4 585.27 21,921.97 19.90 38.8 30 -12,882.92 -3.51
45m3 Rainwater Cistern 122.4 585.27 23,592.97 19.90 41.7 30 -14,553.92 -3.96

Evaluation of Domestic Water Conservation Measures
226
Table 6.20 Cost-benefit analyses of rainwater harvesting systems on a reduced water end-use scenario for mid-low income dwellings
Rainwater Harvesting System Water Savings
(m3/dw/yr)
Financial
Benefits (R$/dw/yr)
Capital Cost (R$/dw)
Operational
Cost (R$/dw/yr)
Simple
Payback (yr)
Average Life
Expectancy (yr)
LCCB (R$)
AIC (R$/m
3)
Re
use
1
1m3 Rainwater Cistern 8.9 42.54 7,454.53 4.68 196.9 30 -8,308.46 -31.14
5m3 Rainwater Cistern 11.9 56.87 11,040.88 4.68 211.6 30 -11,613.95 -32.56
Re
use
2 5m
3 Rainwater Cistern 26.7 127.49 13,000.58 10.58 111.2 30 -12,751.64 -15.95
10m3 Rainwater Cistern 31.7 151.40 13,566.58 10.58 96.3 30 -12,848.91 -13.53
15m3 Rainwater Cistern 32.7 156.40 16,231.58 10.58 111.3 30 -15,415.92 -15.71
Re
use
3
5m3 Rainwater Cistern 56.5 270.36 13,306.50 19.90 53.1 30 -10,439.94 -6.16
10m3 Rainwater Cistern 61.5 294.27 13,872.50 19.90 50.6 30 -10,537.21 -5.71
15m3 Rainwater Cistern 66.5 318.18 16,537.50 19.90 55.4 30 -12,733.48 -6.38
20m3 Rainwater Cistern 71.5 342.10 19,618.30 19.90 60.9 30 -15,345.55 -7.15
25m3 Rainwater Cistern 76.5 366.01 21,289.30 19.90 61.5 30 -16,547.82 -7.21
30m3 Rainwater Cistern 78.0 372.83 22,960.30 19.90 65.1 30 -18,085.27 -7.73

Evaluation of Domestic Water Conservation Measures
227
Table 6.21 Cost-benefit analyses of rainwater harvesting systems on a baseline water end-use scenario for low income dwellings
Rainwater Harvesting System Water Savings
(m3/dw/yr)
Financial
Benefits (R$/dw/yr)
Capital Cost (R$/dw)
Operational
Cost (R$/dw/yr)
Simple
Payback (yr)
Average Life
Expectancy (yr)
LCCB (R$)
AIC (R$/m
3)
Re
use
1
1m3 Rainwater Cistern 11.3 42.14 1,599.05 4.78 42.8 30 -2,960.73 -8.75
5m3 Rainwater Cistern 15.3 57.08 5,185.40 4.78 99.1 30 -6,254.25 -13.64
10m3 Rainwater Cistern 15.5 57.82 5,751.40 4.78 108.4 30 -6,805.83 -14.66
Re
use
2 5m
3 Rainwater Cistern 37.7 184.99 7,305.23 8.96 41.5 30 -5,897.54 -5.21
10m3 Rainwater Cistern 42.7 203.66 7,871.23 8.96 40.4 30 -6,097.50 -4.76
15m3 Rainwater Cistern 47.7 221.66 10,536.23 8.96 49.5 30 -8,409.73 -5.88
20m3 Rainwater Cistern 49.0 221.66 13,617.03 8.96 64.0 30 -11,490.53 -7.81
Re
use
3
5m3 Rainwater Cistern 70.8 264.61 8,000.70 13.42 31.9 30 -5,119.76 -2.41
10m3 Rainwater Cistern 75.8 283.29 8,566.70 13.42 31.7 30 -5,319.72 -2.34
15m3 Rainwater Cistern 80.8 301.96 11,231.70 13.42 38.9 30 -7,618.68 -3.14
20m3 Rainwater Cistern 85.8 320.64 14,312.50 13.42 46.6 30 -10,333.44 -4.01
25m3 Rainwater Cistern 90.8 339.31 15,983.50 13.42 49.0 30 -11,638.40 -4.27
30m3 Rainwater Cistern 95.8 357.99 17,654.50 13.42 51.2 30 -12,943.36 -4.50

Evaluation of Domestic Water Conservation Measures
228
Table 6.22 Cost-benefit analyses of rainwater harvesting systems on a reduced water end-use scenario for low income dwellings
Rainwater Harvesting System Water Savings
(m3/dw/yr)
Financial
Benefits (R$/dw/yr)
Capital Cost (R$/dw)
Operational
Cost (R$/dw/yr)
Simple
Payback (yr)
Average Life
Expectancy (yr)
LCCB (R$)
AIC (R$/m
3)
Re
use
1
1m3 Rainwater Cistern 8.0 29.78 6,150.01 4.78 246.0 30 -7,256.07 -30.34
5m3 Rainwater Cistern 10.4 38.98 9,736.36 4.78 284.7 30 -10,662.06 -34.06
Re
use
2
5m3 Rainwater Cistern 22.6 84.41 11,743.01 8.96 155.6 30 -12,306.72 -18.15
10m3 Rainwater Cistern 26.6 99.47 12,309.01 8.96 136.0 30 -12,577.51 -15.74
Re
use
3
5m3 Rainwater Cistern 44.5 166.31 12,024.68 13.42 78.6 30 -11,070.44 -8.29
10m3 Rainwater Cistern 49.5 184.99 12,590.68 13.42 73.4 30 -11,270.40 -7.59
15m3 Rainwater Cistern 54.5 203.66 15,255.68 13.42 80.2 30 -13,569.36 -8.30
20m3 Rainwater Cistern 59.3 221.66 18,336.48 13.42 88.1 30 -16,297.39 -9.15

Evaluation of Domestic Water Conservation Measures
229
6.5 Greywater Recycling Systems
The representative models composed to represent each income dwelling typology were
used as a basis to evaluate the viability of greywater reuse systems in terms of their
applicability through building adaptation, domestic water reductions and cost-benefits.
Similar to rainwater harvesting systems, greywater recycling systems for residential flat
buildings were considered as one typological unit composed of 72 flat dwellings.
Although greywater recycling system composition, dimensioning and building
adaptability were evaluated at the residential building scale, water savings, costs and
benefits were shared amongst flat dwellings as means for comparison between
residential dwelling types.
Four different types of greywater systems were analysed. The first consisted in simply
storing greywater from the washing machine in a 300 litre greywater butt for irrigation
and floor washing via manual bucketing. The second system consisted of diverting
greywater generated by the premises for gravity fed sub-surface irrigation. The third,
consisted of a commercially available state-of-the-art greywater recycling apparatus
composed of a single wash basin and toilet unit linked together to treat greywater
produced at the lavatory for toilet flushing. The last made use of commercially available
greywater treatment units for three types of greywater demands:
• Reuse 1: Irrigation and floor washing
• Reuse 2: Irrigation, floor washing and toilet flushing
• Reuse 3: Irrigation, floor washing, toilet flushing and clothes washing
In order to compare results with rainwater harvesting systems, the same set of scenarios
were considered for evaluating the performance of greywater recycling systems. The
first, consisted of baseline water end-use consumption from mean values collected
during fieldwork, and the second, consisted of evaluating the performance of greywater
recycling using reduced water end-use consumption values obtained from water
efficient strategies in the home (Table 6.6).
6.5.1 Building Adaptation
Typological characteristics of built form, built area, plot size and typical water and
waste pipe installations from the different representative models were used as a basis for

Evaluation of Domestic Water Conservation Measures
230
hypothetical configurations of greywater recycling systems for the high, mid-high, mid-
low and low income dwelling typologies.
Due to the fact that the greywater collection pipework must be segregated from
blackwater drainage pipes, this study analysed the typical wastewater plumbing
installations for the different building typologies in order to appraise the possibility of
adapting the existing plumbing system for greywater collection.
Three different types of bathroom wastewater drainage pipework configuration were
found. The first was composed by separate drainage systems, which contained distinct
greywater and blackwater discharge pipes which met at an inspection chamber located
outside the residential building. The other two were composed of combined wastewater
discharge pipework, either with an outdoor connection or an indoor connection of
greywater pipes with blackwater pipes prior an inspection chamber located outside the
residential building.
In house dwellings, both greywater and black water pipes are commonly located inside
floor slabs, therefore, it would be necessary to break part of the floor slab to have access
to the existing discharge pipework in order to adapt and install separate lines of
collection pipework. This operation would lead to the redecoration of bathroom floors
and would present some level of inconvenience to residents.
In flat dwellings, greywater and blackwater pipes are commonly located under the floor
slab; hence, the adaptation of the existing discharge pipework would have to be carried
out at a lower level, at a downstairs neighbour bathroom. Furthermore, multi-storey flat
buildings contain a single stack pipe for vertical drainage of bathroom wastewater, and
as a result, a new stack system would need to be installed to transport greywater to the
ground level. Although recently built multi-storey buildings contain installation shafts,
which could facilitate adaptation, a major refurbishment to existing installations would
still be necessary, which would result in a high level of inconvenience to residents.
Both separate bathroom wastewater drainage systems and outdoor connection discharge
systems, proved to be of simple adaptation to the existing bathroom wastewater service
from house dwellings for greywater collection from lavatories and showers. The
adaptation of both drainage systems could be carried outside the building, before the

Evaluation of Domestic Water Conservation Measures
231
pipes reach the inspection chamber. A diversion of the greywater to a new drainage line
destined solely for greywater collection would be necessary. Such approach would
require a low level refurbishment, with minor or no redecoration, hence, promoting little
inconvenience to residents.
In Brazil, utility areas in house dwellings are commonly located next to the kitchens;
hence it is likely to find a combined wastewater pipework with an outdoor connection
of laundry water with kitchen sink water prior an inspection chamber. In multi-storey
flat dwellings, kitchen and utility sometimes share the same space inside the home; even
though, most buildings contain two distinct stack systems to transport laundry water
separately from the kitchen sink water to ground level. Since wastewater from kitchen
sinks and dishwashers contain grease, oil and organic matter, a grease trap box at
ground level prior to an inspection chamber is used to avoid the clogging of the
drainage system. Similarly, wastewater from washing machines and utility laundry
basins contain an antifoam box at ground level before it reaches the inspection chamber.
Plumbing adaptation for both houses and multi-storey flat buildings would require
disconnecting laundry pipework from the kitchen pipework and divert the laundry water
to a new drainage line for greywater collection. Such plumbing adaptation was
considered a simple and effective approach, leading to little or no inconvenience to
residents.
Combined wastewater discharge pipework with indoor connection of greywater pipes to
blackwater pipes from bathrooms, proved to be an unviable option due to the high costs
involved in refurbishment for building adaptation as well as being inconvenient to
residents. Therefore, this investigation focused on a more realistic approach, through the
adaptation of the existing wastewater network through the diversion of greywater pipes
before they reach the inspection chamber at ground level, outside the home, resulting in
a low level of refurbishment and promoting little inconvenience to residents.
Only greywater from utility faucets and washing machines were considered as viable
sources of greywater supply for multi-storey flat buildings. Since bathroom greywater
and blackwater from multi-storey flat buildings commonly shared the same stack
system, greywater from bathroom faucets and shower heads were not considered as
viable sources of greywater for reuse. However, due to the fact that most multi-storey

Evaluation of Domestic Water Conservation Measures
232
flat buildings contained a separate stack system to transport laundry wastewater from
kitchen wastewater to ground level, the diversion of greywater pipes from utility faucets
and washing machines prior connection with kitchen wastewater or inspection chamber,
was considered a viable alternative given that this approach required little adaptation to
existing plumbing installation and rendered little inconvenience to residents.
It is important to highlight the fact that most multi-storey flat buildings contained in
average four individual stack systems to transport laundry greywater to the ground
level. Therefore, not all laundry greywater had to be used. The fact that a multi-storey
flat building contained four segregated stacks for laundry greywater, allowed the use of
the necessary number of stacks to provide enough volume of greywater supply for a
determined demand, reducing refurbishment costs for plumbing modifications at ground
level.
Greywater collection from butt systems for manual bucketing required no building
adaptation. Laundry greywater from washing machines could be fed directly to a 300
litre storage tank placed next to the appliance through the washing machines’ discharge
hose. Such system was considered ineffective for multi-storey flat dwellings, since
outdoor water consumption was for communal garden irrigation and floor washing.
Outdoor distribution for greywater reuse could be done independently from existing
pipes, either through the use of gravity-fed diversion systems for subsurface irrigation,
or directly fed for irrigation or floor washing through water pump. Similar to non-
potable rainwater harvesting systems, indoor greywater distribution consisted in
modifying the existing header pipework layout at loft level, using the existing vertical
distributing pipes that only feed non-potable end-uses to supply treated greywater to
high pressure flush valves, utility faucets and washing machines.
The application of greywater diversion systems required irrigation trenches for sub-
surface irrigation and were only feasible for high-income houses, since the average mid-
low and low income houses contained cemented yards and no vegetated garden.
Although multi-storey flat buildings contained communal gardens, the amount of
greywater produced by flat dwellings on a daily basis was considered excessive for
adequate ground seepage, and therefore was discarded from analysis.

Evaluation of Domestic Water Conservation Measures
233
6.5.2 Domestic Water Reductions
Domestic water reductions of the three different greywater demands described above
were estimated for the different dwelling typologies according to two scenarios: (i)
baseline water end-use consumption and (ii) reduced water end-use consumption. The
first, considered current domestic water end-use consumption, and the latter, considered
the possibility of achieving high water efficiency through the use of effective water
efficient strategies in combination with greywater recycling systems, resulting in a
reduced greywater supply and demand.
Daily greywater supply and demand for the baseline water end-use consumption
scenario were established for the different income typologies according to mean values
obtained from during water auditing. On the other hand, daily greywater supply and
demand for the reduced water end-use consumption scenario, were established
according to results previously obtained through the use of the most effective water
efficient strategies for the high, mid-high, mid-low and low income dwellings (Table
6.6).
Greywater supply for manual bucketing from greywater butt was established according
to the estimated daily average greywater generated from washing machines, while
greywater sources for diversion systems were estimated according to baseline water
demand. Considering the fact that the reduced water end-use consumption scenario
makes use of pressure washers and automatic surface irrigation systems, greywater butt
for manual bucketing and greywater diversion for sub-surface irrigation were not
conceived as adequate alternatives for such scenario.
As for greywater treatment systems, a balance between greywater demand and supply
was sought for the different types of reuse in the attempt to equalise the volume of
greywater available for treatment with the volume of greywater required to meet
demand. Tables 6.23 and 6.24 summarizes the daily volume of greywater generated to
supply different daily greywater demands per income building typology for both
baseline and reduced water end-use consumption scenarios.
The selection of greywater sources was carried out considering the level of
refurbishment required to adapt the existing building typology for greywater collection,
and treatment cost. This study focused on the application of commercially available

Evaluation of Domestic Water Conservation Measures
234
greywater treatment units. The greywater treatment units were selected according to the
volumes of greywater to be treated, since commercially available treatment units are
sold in pre-determined ranges of treatable greywater volume.
Overall, water savings for greywater recycling systems were estimated according to the
balance of greywater supply and demand. When greywater supply was greater than
demand, water savings was estimated according to the daily volume of greywater
demand. However, when greywater supply was insufficient to meet demand, water
savings was estimated according to the daily volume of greywater supply.

Evaluation of Domestic Water Conservation Measures
235
Table 6.23 Baseline water end-use consumption scenario for greywater demand and supply according to different types of reuse HIGH INCOME MID-HIGH INCOME MID-LOW INCOME LOW INCOME
Greywater Demand Reuse 1 Reuse 2 Reuse 3 Reuse 1 Reuse 2 Reuse 3 Reuse 1 Reuse 2 Reuse 3 Reuse 1 Reuse 2 Reuse 3
Toilet Flush (litre/day) --- 169 169 --- 7,504 7,504 --- 133 133 --- 94 94 Utility Faucet (litre/day) --- --- 92 --- --- 2,338 --- --- 70 --- --- 52 Washing Machine (litre/day) --- --- 138 --- --- 5,266 --- --- 123 --- --- 87 External Tap (litre/day) 236 236 236 524 524 524 53 53 53 43 43 43 TOTAL 236 405 635 524 8,028 15,632 53 186 378 43 137 276
Greywater Supply Reuse 1 Reuse 2 Reuse 3 Reuse 1 Reuse 2 Reuse 3 Reuse 1 Reuse 2 Reuse 3 Reuse 1 Reuse 2 Reuse 3
Bathroom Faucet (litre/day) --- 74 74 --- --- --- --- --- 51 --- --- 65 Shower Head (litre/day) --- 145 145 --- --- --- --- --- 164 --- --- 140 Utility Faucet (litre/day) 92 92 92 1,169 2,338 2,338 70 70 70 52 52 52 Washing Machine (litre/day) 138 138 138 2,633 5,266 10,531 123 123 123 87 87 87 TOTAL 230 449 449 3,802 7,604 12,869 192 192 408 139 139 344
Table 6.24 Reduced water end-use consumption scenario for greywater demand and supply according to different types of reuse
HIGH INCOME MID-HIGH INCOME MID-LOW INCOME LOW INCOME
Greywater Demand Reuse 1 Reuse 2 Reuse 3 Reuse 1 Reuse 2 Reuse 3 Reuse 1 Reuse 2 Reuse 3 Reuse 1 Reuse 2 Reuse 3
Toilet Flush (litre/day) --- 67 67 --- 3,152 3,152 --- 58 58 --- 45 45 Utility Faucet (litre/day) --- --- 77 --- --- 3,788 --- --- 65 --- --- 52 Washing Machine (litre/day) --- --- 74 --- --- 4,844 --- --- 60 --- --- 40 External Tap (litre/day) 55 55 55 123 123 123 33 33 33 29 29 29 TOTAL 55 123 274 123 3,275 11,907 33 91 216 29 74 166
Greywater Supply Reuse 1 Reuse 2 Reuse 3 Reuse 1 Reuse 2 Reuse 3 Reuse 1 Reuse 2 Reuse 3 Reuse 1 Reuse 2 Reuse 3
Bathroom Faucet (litre/day) --- 22 22 --- --- --- --- --- 15 --- --- 19 Shower Head (litre/day) --- 120 120 --- --- --- --- --- 142 --- --- 140 Utility Faucet (litre/day) 77 77 77 947 1,894 3,788 65 65 65 52 52 52 Washing Machine (litre/day) 74 74 74 1,211 2,422 4,844 60 60 60 40 40 40 TOTAL 151 293 293 2,158 4,316 8,632 125 125 283 92 92 252

Evaluation of Domestic Water Conservation Measures
236
Greywater collection could be carried out by adapting laundry and bathroom discharge
pipework. Selecting laundry discharge pipework for greywater supply consisted in
quantifying the average daily consumption from both utility faucet and washing
machine, and selecting bathroom greywater discharge for supply consisted in
considering the average daily consumption from bathroom faucets and shower heads.
In order to quantify greywater supply for residential multi-storey flat buildings, it was
important to consider the fact that not all laundry greywater stack systems would have
to be used. As seen in the previous section, multi-storey flat buildings commonly
comprise of four laundry greywater stack systems, and that plumbing adaptations could
be done at ground level. Therefore, in order to quantify greywater supply for multi-
storey flat buildings, the volume of greywater discharged per stack system was
considered in order to reduce refurbishment and costs with greywater treatment units.
Table 6.25 Annual domestic water savings promoted by greywater recycling systems
for different income typologies in baseline and reduced water end-use consumption
scenarios
Greywater Recycling System
Baseline Scenario Reduced Scenario
Water Savings (m
3/dw/yr)
WRI (%)
Water Savings (m
3/dw/yr)
WRI (%)
High Income Dwellings
Greywater Butt for Manual Bucketing 50 9.5 --- --- Greywater Diversion System 84 15.8 --- --- Greywater Reuse Toilet & Lavatory Unit 27 0.1 8 64.7 Greywater Treatment System - Reuse 1 84 15.8 20 67.0 Greywater Treatment System - Reuse 2 148 27.8 45 71.6 Greywater Treatment System - Reuse 3 164 30.8 107 83.3
Mid-High Income Dwellings
Greywater Reuse Toilet & Lavatory Unit 23 9.4 6 44.8 Greywater Treatment System - Reuse 1 3 1.1 1 42.5 Greywater Treatment System - Reuse 2 39 15.8 17 49.1 Greywater Treatment System - Reuse 3 65 26.7 60 67.0
Mid-Low Income Dwellings
Greywater Butt for Manual Bucketing 19 6.9 --- --- Greywater Reuse Toilet & Lavatory Unit 19 6.6 15 42.6 Greywater Treatment System - Reuse 1 19 6.9 12 41.5 Greywater Treatment System - Reuse 2 68 24.1 33 49.0 Greywater Treatment System - Reuse 3 149 52.9 103 73.9
Low Income Dwellings
Greywater Butt for Manual Bucketing 16 6.8 --- --- Greywater Reuse Toilet & Lavatory Unit 24 3.1 7 39.5 Greywater Treatment System - Reuse 1 16 6.8 11 41.1 Greywater Treatment System - Reuse 2 50 21.7 27 48.1 Greywater Treatment System - Reuse 3 126 54.2 92 76.2
Evaluation of Domestic Water Conservation Measures
237
Table 6.25 summarizes the results of annual water savings per dwelling of the varied
greywater recycling systems for the different income dwellings, and their water
reduction index (WRI) achieved according to baseline and reduced end-use
consumption scenarios. Similar to rainwater harvesting systems, higher annual water
saving figures were obtained for the baseline water end-use consumption scenario than
for the reduced water end-use consumption scenario. However, water reduction indexes
proved to be more effective when the greywater recycling systems were used in
combination with water efficient strategies. Overall, dealing with the same values of
baseline water demands, greywater butt for manual bucketing presented equivalent
figures of domestic water reductions as greywater treatment system for irrigation and
floor washing (Reuse 1).
Although the baseline scenario presented higher rates of water savings for high income
dwellings, ranging from 50m3/dw/yr, through the use of greywater butt for manual
bucketing, to 164m3/dw/yr, through the use of greywater treatment system for irrigation,
floor washing, toilet flushing and clothes washing (Reuse 3), the reduced scenario
presented higher water reduction indexes. The lowest water reduction index for the
reduced scenario (64.7%) was more than twice the highest estimated water reduction
index of the baseline water end-use consumption scenario (30.8%). Potentially,
domestic water reductions could reach up to 83.3%, through the combination of water
efficient strategies and the use of greywater recycling systems for irrigation, floor
washing, toilet flushing and clothes washing (Reuse 3).
Mid-high income flat dwellings presented the lowest rates of domestic water reductions
through the use of greywater treatment systems for communal outdoor water end-uses
(Reuse 1). The highest rates of domestic water savings for mid-high income flat
dwellings were obtained through the use of a greywater treatment system – Reuse 1, for
both baseline and reduced water end-use consumption scenario’s (65m3/dw/yr and
60m3/dw/yr, respectively).
Water savings for mid-low income house dwellings ranged from 12m3/dw/yr, using
greywater treatment system for a reduced outdoor (Reuse 1) water end-use consumption
scenario, to 149m3/dw/yr, using a greywater treatment system (Reuse 3) at a baseline
water end-use consumption scenario. The use of a greywater treatment system for floor
washing, toilet flushing and clothes washing (Reuse 3) in combination with water

Evaluation of Domestic Water Conservation Measures
238
efficient strategies, proved to be the most effective measure, with a water reduction
index of 73.9%.
Although baseline water end-use consumption scenario for low income dwellings
presented water reduction indexes ranging from 6.8% (16m3/dw/yr), with greywater
butt for manual bucketing and greywater treatment system – Reuse 1, to 54.2%
(126m3/dw/yr) using greywater treatment system – Reuse 3, the reduced water end-use
consumption scenario presented water reduction indexes ranging from 39.5%
(7m3/dw/yr) with the greywater reuse toilet and lavatory unit, to 76.2% (92m3/dw/yr)
using a greywater treatment system – Reuse 3, in combination with water efficient
strategies.
6.5.3 Cost-Benefit Analyses
The economic assessment of greywater recycling systems for high, mid-high, mid-low
and low income dwellings was carried out using simple payback period, life cycle cost-
benefit analysis and average incremental cost for baseline and reduced water end-use
consumption scenario’s (see Tables 6.26 to 6.33 for a summary of results). Appendix O
summarizes the estimated capital costs and operational costs used for the cost-benefit
analyses of greywater recycling systems.
Overall, the great majority of greywater recycling systems for both baseline and reduced
water consumption scenario’s presented a capital cost superior to resident’s willingness-
to-pay for water conservation measures. However, results showed that the capital cost of
a greywater butt for manual bucketing for baseline water end-use consumption was
lower than high income resident’s willingness-to-pay, indicating that resident’s would
invest in such system. Furthermore, such option contained a payback period much lower
than that expected from high income residents.
Greywater treatment system for garden irrigation and floor washing (Reuse 1) also
contained a lower capital cost than mid-high income resident’s willingness-to-pay.
Since the capital cost of greywater treatment system for irrigation, floor washing and
toilet flushing (Reuse 2) for baseline water end-use consumption was slightly higher
than mid-high income resident’s willingness-to-pay, it might also be considered as an
option flat resident’s would be willing to invest for financial benefits. However,
considering residents’ expectations regarding the payback period of an investment, only

Evaluation of Domestic Water Conservation Measures
239
the greywater treatment system – Reuse 2, might be considered if residents would be
willing to extend the period of investment return to an extra 5 months.
The financial benefits from greywater recycling systems during their useful life was
analysed for the different income dwellings. Considering the benefits gained during its
life cycle, greywater butt for manual bucketing proved to be a feasible option for high
(R$7,766.58), mid-low (R$1,713.53) and low (R$1,054.30) income dwellings.
Moreover, the payback period was of less than one year. The diversion of greywater for
sub-surface irrigation could only be applied to high income dwellings, leading to a
profit of R$7,845.50 during its useful life.
Greywater treatment systems proved to be the most effective greywater recycling
systems for mid-high income dwellings. While the greywater treatment system for
irrigation, floor washing and toilet flushing for both baseline (Reuse 2) resulted in a
financial return of R$2,549.45 during the system’s estimated life expectancy, with a
payback period of 2.4 years, greywater systems for irrigation, floor washing, toilet
flushing and clothes washing (Reuse 3) proved to be more feasible for the baseline
scenario (R$4,842.32) and a payback period of 1.4 year, than for the reduced scenario
(R$379.65), mainly due to the high costs involved in using both water efficient
strategies and greywater recycling systems in combination.
The average incremental cost for these feasible greywater recycling systems was
calculated within a timeframe of 30 years. Overall, the rates of financial return of
greywater butt for manual bucketing for baseline water end-use consumption were
equivalent to 5.15 R$/m3 for high income dwellings, 2.96 R$/m3 for mid-low income
dwellings and 2.24 R$/m3 for low income dwellings. While the rate of financial return
for the greywater treatment system – Reuse 2 for mid-high income dwellings was
equivalent to 2.20 R$/m3, rates of return for the greywater treatment systems for
irrigation, floor washing, toilet flushing and clothes washing, was equivalent to 2.47
R$/m3 (baseline scenario) and 0.21 R$/m3 (reduced scenario).

Evaluation of Domestic Water Conservation Measures
240
Table 6.26 Cost-benefit analyses of greywater recycling systems on a baseline water end-use scenario for high income dwellings
Water Effcient Strategies Water Savings
(m3/dw/yr)
Financial
Benefits (R$/dw/yr)
Capital Cost (R$/dw)
Operational
Cost (R$/dw/yr)
Simple
Payback (yr)
Average Life
Expectancy (yr)
LCCB (R$)
AIC (R$/m
3)
Greywater Butt for Manual Bucketing 50 401.08 94.70 0.00 0.2 30 7,766.58 5.15
Greywater Diversion System 84 670.07 5,288.13 0.00 7.9 30 7,845.50 3.11
Greywater Toilet & Lavatory Unit 27 214.63 84,000.00 360.00 31 23 -86,390.41 -107.59
Greywater Treatment System - Reuse 1 84 670.07 5,477.45 458.38 25.9 30 -2,712.77 -1.08
Greywater Treatment System - Reuse 2 148 1,178.25 21,257.80 910.95 80 30 -17,403.06 -3.93
Greywater Treatment System - Reuse 3 164 1,306.61 21,321.25 927.15 56 30 -15,268.14 -3.11
Table 6.27 Cost-benefit analyses of greywater recycling systems on a reduced water end-use scenario for high income dwellings
Water Effcient Strategies Water Savings
(m3/dw/yr)
Financial
Benefits (R$/dw/yr)
Capital Cost (R$/dw)
Operational
Cost (R$/dw/yr)
Simple
Payback (yr)
Average Life
Expectancy (yr)
LCCB (R$)
AIC (R$/m
3)
Greywater Toilet & Lavatory Unit 8 64.39 93,983.73 360.00 1,100 23 -98,844.64 -408.18
Greywater Treatment System - Reuse 1 20 161.47 15,461.18 508.38 * 30 --- ---
Greywater Treatment System - Reuse 2 45 357.93 31,241.53 910.95 * 30 --- ---
Greywater Treatment System - Reuse 3 107 854.42 31,304.98 927.15 * 30 --- --- * Operational costs overcome financial benefits.

Evaluation of Domestic Water Conservation Measures
241
Table 6.28 Cost-benefit analyses of greywater recycling systems on a baseline water end-use scenario for mid-high income dwellings
Water Effcient Strategies Water Savings
(m3/dw/yr)
Financial
Benefits (R$/dw/yr)
Capital Cost (R$/dw)
Operational
Cost (R$/dw/yr)
Simple
Payback (yr)
Average Life
Expectancy (yr)
LCCB (R$)
AIC (R$/m
3)
Greywater Toilet & Lavatory Unit 23 100.71 42,000.00 180.00 417.0 23 -62.59 -124.55
Greywater Treatment System - Reuse 1 2.7 11.68 265.67 7.91 70.6 30 -197.43 -2.48
Greywater Treatment System - Reuse 2 38.5 169.55 361.86 19.90 2.4 30 2,549.45 2.20
Greywater Treatment System - Reuse 3 65.2 286.96 370.30 19.90 1.4 30 4,842.32 2.47
Table 6.29 Cost-benefit analyses of greywater recycling systems on a reduced water end-use scenario for mid-high income dwellings
Water Effcient Strategies Water Savings
(m3/dw/yr)
Financial
Benefits (R$/dw/yr)
Capital Cost (R$/dw)
Operational
Cost (R$/dw/yr)
Simple
Payback (yr)
Average Life
Expectancy (yr)
LCCB (R$)
AIC (R$/m
3)
Greywater Toilet & Lavatory Unit 6 27.19 46,042.13 180.00 * 23 --- ---
Greywater Treatment System - Reuse 1 0.6 2.74 4,307.80 7.91 * 30 --- ---
Greywater Treatment System - Reuse 2 16.6 73.02 4,403.99 19.90 82.9 30 -3,384.66 -6.80
Greywater Treatment System - Reuse 3 60.4 265.51 4,412.43 19.90 18.0 30 379.65 0.21 * Operational costs overcome financial benefits.

Evaluation of Domestic Water Conservation Measures
242
Table 6.30 Cost-benefit analyses of greywater recycling systems on a baseline water end-use scenario for mid-low income dwellings
Water Efficient Strategies Water Savings
(m3/dw/yr)
Financial
Benefits (R$/dw/yr)
Capital Cost (R$/dw)
Operational
Cost (R$/dw/yr)
Simple
Payback (yr)
Average Life
Expectancy (yr)
LCCB (R$)
AIC (R$/m
3)
Greywater Butt for Manual Bucketing 19.3 92.25 94.70 0.00 1.0 30 1,713.53 2.96
Greywater Toilet & Lavatory Unit 18.6 89.11 42000.00 180.00 * 23 --- ---
Greywater Treatment System - Reuse 1 19.3 92.25 4,223.65 408.38 * 30 --- ---
Greywater Treatment System - Reuse 2 67.8 324.30 20,480.30 927.15 * 30 --- ---
Greywater Treatment System - Reuse 3 148.8 711.65 20,543.75 927.15 * 30 --- --- * Operational costs overcome financial benefits.
Table 6.31 Cost-benefit analyses of greywater recycling systems on a reduced water end-use scenario for mid-low income dwellings
Water Effcient Strategies Water Savings
(m3/dw/yr)
Financial
Benefits (R$/dw/yr)
Capital Cost (R$/dw)
Operational
Cost (R$/dw/yr)
Simple
Payback (yr)
Average Life
Expectancy (yr)
LCCB (R$)
AIC (R$/m
3)
Greywater Toilet & Lavatory Unit 15.3 73.24 47790.13 180.00 * --- --- ---
Greywater Treatment System - Reuse 1 12.1 57.66 10,013.78 408.38 * --- --- ---
Greywater Treatment System - Reuse 2 33.2 158.57 26,270.43 927.15 * --- --- ---
Greywater Treatment System - Reuse 3 103.3 493.92 26,333.88 927.15 * --- --- --- * Operational costs overcome financial benefits.

Evaluation of Domestic Water Conservation Measures
243
Table 6.32 Cost-benefit analyses of greywater recycling systems on a baseline water end-use scenario for low income dwellings
Water Efficient Strategies Water Savings
(m3/dw/yr)
Financial
Benefits (R$/dw/yr)
Capital Cost (R$/dw)
Operational
Cost (R$/dw/yr)
Simple
Payback (yr)
Average Life
Expectancy (yr)
LCCB (R$)
AIC (R$/m
3)
Greywater Butt for Manual Bucketing 15.7 58.62 94.70 0.00 1.6 30 1,054.30 2.24
Greywater Toilet & Lavatory Unit 23.6 88.06 28,000.00 120.00 * 23 --- ---
Greywater Treatment System - Reuse 1 15.7 58.62 3,764.55 788.69 * 30 --- ---
Greywater Treatment System - Reuse 2 50.2 187.40 19,743.65 892.87 * 30 --- ---
Greywater Treatment System - Reuse 3 125.5 468.86 19,808.00 897.33 * 30 --- --- * Operational costs overcome financial benefits.
Table 6.33 Cost-benefit analyses of greywater recycling systems on a reduced water end-use scenario for low income dwellings
Water Effcient Strategies Water Savings
(m3/dw/yr)
Financial
Benefits (R$/dw/yr)
Capital Cost (R$/dw)
Operational
Cost (R$/dw/yr)
Simple
Payback (yr)
Average Life
Expectancy (yr)
LCCB (R$)
AIC (R$/m
3)
Greywater Toilet & Lavatory Unit 7.1 26.42 32550.96 120.00 * 30 --- ---
Greywater Treatment System - Reuse 1 10.6 39.52 8,315.51 788.69 * 30 --- ---
Greywater Treatment System - Reuse 2 27.0 100.85 24,294.61 892.87 * 30 --- ---
Greywater Treatment System - Reuse 3 92.0 343.50 24,358.96 897.33 * 30 --- --- * Operational costs overcome financial benefits.

Evaluation of Domestic Water Conservation Measures
244
6.6 Wastewater Reclamation Systems
The same representative models composed to evaluate rainwater harvesting and
greywater recycling systems, were used to evaluate the viability of wastewater
reclamation systems in terms of their applicability, domestic water reductions and cost-
benefits. As previously seen in Chapter 4, two different types of treated wastewater
demands were derived for analysis:
• Reuse 1: Irrigation and floor washing
• Reuse 2: Irrigation, floor washing and toilet flushing
Both baseline water end-use consumption and reduced water consumption scenarios
were used as a basis for evaluating the performance of wastewater reclamation system
individually, or in combination with water efficient strategies in the home. For baseline
and reduced water end-use consumption scenarios, wastewater demand and supply was
carried out according to Table 6.6.
To avoid risks related with water reuse quality standards, this study focused on the use
of commercially available wastewater reclamation units. Hence, wastewater treatment
units were selected according to the volumes of wastewater to be treated, since
commercially available treatment units are sold in pre-determined ranges of treatable
wastewater volume.
6.6.1 Building Adaptation
The same typological characteristics of built form, built area, plot size and typical water
and waste pipe installations from the different representative models were used as a
basis for a hypothetical configuration of wastewater reclamation systems for the high,
mid-high, mid-low and low income dwelling typologies.
Wastewater collection for both houses and multi-storey buildings would require little
refurbishment to their existing wastewater discharge network, due to the fact that
wastewater reclamation systems make use of both greywater and black water for
biological treatment. The installation of the wastewater reclamation unit would be
carried out at ground level, using the existing wastewater drainage system, collecting
the building’s wastewater before it reached the authority sewer collection system. Such

Evaluation of Domestic Water Conservation Measures
245
plumbing adaptation was considered simple and effective, with little or no
inconvenience to residents.
After receiving an adequate level of treatment for reuse, outdoor distribution of
reclaimed wastewater for irrigation and floor washing could be carried out
independently from the existing pipework through the use of a water pump. Similarly to
both non-potable rainwater harvesting system and greywater recycling system, indoor
distribution of reclaimed wastewater would require modifications to the existing header
pipework layout at loft level, using existing vertical distributing pipes which feed high
pressure flush valves.
6.6.2 Domestic Water Reductions
Water savings for wastewater reclamation systems were determined according to the
volume of daily reclaimed wastewater demand. Table 6.34 presents the domestic water
reductions promoted by the wastewater reclamation systems for the different income
typologies in baseline and reduced water end-use consumption scenarios.
Table 6.34 Domestic water reductions promoted by wastewater reclamation systems for
different income typologies in baseline and reduced water end-use consumption
scenarios
Wastewater Reclamation System
Baseline Scenario Reduced Scenario
Water Savings (m
3/dw/yr)
WRI (%)
Water Savings (m
3/dw/yr)
WRI (%)
High Income Dwellings
Wastewater Treatment System - Reuse 1 86 16.2 20 67.0 Wastewater Treatment System - Reuse 2 148 27.8 45 71.6
Mid-High Income Dwellings
Wastewater Treatment System - Reuse 1 3 1.1 0.6 42.9 Wastewater Treatment System - Reuse 2 41 16.7 17 58.9
Mid-Low Income Dwellings
Wastewater Treatment System - Reuse 1 19 6.9 12 41.5 Wastewater Treatment System - Reuse 2 68 24.1 33 49.0
Low Income Dwellings
Wastewater Treatment System - Reuse 1 16 6.8 11 41.1 Wastewater Treatment System - Reuse 2 50 21.7 27 48.1
As expected, higher levels of domestic water reductions were obtained by using
wastewater treatment systems for irrigation, floor washing and toilet flushing (Reuse 2),
than for irrigation and floor washing (Reuse 1). Similar to both rainwater harvesting
systems and greywater recycling systems, water savings were higher for the baseline

Evaluation of Domestic Water Conservation Measures
246
scenario; however, the reduced water end-use scenario presented higher figures of water
reduction index when wastewater reclamation systems were used in combination with
water efficient strategies.
The highest water reduction index obtained for high income dwellings was 71.6%
through the use of wastewater treatment system – Reuse 2, in combination with water
efficient strategies, and the lowest, was equivalent to 16.2% the use of wastewater
treatment system for baseline water end-use consumption.
Mid-high income dwellings presented the lowest water reduction indexes for both
wastewater treatment systems (1.1% and 16.7%) at the baseline water end-use
consumption scenario. At a reduced water end-use scenario, water reductions reached to
maximum 58.9%.
Mid-low income dwellings presented water reduction indexes ranging from 6.9% using
a wastewater treatment system for outdoor baseline water end-use consumption, to
49.0%, through the application of wastewater treatment systems for both reduced
outdoor end-uses and toilet flushing.
The lowest water reduction indexes for low income dwellings were equivalent to 6.8%
through the use of wastewater treatment systems for floor washing (Reuse 1) and 21.1%
using a wastewater treatment system for floor washing and toilet flushing, at baseline
level. The highest water reduction indexes were registered using wastewater treatment
systems in a reduced water end-use consumption scenario for floor washing only
(41.1%), and both floor washing and toilet flushing (48.1%).
6.6.3 Cost-Benefit Analyses
Simple payback period, life cycle cost-benefit analysis and average incremental cost
methods of financial evaluation were used to assess the feasibility of wastewater
reclamation systems using both baseline and reduced water consumption scenario’s for
high, mid-high, mid-low and low income dwellings (see Tables 6.35 to 6.42 for a
summary of results). Appendix P summarizes the estimated capital costs and
operational costs used for the cost-benefit analyses of wastewater reclamation systems.

Evaluation of Domestic Water Conservation Measures
247
On the whole, capital costs of wastewater reclamation systems for both baseline and
reduced water consumption scenario’s were greater than resident’s willingness-to-pay.
However, wastewater treatment system for garden irrigation and floor washing (Reuse
1) have a lower capital cost than mid-high income resident’s willingness-to-pay. Since
the capital cost of greywater treatment system for irrigation, floor washing and toilet
flushing (Reuse 2) for baseline water end-use consumption was slightly higher than
mid-high income resident’s willingness-to-pay, it might also be considered as an option
flat resident’s would be willing to invest for financial benefits. However, considering
residents’ expectations regarding the payback period of an investment, only the
greywater treatment system – Reuse 2, might be considered if residents would be
willing to extend the period of investment return to an extra 5 months.
The payback analysis shows that only the wastewater treatment system (reuse 2) on
base line scenario for the mid-high income is a viable option. For the other options it
has shown that operational costs were higher than the financial benefits.
The financial benefits during a wastewater reclamation system’s life expectancy was
evaluated for the different income dwellings using both baseline and reduced water end-
use consumption scenarios. Overall, the lifecycle analysis has shown that only the
wastewater treatment system for irrigation, floor washing and toilet flushing on a
baseline water end-use consumption scenario was considered to be a feasible option for
mid-high income dwellings, providing a financial return of R$2,716.31. Using a time
horizon of 30 years, the average incremental cost of such wastewater reclamation
system was equivalent to R$2.22 per cubic meter of water saved.

Evaluation of Domestic Water Conservation Measures
248
Table 6.35 Cost-benefit analyses of wastewater reclamation systems on a baseline water end-use scenario for high income dwellings
Water Effcient Strategies Water Savings
(m3/dw/yr)
Financial
Benefits (R$/dw/yr)
Capital Cost (R$/dw)
Operational
Cost (R$/dw/yr)
Simple
Payback (yr)
Average Life
Expectancy (yr)
LCCB (R$)
AIC (R$/m
3)
Wastewater Treatment System - Reuse 1 86 687.12 20,343.75 508.38 113.8 30 -26,824.07 -10.38
Wastewater Treatment System - Reuse 2 148 1,178.25 22,487.60 508.38 33.6 30 -19,341.53 -4.36
Table 6.36 Cost-benefit analyses of wastewater reclamation systems on a reduced water end-use scenario for high income dwellings
Water Effcient Strategies Water Savings
(m3/dw/yr)
Financial
Benefits (R$/dw/yr)
Capital Cost (R$/dw)
Operational
Cost (R$/dw/yr)
Simple
Payback (yr)
Average Life
Expectancy (yr)
LCCB (R$)
AIC (R$/m
3)
Wastewater Treatment System - Reuse 1 20 161.47 30,327.48 508.38 * 30 --- ---
Wastewater Treatment System - Reuse 2 45 357.93 32,471.33 508.38 * 30 --- --- * Operational costs overcome financial benefits.
Table 6.37 Cost-benefit analyses of wastewater reclamation systems on a baseline water end-use scenario for mid-high income dwellings
Water Effcient Strategies Water Savings
(m3/dw/yr)
Financial
Benefits (R$/dw/yr)
Capital Cost (R$/dw)
Operational
Cost (R$/dw/yr)
Simple
Payback (yr)
Average Life
Expectancy (yr)
LCCB (R$)
AIC (R$/m
3)
Wastewater Treatment System - Reuse 1 2.7 11.68 272.15 12.42 * 30 --- ---
Wastewater Treatment System - Reuse 2 40.7 179.01 312.33 23.37 2.0 30 2,716.31 2.22 * Operational costs overcome financial benefits.

Evaluation of Domestic Water Conservation Measures
249
Table 6.38 Cost-benefit analyses of wastewater reclamation systems on a reduced water end-use scenario for mid-high income dwellings
Water Effcient Strategies Water Savings
(m3/dw/yr)
Financial
Benefits (R$/dw/yr)
Capital Cost (R$/dw)
Operational
Cost (R$/dw/yr)
Simple
Payback (yr)
Average Life
Expectancy (yr)
LCCB (R$)
AIC (R$/m
3)
Wastewater Treatment System - Reuse 1 0.6 4.98 4,314.28 12.42 * 30 --- ---
Wastewater Treatment System - Reuse 2 16.6 132.43 4,354.46 23.37 39.9 30 -2,238.79 -4.50 * Operational costs overcome financial benefits.
Table 6.39 Cost-benefit analyses of wastewater reclamation systems on a baseline water end-use scenario for mid-low income dwellings
Water Effcient Strategies Water Savings
(m3/dw/yr)
Financial
Benefits (R$/dw/yr)
Capital Cost (R$/dw)
Operational
Cost (R$/dw/yr)
Simple
Payback (yr)
Average Life
Expectancy (yr)
LCCB (R$)
AIC (R$/m
3)
Wastewater Treatment System - Reuse 1 19 92.25 20,343.75 927.15 * --- --- ---
Wastewater Treatment System - Reuse 2 68 324.30 22,487.60 927.15 * --- --- --- * Operational costs overcome financial benefits.
Table 6.40 Cost-benefit analyses of wastewater reclamation systems on a reduced water end-use scenario for mid-low income dwellings
Water Effcient Strategies Water Savings
(m3/dw/yr)
Financial
Benefits (R$/dw/yr)
Capital Cost (R$/dw)
Operational
Cost (R$/dw/yr)
Simple
Payback (yr)
Average Life
Expectancy (yr)
LCCB (R$)
AIC (R$/m
3)
Wastewater Treatment System - Reuse 1 12 57.66 26,133.88 927.15 * --- --- ---
Wastewater Treatment System - Reuse 2 33 158.57 28,277.73 927.15 * --- --- --- * Operational costs overcome financial benefits.

Evaluation of Domestic Water Conservation Measures
250
Table 6.41 Cost-benefit analyses of wastewater reclamation systems on a baseline water end-use scenario for low income dwellings
Water Effcient Strategies Water Savings
(m3/dw/yr)
Financial
Benefits (R$/dw/yr)
Capital Cost (R$/dw)
Operational
Cost (R$/dw/yr)
Simple
Payback (yr)
Average Life
Expectancy (yr)
LCCB (R$)
AIC (R$/m
3)
Wastewater Treatment System - Reuse 1 16 58.62 20,343.75 892.87 * 30 --- ---
Wastewater Treatment System - Reuse 2 50 187.40 22,487.60 892.87 * 30 --- --- * Operational costs overcome financial benefits.
Table 6.42 Cost-benefit analyses of wastewater reclamation systems on a reduced water end-use scenario for low income dwellings
Water Effcient Strategies Water Savings
(m3/dw/yr)
Financial
Benefits (R$/dw/yr)
Capital Cost (R$/dw)
Operational
Cost (R$/dw/yr)
Simple
Payback (yr)
Average Life
Expectancy (yr)
LCCB (R$)
AIC (R$/m
3)
Wastewater Treatment System - Reuse 1 11 39.52 24,894.71 892.87 * 30 --- ---
Wastewater Treatment System - Reuse 2 27 100.85 27,038.56 892.87 * 30 --- --- * Operational costs overcome financial benefits.

Evaluation of Domestic Water Conservation Measures
251
6.7 Summary and Conclusions
In order to identify feasible water conservation measures in terms of their applicability,
water savings and financial benefits for the different income ranges and residential
typologies of the Federal District, four representative models were composed according
to the average values of the primary data for public opinion, awareness and acceptance
of water conservation strategies, water end-use consumption and dwelling
characteristics.
These models were used as a basis for evaluating the applicability of water conservation
measures according to public opinion, awareness and acceptance, and building
adaptation. Overall, respondents indicated that they are aware of the existence of water
conservation measures, and that they would be willing to retrofit their homes to reduce
their water consumption. However, results demonstrated that public willingness-to-pay
was low, and the great majority of respondents expected a low payback period for their
investment. Each representative model was also used in the hypothetical configuration
of water efficient equipment and water reuse systems, thus aiding in the estimation the
capital costs and operational costs of each water conservation measure.
Overall, dwelling retrofit for water efficient equipments proved to be of simple
installation, requiring little or no refurbishment for their application. Water reuse
systems on the other hand, required some level of building adaptation. Although the
distribution of treated water for non-potable outdoor end-uses was of simple
refurbishment, the distribution of treated water for indoor end-uses required a higher
level of refurbishment via header pipework adaptation on buildings with single vertical
distribution pipes that solely feed non-potable end-uses. Apart from residential flat
buildings, rainwater harvesting systems required the installation of a rainwater
collection and drainage network for building adaptation. Greywater recycling systems
on the other hand, required a distinct collection pipework. While greywater butts for
manual bucketing and the greywater reuse toilet & lavatory units required no
refurbishment, the application of greywater diversion systems required irrigation
trenches for sub-surface irrigation. Wastewater collection for both houses and multi-
storey buildings would require little refurbishment to their existing wastewater

Evaluation of Domestic Water Conservation Measures
252
discharge network, since wastewater reclamation systems treat both greywater and
black water for reuse.
Domestic water reductions were estimated for every water conservation measure.
Overall, water reuse systems were capable of promoting higher water reductions than
water efficient strategies. The upper limit of achievable water reductions through the
use of the most effective water efficient strategies was verified, and with this, a reduced
water end-use consumption scenario was created, considering the possibility of using
effective water efficient strategies in combination with water reuse systems. As
expected, higher domestic water reductions were achieved through the use of water
reuse systems in combination with water efficient strategies.
The financial benefit promoted by each water conservation measure was evaluated
using simple payback period, life cycle cost-benefit analysis and average incremental
costs. Results indicated that simple, low budget water conservation measures were
capable of achieving the highest rate of financial benefit per volume of water saved.
Table 6.43 on the next page provides an overview of the feasible water conservation
measures for the different income ranges. Domestic water efficiency proved to be the
most viable solution for reducing water consumption, independent of the income level
and building typology. On one hand, simple, small scale water reuse systems proved to
be feasible options for investment on house dwellings – especially greywater butt for
manual bucketing. On the other hand, the use of greywater and wastewater treatment
systems proved to be feasible options for densely populated multi-storey buildings.

Evaluation of Domestic Water Conservation Measures
253
Table 6.43 Feasible water conservation measures for the different income ranges
Water Conservation Measures
HI MHI MLI LI
WRI AIC WRI AIC WRI AIC WRI AIC
(%) (R$/m3) (%) (R$/m
3) (%) (R$/m
3) (%) (R$/m
3)
Water Efficient Fittings, Fixtures and Appliances
Bathroom Faucet Flow Regulator 3.2 4.74 6.9 2.69 4.3 2.24 6.4 1.78
Low-Flush Toilet (6 lpf) 3.9 4.47 5.2 1.68 5.7 2.15 5.0 1.61
Dual Flush Toilet (3/6 lpf) 6.9 3.71 9.0 0.37 9.7 1.61 7.8 1.03
Kitchen Sensor Faucet 3.8 3.24 6.1 0.20 7.5 1.89 7.0 1.23
Kitchen Faucet Flow Regulator 2.9 5.13 4.1 2.75 6.3 2.35 6.7 1.83
Utility Faucet Flow Regulator 1.1 4.99 1.8 2.60 0.6 1.99 --- ---
High-Efficiency Washing Machine --- --- --- --- 36.5 0.65 33.1 0.11
Automatic Shut-off Hose Nozzle 1.2 3.42 --- --- 0.5 0.30 0.5 0.04
Pressure Washer 10.4 3.86 0.7 2.87 --- --- --- ---
Automatic Irrigation Sprinkler System --- --- 0.1 0.57 --- --- --- ---
Leakage Repair 7.4 5.13 --- --- 0.3 1.30 4.1 2.30
Rainwater Harvesting Systems for Baseline Consumption
1m3 Rainwater Cistern - Reuse 1 11.0 2.91 0.7 1.11 --- --- --- ---
5m3 Rainwater Cistern - Reuse 1 11.8 0.82 0.8 0.48 --- --- --- ---
10m3 Rainwater Cistern - Reuse 1 12.7 0.84 0.8 0.52 --- --- --- ---
15m3 Rainwater Cistern - Reuse 1 --- --- 0.9 0.10 --- --- --- ---
5m3 Rainwater Cistern - Reuse 2 19.4 0.16 --- --- --- --- --- ---
10m3 Rainwater Cistern - Reuse 2 20.3 0.32 --- --- --- --- --- ---
10m3 Rainwater Cistern - Reuse 3 30.6 2.49 --- --- --- --- --- ---
20m3 Rainwater Cistern - Reuse 3 32.5 1.54 --- --- --- --- --- ---
30m3 Rainwater Cistern - Reuse 3 34.4 1.13 --- --- --- --- --- ---
40m3 Rainwater Cistern - Reuse 3 36.2 0.52 --- --- --- --- --- ---
Greywater Recycling Systems for Baseline Consumption
300L Greywater Butt for Manual Bucketing 9.5 5.15 --- --- 6.9 2.96 6.8 2.24
Greywater Diversion for Subsurface Irrigation 15.8 3.11 --- --- --- --- --- ---
Greywater Recycling Systems for Reduced Consumption
Greywater Treatment System - Reuse 3 --- --- 67.0 0.21 --- --- --- ---
Wastewater Reclamation Systems for Reduced Consumption
Wastewater Treatment System - Reuse 2 --- --- 16.7 2.22 --- --- --- ---

Chapter 7 Conclusions and Recommendations

Conclusions and Recommendations
255
7. Conclusions and Recommendations
7.1 Introduction
This research arose from the need to reduce domestic water consumption in the Federal
District in a viable and cost-effective manner, so as to avoid water stress and promote
sustainable development through water demand management. Little is known about the
feasibility of domestic water conservation measures for Federal District and for Brazil.
Moreover, there is no information on domestic water consumption of dwellings from
different income groups and residential typologies in the Federal District to adequately
assess the feasibility of these water conservation measures. Therefore, the overall aim of
this thesis was to provide specific information regarding domestic water consumption
and assess the feasibility of domestic water conservation measures for the Federal
District’s dwellings of different incomes and residential typologies.
This chapter presents the findings of the research and its main arguments and
conclusions. Next, it outlines the main contributions to knowledge, looks into the
limitations of the research, and lastly, it provides some recommendations for further
work and some implications of the findings.
7.2 Domestic water consumption
This research uses both quantitative and qualitative methodological approaches to
collect primary data on domestic water consumption. The first, involved a face-to-face
questionnaire survey that gathered data on dwelling characteristics over a stratified
random sample size of 481 dwellings. The second, involved an in-depth analysis of
domestic water end-use consumption using a questionnaire designed to understand
resident’s water-consuming habits and, through a water auditing technique, it measures
domestic water end-use consumption for another 117 dwellings.
The basic hypothesis is that variables such as household income, dwelling typology and
occupant behaviour affects the way water is used. Primary data on annual, monthly,
weekly and daily baseline water consumption indicators was collected for high, mid-
high, mid-low and low income dwellings. Overall, results suggest that there is a positive
relationship between household income and domestic per capita water consumption,

Conclusions and Recommendations
256
where, the higher the income level, the higher the rate of per capita water consumption.
High income dwellings presented significantly higher per capita water consumption
when compared to the lower income ranges, suggesting that such outstanding difference
in consumption is caused by social inequality.
Even though every individual dwelling presents unique patterns of domestic water end-
use consumption, results obtained by water auditing are similar to previous studies
carried out in developing countries. Overall, showerheads, washing machines, toilet
flushes and kitchen faucets had the highest rates of indoor water end-use consumption.
Outdoor water end-use consumption for garden irrigation and floor washing represented
13% of total domestic water consumption, mostly from external taps.
Monthly precipitation and relative humidity were cross-referenced with the average
values of monthly water consumption gathered from historic billing data of the studied
dwellings. It was observed that low levels of precipitation and relative humidity caused
an increase in water consumption. However, seasonal variations in domestic water
consumption were mostly limited to high income dwellings, whose typological
characteristics included a large vegetated garden area.
Residential characteristics such as built type, built area, roof area, garden/yard size,
swimming pools and water fixtures and appliances in the homes were obtained from
both quantitative and qualitative questionnaires. Distinct dwelling characteristics and
typological composition per administrative region of the Federal District could be
found. This research found that the typological composition of dwellings was directly
related to income, where, the higher the income, the bigger the built area, veranda,
garden/yard, quantity and quality of fixtures and appliances, and presence of swimming
pools.
Results suggest that the typological composition of dwellings can influence the way
water is used by residents. For example, high income dwellings contained extra
bathroom fixtures, kitchen faucets and external taps. The wider the range of water
facilities available, the more opportunities residents have to use water. Furthermore,
larger gardens, verandas and the presence of swimming pools, lead to greater outdoor
water consumption.

Conclusions and Recommendations
257
Key elements of water usage were assessed through an in-depth analysis of water-
consuming activities in 117 homes to point out behavioural trends of water consumption
according to dwelling income and built type.
Results show that behavioural patterns of domestic water usage can also be affected by
the typological composition of dwellings in the Federal District and in Brazil; it is a
common habit to wash external grounds of homes such as verandas, yards and
pavements on a regular basis. Findings also suggest that it is a common practice for
Brazilian residents to wash their dishes by hands, controlling the faucet with running
water while washing and rinsing the dishes. No residents washed their dishes using a
plugged sink, which is a common practice in other countries. Such behavioural
differences might be linked to cultural values, custom and tradition, affecting the way
water is used.
This study has shown that domestic water consumption increases proportionally to the
increase in household income and that it a function of income, cost of water, household
size and typological characteristics of built area.
The correlation analysis shows that in one hand, indoor water consumption has a strong
relationship with built area, income, household size and the cost of water. On the other
hand, outdoor water consumption presented a strong relationship with garden/yard area,
income and cost of water. Through multiple regressions, indoor and outdoor water
consumption functions were estimated for the Federal District. Estimated water demand
functions have shown a strong relationship between water consumption and household
income, built area and number of residents.
Since the results show that demand for water is inelastic to its price, public perception
over the cost of water was analysed. Although the great majority of respondents believe
current tariff rates are high, observed water-consuming behaviour indicated otherwise. It
seems that resident’s opinion over cost of water is insufficient to modify their
behaviour.

Conclusions and Recommendations
258
The research has found that most of the water-saving attitudes that have already been
taken by residents were carried out through behavioural changes of water-consuming
habits. The great majority of respondents are rightful owners of their homes, and most
of them are willing to invest on water-saving equipments, such as efficient water
fittings, fixtures and appliances or water reuse systems, for their homes to obtain both
financial and environmental benefits.
Low-budget rainwater and greywater reuse schemes was commonly used by mid-low
and low income dwellings for irrigation and floor washing, suggesting that due to their
income, these households searched for alternative ways to reduce their water bills
through reuse. Our results suggest that the lower the household income, the lower mains
water consumption is, and the higher the usage of alternative sources of water supply
such as untreated rainwater and greywater.
One of the main conclusions drawn from this study is that variables of dwelling
characteristics, income and occupant behaviour are directly related and affect both
indoor and outdoor water consumption patterns, and therefore, should be considered for
adequate water demand predictions, reuse system design dimensioning and quantifying
potential water-savings from conservation measures.
7.3 Evaluation of domestic water conservation measures
Based on the primary data collected on public opinion, awareness and acceptance of
water conservation strategies, water end-use consumption and dwelling characteristics,
the study identifies feasible water conservation measures in terms of their applicability,
water savings and financial benefits for the different income ranges and residential
typologies of the Federal District.
The applicability of both demand-side and supply-side water conservation measures
were evaluated according to: (i) public opinion, awareness and acceptance, and (ii)
building adaptation.
Most respondents are aware of the existence of water efficient equipments and water
reuse systems, and would be willing to adapt their dwellings to reduce water

Conclusions and Recommendations
259
consumption. However, their willingness-to-pay is low, and the great majority of
residents expect to obtain fast financial benefits from their investments on water-saving
products.
The representative models, composed according to typological characteristics such as
built form, built area and typical plumbing installations for the different income
dwellings, were used as a basis for hypothetical configurations of water efficient
equipments and water reuse systems. Furthermore, these hypothetical configurations
were used to estimate capital costs and operational costs of every water conservation
measure.
Overall, water efficient equipments are of simple installation, rendering in little or no
refurbishment of existing dwellings for building adaptation. Apart from manual
bucketing of untreated greywater, the applicability of water reuse systems require some
level of refurbishment for building adaptation, dependent upon the type of system to be
applied and its expected non-potable end-uses.
Water reuse systems for non-potable outdoor water end-uses were found to be easily
adaptable to existing dwellings, and require lower levels of refurbishment than non-
potable indoor end-uses. Considering Federal District’s typical indirectly-fed mains
water supply system, a simple and effective way to adapt existing dwellings for non-
potable indoor water reuse was derived by modifying existing header pipework layout
at building loft level and using existing vertical distributing pipes destined to feed non-
potable end-uses, only.
Domestic water reductions were estimated for a range of water efficient strategies for
each income dwelling typology. The most effective water efficient strategy for high
income dwelling typologies was the pressure washer followed by leakage repair. The
use of high-efficiency washing machines and dual flush toilets proved to be the most
effective water efficient strategies for the mid-high, mid-low and low income dwelling
typologies.
The upper limit of achievable water reductions through the use of the most effective
water efficient strategies was verified for each income dwelling typology. With this, two

Conclusions and Recommendations
260
scenarios were used to estimate water reductions from water reuse systems: (i) baseline
water end-use consumption and (ii) reduced water end-use consumption. The first
considered current domestic water end-use consumption to estimate water savings. The
second, considered the use of effective water efficient strategies in combination with
water reuse systems, resulting in a reduced water demand.
In order to estimate domestic water reductions for rainwater harvesting systems, three
types of rainwater demands were considered for analysis:
• Reuse 1: Irrigation and floor washing
• Reuse 2: Irrigation, floor washing and toilet flushing
• Reuse 3: Irrigation, floor washing, toilet flushing and clothes washing
Potential water reductions were estimated for a range of rainwater cistern storage
volumes. Overall, results indicated that higher water savings were obtained in the
baseline water end-use consumption scenario than for the reduced scenario when using
the same rainwater storage volumes. It was observed that annual water savings rose
proportionally to increase in storage volume, however, reductions stagnated once the
rainwater harvesting system achieved its ideal storage capacity. On the whole, houses
contained the necessary roof area to collect enough rainwater to supply demand
throughout the year. However, multi-storey flat buildings contained insufficient roof
area to collect enough rainwater to supply and its demand.
Domestic water reductions for four different types of greywater systems were estimated.
The first consisted in the manual bucketing of stored laundry greywater in a water butt.
The second, considered a gravity-fed greywater diversion system for sub-surface
irrigation. The third, in a state-of-the-art greywater reuse toilet and lavatory appliance
unit and the fourth, of commercially available greywater treatment units for reuse 1,
reuse 2 and reuse 3 of greywater demand.
Greywater treatment systems for irrigation, floor washing, toilet flushing and clothes
washing provided the highest rates of water reductions. On the other hand, greywater
reuse toilet and lavatory unit presented extremely low levels of water savings. While the
use of greywater butt for manual bucketing is limited to house dwellings, greywater

Conclusions and Recommendations
261
diversion systems were only possible in high income dwelling typologies which
contained sufficient vegetated garden areas.
Potential domestic water reductions from wastewater reclamation systems, two types of
wastewater demands were considered according to manufacturers’ recommendations,
reuse 1 and reuse 2.
Potential water reductions promoted by wastewater reclamation systems were similar to
those from greywater recycling, suggesting that both reuse systems were capable of
providing reclaimed water to fully supply non-potable end-uses.
Higher domestic water reductions were achieved through the combination of water
efficient strategies and water reuse systems. Overall, greywater recycling system for
irrigation, floor washing, toilet flushing, and clothes washing had the highest levels of
water reductions: 83% on high income dwelling typologies, 67% on mid-high income
dwelling typologies, 74% on mid-low income dwelling typologies and 76.2% on low
income dwelling typologies.
An economic assessment for the different water conservation measures was carried out
using simple payback period, life cycle cost-benefit analysis and average incremental
cost in order to identify economically viable options for the different income dwelling
typologies. The feasibility of the water conservation measures was evaluated according
resident willingness-to-pay and in general, findings suggest that simple, low budget
water conservation measures are capable of achieving the highest financial benefits per
volume of water saved.
Results from the economic assessment for water efficient strategies have shown that,
with very little investment, the use of flow regulators in faucets can provide dwellings
with significant financial benefits. Other economically viable water efficient strategies
include leakage repair, low-flush toilets, dual flush toilets, kitchen sensor faucets, high
efficiency washing machines, automatic shut-off hose nozzles, pressure washers, and
automatic irrigation sprinkler system (for mid-high income dwelling typologies only).

Conclusions and Recommendations
262
Results from the cost-benefit analyses suggest that the use of water reuse systems in
combination with water efficient strategies are economically viable solutions only for
dwellings with high consumption rates.
Economically viable water reuse systems for high income dwellings included rainwater
harvesting systems for reuse 1, reuse2 and reuse 3, greywater butt for manual bucketing
and greywater diversion system on baseline water consumption scenario. On the other
hand, economically viable water reuse systems for mid-high income dwelling
typologies included rainwater harvesting systems for reuse 1, greywater treatment
systems for Reuse 2 and Reuse 3 and wastewater treatment system for Reuse 2 on a
baseline consumption scenario. Economically viable water reuse systems for both mid-
low and low income dwelling typologies were limited to greywater butt for manual
bucketing only.
Another main conclusion derived of this study is that although water reuse systems are
capable of promoting higher water savings than water efficient strategies, water efficient
strategies proved to be the most feasible water conservation measures in terms of
applicability and financial benefits, independent of income level and dwelling typology.
7.4 Contribution to knowledge
This study represents the first attempt to explore the relationship between domestic
water consumption and dwelling typology, household income and occupant water use
behaviour in one of the most unequal cities in the world, and to adequately assess the
feasibility of a wide range of water conservation measures for Brazilian dwellings of
different incomes and residential typologies in terms of their applicability, water
savings and financial benefits.
Considering the primary contributions to the field of domestic water consumption, this
research has:
• Assessed current domestic water consumption and identified water end-use
patterns for the different income ranges and dwelling typologies in the Federal
District.

Conclusions and Recommendations
263
• Presented means for more accurate domestic water end-use predictions for the
different income groups and dwelling typologies in Brazil.
• Identified the key variables that affect both indoor and outdoor water
consumption in the Federal District and estimated regression models for water
demand predictions.
• Provided a better understanding of how variables of dwelling characteristics,
income and occupant behaviour are directly related and affect both indoor and
outdoor water consumption patterns.
• Offered a better understanding of the behavioural aspects of domestic water
usage inside Brazilian homes.
• Characterized dwelling composition for high, mid-high, mid-low and low
income households in the Federal District through parameters such as income,
size, tenure, built type, built area, garden/yard area, number of water fixtures and
appliances, presence of swimming pools and their water consumption in
different levels.
• Provided a low-cost and effective water auditing method capable of collecting a
significant sample size of domestic water end-use consumption, regardless of
income and dwelling typology.
With regards to contributions to the field of domestic water conservation, this research
has:
• Identified feasible water conservation measures in terms of their applicability,
water savings and financial benefits for the different income ranges and
residential typologies of the Federal District.
• Offered a better understanding of the water-saving attitudes and public opinion,
awareness and acceptance of water conservation measures for different income
groups.
• Brought together different assessment techniques for the evaluation of water
conservation measures.
• Determined, within the Brazilian context, the applicability of domestic water
conservation measures according to the adaptation of building installations and
public opinion, awareness and acceptance of both demand-side and supply-side
measures.

Conclusions and Recommendations
264
• Identified potential water savings and water reduction indexes for a range of
water conservation measures individually, and in combination.
• Conducted economic assessments of a comprehensive range of demand-side and
supply-side domestic water conservation measures using simple payback period,
life cycle and average incremental cost analysis.
7.5 Limitations of the study
The degree of generalization which can be based on this research is constrained by the
fact that it has been focused in the Federal District. Also, not every single administrative
region of the Federal District has been analysed. Nevertheless, because domestic water
consumption and conservation in different income levels and dwelling typologies were
studied in such depth, some interesting findings which might be relevant to other areas
in Brazil were produced.
The methodologies chosen to undertake this research had their strengths and
weaknesses too. The primary data collection technique used to measure domestic water
end-use consumption through water auditing does not provide the same level of
accuracy as individually metered points of water usage using data-logging equipment,
although data-logging does not work properly when you have water butt, as in Brazil.
Nonetheless, the water auditing method developed, by using diary-tracking techniques
and stop-watches at each point of water usage in the home, fulfilled the requirements of
the research and provided a low-cost method of capable of collecting a larger sample
size of primary data for analysis.
Perhaps the only worry here was that residents were aware that their consumption was
being monitored at all times, affecting the daily habits of water-consuming events.
However, results from the water audits, successfully showed that the accuracy of the
estimated domestic water end-use consumption data collected were within discrepancy
range of metered readings, and findings suggest that they are consistent with previous
findings in published works.
A concluding comment is made about the types of data available for this research. Due
to the lack data regarding the daily frequency of usage for automatically-driven water

Conclusions and Recommendations
265
fixtures, potential reductions for water efficient equipments such as the automatic
faucet, sensor faucet, automatic shut-off hose nozzle and automatic irrigation system
were estimated using percentage-based secondary sources from previous works.
Furthermore, historic time series of hourly or daily rainfall data provide a more precise
estimation of water savings for rainwater harvesting systems. However, such depth of
secondary data is unavailable, so therefore, average monthly rainfall data of a 30 year
time-step for the Federal District was used instead.
7.6 Scope for further research
The study of water consumption and conservation in buildings appears to be now open
to several lines of research. Further studies could benefit from the findings of this
research and amplify its scope, providing further contributions to knowledge and
insights to this current and significant subject.
This study, and as a starting point, this study could be extended to include other cities
and regions in Brazil to expand the number of samples which could allow generalization
over the entire country.
Further research is needed to address the issue of the lack of data regarding the
frequency of daily usage of automatically-driven water fixtures. Adequate data for water
efficient equipments such as the automatic faucet, sensor faucet, automatic shut-off hose
nozzle and automatic irrigation system, can be used to provide more accurate
estimations of water savings. Furthermore, historic time series of hourly or daily rainfall
data could provide a more precise estimation of water savings for rainwater harvesting
systems.
Since cultural values, custom and tradition might be rooted into the way water is used,
further investigations in occupant water-consuming behaviour might provide some
useful insights on how to reduce domestic water consumption through water-saving
attitudes. Other methods for collecting and analysing data on water-consuming activities
could be best addressed through theories of consumer behaviour and behavioural
psychology.

Conclusions and Recommendations
266
7.7 Implications of the findings
Results from this study has made an addition to previous studies by providing specific
information regarding domestic water consumption for different income groups and
dwelling typologies and by identifying feasible domestic water conservation measures
for the Federal District. It seems pertinent to conclude this thesis by relating the
implications of these findings.
Useful water consumption and reduction data from this thesis can be used for the
development of a building certification program destined to promote domestic water
conservation in Brazilian dwellings. Such information could also be applied to the
creation of guidance notes for water conservation in existing and newly built dwellings
in Brazil.
Feasible water-saving strategies have been identified for the different income dwelling
typologies in the Federal District. Findings suggest that low budget water efficient
equipments of simple DIY installation, are capable of promoting water savings and
financial benefits. Water conservation ‘packs’ composed of these simple, low budget
equipments could be distributed to the communities by the local water facility company
as means of reducing water demand to obtain both financial and environmental benefits.
Initial investments made by the company could be paid off through the reduction in
costs related to water production and distribution, water and wastewater treatment, and
wastewater collection.
Findings indicate that although some water conservation measures were capable of
promoting significant reductions on water consumption, overall, they were considered
economically unviable options due to their high costs. Governmental policies and
subsidies over taxes and interest rates could be used as means of promoting incentives
for the general public to invest in water conservation. Tributary tax reductions over
water conservation products could significantly reduce their market price. Furthermore,
low interest rates for long-term investments could also provide means for the general
public to invest on water reuse systems.

Conclusions and Recommendations
267
In sum, results generated from this study could be used as a reference tool for the
development of domestic water conservation programs in the Federal District and in
Brazil.

References
268
References
3P-Technik (2010). Soluções para o manejo sustentável das águas pluviais. Rio de Janeiro: 3P Technik do Brasil Ltda. [Online]. Retrieved on 14 September 2010 from: www.agua-de-chuva.com/
Aarts, H., Verplanken, B. and Knippenberg, A. (1998). Predicting behavior from actions in the past: Repeated decision making or a matter of habit? Journal of Applied Social Psychology 28 (15), pp.1355-1374.
ABNT (1992). Projeto de sistema de bombeamento de água para abastecimento público. NBR 12214. Rio de Janeiro: Associação Nacional de Normas Técnicas.
ABNT (1994). Projetos de reservatório de distribuição de água para abastecimento público. NBR 12217. Rio de Janeiro: Associação Brasileira de Normas Técnicas.
ABNT (1996). Aparelhos hidráulicos acionados manualmente e com ciclo de fechamento automático NBR 13713. Rio de Janeiro: Associação Brasileira de Normas Técnicas.
ABNT (1997). Tanques sépticos: Unidades de tratamento complementar e disposição final dos efluentes líquidos. NBR 13969. Rio de Janeiro: Associação Brasileira de Normas Técnicas.
ABNT (1998). Instalação predial de água fria. NBR 5626. Rio de Janeiro: Associação Brasileira de Normas Técnicas.
ABNT (2007). Aproveitamento de água de chuva de coberturas em áreas urbanas para fins não potáveis. NBR 15527. Rio de Janeiro: Associação Brasileira de Normas Técnicas.
Acqualimp (2010). Cisterna Acqualimp: Guia de Instalação. Valinhos: Dalka do Brasil Ltda.
Agthe, D. E. and Billings, R. B. (1987). Equity, price elasticity, and household income under increasing block rates for water. American Journal of Economics & Sociology 46 (3), pp.273-286.
Ahn, K. H., Song, J. H. and Y., C. H. (1998). Application of tubular ceramic membranes for reuse of wastewater from buildings. Water Science and Technology 38 (4-5), pp.373-382.
Al-Jayyousi, O. R. (2003). Greywater reuse: Towards sustainable water management. Desalination 156 (1-3), pp.181-192.
Alegre, N. et al. (2004). Strategic options for sustainable water management at new developments: The application of a simulation model to explore potential water savings. Water Science and Technology 50 (2), pp.9-15.
Almeida, M. C., Butler, D. and Friedler, E. (1999). At-source domestic wastewater quality. Urban Water 1 (1), pp.49-55.
Alpina (2010). Tratamento de efluentes e reúso de água. São Paulo: Alpina Ambiental. [Online]. Retrieved on 17 September 2010 from: http://www.alpinaambiental.com.br/efluentes.asp
Amin, M. T. and Han, M. y. (2009). Roof-harvested rainwater for potable purposes: Application of solar collector desinfection (SOCO-DIS). Water Research 43 (20), pp.5225-5235.
ANA (2002). A evolução da gestão dos recursos hídricos no Brasil. Brasília: Agência Nacional das Águas.
ANA (2007). Disponibilidade e demandas de recursos hídricos no Brasil. Brasília: Agência Nacional das Águas.
ANA (n.d.). Bacias hidrográficas do Distrito Federal. Brasília: Agência Nacional das Águas.

References
269
ANA, FIESP and SindusCon-SP (2005). Conservação e reúso da água em edificações. São Paulo: Prol Editora Gráfica.
Annan, K. A. (2005). The secretary-general message to launch the "Water for Life" decade. United Nations.
Aquacraft (2008). Produtos de jardinagem com estilo. São Paulo: Aquacraft. [Online]. Retrieved on from: http://www.aquacraft.com.br/
Arbués, F., García-Valiñas, M. Á. and Martínez-Espiñeira, R. (2003). Estimation of residential water demand: a state-of-the-art review. Journal of Socio-Economics 32 (1), pp.81-102.
Arbués, F., Villanúa, I. and Barberán, R. (2010). Household size and residential water demand: an empirical approach. Australian Journal of Agricultural & Resource Economics 54 (1), pp.61-80.
Arcury, T. A. (1990). Environmental attitude and environmental knowledge. Human Organization 49 (4), pp.300 - 304
Arcury, T. A. and Johnson, T. P. (1987). Public environmental knowledge: A statewide survey. Journal of Environmental Education 18, pp.31-37.
Arpke, A. and Strong, K. (2006). A comparison of life cycle cost analyses for a typical college dormitory using subsidized versus full-cost pricing of water. Ecological Economics 58, pp.66-78.
Asano, T., Maeda, M. and Takaki, M. (1996). Wastewater reclamation and reuse in Japan: Overview and implementation examples. Water Science and Technology 34 (11), pp.219-226.
Asano, T. et al. (1986). On-site wastewater reclamation and reuse. Plumbing Engineer 14 (7), pp.22-35.
Astra (2009). Balanço de responsabilidade socioambiental. Jundiaí: Astra S/A Indústria e Comércio.
Athanasiadis, K., Horn, H. and Helmreich, B. (2010). A field study on the first flush effect of copper roof runoff. Corrosion Science 52 (1), pp.21-29.
Ball, A. et al. (2003). Measuring microcomponents for demand forecasting. In: CCWI '03 Conference. London: Taylor & Francis.
Barreto, D. (2008). Perfil do consumo residencial e usos finais da água. Ambiente Construído 8 (2), pp.23-40.
Barrett, G. and Wallace, M. (2009). Characteristics of Australian urban residential water users: Implications for water demand management and whole of the system water accounting framework. Water Policy 11 (4), pp.413-426.
Bidlack, W. R., Wang, W. and Clemens, R. (2004). Water: The world's most precious resource. Journal of Food Science 69 (2), pp.55-61.
Bilderback, T. E. and Powell, M. A. (1996). Efficient Irrigation.Water Quality & Waste Management. North Carolina: North Carolina Cooperative Extension Service.
Billings, R. B. (1982). Specification of block rate price variables in demand models. Land Economics 58 (3), p.386.
Billings, R. B. and Agthe, D. E. (1980). Price elasticities for water: A case of increasing block rates. Land Economics 56 (1), p.73.
Black&Decker (2008). Lavadora de pressão: Manual de instuções. Uberaba: Black&Decker do Brasil.
Bosch (2010). High pressure washer product advisor. Bosch. [Online]. Retrieved on 4 September 2010 from: http://www.bosch-aquatak.com/gb-en/start/prod_uebersicht.htm
Brasil, B. C. d. (2010). Indicadores econômicos. Banco Central do Brasil.

References
270
Brastemp (2008). Produtos: Lavadoras. São Paulo: Whirlpool S.A. Eletrodomésticos. [Online]. Retrieved on 2 September 2010 from: http://www.brastemp.com.br/ch/categoria/index.aspx?cc=57&desc=lavadoras
Brewer, D., Brown, R. and Stanfield, G. (2001). Rainwater and greywater in buildings: Project report and case studies.Technical Note TN 7/2001. Berkshire: BSRIA.
Butler, D. and Memon, F. A. (2006). Water Demand Management. London: IWA Publishing.
CAESB (2002). Siágua 2002: Sinopse do sistema de abastecimento de água do Distrito Federal. 11th ed. Brasília: CAESB.
CAESB (2004). Siágua 2004: Sinopse do sistema de abastecimento de água do Distrito Federal. 13th ed. Brasília: CAESB.
CAESB (2005). Siágua 2004: Sinopse do sistema de abastecimento de água do Distrito Federal. 13th ed. Brasília: CAESB.
CAESB (2006). Siágua 2006: Sinopse do sistema de abastecimento de água do Distrito Federal. 15th ed. Brasília: CAESB.
CAESB (2008). Siágua 2008: Sinopse do sistema de abastecimento de água do Distrito Federal. 17th ed. Brasília: CAESB.
CAESB and MEL (2004). Plano diretor de água e esgotos do Distrito Federal. Brasília: Companhia de Saneamento Ambiental do Distrito Federal.
Christova-Boal, D., Eden, R. E. and McFarlane, S. (1996). An investigation into greywater reuse for urban residential properties. Desalination 106 (1-3), pp.391-397.
CODEPLAN (2006). Distrito Federal: Síntese de informações socioeconomicas. Governo do Distrito Federal. Brasília: GDF.
CODEPLAN (2007). Anuário estatístico do Distrito Federal. Brasília: CODEPLAN. Conley, B. C. (1967). Price elasticity of the demand for water in Southern California.
Annals of Regional Science 1 (1), p.180. Consul (2010). Lavadoras de roupa. São Paulo: Consul. [Online]. Retrieved on 2
September 2010 from: http://www.consul.com.br/Lavadoras Corbella, H. M. and Pujol, D. S. (2009). What lies behind domestic water use? A review
essay on the drivers of domestic water consumption. Boletin de la Asociación de Geógrafos Españoles 50, pp.297-314.
Corral-Verdugo, V. et al. (2002). Residential water consumption, motivation for conserving water and the continuing tragedy of the commons. Environmental Management 30 (4), pp.527-535.
Corumbá-Concessões (2010). UHE Corumbá IV. Luziânia: Corumbá Concessões S.A. [Online]. Retrieved on 11 August 2010 from: http://www.corumbaconcessoes.com.br/br/uhe.aspx
Dalhuisen, J. M. et al. (2003). Price and income elasticities of residential water demand: A meta-analysis. Land Economics 79 (2), p.292.
Dandy, G., Nguyen, T. and Davies, C. (1997). Estimating residential water demand in the presence of free allowances. Land Economics 73 (1), p.125.
De Oreo, W. B., Heaney, J. P. and Mayer, P. W. (1996). Flow trace analysis to assess water use. American Works Association 88 (1), pp.79-90.
Deca (2003). Ficha técnica: Sistema Dual Flux. São Paulo: Deca. Deca (2010). Uso racional da água. São Paulo: Deca. [Online]. Retrieved on 1
September 2010 from: http://www.deca.com.br/ DHWA (2002). Draft guidelines for the reuse of greywater in Western Australia. In:
Health, D. o., ed. Perth: Government of Western Australia. Diaper, C. et al. (2001). Water-recycling technologies in the UK. Water and
Environment Journal 15 (4), pp.282-286.

References
271
Docol (2010a). Docol product catalog. Joinville: Docol Metais Sanitários LTDA. Docol (2010b). Manual de instalação: Válvula de descarga RI - 1.1/2" - 1.1/4".
Joinville: Docol Metais Sanitários LTDA. Donner, E. et al. (2010). Presence and fate of priority substances in domestic greywater
treatmebnt and reuse systems. Science of The Total Environment 408 (12), pp.2444-2451.
Downing, T. E. et al. (2003). Climate change and demand for water. Oxford: Stockholm Environment Institute.
Draco (2010a). Crivo econômico CROMA para chuveiros. São Paulo: Draco Eletrônica Indústria e Comércio. [Online]. Retrieved on 19 May 2010 from: http://www.dracoeletronica.com.br/chuveiro-croma.htm
Draco (2010b). Reguladores de vazão e arejadores economizadores de água. São Paulo: Draco Eletrônica Indústria e Comércio Ltda. [Online]. Retrieved on 2 September 2010 from: http://www.dracoeletronica.com.br/reguladores.htm
Draco (2010c). Torneira Eletrônica. São Paulo: Draco Eletrônica Indústria e Comércio Ltda. [Online]. Retrieved on 1 September 2010 from: http://www.dracoeletronica.com.br/torneira-eletronica-eco-90274.htm
Draco (2010d). Torneira eletrônica de bancada. São Paulo: Draco Eletrônica Indústria e Comércio Ltda.
Dziegielewski, B. et al. (1993). Evaluating urban water conservation programs: A procedures manual. Denver: American Water Works Association.
EA (2000). A study of domestic greywater recycling. National Water Demand Management Centre. Bristol: Environment Agency.
EA (2003). The economics of water efficient products in the household. Bristol: Environment Agency.
EA (2007). Conserving water in buildings: A practical guide. Bristol: Environment Agency.
EA (2008a). Greywater: An information guide. Bristol: Environment Agency. EA (2008b). Harvesting rainwater for domestic uses: An information guide. Bristol:
Environment Agency. EA (2008c). International comparisons of domestic per capita consumption. Bristol:
Environment Agency. EA, Government, C. a. L. and DEFRA (2007). Towards water neutrality in the Thames
Gateway. Bristol: Environment Agency. Eletrolux (2007). Manual de instruções: Lavadora de roupas TRW10. Curitiba:
Eletrolux do Brasil S.A. Eletrolux (2010a). Família Turbo Economia. Curitiba: Eletrolux do Brasil S.A.
[Online]. Retrieved on 2 September 2010 from: http://www.electrolux.com.br/turboeconomia/
Eletrolux (2010b). Produtos: Lavadoras. Curitiba: Eletrolux do Brasil S.A. [Online]. Retrieved on 2 September 2010 from: http://www.electrolux.com.br/produtos_lista.asp?categoria_id=lavadoras
EMATER (2004). Informativo conjuntural da produção agrícola do Distrito Federal. Brasília: Empresa de Assistência Técnica e Extensão Rural do Distrito Federal.
EnHealth (2004). Guidance on the use of rainwater tanks. Canberra: EnHealth Council. EPA (2000). Oil recirculating toilets.Water Efficiency Technology Fact Sheet.
Washington D.C.: United States Environmental Protection Agency. Eriksson, E. et al. (2002). Characteristics of grey wastewater. Urban Water 4 (1), pp.85-
104. Espey, M., Espey, J. and Shaw, W. D. (1997). Price elasticity of residential demand for
water: A meta-analysis. Water Resources Research 33 (6), pp.1369-1374.

References
272
Evans, C. A., Coombes, P. J. and Dunstan, R. H. (2006). Wind, rain and bacteria: The effect of weather on the microbial composition of roof-harvested rainwater. Water Research 40 (1), pp.37-44.
Fabrimar (2010). Catálogo de produtos e informações técnicas. Rio de Janeiro: Fabrimar.
Fewkes, A. (1999). The use of rainwater for WC flushing: the field testing of a collection system. Building and Environment 34 (6), pp.765-772.
Fewkes, A. (2006). The technology, design and utility of rainwater catchment systems. In: Butler, D. and Memon, F. A. (eds.) Water demand management. London: IWA Publishing, pp.27-61.
Fewkes, A. and Butler, D. (2000). Simulating the performance of rainwater collection and reuse systems using behavioural models. Building Services Engineering Research and Technology 21 (2), pp.99-106.
Fewkes, A. and Warm, P. (2000). Method of modelling the performance of rainwater collection systems in the United Kingdom. Building Services Engineering Research and Technology 21 (4), pp.257-265.
Fishbein, M. and Ajzen, I. (1975). Belief, attitude, intention, and behavior: An introduction to theory and research. Reading, MA: Addison-Wesley.
Fito (2010). Águas cinzas. Brasília: Fitoplannus. [Online]. Retrieved on 17 September 2010 from: http://www.aguascinzas.com.br/
Fortlev (2010). Catálogo de produtos: Cisternas. São Paulo: Fortlev. Foster, H. S. and Beattie, B. R. (1979). Urban residential demand for water in the
United States. Land Economics 55 (1), p.43. Fox, C., McIntosh, B. S. and Jeffrey, P. (2009). Classifying households for water
demand forecasting using physical property characteristics. Land Use Policy 26, pp.558-568.
Gardena (2010). Gardena. Ulm: Gardena GmbH. [Online]. Retrieved on 6 September 2010 from: http://www.gardena.com
Gardner, T., Millar, G. and Baisden, J. (2004). Rainwater first flush devices: Are they effective? In: Sustainable Water in the Urban Environment. Brisbane: Australian Water Association.
Gardner, T. and Vieritz, A. (2010). The role of rainwater tanks in Australia in the twety first century. Architectural Science Review 53, pp.107-125.
Gaulke, L. S. (2006). On-site wastewater treatment and reuses in Japan. Water Management 159 (2), pp.103-109.
Generino, R. C. M. (2006). Contribuição da abordagem multicritério na seleção de alternativas de reúso de água: aplicação em um caso de irrigaçãoagrícola e paisagística no Distrito Federal.Faculdade de Saúde Pública. São Paulo: Universidade de São Paulo - USP.
Geudens, P. J. J. G. (2008). Water Supply Statistics: 2007. Rijswijk: Vewin. Ghisi, E. (2006). Potential for potable water savings by using rainwater in the
residential sector of Brazil. Building and Environment 41 (11), pp.1544-1550. Ghisi, E., Bressan, D. L. and Martini, M. (2007). Rainwater tank capacity and potential
for potable water savings by using rainwater in the residential sector of southeastern Brazil. Building and Environment 42 (4), pp.1654-1666.
Ghisi, E. and Ferreira, D. F. (2007). Potential for potable water savings by using rainwater and greywater in a multi-storey residential building in southern Brazil. Building and Environment 42 (7), pp.2512-2522.
Ghisi, E., Montibeller, A. and Schmidt, R. W. (2006). Potential for potable water savings by using rainwater: An analysis over 62 cities in southern Brazil. Building and Environment 41 (2), pp.204-210.

References
273
Ghisi, E. and Oliveira, S. M. (2007). Potential for potable water savings by combining the use of rainwater and greywater in houses in southern Brazil. Building and Environment 42 (4), pp.1731-1742.
Gonçalves, O. M., Ioshimoto, E. and Oliveira, L. H. (1999). Technologias poupadoras de água nos sistemas prediais.Programa Nacional de Combate ao Desperdício de Água. Brasília: Secretaria Especial de Desenvolvimento Urbano e Secretaria de Política Urbana.
Gould, J. and Nissen-Petersen, E. (1999). Rainwater catchment systems for domestic supply: Design, construction and implementation. London: Intermediate Technology Publications.
Grant, N. (2006). Water conservation products. In: Butler, D. and Memon, F. A. (eds.) Water Demand Management. London: IWA Publishing, p.361.
Grant, N., Moodie, M. and Weedon, C. (2005). Sewage solutions: Answering the call of nature. Powys: Centre for Alternative Technology.
Greenway, M. (2005). The role of constructed wetlands in secondary effluent treatment and water reuse in subtropical and arid Australia. Ecological Engineering 25 (5), pp.501-509.
Gregory, G. D. and Di Leo, M. (2003). Repeated behaviour and environmental psychology: The role of personal involvement and habit formation in explaining water consumption. Journal of Applied Psychology 33 (6), pp.1261-1296.
Griggs, J. and Burns, J. (2009). Water efficiency in new homes: An introductory guide for housebuilders. Amersham: NHBC Foundation.
Griggs, J. C., Shoulder, M. C. and Hall, J. (1998). Water Conservation and the built environment. In: Roaf, S. and Walker, V. (eds.) 21 AD: Water. Oxford: Oxford Brookes University and Thames Water, pp.3-9.
Gross, A., Kaplan, D. and Baker, K. (2007). Removal of chemical and microbiological contaminants from domestic greywater using a recycled vertical flow bioreactor (RVFB). Ecological Engineering 31 (2), pp.107-114.
Hall, M. J., Hooper, B. D. and Postle, S. M. (1988). Domestic per capita water consumption in South West England. Water and Environment Journal 2 (6), pp.626-631.
Heinrich, M. (2007). Water end use and efficiency project (WEEP) - Final Project. Judgeford: BRANZ.
Helmreich, B. and Horn, H. (2009). Opportunities in rainwater harvesting. Desalination 248 (1-3), pp.118-124.
Herrington, P. R. (2006). The economics of water demand management. In: Butler, D. and Memon, F. A. (eds.) Water demand management. London: IWA, pp.236-279.
Herrmann, T. and Schmida, U. (1999). Rainwater utilisation in Germany: Efficiency, dimensioning, hydraulic and environmental aspects. Urban Water 1 (4), pp.307-316.
Hervy (2010). Economize água. São Paulo: Hervy. [Online]. Retrieved on 27 August 2010 from: http://www.hervy.com.br/br/economizeagua.html
Hewitt, J. A. and Hanemann, W. M. (1995). A discrete/continuous choice approach to residential water demand under block rate pricing. Land Economics 71 (2), p.173.
Hobson, C., Jeffrey, P. and McIntosh, B. S. (2004). Housing characteristics and their importance in predicting water demand - a study of the Three Valleys water region. In: Proc. IWA World Water Congress. Marrakech, Morocco.

References
274
Hoffmann, M., Worthington, A. and Higgs, H. (2006). Urban water demand with fixed volumetric charging in a large municipality: The case of Brisbane, Australia. Australian Journal of Agricultural & Resource Economics 50 (3), pp.347-359.
House, C. H. et al. (1999). Combining constructed wetlands and aquatic and soil filters for reclamation and reuse of water. Ecological Engineering 12 (1-2), pp.27-38.
Hydra (2007). Nova Hydra. São Paulo: Hydra. [Online]. Retrieved on 27 August 2010 from: www.valvulahydra.com.br
IBGE (2000). Sistema IBGE de recuperação automática: SIDRA. Censo Demográfico. Instituto Brasileiro de Geografia e Estatística.
IBGE (2009). Estimativas de população. Brasília: Instituto Brasileiro de Geografia Estatística. [Online]. Retrieved on 11 August 2010 from: http://www.ibge.gov.br/estadosat/perfil.php?sigla=df#
IPCC (2001). Climate change 2001: Impacts, adaptation, and vulnerability. Cambridge: Cambridge University Press.
IPCC (2007). Climate change 2007: Impacts, adaptation, and vulnerability. Cambridge: Cambridge University Press.
Jefferson, B. et al. (2000). Technologies for domestic wastewater recycling. Urban Water 1 (4), pp.285-292.
Jones, M. P. and Hunt, W. F. (2010). Performance of rainwater harvesting systems in the southeastern United States. Resources, Conservation and Recycling 54 (10), pp.623-629.
Jorgensen, B., Graymore, M. and O'Toole, K. (2009). Household water use behavior: An integrated model. Journal of Environmental Management 91 (1), pp.227-236.
Júnior, G. B. A., Dias, I. C. S. and Gadelha, C. L. M. (2008). Viabilidade econômica e aceitação social do aproveitamento de águas pluviais em residências na cidade de João Pessoa. Ambiente Construído 8 (2), pp.85-98.
Júnior, O. B. O. (2002). Avaliação do desempenho funcional de bacias sanitárias de volume de descarga reduzido com relação à remoção e transporte de sólidos.Faculdade de Engenharia Civil. Campinas: Universidade Estadual de Campinas.
Karcher (2010). Produtos: Lavadoras residenciais. Campinas: Alfred Karcher GmbH & Co. [Online]. Retrieved on 3 September 2010 from: http://www.karcher.com.br/site/categoria.aspx?id=1
Kim, J. et al. (2009). A laboratory-scale graywater treatment system based on a membrane filtration and oxidation process: Characteristics of graywater from a residential complex. Desalination 238 (1-3), pp.347-357.
Kim, R. et al. (2007). Reuse of greywater and rainwater using fiber filter media and metal membrane. Desalination 202, pp.326-332.
Kjellén, M. and McGranahan, G. (1997). Urban water: Towards health and sustainability.Comprehensive assessment of the freshwater resources of the world. Stockholm: Stockholm Environment Institute.
Leggett, D. et al. (2001a). Rainwater and greywater use in buildings: Best practice guidance. London: CIRIA.
Leggett, D. et al. (2001b). Rainwater and greywater use in buildings: Decision-making for water conservation. London: CIRIA.
Leggett, D. and Shaffer, P. (2002). Buildings that save water: Rainwater and greywater use. Municipal Engineer 151 (3), pp.189-196.
LG (2010). Lavadora de roupas. São Paulo: LG Electronics. [Online]. Retrieved on 2 September 2010 from: http://www.lge.com/br/eletrodomestico/lavadora-de-roupas/index.jsp

References
275
Li, Z., Boyle, F. and Anthony, R. (2010). Rainwater harvesting and greywater treatment systems for domestic application in Ireland. Desalination 260 (1-3), pp.1-8.
Liu, J., Savenije, H. H. G. and Xu, J. (2003). Water as an economic good and water tariff design: Comparison between IBT-con and IRT-cap. Physics and Chemistry of the Earth, Parts A/B/C 28 (4-5), pp.209-217.
Loh, M. and Coghlan, P. (2003). Domestic water use study. Perth: Water Corporation. Lu, W. and Leung, A. Y. T. (2003). A preliminary study on potential of developing
shower/laundry wastewater reclamation and reuse system. Chemosphere 52 (9), pp.1451-1459.
Lye, D. J. (2009). Rooftop runoff as a source of contamination: A review. Science of The Total Environment 407 (21), pp.5429-5434.
Machado, C. J. S. (2003). Recursos hídricos no Brasil: Limites, alternativas e desafios. Ambiente & Sociedade 62 (2), pp.121-136.
Maddaus, W. O. (1984). Residential water conservation projects: Summary report. Washington: Department of Housing and Urban Development.
Marshallsay, D., Trew, J. and Waylen, C. (2007). Assessing the cost of compliance with the code for sustainable homes. Bristol: Environment Agency.
Martinson, D. B. and Thomas, T. (2005). Quantifying the first-flush phenomenon. In: 12th International Rainwater Catchment Systems Conference. New Delhi, India.
Masi, F. and Martinuzzi, N. (2007). Constructed wetlands for the Mediterranean countries: Hybrid systems for water reuse and sustainable sanitation. Desalination 215 (1-3), pp.44-55.
Mayer, P. W. et al. (1999). Residential end uses of water.AWWA Research Foundation. American Water Works Association.
Mayer, P. W. et al. (2003). Residential indoor water conservation study: Evaluation of high efficiency indoor plumbing fixture restrofits in single-family houses in the East Bay Municipality District service area. Boulder: Aquacraft.
McMahon, T. A. and Mein, R. G. (1978). Reservoir capacity and yield. Amsterdam: Elsevier Scientific Publishing Company.
Memon, F. and Butler, D. (2006). Domestic water consumption trends and techniques for demand forecasts. In: Butler, D. and Memon, F. (eds.) Water Demand Management. London: IWA Publishing, pp.1-25.
METEOTEST (1999). METEONORM. Bern: METEOTEST. Misra, R. K. and Sivongxay, A. (2009). Reuse of laundry greywater as affected by its
interaction with saturated soil. Journal of Hydrology 366 (1-4), pp.55-61. Mizumo (2010). Melhorando o ambiente em que vivemos. Pompéia: Grupo Jacto.
[Online]. Retrieved on 17 September 2010 from: www.mizumo.com.br/ Mujariego, R. and Asano, T. (1999). The role of advanced treatment in wastewater
reclamation and reuse. Water Science and Technology 40 (4-5), pp.1-9. Mustow, S., Grey, R. and Smerdon, T. (1997). Water conservation: Implications of
using recycled greywater and stored rainwater in the UK. Berkshire: BSRIA. Neal, J. (1996). Wastewater reuse studies and trials in Canberra. Desalination 106 (1-3),
pp.399-405. Niewswiadomy, M. L. and Molina, D. J. (1989). Comparing Residential Water Demand
Estimates under Decreasing and Increasing Block Rates Using Household Data. Land Economics 65 (3), p.280.
Nolde, E. (2000). Greywater reuse systems for toilet flushing in multi-storey buildings: Over ten years experience in Berlin. Urban Water 1 (4), pp.275-284.
NSW (2008a). Greywater reuse in sewered, single household residential premises. Sydney: Department of Water and Energy, NSW Government.

References
276
NSW (2008b). Irrigating with greywater. Sydney: Department of Water and Energy, NSW Government.
Ofwat (2007). International comparison of water and sewerage: 2007 report. Birmingham: Ofwat.
Oliveira, L. H. (2002). As bacias sanitárias e as perdas de água nos edifícios. Ambiente Construído 2 (4), pp.39-45.
Otaki, Y. et al. (2008). Micro-components survey of residential indoor water consumption in Chiang Mai. Drinking Water Engineering and Science 1, pp.17-25.
Ottoson, J. and Stenstrom, T. A. (2003). Faecal contamination of greywater and associated microbial risks. Water Research 37 (3), pp.645-655.
PDAD (2004). PDAD 2004: Pesquisa Distrital por amostra de domicílios. Subsecretaria de Estatística e Informações. Brasília: SEPLAN.
Peter-Varbanets, M. et al. (2009). Decentralized systems for potable water and the potential of membrane technology. Water Research 43 (2), pp.245-265.
Pidou, M. et al. (2008). Chemical solutions for greywater recycling. Chemosphere 71 (16), pp.390-3947.
Potter, R. B. and Darmame, K. (2010). Contemporary social variations in household water use, management strategies and awareness under conditions of ‘water stress’: The case of Greater Amman, Jordan. Habitat International 34, pp.115-124.
QWC (2009). Efficient irrigation for water conservation guideline.Water efficiency guideline. City East: Queensland Water Commission.
Ragab, R., Austin, B. and Moidinis, D. (2001). The HYDROMED model and its application to semi-arid Mediterranean catchments with hill reservoirs 3: reservoir storage capacity and probability of failure model. Hydrology and Earth System Sciences 5 (4), pp.563-568.
Rahman, A., Dbais, J. and Imteaz, M. (2010). Sustainability of rainwater harvesting systems in multistorey residential buildings. American Journal of Engineering and Applied Sciences 3 (1), pp.73-82.
Rajala, R. P. and Katko, T. S. (2004). Household water consumtpion and demand management in Finland. Urban Water 1 (1), pp.17-26.
Randolph, B. and Troy, P. (2008). Attitudes to conservation and water consumption. Environmental Science & Policy 11 (5), pp.441-455.
Rijsberman, F. R. and Cosgrove, W. J. (2000). World water vision: Making water everybody's business. Washington: Earthscan.
RIPSA (2010). Taxa de crescimento da população. Brasília: Ministério da Saúde. [Online]. Retrieved on 10 August 2010 from: http://tabnet.datasus.gov.br/cgi/idb2008/a03cap.htm
Roberts, P. (2005). 2004 residential end use measurement study. Melbourne: Yarra Valley Water.
Roca (2008). Produtos: Louças sanitárias. São Paulo: Roca Brasil. Roca (2010). W+W. Barcelona: Roca Sanitario S.A. [Online]. Retrieved on from:
http://www.roca.com.es/ww/index.html?en Rocha, A. L., Barreto, D. and Ioshimoto, E. (1998). Caracterização e monitoramento do
consumo predial de água.Programa Nacional de Combate ao Desperdício de Água. Brasília: Secretaria de Política Urbana.
Roebuck, R. M., Oltean-Dumbrava, C. and Tait, S. (2010). Whole life cost performance of domestic rainwater harvesting systems in the United Kingdom. Water and Environment Journal Advance of print online article.

References
277
Rosegrant, M. W., Cai, X. and Cline, S. A. (2002). Global water outlook to 2025: Averting an impending crisis. Washington: International Food Policy Research Institute.
Russac, D. A. V., Rushton, K. R. and Simpson, R. J. (1991). Insights into domestic demand from a metering trial. Water and Environment Journal 5 (3), pp.342-351.
SA-Health (2008). Manual bucketing and temporary diversion of greywater. In: Health, D. o., ed. Adelaide: SA Health, Government of South Australia.
SABESP (1996). Relatório mensal 3: Projeto de pesquisa escola politécnica USP e ASFAMAS. São Paulo: SABESP.
SABESP (2010). O uso racional da água no comércio. São Paulo: Federação do Comércio do Estado de São Paulo - FECOMERCIO.
Sakellari, I. et al. (2005). Modelling sustainable urban water management options. Proceedings of the ICE - Engineering Sustainability 158 (3), pp.143-153.
Sant'Ana, D. and Amorim, C. N. D. (2007). Reúso de Água em Edificações: Premisas e perspectivas para o contexto brasileiro. Sistemas Prediais 2 (1), pp.32-37.
Santos, M. A. (2008). Brasília, o Lago Paranoá e o tombamento: Natureza e especulação na cidade modernista.Pós-graduação em Arquitetura e Urbanismo. São Carlos: Universidade de São Paulo - USP.
Saúde, M. d. (2004). Portaria no. 518. Brasília: Editora do Ministério da Saúde. Sautchuk, C. et al. (2005). Conservação e reúso da água em edificações. São Paulo:
Prol Editora Gráfica. Savenije, H. H. G. (2002). Why water is not an ordinary economic good, or why the girl
is special. Physics and Chemistry of the Earth, Parts A/B/C 27 (11-22), pp.741-744.
Schleich, J. and Hillenbrand, T. (2009). Determinants of residential water demand in Germany. Ecological Economics 68 (6), pp.1756-1769.
Schmidt, W. (2004). Produtos economizadores de água nos sistemas prediais.Programa Nacional de Combate ao Desperdício de Água. Brasília: Ministério das Cidades, Secretaria Nacional de Saneamento Ambiental.
Shaw, W. D. (2005). Water resource economics and policy: An introduction. Cheltenham: Edward Elgar Publishing Inc.
Shiklomanov, I. A. (1993). World fresh water resources. In: Gleik, P. H. (ed.) Water in crisis. Oxford: Oxford University Press.
Sivakumaran, S. and Aramaki, T. (2010). Estimation of Household Water End Use in Trincomalee, Sri Lanka. Water International 35 (1), pp.94-99.
SNSA (2010). Sistema Nacional de Informações sobre Saneamento: Diagnóstico dos serviços de água e esgotos - 2008. Brasília: Ministério das Cidades, Secretaria Nacional de Saneamento Ambiental.
Spinks, A. T. et al. (2003). Water quality treatment processes in domestic rainwater harvesting systems. In: 28th International Hydrology and Water Resiource Symposium. Australia.
Tchobanoglous, G., Burton, F. L. and Stensel, H. D. (2003). Wastewater engineering: Treatment and reuse. New York: McGraw-Hill.
Thackray, J. E., Cocker, V. and Archibald, G. (1978). The Malvern and Mansfield studies of domestic water usage. Water Engineers and Science 64, pp.37-61.
TIGRE (2005). Piping for Vacuum Sewerage. Joinville: TIGRE. Troy, P. and Holloway, D. (2004). The use of residential water consumption as an urban
planning tool: A pilot study in Adelaide. Journal of Environmental Planning and Management 47 (1), pp.97-114.

References
278
Troy, P. and Randolph, B. (2005). Water consumption and the built environment: A social and behavioural analysis. Paper No. 5. City Futures Research Center.
Tundisi, J. G. (2005). Água no século XXI: Enfrentando a escassez. São Carlos: RIMA. TWDB (2005). The Texas manual on rainwater harvesting. Austin: Texas Water
Development Board. UN-Water (2006). Coping with water scarcity: A strategic issue and priority for system-
wide action. New York: UN Water. UN (1987). Report of the world commision on environment and development: Our
common future. Brundtland: United Nations. UN/WWAP (2003). 1st UN world water development report: Water for people, water
for life. Paris, New York and Oxford: UNESCO and Berghahn Books. UNEP (2006a). Challenges to international waters: Regional assessments in a global
perspective. Nairobi: United Nations Environment Programme. UNEP (2006b). Challenges to international waters: Regional assessments in a global
perspective. Nairobi: United Nations Environment Programme. Vairavamoorthy, K. and Mansoor, M. (2006). Demand management in developing
countries. In: Butler, D. and Memon, F. A. (eds.) Water Demand Management. London: IWA Publishing, p.361.
Vickers, A. (2001). Handbook of water use and conservation Amherst: Water Plow Press.
Vieira, P. et al. (2007). Household water use: a Portuguese field study. Water Science and Technology: Water Supply 7 (5-6), pp.193-202.
Villarreal, E. L. and Dixon, A. (2005). Analysis of a rainwater collection system for domestic water supply in Ringdansen, Norrkoping, Sweden. Building and Environment 40 (9), pp.1174-1184.
Vimieiro, G. V. and Pádua, V. L. (2005). Emprego de equipamentos especiais na economia de água em residências de famílias de baixa renda. In: 23 Congresso Brasileiro de Engenharia Sanitária e Ambiental. Campo Grande.
Ward, S., Memon, F. A. and Butler, D. (2010). Harvested rainwater quality: The importance of appropriate design. Water Science and Technology 61 (7), pp.1707-1714.
Waterwise (2008). Evidence base for large-scale water efficiency in homes. London: Waterwise.
White, S. B. and Fane, S. A. (2002). Designing cost effective water demand management programs in Australia. Water Science and Technology 46 (6-7), pp.225-232.
Wilson, A. and Navaro, R. (2008). Alternative water sources: Supply-side solutions for green buildings.Environmental Building News. BuildingGreen.
Winward, G. P. et al. (2009). Pathogens in urban wastewaters suitable for reuse. Urban Water Journal 6 (4), pp.291-301.
WISY (2010). Catálogo de produtos: Tecnologia para o reaproveitamento da água de chuva. São Paulo: Aquastock.
Wong, L. T. and Mui, K. W. (2008). Epistemic water consumption benchmarks for residential buildings. Building and Environment 43 (6), pp.1031-1035.
Woods-Ballard, B. et al. (2007). The SUDS manual. London: CIRIA. Worthington, A. C. and Hoffman, M. (2008). An empirical survey of residential water
demand modelling. Journal of Economic Surveys 22 (5), pp.842-871. Yaziz, M. I. et al. (1989). Variations in rainwater quality from roof catchments. Water
Research 23, pp.761-765. Yokomizo, T. (1994). Ultrafiltration membrane technology for regeneration of building
wastewater for reuse. Desalination 98 (1-3), pp.319-326.

References
279
Zhang, H. H. and Brown, D. F. (2005). Understanding urban residential water use in Beijing and Tianjin. Habitat International 29 (3), pp.469-491.

Appendices

Appendix A House Survey Questionnaire

Appendix A
282
This survey is part of a PhD study at the Department of Architecture, Oxford Brookes
University, UK, on domestic water conservation in the Federal District, Brazil. The
questionnaire has been designed to analyse social and economic aspects of domestic
water consumption, as well as public awareness and acceptance of water conservation
strategies. You are under no obligation to participate, feel free to withdraw from the
survey at any time without giving a reason, but your kind contribution would be greatly
appreciated. This will only take a short amount of your time, and your answers will be
kept strictly confidential, private and anonymous. If you are unhappy answering any of
the questions, say so and we will move directly to the next question. The information
collected and the data generated shall be retained and safely stored in accordance with
the University’s policy of Academic Integrity. Participants who wish to be provided with
information on the findings and outcomes of the project will be sent a summary report.
This questionnaire has been approved by the University Research Ethics Committee,
but if you have any concerns about the conduct of this survey, please feel free to contact
the Chair of the UREC at Oxford Brookes University ([email protected]).
Please tick (√) or provide your most appropriate response for each question. If you
require any further forms or if you want any further information about the
survey, or would like to ask any questions please contact:
Mr Daniel Sant’Ana
Telephone: +55 (61) 3307-2454
Email: [email protected]

Appendix A
283
1. How many people live in your household?______________
2. Is your home fully owned, being paid off or rented?
□ Owned fully / fully paid off □ Buying / paying off home
□ Renting from private sector □ Renting from public sector
3. In average, what is the household’s total monthly income?
□ Less than R$380 □ R$381 – R$1,900 □ R$1,901 – R$3,800
□ R$3,801 – R$7,600 □ Above R$7,601 □ Don’t know
4. In average, how much do you spend with your monthly water bills?
□ Less than R$25 □ R$25 – R$50 □ R$50 – R$75 □ Above R$75 □ Don’t know
5. a. In your opinion, current pricing of supplied water is:
□ Expensive □ Fair □ Cheap
b. Do you think current prices of mains water encourage water conservation?
□ Yes □ No □ Don’t know
c. Do you feel that dwellings who consume an amount well above average should pay
an additional fee or rate for their water?
□ Yes □ No □ Don’t know
d. Do you feel that dwellings who consume an amount well below average should pay a
discounted fee or rate for their water?
□ Yes □ No □ Don’t know
6. Please indicate how many of the following water fixtures and appliances you have in
your home.
a. Toilet………………........ □ 0 □ 1 □ 2 □ 3 □ 4 □ 5 □ 6 □ 7 or more
b. Bidets………………...… □ 0 □ 1 □ 2 □ 3 □ 4 □ 5 □ 6 □ 7 or more
c. Shower head………….... □ 0 □ 1 □ 2 □ 3 □ 4 □ 5 □ 6 □ 7 or more
d. Bathtub…………...…….. □ 0 □ 1 □ 2 □ 3 □ 4 □ 5 □ 6 □ 7 or more
e. Bathroom sink………...... □ 0 □ 1 □ 2 □ 3 □ 4 □ 5 □ 6 □ 7 or more
f. Kitchen sink………..…... □ 0 □ 1 □ 2 □ 3 □ 4 □ 5 □ 6 □ 7 or more
g. Dishwashing machine….. □ 0 □ 1 □ 2 □ 3 □ 4 □ 5 □ 6 □ 7 or more
h. Utility sink water tap…... □ 0 □ 1 □ 2 □ 3 □ 4 □ 5 □ 6 □ 7 or more
i. Manual clothes washer…. □ 0 □ 1 □ 2 □ 3 □ 4 □ 5 □ 6 □ 7 or more
j. Clothes washing machine □ 0 □ 1 □ 2 □ 3 □ 4 □ 5 □ 6 □ 7 or more
k. External faucet…………. □ 0 □ 1 □ 2 □ 3 □ 4 □ 5 □ 6 □ 7 or more

Appendix A
284
7. Does your dwelling contain low-volume water fixtures or appliances?
□ Yes □ No □ Don’t know
8. Does your household contain a swimming pool?
□ Yes □ No
9. Are you aware low-volume water fixtures and appliances are capable of promoting
water savings?
□ Yes □ No
10.a. Are you aware rainwater can be collected, treated and used for irrigation, external
cleansing, vehicle-washing, washing clothes and flushing toilets?
□ Yes □ No
b. Would you use treated rainwater on your household for any such purposes in your
home?
□ Yes □ No
11.a. Are you aware greywater (wash water from showers and sinks) if treated, can be
used for irrigation, vehicle-washing, external cleansing and flushing toilets?
□ Yes □ No
b. Would you use recycled greywater for any such purposes in your home?
□ Yes □ No
12.a. Are you aware that if domestic wastewater is properly treated and disinfected, it can
be used for irrigation, vehicle-washing, external cleansing and flushing toilets?
□ Yes □ No
b. Would you use recycled wastewater for any such purposes in your home?
□ Yes □ No
13. a. Would you be willing to retrofit your home to install water-saving features for both
environmental and financial benefits?
□ Yes □ No
b. Please indicate how much you would be willing to invest per month.
□ I wouldn’t invest □ Below R$100 □ R$101 – R$250 □ R$251 – R$500
□ R$501 – R$750 □ R$751 – R$1,000 □ R$1,001– R$2,000 □ Above R$2001
c. For how long?
□ I wouldn’t invest □ Below 1 month □ 1 – 6 months □ 6 months – 1 year
□ 1 – 2.5 years □ 2.5 – 5 years □ 5 - 10 years □ Above 10 years

Appendix A
285
14.a. In the last years, has your dwelling taken any action to conserve water?
□ Yes □ No □ Don’t know
b. If yes, what types of actions have you taken to conserve water?
□ Repaired visible leaks □ Used less water (behavioural
actions)
□ Installed water-saving fittings, fixtures or
appliances
□ Installed water-reuse systems
□ Other (please
specify)_______________________________________________________________
15. How important is it for you to conserve water on a regular basis?
□ Not Important □ Important □ Very important
16. To what degree are you concerned with the future of Brazil’s natural hydrological
resources?
□ Not concerned □ Concerned □ Very concerned

Appendix B Flat Survey Questionnaire

Appendix B
287
This survey is part of a PhD study at the Department of Architecture, Oxford Brookes
University, UK, on domestic water conservation in the Federal District, Brazil. The
questionnaire has been designed to analyse social and economic aspects of domestic
water consumption, as well as public awareness and acceptance of water conservation
strategies. You are under no obligation to participate, feel free to withdraw from the
survey at any time without giving a reason, but your kind contribution would be greatly
appreciated. This will only take a short amount of your time, and your answers will be
kept strictly confidential, private and anonymous. If you are unhappy answering any of
the questions, say so and we will move directly to the next question. The information
collected and the data generated shall be retained and safely stored in accordance with
the University’s policy of Academic Integrity. Participants who wish to be provided with
information on the findings and outcomes of the project will be sent a summary report.
This questionnaire has been approved by the University Research Ethics Committee,
but if you have any concerns about the conduct of this survey, please feel free to contact
the Chair of the UREC at Oxford Brookes University ([email protected]).
Please tick (√) or provide your most appropriate response for each question. If you
require any further forms or if you want any further information about the
survey, or would like to ask any questions please contact:
Mr Daniel Sant’Ana
Telephone: +55 (61) 3307-2454
Email: [email protected]

Appendix B
288
1. How many people live in your flat? _______________
2. Is your home fully owned, being paid off or rented?
□ Owned fully / fully paid off □ Buying / paying off home
□ Renting from private sector □ Renting from public sector
3. In average, what is the dwelling’s total monthly income?
□ Less than R$380 □ R$381 – R$1,900 □ R$1,901 – R$3,800
□ R$3,801 – R$7,600 □ Above R$7,601 □ Don’t know
4. In average, how much do you spend with monthly water bills?
□ Less than R$25 □ R$25 – R$50 □ R$50 – R$75 □ Above R$75 □ Don’t know
5. a. In your opinion, current pricing of supplied water is:
□ Expensive □ Fair □ Cheap
b. Do you think current prices of mains water encourage water conservation?
□ Yes □ No □ Don’t know
c. Do you feel that buildings who consume an amount well above average should pay
an additional fee or rate for their water?
□ Yes □ No □ Don’t know
d. Do you feel that buildings who consume an amount well below average should pay a
discounted fee or rate for their water?
□ Yes □ No □ Don’t know
6. Please indicate how many of the following water fixtures and appliances you have in
your home.
a. Toilet….……………… □ 0 □ 1 □ 2 □ 3 □ 4 □ 5 □ 6 □ 7 or more
b. Bidets………………… □ 0 □ 1 □ 2 □ 3 □ 4 □ 5 □ 6 □ 7 or more
c. Shower head………….. □ 0 □ 1 □ 2 □ 3 □ 4 □ 5 □ 6 □ 7 or more
d. Bathtub……………….. □ 0 □ 1 □ 2 □ 3 □ 4 □ 5 □ 6 □ 7 or more
e. Bathroom sink………….. □ 0 □ 1 □ 2 □ 3 □ 4 □ 5 □ 6 □ 7 or more
f. Kitchen sink…………... □ 0 □ 1 □ 2 □ 3 □ 4 □ 5 □ 6 □ 7 or more
g. Dishwashing machine….. □ 0 □ 1 □ 2 □ 3 □ 4 □ 5 □ 6 □ 7 or more
h. Utility sink water tap… □ 0 □ 1 □ 2 □ 3 □ 4 □ 5 □ 6 □ 7 or more
i. Manual clothes washer….. □ 0 □ 1 □ 2 □ 3 □ 4 □ 5 □ 6 □ 7 or more
j. Clothes washing machine. □ 0 □ 1 □ 2 □ 3 □ 4 □ 5 □ 6 □ 7 or more
7. Does your flat contain low-volume water fixtures or appliances?
□ Yes □ No □ Don’t know
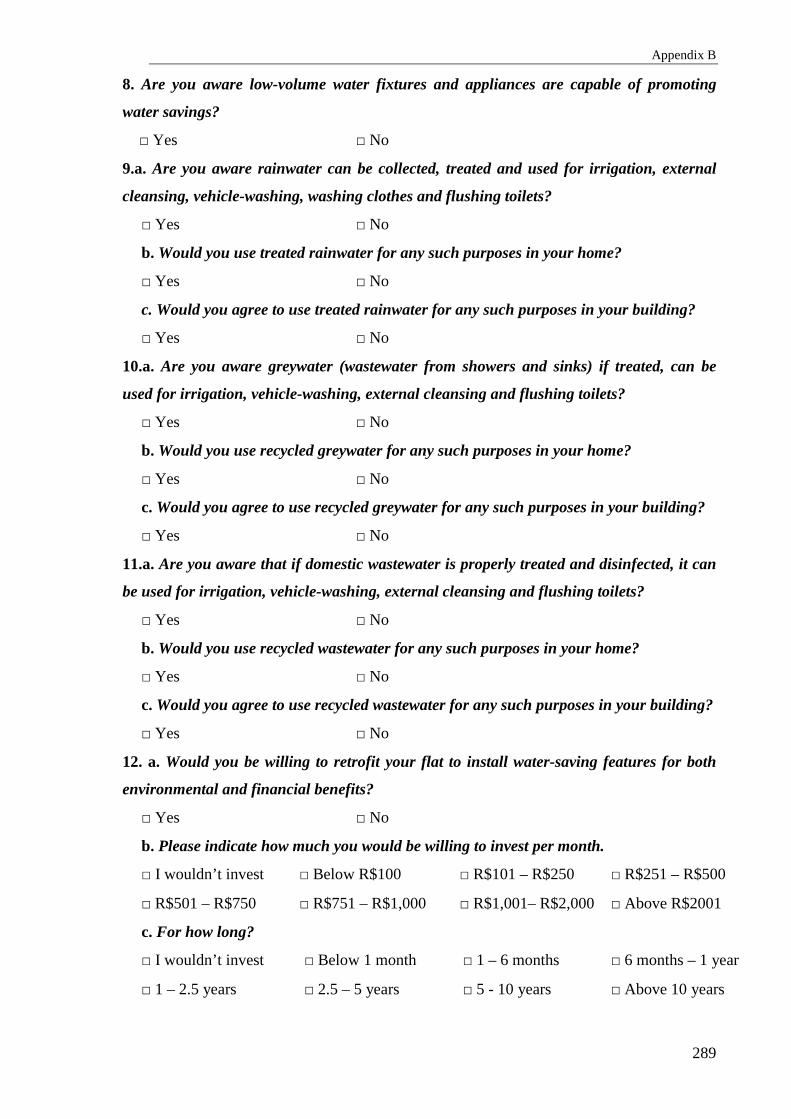
Appendix B
289
8. Are you aware low-volume water fixtures and appliances are capable of promoting
water savings?
□ Yes □ No
9.a. Are you aware rainwater can be collected, treated and used for irrigation, external
cleansing, vehicle-washing, washing clothes and flushing toilets?
□ Yes □ No
b. Would you use treated rainwater for any such purposes in your home?
□ Yes □ No
c. Would you agree to use treated rainwater for any such purposes in your building?
□ Yes □ No
10.a. Are you aware greywater (wastewater from showers and sinks) if treated, can be
used for irrigation, vehicle-washing, external cleansing and flushing toilets?
□ Yes □ No
b. Would you use recycled greywater for any such purposes in your home?
□ Yes □ No
c. Would you agree to use recycled greywater for any such purposes in your building?
□ Yes □ No
11.a. Are you aware that if domestic wastewater is properly treated and disinfected, it can
be used for irrigation, vehicle-washing, external cleansing and flushing toilets?
□ Yes □ No
b. Would you use recycled wastewater for any such purposes in your home?
□ Yes □ No
c. Would you agree to use recycled wastewater for any such purposes in your building?
□ Yes □ No
12. a. Would you be willing to retrofit your flat to install water-saving features for both
environmental and financial benefits?
□ Yes □ No
b. Please indicate how much you would be willing to invest per month.
□ I wouldn’t invest □ Below R$100 □ R$101 – R$250 □ R$251 – R$500
□ R$501 – R$750 □ R$751 – R$1,000 □ R$1,001– R$2,000 □ Above R$2001
c. For how long?
□ I wouldn’t invest □ Below 1 month □ 1 – 6 months □ 6 months – 1 year
□ 1 – 2.5 years □ 2.5 – 5 years □ 5 - 10 years □ Above 10 years
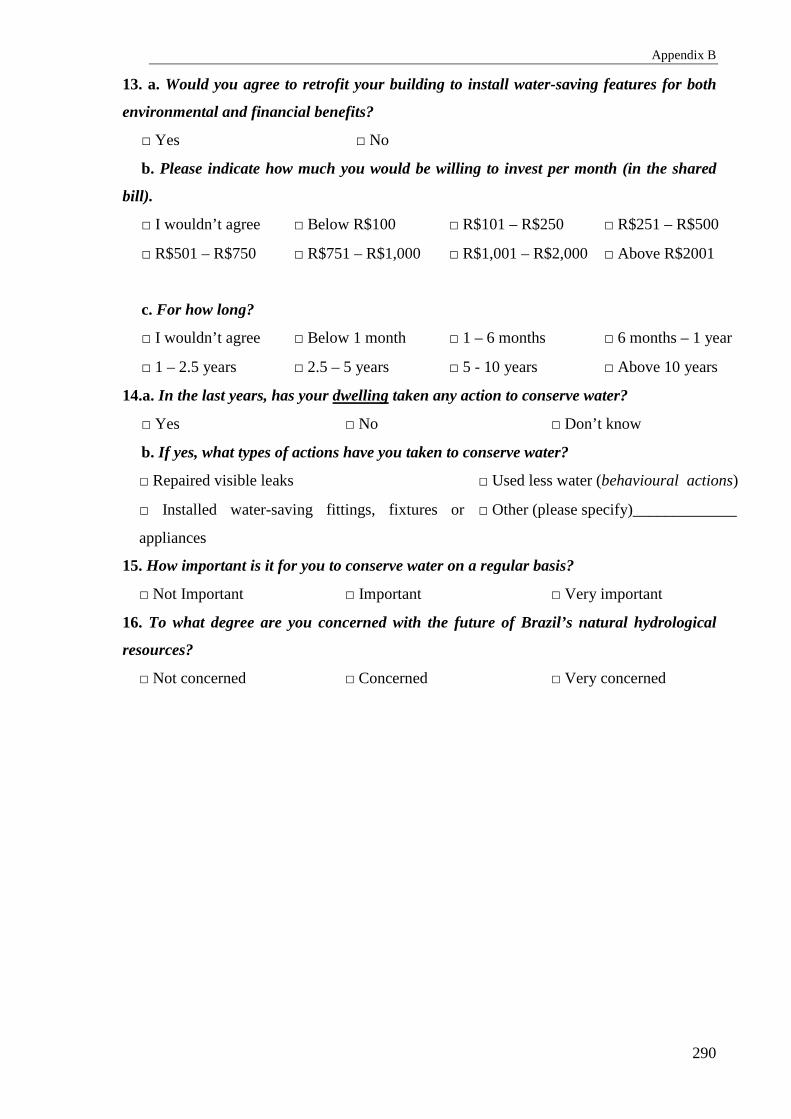
Appendix B
290
13. a. Would you agree to retrofit your building to install water-saving features for both
environmental and financial benefits?
□ Yes □ No
b. Please indicate how much you would be willing to invest per month (in the shared
bill).
□ I wouldn’t agree □ Below R$100 □ R$101 – R$250 □ R$251 – R$500
□ R$501 – R$750 □ R$751 – R$1,000 □ R$1,001 – R$2,000 □ Above R$2001
c. For how long?
□ I wouldn’t agree □ Below 1 month □ 1 – 6 months □ 6 months – 1 year
□ 1 – 2.5 years □ 2.5 – 5 years □ 5 - 10 years □ Above 10 years
14.a. In the last years, has your dwelling taken any action to conserve water?
□ Yes □ No □ Don’t know
b. If yes, what types of actions have you taken to conserve water?
□ Repaired visible leaks □ Used less water (behavioural actions)
□ Installed water-saving fittings, fixtures or
appliances
□ Other (please specify)_____________
15. How important is it for you to conserve water on a regular basis?
□ Not Important □ Important □ Very important
16. To what degree are you concerned with the future of Brazil’s natural hydrological
resources?
□ Not concerned □ Concerned □ Very concerned

Appendix C House Water Audit Questionnaire

Appendix C
292
This survey is part of a PhD study at the Department of Architecture, Oxford Brookes
University, UK, on domestic water conservation in the Federal District, Brazil. The
water audit will be carried out to identify end-use water consumption patterns through
an in-depth interview, taking water measurements and you and your family will be
asked to keep track of your water-use events. This questionnaire is part of the water
audit, and it has been designed to analyse social and economic aspects of domestic
water consumption, as well as public awareness and acceptance of water conservation
strategies. You are under no obligation to participate, feel free to withdraw from the
survey at any time without giving a reason, but your kind contribution would be greatly
appreciated. Your house has been carefully selected to carry out a water audit amongst
a few others, and due to the small sample size, there might be implications towards your
anonymity. If you are unhappy answering any of the questions, say so and we will move
directly to the next question. The information collected and the data generated shall be
retained and safely stored in accordance with the University’s policy of Academic
Integrity. Participants who wish to be provided with information on the findings and
outcomes of the project will be sent a summary report. This questionnaire has been
approved by the University Research Ethics Committee, but if you have any concerns
about the conduct of this survey, please feel free to contact the Chair of the UREC at
Oxford Brookes University ([email protected]).
Please tick (√) or provide your most appropriate response for each question. If you
require any further forms or if you want any further information about the
survey, or would like to ask any questions please contact:
Mr Daniel Sant’Ana
Telephone: +55 (61) 3307-2454
Email: [email protected]

Appendix C
293
1. a. Does your home contain a swimming pool?
□ Yes □ No
b. If Yes, how often is it cleaned?___________________________________________
c. How is it cleaned? ______________________________________________________
2. Does the household contain ornamental water features such as fountains?
□ Yes □ No
3. Please indicate how many of the following water efficient fixtures and appliances you
have in your home.
a. Toilet………………….... □ 0 □ 1 □ 2 □ 3 □ 4 □ 5 □ 6 □ 7 or more
b. Bidets…………………... □ 0 □ 1 □ 2 □ 3 □ 4 □ 5 □ 6 □ 7 or more
c. Shower head……………. □ 0 □ 1 □ 2 □ 3 □ 4 □ 5 □ 6 □ 7 or more
d. Bathtub…………………. □ 0 □ 1 □ 2 □ 3 □ 4 □ 5 □ 6 □ 7 or more
e. Bathroom faucet.……….. □ 0 □ 1 □ 2 □ 3 □ 4 □ 5 □ 6 □ 7 or more
f. Kitchen tap..…………….. □ 0 □ 1 □ 2 □ 3 □ 4 □ 5 □ 6 □ 7 or more
g. Dishwashing machine….. □ 0 □ 1 □ 2 □ 3 □ 4 □ 5 □ 6 □ 7 or more
h. Utility sink water tap..…. □ 0 □ 1 □ 2 □ 3 □ 4 □ 5 □ 6 □ 7 or more
i. Manual clothes washer….. □ 0 □ 1 □ 2 □ 3 □ 4 □ 5 □ 6 □ 7 or more
j. Clothes washing machine. □ 0 □ 1 □ 2 □ 3 □ 4 □ 5 □ 6 □ 7 or more
k. External faucet…………. □ 0 □ 1 □ 2 □ 3 □ 4 □ 5 □ 6 □ 7 or more
4. a. Does your dwelling make use of rainwater?
□ Yes □ No
b. If yes, please indicate where rainwater is reused and describe the process.
________________________________________________________________________
________________________________________________________________________
5. a. Does your dwelling make use of greywater?
□ Yes □ No
b. If yes, please indicate where greywater is reused and describe the process.
_______________________________________________________________________
________________________________________________________________________
6. a. Does your dwelling make use of recycled wastewater?
□ Yes □ No
b. If yes, please indicate where greywater is reused and describe the process.
________________________________________________________________________
________________________________________________________________________

Appendix C
294
7. a. On average, how often are dishes washed in your household?
□ < once a week □ 1-2 times a week □ 3-4 times a week □ 5-6 times a week
□ once a day □ 2 times a day □ 3 times a day □ > 3 times a day
b. Usually, how are dishes washed in your household?
□ By hands, with running water at all time □ By hands, controlling the fixture opening
□ By hands – plugged sink □ Dishwasher
□ Other (specify) _________________________________________________________
c. Are the dishes usually rinsed?
□ No, never (dishwasher) □ Yes, only before washing
□ Yes, only after washing □ Yes, before and after washing
□ Other (specify) _________________________________________________________
d. If machine washed, do you use economy settings to your dishwasher?
□ Yes □ No □ Not Applicable
8. a. How are clothes usually washed in your household?
□ Hand washed □ Part is hand washed only, the remaining is machine washed
□ Machine washed □ Part is pre-handwashed before machine washed, the remaining is
machine washed
□ Other (Specify) ________________________________________________________
b. If machine washed, do you use economy settings to your washing machine?
□ Yes □ No □ Not Applicable
c. On average, how often is a load of clothes washed in your household? ____________
9.a. How many vehicles are used in your house?
□ None □ 1 vehicle □ 2 vehicles □ 3 vehicles □ 4 vehicles □ More than 4 vehicles
b. On average, how often are they washed in your household? ____________________
c. What equipment is normally used?
□ Broom □ Bucket of water and mop
□ Hand-held hose without trigger □ Hand-held hose with trigger
□ Pressurized hose (WAP) □ Other (specify) __________________
10.a. On average, how often are sidewalks, driveways or other external surfaces around
your residence cleaned?
□ Never □ < once a month □ Once a month
□ > once a month □ once a week □ > once a week

Appendix C
295
b. What equipment is normally used?
□ Broom only □ Bucket of water & broom
□ Hand-held hose without trigger □ Hand-held hose with trigger
□ Pressurized hose (WAP) □ Other (please specify) ______________
11.a. During the dry season (April – September), in average, how often do you irrigate
your garden?
□ Never □ < once a month □ once a month □ > once a month
□ once a week □ > once a week □ once a day □ > once a day
b. If you irrigate your garden, which portion is irrigated?
□ The entire garden □ A good portion □ A small portion
c. During the rainy season (October – March), in average, how often do you irrigate
your garden?
□ Never □ < once a month □ once a month □ > once a month
□ once a week □ > once a week □ once a day □ > once a day
d. If you irrigate your garden, which portion is irrigated?
□ The entire garden □ A good portion □ A small portion
e. What equipment is usually used to water your garden?
□ Hand-held garden hose without trigger □ Hand-held garden hose with trigger
□ Soaker hose □ Sub-surface irrigation
□ Sprinklers □ Automatic irrigation system with timer
□ Automatic irrigation system with sensor □ Other (specify)______________________
12.a. In the last years, has your dwelling taken any action to conserve water?
□ Yes □ No □ Don’t know
b. If yes, which actions have you and your family taken to reduce your mains water
consumption?
□ Change in habits of dishwashing □ Change in habits of personal water use
□ Change in habits of floor washing □ Change in habits of clothes washing
□ Change in habits of garden irrigation □ Change in habits of car washing
□ Install water efficient equipment □ Leak repair
□ Install a rainwater reuse system □ Install a greywater reuse system
□ Install a wastewater reuse system □ Other (specify) ____________________
13. Which actions would you and your family take to reduce your water consumption?
□ Nothing □ Change in habits of personal water use
□ Change in habits of dishwashing □ Change in habits of clothes washing

Appendix C
296
□ Change in habits of floor washing □ Change in habits of car washing
□ Change in habits of garden irrigation □ Leak repair
□ Install water efficient equipment □ Install a rainwater reuse system
□ Install a greywater reuse system □ Install a wastewater reuse system
□ Other (specify) ________________________________________________________

Appendix D Flat Water Audit Questionnaire

Appendix D
298
This survey is part of a PhD study at the Department of Architecture, Oxford Brookes
University, UK, on domestic water conservation in the Federal District, Brazil. The
water audit will be carried out to identify end-use water consumption patterns through
an in-depth interview, taking water measurements and you and your family will be
asked to keep track of your water-use events. This questionnaire is part of the water
audit, and it has been designed to analyse social and economic aspects of domestic
water consumption, as well as public awareness and acceptance of water conservation
strategies. You are under no obligation to participate, feel free to withdraw from the
survey at any time without giving a reason, but your kind contribution would be greatly
appreciated. Your house has been carefully selected to carry out a water audit amongst
a few others, and due to the small sample size, there might be implications towards your
anonymity. If you are unhappy answering any of the questions, say so and we will move
directly to the next question. The information collected and the data generated shall be
retained and safely stored in accordance with the University’s policy of Academic
Integrity. Participants who wish to be provided with information on the findings and
outcomes of the project will be sent a summary report. This questionnaire has been
approved by the University Research Ethics Committee, but if you have any concerns
about the conduct of this survey, please feel free to contact the Chair of the UREC at
Oxford Brookes University ([email protected]).
Please tick (√) or provide your most appropriate response for each question. If you
require any further forms or if you want any further information about the
survey, or would like to ask any questions please contact:
Mr Daniel Sant’Ana
Telephone: (61) 3307-2454
Email: [email protected]

Appendix D
299
1. a. Does your home contain a swimming pool?
□ Yes □ No
b. If Yes, how often is it cleaned?___________________________________________
c. How is it cleaned? ______________________________________________________
2. Please indicate how many of the following water efficient fixtures and appliances you
have in your home.
a. Toilet………………….... □ 0 □ 1 □ 2 □ 3 □ 4 □ 5 □ 6 □ 7 or more
b. Bidets…………………... □ 0 □ 1 □ 2 □ 3 □ 4 □ 5 □ 6 □ 7 or more
c. Shower head……………. □ 0 □ 1 □ 2 □ 3 □ 4 □ 5 □ 6 □ 7 or more
d. Bathtub…………………. □ 0 □ 1 □ 2 □ 3 □ 4 □ 5 □ 6 □ 7 or more
e. Bathroom faucet.……….. □ 0 □ 1 □ 2 □ 3 □ 4 □ 5 □ 6 □ 7 or more
f. Kitchen tap..…………….. □ 0 □ 1 □ 2 □ 3 □ 4 □ 5 □ 6 □ 7 or more
g. Dishwashing machine….. □ 0 □ 1 □ 2 □ 3 □ 4 □ 5 □ 6 □ 7 or more
h. Utility sink water tap..…. □ 0 □ 1 □ 2 □ 3 □ 4 □ 5 □ 6 □ 7 or more
i. Manual clothes washer….. □ 0 □ 1 □ 2 □ 3 □ 4 □ 5 □ 6 □ 7 or more
j . Clothes washing machine. □ 0 □ 1 □ 2 □ 3 □ 4 □ 5 □ 6 □ 7 or more
k. External faucet…………. □ 0 □ 1 □ 2 □ 3 □ 4 □ 5 □ 6 □ 7 or more
3. a. On average, how often are dishes washed in your household?
□ < once a week □ 1-2 times a week □ 3-4 times a week □ 5-6 times a week
□ once a day □ 2 times a day □ 3 times a day □ > 3 times a day
b. Usually, how are dishes washed in your household?
□ By hands, with running water at all time □ By hands, controlling the fixture opening
□ By hands – plugged sink □ Dishwasher
□ Other (specify) _________________________________________________________
c. Are the dishes usually rinsed?
□ No, never (dishwasher) □ Yes, only before washing
□ Yes, only after washing □ Yes, before and after washing
□ Other (specify) _________________________________________________________
d. If machine washed, do you use economy settings to your dishwasher?
□ Yes □ No □ Not Applicable
4. a. How are clothes usually washed in your household?
□ Hand washed □ Part is hand washed only, the remaining is machine washed
□ Machine washed □ Part is pre-handwashed before machine washed, the remaining is

Appendix D
300
machine washed
□ Other (Specify) ________________________________________________________
b. If machine washed, do you use economy settings to your washing machine?
□ Yes □ No □ Not Applicable
c. On average, how often is a load of clothes washed in your household? ____________
5.a. In the last years, has your dwelling taken any action to conserve water?
□ Yes □ No □ Don’t know
b. If yes, which actions have you and your family taken to reduce your mains water
consumption?
□ Change in habits of dishwashing □ Change in habits of personal water use
□ Change in habits of floor washing □ Change in habits of clothes washing
□ Change in habits of garden irrigation □ Change in habits of car washing
□ Install water efficient equipment □ Leak repair
□ Install a rainwater reuse system □ Install a greywater reuse system
□ Install a wastewater reuse system □ Other (specify) ____________________
6. Which actions would you and your family take to reduce your water consumption?
□ Nothing □ Change in habits of personal water use
□ Change in habits of dishwashing □ Change in habits of clothes washing
□ Change in habits of floor washing □ Change in habits of car washing
□ Change in habits of garden irrigation □ Leak repair
□ Install water efficient equipment □ Install a rainwater reuse system
□ Install a greywater reuse system □ Install a wastewater reuse system
□ Other (specify) ________________________________________________________

Appendix E Residential Building Block Survey

Appendix E
302
This survey is part of a PhD study at the Department of Architecture, Oxford Brookes
University, UK, on domestic water conservation in the Federal District, Brazil. The
questionnaire has been designed to analyse social and economic aspects of domestic
water consumption, as well as public awareness and acceptance of water conservation
strategies. You are under no obligation to participate, feel free to withdraw from the
survey at any time without giving a reason, but your kind contribution would be greatly
appreciated. This will only take a short amount of your time, and your answers will be
kept strictly confidential, private and anonymous. If you are unhappy answering any of
the questions, say so and we will move directly to the next question. The information
collected and the data generated shall be retained and safely stored in accordance with
the University’s policy of Academic Integrity. Participants who wish to be provided with
information on the findings and outcomes of the project will be sent a summary report.
This questionnaire has been approved by the University Research Ethics Committee,
but if you have any concerns about the conduct of this survey, please feel free to contact
the Chair of the UREC at Oxford Brookes University ([email protected]).
Please tick (√) or provide your most appropriate response for each question. If you
require any further forms or if you want any further information about the
survey, or would like to ask any questions please contact:
Mr Daniel Sant’Ana
Telephone: +55 (61) 3307-2454
Email: [email protected]

Appendix E
303
1. How many flats per floor are there in the building? ____________________________
2. In average, how much water does the building consume in a monthly basis?
Water meter 1:_________________m3 Water meter 2 (If existant):____________m3
3. In average, how much does the building spend with monthly water bills? R$________
4. In average, how much is the monthly condominium bill? R$____________________
5. a. Is the building sub-metered?
□ Yes □ No
6. How many of the following water fixtures and appliances are available on the
building’s communal grounds?
a. Toilet……………............ □ 0 □ 1 □ 2 □ 3 □ 4 □ 5 □ 6 □ 7 or more
b. Shower head……………. □ 0 □ 1 □ 2 □ 3 □ 4 □ 5 □ 6 □ 7 or more
c. Bathroom sink………….. □ 0 □ 1 □ 2 □ 3 □ 4 □ 5 □ 6 □ 7 or more
d. Kitchen sink……………. □ 0 □ 1 □ 2 □ 3 □ 4 □ 5 □ 6 □ 7 or more
e. Utility sink……………… □ 0 □ 1 □ 2 □ 3 □ 4 □ 5 □ 6 □ 7 or more
f. External faucet………….. □ 0 □ 1 □ 2 □ 3 □ 4 □ 5 □ 6 □ 7 or more
7. Does the building contain a communal swimming pool?
□ Yes □ No
8. Please indicate if the building presents leakage on any of the following places, and
quantify them.
a. Toilet………………….... □ 0 □ 1 □ 2 □ 3 □ 4 □ 5 □ 6 □ 7 or more
b. Shower head……………. □ 0 □ 1 □ 2 □ 3 □ 4 □ 5 □ 6 □ 7 or more
c. Bathroom sink………….. □ 0 □ 1 □ 2 □ 3 □ 4 □ 5 □ 6 □ 7 or more
d. Kitchen sink……………. □ 0 □ 1 □ 2 □ 3 □ 4 □ 5 □ 6 □ 7 or more
e. Utility sink……………… □ 0 □ 1 □ 2 □ 3 □ 4 □ 5 □ 6 □ 7 or more
f. External faucet………….. □ 0 □ 1 □ 2 □ 3 □ 4 □ 5 □ 6 □ 7 or more
g. Swimming pool………… □ 0 □ 1 □ 2 □ 3 □ 4 □ 5 □ 6 □ 7 or more
h. Pipework……………….. □ 0 □ 1 □ 2 □ 3 □ 4 □ 5 □ 6 □ 7 or more
9.a. On average, how often are sidewalks, communal areas, driveways or other external
surfaces around the building cleaned?
□ Never □ Less than once a month □ Once a month
□ More than once a month □ Once a week □ More than once a week

Appendix E
304
b. What equipment is normally used?
□ Broom only □ Bucket of water & broom
□ Hand-held hose without trigger □ Hand-held hose with trigger
□ Pressurized hose (WAP) □ Other (please specify) _____________
10.a. During the dry season (April – September), in average, how often are the gardens
irrigated?
□ No garden □ Never □ Less than once a month □ Once a month
□ > a once a month □ Once a week □ More than once a week □ Once a day
b. During the rainy season (October – March), in average, how often are the gardens
irrigated?
□ No garden □ Never □ Less than once a month □ Once a month
□ > once a month □ Once a week □ More than once a week □ Once a day
c. What equipment is used to water the gardens?
□ No garden □ Hand-held garden hose without trigger
□ Hand-held garden hose with trigger □ Soaker hose
□ Sprinklers □ Underground irrigation system
□ Automatic irrigation system (timer) □ Automatic irrigation system (sensor)
□ Other (please specify) _______________________________________________________
11.a. In the last years, has the building taken any action to conserve water?
□ Yes □ No
b. If yes, what types of actions has the building taken to conserve water?
□ Repaired leaks □ Installed water-saving fittings, fixtures or appliances
□ Installed water-reuse systems □ Other (please specify) ____________________________
12. To what degree is the building concerned with saving water?
□ Not concerned □ Concerned □ Very concerned

Appendix F Diary-Tracking Cards

Appendix F
306
Diary-Tracking Card for Toilet Flushing
Day No. of Flushes
Day 1
Day 2
Day 3
Day 4
Day 5
Day 6
Day 7
Please indicate the number of times the toilet has been flushed per day.
Example: = 7 = 7 IIIIIII = 7 XXXXXXX = 7
Diary-Tracking Card for Washing Machine and Dishwashers
Load Day Type of Program Selected
1.
2.
3.
4.
5.
6.
7.
8.
9.
10.
For each washing load, please indicate the day and type of program selected.

Appendix G Diary-Tracking Summary Card

Appendix G
308
Example of Diary-Tracking Summary Card
DAILY READINGS FROM STOP-WATCHES
Address
Water Fixture Day 1 Day 2 Day 3 Day 4 Day 5 Day 6 Day 7
Bathroom 1
Lavatory Faucet
Shower Head
Bidet / Hand Douche
Toilet Flush
Bathroom 2
Lavatory Faucet
Shower Head
Bidet / Hand Douche
Toilet Flush
Kitchen
Kitchen Faucet
Water Filter
Laundry / Utility Room
Utility Sink Faucet
Washing Machine
Garden / Yard
External Tap

Appendix H Water Audit Inventory Form

Appendix H
310
Background Information Dwelling Address: Owner: No. of Residents: Building Type: Built Area: Garden / Yard Area: Roof Area: No. of Bathrooms: Swimming Pool Volume: Meter Reading Before Audit: Meter Reading After Audit: Start Date: End Date:
General Consumption Is the dwelling mains connected? � Yes � Partially � No If Partially, Specify water source(s): _________________________________________________, and points used ________________________________________________________ If No, Specify water source:____________________________________________________ Metered Readings Is the dwelling individually metered? � Yes � No If Yes, is a copy of the water bill available? � Yes � No Notes _____________________________________________________________________________________________________________________________________________________________________________________________________________________________________________________________________________________________________________________________________________________________________________________________________________________________________________________________________________________________________________________________________________________________________________________________________________________________________________ Drawings

Appendix H
311
Bathrooms Toilets
No. ID. Model/Type Type of Flush
Flush Vol. Leak?
1. 2. 3. 4. 5. Bidets / Hand Douches
Sink Faucets
No. ID. Model/Type Aerator? Flow Vol. Leak?
1. 2. 3. 4. 5. Bath Faucets
No. ID. Model/Type Flow Vol. Leak?
1. 2. 3. 4. 5. 6. Shower Head No. ID. Model/Type Flow Vol. Leak? 1. 2. 3. 4. 5.
No. ID. Model/Type Flow Vol. Leak? 1. 2. 3. 4. 5.

Appendix H
312
Kitchen Kitchen sink
No. Model/Type Aerator? Flow Vol. Leak?
1. 2. 3. 4. 5. Dishwasher
No. Model/Type Load Capacity
Design Vol. Leak?
1. 2. Utility Area Washing Machine
No. Model/Type Load Capacity
Design Vol. Leak?
1. 2. Utility Sink Faucet
No. Model/Type Flow Vol. Leak?
1. 2. External Area External Taps / Other
No. Model/Type Flow Vol. Leak?
1. 2. 3. 4. 5.

Appendix I Capital Costs of Automatic Irrigation System

Appendix I
314
Capital Costs of Automatic Irrigation System
Code Description Un. Quant. Unit Price Total
1. AUTOMATIC IRRIGATION SPRINKLER SYSTEM R$ 1,145.81
1.1. Adjustable range pop-up sprinkler 5 R$ 18.33 R$ 91.66
1.2. System connector set 2 R$ 42.37 R$ 84.74
1.3. Water computer for automated irrigation 1 R$ 262.97 R$ 262.97
1.4. L-piece male thread for sprinkler connection DN25 5 R$ 8.71 R$ 43.53
1.5. T-piece - female thread DN25 2 R$ 13.41 R$ 26.83
1.6. T-piece for pipe branching DN25 3 R$ 14.07 R$ 42.21
1.7. Female thread connector DN25 2 R$ 7.13 R$ 14.25
1.8. Connector DN25 2 R$ 9.39 R$ 18.78
1.9. Drain valve DN25 2 R$ 24.59 R$ 49.18
1.10. 50m Connecting pipe DN25 1 R$ 167.85 R$ 167.85
1.11. Irrigation control system 1 R$ 223.81 R$ 223.81
1.12. Installation cost R$ 120.00

Appendix J Performance of Rainwater Harvesting Systems
for High Income Dwellings

Appendix J
316
BASELINE END-USE WATER CONSUMPTION SCENARIO: REUSE 1
A = 111m2, Cr = 0.9, Cf = 0.9
Month R (mm/month)
S (m
3/month)
Q (m
3/month)
Rainwater Storage Volume
1 m3 5 m3 10 m3 15 m3 20 m3 25 m3 30 m3 35 m3
Jan 269 24 7 1.0 5 10 15 17 17 17 17 Feb 214 19 7 1.0 5 10 15 20 25 29 29 Mar 185 17 7 1.0 5 10 15 20 25 30 35 Apr 111 10 7 1.0 5 10 15 20 25 30 35 May 31 3 7 -3.3 1 6 11 16 21 26 31 Jun 5 0 7 -6.6 -6 -1 4 9 14 19 24 Jul 7 1 7 -6.5 -6 -6 -2 3 8 13 18 Aug 10 1 7 -6.2 -6 -6 -6 -4 1 6 11 Sep 38 3 7 -3.7 -4 -4 -4 -4 -2 3 8 Oct 148 13 7 1.0 5 6 6 6 6 9 14 Nov 197 18 7 1.0 5 10 15 17 17 20 25 Dec 287 26 7 1.0 5 10 15 20 25 30 35
Water Savings (m3/yr) 59 63 68 73 78 83 85 85

Appendix J
317
BASELINE END-USE WATER CONSUMPTION SCENARIO: REUSE 2
A = 176m2, Cr = 0.9, Cf = 0.9
Month R (mm/month)
S (m
3/month)
Q (m
3/month)
Rainwater Storage Volume
1 m3 5 m3 10 m3 15 m3 20 m3 25 m3 30 m3 35 m3 40m3 45 m3
Jan 269 38 12 1 5 10 15 20 25 26 26 26 38 Feb 214 31 12 1 5 10 15 20 25 30 35 40 45 Mar 185 26 12 1 5 10 15 20 25 30 35 40 45 Apr 111 16 12 1 5 10 15 20 25 30 35 40 45 May 31 4 12 -7 -3 2 7 12 17 22 27 32 42 Jun 5 1 12 -11 -11 -9 -4 1 6 11 16 21 36 Jul 7 1 12 -11 -11 -11 -11 -10 -5 -0.3 5 10 30 Aug 10 1 12 -11 -11 -11 -11 -11 -11 -11 -6 -1 24 Sep 38 5 12 -7 -7 -7 -7 -7 -7 -7 -7 -7 23 Oct 148 21 12 1 5 9 9 9 9 9 9 9 37 Nov 197 28 12 1 5 10 15 20 25 25 25 25 45 Dec 287 41 12 1 5 10 15 20 25 30 35 40 45
Water Savings (m3/yr)
99 103 108 113 118 123 128 133 138 146

Appendix J
318
BASELINE END-USE WATER CONSUMPTION SCENARIO: REUSE 3
A = 264m2, Cr = 0.9, Cf = 0.9
Month R (mm/month)
S (m
3/month)
Q (m
3/month)
Rainwater Storage Volume
10 m3 20 m3 30m3 40 m3 50 m3 60 m3 70 m3 80 m3
Jan 269 58 19 10 20 30 38 38 38 38 38
Feb 214 46 19 10 20 30 40 50 60 65 65
Mar 185 40 19 10 20 30 40 50 60 70 80
Apr 111 24 19 10 20 30 40 50 60 70 80
May 31 7 19 -2 8 18 28 38 48 58 68
Jun 5 1 19 -18 -10 -0.4 10 20 30 40 50
Jul 7 1 19 -18 -18 -18 -8 2 12 22 32
Aug 10 2 19 -17 -17 -17 -17 -15 -5 5 15
Sep 38 8 19 -11 -11 -11 -11 -11 -11 -6 4
Oct 148 32 19 10 13 13 13 13 13 13 17
Nov 197 42 19 10 20 30 36 36 36 36 40
Dec 287 61 19 10 20 30 40 50 60 70 80
Water Savings (m3/yr) 163 173 183 193 203 213 223 229

Appendix J
319
REDUCED END-USE WATER CONSUMPTION SCENARIO: REUSE 1
A = 26m2, Cr = 0.9, Cf = 0.9
Month R (mm/month)
S (m
3/month)
Q (m
3/month)
Rainwater Storage Volume
1 m3 5 m3 10 m3
Jan 269 6 2 1 4 4 Feb 214 5 2 1 5 7 Mar 185 4 2 1 5 9 Apr 111 2 2 1 5 10 May 31 1 2 0 4 9 Jun 5 0 2 -2 2 7 Jul 7 0 2 -2 1 6 Aug 10 0 2 -1 -1 4 Sep 38 1 2 -1 -1 3 Oct 148 3 2 1 1 5 Nov 197 4 2 1 4 7 Dec 287 6 2 1 5 10
Water Savings (m3/yr) 15 19 20
REDUCED END-USE WATER CONSUMPTION SCENARIO: REUSE 2
A = 52m2, Cr = 0.9, Cf = 0.9
Month R (mm/month)
S (m
3/month)
Q (m
3/month)
Rainwater Storage Volume
1 m3 5 m3 10 m3 15 m3
Jan 269 11 4 1 5 8 8 Feb 214 9 4 1 5 10 13 Mar 185 8 4 1 5 10 15 Apr 111 5 4 1 5 10 15 May 31 1 4 -1 3 8 13 Jun 5 0 4 -3 -1 4 9 Jul 7 0 4 -3 -3 1 6 Aug 10 0 4 -3 -3 -3 2 Sep 38 2 4 -2 -2 -2 0 Oct 148 6 4 1 3 3 3 Nov 197 8 4 1 5 7 7 Dec 287 12 4 1 5 10 15
Water Savings (m3/yr) 31 35 40 44

Appendix J
320
REDUCED END-USE WATER CONSUMPTION SCENARIO: REUSE 3
A = 110m2, Cr = 0.9, Cf = 0.9
Month R (mm/month)
S (m
3/month)
Q (m
3/month)
Rainwater Storage Volume
1 m3 5 m3 10 m3 15 m3 20 m3 25 m3 30m3 35 m3
Jan 269 24 8 1 5 10 15 16 16 16 16 Feb 214 19 8 1 5 10 15 20 25 27 27 Mar 185 16 8 1 5 10 15 20 25 30 35 Apr 111 10 8 1 5 10 15 20 25 30 35 May 31 3 8 -4 -0.5 5 10 15 20 25 30 Jun 5 0 8 -8 -8 -3 2 7 12 17 22 Jul 7 1 8 -8 -8 -8 -6 -1 4 9 14 Aug 10 1 8 -7 -7 -7 -7 -7 -3 2 7 Sep 38 3 8 -5 -5 -5 -5 -5 -5 -3 2 Oct 148 13 8 1 5 5 5 5 5 5 7 Nov 197 18 8 1 5 10 14 14 14 14 16 Dec 287 26 8 1 5 10 15 20 25 30 34
Water Savings (m3/yr) 67 70 76 81 86 91 96 99

Appendix K Performance of Rainwater Harvesting Systems
for Mid-High Income Dwellings

Appendix K
322
BASELINE END-USE WATER CONSUMPTION SCENARIO: REUSE 1
A = 200m2, Cr = 0.9, Cf = 0.9
Month R (mm/month)
S (m
3/month)
Q (m
3/month)
Rainwater Storage Volume
1 m3 10 m3 20 m3 30 m3 40 m3 50 m3 60 m3 70 m3
Jan 269 44 16 1 10 20 28 28 28 28 28
Feb 214 35 16 1 10 20 30 40 47 47 47
Mar 185 30 16 1 10 20 30 40 50 60 61
Apr 111 18 16 1 10 20 30 40 50 60 63
May 31 5 16 -11 -1 9 19 29 39 49 53
Jun 5 1 16 -15 -15 -6 4 14 24 34 38
Jul 7 1 16 -15 -15 -15 -10 0 10 20 23
Aug 10 2 16 -14 -14 -14 -14 -14 -4 6 9
Sep 38 6 16 -10 -10 -10 -10 -10 -10 -4 0
Oct 148 24 16 1 8 8 8 8 8 8 8
Nov 197 32 16 1 10 20 24 24 24 24 24
Dec 287 46 16 1 10 20 30 40 50 50 55
Water Savings (m3/yr) 125 135 145 155 165 175 185 189

Appendix K
323
BASELINE END-USE WATER CONSUMPTION SCENARIO: REUSE 2
Unfeasible, because demand greatly exceeds supply due to the lack of roof area.
If, � = k × l × V × F
Q = Annual Rainwater Demand (litres) R = Average Annual Rainfall (mm) A = Roof Area (m2) Cr = Runoff Coefficient Cf = Filter Coefficient
Then, lpqx = �k� × V × F
Q = Annual Rainwater Demand (litres) R = Average Annual Rainfall (mm) A = Roof Area (m2) Cr = Runoff Coefficient Cf = Filter Coefficient
Hence,
Amin = 2,890,000
1,502 × 0.9 × 0.9 = 2,376m2
Available Roof Area = 1,095m2
0
500
1000
1500
2000
2500
3000
3500
Jan Feb Mar Apr May Jun Jul Aug Sep Oct Nov Dec
Cumulative Rainwater Supply Cumulative Rainwater Demand

Appendix K
324
BASELINE END-USE WATER CONSUMPTION SCENARIO: REUSE 3
Unfeasible, because demand greatly exceeds supply due to the lack of roof area.
If, � = k × l × V × F
Q = Annual Rainwater Demand (litres) R = Average Annual Rainfall (mm) A = Roof Area (m2) Cr = Runoff Coefficient Cf = Filter Coefficient
Then, lpqx = �k� × V × F
Q = Annual Rainwater Demand (litres) R = Average Annual Rainfall (mm) A = Roof Area (m2) Cr = Runoff Coefficient Cf = Filter Coefficient
Hence,
Amin = 8,365,000
1,502 × 0.9 × 0.9 = 6,876m2
Available Roof Area = 1,095m2
0
1000
2000
3000
4000
5000
6000
7000
8000
9000
Jan Feb Mar Apr May Jun Jul Aug Sep Oct Nov Dec
Cummulative Rainwater Supply Cummulative Rainwater Demand

Appendix K
325
REDUCED END-USE WATER CONSUMPTION SCENARIO: REUSE 1
A = 47m2, Cr = 0.9, Cf = 0.9
Month R (mm/month)
S (m
3/month)
Q (m
3/month)
Rainwater Storage Volume
1 m3 5 m3 10 m3 15 m3
Jan 269 10 4 1 5 7 7 Feb 214 8 4 1 5 10 11 Mar 185 7 4 1 5 10 14 Apr 111 4 4 1 5 10 15 May 31 1 4 -2 2 7 12 Jun 5 0 4 -4 -1 4 9 Jul 7 0 4 -3 -3 1 5 Aug 10 0 4 -3 -3 -3 2 Sep 38 1 4 -2 -2 -2 0 Oct 148 6 4 1 2 2 2 Nov 197 7 4 1 5 6 6 Dec 287 11 4 1 5 10 13
Water Savings (m3/yr) 30 34 39 44
REDUCED END-USE WATER CONSUMPTION SCENARIO: REUSE 2
A = 1,095m2, Cr = 0.9, Cf = 0.9
Month R (mm/month)
S (m
3/month)
Q (m
3/month)
Rainwater Storage Volume
20 m3 40 m3 60 m3 80 m3 100m3
Jan 269 239 98 20 40 60 80 100 Feb 214 190 98 20 40 60 80 100 Mar 185 164 98 20 40 60 80 100 Apr 111 98 98 20 40 60 80 100 May 31 27 98 -51 -31 -11 9 29 Jun 5 4 98 -94 -94 -94 -85 -65 Jul 7 6 98 -92 -92 -92 -92 -92 Aug 10 9 98 -89 -89 -89 -89 -89 Sep 38 34 98 -65 -65 -65 -65 -65 Oct 148 131 98 20 33 33 33 33 Nov 197 175 98 20 40 60 76 76 Dec 287 255 98 20 40 60 80 100
Water Savings (m3/yr) 788 808 828 848 868

Appendix K
326
REDUCED END-USE WATER CONSUMPTION SCENARIO: REUSE 3
Unfeasible, because demand greatly exceeds supply due to the lack of roof area.
If, � = k × l × V × F
Q = Annual Rainwater Demand (litres) R = Average Annual Rainfall (mm) A = Roof Area (m2) Cr = Runoff Coefficient Cf = Filter Coefficient
Then, lpqx = �k� × V × F
Q = Annual Rainwater Demand (litres) R = Average Annual Rainfall (mm) A = Roof Area (m2) Cr = Runoff Coefficient Cf = Filter Coefficient
Hence,
Amin = 4,278,000
1,502 × 0.9 × 0.9 = 3,523m2
Available Roof Area = 1,095m2
0
500
1000
1500
2000
2500
3000
3500
4000
4500
5000
Jan Feb Mar Apr May Jun Jul Aug Sep Oct Nov Dec
Cummulative Rainwater Supply Cummulative Rainwater Demand

Appendix L Performance of Rainwater Harvesting Systems
for Mid-Low Income Dwellings

Appendix L
328
BASELINE END-USE WATER CONSUMPTION SCENARIO: REUSE 1
A = 21m2, Cr = 0.9, Cf = 0.9
Month R (mm/month)
S (m
3/month)
Q (m
3/month)
Rainwater Storage Volume
1 m3 5 m3 10 m3
Jan 269 5 2 1 3 3 Feb 214 4 2 1 5 5 Mar 185 3 2 1 5 7 Apr 111 2 2 1 5 7 May 31 1 2 0 4 6 Jun 5 0 2 -2 2 4 Jul 7 0 2 -1 1 3 Aug 10 0 2 -1 0 1 Sep 38 1 2 -1 -1 1 Oct 148 3 2 1 1 1 Nov 197 3 2 1 3 3 Dec 287 5 2 1 5 7
Water Savings (m3/yr) 14 18 19

Appendix L
329
BASELINE END-USE WATER CONSUMPTION SCENARIO: REUSE 2
A = 71m2, Cr = 0.9, Cf = 0.9
Month R (mm/month)
S (m
3/month)
Q (m
3/month)
Rainwater Storage Volume
1 m3 5 m3 10 m3 15 m3 20 m3 25 m3
Jan 269 15 6 1 5 10 10 10 10
Feb 214 12 6 1 5 10 15 17 17
Mar 185 11 6 1 5 10 15 20 22
Apr 111 6 6 1 5 10 15 20 23
May 31 2 6 -3 1 6 11 16 19
Jun 5 0 6 -5 -4 1 6 11 13
Jul 7 0 6 -5 -5 -4 1 6 8
Aug 10 1 6 -5 -5 -5 -4 1 3
Sep 38 2 6 -3 -3 -3 -3 -3 0
Oct 148 9 6 1 3 3 3 0 3
Nov 197 11 6 1 5 9 9 6 9
Dec 287 17 6 1 5 10 15 17 20
Water Savings (m3/yr) 45 49 54 59 64 67

Appendix L
330
BASELINE END-USE WATER CONSUMPTION SCENARIO: REUSE 3
A = 130m2, Cr = 0.9, Cf = 0.9
Month R (mm/month)
S (m
3/month)
Q (m
3/month)
Rainwater Storage Volume
5 m3 10 m3 15 m3 20 m3 25 m3 30m3 35 m3 40 m3
Jan 269 28 11 5 10 15 17 17 17 17 17
Feb 214 23 11 5 10 15 20 25 28 28 28
Mar 185 19 11 5 10 15 20 25 30 35 36
Apr 111 12 11 5 10 15 20 25 30 35 37
May 31 0 11 -6 -1 4 9 14 19 24 25
Jun 5 1 11 -11 -11 -7 -2 3 8 13 15
Jul 7 1 11 -11 -11 -11 -11 -8 -3 2 4
Aug 10 1 11 -10 -10 -10 -10 -10 -10 -8 -6
Sep 38 4 11 -7 -7 -7 -7 -7 -7 -7 -7
Oct 148 16 11 4 4 4 4 4 4 4 4
Nov 197 21 11 5 10 14 14 14 14 14 14
Dec 287 30 11 5 10 15 20 25 30 33 33
Water Savings (m3/yr) 91 96 101 106 111 116 121 122

Appendix L
331
REDUCED END-USE WATER CONSUMPTION SCENARIO: REUSE 1
A = 13m2, Cr = 0.9, Cf = 0.9
Month R (mm/month)
S (m
3/month)
Q (m
3/month)
Rainwater Storage
1 m3 5 m3
Jan 269 3 1 1 2 Feb 214 2 1 1 3 Mar 185 2 1 1 4 Apr 111 1 1 1 4 May 31 0 1 0 4 Jun 5 0 1 -1 3 Jul 7 0 1 -1 2 Aug 10 0 1 -1 1 Sep 38 0 1 -1 0 Oct 148 2 1 1 1 Nov 197 2 1 1 2 Dec 287 3 1 1 4
Water Savings (m3/yr) 9 12
REDUCED END-USE WATER CONSUMPTION SCENARIO: REUSE 2
A = 35m2, Cr = 0.9, Cf = 0.9
Month R (mm/month)
S (m
3/month)
Q (m
3/month)
Rainwater Storage Volume
1 m3 5 m3 10 m3 15 m3
Jan 269 8 3 1 5 5 5 Feb 214 6 3 1 5 8 8 Mar 185 5 3 1 5 10 11 Apr 111 3 3 1 5 10 11 May 31 1 3 -1 3 8 9 Jun 5 0 3 -3 1 6 7 Jul 7 0 3 -3 -2 3 4 Aug 10 0 3 -2 -2 1 2 Sep 38 1 3 -2 -2 -1 0 Oct 148 4 3 1 1 1 2 Nov 197 6 3 1 4 4 4 Dec 287 8 3 1 5 10 10
Water Savings (m3/yr) 23 27 32 33

Appendix L
332
REDUCED END-USE WATER CONSUMPTION SCENARIO: REUSE 3
A = 83m2, Cr = 0.9, Cf = 0.9
Month R (mm/month)
S (m
3/month)
Q (m
3/month)
Rainwater Storage Volume
1 m3 5 m3 10 m3 15 m3 20 m3 25 m3 30m3
Jan 269 18 6 1 5 10 12 12 12 12 Feb 214 14 6 1 5 10 15 19 19 19 Mar 185 12 6 1 5 10 15 20 25 25 Apr 111 7 6 1 5 10 15 20 25 26 May 31 2 6 -3 1 6 11 16 21 22 Jun 5 0 6 -6 -6 -1 4 9 14 16 Jul 7 0 6 -6 -6 -6 -2 3 8 10 Aug 10 1 6 -6 -6 -6 -6 -2 3 4 Sep 38 3 6 -4 -4 -4 -4 -4 -1 0 Oct 148 10 6 1 3 3 3 3 3 4 Nov 197 13 6 1 5 10 10 10 10 10 Dec 287 19 6 1 5 10 15 20 23 23
Water Savings (m3/yr) 53 57 62 67 72 77 78

Appendix M Performance of Rainwater Harvesting Systems
for Low Income Dwellings

Appendix M
334
BASELINE END-USE WATER CONSUMPTION SCENARIO: REUSE 1
A = 17m2, Cr = 0.9, Cf = 0.9
Month R (mm/month)
S (m
3/month)
Q (m
3/month)
Rainwater Storage
1 m3 5 m3
Jan 269 4 1 1 2 Feb 214 3 1 1 4 Mar 185 3 1 1 5 Apr 111 2 1 1 5 May 31 0 1 0 4 Jun 5 0 1 -1 3 Jul 7 0 1 -1 2 Aug 10 0 1 -1 1 Sep 38 1 1 -1 0 Oct 148 2 1 1 1 Nov 197 3 1 1 2 Dec 287 4 1 1 5
Water Savings (m3/yr) 11 15
BASELINE END-USE WATER CONSUMPTION SCENARIO: REUSE 2
A = 52m2, Cr = 0.9, Cf = 0.9
Month R (mm/month)
S (m
3/month)
Q (m
3/month)
Rainwater Storage Volume
5 m3 10 m3 15 m3 20 m3
Jan 269 11 4 5 7 7 7 Feb 214 9 4 5 10 12 12 Mar 185 8 4 5 10 15 16 Apr 111 5 4 5 10 15 16 May 31 1 4 2 7 12 13 Jun 5 0 4 -2 3 8 10 Jul 7 0 4 -4 -1 4 6 Aug 10 0 4 -4 -4 1 2 Sep 38 2 4 -3 -3 -2 0 Oct 148 6 4 2 2 2 2 Nov 197 8 4 5 6 6 6 Dec 287 12 4 5 10 14 14
Water Savings (m3/yr) 34 38 43 49

Appendix M
335
BASELINE END-USE WATER CONSUMPTION SCENARIO: REUSE 3
A = 97m2, Cr = 0.9, Cf = 0.9
Month R (mm/month)
S (m
3/month)
Q (m
3/month)
Rainwater Storage Volume
5 m3 10 m3 15 m3 20 m3 25 m3 30m3
Jan 269 21 8 5 10 13 13 13 13 Feb 214 17 8 5 10 15 20 21 21 Mar 185 15 8 5 10 15 20 25 28 Apr 111 9 8 5 10 15 20 25 28 May 31 2 8 -1 4 9 14 19 22 Jun 5 0 8 -8 -4 1 6 11 14 Jul 7 1 8 -8 -8 -6 -1 4 7 Aug 10 1 8 -8 -8 -8 -8 -4 -1 Sep 38 3 8 -5 -5 -5 -5 -5 -6 Oct 148 12 8 3 3 3 3 3 3 Nov 197 15 8 5 10 11 11 11 11 Dec 287 23 8 5 10 15 20 25 25
Water Savings (m3/yr) 70 75 80 85 90 93

Appendix M
336
REDUCED END-USE WATER CONSUMPTION SCENARIO: REUSE 1
A = 12m2, Cr = 0.9, Cf = 0.9
Month R (mm/month)
S (m
3/month)
Q (m
3/month)
Rainwater Storage
1 m3 5 m3
Jan 269 3 1 1 2 Feb 214 2 1 1 3 Mar 185 2 1 1 4 Apr 111 1 1 1 4 May 31 0 1 0 4 Jun 5 0 1 0 3 Jul 7 0 1 -1 2 Aug 10 0 1 -1 1 Sep 38 0 1 -1 1 Oct 148 1 1 1 1 Nov 197 2 1 1 2 Dec 287 3 1 1 4
Water Savings (m3/yr) 8 10
REDUCED END-USE WATER CONSUMPTION SCENARIO: REUSE 2
A = 28m2, Cr = 0.9, Cf = 0.9
Month R (mm/month)
S (m
3/month)
Q (m
3/month)
Rainwater Storage Volume
1 m3 5 m3 10 m3
Jan 269 6 2 1 4 4 Feb 214 5 2 1 5 7 Mar 185 4 2 1 5 8 Apr 111 3 2 1 5 9 May 31 1 2 -1 3 7 Jun 5 0 2 -2 1 5 Jul 7 0 2 -2 -1 3 Aug 10 0 2 -2 -2 1 Sep 38 1 2 -1 -1 0 Oct 148 3 2 1 1 1 Nov 197 4 2 1 3 3 Dec 287 7 2 1 5 8
Water Savings (m3/yr) 19 23 27

Appendix M
337
REDUCED END-USE WATER CONSUMPTION SCENARIO: REUSE 3
A = 97m2, Cr = 0.9, Cf = 0.9
Month R (mm/month)
S (m
3/month)
Q (m
3/month)
Rainwater Storage Volume
1 m3 5 m3 10 m3 15 m3 20 m3
Jan 269 14 5 1 5 9 9 9 Feb 214 11 5 1 5 10 15 15 Mar 185 9 5 1 5 10 15 19 Apr 111 6 5 1 5 10 15 20 May 31 2 5 -2 2 7 12 16 Jun 5 0 5 -5 -3 2 7 12 Jul 7 0 5 -5 -5 -3 2 7 Aug 10 1 5 -4 -4 -4 -2 3 Sep 38 2 5 -3 -3 -3 -3 0 Oct 148 8 5 1 3 3 3 3 Nov 197 10 5 1 5 8 8 8 Dec 287 15 5 1 5 10 15 17
Water Savings (m3/yr) 41 45 50 55 59

Appendix N Cost of Rainwater Harvesting Systems

Appendix N
339
RAINWATER CISTERNS
Code Description Measure Quant. Unit Price Total
1. 1m3 RAINWATER CISTERN R$ 411.15
1.1. 1m3 polyethelyne rainwater butt r=1.40 h=0.85 1 R$ 342.90 R$ 342.90
1.2. Polyethylene inlet hose DN32 1 R$ 15.70 R$ 15.70
1.3. PVC conector for rainwater butt DN32 1 R$ 12.55 R$ 12.55
1.4. Installation cost R$ 40.00
2. 5m
3 RAINWATER CISTERN R$ 3,997.50
2.1. 5m3 polyethelyne rainwater cistern r=2.24 h=1.83 1 R$ 3,327.00 R$ 3,327.00
2.2. Calmed smoothing inlet DN100 1 R$ 31.80 R$ 31.80
2.3. 3m PVC calmed inlet pipe DN100 1 R$ 17.20 R$ 17.20
2.4. 90o PVC long curve elbow connection DN100 1 R$ 29.80 R$ 29.80
2.5. Overflow siphon with backflow prevention valve DN100 1 R$ 47.70 R$ 47.70
2.6. Backflow and vermin retention valve DN100 1 R$ 30.00 R$ 30.00
2.7. Floating suction filter with flexible hose and connection DN25 1 R$ 514.00 R$ 514.00
2.8. Site preparation and installation cost R$ 320.00
3. 10m
3 RAINWATER CISTERN R$ 4,563.50
3.1. 10m3 polyethelyne rainwater cistern r=2.24 h=3.22 1 R$ 4,407.00 R$ 4,407.00
3.2. Calmed smoothing inlet DN100 1 R$ 31.80 R$ 31.80
3.3. 3m PVC calmed inlet pipe DN100 1 R$ 17.20 R$ 17.20
3.4. 90o PVC long curve elbow connection DN100 1 R$ 29.80 R$ 29.80
3.5. Overflow siphon with backflow prevention valve DN100 1 R$ 47.70 R$ 47.70
3.6. Backflow and vermin retention valve DN100 1 R$ 30.00 R$ 30.00
3.7. Floating suction filter with flexible hose and connection DN25 1 R$ 514.00 R$ 514.00
3.8. Site preparation and installation cost R$ 480.00
3. 15m
3 RAINWATER CISTERN R$ 7,228.50
3.1. 15m3 polyethelyne rainwater cistern r=1.35 h=3.60 1 R$ 5,918.00 R$ 5,918.00
3.2. Calmed smoothing inlet DN100 1 R$ 31.80 R$ 31.80
3.3. 3m PVC calmed inlet pipe DN100 1 R$ 17.20 R$ 17.20
3.4. 90o PVC long curve elbow connection DN100 1 R$ 29.80 R$ 29.80
3.5. Overflow siphon with backflow prevention valve DN100 1 R$ 47.70 R$ 47.70
3.6. Backflow and vermin retention valve DN100 1 R$ 30.00 R$ 30.00
3.7. Floating suction filter with flexible hose and connection DN25 1 R$ 514.00 R$ 514.00
3.8. Site preparation and installation cost R$ 640.00
4. 20m
3 RAINWATER CISTERN R$ 10,309.30
4.1. 10m3 polyethelyne rainwater cistern r=2.24 h=3.22 2 R$ 4,407.00 R$ 8,814.00
4.2. Tank connection set DN100 1 R$ 24.80 R$ 24.80
4.3. Calmed smoothing inlet DN100 1 R$ 31.80 R$ 31.80
4.4. 3m PVC calmed inlet pipe DN100 1 R$ 17.20 R$ 17.20
4.5. 90o PVC long curve elbow connection DN100 1 R$ 29.80 R$ 29.80
4.6. Overflow siphon with backflow prevention valve DN100 1 R$ 47.70 R$ 47.70
4.7. Backflow and vermin retention valve DN100 1 R$ 30.00 R$ 30.00
4.8. Floating suction filter with flexible hose and connection DN25 1 R$ 514.00 R$ 514.00
4.9. Site preparation and installation cost R$ 800.00
5. 25m
3 RAINWATER CISTERN R$ 11,980.30
5.1. 15m3 polyethelyne rainwater cistern r=1.35 h=3.60 1 R$ 5,918.00 R$ 5,918.00
5.2. 10m3 polyethelyne rainwater cistern r=2.24 h=3.22 1 R$ 4,407.00 R$ 4,407.00
5.3. Tank connection set DN100 1 R$ 24.80 R$ 24.80
5.4. Calmed smoothing inlet DN100 1 R$ 31.80 R$ 31.80
5.5. 3m PVC calmed inlet pipe DN100 1 R$ 17.20 R$ 17.20
5.6. 90o PVC long curve elbow connection DN100 1 R$ 29.80 R$ 29.80
5.7. Overflow siphon with backflow prevention valve DN100 1 R$ 47.70 R$ 47.70
5.8. Backflow and vermin retention valve DN100 1 R$ 30.00 R$ 30.00
5.9. Floating suction filter with flexible hose and connection DN25 1 R$ 514.00 R$ 514.00
5.10. Site preparation and installation cost R$ 960.00
Continues on the next page.

Appendix N
340
Code Description Measure Quant. Unit Price Total
6. 30m3 RAINWATER CISTERN R$ 13,651.30
6.1. 15m3 polyethelyne rainwater cistern r=1.35 h=3.60 2 R$ 5,918.00 R$ 11,836.00
6.2. Tank connection set DN100 1 R$ 24.80 R$ 24.80
6.3. Calmed smoothing inlet DN100 1 R$ 31.80 R$ 31.80
6.4. 3m PVC calmed inlet pipe DN100 1 R$ 17.20 R$ 17.20
6.5. 90o PVC long curve elbow connection DN100 1 R$ 29.80 R$ 29.80
6.6. Overflow siphon with backflow prevention valve DN100 1 R$ 47.70 R$ 47.70
6.7. Backflow and vermin retention valve DN100 1 R$ 30.00 R$ 30.00
6.8. Floating suction filter with flexible hose and connection DN25 1 R$ 514.00 R$ 514.00
6.9. Site preparation and installation cost R$ 1,120.00
7. 35m3 RAINWATER CISTERN R$ 16,732.10
7.1. 10m3 polyethelyne rainwater cistern r=2.24 h=3.22 2 R$ 4,407.00 R$ 8,814.00
7.2. 15m3 polyethelyne rainwater cistern r=1.35 h=3.60 1 R$ 5,918.00 R$ 5,918.00
7.3. Tank connection set DN100 2 R$ 24.80 R$ 49.60
7.4. Calmed smoothing inlet DN100 1 R$ 31.80 R$ 31.80
7.5. 3m PVC calmed inlet pipe DN100 1 R$ 17.20 R$ 17.20
7.6. 90o PVC long curve elbow connection DN100 1 R$ 29.80 R$ 29.80
7.7. Overflow siphon with backflow prevention valve DN100 1 R$ 47.70 R$ 47.70
7.8. Backflow and vermin retention valve DN100 1 R$ 30.00 R$ 30.00
7.9. Floating suction filter with flexible hose and connection DN25 1 R$ 514.00 R$ 514.00
7.10. Site preparation and installation cost R$ 1,280.00
8. 40m3 RAINWATER CISTERN R$ 18,403.10
8.1. 10m3 polyethelyne rainwater cistern r=2.24 h=3.22 1 R$ 4,407.00 R$ 4,407.00
8.2. 15m3 polyethelyne rainwater cistern r=1.35 h=3.60 2 R$ 5,918.00 R$ 11,836.00
8.3. Tank connection set DN100 2 R$ 24.80 R$ 49.60
8.4. Calmed smoothing inlet DN100 1 R$ 31.80 R$ 31.80
8.5. 3m PVC calmed inlet pipe DN100 1 R$ 17.20 R$ 17.20
8.6. 90o PVC long curve elbow connection DN100 1 R$ 29.80 R$ 29.80
8.7. Overflow siphon with backflow prevention valve DN100 1 R$ 47.70 R$ 47.70
8.8. Backflow and vermin retention valve DN100 1 R$ 30.00 R$ 30.00
8.9. Floating suction filter with flexible hose and connection DN25 1 R$ 514.00 R$ 514.00
8.10. Site preparation and installation cost R$ 1,440.00
9. 45m3 RAINWATER CISTERN R$ 20,074.10
9.1. 15m3 polyethelyne rainwater cistern r=1.35 h=3.60 3 R$ 5,918.00 R$ 17,754.00
9.2. Tank connection set DN100 2 R$ 24.80 R$ 49.60
9.3. Calmed smoothing inlet DN100 1 R$ 31.80 R$ 31.80
9.4. 3m PVC calmed inlet pipe DN100 1 R$ 17.20 R$ 17.20
9.5. 90o PVC long curve elbow connection DN100 1 R$ 29.80 R$ 29.80
9.6. Overflow siphon with backflow prevention valve DN100 1 R$ 47.70 R$ 47.70
9.7. Backflow and vermin retention valve DN100 1 R$ 30.00 R$ 30.00
9.8. Floating suction filter with flexible hose and connection DN25 1 R$ 514.00 R$ 514.00
9.9. Site preparation and installation cost R$ 1,600.00
Continues on the next page.

Appendix N
341
Code Description Measure Quant. Unit Price Total
10. 50m3 RAINWATER CISTERN R$ 27,510.50
10.1. 50m3 concrete rainwater cistern 5.00x3.33x3.00 1 R$ 25,000.00 R$ 25,000.00
10.2. Calmed smoothing inlet DN100 1 R$ 31.80 R$ 31.80
10.3. 3m PVC calmed inlet pipe DN100 1 R$ 17.20 R$ 17.20
10.4. 90o PVC long curve elbow connection DN100 1 R$ 29.80 R$ 29.80
10.5. Overflow siphon with backflow prevention valve DN100 1 R$ 47.70 R$ 47.70
10.6. Backflow and vermin retention valve DN100 1 R$ 30.00 R$ 30.00
10.7. Floating suction filter with flexible hose and connection DN25 1 R$ 514.00 R$ 514.00
10.8. Site preparation and installation cost R$ 1,840.00
11. 60m
3 RAINWATER CISTERN R$ 32,830.50
11.1. 60m3 concrete rainwater cistern 5.00x4.00x3.00 1 R$ 30,000.00 R$ 30,000.00
11.2. Calmed smoothing inlet DN100 1 R$ 31.80 R$ 31.80
11.3. 3m PVC calmed inlet pipe DN100 1 R$ 17.20 R$ 17.20
11.4. 90o PVC long curve elbow connection DN100 1 R$ 29.80 R$ 29.80
11.5. Overflow siphon with backflow prevention valve DN100 1 R$ 47.70 R$ 47.70
11.6. Backflow and vermin retention valve DN100 1 R$ 30.00 R$ 30.00
11.7. Floating suction filter with flexible hose and connection DN25 1 R$ 514.00 R$ 514.00
11.8. Site preparation and installation cost R$ 2,160.00
12. 70m
3 RAINWATER CISTERN R$ 38,150.50
12.1. 70m3 concrete rainwater cistern 5.00x4.67x3.00 1 R$ 35,000.00 R$ 35,000.00
12.2. Calmed smoothing inlet DN100 1 R$ 31.80 R$ 31.80
12.3. 3m PVC calmed inlet pipe DN100 1 R$ 17.20 R$ 17.20
12.4. 90o PVC long curve elbow connection DN100 1 R$ 29.80 R$ 29.80
12.5. Overflow siphon with backflow prevention valve DN100 1 R$ 47.70 R$ 47.70
12.6. Backflow and vermin retention valve DN100 1 R$ 30.00 R$ 30.00
12.7. Floating suction filter with flexible hose and connection DN25 1 R$ 514.00 R$ 514.00
12.8. Site preparation and installation cost R$ 2,480.00
13. 80m
3 RAINWATER CISTERN R$ 43,470.50
13.1. 80m3 concrete rainwater cistern 5.33x5.00x3.00 1 R$ 40,000.00 R$ 40,000.00
13.2. Calmed smoothing inlet DN100 1 R$ 31.80 R$ 31.80
13.3. 3m PVC calmed inlet pipe DN100 1 R$ 17.20 R$ 17.20
13.4. 90o PVC long curve elbow connection DN100 1 R$ 29.80 R$ 29.80
13.5. Overflow siphon with backflow prevention valve DN100 1 R$ 47.70 R$ 47.70
13.6. Backflow and vermin retention valve DN100 1 R$ 30.00 R$ 30.00
13.7. Floating suction filter with flexible hose and connection DN25 1 R$ 514.00 R$ 514.00
13.8. Site preparation and installation cost R$ 2,800.00
14. 90m
3 RAINWATER CISTERN R$ 48,790.50
14.1. 90m3 concrete rainwater cistern 6.00x5.00x3.00 1 R$ 45,000.00 R$ 45,000.00
14.2. Calmed smoothing inlet DN100 1 R$ 31.80 R$ 31.80
14.3. 3m PVC calmed inlet pipe DN100 1 R$ 17.20 R$ 17.20
14.4. 90o PVC long curve elbow connection DN100 1 R$ 29.80 R$ 29.80
14.5. Overflow siphon with backflow prevention valve DN100 1 R$ 47.70 R$ 47.70
14.6. Backflow and vermin retention valve DN100 1 R$ 30.00 R$ 30.00
14.7. Floating suction filter with flexible hose and connection DN25 1 R$ 514.00 R$ 514.00
14.8. Site preparation and installation cost R$ 3,120.00
15. 100m
3 RAINWATER CISTERN R$ 54,110.50
15.1. 100m3 concrete rainwater cistern 6.67x5.00x3.00 1 R$ 50,000.00 R$ 50,000.00
15.2. Calmed smoothing inlet DN100 1 R$ 31.80 R$ 31.80
15.3. 3m PVC calmed inlet pipe DN100 1 R$ 17.20 R$ 17.20
15.4. 90o PVC long curve elbow connection DN100 1 R$ 29.80 R$ 29.80
15.5. Overflow siphon with backflow prevention valve DN100 1 R$ 47.70 R$ 47.70
15.6. Backflow and vermin retention valve DN100 1 R$ 30.00 R$ 30.00
15.7. Floating suction filter with flexible hose and connection DN25 1 R$ 514.00 R$ 514.00
15.8. Site preparation and installation cost R$ 3,440.00

Appendix N
342
HIGH INCOME DWELLINGS
Baseline water end-use consumption scenario – Reuse 1
Code Description Un. Quant. Unit Price Total
1. RAINWATER COLLECTION PIPEWORK R$ 1,165.50
1.1. 3m PVC gutter 132x89 4 R$ 51.25 R$ 205.00
1.2. Gutter union bracket 132x89 3 R$ 14.10 R$ 42.30
1.3. Gutter support bracket 132x89 20 R$ 4.70 R$ 94.00
1.4. Gutter running outlet 132x89 1 R$ 26.90 R$ 26.90
1.5. External stop end 132x89 2 R$ 7.15 R$ 14.30
1.7. 60o PVC offset bends DN80 2 R$ 10.90 R$ 21.80
1.8. 3m PVC Downpipe DN80 1 R$ 46.00 R$ 46.00
1.9. Downpipe bracket DN80 2 R$ 5.20 R$ 10.40
1.10. PVC "T" connection with inspection acess DN80 1 R$ 11.95 R$ 11.95
1.11. 90o PVC downpipe transition elbow connection 80x100 1 R$ 23.25 R$ 23.25
1.12. 3m PVC collection pipe DN100 3 R$ 17.20 R$ 51.60
1.13. Rainwater filter DN100 1 R$ 498.00 R$ 498.00
1.14. Installation cost R$ 120.00
2. RAINWATER DRAINAGE PIPEWORK R$ 88.45
2.1. 3m PVC drainage pipe DN100 2 R$ 17.20 R$ 34.40
2.2. 45o PVC elbow connection DN100 1 R$ 5.85 R$ 5.85
2.3. PVC "T"connection DN100 1 R$ 8.20 R$ 8.20
2.4. Installation cost R$ 40.00
3. TREATED RAINWATER DISTRIBUTION PIPEWORK R$ 270.20
3.1. PVC connector with free flanges for rainwater cistern DN25 1 R$ 7.70 R$ 7.70
3.2. 3m PVC suction pipe DN25 1 R$ 4.85 R$ 4.85
3.3. 90o PVC elbow conection DN25 1 R$ 0.35 R$ 0.35
3.4. Garden water pump 1/4hp DN25 1 R$ 200.00 R$ 200.00
3.5. Hose bib garden tap kit DN25 1 R$ 17.30 R$ 17.30
3.6. Installation cost R$ 40.00
TOTAL COST R$ 1,524.15
Code Description Un. Quant. Unit Price Total
1. OPERATIONAL COSTS R$ 14.18
1.1. Garden water pump 1/4hp 450 W 105 hr/yr R$ 0,30 kwh R$ 14.18
TOTAL COST R$ 14.18

Appendix N
343
HIGH INCOME DWELLINGS
Baseline water end-use consumption scenario – Reuse 2
Code Description Un. Quant. Unit Price Total
1. RAINWATER COLLECTION PIPEWORK R$ 2,086.08
1.1. 3m PVC gutter 132x89 12 R$ 51.25 R$ 597.92
1.2. Gutter union bracket 132x89 11 R$ 14.10 R$ 150.40
1.3. Gutter support bracket 132x89 58 R$ 4.70 R$ 274.17
1.4. Gutter running outlet 132x89 1 R$ 26.90 R$ 26.90
1.5. External stop end 132x89 2 R$ 7.15 R$ 14.30
1.7. 60o PVC offset bends DN80 4 R$ 10.90 R$ 43.60
1.8. 3m PVC Downpipe DN80 2 R$ 46.00 R$ 92.00
1.9. Downpipe bracket DN80 4 R$ 5.20 R$ 20.80
1.10. PVC "T" connection with inspection acess DN80 2 R$ 11.95 R$ 23.90
1.11. 90o PVC downpipe transition elbow connection 80x100 2 R$ 23.25 R$ 46.50
1.12. 3m PVC collection pipe DN100 8 R$ 17.20 R$ 137.60
1.13. Rainwater filter DN100 1 R$ 498.00 R$ 498.00
1.14. Installation cost R$ 160.00
2. RAINWATER DRAINAGE PIPEWORK R$ 88.45
2.1. 3m PVC drainage pipe DN100 2 R$ 17.20 R$ 34.40
2.2. 45o PVC elbow connection DN100 1 R$ 5.85 R$ 5.85
2.3. PVC "T"connection DN100 1 R$ 8.20 R$ 8.20
2.3. Installation cost R$ 40.00
3. TREATED RAINWATER DISTRIBUTION PIPEWORK R$ 2,344.75
3.1. PVC connector with ring for rainwater cistern DN25 1 R$ 7.70 R$ 7.70
3.2. 3m PVC suction pipe DN25 10 R$ 4.85 R$ 48.50
3.3. 90o PVC elbow conection DN25 5 R$ 0.35 R$ 1.75
3.4. Garden water pump 1/4hp DN25 1 R$ 200.00 R$ 200.00
3.5. Hose bib garden tap kit DN25 1 R$ 17.30 R$ 17.30
3.6. Distribution water pump 1/4hp DN25 1 R$ 200.00 R$ 200.00
3.8. 500 litres rainwater loft tank 1 R$ 144.60 R$ 144.60
3.9. Distribution water pump float switch 1 R$ 29.75 R$ 29.75
3.9. Potable water feed backup set 1 R$ 1,300.00 R$ 1,300.00
3.10. PVC connector with free flanges for rainwater loft tank DN25 1 R$ 7.70 R$ 7.70
3.11. PVC connector with free flanges for rainwater loft tank DN32 2 R$ 12.55 R$ 25.10
3.12. PVC connector with free flanges for rainwater loft tank DN40 1 R$ 17.40 R$ 17.40
3.13. PVC "T" connection DN32 1 R$ 2.00 R$ 2.00
3.14. 90o PVC elbow conection DN32 1 R$ 1.25 R$ 1.25
3.15. 3m PVC overflow pipe DN32 1 R$ 15.70 R$ 15.70
3.16. PVC ball valve DN32 1 R$ 39.00 R$ 39.00
3.17. 3m PVC distribution pipe DN40 10 R$ 8.70 R$ 87.00
3.18. Installation cost R$ 200.00
TOTAL COST R$ 4,519.28
Code Description Un. Quant. Unit Price Total
1. OPERATIONAL COSTS R$ 22.55
1.1. Garden water pump 1/4hp 450 W 105 hr/yr R$ 0,30 kwh R$ 14.18
1.2. Distribution water pump 1/4hp 450 W 62 hr/yr R$ 0,30 kwh R$ 8.37
TOTAL COST R$ 22.55

Appendix N
344
HIGH INCOME DWELLINGS
Baseline water end-use consumption scenario – Reuse 3
Code Description Un. Quant. Unit Price Total
1. RAINWATER COLLECTION PIPEWORK R$ 2,934.15
1.1. 3m PVC gutter 132x89 15 R$ 51.25 R$ 768.75
1.2. Gutter union bracket 132x89 14 R$ 14.10 R$ 197.40
1.3. Gutter support bracket 132x89 75 R$ 4.70 R$ 352.50
1.4. Gutter running outlet 132x89 4 R$ 26.90 R$ 107.60
1.5. External stop end 132x89 2 R$ 7.15 R$ 14.30
1.7. 60o PVC offset bends DN80 8 R$ 10.90 R$ 87.20
1.8. 3m PVC Downpipe DN80 4 R$ 46.00 R$ 184.00
1.9. Downpipe bracket DN80 8 R$ 5.20 R$ 41.60
1.10. PVC "T" connection with inspection acess DN80 4 R$ 11.95 R$ 47.80
1.11. 90o PVC downpipe transition elbow connection 80x100 4 R$ 23.25 R$ 93.00
1.12. 3m PVC collection pipe DN100 15 R$ 17.20 R$ 258.00
1.13. 90o PVC long curve elbow connection DN100 1 R$ 29.80 R$ 29.80
1.14. PVC branch connection DN100 1 R$ 14.20 R$ 14.20
1.15. Rainwater filter DN100 1 R$ 498.00 R$ 498.00
1.16. Installation cost R$ 240.00
2. RAINWATER DRAINAGE PIPEWORK R$ 88.45
2.1. 3m PVC drainage pipe DN100 2 R$ 17.20 R$ 34.40
2.2. 45o PVC elbow connection DN100 1 R$ 5.85 R$ 5.85
2.3. PVC "T"connection DN100 1 R$ 8.20 R$ 8.20
2.3. Installation cost R$ 40.00
3. TREATED RAINWATER DISTRIBUTION PIPEWORK R$ 2,557.90
3.1. PVC connector with ring for rainwater cistern DN25 1 R$ 7.70 R$ 7.70
3.2. 3m PVC suction pipe DN25 10 R$ 4.85 R$ 48.50
3.3. 90o PVC elbow conection DN25 5 R$ 0.35 R$ 1.75
3.4. Garden water pump 1/4hp DN25 1 R$ 200.00 R$ 200.00
3.5. Hose bib garden tap kit DN25 1 R$ 17.30 R$ 17.30
3.6. Distribution water pump 1/4hp DN25 1 R$ 200.00 R$ 200.00
3.8. 1000 litres rainwater loft tank 1 R$ 250.00 R$ 250.00
3.9. Distribution water pump float switch 1 R$ 29.75 R$ 29.75
3.9. Potable water feed backup set 1 R$ 1,300.00 R$ 1,300.00
3.10. PVC connector with free flanges for rainwater loft tank DN25 1 R$ 7.70 R$ 7.70
3.11. PVC connector with free flanges for rainwater loft tank DN32 2 R$ 12.55 R$ 25.10
3.12. PVC connector with free flanges for rainwater loft tank DN40 1 R$ 17.40 R$ 17.40
3.13. PVC "T" connection DN32 1 R$ 2.00 R$ 2.00
3.14. 90o PVC elbow conection DN32 1 R$ 1.25 R$ 1.25
3.15. 3m PVC overflow pipe DN32 1 R$ 15.70 R$ 15.70
3.16. PVC ball valve DN32 1 R$ 39.00 R$ 39.00
3.17. 3m PVC distribution pipe DN40 15 R$ 8.70 R$ 130.50
3.18. 3m PVC distribution pipe DN25 5 R$ 4.85 R$ 24.25
3.19 Installation cost R$ 240.00
TOTAL COST R$ 5,580.50
Code Description Un. Quant. Unit Price Total
1. OPERATIONAL COSTS R$ 38.75
1.1. Garden water pump 1/4hp 450 W 105 hr/yr R$ 0,30 kwh R$ 14.18
1.2. Distribution water pump 1/4hp 450 W 182 hr/yr R$ 0,30 kwh R$ 24.57
TOTAL COST R$ 38.75

Appendix N
345
HIGH INCOME DWELLINGS
Reduced water end-use consumption scenario – Reuse 1
Code Description Un. Quant. Unit Price Total
1. RAINWATER COLLECTION PIPEWORK R$ 930.60
1.1. 3m PVC gutter 132x89 2 R$ 51.25 R$ 102.50
1.2. Gutter union bracket 132x89 1 R$ 14.10 R$ 14.10
1.3. Gutter support bracket 132x89 10 R$ 4.70 R$ 47.00
1.4. Gutter running outlet 132x89 1 R$ 26.90 R$ 26.90
1.5. External stop end 132x89 2 R$ 7.15 R$ 14.30
1.7. 60o PVC offset bends DN80 2 R$ 10.90 R$ 21.80
1.8. 3m PVC Downpipe DN80 1 R$ 46.00 R$ 46.00
1.9. Downpipe bracket DN80 2 R$ 5.20 R$ 10.40
1.10. PVC "T" connection with inspection acess DN80 1 R$ 11.95 R$ 11.95
1.11. 90o PVC downpipe transition elbow connection 80x100 1 R$ 23.25 R$ 23.25
1.12. 3m PVC collection pipe DN100 2 R$ 17.20 R$ 34.40
1.13. Rainwater filter DN100 1 R$ 498.00 R$ 498.00
1.14. Installation cost R$ 80.00
2. RAINWATER DRAINAGE PIPEWORK R$ 88.45
2.1. 3m PVC drainage pipe DN100 2 R$ 17.20 R$ 34.40
2.2. 45o PVC elbow connection DN100 1 R$ 5.85 R$ 5.85
2.3. PVC "T"connection DN100 1 R$ 8.20 R$ 8.20
2.4. Installation cost R$ 40.00
3. TREATED RAINWATER DISTRIBUTION PIPEWORK R$ 270.20
3.1. PVC connector with free flanges for rainwater cistern DN25 1 R$ 7.70 R$ 7.70
3.2. 3m PVC suction pipe DN25 1 R$ 4.85 R$ 4.85
3.3. 90o PVC elbow conection DN25 1 R$ 0.35 R$ 0.35
3.4. Garden water pump 1/4hp DN25 1 R$ 200.00 R$ 200.00
3.5. Hose bib garden tap kit DN25 1 R$ 17.30 R$ 17.30
3.6. Installation cost R$ 40.00
TOTAL COST R$ 1,289.25
Code Description Un. Quant. Unit Price Total
1. OPERATIONAL COSTS R$ 14.18
1.1. Garden water pump 1/4hp 450 W 105 hr/yr R$ 0,30 kwh R$ 14.18
TOTAL COST R$ 14.18

Appendix N
346
HIGH INCOME DWELLINGS
Reduced water end-use consumption scenario – Reuse 2
Code Description Un. Quant. Unit Price Total
1. RAINWATER COLLECTION PIPEWORK R$ 1,165.50
1.1. 3m PVC gutter 132x89 4 R$ 51.25 R$ 205.00
1.2. Gutter union bracket 132x89 3 R$ 14.10 R$ 42.30
1.3. Gutter support bracket 132x89 20 R$ 4.70 R$ 94.00
1.4. Gutter running outlet 132x89 1 R$ 26.90 R$ 26.90
1.5. External stop end 132x89 2 R$ 7.15 R$ 14.30
1.7. 60o PVC offset bends DN80 2 R$ 10.90 R$ 21.80
1.8. 3m PVC Downpipe DN80 1 R$ 46.00 R$ 46.00
1.9. Downpipe bracket DN80 2 R$ 5.20 R$ 10.40
1.10. PVC "T" connection with inspection acess DN80 1 R$ 11.95 R$ 11.95
1.11. 90o PVC downpipe transition elbow connection 80x100 1 R$ 23.25 R$ 23.25
1.12. 3m PVC collection pipe DN100 3 R$ 17.20 R$ 51.60
1.13. Rainwater filter DN100 1 R$ 498.00 R$ 498.00
1.14. Installation cost R$ 120.00
2. RAINWATER DRAINAGE PIPEWORK R$ 88.45
2.1. 3m PVC drainage pipe DN100 2 R$ 17.20 R$ 34.40
2.2. 45o PVC elbow connection DN100 1 R$ 5.85 R$ 5.85
2.3. PVC "T"connection DN100 1 R$ 8.20 R$ 8.20
2.3. Installation cost R$ 40.00
3. TREATED RAINWATER DISTRIBUTION PIPEWORK R$ 2,344.75
3.1. PVC connector with ring for rainwater cistern DN25 1 R$ 7.70 R$ 7.70
3.2. 3m PVC suction pipe DN25 10 R$ 4.85 R$ 48.50
3.3. 90o PVC elbow conection DN25 5 R$ 0.35 R$ 1.75
3.4. Garden water pump 1/4hp DN25 1 R$ 200.00 R$ 200.00
3.5. Hose bib garden tap kit DN25 1 R$ 17.30 R$ 17.30
3.6. Distribution water pump 1/4hp DN25 1 R$ 200.00 R$ 200.00
3.8. 500 litres rainwater loft tank 1 R$ 144.60 R$ 144.60
3.9. Distribution water pump float switch 1 R$ 29.75 R$ 29.75
3.9. Potable water feed backup set 1 R$ 1,300.00 R$ 1,300.00
3.10. PVC connector with free flanges for rainwater loft tank DN25 1 R$ 7.70 R$ 7.70
3.11. PVC connector with free flanges for rainwater loft tank DN32 2 R$ 12.55 R$ 25.10
3.12. PVC connector with free flanges for rainwater loft tank DN40 1 R$ 17.40 R$ 17.40
3.13. PVC "T" connection DN32 1 R$ 2.00 R$ 2.00
3.14. 90o PVC elbow conection DN32 1 R$ 1.25 R$ 1.25
3.15. 3m PVC overflow pipe DN32 1 R$ 15.70 R$ 15.70
3.16. PVC ball valve DN32 1 R$ 39.00 R$ 39.00
3.17. 3m PVC distribution pipe DN40 10 R$ 8.70 R$ 87.00
3.18. Installation cost R$ 200.00
TOTAL COST R$ 3,598.70
Code Description Un. Quant. Unit Price Total
1. OPERATIONAL COSTS R$ 22.55
1.1. Garden water pump 1/4hp 450 W 105 hr/yr R$ 0,30 kwh R$ 14.18
1.2. Distribution water pump 1/4hp 450 W 62 hr/yr R$ 0,30 kwh R$ 8.37
TOTAL COST R$ 22.55

Appendix N
347
HIGH INCOME DWELLINGS
Reduced water end-use consumption scenario – Reuse 3
Code Description Un. Quant. Unit Price Total
1. RAINWATER COLLECTION PIPEWORK R$ 1,360.65
1.1. 3m PVC gutter 132x89 5 R$ 51.25 R$ 256.25
1.2. Gutter union bracket 132x89 4 R$ 14.10 R$ 56.40
1.3. Gutter support bracket 132x89 25 R$ 4.70 R$ 117.50
1.4. Gutter running outlet 132x89 2 R$ 26.90 R$ 53.80
1.5. External stop end 132x89 2 R$ 7.15 R$ 14.30
1.7. 60o PVC offset bends DN80 4 R$ 10.90 R$ 43.60
1.8. 3m PVC Downpipe DN80 2 R$ 46.00 R$ 92.00
1.9. Downpipe bracket DN80 4 R$ 5.20 R$ 20.80
1.10. PVC "T" connection with inspection acess DN80 2 R$ 11.95 R$ 23.90
1.11. 90o PVC downpipe transition elbow connection 80x100 2 R$ 23.25 R$ 46.50
1.12. 3m PVC collection pipe DN100 8 R$ 17.20 R$ 137.60
1.13. Rainwater filter DN100 1 R$ 498.00 R$ 498.00
1.14. Installation cost R$ 160.00
2. RAINWATER DRAINAGE PIPEWORK R$ 88.45
2.1. 3m PVC drainage pipe DN100 2 R$ 17.20 R$ 34.40
2.2. 45o PVC elbow connection DN100 1 R$ 5.85 R$ 5.85
2.3. PVC "T"connection DN100 1 R$ 8.20 R$ 8.20
2.3. Installation cost R$ 40.00
3. TREATED RAINWATER DISTRIBUTION PIPEWORK R$ 2,688.40
3.1. PVC connector with ring for rainwater cistern DN25 1 R$ 7.70 R$ 7.70
3.2. 3m PVC suction pipe DN25 10 R$ 4.85 R$ 48.50
3.3. 90o PVC elbow conection DN25 5 R$ 0.35 R$ 1.75
3.4. Garden water pump 1/4hp DN25 1 R$ 200.00 R$ 200.00
3.5. Hose bib garden tap kit DN25 1 R$ 17.30 R$ 17.30
3.6. Distribution water pump 1/4hp DN25 1 R$ 200.00 R$ 200.00
3.8. 1000 litres rainwater loft tank 1 R$ 250.00 R$ 250.00
3.9. Distribution water pump float switch 1 R$ 29.75 R$ 29.75
3.9. Potable water feed backup set 1 R$ 1,300.00 R$ 1,300.00
3.10. PVC connector with free flanges for rainwater loft tank DN25 1 R$ 7.70 R$ 7.70
3.11. PVC connector with free flanges for rainwater loft tank DN32 2 R$ 12.55 R$ 25.10
3.12. PVC connector with free flanges for rainwater loft tank DN40 1 R$ 17.40 R$ 17.40
3.13. PVC "T" connection DN32 1 R$ 2.00 R$ 2.00
3.14. 90o PVC elbow conection DN32 1 R$ 1.25 R$ 1.25
3.15. 3m PVC overflow pipe DN32 1 R$ 15.70 R$ 15.70
3.16. PVC ball valve DN32 1 R$ 39.00 R$ 39.00
3.17. 3m PVC distribution pipe DN40 30 R$ 8.70 R$ 261.00
3.18. 3m PVC distribution pipe DN25 5 R$ 4.85 R$ 24.25
3.19 Installation cost R$ 240.00
TOTAL COST R$ 4,137.50
Code Description Un. Quant. Unit Price Total
1. OPERATIONAL COSTS R$ 38.75
1.1. Garden water pump 1/4hp 450 W 105 hr/yr R$ 0,30 kwh R$ 14.18
1.2. Distribution water pump 1/4hp 450 W 182 hr/yr R$ 0,30 kwh R$ 24.57
TOTAL COST R$ 38.75

Appendix N
348
MID-HIGH INCOME DWELLINGS
Baseline and reduced water end-use consumption scenarios – Reuse 1
Code Description Un. Quant. Unit Price Total
1. RAINWATER COLLECTION PIPEWORK R$ 1,609.55
1.1. Rainwater diversion chamber DN100/300 1 R$ 78.35 R$ 78.35
1.2. 3m PVC collection pipe DN100 1 R$ 17.20 R$ 17.20
1.3. Rainwater filter DN100 1 R$ 1,394.00 R$ 1,394.00
1.4. Installation cost R$ 120.00
2. RAINWATER DRAINAGE PIPEWORK R$ 88.45
2.1. 3m PVC drainage pipe DN100 2 R$ 17.20 R$ 34.40
2.2. 45o PVC elbow connection DN100 1 R$ 5.85 R$ 5.85
2.3. PVC "T"connection DN100 1 R$ 8.20 R$ 8.20
2.4. Installation cost R$ 40.00
3. TREATED RAINWATER DISTRIBUTION PIPEWORK R$ 270.20
3.1. PVC connector with free flanges for rainwater cistern DN25 1 R$ 7.70 R$ 7.70
3.2. 3m PVC suction pipe DN25 1 R$ 4.85 R$ 4.85
3.3. 90o PVC elbow conection DN25 1 R$ 0.35 R$ 0.35
3.4. Garden water pump 1/4hp DN25 1 R$ 200.00 R$ 200.00
3.5. Hose bib garden tap kit DN25 1 R$ 17.30 R$ 17.30
3.6. Installation cost R$ 40.00
TOTAL COST R$ 1,968.20
Code Description Un. Quant. Unit Price Total
1. OPERATIONAL COSTS R$ 25.65
1.1. Garden water pump 1/4hp 450 W 190 hr/yr R$ 0,30 kwh R$ 25.65
TOTAL COST R$ 25.65

Appendix N
349
MID-HIGH INCOME DWELLINGS
Baseline and reduced water end-use consumption scenarios – Reuse 2
Code Description Un. Quant. Unit Price Total
1. RAINWATER COLLECTION PIPEWORK R$ 6,549.00
1.12. 6m PVC collection pipe DN150 20 R$ 111.55 R$ 2,231.00
1.13. Rainwater filter DN150 2 R$ 1,979.00 R$ 3,958.00
1.14. Installation cost R$ 360.00
2. RAINWATER DRAINAGE PIPEWORK R$ 398.05
2.1. 3m PVC drainage pipe DN100 3 R$ 17.20 R$ 51.60
2.2. 45o PVC elbow connection 2 R$ 5.85 R$ 11.70
2.3. Inspection Chamber DN100/300 1 R$ 78.35 R$ 78.35
2.4. 6m PVC drainage pipe DN300 2 R$ 8.20 R$ 16.40
2.3. Installation cost R$ 240.00
3. TREATED RAINWATER DISTRIBUTION PIPEWORK R$ 5,895.35
3.1. 6m PVC suction pipe DN25 10 R$ 9.70 R$ 97.00
3.2. 90o PVC elbow conection DN25 15 R$ 0.35 R$ 5.25
3.3. Garden water pump 1/4hp DN25 1 R$ 200.00 R$ 200.00
3.4. Hose bib garden tap kit DN25 1 R$ 17.30 R$ 17.30
3.5. Distribution water pump 1hp DN25 1 R$ 400.00 R$ 400.00
3.6. 2,500 litres rainwater loft tank 2 R$ 990.40 R$ 1,980.80
3.8. Distribution water pump float switch 2 R$ 29.75 R$ 59.50
3.9. Potable water feed backup set 2 R$ 1,300.00 R$ 2,600.00
3.9. PVC connector with free flanges for rainwater loft tank DN25 2 R$ 7.70 R$ 15.40
3.10. PVC connector with free flanges for rainwater loft tank DN32 4 R$ 12.55 R$ 50.20
3.11. PVC connector with free flanges for rainwater loft tank DN40 2 R$ 17.40 R$ 34.80
3.12. PVC "T" connection DN32 2 R$ 2.00 R$ 4.00
3.13. 90o PVC elbow conection DN32 2 R$ 1.25 R$ 2.50
3.14. 6m PVC overflow pipe DN32 2 R$ 31.40 R$ 62.80
3.15. PVC ball valve DN32 2 R$ 39.00 R$ 78.00
3.16. 6m PVC distribution pipe DN40 15 R$ 17.40 R$ 261.00
3.17. 90o PVC elbow conection DN40 4 R$ 4.25 R$ 17.00
3.18. PVC "T" connection DN40 2 R$ 4.90 R$ 9.80
3.17. Installation cost R$ 600.00
TOTAL COST R$ 12,842.40
Code Description Un. Quant. Unit Price Total
1. OPERATIONAL COSTS R$ 394.34
1.1. Garden water pump 1/4hp 450 W 190 hr/yr R$ 0,30 kwh R$ 25.65
1.2. Distribution water pump 1hp 1300W 2731 hr/yr R$ 0,30 kwh R$ 368.69
TOTAL COST R$ 394.34

Appendix N
350
MID-HIGH INCOME DWELLINGS
Baseline and reduced water end-use consumption scenarios – Reuse 3
Code Description Un. Quant. Unit Price Total
1. RAINWATER COLLECTION PIPEWORK R$ 6,549.00
1.12. 6m PVC collection pipe DN150 20 R$ 111.55 R$ 2,231.00
1.13. Rainwater filter DN150 2 R$ 1,979.00 R$ 3,958.00
1.14. Installation cost R$ 360.00
2. RAINWATER DRAINAGE PIPEWORK R$ 398.05
2.1. 3m PVC drainage pipe DN100 3 R$ 17.20 R$ 51.60
2.2. 45o PVC elbow connection 2 R$ 5.85 R$ 11.70
2.3. Inspection Chamber DN100/300 1 R$ 78.35 R$ 78.35
2.4. 6m PVC drainage pipe DN300 2 R$ 8.20 R$ 16.40
2.3. Installation cost R$ 240.00
3. TREATED RAINWATER DISTRIBUTION PIPEWORK R$ 6,042.25
3.1. 6m PVC suction pipe DN25 10 R$ 9.70 R$ 97.00
3.2. 90o PVC elbow conection DN25 15 R$ 0.35 R$ 5.25
3.3. Garden water pump 1/4hp DN25 1 R$ 200.00 R$ 200.00
3.4. Hose bib garden tap kit DN25 1 R$ 17.30 R$ 17.30
3.5. Distribution water pump 1hp DN25 1 R$ 400.00 R$ 400.00
3.6. 2,500 litres rainwater loft tank 2 R$ 990.40 R$ 1,980.80
3.8. Distribution water pump float switch 2 R$ 29.75 R$ 59.50
3.9. Potable water feed backup set 2 R$ 1,300.00 R$ 2,600.00
3.9. PVC connector with free flanges for rainwater loft tank DN25 2 R$ 7.70 R$ 15.40
3.10. PVC connector with free flanges for rainwater loft tank DN32 4 R$ 12.55 R$ 50.20
3.11. PVC connector with free flanges for rainwater loft tank DN40 2 R$ 17.40 R$ 34.80
3.12. PVC "T" connection DN32 2 R$ 2.00 R$ 4.00
3.13. 90o PVC elbow conection DN32 2 R$ 1.25 R$ 2.50
3.14. 6m PVC overflow pipe DN32 2 R$ 31.40 R$ 62.80
3.15. PVC ball valve DN32 2 R$ 39.00 R$ 78.00
3.16. 6m PVC distribution pipe DN25 15 R$ 9.70 R$ 145.50
3.17. 90o PVC elbow conection DN25 4 R$ 0.35 R$ 1.40
3.18. 6m PVC distribution pipe DN40 15 R$ 17.40 R$ 261.00
3.17. 90o PVC elbow conection DN40 4 R$ 4.25 R$ 17.00
3.18. PVC "T" connection DN40 2 R$ 4.90 R$ 9.80
3.19. Installation cost R$ 680.00
TOTAL COST R$ 12,989.30
Code Description Un. Quant. Unit Price Total
1. OPERATIONAL COSTS R$ 394.34
1.1. Garden water pump 1/4hp 450 W 190 hr/yr R$ 0,30 kwh R$ 25.65
1.2. Distribution water pump 1hp 1300W 2731 hr/yr R$ 0,30 kwh R$ 368.69
TOTAL COST R$ 394.34

Appendix N
351
MID-LOW INCOME DWELLINGS
Baseline water end-use consumption scenario – Reuse 1
Code Description Un. Quant. Unit Price Total
1. RAINWATER COLLECTION PIPEWORK R$ 894.60
1.1. 3m PVC gutter 132x89 2 R$ 51.25 R$ 102.50
1.2. Gutter union bracket 132x89 1 R$ 14.10 R$ 14.10
1.3. Gutter support bracket 132x89 6 R$ 4.70 R$ 28.20
1.4. Gutter running outlet 132x89 1 R$ 26.90 R$ 26.90
1.5. External stop end 132x89 2 R$ 7.15 R$ 14.30
1.7. 60o PVC offset bends DN80 2 R$ 10.90 R$ 21.80
1.8. 3m PVC Downpipe DN80 1 R$ 46.00 R$ 46.00
1.9. Downpipe bracket DN80 2 R$ 5.20 R$ 10.40
1.10. PVC "T" connection with inspection acess DN80 1 R$ 11.95 R$ 11.95
1.11. 90o PVC downpipe transition elbow connection 80x100 1 R$ 23.25 R$ 23.25
1.12. 3m PVC collection pipe DN100 1 R$ 17.20 R$ 17.20
1.13. Rainwater filter DN100 1 R$ 498.00 R$ 498.00
1.14. Installation cost R$ 80.00
2. RAINWATER DRAINAGE PIPEWORK R$ 88.45
2.1. 3m PVC drainage pipe DN100 2 R$ 17.20 R$ 34.40
2.2. 45o PVC elbow connection DN100 1 R$ 5.85 R$ 5.85
2.3. PVC "T"connection DN100 1 R$ 8.20 R$ 8.20
2.4. Installation cost R$ 40.00
3. TREATED RAINWATER DISTRIBUTION PIPEWORK R$ 270.20
3.1. PVC connector with free flanges for rainwater cistern DN25 1 R$ 7.70 R$ 7.70
3.2. 3m PVC suction pipe DN25 1 R$ 4.85 R$ 4.85
3.3. 90o PVC elbow conection DN25 1 R$ 0.35 R$ 0.35
3.4. Garden water pump 1/4hp DN25 1 R$ 200.00 R$ 200.00
3.5. Hose bib garden tap kit DN25 1 R$ 17.30 R$ 17.30
3.6. Installation cost R$ 40.00
TOTAL COST R$ 1,253.25
Code Description Un. Quant. Unit Price Total
1. OPERATIONAL COSTS R$ 4.68
1.1. Garden water pump 1/4hp 450 W 34,7 hr/yr R$ 0,30 kwh R$ 4.68
TOTAL COST R$ 4.68

Appendix N
352
MID-LOW INCOME DWELLINGS
Baseline water end-use consumption scenario – Reuse 2
Code Description Un. Quant. Unit Price Total
1. RAINWATER COLLECTION PIPEWORK R$ 1,012.63
1.1. 3m PVC gutter 132x89 3 R$ 51.25 R$ 136.67
1.2. Gutter union bracket 132x89 2 R$ 14.10 R$ 23.50
1.3. Gutter support bracket 132x89 13 R$ 4.70 R$ 62.67
1.4. Gutter running outlet 132x89 1 R$ 26.90 R$ 26.90
1.5. External stop end 132x89 2 R$ 7.15 R$ 14.30
1.7. 60o PVC offset bends DN80 2 R$ 10.90 R$ 21.80
1.8. 3m PVC Downpipe DN80 1 R$ 46.00 R$ 46.00
1.9. Downpipe bracket DN80 2 R$ 5.20 R$ 10.40
1.10. PVC "T" connection with inspection acess DN80 1 R$ 11.95 R$ 11.95
1.11. 90o PVC downpipe transition elbow connection 80x100 1 R$ 23.25 R$ 23.25
1.12. 3m PVC collection pipe DN100 1 R$ 17.20 R$ 17.20
1.13. Rainwater filter DN100 1 R$ 498.00 R$ 498.00
1.14. Installation cost R$ 120.00
2. RAINWATER DRAINAGE PIPEWORK R$ 88.45
2.1. 3m PVC drainage pipe DN100 2 R$ 17.20 R$ 34.40
2.2. 45o PVC elbow connection DN100 1 R$ 5.85 R$ 5.85
2.3. PVC "T"connection DN100 1 R$ 8.20 R$ 8.20
2.3. Installation cost R$ 40.00
3. TREATED RAINWATER DISTRIBUTION PIPEWORK R$ 2,229.90
3.1. PVC connector with ring for rainwater cistern DN25 1 R$ 7.70 R$ 7.70
3.2. 3m PVC suction pipe DN25 6 R$ 4.85 R$ 29.10
3.3. 90o PVC elbow conection DN25 5 R$ 0.35 R$ 1.75
3.4. Garden water pump 1/4hp DN25 1 R$ 200.00 R$ 200.00
3.5. Hose bib garden tap kit DN25 1 R$ 17.30 R$ 17.30
3.6. Distribution water pump 1/4hp DN25 1 R$ 200.00 R$ 200.00
3.8. 310 litres rainwater loft tank 1 R$ 110.05 R$ 110.05
3.9. Distribution water pump float switch 1 R$ 29.75 R$ 29.75
3.9. Potable water feed backup set 1 R$ 1,300.00 R$ 1,300.00
3.10. PVC connector with free flanges for rainwater loft tank DN25 1 R$ 7.70 R$ 7.70
3.11. PVC connector with free flanges for rainwater loft tank DN32 2 R$ 12.55 R$ 25.10
3.12. PVC connector with free flanges for rainwater loft tank DN40 1 R$ 17.40 R$ 17.40
3.13. PVC "T" connection DN32 1 R$ 2.00 R$ 2.00
3.14. 90o PVC elbow conection DN32 1 R$ 1.25 R$ 1.25
3.15. 3m PVC overflow pipe DN32 1 R$ 15.70 R$ 15.70
3.16. PVC ball valve DN32 1 R$ 39.00 R$ 39.00
3.17. 3m PVC distribution pipe DN40 3 R$ 8.70 R$ 26.10
3.18. Installation cost R$ 200.00
TOTAL COST R$ 3,330.98
Code Description Un. Quant. Unit Price Total
1. OPERATIONAL COSTS R$ 10.58
1.1. Garden water pump 1/4hp 450 W 34,7 hr/yr R$ 0,30 kwh R$ 4.68
1.2. Distribution water pump 1/4hp 450 W 43,7hr/yr R$ 0,30 kwh R$ 5.90
TOTAL COST R$ 10.58

Appendix N
353
MID-LOW INCOME DWELLINGS
Baseline water end-use consumption scenario – Reuse 3
Code Description Un. Quant. Unit Price Total
1. RAINWATER COLLECTION PIPEWORK R$ 1,126.57
1.1. 3m PVC gutter 132x89 3 R$ 51.25 R$ 170.83
1.2. Gutter union bracket 132x89 2 R$ 14.10 R$ 32.90
1.3. Gutter support bracket 132x89 17 R$ 4.70 R$ 78.33
1.4. Gutter running outlet 132x89 2 R$ 26.90 R$ 53.80
1.5. External stop end 132x89 2 R$ 7.15 R$ 14.30
1.7. 60o PVC offset bends DN80 4 R$ 10.90 R$ 43.60
1.8. 3m PVC Downpipe DN80 2 R$ 46.00 R$ 92.00
1.9. Downpipe bracket DN80 4 R$ 5.20 R$ 20.80
1.10. PVC "T" connection with inspection acess DN80 2 R$ 11.95 R$ 23.90
1.11. 90o PVC downpipe transition elbow connection 80x100 2 R$ 23.25 R$ 46.50
1.12. 3m PVC collection pipe DN100 3 R$ 17.20 R$ 51.60
1.13. Rainwater filter DN100 1 R$ 498.00 R$ 498.00
1.14. Installation cost R$ 160.00
2. RAINWATER DRAINAGE PIPEWORK R$ 88.45
2.1. 3m PVC drainage pipe DN100 2 R$ 17.20 R$ 34.40
2.2. 45o PVC elbow connection DN100 1 R$ 5.85 R$ 5.85
2.3. PVC "T"connection DN100 1 R$ 8.20 R$ 8.20
2.3. Installation cost R$ 40.00
3. TREATED RAINWATER DISTRIBUTION PIPEWORK R$ 2,303.85
3.1. PVC connector with ring for rainwater cistern DN25 1 R$ 7.70 R$ 7.70
3.2. 3m PVC suction pipe DN25 10 R$ 4.85 R$ 48.50
3.3. 90o PVC elbow conection DN25 5 R$ 0.35 R$ 1.75
3.4. Garden water pump 1/4hp DN25 1 R$ 200.00 R$ 200.00
3.5. Hose bib garden tap kit DN25 1 R$ 17.30 R$ 17.30
3.6. Distribution water pump 1/4hp DN25 1 R$ 200.00 R$ 200.00
3.8. 310 litres rainwater loft tank 1 R$ 110.05 R$ 110.05
3.9. Distribution water pump float switch 1 R$ 29.75 R$ 29.75
3.9. Potable water feed backup set 1 R$ 1,300.00 R$ 1,300.00
3.10. PVC connector with free flanges for rainwater loft tank DN25 1 R$ 7.70 R$ 7.70
3.11. PVC connector with free flanges for rainwater loft tank DN32 2 R$ 12.55 R$ 25.10
3.12. PVC connector with free flanges for rainwater loft tank DN40 1 R$ 17.40 R$ 17.40
3.13. PVC "T" connection DN32 1 R$ 2.00 R$ 2.00
3.14. 90o PVC elbow conection DN32 1 R$ 1.25 R$ 1.25
3.15. 3m PVC overflow pipe DN32 1 R$ 15.70 R$ 15.70
3.16. PVC ball valve DN32 1 R$ 39.00 R$ 39.00
3.17. 3m PVC distribution pipe DN40 3 R$ 8.70 R$ 26.10
3.18. 3m PVC distribution pipe DN25 3 R$ 4.85 R$ 14.55
3.19 Installation cost R$ 240.00
TOTAL COST R$ 3,518.87
Code Description Un. Quant. Unit Price Total
1. OPERATIONAL COSTS R$ 19.09
1.1. Garden water pump 1/4hp 450 W 34,7 hr/yr R$ 0,30 kwh R$ 4.68
1.2. Distribution water pump 1/4hp 450 W 106,7hr/yr R$ 0,30 kwh R$ 14.40
TOTAL COST R$ 19.09

Appendix N
354
MID-LOW INCOME DWELLINGS
Reduced water end-use consumption scenario – Reuse 1
Code Description Un. Quant. Unit Price Total
1. RAINWATER COLLECTION PIPEWORK R$ 894.60
1.1. 3m PVC gutter 132x89 2 R$ 51.25 R$ 102.50
1.2. Gutter union bracket 132x89 1 R$ 14.10 R$ 14.10
1.3. Gutter support bracket 132x89 6 R$ 4.70 R$ 28.20
1.4. Gutter running outlet 132x89 1 R$ 26.90 R$ 26.90
1.5. External stop end 132x89 2 R$ 7.15 R$ 14.30
1.7. 60o PVC offset bends DN80 2 R$ 10.90 R$ 21.80
1.8. 3m PVC Downpipe DN80 1 R$ 46.00 R$ 46.00
1.9. Downpipe bracket DN80 2 R$ 5.20 R$ 10.40
1.10. PVC "T" connection with inspection acess DN80 1 R$ 11.95 R$ 11.95
1.11. 90o PVC downpipe transition elbow connection 80x100 1 R$ 23.25 R$ 23.25
1.12. 3m PVC collection pipe DN100 1 R$ 17.20 R$ 17.20
1.13. Rainwater filter DN100 1 R$ 498.00 R$ 498.00
1.14. Installation cost R$ 80.00
2. RAINWATER DRAINAGE PIPEWORK R$ 88.45
2.1. 3m PVC drainage pipe DN100 2 R$ 17.20 R$ 34.40
2.2. 45o PVC elbow connection DN100 1 R$ 5.85 R$ 5.85
2.3. PVC "T"connection DN100 1 R$ 8.20 R$ 8.20
2.4. Installation cost R$ 40.00
3. TREATED RAINWATER DISTRIBUTION PIPEWORK R$ 270.20
3.1. PVC connector with free flanges for rainwater cistern DN25 1 R$ 7.70 R$ 7.70
3.2. 3m PVC suction pipe DN25 1 R$ 4.85 R$ 4.85
3.3. 90o PVC elbow conection DN25 1 R$ 0.35 R$ 0.35
3.4. Garden water pump 1/4hp DN25 1 R$ 200.00 R$ 200.00
3.5. Hose bib garden tap kit DN25 1 R$ 17.30 R$ 17.30
3.6. Installation cost R$ 40.00
TOTAL COST R$ 1,253.25
Code Description Un. Quant. Unit Price Total
1. OPERATIONAL COSTS R$ 4.68
1.1. Garden water pump 1/4hp 450 W 34,7 hr/yr R$ 0,30 kwh R$ 4.68
TOTAL COST R$ 4.68

Appendix N
355
MID-LOW INCOME DWELLINGS
Reduced water end-use consumption scenario – Reuse 2
Code Description Un. Quant. Unit Price Total
1. RAINWATER COLLECTION PIPEWORK R$ 894.60
1.1. 3m PVC gutter 132x89 2 R$ 51.25 R$ 102.50
1.2. Gutter union bracket 132x89 1 R$ 14.10 R$ 14.10
1.3. Gutter support bracket 132x89 6 R$ 4.70 R$ 28.20
1.4. Gutter running outlet 132x89 1 R$ 26.90 R$ 26.90
1.5. External stop end 132x89 2 R$ 7.15 R$ 14.30
1.7. 60o PVC offset bends DN80 2 R$ 10.90 R$ 21.80
1.8. 3m PVC Downpipe DN80 1 R$ 46.00 R$ 46.00
1.9. Downpipe bracket DN80 2 R$ 5.20 R$ 10.40
1.10. PVC "T" connection with inspection acess DN80 1 R$ 11.95 R$ 11.95
1.11. 90o PVC downpipe transition elbow connection 80x100 1 R$ 23.25 R$ 23.25
1.12. 3m PVC collection pipe DN100 1 R$ 17.20 R$ 17.20
1.13. Rainwater filter DN100 1 R$ 498.00 R$ 498.00
1.14. Installation cost R$ 80.00
2. RAINWATER DRAINAGE PIPEWORK R$ 88.45
2.1. 3m PVC drainage pipe DN100 2 R$ 17.20 R$ 34.40
2.2. 45o PVC elbow connection DN100 1 R$ 5.85 R$ 5.85
2.3. PVC "T"connection DN100 1 R$ 8.20 R$ 8.20
2.3. Installation cost R$ 40.00
3. TREATED RAINWATER DISTRIBUTION PIPEWORK R$ 2,229.90
3.1. PVC connector with ring for rainwater cistern DN25 1 R$ 7.70 R$ 7.70
3.2. 3m PVC suction pipe DN25 6 R$ 4.85 R$ 29.10
3.3. 90o PVC elbow conection DN25 5 R$ 0.35 R$ 1.75
3.4. Garden water pump 1/4hp DN25 1 R$ 200.00 R$ 200.00
3.5. Hose bib garden tap kit DN25 1 R$ 17.30 R$ 17.30
3.6. Distribution water pump 1/4hp DN25 1 R$ 200.00 R$ 200.00
3.8. 310 litres rainwater loft tank 1 R$ 110.05 R$ 110.05
3.9. Distribution water pump float switch 1 R$ 29.75 R$ 29.75
3.9. Potable water feed backup set 1 R$ 1,300.00 R$ 1,300.00
3.10. PVC connector with free flanges for rainwater loft tank DN25 1 R$ 7.70 R$ 7.70
3.11. PVC connector with free flanges for rainwater loft tank DN32 2 R$ 12.55 R$ 25.10
3.12. PVC connector with free flanges for rainwater loft tank DN40 1 R$ 17.40 R$ 17.40
3.13. PVC "T" connection DN32 1 R$ 2.00 R$ 2.00
3.14. 90o PVC elbow conection DN32 1 R$ 1.25 R$ 1.25
3.15. 3m PVC overflow pipe DN32 1 R$ 15.70 R$ 15.70
3.16. PVC ball valve DN32 1 R$ 39.00 R$ 39.00
3.17. 3m PVC distribution pipe DN40 3 R$ 8.70 R$ 26.10
3.18. Installation cost R$ 200.00
TOTAL COST R$ 3,212.95
Code Description Un. Quant. Unit Price Total
1. OPERATIONAL COSTS R$ 10.58
1.1. Garden water pump 1/4hp 450 W 34,7 hr/yr R$ 0,30 kwh R$ 4.68
1.2. Distribution water pump 1/4hp 450 W 43,7hr/yr R$ 0,30 kwh R$ 5.90
TOTAL COST R$ 10.58

Appendix N
356
MID-LOW INCOME DWELLINGS
Reduced water end-use consumption scenario – Reuse 3
Code Description Un. Quant. Unit Price Total
1. RAINWATER COLLECTION PIPEWORK R$ 1,126.57
1.1. 3m PVC gutter 132x89 3 R$ 51.25 R$ 170.83
1.2. Gutter union bracket 132x89 2 R$ 14.10 R$ 32.90
1.3. Gutter support bracket 132x89 17 R$ 4.70 R$ 78.33
1.4. Gutter running outlet 132x89 2 R$ 26.90 R$ 53.80
1.5. External stop end 132x89 2 R$ 7.15 R$ 14.30
1.7. 60o PVC offset bends DN80 4 R$ 10.90 R$ 43.60
1.8. 3m PVC Downpipe DN80 2 R$ 46.00 R$ 92.00
1.9. Downpipe bracket DN80 4 R$ 5.20 R$ 20.80
1.10. PVC "T" connection with inspection acess DN80 2 R$ 11.95 R$ 23.90
1.11. 90o PVC downpipe transition elbow connection 80x100 2 R$ 23.25 R$ 46.50
1.12. 3m PVC collection pipe DN100 3 R$ 17.20 R$ 51.60
1.13. Rainwater filter DN100 1 R$ 498.00 R$ 498.00
1.14. Installation cost R$ 160.00
2. RAINWATER DRAINAGE PIPEWORK R$ 88.45
2.1. 3m PVC drainage pipe DN100 2 R$ 17.20 R$ 34.40
2.2. 45o PVC elbow connection DN100 1 R$ 5.85 R$ 5.85
2.3. PVC "T"connection DN100 1 R$ 8.20 R$ 8.20
2.3. Installation cost R$ 40.00
3. TREATED RAINWATER DISTRIBUTION PIPEWORK R$ 2,303.85
3.1. PVC connector with ring for rainwater cistern DN25 1 R$ 7.70 R$ 7.70
3.2. 3m PVC suction pipe DN25 10 R$ 4.85 R$ 48.50
3.3. 90o PVC elbow conection DN25 5 R$ 0.35 R$ 1.75
3.4. Garden water pump 1/4hp DN25 1 R$ 200.00 R$ 200.00
3.5. Hose bib garden tap kit DN25 1 R$ 17.30 R$ 17.30
3.6. Distribution water pump 1/4hp DN25 1 R$ 200.00 R$ 200.00
3.8. 310 litres rainwater loft tank 1 R$ 110.05 R$ 110.05
3.9. Distribution water pump float switch 1 R$ 29.75 R$ 29.75
3.9. Potable water feed backup set 1 R$ 1,300.00 R$ 1,300.00
3.10. PVC connector with free flanges for rainwater loft tank DN25 1 R$ 7.70 R$ 7.70
3.11. PVC connector with free flanges for rainwater loft tank DN32 2 R$ 12.55 R$ 25.10
3.12. PVC connector with free flanges for rainwater loft tank DN40 1 R$ 17.40 R$ 17.40
3.13. PVC "T" connection DN32 1 R$ 2.00 R$ 2.00
3.14. 90o PVC elbow conection DN32 1 R$ 1.25 R$ 1.25
3.15. 3m PVC overflow pipe DN32 1 R$ 15.70 R$ 15.70
3.16. PVC ball valve DN32 1 R$ 39.00 R$ 39.00
3.17. 3m PVC distribution pipe DN40 3 R$ 8.70 R$ 26.10
3.18. 3m PVC distribution pipe DN25 3 R$ 4.85 R$ 14.55
3.19 Installation cost R$ 240.00
TOTAL COST R$ 3,518.87
Code Description Un. Quant. Unit Price Total
1. OPERATIONAL COSTS R$ 19.09
1.1. Garden water pump 1/4hp 450 W 34,7 hr/yr R$ 0,30 kwh R$ 4.68
1.2. Distribution water pump 1/4hp 450 W 106,7hr/yr R$ 0,30 kwh R$ 14.40
TOTAL COST R$ 19.09

Appendix N
357
LOW INCOME DWELLINGS
Baseline water end-use consumption scenario – Reuse 1
Code Description Un. Quant. Unit Price Total
1. RAINWATER COLLECTION PIPEWORK R$ 829.25
1.1. 3m PVC gutter 132x89 1 R$ 51.25 R$ 51.25
1.2. Gutter union bracket 132x89 1 R$ 14.10 R$ 14.10
1.3. Gutter support bracket 132x89 3 R$ 4.70 R$ 14.10
1.4. Gutter running outlet 132x89 1 R$ 26.90 R$ 26.90
1.5. External stop end 132x89 2 R$ 7.15 R$ 14.30
1.7. 60o PVC offset bends DN80 2 R$ 10.90 R$ 21.80
1.8. 3m PVC Downpipe DN80 1 R$ 46.00 R$ 46.00
1.9. Downpipe bracket DN80 2 R$ 5.20 R$ 10.40
1.10. PVC "T" connection with inspection acess DN80 1 R$ 11.95 R$ 11.95
1.11. 90o PVC downpipe transition elbow connection 80x100 1 R$ 23.25 R$ 23.25
1.12. 3m PVC collection pipe DN100 1 R$ 17.20 R$ 17.20
1.13. Rainwater filter DN100 1 R$ 498.00 R$ 498.00
1.14. Installation cost R$ 80.00
2. RAINWATER DRAINAGE PIPEWORK R$ 88.45
2.1. 3m PVC drainage pipe DN100 2 R$ 17.20 R$ 34.40
2.2. 45o PVC elbow connection DN100 1 R$ 5.85 R$ 5.85
2.3. PVC "T"connection DN100 1 R$ 8.20 R$ 8.20
2.4. Installation cost R$ 40.00
3. TREATED RAINWATER DISTRIBUTION PIPEWORK R$ 270.20
3.1. PVC connector with free flanges for rainwater cistern DN25 1 R$ 7.70 R$ 7.70
3.2. 3m PVC suction pipe DN25 1 R$ 4.85 R$ 4.85
3.3. 90o PVC elbow conection DN25 1 R$ 0.35 R$ 0.35
3.4. Garden water pump 1/4hp DN25 1 R$ 200.00 R$ 200.00
3.5. Hose bib garden tap kit DN25 1 R$ 17.30 R$ 17.30
3.6. Installation cost R$ 40.00
TOTAL COST R$ 1,187.90
Code Description Un. Quant. Unit Price Total
1. OPERATIONAL COSTS R$ 4.78
1.1. Garden water pump 1/4hp 450 W 35,4hr/yr R$ 0,30 kwh R$ 4.78
TOTAL COST R$ 4.78

Appendix N
358
LOW INCOME DWELLINGS
Baseline water end-use consumption scenario – Reuse 2
Code Description Un. Quant. Unit Price Total
1. RAINWATER COLLECTION PIPEWORK R$ 1,012.63
1.1. 3m PVC gutter 132x89 3 R$ 51.25 R$ 136.67
1.2. Gutter union bracket 132x89 2 R$ 14.10 R$ 23.50
1.3. Gutter support bracket 132x89 13 R$ 4.70 R$ 62.67
1.4. Gutter running outlet 132x89 1 R$ 26.90 R$ 26.90
1.5. External stop end 132x89 2 R$ 7.15 R$ 14.30
1.7. 60o PVC offset bends DN80 2 R$ 10.90 R$ 21.80
1.8. 3m PVC Downpipe DN80 1 R$ 46.00 R$ 46.00
1.9. Downpipe bracket DN80 2 R$ 5.20 R$ 10.40
1.10. PVC "T" connection with inspection acess DN80 1 R$ 11.95 R$ 11.95
1.11. 90o PVC downpipe transition elbow connection 80x100 1 R$ 23.25 R$ 23.25
1.12. 3m PVC collection pipe DN100 1 R$ 17.20 R$ 17.20
1.13. Rainwater filter DN100 1 R$ 498.00 R$ 498.00
1.14. Installation cost R$ 120.00
2. RAINWATER DRAINAGE PIPEWORK R$ 88.45
2.1. 3m PVC drainage pipe DN100 2 R$ 17.20 R$ 34.40
2.2. 45o PVC elbow connection DN100 1 R$ 5.85 R$ 5.85
2.3. PVC "T"connection DN100 1 R$ 8.20 R$ 8.20
2.3. Installation cost R$ 40.00
3. TREATED RAINWATER DISTRIBUTION PIPEWORK R$ 2,206.65
3.1. PVC connector with ring for rainwater cistern DN25 1 R$ 7.70 R$ 7.70
3.2. 3m PVC suction pipe DN25 3 R$ 4.85 R$ 14.55
3.3. 90o PVC elbow conection DN25 5 R$ 0.35 R$ 1.75
3.4. Garden water pump 1/4hp DN25 1 R$ 200.00 R$ 200.00
3.5. Hose bib garden tap kit DN25 1 R$ 17.30 R$ 17.30
3.6. Distribution water pump 1/4hp DN25 1 R$ 200.00 R$ 200.00
3.8. 310 litres rainwater loft tank 1 R$ 110.05 R$ 110.05
3.9. Distribution water pump float switch 1 R$ 29.75 R$ 29.75
3.9. Potable water feed backup set 1 R$ 1,300.00 R$ 1,300.00
3.10. PVC connector with free flanges for rainwater loft tank DN25 1 R$ 7.70 R$ 7.70
3.11. PVC connector with free flanges for rainwater loft tank DN32 2 R$ 12.55 R$ 25.10
3.12. PVC connector with free flanges for rainwater loft tank DN40 1 R$ 17.40 R$ 17.40
3.13. PVC "T" connection DN32 1 R$ 2.00 R$ 2.00
3.14. 90o PVC elbow conection DN32 1 R$ 1.25 R$ 1.25
3.15. 3m PVC overflow pipe DN32 1 R$ 15.70 R$ 15.70
3.16. PVC ball valve DN32 1 R$ 39.00 R$ 39.00
3.17. 3m PVC distribution pipe DN40 2 R$ 8.70 R$ 17.40
3.18. Installation cost R$ 200.00
TOTAL COST R$ 3,307.73
Code Description Un. Quant. Unit Price Total
1. OPERATIONAL COSTS R$ 8.96
1.1. Garden water pump 1/4hp 450 W 35,4hr/yr R$ 0,30 kwh R$ 4.78
1.2. Distribution water pump 1/4hp 450 W 31hr/yr R$ 0,30 kwh R$ 4.19
TOTAL COST R$ 8.96

Appendix N
359
LOW INCOME DWELLINGS
Baseline water end-use consumption scenario – Reuse 3
Code Description Un. Quant. Unit Price Total
1. RAINWATER COLLECTION PIPEWORK R$ 1,658.40
1.1. 3m PVC gutter 132x89 6 R$ 51.25 R$ 307.50
1.2. Gutter union bracket 132x89 5 R$ 14.10 R$ 70.50
1.3. Gutter support bracket 132x89 30 R$ 4.70 R$ 141.00
1.4. Gutter running outlet 132x89 4 R$ 26.90 R$ 107.60
1.5. External stop end 132x89 4 R$ 7.15 R$ 28.60
1.7. 60o PVC offset bends DN80 8 R$ 10.90 R$ 87.20
1.8. 3m PVC Downpipe DN80 4 R$ 46.00 R$ 184.00
1.9. Downpipe bracket DN80 8 R$ 5.20 R$ 41.60
1.10. PVC "T" connection with inspection acess DN80 4 R$ 11.95 R$ 47.80
1.11. 90o PVC downpipe transition elbow connection 80x100 4 R$ 23.25 R$ 93.00
1.12. 3m PVC collection pipe DN100 3 R$ 17.20 R$ 51.60
1.13. Rainwater filter DN100 1 R$ 498.00 R$ 498.00
1.14. Installation cost R$ 160.00
2. RAINWATER DRAINAGE PIPEWORK R$ 88.45
2.1. 3m PVC drainage pipe DN100 2 R$ 17.20 R$ 34.40
2.2. 45o PVC elbow connection DN100 1 R$ 5.85 R$ 5.85
2.3. PVC "T"connection DN100 1 R$ 8.20 R$ 8.20
2.3. Installation cost R$ 40.00
3. TREATED RAINWATER DISTRIBUTION PIPEWORK R$ 2,256.35
3.1. PVC connector with ring for rainwater cistern DN25 1 R$ 7.70 R$ 7.70
3.2. 3m PVC suction pipe DN25 3 R$ 4.85 R$ 14.55
3.3. 90o PVC elbow conection DN25 5 R$ 0.35 R$ 1.75
3.4. Garden water pump 1/4hp DN25 1 R$ 200.00 R$ 200.00
3.5. Hose bib garden tap kit DN25 1 R$ 17.30 R$ 17.30
3.6. Distribution water pump 1/4hp DN25 1 R$ 200.00 R$ 200.00
3.8. 310 litres rainwater loft tank 1 R$ 110.05 R$ 110.05
3.9. Distribution water pump float switch 1 R$ 29.75 R$ 29.75
3.9. Potable water feed backup set 1 R$ 1,300.00 R$ 1,300.00
3.10. PVC connector with free flanges for rainwater loft tank DN25 1 R$ 7.70 R$ 7.70
3.11. PVC connector with free flanges for rainwater loft tank DN32 2 R$ 12.55 R$ 25.10
3.12. PVC connector with free flanges for rainwater loft tank DN40 1 R$ 17.40 R$ 17.40
3.13. PVC "T" connection DN32 1 R$ 2.00 R$ 2.00
3.14. 90o PVC elbow conection DN32 1 R$ 1.25 R$ 1.25
3.15. 3m PVC overflow pipe DN32 1 R$ 15.70 R$ 15.70
3.16. PVC ball valve DN32 1 R$ 39.00 R$ 39.00
3.17. 3m PVC distribution pipe DN40 2 R$ 8.70 R$ 17.40
3.18. 3m PVC distribution pipe DN25 2 R$ 4.85 R$ 9.70
3.19 Installation cost R$ 240.00
TOTAL COST R$ 4,003.20
Code Description Un. Quant. Unit Price Total
1. OPERATIONAL COSTS R$ 13.42
1.1. Garden water pump 1/4hp 450 W 35,4hr/yr R$ 0,30 kwh R$ 4.78
1.2. Distribution water pump 1/4hp 450 W 64 hr/yr R$ 0,30 kwh R$ 8.64
TOTAL COST R$ 13.42

Appendix N
360
LOW INCOME DWELLINGS
Reduced water end-use consumption scenario – Reuse 1
Code Description Un. Quant. Unit Price Total
1. RAINWATER COLLECTION PIPEWORK R$ 829.25
1.1. 3m PVC gutter 132x89 1 R$ 51.25 R$ 51.25
1.2. Gutter union bracket 132x89 1 R$ 14.10 R$ 14.10
1.3. Gutter support bracket 132x89 3 R$ 4.70 R$ 14.10
1.4. Gutter running outlet 132x89 1 R$ 26.90 R$ 26.90
1.5. External stop end 132x89 2 R$ 7.15 R$ 14.30
1.7. 60o PVC offset bends DN80 2 R$ 10.90 R$ 21.80
1.8. 3m PVC Downpipe DN80 1 R$ 46.00 R$ 46.00
1.9. Downpipe bracket DN80 2 R$ 5.20 R$ 10.40
1.10. PVC "T" connection with inspection acess DN80 1 R$ 11.95 R$ 11.95
1.11. 90o PVC downpipe transition elbow connection 80x100 1 R$ 23.25 R$ 23.25
1.12. 3m PVC collection pipe DN100 1 R$ 17.20 R$ 17.20
1.13. Rainwater filter DN100 1 R$ 498.00 R$ 498.00
1.14. Installation cost R$ 80.00
2. RAINWATER DRAINAGE PIPEWORK R$ 88.45
2.1. 3m PVC drainage pipe DN100 2 R$ 17.20 R$ 34.40
2.2. 45o PVC elbow connection DN100 1 R$ 5.85 R$ 5.85
2.3. PVC "T"connection DN100 1 R$ 8.20 R$ 8.20
2.4. Installation cost R$ 40.00
3. TREATED RAINWATER DISTRIBUTION PIPEWORK R$ 270.20
3.1. PVC connector with free flanges for rainwater cistern DN25 1 R$ 7.70 R$ 7.70
3.2. 3m PVC suction pipe DN25 1 R$ 4.85 R$ 4.85
3.3. 90o PVC elbow conection DN25 1 R$ 0.35 R$ 0.35
3.4. Garden water pump 1/4hp DN25 1 R$ 200.00 R$ 200.00
3.5. Hose bib garden tap kit DN25 1 R$ 17.30 R$ 17.30
3.6. Installation cost R$ 40.00
TOTAL COST R$ 1,187.90
Code Description Un. Quant. Unit Price Total
1. OPERATIONAL COSTS R$ 4.78
1.1. Garden water pump 1/4hp 450 W 35,4hr/yr R$ 0,30 kwh R$ 4.78
TOTAL COST R$ 4.78
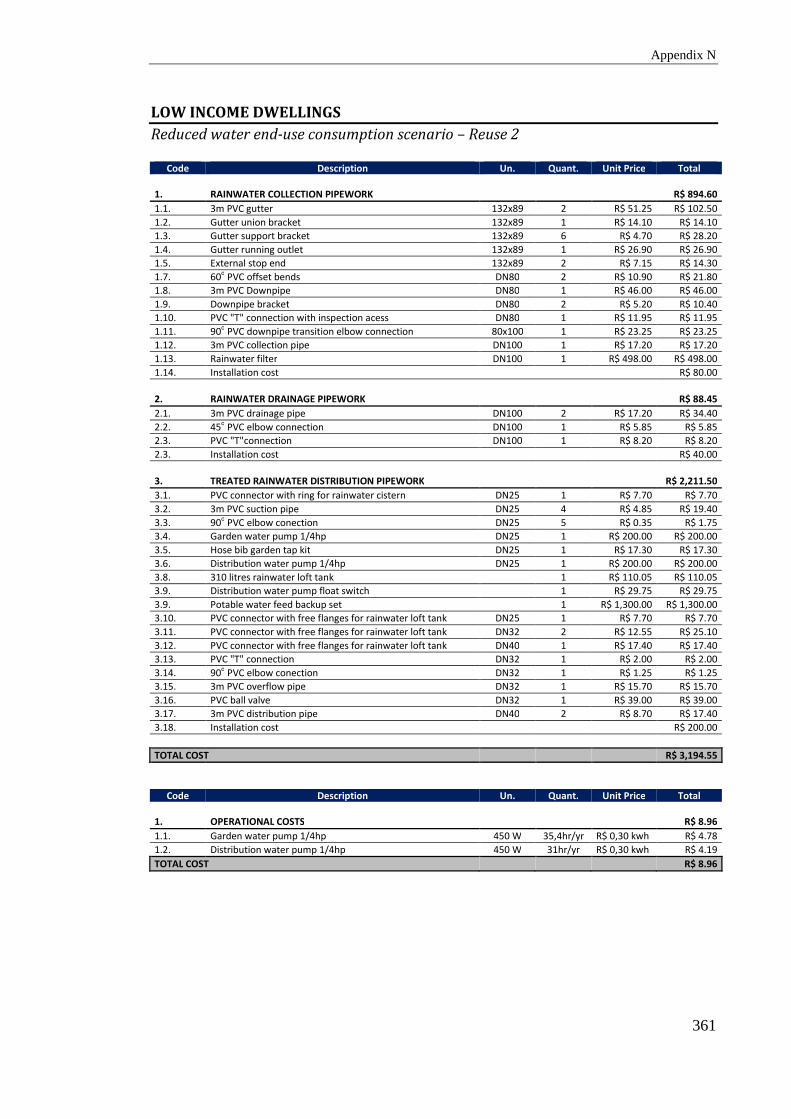
Appendix N
361
LOW INCOME DWELLINGS
Reduced water end-use consumption scenario – Reuse 2
Code Description Un. Quant. Unit Price Total
1. RAINWATER COLLECTION PIPEWORK R$ 894.60
1.1. 3m PVC gutter 132x89 2 R$ 51.25 R$ 102.50
1.2. Gutter union bracket 132x89 1 R$ 14.10 R$ 14.10
1.3. Gutter support bracket 132x89 6 R$ 4.70 R$ 28.20
1.4. Gutter running outlet 132x89 1 R$ 26.90 R$ 26.90
1.5. External stop end 132x89 2 R$ 7.15 R$ 14.30
1.7. 60o PVC offset bends DN80 2 R$ 10.90 R$ 21.80
1.8. 3m PVC Downpipe DN80 1 R$ 46.00 R$ 46.00
1.9. Downpipe bracket DN80 2 R$ 5.20 R$ 10.40
1.10. PVC "T" connection with inspection acess DN80 1 R$ 11.95 R$ 11.95
1.11. 90o PVC downpipe transition elbow connection 80x100 1 R$ 23.25 R$ 23.25
1.12. 3m PVC collection pipe DN100 1 R$ 17.20 R$ 17.20
1.13. Rainwater filter DN100 1 R$ 498.00 R$ 498.00
1.14. Installation cost R$ 80.00
2. RAINWATER DRAINAGE PIPEWORK R$ 88.45
2.1. 3m PVC drainage pipe DN100 2 R$ 17.20 R$ 34.40
2.2. 45o PVC elbow connection DN100 1 R$ 5.85 R$ 5.85
2.3. PVC "T"connection DN100 1 R$ 8.20 R$ 8.20
2.3. Installation cost R$ 40.00
3. TREATED RAINWATER DISTRIBUTION PIPEWORK R$ 2,211.50
3.1. PVC connector with ring for rainwater cistern DN25 1 R$ 7.70 R$ 7.70
3.2. 3m PVC suction pipe DN25 4 R$ 4.85 R$ 19.40
3.3. 90o PVC elbow conection DN25 5 R$ 0.35 R$ 1.75
3.4. Garden water pump 1/4hp DN25 1 R$ 200.00 R$ 200.00
3.5. Hose bib garden tap kit DN25 1 R$ 17.30 R$ 17.30
3.6. Distribution water pump 1/4hp DN25 1 R$ 200.00 R$ 200.00
3.8. 310 litres rainwater loft tank 1 R$ 110.05 R$ 110.05
3.9. Distribution water pump float switch 1 R$ 29.75 R$ 29.75
3.9. Potable water feed backup set 1 R$ 1,300.00 R$ 1,300.00
3.10. PVC connector with free flanges for rainwater loft tank DN25 1 R$ 7.70 R$ 7.70
3.11. PVC connector with free flanges for rainwater loft tank DN32 2 R$ 12.55 R$ 25.10
3.12. PVC connector with free flanges for rainwater loft tank DN40 1 R$ 17.40 R$ 17.40
3.13. PVC "T" connection DN32 1 R$ 2.00 R$ 2.00
3.14. 90o PVC elbow conection DN32 1 R$ 1.25 R$ 1.25
3.15. 3m PVC overflow pipe DN32 1 R$ 15.70 R$ 15.70
3.16. PVC ball valve DN32 1 R$ 39.00 R$ 39.00
3.17. 3m PVC distribution pipe DN40 2 R$ 8.70 R$ 17.40
3.18. Installation cost R$ 200.00
TOTAL COST R$ 3,194.55
Code Description Un. Quant. Unit Price Total
1. OPERATIONAL COSTS R$ 8.96
1.1. Garden water pump 1/4hp 450 W 35,4hr/yr R$ 0,30 kwh R$ 4.78
1.2. Distribution water pump 1/4hp 450 W 31hr/yr R$ 0,30 kwh R$ 4.19
TOTAL COST R$ 8.96

Appendix N
362
LOW INCOME DWELLINGS
Reduced water end-use consumption scenario – Reuse 3
Code Description Un. Quant. Unit Price Total
1. RAINWATER COLLECTION PIPEWORK R$ 1,126.57
1.1. 3m PVC gutter 132x89 3 R$ 51.25 R$ 170.83
1.2. Gutter union bracket 132x89 2 R$ 14.10 R$ 32.90
1.3. Gutter support bracket 132x89 17 R$ 4.70 R$ 78.33
1.4. Gutter running outlet 132x89 2 R$ 26.90 R$ 53.80
1.5. External stop end 132x89 2 R$ 7.15 R$ 14.30
1.7. 60o PVC offset bends DN80 4 R$ 10.90 R$ 43.60
1.8. 3m PVC Downpipe DN80 2 R$ 46.00 R$ 92.00
1.9. Downpipe bracket DN80 4 R$ 5.20 R$ 20.80
1.10. PVC "T" connection with inspection acess DN80 2 R$ 11.95 R$ 23.90
1.11. 90o PVC downpipe transition elbow connection 80x100 2 R$ 23.25 R$ 46.50
1.12. 3m PVC collection pipe DN100 3 R$ 17.20 R$ 51.60
1.13. Rainwater filter DN100 1 R$ 498.00 R$ 498.00
1.14. Installation cost R$ 160.00
2. RAINWATER DRAINAGE PIPEWORK R$ 88.45
2.1. 3m PVC drainage pipe DN100 2 R$ 17.20 R$ 34.40
2.2. 45o PVC elbow connection DN100 1 R$ 5.85 R$ 5.85
2.3. PVC "T"connection DN100 1 R$ 8.20 R$ 8.20
2.3. Installation cost R$ 40.00
3. TREATED RAINWATER DISTRIBUTION PIPEWORK R$ 2,261.20
3.1. PVC connector with ring for rainwater cistern DN25 1 R$ 7.70 R$ 7.70
3.2. 3m PVC suction pipe DN25 4 R$ 4.85 R$ 19.40
3.3. 90o PVC elbow conection DN25 5 R$ 0.35 R$ 1.75
3.4. Garden water pump 1/4hp DN25 1 R$ 200.00 R$ 200.00
3.5. Hose bib garden tap kit DN25 1 R$ 17.30 R$ 17.30
3.6. Distribution water pump 1/4hp DN25 1 R$ 200.00 R$ 200.00
3.8. 310 litres rainwater loft tank 1 R$ 110.05 R$ 110.05
3.9. Distribution water pump float switch 1 R$ 29.75 R$ 29.75
3.9. Potable water feed backup set 1 R$ 1,300.00 R$ 1,300.00
3.10. PVC connector with free flanges for rainwater loft tank DN25 1 R$ 7.70 R$ 7.70
3.11. PVC connector with free flanges for rainwater loft tank DN32 2 R$ 12.55 R$ 25.10
3.12. PVC connector with free flanges for rainwater loft tank DN40 1 R$ 17.40 R$ 17.40
3.13. PVC "T" connection DN32 1 R$ 2.00 R$ 2.00
3.14. 90o PVC elbow conection DN32 1 R$ 1.25 R$ 1.25
3.15. 3m PVC overflow pipe DN32 1 R$ 15.70 R$ 15.70
3.16. PVC ball valve DN32 1 R$ 39.00 R$ 39.00
3.17. 3m PVC distribution pipe DN40 2 R$ 8.70 R$ 17.40
3.18. 3m PVC distribution pipe DN25 2 R$ 4.85 R$ 9.70
3.19 Installation cost R$ 240.00
TOTAL COST R$ 3,476.22
Code Description Un. Quant. Unit Price Total
1. OPERATIONAL COSTS R$ 13.42
1.1. Garden water pump 1/4hp 450 W 35,4hr/yr R$ 0,30 kwh R$ 4.78
1.2. Distribution water pump 1/4hp 450 W 64 hr/yr R$ 0,30 kwh R$ 8.64
TOTAL COST R$ 13.42

Appendix O Costs of Greywater Recycling Systems

Appendix O
364
HIGH INCOME DWELLINGS
Greywater diversion for subsurface irrigation
Code Description Un. Quant. Unit Price Total
1. GREYWATER COLLECTION PIPEWORK R$ 1,212.20
1.1. 3m PVC collection pipe DN50 3 R$ 14.25 R$ 42.75
1.2. Inspection chamber DN50/100 7 R$ 125.35 R$ 877.45
1.3. 3m PVC collection pipe DN100 10 R$ 17.20 R$ 172.00
1.4. Installation cost R$ 120.00
2. GREYWATER DRAINAGE PIPEWORK R$ 960.05
2.1. 3m PVC drainage pipe DN100 2 R$ 17.20 R$ 34.40
2.2. Inspection chamber DN100 7 R$ 125.35 R$ 877.45
2.3. PVC "T"connection DN100 1 R$ 8.20 R$ 8.20
2.4. Installation cost R$ 40.00
3. GREYWATER DIVERSION DEVICE R$ 3,115.88
3.1. 300 litres greywater surge tank 1 R$ 94.70
3.2. 3m PVC distribution pipe DN25 5 R$ 4.85 R$ 24.25
3.3. 3m PVC perforated irrigation pipe DN25 100 R$ 4.85 R$ 485.00
3.4. 90o PVC elbow conection DN25 4 R$ 0.35 R$ 1.40
3.4. PVC "T" conection DN25 60 R$ 0.80 R$ 48.00
3.2. Geotextile membrane m2 150 R$ 0.54 R$ 81.00
3.2. 20mm aggregate m3 13.5 R$ 63.48 R$ 856.98
3.2. Sand m3 13.5 R$ 83.30 R$ 1,124.55
2.4. Site preparation and installation cost R$ 400.00
TOTAL COST R$ 5,288.13

Appendix O
365
HIGH INCOME DWELLINGS
Greywater treatment system – Reuse 1
Code Description Un. Quant. Unit Price Total
1. GREYWATER COLLECTION PIPEWORK R$ 1,212.20
1.1. 3m PVC collection pipe DN50 3 R$ 14.25 R$ 42.75
1.2. Inspection chamber DN50/100 7 R$ 125.35 R$ 877.45
1.3. 3m PVC collection pipe DN100 10 R$ 17.20 R$ 172.00
1.4. Installation cost R$ 120.00
2. GREYWATER DRAINAGE PIPEWORK R$ 960.05
2.1. 3m PVC drainage pipe DN100 2 R$ 17.20 R$ 34.40
2.2. Inspection chamber DN100 7 R$ 125.35 R$ 877.45
2.3. PVC "T"connection DN100 1 R$ 8.20 R$ 8.20
2.4. Installation cost R$ 40.00
3. GREYWATER TREATMENT SYSTEM R$ 3,035.00
3.1. Greywater treatment station R$ 2,795.00
3.2. Site preparation and installation cost R$ 240.00
4. TREATED GREYWATER DISTRIBUTION PIPEWORK R$ 270.20
4.1. PVC connector with free flanges for greywater tank DN25 1 R$ 7.70 R$ 7.70
4.2. 3m PVC suction pipe DN25 1 R$ 4.85 R$ 4.85
4.3. 90o PVC elbow conection DN25 1 R$ 0.35 R$ 0.35
4.4. Garden water pump 1/4hp DN25 1 R$ 200.00 R$ 200.00
4.5. Hose bib garden tap kit DN25 1 R$ 17.30 R$ 17.30
4.6. Installation cost R$ 40.00
TOTAL COST R$ 5,477.45
Code Description Un. Quant. Unit Price Total
1. OPERATIONAL COSTS R$ 458.38
1.1. Garden water pump 1/4hp 450 W 105 hr/yr R$ 0,30 kwh R$ 14.18
1.2. Greywater treatment system 300 W 4380 hr/yr R$ 0,30 kwh R$ 394.20
1.3. Maintenance R$ 50.00
TOTAL COST R$ 458.38

Appendix O
366
HIGH INCOME DWELLINGS
Greywater treatment system – Reuse 2
Code Description Un. Quant. Unit Price Total
1. GREYWATER COLLECTION PIPEWORK R$ 1,212.20
1.1. 3m PVC collection pipe DN50 3 R$ 14.25 R$ 42.75
1.2. Inspection chamber DN50/100 7 R$ 125.35 R$ 877.45
1.3. 3m PVC collection pipe DN100 10 R$ 17.20 R$ 172.00
1.4. Installation cost R$ 120.00
2. GREYWATER DRAINAGE PIPEWORK R$ 960.05
2.1. 3m PVC drainage pipe DN100 2 R$ 17.20 R$ 34.40
2.2. Inspection chamber DN100 7 R$ 125.35 R$ 877.45
2.3. PVC "T"connection DN100 1 R$ 8.20 R$ 8.20
2.4. Installation cost R$ 40.00
3. GREYWATER TREATMENT SYSTEM R$ 16,740.00
3.1. Greywater treatment station R$ 16,500.00
3.2. Site preparation and installation cost R$ 240.00
4. TREATED GREYWATER DISTRIBUTION PIPEWORK R$ 2,345.55
4.1. PVC connector with free flanges for greywater tank DN25 1 R$ 7.70 R$ 7.70
4.2. 3m PVC suction pipe DN25 10 R$ 4.85 R$ 48.50
4.3. 90o PVC elbow conection DN25 5 R$ 0.35 R$ 1.75
4.4. Garden water pump 1/4hp DN25 1 R$ 200.00 R$ 200.00
4.5. Hose bib garden tap kit DN25 1 R$ 17.30 R$ 17.30
4.6. Distribution water pump 1/4hp DN25 1 R$ 200.00 R$ 200.00
4.7. PVC "T" connection DN25 1 R$ 0.80 R$ 0.80
4.8. 500 litres rainwater loft tank 1 R$ 144.60 R$ 144.60
4.9. Distribution water pump float switch 1 R$ 29.75 R$ 29.75
4.9. Potable water feed backup set 1 R$ 1,300.00 R$ 1,300.00
4.10. PVC connector with free flanges for greywater loft tank DN25 1 R$ 7.70 R$ 7.70
4.11. PVC connector with free flanges for greywater loft tank DN32 2 R$ 12.55 R$ 25.10
4.12. PVC connector with free flanges for greywater loft tank DN40 1 R$ 17.40 R$ 17.40
4.13. PVC "T" connection DN32 1 R$ 2.00 R$ 2.00
4.14. 90o PVC elbow conection DN32 1 R$ 1.25 R$ 1.25
4.15. 3m PVC overflow pipe DN32 1 R$ 15.70 R$ 15.70
4.16. PVC ball valve DN32 1 R$ 39.00 R$ 39.00
4.17. 3m PVC distribution pipe DN40 10 R$ 8.70 R$ 87.00
4.18. Installation cost R$ 200.00
TOTAL COST R$ 21,257.80
Code Description Un. Quant. Unit Price Total
1. OPERATIONAL COSTS R$ 910.95
1.1. Garden water pump 1/4hp 450 W 105 hr/yr R$ 0,30 kwh R$ 14.18
1.2. Distribution water pump 1/4hp 450 W 62 hr/yr R$ 0,30 kwh R$ 8.37
1.3. Greywater treatment system 300 W 8760 hr/yr R$ 0,30 kwh R$ 788.40
1.4. System maintenance R$ 100.00
TOTAL COST R$ 910.95

Appendix O
367
HIGH INCOME DWELLINGS
Greywater treatment system – Reuse 3
Code Description Un. Quant. Unit Price Total
1. GREYWATER COLLECTION PIPEWORK R$ 1,212.20
1.1. 3m PVC collection pipe DN50 3 R$ 14.25 R$ 42.75
1.2. Inspection chamber DN50/100 7 R$ 125.35 R$ 877.45
1.3. 3m PVC collection pipe DN100 10 R$ 17.20 R$ 172.00
1.4. Installation cost R$ 120.00
2. GREYWATER DRAINAGE PIPEWORK R$ 960.05
2.1. 3m PVC drainage pipe DN100 2 R$ 17.20 R$ 34.40
2.2. Inspection chamber DN100 7 R$ 125.35 R$ 877.45
2.3. PVC "T"connection DN100 1 R$ 8.20 R$ 8.20
2.4. Installation cost R$ 40.00
3. GREYWATER TREATMENT SYSTEM R$ 16,740.00
3.1. Greywater treatment station R$ 16,500.00
3.2. Site preparation and installation cost R$ 240.00
4. TREATED GREYWATER DISTRIBUTION PIPEWORK R$ 2,409.00
4.1. PVC connector with free flanges for greywater tank DN25 1 R$ 7.70 R$ 7.70
4.2. 3m PVC suction pipe DN25 10 R$ 4.85 R$ 48.50
4.3. 90o PVC elbow conection DN25 5 R$ 0.35 R$ 1.75
4.4. Garden water pump 1/4hp DN25 1 R$ 200.00 R$ 200.00
4.5. Hose bib garden tap kit DN25 1 R$ 17.30 R$ 17.30
4.6. Distribution water pump 1/4hp DN25 1 R$ 200.00 R$ 200.00
4.7. 500 litres rainwater loft tank 1 R$ 144.60 R$ 144.60
4.8. Distribution water pump float switch 1 R$ 29.75 R$ 29.75
4.9. Potable water feed backup set 1 R$ 1,300.00 R$ 1,300.00
4.9. PVC connector with free flanges for greywater loft tank DN25 1 R$ 7.70 R$ 7.70
4.10. PVC connector with free flanges for greywater loft tank DN32 2 R$ 12.55 R$ 25.10
4.11. PVC connector with free flanges for greywater loft tank DN40 1 R$ 17.40 R$ 17.40
4.12. PVC "T" connection DN32 1 R$ 2.00 R$ 2.00
4.13. 90o PVC elbow conection DN32 1 R$ 1.25 R$ 1.25
4.14. 3m PVC overflow pipe DN32 1 R$ 15.70 R$ 15.70
4.15. PVC ball valve DN32 1 R$ 39.00 R$ 39.00
4.16. 3m PVC distribution pipe DN40 10 R$ 8.70 R$ 87.00
4.17. 3m PVC distribution pipe DN25 5 R$ 4.85 R$ 24.25
4.18. Installation cost R$ 240.00
TOTAL COST R$ 21,321.25
Code Description Un. Quant. Unit Price Total
1. OPERATIONAL COSTS R$ 927.15
1.1. Garden water pump 1/4hp 450 W 105 hr/yr R$ 0,30 kwh R$ 14.18
1.2. Distribution water pump 1/4hp 450 W 182 hr/yr R$ 0,30 kwh R$ 24.57
1.3. Greywater treatment system 300 W 8760 hr/yr R$ 0,30 kwh R$ 788.40
1.4. System maintenance R$ 100.00
TOTAL COST R$ 927.15

Appendix O
368
MID-HIGH INCOME DWELLINGS
Greywater treatment system – Reuse 1
Code Description Un. Quant. Unit Price Total
1. GREYWATER COLLECTION PIPEWORK R$ 508.55
1.2. Inspection chamber DN100 1 R$ 125.35 R$ 125.35
1.3. 6m PVC collection pipe DN100 3 R$ 34.40 R$ 103.20
1.4. Installation cost R$ 280.00
2. GREYWATER DRAINAGE PIPEWORK R$ 199.75
2.1. 6m PVC drainage pipe DN100 1 R$ 34.40 R$ 34.40
2.2. Inspection chamber DN100 1 R$ 125.35 R$ 125.35
2.4. Installation cost R$ 40.00
3. GREYWATER TREATMENT SYSTEM R$ 18,150.00
3.1. Greywater treatment station R$ 16,500.00
3.2. Site preparation and installation cost R$ 1,650.00
4. TREATED GREYWATER DISTRIBUTION PIPEWORK R$ 270.20
4.1. PVC connector with free flanges for greywater tank DN25 1 R$ 7.70 R$ 7.70
4.2. 3m PVC suction pipe DN25 1 R$ 4.85 R$ 4.85
4.3. 90o PVC elbow conection DN25 1 R$ 0.35 R$ 0.35
4.4. Garden water pump 1/4hp DN25 1 R$ 200.00 R$ 200.00
4.5. Hose bib garden tap kit DN25 1 R$ 17.30 R$ 17.30
4.6. Installation cost R$ 40.00
TOTAL COST R$ 19,128.50
Code Description Un. Quant. Unit Price Total
1. OPERATIONAL COSTS R$ 569.85
1.1. Garden water pump 1/4hp 450 W 190 hr/yr R$ 0,30 kwh R$ 25.65
1.2. Greywater treatment system 300 W 4380 hr/yr R$ 0,30 kwh R$ 394.20
1.3. System maintenance R$ 150.00
TOTAL COST R$ 569.85

Appendix O
369
MID-HIGH INCOME DWELLINGS
Greywater treatment system – Reuse 2
Code Description Un. Quant. Unit Price Total
1. GREYWATER COLLECTION PIPEWORK R$ 456.70
1.2. Inspection chamber DN50/100 2 R$ 125.35 R$ 250.70
1.3. 3m PVC collection pipe DN100 5 R$ 17.20 R$ 86.00
1.4. Installation cost R$ 120.00
2. GREYWATER DRAINAGE PIPEWORK R$ 951.85
2.1. 3m PVC drainage pipe DN100 2 R$ 17.20 R$ 34.40
2.2. Inspection chamber DN100 7 R$ 125.35 R$ 877.45
2.4. Installation cost R$ 40.00
3. GREYWATER TREATMENT SYSTEM R$ 18,150.00
3.1. Greywater treatment station R$ 16,500.00
3.2. Site preparation and installation cost R$ 1,650.00
4. TREATED GREYWATER DISTRIBUTION PIPEWORK R$ 6,495.35
4.1. 6m PVC suction pipe DN25 10 R$ 9.70 R$ 97.00
4.2. 90o PVC elbow conection DN25 15 R$ 0.35 R$ 5.25
4.3. Garden water pump 1/4hp DN25 1 R$ 200.00 R$ 200.00
4.4. Hose bib garden tap kit DN25 1 R$ 17.30 R$ 17.30
4.5. Distribution water pump 1hp DN25 1 R$ 400.00 R$ 400.00
4.6. 2,500 litres greywater loft tank 2 R$ 990.40 R$ 1,980.80
4.7. Distribution water pump float switch 2 R$ 29.75 R$ 59.50
4.8. Potable water feed backup set 2 R$ 1,300.00 R$ 2,600.00
4.9. PVC connector with free flanges for greywater loft tank DN25 2 R$ 7.70 R$ 15.40
4.10. PVC connector with free flanges for greywater loft tank DN32 4 R$ 12.55 R$ 50.20
4.11. PVC connector with free flanges for greywater loft tank DN40 2 R$ 17.40 R$ 34.80
4.12. PVC "T" connection DN32 2 R$ 2.00 R$ 4.00
4.13. 90o PVC elbow conection DN32 2 R$ 1.25 R$ 2.50
4.14. 6m PVC overflow pipe DN32 2 R$ 31.40 R$ 62.80
4.15. PVC ball valve DN32 2 R$ 39.00 R$ 78.00
4.16. 6m PVC distribution pipe DN40 15 R$ 17.40 R$ 261.00
4.17. 90o PVC elbow conection DN40 4 R$ 4.25 R$ 17.00
4.18. PVC "T" connection DN40 2 R$ 4.90 R$ 9.80
4.19. Installation cost R$ 600.00
TOTAL COST R$ 26,053.90
Code Description Un. Quant. Unit Price Total
1. OPERATIONAL COSTS R$ 1,432.74
1.1. Garden water pump 1/4hp 450 W 190 hr/yr R$ 0,30 kwh R$ 25.65
1.2. Distribution water pump 1hp 1300W 2731 hr/yr R$ 0,30 kwh R$ 368.69
1.3. Greywater treatment system 300 W 8760 hr/yr R$ 0,30 kwh R$ 788.40
1.4. System maintenance R$ 250.00
TOTAL COST R$ 1,432.74

Appendix O
370
MID-HIGH INCOME DWELLINGS
Greywater treatment system – Reuse 3
Code Description Un. Quant. Unit Price Total
1. GREYWATER COLLECTION PIPEWORK R$ 793.40
1.2. Inspection chamber DN50/10
0 4 R$ 125.35 R$ 501.40
1.3. 3m PVC collection pipe DN100 10 R$ 17.20 R$ 172.00
1.4. Installation cost R$ 120.00
2. GREYWATER DRAINAGE PIPEWORK R$ 951.85
2.1. 3m PVC drainage pipe DN100 2 R$ 17.20 R$ 34.40
2.2. Inspection chamber DN100 7 R$ 125.35 R$ 877.45
2.4. Installation cost R$ 40.00
3. GREYWATER TREATMENT SYSTEM R$ 18,150.00
3.1. Greywater treatment station R$ 16,500.00
3.2. Site preparation and installation cost R$ 1,650.00
4. TREATED GREYWATER DISTRIBUTION PIPEWORK R$ 6,766.55
4.1. 6m PVC suction pipe DN25 10 R$ 9.70 R$ 97.00
4.2. 90o PVC elbow conection DN25 15 R$ 0.35 R$ 5.25
4.3. Garden water pump 1/4hp DN25 1 R$ 200.00 R$ 200.00
4.4. Hose bib garden tap kit DN25 1 R$ 17.30 R$ 17.30
4.5. Distribution water pump 1hp DN25 1 R$ 400.00 R$ 400.00
4.6. 2,500 litres greywater loft tank 2 R$ 990.40 R$ 1,980.80
4.7. Distribution water pump float switch 2 R$ 29.75 R$ 59.50
4.8. Potable water feed backup set 2 R$ 1,300.00 R$ 2,600.00
4.9. PVC connector with free flanges for greywater loft tank DN25 2 R$ 7.70 R$ 15.40
4.10. PVC connector with free flanges for greywater loft tank DN32 4 R$ 12.55 R$ 50.20
4.11. PVC connector with free flanges for greywater loft tank DN40 2 R$ 17.40 R$ 34.80
4.12. PVC "T" connection DN32 2 R$ 2.00 R$ 4.00
4.13. 90o PVC elbow conection DN32 2 R$ 1.25 R$ 2.50
4.14. 6m PVC overflow pipe DN32 2 R$ 31.40 R$ 62.80
4.15. PVC ball valve DN32 2 R$ 39.00 R$ 78.00
4.16. 6m PVC distribution pipe DN25 15 R$ 9.70 R$ 145.50
4.17. 90o PVC elbow conection DN25 12 R$ 0.35 R$ 4.20
4.18. PVC "T" connection DN25 2 R$ 0.75 R$ 1.50
4.19. 6m PVC distribution pipe DN40 15 R$ 17.40 R$ 261.00
4.20. 90o PVC elbow conection DN40 4 R$ 4.25 R$ 17.00
4.21. PVC "T" connection DN40 2 R$ 4.90 R$ 9.80
4.22. Installation cost R$ 720.00
TOTAL COST R$ 26,661.80
Code Description Un. Quant. Unit Price Total
1. OPERATIONAL COSTS R$ 1,432.74
1.1. Garden water pump 1/4hp 450 W 190 hr/yr R$ 0,30 kwh R$ 25.65
1.2. Distribution water pump 1hp 1300W 2731 hr/yr R$ 0,30 kwh R$ 368.69
1.3. Greywater treatment system 300 W 8760 hr/yr R$ 0,30 kwh R$ 788.40
1.4. System maintenance R$ 250.00
TOTAL COST R$ 1,432.74

Appendix O
371
MID-LOW INCOME DWELLINGS
Greywater treatment system – Reuse 1
Code Description Un. Quant. Unit Price Total
1. GREYWATER COLLECTION PIPEWORK R$ 735.90
1.1. 3m PVC collection pipe DN50 2 R$ 14.25 R$ 28.50
1.2. Inspection chamber DN50/100 4 R$ 125.35 R$ 501.40
1.3. 3m PVC collection pipe DN100 5 R$ 17.20 R$ 86.00
1.4. Installation cost R$ 120.00
2. GREYWATER DRAINAGE PIPEWORK R$ 182.55
2.1. 3m PVC drainage pipe DN100 1 R$ 17.20 R$ 17.20
2.2. Inspection chamber DN100 1 R$ 125.35 R$ 125.35
2.4. Installation cost R$ 40.00
3. GREYWATER TREATMENT SYSTEM R$ 3,035.00
3.1. Greywater treatment station R$ 2,795.00
3.2. Site preparation and installation cost R$ 240.00
4. TREATED GREYWATER DISTRIBUTION PIPEWORK R$ 270.20
4.1. PVC connector with free flanges for greywater tank DN25 1 R$ 7.70 R$ 7.70
4.2. 3m PVC suction pipe DN25 1 R$ 4.85 R$ 4.85
4.3. 90o PVC elbow conection DN25 1 R$ 0.35 R$ 0.35
4.4. Garden water pump 1/4hp DN25 1 R$ 200.00 R$ 200.00
4.5. Hose bib garden tap kit DN25 1 R$ 17.30 R$ 17.30
4.6. Installation cost R$ 40.00
TOTAL COST R$ 4,223.65
Code Description Un. Quant. Unit Price Total
1. OPERATIONAL COSTS R$ 498.88
1.1. Garden water pump 1/4hp 450 W 34,7 hr/yr R$ 0,30 kwh R$ 4.68
1.2. Greywater treatment system 300 W 4380 hr/yr R$ 0,30 kwh R$ 394.20
1.5. System maintenance R$ 100.00
TOTAL COST R$ 498.88

Appendix O
372
MID-LOW INCOME DWELLINGS
Greywater treatment system – Reuse 2
Code Description Un. Quant. Unit Price Total
1. GREYWATER COLLECTION PIPEWORK R$ 1,212.20
1.1. 3m PVC collection pipe DN50 3 R$ 14.25 R$ 42.75
1.2. Inspection chamber DN50/100 7 R$ 125.35 R$ 877.45
1.3. 3m PVC collection pipe DN100 10 R$ 17.20 R$ 172.00
1.4. Installation cost R$ 120.00
2. GREYWATER DRAINAGE PIPEWORK R$ 182.55
2.1. 3m PVC drainage pipe DN100 1 R$ 17.20 R$ 17.20
2.2. Inspection chamber DN100 1 R$ 125.35 R$ 125.35
2.4. Installation cost R$ 40.00
3. GREYWATER TREATMENT SYSTEM R$ 16,740.00
3.1. Greywater treatment station R$ 16,500.00
3.2. Site preparation and installation cost R$ 240.00
4. TREATED GREYWATER DISTRIBUTION PIPEWORK R$ 2,345.55
4.1. PVC connector with free flanges for greywater tank DN25 1 R$ 7.70 R$ 7.70
4.2. 3m PVC suction pipe DN25 10 R$ 4.85 R$ 48.50
4.3. 90o PVC elbow conection DN25 5 R$ 0.35 R$ 1.75
4.4. Garden water pump 1/4hp DN25 1 R$ 200.00 R$ 200.00
4.5. Hose bib garden tap kit DN25 1 R$ 17.30 R$ 17.30
4.6. Distribution water pump 1/4hp DN25 1 R$ 200.00 R$ 200.00
4.7. PVC "T" connection DN25 1 R$ 0.80 R$ 0.80
4.8. 500 litres rainwater loft tank 1 R$ 144.60 R$ 144.60
4.9. Distribution water pump float switch 1 R$ 29.75 R$ 29.75
4.9. Potable water feed backup set 1 R$ 1,300.00 R$ 1,300.00
4.10. PVC connector with free flanges for greywater loft tank DN25 1 R$ 7.70 R$ 7.70
4.11. PVC connector with free flanges for greywater loft tank DN32 2 R$ 12.55 R$ 25.10
4.12. PVC connector with free flanges for greywater loft tank DN40 1 R$ 17.40 R$ 17.40
4.13. PVC "T" connection DN32 1 R$ 2.00 R$ 2.00
4.14. 90o PVC elbow conection DN32 1 R$ 1.25 R$ 1.25
4.15. 3m PVC overflow pipe DN32 1 R$ 15.70 R$ 15.70
4.16. PVC ball valve DN32 1 R$ 39.00 R$ 39.00
4.17. 3m PVC distribution pipe DN40 10 R$ 8.70 R$ 87.00
4.18. Installation cost R$ 200.00
TOTAL COST R$ 20,480.30
Code Description Un. Quant. Unit Price Total
1. OPERATIONAL COSTS R$ 898.98
1.1. Garden water pump 1/4hp 450 W 34,7 hr/yr R$ 0,30 kwh R$ 4.68
1.2. Distribution water pump 1/4hp 450 W 43,7hr/yr R$ 0,30 kwh R$ 5.90
1.3. Greywater treatment system 300 W 8760 hr/yr R$ 0,30 kwh R$ 788.40
1.4. System maintenance R$ 100.00
TOTAL COST R$ 898.98

Appendix O
373
MID-LOW INCOME DWELLINGS
Greywater treatment system – Reuse 3
Code Description Un. Quant. Unit Price Total
1. GREYWATER COLLECTION PIPEWORK R$ 1,212.20
1.1. 3m PVC collection pipe DN50 3 R$ 14.25 R$ 42.75
1.2. Inspection chamber DN50/100 7 R$ 125.35 R$ 877.45
1.3. 3m PVC collection pipe DN100 10 R$ 17.20 R$ 172.00
1.4. Installation cost R$ 120.00
2. GREYWATER DRAINAGE PIPEWORK R$ 182.55
2.1. 3m PVC drainage pipe DN100 1 R$ 17.20 R$ 17.20
2.2. Inspection chamber DN100 1 R$ 125.35 R$ 125.35
2.4. Installation cost R$ 40.00
3. GREYWATER TREATMENT SYSTEM R$ 16,740.00
3.1. Greywater treatment station R$ 16,500.00
3.2. Site preparation and installation cost R$ 240.00
4. TREATED GREYWATER DISTRIBUTION PIPEWORK R$ 2,409.00
4.1. PVC connector with free flanges for greywater tank DN25 1 R$ 7.70 R$ 7.70
4.2. 3m PVC suction pipe DN25 10 R$ 4.85 R$ 48.50
4.3. 90o PVC elbow conection DN25 5 R$ 0.35 R$ 1.75
4.4. Garden water pump 1/4hp DN25 1 R$ 200.00 R$ 200.00
4.5. Hose bib garden tap kit DN25 1 R$ 17.30 R$ 17.30
4.6. Distribution water pump 1/4hp DN25 1 R$ 200.00 R$ 200.00
4.7. 500 litres rainwater loft tank 1 R$ 144.60 R$ 144.60
4.8. Distribution water pump float switch 1 R$ 29.75 R$ 29.75
4.9. Potable water feed backup set 1 R$ 1,300.00 R$ 1,300.00
4.9. PVC connector with free flanges for greywater loft tank DN25 1 R$ 7.70 R$ 7.70
4.10. PVC connector with free flanges for greywater loft tank DN32 2 R$ 12.55 R$ 25.10
4.11. PVC connector with free flanges for greywater loft tank DN40 1 R$ 17.40 R$ 17.40
4.12. PVC "T" connection DN32 1 R$ 2.00 R$ 2.00
4.13. 90o PVC elbow conection DN32 1 R$ 1.25 R$ 1.25
4.14. 3m PVC overflow pipe DN32 1 R$ 15.70 R$ 15.70
4.15. PVC ball valve DN32 1 R$ 39.00 R$ 39.00
4.16. 3m PVC distribution pipe DN40 10 R$ 8.70 R$ 87.00
4.17. 3m PVC distribution pipe DN25 5 R$ 4.85 R$ 24.25
4.18. Installation cost R$ 240.00
TOTAL COST R$ 20,543.75
Code Description Un. Quant. Unit Price Total
1. OPERATIONAL COSTS R$ 907.49
1.1. Garden water pump 1/4hp 450 W 34,7 hr/yr R$ 0,30 kwh R$ 4.68
1.2. Distribution water pump 1/4hp 450 W 106,7hr/yr R$ 0,30 kwh R$ 14.40
1.3. Greywater treatment system 300 W 8760 hr/yr R$ 0,30 kwh R$ 788.40
1.4. System maintenance R$ 100.00
TOTAL COST R$ 907.49

Appendix O
374
LOW INCOME DWELLINGS
Greywater treatment system – Reuse 1
Code Description Un. Quant. Unit Price Total
1. GREYWATER COLLECTION PIPEWORK R$ 276.80
1.1. 3m PVC collection pipe DN50 1 R$ 14.25 R$ 14.25
1.2. Inspection chamber DN50/100 1 R$ 125.35 R$ 125.35
1.3. 3m PVC collection pipe DN100 1 R$ 17.20 R$ 17.20
1.4. Installation cost R$ 120.00
2. GREYWATER DRAINAGE PIPEWORK R$ 182.55
2.1. 3m PVC drainage pipe DN100 1 R$ 17.20 R$ 17.20
2.2. Inspection chamber DN100 1 R$ 125.35 R$ 125.35
2.4. Installation cost R$ 40.00
3. GREYWATER TREATMENT SYSTEM R$ 3,035.00
3.1. Greywater treatment station R$ 2,795.00
3.2. Site preparation and installation cost R$ 240.00
4. TREATED GREYWATER DISTRIBUTION PIPEWORK R$ 270.20
4.1. PVC connector with free flanges for greywater tank DN25 1 R$ 7.70 R$ 7.70
4.2. 3m PVC suction pipe DN25 1 R$ 4.85 R$ 4.85
4.3. 90o PVC elbow conection DN25 1 R$ 0.35 R$ 0.35
4.4. Garden water pump 1/4hp DN25 1 R$ 200.00 R$ 200.00
4.5. Hose bib garden tap kit DN25 1 R$ 17.30 R$ 17.30
4.6. Installation cost R$ 40.00
TOTAL COST R$ 3,764.55
Code Description Un. Quant. Unit Price Total
1. OPERATIONAL COSTS R$ 793.18
1.1. Garden water pump 1/4hp 450 W 35,4hr/yr R$ 0,30 kwh R$ 4.78
1.3. Greywater treatment system 300 W 8760 hr/yr R$ 0,30 kwh R$ 788.40
TOTAL COST R$ 793.18

Appendix O
375
LOW INCOME DWELLINGS
Greywater treatment system – Reuse 2
Code Description Un. Quant. Unit Price Total
1. GREYWATER COLLECTION PIPEWORK R$ 579.10
1.1. 3m PVC collection pipe DN50 1 R$ 14.25 R$ 14.25
1.2. Inspection chamber DN50/100 3 R$ 125.35 R$ 376.05
1.3. 3m PVC collection pipe DN100 4 R$ 17.20 R$ 68.80
1.4. Installation cost R$ 120.00
2. GREYWATER DRAINAGE PIPEWORK R$ 182.55
2.1. 3m PVC drainage pipe DN100 1 R$ 17.20 R$ 17.20
2.2. Inspection chamber DN100 1 R$ 125.35 R$ 125.35
2.4. Installation cost R$ 40.00
3. GREYWATER TREATMENT SYSTEM R$ 16,740.00
3.1. Greywater treatment station R$ 16,500.00
3.2. Site preparation and installation cost R$ 240.00
4. TREATED GREYWATER DISTRIBUTION PIPEWORK R$ 2,242.00
4.1. PVC connector with free flanges for greywater tank DN25 1 R$ 7.70 R$ 7.70
4.2. 3m PVC suction pipe DN25 3 R$ 4.85 R$ 14.55
4.3. 90o PVC elbow conection DN25 5 R$ 0.35 R$ 1.75
4.4. Garden water pump 1/4hp DN25 1 R$ 200.00 R$ 200.00
4.5. Hose bib garden tap kit DN25 1 R$ 17.30 R$ 17.30
4.6. Distribution water pump 1/4hp DN25 1 R$ 200.00 R$ 200.00
4.7. PVC "T" connection DN25 1 R$ 0.80 R$ 0.80
4.8. 500 litres rainwater loft tank 1 R$ 144.60 R$ 144.60
4.9. Distribution water pump float switch 1 R$ 29.75 R$ 29.75
4.9. Potable water feed backup set 1 R$ 1,300.00 R$ 1,300.00
4.10. PVC connector with free flanges for greywater loft tank DN25 1 R$ 7.70 R$ 7.70
4.11. PVC connector with free flanges for greywater loft tank DN32 2 R$ 12.55 R$ 25.10
4.12. PVC connector with free flanges for greywater loft tank DN40 1 R$ 17.40 R$ 17.40
4.13. PVC "T" connection DN32 1 R$ 2.00 R$ 2.00
4.14. 90o PVC elbow conection DN32 1 R$ 1.25 R$ 1.25
4.15. 3m PVC overflow pipe DN32 1 R$ 15.70 R$ 15.70
4.16. PVC ball valve DN32 1 R$ 39.00 R$ 39.00
4.17. 3m PVC distribution pipe DN40 2 R$ 8.70 R$ 17.40
4.18. Installation cost R$ 200.00
TOTAL COST R$ 19,743.65
Code Description Un. Quant. Unit Price Total
1. OPERATIONAL COSTS R$ 897.36
1.1. Garden water pump 1/4hp 450 W 35,4hr/yr R$ 0,30 kwh R$ 4.78
1.2. Distribution water pump 1/4hp 450 W 31hr/yr R$ 0,30 kwh R$ 4.19
1.3. Greywater treatment system 300 W 8760 hr/yr R$ 0,30 kwh R$ 788.40
1.4. System maintenance R$ 100.00
TOTAL COST R$ 897.36
LOW INCOME DWELLINGS

Appendix O
376
Greywater treatment system – Reuse 3
Code Description Un. Quant. Unit Price Total
1. GREYWATER COLLECTION PIPEWORK R$ 579.10
1.1. 3m PVC collection pipe DN50 1 R$ 14.25 R$ 14.25
1.2. Inspection chamber DN50/100 3 R$ 125.35 R$ 376.05
1.3. 3m PVC collection pipe DN100 4 R$ 17.20 R$ 68.80
1.4. Installation cost R$ 120.00
2. GREYWATER DRAINAGE PIPEWORK R$ 182.55
2.1. 3m PVC drainage pipe DN100 1 R$ 17.20 R$ 17.20
2.2. Inspection chamber DN100 1 R$ 125.35 R$ 125.35
2.4. Installation cost R$ 40.00
3. GREYWATER TREATMENT SYSTEM R$ 16,740.00
3.1. Greywater treatment station R$ 16,500.00
3.2. Site preparation and installation cost R$ 240.00
4. TREATED GREYWATER DISTRIBUTION PIPEWORK R$ 2,306.35
4.1. PVC connector with free flanges for greywater tank DN25 1 R$ 7.70 R$ 7.70
4.2. 3m PVC suction pipe DN25 10 R$ 3.00 R$ 30.00
4.3. 90o PVC elbow conection DN25 5 R$ 0.35 R$ 1.75
4.4. Garden water pump 1/4hp DN25 1 R$ 200.00 R$ 200.00
4.5. Hose bib garden tap kit DN25 1 R$ 17.30 R$ 17.30
4.6. Distribution water pump 1/4hp DN25 1 R$ 200.00 R$ 200.00
4.7. 500 litres rainwater loft tank 1 R$ 144.60 R$ 144.60
4.8. Distribution water pump float switch 1 R$ 29.75 R$ 29.75
4.9. Potable water feed backup set 1 R$ 1,300.00 R$ 1,300.00
4.9. PVC connector with free flanges for greywater loft tank DN25 1 R$ 7.70 R$ 7.70
4.10. PVC connector with free flanges for greywater loft tank DN32 2 R$ 12.55 R$ 25.10
4.11. PVC connector with free flanges for greywater loft tank DN40 1 R$ 17.40 R$ 17.40
4.12. PVC "T" connection DN32 1 R$ 2.00 R$ 2.00
4.13. 90o PVC elbow conection DN32 1 R$ 1.25 R$ 1.25
4.14. 3m PVC overflow pipe DN32 1 R$ 15.70 R$ 15.70
4.15. PVC ball valve DN32 1 R$ 39.00 R$ 39.00
4.16. 3m PVC distribution pipe DN40 2 R$ 8.70 R$ 17.40
4.17. 3m PVC distribution pipe DN25 2 R$ 4.85 R$ 9.70
4.18. Installation cost R$ 240.00
TOTAL COST R$ 19,808.00
Code Description Un. Quant. Unit Price Total
1. OPERATIONAL COSTS R$ 901.82
1.1. Garden water pump 1/4hp 450 W 35,4hr/yr R$ 0,30 kwh R$ 4.78
1.2. Distribution water pump 1/4hp 450 W 64 hr/yr R$ 0,30 kwh R$ 8.64
1.3. Greywater treatment system 300 W 8760 hr/yr R$ 0,30 kwh R$ 788.40
1.4. System maintenance R$ 100.00
TOTAL COST R$ 901.82

Appendix P Costs of Wastewater Reclamation Systems

Appendix P
378
HIGH INCOME DWELLINGS
Wastewater treatment system – Reuse 1
Code Description Un. Quant. Unit Price Total
1. WASTEWATER COLLECTION PIPEWORK R$ 971.70
1.1. 3m PVC collection pipe DN50 1 R$ 14.25 R$ 14.25
1.2. Inspection chamber DN100 7 R$ 125.35 R$ 877.45
1.4. Installation cost R$ 80.00
2. WASTEWATER DRAINAGE PIPEWORK R$ 951.85
2.1. 3m PVC drainage pipe DN100 2 R$ 17.20 R$ 34.40
2.2. Inspection chamber DN100 7 R$ 125.35 R$ 877.45
2.4. Installation cost R$ 40.00
3. WASTEWATER TREATMENT SYSTEM R$ 18,150.00
3.1. Wastewater treatment station R$ 16,500.00
3.2. Site preparation and installation cost R$ 1,650.00
4. TREATED WASTEWATER DISTRIBUTION PIPEWORK R$ 270.20
4.1. PVC connector with free flanges for greywater tank DN25 1 R$ 7.70 R$ 7.70
4.2. 3m PVC suction pipe DN25 1 R$ 4.85 R$ 4.85
4.3. 90o PVC elbow conection DN25 1 R$ 0.35 R$ 0.35
4.4. Garden water pump 1/4hp DN25 1 R$ 200.00 R$ 200.00
4.5. Hose bib garden tap kit DN25 1 R$ 17.30 R$ 17.30
4.6. Installation cost R$ 40.00
TOTAL COST R$ 20,343.75
Code Description Un. Quant. Unit Price Total
1. OPERATIONAL COSTS R$ 458.38
1.1. Garden water pump 1/4hp 450 W 105 hr/yr R$ 0,30 kwh R$ 14.18
1.2. Wastewater treatment system 300 W 4380 hr/yr R$ 0,30 kwh R$ 394.20
1.3. Maintenance R$ 50.00
TOTAL COST R$ 458.38

Appendix P
379
HIGH INCOME DWELLINGS
Wastewater treatment system – Reuse 2
Code Description Un. Quant. Unit Price Total
1. WASTEWATER COLLECTION PIPEWORK R$ 1,040.20
1.1. 3m PVC collection pipe DN50 3 R$ 14.25 R$ 42.75
1.2. Inspection chamber DN50/100 7 R$ 125.35 R$ 877.45
1.4. Installation cost R$ 120.00
2. WASTEWATER DRAINAGE PIPEWORK R$ 951.85
2.1. 3m PVC drainage pipe DN100 2 R$ 17.20 R$ 34.40
2.2. Inspection chamber DN100 7 R$ 125.35 R$ 877.45
2.4. Installation cost R$ 40.00
3. WASTEWATER RECYCLING SYSTEM R$ 18,150.00
3.1. Wastewater treatment station R$ 16,500.00
3.2. Site preparation and installation cost R$ 1,650.00
4. TREATED WASTEWATER DISTRIBUTION PIPEWORK R$ 2,345.55
4.1. PVC connector with free flanges for greywater tank DN25 1 R$ 7.70 R$ 7.70
4.2. 3m PVC suction pipe DN25 10 R$ 4.85 R$ 48.50
4.3. 90o PVC elbow conection DN25 5 R$ 0.35 R$ 1.75
4.4. Garden water pump 1/4hp DN25 1 R$ 200.00 R$ 200.00
4.5. Hose bib garden tap kit DN25 1 R$ 17.30 R$ 17.30
4.6. Distribution water pump 1/4hp DN25 1 R$ 200.00 R$ 200.00
4.7. PVC "T" connection DN25 1 R$ 0.80 R$ 0.80
4.8. 500 litres rainwater loft tank 1 R$ 144.60 R$ 144.60
4.9. Distribution water pump float switch 1 R$ 29.75 R$ 29.75
4.9. Potable water feed backup set 1 R$ 1,300.00 R$ 1,300.00
4.10. PVC connector with free flanges for greywater loft tank DN25 1 R$ 7.70 R$ 7.70
4.11. PVC connector with free flanges for greywater loft tank DN32 2 R$ 12.55 R$ 25.10
4.12. PVC connector with free flanges for greywater loft tank DN40 1 R$ 17.40 R$ 17.40
4.13. PVC "T" connection DN32 1 R$ 2.00 R$ 2.00
4.14. 90o PVC elbow conection DN32 1 R$ 1.25 R$ 1.25
4.15. 3m PVC overflow pipe DN32 1 R$ 15.70 R$ 15.70
4.16. PVC ball valve DN32 1 R$ 39.00 R$ 39.00
4.17. 3m PVC distribution pipe DN40 10 R$ 8.70 R$ 87.00
4.18. Installation cost R$ 200.00
TOTAL COST R$ 22,487.60
Code Description Un. Quant. Unit Price Total
1. OPERATIONAL COSTS R$ 910.95
1.1. Garden water pump 1/4hp 450 W 105 hr/yr R$ 0,30 kwh R$ 14.18
1.2. Distribution water pump 1/4hp 450 W 62 hr/yr R$ 0,30 kwh R$ 8.37
1.3. Wastewater treatment system 300 W 8760 hr/yr R$ 0,30 kwh R$ 788.40
1.4. System maintenance R$ 100.00
TOTAL COST R$ 910.95

Appendix P
380
MID-HIGH INCOME DWELLINGS
Wastewater treatment system – Reuse 1
Code Description Un. Quant. Unit Price Total
1. WASTEWATER COLLECTION PIPEWORK R$ 222.55
1.1. 3m PVC collection pipe DN100 1 R$ 17.20 R$ 17.20
1.2. Inspection chamber DN100 1 R$ 125.35 R$ 125.35
1.4. Installation cost R$ 80.00
2. WASTEWATER DRAINAGE PIPEWORK R$ 951.85
2.1. 3m PVC drainage pipe DN100 2 R$ 17.20 R$ 34.40
2.2. Inspection chamber DN100 7 R$ 125.35 R$ 877.45
2.4. Installation cost R$ 40.00
3. WASTEWATER TREATMENT SYSTEM R$ 18,150.00
3.1. Wastewater treatment station R$ 16,500.00
3.2. Site preparation and installation cost R$ 1,650.00
4. TREATED WASTEWATER DISTRIBUTION PIPEWORK R$ 270.20
4.1. PVC connector with free flanges for greywater tank DN25 1 R$ 7.70 R$ 7.70
4.2. 3m PVC suction pipe DN25 1 R$ 4.85 R$ 4.85
4.3. 90o PVC elbow conection DN25 1 R$ 0.35 R$ 0.35
4.4. Garden water pump 1/4hp DN25 1 R$ 200.00 R$ 200.00
4.5. Hose bib garden tap kit DN25 1 R$ 17.30 R$ 17.30
4.6. Installation cost R$ 40.00
TOTAL COST R$ 19,594.60
Code Description Un. Quant. Unit Price Total
1. OPERATIONAL COSTS R$ 894.34
1.1. Garden water pump 1/4hp 450 W 190 hr/yr R$ 0,30 kwh R$ 25.65
1.2. Distribution water pump 1hp 1300W 2731 hr/yr R$ 0,30 kwh R$ 368.69
1.3. Maintenance R$ 500.00
TOTAL COST R$ 894.34

Appendix P
381
MID-HIGH INCOME DWELLINGS
Wastewater treatment system – Reuse 2
Code Description Un. Quant. Unit Price Total
1. WASTEWATER COLLECTION PIPEWORK R$ 1,040.20
1.1. 3m PVC collection pipe DN50 3 R$ 14.25 R$ 42.75
1.2. Inspection chamber DN50/100 7 R$ 125.35 R$ 877.45
1.4. Installation cost R$ 120.00
2. WASTEWATER DRAINAGE PIPEWORK R$ 951.85
2.1. 3m PVC drainage pipe DN100 2 R$ 17.20 R$ 34.40
2.2. Inspection chamber DN100 7 R$ 125.35 R$ 877.45
2.4. Installation cost R$ 40.00
3. WASTEWATER RECYCLING SYSTEM R$ 18,150.00
3.1. Wastewater treatment station R$ 16,500.00
3.2. Site preparation and installation cost R$ 1,650.00
4. TREATED WASTEWATER DISTRIBUTION PIPEWORK R$ 2,345.55
4.1. PVC connector with free flanges for greywater tank DN25 1 R$ 7.70 R$ 7.70
4.2. 3m PVC suction pipe DN25 10 R$ 4.85 R$ 48.50
4.3. 90o PVC elbow conection DN25 5 R$ 0.35 R$ 1.75
4.4. Garden water pump 1/4hp DN25 1 R$ 200.00 R$ 200.00
4.5. Hose bib garden tap kit DN25 1 R$ 17.30 R$ 17.30
4.6. Distribution water pump 1/4hp DN25 1 R$ 200.00 R$ 200.00
4.7. PVC "T" connection DN25 1 R$ 0.80 R$ 0.80
4.8. 500 litres rainwater loft tank 1 R$ 144.60 R$ 144.60
4.9. Distribution water pump float switch 1 R$ 29.75 R$ 29.75
4.9. Potable water feed backup set 1 R$ 1,300.00 R$ 1,300.00
4.10. PVC connector with free flanges for greywater loft tank DN25 1 R$ 7.70 R$ 7.70
4.11. PVC connector with free flanges for greywater loft tank DN32 2 R$ 12.55 R$ 25.10
4.12. PVC connector with free flanges for greywater loft tank DN40 1 R$ 17.40 R$ 17.40
4.13. PVC "T" connection DN32 1 R$ 2.00 R$ 2.00
4.14. 90o PVC elbow conection DN32 1 R$ 1.25 R$ 1.25
4.15. 3m PVC overflow pipe DN32 1 R$ 15.70 R$ 15.70
4.16. PVC ball valve DN32 1 R$ 39.00 R$ 39.00
4.17. 3m PVC distribution pipe DN40 10 R$ 8.70 R$ 87.00
4.18. Installation cost R$ 200.00
TOTAL COST R$ 22,487.60
Code Description Un. Quant. Unit Price Total
1. OPERATIONAL COSTS R$ 1,682.74
1.1. Garden water pump 1/4hp 450 W 190 hr/yr R$ 0,30 kwh R$ 25.65
1.2. Distribution water pump 1hp 1300W 2731 hr/yr
R$ 0,30 kwh R$ 368.69
1.3. Greywater treatment system 300 W 8760 hr/yr
R$ 0,30 kwh R$ 788.40
1.4. System maintenance R$ 500.00
TOTAL COST R$ 1,682.74

Appendix P
382
MID-LOW INCOME DWELLINGS
Wastewater treatment system – Reuse 1
Code Description Un. Quant. Unit Price Total
1. WASTEWATER COLLECTION PIPEWORK R$ 971.70
1.1. 3m PVC collection pipe DN50 1 R$ 14.25 R$ 14.25
1.2. Inspection chamber DN100 7 R$ 125.35 R$ 877.45
1.4. Installation cost R$ 80.00
2. WASTEWATER DRAINAGE PIPEWORK R$ 951.85
2.1. 3m PVC drainage pipe DN100 2 R$ 17.20 R$ 34.40
2.2. Inspection chamber DN100 7 R$ 125.35 R$ 877.45
2.4. Installation cost R$ 40.00
3. WASTEWATER TREATMENT SYSTEM R$ 18,150.00
3.1. Wastewater treatment station R$ 16,500.00
3.2. Site preparation and installation cost R$ 1,650.00
4. TREATED WASTEWATER DISTRIBUTION PIPEWORK R$ 270.20
4.1. PVC connector with free flanges for greywater tank DN25 1 R$ 7.70 R$ 7.70
4.2. 3m PVC suction pipe DN25 1 R$ 4.85 R$ 4.85
4.3. 90o PVC elbow conection DN25 1 R$ 0.35 R$ 0.35
4.4. Garden water pump 1/4hp DN25 1 R$ 200.00 R$ 200.00
4.5. Hose bib garden tap kit DN25 1 R$ 17.30 R$ 17.30
4.6. Installation cost R$ 40.00
TOTAL COST R$ 20,343.75
Code Description Un. Quant. Unit Price Total
1. OPERATIONAL COSTS R$ 498.88
1.1. Garden water pump 1/4hp 450 W 34,7 hr/yr R$ 0,30 kwh R$ 4.68
1.2. Wastewater treatment system 300 W 4380 hr/yr R$ 0,30 kwh R$ 394.20
1.3. Maintenance R$ 100.00
TOTAL COST R$ 498.88

Appendix P
383
MID-LOW INCOME DWELLINGS
Wastewater treatment system – Reuse 2
Code Description Un. Quant. Unit Price Total
1. WASTEWATER COLLECTION PIPEWORK R$ 1,040.20
1.1. 3m PVC collection pipe DN50 3 R$ 14.25 R$ 42.75
1.2. Inspection chamber DN50/100 7 R$ 125.35 R$ 877.45
1.4. Installation cost R$ 120.00
2. WASTEWATER DRAINAGE PIPEWORK R$ 951.85
2.1. 3m PVC drainage pipe DN100 2 R$ 17.20 R$ 34.40
2.2. Inspection chamber DN100 7 R$ 125.35 R$ 877.45
2.4. Installation cost R$ 40.00
3. WASTEWATER RECYCLING SYSTEM R$ 18,150.00
3.1. Wastewater treatment station R$ 16,500.00
3.2. Site preparation and installation cost R$ 1,650.00
4. TREATED WASTEWATER DISTRIBUTION PIPEWORK R$ 2,345.55
4.1. PVC connector with free flanges for greywater tank DN25 1 R$ 7.70 R$ 7.70
4.2. 3m PVC suction pipe DN25 10 R$ 4.85 R$ 48.50
4.3. 90o PVC elbow conection DN25 5 R$ 0.35 R$ 1.75
4.4. Garden water pump 1/4hp DN25 1 R$ 200.00 R$ 200.00
4.5. Hose bib garden tap kit DN25 1 R$ 17.30 R$ 17.30
4.6. Distribution water pump 1/4hp DN25 1 R$ 200.00 R$ 200.00
4.7. PVC "T" connection DN25 1 R$ 0.80 R$ 0.80
4.8. 500 litres rainwater loft tank 1 R$ 144.60 R$ 144.60
4.9. Distribution water pump float switch 1 R$ 29.75 R$ 29.75
4.9. Potable water feed backup set 1 R$ 1,300.00 R$ 1,300.00
4.10. PVC connector with free flanges for greywater loft tank DN25 1 R$ 7.70 R$ 7.70
4.11. PVC connector with free flanges for greywater loft tank DN32 2 R$ 12.55 R$ 25.10
4.12. PVC connector with free flanges for greywater loft tank DN40 1 R$ 17.40 R$ 17.40
4.13. PVC "T" connection DN32 1 R$ 2.00 R$ 2.00
4.14. 90o PVC elbow conection DN32 1 R$ 1.25 R$ 1.25
4.15. 3m PVC overflow pipe DN32 1 R$ 15.70 R$ 15.70
4.16. PVC ball valve DN32 1 R$ 39.00 R$ 39.00
4.17. 3m PVC distribution pipe DN40 10 R$ 8.70 R$ 87.00
4.18. Installation cost R$ 200.00
TOTAL COST R$ 22,487.60
Code Description Un. Quant. Unit Price Total
1. OPERATIONAL COSTS R$ 898.98
1.1. Garden water pump 1/4hp 450 W 34,7 hr/yr R$ 0,30 kwh R$ 4.68
1.2. Distribution water pump 1/4hp 450 W 43,7hr/yr R$ 0,30 kwh R$ 5.90
1.3. Wastewater treatment system 300 W 8760 hr/yr R$ 0,30 kwh R$ 788.40
1.4. System maintenance R$ 100.00
TOTAL COST R$ 898.98

Appendix P
384
LOW INCOME DWELLINGS
Wastewater treatment system – Reuse 1
Code Description Un. Quant. Unit Price Total
1. RAINWATER COLLECTION PIPEWORK R$ 829.25
1.1. 3m PVC gutter 132x89 1 R$ 51.25 R$ 51.25
1.2. Gutter union bracket 132x89 1 R$ 14.10 R$ 14.10
1.3. Gutter support bracket 132x89 3 R$ 4.70 R$ 14.10
1.4. Gutter running outlet 132x89 1 R$ 26.90 R$ 26.90
1.5. External stop end 132x89 2 R$ 7.15 R$ 14.30
1.7. 60o PVC offset bends DN80 2 R$ 10.90 R$ 21.80
1.8. 3m PVC Downpipe DN80 1 R$ 46.00 R$ 46.00
1.9. Downpipe bracket DN80 2 R$ 5.20 R$ 10.40
1.10. PVC "T" connection with inspection acess DN80 1 R$ 11.95 R$ 11.95
1.11. 90o PVC downpipe transition elbow connection 80x100 1 R$ 23.25 R$ 23.25
1.12. 3m PVC collection pipe DN100 1 R$ 17.20 R$ 17.20
1.13. Rainwater filter DN100 1 R$ 498.00 R$ 498.00
1.14. Installation cost R$ 80.00
2. RAINWATER DRAINAGE PIPEWORK R$ 88.45
2.1. 3m PVC drainage pipe DN100 2 R$ 17.20 R$ 34.40
2.2. 45o PVC elbow connection DN100 1 R$ 5.85 R$ 5.85
2.3. PVC "T"connection DN100 1 R$ 8.20 R$ 8.20
2.4. Installation cost R$ 40.00
3. TREATED RAINWATER DISTRIBUTION PIPEWORK R$ 270.20
3.1. PVC connector with free flanges for rainwater cistern DN25 1 R$ 7.70 R$ 7.70
3.2. 3m PVC suction pipe DN25 1 R$ 4.85 R$ 4.85
3.3. 90o PVC elbow conection DN25 1 R$ 0.35 R$ 0.35
3.4. Garden water pump 1/4hp DN25 1 R$ 200.00 R$ 200.00
3.5. Hose bib garden tap kit DN25 1 R$ 17.30 R$ 17.30
3.6. Installation cost R$ 40.00
TOTAL COST R$ 1,187.90
Code Description Un. Quant. Unit Price Total
1. OPERATIONAL COSTS R$ 4.78
1.1. Garden water pump 1/4hp 450 W 35,4hr/yr R$ 0,30 kwh R$ 4.78
TOTAL COST R$ 4.78