bombay, saurashtra and kutch - Linguistic Survey Of India
349
CENSUS OF INDIA, Volume IV BOMBAY, SAURASHTRA AND KUTCH PART I Report and Subsidiary Tables By J. B. BOWMAN 0/ the. Indian Civil Se.rvice, oj CensUs OPeTations Jar Bomhay, Saurashtra cmd Kutch BOMBAY PRINTED AT THE GOVERNMENT CENTRAL PRESS Price-Rupees Fifteen Annas Eight 1953
-
Upload
khangminh22 -
Category
Documents
-
view
0 -
download
0
Transcript of bombay, saurashtra and kutch - Linguistic Survey Of India

CENSUS OF INDIA, ~1951
Volume IV
BOMBAY, SAURASHTRA AND KUTCH PART I
Report and Subsidiary Tables
By
J. B. BOWMAN 0/ the. Indian Civil Se.rvice,
Sup~rintendent oj CensUs OPeTations
Jar Bomhay, Saurashtra cmd Kutch
BOMBAY PRINTED AT THE GOVERNMENT CENTRAL PRESS
Price-Rupees Fifteen Annas Eight
1953


ACKNOWLEDGEMENTS
When so many people-not least the public-have contributed towards the success of the census it is perhaps invidious to single out individuals for special mention. I should like however to record my special thanks to Shri B. G. KHER, the 'former Chief Minister' of Bombay and now High Commissioner for India in the United Kingdom, Shri M. R. DFSAI, the former Home and Revenue Minister and now the Chief Minister of Bombay, Shri M. D. BHAT, I.C.S., who was the Chief Secretary to the Government of Bombay when the census was taken, and his successor Shri M. D. BHANSALI, I.C.S. The Bombay Government and its officers did everything possible to secure a successful census of the State. I should also like to record my thanks to Shri U. N. DHEBAR, Chief Minister of Saurashtra, Shri B. R. PATEL, I.C.S., Chief Secretary to the Government of Saurashtra, and Shri R. K. TRIVEDI, I.A.S., formerly Collector of Bhavnagar. In Kutch the arrangements for the census were in the capable hands of Shri T. M. SHETH, Collector of Kutch.
My office staff, and in particular my Head Clerk Shri V. R. RANADE, worked with great devotion to secure a successful census.
The printing of this Report and the Tables volumes has been done by, the Government Central Press. I should like in particular to thank the Manager Shri D. K. PRADHAN, the Assistant Manager Shri B. S. NAIK (whose advice on lay-out was most useful) and Shri D. F. SAVAI, the Head Printer.
My friend MAURICE ZINKIN, I.C.S. (Retired), was good enough to read through the draft of this report,-to read through a draft census report deters all but the bravest -and his criticisms were most valuable .
• Lastly I should like to record my sense of gratitude to Shri R. A. GOPALASWAMI. o
I.C.S., Registrar General, India, and ex-officio Census Commissioner of India whose careful planning of the manifold stages of the census operation made the Census Superintendent's job lighter than it otherwise would have been, and whose leadership infused the team of Census Superintendents with an espri I de corps that made participation in the Census of India 1'951 a memorable experience.
Bombay, 11 th May, 1953. J: s:BOwMAN
Ida-A Bk H91-a

alRIAL _alit
I .1. ~
• , • 7
• • II
" IS I. .. IS
• " • IS .0 SI
U :d
sa
KEY TO HAP
HAMI Of PlStRlCT
OIUAT£R SO/rElAY BAMASICANTHA SAtJARKAN7HA. I1EHSIINA AHI1£DAtJAD /CAlif A PANCH I1AHALS BAROl>A BROACH ,/lRn
""'REU WI'" "./IANDISH EAST KHANDESH DANOS NASIK is AHffEDNAGAR ... POOHA Sf SAT,IRA NORTH sa SA'''''''' 'OUTH Sf /(OLHAPUR
J' SHOLAPUR 51 BElOAIIN ft BI"APUR H DHARWAR J6
THANA .KOLABA RATNACIRI KANARA HALAR MADHYA S,IURASHTRA ZAL .. WAD GOHILW,ID SORATH KUTCH
BOMBAY, SAURASHTRA AND KUTCH STATE S
NlJf SltoUli'!J D/,fto!t:f tIna Ti1/vk4 6ovnlil";6S N
0204041080
tf.PZ P. POONA163.

+++++++++++++++++++++++++++++++++++++++++++++++++++++++++++++++++++
CONTENTS +++++++++++++++++++++++++++++++++++++++++++++++++++++++++++++++++++
INTRODUCTION
CHAPTER I-GENERAL POPULATION
S~ction I-Preliminary Remarks Section 2-General Distribution and Density Section 3-Growth Section 4-Movement Section 5-Births Section 6-Deaths Section 7-Livelihood Pattern Section 8-Concluding Remarks
CHAPTER II-RURAL POPULATION
PAGE
1
3 4 5 8
11 13 14 17
Section 1-Preliminary Remarks 19 Section 2-General Distribution; and Distribution among Villages
classified by Size of Rural Population 20 Section 3-Growth 21 Section 4-Movement 22 Section 5--Births 23 Section 6-Deaths 24 Section 7--Livelihood Pattern 24 Section 8-Concluding Remarks 29
CHAPTER III-URBAN POPULATION
Section 1-Preliminary Remarks 31 Section 2-·General Distribution; and Distribution among Towns classi-
fied by Size of Urban Population 32 Section 3-Growth 33 Section 4-Movement 35
Section 5-Births 36 Section 6-Deaths 38 Section 7--Livelihood Pattern 38
Section 8-Concluding Remarks 41 A (Bk) H 91-b

it CONTENTS
PAGE CHAPTER IV-AGRICULTURAL CLASSES
Section I-Preliminary Remarks 43 Section 2-Agricultural Population Ratios; Self-supporting Persons
and Dependants; Secondary Means of Livelihood of Agricultural Classes 45
Section 3-Relative Proportions of different Agricultural Classes; correlated to distribution of land in agricultural holdings of different sizes 50
Section 4-Cultivators of land wholly or mainly owned; and their dependants 54
Section 5-Cultivators of land wholly or mainly unowned; and their dependants 56
Section 6--Cultivating labourers; and their dependants 57 Section 7-Non-cultivating owners of cultivable land; agricultural
rent receivers; and their dependants 59 Section 8-Active and Semi-active workers in cultivation 61 Section 9-Progress of cultivation correlat.ed to growth of General
Population 61 Section 10-Concluding Remarks 65
CHAPTER V--NON-AGRICULTURAL CLASSES
Section I--Preliminary Remarks Section 2-Non-Agricultural Population Ratios; Self-supporting
Persons and Dependants; Secondary Means of Livelihood of Non-Agricultural Classes
Section 3-Employers, Employees and Independent Workers; and unemployment in Factories and Small-scale Iridustries
Section 4-Primary Industries other than cultivation, mining and quarrying
Section 5-Mining and Quarrying Section 6-Processing and Ma:nufacture-Foodstuffs, Textiles, Leather
and Products thereof Section 7-Processing and
Products thereof Manufacture-Metals, Chemicals
Section 8-Processing and Manufacture-Not specified elsewhere Section 9-Construction and Utilities Section 10--Commerce Section ll-Transport, Storage and Communications Section 12-Health, Education and Public Administration
o
and
Section 13-Services not elsewhere specified; and miscellaneous means of livelihood
Section 14-Concluding Remarks
CHAPTER VI-FAMILIES, SEXES AND PRINCIPAL AGE GROUPS
Section I-Preliminary Remarks Section 2--Territorial distribution of Houses and Households Section 3-Size and composition of family households Section 4-Sex Ratios Section 5-Marital Status Ratios Section 6-Infants (aged 0)
... ' ..
69
72
77
79 81
82
85 87 89 91 93 95
98 102
103 104 105 108 111 113

CONTENTS
. . Section 7-Young Children (aged 1-4) Section 8-Boys and Girls (aged 5-14) Section 9-Young Men and Women (aged 15-34) ... Section lO-Middle Aged Persons (aged 35-54) Section ll-Elderly Persons (aged 55 and over) ... Section l2-Concluding Remarks
CHAPTER Vn-8CHEDULED CASTES, SCHEDULED TRIBES AND OTHER BACKWARD CLASSES
Section I-Preliminary Remarks Section 2-The Scheduled Castes Section 3-The Scheduled Tribes Section 4-0ther (Unscheduled) Backward Classes
CHAPTER VIII-DISPLACED PERSONS
CHAPTER IX--LITERACY
CHAPTER X-LANGUAGE Section I-Mother Tongue Section 2-Bilingualism
CHAPTER XI-RELIGION
APPENDICES
APPENDIX A-THE 1951 CENSUS QUESTIONNAIRE AND INSTRUC-
.PAGE
115 116 116 118 118 119
123 124 125 126
129
137
147 149
151
TIONS TO ENUMERATORS 157
APPENDIX B-HOW ACCURATE WAS THE CENSUS? 163
APPENDIX C-BIRTH AND DEATH RATES 169
APPENDIX D-INDEX OF NON-AGRICULTURAL OCCUPATIONS-BOMBAY, SAURASHTRA AND KUTCH 171
SUBSIDIARY TABLES SERIES 1
l'l-Area and Population, actual and percentage, by taluka density 188
1·2-Variation and Density of General Population 192 l'3-Mean Decennial Growth Rates during Three Decades-
General Population 193 l'4-Immigration 198 l'5-Emigration 200 l'6-Migration between the State and other parts of India 206 l'7-Variation in Na.tural Population 207 l'S-Livelihood Pattern of General Population 208
SERIES 2 2'1-Distribution of Population between Villages 209 2'2-Variatjon and Density of Rural Population 210 2'3-Mean Decennial Growth Rates during Three Decades-
Rural Population 211 2·4-Livelihood Pattern of Rural Population 216

iv CONTENTS
PAGE
SERIES 3 a·l-Distribution of Population between Towns ... 217 3·2-Variation and Density of Urban Population.... 218 3·3-Mean pecennial Growth Rates during Three Decades-
Urban Population 219 3j·4-Towns classified by Population 224 3·5-Cities-Chief Figures 225 3·6-Number per 1,000 of the_ General PopUlation and of each
Livelihood Class who live in Towns 226 3·7-Livelihood Pattern of Urban Population 227
SERIES 4 4·1-Agricultural Classes per 1,000 persons of General Popu~
lation; number in each Class and Sub~Class of 10,000 persons of all Agricultural Classes; and comparison with Agricultural Holdings by Size of Holding 228
4·2-Livelihood Class I (Cultivators of land wholly or mainly owned and their dependants)-'-Number per 10,000 persons of Livelihood Class I in each Sub-Class; Secondary Means of Livelihood of 10,000 persons of Livelihood Class I 232
4-3-Livelihood Class II (Cultivators of land wholly or mainly unowned and their dependants)-Number per 10,000 persons of Livelihood Class II in each Sub-Class; Secondary Means of Livelihood of 10,000 persons of Livelihood Class II 234
4·4-Livelihood Class III (Cultivating labourers and their dependants)-Number per 10,000 persons of Livelihood Class III in .' each Sub-Class; Secondary Means of Livelihood of 10,000 persons of Livelihood Class III ... 236
-l·5-Livelihood Class IV (Non-cultivating owners of land; agricultural rent receivers and their dependants)Number per 10,000 persons of Livelihood Class IV in each Sub-Class; Secondary Means of Livelihood' of 10,000 persons of Livelihood Class IV 238
4·6-Active and Semi-active Workers in Cultivatiot;l 240 4·7-Progress of Cultivation during three decades 242 4·a-Components of Cultivated Area per Capita during three
decades 244 4·9-Land Area per Capita (1951); and trend of Cultivation
per Capita during three decades 246
SERIES 5 5·1-Non-Agricultural Classes per 1,000 of General Popu
lation; number in each Class and Sub-Class per 10,000 persons of all Non-Agricultural Classes; and number of Employers, Employees and Independent Workers per 10,000 self-supporting persons of all Non-Agricultural Classes 248
5·1-A-Non-Agricultural Classes per 1,000 of Rural Population; number in each Class and Sub-Class per 10,000 persons of all Non-Agricultural Classes; and number of Employers, Employees and Independent Workers per 10,000 self-supporting persons of all Non-Agricultural Classes 250

CONTENTS
!J'1-H-Non-Agricultural Classes per 1,000 of Urban Population; number in each Class and Sub-Class per 10,000 persons of all Non-Agricultural Classes; and number of Employers, Employees and Independent Workers per 10,000 self-supporting persons of all Non-Agri-
PAGS
cultural Classes 2S2
5'2-Livelihood Class V (Production other than cultivation)-Number per 10,000 persons of Livelihood Class V in each Sub-Class; Number per 10,000 selfsupporting persons of Livelihood Class V who are employers, employees and independent workers; Secondary Means of Livelihood of 10,000 persons of Livehhood Class V 254
5'2-A-Livelihood Class V (Production other than cultivation)Number per 10,000 persons of Livelihood Class V in each Sub-Class; Number per 10,000 self-supporting persons of Livelihood Class V who are employers, employees and independent workers (Rural Popula-tion by Natural Divisions only) 256
5'2-B-Livelihood Class V (Production other than cultivation)-Number per 10,000 persons of Livelihood Class V in each Sub-Class; Number per 10,000 selfsupporting persons of Livelihood Class V who are employers, employees and independent workers (Urban Population by Natural Divisions only) 257
5·3-Livelihood Class VI (Commerce)-Number per 10,000 persons of Livelihood Class VI in each Sub-Class; Number per 10,000 self-supporting persons of Livelihood Class VI who are employers, employees and independent workers; Secondary Means of Livelihood of 10,000 persons of Livelihood Class VI 258
5·3-A-Livelihood Class VI (Commerce)-Number per 10,000 persons of Livelihood Class VI in each Sub-Class; Number per 10,000 self-supporting persons of Livelihood Class VI who are employers, employees and independent workers (Rural PopUlation by Natural Divisions only) 260
5'3-B-Livelihood Class VI (Commerce)-Number per 10,000 persons of Livelihood Class VI in each Sub-Class; Number per 10,000 self-supporting persons of Livelihood Class VI who are employers, employees and independent workers (Urban Population by Natural Divisions only) 261
5·4-Livelihood Class VII (Transport)-Number per 10,000 persons of Livelihood Class VII in each Sub-Class; Number per 10,000 self-supporting persons of Livelihood Class VII who are employers, employees and independent workers; Secondary Means of Liveli-hood of 10,000 persons of Livelihood Class VII 262
5·4-A-Livelihood Class VII (Transport)-Number per 10,000 persons of Livelihood Class VII in each Sub-Class; Number per 10,000 self-supporting persons of Livelihood Class VII who are employers, employees and independent workers (Rural Population by Natural Djvisions only) 2a4
v

CONTENTS
5·4-B-Livelihood Class VII (Transport)-Number per 10,000 persons of Livelihood Class VII in each Sub-Class; Number per 10,000 self-supporting persons of Livelihood Class VII who are employers, employees and independent workers (Urban Population by Natural Divisions only) ....... ..
S·5-Livelihood Class VIII (Other services and miscellaneous sources)-Number per 10,000 persons of Livelihood Class VIII in each Sub-Class; Number per 10,000 self-supporting persons of Livelihood Class VIII who are employers, employees and independent workers; Secondary Means of Livelihood of 10,000 persons of Livelihood Class VIII
5·5-A-Livelihood Class VIII (Other services and miscellaneous sources)-Number per 10,000 persons of Livelihood Class VIn in each Sub-Class; Number per 10,000 self-supporting persons of Livelihood Class VIII who are employers, employees and independent workers (Rural Population by Natural Divisions only)
5·5-B-Livelihood Class VIII (Other services and miscellaneous sources)-Number per 10,000 persons of Livelihood Class VIII in each Sub-Class; Number per 10,000 selfsupporting persons of Livelihood Class VIII who are employers, employees and independent workers (Urban Population by Natural Divisions only)
5·6-Comparison of the Classification of the Population by Livelihood Classes at the 1951 and 1931 Censuses
5·7-Distribution of 10,000 self-supporting persons of ALL INDUSTRIES AND SERVICES in States, Natural Divisions and Districts (by Divisions)
5·7-A-Distribution of 10,000 self-supporting persons of ALL INDUSTRIES AND SERVICES in States and Natural Divisions by Divisions (Rural Population by NaturaJ Divisions only)
S·7-B-Distribution of 10,000 self-supporting persons of ALL INDUSTRIES AND SERVICES in States and Natural Divisions by Divisions (Urban Population by Natural Divisions only)
5·8-Distribution of 10,000 self-supporting persons in States, Natural Divisions and Districts engaged in PRIMARY INDUSTRIES NOT ELSEWHERE SPECIFIED (by Sub-Divisions)
5·8-A-Distribution of 10,000 self-supporting persons in States and Natural Divisions engaged in PRIMARY INDUSTRIES NOT ELSEWHERE SPECIFIED by SubDivisions (Rural Population by Natural Divisions only)
5·8-B-Distribution of 10,000 self-supporting persons in States and Natural Divisions engaged in PRIMARY INDUSTRIES NOT ELSEWHERE SPECIFIED by SubDivisions (Urban Population by Natural Divisions only)
5·9-Distribution of 10,000 self-supporting persons in States, Natural Divisions and Districts engaged in MINING AND QUARRYING (by Sub-Divisions) ...
PAC!;:
265
266
268
268
269
272
274
274
276
277
277
278

CONTENTS
5·9-A-Distribution of 10,000 self-supporting persons in States and Natural Divisions engaged in MINING AND QUARRYING by Sub-Divisions (Rural Population
PAGS
by Natural Divisions only) 279 5'9-B-Distribution of 10,000 self-supporting persons in States
and Natural Divisions engaged in MINING AND QUARRYING by Sub-Divisions (Urban Population by Natural Divisions only) 279
5'10-=--Distribution of 10,000 self-supporting persons in States, Natural Divisions and Districts engaged in PROCESSING AND MANUF ACTURE-FOODSTUFFS, TEXTILES, LEATHER AND PRODUCTS THEREOF (by Sub-Divisions) 280
5'10-A-Distribution of 10,000 self-supporting persons in States and Natural Divisions engaged in PROCESSING AND MANUFACTURE-FOODSTUFFS, TEXTILES, LEATHER AND PRODUCTS THEREOF by SubDivisions (Rural Population by Natural Divisions only) 281
5"10-B-Distribution of 10,000 self-supporting persons in States and Natural DivlsIOns engaged in PROCESSING AND MANUFACTURE-FOODSTUFFS, TEXTILES, LEATHER AND PRODUCTS THEREOF by Su~ Divisions (Urban Population by Natural Divisions only) 281
5'11-Distribution of 10,000 self-supporting persons in States, Natural Divisions and Districts engaged in PROCESSING AND MANUFACTURE-METALS, CHEMICALS AND PRODUCTS THEREOF (by Sub-Divisions) 282
5'11-A-Distribution of 10,000 self-supporting persons in States and Natural Divisions engaged in PROCESSING AND MANUFACTURE-METALS, CHEMICALS AND PRODUCTS THEREOF by SubDivisions (Rural Population by Natural Divisions only) ... 283
5'U-B-Distribution of 10,000 self-supporting persons in States and Natural Divisions engaged in PROCESSING AND MANUFACTURE-METALS, CHEMICALS AND PRODUCTS THEREOF by Sub-Divisions (Urban Population by Natural Divisions only) 283
5'1~-Distribution of 10,000 self-supporting persons in States, Natural Divisions and Districts engaged in PROCESSING AND MANUFACTURE-NOT ELSE-WHERE SPECIFIED (by Sub-Divisions) ... 284
5'12-A-Distribution of 10,000 self-supporting persons in States and Natural Divisions eng2ged in PROCESSING AND MANUFACTURE-NOT ELSEWHERE SPECIFIED by Sub-Divisions (Rural Population by Natural Divisions only) 286
5'12-B-Distribution of 10,000 self-supporting persons In States and Natural Division~ engaged in PROCESSING AND MANUFACTURE-NOT ELSEWHERE SPECIFIED by Sub-Divisions (Urban Population by Natural Divisions only) .. , 286

vHi CONTENTS
50 13-Distribution of 10,000 self-supporting persons in States, Natural Divisions and Districts engaged in CON-
PAGI
STRUCTION AND UTILITIES (by Sub-Divisions) 00. 288 !j'13-A-Distribution of . 10,000 self-supporting persons in
States and Natural Divisions engaged in CONSTRUCTION AND UTILITIES by Sub-Divisions (Rural Population by Natural Divisions only) _ '" 290
Sol3-B-Distribution of 10,000 self-supporting persons in States and Natural Divisions engaged in CONSTRUCTION AND UTILITIES by Sub-Divisions (Urban Population by Natural Divisions only) 290
50 14--Distribution of 10,000 self-supporting persons in States, -Natural Divisions and Districts engaged in COMMERCE (by Sub-Divisions) 292
5'l4-A-Distributic:m of 10,000 self-supporting persons in States and Natural Divisions engaged in COMMERCE by Sub-Divisions (Rural Population by Natural Divi-sions only) 294
5'14-B-Distribution of 10,000 self-supporting persons in States and Natural Divisions engaged in COMMERCE by Sub-Divisions (Urban Popula-tion by Natural Divisions only) 294
5ol5-Distribution of 10,000 self-supporting persons in States, Natural Divisions and Districts engaged in TRANSPORT, STORAGE AND COMMUNICATIONS (by Sub-Divisions) 296
!)o15-A-Distribution of 10,000 self-supporting persons in States and Natural Divisions engaged in TRANSPORT, STORAGE AND COMMUNICATIONS by Sub-Divisions (Rural Population by Natural Divisions only) 298
5'15-B-Distribution of 10,000 self-supporting persons in States and Natural Divisions engaged in TRANSPORT, STORAGE AND COMMUNICATIONS by Sub-Divisions (Urban Population by Natural Divisions only) 298
5 0 16-Distribution of 10,000 self-supporting persons in States, Natural Divisions and Districts engaged in HEALTH, EDOCATION AND PUBLIC ADMINISTRATION (by Sub-Divisions) 300
5·16-A-Distribution of 10,000 self-supporting persons in States and Natural Divisions engaged in HEALTH, EDUCATION AND PUBLIC ADMINISTRATION by Sub-Divisions (Rural Population by Natural Divi-sions only) 302
5'16-B-Distribution of 10,000 self-supporting persons in States and Natural Divisions engaged in HEALTH, EDUCATION AND PUBLIC ADMINISTRATION by Sub-Divisions (Urban Population by Natural Divisions only) 302
50 17-Distribution of 10,000 self-supporting persons in States, Natural Divisions and Districts engaged in SERVICES NOT ELSEWHERE SPECIFIED (by Sub-Divisions) 304

SERIES 6
SERIES 7
CONTENTS
5'l7-A-Distribution of 10,000 self-supporting persons in States and Natural Divisions engaged in SERVICES NOT ELSEWHERE SPECIFIED by Sub-Divisions
PAGE
(Rural Population by Natural Divisions only) 306 S'17-B-Distribution of 10,000 self-supporting persons in
States and Natural Divisions engaged in SERVICES NOT ELSEWHERE SPECIFIED by Sub-Divisions (Urban Population by Natu~al Divisions only) 306
G'1-Persons per 1,000 houses and houses per 100 squares miles and comparison with past censuses "\ . . 308
fj'2-Number of households per 1,000 houses and distribution by size of 1,000 Sample Households of Rural and Urban Population 310
c'3-Family Composition of 1,000 Households of the General Population 314
6'4-Females per 1,000 males (General, Rural and Urban Population~ ; and comparison with previous censuses .,. 315
6'5-Females per 1,000 males in Agricultural Classes and Sub-Classes 316
f)'€-Females per 1,000 males in Non-Agricultural Classes and Sub-Classes 318
6'7-Marital Status of 1,000 of each sex of General Population and comparison with previous c:ensuses 320
6'S-Age distribution of 1,000 married persons of each sex (and comparison with 1941 census) 322
B·g-Infants per 10,000 persons 323 6'lO-Young Children (aged 1-4) per 10,000 persons ,324 6'11-Boys and Girls (aged 5-14) per 10,000 persons 325 f>'l2-Young Men and Women (aged 15-34) per 10,000 persons :i~6
6·13-Middle Aged Persons (aged 35-54) per 10,000 persons ... 327 6'14--Elderly Persons (aged 55 and over) per 10,000 persons 328
7·1-Progress of Literacy 7·2-Literacy Standard of Livelihood Classes 7·3-Educational Services and Research
329
331 333
MAPS
Map showing District and Taluka boundaries Map showing Density of Population
Frontispiece facing page 5
A (Bk) H 91-c
ix


++++++++++++++++++++++++++++++++++++++++++++++++++++++++++++++++++++++
INTRODUCTION ++++++++++++++++++++++++++++++++++++++++++++++++++++++++++++++++++++++
A census has been held in India every ten years since 1872. The method of taking a census has in essence remained the same. The basic unit is the "block", the area in charge of one enumerator. The block generally consisted of a village or part of a village. The enumerator went to every house in his block, and obtained the answers to the census questions. A separate slip was filled up in 1951 for every individual. From the enumerator's block a chain of command stretched through a series of circles and charges to the Collector of the district.
This time the census enumeration was spread over three weeks, from 9th February 1951 to 28th February 1951. A formula was devised to prevent double enumeration. If a person was, or was expected to be, at his normal residence at any time during the 20 days' enumeration pm'lod he was enumerated there. Otherwise he was enumerated where found. Houseless persons were enumerated on the night of 28th February to 1st March. In 1941, by contrast, the enumeration was spread over three days. In 1931 and previously the census was a one-night census.
An innovation at the 1951 census was the preparation of National Registers of Citizens for every village and town, simultaneously with the enumeration. The Registers contained the replies to the more important census questions, arranged by households, in respect of every person enumerated. These Registers were used after the census to extract information on a 4 per cent sample basis about the size and composition of family households. In conjunction with a system of maintained housenumbers the Registers are intended to form a framework for other sampling enquiries in future.
A (Bk) H 91-1
The provisional population figures for Bombay, Saurashtra and Kutch were published in the Bombay newspapers on 21st March 1951. The enumerators totalled the figures for their blocks, circle supervisors for their circles, and so on up the chain of command. The published provisional population figure of the three States was 40,647,368. The final figure arrived at after sorting and compilation in the Tabulation Offices was 40,661,115, a difference of only 0·034 per cent.
The Indian Census figures represent, according to Professor Kingsley Davis,! "the most fruitful source of information about the country," which, he added, has more complete economic and social statistics than most countries in Asia. In 1941, unfortunately, the tabulation undertaken after the census was of a severely restricted nature so that the 1951 census figures represent the most complete collection of census data since 1931, as well as being the first census of independent India.
At past censuses much emphasis was placed on the tabulation of caste and community data. In 1951 the basis of classification was economic and not social. Population figures were extracted in 1951 according to the following eight Livelihood Classes :-
Agricultural Classes Class I-Cultivators of land wholly or
mainly owned; and their dependants.
Class II-Cultivators of land wholly or mainly unowned; and their
. dependants. Class III-Cultivating labourers; and their
dependants.
1 "The Population of India and Pakistan" by Kingsley Davis, page 5.

2 INTRODUCTION
Class IV-Non-cultivating 'owners of land; agricultural rent receivers; and their dependants.
Non-Agricultural Classes
Persons (including dependants) who derive their principal means of livelihood from :-
Class V-Production other than cultivation. Class VI-Commerce. Class VII -Transport. Class VIII-Other services and miscellaneous
sources. Dependants, whether earning or non-earning,
were classified according to the principal means of livelihood of the persons on whom they were dependent.
The Census Report for Bombay, Saurashtra and Kutch consists of three volumes-two volumes of Tables and this volume which contains the Report and Subsidiary Tables.
The Registrar General, India, laid down the chapter headings and section headings for the first six chapters of this Report, and the form of all the main tables and Subsidiary
Tables. Chapters VII-XI have been added with his permission to this Report, to make the census picture as complete as possiblE.
It was originally intended that there should be no Report Volume in 1951, but merely a short synoptic essay to accompany the tables. It was assumed that the users of t:he tables would require little or no commentary to edify or guide them, that the figures, in short, would speak for themselves. To maintain comparability with previous census practice, however, this original intention was modified and the Report Volume has been retained.
The facts of population growth, and the related socio-economic data, are of vital importance to the educated public as well as to professional economists and statisticians. It is the purpose of this volume to bri.ng out some of' the more important aspects of the census data.
The statements made and conclusions drawn in this Report are wholly the responsibility of the author alone in his personal capacity and do not necessarily represent the views of Government.

CHAPTER I
+++++++++++++++++++++++++++++++++++++++++++++++++++++++++++++~+++++++~+
GENERAL POPULATION +++++++++++++++++++++~+++++++++++++++++++++++++++++++++++++++++++++++++
SECTION 1
PRELIMINARY REMARKS
"I do not believe one word of what is said about the increase of the population," commented William Cobbett on the results of an early 19th century British census, wben the era of rapid population expansion had begun. .. All observation and reason is against the fact." There must have been some similar sceptics when the results of the 1951 census of Bombay State were published, because the population showed an increase of 23·2 per cent . duri~g the decade 1941-51, the highest increase ever recorded.
The area dealt with in this report may be described a1l Western India, consisting of the three States of Bombay, Saurashtra and Kutch. In the pa~t there was <> a census report for Bombay Presidency, including Sind, and the Indian states comprised in the various political agencies in the area. Baroda, the largest state in Western India, used to conduct its own census, and a separate report volume for Baroda State was published.
Extensive territorial changes took place after 19~7. Between 8th March 1948 and 1st May 1949, the boundaries of the old province of Bombay were enlarged by the merger of 176 of the former Indian states, of which Baroda was the last to merge. Minor adjustments of territory, aimed at the elimination of enclaves, took place on 26th January 1950, when the n~w Constitution came into effect. Areas haVIng a 1941 population of 8~,618 were added to Bombay State from Rajasthan, Saurashtra and Hyderabad, and areas having a 1941 population of 90,563 were transferred from Bombay State to Rajasthan, Saurashtra and Hyderabad. A change in terminology was also effected, and the province of Bombay became the State of Bombay.
A (Bk) H 91-1a
The State of Saurashtra was formed when the 202 Indian States in the Kathiawar peninsula shed their separate identities early in 1948 and covenanted into a new union of states, called Saurashtra. The administration of the former Indian state of Kutch was taken over by the Government of India in June, 1948, and this border area is now a separate State within the Indian Union. .
The 1951 area and population figures of the three States and the increase in population during the past decade have been shown in the table below;-
Area in 1951 Decennial Stat •• square miles. increase
Persons. M.I ••. Females. 1941-51.
Bomb&y 111,43-4 35,956,150 18,614,862 17,341 ,2M 23'2%
~ura,htra 21,451 4,137,359 2,094,442 2,042,917 16'2%
Kutch 16,724· 567,606 272,977 294,629 11'8%
• The land area is approximately 8,514 equare miles; the: Rann area 8,210 ,~u.r. mil.,.
Among the states of the Indian Union, 1;3ombay was the fifth largestl in area, and the fourth~ most populous. In area Madhya Pradesh was the largest State in India. In terms of population Uttar Pradesh, Madras and Bihar eclipsed Bombay. However none of the Part A States~ recorded such a heavy increase in population as Bombay during the past decade.
1 Madhya Pradesh had 130,272; Rajasthan 130,207; Madras 127,790; and Uttru: Pradesh 113,409 square miles.
!! Next to Uttar Pradesh (63,215,742), Madras (57,016,002) and Bihar (40,225,947).
S So called because of the Schedule in the Constitution in which it is found. The former provinces of India are all Part A States. Saurashtra is a Part B State and Kutch a Part C State. The distinction lies in the constitutional arrangements made for the governance of each State.

4 GENERAL POPULATION
SECTION 2
GENERAL DISTRmUTION AND DENSITY
It has been the practice in the case of large states like Bombay to examine the census data with reference to what are called "natural divisions." Political boundaries were largely the result of historical ci~cumstances, and within the states so constituted different regions exhibited varied characteristics in regard to soil and rainfall conditions as well as other features. Districts with roughly similar characteristics were therefore grouped together into what were called .. natural divisions" in the provincial census reports in the past.
For purposes of reporting at the 1951 census the Registrar General, India, devised a three number code to represent every "Natural division." The first number of the code defined the region (of which there were five); the second defined the sub-region in that region (of which there were fifteen) ; and the third number defined the natural division within the sub-region (of which there were fifty-two). There were seven natural divisions in the area under report, bearing the following code numbers :-Natural Regions, Sub-Regions and Divisions
3. Peninsular Hills and Plateau Region-3·4 North Deccan Sub-Region-
3·43 Bombay Deccan Northern Division.
3·5 South Deccan Sub-Region-3·52 Bombay Deccan Southern
Division. 4. Western Ghats and Coastal Region-
4·1 Gujarat-Kathiawar Sub-Region-4·11 Bombay Guiarat Division. 4 ·12 Saurashtra Division. 4 ·13 Kutch Division.
4·2 Malabar-Konkan Sub-Region-4·21 Greater Bombay Division. 4·22 Bombay Konkan Division.
The natural divisions have always varied considerably in h9mogeneity. Within Guiarat, for instance, there exists considerable variability. However, if Guiarat were not to be one division it would have to be many. Even within the area of :il single district different soil and ~limatic conditions might exist. Kanara district has been placed in the natural division of the Konkan, although the eastern talukas are more akin in climatic and other features to those of the adjacent district of Dharwar in the Deccan Southern Division. The census natural divisions do not coincide exactly with linguistic areas. Language has been only one of the considerations taken into account in defining the boundaries of natural divisions.
In the past Bombay City used to be placed in the Konkan, and climate and geography and the immigration trends would all justify the choice. In practice, however, this led to a distortion of the Konkan figures because the city's economic and social profile was materially different from that of the Konkan or any other area of the State. In this report, therefore, Greater Bombay has been treated as a separate natural division.
The seven natural divisions in Bombay, Saurashtra and Kutch with their areas, population, and component districts are sho'Yll below:-
Area in Natural Division. square
miles.
Component districts and their 1951 populations.
3'43 Bombay Deccan 45,155 Northern Division.
5,391 West Khllndesh 4,535 East Khandesh
658 Dang! 6,035 Nasik 6,602 Ahmednagar 6,028 Poona 4,034 Salara North 3,434 Satara South 2,756 Kolhapur 5,682 Sholapur
3'52 Bombay Deccan 17,430 Southern Division.
12,364,735
1,146,024 1,471,351
47,282 1,429,916 1,410,873 1,950,976 1,175,309 1,000,141 1,227,547 1,505,316
4,698,479
5,524 Belgaum 6,601 Bijapur 5,305 Dharwar
T 1,726,908 1,396,185 1,575,386
4'11 Bombay Gujarat 33,136 Division.
4,11)5 Banaskantha 2,845 Sabarkantha 4,312 Mehsana 3,529 Ahme.dabad 2,542 Kairll 3,500 Panch Mahals 2,969 Baroda 2,911 Broach 4,499 Surat 1,634 Amreli
.. ~
4 '12 Saurashtra Division. 21,451
4 '13 Kutch Division.
4'21 Greater Bombay Divi!ion.
4'22 Bombay Konkali Division.
3,890 Halar 4,660 Madhya Saurashtra 4,425 Zalawad 4,675 Gohilwad 3,801 Sorath
16,724 Kutch
\ 11 Greater Eombay
15,602
3,895 Thana 2,715 Kolaba 5,021 Ratnagiri 3,971 Kanara
11,396,789
748,796 684,017
1,471,662 1,685,630 1,612,426 1,148,432 1.194,746
706,035 1,827,842
317.203
4,137,359
574,472 1,045,675
495,928 1,020,130 1,001.15-4
567,606
2,839,270
4,656,8n
1,518,050 909,083
1,711,964 517.780


o 20 40 80 80
HILES
<.50
!l0 -100
100-200
200-300
30(J-.4.50
450-[;50
>G50
PERSONS PEll sq. /'fILE
BOMBAY, SAURASHTRA AND KUTCH STATES
f1~f Showillj IJen5i~ tf popul.rlion
5.P~.P. POONA ,S3.

GENERAL POPULATION 5
Density
There are in the world three major areas where the' density of population is very high. One of them is in Europe, in a triangle demarcated by England, Italy and European Russia; another is in Eastern Asia in an area embraced by China, Korea and Japan, arid the third occurs in the Indian sub-continent India had in 1951 a population of 356,829,485, in an area of 1,269,640 square miles, an average density of 281 per square mile. No other political entity of equal or greater size in the world had .a higher density. The average density per square mile in Bombay State in 1951 was 523, a figure which was exceeded by the States of Delhi (3,017), TravancoreCochin ( 1,015), West Bengal ( 806), Bihar (572), Uttar Pradesh (557), Madras (446), PEPSU (347) and Punjab (338). The distribution and density of population in India follows a fairly well-defined pattern. The Ganges Plain, the east coast, the southern tip of India, and the west coast up to the Gulf of Cambay have always shown the highest concentrations of population.
In the area that now forms Bombay State there were 201 persons per square mile in 1921, 227 in 1931, 262 in 1941 and 323 in 1951. The density has thus increased sharply during the past thirty years. The Indian states merged with Bombay province after 1947 were slightly less densely populated than was the province. The density of Saurashtra was 119 in 1921 and 193 in 1951. Kutch, on the
other hand, recorded a more modest rise from 29 in 1921 to 34 in 1951. Half the area of Kutch consists of the uninhabitable Rann.
Within the State of Bombay in 1951 the density of Gujarat was 344, of the Konkan 298, of the Deccan Northern Division 274, and of the Deccan Southern Division 270. Greater Bombay, with 25,579 persons to the square mile, was an exclusively urban area and hence not representative. The boundaries of the old city were extended during the decade and that served to· reduce the density. In the 25·24 square miles that used to be Bombay City there were 92,275 persons to the square mile in 1951, a staggeringly high figure, as compared with the already very high figure of 59,029 in 1941.
Ahmedabad district had a density of 478, and Poona of 324. Both districts contained large cities. Forest areas in Dangs and Kanara reduced the densities of these districts to 72 and 130. Kaira district recorded the very high density of 634, and Kolhapur of 445. The number of persons dependent on agriculture per square mile of cultivated land constitutes a better measure of density than ·the average density figures. The quality of the agricultural land is also an important factor. The rich soil of the Ganges basin accounts for the spectacular density figures of those areas. The soil of Kaira district is exceptionally fertile, while in Kolhapur good soil and a fairly assured rainfall account for the high density of the district.
SECTION 3
GROWTH
Increase in population is determined only by ~ree fattors-births, deaths and migration. .[n thIS, and the three sections which follow the pattern of growth of the ~eneral popul~tion has been analysed, and an attempt made to assess the influence on the growth rate of these three factors.
There is a popular misconception that India's population growth has been faster than in most modern countries. During the past three centuries the population of the whole world has been growing at a rate faster than ever experienced before. The expansion of industry and commerce, stimulated by the industrial revolution, started a world growth of population, and I~dia's increase was part of this world· movement.
India's modem population growth has not been exceptional either way but close to average. .. From 1871 to 1941 the average rate of increase of India's population was approximately 0·60 per cent per year. This was slightly less than the estimated rate for the whole world (0·69) from 1850 to 1940."4.
4. " The Population . of India and Pakistan" by Kingsley Davis, pages 26-27.
The population of Bombay State increased by 55 per cent between 1872 and 1941. lapan, during the 70 years from 1870 to 1940, experienced a growth of approximately 120 per cent, and the United States a growth of 230 per cent.
The growth of population in India since 1870 has not been a smooth continuing process but, until 1921, exhibited marked fluctuations from decade to decade. In the table below the population of Bombay State recorded at successive censuses has been shown;-
BOMBAY STATE
Percentage increase Year. Recorded population. or decrease dur-
ing decade. 1872 19,820,480 1881 20,181,709 + 1·82 1891 23,017,208 +14·05 1901 21,217,221 - 7·82 1911 22,326,799 + 5·23 1921 22,353,209 + 0·12 1931 25,242,675 +12·93 1941 29,181,146 +15·60 1951 35,956,150 +23·22

6 GENERAL POBULATION
The pattern outlined by these figures is roughly a reflection of the figures for India as a whole. There was a famine in 1877, hence the population did not increase as fast during the decade 1872-81 as it otherwise would have. Recovery from famine was reflected in the population increase in 1891. In 1899 a famine of great severity occurred, and in 1901 Bombay State suffered its only decennial decrease since the censuses began. The decrease in 1901 was sharper in Bombay than in India as a whole. In 1911 there was recovery from the famine. In 1918-19 the deadly influenza epidemic wrought great havoc and had the most serious effect on population since the famine of 1899. The effect of these famines and the influenza epidemic on the age structure has been traced in chapter VI of this report.
India's population history since 1921, however, has been one of accelerating growth. The alternating process of growth ~nd retardation ceased after the influenza epidemic, and during the past three decades a rapid growth of population has been recorded at successive censuses. Even though the rate of growth has not been exceptional for modern times, the increases have been large in absolute numbers. Bombay not only shared the increases in India since 1921, but experienced recorded increases above the average for the country as a whole. The increase in population in Bombay State was only 18 per cent during the half century from 1872 to 1921. It was 61 per cent during the thirty years from 1921 to 1951.
1901-1951 In the tables the population of every district
since 1901 has been shown. The population of the area of Bombay, Saurashtra and Kutch increased by 70 per cent between 1901 and 1951. Greater Bombay increased by 235 per cent, Gujarat and Saurashtra by 82 per - cent, the Deccan Northern Division by 67 per cent, the Deccan Southern Division by 41 per cent, the Konkan by 39 per cent, and Kutch by only 16 per cent.
1921-1951 During the thirty years from 1921 to 1951
the increase in population was almost as heavy as between 1901 and 1951, because the influenza epidemic wiped out the recovery made by 1911 from the famine of 1899. The increase was 60 per cent in the case of Bombay, Saurashtra and Kutch. Greater_ Bombay increased by 119 per cent, the Deccan Northern Division by 66 per cent, Gujarat and Saurashtra by 62 per cent, the Deccan Southern Division by 44 per cent, the Konkan by 42 per cent, and Kutch by 17 per cent.
The experience of districts varied. At one extreme Greater Bombay increased by 119 per
cent, Ahmedabad by 98 per cent, Ahmednagar and Dangs by 96 per cent, Thana by 80 per cent and Poona by 77 pere cent. At the other extreme Kutch increased by only 17 per cent, Ratnagiri by 26 per cent, Kanara by 29 per cent and Kolaba by 34 per cent.
Greater Bombay, Ahmedabad, Thana and Poona districts attracted migrants. Kutch, Ratnagiri, Itanara, and Kolaba districts on the other hand are districts from which considerable emigration takes place. The inclusion of Ahmednagar among districts showing a high growth rate since 1921 is fortuitious. At the time of the 1921 census there had been an exodus. of population from Ahmednagar district due to famine conditions. Between 1921 and 1931 the population of Ahmednagar district increased by 35 per cent because the famine migrants had returned to their homes. Dangs district is a tiny area and the earlier censuses there may not have been accurate.
The percentage increase in the popUlation of the districts at every census from 1921 has been shown in Subsidiary Table 1· 2. The principal features of population growth during these three decades are analysed briefly below:-
The decade 1921-1931 During the decade 1921-31 the population
of Bombay State increased by 12·9 per cent, Saurashtra by 15·5 per cent, and Kutch by 7· 4 per cent. Greater Bombay increased by only 0'6 per cent. In part this was due to the slump in trade which caused workers to return to their homes, but disturbed political conditions also led to some under-enumeration. Ahmedabad and Surat districts in particular were under-enumerated in 1931 due to the disturbed political situation. nese two districts recorded population increases of only 11 and 9·5 per cent during the decade 1921-31, while at the next census they recorded increases of 38·7 and 21· 1 per cent. The under-enumeration occurred mainly in the urban areas of these districts.
The Deccan Northern Division increased by 18 per cent during 1921-31, a higher increase than was recorded by any other natural division. At the time of the 1921 census Ahmednagar district was suffering from famine, and emigration had occurred. The Deccan Northern Division was badly hit by the influenza epidemic, and its population decreased by 4·9 per cent between 1911 and 1921. The recovery in 1931 was proportionately greater than elsewhere.
The decade 1931 .. 1941 During 1931-41 the population of Bombay
State increased by 15· 6 per cent. This was a higher increase than had been recorded at any previous census. Greater Bombay

GENERAL POPULATION
increased by 30·1 per cent, and Gujarat by 20·2 per cent. Saurashtra increased by 20·5 per cent. The.Deccan Northern Division and the Deccan Southern Division recorded more moderate increases ,of 14·2 and 11·8 per cent. The Konkan, an emigrant area, recorded an increase of only 7·6 per cent, while Kutch actually suffered a decrease of 2·4 per cent due, probably, to emigration.
Conditions during the decade had been relatively prosperous, with no severe famines or epidemics. Competition to inflate the communal returns at the census did not occur in Western India, though it did in the Punjab and Bengal.
The decade 1941-1951 During the past decade Bombay State's
population increased by 23·2 per cent, the highest increase ever recorded. Saurashtra increased by 16·2 per cent, and Kutch by 11 . 8 per cent.
Substantial increases in population were the rule. Eight districts recorded increases of over 25 per cent. Greater Bombay incr~ased by 67·5 per cent, Thana by 45·4 per cent, Poona by 32·5 per cent, Ahmedabad by 28·7 per cent, Banaskantha by 28·4 per cent, Nasik by 26·8 per cent, Ahmednagar by 25·6 per cent, and West Khandesh by 25·4 per cent. Only five districts in Bombay State recorded increases of less than 15 per cent. Ratnagiri increased by only 5·2 per cent, Broach by 10· 2 per cent, East Khandesh by 11·-5 per cent, Kolaba by 12·9 per cent and Amreli by 13·1 per cent.
Greater Bombay recorded a spectacular increase in populati.on. The population 1'ose from 1,695,168 in 1941 to 2,839,270 in 1951. Most of the increase was due to immigration from outside.
The most unusual increase recorded by any Gujarat district was that of Banaskantha, which increased by 28·4 per cent during 1941-51. Migration took place to Sind in 1940 because of famine. These migrants returned to their home district after partition, and were enumerated there at the 1951 census.
Poona district recorded an increase of 32·5 per cent during 1941-51, the highest increase recorded by any Deccan Northern Division district. It was principally due to the growth of Poona City.
The districts of the Deccan Southern Division have always recorded a more moderate rate of increase than other natural divisions. The increases since 1921, however, have been steady in character and increasing with every decade. The increase of 17·4 per cent in 1941-51 was the highest ever recorded.
The Konkan district of Ratnagiri increased by only 5·2 per cent during 1941-51. A considerable amount of emigration takes place from Ratnagiri to Greater Bombay, and this seems principally responsible for the low growth rate. Between 1921 and 1931 by contrast, the population of this district rose by 12·7 per cent. Because of the slump workers went back from Bombay City to their homes in the district.
Thana district increased by 45·4 per cent during the decade 1941-51. The areas adjoining Greater Bombay developed considerably. The urban population of the district rose from 120,452 in 1941 to 524,834 in 1951, a part being' due to the immigration of displaced persons from Pakistan to the new township of Ulhasnagar near Kalyan.
Kanara district entered on a period of decline from 1901 when the population was 454,490. The lowest point was reached in 1921. Even in 1941 the population was less than in 1901. The decline was principally due to malaria. DDT spraying during the past decade revived the area, improved the birth rate, cut down the death rate, and stimulated immigration. Between 1941 and 1951 the population increased by 17·4 per cent.
What caused the heavy population increase during the decade? In addition to such negative factors as the absence of severe famines or epidemics the prosperity of the war years stimulated immigration from other parts of India. A type of immigration peculiar to the decade was the immigration of displaced persons from Pakistan after partition. 409,882 displaced persons from Pakistan were found in Bombay, Saurashtra and Kutch at the census. Relatively to the total population enumerated, however, their numbers were small, and it is, clear that they were not the major factor responsible for the increase during the decade.
The spreading of the enumeration over as long a period as three weeks probably reduced the under-enumeration error. A fairly large proportion of the population lived in urban areas, and these can be censused more completely when the enumeration is not a rushed process. Despite the longer enumeration period there is no evidence that people got counted in two places. A sample verification carried out by magistrates shortly after the census, and an independent verification conducted by the Bureau of Economics and Statistics of the Government of Bombay suggested that double-enumeration was not an error that vitiated the census figures, and that the enumeration was accurate within 1 per cent.
Some part of the increase may have been due to a reduction in the enumeration error by comparison with previous censuses. The

GENERAL POPULATION
public respon~e to the census of 1951, was exceptionally favourable. A part, particularly in those areas like Greater Bombay, Thana, Poona and Ahmedabad, which recorded the greatest increases, was undoubtedly due to increased immigration from outside. But the
balance seems t~ represent a growth of population due to a more favourable survival rate than was ever experienced before. Fairly heavy increases in population were recorded by almost all districts, even in those districts which do not attract migrants.
SECTION 4
MOVEMENT
Immigration from abroad has nev.er been an important feature in India. In 1931 there were 130,546 persons living in India who were born outside. They constituted only 0· 2 per cent of the total population. In 1951 only O· 12 per cent of the population of Bombay, Saurashtra and Kutch was born outside India.5
Only internal migration within India is important; the external migration is small. For migrants outside India there are no figures.
Information about migration is derived mainly from the birthplace question in the census. Though the place-of-birth returns are fairly reliable6 they are not an entirely accurate measure of the extent of migration. A person's place of birth may be unrelated to normal residence. A wife, for instance, usually returns to her parents' house for her first or subsequent confinement. If the house happens to be in an adjacent district or across a state boundary the child becomes an immigrant at the next census.
Analysis of birthplace can never give a complete picture of the movements of population. Place-of-birth data can give no indication of the number of moves an individual may make in his lifetime. The Collector of Banaskantha explained the unusually high decennial increase in the population of his district in 1951 in terms of a large-scale migration to Sind in 1940 following famine. These persons were not enumerated in Banaskantha at the 1941 census but returned after the partition of India and were enumerated in the district of their birth in 1951. In consequence there was a steep rise in the population of the district in 1951, but ~here is nothing in the figures to indicate what took place as there was no complete tabulation after the 1941
• Treating Pakistan, Portuguese and French territories for the purpose as inside India, but Nepal as outside.
o There is a tendency to return the name of the village or town rather than the district of birth. This entails extra work in the Tabulation Office, and sometimes inaccuracy.
census. So far as the figures go these persons might never have moved. Again, 2,274 displaced persons from Pakistan were enumerated in Ratnagiri district in 1951, yet only
- 1,558 persons in the district were born in Pakistan. The slips of displaced persons were sorted separately, and the mother tongue data provided the solution. 2,251 displaced persons returned Marathi as their mother tongue. They were Maharashtrians who had migrated to Sind, and been displaced as a result of partition.
Types of migration
It has been customary in previous census reports" to distinguish various types of migration. Casual migration, involving minor movements between neighbouring villages, largely by way of marriage only affects the figures when the boundaries crossed happen to be those of districts or states. Temporary migration is mainly due to the movement in the demand for labour on public works. Periodic migration is that caused by recurring seasonal demands, as for harvesters. Semi-permanent migration is that of perso~s who maintain their connection with their pre-migraHon homes, earning their living elsewhere but ultimately· returning and often leaving their wives and families at home during the period of migration. Permanent migration is that in which the migrant leaves one place to settle in another for good. Also, in the pre-1941 census, there was an additional form of migration that might be described as daily.
Women migrate for marriage and men for jobs. Hence in migration between adjacent districts females predominated. 11,626 males and 22,484 females born in Kolhapur district were enumerated in Belgaum, and 14,093 males and 27,329 females born in Belgaum district were enumerated in Kolhapur. Out of 133,036 persons, enumerated in the districts of Saurashtra who were born in other districts
1 Census of India, 1931, India Report, page 62.

GENERAL POPULATION
of the state, 89,825 were females and only 43,211 were males. Where females predominate in a migration stream' it is evidence, amounting to certainty, that the migration is marriage migration.
In the migration stream as a whole males predominate. The proportion of females to males tends to fall progressively the greater the distance travelled, because most male migrants from long distances leave their wives and families behind. The following table illustrates the predominance of females among short distance migrants because of marriage, and of males in long distance migration :-
Females per 1,000 males among persons enumerated in districts of Bombay
State but born in :
1. Other districts of the same 1,395 natural division
2. Other parts of the state 758 3. Adjacent states 820 4. Other parts of India 244
There were only two exceptions to the rule that the greater the distance travelled the higher the proportion of males among the migrants. The migration of displaced persons from Pakistan was a movement of whole families. Thus among persons born beyond India-and displaced persons from Pakistan constituted the majority of this' category-there were as many as 734 females per 1,000 males in Bombay State in 1951. Most of the migration from Goa to Bombay was als.o family migration, and there were 750 females per 1,000 males among' migrants from .. Other territories," principally Goa.
Large proportion born within district of enumeration
Western India is an area which attracts migrants yet, in relation to the total population, the movement of people was small. The following table shows the percentage of the population of Bombay, Saurashtra and Kutch returned as born in the district of enumeration at successive censuses:-
Bombay, Saurashtra and Kutch
Census of
1901 1911 1921 1931 1941 1951
..
A. (Bk) H 91-2
Percentage of enumerated population born in districts
of enumeration. 90·0 88·1 87·2 86·1 not available 86·2
These figures do not suggest any great quickening of the tempo of migration since 1921. In 1951, however, two special factors operated. Firstly, the Qoundary changes after 1948 were very sweeping in character, and the merger of the former Indian states made most districts bigger. It is impossible to say to what extent this factor served to increase the percentage of the population returned as born within the district of enum~ration, but the probability is that had there been no boundary changes the percentage of the population returned as born within the district of enumeration in 1951 would have been lower than it was. The second factor that operated was the spreading of the enumeration over 20 days, and the enumeration of persons at their normal place of residence, provided they were there at any time during this period. Up to 1931 the census was a .. one-night" census and persons were enumerated wherever they were found on the census night. The change from a strictly" de facto" count to something approaching a .. de jure" reckoning must have minimised the amount of recorded movement of a short term character.
Reasons jor relative immobility In general the migration figures indicate
a comparatively high degree of immobility. The population is immobile -because' --it is peasant, and attachment to the ancestral soil is a feature of peasant societies everywhere. The immigration of Gujars to West Khandesh funushes an instance of permanent immigration to rural areas in the past, but now that the coun,tryside I has filled up the main stream of migration has turned to the cities and
,_towns. Early marriage 'and assumption of adult
responsibility in the village community have also tended to act as discouragements to migration. The caste system and the joint family are generally considered to have operated in a similar direction. In many cases however they cushioned the risks of migration. Once the early migrants had prospected the areas, new migrants could settle down among those with similar traditions and habits. Large numbers of policemen in Greater Bombay come from Ratnagiri. Bhayyas from Uttar Pradesh concentrate in the suburbs and monopolise the dairy trade. Matunga is a centre of Madrasis. The composition of family households in Greater Bombay suggested that new arrivals tend to stay with male relatives. For the enterprising migrant, the

10 GENERAL POPULATION
caste system and the joint family system probably tended to ll;lake things easier; while the unenterprising were cushio~ed at home.
Paths of migration
Migration tends' to follow well defined paths. Ratnagiri, Sata:m North and Kolaba are emigrant districts. The number of persons enumerated at the census in Ratnagiri was 1,711,964, but 410,999 persons born in Ratnagiri district were enumerated in Greater Bomhay. They constituted 14·5 per cent of the city's population. The Konkan is a poor tract and the surplus population of Ratnagiri has always sought employment for its brawn a:nd brains outside the confines of its home district. In addition to Ratnagiri, the districts of Kolaba, Surat a:nd Satara North also contributed considerably to Greater Bombay's population. In the table below the percentage of the 1951 population of every district who were enumerated at the census outside the district of their birth but in other districts of the state has been shown. (In the case of persons enumerated outside their home states, the district of birth was not tabulat\d; hence we cannot say what were the districts of birth of those migrants enumerated outside the state of enumeration).
State and District.
BOMBAY STATE Greater Bombay ... Banaskantha Sabarkantha Mehsana Ahmedabad Kaira Panch Mahals Baroda Broach Surat Amreli* West Khandesh East Khandesh Dangs Nasik Ahmednagar Poena
, Satan North Satara South
195'population;
2
2,839,270 748,796 684,017
1,471,662 1,685,630 1,612,426 1,148,432 1,194,746
706,035 1,827,842
317,203 1,1'46,024 1,471,351
47,282 1,429,916 1,410,873 1,950,976 1,175,309 1,000,141
No, of personl bominthe district but enumerated
in other districl1
oftheState atthe census.
3
82,103 44,673 37,583
145,119 103,808 114,300 50,599 85,293 69,221
125,028 5,333
70,752 124,417
185 107,058 117,259 188,138 180,786 94,942
Percentage of col. 3 to col. 2.
. 4
2'89 5'97 5'49 9'86 6'16 7'09 4'41 7'14 9'80 6'84 1'68 6'17 8'46 0'39 7'49 8'31 9'64
15'38 9'49
*Amreli district, though a part of Bombay State, is situated within the peninsula of Saurashtra. Most of the migration from Amrel i Roes, in conlequenCe, to Saurashtra and not to districts in Bomba y State.
2 3 4
Kolhapur 1,227,547 ' 100,589 8'19 Sholapur 1,505,316 98,108 6'52 Belgaum 1,726,908 134,695 7'SO Bijapur 1,396,185 92,945 6'66 Dharwar 1,575,386 55,650 3'53 Thana 1,518,050 52,979 3'49
, Kolaba 909,083 130,110 14'31 Ratnagiri 1,711,964 ~88,205 28'52 Kanara 517.780 33,483 6'47
SAURASHTRA STATE Halar 574,472 27,311 4'75 Madhya Saurashtr~' 1,045,675 42,936 4'11 Zalawad 495.928 14,328 2'S9 Gohilwad 1,020,130 20,111 1'97 Sorath 1,001,154 28,350 2'83
KUTCH STATE 567,606
Increase in migration from outside the area
The extensive redistribution of boundaries since 1931 made collation of previons figures of migrants a matter of extreme difficulty. Since 1931" powever, the tempo of immigration from outside the area has undoubtedly been speeded up, There is hardly any objective data for allocating between the two decades the increase or decrease in the migrant population of a state during 1931-50. It has been estimated that 40 per cent of the immigration to Bombay State since 1931 from other parts of India took place during the decade 1931-41, and that 60 per cent was a product of the past ten years, connected with increased urbanisation and industrialisation since the war. This estimate ,is exclusive of the migration of dISplaced persons from Pakistan after 1947.
The number of immigrants to Bombay State doubled between 1931 and 1951. There were 433,090 immigrantN from Saurashtra and 76,020 from Kutch in Bombay State in 1951. In 1931 there were 266,843 immigrants to Bombay State from Saurashtra and Kutch combined, If Western India is regarded as one unit, this type of movement might be regarded as a speCies of internal migration. However, immigration from other areas also increased. The number of immigrants to 'Bombay State from Madras in 1951 quadrupled by comparison with 1931, almost tripled in the case of Madhya Pradesh and Uttar Pradesh, and was two and a half times as great in the case of Rajasthan. A total of 2,254,672 persons were immigrants to Bombay State from other parts of India in 1951, while only 437,021 persons born in Bombay State were enumerated in other states in India. In 1931, by contrast, there were 1,072,867 immigrants to Bombay Sta~e from other parts of India and 607,852 emIgrants.

GENERAL POPULATION 11.
Immigration to Bombay State increased while emigration went down. The states which contributed most heavily to Bombay's immigrant population in 1951 were Saurashtra, Hyderabad, Uttar Pradesh, Madras, Rajasthan, and Madhya Pradesh. Immigrants exc_eeded emigrants in practically every case as the table below shows :-
States which lost population to Bombay State (.1951 Census)
State. Saurashtra Hyderabad Uttar Pradesh Madras Rajasthan Madhya Pradesh Kutch Punjab ... T ravancore-Cochin West Bengal Delhi, PEPSU Vindhya Pradesh ... Bhopal Coorg Himachal Pradesh Bilaspur •••. Manipur
Immigrants. 433,090 353,868 338,913 238,070 190,389 112,083 76,020 35,179 15,257 13,952 6,386 2,411 2,269 1,410
928 358 67 13
Emigrants. 57,977
124,265 16,805 22,747 18,682 66,138
1,795 6,412 1,866
13,698 2,101
511 150 800 294 33
States which gained from Bombay
State. Mysore Madhya Bharat Bihar Assam Ajmer Orissa TripuTll Sikkim
Immigrants. 40,245 30557 5,795
987 3,280 1,216
2 1
Displaced persons
Emigrants. 43,918 42,579 .6,028 4,785 3,831 1,552
52 2
The partition of India in 1947 led to an influx of displaced persons from Pakistan. Out of the 2,254,672 immigrants in 1951 to Bombay State 338,096 were displaced persons from Pakistan. 59,787 out of the 128,511 immigrants to Saurashtra were displaced persons from Pakistan. Out of the 14,501 immigrants to Kutch 11,999 were displaced persons from Pakistan. Not all the displaced persons in Kutch were born in Pakistan. Many of them were Kutchis returning to the land of their birth. Hence only 8,255 persons enumerated in Kutch in 1951 were born beyond India.
SECTION 5
BmTHS
Growth of population is due primarily to the excess of births over deaths. This is called natural increase. The picture is however complicated by immigration and emigration. We have seen in the previous section that the migration figures are sometimes difficult to interpret. The quali~ of the births and deaths record also leaves much to be desired.
Registration of births and deaths Arrangements for the registration of births
and deaths now exist in every village and town of Bombay, Saurashtra and Kutch. In villa_ges information about births that have occurred is generally collected by village servants, and the village police patel (or headman) makes a record. Where the patel is illiterate the talathi ( or village accountant) registers the birth. In municipal areas the municipal authorities make arrangements for the registra-, tion of births and deaths. There is no statutqry' obligation in rural areas on the heads of households to report births and deaths occurring in their households, though in most urban municipal areas such an obligation has been imposed under by-laws.
The fact that an area is nominl!lly under registration, or that a statutory obligation to
A (Bk) H 91-20
register births has been imposed, does not unfortunately mean that all the births and deaths that occur are registered.
Compilation of statistics of registered births and deaths
At the beginning of every month extracts of the births and deaths registers in Bombay State are sent by the village patels to the taluka offices, and from there transmitted to the Assistant Directors of Public Health who compile the figures of births and deaths separately for the rural and urban areas of each district and taluka. The figures are published by the Director of Public Health in the annual report of the Public Health Department.
The birth and death rates, i.e. the number of births and deaths per 1,000 of population are also published. These birth and death rates are worked out for the mid-year population, which is estimated on the assumption that, since the date of the last census, the population has been increasing at the same rate as it did during the previous decade. As the rates of growth of population vary from decade to decade and from area to area, the birth and death rates tend to become progressively more inaccurate the further away from the date of the last

12 GENERAL POPULATION
census one moves. However the method is an advance on the former practice of working out birth and death rates with reference to the population figures recorded at the previous census, without allowing for any, growth of population at all.
Birth rates, death rates and growth rates for past three decades
In Subsidiary Table 1· 3 the birth rates, death rates and growth rates for each of the past three decades have been shown. The calculations of birth, death and growth rates have been based, not on the population at the beginning and end of each decade, but on the mean, or average, of these two figures.s The effect of distortions due to an area recording an unusually large increase in population during one decade ,but not in another has thus been reduced.
Although births and deaths are noW registered in all areas of Bombay, Saurashtra and Kutch they were not registered in all the former Indian States areas. Birth and death rates have consequently been worked out only for those areas in Bombay State for which figures were available. Data for Saurashtra and Kutch were not available.9
The Registered Birth Rate Subsidiary Table 1· 3 shows that the mean
decennial registered birth rate in Bombay State was 35'9 during 1921-30, 31'2 during 1931-40, and 32·9 during the past decade. These figures suggest that the birth rate declined during the past decade in Bombay State. On the other band the mean decennial growth rate during the past decade was higher than ever before. The mean decennial growth rate was 12'1 in 1921-30, 14·5 during 1931-40, and 20'S during 1941-50.
Has there been a real drop in the birth rate, or is the drop illusory and due merely to a decline. in the efficiency of registration of births during the past decade? The number of births in a population where birth control checks are virtually inoperative would seem to depend primarily on the number of married women in the reproductive age group 15-45. The estimated number of married women in
8 As explained on the fly-leaf of SubSidiary Table 1'3,
II 'The larger of the covenanting states in Saurashtra maintained adequate vital statistics but the smaller ones did not, and collection of data that would have given a reasonably accurate picture of the position was Dot possible.
this age group at successive censuses and the percentage that they constituted of the population of Bombay State have been shown below:-
Percent!.ve of Estimated number married women
CenlUl 01 of married women Total papulation. aaed 15.45 15.45. to total
population.
1921 4,934,556 22,353,209 22-08 1931 5,649,454 25,242,675 22·38 1941 6,580,180 29,181,146 22·55 1951 7,866,037 35,956,150 21·88
Worked out on the basis of the mean population for each decade, women aged 15-45 constituted 22'24 per cent of the total population in 1921-30, 22·47 per cent in 1931-40 and 22 ·18 per cent in 1941-50. It seems clear that there has been no great shift in the age structure of tlle population during the past decade making for a reduced proportion of married women in the age group 15-45, and consequently lower birth rate.
It is possible that births registration was particularly defective during the past decade because of the extra load of other work placed on . the registration agency:' The food shortage compelled Government to institute controlled distribution of food to the landless "have-nots" in villages, while most of ~e large urban areas were also rationed. This imposed a great strain on the machinery of Government at the village level, while the efficiency of registration in many urban municipal areas may also have deteriorated. At any rate the annual number of births regis~ered in Bombay Provinee virtually stood still between 1941 and 1948.
The True Btrth Rate
Even in 1921-30 when the registered birth rate in Bombay State was 35'9, and 1931·40 when it was 31' 2, a fair proportion of the births that took place escaped registration. Professor Kingsley Davis estimated10 that 22·8 per cent of the births that took place in Bombay Province in 1926-30 were omitted from registration. Kingsley Davis attempted to arrive at the true birth rate in Bombay Province during 1926-30 by using two methods~Reverse Survival and Successive approximation. The former method gave him a birth rate of 44·46, and the latter a birth rate of 41'75.
The Census Actuary in 1951, Shri S. P. Jain, attempted to estimate the true birth rate during the decade 1941-50. He used two methods-=.. Differencing" and "Reverse Survival." It is
10 .. The Population of India and Pakistan" by Kingsley Davis, pages 244-245.

GENERAL POPULATION 13
unnecessary to detail the basis of these calculations. Suffice it to say that by the first method a birth rate of 41· 0 was obtained, and by the second method 41· 8.
The actuary, Shri S. P. Jain estimatedll that the death rate in Bombay State during 1941-50 was 24·9, as against a registered death rate of 22·6. The actuary's estimate of the birth rate was 41, and the death rate 24·9. Subsidiary Table 1· 3 shows that the growth rate of the population during the decade was 20·8. There was, however, an unusual type of immigration-that of displaced persons from Pakistan-during the decade. If these displaced persons be excluded the growth rate would be 19·9. The actuary estimated that 16·1 of the growth rate was accounted for by the excess of births over deaths, and S· 8 by fresh migration during the decade.
Is the birth rate falling? There is some evidence that the birth rate
has fallen slightly not only in Bombay State but in India as a whole since the tum of the centuryP Even so a birth rate in the region of 40 per 1,000 is by world standards extremely high.l3 That it should be high is inevitable
when knowledge of birth control measures is limited to the educated classes in the towns. That there is a grave population problem is undeniable. The existence of a food shortage in a predominantly agricultural country is sufficient evidence of the fact. The hope of an improved standard of living will inevitably recede unless the birth rate is cut down. The matter is a vicious circle. A continued high birth rate means the perpetuation of poverty, because any gains in productivity will go to sustaining an increasing population at an already low level. Yet poverty is the limiting factor that prevents all but a small section of the community from artificially restricting its numbers.
It seems that a stage has been reached where public health measures have already begun to cut down the death rate, yet in the long run death control without birth control is unthi.nkable. No revolution in agricultural practice that would usher in an era of abundance is in sight. There is no solution but to control births, and if this is not done,_ nature is likely to solve the population problem by the more horrifying alternatives of famine and epidemics.
SECTION 6 DEATHS
Like the birth figures the death rate figures are also defective, though probably less so than the birth figures.
The same machinery that registers births also registers deaths. In villages this means the village patel, "and in towns the municipal authorities. Whereas, however, the arrival of an infant is a matter of little or no interest to society as a whole, death has a much more
11 He assumed that g. 2 per cent of the deaths that occurred were omitted from registration, a percentage that perhaps flatters the registration agency.
12 The causes of the decline are somewhat mysterious. There is some evidence that the birth rate in Western countries was beginning to decline slightly even before birth control became extensively practised. It might he that a change in habits or modes of living has initiated a slight downward trend in the birth rate in India also.
13 The birth rate in the u: K.. in 1947 was 20·8, in the U. S. A. 25·8 and in Japan 34·8. Mexico on the other hand had a birth rate of 45·1. Many International Year books publish the registered birth and death rates without a warning that the completeness of registration varies from country to country. A writer in the .. Economist" (Issue of April 11, 1953, page 82) stated that" In 1947 the crude birth rate of the United States was equal to that of India." Presumably he had been deceived by published figures that were accurate for the U. S. A. but not for India.
universal appea}.l4 Nobody could anticipate their birth; few fail to reflect that they will at some time die. A person's departure hom this mortal scene is much more likely to impress itself on the agency registering births and deaths. In villages the death of a landholder may involve an heirship enquiry and consequent changes in the Record of Rights in land, and hence concerns the village officers. The circumstances attending the disposal of a dead body serve to remind village officers and servants of ~e death. In the larger municipalities inf!)rmation is collected fro;m the cremation and burial grounds about the funerals that have taken place.
The Registered Death Rate Subsidiary Table 1·3 shows that the mean
decennial registered death rate in Bombay State was 26·7 during 1921-30, 25·1 during 1931-40 and 22·6 during the past decade. The trend of the registered death rates is unmistakably downward, and there seems little doubt that there has been a real fall in the death rate during the past decade.
14 In places where births and deaths registration is very bad it seems that deaths stand a better chance than births of heini regi$tered.

14 GENERAL POPULATION
Districts like Broach, East Khandesh and Sholapur that recorded high birth rates during the past three decades also recorded high death rates. Infant deaths generally account for more than twenty per cent of the registered deaths in Bombay State, and deaths among the child population aged 1-4 for another twenty per cent, hence a high birth rate and a high death rate always tend to go together.1
1>
The Kanara figures, though somewhat special, are ail interesting example of the way in which it is the decrease in the death rate which has been mainly responsible for the increase in population. The mean registered birth rates during the past three decades went down slightly, while the death rate slumped during the past decade, as shown below:-
Mean decennial birth rate.
Mean decennial death rate.
Kanara district 1941-50. 1931-40. 1921-30.
registered 31'2 33'~ 34·4
registered 20' 3 27·3 28·9
In the case of Kanara district it was mainly DDT spraying that was responsible. But things like that are happening everywhere. Public health measures probably reach an increasing number of people, even without there being any great rise in all areas in the standard of hygiene or education.
The True Death Rate
It may be assumed that the registered death rate of 22·6 during 1941-50 represents a. minimum figure. The true death rate must have been more than 22'6 per thousand, because the error is always one of omission from registration. The actuary, Shri S. P. Jain, estimated that about 10 per cent of the deaths that occurred in Bombay State during the past decade were not registered and that the true death rate in the State during the decade was 24· 9. This figure represents the most probable level of deaths during the decade, consistent with the other data of births and migration that we possess.
SECTION 7
LIVELIHOOD PATTERN
Roughly three-fifths of the population of the area was returned at the census as principally dependent on agriculture; and the remaining two-fifths on non-agricultural means of livelihood. The percentage of the population belonging to each of the eight main livelihood classes in the three States of Bombay, Saurashtra and Kutch was as shown below:-
I.
II.
III.
IV.
Agricultural Clcw~. Cultivators of land
wholly or mainly owned; and their dependants
Cultivators of land wholly or mainly unowned; and their dependants ...
Cultivating labourers; and their dependants
Non-cu I t iva tin g owners of land; agricultural rent receivers; aod their dependants
Total Bombay. Saura- Kutch. for three
shtra. States.
40'74 32'76 27'89 39'75
.9'69 8'34 9'57 9'56
9'05 3'76 2-97 8'42
1 '98 "76 1'60 1'95
Total ... 61 '46 46'62 42'03 59'68
15 In 1947 the registered death rate on the mid-year population was 10·1 in the U. S. A., 12·1 in the U. K., 14·8 in Japan and 16·3 in Mexico. The birth rates in these countries in the same year were 25· 8, 20·8, 34·8 and 45·1.
Non-Agricultural Classes. Persons (including depen
dants) who derived their pri.ncipal means of livelihood Irom-
V. Production other than cultivation
VI. Commerce VII. Transport
VIII. Other services and miscellaneous sources
Total Bombay. Saura- Kutch. for three
shtra. States.
o
13'76 17'98 7'61 10 '74 2'23 2'59
19'16 11'30 2'48
14'27 7'98 2'27
14'94 22'07 25'03 15'80
Total ... 38'54 53'38 57'97 40'32
These figures split up the population into eight livelihood classes. The number of persons dependent on a means of livelihood included not only the self-supporting persons who maintained themselves from that particular means of livelihood, but also their dependants. For instance, the practice of law (class VIII) was the principal means of livelihood not only of the practising lawYE:lr but also of his dependants. Where a person was in receipt of an income and that income was sufficient at least for his own maintenance then he (or she, as the case might be) was to be regarded as a self-supporting person for purposes of the

GENERAL POPULATION 15
census enquiry. Anyone who was not a selfsupporting person in this sense was a dependant. A depentlant might be either an earning dependant or a: non-earning dependant. The test was whether he secured a regular income even though it might be small. Where the income which he secured was not sufficient to support him, that person was an earning dependant. A person who did not earn any income either in cash or in kind was a nonearning dependant. The basis of enquiry was the individual and his present level of living. The principal means of livelihood of a dependant, whether earning or non-earning, was recorded as being that of the self-supporting person on whom he, or she, was dependent.
For an enumerator to distinguish between an agricultural and a non-agricultural means of livelihood was easy. But for him to distinguish between the four agricultural means of livelihood was often very difficult. It is not uncommon for an agriculturist to own some land of his own and also to cultivate land on lease; or to be the tenant of a piece of agricultural land and also work as an agricultural labourer. It is also of course possible for a person to derive his means of livelihood from agricultural and non-agricultural sources, but cases of mixed agricultural means of livelihood are much more common.
A good deal too was dependent on how a person saw himself. He had to say which particular means of livelihood provided the greater income and was in consequence his principal means of livelihood. The keeping of accounts is of course altogether exceptional so that, in the end, it was the individual's response or the enumerator's attitude that provided the basis of classification, and here a subjective factor entered. Changes of classification within the agricultural category may thus be the result not only of economic shifts and changes, but of a change in how persons saw themselves. The 1951 census returned almost two-thirds of the population dependent on agriculture as belonging to livelihood class I (owner-cultivators), a not unusual result for a predominantly ryotwari area; yet at the 1931 census of Bombay Province more persons were returned as agricultural labourers ~han as owner-<;!ultivators. Clearly something was wrong somewhere. The probability is that the 1931 census data were wrong, because
the 1921, 1941 and 1951 results were at variance with them, and even the exercise of ordinary commonsense would suggest that in a predominantly ryotwari area, the majority of cultivators would be dependent on the cultivation of their own lands.
If, in an industrial society, a worker were asked to describe himself as skilled or unskilled the probability is that, if he could claim on any grounds to be skilled, he would do so. A similar tendency to choose a superior category may have been at work in the census returns among the agricultural classes. A person with any piece of land of his own, however small, may have returned himself as belonging to livelihood class I. There is no reason to suspect that completely landless labourers returned themselves as owner-cultivators. Many enumerators were village officers who knew the persons they were enumerating and would have been able to correct any such tendency. Because of the great importance of livelihood class I, there may, however, have been a tendency among enumerators to treat it -as a residuary category into which agriculturists with any land of their own, and about whose classification there was the slightest doubt, were placed.
The livelihood pattern of the general population discloses differences from region to region. (In the table below brief and more colloquial labels have been applied to the eight livelihood classes).
Percentage of the General Population belonging to different livelihood classes
Agricultural Classes_
I. II. m. IV. Natural Division. Owner- Tenant Agri- Land-
cultiva- cult iva- cultural lords. Total.
ton. tors. labour-ers.
Greater Bombay 0'18 0'09 0'09 0-19 0'55
Gujarat 42'10 9'80 8' I!~ 2'08 62'16
Deccan Northern ... 52'14 3'91 11'07 1'98 69'10
Deccan Southern ... 44'27 JO'61 15'15 3'21 73'24
Konlcan 28'29 29'73 5'08 1'60 64'70
Saurashtra 32'76 8'34 3'76 1'76 46'62
Kutch 27'89 9'57 2'97 1'60 42'03
Total 39'75 9'56 8'42 1'95 59'68

l6 GENERAL POPULATION
Non-Agricultural Classes.
V. VI. VIl VllI Natural Division. Pro- Com- Trans- Other Totd.
duction. merce. port. ser-vices.
Greater Bombay ... 35'01 24'34 8'39 31'71 99'45 Gujarst
Northern::: 13 '93 7-58 1 -70 14'63 37'84
Deccan 10'86 5'32 1'54 J3 -18 30'90 Deccan Southern ... 10'34 5'76 1'03 9'63 26'76 Konkan " '57 5'43 2'83 15'47 35'30 Saurashtra 17'98 10-74 2'59 22'07 53-38 Kutch 19'16 11'30 2'48 25.03 57'97
Total 14'27 7-98 2-27 15'SO 40-32
The Agricultural Classes
The Deccan Northern Division and the Deccan Southern Division were much more heavily dependent on agriculture than other divisions in Bombay State. More than half the population of the Deccan Northern Division were dependent on owner-cultivation. The Konkan was notable for the very high ratio of the agricultural population who were tenants. The higher percentage of agricultural labourers and landlords (livelihood classes III and IV) in the Deccan Southern Division probably reRected the fairly extensive alienations of Government lands in the form of inams which were a feature of the districts of Dharwar, Belgaum and Bijapur.
Slightly less than 10 per cent of the population were tenants. Only in the Konkan was livelihood class II of great importance, due principally, it seems, to the Khoti system of land tenure which existed in Ratnagiri and Kolaba districts, and to the existence of a class of big landlords in Thana district. The percentage returned under class II (tenants) should be compared with that under class IV (landlords). Only in the Konkan was the ratio of class II to class IV very high. It was over 18 : 1 while in the Deccan Northern Division, where ryotwari tenure was the rule, it was less than 2 : 1. This suggests that a landlord-tenant relationship was more frequently encountered in the Konkan than elsewhere. By implication it was only in that area that "landlordism" was a problem on any scale.
The percentage returned under livelihood class III (agricultural labourers) is of great importance because this class represents the landless rural proletariat. It is interesting that the percentage of the total population returned as" dependent on this' means of livelihood
was relatively small. This may have been due in part to subjective factors, inasmuch as people were recorded accordin~ to their own description. The sharp fall in this category as compared with 1931, to whatever cause due, represents an interesting social phenomenon.
The Non-Agricultural Classes
The non-agricultural classes constituted almost two-fifths of the population of Bombay State. In Saurashtra and Kutch more than half the population belonged to them. The reason for the higher percentage of non-agricultural classes in Saurashtra and Kutch appears to lie primarily in the great distances that separate the population centres in these States. Saurashtra is relatively highly urbanised; Kutch is not. But great distances separate the towns and villages in both cases. This probably led to the satisfaction of nonagricultural needs by local manufacture of commodities. The large number of separate states in the Kathiawar peninsula before the formation of Saurashtra may also have tended to increase the nU,mber of persons living in small urban areas and dependent on non-agricultural means of livelihood.
The relative proportions of the population dependent on agricultural and non-agricultural means of livelihood is of vital importance, because in a situation where practically all the cultivable land is already under cultivation, relief and a better standard of living can only come by the expansion of non-agricultural activities and absorption in them ,of the surplus agricultural population, or by improved methods of cultivation which produce better yields from the land that is available. A mere numerical increase in the proportion of the non-agricultural classes is not necessarily a sign of healthy economic progress. It is importa'nt that the surplus agricultural population should be absorbed in industries or other useful services.
It is obvious that within the State and its various natural divisions the proportion dependent on non-agricultural means of livelihood will be greater as the proportion dependent on agriculture falls. Thus the heavier dependence on Production other than cultivation (livelihQod class V) and Commerce (livelihood class VI) observable in Gujarat was the corollary of its lesser dependence On agriculture. This lesser dependence on agriculture reflected the greater urbanisation and industrialisation of Gujarat.

GENERAL POPULATION 17
It is probably true to say that the greatest single factor making for a high percentage in livelihood class VI (C~mmerce) was a high percentage in livelihood class V (Production). Commerce, of course, includes banking and insurance and other more complex operations than the keeping of a village grocer> s shop, and probably only the expansion of livelihood class V (Production) can stimulate a big increase in livelihood class VI (Commerce). For that :.:eason there is probably more of a direct and causative relationship between livelihood classes V and VI than between any other livelihood classes.
The percentage of the entire population ~ependent on livelihood class VII (Transport) was small, but within the various natural divisions there were fairly wide variations. These variations were primarily due to the extent to which road, rail and sea transport facilities existed in the areas in question. The existence
of sea transport is the decisive factor that gave the coastal Konkan natural division its place next to the entirely urban and unrepresentative natural division of Greater Bombay. The extent of railway and road mileages in particular areas were the other important factors affecting the percentage of the population dependent on transport in particular districts.
The percentage of the population dependent on Other services and miscellaneous sources was much higher in Saurashtra and Kutch than in Bombay State. A large number of persons in this livelihood class, which comprises a wide range of occupations from Government servants to unskilled labourers is not necessarily a sign of healthy economic progress. In Kutch there was a large number of general, as opposed to agricultural labourers. They belonged to livelihood class VIII, and that tended to swell the proportion of non-agriculturists in Kutch.
SECTION 8
CONCLUDING REMARKS
The most remarkable feature of the past ten years was the very rapid growth of population in Bombay State. For the first time since the censuses began a decennial increase of over 20 per cent in the population was recorded. Some part of the increase may have been due to the slack in previous census enumerations being taken up, since the circumstances of the 1951 census were very favourable to a complete enumeration. A part was undoubtedly due to a quickening in the tempo of immigration from outside the area. There is no evidence that the census count was inaccurate by reason of people being erroneously counted twice, despite the fact that the enumeration was spread over twenty days and despite the existence of rationing, generally believed to lead to a bogus ration card holder problem.
If one accepts the 1951 census figures as authentic it is clear that they pose a grave population problem. Though there is some evidence that a slight downward trend in the birth rate has occurred in recent years the true birth rate during the past decade would seem to have been somewhere in the region of 40 per thousand. Though birth rates as high as 50 per thousand are possible, a birth rate
" (Bk) H 91-3
of 40 per thousand is by world standards extremely high. The death rate has shown a tendency to fall. It is impossible to state wjth certainty what part of the unusually heavy population increase of the past decade was due to a cutting down of the death rate, but Bombay State may have already entered on a cycle of rapid population increase based on a slightly lowered birth rate but a greatly diminished death rate.
1921 marks the great dividing line in the population history of the area. Up to that time population rose or fell from census to census as famine or disease stayed their hand or took their toll. From 1921 the history of the State has been one of rapid and accelerating growth. The population of Bombay, Saurashtra and Kutch has increased by 6Q per cent since 1921. A population forecas is always a hazardous business. If, how ver, present trends continue, a further increas of about 20 per cent in the population of We tern India may be expected during the co ing decade. Though this may eventually more hands to work, it means ately more mouths to feed.


CHAPTER II
++++++++++++++t++++++t++++++++++++++++++++++++++++++++++++++++++++++++
RURAL POPULATION ++++++++++++++++++++++++++++++++++++++++++++++++++++++++++++++++++++++
SECTION 1
PRELIMINARY REMARKS
It is customary to examine the distribution of the population after the census according to residence in rural or urban areas. How much of the population was rural; how much urban? In most of the tables compiled after the 1951 census separate figures for rural and urban areas have been exhibited, a distinct advance on previous census practice. The rural population lived in villages; the urban population in towns and cities. But where precisely was the dividing line between a town and a village to be drawn ?
In general the term "rural" connotes a population living in places with less than 5,000 inhabitants, but thare were exceptions. All municipalities were treated as urban, even though they had less than 5,000 inhabitants. A few non-municipal areas with less than 5,000 inhabitants were treated as urban because they possessed urban characteristics. In all 62 places in Bombay, Saurashtra and Kutch, having a combined population of 244,456, were treated as urban in 1951, even though they had less than 5,000 inhabitants. Most of them were municipalities.1 To counterbalance these places, whose claims to be treated as urban were perhaps disputable, there were
1 In general the former Il1.dian states created municipalities with a fairly lavish hand. Out of the 62 places with less than 5,000 inhabitants which in 1951 were treated as urban 39 were in Bombay State, 19 in Saurashtra and 4 in Kutch. 26 of these places were municipalities in Bombay, 15 in Saurashtra and 3. in Kutch.
A (Bk) H 91-30
115 places with a combined population of 703,131 which had more than 5,000 inhabitants but were treated as rural because they did not possess urban characteristics.
80·0 per cent of the population of Kutch, 68·9 per cent of the population of Bombay and 66·3 per cent of the population of Saurashtra lived in rural areas. The reason why Kutch was more intensely rural is obvious. There are no very important industrial or trade centres in Kutch. It is a predominantly rural area with poor communications, in which the population centres are comparatively small and separated by great distances. Saurashtra on the other hand is served by fairly adequate communications, and the existence of a large number of separate states prior to their integration in the State of Saurashtra, each with its capital, probably stimulated the growth of urban centres of population.
It is a familiar cliche to describe India: as a land of villages. There were 34,227 villages in Bombay State, 4,842 in Saurashtra, and 964 in Kutch. These figures do not include uninhabited villages.2 The character of the village in Bombay State is extremely varied.
I A dozen years back the writer saw a deserted village in Dharwar district in process of dissolution. The jungle had almost overgrown the village site. Some crumbling walls remained. A solitary cultiV(ltor trekked three miles with his bullocks to plough his ancestral fields. Malaria had driven the population away from that village site. However most deserted villages became uninh3bited a long time ago.

20 RURAL POPULATION
In the open plains the villages generally have only one village site, and constitute identifiable clusters of population living in built-up contiguous areas. In jungle tracts, however, numerous hamlets may be grouped in one
village. The village in such cases is a revenue village, a unit of area into which the countryside was divided for the , purposes of land revenue, and not a single locality population centre.3
SECTION 2
GENERAL DISTRIBUTION; AND DISTRIBUTION AMONG VILLAGES CLASSIFIED BY SIZE OF RURAL POPULATION
Saurashtra was the least rural and Kutch the most rural among the natuml divisions in Western India, if we exclude Greater Bombay, which was entirely urban. Within Bombay State the Konkan was the most rural natural division. Very little margin separated the remaining natural divisions, principally becausethe various component districts differed widely in their rural-urban composition, and the differences tended to be- obliterated at the level of the natural division. The most intensely rural districts in the State were the tiny Dangs (which was exclusively rural), Sabarkantha, Banaskantha, Ratnagiri and Kolaba. The least rural districts were Ahmedabad and Poona, due to the presence in these districts of the second and third largest cities in Bombay State.
The village meant a revenue village, which was sometimes an artificial creation. Bearing this reservation in mind, the figures are illuminating. Only 18·1 per cent of the rural population of Bombay, Saurashtra and Kutch lived in small villages with less than 500 inhabitants. More than half the rural population-55·0 per cent-lived in medium-sized villages with .between 500 and 2,000 inhabitants. The remammg 26·9 per cent lived in large villages . with- 2,000 or more inhabitants.
Small villages4 were frequently found in forest areas or in areas where the soil was comparatively barren and infertile. Dangs district consisted of scattered villages in a forest area.
• In Baroda State, before its merger with Bombay, its Census Commissioner had issued instructions which gave to the hamlet for census purposes a separate existence which it did not enjoy for other administrative purposes. In the interests of uniformity, however, hamlets in the former Baroda State were treated as forming parts of main revenue villages in the compilation of data after this censuS.
4 The commentary in this and the follOWing paragraphs is based on Subsidiary Table 2·~.
The average population per village was only 153, and 92·3 per cent of the population of the district lived in villages with less than 500 inhabitants. Kanara, another forest district, had an average of only 323 inhabitants per village and 38·3 per cent of the rural population lived in villages with less than 500 inhabitants. Small villtlges were also a feature of Banaskantha and Sabarkantha districts. In these arid and infertile tracts 30·5 and 38·8 per cent of the rural population lived in villages with less than 500 inhabitants. In Kutch as much as 21·1 per cent of the rural population lived in small villages with less than 500 inhabitants.
The distinguishing feature of Saurashtra was the high percentage of the population who lived in small villages with less than 500 inhabitants or in medium-sized villages with 500-2,000 inhabitants. There was a rather pronounced gap in the 2,000-5,000 sector before the urban category was reached.
Large villages with 2,000-5,000 inhabitants were a feature of the districts of Belgaum, Satara South and Kaira, where between '38· 1 and 44·2 per cent of the rural population lived in villages of these sizes. They are fertile agricultural tracts, and the average population of a village in these districts was among the highest in Bombay State. Other districts with a high average population per village were Kolhapur and Sholapur. Kolhapur in particular is an area in which most of the rural population lived in large villages. Open plains are favourable to the growth of large viJIages, even in places where the rainfall is precarious, like Bijapur and Sholapur. The size of the economic holding rises in such places, but the soil is fertile and the countryside open, and the rural population tends to congregate in medium or large sized villages.

RURAL POPULATION
SECTION 3
21
GROWTH
By the rural population we mean the population that was treated as rural at a particular census. In general at every census a population of 5,000 marked the dividing line between" a ~ral and an urban area. A place might earn promotion from the rural to the urban category by increasing its population. During the past decade a large number of promotions to the urban category took place. The rural category is not a static and unchanging one. Because of this, the growth of the rural population cannot be considered in isolation. In the table below the growth of the urban as well as the rural population at the past three censuses has been shown :-
Percentage increase in the rural and urban population of Bombay, Saurashtra
Rural Urban
and Kutch at the past three censuses
1941-51. 1931-41. 10-8 12·4 58-5 27-9
1921-81. 13·1 12-9
The urban population has shown an accelerating rate of increase at each of the past three censuses, while the rural population has shown a de-celerating rate of increase. However, one reason for this was the exceptional number of promotions to the urban category that took place during the past decade.
Demotion from the urban category to the rural being exceptional, we can insulate the figures from the e:ffect of the promotion of rural areas to urban by taking the lowest category-the areas that were rural in 1951,-and seeing what their growth rates at the past three censuses were. The areas of Bombay State that were rural in 1951 increased by 16· 9 per cent during 1941-51, by ll· 0 per cent during 1931-41, and- by 13·4 per cent during 1921-31.
Even the smallest villages thus recorded a heavier increase in population during the past decade than they experienced at any previous census. The . migration stream-within the State as well as that coming from outsidegenerally goes to the urban areas. Assuming that the 1941 and 1951 figures were accurate there must have been an improvement in the survival rate during the past decade to give rise to the above-average population increase during the. past decade even in those areas of the State which were most rural.
The usual method of analysing the increase or decrease in the rural population is to trace the growth rate in the population treated as rural at particular censuses, and this has been done in the paragraphs which follow.
The decade 1921-31 The decade 1921-31 was unique, because
the increase in the rural population during that decade was greater than the increase in the urban population, a reversal of the usuai pattern. Urban areas tend to grow as a result of migration from rural areas. At the time that the 1931 census was held, however, there was a world slump in trade, and many workers left the cities and towns and returned to their villages. In consequence during 1921-31 the rural population increased more than the urban population. Again, political conditions in 1931 were disturbed, and some under-enumeration of urban areas occurred, depressing the urban increase even more than was actually the case.
The rural population of the Deccan Northern Division recorded a heavier increase than other natural divisions during 1921-31. The influenza epidemic of 1919 had been particularly virulent in the Deccan Northern Division. Ahmednagar was affected by famine at the time of the 1921 census, and many persons had migrated from the district. The recovery from the influenza epidemic, the return of the famine migrants of 1921 to their homes, and a generally favourable decade caused the rural population of the Deccan Northern Division to increase by 17·9 per cent during 1921-31. Ahmednagar district recorded the phenomenal increase of 38·7 per cent.
The decade 1931-41 During 1931-41 Gujarat was the natural
division that registered the sharpest increase in population. The rural population of Gujarat increased by 15·0 per cent. The rural population of Kaira increased by as much as 20·0 per ceIit dl,uing 1931 to 1941. Even allowing for some under-enumeration in Gujarat in 1931, (which affected the urban areas more than the rural) there seems little doubt that the increase in' the riJral population was heavier in Gujarat during the decade 1931-41 than in other natural divisions of Bombay State. Only Saurashtra rivalled Gujarat's rate of increase.

22 RURAL POPULATION
The decade 1941-51
During the past decade the rural population of Gujarat increased by 15·5 per cent. Next came the Deccan Northern Division with 12·0 per cent, Kutch with 10· 0 per cent, Saurashtra with 7·6 per cent, the Deccan Southern Division with 6·0 per cent, and the Konkan with 5·2 per cent.
The comparatively small increase in the rural population of the Deccan Southern Division was due to the fact that a good number of the places in that division that were rural in 1941 were promoted to the urban category in 1951. If we take the lowest rural category-the places that were rural in 1951-and compare their 1951 with their 1941 populations we find that the populations of "these places increased by 18·6 per cent in Gujarat, 18·8 per cent in the Deccan Northern Division, 14·6 per cent in the Deccan Southern Division, 11· 1 per cent in the Konkan, 8·8 per cent in Kutch and 10·4 per cent in Saurashtra. The Konkan and Kutch are emigrant areas and their figures are not so important as those of the large natural divisions of Gujarat and the Deccan
- Northern Division. The sizable increases in the rural population of these two latter divisions indicate that even after making allowance for the factor of increased immigration from other states, which would naturally affect the urban areas more than the rural, there was a considerable increase in the rural population of Bombay State during the past decade. The past decade was probably exceptionally favourabJe to human survival.
The rural population of Banaskantha district showed the unusual increase of 28· 1 per cent.
Not all of this increase was natural increase i.e. caused by the excess of births over deaths. A large part of it was due to the return of persons who had migrated because of famine at the time of the 1941 census to areas that are now included in Pakistan.
The rural population of Ahmednagar and West Khandesh districts recorded aboveaverage increases in population at each of the past three censuses.
Density
Since a rural population is predominantly dependent on agriculture, the density of the rural population is a matter of considerable importance. There were 239 persons to the square mile in the rural areas of Bombay State in 1951. A density of 279 was recorded in Gujarat, Kaira district returning the extremely high density of 494. Gujarat is the most fertile agricultural tract in the State. The density in the Konkan was 249. The rainfall is generally assured and much of the cultivation is of paddy, a food crop which can support more persons to the square mile than possibly any other. Considering the nature of the terrain in the undulating Konkan tract, where profitable cultivation is limited to the coast and the valleys, and much of the land is forest or barren hill side, the density is extremely high, and the stimulus to emigration obvious. The density in the rural areas of the Deccan Southern Division was 217, and in the Deccan Northern Division 214. In the latter Division Kolhapur had a density of 361, the highest, next to Kaira, of any district in Bombay State. The land is fertile, the rainfall fairly certain, and there are irrigation facilities.
SECTION 4
MOVEMENT
The birth place data have not been exhibited in the tables according to residence in rural or urban areas at the census, but most of the rural population were born within the district where they were enumerated. Immigration into rural areas is generally seasonal in character and limited in numbers. The rural population of some sugar growing talukas in Ahmednagar district rOSe fairly steeply during the past twenty years, but in general most rural colonisation in Bombay State ceased long ago and most of the movement of popUlation that takes place now-a-days goes from the rural areas to the urban.
It is difficult to measure the extent to which the rural population of a district migrates. Such of the growth rate of the population as is not accounted for by the balance of births over deaths is' due to migration. Figures of registered births and deaths among the rural population for the past three censuses have been assembled and shown in Subsidiary Table 2·3. The birth rate minus the death rate gives the rate of natural increase. The decennial rate of natural increase (registered) of the rural population of Bombay State was 12·3 in 1921-30, 14·0 in 1931-40, and 11·3 in 1941-50. The mean decennial growth rates were 12·5

RURAL POPULATION 23
in 1921-30, 11·7 in 1931-40, and 10·6 in 1941-50. The difference between the natural increase rate and the grpwth rate represents the migration-cum-registration error. If registration were perfect the difference would b~ due entirely to migration. The migration-cumregistration error was +0·2 in 1921-30, - 2·3 in 1931-40, and -0·7 in 1941-50. A negative migration-cum-registration error, such as has been registered in Ratnagiri for the past three censuses, indicates emigration from· the rural areas, while a positive migration-cum-registration error, as was registered by Ahmednagar in 1921-30, indicates immigration. (In fact it
represented not fresh immigration but the return of the famine migrants of 1921 to their homes).
The fact that the migration-cum-registration error among the rural population has been negative for the past two decades indicates that movement of population generally takes place from and not into the rural areas. Since the registration figures of births and deaths are not completely accurate refined measurement of population movement by this method is not posslble.
SECTION 5
BffiTIIS
The arrangements made for the registration of births in rural areas and for the subsequent compilation of the data have been outlined in section 5 of chapter 1. The reasons why some births escape registration are obvious. Births tend to be the concern only of the households in which the births occur. The mother is frequently not a permanent resident of the .place where the birth occurred, but may havc returned to her parents' home solely for the confinement. By the time the village patel gets round to the job of registering the birth the mother may have left the village. Again, we cannot say what percentage of births escape registration in cases where a live-born infant dies shortly after birth.
In some of the Konkan districts the villages consist of several hamlets separated by long distances. The village patel is often illiterate, and the registration of a birth must await the visit of the literate talathi (village accountant) who looks after a group of villages. Needless to say this does not make for complete registration of births. The same difficulties exist in other areas where the villages are backward or remote.
The rural birth rate is higher than the urban birth rate. In the cities-and the cities comprised almost ·half the urban population of Bombay State-there are many more men than women. The urban birth rate therefore tends to be artificially low because birth rates are calculated on the total population, while
births occur only to women in the reproductive age groups. In rural areas the sex ratio is more evenly balanced.
Fall in registered rural birth rate during 1941-50
The mean decennial rural birth rate registered in Bombay State was 39·8 in. 1921-30, 40·2 in 1931-40, and 35·8 in 1941-50. During the past decade the birth rate registered by the rural population was 39· 1 in the Deccan Southern Division, 37'8 in the Deccan Northern Division, 36·2 in Gujarat and 28·8 in the Konkan. No figures for Saurashtra and Kutch were available. The lower birth rate recorded by the four Konkan districts is interesting. The rural population of the Konkan districts has always recorded low birth rates. In part this may be due to male emigration, but more defective registration of births in these districts (where the population is frequently more scattered) is probably a major factor. The rural population of Broach, East Khandesh, and Sholapur districts had registered birth rates of more than, 40 per thousand at each of the past three censuses. The rural population of the three districts of the Deccan Southern ·Division have also recorded birth rates of about 40 for the past three decades. When one considers that some omissions of births from registration occur even in those districts where the registration arrangements are most efficient it is reasonable to infer that the true rural birth rate during the past decade must have been over 40 per thousand.

24 RURAL POPULATION
SECTION 6
DEATHS
The mean decennial registered death rate among the rural population in Bombay State was 27·5 in 1921-30, 26·2 in 1931-40, and 24·5 in 1941-50. It is a well-known phenomenon that when birth rates are high, death rates tend. also to be high. The death rate registered among the rural population during the past decade was 26·8 in the Deccan Southern Division, 25'6 in the Deccan Northern Division, 24·7 in Cujarat and 19·9 in the Konkan. The registered birth rates followed a similar trend,
being ijjghest in the Deccan Southern Division and lowest in the Konkan. The registered death rate in East Khandesh has been over 30 per thousand for the past three decades. East Khandesh district had a moderate rate of increase during 1941-50. It has a high birth rate, and also a high death rate. The most noticeable recorded decline in the rural death rate during the past decade occurred in Kanara district.
SECTION 7
LIVELIHOOD PATTERN
An outline of the livelihood pattern of the general population has been given in section 7 of chapter I. In this section the rural population has been considered separately and its livelihood pattern examined. Obviously one of the most important factors affecting the livelihood pattern of a district would be the extent to which the population was rural or urban. Ahmedabad city accounted for almost half the population of the district, and affected the livelihood pattern of the population living in the rural areas of the district.
Four-fifths (79·95 per cent) of the rural population of Bombay, Saurashtra and Kutch belonged to the agricultural classes.1i The livelihood pattern of the rural population differed from region to region. In the analysis that follows each livelihood class has been taken separately, and the proportion of the rural population that belonged to it in different areas examined.
Agricultural Classes
Livelihood Class I (Cultivation of owned land) in rural areas
More than half the rural population in Bombay, Saurashtra and Kutch derived their livelihood from the cultivation of their own land. The proportion was highest in the Deccan Northern Division. 65·5 per cent of the rural population of the Deccan Northern Division were returned under livelihood class I (cultivation of owned land) as compared with 54·3 per cent in the Deccan
Ii Subsidiary Table 2'4.
Southern Division, 54·2 per cent in Cujarat, 44·9 per cent in Saurashtra, 33·7 per cent in the Konkan and 33·5 per cent in Kutch. Dangs district rehlrned 87·4 per cent of the population as dependent on livelihood class I, and Panch Mahals district returned 76· 3 per cent. This is a feature that calls for comment. A high percentage of owner-cultivators in the population, while indicative of a healthy social trend, is not necessarily an index of agricultural prosperity. Both Dangs and Panch Mahals had very high percentages of Scheduled Tribes in the population and were agriculturally backward by comparison with districts like Kaira, where 61· 6 per cent of the rural population were dependent on owner-cultivation, or Kolhapur with 65· 1 per cent. A fertile soil and irrigation facilities are also important factors making for rural prosperity.
Livelihood Class II (Cultivation of unowned. land) in rural areas
Kanara, Kolaba and Thana districts in the Konkan were the only districts in which the percentage of the rural population dependent on the cultivation of unowned land (livelihood class II) exceeded the percentage dependent on livelihood class I (cultivation of owned land). In the case of Kolaba and Thana districts a sizable proportion of the rural population belonged to the backward classes, and the most important crop is paddy which requires a fair amount of capital expenditure. This and the Khoti system of land tenure in

RURAL POPULATION 25
Kolaba district gave rise to a class of big landlords, with the result that mucl1 land was leased out for cultivation. In Kanara district too there was a heavy proportion of tenant cultivators. There garden cultivation, which requires heavy capital expenditure is important, and this was another factor making for the creation of a fairly heavy proportion of tenant cultivators.
Next to the Konkan, where 35·3 per cent of the rural population belonged to livelihood class II, came the Deccan Southern Division with 12· 6 per cent, Saurashtra with 12·0 per cent, Gujarat with 12'3 per cent, and Kutch with 11·5 per cent while the Deccan Northern Division with only 4· 7 per cent tailed a long way behind. Fewer of the rural population of the Deccan Northern Division were tenants (livelihood class II) because so many persons there were owner-cultivators.
Livelihood class II exists because a certain number of people lease out land to others who do not own the land which they agree to cultivate. The circumstances leading to the creation of a class of tenant cultivators would vary. A man might lease out land because he was a big landholder who could not cultivate personally all the land he held, and hence gave it to tenants. By the same token, a tenant might take land on lease because he would otherwise have no land to cultivate, or because the income which he obtained from the cultivation of his own land, or from agricultural labour or from some other occupation was insufficient to maintain him. The livelihood classes are not mutt:ally exclusive. The fact that mixed means of livelihood are far from uncommon is, from the point of view of the analyst of the figures, most unfortunate. If all the persons in livelihood class II held their land from persons who belonged to livelihood class IV analysis of the figures would be simple, and would enable us to work out a landlord-tenant ratio. Since, however, a person belonging to livelihood class II might hold the land on lease from a big landholder belonging to livelihood class IV who let out his land to many tenants, or from the widow of a small landholder who was obliged to lease out land which her husband used to cultivate personally, or from a person in livelihood class I who found it convenient to lease his excess land to a tenant, or from a person who might not be an agriculturist at all, it will be seen that no happy simplicity attends the analysis.
A (Bk) H 91-4
Something can, however, be learned from a comparison of the ratio of class II to class IV. The figures of Thana, Kolaba, Kanara and Ratnagiri districts in the Konkan, Banaskantha, Panch Mahals, and Surat districts in Gujarat, Kolhapur in the Deccan Northern Division, and Belgaum district in the Deccan Southern Division, suggest a situation where a class of big landlords let out land to tenants, because in those districts the proportion of those in livelihood class II was large compared to the proportion in livelihood class IV. The existence of a class of big landlords in the Konkan and in Surat district in Gujarat are established facts. The high ratio of class II to class IV in Kolhapur probably arose from the fact that the district was formerly an Indian State, with a large number of jaghirs and feudatories. The explanation of the fairly large number of adherents of livelihood class II (tenants) in Belgaum probably lies in the alienation of Government lands in the form of inams in that district. The ratio of livelihood class II to livelihood class IV does not give a full picture because . of the varying circumstances under which land might be leased out to tenants. Where, however, the ratio was high then it suggests that the ranks of class IV in those districts included landholders with large holdings of land.
Livelihood Class III (Cultivating labourers) in rural areas
The 1931 census figures of Bombay State gave the peculiar result that most agriculturists were returned as labourers. The definitions employed at successive censuses have varied, but not to such an extent as to warrant this result in a predominantly ryotwari area. An occupant of land in inam villages in the past might have had an equivocal status, the inamdar maintaining that he was a mere tenant, and the occupant claiming full rights in the soil. But most of the land in Bombay State has always been ryotwari.
The legislation of the past decade has probably led to the growth of a more acute awareness of the distinction between a cultivating owner, a cultivating tenant, and a landless labourer. Inevitably the bias would be towards claiming to be an owner-cultivator, and probably in the case of those who combined agricultural labour with the cultivation of their own land, there was a tendency for persons to claim that they were primarily .cultivators of

26 RURAL POPULATION
owned land. It seems however quite improbable that any completely landless labourers would be returned as belonging to livelihood classes I or II, because most enumerators in the rural areas were acquainted with the persons whom they were censusing.
At this census 11· 0 per cent of the rural population of Bombay, Saurashtra and Kutch were returned as dependent on livelihood class III, the proportions being 17·4 per cent in the Deccan Southern Division, 13·2 per cent in the Deccan Northern Division, and 10·5 per ceot in Gujarat, but only 5·9. per cent in the Kookan, 5·3 per cent in Saurashtra and 3·4 per cent in Kutch. The divisiQnal figures are less illuminating than the returns of individual districts.
The circumstances leading to the creation of a class of agricultural labourers require analysis. Under circumstances where population, relative to the land available was sparse, everybody could have land of his own, if not for the asking, at least for the payment of assessment. Within the time of recorded history, however, a class of landless labourers had grown up in most areas. It was only in the under-populated and unsettled parts of the country like West Khandesh a hundred years ago that land had still very little intrinsic value. With settled conditions land acquired a value, and the delighted Bhil discovered that he was able to obtain credit for such expensive social affairs as marriages on the strength of his land. Before Government woke up to the problem, many Bhils had been parted from their lands by the decrees of courts that did not go behind the mortgage bonds and promissory notes, which fraudulently magnified the improvident borrowings of the Bhils.
The first essential to the existence of a class of agricultural labourers is that there should be a demand for labour. One factor that might stimulate the growth of a comparatively numerous class of agricultural labourers would be density of population. In areas like Saurashtra and Kutch, which are less densely populated, the adherents of livelihood class III constituted a smaller percentage of the rural population than elsewhere. Density is not the whole story, however. The growth of irrigation and the cultivation of crops such as cotton, sugarcane, or paddy which require more labour than miIIets, would seem to be another circumstance making for an increase in livelihood
class III. Livelihood class III could therefore arise out of poverty induced by over-population, or because a flourishing agriculture created a demand for agricultural labour.
it would be a hold person who would attempt to explain with precise reference to the circumstances mentioned above the variation in the size of livelihood class III from district to district. It is interesting that 25· 5 per cent of the rural population of East Khandesh were recorded at the census as dependent on agricultural labour. The same picture emerged from a survey6 carried out by the Bureau of Economics and Statistics of the Government of Bombay. The investigation showed in East Khandesh that the most important deviation from the usual pattern of employment found in other districts was the comparatively large proportion of the population who were engaged in agricultural labour. The great importance of livelihood class III in East Khandesh probably arose out of overpopulation in a very fertile agricultural' tract. Dependency on agricultural labour' was also fairly heavy in the rural population of Broach (24·5 per cent), West Khandesh (22·4 per cent), Dharwar (21·8 per cent), Bijapur (18·9 per cent), and Surat (18· 3 per cent). The cultivation of a cash crop, like cotton, which requires a fairly heavy labour force to tend and harvest, or the existence of irrigation facilities, would stimulate a demand for labour in these districts. This, of course, is far from being the whole story. In the Konkan, class III was very small for the simple reason th~t class II was so big. Its size left little room for class III. In Thana, Surat, and Broach districts the Adivasis helped to swell the ranks of agricultural labourers, as did the landless Bhils in West Khandesh. In the districts of Belgaum and Dharwar in the Deccan Southern Division the existence of extensive inam lands in a. fairly prosperous agricultural tract, with irrigation facilities and cash crops, probably accounted for the impor_tance of livelihood class III.
Livelihood elMs N (Landlords) in rural areM
Persons belonging to livelihood class IV, noncultivating owners of land, agricultural rent receivers, and their dependants might be more loosely described as landlords. This class included not only big landholders, inamdars, and, in Saurashtra, girasdars, but other persons
II Bulletin of the Bureau of Economics and Statistics, Vol. IV No.2, October 1950, page 24.

RURAL POPULATION
of smaller means, including widows of cultivators who derive~ their principal means of livelihood from the leasing of land which they could not cultivate personally. The distinction between the rural and urban adherents of this livelihood class is fundamental. A higher percentage in the urban as compared with the rural areas of a district would normally be indicative of absentee landlordism, the persons in question preferring residence in urban areas with their superior amenities to residence in the villages where their lands were situated.
The highest percentage of livelihood class IV was found in the rural areas of the Deccan Southern Division. The principal reason would appear to be the extensive alienation of Government lands in the form of inams in these • districts, as also in Sholapur. Another factor might be the fairly extensive irrigation facilities in Dharwar district, leading to the creation of a fairly numerous class of small landlords.
The percentage of the rural population dependent on livelihood class IV is not an indication of the importance of that class, nor is the ratio of class II to class IV a completely reliable guide. On an average 2·2 per cent of the rural population belonged to livelihood class IV, and the figures showed no very marked fluctuation between Gujarat and the Deccan Northern Division. In the Deccan Southern Division the percentage walt higher, while in the Konkan the percentage was lowest of all (1, 5 per cent), not because landlordism there was not a problerp,-the high percentage of tenants disproves that,-but because the landlords in question had large holdings. Satara North in the Deccan Northern Division produced the contradictory situation of 2· 1 per cent of the rural population being dependent on tenant cultivation (livelihood class II), and 3· 5 per cent of the rural population being noncultivating owners of land. The explanation probably lies in a combination of 1:\\10 circumstances-much of the land might have been leased to persons whose principal means of livelihood was owner-cultivation, and the ranks of livelihood class IV might have been swollen by extensive emigration.
The fact that 2· 28 per cent of the rural population of Saurashtra belonged to livelihood class IV, a figure not notably above the average for the area either for this class or for class II, is intriguing. Girasdari abolition had not been effected at the time of the census.
A. (Bk) H 91-4a
However the percentages of class II and class IV in Zalawad were the highest of any district in Saurashtra, and that accords with known facts. Zalawad contained a larger proportion of tenants and landlords than other districts in that State.
Non-Agricultural Classes
Persons belonging to livelihood class V (Production other than cultivation) in the rural areas would include carpenters, potters, and blacksmiths, members of trades without which a rural agricultural society could scarcely exist at other than a primitive level, as well as spinners, weavers, basket makers, and practitioners of other rural crafts. Under the revised economic classification scheme it also included herdsmen and shepherds, important occupations ancillary to agriculture. 6·9 per cent of the rural population of Bombay State were returned at the census as belonging to livelihood class V.
A very small percentage of the rural population of a district coming in this livelihood class would be prima facie evidence of backwardness, though the converse would not necessarily hold good. In Panch Mahals and Dangs less than 4 per cent of the rural population belonged to this .livelihood class, even though these districts had forests, and forestry and wood-cutting are occupations belonging to livelihood class V.
On the other hand Kutch, which is a rather poor area, had more adherents of livelihood class V than any other district. The percentage of the population belonging to this livelihood class was also high in Saurashtra. The main reason would seem to be the relatively greater distances which separate the villages in Kutch and Saurashtra, aecessitating a greater number of producers to satisfy the local needs of more isolated village communities. The Konkan Division in Bombay State had also a higher percentage in this livelihood class than other divisions for somewhat similar reasons, though the fairly high figure in livelihood class V in Kanara district was accounted for by the timber industry. Among the remaining natural diviSions, 1· 6 per cent of the rural population of Gujarat, 5·7 per cent of the rural population of the Deccan' Southern Division and 6·0 per cent of the rural population of the Deccan Northern Division belonged to this livelihood class.

28 RURAL POPULATION
Only 2·1 per cent of the rural population of Bombay, Saurashtra and Kutch belonged to livelihood class VI (Commerce). Perhaps the most frequent form of commercial activity in rural areas is the conduct of a village grocer's ShOp7. In addition, there is the buying and selling of agricultural products, but the middlemen who engage in this are generally found in the towns. There is also the business of banking and moneylending. The former is virtually non-existent in rural areas and the latter, which has always had a faint odour of disreputability, was at the time of the census a licensed occupation in Bombay State. Moneylending used generally to be carried on as a sideline by wealthy agriculturists or traders, hence the number of persons who declared themselves as principally dependent on it even in the past would not be indicative of the importance of the occupation.
In Dangs and Panch Mahals districts only 0·8 and 1·1 per cent of the rural population were principally dependent on Commerce. The districts are fairly backward, and commercial activities in consequence were not well developed there. However, even in the rich agricultural districts of Kaira and East Khandesh the percentage of the rural population belonging to this livelihood class was below the average for the State,
As in the case of livelihood class V (Production), Saurashtra and Kutch returned the highest percentages of the population as dependent on Commerce, followed by Cujarat. Kutch had the highest percentage (8·0 per cent) of any district in the State. The numbers in this livelihood class in Kutch were possibly swollen by the dependants of emigrant Kutchi ttaders though, as in Saurashtra, the greater distances between the population c,entres was also a factor making for an increase in this livelihood class. 3·0 pet cent of the rural population of Cujarat were returned as -dependent on Commerce, as compared with 1· 9 per cent in the Deccan Northern Division. A high percentage in livelihood class V (Production) would norma:Ily make for a high percentage in livelihood class VI (Commerce).
-7 The variety of goods purchasable in the targer Villages has Increased in the past 20 years and would now include, in addition to foodgrains, cloth and kerosene, such items as cigarettes, matches, torch batteries and boiled sweets.
Transport was the principal means of livelihood of only O·g per cent of the rural population of Bombay, Saurashtra') and Kutch. No district returned such a high percentage of the rural population as dependent on Transport as Ratnagiri-2·4 per cent as compared with only 0·06 per cent in Dangs. Ratnagiri has a longer coast line than any other district. In all the coastal districts the percentage of the rural population dependent on Transport was noticeably higher than in the inland districts. In the coastal Konkan natural division of Bo~bay State 1· 99 per cent of the rural population were returned as dependent on Transport, as compared with 1·00 per cent in Gujarat, 0·55 per cent in the Deccan Northern Division and 0·22 per cent in the Deccan Southern DiviSion. In the maritime States of Kutch and Saurashtra 1· 5 per cent and O· 9 per cent of the rural population belonged to this livelihood class. In the rural areas the proportion of the population dependent on Transport depended on the existence or n<)ll-existence of sea transport, and on the length of rail and road mileages, in the district. It would appear that so far as the rural population is concerned rail transport is a more important factor than road transport, for the simple reason that most of the road transport workers are for obvious reasons urban dwellers. Bus and lorry depots and workshops would necessarily be in towns and the men who drove and looked after the vehicles would also be urban dwellers, but a country railway station or level-crossina
• 0
remams a permanent featqre of the rural land-scape, and the persons who worked them belonged to the Transport livelihood class.
Livelihood class VIII-Other services and mis~ellaneous sources-is the last of the eight broad livelihood classes, and the fourth and most important of the non-agricultural livelihood classes. 7· 6 per cent of the rural population of Bombay State belonged to this livelihood class as compared with 6·9 per cent in livelihood class V (Production). Livelihood class VIII included such varied occupations as teachers, village officers and servants doctors priests and policemen as well as' person~ variously described as coolies or mazdoors and those whose occupations were otherwis~ unclassified. Persons who were dependent on non-productive activities, such as beggars and prostitutes, also came ih this livelihood class.
Kutch and Saurashtra respectively returned 2.1·1 and 14·8 per cent of their rural populahans as belonging to livelihood class VIII.

RURAL POPULATION 29
A high percentage of the rural population in this livelihood class is not an indication that an area is bulgil;g with schools and doctors. Poor communications and a sparse population, or over-population with a consequent swelling of the ranks of unskilled labourers could equally be factors making for a large livelihood class VIII. Panch Mahals returned only 3·1 per cent
of the rural population of the district as belonging to this livelihood class. No other district had less than 4·4 per cent of its rural population in class VIII. Some of the districts such as Kolhapur, with small percentages i~ Other services were prosperous agricultural districts, while Kutch, with a bloated class VIII, was a rather poor region.
SECTION 8
CONCLUDING REMARKS
The population was divided into rural and urban in examining the results of the census. It has always been customary to divide the population into these two categories of rural and urban at censuses in India, but the 1951 census was the first one after which the distinction between rural and urban was regularly maintained in exhibiting results in the census tables.
The precise point at which a rural area qualifies for promotion to the urban category must always cause difficulty. A population of 5,000 has in general marked the dividing line at successive censuses, though there were exceptions. Almost a quarter million people in Bombay, Saurashtra and Kutch were treated as urban in 1951 though ihey inhabited places with less than 5,000 inhabitants, and almost three quarters of a million people were treated as rural though the places they lived in had more than 5,000 inhabitants. Despite this' anomaly the distinction between rural and urban is a necessary and useful one.
Perhaps the most significant development of the past twenty years has been the de-celerating rate of increase of the rural population as compared with the urban. In all countries of
t1)e world there is a trend from the countryside towards the to\';n Even in countries where the rural population is increasing the urban population is increasing at a faster rate, so that everywhere the proportion of the rural to the total population is decreasing. This typical modern development was experienced to a greater degree in Western India during the past ten years th?n at any previous period.
At the end of the decade, however, almost 70 per cent of the population was rural, and thel'( had been no decrease in the absolute numbers of the rural population-quite the reverse. Even the smallest rural areas-those places that were rural in 1951 and had been rural at preceding censuses-recorded a heavier rate of increase in population than ever before.
Four-fifths of the rural population was dependent on agriculture. Food is the essential thing, and the problem plesented by the pressure of an increasing population on the soil is perhaps the gravest that confronts the country and indeed, the world, today. Some aspects of this problem are touched on in section 9 of chapter IV of this report.


CHAPTER III
++++++++++++++++++++++++++++++++++++++++++++++++++++++++++++++++++++++
URBAN POPULATION ++++++++++++++++++++++++++++++++++++++++++++++++++++++++++++++++++++++
SECTION 1
PRELIMINARY REMARKS
For purposes of analysis of the census data the population has been divided into rural and urban according to residence. Within the urban category the .. town" had a multiple and somewhat confusing definition. It included all municipalities, all cantonments, all civil lines, and all places with more than 5,000 population which it was decided to treat as towns on the ground that they possessed urban characteristics. The opinion of the District Collector on the urban character or otherwise of the place was accepted. Substantially the definition of .. urban" h~ remained unchanged since 1891.
A place with 2,000 or more inhabitants might legally be constituted into a muniCipal area under the Bombay District Municipal Act. The number of municipalities with less than 5,000 inhabitants in the old province of Bombay was, however, small, and the reason for their constitution was usually the existence of an important fair or centre of pilgrimage that rendered a municipal form of government desirable despite their small permanent populations.
The boundaries of the State of Bombay have been enlarged since 1947 by the integration of the former Indian State areas. In general the Indian States were more lavish about creating municipalities than was the old province of Bombay. In the process of securing uniformity some of these municipalities have been or are in process of being abolished but if a place was a municipality at the ~e of the 1951 census it was treated as an urban
area. 39 places, having a combined population of 150,853 in Bombay State were treated as urban at the 1951 census, though they had less than 5,000 inhabitants. The total urban population of Bombay State was 11,170,340, so that urban areas with less than 5,000 inhabitants comprised only 1· 3 per cent of the urban category. On the other hand 113 places, with a combined population of 688,749 in Bombay State, were treated as rural, though they had more than 5,000 inhabitants, as they did not possess urban characteristics.
Suburbs of municipalities were treated as urban for purposes of the 1951 census in Bombay State, provided they had 1,000 or more inhabitants and presented urban characteristics.
Of COurse the distinction between a large village and a small town is often meaningless, because the mode of life in each does not much differ, both being predominantly dependent on agriculture. Small towns which are administrative centres, however, tend to acquire a non-agricultural bias. The former district headquarters town of Bijapur district was Kaladgi. It ceased to be the district headquarters town during the decade 1881-1891, but even in 1951 the percentage of its population who were dependent on Commerce and Transport was double the figure for other urban areas in tM district.
At the census of 1951 there were 499 towns in Bombay State, 85 in Saurashtra, and 10 in Kutch. 33·7 per cent of the population of Saurashtra, 31·1 per cent of the population of Bombay, and 20·0 per cent of the population of Kutch lived in urban areas.

32 URBAN POPULATION
SECTION 2
GENERAL DISTRIBUTION; AND DISTRIBUTION AMONG TOWNS CLASSIFIED BY SIZE OF URBAN POPULATION
Saurashtra State was on the definitions adopted slightly more urbanised than Bombay State. Within the natural divisions that comprised Bombay State, Greater Bombay was exclusively urban. In the Deccan Northern Division 26·5 per cent, in the Deccan Southern Division 26·2 per cent, in Gujarat 25·6 per cent, and in the Konkan 19·4 per cent of the population were urban. The existence of a large urban centre within a district raised the urban percentage of the district as a whole. Thus 59· 1 pel' cent of the population of Ahmedabad district, 42·8 per cent of the population of Poona district, and 39·1 per cent of the population of Madhya Saurashtra district were urban. Less than twelve per cent of the population of Banaskantha, Sabarkantha, Panch Mahals, Kolaba, and Ratnagiri districts were urban. Dangs district in the Deccan Northern Division was exclusively rural.
A population of 5,000 roughly marked the difference between a rural and an urban area. But the manner of life ill a small urban centre is fundamentally different from that in a large town or city. For that reason the average population per town in a district, and the distribution of the urban population of a district in towns of various size classes, are more accurate measures of the true degree of urbanisation. The average population per town in Gujarat was 19,859, as compared wilh 17,340 in the Deccan Northern Division, 13,688 in the Deccan Southern Division, and 12,535 in the. Konkan. In Saurashtra it was 16~390 and in Kutch 11,375.
The percentage of the urban population who lived in small towns oC 5,000-10,000 persons was lower-19· 7 per cent-in Gujarat than in any other natural division of Bombay State, and the 'percentage of the urban population who lived in large towns of 20,000 and over was higher-66·2 per cent-than in any other natural division, excluding always Greater Bombay, which .was exclusively urban. In the Deccan Southern Division on the other hand as much as 30·7 per cent of the urban population lived in small towns with 5,000-10,000 inhabitants. Thus, though only 25· 6 per cent of the total population of Gujarat was on definition urban, as compared with 26·2 per cent in the
Deccan Southern Division, Gujarat was in actual fact the most urbanised natural division in Bombay State from the point of view of the proportion of the urban population who lived in large-sized towns, and not small market towns or over-grown villages.
Size class of towns
For purposes of arrangement of the statistics and analysis of the data it has been the practice to recognise six classes of towns :-.
Class I-With a population of 100,000 and over.
Class II-With a population of 50,000-100,000. Class III-With a population of 20,000-50,000. Class IV-With a population of 10,000-20,000. Class V-With a population of 5,000-10,000. Class VI -With a population of under 5,000. The first class of towns, those with popula-
tions of 100,000 or over, are ranked as cities. Bombay has always adhered rigidly to the definition that a city means a place with a population of 100,000 or over, and has accepted no dilution of this standard. There were eight cities in Bombay State at the time of the census-Bombay, Ahmedabad, Poona, Sholapur, Surat, Baroda, Kolhapur and Hubli.
If the criterion were not the form of local government existing in an area, but the existence of a continuous built-up area, Ahmed~ nagar with its municipality and cantonment, and Belgaum with its municipality, cantonment, and suburbs, would also have ranked as cities. Nasik narrowly missed entering the city category in 1951. For purposes of rationing these three areas were ranked as cities, as was the displaced persons' township of Ulhasnagar, adjoining Kalyan, in Thana district.
The eight cities of Bombay, Ahmedabad, Po ana, Sholapur, Surat, Baroda, Kolhapur and Hubli comprised 45·5 per centI of the entire urban population of Bombay State. The seventeen towns with 50,000-100,000 inhabitants comprised 10·2 per cent of the urban population of the State; the fifty-one towns with 20,000-50,000 inhabitants 13· ° per cent; the hundred towns with 10,000-20,000 inhabitants 12·2 per cent and the two hundred and eightyfour towns with 5,000-10,000 inhabitants 17·8 per c.cnt. There were only 39 towns,
1 Subsidiary Table 3'4.

URBAN POPULATION 33
comprising 1· 3 per cent of the urban population of Bombay State, ~th populations of less than 5,000.
The three cities of Bhavnagar, Rajkot and J amnagar comprised 26·9 per cent of the urban population of the State of Saurashtra. The two towns with 50,000-100,000 inhabitants comprised 8·7 per cent of the urban population of the State; the 13 towns with 20,000-50,000 inhabitants 28·0 per cent ( the most important size class); the 12 towns with 10,000-20,000 inhabitants 12·5 per cent; the 36 towns with 5,000-10,000 inhabitants 18·3 per cent. There were 19 towns in Saurashtra, comprising 5·6 per cent of the urban population of the State, with less than 5,000 inhabitants.
There were no class I or II towns in Kutch State. The two towns ~ith 20,000-50,000
inhabitants comprised 53 per cent of the urban population, the one town with 10,000-20,000 inhabitants 17·0 per cent, the three towns with 5,000-10,000 inhabitants 15·8 per cent. Four towns with less than 5,000 inhabitants comprised 14·2 per cent of the urban population of the State.
In Bombay State almost half the urban population lived in cities. In Saurashtra and Kutch more of the urban population lived in class III towns with 20,000-50,000 inhabitants than in any other size class of towns. In Bombay 1· 3 per cent, in Saurashtra 5·6 per cent, and in Kutch 14·2 per cent of the urban population lived in towns with less than 5,000 inhabitants.
SECTION 3
GROWTH
The proportion of the general population .of Bombay State that was urban has shown a progressive increase. In the following table the percentage of the population of Bombay State, as at present constituted, who were treated as urban at successive censuses has been shown:-
Urban percentage.
1872 17·3
1881 17~0
1891 17·8
1901 19·4°
1911 18·6
1921 21·7
1931 21·4
1941 23·6
1951 31·1 o The rise in the urban category in 1901 was prob
ably due to the devastating effect of the famine of 1899 on the rural population.
Save for the decade 1921-31 the urban population in Western India increased faster during the past 30 years than the rural population, as the following table shows :-
Percentage increase in the rural and urban population of Bombay, Saurashtra and
Kutch at the past three censuses
1941-51. Rural .. 10·8 Urban .• 58·5
A (Bk) H 91-5
1931-41. 12·4 27·9
1921-31. 13·1 12·9
The decade 1921-31
The urban population increased by only 12·9 per cent during 1921-31, while the rural population increased by 13·1 per cent. Because of the world slump in trade some immigrants to the urban areas returned to their villages. There was under-enumeration of some urban areas in 1931, particularly in Gujarat and Greater Bombay where political conditions were disturbed. Greater Bombay recorded a population increase of only 0·6 per cent, the smallest in its history. The 'urban areas of Gujarat recorded an increase of only 11· 5 per cent, as compared with 18·3 per cent in the Deccan Northern Division. The urban population of Surat district actually decreased by 0·9 per cent.
The decade 1981-41
At the census of 1941 the under-enumeration error of 1931 in urban Gujarat was corrected. The urban population of Surat district increased by 50·2 per cent. The urban population of Ahmedabad district recorded the stupendous rise of 77·0 per cent. In Gujarat as a whole the urban population increased by 42·3 per cent in 1931-41, a higher increase than was recorded at any of the past three censuses. The 1931 figures seem clearly to have erred on the side of under-enumeration. In all the other natural divisions of Bombay State, excepting Greater Bombay which was also under-enumerated in 1931, the urban population exhibited an accelerating rate of increase at

URBAN POPULATION
successive censuses from 1921. It is possible that the decade 1931-41 did in fact mark the most rapid growth phase in the development of the urban areas of Gujarat but the underenumeration of 1931 magnified and distorted the true growth rate.
The decade 1941-51
Except for Gujarat every natural division recorded a higher percentage increase in its urban population during 1941-51 than was recorded at any previous census. In the area of Bombay, Saurashtra and Kutch the most remarkable growth of ,the urban population occurred during the past ten years. In part this was due to the expansion of population in the areas that had always been urban; in part to the promotion of roral areas to the urban category because of increased population or th~ acquisition of urban characteristics during the decade, as the following table shows:-
No. of places which were]
towns at the No. of No. of 1941 census No. of)
towns at new towns and were towns at States. the 1941 atthe 1951 no longer this
Bombay
Saurashtra
Kutch
census. census. towns· at census. this census.
2
320
60
9
3
207
26
2
28 499
85
10
• The few demotions were mainly due to the abolition of lImall lIlunicipalitiea.
The urban population of Nasik district increased by 11.(,2 per cent, of Poona by 111·.( per cent, and of Abmednagar by 80· 9 per cent. The urban population of Thana district increased by 335·7 per cent. In addition to the rapid residential and industrial development during the decade of the talukas of Thana, Borivali and Kalyan, parts of which are now virtual suburbs of Greater Bombay, SO·5 per cent of the displaced population from Pakistan were found in Thana district, principally at the new township of Ulhasnagar in I:alyan taluka.
The exclusively urban and hence unrepresentative natural division of Greater Bombay increased by 67· 5 per .cent during the past
decade, as compared with 30·1 per cent in 1931-41, and only O· 6 per cept in 1921-31 when there was almost certainly some underenumeration. The stimulus to industry given by the war intensified and magnified the tendency to large urban concentrations.
In olden times the cities tended to be political and religious capitals. . Some of these, such as Bijapur, have declined in population and importance in modem times. Commerce and industry in those days tended to follow the fiag, and the fall of a dynasty spelt the ruination or eclipse of a city. Other political capitals of the past, like Poona and Ahmedabad, survived and grew, either because they were situated at cross-roads of communications, or because some great modem industry grew up on the site of the former capital. The development of world trade and the growth of modem industry caused the spectacular development of Bombay2 from a fishing village to a great international sea port and manufacturing city.
The growth of the population of all cities during the past decade was especially rapid.s None of the eight cities of Bombay State recorded an increase of population of less than 30 per cent. Poona recorded the highest increase of 72·9 per cent, Bombay 67·5 per cent, Kolhapur 47·1 per cent, Baroda 37·9 per cent, Hubli 35·7 per cent, Ahmedabad 33·3 per cent, Sholapur 30·3 per cent, and Surat SO'2 per cent. Because of the very heavy under-enumeration that tpok place in Ahmedabad and Surat in 1931 the increase or decrease figures relating to the decades 1921-31 and 1931-41 must be discarded as inaccurate. The figures of other cities, which are reasonably authentic, illustrate the fact that since the slump of 1931 the cities have experienced very
!l The municipal motto of Bombay 1s .. Urbs prima in In<lli," the first city in India. The distinction Is one that she has long disputed with Calcutta. In 1891 Bombay had a greater population than Calcutta, a position which she lost in 1901 Clnd 1911, regained in 1921, and lost again in 1931 and 1941. In 1951 Greater Bombay had 2,839,270 inhabitants as compared with Calcutta's 2,548,677. The municlpal boundaries of Bombay were extended during the decade 1941-51 to include the rapidly developing Suburban district, (area ~'50 square miles) the population of which rose from 205,285 in 1941 to 510,250 in 1951. The population of the old city of Bombay (area 25'34 square miles) rose from 1,489,883 in 1941 to 2,329,020 in 1951. Even beyond the present boundaries of Greater Bombay much urban industrial development Is taking place in the adjacent talukas of Thana district.
S Subsidiary Table 3·5.

URBAN POPULATION S5
heavy increases in population, and that the increase during the past decade has been especially rapid. •
In Subsidiary Table 3·4 the increase in the urban population has been analysed according· to the size class of the towns at successive censuses. The figures for Bombay State suggest that the bigger the town or city the greater the rate of subsequent expansion. As a whole the classes of towns with populations of 50,000 and above gained most rapidly during the past thirty years. In other words, heavy urbanisation is itself a factor making for even greater urbanisation. The small market towns of 10,000-20,000 inhabitants are tending to stagnate, if not actually decay, and to be surpassed in their growth rate by urban centres of more monolithic proportions. This trend is best brought out by taking the towns and cities of particular size classes at the 1951 census, seeing what the 1941 population of these places was, and working out the increase. This insulates the figures from the effect of promotion of a town to a higher class during the decade.
Bombay Stau
No. of 1951 1941 Percent-towna of population population aae
Size dass of town this .ize 01 towns of town. incretls<! accordillllto 1951 centua. clue at .hownin ahownin 1941-51.
1951 column 2. column 2. centus·
2 3 4 5
100.000 and over 8 5.086,705 3,290,508 54'6 50,000-100,000 17 1,140,965 734,564 55'3 20,000- 50.000 51 1,-«7,292 1,085,930 33'3 10,000- 20.000 ioo 1,357,326 1,083.138 25'3 5,000- 10,000 284 1,987,199 1,6«,468 20'S Under 5,000 39 150,853 141.165 6'9
Trade, industry, administrative functions, and communication facilities are factors determining the growth of cities. The political function has tended to lose its importance, and to be oyershadowed by trade and industry. It has not entirely lost its vitality, however. The population of Rajkot, the capital of the new State of Saurashtra, increased by 99 per cent, from 66,353 to 132,069, during the decade 1941-51. Though spectacular, this performance was perhaps less impressive, because more artificial, than that of a great urban industrial centre like Bombay, during the decade.
SECTION 4
MOVEMENT
Of the three factors that influence population growth-fertility, mortality, and migration
the last named is of particular importance in
the case of the urban population. The growth of the .urban population was particularly rapid during the past two decades, and most of it was
due to immigration.
The census question on birth place asked whether the person was born in the district of enumeration. There is therefore no information about whether a person was born in the town where he was enumerated, except in those
rare cases where the town constituted a separate census district. A continuous series of figures exists of the population who were born outside Bombay City, because Bombay City has always been a separate census district. The boundaries of the City were extended during the past
decade to fonn Greater Bombay. In the table below the figures up tb 1941 are for the
A. (Bk) H 91-50
old area of the City; the figures for 1951 are for the present area of Greater Bombay:-
Bombay City.
1872 1881 1891 1901 1911 1921 1931 1941 Greater Bombay. 1951
Percentaie of population who were born
outside.
68·9 72·2 75·0 76·6 80·4 84·0 75·4 72·6
72·1 Despite the fact that it takes a high number
of migrants to outweigh the greater number of births that inevitably take place in a large city area, the percentage of the out-born in Greater Bombay has shown no real diminution in the past twenty years.
Males predominated in the immigration stream to Greater Bombay in 1951. The greater the distance travelled the more masculine the sex ratio was. There were only

URBAN POPULATION
178 females to every 1,000 males among the persons _ enumerated in Greater Bombay in 1951 who were born in other states in India, a more masculine sex ratio than was recorded in this category at any of the past four censuses. The reason lay in the great increase in male migration to Greater Bombay from non-contiguous states like Uttar Pradesh during the past decade. Among persons born in Pakistan, however, there were 758 females per 1,000 males. The immigration was of whole families displaced by partition. In the case of persons born in Portuguese territories there were 666 females per 1,000 males in 1951, a distinct improvement in the sex ratio as compared with previous censuses.4 This indicates that male immigrants from these areas are tending to bring their families with them.
In addition to an improvement in the sex ratio, save in the case of long-distance migrants from other states in India, the population of
non-adults in the population of Greater Bombay has shown a progressive tendency to rise. Persons below 20 yearS' of age comprised 30·5 per cent of the population of Bombay City in 1921, 34·3 per cent in 1931, and 35·3 per cent in 1941. In Greater Bombay in 1951 such persons comprised 37·7 per cent of the population. If these trends continue one may expect to find Greater Bombay developing a more normal sex and age distribution during coming decades.
The fact that the Migration-cum-Registration error of the urban population in Bombay State as a whole exhibited in columns 29, 30 and 31 o~ Subsidiary Table 3·3 has risen steeply from 12·0 in 1921-30 to 18'0 in 1931-40, and 39·5 in 1941-50 suggests that most of the urban population increase has been due to increased immIgration from outside, particularly during the past decade.
SECTION 5
Bmms
In urban areas where there are municipalities, the municipal authorities make arrangements for the registration of births and deaths. The municipal acts under which the municipalities of Greater Bombay, Ahmedabad and Poona have been constituted penalise the failure to register births and deaths. In most of the smaller municipalities the registration of births and deaths has been made legally obligatory under by-laws passed for the purpose. But despite laws and by-laws, it is doubtful whether any major municipality instituted a single prosecution for failure to report a birth during the past decade. " The registered birth rate has always been lower among the urban population than among the rural population as the following table shows :-
Mean decennial birth rate registered In Bombay StateS
1941-50. 1931-40. 1921-30. Rural population .. 35·8 40·2 39·8 Urban population .". 26·1 27·9 23·2
It is natural that the birth rate among the urban population should be lower than among
4408 females per 1,000 males in 1921 and 493 in 1931, figures which also included French territories, an unimportant category. For 1941, there were no data.
5 Subsidiary Table 3'3.
the rural population, since birth rates are computed with reference to total population, and married women in the reproductive age groups form a smaller proportion of the total urban population than they do of the total rural population.
The birth rates among the urban population show a greater fluctuation from one natural division to another than would be accounted for by the fact that the sex'ratio in some urban areas is heavily adverse to females. The following table compares the mean birth rate (registered) during 1941-50 among the rural and urban population of the component natural divisions of 'Bombay State :-
Mean decennial birth rate ( registered) 1941-50
Natural Division.
Creater Bombay (Urban) Cujarat Deccan Northern Deccan Southern Konkan
Rural population.
36·2 •. 37·8
39·1 28'8
Urban population.
23·1 36·2 28·0 24·8 16·9
A major part of the difference is probably due to the fact that the recording of births is most defective in the smaller urban areas, and in the Deccan Southern Division and the Konkan where the registered urban birth rates were lowest there were very few large and efficient

URBAN POPULATION 37
municipalities like Greater Bombay, Ahmed:' abad and Poona.6 Hence, probably, the lower
• urban birth rates in these areas. It might be argued that in Gujarat, by contrast with the Deccan Southern Division, the urban population
is more perfectly assimilated, and hence the tendency for women to return to villages for their confinements would not be so pronounced as in the more rural Deccan Southern Division.
The standard of literacy in Gujarat is also
higher and that might make for a greater utilisation of urban maternity home and medical facilities, and for more complete registration of births because people there better appreciate the value of a birth certificate. It 'is doubtful, however, whether any of these speculations are correct. The major reason for the differences
in the urban birth rates as between the various natural divisions is probably the presence or absence of an efficient municipal machinery to
register births and deaths.
The Rural-Urban differential in fertility
Because the standard of efficiency of regis
tration of births varies greatly not only from one state to another but within different parts of the same State it is necessary to check any conclusions about differences in fertility· by independent means. One way is to measure the ratio of childre~ aged 0-4 at the census to
the married women in the reproductive age group 15-45. This child-woman ratio consti
tutes a fair index of relative fertility. The ratio has been worked out on the basis of
(1) children 0-4 per 1,000 women 15-45 and
6 The 1951 census population figures are the best starting-off point for computing recent birth rates in Greater Bombay, Ahmedabad and Poona cities. In 1951 the birth rate was 27·8 in Greater Bombay, 29'5 in Poona, and 41·9 in Ahmedabad. Married women in the reproductive age group 15-45 constituted 15'1 per cent of the total population in Greater Bombay, 17·6 in Poona, and 14·1 in Ahmedabad in 1951. The figures suggest that the level of births registration in tbese three cities is fairly high. The percentage of the total registered births that took place in maternity 'homes was 80'0 in Greater Bombay, 70,0 in Poona and 31·0 in Ahmedabad. Ahmedabad has always returned a very high birth rate, for reasons that are not quite clear.
( 2) children 0-4 per 1,000 married women 15-45 and the results are shown below :-
Children 0-4 per 1,000 women 15-45 at the 1951 Census
Total Rural. Urban . • Bombay State 630 646 593
Greater Bombay , 516 516 Bombay Gujarat Divi-
sion 631 646 590 Bombay Deccan North-
ern Division 659 664 645 Bombay Deccan South-
ern Division 670 688 620 Bombay Konkan Divi-
sion 575 571 592
Children 0-4 per 1,000 married women 15-45 at the 1951 Census
Bombay State 757 759 752 Greater Bombay 671 .1 671 Bombay Gujarat Divi-
sion 763 758 780 Bombay Deccan North-
ern Division 766 762 776 Bombay Deccan South-
ern Division 814 828 773 Bombay Konkan Divi-
sion 706 695 763
The results in both cases suggest that a ferti
lity differential does exist between rural and urban ,areas, and between a large urban area like Greater Bombay and other urban areas.
But the important point is that the difference is much smaller than in other countries.7 The
lower fertility of the urban areas does not therefore have much lowering effect on the
general birth rate or population growth. One reason why the cities have not inaugurated a general decline in the birth rate is probably that the city dweller is as often as not a transplanted villager. Most fertility studies in India have suggested that the differences in married
fertility according to income and occupation are
very slight. Fertility is inversely correlated with social position in India as elsewhere, but
the explanation lies primarily in the operation of an indirect institutional form of birth controlthe ban on widow re-marriage.
7 In .. The Population of India and Pakistan" at page 71 Professor Kingsley Davis compares the retio of children 0-4 per 1,000 women aged 15-39 for India. Chile and the U. S. A. The Indian region had a much lower rural-urban differential than either Chile or the United States.

38 URBAN POPULATION
SECTION 6
DEATHS
The cremation or interment of a body requires formal penmsslOn itt the larger municipal areas, but not in the rural areas. The chances of deaths being :qlore completely registered than births in most urban areas are consequently better. The available statistics, which are admittedly faulty and incomplete, suggest that the death rate in rural areas is higher than in urban, as indeed are the birth rates. A high birth rate and a bigh death' rate tend to go together. In the table below the mean decennial death rates registered during the decade 1941-50 in the rural and urban population of Bombay State have been shown :-
Registered mean decennial death rates during 1941-50
Natural Division. Rural. Urban. Greater Bombay 16·0 Gujarat 24·7 24·9 Deccan Northern 25·6 20·8 Deccan Southern 26·8 16·2 Konkan 19·9 9'5
As in the case of the birth rate, we find that where the recorded rural death rate was high e.g. the Deccan Southern Division the recorded urban death rate tended to be low, whereas in Gujarat there was very little
difference between the urban and rural rates. The higher recorded urban death rate in the more heavily urbanised natural division of Gujarat is probably attributable to deaths in urban areas being better recorded there than in other divisions. The low recorded figure for the Konkan seems primarily due to defective registration.
The figures for Greater Bombay are of considerable ~terest. The recorded IIlean decennial death rates have shown a steady decline during the past three decades. The recorded deatIi rate was 28·1 in 1921-30, 21·1 in 1931-40, but only 16·0 during the past decade. This result was not due merely to a decline in the efficiency of registration of births and deaths. The number of registered births has gone steadily up, but the number of registered deaths was less during the decade 1941-50 than in 1921-30, despite a greatly increased population. No relaxation in the formalities attending the disposal of a body has taken place. All the evidence points to a greatly improved survival rate, not only in Greater Bombay, but throughout the State as a whole, though the vital statistics are unfortunately so deficient that they fail to bring out the true extent of the trend.
SECTION 7
LIVELmOOD PATTERN
There are two ways in which the urban livelihood pattern can be examined. One can start with the eight broad livelihood classes adopted at the census and see what proportion of each livelihood class lived in the towns; or one can take the urban population and examine the distribution of the livelihood classes within it. Subsidiary Tables 3·6 and 3·7 analyse the pattern from these two aspects.
Proportion of each livelihood class who lived in towns '"
6·7 per cent of livelihood class I, 6·9 per cent of livelihood class II, and 10· 3 per cent of livelihood class III in Bombay, Saurashtra and Kutch lived in towns. On the other hand as much as 23·7 per cent of livelihood class IV lived in towns, though this latter livelihood class was of course a tiny category that constituted only 1· 5 per cent of the total urban population.
In Satara South 18·1 pet' cent of livelihood class I in the district lived in towns; in East Khandesh 13·5 per cent. More than one-fifth of the persons who belonged to livelihood class II in the districts of Satara South, Kaira and East Khandesh lived in towns. In the districts of Satara South, Poona, Kolhapur, East Khandesh, Dharwar and Kaira between 28·3 and 16·3 per cent of the cultivating labourers (livelihood class III) lived in towns.
Livelihood class IV (non-cultivating owners of land) was in some ways a class apart. About a quarter of the total population belonging to livelihood class IV lived in towns. In East Khandesh, Kolhapur and Kaira districts more than 40 per cent of the adherents of this class lived in towns; in Thana, Kanara, Satara South, West Khandesh, Belgaum and Sorath districts more than 30 per cent. High percentages of this livelihood class living in the towns are suggestive of urban absentee landlordism.

URBAN PQPULATION 39
The percentage of all the agricultural classes who lived in towns was fairly small. The percentage of the ~on-agricultural classes who lived in towns was, on the other hand, considerable. It was highest in livelihood classes VI (Commerce) and VII (Transport). 76·9 per cent of all those in livelihood class VI and 73·2 per cent of all those in livelihood class VII lived in towns. For livelihood class V (Production other than cultivation) and livelihood class VIII (Other services and miscellaneous sources) the percentages were lower and roughly equal, 61·6 and 62·9 per cent.
The percentage gf livelihood class V who lived in towns did not vary very much from one natural division to another. In Saurashtra and Kutch, however, it was noticeably lower. The fact that a relatively small percentage of livelihood class V in Saurashtra lived in towns suggests that the urbanisation of Saurashtra was not the result of industrial growth. Its urbanisation was high, but its industrialisation was superficial. Districts like Ahmedabad and Sholapur on the other hand which contained industrial centres had very high proportions of their livelihood class V in the towns.
Break-up of the urban population into livelihood classes
A more illuminating picture of the urban livelihood pattern is obtained if one examines the urban population separately, and sees the proportion of each livelihood class within it. Only 14·9 per cent of the urban population of Bombay, Saurashtra and Kutch belonged to the agricultural classes. The cultivation of owned land (livelihood class I) outranked in importance the other three agricultural livelihood classes as a means of livelihood of the urban population. 8· (5 per cent of the urban population were cultivating owners. In many ways this is a surprisingly high percentage. The reason is that many of the places that qualified for inclusion in the urban category were in reality over-grown villages, and the manner of life in small towns and villages does not diller greatly, both being predominantly dependent on agriculture.
In the Deccan Southern Division as much as 33·2 per cent of the urban population belonged to the agricultural classes; in the Deccan Northern Division the percentage was 23·7 while in Gujarat it was as little as 12·9. The percentage of the population of the Deccan Southern Division and of
Gujarat who were urban on the census definition was roughly equal, but the difference in the character of the urbanisation is clearly brought out in the livelihood patterns.
Some districts had exceedingly high proportions of their urban population in one or other agricultural livelihood class. About twofifths of the urban population of Satara South belonged· to livelihood class I (cultivation of owned land); in the districts of Satara North, Belgaum, East Khandesh and Mehsana about one-fifth. In Kanara district, where livelihood class II was very important, as much as 16·1 per cent of the urban population belonged to it. In the two districts of East Khandesh and Dharwar, 11· 6 and 10·0 per cent of the urban population belonged to livelihood class III (cultivating labourers). In Kanara, Kaira, Kolaba and Belgaum districts more than 4 per cent of the urban population belonged to class IV (landlords). The urbanisation of those natural divisions and districts in which sizable proportions of the urban population belonged. to the agricultural classes was obviously of a fairly superficial character.
85·1 per cent of the urban population of Bombay, Saurashtra and Kutch belonged to the non-agricultural classes. 31· 9 per cent of the urban population belonged to livelihood class VIII (Other services and miscellaneous sources), 28· 2 per cent to livelihood class V (production other than cultivation), 19·7 per cent to livelihood class VI (Commerce), and 5·3 per cent to livelihood class VII (Transport). The livelihood class pattern of the urban population has been analysed below according to natural divisions.
Greater Bombay Greater Bombay, an exclusively urban area,
was distinguished by its overwhelmingly nonagricultural bias. Only 0·55 per cent of its population was dependent on agricultural means of livelihood, as compared with 35·0 per cent in livelihood class V (production), 31· 7 per cent in livelihood class VIII (Other services and miscellaneous sources), 24·3 per cent in livelihood class VI (Commerce) and 8·4 per cent in livelihood class VII (Transport). The factors that distinguished these results from those of oth~r natural divisions were the relatively higher percentages found under Commerce and Transport, and the fact that the percentage belonging to livelihood class V exceeded that belonging to livelihood class VIII.

40 URBAN POPULATION
Production, commerce and transport are the distinguishing badges of a metropolitan port and manufacturing city.
Gujarat The urban population of Guiarat was more
heavily non-agricultural than that of any other natural division in Bombay State. Only 12·9 per cent of the urban population of Guiarat belonged to the agricultural classes. The proportion of the urban population of Guiarat who belonged to livelihood class V was 32·3 per cent, a much heavier proportion than that. returned by any other natural division. Ahmedabad district returned 47·3 per cent of its urban population in that class, the highest figure returned by any district. In Surat district 37·7 per cent of the urban population belonged to livelihood class V. The cities of Ahmedabad and Surat are important centres of the CQtton textile industry.
Deccan N orthem Division The Deccan Northern Division had 23·7 per
cent of its urban population in the agricultural classes. 24·2 per cent of the urban population belonged to livelihood class V .(Production), a percentage roughly cOIl)parable to that returned by other divisions, 'excluding Guiarat. and Greater Bombay where the percentages were very high. In Sholapur district 39· 9 per cent of the urban population belonged to livelihood class V. The city of Sholapur is an impol\ant centre of cotton textiles manufacture. Only 14·9 per c::ent of the urban population of the Deccan Northern Division belonged to livelihQod class VI (Commerce) as compared with 20·8 per cent in Guiarat. The difference between the Guiarat and Deccan Northern Division figures for Production and Commerce is fundamental. Manufacture and commerce are the true hallmarks of an industrialised urban society. As much as 42·4 per cent of the urban population of Poona district belonged to livelihood' class VIII (Other services). Poona is a Government headquarters and an important educational centre~ Its livelihood class structure may be usefully compared with Ahmedabad. In Ahmedabad the emphasis was on industry; in Poona on administration and education.
Deccan Southern Division The Deccan Southern Division had 33· 2 per
cent of its urban population in the agricultural classes, a higher percentage than any other
natural division. The towns of the Deccan Southern Division were less truly urban in character than elsewhere. Slightly over a quarter of the urban population of Biiapur district, where handloom weaving is an important industry, and of Dharwar district, which contained the city of Hubli, were found in livelihood class V (Production). The proportion of the urban population of the Decca!! Southern Division who belonged to livelihood class Vln ·(Other services) was small.
Konkan The natural division of the Konkan had 16·4
p.er cent of its urban population in the agricultural classes, a smaller proportion than in the Deccan but higher than in Guiarat. Except in Thana district, the proportion of the total population who lived in towns was small. It is a coastal diviSion, and its moderately sized towns are separated by fairly heavy distances. For that reason the proportion of the urban population who belonged to livelihood class VII (Transport) was higher than in the Deccan and Guiarat, a feature which it shared with Kutch and Saurashtra. The proportion of the urban population of the Konkan who belonged to livelihood class VIII (Other services) was high-36· 4 per cent. Only Saurashtra and Kutch returned equally high figures.
Saurashtra and Kutch Saurashtra and Kutch returned only 11· 5
and 9·4 per cent of their urban populations as belonging to the agricultural classes. In Kutch the distinction between urban and rural seemed to be most definitely drawn. Only a fifth of the total population was urban, but it was more genuinely non-agricultural in its pursuits than the urban population of other natural divisions.
In Kutch and Saurashtra almost a quarter of the urban population belonged to livelihood class VI (Commerce), a figure very much akin to Guiarat. The urban centres of Guiarat, Saurashtra and Kutch are obviously important trading centres. The proportions found in livelihood class V (Production) were, however, much lower than in Guiarat, which contained the great industrial city of Ahmedabad. The percentage of the urban population in livelihood class VII (Transport) was fairly high in both Saurashtra and Kutch, notably in Halar district, which contained the port of Jamnagar. The urban centres are separated by great

URBAN POPULATION 41
distances, making for heavier proportions of the urban population in the Transport livelihood class.
The most striking departure, however, was in respect of livelihood class VIII (Other services and miscellaneous sources). As much as 40·8 per cent of the urban population belonged to this livelihood class in Kutch and 36·4 per cent
in Saurashtra. Where the percentage of the urban population in this livelihood class was high, particularly when compared with the proportion engaged in Production, it suggests that the towns are important administrative rather than industrial centres, and such in general was the position in Saurashtra and Kutch.
SECTION 8
CONCLUDING REMARKS
The definition of what constitutes an urban community has not been uniform from one country to another, but the definition of
. " urban" in India, though a multiple one, has remained substantially unchanged since 1891. It has therefore been possible to measure the change in the rural-urban. distribution of population. A notable development of the past decade was the very rapid increase in the proportion of the population who were urban. 17·3 per cent -of the population of Bombay State were urban in 1872 and 23· 6 per cent in 1941. In 1951 the proportion rose sharply to 31·1 per cent.
The growth of towns and cities has been characteristic of modern industrial society, and the change from hand to power driven machine production largely motivated it. However it was principally the impetus given to urban development by the war that led to the very substantial rise in the percentage of the popula-
A (Bk) H 91-6
tion of Western India who were urban during the past decade. It seems unlikely that the coming decade will witness a continuing rise in the urban proportion at the same rapid rate as during 1941-51. The 1931 urban percentage was, for instance, slightly below that of 1921 in Bombay State, but the slump of 1930 was largely responsible.. Another slump could arrest the growth of urbanisation, particularly as such a large proportion of the urban population are recent immigrants, but if the experience of other countries is any guide, then the growth of urbanisation seems likely to continue.
It was the largest urban areas-the citiesthat grew most rapidly during the past ten years. This trend seems likely to continue and, if it does, the problem of housing and maintaining essential services to this increasing urban population is likely to assume considerable importance.


CHAPTER IV
t++++++++++++++++++++++++++++++++++++++++++++++++++++++++++++++++++++~
AGRICULTURAL CLASSES ++++++++++++++++++++++++++++++++++++++++++++++++++++++++++++++++++++++
SECTION 1
PRELIMIl'lARY REMARKS
The 1951 census laid great stress on the collection of economic data. The definitions, the information collected, and the way in which the information was treated have been different at each census since 1921.
The most important variations are summarised below:-
1921 classification schemG In 1921 a distinction was drawn between
.. actual workers" and .. dependants." The
.. actual workers" combined in a single category what in 1951 were two-self-supporting persons and earning depenBants. The "dependants" of 1921 were equivalent to the .. non-earning dependants" of 1951. The .. dependants" of 1921 were classified under the occupational groups of the persons on whom they were dependent, a feature that disappeared at the 1931 and 1941 censuses, but was revived in 1951.
1931 classification scheme A distinction was drawn in 1931 between
.. principal earners" and .. dependants." The latter could be either .. working dependants" or .. non-working dependants."" Working dependants" were classified according to their actual occupations as were" earners." .. Nonworking dependants" were equivalent to the .. dependants " of 1921 and the " non-earning dependants" of 1951. In 1921 these nonworking dependants were classified under the occupational groups of the persons on whom
A (Bk) H 91-6a
they were dependent, but in 1931 this was not done. In his 1921 Bombay Report, L. J. Sedgwick had remarked: " While it is certainly desirable to know how many actual workers there are, and how many non-workers, out of the total population, the advantage of knowing which occupations support more and which less of the non-workers is dubious."1 Dropping this classification meant, however, that for 1931 non-working dependants cannot be classified except by inference .
1941 classification scheme
There was no complete tabulation of the results of the 1941 census, though economic tables were prepared on the basis of a small sample for Bombay province. As in 1931, there was no means of knowing the particular occupation to which non-earning dependants looked for their maintenance.
1951 c'ia.ssification scheme
In 1951 every person was assigned to one of the thre~ categories-self-supporting, earning dependant, or non-earning dependant. In the case of an earning dependant the occupation that gave him an income was recorded, but in assigning persons to livelihood classes dependants, whether earning or non-earning, were classified according to the principal means of livelihood of the persons on whom they were dependent.
1 Census of India, 1921, Bombay Report, page 206.

44 AGRICULTURAL CLASSES
The agricultural classes, according to the 1951 classification scheme, consisted of the following four livelihood classes :
I-Cultivators of land, wholly or mainly owned; and their dependants.
II-Cultivators of land, wholly or mainly unowned; and their dependants.
III-Cultivating labourers; and their dependants.
IV -Non-cultivating owners of lartQ; agricultural rent receivers; and their dependants.
The agricultural livelihood class divisions adopted at the census of 1951 marked a new departure. In Bombay Presidency in 1901 R. E. Enthoven attempted to .. arrive ~t a more detailed classification of the population living on the land." The attempt was made at the abstraction stage and was unsuccessful. L. J. Sedgwick2 in 1921 attempted to secure the information from the very beginning, by asking enumerators to distinguish "cultivating owners" and "cultivating tenants" within the category of "ordinary cultivators." The 1921 attempt in Bombay bore a strong resemblance to the agricultural classifications adopted in 1951 on an all-India basis.
In 1931 the working agricultural population was assigned to various categories. When an attempt is made, however, to compare the relative size of the four agricultural classes adopted in 1951 with the results of previous censuses we find great variations. For one thing, the four-fold agricultural classification of 1951 was new; for another definitions and emphasis changed from one census to another.
It is essential that differences in the definitions and economic classification schemes be grasped, lest false comparisons of the 1951 results with those of previous censuses be attempted, the process amounting t() an attempt to compare things that are not really comparable. There are, however, some comparisons that can be made.
Comparative size of Agricultural and Non-Agricultural Classes in
1921 and 1951
In 1921, when (non-earning) dependants were classified according to the occupations of the persons on whom they were dependent, and what in 1951 would have been called earning dependants were classified according to their own means of livelihood, 64·4 per cent
2 Census of India, 1921, Bombay Report, page 216.
of the population of Bombay State belonged to the agricultural classes. If a similar method of classification had been followed in 1951, then 61· 2 per cent3 of the population would have been classified as belonging to the agricultural classes.
N on-earning dependency at successive censuses
The effect of the differences in definitions and classification had a fairly small effect on the returns of total (or non-earning) dependency. After the 1931 and 1941 censuses the load of non-earning dependency in the total population was measured. There was no separate distribution among the agricultural and non-agricultural classes. The information is contained in the table below:-
Percentage of the population of Bombay State who were returned as non-earning
dependants at the census of
1921.
Agricultural Classes 36'3
Non-Agricultural Classes 18'6
Total for both agricultural and non-agricultural classes 54'9
.. n.a." means" not available."
*Based on 2 per cent sample figures.
1931. 1941. 1951.
n.a· n.a· 33'5
n· a. n. a. 23'7
59'2 59'8* 57-2
These figures suggest that the load of nonearning dependency in the total population was lower ill 1921 than in 1951. They also suggest that the load of non-earning dependency in the case of the agricultural classes has gone down since 1921 and in the non-agricultural classes has increased. Much however depended on the enumerator as to whether he counted women, children, and old persons who assisted in a family occupation as earning or non-earning dependants. The rise in the load of non-earning dependency among the nonagricultural classes in 1951, while it may be a fact, accentuated by increased urbanisation and education, and lesser opportunities for women and children in cities and towns to assist in family occupations, may on the other hand merely be due to a variation in the standards applied by enumerators at different, censuses. One thing seems clear, however,
3 61. 5 per cent of the population of Bombay State belonged to the agricultural classes on the 1951 method of classifying earning dependants according to the occupation of the persons on whom they were dependent.

AGRICULTURAL CLASSES 45
that the load of non-earning dependency in the total population" belonging to all livelihood classes has varied between 55 and 60 per cent, partly due to shifting definitions, and the 1951 figure of 57·2 per cent is very close to average.
The Working Population
Such of the population as were not noneaming dependants and were not pensioners, etc. were economically active. They· were either, to adopt the 1951 terminology, selfsupporting persons, or earning dependants. The proportion of the total population of the area that now comprises Bombay State, who were retumed as self-supporting persons or earning dependants was 45·1 per cent in 1921, 40·8 per cent in 1931, 40·2 per cent in 1941,
and 42·8 per cent in 1951. In the table below, the percentage of actual workers in the agricultural and non-agricultural classes at the censuses of 1921, 1931 and 1951 has been shown. The 1941 results, based on a small sample, have been omitted.
Percentage of the working population (i.e. self-supporting persons and earning
dependants) in Bombay State who belonged to the agricul-
tural and non-agricultural classes
1921. Agricultural Classes ... 28' I Non-Agricultural Classes ... 17'0
Total 45'1
1931. 26'6 14'2
40'8
1951. 27'7 15 '1
42'8
Note.-In the table, earning dependants have been classified as agricultural or non-agricultural according to their own declared means 01 livelihood.
SECTION 2
AGRICULTURAL POPULATION RATIOS; SELF-SUPPORTING PERSONS AND DEPENDANTS; SECONDARY MEANS OF LIVELIHOOD OF AGRICULTURAL
CLASSES.
Roughly three-fifths of the population of Bombay, Saurashtra and Kutch were returneo at the census of 1951 as belonging to the agricultural classes, in the sense that they were self-supporting persons who derived their principal means of livelihood from agriculture, or were dependants, earning or non-earning, of such persons.
There was considerable regional variation in the percentages of -the population returnee:! as belonging to the agricultural classes. In Bombay, Saurashtra and Kutch as a whole 59·7 per cent of the population belonged to the agricultural classes. The ratio was highest in the Deccan. In the Deccan Southern and the Deccan Northern Divisions of Bombay State 73·2 and 69· 1 per cent of the population belonged to the agricultural classes; in the Konkan 64·7 per cent; while in Gujarat the percentage fell to 62·2. In Saurashtra and Kutch it was only 46· 6 and 42·0 per cent. In the exclusively urban natural division of Greater Bombay only 0·5 per cent of the population belonged to the agricultural classes.
Excluding Greater Bombay, which was not representative, there were 27 districts in Bombay State. In 15 out of 27 districts in Bombay State the agricultural classes comprised more than 70 per cent of the general population. In five out of ten districts in the natural
division of Gujarat less than 70 per cent of the population belonged to the agricultural classes. These districts and the percentages which the agricultural classes comprised in the total population of each district were Ahmedabad (29·5 per cent), Amreli (53·3 per cent), Mehsana (61·0 per cent), Surat (61·2 per cent) and Baroda (63·0 per cent).
The ratio of the agricultural classes to the non-agricultural classes was very high in the Deccan. In 9 out of the 13 districts of the Deccan Northern and Southern Divisions the agricultural classes comprised more than 70 per cent of the population. The four districts where the agricultural classes comprised less than 70 per cent of the population were Poona (52·3 per cent), Sholapur (62·6 per cent), Dharwar (69·1 per cent), and Nasik ( 67 . 3 per cent).
Quite clearly one of the main factors aHecting 'the ratio of the agricultural to the nonagricultural classes in Bombay State was the extent and nature of the urbanisation in a district. The districts of Ahmedabad, Po on a, Surat, Baroda, and Sholapur contain the cities of the same name, while Dharwar district contains the city of Hubli.
In Saurashtra and Kutch the agricultural classes formed less than 50 per cent of the population of every district, except Sorath, where they formed 51 per cent. It has been

46 AGRICULTURAL CLASSES
elsewhere suggested that one of the factors making for a high ratio of non-agricultural to agricultural population in the districts of Saurashtra and Kutch was the wide distances that separated the population centres. The other factor operative in the case of Saurashtra was the fact that it is relatively highly urbanised.
The agricultural population consisted of selfsupporting persons, non-earning dependants, and earning dependants. The definitions should be kept in mind. A self-supporting person was defined as a person who was in receipt of an income sufficient to maintain himself or herself. Anyone who was not a self-supporting person in this sense was a "dependant." A dependant might be either an earning dependant or a non-earning dependant. The test was whether he secured a regular income, even though it might be small. The income might be in cash or in kind. Where the income which he secured was not sufficient to support him that person was an earning dependant." A person who did not earn any income in cash or in kind was a "non-earning dependant."
Enumerators were asked to avoid the mistake of recording only the head' of the household as self-supporting; and of recording all women automatically as non-earning dependants. Women might be earning dependants or even self-supporting.
The definitions and the method of classification of the economic data were unique to the 1951 census. The definitions and methods of classification of the economic data have always been subject to variation from one census to another, with the result that complete comparability of the data with those of earlier censuses has been rendered impossible. Such comparisons as were possible have already been made, and commented on in the preceding section of this cbapter, where the 1951 method of classification has been explained. The analysis which follows of the dependency pattern: of the agricultural livelihood classes confines itself to two comparisons-firstly, a comparison of the dependency pattern of the agricultural as compared with the non-agricultural classes; and secondly, a comparison of the dependency pattern of the agricultural classes in the area under report as compared with India as a whole.
Dependency pattern of Agricultural as compared with Non-Agricultural Classes in Bombay, Saurashtra
and Kutch (1951 Census) The main difference between the .dependency
pattern of the agricultural as compared with the non-agricultural classes in Bombay, Saurashtra and Kutch lay in the fact that the agricultural classes had a higher proportion of earning dependants. The main reason is that women and children in agricultural families assist in cultivation. The opportunities for women and children to assist in such nonagricultural occupations as blacksmiths, carpenters and potters are obviously much more limited. Many of the non-agricultural occupations are primarily men's jobs and require adult skills.
The table below shows the relative proportions within the agricultural and non-agricultural classes of self-supporting, earning dependent, and non-earning dependent persons in Bombay, Saurashtra and Kutch at the census of 1951 with, for comparison, the figures for India as a whole. Dependency pattern of Agricultural and N on
Agricultural population: Percentage within the two classes of self-supporting,
earning dependent and non-earning dependent
persons
Self- Earning Nonsupport- depen- earning
ing dants. depen-persons. dants. 123
Bombay, Saurashtra and Kutch
Agricultural Classes 24'5 21'3 54'2
Non-Agricultural Classes 30'3 7'8 61'9
India
Agricultural Classes .. 28'7 11'7 59'6
Non-Agricultural Classes 31'3 5'9 62'8
Self-supporting persons
Total of cols. 1,2
and 3.
4
100
100
100
100
The proportion of the agricultural classes in Bombay, Saurashtra and Kutch who were returned as self-supporting was smaller than the figure for India as whole. It is rather difficult to understand why this should be so. It is possible that the lower percentage by comparison with elsewhere was due to a reluctance, despite the special mention of women in the instructions to enumerators, to concede to women a full Hedged self-supporting status,

AGRICULTURAL CLASSES 47
and a tendency to return them as earning dependants. There was on the whole surprisingly little variation in the percentage of self-supporting persons as between one district and another. Certainly the lower proportion of self-supporting persons in the area under report cannot have been due to women being returned erroneously as non-earning dependants, since the reported extent of non-earning dependency in the agricultural clas:;es was lower in Bombay, Saurashtra and Kutch than in India as a whole.
In the three States of Bombay, Saurashtra and Kutch 12,181,089 males and 12,084,905 females were returned as belonging to the agricultural classes. There was much less disparity in the sex ratio in the agricultural classes as compared with the non-agricultural classes. The inequality in the sex ratio was pronounced in the case of the urban population who followed non-agricultural pursuits.
In the agricultural classes there were 5,158,2] 0 self-supporting males, and 796,350 self-supporting females. 42·3 per cent of the men in the agricultural classes were returned as self-supporting, but only 6·6 per cent of the women. For males and females combined the proportion of the agricultural classes who were returned as self-supporting was 24·5 per cent.
Earning dependants
Earning dependency was a very prominent feature of the agricultural is compared with the non-agricultural classes in India as a whole, because women participate in cultivation to an extent that is not possible in most nonagricultural pursuits. The main difference between dependency in Bombay, Saurashtra and Kutch and the rest of India was the higher proportion of earning dependants in the agricultural classes in Western India. One is fortified in one's belief that the dependency pattern of the agricultural population as returned at the census was accurate by the fact that the Agricultural Labour Enquiry conducted by the Labour Department of the Government of India in sample villages reached a similar conclusion about the extent of earning dependency in rural areas in Bombay State. The Enquiry suggested that "helpers formed roughly the same percentage as earners." The '" helpers" of the Agricultural Labour Enquiry approximated to the .. earning dependants" of the census enquiry, and the "earners" of the
Agricultural Labour Enquiry to the "Selfsupporting persons" of the census enquiry.4
At the census 1,375,918 IJ?ales and 3,786,522 females in the agricultural classes in Bombay, Saurashtra and Kutch were returned as earning dependants. 11· 3 per cent of the men in the agricultural classes were returned as earning dependants, while as much as 31· 3 per cent of the women in the agriculhrral classes were so returned. Excluding nonearning dependants, and taking self-supporting women and earning dependent women in the agricultural classes together, only one out of five was returned as self-supporting, while the other four were returned as earning dependants. Earning dependency was thus a category of great importance for women in the agricultural classes.
N on-earning dependants
There were 5,646,961 males and 7,502,033 females returned at the 1951 census of Bombay, Saurashtra and Kutch as non-earning dependants in the agricultural classes. 46·4 per cent of the males and 62·1 per cent of the females in the agricultural classes were returned as non-earning dependants. For males and females combined the percentage was 54·2.
The results of the Agricultural Labour Enquiry in Bombay State suggested that slightly less than half of the rural population of Bombay State were (non-earning) dependants. The slight difference between the two results, in so far as it was not due to the difference between a sample count and a complete count, may have been due to a difference in definitions and interpretation of the instructions. However carefully instructions are framed a subjective element may always enter into the returns. At the Agricultural Labour Enquiry all old persons and ,children who assisted in cultivation may have been returned as "helpers" i.e. earning dependants, whereas at the census there may have been a disposition to rehlrn thetn as non-earning dependants. The working contribution of very young and very old
• The National Sample Survey returned 27· 0 per cent of the rural population of \Vest India as earners, 21'5 per cent as earning dependants, and 51·5 per cent as non-earning dependants (General Report No.1, page 14).
At the census of 1951 in Bombay, Saurashtra and Kutch 25·0 per cent of the rural population were returned as self-supporting, 20'3 per cent as earning dependants, and 54·7 per cent as non-earning dependants.

48 AGRICULTURAL CLASSES
persons may have been regarded by the census enumerators as too casual and intermittent to warrant their assignment to the earning dependent category.
The recorded extent of non-earning dependency in the agricultural classes in Bombay State showed a slight decline by comparison with 1921. It does not seem, therefore, as though there had been any greater disposition to return earning dependants as non-earning dependants at the census of 1951 by comparison with previous censuses. As compared to most other States in India, excepting chiefly Madhya Pradesh and Rajasthan, the extent of nonearning dependency recorded at the census in Bombay State was below the average for India as a whole. This result suggests that in Western and Central India the load of non-earning dependency in the agricultural classes was less than elsewhere. In part this reHects a real difference in social and working habits. Women and children in Western India in the agricultural classes do assist in cultivation, and hence were quite properly recorded as earning dependants.
Secondary means of livelihood of self-supporting persons
It is. far from infrequent for an agriculturist to have a secondary means of livelihood. Thus a cultivator of owned land might also cultivate land on lease, or might engage in cattle breeding or fishing or some other subsidiary occupation. Information was collected at the 1951 census about the secondary means of livelihood of self-supporting persons who had more than one means of livelihood. At past censuses also information about such subsidiary means of livelihood was collected and tabulated, but practically all past census reports refer to the rapid deterioration in the quality of this return, principally because the enumerator could be as lazy as he liked in filling it up in the confident expectation that this particular feature of his work would not be checked by the supervisor. The error was considered to take the form of under-statement of the frequency of a subsidiary means of livelihood. Thus at the 1931 census of Bombay Presidency only 6·7 per cent of the principal earners ( self-supporting persons) returned a subsidiary means of livelihood. There was a startling improvement at the 1951 census inasmuch as 14· 8 per cent of all the persons returned at the census in Bombay, Saurashtra and Kutch as self-supporting returned a secondary means of livelihood, and even this
figure may have understated the frequency of a secondary means of livelihood. The agricultural classes, not unexpectedly",had more often a secondary means of livelihood than the nonagricultural classes.
Perhaps because of the poor response in the past to the question on subsidiary means of livelihood the tabulation of the data on secondary means of livelihood after the 1951 census was restricted to the generic classification of these secondary means of livelihood into eight livelihood classes without further detail. Thus in the case of self-supporting persons who returned their secondary means of livelihood as fishing, weaving, wood-cutting or gur-making all these secondary means of livelihood were classified at the tabulation stage under livelihood class V (Production other than cultivation).
There were 5,954,560 self-supporting persons in the agricultural classes in Bombay, Saurashtra. and ,Kutch, of whom 4,847,358 had no secondary means of livelihood, while 1,107,202 returned a secondary means of livelihood. In other words 20·0 per cent of the agricultural classes were self-supporting persons without a secondary means of livelihood, while 4·5 per cent were self-supporting persons with a secondary means of livelihood. The following table brings out the position :-
Number of self-supporting persons belonging to
Livelihood class I (Cultivation of owned land) 3,745.668
Livelihood class II (Cultivation of
unowned land) 925,586
Livelihood class III (Cultivating
labourers) 1,066.049
Livelihood class IV (Non-cultiva-
ting owners of land) 217,257
Total for all agricultural livelihood
classes 5,954,560
Number of personsm
column I who retumeda secondarY
means of livelihood.
2
697,565
235.477
105,038
69,122
1,107,202
Percentage of self-supporting
persons who had a secondary
means of livelihood to the total number of
self-supporting persons in the
livelihood class. 3
18·62
25·«
9·85
31·82
18-59

AGRICULTURAL CLASSES 49
For slightly less than half the self-supporting persons in the agric(\ltural classes who returned a secondary means of livelihood agriculture provided the secondary means of livelihood, the balance deriving their secondary means of livelihood from non-agricultural activities, though the specific activities within the nonagricultural categories from which they derived their secondary means of livelihood were unfortuI}ately not tabulated. There were 1,107,202 self-supporting persons in the agricultural classes with a secondary means of livelihood. These persons comprised 4·5 per cent of the persons belonging to the
. agricultural classes. In order of importance, Other services and miscellaneous sources, Production other than cultivation, Agricultural labour, and the Cultivation of unowned land were the most important subsidiary occupations. The following table shows the distribution of this figure of 1,107,202 according to the secondary means of livelihood returned, and the percentage which these secondary means of livelihood constituted of the figure of 4·5 per cent mentioned above.
Secondary means of livelihood returned by self-supporting persons in the agricultural
classes
Livelihood Class. Persons. Percentage.
I-Cultivation of owned land ... 101,407 0'4 II-Cultivation of unowned land 183,598 0'7
III-Agricultural labour 195,474 0'8 IV-Non-cultivating owner-
.ship of land other th~~
42,328 0'2 V-Production
cultivation 211,406 0'9 VI-Commerce 96,210 0'4
VII-Transport 37,479 0" VIII-Other services and
miscellaneous sources 239,300 1'0
Total 1,107,202 4'5
Secondary means of livelihood of earning dependants
In the case of an earning dependant, i.e. a person who had an income, but an income which was not sufficient to maintain himself or herself, the principal means of livelihood was taken to be the same as that of the selfsupporting person on whom he, or she, was dependent. The occupation that gave an earning dependant his own income was taken to be his secondary means of livelihood. If the wife of an agricultural labourer engaged in basket- making but did not earn enough from basket-making to maintain herself she was
A (Bk) H 91 .... 7
treated as an earning dependant within livelihood class III (Agricultural labourers and their dependants), whose secondary means of livelihood was derived from livelihood class V (Production other than cultivation). It would not be possible to say from the data tabulated that the particular secondary means of livelihood was basket-making; merely that the secondary means of livelihood was within livelihood class V.
At the 1951 census of Bombay, Saurashtra and Kutch 21· 3 per cent of the persons who belonged to the agricultural classes were returned as earning dependants. Among earning dependants in the agricultural classes females heavily outnumbered males. Almost three out of four earning dependants in the agricultural classes were women. The amount of declared earning dependency among persons belonging to the first three livelih90d classes was almost equally high. The particular means of livelihood which gave the earning dependants in the agricultural classes an income has been shown below. The table brings out the great importance of employment as agricultural labour as a means of livelihood of earning dependants in the agricultural classes. The distribution of the percentage of 21· 3 earning dependency exhibited by the agricultural classes, according to the actual occupations of the earning dependants, has been shown in column 3 of the table :-
Secondary means of livelihood of earning dependants in the agricultural
classes
Livelihood Class.
I-Cultivation of owned land ...
Number of earning
dependants in agricultural
classes. deriving ownmcome
from means of livelihood shown in colwnn I.
2
2,362,832 II-Cultivation of unowned land 626,216 III-Agricultural 'abour '" 1,764,604 IV-Non-cultivating ownership
ofland 29,378 V-Production other than
cultivation 145,317 Vl-COmmerce 49,189 VII-Transport 9,375 VlH-Other services and
miscellaneous sources 175,529
Total 5.162,440
Proportion which means of livelihood
shown in column I formed of
percentage of 21'3
3
9'7 2'6 7"3
0'1
0'6 0'2 0"
0'7
21'3

50 AGRICULTURAL CLASSES
SECTION S
RELATIVE PROPORTIONS OF DIFFERENT AGRICULTURAL CLASSES; CORRE· LATED TO DISTRmUTION OF LAND IN AGRICULTURAL HOLDINGS OF
DIFFERENT SIZES
Four agricultural livelihood classes were recognised at the census. Enumerators were asked to assign persons in the agricultural classes to one or other of the following liveli-hood classes:- -
I-Cultivators of land wholly or mainly owned; and their dependants.
II-Cultivators of land wholly or mainly unowned; and their dependants.
III-Cultivating labourers; and their dependants.
IV-Non-cultivating owners of land; agricultural rent receivers; and their dependants.
Livelihood Class I-Cultivators of owned land
Of these four livelihood classes, class I (cultivating owners) exceeded in importance all the others in the sense that the cultivation of owned land was the declared principal means of livelihood of more persons than any other agricultural livelihood class. 66·6 per cent of the population belonging to the agricultural classes in Bombay, Saurashtra and Kutch were either cultivating owners or the dependants of cultivating owners. In Bombay State as much as 75·5 per cent of the agricultural classes in the Deccan Northern Division were returned as belonging to livelihood class I. The reason for the 'high percentage in this livelihood class in the Deccan Northern Division lay in the prevalence of the ryotwari system of tenure in that area. Only in the Konkan Division in Bombay State did the percentage of the agricultural classes re,turned as belonging to livelihood class I fall below 60 per cent, the reason being the great importance of livelihood class II in the Konkan. In Saurashtra the percentage of the population returned as belonging to livelihood class I was as high as 70·3 per cent. In Zalawad district the percentage was only 51· 7, but in Madhya Saurashtra and Sorath it was over 70. These Saurashtra figures seem very high, when one considers that girasdari abolition had not been effected by the time of the census. It may be that people returned themselves according to what they shortly expected to be, the effect of the legislation being antiCipated.
Livelihood Class II-Cultivators of unowned land
The next largest agric~ltural class was livelihood class II (cultivators of unowned land and their dependants). They comprised 16·0 per cent of the agricultural population in Bombay, Saurashtra and Kutch. The Konkan was the only natural division in Bombay State where livelihood class II was more important than livelihood class I. 45·9 per cent of the agricultural classes in the Konkan were returned as belonging to livelihood class II., In Kolaba and Kanara, where cultivation by tenants was very important, more than half the agricultural classes were returned as belonging to livelihood class II. Pilst census data supported the same conclusion.5 The Deccan Northern Division returned only 5·7 per cent of the agricultural classes as belonging to livelihood class II, the reason being that livelihood class I in that pre-eminently ryotwari area was of out~tanding importance. In Gujarat 15·8 per cent of the agricultural classes belonged to livelihood class II.
Livelihood Class III-Cultivating labourers
14·1 per cent of the agricultural classes in Bombay, Saurashtra and Kutch were returned at the census of 1951 as 'belonging to livelihood class III (cultivating labourers and their dependants). This meant that the seIfsupporting persons who were returned as cultivating labourers, and the dependants of such persons, were numerically slightly less important than the adherents of livelihood class II, and much less important than the adherents of livelihood class I.
In East Khandesh district as much as 29·9 per cent of the agricultural classes belonged to this livelihood class. No other district returned as high a percentage in this livelihood class. The Agricultural Income Enquiry conducted by the Bureau of Economics and Statistics of the Government of Bombay reached a similar
." .... \lVhen the figures for the Konkan only are examined, and compared with those of the other divisions .... it will be found that in that region alone the cultivator is in far the greater number of cases a tenant,"-Census of India, 1921, Bombay Report, p. 217. '
•

AGRICULTURAL CLASSES 51
conclusion about the importance of agricultural labour as a means of livelihood in East Khandesh district. ~ The census enquiry suggests that in 1?roach and Surat districts, 28 . 7 and 23 . 9 per cent of the agricultural classes belonged to livelihood class III. The reason for these high percentages is to be sought in the "Hali" system which used to exist in these two districts. The position of the Halis, described as "agricultural serfs" in the 1921 report,6 where the nature of the HaH system then prevailing was fully discussed, has now been ameliorated. A sizable proportion of the agricultural population of the districts of Broach and Surat, however, belong to livelihood class III.
As much as 20·7 per cent of the agricultural population of the Deccan Southern Division were returned as belonging to livelihood class III, Dharwar district in particular returning 26·2 per cent, a proportion exceeded only by Broach and East Khandesh districts. It has been earlier suggested that the reason for the comparatively high proportion of agricultural labourers in the districts of the Deccan Southern Division lay in the fairly extensive alienations of Government land in the form of inams in the districts of that division and, to a lesser extent, in Sholapur. To this might be added in the case of Dharwar the fact that there are irrigation facilities in the western half of the district. The factors making for high percentages of livelihood class III in the agricultural population would seem to be-the land tenure system prevailing in the area, the cultivation of a cash crop such as cotton which stimulates a demand for agricultural labour, and the existence of irrigation facilities, which seem to have a similar effect. The Collector of Gohilwad district in Saurashtra attributed the importance of livelihood class III in that district to the existence of irrigation facilities.
6 Census of India, 1921, Bombay Report, pps. 219-222. Prior to June 1948 the Halis and their families in
Surat district used to render forced labour in return for a loan taken from their masters, usually for marriage. There was no legal sanction to the system which was abolished in June 1948 by an amicable settlement between Kheduts and Halis which laid down yearly and daily wage rates. The Collector of Surat reported in April 1953 that the system no longer existed. Most labourers then worked on daily wages and some were on yearly wages. The Collector of Broach also reported in April 1953 that work on daily wages was now the universal practice in the district and that with Backward Class awakening the Hali system of forced labour had disappeared.
A (Bk) H 91-7a
Agricultural class III constitutes the landless rural proletariat. The low recorded ratio of livelihood class III to class I in the agricultural population is, therefore, a factor of great economic and social importance. This comment must not be allowed, however, to obscure the fact that mixed means of livelihood are far from uncommon, and that work as an agricultural labourer was a very important declared means of livelihood in the case of earning dependants belonging to the agricultural livelihood classes.
Livelihood Classes I, II and III compared
The Agricultural Labour Enquiry conducted in sample villages of Bombay State by the Labour Department of the Government of India corroborated that the cultivation of owned land outclassed in importance other agricultural livelihood classes combined in Bombay State as a whole. It also corroborated the outstanding importance of livelihood class I in the districts of the Deccan Northern Division, and the great importance of livelihood class II in the districts of the Konkan. The actual percentages assigned differed, partly because the result of a sample \vill differ from that of a complete count, partly because the definitions employed varied, but principally, perhaps, because of the phenomenon of the mixed agricultural class. Many cultivators of unowned land (livelihood class II) and agricultural labourers (livelihood class III) have also land of their own, and a man who might appear to an investigator to be principally dependent on agricultural labour at an Agricultural Labour Enquiry, might at the general population census return himself as an ownercultivator (class I). Having regard to these considerations, the consistency of the conclusions to be drawn from the results of both the Census and the Agricultural Labour Enquiry seem more remarkable than the differences. More than half the agricultural classes in Bombay State wete principally dependent for a livelihood on the cultivation of owned land, the figure being highest in the Deccan Northern Division . of Bombay State, and lowest in the Konkan where tenant cultivation, the cultivation of unowned land, was of great importance.
Livelihood Class IV-Non-cultivating owners of land
Class IV, the last agricultural livelihood class, had the smallest proportion of adherents. 3 . 27 per cent of the agricultural classes in

52 AGRICULTURAL CLASSES
Bombay, Saurashtra and Kutch were noncultivating owners of land, agricultural rent receivers, and their dependants. The proportion was highest in the Deccan Southern Division where the alienations of Governm.ent lands in the form of inams were most extensIve, the figure being highest in Dharwar. In the districts of Ahmedabad, Kaira, Dharwar, Sat~ra North, Zalawad and Gohilwad the proportlOn exceeded 4·5 per cent. There seemed to be no one single factor making for a high or low percentage in this livelihood class.
Distribution of land according to size of holdings
A "holding" means the area of Ian? h~ld by one person who is primarily responsIble for the payment of land revenue :? Govern~ent. Such a landholder is called an occupant or, in the case of inam lands, a "superior holder." Every year a holding sheet for each landhold~r is compiled by the village accountant In
Bombay State. The purpose for which i.t .is prepared is fiscal. The holding sheet exhIbIts the liability of each khatedar to pay land revenue to Government.
Once in five years a statement based on the holding sheets is prepared for every taluka and district which gives information in regard to the number of landholders and the areas held by them, according to the size ?f their ~oldings, arranged according to SIX magmtude groups-up to 5 acres; over 5 and up to 15 acres; over 15 and up to 25 acres; over 25 and up to 100 acres; over 100 and up to 500 acres; and over 500 acres. The information contained in the statement has been utilised to prepare Subsidiary Table 4·1.
While preparing the quinquennial statement of holdings, the holders are classified. into three classes: A-those who cultivate land themselves, with or without the help of hired labour; B-those who do not cultivate land themselves but supervise and direct the cultivation by labourers or farm servants; and C-those who receive rent but do not directly or indirectly take part in cultivation. These classifications differ from the census agricultural livelihood classes. They relate only to landholders, persons on whom the primary responsibility for the payment of land revenue rests. Quite obviously, therefore, tenants, i.e. cultivators of unowned land, belonging to livelihood class II, would not figure in these returns. Again, the principal means of livelihood of a person who was a class C landholder
might not necessarily be agriculture. He might be a merchant or he might be working in a city or town. 0
The data compiled have another defect from the point of view of those who expect a return based primarily on fiscal considerations to yield economic data, or who look to such returns to cross-check the census data. The data do not reveal how many pieces of land make up a holding of given size. It does not therefore indicate the extent of sub-division and fragmentation. It is, however, a readily ascertainable fact that a holding rarely consists of one compact block of land. Though it may consist of whole survey numbers, it frequently consists of portions of survey numbers, and the several fragments may be at different places. The data compiled therefore give no information about how many holdings are economic to operate.
The concept of an economic holding is that it should support the cultivator and his family without his having to rely on an income beyond the holding. Ordinarily a holding of 15 acres of dry land or 5 acres of irrigated land is regarded as constituting an economic holding in Bombay State, but other factors may operate.
Even though a holding might satisfy the area test of an economic holding, it might consist of a large number of fragments not of "standard area," the minimum size below which it is definitely unprofitable to cultivate. Sub-division and fragmentation of holdings are evils- which are now sought to be remedied by consolidation. The Bombay Prevention of Fragmentation and Con~olidation of Holdings Act was passed in 1947, but by March 1953 consolidation schemes had been enforced only in 77 villages.
Despite the limItations and incompleteness of the data Subsidiary Table 4·1 does bring out some interesting features. P~haps the most important point brought out by the data is tlle extent to which small holdings of up to 5 acres dominated the picture. Slightly more than half the total number of holdings in Bombay State seem to consist of less than 5 acres. About 80 per cent of the holdings, comprising about 40 per cent of the occupied land, consisted of holdings of 15 acres or under. About 18 per cent of the total number of landholders held about 50 per cent of the occupied agricultural land in holdings of between 15 and 100 acres. At first sight these figures suggest a severe unbalance and inequality in the distribution of land. However,. the figures

AGRICULTURAL CLASSES 53
must be treated with caution. To say that 18 per cent of the total number of landholders held about 50 per cent of the occupied agricultural land is not the same as saying that these 18 per cent controlled half the wealth, because land held in the I,lame of one individual head of a joint family might belong legally to several sharers who cultivated their shares separately and were returned at the census as separate households. More investigation of the holding pattern from a socio-economic rather than a fiscal viewpoint is necessary.
One of the purposes for which Subsidiary Table 4·1 was prepared was to see whether there was any correlation between the relative proportions of different agricultural classes as returned at the census and the distribution of land in agricultural holdings of different size classes. There was no invariable connection between the size of the holdings and the livelihood class break-up. But, as one might expect, whenever there was a considerable proportion of large or very large holdings there was also either a large propo£!:ion in class II (Thana, Kolaba, Kanara and Belgaum), or in class III (Sholapur, Bijapur, Dharwar and Baroda), or in both ( Surat) . The detailed figures have been shown in the table below;-
Percentage of the occupied land held in large or very large holdings, and percentage of
agricultural classes returned as belong-ing to livelihood class II (cultivation
of unowned land) and class III (cultivating labourers)
Large Very Total Percentage of agricul ... holding. large columns 2 lural clas ••• returned as
10010 [Iolding. and 3 beloJllring to District. 500 over 500 Large and
acres. acres. very large Livelihood Livelihood holding •. elas.H. CIa .. !lI.
2 4 5 6
&mbauState Data Data 15 'S 14 '7 incomplete incomplete
Baroda S'7 3'4 12'1 13'S 19'7
Surat 11'0 0'3 11'3 IS'I 23'9
Kolhapur 6'5 4'7 11'2 16'6 9'1
Shol.pur 13'3 1'0 14'3 7'4 23'S
Belsaurn S'2 2'1 10'3 19'7 15'0
Bij.pur 13'0 3'1 16"1 9'5 22'0
Dharwar S'O 4'9 12'9 13'1 26'2
Thana 23'S 7'6 31'4 44'S 14'4
Kolaba 18'9 7'8 26'7 56'S 4'4
KanaTIl 13'1 1'5 14'6 55'7 14'1
What constituted a large or very large holding would, of course, depend on the pattern of cultivation in particular areas. Ten acres of good garden or irrigated land would be
immensely more valuable than a hundred acres of medium land in a tract where the rainfall was precarious. For purposes of this analysis, however, we have treated a holding of over a hundred acres and up to 500 acres as a large holding, and a holding of over 500 acres as a very large holding. In 10 out of 23 districts in Bombay State for which data were available more than 10 per cent of the cultivable area was held in large or very large holdings of over 100 acres. The table shows the percentage of the total occupied land held in large or very large holdings in these 10 districts and the percentage of the agricultural livelihood classes who were returned at the census as belonging to livelihood class II ( cultivators of unowned land and their dependants) and livelihood class III (cultivating labourers and their dependants). In the districts where large or very large holdings constituted more than 10 per cent of the cultivable area, above-average percentages of the agricultural population were returned as belonging to either livelihood class II or III.
Large and very large holdings were a marked feature of the Konkan and the Deccan Southern Division. Almost one-fifth of the land in the Konkan districts was comprised in large or very large holdings. In Thana and Kolaba as much as 31· 4 and 26·7 per cent of the occupied land was held in holdings of over 100 acres. This explains why such a large proportion of the agricultural population of these two districts belonged to livelihood class II (cultivators of unowned land). In the three districts of the Deccan Southern Division 13· 6 per cent of the land was held in holdings of over 100 acres. In Bijapur district the percentage was as high as 16· 1. The rainfall there is precarious, however, as it is in Sholapur in the Deccan Northern Division where 14·3 per cent of the land was comprised in holdings of over 100 acres. In Kolhapur and Belgaum, where much of the land is irrigated and the rainfall is more assured the proportion of the agricultural classes who were returned as belonging to livelihood class II, exceeded the proportion returned as belonging to livelihood class III. It may be that irrigation facilities or an assured rainfall stimulate the tendency to lease out land in districts where much land is held in large holdings, while in districts where the large holdings are dry crop the tendency is to cultivate through hired labour. At best however these are speculations.

54 AGRICULTURAL CLASSES
The reason why more than ten per cent of the land in Belgaum, Bijapur, Dharwar and Sholapur districts was comprised in large holdings is to be sought in the alienations of Government lands in these districts. In Kolhapur the jaghirs of the former Kolhapur State probably accounted for the growth of large holdings. The figures suggest that in Kolhapur and Belgaum the jaghirdars and inamdars lease out land to tenants, while in Sholapur, Bijapur and Dharwar many of the big landholders appear to cultivate personally with the assistance of hired labour.
Only in two out of the six districts in Gujarat for which data were available was more than 10 per cent of the land held in large or very large holdings. These districts were Baroda,
where 12·1 per cent of the land was held in holdings of more than 100 acres, and Surat where the percentage was 11· 3. Both districts returned fairly high proportions of the ag!iculhJral classes as belonging to livelihood class III (cultivating labourers and their dependants).
SECTION 4
CULTIVATORS OF LAND WHOLLY OR MAINLY OWNED; AND THEm DEPENDANTS
Cultivators of land wholly or mainly ownedmore colloquially, owner-cultivators or cultivating owners-and their dependants, constituted the largest and most important livelihood class at the census. 8,126,228 males and 8,036,546 females in Bombay, Saurashtra and Kutch were returned as belonging to it. Within this livelihood class of cultivating owners 3,359,027 males and 386,641 females were returned as self-supporting persons; 3,837,812 males and 5,110,501 females as non-earning dependants; and 929,389 males and 2,539,404 females as earning dependants.
Self-supporting persons in livelihood class I
In the area of Bombay, Saurashtra and Kutch 23·2 per cent of the cultivators of owned land were returned as self-supporting persons. Self-supporting males were almost nine times as numerous as self-supporting females in this livelihood class. The number of earning dependent females in this livelihood class was, however, high, indicating that a sizable proportion of the women in this livelihood class do work.
There was very little difference between the proportions of self-supporting persons returned by the two largest natural divisions-Gujarat and the Deccan Northern Division. The proportions were 22·6 and 22·8 per cent respectively. Among individual districts in Bombay State Banaskantha, Dharwar, Bijapur, Kolaba and Kanara returned more than 25 per cent of the population belonging to this livelihood class as self-supporting. The reason in most cases
was that a higher proportion of women was returned as self-supporting than in other districts, suggesting that in these districts women in the families of cultivating owners participated fully in the cultivation of the family land. It is always possible of course that enumerators in these districts were more generous about conceding self-supporting status to women than elsewhere, so that it is perhaps unwise to be precipitate about drawing conclusions from the percentage of self-supporting persons considered in isolation. Kutch State returned a very high percentage of self-supporting persons in livelihood class I.
Almost one out of five ~self-supporting persons in livelihood class I retui'ned a secondary means of livelihood, a means of livelihood next in importance to the cultivation of owned land. 23·2 per cent of the adherents of livelihood class I were self-supporting persons, and 4·3 per cent were self-supporting persons with a secondary means of livelihood. The cultivation of unowned land was the most important secondary means of livelihood returned. The following summarises the position:-
Total percentage of self-supporting persons in livelihood class I.
(i) Self-supporting persons without a secondary means of livelihood.
( ii) Self-supporting persons with a secondary means of livelihood.
Percentage.
23·2
18·9
4·3

AGRICULTURAL CLASSES 55
This among in the
percentage of 4·3 was distributed the ot.'er seven livelihood classes
proportions specified below:
II-Cultivation of unowned land.
III-Employment as cultivating labourer.
IV-Rent on agricultural land. V-Production other than culti-
Vl:!-tion.
Percentage. 1·1
0·8
0·2 0·8
VI-Commerce. 0·4 VII-Transport. 0·1
VIII-Other services and miscel- 0·9 laneous sources.
No data were abstracted about the precise occupations within the livelihood classes which constituted the secondary means of livelihood of self-supporting persons with more than one means of livelihood. It is a fair guess that in Dangs district where 22·3 per cent of the population were self-supporting persons, and the very high proportion of 5·5 per cent were self-supporting persons with a secondary means of livelihood in livelihood class V the particular occupation within that livelihood class' was forestry and wood-cutting.
Non-earning dependants in livelihood class I
The percentage of non-earning dependency recorded among those belonging to livelihood class I was 55·4. In Bombay State the highest proportions were returned from the districts of Ahmedabad, Broach and Surat, Satara North and. Ratnagiri, while the percentage of non-earning dependency returned from Banaskantha, Panch Mahals and Thana districts was lowest. The inference would be that in those districts in which the extent of non-earning dependency was low, women and children in the families of cultivating owners worked to a greater extent than elsewhere, and that is quite possibly descriptive of the state of affairs in Banaskantha, Panch Mahals and Thana districts. In the case of all the districts from which a high percentage of non-earning dependency was returned, however, the converse would not necessarily hold good because many of these districts were districts from which considerable emigration takes place, leaving a large number of dependent children and old persons particularly, probably, in this livelihood class.
Saurashtra and Kutch returned lower percentages of non-earning dependants than
Bombay State. Within the natural divisions of Bombay State the recorded percentage of non-earning dependency showed little variation from one natural division to another. The fact that the figures exhibited great consistency suggests that, given a set of instructions, the interpretation of these instructions by enumerators in different parts of the State was remark-ably uniform. .
As between the first three livelihood classescultivating owners, cultivating tenants and agricultural labourers-cultivating owners returned the highest proportion of non-earning dependants, and agricultural labourers the lowest. In terms of social and economic status cultivating owners, cultivating tenants and agricultural labourers represent a descending gradation, and it was therefore not surprising that the load of non-earning dependency should be heavier in the families of ownercultivators than in those of agricultural labourers, with cultivating tenants occupying a middle position. The literacy statistics exhibited a similar trend. The two circumstances seem connected. Among cultivating owners a higher percentage of non-earning dependency was probably recorded because there would not be the same economic pressure on children and old persons to work. Children could go to school, and the very old could rest from their labours.
Earning dependants in livelihood class I Three out of four of the earning dependants
in this livelihood class were women. Earning dependants constituted 21· 5 per cent of the persons belonging to livelihood class I. The occupation which gave these earning dependants an income was tabulated. Almost two-thirds of this proportion of 21· 5 per cent-14·0 per cent-were engaged in the same means of livelihood as the persons on whom they were dependent, indicating the extent to which wives and chil~en and other members of the family assisted in the cultivation of the family land. 5·5 per cent of livelihood class I were earning dependants whose means of livelihood was employment as cultivating labourers, and the remaining 2 per cent of earning dependants were distributed among other livelihood classes. The proportion of earning dependants belonging to this livelihood class whose own occupation was agricultural labour was high in the districts of Baroda, Broach, and East Khandesh in Bombay State and Halar and Sorath in Saurashtra. The Agricultural Labour

56 AGRICULTURAL CLASSES
Enquiry Committee found that in Bombay State the "number of helpers per family was highest in the families of agricultural land
owners and tenants who required the help of the members of their families for cultivating their farms."
SECTION 5
CULTIVATORS OF LAND WHOLLY OR MAINLY UNOWNED; AND THEIR DEPENDANTS
In the States of Bombay, Saurashtra and Kutch 1,963,570 males and 1,920,941 females were returned as belonging to livelihood class II, cultivators of land wholly or mainly unowned, and their dependants. Within this class of cultivating tenants 834,662 males and 90,924 females were returned as self-supporting persons; 902,532 males and 1,155,461 females as non-earning dependants, and 226,376 males and 674,556 females as earning dependants.
The number of persons returned as belonging to this livelihood class was much smaller than the number returned as belonging to livelihood class I, yet the relative proportions returned as self-supporting persons, non-earning dependants, and earning dependants, did not differ markedly from livelihood class I, nor did the relative proportions of women to men within each sub-class.
Self-supporting persons in livelihood class II 23·8 per cent of the adherents of livelihood
class II in Bombay, Saurashtra and Kutch were returned as self-supporting persons, a slightly greater proportion of self-supporting persons than was returned by livelihood class I (cultivating owners). In the Konkan, where cultivating tenants constituted a more important livelihood class than cultivating owners, 24·9 per cent of those belongir~g to livelihood class II were returned as self-supporting persons. Among individual districts Kanara and Kolaba in the Konkan returned high percentages of self-supporting persons in this livelihood class.
About one quarter of the self-supporting persons in livelihood class II returned a secondary means of livelihood, a means of livelihood next in importance to their principal occupation as cultivating tenants. The proportion of selfsupporting cultivating tenants who returned a secondary means of livelihood was higher than was the case with self-supporting cultivating owners. 23·83 per cent of the persons belonging to livelihood class II were selfsupporting cultivating tenants, and 6·1 per cent were self-supporting persons with
a secondary means of livelihood. The cultivation of owned land was the most important secondary means of livelihood returned. The following summarises the position :-
Total percentage of self-supporting persons in livelihood class II. (i) Self-supporting persons
without a secondary means of livelihood.
(~elf-supporting persons , with a secondary means
of livelihood.
Percentage.
23·8
17·7
6·1
This figure of 6·1 per cent was distributed among the other seven livelihood classes in the proportions specified below:-
I-Cultivation of owned land. III-Employment as cultivating
labourer. IV-Rent on agricultural land. V-Production other than culti-
vation.
Percentage.
1·7 1'3
0·1 1·1
VI-Commerce. 0·3 VII -Transport. 0·4
VIII-Other services and miscel- 1· 2 laneous sources.
Total 6·1
Non-earning dependants in livelihood class II
53·0 per cent of those belonging to livelihood class II were returned as non-earning dependants. The load of non-earning dependency was thus slightly lighter than among cultivating owners (livelihood class I), but heavier than among agricultural labourers.
Among the natural divisions of Bombay State the lowest proportion of non-earning dependants was found in this class in the Konkan where only 50·6 per cent were nonearning dependants. The proportion was highest in Gujarat with 55· 8 per cent, followed by the Deccan Northern Division with 54·9 per cent and the Deccan Southern Division with

AGRICULTURAL CLASSES 5i
53·9 per cent. This feature of there being a greater load of non-earning dependency in the districts of Gujarat was common to most of the agricultural livelihood classes. The census result in this respect corroborates the finding of the Agricultural Labour Enquiry Committee that it was only in this area .. that manpower was not utilised fully." The reason may lie in the greater fertility of the soil in many of the districts of Gujarat. The richer the agriculture the less the necessity for children and old persons to work. The higher literacy of Gujar~t is a connected feature. A higher proportion of children undergoing education would make for a greater load of non-earning dependency. The districts with the highest proportion of non-earning dependants in livelihood class II in Bombay State were Mehsana ( 62·1 per cent), Kaira (61, 2 per cent), and Amreli (61, 4 per cent). Thana district, where cultivating tenants formed an important class, returned the lowest percentage of 45·1. •
Saurashtra and Kutch returned lower percentages of non-earning dependants in liveli-, hood class II than Bombay State, as it did in the case of all the first three livelihood classes. If the standards applied by enumerators were the same there as in Bombay the inference would be that women and children in Saurashtra and Kutch assist in cultivation to a greater extent than in Bombay State.
Earning dependants in livelihood c'la.rs II Three out of four of the earning dependants
in this livelihood class were women, a proportion almost identical to that returned by livelihood class I (cultivating owners).
Earning dependants constituted 23·2 per cent of the cultivating tenant livelihood class. The occupation which gave these earning dependants an income was tabulated. Slightly more than half of this proportion of 23·2 per cent-IS per cent-were engaged in the same occupation as the persons on whom they were principally dependent, viz., the cultivation of unowned land. Most of them were obviously wives and children who assisted in the cultivation of the unowned land. e·5 per cent were. employed as cultivating labour~rs. In the districts of Baroda, Broach, and Surat in Gujarat; West Khandesh and East Khandesh in the Deccan Northern . Division, and Halar and Sorath in Saurashtra the proportion of earning dependants of cultivating tenants whose secondary means of livelihood was employment as cultivating labourer was very high, and exceeded the proportion who assisted in the cultivation of unowned land. The balance of 4·7 per cent wen~ divided among other livelihood classes, none of any great importance.
Earning dependants in livelihood classes I and II thus exhibited the same features. Roughly a quarter of the total numbers belonging to these livelihood classes were earning dependants. Three out of four of them were women. About half the total number of earning dependants engaged in the same occupation as the person on whom they were principally dependent, a quarter were employed as agricultural labourers and the other quarter derived an income from other livelihoods.
SECTION 6
CULTIVATING LABOURERS; AND THEm DEPENDANTS
The data compiled after the 19S1 census suggested that in the agricultural classes more than half the population were agricultural labourers. This was an extraordinary result for a ryotwari area, and was at variance with the result of the 1921 census. Since the result was also belied by the results of the 1941 and 1951 censuses one is forced to conclude that the 19S1 census data in this respect were wrong.
At the 1951 census 1,732,685 males and 1,692,341 females in Bombay, Saurashtra and Kutch were returned as cultivating labourers ElDd their dependants, a smaller number than was returned as belonging to livelihood class II,
A (Bk) H Ql-8
II. result which should not be allowed to obscure the great importance of this livelihood class. 824,659 males and 241,390 females were returned as self-supporting cultivating labourers; 710,942 males and 920,228 females were returned as non-earning dependants, and 197,084 males and 530,723 females were returned as earning dependants.
The features which chiefly distinguished these figures from those of cultivating owners and cultivating tenants were the higher proportion of self-supporting persons among agricultural labourers, and the lower proportion of non-earning dependants.

58 AGRICULTURAL CLASSES
Self-supporting persons in livelihood class III
In the area of Bombay, Saurashtra and Kutch 51·1 per cent of those belonging to the agricultural labour livelihood class were returned as self-supporting persons, a percentage which should be compared with the proportions of 23·2 and 23·8 per cent returned for livelihood classes I and II. Self-supporting males were about nine times as numerous as self-supporting females among cultivating owners and cultivating tenants, but they were only three times as numerous among cultivating labourers. The higher proportion of' selfsupporting persons among agricultural labourers as compared with other agricultural livelihood classes was therefore clearly due to. the greater number of women in the families of agricultural labourers for whom agricultural labour was a full-time occupation.
The proportion of self-supporting persons in this livelihood class showed considerable variation as between different areas. In Kutch 42·3 per cent of the adherents of livelihood class III were returned as self-supporting, and in the Konkan 37·5 per cent. High proportions' of self-supporting persons in these natural divisions were accomparued by low proportions of non-earning dependants, indicating that the number of non-workers in this livelihood class in these areas was genuinely low. The most interesting figure was recorded by Kanara district with 48·9 per cent self-supporting persons in the agricultural labourer livelihood class. This result must have been due to the immigration of adult agricultural labourers from other areas as the proportion of non-earning dependants was also low, a situation that would clearly not have occurred had the agricultural labourers been living with their families in the district. Other districts which returned high proportions of over 35 per cent self-supporting persons were Banaskantha, Sabarkantha, Dharwar, Kolaba, Ratnagiri, Madhya Saurashtra and Sorath, but the proportion of non-earning dependants in these districts was not abnormally low, indicating that immigration was not a cause of the phenomenon.
The proportion of self-suppqrting agricultural labourers who had a s~ndary means of livelihood was small. 31·1 per gent of the adherents. of livelihood class III were selfsupporting persons, but only 3·0 per cent were self-supporting persons with a secondary means of livelihood. Among self-supporting cultivating
owners and cultivating tena~ts approximately one in five had a secondary means of livelihood, whereas among agricultural labourers' the proportion was only one in ten. Agricultural labour was obViously much more of a wholetime job, and. few agricultural labourers had owned land or unowned land from which to supplement their earnings. The following summarises the position:-
Percentage. Total percentage
ing persons class III.
of self-support- 31·1 in livelihood
(i) Self-supporting persons without a secondary means of livelihood.
{ii) Self-supporting persons with a secondary means of livelihood.
28·1
3·0
This percentage of 3·0 was distributed among the other seven livelihood classes in the proportions specified below:-
Percentage.
I-Cultivation of owned land. 0·9 II-Cultivation of unowned 0·3
land. IV-Rent On agricultural land. 0·4
V -Production other than culti- 0·6 vation.
VI-Commerce. 0·2 VII-Transport. 0·02
VIII-Other services and miscel- 0·6 laneous sources.
Total 3·0
The proportion of self-supporting agricultural labourers who derived a secondary means of livelihood from the cultivation of their own land was higher in the Deccan Southern and Deccan Northern Divisions than elsewhere.
Non-earning dependants in livelihood class III
The percentage of non-earning dependency recorded among those belonging to livelihood class III in Bombay, Saurashtra and Kutch was 47·6. Kanara was the only district in Bombay State where the proportion fell below 40 per cent, presumably because of the immigration of adult labourers from outside. Kanara is a district which has always suffered from a lack of agricultural labourers, and the improvement in health conditions has again stimulated the How of immigrant labourers.

AciUcuLrtnUL CLASSES
In Saurashtra and Kutch and in the Konkan the percentage of non-earning dependants within this livelihood class was lowest. It was highest in Gujarat (49·6 per cent), followed by the Deccan Northern Division (48·4 per
cent) and the Deccan Southern Division ( 46 . 5 per cent).
The proportion of total, or non-earning, dependency among agricultural labourers was lower than in any other livelihood class. The census result thus corroborates the findings of the Agricultural Labour Enquiry Committee which was to the effect that " the earning strength of the families of agricultural workers was the highest...... The figures indicate that the economic condition of agricultural workers necessitated the maximum use of manpower by them. The number of women earners per family was also highest among agricultural workers."
Earning dependants in livelihood class III
About three out of four of the earning dependants in livelihood classes I and II were women. Among earning dependants in the agricultural labourer class the ratio of women to men was slightly smaller, the reason being the larger number of women among the families of agricultural labourers who were self-supporting. Earning dependants constituted 21· 3 per cent of the persons belonging to livelihood class III. The occupation which gave these earning dependants an income was tabulated. The overwhelming majority of this proportion of 21· 3 per cent -17·9 per centwere engaged in agricultural labour, the same means of livelihood as the persons on whom they were dependent. No other means of livelihood was of any real importance, though in the districts of Panch Mahals, Ahmednagar and Satara South a fair number of them were returned as dependent on the cultivation of owned land.
SECTION 7
NON-CULTIVATING OWNERS OF CULTIVABLE LAND; AGRICULTURAL REN'r RECEIVERS; AND THEIR DEPENDANTS
Non-cultivating owners of land constituted by far the smallest agricultural class, and was, indeed, the smallest of all the eight livelihood classes in the areas under report. 358,606 males and 435,077 females in Bombay, Saurashtra and Kutch were returned as belonging to it. 'Within this class of what might colloquially be termed non-cultivating landlords 139,862 males and 77,395 females were returned as self-supporting persons; 195,675 males and 315,843 females as nonearning dependants; and 23,069 males and 41,839 females as earning dependants.
The class was not only unique by reason of its small size. It differed from other livelihood classes by reason of the high ratio of females to males Within it, and in the dependency pattern it exhibited. In the population as a whole and in every other livelihood class males outnumbered females. There were 938 women to every 1,000 men in the population as a whole in Bombay, Saurashtra and Kutch, and 992 women to every 1,000 men in the agricultural livelihood classes as a whole, but in livelihood class IV there were 1,213 women to every 1,000 men. In addition to women outnumbering men this livelihood class had
A (Bk) H 9l-8a
another claim to distinctiveness, if not distinction. It had a greater burden of non-earning dependency than any other agricultural livelihood class.
Both the phenomena referred to above are connected ones. In districts like Ratnagm, Kolaba, Satara North and Kutch females outnumbered males in the general population by reason of the emigration of men from these districts. But in livelihood class IV females outnumbered males in every single district. It is not customary for women to live alone. It follows from this that the reason for the preponderance of women in this livelihood class must be sought, not in the temporary migration of the men, but in their complete and permanent absence. In short, they were dead, and the excess of females over males was accounted for by the fact that widows maintained thelllselves by leasing out the land of their deceased husbands.
Self-supporting persons in livelihood class N
The circumstance mentioned ahove explains the relatively higher percentage of self-supporting persons in this as compared with other

AGRICULTURAL CLASSE§
agricultural livelihood classes because in other livelihood classes, women tended to be nonearning or at most earning dependants. In the area of Bombay, Saurashtra and Kutch 27·4 per cent of the persons belonging to liveli .. hood class IV were self-supporting. One out of three of these self-supporting persons was a woman. In no other livelihood class was there such a high proportion of self-supporting women. Kutch and Gujarat recorded higher proportions of self-supporting persons in this livelihood class L.'1an other natural divisions, the reason being the higher number of women in those areas in this livelihood class who were returned as self-supporting. However the figures established no direct and causative relationship between the proportion of widows in the population and the ratio of self-supporting women, though there can be little doubt that the reason for the preponderance of women in thIs livelihood class and the high proportion of self-supporting females, was due to agricul- -tural land being a most important means of livelihood of widows, particularly in rural areas.
Almost one out of three self-supporting persons in livelihood class IV returned a secondary means of livelihood, a means of livelihood next in importance to the principal means of livelihood. More self-supporting persons in this livelihood class had a secondary means of livelihood than had any other livelihood class. For one out of sixteen selfsupporting persons in this livelihood Class work as an agricultural labourer was the declared secondary means of livelihood indicating that the livelihood class was not entirely idle and plutocratic, though its general social and economic standard was relatively high, as indicated by the fact that as much as 36 per cent of the persons belonging to tI1is livelihood class were literate.
27·4 per cent of the adherents of livelihood class IV were self-supporting persons, and 8·7 per cent were self-supporting persons with a secondary means of livelihood. The following data summarise the position :-
Percentage. Total percentage of self-support- 27·4
ing persons in livelihood class IV. (i) Self-supporting persons 18·7
without a secondary means of livelihood.
(ii) Self-supporting persons 8·7 with a secondary means of livelihood.
This percentage of 8·7 was distributed among the other seven livelihoo,d classes in the proportions specified below:-
Percentage.
I -Cultivation II-Culti va tion
land.
of owned land. 0·9 of unowned O· 1
III-Employment as cultivating labourer.
V-Production other than culti-vation.
1·7
1·3
VI-Commerce. 1· 5 VII -Transport. 0·2
VIII -Other services and mis- 3·0 cellaneous sources.
Total 8·7
Other services and Commerce constituted important secondary means of livelihood for persons in this class, and one out of six selfsupporting persons in livelihood class IV had a subsidiary means of livelihood from these sources.
Non-earning dependants in livelihood class N The percentage of non-earning dependency
in this livelihood class was 64·5 in Bombay, Saurashtra and Kutch. No other livelihood class returned such a high proportion of nonearning dependants. In fact, with its high proportion of non-earning dependants, its low proportion of earning dependants, and its high literacy ratio, the pattern of this livelihood class resembled that of the non-agricultural classes.
The proportion of non-earning dependants was highest in the Konkan districts of Bombay State, a circumstance that seems accounted for less by the emigration of males than by the importance of the landlord class in the area. Kolhapur district also returned a very high proportion of non-earning dependants in this livelihood class, as did Saurashtra and Kutch. The proportion of non-earning dependants in other livelihood classes in the Konkan, Saurashtr~ and Kutch was very low, suggesting that livelihood class IV in these three areas was economically fairly well off, and that their dependants were not obliged to work.
Earning dependants in livelihood class IV The proportion of earning dependants in this
livelihood class was only 8·2 per cent in Bombay, Saurashtra and Kutch. A low percentage of earning dependants in this livelihood class indicates a situation where members

AGRICULTURAL CLASSES 61
of the family were not obliged to wa"rk, or not able to work. Both, causes would hold good. It seems reasonably certain that this class contained a large proportion of dependent children, and since the social and economic rating of the class was superior, the children would be undergoing education instead of having to work. Women formed a large proportion of the earning dependants in other agricultural livelihood classes, because wives in those classes helped in cultivation, but in this livelihood class many of the women must have been widows, and self-supporting widows at that.
Only in the Deccan, more specifically in the districts of Nasik, Ahmednagar, Satara North, Sholapur, Bijapur and Dharwar was the proportion of earning dependants fairly high, and since the proportion of earning dependants who engaged in employment as cultivating labourer was also high it is surmised that in these predominantly agricultural districts children may have supplemented the family income by working in the fields. Work as agricultural labourers constituted the most important means of livelihood for earning dependants in livelihood class IV.
SECTION 8
ACTIVE AND SEMI-ACTIVE WORKERS IN CULTIVATION
The active workers in cultivation consisted of self-supporting persons in livelihood classes I, II and III. Semi-active workers in cultivation were self-supporting persons whose
cultivation, but whose secondary means of livelihood was livelihood classes I, II or III, and earning dependa~ts whose secondary means of livelihood was livelihood classes I, II or III. The following table brings out the
principal means of livelihood was other than position ;-
Active and Semi-active workers in cultivation in Bombay, Saurashtra and Kutch
Secondary means of
Principli means of Livelihood Classes. livelihood of self-
supporting persons.
2
I. Cultivation of owned land. ~ 3,745,668
II. Cultivation of unowned land. 925,586
Ill. Employment as cultivating labourer. 1,066,049
On this basis the total number of active and semi-active v.'orkers in Bombay, Saurashtra and K~tch belonging to livelihood class I was 6,320,740, to class II 1,621,288, and to class III 3,046,482.
Livelihood class II was more numerous than livelillOod class III in the general population because earning dependants were assigned to the same livelihood classes as the persons on
livelihood of self-supporting persons Secondary means of
whose principal livelihood of earning Total of columns means of livelihood dependants. , 2,3&4.
was other than cultivation.
3 4 5
131,145 2,443,927 6,320,740
37,842 657,860 1,621,288
55,192 1,925,241 3,046,482
whom they were dependent. In fact, however, a considerable number of earning dependants in all livelihood classes had employment as cultivating labourer as their secondary (i.e. own) means of livelihood. Out of a total of 6,433,l00 persons in all livelihood classes returned as earning dependants at the census, as many as 1,925,241 had their secondary means of livelihooq in class III.
SECTION 9
PROGRESS OF CULTIVATION CORRELATED TO GROWTH OF GENERAL POPULATION
It was customary in previous census reports to say something about the nature of the agri~
cultural seasOns during the decade under review; and about the prices which the agriculturist

62 AGRICULTURAL CLAsSES
received for his produce. A sizable recorded increase in population was regarded as symptomatic of prosperity, and was ascribed either to the beneficence of nature or of the ruleT under which the area had thus prospered. And who will gainsay that an increase in population, in so far as it was due to a lower death rate and a higher survival rate, spelt a diminution in the number of personal tragedies occasioned by famine and disease? A fall in population was generally the product of calamity, of, famine or epidemics or both.
The decade of the thirties was characterised by a slow climb from the economic pit into which the slump in trade thrust the world in 1929, and the pits into which the agricultural countries found themselves thrust were.in general deeper and darker than those of indus-' trial regions. There were no disas~ous famines or epidemics in the area under report during the decade of the thirties. Improved communications had rendered human starvation from famine a remote and ugly memory. The spectacle of human poverty and undernourishment was there, but few thought in terms of what is today called "the food problem."
In 1939 came the second world war. Before 1939 India imported annually about 1 million to l3f million tons of foodgrains, principally rice, from Bunn'a and South-East Asia. Bombay State was deficit in foodgrains, as it grew cotton and oilseeds on an extensive scale, and made up its deficit in foodgrains mainly from Hyderabad, Madhya Pradesh, Uttar Pradesh and the Punjab. It also obtained a major share of the rice imported from abroad. In March 1942, when international trade was virtually halted by the war, the Government of India advised provincial governments to take steps to restrict cotton production and increase the production of foodgrains. The eventual aim was regional self· sufficiency in food. In response to this advice the Government of Bombay took steps to increase the production of food crops and restrict the area under cotton. Between 1942 and 1944 the area under cotton fell from about 4,100,000 acres to 1,300,000. Meanwhile, the internal demand for oilseeds grew very considerably, and part of the area released
7 The a1.Ithor of one old state report pertaining to an area that now forms part of Saurashtra ascribed the increase in population with fine simplification of demography as "entirely due to the beneficent rule of His Highness Xyz:'
from cotton cultivation was diverted to oilseeds.
An era of shortages and inflation had begun. The prices of foodgrains continued to rise and, to relieve distress in the big urban areas, the Government of Bombay instituted foodgrains control and took over from trade channels the function of distributing foodgrains. Controlled distribution of foodgrains was soon extended to all urban areas and to deficit pockets in rural areas. Save for a brief interlude of decontrol in 1947 there was no departure in Bombay State from this pattern of foodgrains control up to the time of the 1951 census.
Mter the merger of the former Indian States the State of Bombay, as at present constituted, is estimated to produce about 4,000,000 tons of cereals in a nonnal season.s The requirements of the Ilopulation in the rationed areas and of non-producers and deficit producers in the non-rationed areas are about 1,500,000 tons a year. About 500,000 tons are secured from cultivators under the monopoly procurement system, and by a levy from surplus produc~rs. About 1,000,000 tons have to be found by imports from other states or from abroad. In short, 20 per cent of Bombay's food has to be imported. It does not grow enough to feed itself. Small wonder that the agricultural statistics are increasingly looked to to supply information about food crop outturns, and that the whole question of food in relation to population growth has acqUired a new urgency.
About one-third of the total cultivated area of Bombay State is subject to frequent scarcity, sometimes bordering on famine conditions, and another one-third is very liable to famine.1} Here we encounter the crux of the problem of self-sufficiency in foo"dgrains. Only about 3·8 per cent of the cultivated land in the State is irrigated; the rest depends ahnost entirely On the nature of the season.
Apart from the Konkan which is mainly a one crop area, growing rice, other parts of the State are capable of growing either food or non-food crops. It is interesting that, despite the incentive in the past decade to shift from food crops to non-food crops because of the higher prices commanded by the latter, the area under cereals in Bombay State
8 Many of the statistics quoted in this section are from the "Report of the Grow More Food Policy Committee, 1951" of the Government of Bombay.
9 "Report of the Grow More Food Policy Committee, 1951," page 68.

AGRICULTURAL CLASSES
remained virtually unchanged. It was surmised by the Grow More Food Enquiry Committee that a shift had taken place to the extent that was practical, consistent with the food and fodder needs of the cultivator himself, and that the shift had taken the fonn of a transfer of the richer lands to non-food crops and of poor lands to food-crops. Such figures as are available suggest that the rate of variation in the acreages under the principal food crops, rice, bajri, jowar and wheat, was less pronounced than the rate of variation in their annual output. Over a period of years from 1945 the range in the output of cereals varied between about 11 per cent above the annual average and about 15 per cent below it, so that the difference in the magnitude of the output between a good year and a bad one was about 16 per cent. It is against the known wide variation in the nature of the rainfall in different areas of the State, which in tum affects the crop outturn, that the food problem must be assessed. Irrespective of the Grow More Food Campaign, the construction of tube wells, the taking of a second crop from land that is capable of yielding it, the more extensive use of fertilisers to improve the yield, decontrol, and the numerous other remedies suggested or devised to improve the quantity of foodgrains production nothing as things stand at present improves crop outturns so much as a good monsoon. This is not of course to suggest that all ameliorative measures should be discarded in favour of prayers for rains. Heaven "helps those w.ho help themselves.
In the table below data have been assembled about the famines and scarcities that have occurred in the area under report since the beginning of the' century :-
Year. Districts affected by Districts affected by Famine. Scarcity.
1900-01 Halar and Sorath 1901-02 1902-03 1903-04 Surat and Halar Ahmedabad
Baroda. and
1904-05 Banaskantha Bijapur
an d Halar.
1905-06 Sorath
1906-07 1907-08 Panch Mahals and
Bijapur 1908-09 1909-10
Ahmedabad, Baroda, Poona and Bel-gaum.
Halar. Baroda.
Madhya Saurashtra. Ahmedabad.
Year. Districts affected by District affected by Famine. Scarcity.
191O-U Halar 1911-12
1912-13
Banadcantha, Sabar-kantha, Aluned-abad, Panch Mahals, Baroda, Bijapur, Halar and Madhya Saurashtra
Zalawad, Sorath and i:utch.
1913-14 Surat 1914-15 Halar
Baroda, Amreli, i:handesh, Dharwar Gobilwad.
Bljapur.
Broach, Weit
DaniS, and
1915-16 Banaslcantha Halar
and Dharwar and Madhya Saurashtra.
1916-17 1917-18 Halar
1918-19 Banaskantha, Ahmedabad, Panch Mahals, Baroda, Smut, Amreli, Ahmed-nagar, Satara North, Belgaum, Thana and Halar.
1919-20 Satara North, Somth' and Kutch
1920-21 Ahrnednagar, gaum and pur
BelBija-
1921-22 Satara North
1922-23
Zalawad and Kutch. Panch Mahal" Baroda,
West i:handesh. Danil, Poona, Bijapur and Dharwur.
Madhya Saurashtra and Gohilwad.
Baroda, Broach, West i:handesh, East Khandesh, Poona, Satara North, Sholapur, Madhya Saura.htra and Zalawad.
Broach, Dangs, Sholapur, Dharwar. Halar and Madhya Saurashtra.
1923-24 Banaskantha, Madhya mshtra
and Sholapur, Bijapur and
1924-25 Satara North
1925-26
1926-27 1927-28 Halar
1928-29
1929-30 1930-31 1931-32 1932-33 1933-34 1934-35 Sorath
Sau- Dharwar.
Kutch. Sholapur, Bijapur and
Halar.
Subarkantha and Satara North.
Baroda.
Satara North. Dharwar.
1935-36 Banaskantha, Kolha- Banaskantha, Poona pur and Belgaum and Belgaum.
1936-37 • I

64 AGRICULTURAL CLASSES
Year. Districts affected by Famine.
1937-38 Banaskantha
1938-39 Halar
Districts affected by Scarcity.
Banaskantha, Ahmedabad, Panch Mahals, Ahmedna~ar, Poona, Sholapur and Bija-pur.
1939-40 Halar and Kutch Ahmedabad, Sholapur and Sorath.
1940-41 Banaskantha, Dangs, Zalawad. Kolhapur, Sholapur and Bel"aum
1941-42 Panch Mahals, Ahmed-
1942-43 Bijapur 1943-44
1944-45 Kolhapur and Bel-gaum
1945-46
1946-47 Kolhapur .ana Bel-
1947-48
1948-49
1949-50
Sabarkantha, Ahmedabad and Baroda
Madhya Saurashtra, Sorath and Kutch
nagar, Satara North, Sholapur, Bel"aum and Bijapur.
Ahmednagar, Sholapur~,
and '
Surat, Poona, Belgaum Dharwar.
Ahmednagar, Poona, Satara North, Sholapur, Belgaum, Bijapur and Dharwar.
Sabarkantha, Kaira, Baroda, Broach, Surat and Bijapur.
Halar and Gohilwad.
Mehsana, Baroda, Broach, Dangs, Ahmednagar, Sholapur and Zalawad.
Since the turn of the century famine has lost its killing power. Communications have improved, and provided grain is available the relief machinery is capable of administering it, without any serious loss of human life taking place.
The gulf between famine and abundance is, however, a wide one, and the food problem should not be measured only by the negative, though creditable, achievements that no famine of the 1899 type has since ravaged the country, and that throughout the war years and subsequently the State of Bombay, which pioneered foodgrains rationing, has protected itself from starvation, despite being heavily deficit in foodgrains. The basic fact is that population is going up rapidly, and.the acreage available for cultivation is not. The accounts have to be balanced somewhere.
For the three decades 1921, 1931, and 1941 fairly adequate agricultural statistics ate
available relating to the former Province of Bombay. After the merger of the former Indian States with the province in 1948 and
onwards the picture changes. The source of information for figures relating to 1951 given in Subsidiary Tables 4'7, 4·8 and 4·9 was the .. Bombay Season and Crop Report for 1949-50." The area figure cif Bombay State contained therein was less than the figure communicated by the Surveyor General. Such imperfections will sort themselves out in the future. Meanwhile the available figures, imperfect though they may be, do bring out the salient features of the situation.
The total area of Bombay State, after the merger of the former Indian States, is about 67,436,000 acres, of which the cultivable area is about 49,049,000. Forests, barren and uncultivable land, land put to non-agricultural uses, etc., accounted in 1949-50 for 18,387,000 a~res. Not all of the estimated cultivable area of 49,049,000 acres was or could be under cultivation during the year. 7,043,000 acres in 1949-50 were current fallows, and 1,058,000 acres were cultivable but not cultivated. 42,363,000 acres were under crops. Considerable confusion in the interpretation of the official classification of land existed in the past, and it is only with effect from .1950-51 that fallow land will be classified more scientifically into current fallows, other fallow lands, and cultivable waste, under definitions standardised by the Government of India.
Faulty classification and confusion about terms led to the growth of a myth that a large amount of land was waiting to be put under the plough. A large part of the land officially classed as cultivable waste land in the past was not in fact fit for cultivation. A land utilisation survey, begun in 1948, found that less than 40 per cent of the land classified as «cultivable waste" was fit for cultivation either immediately or after certain land improvement schemes had been undertaken. Needless to say most of these lands were marginal lands where the profit of cultivation is an uncertain factor.
In the old province of Bombay with its 48,700,000 acres of total area the following were the average net areas sown in three decades :-
Acres. 1921 26,613,000 1931 27,810,000 1941 28,546,000
In 1949-50 in the State of Bombay, as at present constituted, 42,363,000 acres were sown.

AGRICULTURAL CLASSES 65
The precise causes of the rise in the acreage sown between 1921-41 in the old provjnce of Bombay are unkno~, but it is presumed that the bringing of marginal lands under cultivation may have been responsible. The area sown more than twice and the area irrigated more than once showed a decline only in 1931, perhaps because the taking of a second ~rop became unprofitable on account of the world slump in agricultural prices. The important point that clearly emerges from the data, faulty and incomplete though they may be, is that the area of cultivation per capita, which was fairly low to start with, has shown a progressive decrease during the past thirty years because of .the steady decennial increases in the population, as the following table shows:-
Area of cultivation Year. per capita in
acres. 1921 1·66 Bombay Province. 1931 1·54 do. 1941 1·137 do. 1951 1·18 Bombay State. The area of cultivation per capita which was
1·18 acres, or 118 cents on an average in 1949-50, varied considerably among the natural divjsions of the State. In the table below the distribution of the average area of cultivation per capita has been shown according to four compone~t classes of crop-unirrigated single crop, unirrigated double crop, irrigated single crop and irrigated double crop-for the State as a whole and its component natural divisions for 1949-50:-
Bombay State Area of cultivation per capita in cents
1 acre = 100 cents
Unirri- Unirri- Irri- Irri-gated gated gated gated Total. single double single double crop. crop. crop. crop.
Bombay State ", 109'3 2,9 4'9 0'7 117'8 Greater Bombay 1'8 0'9 2'7 Guiarat ", 106'9 3,8 3'4 0'1 114'2 Deccan Northern 137'7 3'0 8'2 1'7 150'6 Deccan Southern 170'4 3'2 6'4 0'3 180'3 Konkan ,,, 44'7 1'7 1'5 47'9
The average area of cultivation per capita was higher in the predominantly agricultural Deccan than in Gujarat. The Deccan, principally Ahmednagar and Kolhapur districts, also had better irrigation facilities than other natural divisions. The area of cultivation per capita in ilie Konkan, where pressure on the land is acute, was very small. The rainfall is, however, less uncertain than elsewhere, and the main crop, paddy, is capable of supporting a larger number of people to the acre.· Quite obviously the quality of the land, the nature of the rainfall, and the irrigation facilities available are very important factors. The average area of cultivation per capita was only 80'6 and 69·4 cents in the comparatively prosperous agricultural districts of Kaira and Kolhapur, while it was 253'1 cents in· Bijapur, a tract with precarious rainfall and very liable to famine.
The proportion of the population of the State of Bombay returned as dependent on agriculture has not declined sensibly since 1921. Moreover the absolute numbers dependent on agriculture have increased. Quite obviously the State, and particularly the rural areas of the State, must be worse off in respect of food supply than twenty or thirty years ago. The only circumstances that would militate against that conclusion would be an improvement of yields by better farming methods, the use of. better seeds and fertilisers, and extension of irrigation facilities. The figures suggest however that only about 3·6 per cent of the cultivable area of the State was irrigated, the rest depending on the rainfall. A gloomy school of thought has put forward the view that agricultural food crop yields per acre have been gradually decreasing, but the Grow More Food Policy Committee was of the opinion that the figures did not reveal a statistically acceptable downward trend as the fluctuations from year to year were mainly due to seasonal factors.1o
SECTION 10
CONCLUDING REMARKS
On the basis of the data assembled at the past four censuses, and the results of special enquiries undertaken from time to time we feel justified in drawing the following conclusions :-
It. (Bk) H 91-9
Livelihood class I (cultivation of owned land) sU:pported more people than a~y .other agricultural livelihood class. LIvehhood
10 " Report of the Grow More Food Policy Committee, 1951," page 100.

AGRICULTURAL CLASSES
class III (agricultural labour) came next in importance as an occupation for those engaged in agriculture, followed by livelihood class II ( cultivation of unowned land) . Livelihood class IV (landlords) was and always has been a tiny category.
The load of non-eaming dependency among agricultural labourers was smaller than in any other livelihood class. The 1921 and 1951 results corroborated each other on this point. Agricultural labour (class - III) was a most important means of livelihood for earning dependants. Thus, though the size of agricultural livelihood classes II and III were, on the 1951 method of treating all dependants as belonging to the same livelihood class as Jhe persons on whom they were dependent" roughly equal, that equality disappeared if the classification were to be done according to the earning dependant's own means of livelihood. Al; an employment for earning dependants, agricultural labour (livelihood class III) was very important.
There is no reason to doubt the accuracy of the distinction drawn between agricultural and non-agricultural classes at successive censuses, because such a distinction is in most cases immediately apparent. The accuracy of the further distinctions drawn between the four agricultural means of livelihood is, as mentioned in section 7 of chapter I, more open to argument. Even though definitions and classifications have changed from one census to another that fact would not' be sufficient to explain the very wide fluctuations in the data obtained in 1931 and 1951. We believe that a part of the explanation of the failure of the 1931 classification of agriculturists lies in the fact that the agricultural classes are not watertight compartments. It is far from uncommon for an agriculturist to own some land of his own and to combine cultivation of it with the cultivation of leased land, or work as an agricultural labourer. Again, there are many agricultural labourers who have small pieces of land of their own. The assignment of a person to a particular category might in such mixed ca5es depend on the care which enumerators took to find out which means of livelihood provided the largest income, and in cases where the enumerator was not -careful would depend on how people saw thomselves. On the whole the pattern outlined by the census data on' agricultural livelihood classes in 1951 is clear and consistent. There may have been a tendency to treat livelihood class I as a residuary category because it was the most
important livelibood class, though the chances of someone without any lapd of -his own being assigned to that 'livelihood class would be remote.
The' percentage of the population dependent on agriculture 'has shown no great diminution since 1921, while the absolute number of perllons dependent on agriculture has shown a considerable increase. In 1951 the average area of cultivation per capIta was about 1·18 acres in B\}mbay State wherea,s in Bombay Province in 1921 it was about 1· 66 acres. It is true that by contrast with the slump years of the early thirties the agriculturist obtained a better price for his produce, particularly during the past decade.
There has however been no revolution in agricultural methods, and cultivation in general .~emains subsistence farming, complicated by t.~e old evils of sub-division and fragmentation, evils which an increase iIi population must tend to aggravate railler than diiriinish. In certain areas of the - State, particularly the Konkim and the Southern Deccan' districts, more than 10 per cent of the land was held in large holdings, but on the whole the average size of the holding was small, and it is evident that the basic' problem of agriculture in the area is not so much land for the landless as that of insufficient land for a large majority of the existing cultivators.
The number of persons returned as landless labourers was surprisingly small. 'Agriculture is a way' of life and land spells security, social and economic, for those who possess it. Land ownership in rural areas' is the major factor determining the social status of a family in the community. Hence by sub-division and fragmentation people cling to. land. FarmIng remains 'in the main subsistence farming and without capital it is difficult to see how the problem of low productivity in agriculture can be solved.
The picture of course is not one of unrelieved gloom. By legislation tenants during the past decade in Bombay State have been given security of tenure, the rents they pay have been limited by law, and consolidation of holdings is getting under way. In Saurashtra, since the census, girasdari has been abolished, and the measure appears to have been an unqualified success. Because of high prices a, great deal ,of rural debt everywhere has been liquidated. There is a, certain heady quality about high prices. In a few good 5easons when sugarcane prices were high in ~olbapur district cultivators with 10 ~cres of, land made

AGRICULTURAL CLASSES
a .. killing." Tea shops everywhere have multiplied; cinemas have sprung up where none existed before; and those who formerly walked now travel in the State Transport bus.
Has the standard of living, then, in the State as a whole and in the rural areas in pIuticular improved? The answer requires a further question: .. Just what does ono mean by • standard of living' ?.. If by standard of living one means .. Are people better dressed, and have they money to spend in the' tea shops while waiting for a bus?" the answer is yes, undoubtedly. If it means are pe<?ple as a whole eating better than they did ten years ago, the answer is, almost certainly, no. There is no evidence that agricultural yields have greatly improved during the past twenty or thirty years, and certainly they have not improved to the extent" necessary to keep pace with the expanding population. There has of course been an improvement in the cultivator's terms of trade. He gets more for his produce than he did formerly. His land revenue remains fixed, and much of his debt to the money lender has been liquidated. In rural areas as in urban there has been a considerable redistribution of income, though not to the same extent as in urban areas. Such improvement has not taken the form of turning landless labourers into landed proprietors, but the labourer tends to get more for his labour, whether in cash or kind, and the man with a small piece of land finds it is worth more than it was formerly.
The writer recollects an estimable old fashioned government servant ten years ago in Dharwar district who referred with nostalgia to the .. good old days" of his youth, and regarded it as axiomatic that the old rural world was coming metaphorically to an end and that cultivation was going to rack and ruin because the present day small cultivator took tea. Such an extreme view is both unjustifiable and unscientific.
Although crop yields have not gone up most observers of the rural scene, at least in Bombay State, feel that the standard of living has. There seems to be a contradiction somewhere.
A (Bk) H 91-90
Perhaps the gain to the cultivator from having a land revenue fixed in relation to pre-war agricultural prices, QUd from the liquidation of much of his debt, cancels out the fact that a larger number of people have to be supported from the same land.
It is unlikely that an economic debacle of the 1929 variety will recur in the foreseeable future. The mere fact that the world's population has increased so tremendously is an insurance against the collapse of aiJicultural prices with all that such a collapse means for a predominantly agricultural country. The terms of international trade are unlikely ever to go again as heavily against the agricultural countries as they did in the thirties; and of course, increasingly, the agricultural countries are becoming industrialised.
The highly desirable developments of th8· past two decades, the rise in agricultural prices, the growth of industrialisation, the growth of literacy, the expanding amenities and petty luxuries available to an increasing number of people, and the fall in the death rate, which is presumed to be the main cause of the increase in population in rural areas must not be allowed, however. to blind us to the darker side of the picture.
Agricultural production is not keapini pace with the expanding population. Only the most heartless would view with equanimity the revival of the old Malthusian checks, famine and disease, as a means of keepini the population in check; yet, in the context of a modern society death control, without some form of birth control, is unthinkable. The figurel suggest the inescapable conclusion that population, in relation to tho available agricultural resources, is too great. It is surely beggini the question to argue, as some people do, that there is no over-population problem, and that what is wrong is the under-exploitation of available resources. There is no agricultural technology in the world that can give a state an acceptable modem standard of living when more than half the population is dependent on agriculture, and the cultivated land per capita is only a little over an. acre.


CHAPTER V
++++++++++++++++++++++++++++++++++++++++++++++++++++++++++++++++++++++
NON-AGRICUL TURAL CLASSES ++++++++++++++++++++++++++++++++++++++++++++++++++++++++++++++++++++++
SECTION 1
PRELIMINARY REMARKS
At the initial sorting of the census slips in 1951, the non-agricultural classes were separated into four main livelihood classes :-
V':""Production other than cultivation. VI-Commerce.
VII-Transport. VIII-Other services and miscellaneous
sources.
How important the non-agricultural classes were in Western India is shown by the following table:-
State.
Part .. A" StatesWest Bengal Bombay Punjab Madras Assam Uttar Pradesh Madhya Pradesh Orissa Bihar
Part .. B" StatesSaurashtra Travancore-Cochin Hyderabad Mysore Rajasthan Madhya Bharat PEPSU
Percentage of the population who belonged to the non
agricultural classes (Livelihood
classes V -VIII) .
42'79 38·54 35·27 35·10 26·66 25·82 24·00 20·71 13'95
53·38 45·15 31·84 30·10 29·13 27'78 27·45
In Bombay, West Bengal, Madras and the Punjab higher proportions of the population were urban than in other Part "A .. States.
Saurashtra had a higher percentage of urban population than any other Part " B" State.
Differences in definitions and classification in 1951
In the preliminary section of Chapter IV allusion has been made to some of the differences in definitions and methods of classification adopted in 1951 as compared with previous censuses.
The .. actual workers" of the 1921 census were equivalent to the self-supporting persons plus the earning dependants of 1951.
The .. principal earners» of the 1931 census were roughly equivalent to the self-supporting persons of the 1951 census. They were not, however, completely comparable. In 1951 the adequacy or otherwise of a person's income to support that person distinguished. the sel£supporting person from the earning dependant. In 1931 there was . no such criterio~. Enumerators were clearly chary about conceding self-supporting status to women in 1951. There were as many as 8·4 self-supporting males to every self-supporting female in the nonagricultural classes in Bombay State in 1951. In 1931 there were 6·3 male principal earners to every female principal earner in the non-agricultural classes, a lower ratio.1
1 The reluctance to concede self-supporting status to women ·in the agricultural classes in 1951 was even more pronounced. There were 6 self-supporting males to every self-supporting female in the agricultural classes in Bombay State in 1951. In 1931 there were less than 3 male principal eameJ;'S to every female principal earner.

70 NON-AGRICULTURAL CLASSES
It was important in 1951 whether ~ person whose own means of livelihood was non-agricultural was returned as .. self-supporting'" or not, because it was only the self-supporting persons whose means of livelihood were subjected to detailed classification.
Classification of occupations
After the 1951 census persons who were returned as self-supporting as a result of engagement in Industries and Services were divided into occupational divisions, suh-divisions, and groups under a new scheme called the Indian Census Economic Classification Scheme, devised by the Registrar General, India.
This scheme was not, of course, entirely new. The elements were there before. But it represented a much more scientific classification than was ever made before.2 The occupational data compiled at previous censuses were rearranged to render them comparable with the "International Standard Industrial Classification" Scheme evolved by the United Nations. There are 10 divisions and 44 major groups of economic activities under the International Standard Industrial Classification Scheme, which include agriculture. Under the Indian Census Economic Classification Scheme there are 10 divisions and 88 sub-divisions of Industries and Services.
Under the "International Standard Industrial Classification" Scheme the Unit of Classification is the organised H Establishment." The commodity produced or the service performed as a result of the work of the organised establishment is the criterion for classifying the establishment. The classification of the establishment is the classification of every member of the esta.blishment. Under the Indian Census Economic Classification Scheme of 1951 the unit of classification was, in every case, the individual. There is thus a technical distinction regarding the ucit of class.ification adopted
2 A full description of the 1951 Indian Census Economic Classification Scheme will be found as a preface to the Economic Tables in Part II-B of this report. The purposes of the Scheme were ;-
( 1)' To establish a comprehensive' economic classification of the people as a whole, and not merely of persons who were gainfully employed.
(2) To simplify and improve the method of presentation of census economic. data and provide additional data; and
(:3) To secure international comparability of data as recommended by the Economic and Social Ccunen of the United NationS.
in the two schemes. This was unavoidable having regard to the questions, that alone could be put in a general population census in India. Nevertheless the difference to the comparability of the data classified under the two schemes 'is unlikely to have been significant. Economic table B-III contains the classification of self-supporting persons in Industries and Services.
Additional data were provided in 1951 by classifying the economically active self-supporting persons in the non-agricultural classes into employers, employees and indepeQdent workers. The results of that analysis are contained in section 3 of this chapter.
Because, of changes in .the definitions from one census to another and or changes in the classification scheme in 1951, it has not been 'possible to trace the fluctuations in the size of' all the occupational groups from one census to another. Even in the past when there were ~o radical changes in the classification scheme comparability was frequently lost. A violent increase or decrease in the size of the various occupational groups was frequently exhibited from one census to another because the tabulation offices classified occupations under one group at one census, and under another at the succeeding cerisus. Sources 6f error in occupational classification
Means of livelihood is by far the most difficult of the census questions to enumerate "fully and to classify accurately, not only in India but elsewhere.
The most formidable ca"use of confusion in occupational classification is incomplete returns. The cliches .. service" and "labour" as descriptions of means of livelihood enjoy wide currency and, although the instructions stipulated that they' should be avoided, and that what w.as required was a precise return of what a person did· for a living and where he did it, the instruction was not always observed, though ~e occupational returns seemed to b~ better in. 1951 than in the past.
Another 'cause of error or misunderstanding has always related to the classification of persons who' were bq~ makers and sellers of the same article, as very often happens when much manufacture is of the cottage industry variety. When a person both made and sold an article lie was clMsified under Production and not under Commerce. However the possibillty of Production and Commerce being confused .in marginal cases could exist.

NON-AGRICULTURAL CLASSES 71
The Abstraction Offices sometimes classified on probabilities ~ in the past. In fact as nature abhors a vacuum so did the Abstraction Offices sometimes endeavour to improve the returns by interpreting doubtful entries in the way they deemed fit. The fall from one census to another in the number of persons returned as following occupations insufficiently described was not always an indication of improved enumeration, but of an increased tendency on the part of the Abstraction Offices to atone for deficiencies in the schedules by calling on their own ingenuity. Thus, as L. J. Sedgwick pointed outs in 1921 the figure of unclassified (non-agricultural) labourers in British districts of Bombay Presidency was' 1,102,382 in 1901, fell to 250,853 in 1911, and rose again to 833,964 in 1921, due less to improved enumeration in 1911 than to the fact that in 1911 the Abstraction Offices classified on probabilities. In 1951 non-agricultural labourers, persons variously described as .. coolies, mazdoors, general labourers, workers on daily wages, etc." were taken under" Services otherwise unclassified." Some of the persons who- were classified under that head might in actual fact have been unskilled workers employed on daily wages in a factory or in a government or municipal department, and would have been classified with reference to the industry or department that they served had the description of their means of livelihood been more detailed.
Another cause of misclassification in the past arose out of confusion of terms. The word for .. charcoal" and .. <steam coal" is .. kolsa" in all the regional languages q£ Bombay State. In consequence 2,231 persons in the ~rea of Bombay State as at present constituted were classified in 1921 as engaged in coal mining, the bulk being in Thana district. A similar mistake is observable in the 1941 sample tables. There are no coal mines in the area, and the figures in both 1921 and 1941 must have been those of charcoal burners. c
U nproductlve means of livelihood
Self-supporting persons belonging to the . ncin~agriCliltural classes who derived their means of livelihood from unproductive activities were separately shown in a fly-leaf - to Economic Table B-III. These unproductive means of livelihood, and the number of selfsupporting pe~sons who deIjved their principal
8 Census of India, 1921, Bombay Report, page 232.
means of livelihood from them have been shown below:-
Unproductive means of livelihood in Bombay, Saurashtra and Kutch
Persons. Malell. Female&.
(1) Persons living principally on - income from non-agricultural
property
(2) Persons living principally on pensions. remittances. scholarships and funds
(3) Inmates of jails. asylums. almshouses and recipients of doles
(4) Beggars and vagrants
(5) All other persons living principally on income from unproductive activities
Total
27,218
38.965
3,265
58.013
16,434
143.895
13.306
34.110
2.753
45,353
7.291
102.813
13,912
4.855
512
12,660
9,143
41,082
The size of the unproductive category can be assessed from the fact that out of a total of 4,973,160 persons in Bombay, Saurashtra and Kutch classifie<l as self-supporting persons belonging to the non-agricultural classes, there were 143,895 persons, or 2·89 per cent of the total number of self-supporting persons in the non-agricultural classes, who were returned as dependent on unproductive means of livelihood. The balance of 4,829,26?: persons represents the economically active population within the non-agricultural categories.
Sum~ry
To recapitulate, the arrangement of the 1951 economic data classified the non-agricultural population -into four broad livelihood classes, and exhibited the population within these livelihood classes according to whether they were self-supporting persons, non-earning dependants, or earning dependants. The sel£supporting persons within the non-agricultural classes who were economically active were then classified into divisions and sub-divisions of Industries and Services under the Indian -Census Economic -Classification Scheme, There was a classification by groups within the occupational sub-divisions. Appendix D to this report contains an index of the non-agricul-tural occupations in the area arranged by occupational groups. .

72 NON-AGRICULTURAL CLASSES
SECTION 2
NON-AGRICULTURAL POPULATION RATIOS; SELF-SUPPORTING PERSONS AND DEPENDANTS; SECONDARY MEANS OF LIVELmOOD OF
NON -AGRICULTURAL CLASSES
Approximately two-:Sfths of the population of Bombay, Saurashtra and Kutch belonged to the non-agricultural classes. That means that they were either self-supporting persons whose principal means of livelihood was derived from a non-agricultural source, or were dependants, earning or non-earning, of such persons. The non-agricultural bias was, obviously, much heavier among the urban population than among the rural; nevertheless, there was everywhere a considerable percentage of agriculturists in the towns (except in Greater Bombay) and of non-agriculturists in the countryside. In the table below the percentage of the general, rural and urban population who belonged to the non-agricultural c1asses has been exhibited:-
Percentage of the general, rural, and urban population in Bombay, Saurashtra and
Kutch who belonged to the non-agricultural classes
State and Natural Division.
Bombay, Saurashtra Kutch
Bombay State Greater Bombay Gujarat Deccan Northern Deccan Southern Konkan Saurashtra State Kutch State
and
General Rural Urban population. population. population.
40·3 2D·1 85'1
38·5 17·8 84'6 99·5 99'5 37·8 20·9 87'2 30·9 14·5 76'3 26·8 12·5 66'8 35·3 23·7 83'6 53·4 35·5 88·5 58·0 49·8 90'6
There were marked regional variations in the proportion of the population return~d as belonging to the non-agricultural classes. In Kutch and Saurashtra as much as 58· 0 and 53·4 per cent of the population belonged to the nonagricultural classes. High proportions of the population in the non-agricultural classes were distinctive features of the economies of the rural as well as the urban areas of Saurashtra and Kutch. In every district in Saurashtra, except Sorath, the non-agricultural population outnumbered the agricultural, the highest proportion of 57·1 per cent being found in Madhya Saurashtra district, which contains the administrative capital of Rajkot. In Kutch
58·0 per cent of the population belonged to the non-agricultural classes, an extremely high proportion when one considers that only 20·0 per cent of the population of Kutch lived in urban areas. The Agricultural Labour Enquiry conducted by the Government of India found that even in the rural areas of Saurashtra non-agricultural families formed a considerable proportion of the total population, and the same situation obtained in Kutch.
In Bombay State as much as 99·5 per cent 'of the population of Greater Bombay belonged to the non-agricultural classes; in Gujarat 37· $ per cent; in the Konkan 35·3 per cent; in the Deccan Northern Division 30·9 per cent, and in the Deccan Southern Division 26·8 per cent.
The lesser proportions found in the non· agricultural classes in the Deccan Northern and Deccan Southern Divisions as compared with Cujarat were due to the fact that Gujarat was more intensively urbanised and industrialised. In Ahmedabad district 70· 5 per cent of the population belonged to the non-agricultural classes. In the districts of Amreli, (which geographically fonus part of the Saurashtra peninsula) Mehsana, Surat, and Baroda between 46·7 and 37 per cent of the general population belonged to the non-agricultural classes. ~
Only in one district of the Deccan Northern Division, on the other hand, did the non. agricultural classes form anything approaching half the population, and that district was Poona where 47·7 per cent of the general population belonged to the non-agricultural classes, followed by Sholapur district, which contains the industrial town of the same name, with 37·4 per cent and Nasik district with 32·7 per cent. In the three districts of the Deccan Southern Division the non-agricultural classes formed only slightly over a quarter of the general popu1ation, Dhanvar district having the highest ratio of 30· 9 per ceifi.
The four Konkan districts exhibited wide variations in the non-agricultural ratio. In Thana district, which adjoins Greater Bombay and has undergone considerable industrial development, 45· 6 per cent of the population

NON-AGRICULTURAL CLASSES 73
belonged to the non-agricultural classes. In Kanara district ,where forestry and fishing were important industries, 37·2 per cent of the general population belonged to the non-agricultural classes. In Ratnagiri district 30·5 per cent of the population belonged to the nonagricultural classes, a fair proportion being dependants of emigrants who earned their living in Greater Bombay. (The percentage of non-earning dependency among the nonagricultural classes in Ratnagiri district was higher than in any other district in the area). Kolaba district was predominantly agricultural, and only 26·0 per cent of the population belonged to the non-agricultural classes.
Self-supporting persons and dependants in the non-agricultural classes
The main difference between the dependency pattern exhibited by the non-agricultural classes as contrasted with the agricultural classes consisted in the greater load of nonearning dependency in the non-agricultural classes not only in the area under report but in India as a whole. The proportion of selfsupporting persons in the non-agricultural classes was higher, while the proportion of earning dependants was lower, chiefly because the opportunities for women to assist in a family occupation when that family occupation was cultivation were considerable, while many of the non-agricultural occupations were primarily men's job. This explains why such a high proportion of women in the agricultural classes were returned as ~aming dependants, and why the load of non-earning dependency among women in the non-agricultural classes was so heavy. The following table compares the dependency pattern of the agricultural and nonagricultural classes in the area of Bombay, Saurashtra and Kutch, according to sex ;-
Percentage of the general population in Bombay, Saurashtra and Kutch
who were returned as-
Self- N . E . . on-earrung ammg supportmg dependants. dependants.
persons.
Agricultural Classes-Persons • • 24·5
. Males .. 42·3 Females 6'6
Non-Agricultural Classes-Persons 30,3 Males 50·3 Females 7·2
A (Bk) H 91-10
54·2 46·4 62·1
61·9 43·9 82·8
21·3 11'3 31·3
7·8 5·8
10·0
The heavier load of non-earning dependency among families in ·the non-agricultural classes is clearly brought out by the table.
The next question that suggests itself is whether, among the non-agricultural classes there is any discernible difference in th~ dependency pattern, if the analysis is done on the basis, not of sex, but of residence of the non-agricultural population in rural and urban areas. The following table brings out the position ;-
Percentage of the non-agricultural classes in Bombay, Saurashtra and Kutch who were
returned as-
General population Rural population Urban population
Self~ Non-earning Earning supportmg dependants. dependants.
persons.
SO'3 26·9 32'1
61'9 59·2 63·4
7·8 13·9 4·5
The higher percentage of earning dependency exhibited by rural non-agriculturists is interesting. Earning dependency, as we have seen, was primarily a characteristic of the agricultural classes, and the importance of the earning dependent category was due to the large number of women among the agricultural classes who assisted in cultivation as earning dependants. A similar reason explains the high proportion of earning dependants in the rural non-agricultural population. There were many cottage industries where women and others who in the towns would be non-earning dependants could assist in a family occupation and qualify as earning dependants.
In urban areas, on the other hand, the concept of a family occupation does not have the same validity. Many of the male nonagricultural urban population would come from rural areas and from agricultural families. A man who might be an earning dependant in a rural family assisting in a family occupation became a self-supporting person in the nonagricultural classes when he emigrated to' a town. His occupation ceased to be a family occupation and was self-determined. This had two consequences. The proportion of selfsupporting persons was higher in the non~agricultural as compared with the agricultural classes (30·3: 24·5). Again, the urban as compared with the rural non-agricultural classes had a higher proportion of self-supporting persons (32,1; 26· 9 ) .

74 NON-AGRICULTURAL CLASSES
One further feature that requires study i:; whether the dependency pattern of the four livelihood classes, which together comprised the non-agricultural classes, exhibited any remarkable deviations, The table which follows brings out the position :-
Percentage of the non-agricultural livelihood classes in the general, rural and urban
population in Bombay, Saurashtra and Kutch who were returned as-
Self- Non- Earning Livelihood Class, supporting earning depen
persons, dependants, dants,
General population
V-Production other than cultivation 30' 7
VI-Commerce 27'3 VII-Transport 30'0
Vm-Other services and miscellaneous sources 31 '5
Rural P opulalion
V-Production other than cultivation 2S '6
VI-Commerce 25'3 VII-Transport 23'S Vm-Other service. and
miscellaneous sources 28' 9
Urban Population
V-Production other than cultivation 33'~
VI-Commerce 28'0 VII-Transport 32'5
Vm-Other services and miscellaneous source. 33 'I
59'2 67'9 65'3
60'9
57"5 65"6 67"8
57'9
60'3 68'S 64'4
62'7
10'1 4'8 4'7
7'6
16'9 9'1 8'7
13'2
The proportion of non-earning dependants among the Commerce and Transport livelihood classes was noticeably higher than among other non-agricultural classes. These two livelihood classes had also the highest proportion of literacy, The two circumstances seem connected. The schooling and education of children in these two livelihood classes would tend to be prolonged, and hence they would remain non-earning dependants for a longer period, Again the economic pressure on the dependants of mOre well-to-do families to work would not be so acute.
The high percentage of earning dependants among livelihood class V in the IlJral areas seems connectable with cottage industries and
the opportunity for dependants to assist in family occupations in rural areas.
Numbers of self-supporting persons in the non-agricultural classes
16,395,121 persons-8,801,192 males and 7,593,929 females-were returned as belonging to the non-agricultural classes at the census in Bombay, Saurashtra and Kutch. Of these, 4,428,106 males and 545,054 females were returned as self-supporting. Half the males in the non-agricultural classes were self-supporting, as compared with one out of every
14 women, The non-agricultural classes were distinguished by the high proportion of males within them who were self-supporting. In all, 30·3 per cent of the non-agrh;:ultural classes were self-supporting, as compared with 24·5 per cent in the agricultural classes.
Numbers of earning dependants in the non-agricultural classes
An earning dependant was a person who had an income, but an income insufficient to
maintain himself or herself, and was in consequence principally dependent on somebody else. 510,279 males and 760,381 females, returned at the census of Bombay, Saurashtra and Kutch as belonging to the non-agricultural classes, were earning dependants. Earning dependency was primarily a characteristic of females in both the agricultural and the nonagricultural classes, though the extent of earning dependency among females in the nonagricultural classes was much less than in the agricultural classes. Dnly 10·0 per cent of the women in the non-agricultural classes were earning dependants, as compared with 31' 3 per cent in the agricultural classes.
In all there were 1,270,660 earning dependants among the non-agricultural classes. There were three earning dependent women to every two earning dependent men in the nonagricultural classes in Bombay, Saurashtra and

NON-AGRICULTURAL CLASSES 15
Kutch. In all, 7· 8 per cent of the non-agricultural classes w.,ere earning dependants.
Numbers of non-earning dependants in the non-agricultural classes
Within the non-agricultural classes in Bombay, Saurashtra and Kutch non-earning dependants numbered 10,151,301. Of these
3,862,807 were males and 6,288,494 were females. 43·9 per cent of the males and 82·8 per cent of the females in the non-agricultural classes were returned as non-earning dependants. For males and females combined the
percentage was 61· 9, while among the agricultural classes the percentage of non-earning dependency was only 54·2.
Secondary means of livelihood of nonagricultural classes
Information was collected at the census about the secondary means of livelihood of selfsupporting persons who had more than one means of livelihood. It has already been mentioned in section 2 of chapter IV that the
agricultural classes had more often a seconrlary means of livelihood than the non-agricultural classes, principally because mixed agricultural means of livelihood were far from uncommon. Among the agricultural classes 24·5 per cent were self-supporting persons, 20·0 per cent being self-supporting persons without a secondary means of livelihood, and 4·5 per cent being self-supporting persons with a secondary means of livelihood.
In the non-agricultural classes there was a higher proportion of self-supporting persons, but a smaller proportion of them had a secondary means of livelihood. There were 4,973,160 self-supporting persons in the nonagricultural classes in Bombay, Saurashtra and Kutch of whom 4,462,047 had no secondary means of livelihood, and 511,113 had a seCOndary means of livelihood. Among the non-agricultural classes 30·3 per cent were self-supporting persons, 27·2 per cent being self-supporting persons without a secondary
means of livelihood, and 3·1 per £ent being A (BlE) H gl-lOc
self-supporting persons with a secondary means of livelihood. The proportion of the nonagricultural classes who had a secondary means of livelihood was smaller than among the agricultural classes. 10· 3 per cent of the selfsupporting persons in the non-agricultural classes had a secondary means of livelihood, while among the agricultural classes the percentage of self-supporting persons with a secondary means of livelihood was as high as 18·6 per cent. The following table indicates the frequency of a secondary means of livelihood among self-supporting persons in the nonagricultural classes;-
Non-Agricultural Classes in Bombay, Saurashtra and Kutch
Number of self
lupporting persons
belonging to-
Livelihood Class V (Production other than cultivation) .. , 1,782,760
Livelihood Class VI (Commerce) .. , 887,580
Livelihood Class VII (Transport) .. , 277,392
Livelihood Class VIII (Other services and miscellaneous
sources) 2,025,428
Total for all non-agricultural liveli-hood classes 4,973,160
Number of persons in column I
who returned a secondary means of
livelihood,
2
184,687
101,685
20,944
203,797
511,113
Percentage of self-supporting persons who had a secondary
means of livelihood to
the total number of self
supportinlt persons in the
livelihood class, 3
10'4
II'S
7'6
10'1
10'3
The proportion of self-supporting persons in livelihood class VII (Transport) who had a secondary means of Hvelihood was lower than in other classes presumably because, in the case of rail transport particularly, the principal means of livelihood was apt to be a full time job, permitting' no subsidiary employment, and hence reducing the chances of a person having a secondary means of livelihood.
For slightly less than half the self-supporting persons in the agricultural classes who returned a swondary means of livelihood,

76 NON-AGRICULTURAL CLASSES
agriculture provided the secondary means of
livelihood. Among the non-agricultural
classes, however, two-thirds of the self-support
ing persons in the non-agricultural classes who
had a secondary means of livelihood derived their secondary means of livelihood from agricultural sources. The following table shows
the secondary means of livelihood returned by self-supporting per~ons in the non-agricultural
classes :-
Source of secondary means of livelihood of selfsupporting persons in the non
agricultural classes in Bombay, Saurashtra
and Kutch
Livelihood Class.
I-Cultivation of owned land II-Cultivation of unowned land
III-Agricultural labour IV-Rent on agricultural land
V-Production other than cultivation .. VI-Commerce
VII-Transport VIII-Other services and miscellaneous
sources
Persons.
124,261 36,786 41,616
125,900 50,142 37,324
5,291 89,793
Total ., 511,113
Among the agricultural classes cultivation of
unowned land and agricultural labour were
the two most important secondary means of livelihood of self-supporting persons with
a secondary means of livelihood. Among non
agriculturists, however, the position was reversed
and the cultivation of owned land and rent
from agricultural land were the two most important sources. In Greater Bombay, where
only 5,091 self-supporting persons derived
their principal means of livelihood from
agriculture, there were as many as 12,214 self
supporting persons belonging to the non
agricultural classes whose secondary means of
livelihood was cultivation of owned land, and
12,607 whose secondary means of livelihood was
rent on agricultural land. These figures of
persons in Greater Bombay who derived a secondary means of livelihood from rrgriculture seem plausible, while in 1921 the figures
of persons in Bombay City who were returned
as partly agriculturists were obviously severely
understated.
Secondary means of livelihood of earning dependants
An earning dependant was a person
who had an income, but an income that was
not sufficient to maintain himself or herself. The livelihood class of an earning dependant
was determined by the principal means of
livelihood of the person on whom he or she was dependent.
Within the four component non-agricultural
livelihood classes, the percentage of recorded
,earning dependency varied considerably.
1Q·1 per cent of the total population belonging
to livelihood class V (Production other than cultivation) were earning dependants; in
livelihood class VIn (Other services and
miscellaneous sources) the percentage was
7· 6; while in Commerce and Transport the proportions were lower, being 4·8 and 4·7 per
cent respectively. The higher percentage of
earning dependency in livelihood class V is
associated with the greater opportunities that exist for dependants to assist in a family
occupation of the cottage industry variety.
Livelihood class VIn includes mazdoors
and in this livelihood class too there
were opportunities for dependants to work as casual labourers particularly when the heads
of the households were Similarly employed.
Among those belonging to Commerce and
Transport the incentive as well as the opportuni
ties for dependants to assist were diminished.
Earning dependency' was primarily
a characteristic of females. In the agricultural
classes three out of four earning depen~ants were women; among the non-agricultural
classes the proportion was lower-three out of
five. While, however, 21· 3 per cent of the
persons who belonged to the agricultural
classes were earning dependants, only 7·8 per cent of the persons who belonged to
the non-agricultural classes were earning dependants. A fundamental difference in

NON-AGRICULTURAL CLASSES 77
pattern between the agricultural classes and the non-agricultural.,classes is revealed by these
figures. Among the non-agricultural classes
a smaller proportion were earning dependants,
because among those classes there was less
opportunity and less necessity for women and
other dependants to augment the family income
by working.
Earning dependants in the non-agricultural
classes derived their own incomes mainly from
Production other than cultivation, and Other
services and miscellaneous sources. The
precise occupations from which they derived their incomes were not tabulated. 7·8 per
cent of the persons who belonged to the
non-agricul~ral classes were earning dependants. The distribution of this percentage,
according to the livelihood class from which the persons concerned derived their incomes,
has been shown in the table opposite :-
Secondary means of livelihood of earning dependants in the non-agricultural
classes in Bombay, Saurashtra and Kutch
Livelihood Class.
I-Cultivation of owned land II-Cultivation of unowned land
III-Agriculturalla'bour ' .. IV-Rent on agricultural land .. , V -Production other than culti-
vation VI-Commeree VII-Transport
VIII-Other services and miseel-laneous sources
Total ' ..
Number of earning
dependants in the non-agri
cultural classes derivi!lg their own Income
from the means of livelihood.
shown in _ column I.
2
81,095 31,644 160,637 16,109
406579
145,360 19,004
410,232
1,270,660
Proportion which means of livelihood
shown in column I formed of percentage
of 7'8.
3
0'5 0'2 I'D 0'1 2'5
0'9 0'1 2'5
7'S
SECTION 3
EMPLOYERS, EMPLOYEES AND INDEPENDENT WORKERS; AND EMPLOYMENT IN FACTORIES AND SMALL-SCALE INDUSTRIES
An innovation at the 1951 census was the tabulation of self-supporting persons in the non-agricultural classes into employers, employees, and independent workers,
An "employer" was· defined at the census enumeration as a person who had necessarily to employ other persons in order to carryon the business from which he secured his livelihood, Thus, if a person employed a cook or other person for domestic service he was not to be recorded as an "employer" merely for that reason.
An "employee" was a person who ordinarily worked under some other person for a salary or a wage in cash or in kind, as the means of earning his livelihood, There might be persons who were employed as managers, superintendents, agents etc., and in that capacity controlled other workers. Such persons were employees nevertheless and were not to be recorded as employers.
An "independent worker" meant a person who was not employed by anyone else and who did not employ anybody else in order to earn his livelihood.
Cases did occur of government servants being recorded in breach of the instructions as employers or even independent workers but in general the meaning of the terms was fairly well understood. There were other marginal cases where the assignment of a person to one of these three groups by an enumerator without hesitation was not always possible. In general, however, the terms were fairly well comprehended and data of considerable value were collected.
The 143,895 self-supporting persons, referred to in the preliminary section, who derived their principal means of livelihood from unproductive means of livelihood, constituted 2·89 per cent of the self-supporting persons belonging to the non-agricultural classes. They formed a residuary category of "Others" who were neither employers, employees, nor independent workers. In the table which follows the per., centage of the self-supporting persons in the non-agricultural classes who were I returned as employers, employees, independent workers, and " Others" has been shown. The rural/urban break-up has also been exhibited.

78 NON-AGRICULTURAL CLASSES
Self-supporting persons in the non-agricultural classes in Bombay, Saurashtra and Kutch
General population ...
Rural population
Urban population
Percentage who were returned as
Employers.
4'65
2'65
5'52
Employees.
50'25
29'28
59'38
Independent
worken.
42'21
64'94
32'31
Othen.
2'89
3'13
2'79
The principal feature of interest in. these figures is that independent workers were relatively twice as numerous among selfsupporting non-agriculturists in the rural as compared with the urban areas, while in the case of employees these ratios were reversed. The ratio of employers to employees was roughly the same in both rural and urban areas. There were approximately eleven employees to every employer in both rural and urban areas. Less significance is however to be attached to this result, which is the aggregation of all industries and services, than to analysis of the ratios of employers, employees and independent workers among the various non-agricultural occupational sub-divisions.
The reason why independent workers preponderated in the rural areas and employees in the towns is obvious. Many of the selfsupporting persons in the non-agricultural classes in the rural areas were independent craftsmen or artisans, while in the bigger population centres the opportunities for independent employment were reduced. The greater the concentration of population the higher the percentage of employees tended to be. Thus in Greater Bombay it was 76 per cent, and in Ahmedabad and Poona 62 per cent, while in the area as a whole it was only 50 per cent.
The ratios of employers, employees and independent workers have been exhibited by natural divisions and districts for the general, rural and urban population in Subsidiary Tables 5 ·1, 5·1 A and 5·1 B. Kutch, Saurashtra and the Deccan Southern Division returned higher proportions of independent workers and lower proportions of employees than other natural diVisions in the area.
Employers, Employees and Independent Workers within the four non-agricultural livelihood
claSses
In addition to the variation in the pattern of employers, employees and independent workers in the urban as contrasted with the rural areas fundamental differences are also discernible if the analYSis is based on livelihood classes. In the table below the percentage of the selfsupporting population within the four nonagricultural livelihood classes who were returned as employers, employees and independent workers has been shown:-
Percentage of the self-supporting population in the four non-agricultural livelihood classes
in Bombay, Saurashtra and Kutch who were returned as-
Livelihood Class. Emplo- Emplo- Indepen-
yers. yees. dent Othell. worken.
V-Production other than cultivation ... 3'2 51'8 45'0 Nil.
VI-Commerce 14'0 29'6 56'4 Nil. VII-Transport 2'1 77'5 20'4 Nil. VIII-Other servIces
and miscellaneous sources 2'2 54'2 36'5 7'1
Perhaps the most interesting point brought out by these figures is the extent to which the independent worker dominated the field of commerce. A large number of those engaged in commerce were small traders. The ratio of employees to employers in Commerce was as low as2:1.
In Transport, on the other hand, the overwhelming majority were employees. Rail transport was state-owned, air transport company-owned, while transport by sea likewise offered few opportunities to independent workers. Only road transport, which included bullock-cart men, tonga drivers, pliers of hand carts, and owners of pack animals as well as bus and lorry drivers offered real scope to independent workers. But for such persons, the proportion of independent workers in the Transport livelihood class would have been lower than it was.
In livelihood class V (Production other than cultivation) 51·8 per cent were employees and 45·0 per cent independent workers. There was however a fundamental difference in the pattern as between the urban and rural areas in this livelihood ~lass. In the urban

NON-AGRICULTURAL CLASSES 79
areas the percentage of employees was high,
while in the rural" areas the independent workers dominated the picture as the follow-
ing table shows:-,
Self-supporting persons in livelihood class V
General population
Rural population
urban population
Percentage who were
Employers, Employees. Independent workers,
51'B
19'2
67'1
45'0
78'3
29'3
In rural areas many of the persons belonging to livelihood class V were blacksmiths, carpenters, weavers, and exponents of other crafts, who were normally self-employed, In the urban areas however the factory or larger workshop dominated the industrial scene, and the independent artisan of the rural areas
became, in the urban areas, an employee, That the proportion of independent workers
in class V i~ the urban areas was as high as 29·3 per cent was due to the fact that whereas
in Greater Bombay and Gujarat, the most industrialised areas, the percentage of independent workers was as low as 10, 5 and 26 per cent the proportions in Kutch, the Deccan Southern Division and Saurashtra were as high as 76, 69· 7 and 60 per cent, In these latter areas the independent artisan in Production still held his own,
Livelihood class VIII-Other services and
miscellaneous sources,-as its very name
implied, would tend to have a smaller propor
tion of independent workers in both the rural and urban areas than livelihood class V, 38,9
per cent of the self-supporting persons in
livelihood class VIII in the rural areas of
Bombay, Saurashtra and Kutch were employees,
while in livelihood class V the corresponding
proportion was 19, 2 per cent. In the rural
areas carpenters, blacksmiths and weavers were
typical representatives of livelihood class V,
and teachers and government servants of livelihood class VIII, In other words, the typical
representative of livelihood class V in the rural
areas tended to be an independent worker, and the typical representative of livelihood class VIII
an employee.
SECTION 4
PRIMARY INDUSTRIES OTHER THAN CULTIVATION, MINING AND QUARRYING
Division 0 of the Indian Census Economic
Classification Scheme comprised Primary Indus
tries not elsewhere specified. A total of
209,552 self-supporting persons in Bombay,
Saurashtra and Kutch were returned as belong
ing to this division. They comprised 4·34 per
cent of the self-supporting persons belonging
to all Industries and Services.
This division had six sub-divisions, of which stock raising outweighed in importance the
other sub-divisions. In the table opposite the
actual number of self-supporting persons classi
fied under each sub-division, and the propor
tion that they constituted of all the self-support
ing persons in division 0 has been shown :-
Division O-Primary Industries not elsewh~re specified
Bombay, Saurashtra and Kutch
No, of self- Percentage of supporting self-supporting
persons belonging persons in division to sub-division 0 who belonged
Sub-division.
0'1 Stock Raising 0' 2 Rearing of small animals
and insects 0' 3 Plantation Industries 0' 4 Forestry and collection of
products not elsewhere specified ...
0'5 Hunting (including trapping and Game Propagation)
0'6 Fishing ...
in column I. to sub-division shown in column J.
2 3
112.B14 53'8
1.040 0'5 8.308 4'0
31,402 15'0 740 0'3
55,248 26'4
As might be expected in the case of industries, many of which were ancillary to agriculture, the great majority of the persons engaged in the occupations in this division were found

NON-AGRICULTURAL CLASSES
in the rural as distinct from the urban areas. 153,647 of the self-supporting persons classified under this division were in the rural areas, and 55,905 in the urban areas of Bombay, Saurashtra and Kutch. Thus, though the persons in division 0 comprised only 1·7 per cent of the self-supporting persons belonging to all Industries and Services in the urban population, they comprised as much as 10·5 per cent of the self-supporting persons belonging to all Industries and Services in the rural population.
The occupations comprised in this division were of particular prominence in the coastal Konkan districts, where forestry and fishing were very important. As much as 12·4 per cent of the self-supporting persons belonging to all Industries and Services in the Konkan natura,l division belonged to division 0, as compared with 4'3 per cent returned for the area under report as a whole. Division 0 was also of more than average importance in Saurashtra and Kutch, where stock raising was an important occupation.
Sub-division 0 . I-Stock Raising
Stock raising engaged 112,814 persons in Bombay, Saurashtra and Kutch, more than half the persons belonging to division O. The occupation was of particular importance in Kutch, Saurashtra, and Gujarat in Bombay State, traditional cattle-raising centres. Every district in Saurashtra returned a fairly high number of persons as engaged in stock raising, as did Mehsana and Ahmedabad districts in Bombay State.
The sub-division embraced herdsmen and shepherds, and breeders and keepers of cattle and buffaloes. The number of self-supporting persons returned at the census as principally dependent on cattle breeding fails to indicate the great importance of these occupations in the rural economy. Many cultivators keep milch buffaloes as well as draught animals. Women and children frequently look after them, thereby augmenting the family income. It seems probable that in such cases the head of the family was classified properly under one of the agricultural livelihood classes, and the other members of the family did not figure in the B-I1I table which was reserved for self-supporting persons in industries and services, leading to still further understatement of the importance of this means of livelihood.
Sub-division o· 2-Rearing of small animals and insects
The rearing of small animals and insects, poultry farmers, Bee-keepers, etc., accounted for only 1,040 self-supporting persons in Bombay, Saurashtra and Kutch. Most of them were in Kaira, Surat and Panch Mahals districts. Bee-keeping was the particular occupation specified in the case of Panch Mahals district.
As in the case of stock raising, the keeping of poultry is a side-line with agriculturists in most
- places, but as it was not their principal means of livelihood, it was not classified in the B-IlI table.
Sub-division O· 3-Plantation Industries Only 8,308 persons in .Bombay, Saurashtra
and Kutch were returned as belonging to this sub-division. There are no tea, coffee or rubber plantations in the area, and most of the . persons classified under this sub-division were persons who engaged in market-gardening or the cultivation of special crops. About half the total number were found in Saurashtra State, principally in Madhya Saurashtra district. In Bombay State the largest number was found in Gujarat, principally Mehsana district.
The cultivation of special crops in conjunction with the ordinary cultivation. of field crops did not qualify for inclusion in industries and services, so that as in the case of stock raising the true importance of market-gardening and vegetable-growing has not been brought out by the figures because a fair proportion of the persons engaged in it were probably returned as belonging to one of the four agricultural classes.
Sub-division O·4-Forestry and collection of products not elsewhere specified
31,402 persons in Bombay, Saurashtra and Kutch were returned as engaged in forestry and collection of products not elsewhere specified., There were four groups within this sub-division-persons concerned with the planting and conservation of forests, charcoal burners, collectors of forest produce and lac, and woodcutters. These occupations were of particular importance in the Konkan, particularly Thana, Kolaba and Kanara districts.
In the tiny Dangs district the 417 persons returned as belonging to this sub-division com· prised 22·5 per cent of the persons belonging to all Industries and Services in the district. Forestry and woodcutting were very important to the economy of the district.

NON-AGRICULTURAL CLASSES 81
Sub-divisIon o· 5-Hunting (including trapping and Game Propagation)
Hunting eng~ged only 740 self-supporting persons in Bombay, Saurashtra and Kutch, the majority being found in districts of the Deccan Northern Division in Bombay State, principally East Khandesh, West Khandesh, Ahmednagar and Poona.
Sub-division o· 6-Fishing
N ext to stock raising, fishing was the most important means of livelihood in division O. 55,248 persons in Bombay, Saurashtra and Kutch were classified under this sub-division. The great majority of the nshermen were sea fishermen, though virtually every district returned some persons as engaged in fishing, which included persons who nshed in inland waters.
Ratnagiri district, the district in Bombay State with the longest coast linc, returned 10,910 self-supporting persons as engaged in fishing. The other coastal Konkan districts of Thana, Kolaba and Kanara also returned large numbers of nshermen, as did Surat. Greater Bombay returned 5,890 nshermen.
In nshermen's families women tend to market the nsh. Thus in Ratnagiri district as against the 9,905 males and 1,005 females returned as engaged in fishing, 1,242 males and 1,021 females were returned as retailers of fish. Fishing is an occupation in which the Industrial and Trade heads tend to overlap. In the Konkan in Bombay State fishing is frequently combined with other agricultural or semi-agricultural occupations, such as garden cultivation and the rearing of poultry.
SECTION 5
MINING AND QUARRYING
Division 1 of the Indian Census Economic Classification Scheme comprised Mining and Quarrying. A total of 31,189 self-supporting persons in Bombay, Saurashtra and Kutch were returned as belonging to this division. The persons in it comprised only 0·65 per cent of the self-supporting persons belonging to all Industries and Services. It was thus the smallest occupational division of all.
This division had eight sub-divisions of which stone-quarrying, clay and sand pits, was the most important, followed by salt manufacture. In the table below the actual number of selfsupporting persons .classified under each subdivision, and the proportion that they constituted of all the self-supporting persons in division 1 has been shown ;-
Division l-Mining and Quarrying Bombay, Saurashtra and Kutch
Sub-division.
1'0 Non-metallic mining and Quarrying not otherwise classified
1'1 Coal mining 1 . 2 Iron ore mining I -3 Metal mining except iron
ore mining 1-4 Crude Petroleum and
Natural gas 1 -5 Stone·quarrying, clay
and sand pits 1'6 Mica _._ I -7 Salt, saltpetre. and saline
substances .A. (Bk) H 91-11
Percentage of the Number-of self-supporting
persons persons in belonging to division 1 sub-division who belonged to in column I. the sub-division
shown in column I. 2 3 632 2'0
92 0-3 17 0-1
2,697 8-6
50 0-2
16,497 52-9
7 11.197 35"9
19,919 persons classified under mining and quarrying were found in the rural areas and' 11,270 in the urban areas of Bombay, Saurashtra and Kutch. The persons classilied under this division comprised 1· 36 per cent of the self-supporting persons belonging to all Industries and Services in the rural population, and 0 -33 per cent of the persons belonging to all Industries and Services in the urban population.
Sub-division l'O-Non-metallic rmllIng and quarrying not otherwise classified
The majority of the 632 persons classified under this head were in Saurashtra, mainly Zalawad district. Unfortunately no details were available_
Sub-divisions 1· 1 and 1· 2-Coal mining and Iron ore mining
There are no coal mines or iron ore mines in the area. Some of the 109 persons returned under these heads might have been miners on leave, but the more probable cause of their inclusion is misclassmcation.
Sub-divisioQ 1· 3-Metal mining except iron ore mining
Manganese mines accounted for 2,266 of the 2,697 persons returned under this sub-division. The main centre of manganese mining was Panch Mahals district in Bombay State, where 2,265 persons were returned as manganese miners.

82 NON-AGRICULTURAL CLASSES
Sub-division 1· 4-Crude Petroleum and Natural gas
This sub-division was intended for oil well drillers. The 50 persons classified under this sub-division were mainly in Broach and Poona districts. In actual fact they were almost certainly oil company employees who should have been classified elsewhere.
Sub-division 1· 5-Stone-quarrying, clay and sand pits
16,497 persons in Bombay, Saurashtra and Kutch we~e returned as engaged in the extraction of stone, clay, sand and other materials used in building or the extraction of cement. Greater Bombay, Thana, Poona and Ahmednagar districts in Bombay State returned sizable numbers under this sub-division as did Sorath, Madhya Saurashtra and Halar districts in Saurashtra.
Sub-division 1· 6-Mica
The six persons returned under the above head came from a rural tract in the north of Thana district. They were all returned as independent workers. There are no mica mines in the area. It looks like a case of misclassification.
Sub-division 1· 7 -Salt, saltpetre and saline substances
Bombay, Saurashtra and Kutch are maritime States. The main centres of commercial extraction of salt from the sea in Bombay State are in the districts of Greater Bombay, Thana, Kolaba and Ahmedabad. Salt manufacture takes place in the suburban area of Greater Bombay, and in the adjacent talukas of Borivli and Bassein in Thana district, and at Uran in Kolaba district where, significantly, the great majority of the workers were employees. Salt manufacture on a large scale also takes place at Kharaghoda in Viramgam taluka in Ahmedabad district. Salt manufacture in Surat, Ratnagiri and Kanara districts was on a small scale by comparison with the four areas already mentioned.
Salt manufacture was of considerable importance in Saurashtra and Kutch. About half the persons engaged in salt manufacture in Saurashtra were found in Dasada taluka in Zalawad district where the salt is extracted, as in the case of the nearby Viramgam taluka of Ahmedabad district, by digging pits in the Little Rann of Kutch.
SECTION 6
PROCESSING AND MANUFACTURE- FOODSTUFFS, TEXTll..ES, LEATHER AND PRODUCTS THEREOF
Division 2 of the Indian Census Economic Classification Scheme comprised the processing and manufacture of foodstuffs, textiles,
leather and products thereof. A total of 1,000,241 self-supporting persons in Bombay,
Saurashtra and Kutch were returned as belonging to this division. They comprised 20·7 per cent of the self-supporting persons belonging to all Industries and Services.
This division had ten sub-divisions, of
which the cotton textiles sub-division was by far the most important. In the table opposite
the actual number of self-supporting persons
classified under each sub-division, and the
proportion that they constituted of all the selfsupporting persons in division 2 has been shown :-
Division 2-Processing and ManufactureFoodstuffs, Textiles, Leather and
Products thereof Bombay, Saurashtra and Kutch
Number of self. Percentage of supporting self -supp~rting
persons persons In Sub-division. belonging to division 2 who
sub-division belonged to in column 1. sub-division
shown in column 1. 2 3
2 . 0 Food Industries otherwise 18,146 1'8 unclassified
2'1 Crains and pulses 22,639 2'3 2' 2 Vegetable oil and dairy 38,460 3'8
products 2' 3 Sugar Industries 18,335 1'8 2' 4 Beverages 5,376 0'5 2'5 Tobacco 46,687 4'7 2' 6 Cotton textiles 603,002 60'3 2'7 Wearing apparel (except
footw~ar) and made up 108,672 10'9
textile goods 2' 8 Textile industries otherwise 62,195 6'2
unclassified 2' 9 Leather, leather
and footwear products 76,729 7'7

NON-AGRICULTURAL CLASSES 83
Most of the persons belonging to division 2 were found in tqe urban as distinct from the rural areas. 778,854 of the 1,000,241 persons in this division were found at the census in urban areas, and 221,387 in rural areas. Persons engaged in this division comprised 15· 2 per cent of the persons engaged in all Industries and Services in the rural areas, and 23· 1 per cent of the persons engaged in all Industries and Services in the urban areas.
Sub-division 2· O-Food Industries otherwise unclassified
A total of 18,146 persons in Bombay, Saurashtra and Kutch were returned as belonging to this sub-division. This sub-division included butchers and bakers, as well as persons engaged in other food industries. About one-third of the total number of persons in this sub-division were found in Greater Bombay. The Deccan Northern Division returned more persons as belonging to this sub-division than Gujarat.
Sub-division 2·1-Grains and pulses
A total of 22,639 persons in Bombay, Saurashtra and Kutch were returned as belonging to the grains and pulses sub-division. Hand pounders of rice, millers of cereals and pulses, grain parchers and other grain processers were classified under this head. As might have been expected the number of persons found under this head bore a fairly close relationship to the population of each natural division, indicating that the persons engaged in these occupations were fairly evenly distributed ...
Sub-division 2·2-Vegetable oil and dairy products
A total of 38,460 persons in Bombay, Saurashtra and Kutch were returned as belonging to the vegetable oil and dairy products sub-division. Makers of butter, cheese, ghee and other dairy products, vegetable oil pressers and renners, and manufacturers of hydrogenated oils were classified under this head. Greater Bombay returned more persons under this sub-division than any other natural division. Out of the 11,489 persons returned under this sub-division in Greater Bombay 7,442 were returned as makers of butter, cheese, ghee and other dairy products, 2,446 as vegetable oil pressers and renners, and 1,601 under hydrogenated oils (Vanaspati) manufacture.
The Deccan Northern Division returned more persons under this sub-division than any other natural division excluding Greater Bombay.
. A (Bk) H 91-11a
Vegetable oil pressing and renning and butter and dairy products making were of approximately equal importance in most natural divisions.
Sub-division 2· 3-Sugar Industries 18,335 persons in Bombay, Saurashtra and
Kutch were returned as gur manufacturers and sugar manufacturers. The great majority of these persons were engaged in sugar manufacture, and were in Bombay State, principally in the district of Ahmednagar, where as many as 7,067 persons were returned under sugar manufacture and 954 under gur manufacture. Of this total of 8,021 persons in Ahmednagar district only four were returned as employers as against 7,666 employees and 351 independent workers. The majority of the persons engaged in the sugar industry were obviously factory employees.
The sugar industry in Bombay State has expanded tremendously during the past two decades. In 1931 only 1,176 persons in the area that is now Bombay State were classified under this head. The sugar factories work on a seasonal basis. Gur manufacture, which is generally conducted in or near the cultivators' own nelds is also of great importance in the Deccan. When the gur making season is in progress in districts like Kolllapur the night is illuminated as though by a host of bonfires. The cultivators themselves participate in the gur-making, and their principal means of liveliliood has obviously been returned correctly as agriculture. The number of persons returned under Sugar Industries does not fully convey, therefore, the impOltance of gur manufacture as a subsidiary seasonal occupation. About two-thirds of the persons returned under Sugar Industries were found in rural areas, and the great majority were employees, as most of the persons were engaged in sugar renning factories.
Sub-division 2· 4-Beverages Only 5,376 were returned under Beverages
in Bombay, Saurashtra and Kutch. The subdivision comprised brewers and distillers, toddy drawers, ice-manufacturers, and manufacturers of aerated waters and other beverages. About one-third of the total number of persons classified under this head were found in Greater Bombay. Elsewhere the numbers were fairly evenly distributed among the various districts, the more " backward" districts returning, however, a smaller number of persons as engaged in these occupations, which are really semi-luxury trades .

84 NON-AGRICULTURAL CLASSES
Sub-division 2·5-Tobacco
A total of 46,687 persons in Bombay, Saurashtra and Kutch were returned under Tobacco, a sub-division which included the manufacture of bidis, cigarettes, and other tobacco products, and the preparation of the raw leaf tobacco for manufacture. The number of persons returned under this head showed a tremendous rise by comparison with 1931. Greater Bombay, Mehsana, Ahmedabad, Kaira, N asik and Poona districts all retumed more than 2,000 self-supporting persons under this head. Every district except the tiny Dangs returned some people as engaged in tobacco manufactures.
Sub-division 2· 6-Cotton textiles
The manufacture of cotton textiles, which included cotton ginning and cleaning, cotton spinning, sizing and weaving, and cotton dyeing and bleaching, was the biggest single industry in the area under report. A total of 603,002 were returned as engaged in cotton textiles manufacture.
The main centres of cotton textiles manufacture were Greater Bombay, Ahmedabad and Sholapur. In the following table the number of self-supporting persons classifIed under this sub-division in 1951 has been compared with the number returned as "principal earners" in 1931. In all three districts textile mills account for the bulk of the persons engaged in cotton textiles manufacture as is proved by the fact that all except a small fraction in 1951 were returned as employees and not independent workers.
Cotton textiles manufacture
Figures of self-supporting Fignres of .. principal persons in 1951. earners" in 1931.
District. Persons. Male~. Females. Persons. Males. Females.
Greater Bombay ... 225,508 208,909 16,599 115,893 99,155 16,738
Ahmedabad 131,679 125,208 6,471 51,724 42,207 9,517
Sholapur ... 40,922 37,529 3,393 38,091 30,266 7,825
There are good grounds for believing that Ahmedabad City was under-enumerated in 1931. Moreover 1931 was a slump year. Even after making allowance for these two factors, however, there has been a considerable increase in the number of persons engaged in cotton textiles manufacture in 1951 as compared with
1931 in Greater Bombay and Ahmedabad. A rather fascinating problem i~ presented by the female figures. The number of self-supporting females engaged in this industry has shown a decrease in each case between 1931 and 1951.4
It looks as though, with the trend towards equal pay for equal work, and other labour legislation, there must today be an increasing tendency to employ male labour, which is ineligible for maternity benefIt.
In addition to these main centres there are cot.ton textile mills at many other places, ranging from N adiad in Kaira district to J algaon in East Khandesh, and Hubli in Dharwar district. There is a flourishing power-loom industry in Surat district where 19,936 persons were classified under cotton textiles. Ilkal and Banhatti in Bijapur district, Bhiwandi in Thana district and Malegaon in N asik district were important centres of the handloom industry. Every district returned some people as cotton ginners, spinners, or weavers and only in the nine districts of Banaskantha, Sabarkantha, Panch Mahals, Amreli, Dangs, Satara North, Satara South, Kolaba and Kanara was the number classified under cotton textiles manufacture less than three thousand.
Sub-division 2·7-Wearing apparel (except footwear) and made up textile goods
Tailors comprised the vast majority of the persons classified under this sub-division, though the group also included hat makers, and manufacturers of hosiery, umbrellas, and other made up textile goods. Principally because of the ubiquitousness of the "darzi" the number of persons classified under this sub-division bore a fairly close relationship to the population of every division, except the unrepresentative area of Greater Bombay. For every 1,000 of total population there were 9·1 self-supporting persons in this sub-division in Greater Bombay, 3·2 in Saurashtra, 2·5 in Kutch, 2·4inGujarat, 2·1 in the Deccan Southern Division, 2· ° in the Deccan Northem Division, but only 1·3 in the Konkan, which is a poorer tract.
A total of 108,672 persons were classified in Bombay, Saurashtra and Kutch under this sub-division. Although the majority of the persons in this sub-division were found in urban as distinct from rural areas, independent
4 Enumerators were clearly more willing to return women as principal earners in 1931 than they were to return them as self-supporting persons in 1951. Even after making allowance for this, however, the drop in the proportion of women among cotton textile mill workers between 1931 .and 1951 seems real.

NON-AGRICULTURAL CLASSES 85
workers outnumbered employees in both urban and rural areas. This was because most tailors operate as one-man outfits, and are independent artisans, and not employees in shops or establishments.
Sub· division 2·8-Textile Industries otherwise unclassified
Textile Industries otherwise unclassified included rope-making, woollen and silk spinning and weaving and rayon manufacture, as well as other (including insufficiently described) textile industries. A total of 62,l95 persons in Bombay, Saurashtra and Kutch were classified under this sub-divi~ion. Greater Bombay returned 13,420 persons under this sub-division of whom 9,284 were engaged in silk spinning and weaving. Surat district returned 9,556 persons under this head, of whom 6,405 were engaged in the "jari" industry. Thana district returned 4,525 persons, woollen spinning and weaving accounting for 2,777 persons and rayon manufacture for 352. In several of the Deccan districts rope-making accounted for the bulk of the persons included in this sub-division. In districts where the majority of persons classified under this head were urban dwellers they tended to be employees, employed in silk,
woollen, or other factories. In districts where rural dwellers preponderated they tended to be rope makers and independent workers, since rope-making is largely a cottage industry.
Sub-division 2· 9-Leather, leather products and footwear
Persons classified under this sub-division included tanners, cobblers, and makers and repairers of all other leather products. The " mochi" or shoe-maker may be taken as the stereotype of persons classified under this subdivision. A total of 76,729 persons in Bombay, Saurashtra and Kutch were classified under this sub-division.
Greater Bombay returned 10,710, of whom 6,057 were shoe-makers, 2,763 were tanners, and 1,890 were manufacturers and repairers of other leather products. Because, elsewhere, the shoe-maker was the stereotype, the majority of the persons belonging to this sub-division were found in rural and not urban areas. Persons classified under this sub-division were distributed fairly evenly among the various natural divisions. Relatively, however, to their populations Saurashtra and Kutch seemed to have more than their fair share of shoemakers and leather workers.
SECTION 7
PROCESSING AND MANUFACTURE-METALS, CHEMICALS AND PRODUCTS THEREOF
Division 3 of the IJ4dian Census Economic Classification Scheme comprised the processing and manufacture of metals, chemicals and pro
ducts thereof. A total of 215, 298 self-support
ing persons in Bombay, Saurashtra and Kutch
were returned as belonging to this division. They comprised 4:5 per cent of the self-supporting persons belonging to all Industries and Services.
This division had nine sub-divisions, of which the manufacture of metal products otherwise
unclassified and the manufacture of transport
equipment were the two most important categories. In the table opposite the actual number
of self-supporting persons classified under each
sub-division, and the proportion that they constituted of all the self-supporting persons in division 3 has been shown ;-
Dioision 3-Processing and ManufactureMetals, Chemicals and Products thereof \
Bombay, Saurashtra and Kutch
Sub-division.
Number of self-supporting
persons belonging to sub-division in column I.
Percentage of self-supporting persons in o:livi
sion 3 who belonged to sub.division
2 shown in column 1.
3
3'0 Manufacture of metal products 94,337 otherwise unclassified
3'1 Iron and Steel (Basic Manu- 10,677 facture)
3'2 Non-Ferrous Metals (Basic 1,625 Manufacture)
3°3 Transport Equipment 44,174 3°4 Electrical machinery, apparatus, 6,654
appliances and supplies 3'5 Machinery (other than electri- 29,587
cal machinery) including Engineering Workshops
3'6 Basic Industrial Chemicals, 6,778 Fertiliser and Power Alcohol
3°7 Medical and Pharmaceutical 4,465 preparations
3-8 Manufacture of chemical pro- 17,001 ducts otherwise unclaasified
43°8
5'0
0°8
20°5 3'1
13°7

86 NON-AGRICULTURAL CLASSES
Most of the persons returned as belonging to division 3 were found in the urban as distinct from the rural areas. 176.,473 of the 215,298 persons in this division were found at the census in urban areas, and 38,825 in rural areas. Persons engaged in this division comprised 2·7 per cent of the persons engaged in all Industries and Services in the rural areas, and 5·2 per cent of the persons engaged in all Industries and Services in the urban areas.
Sub-division 3· O-Manufacture of metal products otherwise unclassified
A total of 94,337 persons in Bombay, Saurashtra and Kutch were returned as belonging to this sub-division. The sub-division included blacksmiths, coppersmiths and workers in other metals, as well as ordnance factory and mint workers. Because of the great importance of blacksmiths to the economy of rural areas persons belonging to sub-division 3·0 constituted 73·8 per cent of all the self-supporting persons belonging to division 3 in the rural areas, but only 37·2 per cent of all the self-supporting persons belonging to division 3 in the urban areas. The great majority of persons classified under this sub-division in the rural areas were independent workers and not employees. In absolute numbers however there were only 28,635 persons classified under sub-division 3·0 in the rural areas as compared with 65,702 in the urban. Another feature of this subdivision was the very low ratio of females to males within it, principally because male brawn is required for plying the trades included in this sub-division.
to,070 of the 94,337 persons in this sub-division were found in Greater Bombay. 9,057 of these were blacksmiths and other workers in iron, and 1,339 were mint workers and die makers. Next to Greater Bombay came Poona district with 22,933 persons in this sub-division, of whom 15,989 were ordnance factory workers, and Thana district with 4,861 persons, of whom 2,015 were ordnance factory workers. In other districts the number of persons in this sub-division was fairly evenly distributed, principally because blacksmiths, coppersmiths and other metal workers were found practically everywhere.
Sub-division 3 . I-Iron and Steel (Basic Manufacture)
10,677 persons were returned as engaged in the manufacture of iron and steel, which included smelting, rolling, and casting. 7,077 were in Greater Bombay, and 1,218 in Ahmedabad. Satara South and Surat returned a few
hundred persons. Other districts returned very small numbers in this ~roup, and some none at all.
Sub-division 3·2-Non-Ferrous Metals (Basic Manufacture)
1,625 persons were returned as engaged in non-ferrous metals (basic manufacture), of whom 833 were in Greater Bombay.
Sub-division 3·3-Transport Equipment 44,174 persons were returned as engaged in
the manufacture of transport equipment. Almost half the persons classified under this head were in Greater Bombay. Persons engaged in the assembly of automobiles, the manufacture of lorry bodies, and bicycle manufacture formed part of the total of 23,381, but railway workshops accounted for the largest number.
Railway workshops at Hubli in Dharwar district and at Godhra in Panch Mahals led to these two districts returning more persons under this sub-division than any other district except Greater Bombay. 4,354 persons were returned as railway fitters in Dharwar district, and 2,676 in Panch Mahals.
Sub-division 3· 4-Electrical machinery, apparatus, appliances and supplies
Only 6,654 persons in Bombay, Saurashtra and Kutch were classified under this sub-division, which included the manufacture of electric lamps, fans, wire and cable, and other electrical appliances and equipment. 5,620 of them were in Greater Bombay, 320 in Ahmedabad, and 149 in Poona. In every other district they numbered less than a hundred.
Sub-division 3· 5-Machinery (other than electrical machfuery) including
Engineering Workshops This sub-division accounted for 29,587
persons in Bombay, Saurashtra and Kutch, of whom 17,166 were in Greater Bombay, 2,401 in Thana, 2,138 in Poona and 1,233 in Satara North. Every other district returned less than a thousand persons under this head of engineering workshops and mechanics. Sub-division 3· 6-Basic Industrial Chemicals,
Fertiliser and Power Alcohol Only 6,778 persons were classified under the
head of basic industrial chemicals and fertiliser manufacture. The most important districts were Greater Bombay with 1,836 persons, Amreli with 1,802 persons, Zalawad in Saurashtra with 930 persons, and Thana district with 778 persons. A salt and heavy chemicals factory at Mithapur in Amreli district, a chemicals factory at Dhrangadhra in Zalawad district, and a chemicals factory at Ambarnath

NON-AGRICULTURAL CLASSES 87
1n Thana district, principally' accounted for these figures. Sub-division 3'7-Medical and Pharmaceutical
preparations 4,465 persons were returned as engaged in
the manufacture of medical and pharmaceutical preparations, of whom 2,410 were in Greater Bombay and 882 in Baroda. These were thc most important centres of the industry.
Sub-division 3· 8-Manufacture of chemical products otherwise unclassified
The chemical products otherwise unclassified sub-division consisted of such diverse items as perfumes, soaps, paints and varnishes, ink,
matches, and c~ndles. As with so many of the sub-divisions in the metals and chemicals division Greater Bombay accounted for almost half the total number-7,456 out of 17,001. The manufacture of soap and cleaning compounds accounted for 2,960 perso)1s in Greater Bombay and was the biggest group.
Thana district returned 3,100 persons in this sub-division, the manufacture of matches accounting for 2,123 persons. A match factory at Ambarnath in Thana district, about 40 miles from Bombay, accounts for the 'bulk of the production of matches in Western India.
SECTION 8
PROCESSING AND MANUFACTURE-NOT SPECIFIED ELSEWHERE
Division 4 of the Indian Census Economic Classification Scheme comprised processing and manufacture-not specified elsewhere. A total of 326,480 self-supporting persons in Bombay, Saurashtra and Kutch were returned as belonging to this division. They comprised 6·76 per cent of the self-supporting persons belonging to all Industries and Services.
This division had ten sub-divisions, of which wood and wood products manufacture, which included carpenters, sawyers and basket makers, was the most important. In the table below the actual number of self-supporting persons classified under each sub-division, and the proportion that they cohstituted of all the selfsupporting persons in division 4 bas been shown :-
Division 4-Processing and ManufactureNot elseWhere specified
Bombay, Saurashtra and Kutch Percentage of
Number of self-supporting self -supporting persons in
Sub-division. persons belonging division 4 who to sub-division in belonged to
4 ° 0 Manufacturing Industries otherwise unclassified
4 °1 Products of petroleum and coal
4' 2 Bricks, tiles and other structural clay products
4'3 Cement-Cement pipes and other cement products
4'4 Non-metallic mineral products
4' 5 Rubber products 4 '6 Wood and wood products
other than furniture and fixtures
4' 7 Furniture and fixtures 0"
4 . 8 Paper and paper products 4'9 Printing and Allied
Industries
column I. sub-division in column I.
2 3 64,127 19'6
1,138 0'3
15.603 40S
5,529 1°7
53,749 160S
3.154 1'0 J4J ,579 43"4
6,873 2°1 2,932 0°9
31,796 9"7
137,764 out of the 326,480 persons in this division were found in the rural areas, ann 188,716 in the urban areas. Though the absolute number of persons found in the urban areas exceeded those found in the rural areas, persons belonging to this sub-division comprised only 5·60 per cent of the persons belonging to all Industries and Services in the urban population as against 9·43 per cent of the persons belonging to all Industries and Services in the rural population. In other words the occupations comprised in this division were of comparatively greater importance to the economy of the rural areas than of the urban areas. The reason lay in the great importance of carpenters, potters and goldsmiths, three crafts included in this division, in the rural areas.
Sub-division 4·0-Manufacturing Industries otherwise unclassffied
A total of 64,127 persons in Bombay, Saurashtra and Kutch were' returned as belonging to this sub-division. By far the most importan group in this sub-division were the workers in precious . stones, precious metals and makers of jewellery and ornaments. There were 47,247 goldsmiths. The goldsmith is a featurei of the rural as well as the urban scene, since l
much rural as well as urban investment takes: the form of buying gold and silver ornaments.! This fact accounted both for the comparatively high ratio of rural to urban workers in the. sub-division, and .for the fact that in urban as: well as rural areas independent workers heavily outnumbered employees in this sub-division, since most goldsmiths are craftsmen who work: on their own.
Even in Greater Bombay, where 14,311 persons were classified under this sub-division as many

88 NON-AGRICULTURAL CLASSES
as 6,697 were goldsmiths; 2,934 were engaged
in ivory and bone products manufacture; 1,906 in the manufacture of plastic and celluloid articles, (as in the case of matches manufacture the number of persons returned as engaged in the industry fails to convey the extent of the output of which the plastics industry is capable); 1,367 in watches and clocks repair and manufacture; 458 in toy making; 392 in the
manufacture of stationery articles other than paper and paper products; 285 in photographic and optical goods manufacture; 149 in musical instruments manufacture; 73 in scientific instruments manufacture; and 50 in SP9rts goods manufacture.
In other districts too the majority of the persons classified under sub-division 4·0 were goldsmiths, while ivory and bone products manufacture and watches and clock repairing accounted for most of the remainder.
Sub-division 4· I-Products of petroleum and coal
This sub-division was intended for kerosene and petroleum refineries, and the manufacture
of products from petroleum and coal. Greater Bombay and Amreli districts accounted for more than half of the 1,138 persons classified, with doubtful accuracy, under this head. In Amreli they seem to have been oil company employees employed on an oil company's instal
lation which was not really a refinery.
Sub-division 4· 2-Bricks, tiles and other structural clay products
15,603 persons in Bombay, Saurashtra and
Kutch were classified as engaged in bricks, tiles
and other structural clay products manufacture. Brick makers were found in every district except Dangs. The districts which returned the largest number of persons in this group were Ahmedabad, Greater Bombay, and Surat, in each
of which more than 1,700 persons were returned as engaged in brick making. The ratio of women to men in this sub-division was higher than in most industrial occupation groups.
Sub-division 4· 3-Cement-Cement pipes and other cement products
" 5,529 persons were returned as engaged in
the manufacture of cement, cement pipes and cement products. There are cement factories at Sevalia in Kaira district and Dwarka in Amreli
district in Bombay State. In Kaira district 1,706 persons were classified under this subdivision; in Amreli district, 973. Asbestos cement products are manufactured at Mulund in Thana district, and 1,172 persons were classified under sub-division 4·3 in that district. In Greater Bombay 710 persons were classified under cement pipes and other cement products manufacture.
Sub-division 4·4-Non-metallic mineral products 53,749 persons in Bombay, Saurashtra and
Kutch were classified under non-metallic mineral products. They comprised 16·5 per cent of the total number of persons in division 4. Potters formed the biggest single group within this sub-division. About two out of three of the persons found in this sub-division were in the rural areas, and in both the urban and
rural areas independent workers outnumbered employees. The sub-division also included the
manufacture of glass beads and bangles and other glassware, and makers of porcelain and crockery.
There were very few districts in which potters did npt outnumber all other groups in this sub-division. One of these was Greater Bombay where only 585 persons were returned as potters as against 620 makers of porcelain and crockery, 647 glass bangles and beads makers, 2,773 persons making glassware, and
169 lime bu~ners.
Relative to their populations Saurashtra among other natural divisions in the area returned a very high number of persons in this sub-division, followed by Gujarat.
Sub-division 4·5-Rubber products Rubber products manufacture was a very
small category in which only 3,154 persons
were engaged, of whom 2,318 were in Greater

NON-AGRICULTURAL CLASSES 89
Bombay where there is a tyre factory. Most
districts however·returned a few persons under this head, the manufacture of toy balloons
accounting for many of these scattered few.
Sub-division 4·6-Wood and wood products other than furniture and Gxtures
A total of 141,579 persons in Bombay, Saurashtra and Kutch were returned as belonging to this sub-division. They comprised 43·4
per cent of the persons belonging to division 4.
This was thus the most important sub-division
within division 4. The number of persons classi
fied as belonging to this sub-division was about
the same in the urban as in the rural areas.
Carpenters and joiners comprised the bulk of
the persons in this sub-division, sawyers and basket makers bringing up the rear. Carpentry is an important rural craft. Because
carpenters are found everywhere the number of persons found in this sll:b-division bore a
fairly close relationship to the population of
every natural division, excluding always Greater Bombay. Relative to its size East Khandesh district returned a high number of persons in this occupational sub-division-5,714, of whom 4,218 were carpenters, turners and joiners, 856 basket makers, 218 sawyers and 422 makers
of miscellaneous wood products. o
Sub-division 4·7-Furniture and fixtures The manufacture of furniture and fixtures,
regardless of the material used, engaged 6,873
persons in Bombay, Saurashtra and Kutch, of whom 2,472 were in Greater Bombay. Kaira, Ratnagiri, and Kanara districts in Bombay State, and Gohilwad district in Saurashtra, also
returned fair numbers.
Sub-division 4·8-Papcr and paper products
The manufacture of paper and articles of pulp, paper and paper board engaged only 2,932 persons in Bombay, Saurashtra and Kutch, of whom 1,404 were in Greater Bombay, 440 in Ahmedabad, 389 in Surat, and 251 'in Poona district.
Sub-division 4·9-Printing and Allied Industries
A total of 31,796 persons in Bombay; Saurashtra and Kutch were returned as engaged in printing and bookbinding and allied indus
tries. The great majority of them were found, not unnaturally, in urban areas, and most wereemployees and not independent workers.
In 1931 only 3,911 persons were classified under this head in the area that now forms Bombay State. Even allowing for the fact that
the number may have been understated in 1931 there is no doubt that this is an industry that has expanded greatly in the past twenty years. 16,818 persons, about half the total number of person~ classified under this subdivision, were in Greater Bombay at the 1951 census. 14,949 were engaged in printing presses, and 1,869 in bookbinding.
Outside Greater Bombay the districts of Nasik (where the Government Security Press is situated), Poona and Ahmedabad returned the largest number of, persons under printing.
More than 400 persons were returned as engaged in printing in the districts of Baroda, Surat, Dharwar, Thana, Ratnagiri, Madhya Saurashtra and Gohilwad. The tiny Dangs district was the only district which failed to return anybody under this sub-division.
SECTION 9
CONSTRUCTION AND UTILITms
Division 5 of the Indian Census Economic Classification Scheme comprised Construction and Utilities. A total of 191,263 self-supporting persons in Bombay, Saurashtra and Kutch were returned as belonging to this division. They
A (Bk) H 91-12
comprised 3·96 per cent of the self-supporting persons belonging to all Industries and Services.
This division pad eight sub-divisions, of which the construction and maintenance of buildings was the most important; In the table

90 NON-AGRICULTURAL CLASSES
below the actual number of self-supporting persons classified under each sub-division, and the proportion that they constituted of all the self~supporting persons in division 5 has been
shown:-
Division 5-Construction and Utilities Bombay, Saurashtra and Kutch
Sub-division.
;'0 Construction and maintenance of works otherwise uncla.sified ,o.
S'I Construction lind maintenance-Buildings
5'2 Construction and maintenance-Roads • Bridges and other Transport Works ."
5'3 Conltruction and main-tenance-Telegraph and Telephone Lines
S'" Coll5truction and maintenance operation_1mplion and other agricultural worb '" '"
5'5 Works and ServicesElectric Power and Gat lupply
5'6 Works and Service_ Domestic and Industrial water supply
"7 Sanitary Work! and
Number 01 seU-supporting persons retumed
as belonging to sub-divi-
810n In
column I.
2
5.301
116.580
16.096
lI.m
11.6-47
5.260
Services-Indudinl scavengera 24,389
Percentage of self-supporting
persons in division 5 who
belonged to sub-division shown in
column I.
3
2'8
60'9
8'"
0'2
12'S
124,149 of the persons returned as belonging to division 5 at the census were in the urban areas, and 67,114 in the rural areas of Bombay,
Saurashtra and Kutch. Persons belonging to
this division comprised 4·59 per cent of the persons engaged in all Industries and Services
in the rural areas, and 3·69 per cent of the persons engaged in all Industries and Services in the urban areas.
Sub-division:;' O-Construction and maintenance of works-otherwise unclassified
A total of 5,301 persons in Bombay, Saurashtra and 'Kutch were returned as belonging to this sub-division, Greater Bombay and Ahmedabad district accounting for about half the total number.
Sub-division 5'I-Construction and maintenance-Buildin3s
A total of 116,580 persons were returned as
belonging to sub-division 5· L The sub
division comprised masons and bricklayers, stone cutters, house painters, and other persons engaged in the construction or maintenance of
buildings. Persons engaged in these occupations were twice as numerous in the urban as compared with the rural areas, but in both rural and urban areas independent workers outnumbered employees. Only in Greater Bombay did employees slightly outnumber independent workers, the reason being that iu
most areas masons and other workers function as ip.dependent artisans and not as employees.
In Greater Bombay, out of a total of 22,056 persons in this sub-division, 11,227 were building construction workers, 6,076 were masons, and 4,75.3 painters and decorators. Next to Greater Bombay, Poona district returned the largest number of persons in this sub-division
-12,865-of whom 8,259 were masons. These figures reRect the building "boom" in POOna which has undergone extensive development both during and after the war.
Sub-division 5· 2-Construction and maintenance-Roads, Bridges and other
Transport Works
16,096 persons in Bombay, Saurashtra and Kutch were returned as engaged in the construction and maintenance of roads, bridges and other transport works, the majority being in the rural as distinct from the urban areas, and employees rather than independent workers. The districts of Mehsana, Surat, Poona and Thana returned the largest numbers.
Sub-division 5· 3-Construction and main. tenance-Telegraph and Telephone
Lines
Only 355 persons were classified under construction and maintenance of telegraph and telephone lines, of whom 150 were in Greater Bombay and 50 in Poona. Most districts must have had some persons engaged in this work.
They were possibly returned, and almost

NON·AGRICULTURAL CLASSES 91
certainly classified, under some other sub· division.
Sub-division 5· 4-Construction and maintenance operations-Irrigation and other agricultural
works
A total of 11,635 persons in Bombay, Saurash· tra and Kutch were returned as engaged in the construction and maintenance of irrigation and other agricultural works. The surprisingly high number of 5,020 was returned from Surat dIstrict, mainly Navsari taluka, a fact which the Mamlatdar of Navsari has attributed to the seasonal irrigation workers on the Tapti canal. Belgaum and Kolhapur returned the next high· est numbers, followed by Nasik, Poona and Ahmednagar districts in which there are irri· gation canals.
Sub-division 5·5-Works and Services-Electric Power and Gas supply
A total of 11,647 persons were classified as engaged in electric power and gas supply. Almost a quarter of them-3,075 personswere in Greater Bombay. Ahmedabad, Poona, Thana and Kolaba districts returned fairly high numbers.
The actual number of persons engaged on electric supply works has probably been understated. Where thE:') electric undertaking was municipally owned, as in Greater Bombay, there was probably a tendency for employees to describe themselves as municipal servants instead of employees of a specific public utility.
Sub-division 5·S-Works and ServicesDomestic and Industrial water supply
5,260 persons were classified as engaged in domestic and industrial water supply. The
three districts of Thana, (where Lake Tansa, the source of Bombay's water supply is situat· ed, and where the new Vaitama project to in· crease the city's water supply is being carried out), Poona, and Greater Bombay returned the largest numbers in this occupational sub-division. In some districts in Gujarat no persons were classified under this head, suggesting denciencies either in the returns or the subsequent tabulation. In areas where the water undertakings were municipally owned it seems as though the workers may have been returned as municipal employees without reference
to the department in which they served, because the total ngure of 5,260 seems an obvious understatement of the true numbers employed, even after allowing for the fact that
water from wells rather than a piped supply is the main source of water supply in most places in the area.
Sub-division 5·7 -Sanitary Works and Services-Including scavengers
The sub-division sanitary works and services, including scavengers, accounted for 24,389 persons. Almost half the total number were found in Greater Bombay. The great majority of sweepers and scavengers were found in urban areas, and were employees, not in·
dependent workers, while the proportion of women in this category was very high. Ahmedabad, Poona, Thana, Dharwar and Sorath districts also returned fairly high num· bers, but the general impression is one of understatement. Outside Greater Bombay and Poona, there may have been a tendency to return the occupation as «municipal service," else it is difficult to understand why the numbers in some districts should be so low.
SECTION 10
COMMERCE
Division 6 of the Indian Census Economic Classillcation Scheme comprised Commerce. A total of 887,580 self-supporting persons, constituting 18·38 per cent of the self-supporting
A (Bk) H 91-12a
persons belonging to all Industries and Services, were returned as engaged in commerce.
The division had nine sub-divisions, of which retail trade in foodstuffs was the most

92' NON-AGRICULTURAL CLASSES
important. In the' table which follows the actual number of self-supporting persons classified under each sub-division, and the proportion that they constituted of all the selfsupporting persons in division 6 has been shown :-
Division 6-Commerce Bombay, Saurashtra and Kutch
Sub-division.
6' 0 Retail trade otherwise unclassified
6' 1 Retail trade in foodstuffs (including beverages and narcotics)
6' 2 Retail trade in fuel (including petrol)
6' 3 Retail trade in textile and leather goods
6' 4 Wholesale trade in foodstuffs 6'5· Wholesale trade in commo-
dities other than foodstuffs 6' 6 Real Estate 6'7 Insurance 6'8 Moneylending, banking and
other financial business
Number of self-supporting
persons returned as belonging to sub-division in
column I.
2 243,713
345,062
37,467
95,733
18.917 70,359
3,366 10,634 62,329
Percentage of self-supporting
persons in division 6 who belonged to sub-division shown in column I.
3 27'5
38'9
4'2
10'8
2'1 7'9
0'4 1'2 7'0
189,946 of the persons classified under Commerce were in the rural areas, and 697,634 in the urban areas of Bombay, Saurashtra and Kutch. They comprised 13·0 per cent of the persons engaged in all Industries and Services in the rural areas and 20·7 per cent . of the persons engaged in all Industries and Services in the urban areas. Both relatively and absolutely, therefore, commercial activities were of much greater importance in the urban areas than in the rural.
Sub-division 6· O-Retail trade otherwise unclassified
A total of 243,713 self-supporting persons in Bombay, Saurashtra and Kutch were returned as engaged in retail trade otherwise unclassified. General storekeepers, hawkers and street-vendors, dealers in drugs, and booksellers and stationers were all included in this sub-division.
About one-third of the total number were found in Greater Bombay where 55,886 persons were engaged in general storekeeping or retail trade otherwise unclassified, 13,198 were hawkers, 3,300 druggists and chemists, and 2,951 booksellers and stationers.
Relative to their populations Gujarat and Saurashtra returned high numbers under this sub~division. Districts which contained
cities or, like Thana, adjoined a . large urban concentration, tended to retum large numbers under this sub-division.
Sub-division 6 . I-Retail trade in foodstuffs (including beverages and narcotics)
A total of 345,062 self-supporting persons in Bombay, Saurashtra and Kutch were returned as engaged in retail trade in foodstuffs. They comprised 38·9 per cent of the self-supporting persons in division 6. This was thus the most important sub-division under Commerce.
Retail dealers in grains and pulses and other foodstuffs, principally vegetables and fruits, were the most important groups within the sub-division, though pan, bidi, cigarette and tobacco dealers were also very important.
Sub-division 6· 2-Retail trade in fuel (including petrol)
A total of 37,467 self-supporting persons were returned as retail traders in fuel, including petrol. Of these 11,385 were in Greater Bombay, where 6,754 were dealers in firewood, charcoal, and other fuel, and 4,631 were dealers in petroleum. Ahmedabad and Poona districts returned the next highest numbers under this sub-division,
Sub-division 6, 3-Retail trade in textile and leather goods
95,733 self-supporting persons in Bombay, Saurashtra and Kutch were returned as engaged in retail trade in textile and leather goods. 21,596 of them were in Greater Bombay. Cloth traders were found :\n every district, but were numerically most important in districts like Greater Bombay, Ahmedabad, Surat and Sholapur which are textiles manufacturing centres, and in Thana district which adjoins Greater Bombay. A high proportion of the persons in tlns sub-division in both the rural and urban areas were employees, but as employers were almost as numerous as employees the normal textiles retail establishment is obviously a very small unit.
Sub-division 6·4-Wholesale trade in foodstuffs 18,917 self-supporting persons were returned
as engaged in wholesale trade in foodstuffs in Bombay, Saurashtra and Kutch, as against 345,062 retailers in foodstuffs, including beverages and narcotics. The distinction between wholesale and retail is frequently a nne one, and may not always have been correctly drawn by enumerators and persons enumerated. It may be assumed, therefore, that this ngure of 18,917 represents a minimum figure

NON-AGRICULTURAL CLASSES 93
since the wholesale nature of the trade must have been definitely specmed to warrant classification under this sub-division. The largest number of persons was returned from the Deccan Northern Division under this head, and comparatively few in Cujarat.
Sub-division 6·5-Wholesale trade in com· modities other than foodstuffs
70,359 self-supporting persons were returned as engaged in wholesale trade in commodities other than foodstuffs, the great majority being found, not unnaturally, in the urban as distinct from the rural areas. 54,932 of these wholesalers were concentrated in Greater Bombav. In other districts the numbers were, compar~tively speaking, insignificant, the Deccan Northern Division leading other natural divisions, but none approaching the Greater Bombay figure.
Sub·division 6· 6-Real Estate
The real estate sub-division included house and estate agents and rent collectors of property other than agricultural land. Only 3,366 self-supporting persons were returned under this sub-division from the entire area, and of these 2,439 were in Greater Bombay.
Sub-division 6·7 -Insurance
10,634 self-supporting persoqs in Bombay, Saurashtra and Kutch were returned as engaged in the insurance business, and of these 6,960
were in Greater Bombay where the head offices of many insurance companies are situated. Next in importance came Ahmedabad and Poona districts if Thana be excluded because most of those returned under insurance there were probably employees of companies in Greater Bombay who resided in Thana district and travelled into Bombay for work.
Sub·division 6· 8-Moneylending, banking and other flnancial business
A total of 62,329 self-supporting persons in Bombay, Saurashtra and Kutch were returned as principally dependent on moneylending, banking and other financial business. 18,748 were in Greater Bombay, followed by Ahmedabad district. Bombay and Ahmedabad are the two principal industrial and financial centres of the State. A surprisingly high number of persons in this sub-division were independent workers and not employees.
The number of persons returned as either employers or independent workers under t~is sub-division fails to convey the true number of persons who engage in moneylending, partly because it has often been a side-line with wellto-do agriculturists and merchants rather than a principal means of livelihood, and more specmcally perhaps because it is now a licensed occupation in Bombay State and those who engage in moneylending would probably hesitate to describe it as their principal means of livelihood even if in truth it were.
SECTION 11
TRANSPORT, STORAGE AND COMMUNICATIONS
Division 7 of the Indian Census Economic Classmcation Scheme consisted of Transport, Storage and Communications. A total of 308,125 self-supporting persons in Bombay, Saurashtra and Kutch were returned as belonging to this division. They comprised 6· 38 per cent of the self-supporting persons belonging to all Industries and Services.
The division had ten sub-divisions of which transport by road and transport by rail accounted between them for 69 per cent of the persons in the division. In the table opposite the ten sub-divisions have been shown, together with the number of self-supporting persons returned as belonging to each, and the proportion which they constituted of the total self-supporting population belonged to division 7 :-
Division 7-Transport, Storage and Communications
Bombay, Saurashtra and Kutch
Sub-division.
Number of self-supporting
persons returned as belonging to sub-division in
column 1.
2 7'0 Transport and communications
otherwise unclassified and incidental services
2,841
7 . 1 Transport by road 7' 2 Transport by water 7' 3 Transport by air 7' 4 Railway transport 7 . 5 Storage and warehousing 7' 6 Postal Services 7' 7 Telegraph Services 7' 8 Telephone Services 7' 9 Wireless Services
110.477 59.133 3,1W
101.770 4.772
19.119 3.601 2,801
440
Percentage of self-suppor~ing
persons In division 7 who
belonged to sub-division
shown in column I.
3 0'9
35'9 19'2 1'0
33-0 1'6 6'2 1'2 0'9 0'1

94 NON-AGRICULTURAL CLASSES
63,649 of the persons classified under this sub-division were in the rural areas, and 244,476 in the urban areas of Bombay, Saurashtra and Kutch. They comprised 4·36 per cent of the persons engaged in all Industries and Services in the rural areas, and 7·26 per cent of the persons engaged in all Industries and Services in the urban areas.
Sub-division 7· O-Transport and communications otherwise unclassified and
incidental services
The number of self-supporting persons taken under Transport and communications otherwise unclassified in the whole of Bombay, Saurashtra and Kutch was only 2,841, of whom 2,077 were in Greater Bombay, where -the majority were travel agents. Most districts reo. turned no persons under this head. It was a residuary category and very little significance can therefore be attached to the return of 386 persons under this head in Madhya Saurashtra, the largest number returned by any district apart from Greater Bombay.
Sub-division 7 . I-Transport by road
A total of 110,477 self-supporting persons in Bombay, Saurashtra and Kutch were returned as engaged in road transport. They comprised 35·9 per cent of the persons in the Transport and Communications division, and were slightly more numerous than the persons classified under railway transport, who numbered 101,770. Excluding air transport, no other transport sub-division has shown such a tremendous expansion since the 1931 census. In the area of Bombay State as at present constituted 43,034 persons were returned as principal earners under road transport in 1931. These principal earners corresponded to the self-supporting persons of the 1951 census, of whom there were 99,578 in Bombay State in 1951. A great expansion in road transport took place during and after the war.
Sub-division 7·2-Transport by water
Transport by water which included officers and mariners of ocean-going vessels as well as ships and boats plying in inland and coastal waters, and persons employed in harbours and docks accounted for 59,133 self-supporting persons in the area of Bombay, Saurashtra and Kutch at the census of 1951. Of these 37,563 were in Greater Bombay. Ratnagiri district, which has the longest coast line of any district
in Bombay State, returned 4,622 persons, Surat 2,006, Kolaba 1,951, Kanara "1,310, Thana 1,241. and Amreli 985.
In Saurashtra 6,707 persons were returned under transport by water, of whom 2,659 were in Sorath, 1,928 in Ralar and 1,921 in Gohilwad district. In Kutch, also a maritime State, 1,387 persons were returned under transport by water.
The existence of ferries and inland waters accounted for the fact that all except three districts returned some persons under this subdivision.
Sub-division 7· 3-Transport by air
Transport by air, persons concerned with airfields and aircraft other than construction of airfields and airports, accounted for 3,171 self-supporting persons in Bombay, Saurashtra and Kutch at the census of 1951. 2,625 of them were in Greater Bombay. Thana district which adjoins the international airport of Santa Cruz accounted for 139 persons, Ahmedabad for 111, and Poona for 91. Saurashtra State, principally Ralar district, accounted for 168 persons and Kutch for 17.
In 1931 in the area of Bombay State as at present constituted only 39 persons were returned under air transport, as against 2,986 in 1951.
Sub-division 7· 4-Railway transport
A total of 101,770 self-supporting persons, constituting 33· ° per cl:!nt of the persons in division 7, were returned as engaged in railway transport in Bombay, Saurashtra and Kutch at the census of 1951. The railway transp()rt subdivision included railway employees of all kinds, except those employed on construction works. Persons engaged in the manufacture and repair of railway transport equipment, however, were not classified under Transport, but under Production in sub-division 3·3.
Excluding Greater Bombay and the adjacent district of Thana, where 25,111 and 9,719 persons were respectively classified under railway transport, the figures reflected in general the extent of railway mileage and the existence of important railway centres or junctions within particular districts. Ahmedabad and Baroda districts in Gujarat, and East Khandesh, Poona, Nasik and Sholapur districts in the Deccan Northern Division all returned more' than four thousand persons under railway transport.

NON-AGRICULTURAL CLASSES 95
In the table at the end of this paragraph the relative figure~ of self-supporting persons returned as engaged in various fOnTIS . of transport in the area of Bombay State as at present constituted have been shown. The " principal earners of the 1931 census correspond to the self-supporting persons of 1951. The 1941 figures are based on a small sample. The 1951 figures of railway transport understate the true comparative numbers since railway workshop employees were not classified under this sub.division in 1951.
Number of self-supporting persons returned a.s engaged in various forms of transport
at successive censuses in Bombay
Transport by road Transport by water Transport by air Railway transport
State
1931 43,034 39,937
39 66,206
1941* 54,511 44,578
121 83,584
1951 99,578 51,039 2,986
90,866
* Sample figures adjusted proportionately to population for changed boundaries.
Sub-division 7· 5-Storage and warehousing
4,772 persons in Bombay, Saurashtra' and Kutch were returned as engaged.in the operation of storage facilities such as warehouses and safe deposits when such storage was offered as an independent service. 3,252 of them were in Greater Bombay.
. , J
Sub-division 7· 6-Postal Services
A total of 19,119 persons were classified under postal services. Almost one-third of them, 6,181 persons, were in Greater Bombay, with Ahmedabad and Poona districts returning the next highest numbers. The greater the concentration of population, the larger the number of postal employees would obviously be.
Sub-division 7·7-Telegraph Services
A total of 3,601 persons were classified under telegraph services. 1,860 of them were in Greater Bombay. The Deccan N rthern Division returned 872 persons under t is sub-division while Gujarat, roughly equival nt inc population, returned only 160 pers ns. Clearly either the census slips in Gujar t must have been incompletely filled in, or else there was misclassification of these persons under some other head, such as Union Government servants, at the subsequent tabulatipn.
Sub-division 7·8-Telephone Services
2,801 self-supporting persons w re classified under telephone services in Bo bay, Saurashtra and Kutch at the census of 1951, of whom 1,972 were in Greater Born ay. In the case of this sub-division too th published figures are clearly an understate ent of the true numbers engaged in this 0 cupation in Gujarat, since the figure of 2 tel phone employees for Ahmedabad district is fantastically low. It is not known whether the error occurred at the enumeration or orting and tabulation stage.
Sub-division 7 ·9-Wireless S+rvices
Only 440 persons were classifiea under this sub-division, of whom 164 were in Greater Bombay. Elsewhere the figure$ under this head seem unreliable .
At previous censuses postal, te
1graPh, tele
phone and wireless services were abulated together. The number of persons i the State of Bombay as at present constitut d classified under these heads was 8,162 in 931, 15,869 (adjusted sample figure) in 1941, ~nd 23,713 in 1951. These figures illustrate the 'expansion of communications facilities that has I taken place in the past twenty years.
SECTION 12
HEALTH, EDUCATION AND PUBLIC ADMINISTRATION
Division 8 of the Indian Census Economic Classification Scheme, comprising Health, Education and Public Administration, accounted for 524,647 self-supporting persons in Bombay, Saurashtra and Kutch, 10·86 per cent of the self-supporting persons belonging to all Industries and Services in the area.
There were nine sub-divisions within the division, of which State Government employees and Educational Services and Research were the most important categories. In the table which follows the actual number of selfsupporting persons classified under each subdivision, and the proportion that they constituted of all the self-supporting persons in the

96 NON-AGRICULTURAL CLASSES
Health, Education and Public Administration division has been shown :-
Division 8-H ealth, Education and Public Administration
Bombay, Saurashtra and Kutch
Sub-clivision,
8' I Medical and other Health Services
8'2 Educational Services and
Number of self-supporting
persons returned as belonging to sub-divi
sion in column I,
2
47,212
Research 8'4 Police (other "than villa~~
120,186
watchmen) '" .. , 67,672 8'5 Village officers and
servants, including village watchmen 29,509
8'6 Employees of"Municjpaii~ ties and Local Bodies ... 57,884
8'7 Employees of State Governments 136,180
8'8 Employees of the Uni~~ Government 65,305
8'9 Employees of Non-Indi~~-Governments 699
Percentage which the
persons shown in column 2 constituted of all the
self-supporting persons in
division 8, 3
9'0
22'9
12'9
5'6
11'0
26'0
12'5
0'1
147,452 of the persons classified under this division were in the rural areas, and 377,195 in the urban areas of Bombay, Saurashtra and Kutch, They comprised 10, 09 per cent of the persons engaged in all Industries and Services in the rural areas, and 11, 20 per cent of the persons engaged in all Industries and Services in the urban areas, a position of greater relative equality than obtained in other occupational divisions. Sub-division 8 'I-Medical and other Health
Services This sub-division included registered medical
practitioners, vaids and hakims, dentists, mid--wives, vaccinators, compounders, nurses, veterinary doctors, and other persons employed in hospitals or other public or private establishments rendering medical or other health services; but not including scavengers or other sanitary staff.
A total of 47,212 self-supporting persons in Bombay, Saurashtra and Kutch were classified as belonging to this sub-diviSion, of whom 13,873 were in Greater Bombay. In Greater Bombay 5,650 persons were classified as hospital and health service employees, 2,946 as registered medical practitioners, 2,459 as nurses, 1,668 as compounders, 699 as vaids and hakims, 204 as dentists, 199 as midwives, 41 as vaccinators, and 7 as veterinary assistant surge'Ons. These figures suggest that there may have been some tendency for dentists to be returned or
classified as registered medical practitioners and since it is the practice, in Bombay for dentists to style themselves as doctors the tendency is comprehensible. Veterinary surgeons would also seem to have been classified either as doctors or hospital employees. The figures of some other districts such as Ahmedabad suggest that the distinction between a registered medical practitioner and a vaid or hakim may not always have been correctly drawn. Even allowing however for overlapping and minor errors of classification there would seem to have been a definite expansion of medical and health services between 1931 when 15,915 "principal earners," equivalent to the self-supporting persons of the 1951 census, were classified under this head in the area that at present comprises Bombay State, and 1951 when 41,961 persons were so returned, In Greater Bombay, Poona and Ahmedabad cities there would seem to be no shortage of doctors but in the rural areas medical and other health service employees are obviously spread very thin. Sub-division 8· 2-Educational Services and
Research Educational services and research, a sub
division that included professors, lecturers, teachers and research workers employed in Universities, Colleges and Research Institutions; professors, lecturers and teachers of all kinds; and managers, clerks, and servants of educational institutions, libraries and museums accounted for 120,186 self-supporting persons in Bombay, Saurashtra and Kutch at the 1951 census. The distribution" of these persons per 100,000 of population fonns the subject of Subsidiary Table 7·3.
This too is a sub-division whose adherents have more than doubled in numbers since 1931 in the present area of Bombay State--from 47,766 in 1931 to 109,035 in 1951. In this subdivision approximately one out of five selfsupporting persons at the 1951 census was a woman j in the urban areas the ratio was higher, almost one in three.
There were no gross anomalies in the distribution of teachers among the various natural divisions. This was one sub-division in which the numbers found in Greater Bombay did not outweigh heavily the numbers found in other natural divisions. The Deccan Northern Divi~ sion returned 38,816 persons under this subdivision, Gujarat 29,952, Greater Bombay 14,650, the Konkan 13,034, the Deccan Southern Division 12,583, Saurashtra 9,937, and

NON-AGRICULTURAL CLASSES Q7
Kutch 1,214. The Deccan Northern Division, where literacy is lower than in Gujarat, owed its lead to the fact ~hat there were 9,147 persons in this sub-division in Poona district, which is an educational centre.
Sub-division 8· 4-Police (other than village watchmen)
Police, othel;' than village watchmen, accounted for 67,672 self-supporting persons in Bombay, Saurashtra and Kutch, of whom 57,577 were in Bombay State. The Commissioner of Police in Greater Bombay and the District Superintendents of Police elsewhere were asked to state the number of police on their establishments at the time of the census. A figure of 55,453 police was furnished for Bombay State, as against a census figure of 57,577. However, some District Superintendents of Police did not count police officers as policemen. Others did not include railway police. In general the census figure understates the figure of policemen in Bombay State. In Kutch State 1,141 persons were classified under this sub-division. The difference between the census figure and that obtained independently from police sources in Kutch was only 5.
Sub-division 8·5-Village officers and servants, including village watchmen
Only 29,509 self-supporting persons in Bombay, Saurashtra and Kutch were classified as village officers and servants, including village watchmen. Only 23,342 persons were so classified in Bombay State in 1951 as against 50,763 at the time of the 1931 ce:!1Sus. It is probable that by contrast with 1931 when agricultural prices were low some of the village patils and servants derived their principal means of livelihood in 1951 from land rather than their offices and returned themselves under the agricultural livelihood classes, but this would not explain the complete absence of any persons in this sub-division in rural areas of Panch Mahals and Dangs districts. The true explanation of the phenomenon is more sinister-misclassification. It has been verified that in many cases talathis, patils and other village officers were wrongly classified after the census as employees of the State Government and not under the sub-division to which they rightfully belonged. A certain amount of misclassification in occupational groupings is inevitable after every census but it is ironical that a class of Government officers on whom Government relies so heavily for the efficient conduct of the census should
A (Bk) H 91-13
have had their own means of livelihood inisclassified after the census by the Tabulation Offices. Sub-division 8· 6-Employees of Municipalities
and Local Bodies A total of 57,884 persons in Bombay, Sau
rashtra and Kutch were classified as employees of Municipalities and Local Bodies, excluding persons classifiable under any other division or sub-division. Municipal sweepers and scavengers, and employees of a municipal water undertaking etc. would be. classified under other subdivisions. Other municipal employees would fall under this sub-division. 14,878 persons were so classified in Greater Bombay, 14,802 in Gujarat, 14,638 in the Deccan Northern Division, 3,938 in the Deccan Southern Division, 4,416 in the Konkan, 5,007 in Saurashtra and 205 in Kutch. The figures seem reasonably consistent and in accordance with the actual position. Local bodies are less developed in Kutch than elsewhere.
Sub-division 8·7-Employees of State Governments
Employees of State Governments, excluding persons classifiable under any other division. or sub-division, accounted for a total of 136,180 persons in Bombay, Saurashtra and Kutch at the 1951 census. To a certain extent this was a residuary category. A cert.ain number of village officers and servants who rightly belonged elsewhere were wrongly classified in this sub-division. Another error swelling unduly the proportions of this sub-division occurred in Nasik where there was a failure at the time of enumeration to effect a distinction between State and Union Government servants. Many Union Government servants were returned as Government servants, but the mistake was corrected in consultation with the Collector before the State tables were published.
Perhaps the principal feature of interest in the fIgures of State Government servants lies in the fact that Poona district, where . the headquarters of many offices of the Go,vernment of Bombay are situated, returned 19,338 State Government employees as against 16,169 in Greater Bombay. Many State Government employees of course in both Bombay and Poona were classified, rightly, under other divisions and sub-divisions; and again sever~l thousand employees of the State Governmen,t employed in Greater Bombay obviously .lived outside the municipal limits in Thana district, else the number of State Government employees in that district would not have been so high. .

98 NON-AGRICULTURAL CLASSES
In the State of Saurashtra the district of Madhya Saurashtra, which contains the capital of Rajkot, returned the largest number of State Government employees.
Sub-division 8· 8-Employees of the Union Government
A total of 65,305 self-supporting persons were returned as employees of the Union Government excluding persons classifiable under any other division or sub-division. Only two districts were of major importance-Greater Bombay with 15,226 persons and Poona with 24,l89. Railway employees and post office employees were, of course, classified separately under other subdivisions, so that this sub-division was in effect
Sub-division 8· 9-Employees of Non-Indian Governments
699 persons were classified as employees of Non-Indian Governments. Foreign diplomats and consular officers were excluded from the census count, but other employees of NonIndian Governments were not. The figure of 198 employees of Non-Indian Governments for Greater Bombay seems possible though on the low side; but it is difficult to understand how Poona and Ratnagiri turned up 304 and 120 persons under this sub-division. Perhaps em-
. ployees of the rulers of the former Indian states wrongly swelled this sub-division in Poona.
a residuary one. SECTION 13
SERVICES NOT ELSEWHERE SJ'ECIFIED; AND MISCELLANEOUS MEANS OF LIVELllIOOD
Division 9 of the Indian Census Economic Classification Scheme consisted of Services not elsewhere specified. It was numerically the most important division in Bombay, Saurashtra and Kutch, accounting as it did for 1,134,890 self-supporting persons, ~mprising 23·5 per cent of the self-supporting persons in all Industries and Services.
Within this division there were nine sub_ divisions, of which Services otherwise unclassified, to which almost half the persons in
_ division 9 belonged, was the most important. In the table below the actual number of selfsupporting persons classmed under each subdivision, and the proportion that they constituted of all the self-supporting persons in division 9 has been shown :-
Division 9-Services not elsewhere specified Bombay, Saurashtra and Kutch
Percentage of Number of self-supporting
persons belong- persons in division ing to sub- 9 who belonged
Sub-division,
9' 0 Services otherwise unclassi-fied .. , '"
9' I Domestic services (hut not including services rendered by members of family households to one another)
9'2 Barbers and beauty shops 9'3 LlU?drie, and laundry
selVlces '" .. , 9' 4 Hotel., restaurants and
eating houses '" 9' 5 Recreation services .. , 9'6 legal and business lervicea 9' 7 Arb, letters and journalism 9'8 Religioul, Charitable and
Wdfare Services
division in to sub-division column I, shown in
column I, 2 .3
560,198 49'4
221,812 19'; 63,621 5'6
33,744 3'0
127,502 " '2 37,507 3'3 30,637 2'7 6,910 0'6
52,959 4'7
421,598 of the persons classified under this division were in the rural areas, and 713,292 in the urban areas of Bombay, Saurashtra and Kutch, They comprised 28, 85 per cent of the persons engaged in all Industries and Services in the rural areas, and 21· 18 per cent of the persons engaged in all Industries and Services in the urban areas. This was one of the few divisions in which the proportion of seHsupporting persons engaged in all Industries and Services was greater in the rural than in the urban areas, The explanation lies in the fact that the rural areas returned a sizable number of persons under Services otherwise unclassified, Sub-division 9' O-Services otherwise unclassified
A total of 560,198 persons, comprising 49, 4 per cent of the self-supporting persons in division 9, were engaged in services otherwise .unclassified, This sub-division was a residuary category. Persons whose means of livelihood were inadequately described, or otherwise unclassified, were included within its fold, 281,329 of the persons classified under subdivision 9, 0 were found in the rural areas and 278,869 in the urban areas of Bombay, Sau'rashtra and Kutch,
Although this sub-division was a residuary category, comprising as it did those whose occupations were unclassified, it was obviously important to know as preCisely as possible the occupational returns of persons classified under this sub-division, It was discovered at a fairly early stage that quite a number of persons were returned as .. coolies," .. mazdoors, " .. workers on daily wages" or other variants of

NON-AGRICULTURAL CLASSES 99
the same expression. The Tabulation Offices were therefore aske~ to tabulate such persons separately as .. mazdoors " within sub-division 9. Out of the 560,198 persons in this sub-division 449,212 persons were returned as .. mazdoors " or other descriptive equivalents of the same expression.
One cannot exclude entirely the possibility that a person might be described at the census enumeration as a .. mazdoor " or .. coolie" though he was in fact employed regularly on daily wages in a factory or other organised labour force, and with more careful enumeration might have been classified with reference to the industry or occupational group that he served. In general, however, the occup'ational returns at the census were fairly complete, so that this would not be an explanation of the large number of persons returned as .. coolies" or .. mazdoors" at the census.
Another possibility is that some of the persons classmed under this sub-division were primarily agricultural labourers. Since, however, agricultural labourers constitute a fairly easily identillable working group, and were separately coded by enumerators at the census enumeration as a distinct livelihood class it seems reasonable to discount the possibility' of agricultural labourers having been erroneously returned as .. coolies" or " mazdoors" bv enumerators on any scale. 1,066,049 sellsupporting persons were returned as agricultural labourers at the census in Bombay, Saurashtra and Kutch as against 449,212 .. mazdoors." It is true. that persons included in the sub-division Services otherwise unclassified formed 19·3 per cent of the total number of self-supporting persons in all Industries and Services in the rural areas of Bombay, Saurashtra and Kutch, and only 8·3 per cent of the total number of self-supporting persons in all Industries and Services in the urban areas but the reason for this is that organised indusU; and a trained labour force is a feature of an urban or industrialised society, and the proportion of the residuary categories classified under this sub-division in urban areas was COll
sequently smaller than in the rural areas.
It seems reasonable again to assume that a .. coolie" or " mazdoor" in a rural area would be able and willing to function as an agricultural labourer as seasonal requirements or the aVailability of employment of any sort dictated. Thus in the Deccan Northern and Southern Divisions, which had a heavier agricultural bias
A (Bk) H 91-1Sa
than other natural divisions, the proportion of agricultural labourers in the population was higher than elsewhere, and the proportion of .. mazdoors" was correspondingly less. This suggests that in the predominantly agricultural areas labourers are primarily agricultural labourers, while elsewhere the process of their divorce from the soil has proceeded further and, while they constitute a pool of labour available for seasonal agricultural requirements, they are and regard themselves primarily as general and not agricultural labourers.
One of the most remarkable features of the livelihood returns at the census was the heavy proportion of non-agriculturists in Saurashtra and Kutch by comparison with Bombay. In Bombay State 14·9 per cent of the general population belonged to livelihood class VIII while in Saurashtra the percentage was as high as 22·1 per cent and in Kutch 25· 0 per cent. An obvious line of enquiry in explaining or understanding this phenomenon would be to examine the returns of self-supporting persons in livelihood class VIII. Division 9 of the Indian Census Economic Classification Scheme comprised the bulk of those in livelihood class VIII. In Saurashtra and Kutch the pre~ centage of the self-supporting persons in all Industries and Services who were returned as belonging to division 9 in both the rural and urban population was in excess of the percentages returned by other natural divisions in Western India. The overwhelming majority of the self-supporting persons belonging to division 9 in Saurashtra and Kutch were classified under 9· O-Services otherwise unclassified , and the great majority of these were .. mazdoors." The percentage of agricultural labourers in Saurashtra and Kutch was very low by comparison with Bombay. It seems probable that the .. mazdoors" in the rural areas of Saurashtra and Kutch work seasonally on agriculture, but unless there was a widespread tendency to return agricultural labourers in Saurashtra' and Kutch as .. mazdoors .. the figures suggest that these areas had a disproportionately large number of general labourers. These- persons were not primarily agricultural labourers because they were not returned as such. They were not skilled craftsmen or artisans or they would have returned their trades or callings "as their principal means of livelihood. They were essentially an unskilled body of workers whose employment depended on the general level of prosperity.

100 NON-AGRICULTURAL CLASSES
Kutch State, with a population of 567,606 returned as many as 22,325 persons as "mazdoors," the majority in the rural areas. In the city of Poona, on the other hand, with almost the same population as Kutch State, only 9,633 persons. were returned as mazdoors. In big cities a fairly large pool of unskilled labourers is inevitable and not necessarily economically unhealthy. In less developed regions, however, the manifestation of such a phenomenon in rural areas is suggestive evidence of over-population in relation to the available resources, however thinly that population might be spread on the ground. The ranks of "mazdoors» are recruited in rural areas from those who are surplus to the agricultural economy, and are not yet integrated in other industries and services.
Outside the ranks of the "mazdoors" (who were separately tabulated) and those whose occupations were inadequately described came a small body of astrologers and palmists in sub-division 9·0, of whom there were 573 in Greater Bombay. Practically every district supported some persons whose principal means of livelihood was astrology.
Prostitutes were not a separate occupational group. They should, strictly speaking, have been classified outside the general body of Industries and Services since, though se1£supporting, they were economically inactive. Their correct place was on the fly-leaf to the B-III table as "all other persons living principally on incomes from unproductive occupations." In some cases however they seem to have been wrongly classified under sub-division 9· O. Past census reports testify to the impossibility of getting a true return of prostitutes, particularly in Gujarat, where prostitution is in any case much less than elsewhere, and where such prostitution as exists tends to be clandestine, and is concealed under other occupational returns at the census. Such, however, is morbid ·public interest in this oldest of the professions, that one might imagine that the success of a census should be judged by the fullness and accuracy of the returns of prostitutes that it secures.
Sub-division 9 . I-Domestic services (but not including services rendered by members
of family households to one another)
A total of 221,812 self-supporting persons in Bombay, Saurashtra and Kutch were returned as engaged in domestic service, excluding
services rendered by members of family households to one another. Slightly more than three out of four domestic servants were males. Both relatively and absolutely domestic servants were _numerically more important in the urban as distinct from the rural areas. Thus 86,875 of the persons classified as domestic servants in the area of Bombay, Saurashtra and Kutch were found in Greater Bombay. Of these, 5,488 were private motor drivers, 15,133 were cooks, 4,969 were gardeners, and 61,285 were other domestic servants. Domestic servants in Greater Bombay constituted as much as 7 per cent of the self-supportiIlg persons engaged in all Industries and Services.
The great majority of domestic servants, particularly in Greater Bombay, were employees and not independent workers. A myste·dous 1,292 persons throughout the area of Bombay, Saurashtra and Kutch were returned, presumably erroneously, as employers. The Deccan Northern Division and Gujarat relatively to their populations returned roughly equal numbers of domestic servants. The Konkan districts of Kolaba and Ratnagiri returned relatively high numbers of domestic servants, particularly in the rural areas. Possibly in these areas they were employees of big landlords and combined domestic service with seasonal agricultural labour. Sub-division 9· 2-Barbers and beauty shops
Barbers, hairdressers and wig makers, tatooers, shampooers, and bathhouse workers accounted for a total of 63,621 self-supporting persons in Bombay, SalJrashtra and Kutch. In actual practice barbers and hairdressers accounted for all but a tiny fraction of the selfsupporting persons in this sub-division. Representatives of the craft were found in every district. Relatively to the total number of persons engaged in all Industries and Services barbers were more important in rural than in urban areas, though the absolute numbE;lrs were roughly equal. The figures provide ground for much fascinating if inaccurate speculation. Relatively to their populations the Deccan Southern Division and the Konkan had fewer tonsorial artists than the other natural divisions, though whether this was due to the higher proficiency of barbers in these areas or to lesser patronage of the craft cannot be stated. If the figures mean anything the rural areas of Mehsana district, which had 2,079 barbers, may fairly claim to be the most generous supporters of barbers in Bombay State.

NON-AGRICULTURAL CLASSES 101
Sub-division I). 3-Laundries and Laundry ~ services
A total of 33,744 self-supporting persons in Bombay, Saurashtra and Kutch were returned as engaged in laundry and laundry services, washing and cleaning. Except in Greater Bombay, where as many as 14,315 of the persons classified under this sub-division were found, the great majority were independent workers and not employees or employers. In Bombay State as a whole there were almost twice as many .. barbers as washermen, but in Greater Bombay washermen outnumbered barbers. Relatively to its population the Deccan Northern Division returned more dhobis than any other natural division, excluding always Greater Bombay.
In the area that at present comprises Bombay State the number of self-supporting persons returned as barbers and washermen remained virtually the same between 1931 and 1951.
Sub-division 9· 4-Hotels, restaurants and eating houses
The 1931 and 1951 figures suggested virtual stagnation in the barbering and washing trades. The hotel, restaurant and eating house business, by contrast, underwent a marked expansion. A total of 127,502 self-supporting persons were clas~ed under this sub-division in Bombay, Saurashtra and Kutch at the 1951 census. In 1931, a slump year, only 25,164 persons were so returned in the area that at present comprises Bombay State.. The 1941 sample figures suggest that in that year about 70,000 persons were so employed. The 1951 figure was 119,830. There is thus clear evidence of a remarkable growth in the hotel and restaurant business during the past twenty years.
This business was of considerable importance in 1951 in Greater Bombay where 48,524 persons were classified under it. Among the remaining natural divisions of Bombay State, out of every 1,000 of total population two persons were self-supporting as a result of engaging in the hotel and restaurant business in Gujarat and the Deccan Northern Division, while in the Deccan Southern and Konkan Divisions the proportion was higher-2· 6 persons.
The growth of the hotel and restaurant business in Greater Bombay is attributable to the tremendous growth of the city's population during the decade. Elsewhere it seems attributable primarily to general prosperity, and the growth of urbanisation. Most of the establish-
ments styled as "hotels" are not residential hotels, but are primarily restaurants and eating houses.
Sub-division 9·S-Recreation services Under the sub-division of recreation services
were classified persons engaged in the production and distribution of motion pictures and the operation of cinemas and theatres and radio broadcasting, as well as exponents of timehonoured entertainments-musicians, actors, dancers, acrobats, and recitors. The newer forms of entertainment-the cinema and the radio-have made wide inroads into the old. There are very few towns of moderate size in Bombay State that do not support a cinema. Greater Bombay is an important centre of motion picture production.
A total of 37,507 persons in Bombay, Saurashtra and Kutch were classified under recreation services. Three out of four persons in this sub-division were in the urban as distinct from the rural areas, and 15,047 out of the total of 37,507 were in Greater Bombay. The figures suggested that the Deccan Northern and Southern Divisions were more liberally provided with entertainment, or at least supported more entertainers, than other natural divisions in the area,' excluding always the untypical natural division of Greater Bombay. Sub-division 9· 6-Legal and business services
Lawyers of all kinds, lawyers' clerks and petition writers, stenographers, accountants and auditors as well as employees of trade associations were classified under Legal and business services. A total of 30,637 - self-supporting persons were so classified at the 1951 census in Bombay, Saurashtra and Kutch. Approximately half-15,143 persons-were in Greater Bombay where 1,679 were lawyers, 1,090 lawyers' clerks, 2,011 architects, surveyors and engineers (not being State servants), 8,933 stenographers, accountants, and auditors, and 1,430 employed in Chambers of Commerce, labour organisations and Trade associations. This distribution was untypical. Outside Greater Bombay lawyers and lawyers' clerks tended to comprise the majority of the persons in this sub-division. Sub-division 9·7 -Arts, letters and journalism
Artists, sculptors and image makers, authors, editors and journalists, and photographers were classified under Arts, letters and journalism. In Greater Bombay, where 3,369 out of the total of 6,910 persons classified under this sub-division in Bombay, Saurashtra

102 NON-AGRICULTURAL CLASSES
and Kutch were- found, there were 1,632 artists, sculptors and image makers, 1,194 authors, editors, and journalists, and 543 photographers.
Sub-division 9· 8-Religious, Charitable and Welfare Services
A total of 52,959 persons were classified under religious, charitable and welfare services, a sub-division which included priests, ministers, monks, nuns, sadhus, religious mendicants and other religious workers; servants in religious edifices, burial .and burning grounds; and managers and employees of' organisations and institutions rendering charitable and welfare services.
In Greater Bombay 3,822 persons were classined as priests, sadhus, nuns and other religious workers, 1,276 as servants in religious edifices, bUrial and burning grounds servants, and 990 as charitable and welfare institutions employees,
a total of 6,088 self-supporting persons. In the remaining natural divisions Kq~ch, Saurashtra and Gujarat returned the highest proportions of priests relatively to their populations, the Deccan Northern and the Konkan Divisions occupied a middl~ position, and the Deccan Southern Division came last. Possibly Kutch, Saurashtra and Gujarat are more orthodox in their religious observances and hence supported a larger number of priests, while in the Deccan Southern Division Lingayat jangams who follow lay professions may and do preside at religious ceremonies, thus reducing the need for a professional priesthood. The other factor determining the relative proportions of priests in particular areas is the extent to which temples and religious edifices are endowed with devasthan inams; but unfortunately no reliable statistics were available to indicate the relative extent of this type of alienation in the natural divisions of the area.
SECTION 14
CONCLUDING' REMARKS
Because of changes in the dennitions and classiScations adopted from census to census the data compiled in relation to the nonagricultural classes have not always been comparable. When to these changes the risks of inadequacies or inaccuracies in descriptions of occupations at the census enumeration, and vagaries in the subsequent abstraction, are added it will be seen why the occupational returns have to be scrutinised with special care.
Inaccuracy in classification was undoubtedly the reason why the number of village officers declined between 1931 and 1951. It ~ impossible to be certain whether the fact that the number of washermen and barbers did not iilcrease during the same period reflected a true trend or was due to inaccuracy. On the other hand there was a very' steep and noticeable rise in the number of self-supporting persons returned as engaged in the sugar, tobacco, cotton textiles and printing industries in 195i by comparison with 1931, as also in the number of persons engaged in transport, medical and educational services, and the hotel and restaurant trade, and this rise seems to reBect a true trend.
The number of persons returned as engaged in the manufacture of such articles of common use as soap, matches, vanaspati and plastic goods was small in relation to the output of which the factories making these products are
capable. A modem factory bottling aerated water in Bombay ~ reputedly so highly mechanised as to function with about a dozen workers. The tendency for men to be replaced by machines is somewhat disturbing. Probably, however, these factories give rise to a lot of secondary employment in the demand they create for materials and the employment they create among the distributive trade and transport workers.
The extent to which Greater Bombay. with less than one-tenth of the total population dominated several fields of activity was marked. The tendency for new industries to be located in Greater Bombay or its vicinity has increased. It is a trend which those who believe in the dispersal of industry will deplore, though what precisely should be done if it were desired to arrest the trend is not quite clear.
Analysis of the proportion of employers, employees and independent workers among self-supporting persons was an important and interesting innovation at the 1951 census. Is the independent worker bein~ squeezed out and converted into an employee I' The fact that three-quarters of the self-supporting persons in Greater Bombay in 1951 were employees. suggests that it may be so. It seems part of an inevitable trend, but the only way in which the trend could be measured is to repeat these questions with the same deSnitions at the next census.

CHAPTER VI
++++++++++++++++++++++++++++++++++++++++++++++++++++++++++++++++++++++
FAMILIES, SEXES AND PRINCIPAL AGE GROUPS
++++++++++++++++++++++++++++++++++++++++++++++++++++++++++++++++++++++
SECTION 1
PRELIMINARY REMARKS
This chapter deals with families, sexes and principal age groups. The' question of houses .and households are dealt with fully in the appropriate sections. At all past censuses details in regard to the number of occupied houses were published after each census, but it was difficult to draw reliable conclusions from data about the number of houses because of changes in the definition of the house adopted at successive censuses, to which must be added the consideration that it was the man with the brush and the paint in whose capable or incapable hands reposed the ultimate decision on what dwellings qualified for separate numbers. The past dennition of the house was based on the commensal family. In other words it was a hybrid between the house and the household. The household is a more comprehensible concept than the house, and a distinct advance over past practice was registered in 1951, when the analysis of 4 per cent of the households in regard to size and composition was undertaken after the census.
The other matters dealt with in this chapter centre round the age returns. Age is a question asked at every census in the world. The trouble is that not everbody knows his exact age. In consequence there is a marked tendency, especially among illiterate people, to report age in round numbers, that is, in numbers ending in 0 or 5, or in even rather than odd numbers. This is a pheno-
menon not confined to India. To eliminate the bias in favour of these particular digits the age figures were exhibited in the past in terms of a nve-year or ten-year distribution that was closer to reality than would otherwise have been the case.
Single year age returns were compiled and regularly exhibited at past censuses only for those returned as less than 5 years old, and no way was left open to the statistical analyst to get back to the Qriginal age returns of other ages until 1941, when single year age returns for several provinces, including Bombay, prepared by the Statistical Institute, Calcutta, on the basis of a 2 per cent sample after the census were published. The predictive qualities of a sample will vary according to the aspect under examination and will in general be best when the aspect is universally present in the population. Age is a universal. Everybody, whatever his vocation or location, must have an age. The age sample' in 1941 was a very small one, but the extraction of ·data in regard to single year -age returns marked a definite ad,vance over the previous practice of publishing only age . groups, a' procedure which has been likened to putting the .figures in a straight jacket. In 1951 extraction of age data was done on a sample basis by taking out every tenth slip. The 'greater size of the sample would tend to decrease the sampling error.

104 FAMILIES, SEXES AND PRINCIPAL AGE GROUPS
The single year age returns in both 1941 and 1951 reveal the overwhehning extent to which age was returned at the census in terms of the nearest five years, particularly after the age of twenty. It is for this reason that examination of the age data is done in relation to age groups, but since these age groups are merely summations of the single year age returns the quality of the single year age returns at any particular census is a matter of considerable importance.
The tendency to round off ages after 20 is very marked. More persons returned themselves as 25 or SO at the census of 1951 than as any other age. This tendency to round off ages is comprehensible because recollection tends to fade with increasing years and birthdays have no special significance for most people. It does not matter what a man's exact age is .. so long as he can be assigned to one or O'I:her life's chief periods-childhood or adolescence, the adult middle period or old age-to each of which Hindu social custom assigns specific duties."l
Though the preference for round numbers in 1951 was very marked the quality of the single year age returns was better than in 1941. For every 10,000 persons who returned their age as 25 in 1941 the sum of those who returned their age as 21, 22, 2S and 24 was lO,84S. In 1951 it was 12,212. For every
10,000 persons who returned their age as 25 in 1941 the sum of those who returned their age as 26, 27, 28 and 29 was 9;'1.28. In 1951 it was 9,706.
There is another direction in which improvement in age reporting is discernible in 1951~ In the table below six selected single year age returns in 1941 and 1951 are compared. It will be seen that, despite the fascination exercised by digits ending in "0," the returns in 1951 did taper off at higher ages in accordance with actuality, while in 1941 there were bulges at ages 40 and 50, attributable to greater inaccuracy in age reporting. To facilitate comparison a base line of 10,000 persons at age SO has been assumed.
Single year age returns. SO 35 40 45 50 55
Bombay State 1941
Persons. 10,000 8,375 8,429 6,149 6,635 3,367
1951 Persons. 10,000 8,994 8,551 6,291 6,097 3,504
In most districts the single year age returns of urban areas were rather better than those of the rural areas,2 a result which could be attributed to the greater literacy of the urban areas.
SECTION 2
TERRITORIAL DISTRffiUTION OF HOUSES AND HOUSEHOLDS
The problem of finding a completely satisfactory definition of a census house is perhaps insoluble, not only in India but el~ewhere. The 1951 census distinguished the house and the household. A" house" was defined as "a dwelling with a separate main entrance." A" household," on the other hand, meant "all the persons who lived together in the same house and had a common mess/'
At previous censuses statistics of houses were collected, but the definition of the house swung between the household and the house. Up to 1901, the definition of- a house in Bombay Presidency was .. the residence of one or more families having a separate entrance from a common way." In 1911 however the commensal family formed the basis of the definition and continued to do so until 1951. The 1941 definition of a .. house;' was "the
1 Census of India, 1941, Baroda Report, page ISO.
building or part of a bUilding inhabited or likely to be inhabited by one or more persons living together and eating together in one common mess with resident dependants and servants."
The 1951 definition of a "house" was thus not comparable with the definition adopted at previous censuses. The" household" of 1951 approximated to the t< house" of 1941 and previous censuses as it was based on the commensal family. This was not true, however, of Bombay City. In Bombay City, until 1951, the census house was a whole building separately assessed to municipal taxation. The individual .c Hats" or .. blocks" contained in these building~ were not separately numbered. As a result the census house in Greater Bombay contained over 30 persons at censuses from
• Single year age returns of ruml and urban areas have been published in the District Census Handbooks.

FAMILIES, SEXES AND PRINCIPAL AGE GROUPS 105
1921 to 1941, while in 1951 it contained only 5·8 persons. Thus 'even the figures of households in 1951 cannot be compared with the figures of houses at earlier censuses, at least in Greater Bombay.
Because of inadequate and changing definitions the comparative figures of houses per 100 square miles in Subsidiary Table 6·1 must
be treated with caution. The rise in the number of houses per 100 square miles in Greater Bombay in 1951 was not due to fresh building, but to the fact that at previous censuses not all the houses were given separate numbers. Kaira district had the highest number of persons per square mile of any district outside Greater Bombay.
SECTION 3
SIZE AND COMPOSITION OF FAMILY HOUSEHOLDS
The .. household" and not the .. house" is the apprqpriate starting point for social and economic enquiries. When more than one " household" was found in the same census "house," or dwelling with a separate main entrance, in 1951, the enumerator was asked to distinguish the households by adding th~ letter A or B after the housenumber on the census slips. The answers were later transcribed by houses and households into National Registers, and these were used to examine the size and composition of family households on a 4 per cent sample basis. An enquiry of this nature would not have been possible on the basis of the census slips alone. The number of households would always exceed the number of houses, though cases of· a household spreading itself over more than one house were encountered. Thus in Bombay, Saurashtra and Kutch there were 7,248,611 houses at the 1951 census, containing .,8,066,427 households, an average of 5·6 persons per census house. 414,132 persons, or 1 per cent of the population, were enumerated in institutions or were houseless.
The definition of a "household" in 1951 was roughly comparable to the definition of a "house" in 1941 and preceding censuses. Past census figures suggested that the size of the house (present household) in Bombay, S:wrashtra and Kutch was bigger in urban than in rural areas. This result, however, was due to the distorting influence on the returns of the Bombay City figure of houses, where there was a divergence from the practice followed elsewhere of numbering separately each commensal dwelling place. The figures of most other natural divisions presented a different picture.
For 1951, we have two sets of figures indicating household size-the deduced figure derived by dividing the population per.
A (Bk) H 91-14
1,000 houses by the number of households per 1,000 houses, and the figure obtained by analysis of a 4 per cent sample of the households extracted from the Nat~onal Registers.
The results are compared below:-
Average number of persons per household in Bombay, Saurashtra and Kutch in 1951
Deduced 4 per cent
'Total population Rural population Urban population
I: _'
figure. households
5·0 5·1 4·9
sample figure.
4·9 5·0 4·7
It seems valid to assume from these figures that the average family household in 1951 had 4·9 or 5 persons, and that the average size of a household was larger in rural areas than in urban, since both the deduced figure and the specific enquiry into sample households support the same conclusion. Only in the Deccan Southern Division and in Kutch was the urban household larger on an average than the rural household. Households in the Deccan were on an average slightly bigger than in Gujarat, while in Kutch the average household in both rural and urban areas was noticeably smaller than anywhere else. These trends were also suggested by the 1921 and 1931 figures of houses.
For purposes of analysis of households according to size four gradations were recognised-small households (with 3 members or less); medium (with 4-6 members); large (with 7-9 members) and very large (with 10 members or more). The average size of a household was a complex of the number of persons living in households of different sizes. More persons lived in households of medium size, having from four to six members, than in any other size of household. The reason why the average size of a household was larger in rural than in urban areas was that in

106 FAMILIES, SEXES AND PRINCIPAL ACE CROUPS
the rural areas the percentage of the household population who lived in medium or large sized households was greater as the following table shows ;-
Percentage of the household population who lived in households of different sizes in
Bombay, Saurashtra and Kutch
Rural Urban
Small.
14·0 17·3
Medium. Large. Very large.
43·6 41·3
28·2 26·3
14·2 15·1
It is interesting that the rural and urban patterns were not widely divergent. Urban conditions with their individualistic modes of living would be more favourable to the growth of small households than rural conditions, yet the high percentage of the urban population found in very large households would seem to contradict that conclusion. There is really no contradiction. The very large family household is still a feature of most urban areas, although small family households are also more frequently encountered in urban areas than in rural. Again in some city areas there is a tendency for houses to be shared in a quasiboarding house arrangement centring round some sort of family household. Perhaps the most remarkable feature brought out by the figures was that in the area as a whole as much as 42·1 per cent of the household population lived in large or very large households.
Size oj households in rural areas3
Large and very large households were less frequently encountered in Cujarat than in the Deccan. It was this feature that principally served to depress the average size of the household in rural Cujarat by contrast with the Deccan Northern and Southern Divisions, a feature brought out by past census statistics. The reason why the number of persons per household was much higher in the districts of West Khandesh, Amreli, Satara South and Halar than in other districts was that the higher percentage 6f the population of these districts who lived in large or very large households raised the average size of the households in these districts. In the districts of the Konkan the average rural household was slightly smaller than in other divisions of Bombay State; in Kutch it was very noticeably smaller. Large and very large households were less a feature of these divisions than of other natural divisions, and there was a rise in the number of small households. This was
3 Subsidiary Table 6'2.
possibly due to the scattered nature of the dwellings in the Konkan tract, discouraging large aggregations of people in individual households. Emigration would also seem to be a factor favourable to the formation of small households in the districts from which emigration took place, and from the Konkan and Kutch considerable emigration takes place.
Size of households in urban areas
All over Western India, except in Kutch and the Deccan Southern Division, the rural household was larger than the urban one. One would expect that the urban household would always be smaller than the rural. The reasons why Kutch and the Deccan Southern Division "departed from the normal pattern are not known.
In Kutch and the Konkan the households in both rural and urban areas were belo~ the average in size, because of emigration.
Family composition of households1
Past census reports sometimes attempted to use the figures of houses and population to draw conclusions about the fate of the jOint family-whether or not it was br~aking up. Because of lack of data such speculations tended to be inconclusive. After the 1951 census, the sample households were analysed not only according to size, but also according to composition. The composition was established according to the number per 1,000 households of the following personsheads of households and their wives, sons of heads of households, daughters of heads of households, other male relations to heads of households and other female relations to heads of households. Servants and unrelated persons were excluded from the analysis. They formed only 1'5 per cent of the household population in Bombay, Saurashtra and Kutch. In Creater Bombay they formed 11· 4 per cent. In every other natural division they were less than 2 per cent.
In Western Europe the normal family household would probably be considered to consist of a husband, his wife, and their children, with such variations in the pattern as might be induced by the death of parents. Any additions to this normal pattern would be held to fall under the heading of calamities as when orphaned children might live with relatives, or when a widowed mother might descend temporarily or permanently on the
4 Subsidiary Table 6·3.

FAMILIES, SEXES AND PIHNCIPAL AGE GROUPS 107
household of her llion-in-Iaw or daughter-in-law. A recent variation of the calamity pattern was occasioned by thi! post-war housing, shortage in Britain which compelled a number vf young married persons to live with in-laws, a process which was regarded as conducive to much stress, strain and marital unhappiness. Such attributes are thqse of a highly individualistic society, and have probably been reinforced by the urban pattern of living, a decline in the death rate, and the growth of insurance. In a predominantly agricultural country like India' the social attitude has not hardened into resentment of in-laws, though the ,joint family is undoubtedly tending to break-up.
The break-up of the joint family has been occasioned largely by economic circumstances. Gousins no longer enjoy their old status in the family pattern. Pressure on the land has also probably accelerated the break-up of the large agricultural joint family. There is no shortage in most areas of agricultural labour, hence the tendency for those whose endeavours were surplus to the cultivation of joint family property to seek other avenues of emplo~ent. Again education of women and the disappearance of child marriage have mean~: that women have become increasingly unabJe or unwilling to adapt themselves to a dOJpestic situation in which they have to play a .suborordinate role to an elder matriarch.
The old style joint family in the s~hse of numerous families living together Ul.{der one roof is much rarer thjln is frequently s~pposed. Even when families remain legally joint today it is fairly uncommon· to find several selfsupporting males and their families living together. The writer came across one joint family household with more than thirty members in Belgaum town, but cases of this type are extremely rare in Bombay State.
In tpe table which follows the six degrees of relationship-heads of households and their wives, sons, daughters, other male relatives, and other female relatives-have been shown according to the percentage that they formed of the average family household. Figures for Gujarat where the average family household was smaller (4·8 persons) than in other divisions of Bombay State, and for the Deccan Southern Division, where it was larger (5·1 persons), have also been shown for purposes of comparison.
A (Bk) H 91-14a
Percentage of types of relationships in family households
Bombay, Sau- Gujarat. Deccan rashtra and Southern.
Heads of households Wives of heads
households Sons ,'. Daughter$
Kutch. 18·35
of 16·75
Other male relatives Other female relatives ..
22·69 17·54 10·20 14·47
Total .. 100·00
19·02 17·08
23·72 18·67 8·72
12·79
100·00
17'21 15'66
22·35 17·07 11·39 16'32
100'00
It is· a pity that degrees of relationship were not tabulated more fully. There are however enough data to suggest that it is dependency that primarily determines family composition. In every district the number of sons of heads of households exceeded the number of daughters, due to the fact that daughters marry ~t an earlier age than sons and when they
.:narry, they generally leave their fathers' houses to live in the houses of their husbands or fathers-in-law. Sons tend to marry earlier than in the West, before they can afford a separate establishment, and continue to stay in their fathers' houses and are joined by their wiv~~. In consequence sons were more numerous t?,an daughters in the sample households and female relatives were more numerous than male relatives. 'Widowhood also accounted for the excess of other female relations over other male relations. Dependent widows would go' to stay with male relatives.
Other relatives formed a higher proportion of the household population in the Deccan Southern Division than in Gujarat. This is capable of several explanations. Birth and death rates in the Deccan Southern Division were both high, and there were more widows there than elsewhere in Bombay State. Again the large family household with its attendant male and female relatives may survive to a greater degr~e in the more intensely rural Deccan Southern Division than in urbanised Gujarat. The fact, however, that the average family household in Western India had only five members, and that only about a quarter of the household population were other than heads of households and their wives or sons and daughters of heads of households: suggests that the composition of the average family household departs from the unitary husband-wife-children pattern only to the extent necessary to take care of dependants.

108 FAMILIES, SEXES AND PRINCIPAL AGE GROUPS
Precise degrees of relationship were not established by the tables. It might be asked for instance why, when there were 887 male heads of households in Bombay, Saurashtra and Kutch there were only 810 wives of heads of households. The explanation is that the sex ratio is unfavourable to women, particularly in the adult age groups. Many male immigrants to urban areas are not accompanied by their wives. Thus, in Greater Bombay, for every 945 male heads of households per 1,000 households (almost the highest figure returned by any district) there were only 633 wives of heads of households, by far the lowest figure returned by any district. Ahmedabad also returned a low figure for wives of heads of households for an identical reason. On the other hand, in the districts of Ratnagiri, Satara North, Kolaba, and Kutch, from which considerable male emigration takes place, the number of women who were heads of households exceeded the number of men. The influence of emigration or immigration was
discernible also in the figums of sons of heads of households. In the districts from or into which heavy male migration occurred the number of sons in the sample households was abnormally low ..
It would be unsafe to push the analysis too far, b!lt the higher number of daughters in the households in Gujarat, coupled with the fact that there was a higher number5 of unmarried females per 1,000 in that division than in any other, suggests that the age of marriage of women there may be advancing to a greater extent than elsewhere. This may in part be connected with the higher literacy of women in Gujarat. Lastly, the very high figure of other male relatives in the sample households in Greater Bombay illustrates the strength of family ties among the immigrant male population. In the general shortage of accommodation they joined the households of relatives. 'The number of such other male relations in the sample households exceeded the number of wives of heads of households.
SECTION 4
SEX RATIOS
There were 938 females per 1,000 males in Bombay, Saurashtra and Kutch in 1951. Western India thus exhibited a feature that has been characteristic of India as a whole since the censuses began.
Successive censuses in India have shown that men consistently outnumber women. Indeed the defiCiency of females in certain areas was so marked that some demographers believed that it was due to the omission of women from the census count, a theory which was effectively refuted in the Indian Census Report of 1911. The defiCiency of females in the population is an undoubted fact. The deficiency tended to be very marked in the north and north-west of India, and to be counterbalanced by an excess of females in the south.
A number of theories have been advanced to explain the differential sex ratio obtaining in various parts of the country. Race and environment, the latter in the sense of different climatic, social and dietary conditions, have been put forward as explanations. The argument based on race explained the lower proportion of females in the north and northwest in terms of the higher proportion of Aryan and Semitic elements in the population,
and the greater proportion of females in the south in terms of the preponderance of Dravidian elements. If there was a tendency for persons of a particular racial strain to have a preponderance of males or females, the endogamous caste divisions of society were believed to favour the continuation of the characteristic.
In the 1921 Bombay Report6 L. J. Sedgwick, who was a believer in the theory that sex ratios were primarily a matter of race, endeavoured to show that particular castes which were believed to be of the same racial origin, had similar sex ratio when the geographical areas in which they were found and the climatic conditiQns urider which they lived were different. In the case of castes which were entirely different there was a tendency for the northern castes in Bombay Presidency to have lower sex ratios, but this he ascribed not to geography or climate, but to the fuct that a low female index was a racial peculiarity of the north. On the other hand the National Planning Committee noted7 that the same castes
---:,--:c-----------------5 Subsidiary Table 6'7. 6 Census of India, 1921, Bombay Report, page 104. 7 It might of course be that an identical caste name
concealed a different racial origin.

FAMILIES, SEXES AND PRINCIPAL AGE GROUPS 109
which were di~tributed in different parts of northern India showed a deficiency of females, as one moved turther towards the arid conditions in the west and north-west. Race would not seem to be a complete explanation of the differential sex ratios; and the cessation of caste tabulation at the 1951 census has deprived those interested of data with which to continue the speculation. .
The second theory which sought to explain the matter in terms of environment, in the sense of different climatic or social conditions, argued that as climatic conditions became more arid and the conditions of life more severe a deficiency of females developed. A low damp climate was believed to be favourable to females, and dry uplands to males. To this might be added the related speculation that past infanticide or deliberate neglect of girl babies in areas where conditions of life were hard might have selected those females for survival who were likely to bear a preponderance of male children, a theory which seems somewhat fanciful.
In most parts of the world more male children than female children are born, and India is no exception. The reason would appear to be that the male infant is more delicate than the female and this is nature's way of redressing the balance. The census of course does not provide data about the number of male and female births, since the average age of those returned as less than one year old at the census was six months. The registered figures of births however show that more boy babies th1l.n girl babies are born. There were 164 males to every 161 females in Bombay, Saurashtra and Kutch at the census aged less than one year old.
Effect of migration on sex ratios
Migration acts as a powerful distortion to sex ratios. The question of age in relation to sex ratios is of particular importance in the case of a state like Bombay which not only attracts migrants from outside, but within whose borders there are certain well-defined patterns of migration; and migration, as is well-known, tends to affect most the adult male age groups. It is, in fact, impossible to consider sex ratios, divorced from the phenomenon of migration. The excess of females over males, which is a feature of the sex composition of Great Britain, is a result not only of war casualties among the male population, but of male emigration during the latter
part of the 19th century. At the time of the 1951 census there were 1,079 females per 1,000 males in Kutch, not because nature there is more favourable to female survival but because of heavy male migration. In fact: in the youngest age groups (0-5 years) in Kutch, females were deficit to a greater extent than in Bombay or Saurashtra. Saurashtra is also a state from which emigration takes place, though not on such a heavy scale as to leave an excess of females in the population as a whole.
In the case of Bombay State the effect of migration on the sex ratio was very marked. Since there is a deficiency in the number of females in the state as a whole, an excess of females over males in any district in Bombay State may be regarded as proof positive of the existence- of male emigration from the area. In Ratnagiri district in 1951, there were 1,224 females for every 1,000 males, in Satara North there were 1,051, and in Kolaba there were 1,040. The heavy disparity in the sex ratio of Ratnagiri indicates male emigration. The disparity was greater at this census than at any of the past four censuses. This was probably due to intensification of emigration to Bombay City from a traditionally emigrant district dming the past ten years.
Because of this factor of emigration it is difficult to arrive at the true sex ratio of the natural population of the area. In the population as a whole, the number of females per 1,000 males in Bombay, Saurashtra and Kutch registered a slight decline from 941 in 1921, 1931 and 1941 to 938 in 1951, the deterioration being attributable to increased male immigration into the area from other states during the past two decades. The sex ratio of Bombay State recorded a slight increase in masculinity during the decade, there being only 932 females per 1,000 males in Bombay State in 1951, as compared \yith ~35, 936, and 935 at the three preceding censuses. The deterioration may be safely attributed to a rise in the amount of male immigation to Bombay State from other parts of India.
Districts with an unusually masculine sex ratio were Greater Bombay (596), Ahmedabad (84~) and Thana (907). Greater Bombay, Ahmedabad and Thana attracted a large number of immigrants during the pa·st decade and in the migration stream male~ predominated.

110 FAMILIES, SEXES AND PRINCIPAL AGE GROUPS
Because of migration the sex ratio in urban areas was more unequal than in rural areas. The reason is that the urban areas draw a considerable proportion of their population from rural areas. Hence, the bigger the urban area, the more masculine its sex ratio tended to become. In Greater Bombay, the largest city, there were 596 women to every 1,000 men in 1951 ; in Ahmedabad 765; and in Poona 865. In each of the other five cities of Sholapur, Surat, Baroda, Hubli and Icolhapur, however, the sex ratio improved progressively at the past three censuses, suggesting that the ruralurban migration increasingly contains a larger proportion of women than it formerly did. Bombay and Poona, however, grew phenomenally during the past decade and in 'tl1eir migration streams (particularly when the migration was from a long distance) males outnumbered the females, with the result that there was no improvement in the sex ratio.
Even in those districts whose sex ratios were not disturbed to any extent by migration there was a deficiency of females at this as at past censuses. This is the important fact that distinguishes Bombay from states like Madras and Travancore-Cochin where the sex ratio is much more favourable to females.
Ages at which female numbers are de-[i'Cient The ages at which the deficiency of females
makes itself manifest is important. In the table below the number of' females per 1,000 males at different age groups in Bombay State has been shown .:-
Females per 1,000 males in 1951 in Bombay State
Age Group. o 980
1- 4 963 5-14 937
15-24 949 ~-M 9M 35-44 859 45-54 866 55-64 962 65-74 1,135 75 and over 1,177
It \vill be seen that the ratio of females to males, which was not particularly unfavourable below the age of 5, showed a steady decline thereafter. The ages 35-44 were especiall; unfavourable to women. With old age the sex ratio became favourable to women, which it· seems to do in every country. At the business of outliving old men old women enjoy a tremendous advantage. It might be
asked why there was a bulge fn the age group 15-24. The reason is that the number of women in this age group has been artificially inHated because of the large number returned as aged 20. There is always a tendency to round off women's ages which are less accurately reported than men's.
Comparing these figures with the pattern in areas like Travancore-Cochin, Madras and Orissa, where there was no deficiency in female numbers, we find that both share one feature. The age group 35-54 was the worst for female survival. This may be due to the hazards of child bearing at later ages, or is more probably a ~ matter of relative stamina. A man in those ages may still be relatively vigorous, while a woman is undergoing the change of life with its attendant complications. The ages between 15 and 34 would not seem to be a particularly bad time for women. In areas where women were in excess, they were in excess at these ages, and though errors in age reporting make it impossible to be dogmatic, the recorded ratio of females to males in Bombay State underwent no great deterioration between the ages of 5-14 and 15-M.
The sex ratio in Western India has remained fairly stable during the past thirty years. There is no indication that it will in the near future alter very much. If anything, there might be a slight decrease in masculinity during the coming decade, assuming that the heaviest wave of male immigration is now over.
Proportion of Women to Men according to livelihood", classesB
There were relatively fewer women to men in the non-agricultural classes ( 863 females per 1,000 males in Bombay, Saurashtra and Kutch) than in the agricultural classes (992 females pel' 1,000 males). To a great extent this was a mere reflection of the ruralurban differential, ascribable to the fact that migration to the towns from the rural areas left a larger number of women than men dependent on agriculture. In Ratnagiri, Satara North, Kolaba, Poona aqd Surat districts in Bombay State and in Kutch State the proportion of females in the agricultural classes exceeded the males, suggesting that it was from among the agricultural classes in these areas that emigration occurred. In Kutch and Saurashtra, however, the excess of females over males was greater in the non-agricultural classes than in the agricultural classes,
8 SubSidiarY Tables 6·5 and 6·6.

FAMILIES, SEXES AND PRINCIPAL AGE GROUPS 111 )
a reversal of the Bombay position. Merchants and non-agriculturists tended to predominate in the migration stream from these states leaving their women folk behind.
In addition to comparing the ratio of females to males in the eight livelihood classes, a comparison of the ratios of self-supporting, nonearning dependent and earning dependent females to males of similar dependency status is illuminating. For every 1,000 males in the agricultural classes who were self-supporting there were 154 self-supporting females in Bombay, Saurashtra and Kutch, whereas in the non-agricultural classes the proportion was 123. In other words there were more self-supporting females relatively to males in the agricultural classes than in the non-agricultural classes. The main difference however was in respect of non-earning dependency and earning dependency. There were 1,329 non-earning dependent and 2,752 earning dependent females for every 1,000 males of similar dependency status in the agricultural classes in Bombay, Saurashtra and Kutch, while in the non-agricultural classes there were 1,628 non-earning dependent and 1,490 earning dependent females. Relatively to males there was, a heavier burden of non-earning dependency among females belonging t6 the non-agricultural classes, while in the agricultural classes
a very considerable proportion of women were earning dependants.
In livelihood class IV ( non-cultivating owners of land; agricultural rent receivers and their dependants) a very high figure of 553 self-supporting females per 1,000 selfsupporting males was recorded. Rent from agricultural land was an important source of income for widows. The principal means of livelihood of the deceased husband might have been owner-cultivation or even a non-agricultural means of livelihood. The principal means of livelihood of the widow, unable to cultivate personally or carryon her husband's occupation, would tend to be rent from agricultural land, and she would rank as selfsupporting.
Next to livelihood class IV livelihood class VIII (Other services and miscellaneous sources) provided the highest proportion relatively to males of self-supporting females. It was within this livelihood class that women found their greatest opportunities for independent, self-supporting, employment. Many of the traditional women's employments, nursing and domestic service, as well as the humbler job of sweeping,' are in that livelihood class, while many of the new avenues of employment opening to women were also in this livelihood class.
SECTION 5
MARITAL STATUS RATIOS
A comparison of the marital status of the population for th~ past four censuses is interesting. By marital status or civil condition is meant whether a person was married, unmarried, widowed or divorced at the time of the census. Divorce is so uncommon that it was omitted as a subject for comparative study. The comparison therefore related to the marital status of 1,000 of each sex of the general population in respect of the three civil conditions married, unmarried or widowed, at the past four censuses.
Since 1921 a steady rise in the nuinber of unmarried persons of both sexes has been recorded, save for the- census year 1931. Data for 1941 for Saurashtra are lacking, hence the figures for Bombay State alone are exhibited in the following table :-
Unmarried persons per 1,000 of each sex
Males Females
1951. 1941. 1931. 1921. 525 493 462 464 406 369 324 319
The figures suggest that the age of marriage is becoming progressively higher. The figures also illustrate, what is common knowledge, that the age of marriage in the case of males is much higher than in the case of females. Relatively to males the age of marriage of females would seem to have recorded a proportionately greater advance since 1921. The proportion of unmarried persons in the male population increased by 6· 1 per cent between 1921 and 1951, while in the case of females the increase was 8·7 per cent.
The figures for married persons for the past four censuses for Bombay State are reproduced below:-r
Married persons per 1,000 of each sex
1951. 1941. 1931. 1921. Males 434 453 483 467 Females 462 481 513 490 The noticeable bulge in tJJ.e number of
married persons, both males and females in

112 FAMILIES; SEXES AND PRINCIPAL AGE GROUPS
1931, in reversal of an otherwise downward trend, was due to the passing of the Child Marriage Restraint Act, 1928, more commonly known as the Sarda Act, which made the marriage of a male under 18 years of age or
a female under 14 years of age a penal offence9• The Act had been in operation for less than twelve months when the 1931 census was held. Knowledge of the impending
enactment prohibiting child marriage led to
the celebration of a number of m~rriages
which would otherwise have been performed later. This led to an increase in the number of married persons both male and female in 1931 by comparison with 1921.
Age Group.
All ages o
1--4 5-14
15-24 25-34 35--44 45-54 55---{J4 65-74 75 and over Age not stated
Total. 2
46'96
93'48 39'87 7'71' 2'77 1'94 2'15 1'82 \'89
67'35
(top of next column)
Unmarried.
Males. Females. Tota!' 3 4 5
52'63 40'89 44'55
97'55 89'12 6'39 61'70 16'97 58'66 \2'20 2'84 87"25 3'91 1'46 84'03 2'83 0-93 70'25 2'95 1'33 51'31 2'32 1'38 37'49 2-66 1'26 27"72
48'71 78'86 26'23
The decline in the number of married persons in the total population of Bombay, Saurashtra and Kutch since 1931 is due not to any great shift in the sex ratio or age structure, but to the fact that the age of marriage is becoming progressively higher. Infant marriages have become extremely rare, though some do still take place. Examination of the slips of married females below 15 years of age showed that most were cases of marriages of girls returned as 14 years of age, and not of infant marriages. Infant marriages seemed to be confined almost entirely to the backward classes. 97 out of every 1,000 married females in Bombay Province in 1941 were less than 15 years of age. In 195] the number had fallen to 60. Even this figure is too high, though whether an improvement
o In 19,19 the minimum age was raised to 15 in the case of girls, a fact that singularly few people seem to know about. In 1951, 6 per cent of the married women in Bombay, Saurashtra and Kutch were below the age of 15.
'~ -Age at marriage
The proportion of a gelleration which ultimately marries is in a sense the fundamental fact about its marriage habits, but another aspect of importance is the age at which marriages occur. In the West people tend to marry less and later than in India, where universality of marriage is the normal thing. At the 1931 census of Great Britain 88· 6 per cent of the males and 83·1 per cent of the females aged 45-54 were or had been married.lO In India marriages take place earlier, and the percentage of the population who never marry is very small indeed. The following table shows the percentage of the population in Bombay, Saurashtra and Kutch belonging to particular age groups according to their civil condition :-
Sample Population.
Married. Widowed and Divorced.
Males. Females. Total. Males. Females. 6 7 8 9 10
43'18 46'02 8'49 4'19 13'09
2'39 10'68 0'13 0'06 0-20 37'55 80'81 1'47 0'75 2'22 84'93 89'76 5'04 2'87 7"40 90'09 77-05 13'20 6'00 21'49 84"64 53"91 27'81 12'53 45'16 74-08 28'12 46'54 22'97 70'55 63'55 14'59 60'69 34'13 84'03 51'\0 8'37 70'39 46-24 90'37 44'40 15'03 6'42 6'89 6'11
could be secured by a further statutory raising of the age of marriage is open to doubt. There is no substitute for enlightened public opinion, and fortunately the trend of the figures suggests that public opinion is increasingly setting itself against very early marriage of girls.
The customs of different communities in regard to marriage have received the fullest treatment in past census reports, where civil condition was analysed according to religion. In 1951 the basis of the sorting for civil condition was territorial and not religious, and since there are very few districts in Bombay State where the population is homogeneous no analysis of any shifting trends in the marriage habits of particular communities was possible.
10 The main reason why the proportion of married was so much higher among men than among women was the abnormal sex ratio in the relevant age groups. Heavy male emigration in the late 19th century produced the abnormality in the sex ratio, and its effect was greatly reinforced in certain generations by the war casualties of 1914-18.

FAMILIES, SEXES AND PRINCIPAL AGE GROUPS 113
Widowed persons ~
Though the major trend discernible since 1921 in the civil condition of the population was the rise in the proportion of unmarried persons, attributable primarily fo an increase in the age of marriage, there is another trend of even greater significance and that is the fall in the number of widowed persons in the population. The percentage of widowed persons in the male population of Bombay State fell from 6·9 in 1921 to 4 in 1951. Even more significant was the fall in the number of widows, since widowers can and ,do remarry. 19·1 per cent of the entire female population were widowed in 1921, while in 1951 the proportion had fallen to 13·0 per cent. It is improbable that the custom of non-marriage of widows is breaking down in practice very fast, although enlightened public opinion realises increasingly that the social sterilisation of a fairly large proportion of women by virtue of the ban on widow
remarriage is not a particularly desirable taboo, however much it might indirectly serve as a crude institutional form of birth control. The decline in mortality that has occurred since 1921, when the era of rapid population increase began, is reflected in the fall in the proportion of widows in the age group 40 and over as the following table shows :-
BOMBAY STATE
Percentage Of women of 40 and over who were widowed
1881 1891 1901 1911 1921 1931 1941 1951
60·4 59·2 60·S 60·7 60·3 59·4 56·9 51·5°
o Percentage obtained by interpolation of the age group 35-44.
SECTION 6
INFANTS (AGED 0)
The age recorded at the census was the age in completed years. For infants below one year of age .. 0 " was written. The number of infants below one year of age is of especial interest. If the coverage of the population at the census were complete and the recording of uge accurately done, it would be possible to work back from the figures of those in the "0" age group to the probable number of births and, in consequence, to a true birth rate. Unfortunately several factors prevent this. One of the chronic problems of census-taking everywhere is to secure a full return of young children. They tend to be omitted from the enumeration, and there is no reason to believe that India is an exception to a universal trend. The most important
factor that vitiates the" 0" age return is, however, extreme inaccuracy in age reporting.
The great difference between the number returned as less than one year old and those who had entered the second year of life caused considerable astonishment when mst observed. After the 1881 census, at which the ages of
A (Bk) H 91-15
infants were recorded in months, it was feared that mistakes in abstraction had led to the months being treated as years. In consequence, in 1891 the rule was that all children of less than one year old should be recorded as infants, without specifying the number of months. .. Unfortunately, however, the term suggested applies, in nearly all the vernacular tongues, to any unweaned child, and as the period during which the latter is kept at the breast is far longer in India than in most temperate climates, the second year of life was largely absorbed by the first, and the last state of the returns was worse than the first."ll
Since 1891 we have had the experience of many censuses to guide us, and many subtle variations have been devised to try to secure a more accurate age return of infants and young children. The results, however, have not led to any startling improvement as the table which follows shows. To facilitate comparison a base line of 100,000 at age 0 has been assumed.
11 Census of India, 1891, General Report, page 277.

114 FAMILIES, SEXES AND PRINCIPAL AGE GROUPS
Single Year Age Returns-Bombay Area
1941 1951 AtJe. 1901. 1911. 1921. 1931. (Bombay (Bombay
Province). State).
0 100,000 100,000 100,000 100,000 100,000 100,000 1 74,605 54,055 47,717 96,147 102,710 72,019 2 125,665 90,973 86,i91 102,139 106,841 85,467 3 125,730 90,559 95,228 103,257 114,269 81,249 of 140,487 86,583 101,538 103,502 ll9,135 84,932
Reference. P. 54, Vol. IX-A, P. 64, Vol. VII, P. 62, Vol. VIII, P. 94, Vol. VIII, P. 15 of2 per C-V table of the Part 11-1901 Part 11-1911 Part 11-1921 Part II-1931 cent Y -Sample ) 95) Census. Census of India. Census of India. Cen.us of India. Census of India. tables for
('- !
In 1921, as in 1891, infants less than one year old were to be recorded simply as .. infants,';' despite the earlier speculation about the influence of the longer weaning period on the infant age returns. In 1931 the age asked for was the age next birthday. Infants less than six months old were recorded as .. 0" and infants over 6 months as .. 1." The age returns in 1931 were adjusted to eliminate preferences for particular digits. The 1931 figures are thus not comparable with others in the series. In 1941 .. 0" and the number of months was entered in the case of infants. The small size of the 1941 age sample, coupled with possible vagaries in its extraction,. may account for the single year age returns from o to 4 presenting the appearance of an upturned pyramid. Instead of tapering off at higher ages there were bulges, and each age group betwen 0 and 4 was larger than its predecessor.
The most noticeable feature of the 1951 single year age returns of infants and small children is the bulge at age .. 0" and the gap at age 1. A certain number of those who rightfully belonged to age 1 must have been absorbed either in the age group immediately preceding or succeeding it. The single year age returns obstinately refused to taper off signi£cantly the higher the age return below 10 years of age, as the following table shows, a phenomenon that is against all probability :-
Single year age returns for Bombay State in 1951
(10 per cent sample population) Single year age
returnS: o 1 2 3 4
115,726 83,345 98,907 94,026 98,288
Bombay Paper No. 10, 1951.
Single year age returns.
5 97,898 6 97,630 7 93,122 8 105,678 9 71,338
10 .. .. 126,278 The bias in favour of even numbers as against
odd manifested itself only after the age of 7, suggesting that the single year age returns of those below 8 are, apart from the mix-up at 0, 1 and 2, and a presumed omission of infants and small children, reasonably accurate, or at least more accurate than any other group of single year age returns. A variation in the form of the instructions for the recording of infant ages, or in their emphasis, would accentuate the tendency to inaccuracy, rendering comparability of the data obtained at successive censuses difficult" It follows from all this that the size of the .. 0" age group at successive censuses will not be a completely accurate measure either of the actual number of infants below one year of age or of trends in the birth rate. For purposes of analysis, therefore, the size of the" 0" age group cannot be considered in isolation, but must be analysed with the age group 1-4, which succeeds it. On the other hand, since the instructions were common to all parts of the State at the census, the relative size of the .. 0" age group in different districts probably furnishes a fairly accurate measure of the number of infants in the population, assuming that the tendency to omit infants or to return those aged 1 as aged 0 or as aged 2 was subject to the same general constant errors.
Infants recorded in Bombay State as belong. ing to the "0" age group comprised 3·25 per cent of the population in 1951, as against 2·52 per cent in 1941. It would be unsafe, however, to argue from this that the birth rate was

FAMILIES, SEXES AND PRINCIPAL AGE GROUPS 115
higher- in the.year preceding the 1951 census than in the year preceding the 1941 census, or that infant mo.rtality had decreased, because it is surmised that the form of the 1951 census instructions with their emphasis on infants may have accentuated the tendency for those belonging to the second year of life to be largely absorbed by the first.
Very high percentages in the " 0" age group were recorded in the districts of Panch Mahals, Dangs, and West Khandesh, where the percentage was between 4· 15 and 3·78. In all three districts the Scheduled Tribes, particularly Bhils, form a large element in the population. The tribes have a shorter life expectancy-the number who survive to old age is noticeably lower than in other sections of the population-so that the consistently high decennial increases recorded in the population of these districts at successive censuses seem to be achieved by a high fertility which counterbalances the heavy mortality. The alternative suggestion that the
forest tribes are unable to specify with accuracy any age over a cerfain number might operate partially to inflate the lower age groups, but the general proposition that they have a higher fertility and higher mortality than other sections of the population seems undeniable.
Greater Bombay, not surprisingly, had a lower percentage of the population in the u 0" age group than any other district. The reason is that the middle age groups are swollen by heavy immigration. The figure of 2·36 per cent in the "0" age group and 7·8 per cent in the 1-4 age group should be contrasted with the lower percentages of 1· 74 and 7· 3 recorded in 1941. Since persons under 15 and over 55 also formed a larger percentage of the city's population than in 1941, it looks as though Greater Bombay may increasingly be tending to become the permanent home of a larger number of people, and that a trend towards a more normal sex and age ratio may have begun.
SECTION 7
YOUNG CHILDREN (AGED 1-4)
We have cautioned in the preceding section against separate analysis of the "0" age group without comparison with the succeeding age group 1-4. The percentages of the population recorded as belonging to these two age groups at preceding censuses were as shown below :-
Percentage of total population that particular age groups comprised at successive
.. censuses
Bombay Area
Age 1901. 1911. 1921. 1931. 1941. 1951. Group.
0 2'10 3'43 2'93 2'98 2'52 3'25 1-4 .. , 9'80 11'04 9'72 12'06 11'17 10'52 Total
i.e. 0----4 11'90 14'47 12'65 15'04 13'69 13'77
In the context of the very considerable decennial increases in the population that have been recorded since 1921, the percentage recorded in this age group at the 1951 census seems rather small. The lower percentages found in the age group 0-4 in 1901 and 1921 can be attributed to the disastrous famine of 1899 and the influenza epidemic which followed the first world war with their consequent effect on the birth rate. The relatively higher percentages' in the 0-4 age group in 1911 and 1931 probably mark respectively the recovery
A (Bk) H 91-150
from famine and epidemic. The past decade was however a comparatively healthy one so that, unless there was a decline in the birth rate, the percentage of 13·77 in the 0-4 age group seems fairly small. This proposition will be plainer if we compare with the Bombay State age distributions based on a 10 per cent sample the corresponding age distributions of Japan (1947 census) also based on a 10 per cent sample.
Percentage of the population returned as belonging to specified age groups
Age Group. Bombay State. Japan. 0- 4 13·771 13·465 5- 9 13·077 11·468
10-14 12·430 10·475 15-19 9·032 10·275 20-24 9·019 9·272 25-29 8·622 7·410 30-34 7·444 6· 2'36 35-39 6·240 6·071 40-44 5·440 5·390 45-49 4·086 4·808 50-54 3·702 4·082 55-59 2·349 3·297 60-64 2·291 2·769 65-69 1·076 2·130 70-79 1·034 2·361 80 and over 0·371 0·453

116 FAMILIES, SEXES AND PRINCIPAL AGE GROUPS
The table brings out several interesting points of difference between the age structures in the two areas, notably the much higher proportion of the Japanese population who survive to higher ages (45 and over) than in Bombay State. The main purpose of the statement, however, is to facilitate analysis of the first three age groups. Having regard to the fact that mortality among small children in Bombay is probably not less than in Japan it would appear as though infants and small children aged 0-4 have either been under-enumerated at the census or were returned as older than they actually were. In fact there is probably a general tendency to understate ages below 15.
Interesting figures in the 0-4 age group were provided by Kanara. From the turn of the century this district entered on a period of decline which was so severe that its 1941
population was less than its 19Q1 population. The 0-4 age group in Kanara comprised only 11· 6 per cent of the population" of the district in 1941, whereas the average for Bombay Province then was 13·1 per cent. DDT spraying from 1945 onwards led to a significant increase in the birth rate and the natural increase rate, and a significant decrease in the malaria death rate. At the time of the 1951 census the 0-4 age group comprised 14·2 per cent of the population, a figure above the average for the State as a whole. No other district recorded such a spectacular increase in the 0-4 age group during the decade.
DDT spraying was also carried out in the adjoining district of Dharwar, parts of which are malarious, and the percentage of the p012ulation in the 0-4 age group rose in Dha:nvar district from 13·4 in 1941 to 14·5 in 1951.
SECTION 8
BOYS AND GIRLS (AGED 5-14)
The size of this age group in the population is very important. It is this age group that is being educated, or not being educated, and it is the females in this age group who will move into the reproductive age groups during the coming decade, with consequent effects on future births. This age group formed roughly one quarter of the population. The percentage that this age group formed of the population increased slightly during the past decade from 24·88 to 25·51. In 1941 the under~fifteens comprised 38·57 per cent of the population. In 1951 they formed 39· 28 per cent. There was an increase in the proportion of every age group-O, 1-4, and 5-14. Although this result might be due to the small size of the sample in 1941, it is significant that the very considerable decennial increases in population that have taken place since 1921 have not been accompanied by any great change in the age composition of the population. This suggests that a major reason for the heavy decennial increases lay in a very considerable decline in
mortality, which affected all age groups. Since the general decline in mortality has tended to increase the number of surviving children in the population the recorded decline in the birth rate, even if real, is clearly not of such a dimension as would solve the population problem. Any decline in the birth rate must have becn accompanied by an even steeper decline in the death rate.
Districts in which boys and girls formed below-average percentages of the population were Greater Bombay (17,7), Ahmedabad (23·8) and Thana (23' 9). The reason lay in the immigration of adults into the cities of Bombay and Ahmedabad, and into the areas of Thana district, which adjoin Greater Bombay, depressing thereby the proportion of boys and girls in the natural population. On the other hand above-average percentages in this age group were recorded in the districts of Ratnagiri (27·2), Satara North (26·6) and Kolaba (26·5) from which considerable adult emigration takes place.
SECTION 9
YOUNG MEN AND WOMEN (AGED 15-34)
The twenty year age group 15-34 is compounded of two decennial age groups-15-24 and 25-34. One would expect the age group 15-24 to be larger than the age group
25-34, and this was so in Bombay State and has been since 1931. -But this is not the general rule in India. " The lndian age distributions show, as do those in many other

FAMILIES, SEXES AND PRINCIPAL AGE GROUPS 117
countries, a prono'1nced trough at ages 15-25, and a peak at ages 25-35...... The variation is such that a. smoothing formula would not do justice to it. There is a strong suggestion that the trough at ages 15-25 is due partly to under-enumeration and partly to the erroneous recording of persons of these ages as older than they actually are."12
The superiority in the number of males and females returned as belonging to the age group 25-34 over those belonging to the age group 15-24, was a recurring phenomenon in the Bombay area from 1881 to 1921, but ceased after that date. There is no reason to believe that under-enumeration affected the 15-24 age group more than others in the past, and the explanation of the phenomenon almost certainly lay in misstatement of age. The tendency to concentrate on multiples of 10 or 5 when recording ages has already been noted. The more inaccurate the age returns the greater would be the tendency to concentrate on these multiples, hence the correction of the position in respect of the two age groups in Bombay since 1921 would seem to be due not to an improved enumeration of those belonging to the age group 15-24 but to better age returns. The bulge in the age group 25-34 and gap in the age group 15-24 existed in the age returns of Orissa and Madhya Pradesh in 1941 but not in Uttar Pradesh or Bombay. The more backward or illiterate an area the greater would be the probability of inaccuracy in the age returns.
In the table below the estimated number of persons in various age groups at successive censuses from 1901 to H151 has been shown :-
Bombay Saurashtra and Kutch (Figures in thousan ds)
Age Group. 1951. 1941. 1931. 1921. 1911. 1901.
0 1.323 838 874 750 880 493 1-4 4,289 3,714 3,460 2,469 2,808 2,329 5-14 10,453 8,169 7,130 6,776 5,709 6,366
15-24 7,393 6,164 5,324 3,857 4,439 4,082 25-34 6,466 5,709 4,690 4,559 4,618 4,360 35-44 4,707 3,837 3,360 3,214 3,258 3,047 45-54 3,118 2,574 2,117 2,038 2,073 1,893 55 and over 2,894 2,244 1,753 1,632 1,579 1,403
The table exhibits clearly the curious phenomenon that at each census the age group 25-34 had more people in it than the age group 15-24 at the preceding census. This can probably be explained in part by immigration of young adults into the State, but seems
12 " The Population of India and Pakistan" by Kingsley Davis, pages 238-39.
principally due to vagaries in age reporting. Age 25 appears to exert a much higher degree of attraction upon neighbouring age classes than age 15, and the 10 year age group 15-24 loses more to the following age group than it gains from the preceding one. The number in it is therefore understated.
In the Bombay Report13 of 1911 there is a most interesting table which gives the single year age returns of 100,000 of each sex in the population. The table illustrates that (1) the single year age returns were more inaccurate in 1911 than in 1951 and that (2) the inaccuracy took the form of a heavy concentration on the ages 25 and 30. The gap in the age group 15-24 and bulge in the age group 25-34 which existed from 1881-1921 must have been due primarily to the latter age group being weighted by the large numbers who were returned as 25 or 30. The fact that the phenomenon exists in other parts of the world supports this suggestion. The table below contains a comparison of the single year age returns given in the 1911 report and the single year age returns of Bombay State in 1951 for those belonging to the age group 15-24.
Single year age returns of 100,000 of each sex in the population in Bombay State
Age.
15 16 17 18 19 20 21 22 23 24 25 26 27 28 29 30 31 32 33 34
Males.
2,240 1,948 1,240 2,690
976 3,349
918 2,407
962 1,146 4,333 1,150
951 1,775
470 4,359
435 1,726
471 530
(Exhibited for ages 15-34 only)
1951.
Females.
2,037 2,046 1,221 2,733
930 4,027
831 2,408
875 1,132 4,420 1,054 848
1,784 452
4,597 373
1,518 407 466
Males.
2,676 1.794
933 2,039
719 4,463
480 1,984
631 800
5,656 1,111
770 1,487
371 6,010
270 1,294
350 311
~11.
Females.
2,237 1,696 1.120 1,987
889 4,739 1,097 1,966
847 1,056 5,500
946 809
1,506 442
6,148 290
1,180 300 424
The table suggests another bias-that in the female age returns. The desire of young women to move too rapidly out of their teens
13 Census· of india, 1911, Volume VII, Bombay, p. 80. The table was reproduced at p. 173 of the India Report Volume of 1911, which also contains data for other provinces.

118 FAMILIES, SEXES AND PRINCIPAL AGE GROUPS
or to linger too long in their twenties is a feature familiar to census takers in the West. Though it is doubtful whether any such process of female vanity or expediency was at work in the Bombay age returns where a female in her teens is as often as not a matron, and
. a female of thirty would not normally be reluctant to acquire the heightened status of middle aged matronhood, considerably more females than males were returned as aged 20 in Bombay State in 1911, 1941 and 1951. Since this result is clearly not a demographic fact, the phenomenon must be attributed to
greater inaccuracy in the returns of the ages of females. The exact age of females is a matter of greater ignor.ance or indifferencethan that of males. Hence the tendency for the females at the favoured round numbers 18, 20, 22, 25, 28 and 30 to outnumber the males. It will be a long time before _ the single year age returns approach even reasonable accuracy, but it is heartening that since 1921 one major error relating to the respective age groups 15-24 and 25-34 has been eliminated, and the single year age returns are showing improvement.
SECTION 10
MIDDLE AGED PERSONS (AGED 35-54)
The important point about the 35-54 age group is that, relatively to 1941, there was virtually no change in the percentage of the population returned as belonging to it. Since the heavy increases in population that have occurred since 1921 in Bombay State have been attributed partly to immigration and partly to a fall in the death rate, it might at first sight appear tllat a decline in the proportion of middle aged persons is inconsistent with an improved survival rate. Such, however, is not the case. If the increase in population is due primarily to a reduction in mortality, unbalanced as yet by a corresponding reduction in fertility, the effect of the changed relationship between birth and death rates would lead to no decline in the proportion of children and young persons in the population.. "Census data for various countries in Asia and Africa, and for most Latin American countries, show little change in the age composition of the population during recent decades, even where mortality has been considerably reduced. In fact, such changes as have occurred appear, in most cases, to have been in the direction of increasing the burden of childhood dependency, because of the
initial increases in the numbers of survIVmg G_hildren which are brought about by declines in childhood mortality rates."14
The percentage of persons returned as belonging to the age group 35-54 in the population of Bombay State was 19·47 in 1951, whereas 20·34 per cent of the population in 1941 were returned as belonging to this age group. A fall in the percentage of the population belonging to this age group was recorded by almost every district. The fall was most marked in the districts of Greater Bombay, Thana, and Kanara. In the case of Greater Bombay and Thana the fall was due to the heavy influx of immigrants belonging to younger age groups, while in Kanara the fall may be attributed to the fact that the age composition of the district is becoming more normal on account of c the improvement in the survival rate of younger age groups, due to DDT spraying. The 1941 percentage of 23· 44 returned as belonging to this age group in Kanara was a good 3 per cent above the average for the province. This was due to deficiencies in the numbers belonging to younger age groups, because of the unhealthy conditions in the malarial talukas. .
SECTION 11
ELDERLY PERSONS (AGED 55 ~ND OVER)
The proportion of elderly persons aged 55 and over in the population of Bombay State in 1951 was 7 ·12 per cent. In 1941 the proportion was 7·62 per cent.
Elderly persons of 55 years of age and over would generally speaking be those born in the districts where they were enumerated, because
workers who migrate for employment to the cities tend to return to the districts of their bfrth on retirement. Thus Ratnagiri district,
14 United Nations Economic and Social CouncilFindings of Studies on the Relationships between Population Trends and Social Factors. Part three, pps. 10-11.

FAMILIES, SEXES AND PRINCIPAL AGE GROUPS 119
from which a large "number of persons migrate for work to Bombay City returned by far the highest percentage of persons in this age group. 10·4 per cent of the population of Ratnagiri district were aged 55 and over. Satara North and Kutch, which are also emigrant areas, returned 8· 8 and 8· 6 per cent respectively. Because of the superior facilities oiJered by the cities in respect of education and the ordinary amenities of life a tendency for the professional and business classes to settle down on retirement in places like Poona has developed in the past few decades, though this tendency cannot be statistically proved by the census data.
One might expect to find an increase in the proportion of elderly persons in the 'population as a consequence of the decline in the death rate due to improved public health. This expectation is however falsified by the figures. The reason, as explained in the preceding section, lies not in an increased mortality among elderly persons, but in the fact that the other age groups, particularly the youngest age groups, have increased faster than the old.
A low percentage in the age groups 55 and over might be a result of poorer survival rates among the population of the districts concerned, or it might be due to a disproportionately high number of persons in other age groups reducing the relative proportion of elderly persons in the population. Only 4·6 per cent of the population of Greater Bombay were aged 55 and over in Hl51. With the exception of Dangs this was the lowest proportion retumed by any district. This low figure for Greater Bombay was the converse of the high Ratnagiri figure, and was due to the fact that Greater Bombay had in its population a large number of immigrants in the middle periods of life. It is possibly significant that this proportion of 4·6 per cent marked an increase over the 1941 figure of 4·0 per cent. The
reason may be that despite the heavy immigration of the past ten years an increasing number of persons are tending to settle down after retirement in the city. Improved survival rates might also be a factor.
Other districts returning below-average percentages of their population in this age group were Dangs, Panch Mahals, Sabarkantha, Thana and West Khandesh. A majority of the population of Dangs, Panch Mahals and West Khandesh districts belonged to the backward classes, more specifically the Scheduled Tribes, and this reinforces the suggestion made earlier that the Scheduled Tribes have a shorter life expectancy than other sections of the population. In Sabarkantha and Thana also considerable proportions of the population belonged to the backward classes, though in the case of the latter district the heavy immigration of the past decade also tended to reduce the proportion of elderly persons in the population.
There were more women than men of 55 and over. The precise age at which the tendency to female longevity asserts itself is difficult to determine because of the greater inaccuracy in age reporting at higher ages. Old people tend to exaggerate their age, and not all claims to centenarianship are to be taken seriously. In some cases the claim to great antiquity was unsustainable when the ages of descendants were referred to. One old lady returned her age as 125. The age of her son was 60. This was a gynaecological miracle or wrong age reporting, and the latter is deemed the more probable explanation. The reason why females live longer than males is that the weaker sex, so-called, is in reality the stronger at the business of continuing to live. The ratio of females to males waS high among elderly persons. In the age group 65-74 in Bombay State there were as many as 1,135 women to every 1,000 men. At age 75 and over there were 1,177.
SECTION 12
CONCLUDING REMARKS
In the previous sections the population has been analysed according to its distribution among specified age groups. A comparison was made with the 1941 data. A comparison with the results of censuses prior to 1941 for identical age groups would be desirable. Unfortunately, however, the data for such a comparison were lacking since the age
groupings adopted at censuses prior to 1941 were different, and no single year age returns
from which any desired age grouping could
be reconstructed were available. Even for 1941 age retums were available only for the former province of Bombay and Baroda, and not for the other merged states.

120 FAMILIES, SEXES AND PRINCIPAL AGE GROUPS
In the 1931 census report the increase or decrease at successive censuses in certain specified age groups was shown, and this comparison is so interesting that a similar table has been reconstructed for all past censuses. The table has the additional advantage that it relates to the area that at present constitutes Bombay State, adjustments for changed boundaries being made.
Percentage increase or decrease in the population belonging to specified
age groups at successive censuses
All 1-10. 10-15. 15-40. 40-60. 60 and ages. over.
1872-1881 ... 2 -13 21 I 15 ,55 1881-1891 ... 14 21 -5 12 18 30·, 1891-1901 -8 -18 16 -6 -5 -17 1901-1911 5 10 -15 7 7 15 1911-1921 ... 0'1 2 15 -5 -0'5 7 1921-1931 ... 13 16 12 18 4 -12 1931-1941 ... 16 14 II 17 17 23 1941-1951 ... 23 20 36 19 25 45
The table shows the influence on specified age groups of three important events-the famine of 1877, the famine of 1899, and the influenza epidemic of 1919. The effect of famine is to eliminate young children and aged persons, as well as to reduce births. Such calamities occurred in the past just in advance of the censuses of 1881 and 1901. The influenza epidemic on the other hand selected primarily those in the prime of life, and also operated to reduce the birth rate in the years preceding the census of 1921.
The effect of the famine of 1877 can be seen in the fall in the proportion of children aged 1-10 in 1881, and again in the fall in the proportion of children aged 10-15 in 1891. (There is, however, an unaccountable steep rise in the proportion of persons aged 60 and over in 1881 which is contrary to the accepted effect of famine on age distributions. The crude figures suggested that this age group must have been badly under-enumerated in 1872).
The much more serious famine of 1899 affected principally in the classic style the age group 1-10 and persons over 60. The reason why the 10-15 age group alone in 1901 increased by comparison with the previous decade was that the absolute number belonging to the age group 1-10 in 1891 was higher than at any previous census or any subsequent census until 1931. Moreover the 10-15 age group in 1891 was already depleted by the famine of 1877, so that an increase in the same age group
at the next decade became more probable. The effect of the famine _, of 1899 was again visible in 1911 in the fall in the 10-15 age group.
The effects of the influenza epidemic of 1918-19 can be observed in the age returns at the 1921 census. There was a fall in the proportion of children aged 1-10 in 1921 by comparison with the previous decade, whjle the combined effect of the famine of 1899 and the influenza epidemic are clearly visible in the fall in the proportion belonging to the age group 15-40. The effects of the famine of 1877 had presumably worked themselves out by 1921, though it is possible that it may have been a factor serving with influenza mortality to reduce the proportion in the age group 40-60 in 1921.
After 1921 the population history of the State is one of rapid and accelerating growth affecting all ages. It is difficult to account for the fall in the percentage of persons aged 60 and over in 1931, but apart from this solitary instance, every single age group recorded increases in population at successive censuses after 1921.
Apart from vagaries in age reporting and the effect of famine and epidemic on particular age groups the age structure of the population has remained remarkably constant throughout the half century under review. This is also evidenced by the fact that the median age15
has varied only within narrow limits. Such constancy would be expected in a "stable" population i.e. a .. population growing at a constant rate with its age specific mortality rates remammg constant. A constant or unchanging age structure is characteristic of all such stable populations. In actual fact the rate of growth of the population of Bombay State has been more rapid over the past three decades than it had been during the early decades of the 20th century. Such an acceleration of growth would normally have increased the proportion of young persons in the population, but this effect has apparently been balanced by a greater longevity of the people.
Biases in age reporting It was suggested in past census reports that
an enquiry might be made to determine biases in age reporting. The suggestion was made on the assumption that the same general constant errors in the reporting of age perSisted
15 The median age in Bombay State was 20·9 in 1951, 21·3 in 1941, 20'8 in 1931, 22·4 in 1921, 22·4 in 1911 and 21'8 in 1901.

FAMILIES, SEXES AND PRINCIPAL AGE GROUPS 121
from decade to decade. However, as we have already seen, "the bulge in the 25-34 age group has been corrected at the past three censuses. An interesting, if inconclusive, survey of the census returns of age from the village of Miri in Ahmednagar district in Bombay was carried out after the census of 1931 by the Provincial Superintendent of Census Operations. He found that ages in the census returns were wrongly stated in one case in five and that, contrary to general belief, the number of understatements of age greatly exceeded the number of overstatements of age. Unfortunately no attempt was made to assign the errors to particular age groups or determine the cause of the misstatement.
A somewhat similar experiment was attempted in Bombay City after the 1951 census. Age data were provided by the declarations of age on applications for ration cards, which exhibited the same feature of rounded ages as the census age returns. Rationing inspectors endeavoured to ascertain the true ages by reference to birth certificates or other documentary evidence or, in default, by oral enquiries. Unfortunately it was not possible to supervise the experiment. The conclusion drawn from the survey, for what it is worth, was that understatements of age were twice as numerous as overstatements. Apart from minor errors caused by the preference for even numbers as against odd in reporting ages, grosser errors of 35 being returned as 25, 50 as 35 and 60 as 50 were discovered. To what extent this latter type of error was due to ignorance and to what extent to deliberate understatement, a desire to cling to the prime of life in a city· where the labour market is competitive and the urban artifices of hair dyeing are not unknown, could not be ascertained.
Possibly in the matter of age returns there are several unconscious biases at work at different ages. In addition to a presumed omission of infants and small children aged 1-4 from the census count, it woul~ appear as though some children returned as aged 5-9 at the census really belonged to the 1-4 age group. There also appears to be a tendency to deplete the age group 15-19. The great attraction exercised by the numbers 10, 12 (always a favourite number) and 14 possibly led to a certain number of those who were in reality 15 or over being returned as belonging to the 10-14 age group. T'nese speculations are based on the fact that the age groups 0-4, 5-9, and 10-14 did not taper off appreciably at higher ages,
A (Bk) H 91-16
a result which is against all probability. The large number of persons, particularly females, returned as aged 20 suggests that a certain number of persons who in reality belonged to the age group 15-19 were returned as older than they actually were.
In middle life the biases are difficult to determine. The bulge at age 25-34 which existed for five censuses from 1881 to 1921 was probably due to persons who belonged to the age group 15-~4 returning themselves as older than they actually were, and possibly some who were older returned themselves as 25 or 30, but this bias has not been a feature of the census returns of age/in Bombay after 1921.
There is also possibly a tendency for those who are ageing to cling statistically to the prime of life, hcnce the instances of persons aged 60 returning themselves as 50. Once however, old age is reached there is a natural tendency to exaggerate age. The interesting point is, however, that even if four-year age groups are reconstructed from the single year age returns there is an observable tapering off at higher ages in 1951, indicating a definite improvement in the age returns.
In analysing the age returns we cannot make allowance for biases in age reporting; for the simple reason that the exact nature and extent of the biases cannot be determined. Even an actuarial calculation of age distribution represents ideal conditions that never do arise though they are theoretically correct. In the commentary which follows on age distributions the actual age group figures returned at the census in Bombay State form the basis for the analysis. The age groups selected are so wide that errors due to age reporting must have been to a large extent eliminated.
Age distributions
The distribution of the population between three main age groups-under 15, 15 to 64 and 65 years of age and over varies widely' in different parts of the world. The age pyramid in Bombay and in India generally has a very broad base and a qUickly attenuated top. Th~ existence Of veq' large numbers in the lowest age groups and very small numbers in the highest age groups is a result of high mortality and high fertility. In countries with a low fertility and mortality the age pyramid rests on a much narrower base. In the table which follows the percentage of the population belonging to four age groups in three areas of the
. world has been shown:-

122 FAMILIES, SEXES AND PRINCIPAL AGE GROUPS
Age Group.
Under 15 15-44 45-64
65 and over
Bombay State (1951
census; 10 per cent
samp'le).
39·3 45·8 IN 2·5
Japan Great (1947 Britain census; (1951
10 per cent census: sample). 1 per cent·
sample).
35·4 22:5 44·7 42·7 15·0 24·0 4·9 10·8
Bombay State and Great Britain represent two entirely opposite types of age structure. Japan, where the birth rate appears to have been falling since about 1923, represents an intermediate stage. The difference between the two kinds of age structure affects profoundly the kind and degree\of dependency. N otestein and his associates took the population under 15 years of age to represent dependent children, the population aged 15 to 64 to represent producers, and the population aged 65 and over to represent old age dependants. The selection of these age groups would be somewhat arbitrary in their application to Indian conditions. Children, for instance, in rural areas in India tend to play a much more active economic role than they do in the West; while 65 in India is a relatively much greater age. For the vast majority of the population economically useful activity after 55 or 60 is exceptional. Adopting, however, for the sake of argument Notestein's three age groups, and comparing the Bombay and British age structures it will be seen that in Bombay most of the dependants were children, while in Great Britain an increasing number of the dependants were old personsYI Bombay where the under 15 group is numerous, has a heavy "youth dependency," while Britain which has a high ratio of old persons to reproducers has a heavy .. old age dependency." Large proportions of children under 15 years of age, minimal percentages of aged persons, and a median age around 20 years as in Bombay are the result of continuing high birth rates.
Many experts believe the trend towards an older population which countries like Britain exhibit today to be more expensive and disadvantageous. Increasing numbers of old age dependants will as time passes have to be supported by the labours of a steadily diminishing number of persons in the working age groups. On the other hand if one believes that population should be related to available resources there are good grounds for holding
18 The percentage of the total population of Great Britain aged 65 and over rose from 7·4 in 1931 to 10·8 in 1951.
that a reduction i~ the population of Bombay as wen as Britain would be a very desirable thing. Again, while the decline in the proportion of young persons in Britain has been due primarily to a conscious limitation of numbers for several decades past and the death rate has been appreciably cut down,11 Bombay's burden of dependency is accentuated at all ages by bad health conditions associated with a fairly high mortality. The evidence suggests that the infant mortality rate and the death rate in Bombay have been falling in recent years. Even so these rates are still high. Increase in population is secured by wasteful reproductive behaviour, that is, by very high birth rates counterbalancing the relatively high death rates.
The age structure affects not only the amount of dependency, but also the future population growth. Children are born only to women and, generally speaking, to women between the ages of 15 and 45. Obviously the number of women of reproductive age is fundamental to the growth or otherwise of the population. An increase in the number of women in the reproductive age groups in Bombay State at successive censuses will, in the absence of other factors such as postponement of the age of marriage or birth control, have a great influence on population growth. The age structure in Bombay State is such that it has a potential growth far exceeding that of Western countries where fertility has shown a progressive decline. The large numbers on which the agl( pyramid rests will eventually occupy a middle position, giving birth to still greater numbers. If present trends in fertility and mortality continue a countinuing rapid growth in population seems inevitable. There is at present little evidence of any substantial decline in fertility. The general picture in Bombay since 1921 is one of increasing population growth and high fertility, unaccompanied by epidemic, famine, or deliberate restriction of numbers.
17 Since old people whatev~r their state of health are normally more liable to die than young people, it follows that the more old people there are in the population the higher will be the crude-that is, unstandardised-death rate. As a result the crude death rate for England and 'Wales, which averaged 23·3 per 1,000 per annum in 1846-50 and had fallen to 12·1 by 1921-25 was still ~1·8 in 1949. This does not indicate a slowing down of improvement in the nation's health but just the opposite. When allowance is made for ageing of the population, the death rate In 1949 is found to have fallen by almost 30 per cent, compared with 1921-25.-" Medical Significance of the Census" In British Medical Journal of April 7, 1951.

CHAPTER vn ++++++++++++++++++++++++++++++++++++++++++++++++++++++++++++++++++++++
SCHEDULED CASTES, SCHEDULED TRIBES AND OTHER BACKWARD
CLASSES ++++++++++++++++++++++++++++++++++++++++++++++++++++++++++++++++++++++
SECTION 1
PRELIMINARY REMARKS
The backward classes consist of three distinct groups-the Scheduled Castes or Harijans, the Scheduled Tribes, and the other (unscheduled) backward classes.
The Scheduled Castes comprise those formerly labelled as untouchables. The new Constitution of 1950 abolished untouchability in all its forms. The main sanction behind untouchability was religious, and hence most state governmenB passed enactments to ensure that Harijans were permitted to enter temples open to other Hindus, and to penalise discrimination against Harijans in hotels and eating houses.
The Scheduled Tribes are the Adivasis, or aboriginal inhabitants. Though no stigma of untouchability has applied to them, they were and are economically and educationally backward. The past century saw the growth of communications, the commercial exploitation of the forests, and the spread of cash crops, and the Adivasis in most areas found themselves in intimate contact with "civilisation." Their original animistic religion has through the centuries taken over so many features of Hinduism that at this census in Bombay State no persons were recorded as professing a Tribal Religion. At least in Bombay they are, and regard themselves, as Hindus.
A (Bk) H 91-1&
The unscheduled backward classes consist of those castes which, tfiOugh neither Scheduled Castes nor Scheduled Tribes, have remained economically and educationally backward. In Bombay State they are known as the " other backward classes."
Past dioisions of society
For purposes of recruitment to Government services in the past there was a three-fold division into advanced, intermediate and back~ ward classes. The purpose of this division was to ensure that the advanced classes did not obtain a monopoly of government appointments by virtue of their traditional high standards of education, and that the backward classes were encouraged by getting a fair share of appointments. Advanced class recruitment was limited by quota, and backward class recruitment up to a certain percentage was :qtade mandatory. With the coming into effect of the new Constitution the maintenance of the distinction between advanced and intermediate 'classes ceased to be vital or, indeed, legal. But special provision was made in the Constitution for the backward classes.
The consequent desirability of obtaining as full information as possible about the backward classes at the census was obvious. At the same time it was considered that to record

124 SCHEDULED CASTES, SCHEDULED TRIBES AND OTHER BACKWARD CLASSES
every person's caste on the census slip would be retrograde and give rise to misapprehensions. At past censuses information was extracted about the nUlnber of persons belonging to various castes and tribes, but the approach in 1951 was economic and not social. The answers to the census question on Special Groups were therefore recorded in such a fashion as to make it impossible for the individual caste affiliations of persons who did not belong to the backward classes to be identified. But, in the case of persons who were not obviously non-backward, the caste was recorded, and in the subsequent tabulation these replies were used to extract information about the number of persons belonging to the
Scheduled Castes, and Scheduled Tribes. There have been no material changes since 1931 in the lists of Scheduled Castes (formerly known as Depressed Classes) and Scheduled Tribes (formerly known as Aboriginal and Hill Tribes). No totals were made of the number of persons belonging to particular Scheduled Castes and Scheduled Tribes, but only of the total number of persons belonging to these two categories. In addition to the extraction of information in regard to those classified by the Government of· India as Scheduled Castes. and Scheduled Tribes, information in regard to the other unscheduled backward classes was also extracted after the census on the basis of the State Governments' existing lists.
SECTI.ON 2
THE SCHEDULED CASTES
The Scheduled Castes were numericallv much more important in Bombay State tha~ in Saurashtra or Kutch. In 1951 they constituted 8·35 per cent of the population in Bombay State, but only 2·88 per cent in Saurashtra and 1· 31 per cent in Kutch.
Past figures for Salirashtra and Kutch could not be assembled, because of extensive boundary changes and lack of data. The following table shows, however, the Scheduled Castes :figures recorded at the past three censuses in Bombay State:-
Scheduled Percentage of Decennial Castes Scheduled increase in
Census Year. population Castes in Scheduled recorded at total population. Castes the census. population.
1931 2,260,355 8'95
1941 2,558,744 8'77 +13'20
1951 3,003,024 8-35 +17-36
The districts in Bombay State with the highest proportions of Scheduled Castes in the population in 1951 were Sholapur (15·36 pel; cent), Sa tara South (12·18 per cent), Kolhapur (11'33 per cent), Satara North (11·29 per cent), Ahmednagar (11·04 per cent) and Poona (10' 35 per cent). Geographically these districts form a compact area in the Deccan Northern Division. The Scheduled Castes formed 10'69 per cent of the. _ population of the Deccan Northern Division. Outside the area of this concentration, the Scheduled Castes were
fairly evenly distributed in Bombay State. They formed 7·40 per ccnt of the population in Greater Bombay, 1·42 per cent in Gujarat, 7·35 per cent in the Decc-an Southern Division and 6· 01 per cent in the Konkan. Only in the three districts of Dangs, Thana and Panch Mahals, did the Scheduled Castes form less than 5 per cent of the population. In these three districts the percentage of Scheduled Tribes was very heavy.
Rural-Urban distribution 73·5 per cent of the Scheduled Castes in
Bombay, Saurashtra and Kutch lived in rural areas, and 26·5 per cent in urban areas. They were thus slightly less urbanised than the general population. In Ahmedabad and Poona districts 57· 5 and 44·9 per cent of the Scheduled Castes population lived in urban areas, proportions which approximated very closely to those of the general population. In the Konkan districts of Kolaba, Ratnagiri and Kanara the Scheduled Castes were only about half as urbanised as the general population.
Livelihood class distribution of Scheduled Castes
Although the Scheduled Castes were less urbanised than the general population, the proportion of the Scheduled Castes who belonged to the non-agricultural classes was greater than among the general population. 45· 58 per cent of the Scheduled Castes in Bombay, Saurashtra and Kutch belonged to the non-agricultural classes, as against 40·32 per cent in the general population. In Saurashtra and Kutch more than

SCHEDULED CASTES, SCHEDULED TRIBES AND OTHER BACKWARD CLASSES 125
two-thirds of the S~heduled Castes belonged to the non-agricultural.,classes.
Many of the Scheduled Gastes in the agricultural classes in Bombay, Saurashtra and Kutch were cultivating labourers. Only 26 per cent of the Scheduled Castes were cultivating owners (livelihood class I), while as many as 19 per cent were agricultural labourers (livelihood class III). In Baroda, Broach, West Khandesh, East Khandesh, Sholapur, Belgaum, Bijapur and Dharwar districts more than 30 per cent of the Scheduled Castes were cultivating labourers. The high proportion of agricultural labourers and the low proportion of owner-cultivators were characteristic of the Scheduled Castes. The proportion of the Scheduled
Castes who were tenants was much the same as in the general population.
Almost half the Scheduled Castes belonged to the non-agricultural classes. Many of the traditional Scheduled Castes skills, such as tanning and shoe-making, are non-agricultural, as are many other of their traditional occupations such as village servants and, in towns, sweepers. Production other than cultivation accounted for 21· 1 per cent of the Scheduled Castes and Other services and miscellaneous sources for 19·8 per cent. The precise occupations were not tabulated, hence it is not known to what extent there has been a shift from traditional occupations to newer ones. The proportion of Scheduled Castes in Commerce was very small.
SECTION 3
THE SCHEDULED TRmES
The Scheduled Tribes were of importance only in Bombay State where they comprised 9·34 per cent of the population in 1951. In Kutch 3 per cent of the popul~tion were Scheduled Tribes. In Saurashtra, though 0·94 per cent of the population were classified as Scheduled Tribes in accordance with the Constitution (Scheduled Tribes) Order, 1950, issued by the President, the> Government of Saurashtra considers that the six castes specified in that Order were in reality - backward communities, but not Scheduled Tribes.
Past figures of Schedule'd Tribes for the area that now comprises Bombay State were assembled, and are exhibited below :-
Scheduled Tribes in Bombay State
Scheduled Percentage of Decennial Census Year. Tribes popula- Scheduled increase.
tion recorded Tribes in at the census. total population.
1931 2,305,728 9'13 1941 2,645,594 9'07 + 14'74 1951 3,359,305 9'34 +26'98
The steep increase during 1941-51 requires comment. Vagaries in the recording or subsequent classification of persons as Scheduled Tribes seem primarily responsible, but the fact that districts like Panch Mahals and West Khandesh, which contain large numbers of Scheduled Tribes, recorded above-average increases in population from one census to
another over the past fifty years suggests that the Scheduled Tribes may have a higher fertility than the general population. Immigration would not explain the con~istently large increases. A part of the increase may also be due to a steadily improving standard of enumeration in the remoter forest areas at successive censuses.
Unlike the Scheduled Castes who formed a fairly constant element in the population of rhost districts, the Scheduled Tribes were concentrated in ten districts in Bombay State. In Dangs L'1e Scheduled Tribes formed 84·35 per . cent of the population, in Surat 46·74 per cent, in Panch Mahals 40·97 per cent, in West Khandesh 39·42 per cent, in Broach 37·28 per cent, in Thana 21· 91 per cent, in Baroda 17·48 per cent, in Nasik 16·83 per cent, in Sabarkantha 10·44 per cent and in Kolaba 10·18 per cent. The biggest concentration of Scheduled Tribes was in Gujarat. In eleven out of the twentyeight districts in Bombay State they formed less than one per cent of the population.
Rural-Urban distribution
The great majority of the Scheduled Tribes in Bombay, Saurashtra and Kutch Jived in rural areas. Only 6·51 per cent of them lived in urban areas, and the remaining 93·49 per cent in . rural areas. The percentage that lived in urban areas was high ·only in those districts like Ahmedabad where they formed' a tiny fraction of the total population.

126 SCHEDULED CASTES, SCHEDULED TRIBES AND OTHER BACKWARD CLASSES
Livelihood class distribution of Scheduled Tribes
The Scheduled Tribes were not only primarily rural dwellers; they were also primarily agriculturists. The great majority-83·71 per centof the Scheduled Tribes belonged to the agri-
, cultural classes, and only 16·29 per cent to the non-agricultural classes.
In the Deccan Northern Division 89·09 per cent of the Scheduled Tribes were agriculturists; in Gujarat 84·71 per cent. In the general population too a higher proportion of the population were agriculturists in the Deccan Northern Division as compared with Gujarat.
46·0 per cent of the Scheduled Tribes depended for a livelihood on the cultivation ·9f their own land. The proportion of ownercultivators was high in Panch Mahals, Dangs, and Sabarkantha districts. Elsewhere a considerable number of Scheduled Tribes were tenants or cultivating labourers. In Thana district 49·27 per cent of the Scheduled Tribes were tenants (livelihood class II), in Kolaba
33· 61 per cent, and in Suiat 19· 35 per cent. Slightly over a fifth of the Scheduled Tribes population were dependent on agricultural ·labour. In Baroda 31·30 per cent were cultivating labourers, in Broach 30· 87 per cent, in Surat 23·79 per cent, in West Khandesh 28·50 per cent and in Nasik 30·98 per cent. These proportions are all the more impressive when one remembers that the Scheduled Tribes formed sizable proportions of the population of all these districts. They were not freak cases of small numbers exaggerating the proportions.
Only 16·29 per cent of the Scheduled Tribes belonged to the non-agricultural classes. More than half (9·76 per cent) belonged to livelihood class VIII (Other services and miscellaneous sources). 4·67 per cent were in Production other than cultivation (livelihood class V). 'Less than 1· 0 per cent were in Commerce or Transport. The particular occupations in which the self-supporting persons engaged were not tabulated.
SECTION 4
OTHER (UNSCHEDULED) BACKWARD CLASSES
In addition to the Scheduled Castes and Scheduled Tribes there are other communities which the State Governments have classified as backward. The Backward Classes of a State consisted of the Scheduled Castes, Scheduled Tribes, and the other (unscheduled) backward classes. 12·49 per cent of the population of Bombay State belonged to this latter category, the heaviest percentages being found in Sabarkantha (37·73 per cent), Banaskantha (33·67 per cent), Baroda (27·79 per cent) and Panch Mahals (25·36 per cent). In the six districts of Dangs, Panch Mahals, Surat, Broach, Baroda and West Khandesh more than half the population belonged to the backward classes. In Saurashtra as much as 38· 14 per cent of the total population were classified as unscheduled backward classes. In Kutch only 0·22 per cent.
More than three-quarters of the unscheduled backward classes in Saurashtra as well as in Bombay State lived. in rural areas. In Bombay State the proportion was 83·33 per cent; in Saurashtra 77·26 per cent. Whereas, however, only 30·16 per cent of the unscheduled backward classes belonged to the non-agricultural classes in Bombay State, the proportion was as high as 54 ·19 "per cent in Saurashtra.
CONCLUSION
In the table which follows the livelihood pattern of the Scheduled Castes, Scheduled Tribes and the other (unscheduled) backward classes has been compared. The livelihood pattern of the general population has been shown for comparison.
Distribution of the General, Scheduled Castes, Scheduled Tribes and other (unscheduled) backward classes population among the eight main livelihood classes in
Bombay, Saurashtra and Kutch (The figures shown are percentages)
Livelihood Livelihood Livelihood Livelihood Livelihood Livelihood Livelihood Livelihood Class I. Class II. Class Ill. Class IV. Class V. Class VI. Class VII. CIa •• VIII.
General Population 39·75 9'56 8'42 1'95 14'27 7'98 2'27 15'80 Scheduled Castes 25'56 8'62 19'21 1·03 21'14 2'00 2'68 19'76 Scheduled T ribet 45'99 16'31 21'14 0'27 4'67 0'98 0·88 9'76 Other (unscheduled) back- 39'22 13'17 10·21 0'97 15·32 4'05 2'06 15'00
ward dauca

SCHEDULED CASTES, SCHEDULED TRIBES AND OTHER BACKWARD CLASSES 127
The most impodant features brought out by the table are the hf';tvy agricultural bias among the Scheduled Tribes, the high proportion of tenant qultivators (livelihood class II) among the Scheduled Tribes, and the high proportion of Scheduled Castes and Scheduled Tribes who were cultivating labourers Qivelihood class III). The low proportion of the backward cllWses i~ Commerce is also noteworthy.
Backward class literacy
The backward classes were less literate than other sections of society. Only 10·67 per cent of the backward classes in Bombay State were literate, while almost a quarter of the general population were literate. Backward class literacy has been dealt with as a separate topic in the chapter on literacy.


CHAPTER Vln
+++~++++++++++++++++++++++++++++++++++++++++++++~++++++++++++++++++++++
DISPLACED PERSONS ++++++++++++++++++++++++++++++++++++++++++++++++++++++++++++~+++++++++
At the census of 1951 one of the questions was for displaced persons. Displaced persons were asked to state the date of their arrival in India and district of origin in Pakistan. The definition of a displaced person was as follows :-
" 'Displaced Person' means any person who has entered India having left or been compelled to leave his home in Western Pakistan on or after 15th March 1947, or his home in Eastern Pakistan on or after 15th October 1946, on account of civil disturbances or the fear of such disturbances or on account of the setting up of the two dominions of India and Pakistan." At the sorting alid tabulation which followed
the census enumeration the slips of displaced persons were separated from other slips. The object was to obtain the fullest possible information about displaced persons, whose rehabilitation had been one of the major problems confronting Government since August 1947. An additional reason was that, in areas where displaced persons were especially numerous, failure to separate the slips of displaced persons might have distorted the picture presented by the census in regard to the general population.
409,882 displaced persons from Pakistan were enumerated at the census in the three States of Bombay, Saurashtra and Kutch, as shown in the table below:-
Displaced Population in Bombay, Saurashtra and Kutch
State of enumeration. Persons. Males. Females.
Bombay 338,096 179.770 158,326 Saurashtra 59.787 31,302 28,485 Kutch 11.999 6.432 5.567
A (Bk) H 91-17
In Bombay State displaced persons constituted 0·94 per cent of the total population enumerated at the census; in Saurashtra they constituted 1· 45 per cent and in Kutch 2 . 11 per cent.
The great majority of displaced persons in Bombay, Saurashtra and Kutch came from Sind, and the migration was a mass migration involving whole families. For that reason the ratio of females to males in the displaced population was fairly high, while in normal long distance migration males tend greatly to outnumber females. In the table below the sex ratio of the displaced population has been shown with, for comparison, the sex ratio of the general population ( excluding displaced persons).
Females per 1,000 males among Displaced Population as compared with General
Population
State. Displaced General Population. Population.
Bombay. Saurashtra and Kutch Total 884 938
Rural 853 987 Urban 889 837
Bombay State Total 881 932 Rural 859 988 Urban 884 816
Saurashtra State Total 910 976 Rural 617 964 Urban' 928 1.002
Kutch State Total 866 1.084 Rural 958 1.087 Urban 791 1,076
In the north generally in undivided India males greatly outnumbered females, and Sind was no exception to this rule. It was a feature that was shared by both Hindus and Muslims,

130 DISPLACED PERSONS
though the Muslim sex ratio was even more masculine than the Hindu as the following table shows :-
Census of 1931 1941
Females per 1,000 males in Sind
Hindus.
792 825
Muslims.
781 819
Shortage of females characterised both communities in Sind in 1931, though the sex ratio showed some improvement in 1941. Among the displaced persons in Bombay, Saurashtra and Kutch the sex ratio showed a very considerable improvement over the sex ratio among Hindus in Sind in 1931 and 1941. The available data do not adequately explain the phenomenon. The sex ratio' among displaced persons in Bombay and Saur~shtra was less masculine in the urban areas than in the rural, a reversal of the usual trend. The displaced immigrant was normally a towndweller.
Districts of origin of displaced persons
Displaced persons were asked to specify their district of origin and date of arrival in India. Only 1· 24 per cent of the displaced population in Bombay, Saurashtra and Kutch failed to specify their district of origin, and only in Kutch did omissions occur on any scale.
The overwhelming majority of displaced persons in Bombay, Saurashtra and Kutch came from West Pakistan. East Pakistan accounted for only 2,340 persons or 0·57 per cent of the displaced population who supplied information about their district of origin.
In Bombay, Saurashtra and Kutch 337,585 persons or 82·36 per cent of the displaced population came from Sind. Khairpur State, which for practical purposes may be regarded as going with Sind, accounted for 23,626 persons, or 5 -76 per cent of the displaced population. 32,162 persons, or 7-85 per cent of the displaced population, came from the West Punjab_ This latter group was of numerical importance only in Bombay State, where 31,691 displaced persons of West Punjab origin were enumerated. In Saurashtra and Kutch they formed less than one per cent of the displaced population. Sind, West Punjab, and Khairpur State thus accounted for an overwhelming majority of the displaced population, as the following table shows :-
Percentage of the displaced population who came from West Pun;hb, Sind and
Khairpur State
State of enumeration.
State of origin. Bombay. Saurashtra Bombay. Saurashtra. Kutch.
West Punjab Sind Khairpur State
Total
and Kutch.
7'85 82'36 5-76
95'97
9-37 82'01 4'39
95-77
0'65 83'80 14'62
99'07
0'68 85-14 0'35
86'17
The comparatively low percentage in Kutch was due to the fact that 13-52 per cent of the displaced population there failed to specify their district of origin. It is probable that the majority of this unspecified group came from Sind or Khairpur.
In Bombay State, out of the 31,691 displaced persons of West Punjab origin 10,052' came from Lahore district and 4,856 from Rawalpindi. Out of the 277,267 displaced persons who came to Bombay State from Sind 106,955 were from Karachi district, 58,073 from Sukkur, and 33,369 from Larkana. More than half the displaced population in Saurashtra and Kutch came from Karachi district. -
Influx of displaced persons from Pakistan The main influx of displaced persons started
immediately after partition in August 1947 and was compressed into the last months of 1947 and the year 1948. There appears to have been a small movement of population, mainly in March 1947, prior to partition, but the main movement took place in the period of 9 months from August 1947 ,as the following table shows :-Percentage of the displaced population (407,542
persons) from West Pakistan in Bombay, Saurashtra and Kutch, classified
according to stated month of arrival in India
Bombay. Saurashtra. Kutch.
Before August, 1947 9' 3 August, 1947 6'1 September. 1947 8'8 October, 1947 9'3 November, 1947 6'4 December. 1947 5'4 January, 1948 11-6 February, 1948 8'9 March, 1948 8'3 April, 1948 5-3 Remaining months of 1948 16-3 1949,1950 and 1951 ... 4-3 Percentage of total displaced
population who arrived during 9 months from August, 1947 to April, 1948 70-1 82'9 65-8

DISPLACED PERSONS 131
~ Figures of the arrival of displaced persons
in Bombay by the 'Sea route were available for most months. These figures differed from the picture presente~ by the census mainly in respect of the months of September, October and November, 1948, 51,484 displaced persons arrived in Bombay by the sea route from Sind in these months, but only 20,662 displaced persons in Bombay State returned these months at the census as the date of their arrival. The explanation may lie in faulty memory working or in subsequent dispersal to other states of those who arrived in Bombay at the end of 1948.
Distribution of displaced persons among districts of Bombay, Saurashtra
and Kutch
The largest single aggregation of displaced persons in Bombay State was found in Thana district. A new displaced persons' township called Ulhasnagar has been established there on the site of the former Kalyan transit camp, about 40 miles from Bombay. Many displaced persons travel daily by train from there to work in Greater Bombay. Greater Bombay recorded a displaced population of 83,964 persons, or 2·9 per cent of the city's population. Probably half the displaced persons in -:Bombay State depend directly or indirectly on Greater Bombay for employment, since the displaced population of Greater Bombay and the adjacent district of Thana combined numbered .181,111, or 55·3 per cent of the displaced population in Bombay State.
84,891 displaced pe~sons were enumerated in the ten districts of Gujarat. 41,675 were in Ahmedabad district, 14,476 in Baroda, 7,471 in Mehsana, 6,607 in Surat, 4,178 in Panch Mahals and 5,758 in Banaskantha. The displaced population in fhe remaining four Gujarat districts of Kaira, Sabarkantha, Broach and Amreli combined was less than 5,000.
62,623 displaced persons were enumerated in the ten districts of the Deccan Northern Division. The largest number was found in Poona district with 25,425 displaced persons, followed by Nasik with 9,869, East Khandesh with 7,875, West Khandesh with 6,853, Kolhapur with 5,050 and Ahmednagar with 5,508. In the remaining four districts of .Sholapur, Satara North, Satara South and Dangs the number of displaced persons was small.
The three districts of Belgaum, Bijapur, and Dharwar, which together constituted the
A (Bk) H 91-170
Deccan Southern Division had only 625 displaced persons, while the Konkan Division ( excluding Thana) accounted for only 2,846 persons, of whom 2,274 were ill Ratnagiri.
There were 59,787 displaced persons in Saurashtra. 26,492 were in Sorath district, 14,859 in Madhya Saurashtra, 8,186 in Gohilwad, 7,916 in Halar, and 2,334 in Zalawad.
The State of Kutch, in which 11,999 displaced persons were found, consisted of only one district.
Rural-Urban distribution of displaced population
The great majority of displaced persons were in urban as distinct from rural areas. In the table below the proportion of the displaced population found in rural and urban areas has been shown. Figures for the general popUlation have been shown for comparison.
Total number of
State and displaced Natural Division. persons
Percentage who were enumerated in
Rural areas. Urban areas.
Dis- General Dis- General placed popula-
enumerated. popula- tion. placed popula-
popula- tion.
Bombay State 338,096
Greater Bombay .. 83,964
Gujarat 84,891
Deccan Northern ... 62,623
Deccan Southern ... 625
Konkan* 105,993
Saurashtra State 59,787
Kutch State 11,999
Total for 3 States ... 409,882
tion. tion.
12'0 68'9 88'0 31'1
100'0 100'0
19'0 74'4 81'0 25'6
32'4 73'5 67'6 26'5
5'4 73'8 94'6 26'2
3'7 80'6 96'3 19'4
5'0 66'3 95'0 33'7
47'0 80'0 53'0 20'0
12'0 68'8 88'0 31'2
*Principally Thana district where 103,147 displaced persons were enumerated, of whom 80,861 were in the new Ulhasnagar township (formerly Kalyan Camp).
The reason for the overwhelmingly urban character of the displaced population lay in the fact that even in Pakistan the great majority of the displaced persons were not agriculturists. Apart from the existing scarcity of land in Bombay State, rehabilitation in agriculture would not have heen congenial to the majority of displaced· persons. The only

1S2 DISPLACED PERSONS
districts in which more than half the displaced population of the district were found in rural areas at the census in Bombay State were Sabarkantha, Mehsana, Surat, West Khandesh, Dangs, Kolhapur, Ratnagiri and Kanam. The displaced persons in Saurashtra were overwhelmingly urban. In Kutch 5,635 displaced persons out of 11,999 were enumerated in rural areas. The percentage of the general population in Kutch who were urban was small. Residence in a rural area at the time of the 'census did not necessarily mean that the displaced persons were engaged in agriculture. In fact only 15·6 per cent of the displaced population in rural areas of B0Il!:bay, Saurashtra and Kutch at the census belonged to the agricultural classes.
Livelihood class distribution
At the census of 1951 the main emphasis was on the extraction of economic data. In the table below the percentage of the displaced population who belonged to the agricultural classes has been shown.
Percentage of the displaced population in Bombay, Saurashtra and Kutch who
were returned as principally dependent on agriculture
Agricultural Classes.
State Rnd Class I Class II Class III Class IV Total Natural Division. (Owner (Tenant (Agri- (Land- for the
culti- culti- cultural 10rds). agri-
Bombay State
Greater Bombay
Guiarat
Deccan Northern
Deccan Southern
Konhn
Saurashtra State
Kutch State
Total for 3 States of Bombay. Saurashtra
vators}. vators}.labourers}. cultural classes.
1'32 0'40 0']3 0'10 1'95
0'03 0'01 0'12 0'16
4'27 1'17 0'34 0'09 5'87
0'46 0'03 0'14 0'09 0'72
2'08 0'16 2'24
0'47 0'32 0'07 0'11 0'97
1'32 0'14 0'18 0'14 1'78
6'87 4'67 2'29 0'55 14'38
and Kutch 1'48 0'49 0'20 0'12 2'29
Only in Kutch and Gujarat was the percentage of displaced persons in agriculture other than tiny. In Bombay State, for instance, only 1· 95 per cent of the displaced persons were principally dependent on agriculture. In the general population the proportion was
61·46 per cent. The oveAvhelming majority of displaced persons belonged to the non-agricultural classes, as shown below:-
Percentage of the displaced population in Bombay, Saurashtra and Kutch who
were returned as principally dependrmt on non-agricul-
State and Natural Division.
Bombay State
Greater Bombay
Gujarat
tural means of livelihood
Non-Agricultural Classes.
Class V Class VI Class VII Class Vlll Total (Pro- (Com- (T rans- (Other> for non-
duction merce). port). services agri-other and cultural than miscell- classes.
cultiva- aneous tion}. sources}.
... 12'98 40'13 4'09 40'85 98'05
... ]3'66 :43'82 7'34 35'02 99'84
... 15'29 42'52 3'90 32'42 94'13
Deccan Northern ... 9'70 46'97 1'84 40'77 99'28
Deccan Southern ... 11'52
Konkan '" 12'54
Saurashtra State ... 14'53
Kutch State ... 22'50
Total for 3 States of Bombay, Saurashtra
28'48
31'33
50'89
12'85
3'84 53'92 97'76
3"00 52'16 99'03
2'41 30'39 98'22
3'08 47'19 85'62
and Kutch ... ]3'48 40'90 3'82 39'51 97'71
The proportion of the displaced population who depended on Commerce was very high. In the general population only 8·0 per cent belonged to class VI (Commerce), while among the displaced population the proportion was 40· 9 per cent. Other services and miscellaneous sources was the other livelihood class of great importance all!ong displaced persons.
Dependency status of displaced persons
In addition to assigning the population to eight main livelihood classes, the relative proportions within these classes of self-supporting, earning dependent, and non-earning dependent persons was also measured. The meaning of these terms has already been explained.
The basis of enquiry was the individual and his present standard of living. In the ~able which follows the percentage of the

DISPLACED PERSONS 133 ')
displaced population belonging to various livelihood clas~ses in the three States of Bombay, Saurashtra and Kutch who were returned as self-supporting persons, non-earning dependants and earning dependants has been shown.
Dependency pattern of Displaced Population
Percentage of displaced population who were returned as
Liv.elihood Class. Self- Non- Earning
supporting earning dependants. persons. dependants. 234
Bomhay State Agricultural Classes I-IV 26'72 53'42 1lJ'B6
V-Production other than cultivation 30'64 65'72 3'64
VI-Commerce 26'10 71'03 2'B7 VI I-Transport 30'63 67'03 2'34
VIII-Other services and miscellaneous sources 24'69 73'05 2'26
Total for non-agricultural classes V -VIII .. , 26'30 71'00 2'70
Saurashtra State Agricultural Classes I-IV 28'87 61'01 10'12
V-Production other than cultivation 25'25 68'JO 6'65
VI-Commerce 25'78 69'34 4'88 VII-Transport 24'20 72'46 3'34
VIII-Other servIces and miscellaneous sources 20'65 74'92 4'43
Total for non-agricultural classes V-VIII 24'08 70'96 4'96
KulchSlale Agricultural Classes I-IV 31'77 41'10 27'13
V-Production other than cultivation 31'44 60'67 7'B9
VI-Commerce 26'65 68'94 4'41 VII-Transport 34'87 63'78 1'35
VIII-Other services, and miscellaneous sources 32'76 56'02 11'22
Total for non-agricultural classes V-VIIl .. , 31'57 59'46 8'97
The small proportion of the displaced population who belonged to the agricultural classes had a dependency pattern which resembled that of the general agricultural population. Most of the displaced population, however, belonged to the non-agricultural classes, and they had a smaller percentage of self-supporting persons, a higher percentage of non-earning dependants, and a smaller percentage of earning dependants than the general non-agricultural population. This suggests that at the time of the census the rehabilitation of displaced persons was not yet complete. The excess load of non-earning dependency must be shed before the rehabilitation of displaced persons can be considered complete. The burden of non-earning dependency was
noticeably lighter among displaced persons residing in the rural areas. Probably the majority of displaced persons in the rural areas had been rehabilitated.
Self-supporting displaced persons in the non-agricultural classeS
Self-supporting persons were classified after the census according to occupational divisions and sub-divisions. 3,674 self-supporting displaced persons in Bombay, Saurashtra and Kutch depended on non-productive means of livelihood, but very few were beggars and vagrants. 100,900 of the displaced population were self-supporting persons engaged in productive industries and services. In the table below the means of livelihood of the selfsupporting displaced population have been shown by divisions and sub-diyisions of Industries and Services. The percentage that each, division and sub-division constituted of the total self-supporting displaced population has also been shown.
Displaced Population in Bombay, Saurashtra and Kutch shown by Divisions and
Sub-Divisions of Industries and Services
Division G-Primary Industries not elsewhere specified
Sub-Division 0 'I-Stock Raising O'4-Forestryand collection of
products not elsewhere specified
Division I-Mining and Quarrying Sub-Division I' 5-Stone-quarrying, d~;
and sand pits 1'7-Salt, saltpetre and saline
substances Division 2-Processing and Manufacture
F oodstuffs. Textiles, Leather and Products thereof
Sub-Division 2 'I-Grains and pulses 2' 6-Cotton textiles 2'7-Wearing apparel (except
footwear) and made up textile goods ...
2' 9-Leather, leather products and footwear ...
Division 3-Processing and ManufactureMetals. Chemicals and Products thereof .. ,
Sub-Division 3'G-Manufacture of metal i products, otherwise
unclassified ... 3' 3-Transport Equipment '" 3'5-Machinery (other than
electrical machinery) including Engineering Workshops ...
3' S-Manufacture of chemical products otherwise unclassified ...
Division 4-Processing and ManufactureNot elsewhere specified
Percentage Persons, of the
total.
468 107
274 158
60
79
8,748 1.033 1,972
1,639
1,127
3,514
-1,389 566
457
616
3,600
0'45 0'10
0'26 O'IS
0'06
0'08
8'37 0'99 "8<)
1'57
1'08
3'36
1 '33 0'54
0'44

134 DISPLACED PERSONS
Percentage Persons, of the
total.
Sub-Division 4' O-Manufacturing Industries otherwise unclassilied
4'6-Wood and wood products other than furniture and lixtures
4'9-Printing and Allied Industries
Diei.ian 5-Construction and Utilities Sub-Division 5' I -Construction and main
tenance-Buildings '" 5'5-Works and Services
Electric Power and Gas supply
S'7-Sanitary Works and Servicea-Inclu din g scavengers
Division &-Commerce
I.ISO
1.411
540 3.304
1,578
415
440 43.672
Sub-Division 6 'I-Retail trade otherwise unclassilied I I .704 .. 6' 2-Retail trade in foodstuffs (including beverages and narcotics) 13.543
6'3-Retail trade in textile and leather goods
6'S-Wholesale trade in commodities other than foodstuffs
6'S-Moneylending. banking and other financial business
11.339
3.657
1.911 Division 7-Transport. Storage and
5.701 1.819 2.124
Communications Sub-Division 7'I-Transport by Road
7' 4-Railway transport 7'6-Postal Services 7'7-Telegraph Services ,,'
443 375
Divisio; B-Health. Education and Public Administration ". 14.192
Sub-Division S' I-Medical and other Health Services '" 1.240
S'2-Educational Services and Research
6'4-Police (other than village watchmen) ,"
6'7-Employees of State
1.885
750
Governments 6. I 7S S'B-Employees of the Union
Government ... 3.647 Division 9-Services not elsewhere specilied 17,543 Sub-Division 9'O-Services otherwise un-
classilied ", 6.857 9'I-Domestic services (but
not including services rendered by members of family households to one another) 2.637
9'4-Hotels, restaurants and eating houses 3.563
1'13
1'35
0'22 3'16
1'51
0'42 41 '76
11'19
12'95
10'84
3'50
1'83
5'45 1'74 2'03 0'42 0'36
13'57
1'19
1'80
0'72
5'91
3'49 16'78
6'56
Sub-Division 9'S-Recreation services ", 9'6-Legal and business
. services 9'S-Religious, Charitable
and WelEare Services Non-productive meam 0/ /ieeiihooJ (Others) ",
(i) Persons living principally on income from non-agricultural property ...
(ii) Persons living principally on pensiolUJ. remittances. scholarships and funds
(iii) Inmates of jails. asylums, almshouses and recipients of doles
(iv) Beggars and vagrants (II) All other persons living principally
on income derived from nonagricultural activities
" Percentage Persons, of the
total,
1.170
1.358
926 3,674
1.132
1,348'
120 288
786
1'12
1'30
0'89 3'51
I'OS
1'29
0'12 0'27
There were only 44 self-supporting females per 1,000 self-supporting males among the displaced population, while in the general popUlation there were 117. A higher proportion of the displaced population were employers than in the general population, as the following table shows :-
Percentage of Employers, Employees and Independent Workers among the self
supporting population in Bombay, Saurashtra and Kutch
Indepen-Employers, Employees, dent Others,
General population
Displaced population
50'25
41'39
Workers,
42'21
46'24
Age groups of disp!flced persons
2'89
3'51
The age last birthday was ascertained at the census, and information about the age groups to which the displaced population belonged was extracted, For the non-displaced population, this information was obtained by sorting a 10 per cent sample of the slips, In the table below the percentage of the population, displaced and sample, returned as belonging to specified age groups has been shown,
Percentage of population belonging to specified age groups in Bombay, Saurashtra and Kutch
Displaced Population, Sample (Non-displac~d) Population. Av.e Group, -----------------------------
Persons. Males, Females. Persons, Males. Females.
0 0'813 0'770 0'863 3'253 3'174 3'337 1-4 5'323 5·073 5'606 lO'S49 10'396 10'713 5-14 28'047 26'903 29'339 2S'720 2S'726 25'113
IS-24 22'796 22'914 22"663 18'183 18'022 18'354 25-34 17"40S IS'30S 16'391 IS '902 16'017 15'179 35-44 II '307 II '869 10'671 II '577 11'993 11'132 45-S4 7'S39 7"68S 7'371 7"669 7'S94 7"430 5S--64 4'SI2 4'461 4'S69 4'642 4'534 057 65-74 1'606 1'47S 1'7SI I'S08 1'637 1'991 75 arid over O'SSI 0'463 0'714 0'667 0'585 0'755 Age DOt stated 0'068 0'073 0'062 0'030 0'022 0'039

DISPLACED PERSONS 135
By defiI!ition the children of displaced persons born in Ind:Jl were not displaced persons. This fact accounts for the gaps in the displaced population at age groups 0 and 1-4, and for the correspondingly higher percentages of displaced persons in the age groups 5-14, 15-24, and 25-34. The figures indicate that the migration from Pakistan had the character of a mass exodus and transplantation of population, belonging to all age groups. Only in the age group 35-44 and onwards did the percentage of displaced persons fall below that of the nondisplaced ( sample) population, suggesting that older sections of the population might not have migrated. This latter feature was, however, peculiar to Bombay State, though the
Age Group. Unmarried.
greater numbers involved, caused the feature to be reproduced in the totals for Bombay, Saurashtra and Kutch.
Civil Condition By civil condition is meant whether a person
was married, unmarried, widowed or divorced. Divorce being uncommon, widowed and divorced persons were lumped together for purposes of the census tabulation. In the table which follows the proportion of persons of each age group who were married, unmarried, widowed and divorced in the displaced population has been shown. The table can be compared with that given for the sample population in section 5 of chapter VI.
Displaced Population.
Married. Widowed and Divorced.
Total. Males. Females. Total. Males. Females. Total. Males. Females.
All Ages
o 1-4
5--14
15--24
25--34
35--44
45--54
S5-64
65--74
75 andover
Age not ltated
2 3 .. 5 6
47'95 53'14 42'08 42'16
97'30 98'72 95"82 2"61 1'25
50'21 69'73 27'91 48'73 29'62
12'47 18'56 4'78 82"46 78'07
4'23 6'40 1'49 81'53 86'43
2'64 4'10 0'92 66'92 80'25
2'55 3'26 1'78 51'90 72'07
2'34 3'77 0'98 37'25 59'27
1'85 2'98 1'02 26'15 47'92
93'93 93'75 94'17 6'25
7 8 9
45'13 8'50
4'01 0'09 0'03
70'57 1'06 0'65
88'01 5'07 3'37
75'37 14'24 7'17
51'20 30'44 15"65
29'62 45'55 24'67
16'24 60'41 36'96
10'19 72'00 49'10
1'43
10
12'79
0'17
1'52
7'21
23'14
47'88
68'60
82"78
88'79
3'33
A comparison will show that the displaced population marries later than the non-displaced population. In the age group 15-24 only 39·87 per cent of the non-displaced population were unmarried: among displaced persons the proportion was 50· 21 per cent. It is also possible that the displaced population marries less. There was a larger proportion of unmarried males at all age groups in the displaced
population than in the sample population, but this may have been due to the unfavourable sex ratio. and shortage of women.
Literacy One of the most admirable features of the
displaced population was its extremely high literacy. This difference in literacy attainment between the general population and the displaced population was particularly marked

138 DISPLACED PERSONS
in the case of females. Displaced females were more than three times as literate as females in the general population, while displaced males
were about twice as literate. In the fo1Iowing table the percentage of literacy hts been shown by natural divisions :-
Percentage of literacy of Displaced Population compared with General Population
State and Displaced Population. General Population. Natural Division.
Persons.
BOMBAY, SAURASHTRA AND Total 53 KUTCH Rural 39
Urban 55
BOMBAY STATE Total 56 Rural 41 Urban 58
Greater Bombay Total (Urban) ... 73
BomAay Gujarat Dioulon Total 43 Rural 32 Urban 46
.Bomhag Ducan Northern Division Total 57 Rural 46 Urban 62
Bombay D~ Southern Division Total 61 Rural 35 Urban 63
&tmhau Konkan Division Total 51 Rural 57 Urban 50
SAURASI-ITRA STATE Total 41 Rural 38 Urban 41
KUTCH STATE Total 36 Rural 25 Urban 46
The displaced population in its dispersal over Bombay, Saurashtra and Kutch reproduced roughly the same features in regard to literacy as the general population as though, like water, people had tended to seek their own level. The differential attainment in literacy which existed as between the three States of Bombay, Saurashtra and Kutch was also reflected by the displaced population. The proportion of the displaced persons who were literate was higher in the urban areas than in the rural, particularly (except in Saurashtra) in the case of females. Only in the Konkan was this trend towards a higher urban literacy ratio reversed in the case of the displaced population. The new Ulhasnagar township contained a quarter of the displaced persons in Bombay State, and the Konkan urban ligure was the entire. area of
Males. Females. Persons. Males. Females.
65 39 24 34 13 54 22 16 26 7 67 41 40 52 27
68 41 25 35 13 57 23 17 27 7 70 44 41 53 27
81 64 49 56 38
57 27 25 35 15 44 17 19 28 10 61 30 42 54 29
71 40 21 32 9 64 25 15 25 5 75 48 36 50 21
65 55 22 34 9 42 20 18 29 6 67 56 34 49 19
64 35 21 32 " 71 42 16 26 7 64 35 42 53 30
53 27 18 26 10 50 19 11 17 5 53 28 34 46 22
49 21 17 24 10 36 13 14 20 8 59 29 30 42 19
Bombay, Saurashtra anW Kutch in miniature so far as displaced persons' literacy was concerned. The 3,961 displaced persons who had settled in the rural areas of the Konkan had as high a literacy percentage as urban displaced dwellers elsewhere for two reasons. Firstly, many were educated Maharashtrians1
who had been displaced from Sind by partition. Secondly, the Konkan is a poor tract, and displaced persons settling down there had to be smarter to make a living. The exclusively urban area of Greater Bombay had the highest literacy percentage in the general population of 49·3 per cent. Displaced persons in Greater Bombay also returned an extremely high literacy ratio of 73·4 per cent-Sl' 2 per cent for males and 64·4 per cent for females.
1 This was indicated by the mother tongue returns of displaced persons in Ratnagiri district.

CHAPTER IX
++++++++++++++++++++++++++++++++++++++++++++++++++++++++++++++++++++++
LITERACY ++++++++++++++++++++++++++++++++++++++++++++++++++++++++++++++++++++++
Statistics of literacy which are useful for all countries are of particular interest in cases where a large proportion of the population is illiterate. The results of the decennial censuses furnish an indication of the lee-way made up in education during the decade, and few aspects of the census data are, for that reason, more eagerly examined than the literacy figures.
Census de-finition of literacy The census definition of literacy was the
ability to read and write a simple letter in any language. This is a more stringent definition of literacy than that adopted by a good many other countries which merely require that a person be able to read. The Indian Census has always used a.strict definition of literacy, as including only those persons who were able both to read and write. In 1881 and 1891 a three-fold division into literate, learning, and illiterate caused some confusion as the learning category could include both literates and illiterates. The " learning" category was dropped in 1901. In 1911 a standard of proficiency for literates was laid down, and a literate was defined as a person who could write a letter to a friend and read the answer to it. This definition of literacy has remained substantially unchanged since 1911. Within this definition runs the whole gamut from the finest intellects in the country to the artisan who can sign his name and with difficulty put large characters on a postcard.1
It has b(len suggested in the past that the statistics exaggerated the amount of literacy because school children tended to be accepted as literate when they were not; that adults were recorded as literate though they had long
1 Census of India, 1941, Tables Volume, page 31. A (Bk) H 91-18
since lost the ability to read and write and that, finally, as literacy has prestige, people claimed a non-existent literacy which the enumerator accepted without question.2 It is true that the answer to this question, as with every other, depends on the return of the citizen. Within limits the enumerator can apply some check, particularly in rural areas where he is frequently acquainted with the people he enumerates and is in many cases a schoolmaster. Moreover, since the instructions are, apart from verbal alterations, the same from 1911 to 1951 comparability of the literacy figures should be possible. In fact, so far as Bombay State is concerned, the suggestion that the census figures exaggerated the true extent of literacy is one that might have been made more appropriately in 1941 than in 1931.
There are several aspects from which the literacy data can usefully be examined. These are:
( 1) The increase in general literacy as ascertained at successive censuses.
(2) The'regional differences in the literacy pattern.
( 3) The male-female differential in literacy.
(4) The rural-urban diHerential in literacy. ( 5) The livelihood class differential in
literacy. ( 6) Literacy according to age groups. (7) The difference in literacy attainment
between the general population, and that section classified as backward.
( 8) Partial literacy. (9) Higher literacy.
( 10) The proportion of professors and teachers in the population. 2 Census of India, 1931, Bombay Report, page 288.

138 LITERACY
Analysis was hampered by the fact that full data for all past censuses were not available on all these topics. Compilation of statistics was also hampered by the extensive boundary changes that had taken place since 1947. Past data for Saurashtra and Kutch could not be assembled.
Increase in general literacy 1931 marked a watershed in the growth of
literacy in Bombay State. Up to 1931 the increase in the percentage of the total population who were recorded as literate was only about 1 or 2 per cent every decade. Between 1931 and 1941, however, the percentage of the population who were returned as literate at the census almost doubled. In the table below the percentage of the total population of the area that now comprises Bombay State who were returned as literate at successive censuses has been shown;-
Census.
1901 1911 1921 1931 1941 1951
Bombay State Percentage of literacy in total population.
6·75 7·13 8·93 9·87
18·28 24·56
In an interesting paper3 on the 1941 literacy statistics of the Province of Bombay R. V. Parulekar pointed out that the unique characteristic of the literacy figures of 1941 was the substantial addition to the number of adult literates aged 20 and over by comparison with previous censuses. Even after making allowances for the acquisition of literacy during the decade by those who belonged to the 10-20 age group in 1931, and for gains ascribable to adult literacy classes, he came to the conclusion that the main reason for the increase in the adult literacy fig_ures in 1941 was the unprecedented interest in literacy created among the masses by the campaigns against illiteracy. Those who in the past had attended the 2nd or 3rd year class but felt shy about claiming literacy in Bombay Province, where the previous tendency had been to count only those who had completed the 4th year class as literate, were emboldened by the literacy campaigns to claim that they were literate within the census definition in 1941. Though there is nothing in the previous census instructions to support
3 "A study of literacy statistics ( 1941 ) of the Bombay Province; co-relation of educational and census figures."
Parulekar's assertion that only those who had passed the IVth standard were ~Q be counted as literate the writer found in the course of instructional tours in 1950 that a frequent question was "Should a person ~e counted as literate if he has not passed the IVth standard? " The 'answer of course was that a person should be counted as literate if he could read and write a letter in any language. Parulekar's explanation of the steep rise in literacy in 1941 may be correct. Enumerators, many of whom were schoolmasters, may have applied their own unofficial yardstick of completion of the IVth standard as the test of literacy at previous censuses whereas, as Parulekar points out elsewhere,4 completion of the 3rd year class is generally sufficient to make a person literate within the Indian Census definition, and the whole problem of .. relapse into illiteracy" is probably overstated.
Regional differences in the literacy pattern The regional differences in the literacy pattern
were fairly marked. In Creater Bombay, an exclusively urban and hence untypical area, almost half the population were returned as literate in 1951. The effect of the higher literacy of the city areas of Ahmedabad and Poona on the literacy figures of those districts was also noticeable. Among the natural divisions of Cujarat, Deccan Northern, Deccan Southern and Konkan the natural division of Cujarat enjoyed a superiority in literacy. 25 per cent of the population of Cujarat were returned as literate, despite the fact that 45·5 per cent of the population of Cujarat belonged to the backward djilsses. Very little margin separated the literacy figures of the other natural divisions.
The district rather than the natural division is for most purposes a more reasonable unit of
4" Literacy in India" by R. V. Parulekar (published by Macmillan).
Reference to standards is confusing. Up tq 1948 the scheme of Primary Education in Bombay Province was as follows :-There was an infant class to which children were admitted at the age of 6. In villages the age was sometimes higher. Thereafter a child passed into the 1st, 2nd, Srd, and 4th standards. In 1948 the infant standard was eliminated.
Professor Gadgil's investigation of the problem of relapse into illiteracy conducted in the old Satara district of Bombay Province suggested that four years at school, passing from standard to standard, was sufficient for a child to acquire full literacy. It was not necessary that a child should pass the old Srd (present 4th) standard examination. The failure to get 3 extra marks in arithmetic would make a child a technical failure at the examination. It would not destroy the child's acquisition of permanent literacy.

LITERACY 189
area for measuring differences in literacy attainment. In the table below the percentage of the total population who were returned as literate at the past four censuses has been exhibited according to natural divisions and districts. Adjustments have been made for boundary changes, and for 1951 the proportion of literate males and females has been separately shown;-
Percentage of the total population returned as literate
Stat •• Natur.IDi.i.ion 1921 1931 1941 1951 and Di.trict. --------------
Persons. Persons. Persons. Persons. Males. Females.
Bombau Stat. 8'93 9'87 18'28 24'56 35'46 12'85
Great" Bombau ,. 23'47 23'93 38'93 49'33 55'93 38'25
Bomba~ Gujarat Division.. 11'03 12'43 19'81 25'08 34'90 14'60
Banaslamtha ,. 4'15 3'36 6'59 7'17 11'94 2'14
S.barkanth.
M.h.ana
Ahmedabad
Kaira
Panch Mohall
Barod.
Broach
Sural
Amreli
5'82 6'47 8'00 14'38 23'58 "'92
8'43 12'78 18'16 25'04 34'95 15'06
'. 13'97 12'22 24'45 32'59 43'56 19'67
.• 12'50 14'02 22'00 29'13 40'32 16'85
.• 5'40 5'69 10'03 13'41 20'03 5'95
,. 13'48 17'l5 22'12 28'62 39'02 17'23
.• 13'38 14'71 21'39 27'90 39'80 15'30
.. 13'79 14'85 22'76 29'08 39'02 19'05
.. 14'49 19'38 25'17 29'71 39"37 19'75
Bombay Deccan North"n Division 6'51 7'46 15'42 20'60 31'95 8'88
West Khande,h
East Khand •• h
DanaI
Nasik
Ahrnednagar
Poona
S_tara North
Sa .. r. South
Kolhapur
Shor.pur
'. 4'83 5'87 14'72 19'41 30'28 7'67
.. 6'91 9'16 19'18 27'92 43'56 11'82
.. 0'66 1'25 2'24 6'37 10'39 1'79
" 6'26 7'78 14'69 21'43 33'25 9'07
'. 6'40 6'01 13'21 18'82 29'42 1'90
'. 8'45 10'40 19'50 28'13 39' 81 15'69
,. > 5'41 6'40 14'59 20'59 33'50 8'30
'. 5'07 ~5'77 12'94 17'24 27'83 6'30
., S'50 6'60 12'60 12'52 20'79 3'99
•• ,'54 7'08 14'77 14'98 24'14 5'30
Bombay Deccan Southern Divi~io" • • 7' 43
Beliaulll
Bijapur
Dharwar
•• 6'27
7'59 16'05 21'86 34'19
6'.18 13'84 19'15 29'63
9'08
8'19
" 6'37 6'45 13'43 18'82 31'16 6'21
.. 9'45 10'05 20'77 27'53 41'84 12'61
BambauKon~anDit>ilion '. 5'69 7'35 15'38 21'39 31'94 11'31
Th"""
Kolab.
Ratnaairi
Kanara
Saurashtra Stat.
Halar
Madhya Saurashtra
Zalawad
Gohilwad
Sorath
.. 5'6/ ;'93 /6'1/ 25'47 35'/5 14'79
.. 5'14 6'81 13'62 19'22 29'44 9'40
.. 4'86 6'61 14'21 17'73 28'70 8'78
.. 9'63 9'75 21'19 25'32 35'96 14'32
Nolanil.ble 18' 47 26' 28 10' 46
Notawil.bl.
Nota •• il.bl.
Not availabl.
Not available
Not •• ail.ble
16'40 23'42 9'31
23'60 31'44 15'65
18'86 26'43 10'97
17'13 25'09 8'S3
15'47 23'67 7'10
Kutch Stat. Not availabl. 17'06 24'43 10'23
A (Bk) H 91-1&
Other natural divisions in Bombay State are gradually overtaking Gujarafs lead in literacy. This is scarcely remarkable since the lower the figure an area started with the easier it should be to register a large percentage increase at succeeding censuses. The literacy percentage in Gujarat has doubled since 1931 while in the Deccan and Konkan Divisions it has almost trebled.
Within Gujarat considerable territorial changes took place after 1947. The three districts of Mehsana, Baroda and Amreli were formed out of the territory of the former Baroda State. Banaskantha and Sabarkantha districts were also formed out of Indian State areas, but whereas literacy in Baroda territory was relatively high and has remained relatively high Banaskantha and Saharkantha districts have always had very low literacy percentages. It has been remarked in previous Bombay census reports that the percentage of literacy in Baroda State was not superior to that in the old districts of Kaira, Surat and Broach in Bombay Province, despite the fact that Baroda State had compulsory primary education. The Baroda State Census Commissioner5 ascribed this to the fact that there was a higher percentage of backward classes and a lower percentage of advanced classes in the population of Baroda State by comparison with Bombay Province. This topic will be discussed later when dealing with literacy among the backward classes.
The true 1931 literacy percentage of Ahmedabad, Kaira, Surat and Broach districts was probably in excess of the recorded figures. Those districts were affected by the boycott of the 1931 census operation, and literate persons probably tended to be omitted from the census count. The 1921, 1941 and 1951 figures of those districts are comparable with those of Baroda but there was a fall or a failure to rise in 1931 that seems explicable only in terms of under-enumeration in that year. The recorded rise in literacy in the former Baroda districts at successive censuses was much steadier than in otl1er districts.
The most noticeable feature of the Deccan Northern Division literacy figures is the high position opcupied by East Khandesh ( the Poona literacy figure was inflated by the inclusion of Poona City), and the low position of Kolhapur and Sholapur districts. Dangs which is a special area can be excluded from consideration. Literacy remained almost stationary in Kolhapur and Sholapur districts
• Census of India, 1941, ,Baroda Report, page 90,

140 LITERACY
during the decade 1941-51. This stagnation in the literacy percentage between 1941 and 1951 seems fictitious and not real. Enumerators in Kolhapur and Sholapur were apparently more rigorous than in most other areas in returning school children and others as partially literate rather than fully literate in 1951, leading to a retardation in the recorded progress of literacy by comparison with other districts. The figures of literacy in the age group 15 and over were also lower in these districts than in the state as a whole. The percentage of general literacy in these districts was below average, though not to the extent suggested by the figures shown in the table.
Among the districts of the Deccan Southern Division Dharwar led in literacy. It has maintained its clear lead for the past three decades.
Among the Konkan districts Kanara, which led for three decades, was overtaken in 1951 by Thana, but this was due principally to a heavy increase in immigration into Thana district during the past decade of persons with a high percentage of literacy.
Male-female differential in literacy
Roughly one male out of three and one female out of eight in Bombay State was returned as able to read and write at the 1951 census. The gap between male and female literacy was thus very striking. In the tablebelow the percentage of literacy according to sex and natural divisions has been shown :-
State and Natural Division.
Percentage returned as literate in 1951.
Persons. Males. Females.
Bombay Slate 24'56 35'46 12'85 Greater Bombay 49'33 55'93 38'25 Gujarat 25'08 34'90 14'60 Deccan Northern 20-60 31 '95 8'88 Deccan Southern 21'86 34'19 9'OB Konkan 21 '39 31 '94 II '31 Saurashtra Stale 18'47 26'28 10'46 Kutch Stale 17'06 24'43 10'23
Perhaps the most interesting feature of these figures is the very high percentage of female literacy in Greater Bombay. In no other natural division was the gap between male and female literacy so narrow. Gujarat enjoyed a clear superiority in female literacy among the remaining natural divisions. In fact the superior position in respect of general literacy held by Gujarat was largely due to the heavier percentage of females who were literate bringing up the average for the whole population. In Saurashtra and Kutch also the percentage of female literacy relative to male literacy was fairly high.
Female literacy has increased ~aster than male literacy as the following table shows :-
Bombay State
Percentage of literates. - Year.
Persons. Males. Fernales.
1921 8'9 14-9 2'5 1931 9-9 16-5 2'9 1941 18'9* 28'7 8'4 1951 24'6 35'5 12'9
'" Based on a 2 per cent sample count, hence the difference between this figure and that on page 138.
Since 1931 male literacy has slightly more than doubled while female literacy has slightly more than quadrupled. To talk in terms of quadrupling and doubling is, however, somewhat misleading. If one starts off with a very low percentage a rapid improvement is fairly easy. The gap in the elements of learning between males and females is still wide.
Rural-Urban differential in literacy One of the principal advances registered at
the census of 1951 was the exhibition of the data on a basis of rural and urban areas. This process has brought into clear relief the fundamental difference in the literacy pattern of rural and urban areas. The higher standard of literacy in cities and towns has been commented on in past census reports. The most common reason adduced was that better facilities for education were available in urban areas. Facilities are certainly an important factor. Though increasing urbanisation generally goes hand in hand with increasing literacy it must not be forgotten that the highest percentage of literacy in India is found in a predominantly rural area-TravancoreCochin.6
Since the cities in particular among urban areas owe their decennial population increases largely to immigration, a part of their gain in literacy is due to the influx of adults who have been made literate elsewhere, either in rural or smaller urban areas. On the other hand the cities and towns undoubtedly provide better facilities for the education of children. In the cities and towns, moreover, there are fewer distractions of cattle herding, crop watching, and harvesting that tend to keep children away from school in rural areas.
(I Where it was 45·8 per cent in 1951. For India as a whole the literacy percentage in 1951 was 15·8. Among the Part "A" States the percentage of literacy was 10'8 in U. P., 1l'0 in Orissa, 11·3 in Bihar, 13·3 in Madhya Pradesh, 15·2 in Punjab, 17·4 in Assam, 19·3 in Madras, 22·0 in West Bengal, and 24·1 in Bombay. These are sample figures based on the C-IV table.

LITERACY 141
Lastly, literacy treeds literacy. Literate parents would normally insist on their children being educated. An illiterate parent would be less easy to convince of the benefits ,of education. For a complex of reasons, therefore, traditional and environmental, the towns and cities are much more literate than the rural areas as the following t~b~e shows :-
Percent .. Stal. and Natural age of
Division. Iota I Percentalle of literacy.
population wholiv~d
Rural Areas, Urba.n Areas.
in urban Per- Male., Fe- Per- Male., Fe-areas. son" males. sons. males.
Bombau Stat. 31'1
Grealer Bombay .. 100'0
Gujarat 25'6
Deccan Northern 26'5
Deccan Southern 26'2
Konhn 19'4
SauraJ,lra Stat. 33'7
Kutch 5101. 20'0
17'0 26'9 6'9 41'3 52'S 27'3
19'2
14'9
17'5
16'5
10'S
13'8
2S'2
25'2
29'1
26'4
16'7
20'0
•. 49'3 55'9 3S'3
9'9 42'1 53'7 28'9
4'6 36'3 50'1 21'3
5'6 34'0 48'5 IS'9
7'3 41'9 53'1 29'6
4'6 33'6 45'6 21'7
S'I 30'1 42'0 IS'S
The towns were more literate than the villages, and the cities were more literate than other urban areas. Only 17 per cent of the people who lived in villages in Bombay State were literate while 37 per cent of those who lived in towns of up to 100,000 population were literate. In the eight cities of Bombay State, however, as much as 46 per cent of the population were literate. Similarly, in Saurashtra, in the cities 41 per cent of the population were literate, in the towns 31 per cent and in the villages 11 per cent.
Livelihood Class differential in literacy achievement
The arrangement of the 1951 census data permitted the percentage of literacy ;lmong the eight livelihood classes to be compared. Since the basic feature brought out by the figures was the same for all three states the data have been exhibited in the table below only for Bombay State.
Percentage of literacy among the eight livelihood classes in Bombay State
Persons. Males. Females, Airicultural Classes-
I Cultivators of land wholly or mainly owned;
(7'85 28'54 7'06 and their dependants '" II Cultivators of land
wholly or mainly unowned; and their dependants II '63 19'35 3'76
III Cultivating labourers; and their dependants .. , 9'56 16'14 2'89
IV Non-cultivating owners of land; agricultural rent receivers; and and their dependants 37'51 53'85 24'09
All agricultural classes 16'28 25'98 6'54
Persons. Males. Females, Non-Agricultural Clanes-
Persons, including dependants, who derived their principal means of livelihood from-V Production other than
cultivation VI Commerce
VII Transport VIII Other services and
31'49 j9'97 37'97
43'81 62'6 ( 49'16
16'37 35'06 24'(5
miscellaneous sources .. , 37'26 47'94 34'87 All non-agricultural classes .. , 37' 75 49' 40 23' 86
The disparity between male and female literacy among the agricultural classes was very wide. Literacy in the agricultural classes seems relatable to social and economic status, with class IV at the top, followed by classes I, II and III. The proportion of non-earning dependants followed an identical stratification. There is not the same economic pressure on the dependants of the comfortably-off to work and they are able to acquire literacy. Education is a factor that makes for an increase in the proportion of non-earning dependency. Among the non-agricultural classes those in class VICommerce-had a higher proportion of literates than any other livelihood class, partly because of better economic circumstances and partly because most of those who engage in it must know how to read and write.
16·3 per cent of the agricultural classes and 37, 8 per cent of the non-agricultural classes were returned as literate, percentages which corresponded very closely to the rural-urban literacy percentages as the table that follows shows. (The rural-urban figures were abstracted on the basis of a 10 per cent sample, and the livelihood class :figures on the basis of a complete count):
Bombay State Percentage of literacy.
10 percent sample count
Rural areas
Urban areas
Complete count Agricultural classes
Non-agricul-
Persons,
16'9
40'6
16'3
Males,
26'7
52'0
26'0
tural classes 37' 8 49' 4 Literacy according to age groups
Females. 6'9
26'7
6'5
23'9
At past censuses it was customary to exhibit the figures of literacy according to age groups. The range of age groups, covered was, however, not very wide until 1941 when it was greatly extended. In making comparison with previous census :figures boundary changes, changes in the age groups prescribed, and differences in the size of the count, which was a complete count until 1941, a 2 per cent sample CQunt in 1941 and a 10 per cent sample count in 1951 caused difficulties.

142 LITERACY
In order to render the data for the past four censuses comparable, recourse has been had to the rather risky course of interpolating the 1941
and 1951 figures of the rage group 15-24 in order to obtain figures for the age group 15-20, with results as shown below:-
Percentage of literacy among persons belonging to specified age groups in Bombay State
1921 1931 1941 1951 Age Group.
Persons. Males. Females. Persons. Males. Females. Persons. Males. Females. Persons. Males. Females.
0-5 5..:...10
10-15 15-20 20 and over All ages
2'6 10'6 15'4 11'4 8'9
3'8 15'7 23"9 19'7 14"9
1'4 5'2 7'6 4'5 9'8 14'5 5'7 16'1 26'1 2'5 13"0 22'1 2'5 9'9 16"5
These age groupings are unsatisfactory as they do not permit any comparison to be in~de with the behaviour of corresponding age groups at successive censuses. Thus, though the age group 15-20 corresponds to the age group 5-10 at the preceding census, the latter age group is one which is still in the process of acquiring literacy, and hence the basis for comparability does not exist. Inexactitude in age reporting is also a factor to be considered. The more illiterate the person the less accurate the age returned is likely to be.
The table which follows shows the percentage of persons belonging to a more extended series of age groups who were returned as literate in 1941 and 1951. The areas to which the 1941 and 1951 figures relate were not identical as sample tables were prepared only for the former Bombay Province and Baroda State after the 1941 census. The size of the sample also differed, being 2 per cent in 1941 and 10 per cent in 1951. Moreover in 1941 no separate classification was made for age groups of 45 and over. So far as they go, however, the figures are interesting.
Percentage of literacy according to age groups in Bombay State
1941 1951 Are Group.
Persons. Males. Females. Penons. Males. Female$.
0-4
5-9 13"3 17'9 8'5 14'S IS'4 11"1
10-14 27'5 37'4 16'4 38'8 49'9 26'6
15-24 2S'S 43'0 14'3 36'2 50'6 21'0
2;-34 23'5 36'7 9'0 ,29'8 45'1 13'1
35-44 20'4, 32'7 6'2 25'7 39'5 9'7
45-54 "I 23'0 37'0 6'8
55-64 17'8 30'S 4'4 "r 16' J. 27'4· 3'4· 65-74 ,J 17'0 31'S 4'1
75 and over J5'J 28'9 3'3
All 0li.1 .. 18'9 28'7 a 4 24'1 34'9 12'6 ·Th .. e GlUre. ore for qe 45 and oVer,
2'5 ]3'3 17'9 8'5 14'8 18'4 II" 4'4 27'S 37'4 16'4 33'S 49'9 26'6 5'S 31'0 44'5 16'7 42'2 58'7 24'3 3'1 21'4 34'1 7'5 26'2 40'2 11'0 2'9 IS'9 2S'7 S'4 24'1 34'9 12'6
The table shows that the older the individuals the greater the inequality in literacy between
men and women. It also indicates that literacy drops the higher the age group. One rather surprising feature is that the percentage who were literate in 1941 in the age group 25-34, by which time schooling .had been completed, was 23, 5, while in the corresponding age group
35-44 in 1951 25·7 were literate. There are two possible explanations, apart from those attributable to en-ors either of sampling or age reporting. The first is that the gain is attributable to adult education, and the second is that literates are to some extent selected lives, as a result of whieh the survivors of each age
group contain a larger proportion of literates.
Backward class literacy
The backward classes in Bombay State consist of the Scheduled Castes (Harijans), Scheduled Tribes, and those other communities which are classified by the State Governments as backward. The Registrar General directed that where- possible separate literacy figures for the backward classes should be extracted. This it was possible to do in Bombay State, It was not possible to extract separate figures for each of the three component groups-Scheduled Castes, Scheduled Tribes, and the other (unscheduled), backward classes-which collectively comprise the backward classes, but the percentage of literacy among the Backward Classes as a whole is shown in the following table. The percentage that the backward classes formed in the total population of the district is shown in column 2 of the table. The backward class figures by districts can be compared with the 1951 literacy figures for the general population in the table on page 139.

LITERACY 143
State, Natura j Percen'1ge Division and Dist:-ict. oi BackWard
Percent!.ge of literacy arnona' the Backward Cle!ses.
Cia" ----------popuiatilb to total population.
2
Bo",baySlal< 30'I,B'
e "at" Bombau 10' 43
Bombay Gujarat Division 45' 52
Ban .. kanth. 48'05
S.bukanlh. 56' 73
Moh,ana 15 '78
Ahmed.b.d 35' 53
Kaira 25'95
Panch Mahal. 69'85
Baroda 51'95
Broach 57'43
Surat 68'83
Amreli ,,32'54 Bombay Deccan Northern
Divi"un 25 '67
West Khandesh 50' 96
East Kh.ndesh 23' 67
D'nllI 89'18
N .. ik 38'73
Ahmednar., 27'02
Poona 20'19
Sawa North 17'51
Satar.South 16'61
Kolh.pur 13'15
Shol.pur .. 22'41 Bombay Deccan Southern
Divuion 17'59
Bolg.urn 16'08
Bijapur 19'50
Dharwar 17'60
Bombay Konkan Division 29'35
Thona 36'02
Kolaba 20'81
Ratnariri 28'86
Persons. Male •.
3 04
10'67 17'44
19'54 28'81
12'13 18'95
1'69 3'01
4'90 8'87
17'29 25'40
13'13 21'13
15'46 24'57
6'19 10'96
12'68 19'91
13'46 21'14
17'73 26'81
l5'22 21'87
9'35 16'12
7'24 12'87
13'26 23'44
4'14 7'14
6"74 II '53
9'56 16'68
14'07 21'94
14'74 26'47
8'51 14'81
4'77 8'91
7'45
8'68
7'75
6'78
12'10
7'50
7'91
8'02
5'48
13'39
15'28
12'81
12'11
20'82
13'03
12'82
13'81
10'66
Female~.
3'68
7'03
4'94
0'20
0'63
9'%
4'30
5'40
1'02
4'97
5'41
S'73
8'36
2'48
1'50
2'99
0'78
1'84
2'34
6'19
3'14
2'15
0'61
1'38
1'99
1'44
1'45
3'09
2'22
2'68
2'12
1'31
Kanar. .. 25'47 12'45 20'31 4'27
At the bottom of the list so far as general literacy was concerned stood the districts of Sabarkantha, Panch Mahals, Kolhapur, Banaskantha and Dangs, In all these districts, except Kolhapur, the backward classes comprised more than half the population, In most areas the percentage of literacy among the backward classes tended to vary directly with the percentage of literacy among the general population, In areas like Gujarat where general literacy was high backward class literacy was also high, Thus in the district of Surat the backward class literacy percentage exceeded the general literacy percentage7 of the district of Kolhapur, despite the fact that the
7 The general literacy percentage in Kolhapur was probably understated in 1951, but the conclusion about the high literacy of the Surat backward classes remains unaffected,
proportion of backward classes in Surat district was 68, 9 per cent and in Kolhapur only IS, 2 per cent, In thirteen districts in Bombay State more than ten per cent of the backward classes were literate, The majority were Gujarat districts,
Female literacy among the backward classes was very low, In the population as a whole there was approximately one literate female to every three literate males, Among the backward classes however there was approximately only one literate female to every five literate males, Backward class males were about half as literate as the general male population, but backward class females were only about one quarter as literate as the general female population, Only in Mehsana, Surat and Amreli districts was the percentage of female backward class literacy above 8 per cent. In the old Baroda State backward ~lass literacy made considerable strides, In fact past statistics of Bombay ProvinceS and the old Baroda State suggested that the ratio of literates among the classes then classified as advanced was higher in the Province ( where they were relatively more numerous) than in Baroda State, while the backward classes in Baroda State had a higher proportion of literates than the backward classes in the Province,
Partial literacy The question of standards focuses attention
on the subject of partial literacy i,e, the ability to read but not write, This was first introduced into the all-India questionnaire in 1941 on a Baroda suggestion, Information about partial literacy was extracted at the Baroda census of 1921 and was continued at succeeding censuses, The Census Commissioner of Baroda State described it as "a most useful corrective to the whole statistical material" compiled on literacy. "The existence of an intermediate class between the wholly illiterate and the literate (i.e, those who are able to read and write) helped the State authorities to gauge accurately, from decade to decade, the educational progress achieved and the success or otherwise of the experiment of compulsory education,"
It would not be possible to urge these high claims for the data on partial literacy extracted for Bombay State in 1951, although there seems to have been an improvement by comparison with 1941. In 1941 only 0, 7 per cent of the population of the former Province of Bombay
8 Census of India, 1921, Bombay Report, page 137 and Census of India, 1931, Bombay Report, pages 293-94,

144 LITERACY
were returned as partially literate; in 1951 the proportion rose to 1· 4 per cent. These percentages should be compared, however, with the figures of 4·2 per cent returned for the former Baroda State in 1931 and 5·6 per cent in 1941.
It is interesting that only five districts reported fairly high percentages of partial literacy in 1951. Those districts were Kolhapur, Kanara, Sholapur, Ratnagiri and Satara South. Though they reported the occurrence of partial literacy on a fairly extensive scale in the age group 15 and over, partial literacy was most frequent in the age group 5-15. In fact it seems indisputable that partial literacy is primarily a phenomenon of the school-going population. The acquisition by school children of the ability to read fairly fluently generally precedes .the ability to write with any confidence. Wha,t was surprising was that the occurrence of partial literacy among school children and others was extensively reported only from five districts as the table below shows :-
Percentage of partial literacy among the population belonging to various age groups _in districts from which high percentages of partwl literacy were reported (10 per cent sample figures) with, for comparison, figures for Bombay State ~e Croup. Bombay Kolhapur. Kanara. Sholapur. Ratnllgiri. Satara
State. South. 5-9 2'12 8'09 6'40 8'85 6'29 6'61
5-14 2'57 11"02 8'00 10'43 S'OI S'65
15 and over 1'23 4'90 4'56 3'34 3'03 3'23
5 and ovor 1'63 6'77 5'64 5'50 5'07 4'90
It seems unlikely that children in the districts mentioned above would acquire full literacy later than those in other areas and this, coupled with the reported occurrence of partial literacy to a greater degree than elsewhere in the age group 15 and over, provides reasonable grounds for believing that the enumerators in these districts tended to be stringent about conceding full literacy not only to those whose education was still in progress but also to others. It has already been noted that in the case of Kolhapur and Sholapur this led to a stagnation in the reported percentage of literacy as between 1941 and 1951. It would probably be justifiable in the interests of comparability of the literacy data to increase the literacy percentages of those districts to offset the more extensive returning of children in the 5-14 age group as partially literate instead of completely literate by comparison with elsewhere. Since, however, it could be argued with equal facility that the reported literacy percentages of other districts should be reduced, the figures may be allowed
to remain as they are. It has already been noted that vagaries in • the partial literacy returns appear to have done less than justice to the districts of Kolhapur and Sholapur as regards their general literacy attainment in 1951.
Higher literacy The agricultural classes, with the exception
of the small and unrepresentative livelihood class IV, had relatively few who had progressed beyond simple literacy. In Subsidiary Table 7·2 the proportion of persons with higher literacy attainments has been exhibited by livelihood classes. &
" Among the non-agricultural classes livelihood class V (Production other than cultivation) occupied a position of distinct inferiority to the other non-agricultural classes, so far as educational qualifications in excess of simple literacy were concerned. Manual dexterity and brawn rather than high educational qualifications were required of most persons who derived a livelihood from Production other than cultivation. Livelihood class VIII, relatively to the other non-agricultural classes, had a heavier proportion of degree and diploma holders, mainly because the teaching, legal, and medical professions were in this livelihood class, and arts graduates would also tend to find employment among occupations in livelihood class VIII. So far as simple literacy was concerned, however, Commerce (livelihood class VI) enjoyed unquestioned superiority.
Proportion of professors and teachers in the population
Persons engaged in Educational Services and Research have been shown according to three occupational groups in Subsidiary Table 7·3 :
( 1) Managers, clerks and servants of educational and research institutions, including libraries and museums.
( 2) Professors, lecturers, teachers and research workers other than those employed in Universities, Colleges and Research Institutions.
( 3) Professors, lecturers, teachers and research workers employed in Universities, Colleges and Research Institutions. The first category constituted the administra
tive framework of education and research. Greater Bombay outclassed every other district with Poona, the other great educational and research centre in the area, coming next.
From the point of view of literacy and education it was the second and third categories -the ordinary teachers and the University teachers-that mattered. Their distribution per

LITERACY 145
100,000 of popu:Mion has been shown in Subsidiary Table 7· 3. Bricks cannot be made without straw, or literates without teachers. The higher the proportion of teachers in the population the more literate one would expect that population to be. General literacy was higher in Bombay State than in Saurashtra, and higher in Saurashtra than in Kutch. The number of teachers per 100,000 of population exhibited a similar trend. Banaskantha, Panch Mahals and Dangs districts in Bombay State had below-average literacy percentages and a smaller proportion of teachers in the population than other districts. The superior position in regard to literacy enjoyed by a district like East Khandesh might be explained in terms of the higher ratio of teachers in the population. The proposition is, however, one that cannot be pressed too far since most of the natural divisions in Bombay State returned figures of ordinary teachers per 100,000 of population that were fairly close to the average ·figure for the State of 215 males and 45 females.1) Greater Bombay, Poona and Ahmedabad districts
. returned fairly high proportions of women teachers. The" schoolmarm" was primarily an urban phenomenon. The greater the degree of urbanisation; the higher the proportion of women teachers tended to be.
9 Amreli district had a high percentage of general literacy but a low proportion of teachers. Teachers were clearly misclassified as servants of educational institutions in that district.
A (Bk) H 91-19
Greater Bombay and Poona districts had much higher proportions of University professors and teachers than other districts because they were educational centres.10
CONCLUSION
About a quarter of the total population of Bombay State were returned as literate in 1951. Since 1931 there has been a steady increase in recorded literacy. Great disparities, however, exist in the percentage of literacy in the urban population as compared with the rural, among those engaged in non-agricultural pursuits as compared with those engaged in cultivation, and among men as compared with women.
Although almost three quarters of the total population were illiterate, this exaggerates the extent of illiteracy because it includes age groups that were too young to have acquired literacy. In Bombay State 30 per cent of the population in the age group 10 and over were returned as literate in 1951. That still leaves a formidable burden of illiteracy, but at least the picture has improved rapidly in the past two decades, and will continue to improve as an increasing proportion of children, particularly girls, acquire literacy.
10 The absence of college professors in Gohilwad district in Saurashtra was due to their being misclassified there as ordinary teachers.


CHAPTER X
+++++++++++++++++++++++++++++-+++++++++++++++++++++++++++++++++++++++++
LANGUAGE +.+++++++++++++++++++++++++++++~++++++++++++++++++++++++++++++++++++++
SECTION 1
MOTHER TONGUE
Information in regard to each person's mother tongue was extracted at the census. Though 85 languages were enumerated as being spoken as mother tongues in the State of Bombay as a whole, and 67 in Greater Bombay alone the problem of linguistic diversity is not as complicated as these figures suggest. Only a few languages were of outstanding numerical importance. Speakers of Marathi, Gujarati, Kannada and Urdu, the four most widely spoken languages, constituted 93·25 per cent of the total population. In the table below the principal languages spoken in Bombay State, and the percentage that each constituted of the total population with declared mother tongue at the census of 1951 has been shown :-
I. Marathi 2. Cuiarati 3. Kannada 4. Urdu 5. Hindi 6. Bhili 7. Konkani 8. Teluau 9. Sindhi
10. Raiaathani II. Tamil 12. Punjabi 13. Kac.hc.hhi 14. English 15. Malayalam 16. Bengali 17. Tulu
Bombay State. Number of PercentAie of speakers. total reportina. 15.850.632 44'08 11.413.554 31'74 4,350.791 12'10 1.917.081 5'33
485.278 1'35 370.062 1'03 313.677 0-87 306.949 0'85 280.091 0'78 259.334 0'72 110.370 0'31 68.141 0'19 67.376 0'19 47,387 0'13 39,818 0'" 15,554 0'04 10.437 0'03
There was some discussion after the 1921 census about the utility of the language statistics recorded at the census, particularly as
A (Bk) H 91-19Q
the language figures extracted at the 1921 census showed wide divergence in some cases from the figures compiled by the Linguistic Survey. In respect of the main languages, and particularly the areas where the main languages were predominant, however, the census figures have always been very reliable. In respect of dialects, like Bhili, the probabilities of differences would be greater, since enumerators are not grammarians or philological e~.
Dialects of main languages
Bhili, the sixth language on the list, is generally a dialect ~f the principal language of the district, either Marathi or Gujarati. In the case of the tiny new district of the Dangs, formed in 1948, a controversy arose regarding the language spoken by the Adivasis of the area. The Chief Minister and Deputy Chief Minister of Bombay, whose mother tongues were respectively Marathi and Gujarati, but who spoke both languages with almost equal facility, decided after touring the area that the language of the Dangs was Marathi. At the census of 1951 no persons in the district were returned as spea19ng Bhili. In other areas the fall in the number of persons returned as speaking Bhili was less spectacular but, with the spread of communications and the growth of education, the standard languages are tending to drive the dialects out. Even in the past enumerators who spoke Marathi or Gujarati tended to return any Bhil whose dialect they could understand as a Marathi speaker or a Gujarati speaker, as the case might be.

148 LANGUAGE
An interesting case of a standard written language driving out a dialect is provided by Ahirani or Khandeshi. Ahirani is a composite language with a basic structure of old Gujarati and admixture of Marathi words. The Linguistic Survey estimated the number of speakers of Ahirani at over a million, but the 1921 census returned only 200,261 speakers of the language. L. J. Sedgwick, the Superintendent of Census Operations in 1921, considered as a result of the enquiries that he made that the general opinion was that it was talked only by old fashioned people in villages and towns and was everywhere giving way to standard Marathi. In 1951, only 6,163 persons were returned as speaking Ahirani, a steep fall amounting almost to extinction by comparison with 1921 and 1931. All but 3 of the speakers were in West Khandesh district, and of the 6,160 persons returned as Ahirani speakers in that district 5,206 were females. It is becoming progressively more difficult for a dialect to survive in an atmosphere of increasing literacy.
The main languages spoken in the area
In the table below the population of Bombay State has been analysed since ,1921 according to the percentage of the total population who ~poke declared languages as their ~other
,tongue. Data for 1\}41 were not avru.~able. In the'table Bhili has been treated as a dIalect of the principal language of the district, either Marathi or Gujarati, as the case might be. Below the table separate figures for Bhili and Ahirani have been furnished.
Percentage of the total population of Bombay State with declared mother tongue
Census of :-Language.
, 1921 1931 1951
I. Marathi (including Bhili* and 46'86 46'73 45'04 Ahirani**) ...
2. Gujarati (including Bhili *) ... 31'27 31'00 31'83 3. Kannada . ]3'18 12'72 12'10 4.' Urdu 5'55 6'26 5'33 5. Hindi 0'002 0'09 1'35 6. Konkani 0'82 0'83 0'87 7. Telugu 0'68 0'65 0'85 8. Sindhi '0'03 0'16 0'78 9. Rajasthani 0'81 0'78 0'72
10. Tamil 0'13 O'JO 0'31 11. Punjabi 0'04 0'03 0'19 12. Kachchhi 0'26 O'JO 0'19 13. English 0'21 0-17 0'13 14. Bengali 0'01 0'01 0'04 15. Malayalam 0'01 0'05 0'11 16. Tulu ... ... 0'004 0'09 0'03
, 17. Minor I~nguages with less 0'14 0'23 0'13 than 10,000 speakers each ...
Total 100'00 100'00 100'00
"'Bhili 3'83 2'98 1'03 **A)tirani 0'90 0'88 0'02
The three languages, Marathi, Gujarati and Kannada, which are recognised as regional languages in Bombay State have, generally speaking, maintained their position since 1921, though Kannada relatively to other languages slightly lost ground, while Gujarati increased its position. Speakers of Marathi ( excluding Bhili and Ahirani) constituted 43· 92, 44·30 and 44· 08 per cent of the total population at the. censuses of 1921, 1931 and 1951. Speakers of Gujarati (excluding Bhili) constituted 29·48, 29·54 and 31· 74 per cent of the population at the censuses of 1921, 1931 and 1951.
Speakers of Urdu comprised 5·33 per cent of the population in 1951, a slight decline since 1921. Until 1931 this language was tabulated under Western Hindi. In Bombay State a considerable proportion of those persons who returned Urdu (or Musalmani) as their mother tongue can speak the regional languages with equal fluency. In Bombay State as a whole 8·1 per cent of the population were Muslims, while Urdu speakers comprised 5,3 per cent of the population. In Guj;uat 8 per cent of the population were Muslims, but only 2·9 per cent of the population returned Urdu as a mother tongue; while in the Deccan Northern Division the relative proportions of Muslims and Urdu speakers in the population were 6·1 and 5·4 per cent. In the Deccan Southern Division and in the Konkan the position resembled that obtaining in the Deccan Northern Division. In other words, most of the Muslims in Gujarat returned Gujarati as their mother tongue while elsewhere, and particularly in the _Deccan, they returned Urdu .. In Saurashtra and Kutch, where the percentage of Muslims' in the population was higher, Urdu was very little spoken.
Persons with Hindi as their declared mother tongue recorded a, -bigger- increase-since -1921 than any other linguistic group. Increased immigration from Hindi speaking areas probably accounted chiefly. for the phenomenon. Immigration also accounted for the rise in the proportion of Telugu, Sindhi, Tamil, Ptinjabi, Bengali and Malayalam speakers in the population. The majority of the displaced persons from P~kistan were Sindhi speakers. '
Less linguistic diversity in Saurashtra and Kutch
In Saurashtra and Kutch the' linguistic picture was less diversi£ed than in Bombay State. 96·06 per cent of the pop~lation of Saurashtra in 1951 spoke Gujarati, while Urdu, Kachchhi, and Sindhi accounted for the remainder. In Kutch 50,49 per cent of the population spoke Gujarati and 48-26 per cent

LANGUAGE 149
spoke Kachchhi,1)Sindhi principally accounting for the remainder~ Though originally regarded linguistically as a dialect of Sindhi, the proportion of Gujarati words in Kachchhi has shown a progressive increase, and time and political circumstances seem likely to lead to the progressive .assimilation of Kachchhi to Gujarati, as the script used in writing Kachchhi is the Gujarati script. At the 1921 and 1931 censuses 54·09 and 57·40 per cent of the population of Kutch were reported as speaking Kachchhf as a mother tongue. The figure at this census registered a slight decline to 48·26 per cent.
Linguistically homogeneous districts in Bombay State
The extent to which the principal language of a district was spoken by a majority of the
population found in a district at the time of the census is an indication of the linguistic homogeneity of an area. The position is, however, somewhat obscured by the varying extent to which Urdu and Bhili were returned as mother tongues in particular districts. In 5 out of 10 districts in Gujarat-Sabarkantha, Mehsana, Kaira, Panch Mahals and Broach-more than 95 per cent of the population returned Gujarati as their mother tongue. Out of the 10 districts of the Deccan Northern Division only Dangs and Satara North returned more than 95 per cent of the population as speaking Marathi In the remaining 7 districts of the Deccan Southern Division and the Konkan only Ratnagiri returned more than 95 per cent of its population as speaking the principal language of the district.
SECTION 2
BILINGUALISM
If a person commonly spoke any Indian language other than his mother tongue in daily or domestic life, the name of the language was recorded,. and .information about the -extent and nature of bilingualism was abstracted after the census. The bilingualism related 'not to the ability to speak another Indian language, but to its employment in daily life. --T-wo" main· types· of· ·bilingualism can be distinguished-the territorial bilingualism that arises in those border areas whert: the regional languages co-exist, and the socio-economic bilingualism that arises, out of the necessity of immigrants to employ a regional language or a lingua franca as a means of communication. It follows that the more linguistically homogeneous an area, the smaller the percentage of bilingualism. Thus, among the persons who spoke as a mother tongue the three great regional languages of Bombay State, viz., Marathi, Gujarati and Kannada, the percentage of bilingualism among Gujarati speakers was only 2·62 as against 3·23 among Marathi speakers, and 8·94 among Kannada speakers. Konkani alone among the languages indigenous to Bombay State returned a high percentage of bilingualism. The language is indigenous to Kanara district, where about half the Konkani speakers in Bombay State were found. The great majority of the Konkani speakers in Kanara district, who were bilingual, were -bilingual in Kannada. The other concentration of Konkani speakers in Bombay State was found in Greater Bombay. Many of these Konkani speakers were immigrants from Goa,
and Marathi and Hindi outdistanced Kannada as the second language in which they were bilingual.
Urdu and Kachchhi in Bombay State occupied a special position. Urdu is not a regional language in the sense of having a well defined region where the speakers of the language constitute an important block. The majority of the speakers of the language were not immigrants, but Muslims who were indigenous to the areas where they resided, and in consequence spoke the regional languages. 52· 16 per cent of the persons who returned Urdu as their mother tongue in Bombay State were bilingual-Maratbi, Kannada and Gujarati, in that order, being the languages in which the Urdu speakers were bilingual. It has already been noted that the mother tongue of most Muslims in Gujarat was not Urdu, but Gujarati. The number of persons in Bombay State who spoke Kachchhi as a mother tongue was 67,376 and 61· 75 per cent of them were bilingual, the great majority being bilingual in Gujarati. The language is indigenous to Western India, but not to Bombay State.
In addition to' the languages which were indigenous or semi-indigenous to Bombay State, there were other languages which more than 10,000 persons spoke as a mother tongue. These languages, in order of their numerical importance as mother tongues in Bombay State, were Hindi, Telugu, Sindhi, Rajasthani, Tamil, Punjabi, English, Malayalam, Bengali and Tulu. The recorded percentage of bilingualism

150 LANGUAGE
among the speakers of all these languages, except Hindi and Sindhi, was very high. Only 22 per cent of the persons who spoke Sindhi as a mother tongue were bilingual, and the language in which they were principally bilingual was Hindi, with Gujarati a bad second. Most of the Sindhi speakers were recent arrivals, displaced persons from Pakistan, and were concentrated in Greater Bombay, where English serves as a commercial lingua franca, or in the new township of Ulhasnagar in Thana district where the necessity of acquiring another language in addition to Sindhi was not acute.
Only 24 ·12 per cent of the Hindi speakers in Bombay State were bilingual. They weI:e already the fortunate possessors of India's" lingua franca, hence such of them as were bilingual were bilingual in the regional languages of Bombay State, Marathi, Gujarati and Kannada, in that order.
Among the quarter million persons who spoke Rajasthani as a mother tongue 49 per cent were bilingual. Many of them were Marwaris who had been settled in Bombay State for generations, and the languages in which they were bilingual were the regional languages, Marathi, Gujarati and Kannada, in that order. Speakers of Telugu and Tulu also showed a high percentage of bilingualism. 48 per cent of the Telugu speakers were bilingual, the majority in Mara~hi. 58 per cent of the Tulu speakers were bilingual, mainly in Kannada.
Outside the Rajasthani, Telugu, Tulu group, where a majority of the speakers who were bilingual were bilingual in the regional languages of Bombay State, came the Tamil, Punjabi, English, Malayalam and Bengali group. The percentage of bilingualism in this group was high. It ranged between 36 per cent in the case of Tamil speakers, and 49 per cent in the case of speakers of Bengali. The distinguishing feature of this group was that Hindi outclassed in importance any other language as the language in which speakers of
\'l Tamil, Punjabi, English, Malayalam .and Bengali were bilingual. "
The answers to the question on bilingualism concerned daily use, and not knowledge, of different Indian languages. Only one subsidiary language was to be recorded. Hence the returns did not reveal the extent to which Hindi, the lingua franca of India, was understood, but only the extent to which it was in daily currency. For that reason two of the regional languages, Marathi and Kannada, outclassed Hindi as the declared second language of persons in Bombay State. In the table below the principal languages in which people in Bombay State declared themselves to be bilingual have been shown, in order of importance. Speakers of Bhili and Ahirani have been treated as having Marathi or Gujarati as their mother tongue, and have not been analysed for the secondary characteristic of bilingualism in these two languages. To the persons returned as bilingual in Hindi or Urdu might be added the 1,623 persons who were returned as bilingual in Hindustani.
I.
2.
3.
4.
5.
Bilingualism in Bombay State
Language.
Marathi (including Bhili and Ahirani)
Kannada
Hindi
Gujarati (including Bhili)
Urdu
Number of persons
speaking the language as a mother tongue.
2
16,195,237
4,350,791
<> 485,278
11,445,174
1,917,081
Number of persons returned as
bilingual in the language at the
1951 census. 3
1,122,065
735,355
440,867
406,363
177,526
A rather fascinating feature of the language returns was that 27 persons in Bombay State returned Sanskrit as their mother tongue, and as many as 1,404 persons returned themselves as bilingual in that language.
In Saurashtra and Kutch bilingualism was not an important feature.

CHAPTER XI
++++++++++++++++++++++++++++++++++++++++++++++++++++++++++++++++++++++
RELIGION ++++++++++++++++++++++~+++++++++++++++++++++++++++++++t+++++++++++++++
At previous censuses religion and community loomed fairly large in the treatment of the census data. In fact, the primary sorting of the slips was done on the basis of religion. At the census of 1951 information was extracted about the number of persons who returned themselves as Hindus, Sikhs, J ains and Buddhists, the four principal religions of Indian origin, and as Zoroastrians, Muslims, Christians and Jews, the four main religions of non-Indian origin which were of any numerical importance in the area. The number of persons returned as professing other religions, or lack of any religious beliefs, was also tabulated under "Others." In the table below the number of persons professing particular religions in 1951, and the percentage which they constituted of the total population, has been shown wit.h, for comparison, the percentages which persons following these main religions formed of the total population of the area in 1921, 1931 ahd 1941.
Hindus
Muslims
J.ln.
(l"I.tlan.
Zoroaotrlanl
Sikh.
J ......
Buddhlsl1
Othen
Total
RELIGION
Bombay State (as at present constituted)
..
..
..
Persons. Percentage of each religion in total population at the
census of-1951 1951 1941 1931 1921
31.785.614 88'40 88'18 88'72 88'78
2.906.887 S'09 S'47 S'I2 7'94
572.093 1'59 1'51 1'43 1'60
525.454 1'46 1'40 1'28' 1'22
97.573 0'27 0'32 0'38 0'40
37.017 0'10 0'03 0'01
20.135 0'06 0'05 0'05 O'OS
2.395 0'01 0'01 0'01 0'01
8.982 0'02 0'03
35.956.150 100'00 100'00 100'00 100'00
Tribal Religionists The great majority of the population of
Bombay State in 1951 professed the Hindu religion. Nobody in Bombay State was returned in 1951 as professing a Tribal religion. This may have been due in part to the brevity of the instructions issued to enumerators, but was principally due to the fact that the ~ribal religion return in Bombay State in the past was largely meaningless, as recognised by Sedgwick! in 1921. The Tribal population of Bombay State has been largely assimilated to Hinduism as regards its religious practices. In order to ensure comparability of the data compiled at previous censuses with the 1951 results those who at the censuses of 1921 and 1931 were returned as professing an Animist or Tribal religion were treated in the table above as Hindus.
In the case of almost all the returns to the census questions in the past the enumerator was bound to accept the reply of the individual. However, in the case of Tribal religionists, or Animists as they were called until the 1931 census, the enumerator used to be left to decide whether a member of a jungle tribe was a Hindu or an Animist. Consequently it was almost a matter of luck what the number of Animists at any particular census would be. To the chance of being returned or not returned as an Animist by an enumerator wa's to be added the chance of being classified or not classified as such on the ground of caste by the head of the Abstraction Office. In 1911 Mr. Gait, the Census Commissioner, when visiting the Presidency on tour, converte(f2 70,000 Bhils in Reva Kantha
! Census of India, 1921, Bombay Report, p. 67. 2 Census of India, 1921, Bombay Report, p. 63.

152 RELIGION
from Hindus to Animists by a stroke of the pen. In consequence there was little hope of consistency in the past returns of Tribal religionists, and the returns of Animists or Tribal religionists showed wide fluctuation from one census to another. In the area that today forms Bombay State 426,421 persons were returned as Animists in 1911, 343,651 in 1921, and 199,825 in 1931. The average enumerator has always tended to regard the aboriginal tribes as Hindus, and Hindu influence pervades practically every Tribal religion. Some Tribals, notably the Tadvi Bhils3 of East Khandesh, are Muslims, and a few are Christians, but the vast majority are Hindus or follow a form of worship that is virtually indistinguishable from Hinduism.
Largely because of the difficulty presented by the religious classification of Tribals there was a change from a Religion to a Community return in 1941. Caste tables were compiled after the 1941 census in Bombay Province. Such of the Tribal population as were specifically Muslim or Christian were taken under the totals of these religions, and the remainder were classified as Tribes, without attempting to assess how many were Hindus and how many followed a Tribal religion. In 1951 the religion was to be returned as stated, but in practice it was found that all Tribals who were not specifically Muslims or Christians were returned by enumerators as Hindus. It is a matter of speculation whether the result would have been different if the instructions, which were deliberately kept brief, had been expanded. Probably the difference would not have been significant. In 1941 Baroda State classified the Tribals according to Religion, as had been done all over India up to 1931. Tribal religionists in Baroda State decreased from 44,890 in 1931 to 2,395 in 1941, despite precautions taken there to ensure that Tribals were not returned against their wishes as Hindus. Mter the 1941 census of Bombay Province no attempt was made to compile a return of Tribal religionists but, of the 199,825 Tribal religionists found in 1931 in the area that is now Bombay State, 44,890 were in Baroda State. The assimilation of the Tribals to Hinduism has been a' genuine and painless process, unlike in several other areas where the Tribal population was more backward. It has not been accompanied by any drastic readjustment of Tribal customs. The Scheduled Tribes are regarded by their
• The recorded figure of Tadvi Muslim Bhils in Bombay Province was 8,172 in 1931, and 2,462 in 1941. The reasons for the decline are not known.
neighbours as Hindus, and suc'l;t of them as are articulate in Bombay State would probably describe their religion as Hindu. By adding the Animists or Tribal religionists of past censuses to the Hindu total, comparability of the data has been ensured.
Hindus During the three decades from 1921, when
the general population increased by 12·9, 15·6 and 23·2 per cent the Hindu population (including Tribal religionists) increased by 12· 5, 15 and 24 per cent. Since Hindus form an overwhelming proportion of the population it is natural that the Hindu figures should mirror the decennial increases in the general population. The decennial increase in the Hindu population slightly exceeded the increase in the general population during the past decade. Hindus preponderated in the immigrant population, particularly the displaced population from Pakistan, which arrived during the past decade.
Muslims Muslims constituted the second most
important religious group in Bombay State. They numbered 2,906,887 or 8·09 per cent of the total population. During the past three decades the decennial increases in the Muslim population were 15· 1, 20· 6 and 18· 1 per cent. Muslims exhibited a heavier growth rate than the general population during the decades 1921-41. The slight fall in the growth rate during the past decade was probably due to a slowing down in the tempo of immigration of Muslims from other rarts of India, and to the emigration of some Muslims from Bombay State to Pakistan after partition.
]ains J ains constituted the third most important
religious group in Bombay State. They numbered 572,093 or 1·59 per cent of the total population. During the past three decades from 1921 the Jain population increased by 0·78, 21· 83 and 30·44 per cent. The J ains in the main are an urban-dwelling trading community, except in the Southern Deccan, notably Belgaum, where a considerable proportion are agriculturists. The recorded Jain population remained virtually stationary between 1921-31, largely due to the boycott of the 1931 census in the urban centres of Cujarat. Until recently Jains tended to be regarded as Hindus, and among certain Bania communities Hindus and Jains intermarry. The heavy increase of 30·44 per cent in the

RELIGION 153
~ Jain population during the past decade was probably due to increased immigration of )ains to Gujarat and Greater Bombay from Kutch and Saurashtra and other areas, and to a better recording of J ains as J ains than was the case here-to-fore.
Christians Christians in Bombay State in 1951 numbered
525,454 'or 1· 46 per cent of the population. 206,199 were in Greater Bombay. In Thana, Kaira, Ahmednagar and Poona districts they were numerically fairly important. The Christian population in Bombay State recorded increases of 18'94, 26'26 and 28'85 per cent at the past three censuses, due partly to continued conversion, but principally to increased immigration of Christians from Goa and other areas.
Zoroastrians Zoroastrians, influential far beyond their
numerical importance, being the most literate, the most urban, and possibly the wealthiest, of all the religious groups in India, are concentrated in Western India, principally in Greatex: Bombay and Surat. Zoroastrians in Bombay State numbered 97,573 or 0·27 per cent of the population, in 1951. During the past three decades from 1921 the recorded decennial increases in the Zoroastrian population were 6'02, 0'12, and 3'32 per cent. They were the only religious group whose population performance was predictable. A projection estimate, done on the basis of past Zoroastrian figures. from 1921, suggested a theoretical 1951 Zoroastrian population that was only 0·68 per cent more than the actual. Parsis marry later and less than other religious groups, but counterbalance their low fertility with an exceptionally low death rate. They have lost ground relatively to other religious groups, though their total numbers have never declined from one census to another.
Sikhs
Sikhs numbered 37,017 in Bombay State at the census of 1951 or 0'10 per cent of the population. Their numbers as recorded at successive censuses increased by 251· 7, 199·3 and 319· ° per cent from 1921. These rates of increase were startling, but the absolute numbers involved were inconsiderable-839 in 1921, 2,951 in 1931, 8,834 in 1941, and 37,017 in 1951. The Sikh sex ratio was heavily masculine. There were 563 women per 1,000 men. in 1951. Only Buddhists had a more masculine sex ratio. The events which
A (Bk) H 91-20
followed the partition of India led to an influx of Sikhs to Bombay State. A little over a third were found in Greater Bombay. Poona was another important centre of Sikh immigration.
lews There were only 23,000 Jews in undivided
India, and two-thirds of them were in what is now Bombay State. There were 20,135 Jews in Bombay State in 1951. 16,085 were in Greater Bombay. Kolaba district, where the predominantly rural Bene-Israelite Jewish community is found, had the next most important concentration. The number of Jews in Jiombay State increased by 15,2, 12·8 and 31· 2 per cent during the past' decade. The sizable increase during the past decade was localized in Greater Bombay.4
Buddhists Buddhism has all but vanished from the
land where it originated. Only 2,395 Buddhists were found in Bombay State in 1951-1,497 in Greater Bombay and 504 in Dharwar district. Past census figures5 testified to the existence of a few hundred Buddhists in Dharwar district. The precise location of this interesting group is now known to be Hubli City. The number of Buddhists in the area of Bombay State was 1,694 in 1921, 2,095 in 1931, 1,442 in 1941, and 2,395 in 1951. The reasons for the fall in 1941 are not known. Most of the Buddhists at the past three censuses were in Greater Bombay. The Chinese probably contributed most to the Buddhist figures.
Saurashtra and Kutch In Saurashtra and Kutch only Hinduism,
Islam and J ainism were of outstanding numerical importance. In the State of Saurashtra in 1951 Hindus comprised 86·72
4 The increase was so spectacular as to raise suspicions of inaccuracy. The Bombay Tabulation Office classified 9,247 males and 6,838 females in Greater Bombay as Jews after the 1951 census. In 1941, there were 5,602 males and 5,247 females in the area. The 1951 figure of Jews in Khara Talao, Kumbharwada, Market, Dhabi Talao and Fanaswadi Wards of Greater Bombay, was '1,886 males but only 4 females, all i~ livelihood class VI ( Commerce). A search of the National Registers of these Wards revealed only 4 Jewish males and 2 Jewish females. If these figures are taken as correct there were 7,365' males and 6,836 females in Greater Bombay in 1951. The increase in the Jewish population of Bombay State during 1941-51 would thus be 18,6 per cent, and not 31·2 per cent.
5 There were 316 Buddhists in Dharwar district in 1931, and 377 in 1941.

154 RELIGION
per cent of the total population, Muslims 10·20 per cent, and Jains 3·00 per cent. Only 0·08 per cent of the population belonged to other religions. In Kutch the proportion of Muslims and Jains in the population was higher than in Bombay and Saurashtra. In Kutch 69·26 per cent of the total population were Hindus, 19·63 per cent were Muslims and 10·99 per cent were Jains. Only 0·12 per cent of the population belonged to other religions. Females heavily outnumbered males in the case of Jains in Kutch, the explanation lying in the emigration of Jain traders, principally to Greater Bombay.
Urbanisation of religiOUS groups One of the most striking points of difference
between the various religious groups was their degree of urbanisation. Excepting Hindus, most religious groups had very sizable proportions of their adherents in the urban,
as distinct from the nJal areas. In the table below the rural-uroan ratio of the various religious groups has been analysed and, for comparison, the percentage of each religion who were enumerated in urban areas at previous censuses has been shown, where such data were available:-
Bombay, Saurashtra and Kutch Percentage of each religion
who were urban at the census 01-
1951 1941 1931 1921· Hindus 27'22 n. a. 17'73 18'10 Muslims 58'38 51'42 47'85 46'48 Jains 56'31 41'13 33'46 35'52 Christians 67'64 n, ., 55'81 55'89 Zoroastrians 92'23 n.8. 88'66 87'70 Sikh. 87'27 90'33 89'26 92'03 Jews' 92'52 n,a. 82'18 88'09 Buddhists, 94'93 n, a. 80'43 97'12 Others 54'45 n .•• n,., n, ••
o. n,8, '0 means '., not available." * Exclusive of Baroda State.

APPENDICES
A (Bk) H 91-20.


ApPENDIX A
+++++++++++++++++++++++++++++++++++++++++++++++++++++++++++++++++++++++
T.HE 1951 CENSUS QUESTIONNAIRE AND INSTRUCTIONS TO
ENUMERATORS ++++++++++++++++++++++++++++++++++++++++++++++++++++++++++++++++++++++
The Indian Census is a highly decentralised undertaking. The Registrar General and ex
officio Census Commissioner for India drew up
a model questionnaire, and the Superintendents
of Census Operations were responsible for
issriitlg appropriate instructions for their States.
The instructions issued to enumerators in Bombay, Saurashtra and Kutch have been reproduced in this appendix, together with the census questions.
The answers to the questions were recorded on enumeraticn slips, which took the following form ;-
1.-----------------------· 2a.----------·b.----------c.------------·------------
3.------------4.---------5.-----------------------6.------------- I -----------7.-------------8.----------9.------------------------10.------------------------·
11.----------------------12.----------------------13.-------------------- 14.·

++++++++++++++++++++++++++++++++++++++++++++++++++++++++++++++++++++++
THE 1951 CENSUS QUESTIONNAIRE ++++++++++++++++++++++++++++++++++++++++++++++++++++++++++++++++++++++
INSTRUCTIONS TO' ENUMERATORS
PART A-GENERAL PROCEDURE
1. Object of Census.-The object of the census is to catch every man. But remember that we want to catch him only once. You must be careful in the case of visitors, absentees etc. that there is no chance of their being enumerated in more than one place.
2. Census Dates.-The reference date for the census is 1st March 1951, i.e. our aim is a count of the population as it actually is at sunrise on the 1st March 1951. The enumeration is, however, to be made during
. the period of 20 days preceding the reference date. Our count must, therefore, begin on 9th February 1951 and end at sunri!ie on 1st March 1951.
Beginning from 9th February you will visit every house under your charge, and enter the details for each question regarding every person according to the instructions given in Part B, or given by your Supervisor. See that you spread the enumeration evenly over the 20 days.
3. Enumeration of households.-(i) When you visit each house you will enumerate every person whom you find there and who is normally resident in that house'. A person is regarded as normally resident if, except for temporary periods of absence, he uses that house as his sleeping place.
(ii) You will then enquire whether there is any person who is normally resident in the house but is absent at the time you visit the house. All such persons should also be enumerated, unless they left the house before the 9th February 1951 and are not expected to come back to the house until after the lst March 1951.
(iii) Occasionally you may find a visitor in a house who does not normally reside there. You should enquire from him when he left his house and when he expects to be back there. Do not enumerate him if he left his house on or after the 9th February or expects to go back there before sunrise on the 1st March. If however, he is away from his house throughout the
enumeration period and has not been enumerated anywhere else, you should enumerate him at the house where you find him.
4. Enumeration of houseless persons.-Persons who do not normally reside in houses (e.g. members of wandering tribes, tramps, sadhus, etc. ) should be enumerated wherever they may be fo_und during the night preceding sunrise of 1st March. For this purpose you will have to take a complete round of your block on the night of 28th February 1951.
5. Final Check.-You must revisit every house in your block and carry out a final check during the first three days of March. The object of this second visit is to bring your enumero.tion up to the reference date. This means .. (1) You should etlumerate every birth that has taken place in a house since your last visit. For every birth you will have to write a fresh slip. (2) You shQuld cancel the slip for any death that may have taken place in any house since your last visit. The fact and date of death should be written on the siip. The cancelled slip must not be removed from the pad. (3) If you happen to find any visitor who has not been enumerated anywhere else during the period of enumeration, you should enumerate him also.
6. Working with the Checker.-There is a checker for your block. He is not your superior but your partner. When you finish a pad you should write on the outside of the pad the total number of males and females and of displaced persons in that pad and hand it over to your supervisor.
Your supervisor will hand the pads to the checker of your block who will follow in your footsteps, checking to see that nobody has been inadvertently omitted by you from enumeration, and also to see that all the slips have been correctly filled in. He may correct and initial wrong entries. He should check particularly 'the house-number, and the answers to questions 1, 4, 9, 10, 11 and 12. Then he will give the pads back to the supervisor who will

THE 1951 CENSUS QUESTIONNAIRE 159
~ hand them over to you to make the final check (para. 5). Th~ checker should accompany you for the enumeration of houseless persons on the 28th night and also, if possible, for the final check during the first 3 days of March.
7. Provisional Totals.-On the morning of the 4th March 1951, after you have completed the final check of your block, you must go to the central place previously fixed by your supervisor at the time fixed and prepare there the Enumerator's Abstract of the population of your block in accordance with the instructions of your supervisor. You must take with you the pads and other documents relating to your block. Your supervisor will take' charge of these.
B. Legal rights and duties.-Under the Census Act, every person is legally bound to furnish you with the information you need for recording your answerS. You, however, must not ask information on any matters not necessary for the purpose of the Census. Nor must you disclose to any unauthorised person any information given to you or the results of the enumeration. All census entries are confidential and cannot be admitted as evidence in any civil proceeding whatsoever or in any criminal proceeding other than a prosecution for a census offence.
If a person persists in giving what you b~lieve to be a false reply warn him and, if he insists, accept the reply given and report the case to your Supervisor.
Any enumerator extracting money on any pretext connected with the census will make himself liable to punishment under the Census Act or the Penal Code.
ENUMERATOR'S ABSTRACT
District
Taluka
Town or Village
Enumeration began
Enumeration ended
Number of books used
Abstract
Number of occupied houses Persons.
Total Displaced persons
(Q. No.6)
Males. Females.
(Signature of Enumerator).
Checked and found correct.
(Signature of Supervisor).
PARTB
1. Rules for filling up the slip.-Use black ink only and write very clearly. This is the only slip that will be written in the census and you must, therefore, take great care. In recording the answers to the questions contractions in the form of numerals will be used in the case of some questions. Study these contractions and try to memorise them. For instance in question three, 1 denotes an unmarried person, 2 a married person, 3 a widowed person:" For divorced persons you are to wrile O. You can easily remember the first two if you think that 1 means a single person and 2 a couple.
The purpose of these contractions is to save you writing long answers. Take care you use the right contractions. You can make sure of this by keeping the questions and this booklet before you while recording the' answers.
Practise the questions as much as you can. Write down the answers on the back of an envelope or any old piece of paper.
2. Location Code i.e. Identifying numbers on slips.-At the top of every enumeration slip you will see a printed figure. This represents the district number. Other numbers to represent the taluka and the village have to be written on the slips. It is proposed that these numbers should be written on the slips under the instructions of the Circle Supervisor.
3. When you visit each house for enumeration, you must write the house number on the slip relating to the person enumerated in that house. The house number is the last element in the Location Code. In rural areas there are four elements in the Location Code. First comes the district number, which is a printed number, this is followed by the taluka number, tben the village number and lastly, when you go for enumeration, you have to write down the house
number. Thus the figures 7-10-79-103 on the top of a slip indicate that the slip comes from house 103 in village number 79, in taluka number 10, in district number 7.
4. In non-rural areas the Location Code numbering is slightly ~ifferent and consists of a group of 5 numbers, Instead of 4. One of these numbers is in Ruman numerals. For instance, the figures 7-11-3-2-63 on top of a slip would indicate house number 63 in block number 2, in ward number 3, in the second municipality in district number 7. Your supervisor will explain the Location Code numbering to you. You must see that all numbers up to the house number are written on all the slips in the pads which are given to you, Then, when you go to the house for enumeration, you will write the house number on the slip.
5. You should visit the houses for enumeration in the order mentioned in the Block list i.e. the list of houses in your block. Generally the numbers afe in serial order. This list shows you the number of adults and children you may expect to find in each house. You should enumerate first the head of the household, then relatives, then unrelated persons, in that order. Record information for all persons in the household even if they are not physically present, provided there is some responsible member of the household there to give you information. If there is nobody in the house when you first visit or if you fail to obtain full information for ail members of the household, make a note in the Remarks Column of the Block list to remind you to visit the house again. Try as far as possible to fill up the slips in the order in which the houses are given in the Block list.
6. In some houses there may be more than one household. It is important to show this fact when it occurs. Where there is more than one household, therefore. distinguish them by adding the letter A. B

160 THE 1951 CENSUS QUESTIONNAIRE
etc. after the house number. For instance, if there were two households in house No. 49, the slips relating to the first should be given house No. 49-A, and those relating to the second No. 49-B.
If in a particular house there is a visitor, he should be enumerated as part of the household to which his host belongs. For example, if he is a guest of household 'A,' in house No. 49, then house No. 491 A should be written on his enumeration slip.
In respect of institutions, such as jails, beggar homes, asylums, hospitals, hostels, boarding houses and hotels, the members of the staff who are normally resident in the building, should be enumerated in households as mentioned above. But others enumerated in these buildings should be enumeraled in the manner prescribed for visitors, [Part A, para. 3 (iii)], subject to the modification that, in such cases, the entry in respect of the house number at the top of the slip should be 49/Inst., to indicate that that particular house number is an institution.
In the case of persons enumerated under the cate-" gory of houseless persons, there will be no house number to enter. Write' 0' in place of the house number.
7. On the enumeration slip itself, put down nothing except the Location Code numbers at the top of the slip and thc answers to the questions. YO)l must not remove any slip from your enumeration pad.
INSTRUCTIONS FOR RECORDING ANSWERS TO QUESTIONS
QUESTION No. l.-(Name and relationship to the head of the household)
Write the names of the persons enumerated. After the name write 1 for the head of the household. For near relatives (viz. wife, son, daughter, brother, sister, father, mother) write the actual relationship in fulL For other relatives write 2. For unrelated persons (if any) living in the household write O.
Note.-For purposes of census, a "house" has been defined as a dwelling with a separate main entrance. A "household" means all the persons who live together in the same house and have a common mess. In some houses, there may be more than one group of persons with a common mess. In these cases, each group should be regarded as a separate household for purposes of the census. The head of the household is the person on whom falls the chief responsibility for the maintenance of the household. Treat as the head of the household without enquiry any person who is acknowledged as such. A household may include persons (e.g. domestic servants, lodgers etc.) who are not related to the head of the household, but live together and have a common mess. First enumerate the head of the household and then the other members in the household.
QUESTION No. 2.-(Nationality, Religion and Special Group).
Part (a) Nationality-Write 1 for all Indian Nationals. For .others write the Nationality in full.
Part (b) Religion-Write 1 for Hindu, 2 for Muslim, 3 for Christian, 4 for Sikh, 5 for Jain, 6 for Parsi. For others write the answer as actually returned. If a person says he is an atheist record " Atheist."
Part (c) Special Groups-Write 0 for any person who says he is not a member of any casle or tribe. Write 1 for a person who is a member of one of the castes ment;oned in the list of non-backward castes supplied to you. In all other cases, write the name of the caste or tribe as returned by the person enumerateil. Write 2 for an Anglo-Indian.
The list of non-backward classes in respect of whom you are to write 1 is as follows I-
I. Agri. 2. Bhansali. 3. Bhat or Barot or Brahmabhat. 4. Bhatia. 5. Bhavsar or Chipa. 6. Bhor. 7. Brahman. B. Darji, Shimpi, Sai and Mivai. 9. Gujar.
10. Halwaki-Wakhal. 11. Kanti or Vaishya. 12. Kayastha. 13. Kayastha Prabhu. 14. Koshti, Hutgar, Jed, Winkar, or Devang. 15. Leva or Reva Kunbi of Khandesh. 16. Lingayat or Veershaiva. 17. Lohana or Luvana. lB. Lahar, Luhar and Kammar. 19. Mahratta. 20. Mahratta Kunbi. 21. Panchal and Vishwa Brahman. 22. Panchkalshi or Soma Vanshi Kshatriya. 23. Patane Prabhu. 24. Raddi. 25. Rajput. 26. Sali and Padma Sali. 27. Shinde. 28. Soni, Sonar, Aksali and Daivadnya Brahman. 29. Sutar. 30. Tirole Kunbi of Khandesh. 31. Vani, Vania or Bania.
QUESTION No. 3.-(Civil Condition)-Write 1 for unmarried, 2 for married, 3 for widowed. If divorced write O.
QUESTION ~o. 4.-(Age)-Write the age last birthday; that is, the actual number of completed years. Write 0 for infants below 1.
Note.-This is an important question and many persons are likely to find it difficult to state their age exactly. You should assist them and try to record, as far as possible, the correct age of the person enumerated. If you are not able to find out the age by direct questioning, you should get at it by referring to some event of importance that. occurred in the past and is remembered by everyone. You should use any local calendars of such events that may have been prepared for the purpose.
Many people give what they call their "running" age i.e. the age they would reach next birthday. Explain clearly that you want to know the age in completed years.
QUESTION No. 5.-(Birth place)-Write 1 'for every person born in ,he district of enumeration.
If the person was born inside the State of enumeration (Bombay 1 Saurashtra) but outside the district of enumeration write the name of the birth district.
If the person was born outside the State of enumeration write the name of the State or Foreign country where he was born, according to the answer given.
QUESTION No. 6.-(Displaccd Persons)-~f the person enumerated is not a displaced person write 0 in both compartments. If he is a displaced person, write the date of arrival in India in the first compartment; and the district of origin in Pakistan in the second compartment.
The definition of a displaced person is as follows: "Displaced P{'rson" means any person who has
entered India having left or been compelled to leave his home in Western Pakistan on or after the 15th March 1947, or his home in Eastern Pakistan on or

THE 1951 CENSUS QUESTIONNAIRE 161
after the 15th October 1946, on account of civil disturbances or the fear o? such disturbances or on account of the setting up of ~the two Dominions of India and Pakistan.
QUESTION No. 7.-(Mother tongue)-Write 1 for Marathi; 2 for Gujarati; 3 for Kannada. In any other case write the mother tongue in full according to the answer given.
Mother tongue is the language spoken from the cradle. In the case of infants and deafmutes the mother tongue of the ffiQther should be given.
QUESTION No. 8.-(Bilingualism)-If a person commonly speaks any Indian language other than his mother tongue in daily or domestic life record it~ using the abbreviations given in question 7. Record only one subsidiary language.
If a person is not bilingual write O.
QUESTION N~. 9.-(Economic status). There are two compartmcnts because there are two
parts to this question. Part One-Dependency-Write 1 for a self-supporting
person; 2 for a non-earning dependant; and 3 for an earning dependant. Write the answer in the first compartment.
Note 1.-'Vhere a person is in receipt of an income, and tbat income is sufficient at least for his own maintenance then. he (or she, as the case may be) should be regarded as a self-supporting person." Anyone who is not a self-supporting person in this sense is a .. dependant." A " dependant" may be either an earning dependant or a non-earning dependant. The test is whether he secures a regular income, even though it may be small. Such income may be in cash or in kind. Where the income which he secures is not sufficient to support him, that person is an "earning depenqent." A person who does not earn any income either in cash or in kind is a non-earning dependant.
The basis of enquiry is the individual, and his present level of living. A person does not cease to be selfsupporting merely for the reason that he, his wife and children taken together are not maintained by his own income.
A void two common mistakes : ( 1) Recordiog only t1;t~ head of the household as
self-supporting. (2) Recording all women automatically as non
earning dependants. Women may be earning dependants or even self-supporting.
Note 2.-Where two or more members of a family houshold jointly cultivate land and secure an income therefrom, each of them should be regarded as earning a part of the income. None of them "is, therefore, a non-earning dependant. Each of them should be classed as either a "self-supporting person'" or an .. earning dependant," according to the share of income attributable to him (or her). The same applies to any other business carried on jointly.
Example.-In an agricultural family consisting of a husband, wife and son all work on the family land. The husband and son work full time, and the wife works part time. The husband and son may be classified as self-supporting, and the wife as an earning dependant.
This does not mean that every one who works is necessarily a self-supporting person, or an earning dependant. Thus, for instance a housewife who cooks for the family, brings up thc children or manages the household is doing very valuable work. Nevertheless, her economic status is that of a .. non-earning dependant," if she does not also earn an income and should be recorded as such.
A (Bk) H 91-21
Part Two-Employment.-If a self-supportinO' person earns his principal means of livelihood as an ~mployer write 1, as an employee write 2, as an independent worker write 3. Write 0 in (lther cases. Write the answer in the second compartment'.
Note.-You are asked to distinguish whether a selfsupporting person is an employer, an employee or an independent worker.
(a) You should record as an "employer" only that person who has necessarily to employ other persons in order to carryon the business from which he secures his livelihood. Thus, if a person employs a cook or other person for domestic service, he should not be recorded as an "employer" merely for that reason.
( b) An "employee" is a person who ordinarily works under some other person for a salary or a wage in cash or in !<ind, as the means of earning his livelihood. There may be persons who are employed as managers, superintendents, agents, etc., Hnd in that capacity control other workers. Such persons are also employees only, and should not be recorded as employers. All Government servants are employees.
( c) An "independent worker" means a person who is not employed by anyone else and who does not also employ anybody else in order to earn his livelihood.
Note that dependants (whether earning or nonearning) are not to be classified under these three heads. Examples:
( 1) Doctors or lawyers who employ compounders and clerks are employers.
(2) Beggars and convicts in jails fall in none of the three categories. Record" 0" for them.
QUESTION No. 10.-(Principal means of livelihood) This is a very important question. Please therefore
pay great care. If the slip relates to a self-supporting person, record his principal means of livelihood. If the slip relates to a dependant (whether earning or non-earning), record here the principal means of livelihood of the self-supporting person on whom he is dependent. A person may have more than one means of livelihood. In that case the means of livelihood which provides the largest income is the principal means of livelihood for a self-supporting person who has more than one means of livelihood. In the case of other self-supporting persons it is the only means of livelihood.
Use the following contractions.-Write 1 for a person who cultivatcs land owned by him, 2 for a person who cultivates land owned by another person, 3 for a person who is employed as a labourer by another person who cultivates land, 4 for a person Who receives rent in cash or kind in respect of land which is cultivated by another person.
If a person falls under two of these categories note the category that provides the largest income agaiost question 10, and the second against question 11.
Note.-The test of "ownership" is the existence of a right of occupancy in land, which should be heritable; but mayor may not be .a transferable right. For instance a person who cultivates "new tenure" land in the State of Bombay should be treated as an owner-cultivator and enumerated as 1, though he is legally prohibited frofu transferring the land.
For all other means of livelihood, write fully and clearly what the person docs in order to earn his livelihood and where he does it. Avoid terms like .. Labour" "and "Service" which arc not nearly exact enou~.
For instance, a man may be a clerk. You must state not only that he is a clerk, but whether he is a clerk in a mamlatdar's office, or a municipality, or a lawyer's

162 THE 1951 CENSUS QUESTIONNAIRE
clerk, or a clerk in a firm of soap manufacturers etc. Or a man who is a labourer may be engaged in a salt works, or a cotton gin, or a match factory and so on. By showing what he does and where he does it you enable him to be classed to the industry which he serves. You have three lines. Use them fully if necessary. The test is this: If you showed what you have wrilten to a complete stranger would he get a full picture of the person's means of livelihood.
In the case of a trader, in addition to giving the articles in which he is carrying on trade, state whether he is a wholesale or retail trader. A retail trader sells to the public; a wholesale trader does not.
QUESTION No. ll.-(Secondary means of livelihood) For a self-supporting person who has more than one
means of livelihood write here the means of livelihood next in importance to his principal. means of livelihood. For an earning dependant write the occupation that gives him an income; use the contractions given in question 10. For a self-supporting person who has only one means of livelihood write O. In the case of a non-earning dependant also writc O.
Note.-An earning dependant is maintained partly by the income of some one else and partly by his o~n. It is not necessary to enquire which is more importarit .. His principal means of livelihood should always be taken to be the same as that of the self-supporting person on whom he is dependent. The occupation which gives an earning dependant an income is his secondary means of livelihood.
QUESTION No. 12.-(Literacy and Education)
Write "0" for a person who can neither read nor write' write 1 for a person who can rcad but cannot write; write 2 for a person who can read and write. But if a person who can read and write has also passed
any examination write the highest examination passed instead of writing 2.
If the examination in questio:.! consists of a degree or degrees with which you are not familiar then request the person to write it down on a separate picce of paper and then copy what he writes On to !:pe slip in the pad.
Note.-The test for reading is ability to read n simple letter either in print or in manuscript. The test for writing is ability to write a simple letter.
QUESTION No. 13.-(Unemployment)
Write 0 for all persons below 16 or above 60 years of age, housewives, students, permanently disabled persons etc. who are not gainfully employed. Write 0 also for persons not seeking employment.
Write 1 (or persons gainfully employed on the date of enumeration, or on leave from gainful employment on that date.
Write 2 for persons unemployed and seeking employment for a period of less than 3 months preceding the date of enumeration.
In the case of persons unemployed and seeking employment for a period of 3 months or more preceding the date of enumeration write the number of completed months for which the person has been continuously unemployed i.e. 3, 4, 5, 6, etc. up to 12. In the case of continuous unemployment for more than 12 months also, the number 12 should be written.
QUESTION No. 14.-(Sex)
Write 1 for a male and 2 for a female.
Eunuchs and hermaphrodites should be treated as males.

APPENDIX B
++++++++++++++++++++++++++++++++++++++++++++++++++++++++++++++++++++++
HOW ACCURATE WAS THE CENSUS? ++++++++++++++++++++++++++++++++++++++++++++++++++++++++++++++++++++++
SECTION 1
VERIFICATION OF THE CENSUS HEAD COUNT
How many people escaped the census head count? Were any people counted twice P When the provisional census totals of Bombay State revealed an increase of 23· 2 per cent over the 1941 population it was at first surmised that the census result had erred on the side of over-enumeration. A fear was expressed that the existence of rationing, of which a certain number of bogus cards is an inevitable accompaniment, might have led to a swelling of the census count by fictitious persons. The longer enumeration period of twenty days, with its attendant risks of double-enumeration, was also regarded as a facto? making for possible inaccuracy.
Sample Verification of the 1951 Census Count
Fortunately a scientifically organised verification of the 1951 census count was undertaken at the instance of the Government of Ip.dia after the census. The purpose was to make a definite ascertainment of the degree of error that may be present in the census statistics. In reaching its decision the Government of India was influenced by certain observations contained in a review of population census methods of all countries, published by the Secretariat of the United Nations. "A scientific appraisal of the accuracy of census results has been avoided by official statistical agencies of ~ome countries. The result is an unfounded impression in the minds of uncritical users of the figures that they are perfectly reliable.
A (Bk) H 91-21a
In some countries there is a progressive tendency to discuss frankly the defects in census statistics, but until this practice becomes general it will be difficult to determine with any precision the degree of unreliability of the figures for most areas of the world." The authors of the review stated that "the completeness of enumeration can be estimated by a well-planned verification carried out immediately after the original enumeration in a scientifically selected sample of the area."
The sample was intended to be a random sample of the approximate dimension of one in one thousand, and aimed at a determination of the percentage of error present in the census count, -either in the form of under-enumeration or over-enumeration, and not at investigating the correctness of the replies to the census questions.
A census "block" was the area in charge of one enumerator. In rural tracts one village census block was chosen out of every 100 blocks, and in each of the selected census blocks, every tenth household was chosen. In urban tracts one town census block was chosen out of every twenty blocks; and in each of the selected blocks, every fiftieth household was chosen. Selection of sample households and blocks was made according to a prescribed formula. Application of the formula, coupled with the inability of the Verification Officers to verify all the selected households, resulted in practice in curtailing the dimension of the sample from

164 HOW ACCURATE WAS THE CENSUS?
1/1000 to 1/1335. In addition to verifying the selected households, the Verification Officers had to ascertain whether the three occupied houses nearest to the sample houses were numbered for census enumeration and found a place in the National Register of Citizens, a document which consisted of a transcription of the replies to the more important census ·questions in respect of every person enumerated.
Throughout the State of Bombay, excluding Greater Bombay, and in Saurashtra and Kutch the verification was entrusted to revenue officers who were also magistrates. The Chief Verification Officers were district or sub-divisional magistrates. In Greater Bombay the Deputy Commissioner of Labour was the Chief Verification Officer, and suitable officers from his fieldstaff worked under him as Verification Officers.
The census count ended on 3rd March 1951, the verification commenced in June 1951, and was completed by the middle of July 1951.
The results of the verification in Bombay State were reviewed in an article published in the January 1952 issue of the Bulletin of the Bureau of Economics and Statistics, Government of Bombay. The data for Saurashtra and Kutch were similarly processed later.
The main conclusions suggested by the verification are reproduc~d below:-
(1) In the whole area of Bombay, Saurashtra and Kutch the error at the census count was one of under-enumeration. The error was greater in the urban areas than in the rural. This accords with expectations since the rural population is less mobile and is more likely to be personally known to the enumerators, which is always an advantage.
The follOWing table brings out the . position :-
Percentage of under-enumeration
State and suggested by the verification.
Natural Division. General Rural Urban population. population. population.
Bombay State 0·9910 0·7070 1·5644 Greater Bombay 2·5308 2·5308 Gujarat 0'6681 0·2794 1·6470 Deccan Northern 0·9828 1·1099 0'6476 Deccan Southern 1·0451 0·7875 1·9555 Konkan 0'6566 0·6284 0·7717 Saurashtra State 0·5973 0·7249 0·3695 Kutch State 0·3906 2·6223
The error in the cities was highest. The verification indicated that m Greater Bombay the error was 2·5 per cent under-enumeration, in Ahmedabad City 1· 8 per cent underenumeration, while Poona City which did an excellent census had only 0'8 per cent under-enumeration.
(2) The total number of persons in respect of whom the verification was done was 30,147. The number of cases of clear omissions detected was 280, while the number of cases of fictitious entries was 60. This suggests a ratio of 5 : 1, and it is chieHy on the basis of this result that the proposition that bogus ration cards vitiated the census head count can be disputed. A comparison
, of the census figures with the figures of ra,tion card holders in rationed cities and towns showed that in general the population according to the rationing figures was higher than the population recorded at the census, and the gap tended to widen as the size of the city increased. This too was in line with expectations because the opportunities for operating bogus ration cards without detection would be greater in cities than in the smaller towns.
A.
(.'3) The verification suggested that the error at the census count was an error of under-enumeration, and that the error was within 1 per cent. Unless the sample was too small to be decisive, or the operators of bogus ration cards so shrewd as to bamboozle the Verification Officers, cases of fictitious entry were "hot an important factor in the census result. It seems possible that the existence of rationing, and its apparatus of house to house enquiry, far from inHating the census head count, may actually have improved it by reducing the degree of under-enumeration present in the past.
The calculations for the area of Bombay, Saurashtra and Kutch are reproduced briefly below:
Bombay, Saurashtra and Kutch
Verification of persons:
(1) Total number of sample households selected for verification of the number of persons enumerated.
(2) Number of households out of (1) verified.
(3) Total number of persons in households at (2) in respect of whom verification work was done.
5,991
5;937
30,147

HOW ACCURATE WAS THE CENSUS? 165
(4) Number oli cases of clear OlniS- (11) Enumerated household popula-sions. 280
(5) Number of' cases of fictitious entries. 60
(6) Erroneous count of visitors and
tion. 40,233,323 (12) Average number of persons per
house- (_!_!1 5·6839 (10)
absentees; (i) Number of cases tending to
(13) Number of houses checked. . . 17,850 (14) Number of houses out of (13) found
under-enumeration. 29 to have been not covered in the (ii) Number of cases tending to
over-enumeration. 26 course of enumeration. 38
(15) Estimated number of houses not (7) Net number of cases of under- covered in the course of enume-
enumeration ration. 15,069 [4 + 6 (i)] - [5 + 6 (ii)]. 223 (16) Estimated number of persons in
(8) Enumerated household popula-tion. 40,233,323
(9) Estimated number of persons not enumerated
houses not covered. 85,651 C. Results;
(17) Enumerated populatio'n. 40,661,115 (18) Total estimated number of persons
(7) (8) X (3) 297,609
not enumerated-(9 + 16). 383,260 (19) Percentage of under-enumera-
B. Checking of houses: (10) Total number of houses. 7,078,454
tion. 0·9426 (20) Estimated real population-
(17 + 18). 41,044,375
SECTION 2
A CHECK OF THE CENSUS COUNT FROM THE RURAL SAMPLE SURVEY DATA OF THE BUREAU OF
ECONOMICS AND STATISTICS OF THE GOVERNMENT OF BOMBAY
The statistical data obtained by the Bureau of Economics and Statistics, Government of Bombay, in conducting a sample survey of Employment, Income alid Expenditure in 1951-52 were also used to make an estimate of rural and urban population for different regions of Bombay State.
The whole state was divided into eight tracts_ according to their geographical position and predominant crop economy. In each of the tracts groups of ~ontiguous talukas were formed in such a way that each group had the same rural population. From each group two talukas were selected with probability of selection of the taluka proportional to the population of the taluka. Further, from each of the selected talukas a constant number of villages was selected with probability proportional to the population. Ultimately, in each of the selected villages thirty houses· were selected, and, if a selected house had more than one household, only one household from these was selected. The total sample covered O· 15 per cent of the total rural population of the State. The urban centres were selected directly from each tract with probability of selection proportional to population. Four of the eight tracts had to be combined for selecting urban centres as the number of urban centres in each of these tracts was small. In each of the selected urban
centres sixty households were selected in the same way as in the case of villages. About 0·15 per cent of the urban population was thus covered.
Information about the number of persons in the selected families was obtained from the weekly schedules for the month of April 1951 in the case of rural areas of six of the eight tracts, and for the month of June 1952 for the urban centres and for two of the rural tra~ts, as the survey in these last two tracts was started later due to administrative difficulties.
For each tract a weighted average of the average number of persons per household for each selected village was obtained. This, when multiplied by the total number of households in the tract-the data collected at the census were used-gave the rural population of the tract. A similar procedure was adopted to estimate the urban population but, as there were few selected urban centres in each tract, the weighted average was obtained for the
whole state.
The statement which follows gives· 'the estimates of rural population and urban population in Bombay State.

166 HOW ACCURATE WAS THE CENSUS?
Estimates of Population of Bombay State from Rural Sample Survey (1951-52)
Rural 24,316,386 Urban 11,462,125
Total 35,778,511 ------'
The census figure of Qopulation was 35,956,150, but the household" population was only 35,560,346, the balance of 395,804 being institutional and houseless population. These figures suggest that the census count of the population was very accurate.
SECTION 3
VERIFICATION OF THE CENSUS LIVELIHOOD CLASS RETURNS AT THE RURAL SAMPLE SURVEY
Errors at a census may be of content as well as coverage. How accurate, for instance, were the means of livelihood returns at the census of 1951? In particular, how accurately did the census' 'figures of livelihood classes I, II and III (cultivating owners, tenants and labourers) reflect the actual position in the rural areas ?
The census was not the first enquiry in recent years to examine the livelihood pattern of the rural population. The Agricultural Labour Enquiry of 1950-51 covered 8,069 families in 55 sample villages in Bombay State. Its results suggested that 88·1 per cent of the population
were agricultural, 11· 2 per cent non-agricultural, and 0·7 per cent had no specific stable occupation. The agricultural percentage of 88·1 was distributed as follows:-
1. Agricultural land owners 49·5
2. Agricultural tenants 20· 1
3. Agricultural workers 18·5
Total 88·1
These categories corresponded fairly closely to livelihood classes I, II. and III at the census.
A check of the accuracy of the census returns of means of livelihood was obtained at the Rural Sample Survey of Employment, Income and Expenditure conducted by the Bureau of Economics and Statistics of the Government of Bombay. The households of the Rural Sample Survey p~ovided a check not only of the accuracy of the census head count, but of the,
census returns of means of livelihood. The
investigators adopted the same definitions as those employed at the census but they did not refer to any of the census livelihood returns. it. was a completely separate enquiry. The inve'stigators, moreover, did not ask the heads of households to describe their principal means of livelihood. They visited each family every
month for a year from March 1951 to February 1952 and applied their own checks to determine what the family's principal means of livelihood was. It was thus a more objective and scientific enquiry than the census enquiry, into which necessarily a subjective factor
entered, 1!ince at the census the replies to the questions were generally recorded as given. The results are therefore of considerable interest as furnishing a check of the means of livelihood returns in rura. areas at the census. It was impossible to gauge accurately on a O· 15 per cent sample basis the size of livelihood class IV which formed only 2·2 per cent of the rural population at the census. Therefore, the tiny number· of families in the Bureau's sample returned as belonging to livelihood class IV were redistributed among other livelihood classes according to any other means of livelihood they had returned.
The table which follows shows the percentage of the rural population of Bombay State classified as belonging to the three main agricultural livelihood classes, and to the non-agricultural clas~es, at the Agricultural Labour Enquiry, the Census of 1951, and the Rural Sample Survey of the Bureau of Economics and Statistics of the Government of Bombay. '

HOW ACCURATE WAS THE CENSUS? i67
Percentage of rural population in Bombay State who were
Agricultural Agricultural Agricultural Non-agriculturists land owners tenants i.e .. workers i.e. i.e. Livelihood Unclassified
I.e. Livelihood Livelihood Livelihood Classes V-VIII. or Others. Class I. Class II. Class III.
2 3 4 5 6
I. Agricultural Labour Enquiry 1950-51 49'5 20'1 18'5 11'2 0'7
2. The 1951 Census 55'3 ]3'0 11'7 17'8 2'2*
3. The Rural Sample Survey of the Bureau of 51'4 12'1 18'9 17'6 Nil·· Economics and Statistics of the Govern-ment of Bombay. 1951~52"""
·These were persons classified as belonging to livelihood class IV (non-cultivating owners or landlords).
uThe persons returned as belonging to livelihood dass IV were redistributed among other livelihood classes .
.. ··The figures given in this survey are for families and not for persons. As every survey has indicated that the size of cultivating labourers' households is smaller than in other livelihood classes, the percentage shown in column 4 of this line should be reduced slightly.
The 1951 census figures and the Rural Sample Survey figures of non-agriculturists tallied, and probably represent the true percentage. The sample villages in the Agricultural Labour Enquiry were probably more intensively rural and agricultural than the average and were, consequently, not completely representative. For instance, only 11 per cent of the population of the sample villages of the Agricultural Labour Enquiry were literate, while at the census 17 per cent of the rural population of Bombay State were returned as literate.1
The census figure of tenants (livelihood class II) and the R~ral Sample Survey figure were in very close accord, and may be taken as corroborating each other. The ratio of owners to tenants seems to be about 4 : 1 in Bombay State.
Only in regard to labourers (livelihood class III) was there a fairly wide range of disagree-
1 At the Rural Sample Survey thc percentage was 17·4. The Bureau's sample, though small, seems to have been a better sample than the Agricultural Labour Enquiry Committee's sample.
The Bureau's investigators did not see the census record, but they employed the same definitions as were used at the census. At the 1951 census 27'2 per cent of the population of Bombay State were returned as self-supporting persons, 57· 2 per cent as nonearning dependants, and 15· 6 per cent as earning dependants. The Rural Sample Survey of the Bureau of Economics and Statistics also investigated this question. They found 26·6 per cent of their sample population were self-supporting, 57'1 per cent were non-earning dependants, and 16'3 per cent earning dependants. The correspondence is amazingly close.
ment between the census figure and the Rural Sample Survey figure. Which is correct? The writer feels that as the latter investigation employed the same definitions as the cen:;us, was spread over a year, was more detailed and scientific, and carried out through trained investigators it is probably nearer the truth despite the very small size of the sample. Some persons who were principally dependent on agricultural labour seem to have been returned at the census as cultivating owners (livelihood class I). The census figure of owner-ccltivators is consequently slightly over-stated, while the size of livelihood class III should really be increased to arrive at a true picture.
How could such a thing happen? Primarily, it seems, because not all the persons classified at the Rural Sample Survey as principally dependent on agricultural labour were completely landless. No data were readily available about land held by labourers at the Rural Sample Survey, but the results of the Agricultural Labour Enquiry furnish a good indication of the probable position. Out of the 8,069 families in the sample villages at that enquiry 1,643 were classified as agricultural labourers. 768 of these families had some land; 875 had no land. 12'2 per cent of the total number of 5,230 cultivators' holdings in the sample villages, comprising 4·7 per cent of the area, were held by agricultural labourers. Cultivating owners had on an average holdings of 11· 69 acres, agricultural tenants had 8·76

168 HOW ACCURATE WAS THE CENSUS?
acres, and agricultural labourers had 3·72 acres. Probably, then, the census figure of cultivating labourers represents completely landless labourers and those whose holdings were so small as to arouse no pretensions to membership of livelihood class I (cultivating owners).
All these surveys indicate that (1) About half the rural population of
Bombay State consists of persons who own the land they cultivate (livefihood class I).
(2) Cultivating labourers' (livelihood class III) do not comprise more than one-fifth of the rural population.
These two facts are of great economic and social importance.

APPENDIX C
++++++++++++++++++++++++++++++++++++++++++++++++++++++++++++++++++++++
BIRTH AND DEATH RATES ++++++++++++++++++++++++++++++++++++++++++++++++++++++++++++++++++++++
For the past eight years a Health Unit has operated in 250 square miles of Sirur taluka in Poona district. It overchecked the births and deaths recorded under normal registration. The area cannot be regarded as typical of all rural, areas of Bombay State nor is there any guarantee that the figures are completely
authentic. However the level of births and deaths registration as corrected for omissions is probably as high there as any where in the State. 1931, 1941 and 1951 census figures have been used to estimate the mid-year population figures of the area with results as· shown below;-
SiTur Health Unit
Mid-year Year. estimated Births.
population. Deaths. Birth rate. Death rate. Survival rate.
2 3 4 5 6 7
1931 34,233 1,774 1,089 51'82 31'81 20°01 1932 34,658 1,643 848 47°41 24°47 22°94 1933 35,083 1,577 994 44°95 28°33 16°62 1934 35,508 1.500 948 42°24 26°70 15°54 1935 .. 35,933 1,668 1,075 46°42 29°92 16°50 1936 36,358 1,590 1,196 43°73 32°90 10 °83 1937 36,783 1,201 969 32°65 26°34 6°31 1938 37,208 1,641 832 44-10 22°36 21 °74 1939 37,633 1,612 794 42°83 21°10 21 -73 1940 311,058 1,529 769 40-18 20°21 19°97 1941 38,585 1.785 952 46°26 24-67 21°59 1942 39,433 1.700 1,071 43°11 27°16 15°95 1943 40,281 1,836 856 45°58 21-25 24°33 ~944 _ .. C' 41,129 1.958 934 47°61 22°71 24°90 1945 41,977 1,790 1,189 42-64 28°33 14°31 1946 42,825 1,839 1,040 42°94 24-28 18°66 1947 43,673 2,076 1,339 47-54 30°66 16°88 1948 44,521 1,998 1,056 44°88 23°72 21 °16 1949 45,369 2,176 1,200 47°96 26-45 21 -51 1950 46,217 1,691 961 36°59 20-79 15°80
Applying the method of exhibition of the 3·3 we get the following ;-data adopted in Subsidary Tables 1· 3, 2· 3 and
SiTur Health Unit
Mean population of the decade. Growth. Growth rate. Birthso
1941-50. 1931--40, 1941-50. 1931--40. 1941-50. 1931--40. 1941-50_ 1931-40. I 2 3 4 5 6 7 8
42,613 36,250 8.480 4,246 19°90 11°71 18;849 15,735 A lBk) H 91-22

170 BIRTH AND DEATH RATES
Birth rate. Deaths. Death rate. Decennial increase. Migratltn-cum-Registration " error.
1941--50. 1931--40. 1941--50. 1931--40. 1941--50. 1931--40. 1941--50. 1931--40. 1941--50. 1931--40. 9 10 II 12 13 14 15 16 17 18
----------------44'23 43'41 10,598 9,514 24'87 26'25 19'36 17'16 +0'54 --5'45
An Experimental Census of Births and Deaths carried out late in 1952 in l/IOth of the households in sixteen talukas from five districts of Bombay State suggested that 14·2 per cent of the births and 13·6 per cent of the deaths were omitted from normal registration. The older
the deceased the better the chance of the death being registered. Due to lack of time it has not been possible to include a full analysis of the results of the Experimental Census in this volume.

APPENDIX D
INDEX OF NON"AGRICULTURAL OCCUPATIONS
BOMBAY, SAURASHTRA AND KUTCH

172 c··
Croup Code No.
1
0'11 0'12 0'10
0'21 0'22 0'23 0'20
0'30
0'31
0'40
0'41 0'42 (}'43
0'5
0'60
0'61
1'0
I'J
1'2
1'33 1'34 1'30
1'4
I'S
1'6
1'7
INDEX OF NON-AGRICULTURAL OCCUPATIONS
Bombay, Saurashtra and Kutch. Occupation.
Persons.
2
Division 0: Primary Industries not elsewhere specified
0'1 Stock Raising
3
Herdsmen and shepherds Breeders and keepers of caule and buffaloes
... 53,776 58,417
Breeders and keepers of other large animals including transport animal.
O' 2 Rearin,q of small animals and insecls
Poultry farmers Bee keepers Silkworm rearers ... Rearers of other small animals and inlectl
0'3 Plantation Industries
All other plantations but not including the cultivation of special crops in conjunction with ordinary cultivation of field crops
(i) Tobacco plantation (ii) Vegetable gardening ... • .. (iii) Melon growers and other fruit plantation ...
Tea plantation
o . 4 F oreslry and collection of producb nol .lmchere specified
Planting, replanting, conservation of (including forest officers, rangers and and cow-dung collectors .. .
Charcoal burners .. . Collectors of forest produce and lac ... Woodcutters !..
foresls guards)
Hunting (including trapping and Came Propa2ation)
Fishing in sea and inland waten including the opera-
621
442 195
6 397
288 7,830
188 2
8,118 6,836 2,021
14,427
740
tion of fish f.rms and fish hatcheries ... 55,235 Catherers of chanks and pearls 13
Division 1 : MiniDIl' and QuarryiDIl'
Non-metallic mining and quarrying not otherwise classified-including mining and quarrying of such materials as precious and semi-precious stones, asbestos, etc.
Coal mining
Iron ore mining
I '3 Metal milling except iron ore mining
Manganese mining .. . Tin and wolfram mining .. . Other metallic minerals
632
92
17
2,266 66
365
50
Males.
04
50,135 53,722
604
263 6,970
174 I
7,679 6,062 1,706
13,050
635
48,722 10
568
92
16
1,765 66
331
41 Crude Petroleum and Natural gas
Stone-quarrying, clay and sand pits 16,497 14,634
Mica 7 7
Salt, saltpetre and saline substances 11,197 10,206
Females.
5
3,641 4,695
17
87 9 2
13
25 860
14 I
439 774 315
1,377
105
6,513 3
64
501
34
9
1,863
991
I - .. ,.,
Total for the State.
Persons.
6
42,456 24,629
509
438 189
6 397
288 3,416
188
7,976 6,618 1,845
13,675
738
52,550 13
284
87
II
2,265
141
34
12,684
7
5,766
Miles.
7
39,474 22,270
508
352 183
4 384
263 2,999
174
7,568 5,896 1,583
12,454
633
46,320 10
278
87
II
1,764
130
34
11,008
7
3,513
Females.
8
2,982 2,359
86 6 2
13
25 417
14
408 722 262
1,221
105
6,230 3
6
501
II
1,676
253
Bomba,
Creater Bombay
Males.
9
1 2,232
492
3 I
163
14
55 87 I
65
4,974 8
1,888
I
1,009
Female.
10
04 5
3
905 3
318
20

State.
Bombay Cujarat Division.
Males. Females.
II 12
----------
20,486 14,354
259 140
221
263 2,222
35
1.199 1,523
733 4.802
11
5,199 1
171
58
1.764
95
27
886
934
1.510 1,719
46 3
13
25 230
7
57 77
132 265
566
501
11
222
169
INDEX OF NON-AGRICULTURAL OCCUPATIONS
~
, Bombay Deccan
Northern Division.
Males.
13
11.503 2,835
16
79 II
265 139
1,624 286
87 2,460
SOl
3,542 1
47
28
6
5,053
Females.
14
885 274
33 1 2
32 7
33 10 17
293
61 ~
270
;
719
Bombay Deccan Southern Division.
Males. Females.
15 16
6,032 40B 1.188 262
9 3 19 I
33
716 35 21 17
210 43 1,232 98
35 10
436 17
932 83
3
Bombay Konkan Division.
Males, Females.
17 18
1.452 175 1.661 99
2 4 12 1 4
465 151
3,974 250 3,979 604
552 70 3,895 542
85 34
32,169 4,472
59
II
35
2,249 334
6
3,566 64
Saurashtra State.
Persons,
19
7,632 27.628
31
4
4,281
2
45 218 87
324
1,993
329
.. 6
66 224
16
3,730
4,900
Males, Females,
20 21
7,182 450 25,735 1.893
18 13
3
3,866 415
39 6 166 52 63 24
292 32
1.872 121
271 58
.. 5
66 201 23
7 9
3,549 181
4,185 715
Kutch State.
Persons. Males. Females,
22 23 24
3,688 3,479 209 6,160 5.717 443
81 78 3
6 3 3
133 105 28
97 72 25
89 60 29 428 304 124
2 2
692 530 162
19 19
83 77 6
531 508 23
I
173
Croup Code No.
0'11 0'12
0'10
0'21 0'22 0'23 0'20
0'30(i) (ii) (iii)
0'31
0'40 0'41 0'42 0'43
0'5
0'60 0'61
I'D
1'1
1'2
1'33 1'34 1'30
1'4
1'5
1'6
1'7

174
Group Code No,
INDEX OF NON-AGRICULTURAL OCCUPATIONS
Bombay, Saurashtra and Kutch, Total for the State.
Persons,
Occupation, 1 __________________ ._1, __________________ _
Fe:~es'l 2
M~e.,
3 4
Penons. Males, Females,
6 7 8
Bombay
Greater Bombay,
M.les, Females,
9 10 ______ I-__________________________ i. ________________ I __________________________ __
2'OJ 2'02 2'03 2'00
2'11
2-12 2'13
2-21 2'22 2'23
2'31 2'30
2-41 2'42 2'43 2-40
2'51 2"50
2'61 2'62 2'63
2'71 2'72
2'73 2'74
2'75 2'70
2'81 2'82
Division 2 : Procel.ing and ManufactureF oodltuffs, TeKtiles, Leather and Products
thereof
2 '0 Food Industries otherwise unclassified Canning and preservation of fruits end vegetables __ _ Canning and preservalion of fish Slaughter, preparation and preservation of meat
(0 Bakeries and other food industries (ii) Sweetmeats and confectionery preparations
2 'I Grains and pulses Hand pounders of rice and other persons engaged in
manual dehu,king and Rour grinding Millers of cereals and pulses Grain parchers and makers of blended and prepared
Rour and other cereal and pulse preparations
2 '2 Vegetable oil and dairy product.
206 63
6,590 8,709 2,578
4,968 13,375
4,296
Vegetable oil pressers and refiners Manufacture of hydrogenated oils Makers of butter, cheese, ghee
19,559 2,405
anci"other dairy products (including milkmen) 16,495
2 '3 Sugar I ndusrri .. Gur manufacture 1,827 Other manufactures and refi ning of raw BUllar,
syrup and granulated or clarified sugar from sugarcane or from sugar beets 16,508
2 '4 B.verages Brewers and distillers Toddy drawers lee-manufacturers ... _.. _ .. Manufacture of aerated and mineral wate" and other
beverages
2 '5 Tobacco
301 199
1,654
3,222
Manufacture of bidis '" .. , ... 44,070 Manufacture of tobacco produclI such as cisarettes,
cigars, snuff, etc. 2,617
2 '6 Cotton textiles
Cotton ginning, cleaning and pre .. ini .. _ 14,785 Cotton spinning, sizing and weaving ,.. _.. 562,674 Cotton dyeing, bleaching, printing, preparation lind
sponging 25,543
2 '7 Wearing apparel (except footwear) and made up textile goods
143 63
6,315 7,448 .2,397
4,520 12,601
3,721
17,993 2,225
15,357
1,577
15,443
300 193
1,611
3,154
34,257
2,186
12,247 518,878
23,933
Tailors, milliners, dress makers and darners _ .. 100,355 92,721 Manufacturers of hosiery, embroiderers, makers of
crepe, lace and fringes 4,388 3,652 Fur dressers and dyers .. , .. _ 367 361 Hat-makers and makers of other articles of wear from
textiles .. ' .. ,... 741 710 Manufacture of house furnishing textiles ,.. 1,081 999 Makers of other made up textile goods including
umbrellas 1,740 1,577
2 '8 Textile Industries otherwise unclassified
Jute pressing, baling, spinning and weaving Woollen spinning and weaving .. ,
2,645 9,685
2,607 8,141
63
275 1,261
181
, 448 '774
575
1,566 180
1,139
250
1.065
I 6
43
68
9,813
431
2.538 43,796
1,610
206 63
6,307 8,131 1,358
4,425 11,569
4,214
15,503 2,025
16,309
1,755
16,395
282 194
1,480
3,007
37,193
2,585
13,436 527,921
22,883
143 63
6,055 6,911 1,268
4,058 10,843
3,641
14,182 1,878
15,195
1,509
15,333
281 193
1,440
2,942
27,802
2,168
10,995 486,813
21,532
7,634 86,466 79,988
736 3,640 3,136 6 367 361
31 725 695 82 1,081 999
163 1,690 1.542
38 1,544
2,630 8,955
2,593 7,690
63
252 1,220
90
367 726
573
1,321 147
1,114
246
1,062
I I
40
65
9,391
417
2,441 41,108
1,351
117 12
1,734 3,874
1,994 503
383
2,330 1,466
7,381
36
6 16
488
I,ISO
3,994
967
849 199,082
8,978
6,478 21,283
504 1,825 6 137
30 304 82
148 1,064
37 1.265
298 1,459
59
31 347
47 26
21
116 135
61
10
24
2,091
86
281 15,966
352
1,061
172 3
3
24
22 84

State, ~
Bombay Cujarat Bombay Deccan Division, Northern Division,
-Malel,
II
13 825 616 300
MD 3,371
1,071
5,155 100
1,138
36
49
5 104 423
SM
10,567
7el
5,720 169,221
9,698
23,4e8
723
135 365 , ..
2,260 128
Females,
12
31 51 11
127 180
55
348 2
162
1
I , 7
'07
147
777 10,004
783
Males.
13
25
2.511 1,061
893
7M 3,972
785
5,068 288
4,587
Females.
14
142 133 64
40 293
112
559 9
673
1,375 239
14,311 1,035
248
287
666
J
20
7,522 4,739
392 179
1,649 274 72,254 7,041
1,903 130
2,742 21,601 1,568
251 247 60 2 127
19
IJ
S 15
154 414
171
23 24
36
17 3 1,998 '2!J6
INDEX OF NON-AGRICULTURAL OCCUPATIONS
Bombay Deccan Southern Division.
Males.
15
38 532 325
572 1,209
927
98B
107
18
922
22 20 58
las
Females,
16
36 60
71 81
195
242
25
24
4
3
3,~"2 884
9 2
2,458 993 36,573 6,800
470 63
Bombay Konkan Division,
Males. Females.
17
453 1,035
75
24 1,788
475
541 24
1,982
80
15
53 184
m
18
3
12 629
15
82 1~6
190
56 1
193
4
14
II
2,377 770
19 3
319 116 9,683 1,297
483 23
Saurashtra State.
Persons.
19
257 578 969
508 1,584
80
3,691 380
85
72
102
19 5
147
177
6,022
21
1,214 31,795
2,007
Males,
20
234 537 896
462 1,549
78
3,475 347
83
68
100
19
146
175
Females.
21
23 41 73
46 35
2
216 33
2
2
5 I
2
5,635 387
14 7
1,150 64 29,468 2,327
1,878 129
8,297 6B6 5,319 421 12,516 11.642 874
205 17 136 4 719 504 215 31 I
31 187
67
35
72
66
71 33
146
4 4
3
II 7 7 1,313 678 2.792 222
8
50
6 616
a
35 15
5 I 396 220
Persons,
22
26
251
35 222
2
365
102
11
27
38
855
11
135 2,958
653
1,373
29
8
9 114
Kutch State.
Males.
23
26
233
209
2
336
79
10
25
37
820
4
102 2,597
523
Females,
24
18
35 13
23
2
175
Croup Code No.
2'01 2 '02 2 '03 2 '00(i)
(i1)
2 '11 2'12
2 '13
2 '21 2'22
2'23
2'31
2'30
2'41 2'42 2 '43
2'40
35 2 '51
7 2 '50
33 2'61 361 2 '62
130 2 '63
1,091 282 2 '71
12 17 2'72
7
9 55
2 '73
2'74 2'75
2'70
2 '81 59 2 '82

176 INDEX OF NON-AGRICULTURAL OCCUPATIONS
Group Code No.
I
2'83 2'84 2'85 2'86
2'80
2'91 2'92
2'90
Occupation.
2
Silk reeling, spinning and weaving Hemp and flax ~pinning and weaving Manufacture 01 rayon
I
Manufacture of rope, twine, string and other related goods from cocoanut, aloes, straw. linseed and hair .. ' '" ...
(i) All other (including insufficiently described) textile industries, including artificial leather and cloth ...
(ii) Jari thread works
2'9 Leath", lealh" products and footwear
Tanners and all other workers in leather Cobblers and all other makers and repairers of boots,
shoes, sandals and clogs M.ken and repairers of all other leather products".
, Division 3 : Processing and ManufactureMetals, Chemicals and Products thereof
3'01
3'02 3'03 3 '04 3'05 3'06
3'31 3'32
3-33 3'34
3 '30
3'41 3'42 3'43 3'40
3'61
3'62 3'63 3'64 3-65
3'0 Manufacture of metal praduc" otherwiu unclallilied
Blacksmiths and other worken in iron and mlkers of implement., horseshoers , ..
Workers in copper, brass and bell metal Worken in other metal., locksmiths Cutlers and surgical and veterinary instrument makers Workers in mints, die sinkers, elc. ... Maken of arms, guns, etc., including workers in
ordnance factories ...
Iron and Steel (Basic manufacture)
Non-Ferrolll Metals (Basic manufacture)
3'3 Tramporl Equipment
Building and repairing of .hips and boals Manufacture, assembly and repair of railway equip
ment, motor vehicles and bicycles, railway fitters ... Manufacture of aircraft ... ... . .. Coach builders and makers of carriages, palki,
rickshaw, etc, and wheel wrights Manufacture of all other transport equipment
3'4 Eleclricnl mac!.inery, apparaluJ, appliancu and .upplies
Manufacture of electric lamps ... Manufacture of electric fans and other accessories ... Manufacture of dectric wire and cable ...
(i) Manufacture of electrical generating, transmis!ion and distribution apparatus, electriCiI household appliances elc.
(ii) Radio repairing
Machinery (ot her than electrical. machinery) including Engineering Workshops ...
3'6 Basic IndUJtrial Chemical., Fertiliser and Power Alcohol
Manufacture of basic industrial chemicals such as acids, alkali, salts ... .
Dyes, explosives and fireworks Synthetic resins and other plastic materials Chemical fertilisers Power Alcohol
Bombay, Saurashtra and Kutch.
Persons.
3
14.707 549 637
19,047
8,520 6,405
21,786
50,793 4,150
47,261 12,154 14,127
414 1,879
18,502
10,677
1,625
2,018
32,528 518
19 9,091
117 107 497
5,678 255
29,587
4,334 1,592
516 313 23
Males.
4
12,962 488 606
16,156
7,728 5,863
20,137
48,852 3,964
45,997 11,m 13,657
412 1,831
18,060
10,439
1,551
1,995
32,237 503
19 8,929
116 105 489
',550 250
29,093
4,084 1,516
463 300
22
Females.
5
1,745 61 31
2,891
792 542
1,649
1,941 186
1,264 359 470
2 48
442
238
74
23
291 15
162
1 2 8
128 5
494
250 76 53 J3 1
Total for the
Persons.
6
14,165 549 637
18,498
7.979 6,405
13,193
43.962 3,584
40,806 9,90[
13,986 414
1,877
18,498
10,2[0
1,359
2,018
32,528 518
19 7,968
117 107 497
',536 255
28,211
3,399 1,533
499 254 23
Males.
7
12,494 488 606
15,747
7,233 5,863
12,101
42,179 3,456
39,680 9,592
13,522 412
1,829
18,056
9,992
1,291
1,995
32,237 .503
19 7,818
116 105 489
5,412 250
27,726
3,240 1,457
446 246 22
I'
State.
Females.
8
1,671 61 31
2,751
746 542
1,092
1,783 128
1,126 309 464
2 48
442
2[8
68
23
291 15
150
I 2 8
124 5
485
159 76 53 8 1
Bombay
Greater Bombay.
Males.
9
8,657 I
203
336
1,429
2,6#
5,973 1,838
8,934 1,858 6,933
288 1,311
261
6,931
795
1,970
20,843 365
116 105 489
4,788
16,884
1,091 421
141 8
Females.
10
627
26
55
223
119
84 52
123 80
222 2
28
30
146
38
22
169 12
I 2 8
111
282
119 54
.2

INDEX OF NON-AGRICULTURAL OCCUPATIONS
State.
Bombay Gujarat Division.
Males.
II
789 4
56
491
3,906 5,863
4,362
11,903 272
11,824 1,668 1,428
64
14
1,934
55
3
870 16
4,478
519 7
2,137
1,880 93
" 14
Females.
12
107
235
235 542
472
480 31
412 24 75
23
36
7
30
9
46
14 6
-Bombay Deccan
Northern Division,
Males. Females.
13
201 481 .
12,505
1,098
1,971
17,889 521
11,614 3,230 3,133
48 324
15,807
945
218
18
4,222 91
2,700
74 162
5,389
27 869
11 87
14
83 61
1,454
131
262
779 16
350 96 95
341
17
14
" I
52 3
48
3
65
1 13 5 4
MD-A BkH91-23
Bombay Deccan Bombay Konkan Southern Division. Division.
Males. Females. Males. Females.
15 16
1,703 820 2
1,478 431
715 156
2,855 226
3,683 354 746 26
4,490 159 1,443 45
826 25 7
65
159
4,502 27
419 2
23 8
437 5
17
1,144
347
937
85
269
2,731 79
2,818 1,393 1,202
5 194
1,974
117
64
4
1,800 31
19 221
8 73
2,879
242 74
435 7
18
34
5
576
13
86 3
82 64 47
20
48
18
16
36
70
1 4
87
25 3
48 I
Saurashtra State.
Persons.
19
539
247
541
6,129
6,192 394
5,344 2,027
132
2
4
467
266
1,083
131
1,285
935 59 17 59
Males.
20
467
237
495
5,767
6,044 374
5,251 1,989
126
2
4
447
260
1,071
127
1,276
844 59 17 54
Females.
21
72
10
46
362
148 20
93 38 6
20
6
12
4
9
91
5
Kutch State.
Persons. Males. Females.
22 23 24
3 2
302 172 130
2,464 2,269 195
639 629 10 172 134 38
1,111 1,066 45 226 214 12
9 9
40 40
" 11
91 91
177
Group Code No.
2'83 2'84 2'85
2'86
z.sO(i) (ii)
2'91
2'92 2'90
3-01 3-02 3'03 3'04 3'05
3'06
3 '1
3'2
3'31
3'32 3'33
3'34 3'30
3'41 3'42 3'43
3 '40(i) (ii)
3'5
3'61 3'62 3'63 3'64 3'65

178
Group Code No,
3'81
3 '82 3'83 3'84 3'85 3'86 3'80
4'01
4'02 4'03 4'04
4'05 4'06
4'07
4-08 4'09 "'00
HI 4062 4'63
4'64 4'60
INDEX OF NON-AGRICULTURAL OCCUPATIONS
.,
Bombay, Saurashtra and Kutcn. Total for the State. Occupation.
2 I
MediCllI and Pharmaceutical preparations
3'8 Manufacture of chemical products cthawise unclassified
Manufacture of perfumes, cosmetics and other toilet preparations ... ... ...
Soaps Bnd other washing and cleaning compounds ... Paints, varnishes and lacquers and polishes Ink Matches Candles Other chemical products
Division 4: Processing and ManufactureNot elsewhere specified
4'0 Manufacturing Indmtri,s otherwise unclalji/ied
Manufacture 01 professional scientific and controlling instruments
Plwtographic and optical goods ... Repair and manufacture of watche~ and clecks Workers in precious stones, precious metals and
makers of jewellery and ornaments ... Manufacture of musical instrllments and appliances .. Stationery articles other than paper and poper
prodl1cts ...... Mnkers of plastic and celluloid articles other than
rayon Sports goods makers Toy makers Other miscellaneous manufacturing industries,
including bone, ivory, horn, shell, etc.
4'1 Products of p~troleum and coal
Persons.
3
4,465
1,477 5,920 2,663
272 2,394
86 4,189
235 571
3,497
47,247 512
544
1,939 97
1,365
8,120
Males.
4
4,093
1,202 5,226 2,523
247 2,269
85 3,822
231 555
3,466
46,337 489
518
1,883 97
1,237
7.498
Kerosene and petroleum refineries 183 177 Other manufacturers of products from petroleum
and coal 955 909
Bricks, tiles and other structural clay products 15,603 12,156
Cement-Cement pipes and other cement products... 5.529 5,243
4'4 Non-metallic min~ral prodUC!J
Potters and maker~ of earthenware Makers of porcelain and crockery Gloss hangles, glass beads. glass necklaces, etc. M.kers of other glass and crystal ware ... Makers of other miscellaneous non-metallic mineral
products, burning lime for construction of buildings
Rubber products
4'6 Wood and wood products other than furniture and fixtures
44,437 2,081 2,306 2,874
2,051
3,154
Sawyen ... 6,708 Cnrpenters, turnm and joiners ... ... 110,248 Veneer and plywood makers, match veneer and splint.
makers Basket makers ... ...
576 17,512
Other industries or woody materials, includini' leaves, but not including (urniture or fixtures ... 6,535
Furni!ure and fixtures
Paper and paper products
6,873
2,932
39.723 1.925 2,121
2,622
1,682
2,968
6.403 108,424
548 13,500
5,404
6,564
2,609
Females.
5
372
275 694 140 2S
125 1
367
4 16 31
910 23
26
56
128
622
Persons.
6
4,425
1,393 5,338 2,562
272 2,313
68 4,143
126 493
3,223
40,201 445
478
1,906 92
1,239
6,393
6 183
46 734
3,447 15,324
286 5,105
4,714 156 185
252
369
186
305 1,824
28 4,012
1,131
309
323
32,942 1,530 2,227 2,874
1,692
2,934
6,431 96,631
459 16,906
6,065
6,316
2,849
Males.
7
4,053
1.122 4,697 2426 247
2,231 68
3,m
122 479
3,195
39,383 422
452
1,862 92
1,117
5,847
177
689
11,879
4,869
29.255 1,434 2,051
2,622
1.373
2,759
6,170 95,061
438 12,987
4,993
6,007
2,526
Females.
8
372
271 641 136 25 82
366
4 14 28
818 23
26
44
122
546
6
45
3,445
236
3,687 96
176 252
319
175
261 1,570
21 3,919
1,072
309
323
Bombay
Greater Bombay.
Males.
9
2,140
597 2,784 1,252
180 139
1.996
70 283
1,357
6,624 146
374
1,862 ;0
416
2,741
142
173
1,702
674
50B 563 609
2,531
154
2,225
1,259 21,259
24 355
1,461
2,400
1,252
Females.
10
270
29 176 63 24 8
208
3 2
10
73 3
18
44
42
193
2
20
450
36
77 57 38
242
15
93
15 166
152
125
72
152

INDEX OF NON-AGRICULTURAL OCCUPATIONS
v State. 41
Saurashtra State. Bombay Cujarat Bombay Deccan Bombay Deccan Bombay Konkan
Division. Northern Division. Southern Division. Division.
Males. Females. Males. Females. Males. Female •. Males. Females. Persons. Male •. Females.
II
935
21 1,077
414 5
934
50 99
818
11,794 128
1
42 60
1,921
353
5,146
2,a31
14,925
324
220
177
490 24,080
3,990
1,668
823
837
12
7
" 42B 40
76
5 2
13 14
364 71
256 181 467 21 197 6 35 I 19 I 22
295 IS
2 49
539
1 6 5
129 11,190 263 4 70 I I
8
183
21
1,580
182
1,369
44
37
40
585
759
18
41
8
55
79
tP
4
2,154 430
130 5
8,873 1,149 867 39 495 47
3 I
372
160
48
58
15
167 181 22 17
141
29 151
16
56 4 4
17
5,454 186 35 2
3
7
204
308
62
3,275 4
107
10
35
69
6
6111
j'j
362 126
5
17
614
81 188 541
10 2,073
46 411
19 330
4,321 43
26
49
222
17
122
18
24
I 12 23
73
50
I
" 167 3
7
56
3
19
37
82 558 99
81 18 43
108 75
245
6,024 67
66
33 5
119
1,398
2,569 916
221
269
408 1,172
1,674
516 88
265
192
7
411 10,084 551
36 76 9
93
24
316
Zl9
20
37
78 509 95
38 17 42
108 73
243
5,949 67
66
21 5
liS
1,335
220
268
358
9,338 491 67
266
208
21
4 49 4
43 I I
2 2
75
12
4
63
50
746 60 9
50 '
II
28 1.730 84 1.136 33 1,555 lOJ 70 34 36 535 28,982 436 10,578 243 10,162 190 11,533 11,324 209
414 21 106 100 6 729 4,437 1,013 2,567 952 1.638 1,073 580 492 88
374 1,174 267 259 187 431 119 467 408 59
50
93
1,166 107
265 58
163
4
2 1,455
168
78
20
521
83
521
83
MO-A H 93-23a
Kutch State.
Persons.
22
3
2 24 2
3
I 3
29
1,022
7
329
10
16
1,411
3
43
207 2,084
11 26
3
36
Males.
23
3
2 20 2
3
1 3
28
1,005
5
316
9
16
1,130
3
43
199 2,039
10 21
3
36
179
Croup Code ,No.
Females.
24 I
3'111 4 3'82
3 '83 3'84 3 '85 3'86 3'80
4'01 4'02 4'03
17 4'04
2
13
4'05
4'06
4'07 4'08 4'09
4'00
251 ·4'41 4'42 4'43 4'44
4'40
~'5
8 4'61 45 4'62
1 4'63 5 4'64
4'60
4.7
U

180 INDEX OF NON-AGRICULTURAL OCCUPATIONS
. Bombay Group
Bombay, Saurashtra and Kutch, Total for the State. Code Occupation. Greater Bombay. No.
0 Persons. Males, Females. Persons. Males. Females. Males. Females.
I 2 3 4 5 6 7 8 9 10
4'9 Printing and Allied Tndustries 28,696 475 4'91 Printers, lithographers. engraven 28,221 27.172 26,738 434 14,780 169
4'92 Bookbinders and stitchers 3,100 3,007 93 3,003 2,930 73 1.835 34
Division 5 : Construction snd Utilities 5'0 Construction and maintenance of works-otherwise
unclassified 5,301 5,028 273 4,553 4,309 244 1.370 78
5 'I Construction and maintenance-Buildings 5'11 Masons and bricklayers 81,163 73,528 7,635 70.416 64,170 6,246 5,929 147 5'13 Painters and decorators of house 8,837 8,49;3 344 8,646 8,304 342 4.671 82 5'10 Other persons engaged in the construction or main-
tenance of buildings 26.580 20,192 6,388 25,694 19,334 6,360 9,594 1.633
5'2 Construction and maintenance-Roads. Bridges and 1.082 other Transport Works 16,096 15.014 14,773 13,926 847 396 53
5'3 Construction and maintenance-Telegraph and Telephone lines 355 282 73 328 261 67 135 1;
5'4 Construction and maintenance operations-Irrigation and other agricultural works 11,635 10,596 1.039 11.025 9.999 1,026 7
S'5 Wotbs and Setvices-Eleclric Power and Gas supply
5'51 Electric supply 10,314 10,140 174 9,104 11,947 157 1,766 22 5'52 Gas supply 1,333 1.312 21 1,333 1.312 21 1.276 11
5'6 Works and Services-Domestic and Industrial water supply 5,260 4,883 377 5,038 4,663 375 710 9
5'7 Sanitary Works and Services-Including ~cavengers .. 24,389 17,784 6,605 21.958 16,148 5,810 9.353 2,258
Division 6 : Commerce 6'0 Retail trade otherwise unclas,;foed
6'01 Hawkers and street-vendors otherwise unclassified ... 32,439 29,443 2.996 28,262 25,617 2,585 12,236 962 6'02 Dealers in drugs and other chemical stores 8.575 8,182 393 7,962 7,581 381 3,121 179 6'03 Publishers, booksellers and stationers 11,438 11,045 393 11,170 10
1782 388 2,894 57
6'00 General storekeepers, shopkeepers and persons employed in shops otherwise unclassified 191.261 180,861 10,400 157,191 • 148,630 8.561 53,975 1.911
6 'I Retail trade in foodstuffs (including beverages and narcotics)
6'11 Retail dders in grain and pulses; sw~et-meats. sugar and spices, dairy products, eggs and poultry; animals for food; fodder for anim,I.; other foodstuffs; vegetables and fruits .. , 283,304 249,836 33.468 248,692 217.526 31.166 40.700 4.289
6'12 Vendors of wine, liquors. aerated waters and ice in shops 4.107 4,030 77 3,808 3.738 70 1,125 13
6'13 Retail dealers in tobacco, opium and ganja 4,715 4,398 317 3,883 3,582 301 779 39 6'14 Hawkers and street-vendors of drink and foodstuffs ... 14,859 13,541 1.318 14,417 13,104 1.313 7,891 854 6'15 Retail dealers in pan, bidi. and cigarettes 38,077 36.378 1,699 31.779 30,203 1,576 9.977 420
6'2 Retailtrale in fuel (incl"lin.q pelro!) 6'21 Petroleum distributors 6,652 6,4% 156 6.438 6,289 149 4.541 90 6'20 Retail dealers (including hawkers and street-vendo;~j
in firewood charcoal, coal. cow-dung and all other fuel except petroleum 30,815 26,682 4.133 27.407 24.309 3.098 6.471 283
6'3 Retail trade in textile and leather goods 95,733- 93.603 2.130 84.738 82.780 1.958 21.247 349
6'4 Wholesale trade in foodstuffs 18,917 17,824 1,093 17,587 16,521 1,066 3,775 324
6'5 Wholesale trade in commodities other than foodstuffs 70,359 67.887 2,472 68,465 66.022 2.443 53.022 1.910
6'6 Real Estate 3,366 2,998 368 3.008 2,766 242 2.399 40
6'7 Insurance 10,634 10,239 395 9.716 9,430 286 6.769 191
6'8 Moneylending, bankinll and other financial busines .... 62,329 60,529 1.800 57.021 55.599 1,422 18,209 539

INDEX OF NON-AGRICULTURAL OCCUPATIONS 181
State. II - 1,--·----,-------'1-
Bombay Gujarat Division.
-~---------------, Saurashtra State'. Kutch State. Group Bomb:y Deccan Bombay Deccan Bombay Konkan I Code
Northern Division. Southern Division. Division. No. ------- --------
Males, Females. Males. Females. Males. Females. Males. Females. Persons, Males, Females, Persons, Males, Females,
II 12 13 14 15 16 17 18 19 20 21 22 23 24
------------------·----·------------------'--------------[---------------1.----3,001
424
1,752
17,223 644
835
4,162
31
4,927
1,862
121
1,640
6,772 1,550 1,941
44,068
75,115
376 615
1,801 8,038
441
6,394
27,855
1,625
3,622
35
1,076
16,673
48 5
78
6,687 496
595
81 28
84
926 114
184
13 4
2,187 24,184 2,320 12,582 1,301 28 1;588 152 369 II
2,529
277
49
618
19
2
6,381 1,326
4,373
77
3,525
2,553 13
132
3
87
75 I
2,409 338
1,199 3,058 1,525
511 4,133 691 34 1,694 133 28 3,451 153
2,538 28,391 2,1m!
8,585
8 27
134 193
Hi
55,609 8,223
681 34 1,384 117 2,274 253 6,193 534
609 24
437 6,835 969
609 19,402 634
51 6,595 345
37 6,146 372
96
21
415
258
642
9,801
68
40
245
895 434
1,389 90
16
1,502 319
456 3
71 2
1,047 626
538 325 574 II
1,260 89
10.367 1,098
23,781 5,805
1.314 12 331 103
70 3 2,822 295
205 4
2,009 662
8,298 201
3,085 87
1,278 40
150
6,007
13
130
1,344 61
408
123 2
3
4,252 291 1,032 69
1,629 438
3,606 295
2
38
2,310 23
2
38 9
24
1,460 96
652
8,167 155
673
708
19
506
1,129
147 1,352
1,050 202 2,227
1,998 642
1,230
96 3,785 24 556 61 261
11,829 826 33,163
22,321 4,264
242 3 473 10
1,068 69 3,173 134
493 21
26,048
298 727 417
5,623
206
2,600 747 2,576
5,978 165 10,022
1,441 259 1,312
1,954 84 1,585
73
793
4,909
25
33
93
358
894
4,641
1,421 76
625
39 20
27
7,671 495 154 I
646 27
589 119
13 6
493 13
1,112 17
146
1,493 734
3,427 358 545 11 256 5
31,369 1,794
24,415 1,633
291 7 715 12 412 5
5,510 113
199 7
1,973 603
9,859 163
1,285 27
1,561 24
232
785
126
[09
4,326 315
64 I
96
62 I
94
2 4'91 4'92
2 5'0
2,580 1,687 893 5'11 36 . 35 1 5'13
213
615
8
104
81
75
204
392 57 7
907
8,564
I 105 25
675
8
832
1973
[8
309
24
667
212
499
8
104
81
74
143
339 56 7
862
7,895
I 101 25
665
8
5'10
116 5'2
5'3
5'51 5'52
5'6
61 5'7
53 6'01 I 6'02
6'03
45 6'00
669 6'11
6'12 4 6'13
6'14 10 ·6'15
6'21
400 432 6'20
964 9 6'3
18 6'4
304 5 6'5
24
604
6'6
6'7
63 6'8

182 INDEX OF NON-AGRICULTURAL OCCUPATIONS
iI' Bombay
Group Bombay, Saurashtra and Kutch, T olal for the State, Greater Bombay, Code Occupation, No,
Persons, Males, Females, Persons, Males, Females, Males, Females,
I 2 3 4 5 6 7 8 9 10
Division 7: Transport, Storale and Communications
7'0 T ranspor! and communications otherwise unclanified 8nd incidental.ervice. 2,841 2,708 133 2,363 2.249 114 1.989 88
7') Transport by road 110,477 106,677 3.800 99578 96.002 3.576 33.982 592
7'2 T I'Ilnspor! by water 59,133 57.366 1.767 51.039 49.763 1.276 36.962 601
7'3 T I'Ilnsport by air 3.171 3,074 97 2,986 2,892 94 2,534 91
7 '4 Railway transport 7"41 Railway employees of all kinds not otherwise classified 92.319 90.328 1.991 81.415 79.701 1,714 20.742 321 7'42 R.ilway hamals (Porters} .. , .. , .. , 9.451 9,222' 229 9,451 9,222 229 3,945 103
7'5 Storage and warehousing 4,772 4.313 459 4.720 4,261 459 2.835 417
7'6 Postal Services 19.119 18,549 570 17,373 16,829 544 5.965 216
7'7 Telegraph Services 3.601 3.467 134 3,347 3,217 130 1.783 77
7'8 Telephone Services 2.801 2,427 374 2,589 2,218 371 1.657 315
7'9 Wireless Services 440 426 14 404 390 14 161 3
Division 8 : Health, Education and Public Admini.tration
8'1 MeJical and other Health Services 8'11 Registered medical practitioners .. , , .. 13,194 12,061 1.133 12.052 10,956 1,096 2,585 361 8'12 Vaids, Hakims and olher persons practising medicine
without heinlfTegistered .. , 5,425 5,198 227 4519 4.318 201 663 36 S'13 Dentists .. , 513 501 12 363 352 11 196 8 8'14 Midwives 1,085 35 1.050 724 29 695 13 186 8'15 Vaccinators 682 673 9 506 499 7 38 3 8'16 Compounders 6.244 6.122 122 5,428 5,316 112 1.632 36 8'17 Nurses 5.786 23) 5551 5,534 222 5.312 59 2,400 S'18 Assistant veterinary surgeons '" .. , 278 262 16 261 245 16 7 S'IO All other persons employed in hospitals or other "'-public or private establishments rendering medical
or other health services; but not including scaveniers or other sanitary staff 14,005 10,935 3.070 12,574 9,615 2,959 4.214 1.436
8 '2 Educational SerVices and Research 8'21 Professors. lecturers. teachers and research workers
employed in Universities. Colleges and Research 5.880 4,994 886 4,857 Institutions .. , '.. '" 5.688 831 1,923 444
8'22 AU other profe •• ors. lecturers and teachers .. , 103,324 85,280 18.044 93.521 77.340 16.181 5.843 3.373 8'20 Managers. clerks and servants of educational and
research institutions, including Libraries and Museums. etc, 10.982 9,063 1.919 9.826 8.186 1.640 2,550 517
8'4 Police (other than village watchmen) .. , 67.672 66,632 1,040 57.577 56.685 892 11.108 209
8'5 Village officers and servants, including village watchmen 29,509 28,618 891 23.342 22,5~4 808 242 6
8'6 Employees of Municipalities and Local Bodies (but not including persons classifiable under any other
45,549 division or sub-division) 57,884 49,865 8.019 52.672 7,123 13,597 1,281
8'7 Employees of State Governments (but not including persons classifiable under any other division or sub-division) 136,180 131.679 4.501 123,171 118,957 4.214 14,832 1,337
8'S Employees of the Union Government (but not including persons classifiable under any other
65,305 63.691 60,796 division or sub-division) .. ' 1,614 62,350 1,554 14.715 511
8'9 Employees of Non-Indian Governments 699 620 79 635 590 45 172 26

INDEX OF NON-AGRICULTURAL OCCUPATIONS
State. D
-Saurashtra State.
BomblY Cuiarat Bombay Deccan Bombay Deccan Bombay Konkan Northern Division. Southern Division. Divi;ion. Division.
M.les.
11
219
22,981
3,708
114
20,390 1,751
224
3,877
137
98
5
4,546
478 8
35 1,712
108
753
861 22,755
1,387
16,775
5,332
Females. Malel. Female •.
12 13 14
26 40
2,123 21,946 392
65 420 2B
99
399 24,177 666 33 2,434 50
98
23
4
2B9
10.
178
1 769
413
104 4,677
168
343 27
3,839 14B
854
283
189
IB
34
10
2,263 332
1,841 109 100 I
16 153 196
1,104 62 27 1,464
136 15 ~
2,842 830
1,633 274 28,623 4,944
2,771 571
152 17,598 351
80 11,149 4M
Males. Females. Males. Females. Person •. Males. Females.
1) 16 17 18 19 20 21
420 401 19
8,127 178 8,966 291 9,223 9,027 196
109 22 8,564 560 6,707 6,245 462
2
4,110 422
331
1,144
208
44
15
614
821 36
89 453
18 71
795
143 2
45 10,282 283 14 670 29
5
13
3
528
2,004
235
136
20
31 948
24' 515 I 12
44 3 141 5 415
323 10 I 31
83 1,011
10
69
9
18
83
22 I
134 1 8
356
197
267 7 173 2 9,765 1,561 10,354 1,626
860 123 61B 261
5,501 36 5,703 144
4,269 169 1.542 69
168
9,708
17
1.406
245
211
17
976
819 145 201 162 685 236
15
1.243
IBI B,6&7
1,089
8,954
165 3
9,446 262
17
1.383
241
208
17
942
798 144
6 160 677
13 15
1.151
23
4
3
34
21 I
195 2 8
223
92
126 55 7,053 1,614
855 234
8,807 147
5,464 5,3B3 8)
11,827 2,975 12,567 2,071 3,551 387 4,007 409 5,007 4,171 B36
39,906
1.625
"
1,128 41.057 1,086 9,081 212 14,081 451 11,573 11,317 256
12 38.167 623 3,236 21 3,053 387 2,030 I,m 53
288 19 126 64 30 34
Persons.
22
5S
1,676
1,387
17
1,196
35
340
9
19
166
87 5
160 14
131 16 2
188
11 1,136
67
1.141
703
205
1,436
925
183
I Kutch State.
Croup Code No.
Males. Female •.
23
58
1.648
1,358
11
1,181
35
337
9
19
163
82 5
14 129
2
169
11 8S7
22
1,140
701
145
1.405
91S
24 I
1'0
28 7'1
29 1'2
1'3
15 7"41 1"42
7'S
3 7"6
3
5
160
2 16
19
249
7"7
7"S
7'9
S'II
8'12 8'13 8'14 8'15 S'16 8'17 S'18
S'10
S'21 S'22
45 8'20
8'4
2 8'5
1 8'S
S'9

184
Group Code No.
I
9'11 9'12 9'13 9'10
9'2
9'3
9'4
9'5
9'61
9"62 9"63
9"64 9"65
9'71 9'72 9'73
9'81
9'82
9'83
INDEX OF NON-AGRICULTURAL OCCUPATIONS ,
<!'
Bombay, Saurashtra and Kutch. Total for the State. Occupation.
2
Division 9 : Services not elsewhere specified
9' 0 Services otherwise unclassified
(i) Astrologers (ii) Mazdoors i.e. unskilled labourers (iii) Services unclassified ...
Persons.
3
.. , 1530
.. , 449,212 109,456
9'1 Domestic services (but not including services rendered by members of family households to one another)
Private motor drivers and cleaners Cooks Gardeners Other domestic servants
Barbers and beauty shops
Laundries and Laundry services
Hotels, ~estaurants and eating houses
12,805 28,666 11,285
169,056
63,621
33,744
127,502
. Males.
4
1,514 324,470 84,661
)2,707 23,784 10,3,0
120,m
62,375
29,741
122,739
Recreation services-Managers and employees of cinemas, musicians, dancers, acrobats, recitors, etc. 37507 34.342
9' 6 Lega I and business services
Lawyers of all kinds, including qazis,law agents and mukhtiars
Clerks of lawyers, petition writers, etc. Architects, Surveyors, Engineers and their employees
(not being State servants) Public scribes, stenographers, accountants, auditors ... Managers, clerks, servants and employees of Trade
Associations, Chamber of Commerce, Board of Trade, Labollr Organisation and similar organisation of employers and employees
9' 7 Arts, letlers and journalism
Artists, sculptors and image makers Authors, editors and journalists
. Photographers ...
9'8 Religious, Charitahle and Welfare Services
Priests, Ministers, Monks, Nuns, Sadhus, Religious mendicant.; and other religious workers
Servants in religious edifices, burial and burning grounds, pilgrim conductors and circumcisors, etc.
Managers and employees of organisations and institutions rendering charitable and othel welfare services
8,446 3,985
3,443 10,067
4,696
3523 2,050 1,337
37,142
12,613
3,204
8,330 3,768
3.387 9,089
4,527
3,398 1,966 1,310
33,422
11,492
2,832
Females.
5
16 124,742 24,795
98 4,882
935 48,083
'1,246
4,003
4,763
Persons.
6
1,494 349,964 86,434
12,154 26,811 10,719
158,883
53,388
31,437
119,830
Males.
7
1.483 257,869 66,031
12,056 22,440 9,845
114,716
52,363
27,812
115,235
3,165 34,475 31,445
116 217
56 978
169
12) 84 27
3,720
1,121
372
7,723 3,612
3,027 9,877
4,022
3,434 1,972 1,337
30,306
8,433
2,466
7,610 3,399
2,972 8,899
3,864
"'" 3,309 1,888 1,310
27,423
7,638
2,188
Females.
8
11 92,095 20,403
98 4,371
874 44,167
1,025
3,625
4,595
3,030
113 213
55 978
158
125 84 27
2,883
800
278
Bombay
Greater Bombay.
Males.
9
569 31,378 21,932
5,455 13,791 4,754
41,784
9,836
13,871
46,72)
13,777
1,656 989
1,966 7,989
1,400
1,568 1,134
530
3,700
1,211
865
Females.
10
4 5,863 2,010
33 1,342
215 19,501
104
444
1,799
1,270
23 101
45 944
30
64 60 13
122
65
125

State.
Bombay Gujarat Division.
Males.
11
573 116,843 17,544
2.447 3,509 1,152
25,974
15,867
3,859
22,290
4,992
2,067 232
142 42
221
1,002 46
102
11,877
2,181
259
Females.
12
4 46,650 2,604
2 524 190
6,71B
382
785
397
333
8 13
6
2
31
2
1,432
222
89
INDEX OF NON-AGRICULTURAL OCCUPATIONS
IW
Bombay Deccan Bombay Deccan Bombay Konkan Northern Division. Southern Division. Division.
Males. Females. Males. Females. Males. Females.
13 14 15 16 17 18
211 3 56 74 64,184 20,805 16.421 6,764 29,043 12,013 8,690 3,891 403 213 17,462 11,6B5
2,645 41 360 1,149 22 3,906 1,671 567 440 667 394 2,700 356 185 13 1,054 100
24,559 10,694 2,843 1,754 19,556 5,500
16,566 381 5,449 72 4,645 B6
5,868 1,343 2,501 888 1,713 165
23,037 1,222 11,589 627 11,594 550
7,412 999 3,398 300 1,866 128
2,655 76 752 3 480 3 1,050 66 572 23 556 10
556 7 47 261 3 384 8 66 13 418 7
1,544 93 185 6 514 27
y
515 ~ 10 48 IS 176 5 316 21 102 290 3 383 5 123 2 172 5
8,380 977 1,527 225 1,939 127
1,938 266 439 51 1,869 196
521 36 164 14 379 14
Saurashtra State.
Persons.
19
36 76,923 22,633
506 1,621
513 8,772
9,087
2,097
6,356
2,762
639 292
376 127
673
84 69
6,275
3,340
581
Males. Females.
20 21
31 5 54.150 22,713 18,246 4,387
506 1,204 417
460 53 5,445 3,327
8,878 209
1,795 302
6,217 139
2,671 91
637 2 289 3
376 , 127
662 11
B4 69
5,590 685
3,097 243
493 88
Kutch State.
Persons.
22
22,325 389
145 234
53 1,401
1,146
210
1,316
270
B4 81
40 63
5 9
561
835
157
Males.
23
12.451 384
145 140 45
B12
1,134
134
1,287
226
83 80
39 63
5 9
409
757
151
185
Group Code No.
Females.
. 24
9'0 (i) 9,874 (ii)
5 (iii)
9'11 94 9'12 8 9'13
589 9'10
12 9'2
76 9'3
29 9'4
44 9'5
9'61 9'62
9"63 9'64
9'65
9'71 9'72 9'73
152 9'81
78 9'82
6 9'83


SUBSIDIARY TABLES

188
State, Natural Division and District,
BOMBAY, SAURASHTRA AND KUTCH
Per cent
BOMBAY STATE Per cent
Greater Bombay Per cent
Bambuy GujaTa! Division Per cent
Banaskantha Percent
Sabarkantha Percent
Mehsana Per cent
Ahmedabad Percent
Kaira Percent
Panch Mahala Per cent
Baroda Per cent
Broach Per cent
Surat Percent
Amreli Per cent
Bombay D'eccan Northern Division Percent
West Khandesh Percent
East Khandesh Percent
Dang; Percent
Nasik Percent
Ahn::edllsgar Percent
POODS
rer cent Satara North
Percent Satara South
Percent Kolliapur
Percent Sholapur
Percent
SUBSIDIARY
Are; and Population, actual
No/e.-In this tahle the area figures supplied by Collectors and the Land Records Depar/ment have been made use
TalUKaS with
Under 100, 100-150, 150-200, 200-300,
Area, Population. Area. Population. Area, Population. Area, Population.
2 3 4 5 6 7 8 9
11,785 666,658 13,496 1,713,773 23,714 4,069,641 45,402 11,155,141
8'7 1'6 9'9 4'2 17'4 10'0 33'4 27'5
4,366 295,722 8,874 1,157,891· 18,439 3,199,574 40,323 9,954,661 4'0 0'8 8'1 3'2 16'9 8'9 36'9 27"7
1,307 114.476 2,682 338,893 3,554 609,152 10,297 2,544,928 4'2 1'0 8'6 3'0 11'3 5'3 32'8 22'3
834 109,435 1,778 294,529 1,159 271,419 20'9 14'6 44'6 39'3 29'1 36'2
153 21,376 1,401 353,051
84:425 6'3 3'1
45,69i 57'2 51'6
915 269 158 33,655 22'2 5'7 6'5 3'1 3'8 2'3
1,077 127,265 1,555 357,637 31'7 7'5 45'7 21'2
1,542 39{S96 44'1 34'S 939 244,105 ... 33'7 20'4
392 30,051 476 61,601 1,654 400,756 13'4 4'3 16'2 8'7 56'4 56'8
575 112,109 1,686 429,794 14'1 6'1 41'5 23'S
142 19,216 932 156,823 203 58,615 9'2 6'1 60'7 49'4 13'2 18'5
1,562 128,360 3,628 485,994 9,689 1,661,700 18,899 4,576,636 ~'S 1'0 8') 3'9' 21 '5 )3"4 42'0 37'0 904 81,078 1,682 231,857 1,423 388,242
16'7 7'1 31'1 20'2 26'3 33'9 250 45,766 1,378 355,597 5'6 3'1 30'8 24'2
658 47,282 100'0 100'0
79i:si'j 316 43,823 1,897 334,204 3,275 5"3 3') 31 '5 23'4 54'5 55-8 560 74,653 2,699 448,593 1,905 403,362 8'7 5'3 41 '7 31'8 29'4 28'6 196 27,391 2,066 373,458 3,178 775,391 3"3 1'4 34'3 19'1 52'8 39'7
556 83,478 2,114 517,461 13'8 7') 52'5 44'0
874 108,270 847 183,441 26'3 10'8 25'5 18'3
1,471 351,846 52'7 28'7
2,221 376,301 3,308 803,483 38'2 25'0 56'9 53'4

189
TABLE 1'1
and percentage, by taluka density
of III the Surveyor General of India wal unable to mpply area figUTes for the T uluk_as.
Density
300-450, 450-600, 600-750, 750 and over, State, Natural Division a nd District,
Area, Population, Area, Population, Area, Population, Area, Population,
10 " 12 13 14 15 16 17
27,248 9,587,199 8,799 4.521,368 2,075 1,385,235 3,491 7,562,100 BOMBAY, SAURASHTRA AND KUTCH
20'0 23'6 6'5 11'1 1'5 3'4 2'6 18'6 Per cent
23,422 8,182,297 8,455 4,339,749 1,893 1,264,156 3.491 7,562,100 BOMBAY STATE 21'4 22'8 7'B 12'1 1'7 3'5 3'2 21 '0 Per cent
91 2,839,270 Greater Bombay 100'0 100'0 Per cent
7,560 2,754,715 3,359 1,754,768 %2 638,864 1,634 2,640,993 Bomhag Gujarat Division 24'1 24'2 10'7 15'4 3'1 5'6 5'2 23'2 Per cent 215 73,413 Banaskantha 5'4 9'8 Per cent 894 309,590 Sabarkantha
36'5 45'3 Per cent 1,435 548,918 1,091 603,242 257 155,731 Mehsana 34'S 37'3 26'4 41'0 6'2 10'6. Per cent 334 130,928 327 147,740 108 922,060 Ahmedabad 9'8 7'S 9'6 8'8 3'2 54'7 Per cent 823 291,574 825 409,250 917 911,602 Kaira
32'1 18'1 32'2 25'4 35'8 56'S Per cent 1,779 663,484 178 89,052 Panch Mahals 50'8 57'8 5'1 7'7 Percent 1,376 485,241 209 116,472 263 348,928 Baroda 49'3 40'6 7'6 ~1 9'7 9'4 29'2 Per cent
160 62,949 253 150,678 Broach 5'5 8'9 8'6 21 '3
"705 45s;4iij Per cent
285 106,069 473 238,334 483,133 346 Surat 7'0 5'8 lJ'6 13'0 17'3 26'4 8'5 25'1 Percent 259 82,549 Amreli
16'9 26'0 Percent
6,915 2,415,214 3,451 1,741,117 235 169,700 614 1,186,014 Bombay Deccan Northern Division 15'4 19'5 7'7 14'1 0'5 1'4 1'4 9'6 Per cent 1,3% 444,847 West Khandesh 25'8 38'S Percent
2,192 756,401 648 313,587 East Khandesh 49'1 51'4 14'5 21'3 Percent
Danga Per cent
525 254,076 Nasik 8'7 , 17'8 Percent 1,30B 484,265 Ahmednagar
20'2 34'3 Per cent 515 180,653 68 594,083 Poona B'6 9'3 1'1 30'5 Percent 594 203,928 759 370.442 Satara North
14'S 17'4 18'9 31 '5 Per cent 692 248,741 912 459,689 Salara South 20'S 24'9 27'4 46'0 Per cent 218 %,379 607 343,323 235 169.700 262 266.299 Kolhapur 7'8 7'9 21'7 28'0 8'4 13'8 9'4 21'7 Percent
••••• j- 284 325,632 Sholapur 4'9 21'6 Per cent

190 SUBSIDIARY
Area,and Population, actual
Talukas with
State, Natur81 Division and District, Under 100, 100-1.50, 150-200, 200-300,
Area, Population, Area, Population, Area, Population, Area, Population,
2 3 4 5 6 7 8 9
Bomhay Deccan Southern Division 1,011 148,835 4,669 834,398 6,906 1,701,272
Percent 5'8 3'2 26'8 17'8 39'7 36'2
Belgaum 675 99,872 470 90,051 2,717 657,156
Per cent 12'2 5'8 8'5 5'2 48'9 38'1
Bijapur 3,346 5B4,937 2,767 667,974
Percent 51'0 41'9 42'2 47'S
Dharwar 336 48,963 853 159,410 1.422 376,142
Percent 6'4 3'1 16'1 10'1 26'9 23'9
Bomball Konkan Division 1.497 52,886 1,553 184,169 527 94,324 4,221 1,131,825
Percent 9'7 1'1 10'1 4'0 3'4 2'0 21'4 24'3
ThaDa 527 94,324 347 69,563
Percent '" 14'0 6'2 9'2 4'6
Kolaba ...... 1,517 411,963
Percent 55'9 45'3
Ratnagiri 1,794 497,084
Percent 36'0 29'0
Kaoara 1,497 52,8S6 1,553 184,169 563 153,215
Percent 37'7 10'2 39'1 35'6 14'2 29'6
SAURASHTRA STATE- 1,448 121,137 3,335 408,845 4,233 699,297 5,079 1,200,480
Percent 1'3 2'9 18'1 9'9 22'9 16'9 21'5 29'0
Halar 546 49,986 1,342 167,034 1,071 176,710
Percent 16'0 8'7 39'3 29'1 31'6 30'8
Madhya Sauraahtra- 885 I I 9,B9 I 978 153,199 1,354 30B,m
Per cent 20'0 11'5 22'1 14'7 30'7 29'S
Zalawad 902 71,151 1,10B 121,920 1,062 167,795 157 40,497
Percent 25'7 14'3 31'6 24'6 30'3 33'S 4'5 S'2
Gohilwad 434 74,377 2,032 467,370
Per cent II'S 7'3 55'2 45'S
Sorath 682 127,216 1,536 383,836
Percent 19'9 12'7 44'8 38'3
KtJrCH STATE 5,971 249,799 1,287 147,037 1,042 170,770
Per cent 71'9 ,44'0 15'5 25'9 12"6 30'1

TABLE 1'1 J9J
~d percentage, by UoJuka density
Density
300-450, 450-600, 600-750, 750 and over, State, Natural DiYi.ion and District,
Area, Population, Area, Population, Area, Population, Area, Population,
10 " i2 13 14 15 16 17
3,266 1,093,107 862 -444,248 291 195,532 394 281,087 Bom5au Deccan Southern Division
18'8 23'3 S'O 9'S 1'7 "'2 2'3 6'0 Per cent
434 154,494 862 444,248 394 281,087 Bellaum
7'8 8'9 IS'S 25'7 7'1 16'3 Per cent
450 143,214 Bijapllr , .. 6'9 10'3 Per cent
2,382 795,339 291 195,532 Dharwar
45'1 50'S 5'5 IN Per cent
5,681 1,919,261 786 399,616 405 260,060 758 614,736 Bomoou Konkan Division .. ,
36'S 41'2 S'I 8'6 2'6 5'6 4'9 13'2 Per cent
1,693 492,442 229 113,462 203 133.523 758 614,736 thaDa
45'1 32'4 6'1 7'5 5'4 8'8 20'2 40'S Per cent
819 293,458 301 156,340 75 47,322 Kolaba
30'2 32'3 11'1 17'2 2'8 5'2 rer cent
2,806 1,005,851 256 129,814 127 79,215 Ratnagiri
56'3 5e'8 5'1 7'6 2'5 4'6 Per cent
363 127,510 Kanara
9'1 24'6 Per cent
3,8%6 1,464.90% m 181,619 182 121,079 SAURASHTRA STATE .. ,
20'7 34'0 1'9 4'4 1'0 2'9 Per cent
446 180,742 Halar
13'1 31'5 Per cent
856 282,189 344 181,619 Madhya Saura.htra .. ,
19'4 27'0 7'8 17'4 Per cent
281 94,565 Zalawad
8'0 19'1 Per cent
1,216 478,383 Gohilwad
33'0 46'9 Per cent
1,027 369,023 182 121,079 Sorath
30'0 36'9 5'3 12'1 Per cent
KUTCH STATE
Per cent

192
SUBSIDIARY TABLE I' 2
Variation and Density of General Population
N ole,-The percentage variatiol1$ shown in columns 2 to 4 of Ihis table have been worked out on the basis 01 the population ligures for States and districts given in table A- I I.
The density ligures shown in columns 5 to 8 01 this table have been worked out on the basis of the ligures of population shown in table A. II and the ligures of area for States and districts supplied by the Surveyor General of India and shown in Table A-I.
.--General Population,
I
State. Natural Division and District, Percentage increase ( +) or decrease ( - ), Density,
1941 to 1951 1931 to 1941 1921 to 1931 1951 1941 1931 1921
1 2 3 4 5 6 7 8
BOMBAY STATE .. , +23'2 +15'6 +i2'9 323 262 227 201
Greater Bombay +67'5 +30'1 + 0'6 25,579 15.272 11.734 11,659
Bomhay GujaTat Division +19'9 +20'2 +12'2 344 287 239 213 Banaskantha +28'4 +15'1 + 8'0 170 133 115 107 Sabarkantha +19"4 +17'2 +18'7 240 201 172 145 Mehsana +19'1 +13'4 +10'6 341 287 253 228 Ahmedabad +28'7 +38'7 +11'0 478 371 268 241 Kaira +20'7 +19'0 + 8'8 634 526 442 406 Panch Mahala +19'5 +15'1 +19'0 328 274 239 200 Baroda +15'9 +19'1 +16'3 402 347 292 251 Broach +10'2 +19'5 +13'2 243 220 184 163 Surat +17"4 +21'1 + 9'S 406 346 286 261 Amreli +13'1 +20'8 +13'7 194 172 142 125
Bomhay Deccan Northern Division .. , +22'9 +14'2 +18'0 274 223 195 165 West Khandesh +25'4 +18'1 +20'3 213 170 143 119 East Khandesh +11'5 +10'2 +12'0 324 291 264 236 Dangs +17'5 +20'1 +38'7 72 61 51 37 Nasik +26'8 +11'7 +19'4 237 187 167 140 Ahmednagar +25'6 +15'9 +34'8 214 170 147 109 Poona +32'5 +15'4 +15'5 324 244 212 183 Satara North +16'2 +13'2 +13'8 291 251 222 195 Satara Soutb +22'8 +14'9 +18'7 291 237 206 174 Kolhapur +21'8 +14'4 +14'3 445 366 319 279 Sholapur +22'6 +14'8 +17'6 265 216 188 160
Bombay Deccan Southern Division ... +17'4 +11'8 + 9'8 270 230 205 187 Belgaum +17'0 +14'0 +13'6 313 267 234 206 Bijapur +18'8 +12'3 + 9'3 212 178 159 145 Dharwar +16'7 + 9'1 + 6'6 297 255 233 219
Bombay Konh,an Division +18'9 + 7'6 +10'8 298 251 233 211 Thana +45'4 +12'0 +10'4 390 268 239 217 Kolaba +12'9 + 6'S +11'6 335 297 279 250 Ratnagiri + 5'2 + 6'0 +12'7 341 '324 306 271 Kanara +17'4 + 5'6 + 4'0 130 111 105 101
SAURASHTRA STATE +16'2 +20'5 +15'5 193 166 138 119 Balar +19'6 +21'8 +18'7 148 123 101 85 Madhya SalU'ashtra +16'3 +17'8 +15'7 224 193 164 142 Zalawad +17"8 +11'9 + 9'9 112 95 85 77 Gohilwad +16'0 +21'7 +14'1 218 188 155 135 Sorath +13'7 +26'2 +18'1 12B \13 89 76
KUTCH STATE +11'8 -2'4 + 7'4 34 30 31 29

193
SUBSIDIARY TABLE l' 3
Mean Decennial Growth Rates during Three Decades-General Population
Births and deaths are registered in all districts of the State of Bombay. However, during the past decade (1941-50), the boundaries of every district, e.{cept Kanara, changed and many districts absorbed, wholly or in part, areas of the former Indian States, for which figures of births and deaths were not available. In addition, new districts were formed. Details regarding the constitution of the districts at the time at the 1951 Census have been given in the fly leaf of Table A~II.
The figures of total births and deaths for each of the past three decades were not available for the following newly created districts :-
8anaskantha, Sabarkantha, Mehsana., Baroda, Dangs and Satara South.
The mean population figures given in columns 2, 3 and 4 were worked out on the basis of the population figures according to past censuses given in Table A~II. Normally the figures of mean population given in columns 5, 6 and 7 should have been the same a" the popula~ion figure~ given in column~ ~, 3 a~d .4 respectively. But m the ca 'e of some dlstncts, thiS did not happen, because in the case of these districts figures of births and deaths were not available for the districts as constituted at the time or the Census and the mean population figures given in columns 5 to 7 pertain to areas for which figure;:; of births and deaths were available, and have been given in this table.
The following notes will show to which areas the figures of population given in columns 5 to 7 and the figures of birth and deaths given in columns 14 to 16 and 20 to 22 pertain.
Ahmedabad.-The figures of mean population given in columns 6 and 7 and the figures of births and deaths for the decades of 1921-30 and 1931-40 given in the table pertain to Ahmedabad District as it was constituted in 1941. During the past decade, Chogho Mahal was transferred to Amreli District and Modasa <,nd Prantij T alukas were transferred to Sabarkantha District. The areas of Dehgam Taluka and some villages of Attar~ sumba T aluka of the former Indian Stale of Baroda were added to this district. The areas of the former Indian States of Sankheda Mewas and Pandu Mewas were also added. The figures of births and cleaths for areas which were added to this di3trict were not avail~ able.
Paflch M Inals, Brolch, Sural, Nasik, Poona, Sh'Jlapur, BelgaurTl, Bijapur, Dharwa" Kolaba and Ratnagiri :- .
The figures of mean population of areas under registration given in columns 5 to 7, and the ligures
MO-A Bk H 91-24
of births and deaths for these districts pertain to the areas which constituted these districts in 1941, and do not include figures for the areas of the former Indian States, merged in these districts during the past decade.
The figures of population according to the censuses of 1921, 1931 and 1941 for the old districts of Bombay Province have been taken from the old Census Reports. The 1951 population figures of the areas for which the figures of births and deaths were available were estimated to be as under;-
Panch Mahals 630,418 Belgaum 1,434,363
Broach 427,598 Dharwar 1,401, 105
Surat 1,034,715 Bijapur 1,159,369
Nasik 1,412,537 Kolaba 755,280
Poona 1,822,407 Ratnagiri 1,455,024
Sholapur 1,243,681
Amreli.-The figures of births and deaths available for Amreli and Okhamandal divisions of the former Indian State of Baroda are shown in the re~pective columns of this table.
The figures of births and deaths for Chogho Mahal which was transferred to thi'S district from Ahmedabad District were not available.
The figures of population for Amreli and Okha~ mandai divisions of the former Indian State of Baroda were available in the old Census Reports of Baroda. The 1951 population of these areas was estimated to be 275,985.
Salara North.-The figures of births and deaths for 1921-30 and 1931-40 and the figures of mean popula~ tion for the area under registration for 1921-30 and 1931-40 given in the table pertain to the old Satara District of the former Bombay Province.
Kolhapur.-For this district, the figures of births and deaths were not available for all the ten years of the 1941-50 decade. They were available only for the first seven years i.e. 1941 to 1947. The figures for the decade (1941-1950) given in the table have been estimated on the basis of the figures for 1941 to 1947.

194 SUBSIDIARY
Mean Decennial Crowth Rates during
Mean population of Decade for Area under State, Natural Mean Population of Decade. Regi5tralion of Births and Deaths.
Division and District. 1941-'>0. 1931-40. 1921-30. 1941-50. 1931-40. 1921-30.
2 3 4 5 6 7 ----
BOMBAY STATE ... 32,558,548 27,211,911 23,797,942 22,327,147 21,029,217 18,(1)2,286
Groater Bombay 2,267,219 1,493,842 1,298,336 2,267,219 1,498,842 1,298,336
&mhay G:Ijaraf Did.iarf 10,452,380 8,707,802 7,477,030 3,686,077 4,286,369 3,633,986
Banaskantha 665,993 544,829 487,740 Not available
Sabllrkantha 623.482 53 I ,O{)2 450,551 Not available
Mehs!llIll 1,353,780 1.162.984 "
1,037,642 Not available
Ahmedabad 1,497,880 1,127,293 897,722 Not avail.ble 1,185,970 945,339
Kaira 1,474,362 1,229,746 1,077,843 1,474,362 1,229,746 1,077,843
Panch Mahal. 1,054.537 897,778 768,241 578,872 490,926 414,693
Baroda 1,112,952 948,549 305,135 Not available
Broach 673,475 588,597 504,923 412,399 365,686 320,958
Sural 1.692,146 l,.i20,781 1,229,103 957,886 787,335 683,982
/unreli 298,773 256,243 218,130 262,558 226,706 191,171
-I
BomhCIIJ Deccan Northern Divi3ian 11.212,171 9,436,000 8,140,444 8,793519 8,614,181 7.430.023
West Khand~Jh 1,029,905 843,602 708,114 1,029.905 843,602 708,114
East Khandesb 1.395,712 1.259,167 1,133,958 1.395,712 1,259,167 1,133,958
Dang. 43,759 36,866 28,819 Not available
Nasik 1.278,757 1,068,590 927,683 1,263,219 1,056,975 916.312
Abmednagar 1,266,956 1,046,124 844,173 1,266,956 • 1,046,124 844,173
Poona 1,711,974 1,374,427 1,190,448 1,590,908 1.264.603 1.089.415
Satara North 1.093,531 952,701 839,477 Not available 1,253,480 1,102,216
Satara South 907,233 761.58-4 653,087 Not av.ilable
Kolhapur 1.117.643 944,135 825,299 1,117,643 944,135 825,300
Sholapar 1,366,701 1,148,804 989,386 1,129,176 946,095 810,535
Bombay Deccan SOlllhern DivisiQII ... 4,349.809 3,790,153 3,418,962 3,698,632 3,225,512 2,917,697
Bellaam 1,601,159 1,384,995 1.216,915 1,329,895 1,151.065 1,014,848
Bijapur 1.285,760 1,110,946 1,002,247 1,067,676 " 922,601 833,048
Dharwar 1,462,890 1.294,212 1.199,800 1,301,061 1,151,M6 1.069,801
B0rnh4g Krml(an Dicisitttt 4,287,069 3,779,114 3,463,170 3,881.700 3,404,313 3,122,224
Thana 1,280.886 987,999 888,226 1,280,886 987,999 888,226
Kolaba 857,120 780.736 716,951 712,101 648,821 595,832
Ratnagiri 1,669,595 1,580,883 1,448,212 1.409,245 1,337,997 1,228,385
Kanara 479,468 429.495 409,781 479,468 429,496 409,781

TABLE 1'3 195
Three Decades-G6Iu..ral Population
/
Growth of Population during Decade, Mean Decennial Growth Rate. State, Natural Division and District.
1941-50. 1931-40, 1921-30, 1941-50, 1931-40, 1921-30, 8 9 10 11 12 13
6,775,004 3,938,471 2,889,466 2O'S 14'5 12'1 BOMBAY STATE
1,144,102 392,653 8,358 50'5 26'2 0'6 Greater Bombay
1,888,817 1,600,340 861,205 18'1 18'4 11'5 Bombay Gujarat Diui,ion
165,605 76,723 37.456 13'1 14'1 7'7 B3Dukantha
111,059 83,892 77,010 17'7 15'8 17'1 Sabarkantha
235,764 145,829 104,R54 17'4 12'5 10'1 Mehlana
375501 365,672 93,470 25'1 32'4 10'4 Ahmedabad
276.129 213,101 90,706 18'7 17'3 8'4 Kaira
187,791 125,727 133,347 17'8 14'0 17'4 Panch Mahal.
153,537 165.219 12i,610 14'7 17'4 15'1 Baroda
65,119 104,638 62,710 9'7 18'7 12'4 Broach
271,393 271,337 112,018 16'0 19'1 9'1 Sarat
36,859 48,202 28,024 12'3 18'8 12'8 Amreli
2.305,123 1,247,214 1.343,898 20'6 13'2 16'5 Bombay Deccan Northern Diuinon
232,238 140,368 130,608 22'; 16'6 18'4 Weat Khandelh
151,277 121,814 12B,604 10'8 9'7 11'3 Ea.t Khaadeah
7.046 6,741 9.353 16'1 18'3 32'5 Dang.
302,319 118,014 163,800 23'6 11'0 17'7 Nuik "
287,833 153,831 250,072 22'7 14'7 29'6 Ahmedaagar
478,004 197,090 170,868 27'9 14'3 IN PooDa
163,557 118,102 108,346 15'0 12'4 12'9 Satara North
185,816 105,482 111,512 20'5 13'9 17'1 Satara Soath
219,807 127,211 110,459 19'7 13') IN Kolhapar
277.231 158,561 160,276 20'3 13'S 16'2 Sholapar
697,340 421.972 320.409 16'0 11'1 9'4 BombCIJ/ DuCmI Southern Division
251,498 180,830 155,329 15'7 13'1 12'8 Helraam
220,849 128,780 ,88.618 11'2 11'6 S'8 Bijapar
224,993 112,362 76,-462 15'4 8'7 6'4 Dharwar
739,617 276).92 355,596 17'3 7'3 10'3 Bombay Konkan Divuion
474.329 111,443 88,103 31'0 11'3 9'9 Thana
103,926 48,842 78,729 12'1 6'3 11'0 Kolaba
84,739 92,685 172,656 S'I 5'9 11'9 Ratnqiri
76,623 23,322 16,108 16'0 5'4 3'9 Kanara
KO·A, BI:: H 91-24a

196
Registered Births during Decade. State, Natural
Division and District. 1941-50. 1931-40,
14 15 1921-30.
16
BOMBAY STATE ,.. 7,341,581 7,816,171 6,603,769
Greater Bombay 523,190 380,164 244,472
Bombay Gujarat Division 1,335,099 1,666,718 1,315,632
Banaskantha
Sabarkantha
Mehsana
Ahmedabad Not availahle 465,678
Kaira .. , 487,669
Panch Mahals 195,361
Baroda
Broach 175,101
Surat 374,832
Amreli 102,136
Bombay Deccan Northern Division 3,105,621
West Khandesh .. , 389,088
East Khandesh 518,500
Dangs
Nasik
Ahmednagar
Poona
439,144
433,020
444.430
458,880
174,873
164,949
312,153
90,185
3,403,625
340,341
506,860
434,289
434,048
441,549
Satara North
Satara South
Not available 493,324
Kolliapur .. , 416,350
Sholapur 465,089
Bombay Deccan Southern Division 1,330,504
BeIgaum 457,080
Bijapur 407,497
Dharwar 465,927
BombayKonkan Division ", 1,047,167
Thana 263,743
Kolaba 222,579
Ratnagiri 411,030
Kanara 149;815
354,631
398,583
1,242.127
441,083
370,358
431,286
1,122,937
295,154
243,510
441,558
142,715
336,915
358,116
148,691
140,365
264,190
67,355
2,893,391
297,917
507,682
373,728
347,404
347,037
414,634
288,580
316,409
1,092,468
386,802
317,069
388,597
1,057,806
267,754
223,254
425,859
140,939
SUBSIDIARY
Mean Decennial,Growth Rates during
Mean Decenni~l Birth Rate (Registered).
Registered Deatbs during Decade.
1941-50. 1931-40, 1921-30, 1941-50, 1931-40, 1921-30, 17 18 19 20 21 22
32'9 37'2
23'1 25'4
36'2 38'9
Not available
Not available
Not available
Not available 39' 3
33"1
33'7
Not available
42'S
39'1
38'9
35'3
37'8
37'1
Not available
34'8
34'2
27'9
37'3
35'6
45'1
39'6
39'8
39'S
40'3
40'3
41'1
41'S
34'9
Not available 39' 4
Not available
37'3
41-2
36'0
34'4
38'2
35'8
27'0
20'6
31'3
29'2
31 '2
37'6
42'1
38'5
38'3
40'1
37'4
33'0
29'9
37'5
33'0
33'2
35,9 5,038,376 5,275,109 4,912,309
18'8 363,410 316,242 365,409
36'2 912,657 1,141,646 969,407
35 '6 Not available 344,373
33'2 361,374
35'9 115,366
43'7 131,426
38' 6 235,700
35'2 68,791
36'9 2,144,667
42'1 262,413
44'8 387,399
40'8 306,401
41'2) 279,862
31'9 332,616
327,588
105,793
107,512
202,466
53,614
2,243,327
203,200
338,642
297,235
274,554
312,008
37'6 Not available 303,969
35'0
39'0
37'4
38'1
38'1 "
36'3
33'9
30'1
37'5
34'7
34'4
249,630
326,346
905,457
310,082
272,362
323,013
712,165
170,126
158,914
265,908
97,237
227,301
286,418
849,408
287,564
252,890
306,954
724,486
196,781
147,705
262,592
117,408
275,438
276,010
84,299
99,682
188,954
45,024
2,055,726
181,544
354,579
258,418
228,577
285,404
302,458
196,378
248,368
794,588
264,059
221,137
309,392
727,179
191,436
150,427
266,736
118,580

TABLE 1'3
Three Decades-General Population It
Mean Decennial Death Rate (Registered),
1941-50, 23
16'0
24'8
1931-40, 24
25'1
21'1
26'6
Not available 29'0
24'S
19'9
31'9
24'6
26'2
24'4
25'S
27'8
26'6
2) '5
29'5
25'7
23'6
26'0
24')
26'9
1921--;30, 25
26'7
28'1
26'7
29'1
25'.6
20'3
31'1
27'6
23'6
27'7
25'6
31'3
Decennial Rate of Natural increase (Registered),
1941-50, 26
10'3
7'1
11'4
1931-40, 27
12'1
4'3
12'3
1921-30, 28
9'2
- 9'3
9'S
Not available
Not available
Not available
Not available 10'3
8'6
13'8
10'6
14'5
12"7
10'9
12'3
9'3
10'7
14'1
Not available
15'6
13'9
16'2
13'5
16'2
13'4
Not available
12'6
11'0
11'6
11'2
16'5
13'5
24'3
22'1
20'9
28'1
26'2
24'7
28'2 10'5 13'0
15'3
10'2
12'6
14'1
5'7
10'2 Not available 24' 3
22'3
28'9
24'5
23'3
25'S
24'8
18'3
13'3
22'3
20'3
20'3
24'1
30'3
26'3.
25'0
27'4
26'8
21'3
19'9
22'8
19'6
27'3
27'1 • 12'1
26'2 7'0
27'4 Not available 15'1
23'8
30'6
27'2
26'0
26'S
28'9
23'3
21'6
25'2
21'7
28'9
15'0
12'3
II'S
11'1
12'7
11'0
8'7
7'3
9'0
8'9
10'9
Not available
13'5
11'8
12'2
13'3
12'7
10'7
11'7
10'0
14'7
13'4
5'9
11'2
8'4
10'2
12'1
11'6
7'4
10'6
8'5
12'3
13'0
5'5
197
Migration-cum-Registration Error,
1941-50, 29
+43'4
1931-40, 30
+21'9
+ 6'1
Not available +22 'I
-0'9
+ 1'5
-0'4
+ 9'7
+10'2
+ 1'5
+13'1
+10'6
+20'9
+ 6'6
-0'1
+ 3'1
+ 5'2
+2'6
- 0'3
+ 0'4
-3'7
-2'0
-0'6
+ 4')
Not available - 2'7
+ 4'7 0
+ 8'0 + 2'0
+ 4'S -1'1
+ 4'6 - 0'2
+ 4'5 -1'1
+ 4'4 -1'9
+ 8'6 - 4'4
+29'7, + 1'3
+ 3'1 - 8'4
-3'8 -7'5
+ 5'1 - D'S
1921-30, 31
State, Natural Division and District,
+ 2'9 BOMBAY STATE
+ 9' 9 Grenter Bombay
+ 2'0 Bombay Gujarat Division
+ 3'9
+ 0'8
+ 1'8
Banaskantha
Sabarkantha
Mehsana
Ahmedabad
Kaira
Panch Mahals
Baroda
- 0'2 Broach
- 1'9 Surat
+ 1'2 Amreli
+ 5'3 Bombay Deccan Northern Division
+ 1'9 West Khandesh
- 2'2 East Khandesh
Dangs
+ 5'1
+15'5
+ 9'7
+ 2'7
Naaik
Ahmednagar
Poona
Satara North
Satara South
+ 2' 2 Kolhapur
+ 7' 8 Sho!apur
- 0' 8 Bombay Deccan Southern DiVision
+ 0'7 Belgaum
- 2' 8 Bijapur
- I'D Dllarwar
- 0'3 Bombay Kon~an Division
+ 1'4 Thana
- )'3 Kolaba
- I 'I Ratnagiri
- 1'6 Kaoara

198
Slate, Natural Divi,loa and Djltrict ... Jur. enumerated ..
I
BOMBAY STATE
Cr •• ter Bomb.,
BOWl~(I" Gujtl.rat DilJilion ..
Bua.kalltba
Sabarkutba.
M.bama
Ahmedabad
Kaira
Palleb Maba1s
Baroda
Broad.
Surat
Amreli
E"mhau D'Cc.an. Northern Ditrilion
We.t Kbud •• b
Ea.t n""deab
D .....
Nuik
Abmednarar
POOll&
Salar. North
SaWa South
Kolbapur
Sbclapur
B.qaum
Bijapur
Dha .... ar
Bomhag K.n~an Dillin"" . ,
K.I.b.
Ralllqiri
.l[uara
SAURASHTRA STATE ..
Halar
MadbJ' Saurashtra
lala ... cI
CoLiI"ad
Soratla
KUTCH STATE
I
1
Di.trict of enumeration.
Penon •. Mal ••.
2 3
30.614,838 15.672,283
791,706
10,123,92.
696,951
633,309
1.400,803
1,145,214
1,487,647
1,096,678
1,039,317
643,265
1,716,640
259,102
11,091,393
1,043,955
1,358,0.33
42,173
1,302.376
1,251,922
1,604,259
1,113,703
910,858
1,128,458
1,335,631
4,404,468
1,617,921
1,323,428
1,463,119
4,203~3
1,174,710
871,167
1,679,m
477,744
3,870,473
535,591
966,315
457,711
978,512
932,344
420,610
5,269,199
363,631
m,m 711,200
617,648
791,708
569,810
551,807
337.433
858,422
142,164
5,693,721
536,625
699,307
22,078
667,180
640,020
817,833
548,457
475,220
588,197
698,804
2,267,755
839,118
676,525
751.512
2,020,998
597,427
427,669
754.912
240,990
1,988,953
272,869
495,960
240,643
504,376
415,105
265.178
Ferm! ...
4
1(.942,553
371,09&
4,854.727
333,319
307,984
689,603
527,566
695,939
" 526,868
487,510
310,782
858,218
116,938
5,397,672
507,330
658,746
20,100
635,196
611,902
786,426
565,246
435.638
540,261
636,827
2,136,713
778,203
646,903
711,607
2,182,345
571,283
443,49B
924,BI0
236,754
1.881,520
262,722
470,355
217,068
474,136
457,239
2S7.ua
Bom in
Other di,tricts ol •• me Natural
Penons.
S
1,135.575
578,294
17,980
27;HI
39,281
225,164
BD,099
25,210
91,894
35.445
33,419
2,661
389,697
67,243
~4,7j6
2,418 •
61,264
68,191
5,009
44,088
53,529
872
42,m
110,610
37,266
29,216
44,128
56,974
37,964
13,133
4,401
1,476
Divi.ion.
Mal ••.
6
474.117
246,855
4,986
9,983
11,138
114,867
27,037
9,686
36,998
13,438
17,485
1,237
153,648
27,171
16,05B
1,258
26,592
29,781
1,71B
16,040
17,479
332
17,219
45,175
13,760
11,637
19,77B
28,489
20,561
5,158
1,769
1,001
SUBSIDIARY
Immi It
Other part. 01 t he State. Atlia<ent
F.mal ••• Penon •. Mal ••.
7 8 9
811.408 1.797.786 1.0%2,413
331,439
12,994
17,158
28,143
110,297
53,062
15,524
54,896
22,007
15,934
1,424
236,049
40,072
28,698
1,160
34,672
38,412
3,291
28,043
36.050
540
25,106
65A35
23,506
17,579
24,350
23,455
17,403
7,975
2,632
4n
1,0&0.048
75.400
702
425
1.940
21,429
3,589
2,100
13,070
7,6-11
23,636
868
406,425
5,427
2,950
2,243
13,737
5,461
209,317
12,060
30.519
"89,154
35,551
90,279
59,698
16,295
14,286
165,634
111,801
17,164
18,462
18,207
133,036
23,429
50,285
16,032
14,114
29,176
673.774
39,576
356
216
963
11.692
1,993
1,142
7,057
3,940
11,757
~60
186,356
2,393
1,568
1,588
7,205
3,137
106,980
5,336
12.363
29,926
15,860
35,712
22,018
6,201
7,493
86,995
60,678
8,3;'
8,902
9,050
43.211
7,459
15,843
4,967
4,B35
IO,Ie7
Femal ••. Persenl.
10 II
775,373 1.474,3%2
386,274
35,824
346
209
977
9,737
1,596
958
6,013
3,701
11,879
408
220,069
3,034
1,382
655
6,532
2,324
102,337
6,724
18,156
59,228
19,697
54,567
37,680
10,094
6,793
78,639
51,123
8,799
9,560
9,157
89,825
15,970
34,442
11.055
9,279
19,069
4gZ,021
443,991
24,780
22,135
19,411
204,505
32,675
15,323
27,315
12.064
34,044
51,679
356,881
20,792
lO,m
389
30,680
72,974
80,863
3,BI2
4,012
3,23>
89,389
85,035
6,198
26,930
51,907
96,394
74,216
5,815
1,822
14,541
6&,300
5,702
12,923
18,617
17,532
11,526

TABLE 1'4
gratioD
Sill ...
M.I.,.
12
810,%51
316,983
220.397
IO,B02
10.67a
9,203
108,928
17.334
7,315
14,845
6,604
19,240
15,448
178,686
10,235
22,597
234
16,028
34,278
~a.221
2,220
2,423
1,928
40,524
39,369
3,907
10,942
24.520
54,814
41,603
3,221
1,170
8.820
24.410
2,998
5,336
5,733
5,942
4.401
Femal ••.
13
IM.071
1'15,038
223,594
13,978
11,457
[0,208
95,577
15,341
8.008
12,530
5,460
14,804
36,231
178,193
10,551
28,138
155
14,652
38,696
32,642
1,592
1,589
1,307
48,865
45,666
2,291
15,988
27,387
41,580
32,613
2,594
652
5,721
41.890
2,704
7,587
12,BB4
11,590
1,125
2.720
I
~
Other ports of [ndi •.
Perlon •.
14
~O.590
289.054
71,127
2,705
335
2,227
42,746
2,655
4,452
6,826
1,540
7.337
304
45,336
1,814
6,731
32
10,481
6,200
17,736
468
435
458
981
1,131
481
172
478
23,942
23,055
530
223
134
8,281
1,443
2,099
1.525
1,700
1,514
l,558
Mal.,. 15
2(5,357
52,372
1,433
219
1,603
32,832
1,973
2,981
4,840
1,087
5,158
246
29,990
1,063
2.543
24
7,660
4,956
12,298
272
264
~70
635
772
302
122
348
17,678
17,056
J7j
156
9!
5,160
1,043
1,187
893
1,101
936
I.Z11
Femal.,.
16
84.421
13,755
1,272
115
624
9,914
692
1,471
1,980
m 2,179
58
15,345
751
4,183
2,821
1,244
5,438
196
171
188
346
359
179
50
130
6.264
5,999
155
67
43
3.121
400
912
632
599
578
337
Born in
I I
I Ptrlons.
17
392.176
128,021
n512
5,651
664
7,970
46,053
5,728
4,492
15,973
1,025
10599
1,357
6~,715
6,777
3,023
20
10,897
6,022
30.490
890
397
4,977
1.217
I,5S7
910
100
577
93,341
90,447
802
1,914
178
57,881
8,294
14,011
2,005
8,125
25,44;
8.255
Boyond [ndi •.
Mal".
IB
226.213
75.457
54,293
2,856
346
4,404
25,597
3,184
2,538
8,642
562
5,405
759
3~,820
3,652
4,321
12
5,983
3.544
17,266
496
286
2,597
663
945
517
79
349
56,698
5;,161
448
999
90
31.879
4,387
6,041
923
4,396
14,132
4.335
Female •.
19
165.D53
52,5M
45,219
2,795
318
3,566
20,456
2,544
1,954
7,331
463
5,194
598
30,895
3,125
3,707
8
4,914
2,478
13,224
394
III
2,380
554
642
393
21
228
36,643
35,286
354
915
53
26,002
3,907
5,970
1,082
3,730
11,313
3,,:0
-
Person ••
20
110.855
78,420
4.539
27
30
519
33
177
291
55
2,167
1.232
5,233
16
98
2
461
101
3,302
288
391
393
216
5,369
4,4)4
44
891
17,249
5,857
472
5,420
5,500
1.388
13
42
38
146
1,149
Olher terri''''''''
Mal ...
21
63.356
2,087
17
17
305
21
49
170
31
810
660
2.5~3
53
2
279
47
1,885
146
205
171
104
2,552
2,056
20
476
8,756
3,521
344
1,727
3,164
829
10
24
27
84
684
199
I Stlte, Natural DiTision ami DistriC't where enumerated.
F.mal ...
22 I
-47.'99 BOMBAY STATE
31,34% er •• ter Bomb.,
1,4S1 S.",&.u G.ja,.' DiDiuon
10 Bana.kaotb.
I 5ab.rk""lba
II M.b .. n. 214 Ah",edabad
12 K.ira
128 Pallcll Mabal.
121 Baroda
24 Bro.cb
1,357 Sural
572 AmnIi
2,395 B.m~u D,cca. N.rth". Di.ioi ..
15 W .. t Kb""d •• b
45 Eut Kband •• b
Dan,.
202 Na.ik
54 Abmodna:ar
1,411 POGa.
142 53tar. Nortb
186 Sat.ra Soutb
222 KolbaplU'
112 Sh.lapur
2,817 B.",~.u D<o:". S •• thtrn Dioilioft
2.378 Belsaum
24 Bijaput
415 Dbarwar
8,493 Bomba. Kaok •• DloUI ..
2,336 Thana
128 Kolab.
3,693 RIoIDQiri
2,336 Kanan
559 SAURASHTRA STATE
3 Halar
18 Madhya Sa .... ubtr.
II Zala .. ad
62 Gohllwad
465 Soratla
KUTCI;l STATE

200
State where enumerated.
BOMBAY STATE
States adjacent to Bombay
Hyderabed
Kutch
Madhya Bh.rat
Madhya Pradesh
Madras
Mysore
Rajesthan
Saurashtra
Other States
Ajmer
Andarnan and Nicow
Assam
Bhopal
Bihar
Bilaspur
Coorg
Delhi
Himachal Pradesh
Jammu and Kashmir
Manipur
Orissa
Paliah and East Punjab States Union
Punjab
Travancore-Cochin ...
Tripura
Uttar Pradesh
Vindhya Pradesh
W.st Bengal
Sikkim
Bombay State.
Persons. M~les. Females.
2 3 4
... 33,548,197 17,163,853 16,379,334
.......
SUBSIDIARY
Emi
Born in Bombay State and
Adjacent States.
Persons. Males. Females.
5 6 7
BOMBAY
3711,101 159,995 218,100
124,265 42,612 81,653
1,795 396 899
42,579 20,412 22,167
66,138 31,580 34,55e
22,747 11,271 11,476
43,918 22,159 21,759
18,682 10,184 8,498
57,977 20,881 37,0%
......•
.......


202
State where enumerated.
SAURASHTRA STATE
States adjacent t<l Saurashtra
Bombay
Kulch
Other States
Aimer
Ar.damon and NicQb<.r
Assam
Bhopal
Bihsr
Bilaspur
Coorl!
Delhi
Himachal Prade,h
Hyderabad
Jammu and Kashmir
M.dhya Bharal
Madhya Pradesh
Madras
Mmipur
Mysore
Ori.5S
Pati,)a Qnd East Punjab State. Union
Punjab
RBjulhan
Sikkim
T r. vaneore-Cochin
Tripura
Uttar Pradesh
VindhYB Pradesh
West BeDiial
Saura.htra State.
Persons. Malea.
2 3
4,003,509 2,032,164
SUBSIDIARY
Emi
Born in Saurashtra State and
Adjacent St.le •.
Females. Persons. Male •• Females.
4 5 6 7
SAURASHTRA
1,971,345
435,231 213,942 _Pl,289
433.090 213.514 219,576
2.141 428 I,m

TABLE 1'5 203
gration
enumerated in India. Natural Population.
Olher Stale •. State where enumer~led.
Penons. Males. Fema!' •. Persons. Males. Females.
8 9 10 II 12 13
STATE
4,482,859 2,271,649 2,211,210 SAURASHTRA STATE
States adjacent to Saurashtra
Bombay
Kutch
«,119 25,543 18,576 Other States
1,756 901 855 Aimer
Andaman and Nicobar
65 56 9 Assam
26 10 16 Bhopal
811 560 251 Bihar
Bilaspur
Coorg
563 560 3 Delhi
Himachal Pradesh
6,217 3.720 2,497 Hyderabad
Jammu and Kashmir
4,928 3,200 1,728 Madhya Bharat
17,676 9,243 8,433 Madhya Pradesh
2,387 1,519 868 Madras
Manipur
243 98 145 Mysore
337 197 140 Orissa
Patiala and East Punjab States Union
Punjab
1.355 891 464 Rajasthan
Sikkim
136 117 19 T ravancore-Cochin
6 5 Tripura
2,099 1,275 824 U Itar Pradesh
Vindhya Pradesh
5.513 3.194 2.319 West Bengal

204
State ",here enumerated.
KIJfCH STATE
States adjacent to Kutch
Bombay
Saurashtra
Rajll$than
Other States
Ajmer
Andaman and Nicohar
Assam
Bhopal
Bihar
BiIaapur
Coorg
Delhi
Himachal Pradesh
Hyderabad
J IIIllIDU and Kashmir
Madhya Bbarat
Madhya Pradesh
Madras
Manipur
MY80re
Oriasa
Patiala and East Punjab States Union
Punjab
Sikkim
T ravsncore.Cochin ...
Tripurs
Uttar Pradesh
Vindbya Pradesh
West Bengal
Persons.
2
552,826
Ku~h State.
M~.
3
Z65,178
SUBSIDIARY
Emi
Born ill Kutch State ancl
Adjacent States.
Females. PerSOllS. Miles. Females.
.. 5 , 7
KUTCH
387,848
84.343 47,701 38,642
76,020 44,172 31,848
8,323 3,529 4,794


206
SUBSIDIARY TABLE l' 6
Migration between the State and other parts of India
Immigration.
STATE. 1951. 1931. Variation.
.
I 2 3 4
BOMBAY STATE 2,251,672 l,1l72,967 l,181,9l}S
SAURASlfTRA STATE 128,511 78,353 + 50,158
KUTCH STATE 14,501 10,557 + 3,934
Nole.-This table gives the figures 01 immigrants and emigrants for the States of Bombay, Saurashtra and Kutch.
Column 2 gives the number of immigrants according to the 1951 Census i.e. it shows the number of persons who were born in States of the Indian Union (other than the State of enumeration), or in Pakistan or in areas such as Goa classified as "Elsewhere in India" in the Migrants Table-Table D-IV.
The figures in column 5 are, however, not exactly comparable with the figures given in column 2, because they do not include the figures of emigrants to Pakistan or of emigrants to places" Elsewhere in India" (this latter figure would be veIY small) as these figures are not available.
The figures for Bombay State for 1931 have been worked out from the data available in the 1931 Census Reports for Bombay, Baroda, and the Western India States Agency. In 1931, Sind and the former Indian State of Khairpur were parts of Bombay Province. In 1951 these areas belonged to Pakistan. Separate figures of persons born in these areas and enumerated in 1931 in areas which today form the Slale of Bombay were not available. Such persons were really immigrants into Bombay State as at present constituted, but as it was not possihle to fix their number or to resort to estimation with any confidence such persons had to be treated as forming part of the inborn population of the State of Bombay in 1931. In actual practice in 1931 the amount of migration from Sind to the area that at present constitutes Bombay State' was probably small.
Emigration. I Immigration minus Emigration.
195\. 1931. Variation. 1951. 1931.
5 6 7 8 9
437,021 -170,831 1,817,651 455,015
479,349 2D8;031 +271,318 -350,938 -129,678
89,042 83,291 + 5,751 -74,541 -72,724
With regard to emigrants separate figures of persons who had emigrated in 1931 to Sind and other areas which now form Pakistan were not available. and so it was not possible to exclude the number of emigrants to areas which now constitute Pakistan from the figure of emigrants in 1931 given in column 6.
Similarly in the case of Saurashtra and Kutch, there were many difficulties in arriving at the required figures. The State of Saurashtra did not consist of all the States that in 1931 constituted the We~tern India States Agency. The former Indian State of Kutch has now been formed into a separate State of Kutch within the Indian Union- The old jndian States 01 Palanpur, Vijayanagar, Radhanpur and Idar which belonged to the Western India States Agency in 19::: I, formed part 01 Bombay State in 1 ~51. The Adhoi Mahal of the former Morvi State has gone to Kutch. It was possible to make only a few adjustments for these changes, but all the adjustments that were necessary could not be made.
Therdore, while every effort has been made to render the 1931 figures comparable with those of 1931, the 1931 figures hive to be accepted with caution and allowance has got to be mlde for adjustments which it was not possible to make. The general picture of greatly increased immigration into Bombay State in 19j 1 by complrison with 1931, and of increased emigration from Sauras~tra (principally to Bombay State), i. however brou~ht out by the figures.

207
SUBSIDIARY TABLE 1'7
Variation in Natural Population
1951. 1931. Percentage Increase (+) or Decrease (-)
STArE. 1931-51 in Recorded Immigrants. Emigrants. Natural Recorded Immigrants. Emigrants. Natural Natural
Population. Population. Population. Population. Population.
J 2 3 4 5 6 7 8 9 JO
BOMBAY STATE 35,955,150 2,407;953 437,021 33,985,218 25,242,675 1,102,692 6D7,852 24,747,835 37'33
SAURASHTRA STATE
4,137,359 133,850 479,349 4,482,858 2,953,876 80,927 208,031 3,080,980 47'90
KUTCH STATE 567,606 14,780 89,042 641,868 520,496 10,765 83,291 593,022 8'24
Nole.-Columns 3 and 7 Rive tbe total number. of immigrants. They include the number of immilfrantl shown in colwnns 2 and 3 of Subsidiary Table I' 6 and in addition immigrants from outtide India.

208 SUBSIDIARY TABLE l' 8
Livelihood Pattern of General Population
State, Natural Division Number per 10,000 of General Pop1J\ation belonging to Livelihood Class and District.
II III lV V VI VII VIII
2 3 4 6 7 8 9
BOMBAY. SAURASHTRA 3.975 955 842 195 1.427 798 227 1,530 AND KUTCH
BOMBAY STATE 4,074 969 90S 193 1,376 '161 221 1,494
Greater Bombay 18 9 9 19 3,501 2,434 839 3,171
Bombay Gujaral Division 4,210' 980 818 208 1,393 758 170 1,463
Banaskantha 4,556 2,233 179 145 926 641 166 1,154
Sabarkantha 6,663 205 359 162 895 551 72 1,093
Mebsana 4,710 447 569 374 1,403 802 152 1,543
Abmedabad 1,589 666 515 181 3,311 1.439 256 2,043
Kaira 4.891 . 1,205 669 346 917 604 101 1,267
Panch Mahals 6.837 1,232 246 61 460 382 95 687 Baroda 3,929 871 1,242 254 972 752 201 1,779
Broach 3,594 1,275 2,047 209 732 530 101 1,512
~urat 3,466 1,106 1,462 82 1,480 670 244 1,490 Amreli 3,477 791 866 194 1,675 851 254 1,892
Bombay Deccan Northern Division 5,214 391 1,107 198 1,086 532 154 " 1.318
West Khandesh 5,362 330 1,980 58 729 445 62 1.034 Ea.t Kbandesh 4.642 219 2,105 80 1,037 546 230 1,141 Dangs 8,742 67 227 2 377 77 6 502 Nasill: 5,080 323 1,169 ISS 1,148 556 ZI9 1,350 Abmednagar 5,652 224 1,180 241 950 446 85 1.222 Poona 4,429 204 411 190 1.370 760 271 2.365 Satara North 6,776 193 395 355 888 365 62 966 Satara South 6,534 488 655 211 708
" 366 99 939
Kolhapur 5,402 1,255 689 216 88S 439 75 1,039 Sholapur 4,038 464 1,469 288 1,700 676 176 1,189
Bomhay Deccan Southnn Division 4,427 1,0&1 1,515 321 1,034 576 103 963
Belgaum 4,607 1,483 1.135 322 922 4gB 84 959 Bijapur 4,863 716 1.652 288 1.028 519 63 871 Dharwar 3,845 903 1,810 350 1,161 723 159 1,049
Bomhay KOM,an Division 2,B29 2,973 SOB 160 1,157 543 283 1.547 Thana 2,130 2,435 785 89 1,462 82B 345 1,926 Kolaba 2,673 4,201 324 203 819 376 227 1,177 Ratnagiri 3,910 Z,638 247 154 1,016 358 278 1,399 Kanara 1,583 3,500 835 314 I,3Z1 613 214 1,570
SAURASHTRA STATE ... 3,276 834 376 176 1,798 1,074 259 2,207 Halar 3,716 554 209 178 2,000 LO()3 342 1,998 Madhya Saurashtra ... 3,20S 719 235 133 1,834 1,213 262 2,399 Zalawad 2,364 1,564 382 264 2,023 918 169 2,316 Gohilwad 3,071 786 573 231 1,759 1,094 259 2,227 Sorath 3,760 804 416 120 1,571 1,026 252 2,051
KUTCH STATE 2,789 951 297 160 1,916 1,130 248 2,503

209
SUBSIDIARY TABLE 2'1
Distribution of Population between Villages
Number per Numberper 1.000 of Rural Population in Villages with a population 01 Population 1,000 of -------------------------------
State, Natural Division and District. per Village. Ceneral Population in 5,000 and over. 2,000-5,000. 500-2,000. Under SUO.
Villages.
2 3 4 5 6 7
--------------------------------BOMBAY, SAURASHTRA AND KUTCH 708 688 30 239 550 181
BOMBAY STATE 724 689 33 249 543 175
Greater Bombay
Bomhay Gujarat Division 652 744 25 236 534 205
Banaskantha 520 924 168 527 305 Sabarkantha 386 928 123 4B9 38B Mehsana 928 780 17 324 540 119 Ahmedabad 930 409 3 259 636 102
Kaira 1,223 717 41 442 450 67
Panch Mahals 522 BBI 12 134 582 272
Baroda 528 751 30 191 489 290
Broach 489 817 1 173 520 306
Surat 743 787 64 217 550 169
AmreIi 669 728 25 118 663 194
Bombay Deccan Northern Division ... 810 735 43 256 555 146
West Khandesh 633 829 36 197 563 204
East Khandesh 705 682 7 249 556 188
Dangs 153 1,000 43 34 923
Nasik 641 741 18 181 578 223
Ahmednagar 907 848 81 219 569 131
Poona 757 572 78 218 531 173
Satata North 881 864 32 288 557 12:-
Satara South 1.421 713 80 394 491 35
Kolliapur 1,002 774 7 335 569 B9
Sholapur 1.108 6BB 54 290 589 67
Bomhay Deccan Southern Division •.. 905 73B 36 304 537 123
Belganm 1,031 758 49 381 475 95
Bijapur 874 770 24 249 597 130
Dharwar 812 687 32 265 553 150
B~mhay Konk_an Division 608 806 26 211 540 223
Thana 597 654 5 200 535 260 Kolaba 458 894 12 100 519 369 Ratnagiri 1.026 908 52 272 593 83
Kanata 323 761 229 387 383
SAURASHTRA STATE 632 663 7 148 615 230 J
Halar 598 671 33 83 632 252 Madhya Saurashtra 657 609 151 631 218 Zalawad 535 6% 17 129 582 272 Gohilwad 682 691 169 619 212 Sorath 639 672 171 605 224
KUTCH STATE 471 800 223 506 271
MO-A Bk H 91-25

21O
SUBISIDARY TABLE 2' 2
Variation and Density of Rural Population
Note,-The density ligures shown in column 5 of this table are the same as those shown in column 9 of the E Table, of the area ligures obtained from Collectors, District Inspectors of Land Records, or other local sources,
They have been worked out on the basis
------Percentage increase (+ ) or decrease (-),
State, Natural Division and District, Density 1941 to 1951 1931 to 1941 1921 to 1931 1951
2 3 4 5
-----
BOMBAY, SAURASHTRA AND KUTCH +10'S +IN +13'1
BOMBAY STATE .. , +11'2 +1N +13'3 239
Greater Bombay ...... , , Bombay Gujarat Division +15'5 +15'0 +12'4 279
Banaskantha ,<!-28'1 +16'6 +7'0 175 Sabarkantha +18'7 +16'7 +IB'9 265 Mehsana +20'0 +?'4 +9'4 293 Ahmedabad +11'1 +11'9 +11'3 213 Kaira +9'2 +20'0 +7'5. 494 Panch Mahals +17'5 +16'4 +17"7 293 Baroda +12'7 +15"6 +16'1 329 Broach +10'2 +16'3 +14'8 199 Surat +16'8 +15'2 +11'9 358 Amreli +9'0 +15'2 +17'7 160
Bombay Deccan Northern Division +12'0 +12'3 +17'9 214
West Khandesh +21'8 +15'9 +18'5 IBO East Khandesh +4'0 +6'6 +10'0 243 Dangs +17'5 +20'1 +3B'7 72 Nasik +11'0 +11'9 +21'7 185 Ahmednagar +19'1 +15'4 +37'8 192 Poona +3'5 +12'9 +16'5 203 SataraNorth +11'8 +12'4 +13'7 265 Satara South +5'6 +14'8 +16'6 251 Kolhapur +14'1 +12'0 +12'2 361 Sholapur +18'1 +10'2 +16'6 18S
Bombay Deccan Southern Division +6'0 +12'2 +7'9 217 Belgaum -rI'3 +14"6 +11 '8 259 Bijapur +10'2 +10'8 +8'5 178 Dharwar +8'1 +10'6 +2'8 224
Bombay Konkan Division, .. +5'2 +7'6 +10'4 249
ThaDa +7"6 +9'9 +9'2 276 Kolaba +9'7 +6'9 +12'0 304 Ratnagiri +1'0 +7'2 +12'3 320 KaDara +7'6 +5'1 +2'9 101
SAURASHTRA STATE +7"6 +15'8 +13'3 Halar +10'0 +16'0 +12'2 122 Madhya Saurashtra +1'1 +12'7 +13'1 155 Zalawad +10'4 +10'1 +10'2 104 Gohilwad +9'5 +20'2 +10'8 203 Soratb +9'2 +17'7 +18'8
KUTCH STATE +10'0 -3,7 +5'9 56

SUBSIDIARY TABLE 2'3
Mean Decennial Growth Rates during Three Decades-Rural Population
The figures of mean population given in columns 2 to 4 pertain to areas which were treated as rural at the respective censuses.
(2) The hgures of mean population given in columns 5, 6 and 7 pertain to areas, which were treated as rural in the decades concerned, and for which hgures of births and deaths were available.
(3) Figures of births and deaths were not available for the following districts :-
(1) Banaskantha (4) Baroda
(2) Sabarkantha (5) Dangs-
(3) Mehsana (6) Satara South.
(4) Figures of births and deaths were available for the decades 1921-30 and 1931-40 for the old districts of Ahmedabad and Satara of Bombay Province. On the merger of the Indian States and the reconstitution of the districts during the past decade, there were ~ajor changes in the constitution of these districts, and no adjustments for these changes could be made in the figures of births and deaths which were available for old districts for years prior to their reconstitution or for new districts for years after their constitution. Therefore hgures of births and deaths have not been given for 1941-50 for Ahmedabad and Satara North. The hgures for 1921-30 and 1931-40 given for these districts pertain to the old districts of Ahmedabad and Satara.
(5) In the case of the following districts, th~ figures of births and deaths and of the mean population of the area under registration given in columns 5, 6 and 7 pertain to the areas of the districts, less the areas of the former Indian States merged in them:-
Panch Mahals, Broach, Surat, Nasik, Poona, Sholapur, Belgaum, Bijapur, Dharwar, Kolaba and Ratnagiri. -
(6) The hgures of births and deaths and of the mean population of the area under registration given for Amreli I
District pertain to that district, excluding Chagha peta.
MO-ll Bk H 91-250

212
----------------------
State, Natural Division and District.
BOMBAY STATE
Creater Bombay
Bombay Guiarat Division
Banaskantha
Sabarkantha
Mehsana
Ahmedabad
Kaira
Panch Mahals
Baroda
Broach
Surat
AmreIi
Bombay Deccan Northern' Division ...
West Khandesa
East Khandesh
Dangs
Nasik
Ahmednagar
Poena
SataraNerth
Satara South
Kolhapur
Sholapur
B •• bay Deccan Sot1thern Division .. ,
Be1laum
Bijapur
Dharwar
B~mbag Konkan Division
Titans
Iolsbs
Ratnagiri
Kanara
SUBSIDIARY \
Mean Decennial Growth Rates during
Mean Population of D~::~--~.·I-::~~:::n~of~ Decade for Areaund-:--Registration 0 Births and Deaths,
1941·50
2
23,537,120
7,907,188
616,064
584,947
1,052,764
655,039
1,107,996
936,129
846,973
550,391
1,335,652
221,233
8,601,167
865,411
984,637
43,759
1,007,420
1,100,178
1,097,158
961,236
694,255
891,217
955,896
3,367,771
1,301,104
1,024,808
1,041,859
3,661,594
958,243
777,251
1,545,870
380,230
1931.40
3
Zl,062,.99
6,859,114
501,693
496,589
923,942
587,724
970,759
800,173
742,723
487,135
1,150,644
197,732
7,669,352
726,639
935,265
36,866
904,024
937,432
1,016,306
857,265
631,731
787,778
836,046
3,091,014
1,210,546
927,478
952,990
3,443,019
881,817
717,646
1,486,157
357,399
1921.30
4
18,671,915
6,029,430
44 ,080
421,806
852,472 , 526,755
851,5~
683,859
641,328
421,448
1,012,169
169,918
6,674,784
620,523
864,084
28,819
777,196
751,045
886,915
758,533
546,275
702,751
738,643
2,806,935
1,068,807
845,746
892,382
3,160,766
804,809
656,719
1,355,628
343,610
1941.50
5
15,565,010
2,804,572
Not available
1,120.488
484,092
308,057
704,156
187,779
6,573,3'12
865,411
984,637
991,882
1,100,178 ill
982,956
Not available
888,434
759,814
2,886,500
1,071,650
877.324
937,526
3,300,626
958,243
651,826
1,310,327
380,230
1931.40
6
15,863,069
3,099,715
Not available
Not available
Not available
635,007
994,794
413,039
Not available
282,696
605,984
168,195
6,990,505
726,639
935,265
Not available
892,409
937,432
913,967
1,131,718
Not available
782,529
670,546
2,675,018
1,011,758
799,489
863,771
3,097,831
882,504
600,947
1,256,981
357,399
1921.30
7
14,075,499
2,715,822
562,905
872,298
350,905
251,470
533,192
145,052
6,085,208
620,523
864,084
765,825
751,045
793,935
999.326
698,285
592,185
2,435,802
899,692
727,393
808,717
2,838;667
801,823
549,049
1,144,186
343,609

TABLE Z'3 713
Three Decades-Rura~ Population
I _----------------------
Growth of Papulation during Decade, Mean Decennial Growth Rate,
_I ,State, Natural Division and District,
1941·50 1931.40 1921·30 1941·50 1931-40 1921.3()
8 9 10 11 12 13
-,------------------
2,49S,180 2,454,263 2,326,904 10'6 11'7 12'5 BOMBAY STATE
Greater Bombay
1,140,671 955,473 703,895 14'4 13'9 I J '7 Bomhay Gujarat Division
151,779 76,963 30,264 24'6 15'3 6'8 Banaskantha
100,116 76,600 72,967 17'1 15'4 17'3 Sabarkantha
191.333 66,312 76,627 18'2 7'2 9'0 Mehsana
66,B12 65,819 56,119 10'5 11'2 10'7 Ahmedabad
97,790 176,684 61,644 8'8 18'2 1'2 Kaira
150,313 121,599 III ,028 16'1 15'2 16'2 Panch Maha!s
101,109 107,392 95,398 11'9 14'5 14'9 Baroda
53,273 73,234 58,140 9'7 15'0 13'8 Broach
207,079 162,936 114,014 IS'S 14'2 11'3 Surat
19,068 27,934 27,694 8'6 14'1 16'3 Amreli
972,430 891,200 1,097,935 11'3 11'6 16'4 Bombay Deccan North,m DiVision
170,284 107,2S9 104,973 19'7 14'8 16'9 West Khandesh
38,562 60,182 62,180 3'9 6'4 9'5 East Khandesh
7,046 6,741 9,353 16'1 18'3 32'5 Dangs
105,093 101,698 151,958 10'4 11'2 19'6 Nasik I >
191,726 133,766 239,008 17'4 14'3 31'8 Ahmednagar
38,189 123,516 135,265 3'5 12'2 15'3 PooDa
107,468 100.473 96,992 11'2 11'7 12'8 5 atara North
37,912 87,136 83,775 5'S I3'B 15'3 Salara South
117,746 89,133 80,920 13'2 11'3 11'5 Kolhapur
158,404 81,296 113,511 166 9'7 15'4 Sholapur
197,563 355,949 212,210 5'9 II'S 7'6 Bomhay Deccan Southern Divi,ion
16,270 164,845 118,633 1'3 13'6 11'1 Belgaum
99,846 94,815 68,648 9'7 10'2 8'1 Bijllpur
81,447 96,289 24,929 7'8 10'1 2"S Dhllrwar
185,5]0 251,641 312,864 5'1 7'3 9'9 Bomhay Konkan Division
69.947 82,904 71,111 7'3 9'4 8'8 Thana
71,608 47,602 74,253 9-2 6'6 11'3 Kolaba
15,976 103,451 151,605 1'0 7'0 11'6 Ratnagiri
27.979 17,684 9,895 7'4 4'9 2'9 Kanara

214 SUBSIDIARY
Mean Decenniab Growth Rates during
_"-. -----------------
Registered Births during Decade. Mean Decennial Birth Rate (~egistered).
Registered Deaths during Decade.
-------------------State. Natural Division
and District. 1941-50 1931-40 1921-30 1941-50 1931-40 1921-30 1941-50 1931-40 1921-30
14 15 16 17 18 19 20 21 22
--------..
BOMBAY STATE ... 5,577,388 6,376,172 5,598,524 35'8 40'2 39'S 3,807,741 4,148,790 3,865,551
Greater Bombay
Bombay Gujaral Division 1,015,657 1,221,41j 1,011,661 36'2 39'4 37'3 693,519 BD4,889 704,230
Banaskaotha Not available
Sabarknntha ~ot available
Mehs80a Not available
Ahmedabad .. , Not available 264,094 204,434 Not available 41 '6 36'3 Not available 178,523 146,702
Kaira 355,853 357,993 288,625 31'8 36'0 33'1 261,959 255,111 217,222
Panch Mahals 173,330 157,652 134,557 35'8 38'2 38'3 104,417 95,221 75,212
Baroda Not available
Broach 134,561 131,164 111,485 43'7 46'4 44'3 105,468 87,771 80,408
Surat 274,046 241,433 219,077 38'9 39'8 41'1 168,813 147,430 149,894
Amreli 77,867 69,079 53,483 41'S 41'1 36'9 52,862 40,833 34,792
B omboy Deccan Northern Division 2,483,970 2,999,671 2,642,597 37'8 42'9 43'4 1,683,017 1,912,583 1.780,147
Welt Khaodesh 344,907 313,786 281.189 39'9 43'2 45'3 232,373 187.060 170,457
East Khandesh 395,006 434,104 459,742 40'1 46'4 53'2 306,239 287,876 314,572
Dangs Not available
Nasik 382,521 397,995 344.015 38'6 44'6 44'9. 261,253 260,120 227,301
Ahmednal[ar 392,546 405,403 331.596 35'7 43'2 44'2 255,885 257,143 217,203
Poooa 320,596 360,744 305,757 32'6 39'S 38'S 221,549 231,221 212,039
Salara North .. , Not available 471,287 401,320 Not available 41 '6 40'2 Not available 286.634 287,400
Satara South Not available
Kolhapur 325,430 317,538 262,931 36'6 40'6 37'7 189.760 195,261 170,692
Sholapur 322,964 298,814 256,047 42'S 44'6 43'2 215.958 207,268 180.483
Bombay Deccan Southern Division 1,128,711 1,109.572 957,525 39'1 41'S 39'3 774,087 751,693 697,169
Balgaum 406,867 413,421 333,960 38'0 40'9 37'1 277,022 265,268 239,7 1 IJi Bijapur 356,535 337,218 288,267 40'6 42'2 39'6 " 238,825 226,862 196,498
Dharwar 365,309 358,933 335,298 39'0 41'6 41'5 258,240 259,563 260.952
Bombay Konkan Division 949,050 1,045,514 986,741 28'8 33'7 34'8 657,118 679,625 684,005
Thana 233,056 277,461 252,853 24'3 31'4 31'S 151,932 182,951 176,667
Kolaba 205,095 224,198 201,225 31'5 37'3 36'6 149,375 141,096 145,240
Ratnagiri 383,461 419,667 406,244 29'3 33'4 35'5 270,582 247,334 252,587
Kanara 127,438 124.188 126,419 33'5 34'7 36'S 85,229 108,244 109,511

TABLE 2'3
Three Decades-Rural Population )
Meln Decennial Death Rate (Regittered),
1941.50
23
24"5
24'7
Not available
23'4
21'6
34'2
24'0
28'2
25"6
26'9
31'1
26'3
23'3
22'S
Not available
21'4
28'4
26'8
25'9
27'2
27'5
19'9
J5'9
22'9
20-6
22"4
1931·40
24
26'2
26'0
28'1
25'6
23'1
31'0
24"3
24"3
27"4
25'7
30'8
29'1
27"4
25'3
25'3
25'0
30'9
28'1
26'2
28'4
30'6
21'9
20'7
23'5
19'7
30-3
1921·30
25 ,
27'5
25'9
26'1
24'9
21'4
32'0
28'1
24'0
29'3
27'S
36'4
29'7
28'9
26'7
28'8
24'4
30'5
28'6
26'6
27'0 •
32'3
24'1
22'0
26'5
22'1
31-9
Decennial Rate of Natural I ncrea,e (Regd ,),
1941·50
26
11'3
11'5
1931.40
27
14'0
13'4
Not available
Not available
Not available
Not available 13'5
8'4 10'4
14'2 15'1
Not available
9'5 15'4
14'9 15'5
13'3 16'8
12'2 15'5
13'0 17'5
9'0 15'6
Not available
12'3 15'5
12'4 15'8
10'1 14'2
Not available 16'3
Not available
15'2 15'6
14'1 13'7
12'3 13"4
12'1 1.4'7
13'4 13'8
\1'5 11'0
8'9 11'8
8'4 10'7
8-6 13-8
8'7 13-7
11-' 4-4
1921.30
28
12'3
11'4
10'2
8'2
16'9
12'3
13'0
12'9
14'1
IN
16'8
15'2
15'3
11'8
11'4
13'3
12"7
10'7
10'5
12'6
9'2
10'7
9'5
10'1
13'4
4'9
Migration .cum.Registration Error,
215
------------- State, Natural Division
1941·50
29
-0'7
+2"9
Not al'ailable
+0'4
+1'9
+0'2
+0'6
-4'7
-0'9
+6'7
-5'1
-1'9
+5'0
-6'6
Noi available
-2'0
+2'5
-6'4
-10'8
-3"7 -3'7
-3'8
-1'1
+0-6
-7"7
-3"7
1931·40
30
-2'3
+0'5
-2'3
+7'8
+0'1
-0'4
-1'3
-2'7
-3'9
-2'7
-9'2
-4'3
-1'5
-2'0
-4'6
-4'3
-4'0
-1'9
-1'1
-3'6
-0'9
-4'5
-1'3
-7-2
-6'7
+0'5
1921·30
31
+0'2
+0'3
+0'5
-1'0
-0'7
+1';
-.1'7
+3'4
+2'3
-0'9
-7'3
+4'4
+16'5
+3'5
+1'4
-1'8
+2'7
-3'1
+0'6
-4"5 -6'4
-0'8
-0'7
+1-2
-1'8
-2'0
and District.
BOMBAY STATE
Greater Bombay
Bomhay Gujarat Division
Banaskantha
Sabarkantha
Mehsana
Ahmedabad
Kaira
Panch Mahala
Baroda
Broach
Sural
Amreli
Bombay Deccan Northern Division
West Khandesh
East Khandesh
Dangs
Nasik
Ahmcdnagar
Poona
Satara North
Satara South
Kolhapur
Sho]apur
Bombay Deccan Southern Division
Belgaum
Bijapur
Dharwar
Bombay Konkan Division
Thana
Kolaba
Ratoagiri
Kanara

216
State, Natural Division and District.
BOMBAY, SAURASHTRA AND KUTCH
BOMBAY STATE
Greater Bombay
Bombay Gujarat Division Banaskantha Sabarkantha Mehsana Ahmedabad Kaira Panch MahaIs Baroda Broach Surat Amreli
Bombay Deccan Northern Division
West Khandesh East Khandesh Dangs Nasik Ahmednagar Poona SataraNorth Satara South Kolhapur ... ... Sholapur ...
Bombay Deccan Southern Division
BelgaUD] Bijapur Dharwar
Bombay Konkan Division Thana Kolaba Ratnagiri Kanara
SAURASHTRA STATE HaIar Madhya Saurashtra Zalawad GohlIwad ... Sorath
KUTCH STATE
2
5,389
5,526
5,423 4,891 7,103 5,521 3,67() 6,163 7,633 5,136
' 4,276 4,341 4,481
6,551 6,216 5,886 8,742 6,512 6,428 6,968 7,504 7,501 6,508 5.586
5.428 5,416 5,839 5.034
3,369 3.008 2,894 4,210 1,945
4,486 5,096 4,638 3,058 4,141 5,091
3,346
SUBSIDIARY TABLE 2' 4
Livelihood Pattern of Rural Population
Number per 10,000 of Rural Population belonging to Livelihood Class
II
3
1,292
1,304
1,230 .2,410
204 514
1,530 1,308 1,350 1,125 1,501 1,387 1,027
471 367 253 67
410 247 301 205 519
1,462 619
1.260 1,717
836 1.129
3,530 3.547 4,615 2,808 4.092
1,204 792
1,126 2,139 1,082 1.163
1,145
III
4
1,098
1,175
1,045 192 380 666
1,161 780 261
1,609 2,454 1,826 1,123
1,322 2,243 2,545
227 1,420 1,327
553 430 658 701
1.967
1.743 1.265 1,888 2.177
587 1.103
351 265
1.048
528 280 339 527 792 563
344
IV
5
216
216
' 216 i5~
168 ' 403 379 288
51 262 196 77
223
204 47 59 2
167 252 247 346 191 153 355
318 295 285 378
148 84
175 146 257
228 234 193 335 304 123
186
V
6
797
692
761 844 827
1,184 1,265
564 261 479 378 862
1,336
604 423 523 377 553 764 682 728 473 551 659
568 630 513 547
865 901 650 889
1.125
1,554 1,851 i,654 1.792 1,335 1,394
1,920
VI
7
268
239
304 481 395 447 466 217 112 278 179 235 455
186 172 169 77
217 205 226
* 178 127 167 188
201 172 182 254
259 239 248
.257 337
436 423 410 408 525 393
801
VII
8
88
88
100 125 47
124 106 33 22
117 35
217 86
55 20 95 6
99 44 58 27 62 15 71
22 27 13 26
199 170 176 240 159
86 116 109 39
100 58
151
VIII
9
852
760
921 902 876
1,141 1,423
647 310 994 981
1,055 1,269
607 512 470 502 622 733 965 582 469 443 555,
460 478 444 455
1.043 948 891
1.185 1.037
1,478 1.208 1.531 1,702 1,721 1,215
2,107

2.17
SUBSIDIARY TABLE 3'1
Distribution of Population between Towns
State, Natural Division and District. No. per 1,000 Number per 1,000 of Urban Population in Towns with
Population per of General a population of Town. Population in
Towns. 20,000 and 10,000 to 5,000 to Under 5,000. over. 20,000. 10,000.
I 2 3 4 5 6 7
BOMBAY, SAURASHTRA AND KUTCH ... 21,342 312 684 120 178 18
BOMBAY STATE 22,385 311 692 119 178 11
Greater Bombay 2,839,270 1,000 1.000
Bombay Gujarat Divisirm ... 19,859 256 662 130 197 11
Banaskantha 11,368 76 398 408 116 78 Sabarkantba 8.169 72 223 777 Mehsana 11,972 220 480 229 291 Ahmedabad 47,437 591 839 70 91 Kaira 11,988 283 439 196 343 22 Panch Mahala 17,143 119 601 182 217 Baroda 29,722 249 795 50 122 33 Broach 18,429 183 486 364 150 Surat 25,910 213 798 66 122 14 Amreli B,644 272 322 642 36
Bombay Deccan NOTthern Division 17,340 265 612 146 227 15
West Khandesh 16,289 171 547 255 152 46 East Khandesh 16,118 318 517 283 200 Dangs Nasik 15,415 259 664 126 185 25 Ahmednagar 16,526 152 490 208 302 Poona 23,187 428 725 94 160 21 Satara North 10,689 136 417 176 379 28 Satara South 10,627 287 316 144 540 Kolhapur 14,603 226 592 36 347 25 Sholapur 33,587 312 807 103 90
Bomhay Deccan Sollthern Division 13,688 262 454 221 307 18
BelgaWD 11,602 242 264 385 339 12 Bijapur f 12,858 230 503 133 364
Dharwar 16,993 3J3 582 139 243 36
Bomhay Konh,an DiviJion .. , 12,535 194 431 221 319 29
Thana 15,436 346 589 144 230 31
KoJaba 8,002 106 369 571 60
Ratnagiri ". a 12,162 92 504 179 287 30
Kanara 9,505 239 486 514
SAURASHTRA STATE 16,390 337 636 125 183 56
Halar 15,762 329 552 80 271 97
Madhya Saurashtra 18,601 391 745 97 117 41
Zalawad 12,556 304 553 121 270 56
Gohilwad 18,556 309 670 105 183 42
Sorath 14,939 328 554 206 177 63
KUTCH STATE 11,375 200 530 170 158 142

218
SUBSIDIARY TABLE 3'2
Variation and Density of ' Urban Population
Note.-The density figures shown in column 5 of this table are the sarne as those shown in the E Table. They have been worked out on the basis of the area ligures obtained fro:n Collectors, District Inspectors of Land Records, or other local sources.
State, Natural Division and District.
BOMBAY, SAURASHTRA AND KUTCH ...
BOMBAY STATE
Greater Bombay
Bombay Gujarat Divi3ion
Banaskantha Sabarkantha Mehsana Ahmedabad Kaira Panch Mahals Baroda Broach Surat Amreli
Bombay Deccan Northern Division
West Khandesh East Khandesh Dangs Nasik Ahmednagar Poooa Satara North Salara South Kolhapur Sholapur
Bomooy Deccan Southern Division
Belgaum Bijapur Dharwat
Bombay Konkan Division
Thana Kolaba Ratnagiri Kanara
SAURASHTRA STATE
Halar Madhya Saurashtra Zalawad Gohilwad Sorath
KUTCH STATE
Percentage increase (+) or decrease (-).
1941 to 1951
2
+58'5
+62'1
+67'5
+34'5
+32'1 +28'.8 +15'9 +44'5 +64'4
+37'6 +26'6 +10'1 +19'8 +25'9
+68'5
+46'4 +31'8
+114'2 +80'9
+111'4 +53'8
+106'4 +58'2 +33'8
+68'3
+128'9 +60'4 +41'1
+159'0
+335'7 +?0'7 +77'0 +64'9
+38'0
+45'3 +51'7 +39'2 +33'8 +23'9
+19'3
1931 to 1941
3
+27'9
+27'4
+30'1
+42'3
- 0'6 +23'7 +39'9 +77'0 +15'1 +4'3 +32'7 +36'6 +50'2 +41'9
+22'4
+33'0 +21'0
+10'4 +20'3 +22'9 +20'4 +15'2 +27'7 +28'2
+ 9'9
+ 9'6 +20'4 +4'8
+7'6
+31'1 + 2'0 -lo·S '+ 8'1
+34'3
+40'5 +31'8 +17'5 +26'1 +51'7
+3'7
1921 to 1931
4
+12'9
+11'6
+ 0'6
+11'5
+19'9 +15'1 +16'5 +10'6 +13'7 +30'5 +17'4 + 5'6 - 0'9 + 0'7
+18'3
+34'3 +18'8
+ 8'2 +12'6 +12'5 +15'1 +29'8 -1:27 '4 +20'6
+19'4
+28'3 +13'6 +18'3
+1 .
+22'7 + 7'] +17"7 +9'9
+22'5
+46'0 +23'6 + 9'1 +25'0 +16'3
+15'4
Density 1951.
5
2,029
31,269
3,089
1,771 901
1.620 6,369 2,058 2,810 4,921 3,707 8,542 .949
1,249
1,671 1,410
1,373 930
1,567 849 591
1,679 1,552
849
855 626
1,098
2,407
3,455 2,281 1,295 2,087
763 1,298
760 1,543
560

SUBSIDIARY TABLE 3'3
Mean Decennial Growth Rates during Three Decades-Urban Population
. The figures of mean population given in columns 2 to 4 pertain to areas which were treated as urban at the respectiV'e censuses. .
(2) The figures of population given in columns 5, 6 and. 7 pertain to areas which were treated as urban in the decades concerned and for which figures of births and deaths were available.
(3) Figures of births and deaths were not available for the following districts :-(1) Banaskantha (3) Mehsllna (5) Satara South. (2) Sabarkantha (4) Baroda
(4) Figures of births and deaths were available for the decades 1921-30 and 1931-40 for the old districts of Ahmedabad and Satara in Bombay Province. On the merger of the Indian States and the reconstitution of districts during the past decade, there were major changes in the constitution of these districts. No adjustments for the£e changes could be made in the figures of births and deaths which were available for old districts for years prior to their reconstitution or for new districts for years after their constitution. Therefore figures of births and deaths have not been given for 1941-50 for Ahmedabad and Satara North Districts. The figures for 1921-30 and 1931-40 given for these districts pertain to the old districts of Ahmedabad and Satara in Bombay Province.
(5) In the case of the following districts, the figures of births and deaths and of the mean population of the area under registration given in columns 5, 6 and 7 pertain to the areas of the districts less the areas of the former Indian States merged in them :-
(I) Panch Mahals (2) Broach (3) Surat (4) Nasik (7) Belgaum (8) Bijapur (9) Dharwar (10) Kolaba
(5) Poona (11) Ratnagiri.
(6) Sholapur
(6) The figures of births, deaths and of the mean population of the area under registration given for Amreli District pertain to that district excluding Chogho peta.

au
SUBSIDIARY
Mean Decennial Growth Rates during
----Mean Population of Decade. Mean Population of Decade for Area under
Registration of Births and Deaths. State, Natural Division and District.
1941.50 1931-40 1921·30 1941.50 1931-40 1921·30
1 2 3 4 5 6
BOMBAY STATE 9,030,928 6,149,412 5,126,027 6,762,137 5,166,148 4,326,767
Greater Bombay 2,267,219 1,498.l?42 1,298,336 2,267,219 1,498,842 1,298,336
Bombay Gujarat Division 2,545,192 1,848,688 1,447,61)0 881,505 1,186,654 918,164
Banaskantha 49,929 43,136 39,660 Not available
Sabarkantha 43,535 34,413 28,745 Not available
Mehsana 301,016 239,042 185,170 Not available
Ahmedabad 842,841 539,569 370,967 Not available 550,963 382,434
Kaira 366,366 258,987 226,248 353,874 234,952 205,545
Panch Mahals 118,408 97,605 84,382 94,780 77,887 63,788
Baroda 265,979 205,826 163,807 Not available
Broach 123,084 101,462 83,475. 104,342 82,990 69,488
Surat 356,494 270,137 216,934 253,730 181,351 150,790
Amreli 77,540 58.511 48,212 74,779 58,511 46,119
Bombay Deccan Northern Division 2,611,004 1,766,648 1,465,660 2;220,207 1,623,676 1,344,815
West Khandesh 164,494 116,963 87,591 164,494 116,963 87,591
East Khandesh 411,075 323,902 269,874 411,075 , 323,902 269,874
Dangs There is no Urban area in this district
Nasik 271,337 164,566 150,487 271,337 164,566 150,487
Ahmednagar 166,778 108,692 93,128 166,778 108,692 93,128
Poona 614,816 358,121 303,533 607,952 350,636 295,480
Satata North 132,295 95,436 80,944 Not available 121,762 102,890
Salara South 212,978 129,853 106,812 Not available
Kolhapur 226,426 156,357 122,548 229,209 161,606 127,015
Sholapur 410,805 312,758 250,743 369,362 275,549 218,350
Bomhay Deccan Southem Division ... 982,038 699,139 612,027 812,132 550,494 481,895
Belgaum 300,055 174,449 148,108 258,245 139,307 115,156
Bijapur 260.952 183,468 156,501 190,352 123,112 105,655
Dharwar 421,031 341,222 307,418 363,535 288,075 261,084
Bombay Konkan Division 625,475 336,095 302,404 581,074 306,482 283,557
Thana 322,643 106,182 83,417 322,643 105,495 86,403
Kolaba 79,869 63,090 60,232 60,275 47,874 46,783
Ratnagiri 123,725 94,726 92,584 98,918 81,016 84~199
Kanarll 99,238 72,097 66,171 99,238 72,097 66,172

221
TABLE 3'3
Three Decades-Urbatl Population
----------------------------1-----------------------------,---------------_______ _ Growth of Population during Decade,
1941-50
8
4,278,824
1,144,102
748,140
13,826
10,953
44,431
306,689
178,339
37,478
62,478
11,841
64,314
17,791
1,332,698
61.954
112,715
1931-40
9
1,484,208
392.653
644,867
-240
7,292
79,517
299,853
36,417
4,128
57,827
31,404
108,401
20,268
356,014
33,109
61,632
1921-30
10
562,562
8,358
157,310
7,192
4,043
28,227
37,351
29,062
22.319
26,212
4,570
,\1,996
330
245,963
25,635
46,424
Mean Decennial Growth Rate,
1941-50
11
47'4
50'S
29'4
27'7
25'2
14'8
36'4
48'7
31'7
23'5
9'6
18'0
22'9
51'0
37'7
27"4
1931-40
12
24'1
26'2
34'9
-0'6
21'2
33'3
55'6
14'1
4'2
28'1
30'9
40'1
34'6
20'2
28'3
19'0
There is 1].0 Urban area in this district
197,226 16,316 11,842 72'7 9'9 96,107 20,065 11,064 57"6 18'5
439,815 73,574 35,603 71'S 20'S
56,089 17,629 11,354 42'4 18'5
147,904 18,346 27,737 69"4 14-1
102,061 38,078 29,539 45'1 24'4
118,827 77,265 46,765 28'9 24'7
499,777 66,023 108,199 50'9 9'4
235,228 15,9B5 36,696 78-4 9'2 121,003 33,965 '19,970 46'4 18'5
143,546 16,073 51,533 34'1 4'7
554,107 24,651 42,732 88'6 7'3
404,382 28,539 16,992 125'3 26'9 32,3IB 1,240 4,476 40'S 2'0 68,763 -10,766 15,051 55-6 -11'4 48,644 5,638 6,213 49'0 7'8
1921-30
13
11'0
0'6
10'9
18'1
14'1
15'2
10'1
12'8
26'4
16'0
5'5
-0'9
0'7
16'8
29-3
17'2
7-9
11-9
11'7
14'0
26'0
24'1
18'6
17'7
24'8
12'8
16'8
14'1
20'4 7'4
16'3 9'4
State, Natural Division and District,
BOMBAY STATE
Greater Bombay
Bombay Gujarat Division
Banaskantha
Sabarkantha
Mehsana
Ahmedabad
Kaira
Panch Mahals
Baroda
Broach
Surat
Amreli
Bombay Deccan Northern Division
West Khandesh
East Khandesh
Dangs
Nasik
Ahmednagar
Poona
Satara North
Satara South
Kolhapur
Sholapur
Bombay Deccan Southern Division
Belgaum
Bijapur
Dharwar
Bombay Konk_an Division
Thana Kolaba Ratnagiri Kanara

222
State, Natural Division and District.
BOMBAY STATE
Greater BDmbay
Bombay Gujarat Division
Banaskantha
Sabarkantha
Mehsana
Ahmedabad
Kaira
Panch Mahals
BarDda
Broach
Surat
Amreli
Bombay Deccan Northern Dioision ...
West Khandesh
East Khandesh
Dangs
Nasik
Ahmednagar
Poona
Satara North
Satara South
Kolhapur
Sholapur
Bombay Deccan Srnlthern DiVision
Belgaum
Bijapur
Dharwar
Bombay Konkan Division
Thana Kolaba Ratnagiri Kanara
Registered Births during Decade.
1941-50
14
1,764,193
523,190
319,442
Not available
131,816
22,031
40,540
100,786
24,269
621,6S1
44,181
123,494
56,623
40,474
123,834
1931-40
15
1,439,999
380,164
445,303
201,584
100,887
17,221
33,785
70,720
21,106
403,954
26,555
72,756
36,294
28,645
80,805
Not available 22,037
90,920 37,093
142,125 99,769
201.793 133,155
50,213 27,662
50.962 33,140
100,618 72,353
98,117 77,423
30,687 17,693 17,484 19,312 27.569 21.891 22,377 18,527
1921-30
16
I,OD5,245
244,472
303,971
132,481
69,491
14,134
28,880
45,113
13,872
250,794
16,728
47,940
29,713
15,808
41,280
13,314
25,649
60,362
134,943
52,842
28,802
53,299
71,065
14,901 22,029 19,615 14,520
SUBSIDIARY
Mean Decennial trowth Rates during
Mean Decennial Birth Rate (Registered),
1941-50
17
26'1
,23'1
36'2 '.
Not available
37'2
23"2
38'9
39'7
32'5
28'0
26'9
30'0
1931-40
18
27'9
25'4
37"5
Not-,available
Not available
Not available,
36'6
42'9
22'1
Not available
40'7
39'0
36'1
24"9
22'7
22'5
1921-30
19
23'2
18'8
33'1
34"6
33'8
22'2
41'6
29'9,
30'1
18'6
19'1
17'8
Registered Deaths during Decade.
1941-50 1931-40
20 21
1,23D,635 1,126,319
363,410 316,242
219,138 336,757
Not available 165,850
99,415 72,477
10,949 10572
25,958 20,041
66,887 55,036
15,929 12,781
461,650 330,744
30,040 16,140
81,160 50,766
1921-30
22
1,046,758
365,409
265,177
128,736
58,788
9,087
19,274
39,060
10,232
275,579
11,087
40,007
There is no Urban area in this district e
20'9 22'1 19'7 45,148 37,115 31,117
24'3 26'4 17'0 23,977 17,411 11,374
20'4 23'0 14'0 111,067 80,787 '73,365
Not available 18'1 12'9 Not available 17,335 15,058
Not available
39'7 23'0 20'2 59,870 32,040 25,686 ·38'5 36'2 27'6 110,388 79.150 67,885
24'8 24'2 28'0 131,370 97715 97.419
19'4 19'9 45'9 33,060 22,296 24,340
26'8 i6'9 27"3 33537 26,028 24,639 27'7 25'1 20'4 64,173 49,391 48,440
16'9 25'3 25'1 55.067 44,B61 43,174
9'5 16'8 17'2 18,194 13,830 14,769 29'0 40'3 47'! 9,539 6,609 5.187 27'9 27'0 23'3 15,326 15,258 14.149 22'5 25'7 21'9 12,008 9,164 9,069

223·
TABLE 3'3
Three Decades-Urbin Population
I -----------
Mean Decennial Death Rate I Decennial Rate of Natural Increase Migration-cum-Registration Error, (Registered),
I (Registered),
State. Natural Division
1921-30 I and District,
1941-50 1931-40 1941-50 1931-40 1921-30 1941-50 1931-40 1921-30
.23 24 25 I 26 27 28 29 30 31
18'2 21'8 24'2 7'9 6'1 -1'0 +39'5 +18'0 +12'0 BOMBAY STATE
16'0 21'1 28'1 7'1 4"3 -9'3 +43"4 +21'9 +9'9 Greater Bombay
24'9 28'4 28'9 11'3 9'1 4'2 +18'1 +25'8 +6'7 Bombay Gujarat Division
Not available Banaskantha
Not available Sabarkantha
Not available Mehsana
Not available 30'1 33'7 Not available 6'5 0'9 Not available +49'1 +9'2 Ahmedabad
'28'1 30'8 28'6 9'1 12'1 5'2 +39'6 +2'0 +7'6 Kaira
11'6 13'6 14'2 11'6 8'5 8'0 +20;1 -4'3 +18"4 Panch Mahals
Not available Baroda
24'9 24'1 27'7 14'0 16'6 13'9 -4'4 +14'3 -8'4 Broach
26'4 30'3 25'9 13'3 8'7 4'0 +4'7 +31'4 -4'9 Surat
21'3 21'8 22'2 11'2 14'3 7'9 +11'7 +20'3 -7'2 Amreli
20'8 20'4 20'S 7'2 4'5 -1'9 +43'8 +15'7 +18'7 Bombay Deccan Northern Divis ion
18'3 13"8 , 12'7 8'6 8'9 6'4 +29'1 +19'4 +22'9 West Khandesh
19'7 15'7 14'8 10'3 6'8 3'0 +17'1 +12'2 +14'2 East Khandesh
" ~ There is no Urban area in this district Dangs
16'6 22'6 20'7 4"3 -0'5 -1'0 +68'4 +10'4 +8'9 Nasik
14'4 16'0 12'2 9'9 10'4 4'S +47"7 +8'1 +7'1 Ahmednagar
18'3 23'0 24'8 2'1 0 -10'8 +69'4 +20'5 +22'5 Poona
Not available 14'2 14'6 Not available 3'9 -1'7 Not available +14'6 +15'7 Satara North
Not available Satara South
26'1 19'8 20'2 13'6 3'2 0 +31'5 +21'2 +24'1 Kolbapur
29'9 28'7 31'1 8'6 7'5 -3'5 +20'3 +17'2 +22'1 Sholapur
16'2 17'8 20'2 8'6 6'4 7'8 +42'3 +3'0 +9'9 Bombay Deccan Southern Division
12'8 16'0 21'1 6'6 3'9 24'8 +71'S +5'3 0 ,Belgaum
17'6 21'1 23'3 9'2 5'S 4'0 +37'2 +12'7 +8'8 Bijapur
17'6 17'1 18'6 9'9 S'O I'S +24'2 -3'3 +15'0 Dbarwar
9'5 14'6 15'2 7'4 10'7 9'9 +81'2 -3"4 +4'2 Bombay Konkan Division •
5'6 13'1 17'1 3'9 3"7 0'1 +121'4 +23'2 +20'3 Thana 15'8 13'8 11'1 13'2 26'S 36'0 +27'3 -24'5 -28'6 Kolaba 15'5 18'S 16'8 12"4 8'2 6'5 +43'2 -19'6 +9'8 Ratnagiri 12'1 12'7 13'7 10'4 13'0 8'2 +38'6 ~5'2 +1'2 Kanara
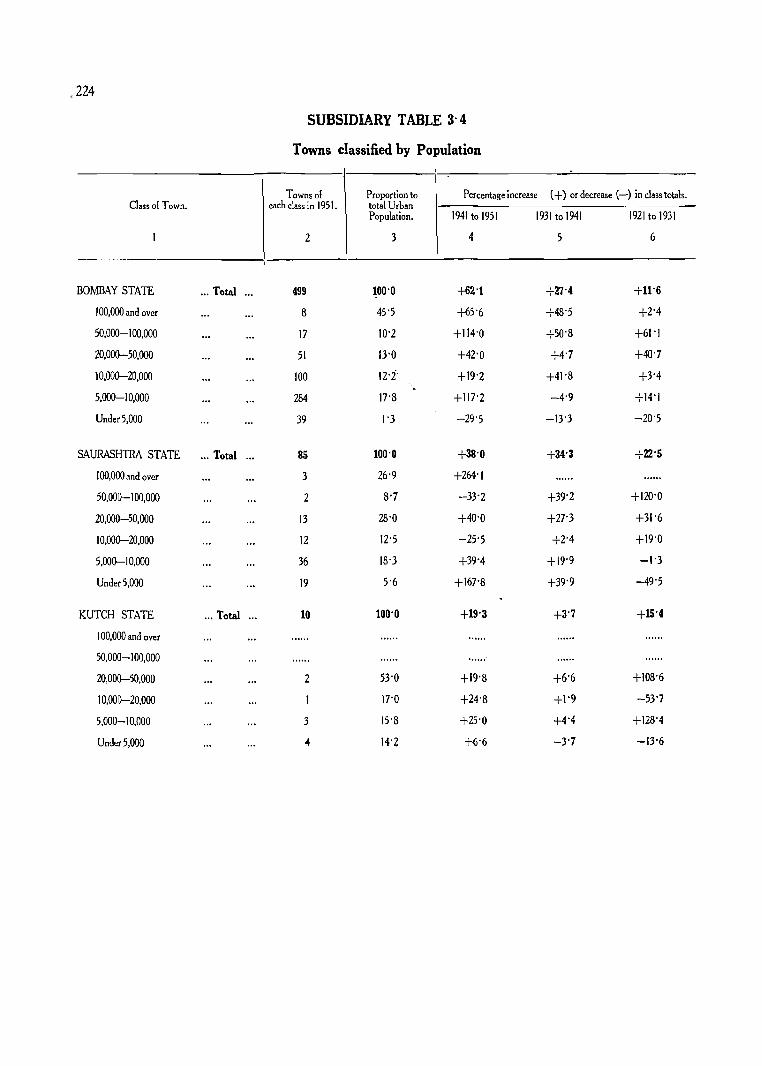
Class of Town.
BOMBAY STATE ... Total
100,000 and over
50,000-100,000
20,Om-50,OOO
10,000-20,000
5,000-10,000
Under 5,000
SAURASHTRA STATE .. , Total
100,000 and over
50,000-100,000
20,000-50,000
10,000-20,000
5,000-10,000
Under 5,000
KUTCH STATE ' .. Total
100,000 and over
50,000-100,000
20,000-50,000
10,000-20,000
5,000-10,000
UnderS,OOO
SUBSIDIARY TABLE 3'4
Towns classified by Population
Towns of each class in 1951.
Proportion to total Urban Population.
Percentage increase (+) or decrease (-) in class totals.
Z 3
499 100'0
8 45'S
17 10'Z
51 13'0
100 IZ,t ,
284 17'8
39 1'3
85 100'0
3 26'9
2 8'7
13 28'0
12 12'5
36 18'3
19 5'6
10 100'0
2 53'0
17'0
3 15'8
04 14'2
1941 to 1951
4
+62'1
+65'6
+114'0
+42'0
+19'2
+117'2
-29'5
+38'0
+264'1
-33'2
+40'0
-25'5
+39'4
+167'8
+19'3
...... +19'8
+24'8
+25'0
+6'6
1931 to 1941
5
+27"4
+48'5
+50'8
H'7
Hl'8
-4'9
-13'3
+34'3
+39'2
+27'3
+2'4
+19'9
+39'9
+3'7
+6'6
+1'9
+4'4
-3'7
19Z1 to 1931
6
+11"6
+2'4
+61'1
+40'7
+3'4
+14'1
-20'5
+22'5
+120'0
+31'6
+19'0
-1'3
-49'5
+15'4
+108'6
-53'7
+128'4
-13'6

City,
BOMBAY STATE
(1) Greater Bombay
(2) Ahmedabad City
(3) Poona
(4) Sholapur (including Suburbs)
(5) Surat
(6) Baroda
(7) Kolhapur
(8) Hubli
SAURASHTRA STATE
(I) Bhavnagar
(2) Raikot
(3) Jamnagar
__ ..... 01. un. _~£
225
SUBSIDIARY TABLE 3'5
Cities-Chief Figures
Population, Density,
2 3
2.839.270 25.579
788.333 38.834
480.982 9.620
277.087 9.655
223,182 58,732
211.407 19,395
136,835 5,518
129,609 6,416
137.951 5,109
132.069 5,262
104,419 3,601
Percentage increa,e (+) or decrease (-),
1941 to 1951
4
+67'5
+33'3
+72'9
+30'1..
+30'2
+37'9
+47'1
+35'7
+34'1
+99'0
+45'9
1931 to 1941
5
+30'1
+90'7
+30'2
+47'0
+73'3
+35'8
+39'4
+14'4
+36'1
+12'2
+30'0
1921 to 1931
6
+0'6
+14'5
+18'6
+21'0
-15'8
+19'2
+33'6
+25'0
+27'3
+28'9
+29'6

226
SUBSIDIARY TABLE 3' 6
N umber per 1,000 of the General Population and of each Livelihood Class who live in Towns
Slate, Natural Division and District.
BOMBAY, SAURASHTRA AND KUTCH
BOMBAY STATE '"
Greater Bombay
Bomhay Gujaral Division Banaskantha Sabarkantha Mehsana Abmedabad lttUra Panch Mahals Baroda Broach Surat Amreli
Bombay Deccan Northern Division '" West Khandesh ... East Khandesh '" Dangs Nasik Abmednagar Poona Satara North Satara South Kolhapur Shoiapur
Bombay Deccan Southern Division '" Belgaum' Bijapur Dharwar
Bombay Konkan Diuision Thana Kolaba Ratnagiri Kanara
SAURASHTRA STATE Halar Mll[lhya Saurashtra Zaiawad Gohilwad Sorath
KUTCH STATE
General Livelihood Class Population. 1---------------------------
2 3
312 67
311 65
1,000 1,000
256 42 76 8 72 10
220 85 591 .55 283 96 119 17 249 18 183 28 213 14 272 .62
265 ·77 171 38 318 135
259 50 152 36 428 100 136 44 287 181 226 67 312 49
262 95 242 109 230 76 313 100
194 40 346 76 106 32 92 23
239 65
337 92 329 80 391 119 304 100' 309 69 328 91
200 41
II
4
69
72
1,000
66 3
77 102 61
222 35 30 38 13 55
114 77
212
57 65
157 83
241 98 84
123 122 102 141
43 41 17 34
110
42 40 46 48 48 28
44
III
5
103
105
1,000
50 8
16 87 78
163 66 27 20 17 56
123 61
175
100 46
230 61
263 214 79
151 155 120 173
68 81 30 28 99
73 101 123 41 44 89
75
IV
6
237
249
1,000
.225 'J2; 39
160 146 403 255 226 231 262 165
239 323 499
204 113 255 157 353 451 152
271 307 239 257
258 386 229 140 376
141 120 113 116 92
314
7D
V
7
616
653
1,000 .
593 157 142 341 844· 559 500 630 579 541. 420
591 519 65&.
643 318 715 . 293 523 518 733
595 482 616 676
397 597 29.1 206 352
427 379 451 383 476 404
199
VI
~
769
783
1,000
702 307 ' 335 565 868 742 743 722 723 724 611
743 679 788
711 611 830 5eO 753 705 808
743 732 731 759
616 ell 410 347 581
730 717 795 690 237 743
433
VII
9
732
729
1,000
562 305 400 362 831 765 '794 562 720 JOO 754
739 728 719
666 55~
877 616 557 M4 724
640 756 846 887
431 677 308 214 431
778 773 745 839 149 844
512
VIII
10
629
649
1,000
532 277 256 423 715 633 603 580 470 442 512
661 590 719
658 491 767 479 644 670 679
647 622 607 702
456 678 322 231 497
SS6 594 612 488 360 602
327

State, Natural Diviiion And ' District.
BOMBAY, SAURASHTRA AND KUTCH
BOMBAY STATE
Greater Bombay
Bombay Gujarat Division Banaskantha Sabarkantha Mehsana Ahmedabad Kaira Panch Mahala Baroda Broach Surat Amreli
Bombay Deccan Northern Division
West Khandesh East Khandesh Danga Nasik Ahmednagar Poona Satara North Satara South Kolhapur Shoiapur
Bombay Decccm Southern Division
Belgaum Bijapur Dharwar
Bombay Konkan Division Thana Kolaba Ratnagiri Kanara
SAURASHTRA STATE Halar Madhya Saurashtra Zalawad Gohilwad Sorath
KUTCH STATE MO-A H 91-26a
2
855
853
18
689 484 958
1,828 148
1,661 968 283 542 225 79~
1,S09 1,210 1,969
978 1,336 1,032 2,l98 4,131 1,613
632
1,612 2,070 1,599 1,233
585 468 804 ,960 429
893 906 977 776 681
1,037
566
SUBSIDIARY TABLE 3' 7
-Livelihood Pattern of Urban Population
Number per 10,000 of Urban Population belonging to Livelihood Class
II
3
212
226
9
252 85
220 208 68
946 361 107 262
67 159
169 148 146
71 96 75
117 409 546 125
499 148 316 407
658 330 695 974
1,614
105 67 85
248 123 69
-210
III
4
279
305
9
161 18 82
224 68
387 I3S 132 230 lH 179
512 703
1,160
451 358 222 177 647 652 372
873 '128 861
1,004
180 184 92 73
366
81 64 74 52 82
113
111
IV
5
148
159
19
183 24 89
273 45
493 130 231
- 264 101 117
178 110 125
123 178 113 407 260 432 140
332 409 299 287
213 99
442 234 496
73 65 38
100 69
115
56
V
6
2,818
2,894
3,501
3,227 1,915 1,770 2,182 4,727 1,814 1,930 2,461 2,319 3,770 2,583
2.424 2,219 2,143
2.852 1,937 2,290 1,907 1.293 2,031 3,990
2,3« 1,837 2,749 2,510
2,370 2,524 2,255 2.263 1.945
2,278 2.302 2,113 2,551 2.701 1,931
1,901
VI
7
1,968
1,918
2,434
2,077 2,590 2,576 2,062 2,113 1,586 2,377 2,184 2,096 2,280 1,910
1.491 1,771 1.355
1.527 1,790 1,474 1.552
960 1,368 1,750
1,632 1,471 1,647 1,754
1,724 1,941 1,459 1,344 1,492
%,330 2,185 2,464 2,084 2,367 2,322
2,44.3
VII
8
533
524
839
373 667 403 251 359 273 ' 629 454 398 344 703
428 264 522
564 310 556 280 192 279 408
331 264 233 451
629 616 662 644 386
598 804 498 466 614 650
6~_3
VIII
9
3,187
3,121
3,171
3,038 4,217 3,902 2,972 2,472 2,840 3,470 4,148 3,889 3,099 3,553
3.289 3,575 2,580
3,434 3,945 4,238 3,392 2,108 3,079 2,583
2,377 2,467 2,296
227
2,354.
3,641 3,778 3,591 3,508 3,272
3,642 3,607 3,751 3,723 3,357 3,763
4,080

228 SUBSIDIARY
Agl icultural Classes per 1,000 persons of General Population; number in each Class and Sub "Class of 10,000 ~
Agricultural Number per 10,000 persons of all Agricultural aasses. Classes per
Total. 1,000 persons - ofCeneral I-Cultivators II-Cultivators lII-Cultivating IV-Non-cultiva.
Popultion. of land wholly of land wholly labourers ling owners of State, Natural Division and Self- Non-earning Earning or mainly own· or mainly and their land; agri.
District. supporting dependants. dependnts. ed and their unowned and dependants. cultural rent persons. dependants. their receivers and
dependants. their dependants.
L 2 3 4 5 6 7 8 9
BOMBAY, SAURASHTRA ANDKUTCH ..• 597 2.454 5,419 2.127 6.661 1.601 1.411 327
BOMBAY STATE 615 2,461 5,458 2,081 6,629 1.577 1.472 322 ,
Greater Bombay 5 3,284 6,351 365 3,305 1,580 1,684 3,431 .....
Bombay Gujarat Divisitm 622 2,385 5,518 2,097 6,774 1.576 1,316 334 Banaskantha 711 2,581 4,916 2,503 6,405 3,139 252 204 Sabarkantha 739 2,074 5,20B 2,71B 9,018 277 486 219 Mehsana ... 610 2,429 5,545 2,026 7,722 732 932 614 Ahmedabad 295 2.389 5,98B 1.623 5,382 2,258 1,746 614 Kaira 711 2,363 5,954 1,683 6,878 1,695 941 486 Panch Mah~b 838 2,308 4,880 2,812 8,163 1,471 294 72 Baroda 630 2,537 5,446 2,017 6,240 1,384 1,972 404 Broach 712 2.207 5.748 2.045 5.044 1.789 2,874 293 Surat 612 2,428 5,751 1,821 5,666 1,809 2,390 135 Amreli 533 2,571 5,601 1,828 6,526 1,484 1,626 364
BombC1!/ Deccan Northern Division 691 2,393 5,510 2,097 7,546 566 1,602 286
West Khand~~h 773 2,422 5,510 2,068 6.937 427 2,561 75 East Khandesh 705 2,546 5,519 1,935 6,588 311 2,988 113 Dangs 904 2,245 5,635 2,120 9,673 74 251 2 Nasik 673 2,281 5,253 2,466 7,551 400 1,738 231 Ahmednag~" 730 2,263 5,301 2,436 7,747 307 1,616 330 Poona 523 2,429 5.327 2,244 8,462 J 390 786 362 Salara North" 772 2,262 5,636 2,102 8,779 250 512 459 Satata South 789 2,25B 5,940 1,802 8,284 618 830 268 Kolhapur ... 756 2,551 5,624 1,825 7,143 1,659 912 286 Sholapur ... 626 2,504 5,589 1,907 6,452 742 2.346 460
Bombay Deccan Southem Division 732 2,738 5,370 1,892 6,045 1,448 2,068 439
Belgaum 755 2,601 5.451 1,948 6,104 1,965 1,504 427 Bijapur 752 2,689 5,289 2,022 ~,468 953 2,196 383
~ Dharwar 691 2,949 5,352 1,699 5,565 1,30B 2,621 506
Bombay Konkan Division 647 2,516 5,261 2,223 4.372 4,594 786 248 Thana 544 2,538 4,654 2,80B 3,916 4,477 1,443 164 Kolaba 740 2,651 5,084 2,265 3,612 5,676 437 275 Ratnllgiri 695 2,282 5.83B 1,880 5,626 3,797 355 222 Kanara 628 3,037 5,061 1,902 2,520 5,571 1,409 500
SAURASHTRA STATE 466 2,321 5,013 2,666 7,027 1,789 807 377 HaIar 466 2,252 4,981 2,767 7,981 1,189 448 382 Madhya Sau~~shtra 429 2,353 4,769 2,87B 7,46B 1,675 548 309 ZaIawad 457 2,274 5.097 2,629 5,168 3,419 836 577 Gohilwad 466 2,201 5.329 2,470 6,590 1,686 1,228 496 Sorath 510 2,461 4,913 2,626 7,373 1,576 815 236
KUTCH STATE ... 420 2,836 5,107 2,057 6,635 2;J.77 708 380

TABLE 4'1 229
persons of all Agricultural Classes; and comparison with Agricultural Holdings by Size of Holding ,.
Distribution of 10,000 agricultural holdings by size 01 holdings.
Holdina" up to 5 acres.
Number. Extent.
9-,199 3,281
5,716 1,685 7,902 3,420 5,OOB 2,291 4,874 1534 5.663 2,026 7,088 2,219
2,592 1,881 4,922 1,439
3,972 1,002 3,308 706 4}48 1.310 6,133 2,305
7,146 2,759 2,886 593
4,127 953
5,196 1,615 2,411 530 4,555 1,007
7,026 1,947 7,419 1,580 7,970 2,173 6,394 2,098 7,436 1,776
Holdings over 5 acres and up to 15 acrei. Holdinisover 15 acres and up to 25 acres.
Number. Extent. Number. Extent.
10
Not available
Not available
541 1,843 119 911
Not available Not available Not available
2,909 2,950 B27 1,632 1570 3,095 335 1,346 3,633 3.932 936 1,901 3.101 2561 1,048 2.092 2,709 2,890 886 2,279 2,026 2,810 477 1,506
Not available
Not available
4,004 2,245 1,%2 2,133 3,504 3.471 . 939 1,882
3,419 2,679· 1,395 2.144 3,455 2,369 1,730 2,424 2.654 2,342 1,558 2,696 2,469 2,795 925 1,998
Not available 2,020 2,814 500 1,465 3.313 1,81B 1,770 1,961
3,332 2,393 1,400 1,926
3,167 2,921 940 1,723 3,464 1,791 2,146 1,985 3,356 2,750 1,209 1,994
1,765 2,077 654 1576 1,458 1,549 505 1,121 1,301 1,941 345 1,086 2,083 2,254 899 1,942 1,735 2,674 423 1,423
Not available
Not available
State, Na~ural Division and District.
BOMBAY, SAURASHTRA AND KUTCH
BOMBAY STATE '
Greater Bombay
Bombay GujaTat Division Banaskantha Sabarkantha Mehsana Ahmedabad Kaira Panch Mahals Baroda Broach Surat Amreli
Bombay Deccan NOTtTrernDivision
West Khandesh East Khandesh Dangs Nasik Ahmednagar Poona Satara North Satara South Kolhapur Sholapur
Bombay Deccan Southern Division
Belgaum Bijapur Dharwar
Bombay Konk,an Division Thana Kolaba Ratnagiri Kanara
SAURASHTRA STATE HaIar Madhya Saurashtra Zalawad Gohilwad Sorath
KUTCH STATE

230 SUBSIDIARY
Agricultural Classes per 1,000 persons of General Population; number in each Class and Sub .. Class of
State, Natural Division and District. I
BOMBAY, SAURASHTRAAND KUTCH
BOMBAY STATE '"
Greater Bombay ...
Bomball Gujarat Division
Banaskantba Sabarkantba Mehsana
Ahmedabad Kaira Panch Mahals Baroda Broach Surat Amreli
Bombay Deccan Northern Division West Khandesh .. , East Khandesh Dang.
Nasik Ahmednagar Poona Satara North Satara South Kolhapur Sholapur .. ,
Bombay Deccan Southern Division Helgaum Bijapur
I Dhatwar Bombay Konkan Divisio~'
Thana Kolaba Ratna&iri Kanara
SAURASHTRA STATE
Halar
Madhya Saurashtra Zalawad
Gohilwad
Sorath
KUTCH STATE
Distribution of 10,000 aa-ricultural holdings by size of holdings.-conld.
Holdings over 25 acres and up to 100 acres.
Number. Extent.
130 "2,910
485 2,367 133 1,307 362 1,407 911 2,605 695 2,269 374 2,339
1,387 3,013 594 2,558
1,161 3,494 1,427 3,701
973 3,010 454 2,416
312 1,780 1,867 4,199 1,057 3,366
649 2,706 1.840 4,088
B08 2.956 483 2,527 507 2,604 315 2,131 563 2,562 362 2,677
Holdings over I 00 acres and up to 500 acres.
Number. Extent. -IO-Contd.
Not available
Not available
II
Not .available
Not available Not.available
59 8
10 61 47 33
Not available Not available
50 40
52 79 62 18
Not available 19
162 . 78
47 133 63 68
103 64 59 43
Not available
1,055
1,077 418 240 869 527
1,097
521 582
598 765 596 377
649 1,327 1,012
821 1,297
804 1.457 2,382 1,891
936 1,305
Holdings over 500 acres.
.Number. - Extent.
4 289 2 414 I 229 5 339
9 29
5 207 1 68
1 83 I 35 5 46 I 109
3 473 2 102 6 350 1 214 6 309 9 489 4 416 B 764 5 778
' 2 208 .1 145

TABLE 4'1 231
10,000 persons of all Agricultural Classes: and comparison with Agricultural Holdings by Size of Holding
r--------------------Upto 5 Bishas
Number. 3.440
r
Extent. 894
Over 5 Bighas and up to 15 Big-has.
Number. Extent. 3,000 2,269
Over 15 Bighas and up to 25 Bighas.
Number. Extent. 1,720 2,155
J...
Remarks:
11
Over 25 Bighas and up to 100 Bighas. Number. ,Extent.
. I,m 3,379
Over 100 Bighas and up to 500 Bighas.
Number. Extent. 102 1,109
Up to 3 1/2 acres. Over 3 1/2 acres and Over 7 1/2 acres and Over 10 1/2 acres. up to 7 acres. up to 10 acres.
No. Extent., No. Extent. No. Extent. No. Extent. 2,107 1,110 7,303 7.694 91 143 499 1,053
Exclusive 01 fiaures lor Phaltan Taluka
Exclusive of fiaures for Shirhatti Taluka and Kundgol Peta
Over 500 Biahas.
Number. . 3 Extent. . '194 Mehsaua
Danis
Satara N.
Dharwar
r -----, a to 2 acres. 2 to 5 acres. 5 to 10 acres. 10to 15 acres. 15 to 25 acres. 25 to 50 acres. 50 to 100 acres. I 00 to 200 acres. 200 acres and
over. No. Extent. No. Extent. No. Extent. No. Extent. No. Extent. No. Extent. No. Extent. No. Extent. No. Extent. 336 17 299 36 674 140 1.701 674 2,049 1.426 3.284 3,662 1,386 2,651 255 1,245 16 149 Halar
Not available MadhyaS. 482 26 1.753 469 1,659 898 670 261 1,811 1,101 2.282 3,514 1,055 2,376 284 1,321 4 34 Zalawad
r-----------------------------------~----------------------------------------~ 20 acres and below. No. Extent.
20 to 40 acres. No. Extent.
40 to 80 acreS. No. Extent.
80 to 120 acres. 120 to 160 acres. 160 acres and ahove. Nd. Extent. No. Extent. No. Extent.
6,584 2,736 2,008 3,243 1,138 3,034 t95 596 41 176 34 215 Gohilwad
Up to 5 acres. 5 to 15 acres. 15 to 25 acres. 25 to 100 acres, 100 to 500 acres. Over 500 acres. No. Extent. No. Extent. No. Extent. No. Extent. No. Extent. No. Extent. 1,305 n. a. 2,668 n. a, 2,770 . n. a. 3,209 n. a, 47 n. a. I n .•. Sorath r- A __________ . ____________________________ ~
o to I acre. I to 2 acres. 2 to 3 acres. 3 to 5 acres. 5 to 10 acres. 10 to 15 acres. 15 to 20 20 to 30 30 to 40 40 acres .. acres. acrei. acres. and over.
No. Extent. No. Extent, No, Extent. No. Extent. No. Extent. No. Extent. No. Extent. No. Extent. No. Extent. No. Extent. 442 o,a, 765 o.a, 955 o.a. 1,972 o.a. 3,625 n, a. 1,382 n.a. 426 n.a. 305 o.a. 82 n.8. 46 o,a· KUTCH

232
State, Natural Division and District.
I
. BOMBAY, SAURASHTRA AND
KUTCH
BOMBAY STATE
Greater BOJIlbay
Bombay Gujarat Division BIlDaskantha Sabarkantba Mehsana Ahmedabad Kaira Panch Mahals Baroda Broach Surat Amreli
Bombay Deccan Norfhem Division ... West Khandesh ... East Khandesh ... Dangs Nasik Ahmednagar Poona Satara North Satara South Kolbapur Sholapur
Bomhay Deccan Southern DirJision ... Belgaum / Bijapur Dharwar
Bomhay Konk_an Division Thana KolBba Ratnagiri Kanara
SAURASHTRA STATE Halar Madhya Saurashtra Zalawad Gobilwad Sorath
KUTCH STATE
SUBSIDIARY
Livelihood Class I (Cultivators of land wholly or
Number per 10,000 persons of Livelihood Classo:I in each Sub.Class ;
Number per 10,000 of Livelihood Number per 10,000 of Livelihood Gass I.
Cultivation of owned Cultivation of unowned Employment as land. land. cultivating labourer.
Self-support- Non-earning Earning ing persons. dependants. dependants.
Self. Self. Earning Self· Earning Earning supporting dependants. supportinlr dependants. supporting dependants. person •• persons. persons.
2 3 4 5 6 , 7 B 9 10
2,318 5,536 2,148 1,400 106 64 81 545 ,
2,318 .5,589 2,093 1,3$3 114 69 86 499
2,797 6,805 398 201 8 6 18
2,260 5,571 2,169 1,378 83 29 68 634 2.660 4,843 2,497 2.ll7 18 12 21 140 1,944 5,222 2,834 2,244 19 5 10 494 2.286 5,469 2,245 1,759 51 14 9 311 2.261 6,278. 1,461 747 92 28 27 545 2.275 5,943 1,782 700 133 46 233 932 2.30B 4,878 2,814 2,412 11 34 11 307 2,245 5,696 2,059 784 202 31 77 1,126 2,041 6.047 1,912 188 145 31 98 1,566 2,263 6.103 1,634 745 96 43 73 663 2,270 5,774 1,956 1,048 154 36 32 789
2,276 5,629 2,095 1,43;;1 107 61 90 465 2,364 5,773 1,863 809 16 12 69 976 2,320 5,879 1.801 682 71 10 169 1,033 2,234 5.604 2,162 1,056 1 25 195 2,153 5,368 2,479 1,898 47 38 43 435 2.176 5,379 2,445 1,628 66 1:1 134 57 471 2,310 5,385 2,305 1,884 89 46 64 233 2.184 5,638 2,178 1,735 90 38 53 254 2,179 5,984 1,837 1,341 123 63 97 290 2,499 5,642 1,859 1.412 323 143 124 184 2,348 5,782 1,870 1,218 162 65 170 463
2,569 5,538 1,893 1,199 162 125 127 447 2,462 5,548 1,990 1.260 239 157 160 436 2,561 5,474 1,965 1.228 93 136 118 479 2,719 5,597 1,684 1,085 138 73 94 426
2,338 5,538 2.124 1,450 184 160 67 251 2,304 4,914 2,782 2,383 128 103 40 106 2,608 5,168 2,224 1,411 313 301 50 342 2,228 5,969 1,803 1,043 141 . III 88 308 2,577 5,581 1,842 1,198 374 377 54 97
2,255 5,020 2,724 1,642 24 20 27 995 2,200 4,952 2,848 1,401 4 3 41 1,411 2,252 4,802 2,946 2,502 18 7 6 397 2,296 5.183 2,521 1,632 37 13 18 752 2,191 5,318 2,491 1,955 43 31 23 392 2,333 4,9.55 2,712 756 22 34 41 1,870
2,789 5,065 2,146 837 117 62 25 932

TABLE 4'2 233
mainly owned and their dependants)
Secondary Means of"Li'velihood of 10,000 persons of Livelihood Class I
Qass 1 whose Secondal'Y Means of Livelihood is
Rent on agricultural Production other than Commerce. Transport. Other services and land. cultivation. misceUaneous
sources. State. Natural Division and District.
Self· Earning Self· Earning Self. Earning Self. Earning Self. Earning supporting dependants. supporting dependants. supporting dependants. supporting dependants. supporting dependants.
persons. persons. persons. persons. persons.
11 12 13 14 15 16 17 . 18 19 20 1
BOMBAY, SAURASHTRA 16 4 85 58 40 18 13 3 91 54 AND KUTCH
IS " 90 61 4,2 19 13 4, 96 54 BOMBAY STATE
37 2 62 84 100 21 35 14 166 52 Greater Bombay
21 4 80 54 29 15 11 3 81 52 Bombay Gujaral Division
124 21 136 75 56 52 10 2 105 78 Banaskantha 6 1 101 47 14 9 3 I 65 33 Sabarkantha
12 2 74 106 29 21 2 1 56 31 Mehsana 30 5 74 60 41 18 1 1 65 57 Ahmedabad 15 3 67 54 37 14 3 2 71 31 Kaira 5 4 41 19 12 4 18 3 77 31 Panch Mahals
21 1 46 32 24 7 12 2 86 76 Baroda 14 3 188 40 39 13 5 \ 1 79 70 Broach 8 1 " 93 57 33 16 35 8 131 101 Surat
21 3 45 25 33 10 6 1 76 ~
44 AmnIi
7 3 90 64 41 18 9 3 85 47 Bombay Deccan Northern Division 2 55 28 35 10 8 1 53 27 West Khandesh 4 75 34 75 22 8 2 76 18 East KhllIldesh
·····6 · .. ·3 549 498 10 2 22 2 348 409 Dangs , 53 49 25 19 14 11 41 26 Nasik
7 14 76 ~ 96 30 24 3 2 59 76 Ahmednagar 9 2 88 72 39 19 13 4 90 45 Poona 5 2 113 67 33 11 6 1 130 70 Satara North 7 2 llB 74 44 17 6 1 103 49 Salara South
10 2 110 51 42 20 20 3 108 44 Kolhapur 14 3 90 72 54 19 7 1 88 29 Sholapur
13 5 89 60 63 25 4 1 90 31 Bombay Deccan Southern Division 13 4 100 71 61 24 7 2 97 36 Belgaum 12 4 95 62 63 26 2 1 92 29 Bijapur 14 5 67 44 66 23 2 1 77 27 Dharwar
36 10 129 75 54 27 52 14 209 137 Bombay Konk,an Division 14 3 146 87 53 34 120 27 90 39 Thana 32 4 121 40 65 20 42 11 175 95 Kolaba 28 7 129 86 49 27 25 10 285 211 Ratnagiri
196 71 93 35 68 20 28 4 150 ~O Kanara
25 6 26 22 24 12 3 1 36 26 SAURASHTRA STATE 25 2 16 8 17 13 1 1 20 9 Halar 19 3 16 13 24 11 1 1 ' 22 12 Madhya Saurashtra 80 21 34 46 15 16 2 32 39 Zalawad 28 11 36 35 24 13 B 1 63 53 Gohilwad 10 1 31 20 32 9 3 1 37 21 Sorath
60 4 106 45 58 16 65 7 121 243 KUTCH STATE

234 SUBSIDIARY
Livelihood Class II (Cultivators of land wholly or .. Number per 10,000 persons of Livelihood Class II in each Sub"Class;
------------,.-----------------------------------------------------------------Number per 10,000 of Livelihood I __
State, Natural Division and Diatrict.
I BOMBAY, SAURASHTRA AND KUTCH
BOMBAY STATE
Greater Bombay
Bombau Gujarat Division Banaskantha Sabarkantha Mehsana Ahmedabad Kaira Panch Mahall Baroda Broach Surat Amreli
Bombav Deccan Northern Division ... West Khandesh ... East Khandesh Dangs Nasik Ahmednagar' Poona Satara North Satara South Koihapur .\. Sholapur
Bombay Deccan Southern Division Belgaum Bijapur Dharwar
Bombau Konkan Division Thana Kolaba Ratnagiri Kanara
SAURASHTRA STATE Halar Madhya Saurashtra Zalawad Gohilwad Sorath
KUTCH STATE
Number per (0,000 of Livelihood Class II. ~
---------------------------1-------------
Sell-support- Non-earning Earning ing persons. dependants. dependants.
2 3 4
2,383 5,298 2,319
2,401 5,334 2,265
3,050 6,370 580
2,249 5,577 2,174 2.301 5,020 2,679 2,169 5,611 2,220 2,276 6,208 1,516 2,239 5,843 1,918 2,328 6,120 1,552 2,167 4,887 2,946 2,428 5,528 2,044 2,028 " 5,860 2,112 2,206 5,472 2,322 2,163 6,138 1,699
2,403 5,487 2,110 2,265 5,5% 2,139 2,352 5,393 2,255 3,491 4,906 1,603 2,591 5,281 2,128 2,147 5,859 1,994 2,543 5,205 2,252 2,339 5,586 2,075 2,302 5,876 1,822 2,467 5.393 2,140 2,357 5,508 2,135
2,497 5.391 2,112 2,484 5,331 2,185 2,469 "5,332 2,199 2,538 • 5,543 1.919
2,487 5,063 2,450 2,457 4,509 3,034 2,636 4,933 2,431 2,237 5,653 2,110 2,854 4,996 2,150
2,180 4,939 2,881 2,119 5,012 2,869 2.348 4,522 3,130 2,116 4,926 2,958 1,917 5,429 2,654 2,369 4,824 2,807
2,528 5,247 2,225
Cultivation of owned land.
Self- Earning supporting dependants. persons.
5 6
"' 165 159
180 , 154
143 106
97 85 6 27
94 347 71 61 78 30
123 65 31 282
306 52 53 45
124 68 103 70
347 288 36 40
213 106 472 503 117 170 160 249 332 490 439 486 382 356 522 359 379- 218
342 174 480 230 171 135 212 101
131 156 76 251
177 75 123 178 164 76
34 233 17 29 75 695 19 105 37 196 13 42
45 14
Cultivation of unowned land.
Employment as cultivating labourer.
Self- Earning Self- Earning supporting dependants. supporting dependants.
persons. persons.
7 8 9 10
1,299 133 648
1,296 144 594
127 8 41
1,090 109 836 2,494 11 48
700 27 972 842 26 370 980 28 756 374 230 925
2,443 16 148 421 120 1,404 218 137 1,666 616 205 1,443 760 49 565
1,011 168 644 490 102 1,550 552 244 1,487
1.006 1,112 196 685 1,030 82 491 1,105 118 415
910 111 418 841 151 422
1,276 218 349 939 140 819
1.222 152 584 1,250 178 568 1,188 151 730 1,194 lOB 510
1,589 162 386 2,273 153 232 1,580 131 537 1,010 145 434 1,655 290 261
1,430 25 1,137 1,198 30 1,607 1,813 20 572 1,831 35 912 1,797 14 527
413 29 2,306
675 54 1,003

TABLE 4'3 235
mainly unowned and their dependants) , Secondary Means of Livelihood of 10,000 persons of Livelihood Class II
---Class II whose Secondary Means of Livelihood is
Rent on agricultural Production other than Commerce. Transport. IO~~rvice;and -land. cultivation. miscellaneouss
sources.
I State, Natural Division and
Self. Earning I Self· Earning I Self. Earning District.
Self· Earning Self· Earning supporting dependants. supporting dependants. supporting dependants. supporting dependants. supporting dependants.
persons. persons. persons. I persons. persons.
11 12 13 14 15 16 I 17 18 19 20
-~----------
.6 2 110 69 30 22 38 8 124 112 BOMBAY, SAURASHTRA AND KUTCH
6 2 118 74. 32 23 39 9 133 113 BOMBAY SrATE
20 4 69 119 90 65 16 4 110 114 Greater Bombay
4 2 96 55 16 12 13 2 81 92 Bombay Gujarat Division
3 210 56 21 13 6 1 96 40 Banaskantha 7 1 49. 31 \4 9 4 9 65 151 Sabarkantha 8 11 81 101 13 32 5 2 76 97 Mehsana
10 2 71 54 24 24 2 1 60 71 Ahmedabad 3 1 101 94 15 \4 4 1 12 78 Kaira 1 3B 31 1'1 4 4 I 55 37 Panch Mahals 3 1 40 26 \3 9 4 1 66 130 Baroda 6 2 53 31 2\ 9 3 2 65 139 Broach 1 2 112 42 11 4 53 5 128 142 Surat 1 1 67 120 12 8 12 1 64 174 Amreli
12 4 88 64 46 31 15 4 86 64 Bombay Deccan Northern Division
3 I 35 22 40 II 15 6 51 19 West Khandesh 9 80 49 75 31 18 3 57 27 East Khandesh
314 31 63 63 Dangs 7 5 69 58 24 14 20 11 65 73 Nasik
23 19 59 79 22 31 3 3 68 92 Ahmednagar 14 9 138 76 98 89 19 5 99 63 Poona 21 3 136 97 35 12 12 2 179 147 Satara North 7 2 95 117 35 \9 9 2 99 63 Satara South 8 1 % 45 47 37 19 3 94 70 Koibapur
23 6 79 80 43 21 13 2 74 50 Sholapur
11 '4 64 57 47 33 II 2 64 36 Bombay Deccan Southern Division 10 2 64 61 40 31 19 3 69 40 Belgaum 12 11 78 62 52 37 3 I 64 35 Biiapur 13 4 56 45 56 36 4 1 56 28 Dharwar
5 2 167 99 35 26 79 18 215 174 B~mbay Kon~an Di~ision
1 1 211 134 17 18 205 32 120 93 Thana 3 117 49 47 36 38 10 187 144 Kolaba 3 2 185 133 36 29 29 20 337 304 Ratnagiri
23 6' 134 47 41 17 32 7 164 81 Kanara
4 3 25 23 14 7 5 1 25 47 SAURASHTRA STATE 4 2 \5 14 14 7 2 1 15 \1 Halar 1 21 15 15 7 2 1 . 17 27 Madhya Saurashtra 7 3 46 49 9 6 I 29 51 Zalawad 8 9 22 21 13 9 14 2 36 93 Gohilwad 1 18 9 19 7 3 23 30 Sorath
6 133 55 26 23 142 20 195 435 KUTCH STATE

236
State, Natural Division and District.
I
BOMBAY, SAURASHTRA )\NI) KUTCH
BOMBAY STATE
Greater Bombay
Bombay Gujrzrat Division Banaskantha Sabarkantha Mehsana Ahmedabad Kaira Panch Mahals Baroda Broach Surat Amreli
Bambay Deccan Northern Division .. , West Khandesh ... East Khandesh Dang. Nasik Ahmeclnagar Poona Satara North Satara South Koihapur Sholapur
Bombay Deccan Southern Division ... Beigaum Bijapur Dharwar
Bombay Konkan Division Thana Kolaba Ratnagiri Kanara
SAURASHTRA STATE Halar Madhya Saurashtra Zalawad Gohilwad Sorath
KUTCH STATE
SUBSIDIARY
Livelihoo~ Class III (Cultivating
Number per 10,000 persons of Livelihood Class III in each Sub-Class ; Secondary
Number per 10,000 of Livelihood Class III.
Number per 10,000 of Livelih oed
Cultivation of owned Cultivation of uno'wned Employment as land. land. cultivating labourer. .
Self-support- Non-earning Earning . ing persons. dependants. dependants.
Self- Earning Self- Earning Self- Earning supporting dependants. supporting dependants. supporting dependant I.
persons. persons. persons.
2 3 4 5 6 7 8 9 10
3,113 4,762 2,125 89 96 32 48 1,786
3,105 4,789 2,106 92 97 33 49 1,774
3,826 5,695 479 61 27 27 ~ 345
3,035 4,964 2,001 31 50 17 11 1,681 3,715 4,477 1,808 42 112 47 51 910 3,965 4,346 1,689 68 185 10 14 1,124 3,291 5,258 1,451 13 57 4 7 973 2,789 5,153 2,058 24 22 12 11 1,756 2,853 5,325 1,822 47 63 24 18 1,543 2,927 4,498 2,575 80 451 21 51 1,941 3,442 4,412 2,146 36 42 9 8 1,832 2,544 5,070 2.386 33 16 27 . 5 2,102 2,979 5,068 1,953 21 21 19 9 1,723 3,639 4,715 1,646 21 25 4 2 1,308
2,871 4,835 2,294 114 142 16 44 1,960 2,597 4,758 2,645 23 39 3 95 } 2,424 3,057 4,705 2,238 109 125 10 44 1,967 2,286 7,024 690 75 19 9 569 2,684 4,679 2,637 39 81 14 13 2,341 2,604 4,708 2,688 83 379 11 78 1,990 3,382 4,458 2,160 152 133 19 18 1,821 3,105 5,111 1,784 248 210 18 11 1344 2,842 5,339 1,819 246 278 21 20 1,321 3,091 5,473 1,436 348 216 82 41 1,051 2,930 4,983 2,087 126 58 17 16 1,889
3,428 4,646 1,926 110 80 38 77 1,633 3,320 4,898 1,782 253 138 82 81 1,419 3,185 4,555 2,260 90 69 26 115 1,937 3,698 4,547 1,755 102 49 17 43 1,535
3,749 4,252 1,999 61 79 176 147 1,507 3,432 4,140 2,428 38 51 105 133 1,973 3,572 4,722 1,706 49 25 118 71 1.121 3,531 4,963 1,506 166 157 208 164 955 4,886 3,586 1,528 29 114 370 219 1,054
3,154 4,271 2,575 20 79 3 14 2,122 3,322 3,965 2,713 96 373 5 9 2,138 3,769 3,843 2,388 37 177 3 42 1,693 2,673 4,061 3,266 18 75 13 44 2,855 2,586 4,680 2,734 6 20 3 2,470 3,758 4,132 2,110 10 23 3 I 1,547
4,227 4,251 1,522 31 79 66 20 866

TABLE 4'4 237
labourers and their dependants) 1
Means of Livelihood of 10,000 persons of Livelihood Class m
Class III whose Secondary Means 01 Livelihood is
Rent on agricultural Production other than Commerce. Transport. Other services and " land. cultivation. miscellaneous State, Natural Division and sources. District.
Self· Earning Self· Earning Self. Earning Self. Earning Self. Earning supporting dependants. supporting dependants. supporting dependants. supporting dependants. supporting dependants.
persons. persons. persons. persons. persons.
II 12 13 14 15 16 17 18 19 20 \
BOMBAY, SAURASHTRA 40 12 63 55 21 21 2 1 60 106 AND KUTCH
40 13 63 55 21 21 2 1 60 96 BOMBAY STATE
6 6 23 II 7 4 38 27 Greater Bombay
22 5 44 42 10 12 2 63 199 Bombay Gujarat Division 92 6 77 86 12 19 7 63 622 Baoaskantha 46 1 37 22 6 6 42 335 Saharkaotha 65 6 71 86 15 39 1 1 54 280 Mehsana 59 14 57 55 16 19 2 1 59 180 Ahmedabad 21 I 73 57 17 18 3 1 89 121 Kaira 9 28 25 5 4 1 2 60 101 Panch Mahals
14 12 21 16 8 10 1 80 223 Baroda 11 2 33 20 10 6 1 I 52 234 Broach 3 38 43 2 3 2 2 53 152 Surat
23 2 64 41 31 27 2 2 64 239 Amreli
45 19 55 55 19 26 2 45· 47 Bombay Deccan Northern Division 4 4 31 31 11 19 I 16 32 West Khandesh
13 9 49 40 25 27 3 37 25 East Khaodesb 93 9 569 93 Dang.
59 28 37 53 22 67 1 2 33 52 Nasik 77 66 46 ., 73 12 18 1 I 39 63 Ahmednagar 78 19 60 63 41 40 1 1 66 65 Poooa
113 19 104 85 21 23 2 2 126 90 Satata North 29 11 110 106 20 9 2 I 73 73 Satara South 23 ·3 94 53 23 11 4 55 61 Kolhapur 85 14 62 64 14 10 1 59 35 Sholapur
66 13 75 60 32 22 66 40 Bombay Deccan Southern Division 68 6 87 74 33 20 80 43 Belgaum 28 8 74 55 31 21 71 54 Bijaput 95 22 67 55 32 22 52 28 Dharwar
, 7 2 154 97 .48 26 13 4 119 137 Bombay K~an Division 5 2 180 107 45 16 17 5 III 141 Thana 6 ,I 188 149 132 105 " 24 5 138 229 Kolaha 4 1 100 84 14 13 3 2 133 130 Ratoagiri
15 2 114 51 31 13 6 2 114 73 Kanara
44 5 49 48 15 24 1 1 52 282 SAURASHTRA STATE 8 I 48 71 17 17 23 103 Halar
231 2 71 76 30 47 2 39 350 Madhya Saurashtra 30 10 65 58 16 32 1 61 191 Zalawad 4 1 38 33 15 18 2 74 168 Gohilwad 6 14 44 42 6 18 32 465 Sorath
26 1 60 111 Z8 49 3 1 141 396 KUTCH STATE

238
State, Natural Division and District.
1
BOMBAY, SAURASHTRA AND KUTCH
BOMBAY STATE
Greater Bombay ... l)
Bombay Gujarat Division Banaskantha Sabarkantha Mehsana Ahmedabad Kaira Panch Mahals Baroda Broach Surat Amreli
Bombay Deccan Northern Division ... West Khandesh ... East Khandesh Dangs Nasik Ahmednagar Poona Satara North Satara South Kolhapur Sholapur
Bombay Deccan Southern Division ... Belgaum Bijapur Dharwar
Bombay Konkan Division Thana Kolaba
I Ratnagiri Kanara
SAURASHTRA STATE Halar Madhya Saurashtra Zalawad Gohilwad Sorath
KUTCH STATE
SUBSIDIARY
Livelihood Class IV (Non .. cultivating owners of land;
Number per 10,000 persons of Livelihood Class IV in each Sub-Class;
I ~
Number per 10,000 of Livelihood Number per 10,000 of Livelihood Class IV.
Cultivation of owned Cultivation of unowned I Employment as land. land. cultivating labourer.
~elf-support- Non-earning Earning mg persons. dependants. dependants.
Self- Earning Self- Earning Self. Earning supporting dependants. supporting dependants. supporting dependants.
persons. persons •. persons.
2 3 4 5 6 7 8 9 10
,
2,737 6,445 818 87 -, 74 13 15 171 267
2,768 6,404 828 79 76 14 16 186 282
3,595 6,228 177 21 8 49
2,982 6,360 658 79 71 7 6 88 214 3.014 6,165 821 576 290 8 13 46 82 3,118 6,060 822 108 193 4 4 124 313 3,112 6,136 752 38 75 1 1 81 200 2,934 6,350 716 54 22 7 3. 166 270 2,793 6,738 469 51 36 8 9 71 162 2,711 6,482 ' 807 106 191 9 24 52 125 3,003 6,344 653 46 63 15 5 98 311 2,862 6,561 577 79 19 16 11 66 326 2,607 6,790 603 68 25 6 3 44 146 4,861 4,270 869 50 136 2 80 140
2,786 6,195 1,019 56 107 12 11 259 363 2,661 6,340 999 53 29 6 1 199 587 2,725 6,406 . 869 79 33 4 5 319 558 1,250 8,750 1,250 2,773 5,753 1,474 45 62 18 43 332 542 2,742 5,859 1,399 26 128 14 15 294 424 3,014 6,002 984 54 163 7 3 243 298 2,776 6,202 1,022 65 175 6 4 178 248 2,809 6,550 641 54 60 14 10 122 150 2,614 7,002 384 121 76 25 14 40 75 2,770 6,099 1,131 33 75 12 6 476 581
2,605 6,404 991 54 42 13 30 306 385 2,596 6,580 824 86 42 17 18 234 293 2,546 6,265 1,189 51 52 12 54 240 432 2,658 6,328 1,014 25 35 10 25 426 443
2,305 7,239 456 209 62 41 35 26 47 2,491 6,939 570 249 69 27 17 26 37 2,056 7,655 289 176 36 26 31 10 38 2,456 7,053 491 199 79 42 28 28 64 2,189 7,318 493 231 60 68 63 39 38
2,414 6,824 762 144 56 11 5 41 138 2,482 6,700 818 256 64 12 2 28 290 2,325 6,950 725 244 124 14 13 26 79 2,438 6,838 724 174 62 25 11 87 112 2,339 6,748 913 84 31 4 19 87 2,578 6,920 502 17 15 4 65 201
2,906 6,603 491 217 45 8 4 SO 78

TABLE 4'5 239
agricultural rent receivers and th~ir dependants)
Secondary Means of Li~elihood'of 10,000 persons of Livelihood Class IV ,-------------
Class IV whose Secondary Means of Livelihood is
Rent on agricultural land.
Production other than cultivation.
Commerce. ----,-----1
Transport. Other services and miscellaneous
sources.
Self- Earning Self- Earning Self- Earning Self- Earning Self- Earning supporting dependants. supporting dependants. supporting dependants· support- dependants"supporhng dependants. persons. persons. persons· persons· persons·
11 12 13 14 IS 16 17 18 19 20
218 130 77 152 49 19 3 298 115
201 139 82 160 52 21 4 308 115
17 88 21 147 36 880 4 143 99
99 103 72 139 53 5 4 289 139 144 B7 51 60 26 13 4 507 211 67 99 67 115 27 5 2 2BB 149
121 154 132 114 50 3 1 261 172 142 126 75 134 44 4 2 333 15B 49 7B 4B 149 62 5 9 228 94
218 128 76 175 21 10 6 335 146 52 68 38 198 59 2 2 3B4 123 41 88 32 133 47 3 1 316 100
221 69 57 162 48 12 II 253 92 63 50 80 94 164 5 10 159 274
255 168 98 160 50 17 4 343 131 277 129 42 203 22 9 \". 274 41 90 104 56 233 57 8 4 264 66
526 146 98 131 43 17 9 282 151 413 170 ~ 125 147 87 9 4 368 203 237 168 91 151 39 28 4 425 149 267 256 138 122 3-4 14 4 426 152 203 158 6B 191 39 11 3 400 lOB 63 123 53 225 41 51 4 283 58
182 148 109 145 63 5 1 248 114
315 165 96 165 5-4 15 2 284 67 215 166 113 193 67 33 1 307 75 427 IB8 101 157 54 4 1 295 68 334 146 75 144 42 4 2 253 58
129 113 33 220 54 31 7 313 89 274 137 39 294 . 70 47 7 289 57
56 132 23 220 38 37 6 269 61 122 90 35 167 40 31 8 344 115 103 107 38 246 81 12 4 331 106
410 49 30 60 19 7 2 193 102 421 26 16 37 5 4 I 123 19 337 71 34 77 20 14 2 206 116 329 48 44 51 15 2 1 216 150 657 34 20 40 18 3 I 165 99 86 73 43 110 35 14 8 270 113
40 98 74 218 72 17 378 178
State, Natural Division and District.
BOMBA~ SAURASHTRA AND KUTCH
BOMBAY STATE
Greater Bombay
Bombay Gujaral Division Banaskantha Sabarkantha Mehsana Ahmedabad Kaira Panch Mahala Baroda Broach Sural Amreli
Bomhay Deccan Northern Division West Khandesh East Khandesh Dangs Nasik Ahmednagar Poona Salara North Satara South Koihapur Shoiapur
Bcmbay Deccan Southern Division Belgaum Bijapur Dharwar
Bombay Konkan Division Thana Kolaba Ratnagiri Kanara
SAURASHTRA STATE Halar Madhya Saurashtra Zalawad Gohilwad Sorath
KUTcH STATE

·240
State, Natural Division and District.
1
BOMBAY, SAURA. SHTRA AND KUTCH
BOMBAY STATE
Greater Bombay
Bomhay Gujarat Division ... Banaskantha Sabarkantha Mehsana Ahmedabad Kaira Panch Mahals Baroda Broach Surat Amreli
Bomhay Deccan Northern Division
West Khandesh East Khandesh Dangs Nasik Abmednagar PooQa Satara North Satara South Koihapur Sholapur
Bombay Deccan Southern Division
Belgaum Bijapur Dharwar
Bombay Konk,an Division ... Thana Koillba Ratnagiri Kanara
. SAURASHTRA STATE Halar Madhya Saurashu'~' Zalilwad ... Gohilwad Sorath
KlJfCH STATE
Total.
2
10.988,510
9.920,073
19,317
3,107,805 263,571 242,679 379.455 190,863 451.056 492.933 332.318 210.324 472,887 71,719
3,812,120 400,094 478,886
15,493 450,913 469,341 472,486 387,798 316,528 406,819 413,762
1.569,698 584,594 487,629 497.475
1,411.133 436,974 326,412 487,524 160.223
954,824 136,077 233,775 111,199 215,722 258,051
113,613
Cultivation.
Principal Means of
Livelihood of self
supporting persons.
3
5,737,303
5,242,157
3,179
1,618,508 134,205 101,368 200,938 109.911 255,412 220,146 181.742 106,816 267,512 40,457
1.976,492 212.739 260,718
9,591 213,216 223,680 236,877 193,614 172,204 229.877 223.976
902,886 324,547 272,041 306.298
741,092 206;230 174,574 265,036 95.252
430,129 57.699
102,391 48,401 99,115
122,523
65,017
Secondary Means of Livelihood
of self. supporting
persons whose Principal Means of
Livelihood is othertban cultivation.
4
224,179
208,277
14,464
43,745 3,495 3,535 5,156 3.858 7,120 2.977 4.180 2,594 9.516 1.314
75.754 3,222 9,505
374 5,2;;1 6,705
11,898 9,491 8,186
10,175 10,947
32,573 13,537 8,805
10,231
41,741 11,980 7,448
17,179 5.134
11,619 1,672 1,916 2,300 3,337 2,394
4,283
Secondary Means of
Livelibood of earning
dependants.
5
, 5,027,028'
4,469,639
1,674
1,445,552 125,870 137,776 173,361 77.094
188,524 269,810 146,396 100,914 195,859 29,948
1.759,874 184.133 208,663
5,528 232,446 238.956 223,711 184,693 136,138 166.767 178,839
634.239 246,510 206.783 180,946
628,300 218,764 144,390 205,309 59,837
513,076 76,706
129,468 60.498
113,270 133.134
44,313
Total.
6
6,320,740
' 5,710,519
14,419
1,807,128 167,489 198,614 288.127 83.249
242,281 381,547 146,821 59,003
202,244 37,753
2,510,553 198,406 216.889 14,123
301.907 320,549 380,552 327,308 243,415 280,130 227,274
822.193 316,067 267,247 238,879
556,226 168.871 104,362 248,380 34,613
549,211 79.355
168.058 49,113
134,108 118,577
61,010
SUBSIDIARY
Active and Semi-active
Cultivation of owned land.
Principal Means of
Livelihood of self
supporting perspns.
7
3,745,668
3,395,691
1,433
1,084,467 90,741 88,594
158.447 60,545
179,395 181.217 105.386 51.786
143.322 25,034
1,467,216 145.249 158,462
9.235 ,56,396 173,565 199,615 173,892 142,372 165,710 142,720
534,458 195,867 173.900 164,691
308,117 74,503 53,382
149,104 21.128
305,835 46,976 75,462 26,917 68,654 87.826
44,142
Secondary Means of
Livelihood of self
supporting persons wbose
Principal Means of
Livelihood is otber than cultivation.
B
131,145
122,358
12,225
25,572 2,121 2,902 3,051 1,586 3.319 2,161 2,318 1,148 6,362
604
50,173 1,845 6.101 , 347 3,042 4.120 8,545 6,973 6,245 7.615 5,340
17,164 7,913 5,077 4,174
17.224 5,155 2.533 8,244 1.292
6,408 1,022 1,124 1,062 1,989 '1.211
2,379
Secondary Means of
Livelihood ofeaming
dependants.
9
2,443,927
2,192,470
761
697,089 74,627
107,118 126.629 21.118 59,567
198,169 39,117 6,069
52,560 12,115
993,164 51,312 52,326 4,541
142,469 142.864 172,392 146,443 94,798
106,805 79,214
270,571 112,287 88,270 70,014
230,885 89,213 38.447 91.032 12,193
236,968 31,357 91,472 21,134 63,465 29,540
14,489

TABLE 4'6 241
Workers in Cultivation
Cultivation of unowned land. Employment as cultivating labourer.
Principal Secondary Secondary Principal Secondary Secondary Means of Means of Means of Means of Means of Means of
Livelihood Livelihood Livelihood Livelihood Livelihood Livelihood Total. of self· of self. of earning of self. of self. of earning State;: Natural Division
supporting supporting dependants. Total. supporting supporting dependants, and District. persons. persons whose persons, persons whose
Principal Principal Means of Means of
Livelihood is Livelihood is other than other than cultivation. cultivation.
10 " 12 13 14 15 16 17
1,621,288 925,586 37,842 657,860 3,046,482 1,056,049 55,192 1,925,241 BOMBAY, SAURA-SHTRA AND KUTCH
1,471,665 836,624 35,474 599,567 2,737,889 1,009,842 50,445 1,677,602 BOMBAY STATE
2,653 747 1,636 270 2,245 999 603 643 Greater Bombay
398,646 251,097 6,207 141,342 902,031 282,944 11,966 607,121 Bombay Gujarat Division 82,606 38.479 973 43,154 13.476 4,986 401 8,089 Banaskantha 4,552 3,039 186 1,327 39,513 9,735 447 29,331 Sabarkantha
22,366 14,951 445 6,970 68,962 27,540 1,660 39,762 Mehsana 38,063 25,149 754 12,160 69,551 24,217 1,518 43,816 Ahmedabad 58,122 45,249 1,048 11,825 150,653 30,768 2,753 117,132 Kaira 69,276 30,657 477 38,142 42,110 8,272 339 33,499 Panch Mahals 31,865 25,285 480 6,100 153,632 51,071 1,382 101,179 Baroda 21,744 18,259 426 3,059 129,577 36,771 1,020 91,786 Broach 62,157 44,605 , 1,325 16,227 208,486 79,585 1,829 127,072 Surat 7,895 5,424 93 2,378 26,071 9,999 617 15,455 Amreli
Bumbay Deccan Northern 220,571 116,121 5,974 98,476 1,080,996 393,155 19,607 668,234 Division
13,781 8,567 273 4,941 187,907 58,923 1,104 127,880 West Khandesh 12,233 7,581 642 4,010 249,764 94,675 2,762 152,327 East Khandesh
151 111 6 34 1,219. 245 21 953 Dangs 20,994 11,953 '4 374 8,667 128,012 44,867 1,835 81,310 Nasik 23,132 6,787 348 15,997 125,660 43,328 2,237 80,095 Ahmednagar 20,212 10,118 952 9,142 71,722 27,144 2,401 42,177 Poona 11,128 5,296 434 5,398 49,362 14,426 2,084 32,852 Satara North 20,304 11,222 551 8,531 52,809 18,610 1,390 32,809 Satara South 69,922 38,005 1,477 30,440 56,767 26,.162 1,083 29,522 Kolhapur 28,714 16,481 917 11,316 157,774 64,775 4,690 88,309 Sholapur
Bombay Deccan Southern 225,218 124,416 3,906 96,896 522,287 244,012 11,503 266,772 Division 113,555 63,602 1,954 47,999 154,972 65,078 3,670 86,224 Belgaum 51.033 24,697 971 25,365 169,349 73,444 2,757 93,148 Bijapur 60,630 36,117 981 23,532 197,966 1 ()S,490 5,076 87,400 Dharwar
624,577 344,243 17,751 262,583 230,330 88,732 6,766 134,832 Bombay Konk,an Division 184,014 90,821 2,818 90,375 84,089 40,906 4,007 39,176 Thana 175,844 100,677 4,108 71,059 46,206 10,515 807 34,884 Kolaba 174,428 101,01.5 8,030 65,383 64,716 14,917 905 48,894 RatDagiri 90,291 51,730 2,795 35,766 35,319 22,394 1,047 11,878 Kanara
129,291 75,228 1,039 53,024 276,322 49,066 4,172 223,084 SAURASlITRA STATE 10,995 6,740 103 4,152 45,727 3,983 547 41,197 Halar 31,893 17,649 154 14,090 33,824 9,280 638 23,906 Madhya Saurashtra 31,277 16,416 290 14.571 30,809 5,068 948 24,793 Zalawad 31,262 15,360 318 15,584 50,352 15,101 1,030 34,221 Gohilwad 23,864 19,063 174 4,627 115,610 15,634 1,009 98,967 Sorath
20,332 13,734 1,329 5,269 32,271 7,141 575 24,555 KUTCH STATE MO·A Bk H 91-27

242 SUBSIDIARY
Progress of Cultivation
(Figures in
The figures given for 1921. 1931 and 1941 for Bombay State and the various districts thereof were obtained from the Director of Agliculture. They pertain, however, to the dis~ricts of the former Bombay Province and not to the existing districts of the State of Bombay. These figures require adjustments for territorial changes that took place after 1947, but it was not possible to make these adjustments as the data necessary for the purpose were not available.
(2) The figures given for Satara North District pertain to the old district of Satara. The figures for 1941 shown against the district of Broach pertain to the old combined district of Broach and Panch Mahals.
(3) The figures for 1951 have been taken from the .. Bombay Season and Crop Report for 1949-50," the only report giving figures for all the newly constituted district!> of the Bombay State that was available when this and the two following Subsidiary Tables were prepared.
State. Natural Division and District.
BOMBAY STATE
Greater Bombay
Bombay Gujarat Division Banaskantha Sabarkantha Mehsana Ahmedabad Kaira Panch Mahala
Baroda Broach Surat Amreli
Bombay Deccan Northern Division
West Khandesh East Khandesh Dang. Nasik Ahmednagar Poona Satara North Satara South Koihapur Sholapur
BombaJl Deccan Southem Division
Belgaum' Bi;apur Dharwar
Bombay Konk_an Division Thana Ko1aba Ratnagiri Kanara
SAURASHfRA STATE
KUTCH STATE
1951
2
42,362'8
14'0
13,022'6 1,196'2 902'2
1.788'4 1,475'5 1.299'3 1,340'2
1,706,6 1,073'7 1,701'6 538'9
18,634'3
1,760'6 1,934'4
25'3 2,294'2 3,053'8 2,439'6 1,738'4 1,652'0
851'7 2.874'3
8,472'5
2,260'4 3,535'1 2,677'0
2,219'4 737,2 486'4 744'6 251'2
958'0
515'0
Average net area sown in acres, A (I)
1941
3
28,S46
29
4,402 Not availahle Not available Not available
1.598 837
included in Broach
Not available 1,198
769 Not available
15,057
1,570 1,953
Not available 2,270 2,851 2,087 2,122
Not available Not available
2,204
7.029
1,878 2,899 2,252
2.029 632, 403 767 227
795'1
Not available
1931
4
27,810
37
4,223 Not available Not available Not available
1.464 816 561
Not available 625 757
Not available
14,549
1,497 1,993
Not available 2,062 2,703 2,007 2,056
l'iot available Not available
2,231
7,040
1,862 2,937 2.241
1,961 593 394 737 237
814'6
Not available
1921
5
26,613
Not available
4,177 Not available Not available Not available
1,219 762 843
Not available 60S 745
Not available
13,690
1,340 1,974
Not available 1,960 2,563 1,822 1,926
Not available Not available
2,105
6,777
1,751 2,842 2,184
1,969 595 391 735 248
771'5
Not available
Average area sown more than once in acres,
1951
6
1,281'3
448'5 23'7 34,7 84'1 6'9
24'S 147'3
8'3 3'2
111'6 4'2
583"9
69'8 51'9
73'3 83'3
109'6 91'5 37'5 9'2
57'8
165'0
~2'1 51'0 51'9
83'9 6'0
29'7 2B-3 19'9
Not available
17'S
A (2)
1941
7
931
158 Not available Not available Not available
16 19
Not available 69 54
Not available
621
94 30
Not available 74 71
176 138
Not available Not available
38
75
31 22 22
77 8
17 35 17
Not available
Not available
1931
8
734
152 Not available Not available Not available
16 23 69
Not available 1
43 Not available
426
27 13
Not available 53 59
121 122
Not available Not available
31
72
33 9
30
84 12 14 39 19
5'8
Not available
1921
9
7BB
Not available
195 Not available Not available Not available
32 43 72
Not available 2
46 Not available
448
25 18
Not available 59 68 94
150 Not available Not available
34
60
28 9
23
85 8
11 46 20
Not available,
Not available

TABLE 4'7
during three decades
thousands of acres)
243
, (4) Figtires for 1921, 1931 and 1941 are quinquennial averages. Figures for 1951, however, pertain only to the year 1949-50 as figures for earlier years for districts and states as now constituted were not available.
(5) Figures for Greater Bombay are really figures for the Bombay Suburban District which since 195.9 has been included in Greater Bombay for purposes of civic administration.
(6) Figures for Saurashtra and Kutch States have been taken from the" Statements showing the progress of cultivation during the three decades 1921 to 1951 " which were prepared by the Ministry of Food and Agriculture of the Government of India. Figures for the individual districts of Saurashtra State were not available. The Saurashtra figures would appear to be incomplete.
Aver8ge net area irrigated more than once in acres, A(4)
Average net area irrigated in acres. A(3)
State, Natural Division and ------------------1-------------------1 District.
1951
10
2,015'6
5'0
402'2 69'0 53'9
105'8 66'4 53"3 14'7
2"6 11'5 25'0
1,232'8
80'7 68'4
112.7 253'3 207'8 146'8 77"6 35-6
249'9
315'3
150'0 54"4
110'9
60'3 9'0 6'1
13"0 32'2
46'3
51'2
1941
"
1,125
1
117 Not available Not available Not available
62 40
Not available 7 8
Not available
761
27 33
Not available 88
182 I 163 124
Not aV8ilable Not available'
144
193
66 37 90
53 7 1
18 27
36'7
Not available MO.A Bk H 91-27a
1931
12
1,013
119 Not available Not available Not available
66 40 5
Not available 1 7
1921
13
995
Not available
138 Not available Not available Not available
76 48 4
Not available I 9
Not available ... Not available
647 634
24 30 24 30
Not available Not available 72 90
131 123 144 114 III 108
Not available Not available Not available Not available
141 139
187 157
64 62 27 17 96 78
60 66 5 5 I 1
2B 39 26 21
36'3 95'5
Not available Not available
1951
14
249'6
17"6
0'2 12"4 2'3
? 0'6 2'1
210'2
12'0 12"6
31'3 24'3 32') 33"8 16') 0'8
46.4
15.3
11'7 3"6
6'5 1'3 3'5 1'7
2'3
"-
1941
15
178
5 Not available Not available Not available
3 2
Not available
Not available
158
4 3
Not available 21 24 4) 30
Not available Not available
31
10
) 4 I
5
5
Not available
1931
16
126
2 Not available Not available Not availab e
I 1
Not available
Not a;~il~ble
111
3 1
Not available 18 lB 26 23
Not available Not available
22
10
6 3 I
3 1
. 2
5'8
Not available
1921
17
133
7 Not available Not available Not available
4 3
Not available
Not available
116
3 3
Not available 19 16 28 21
Not available Not available
26
9
7 2
Not available
BOMBAY STATE
Greater Bombay
Bombay Gujarat Division Banaskantha Sabarkantha Mehsana Ahmedabad Kaira Panch Mahala
Baroda Broach Surat Amreli
Bombay Deccan Northern Division West Khandesh East Khandesh Dangs Nasik Ahmednagar Poona SataraNonh Satara South Kolhapur Sholapur
Bombay Deccan Southern Division Belgaum Bijapur Dharwar
" Bombay Konk_an Division Thana Kolaba Ratnagiri Kanara
SAURASHTRA STATE
KUTCH STATE

244 SUBSIDIARY
Comp'9nents of Cultivated Area
For working out figures of cultivated area per capita in cents, the acreage figures shown in Subsidiary Table 4'7 were divided by the population figures pertaining to the year in question and then multiplied by 100. Thus in this table a figure of 100 cents represents one acre.
The acreage figure shown against Greater Bombay related to the former Bombay Suburban District and therefore. for workin~out figures per capita in cents, the acreage figure was divided by the population figure of Bombay Suburban District at past censuses. and then multiplied by 100. The acreage figures shown for Satara North for the years 1921. t 931 and 1941 pertained to the former Satara District of Bombay Province and were. therefore. divided by the population figure of the old SataTa District and not the present district of Satara North.
The figures shown for 1921, 193 t and 194 t for the State of Bombay relate to the districts of the former Province of Bombay, without adjustment for boundary changes that occurred after the merger of the former Indian States that took place from 1948 onwards. The figures for 1951 for Bombay State pertain to Bombay State as constituted at the time of the 1951 Census. If comparable figures for 1951 were required for the area of the former Province of Bombay they could be worked out by utilising the following method :-
The 1941 population figure of the area that at presen~ constitutes Bombay State was 29.181,146. The 1941 population of the twenty districts of the former Province o'f J;3ombay for which acreage figures have been worked out was 20,849.840. The difference between these two figures is 6,33l,306. Therefore, the net effect of the merger of the former Indian States and other territorial changes was the acquisition of an additional 1941 population of 8.331.306. , I Unirrigated Single Crop Cultivation per Capits (USC) Unirrigated Double Crop Cultivation per Capita (UDC)
, (in cents). (in cents). State, Natural Division and,
District. 1951 1941 1931 1921 1951 1941 1931 1921 {
1 _ ,,_,' 2 3 4 5 6 1 8 9
BOMBAY STATE Greater Bombay
Bombay Gujarat Division Banaskantha Sabarkantha Mehsana Ahmedabad Kaira Panch Mahal.
Baroda Broach Surat Amreli
Bombau Deccan Northern Division ...
West Khandesh East Khandesh DaniS Nasik Ahmednagar Poona Satara North Satara South Kolhapur Sholapur ...
Bombay Deccan Southern Division
Belgaum ... Bijapur Dharwar ...
Bombay Konk,an Division Thana Kolaba Ratnagiri Kanara
SAURASIITRA STATE
KUTCH STATE
109'3 1'8
106'9 147'4 119'0 109'5 83'3 75'8
102-6
142'1 151'2 86'4
16('3
137'7 141'5 124'1 53'5
149'6 194'3 110'4 130'5 156'3 65'8
173'6
170'4 119'3 245'9 159'6 44'7 47'7 50'0 41'2 38'5
127'9 11'1 101'0
Not available Not available Not available
111 '0 85'0
included In
Broach Not available
121'3 80'0
Not available
168'7 159"0
, 143'0 N'6t available ~191'0
229'0 132'0 142'0
Not available Notivailable
202'0
199'0 145'0 291 '0 178'0 55'7 66'0 57'0 52'0 41'0
145'6 21'3 125'6
Not available Not available Not available
150-0 102'0 107'0
Not available 186'0 102-0
Not available
188'9 188'0 162'0
Not available 195'0 256·0 151'0 155-0
Not available Not available
248'0
222'8 163'0 334'0 192'0
57'1 69'0 60'0 51'0 46'0
26'5
15S'S Not availablG
130'2 Not available Not available Not available
125-0 95'0
205-0
Not available 196'0 IOZ'O
Not available
210'0 201'0 179'0
Not available 220'0 326'0 163'0 164'0
Not available Not availablel
264'0
235'7 , 175'0 354-0 ,201'0
63'2 77'0 67'0 56'0 51'0
26'.
Not available Not available Not available
, ,
2'9
3'8 3'2 5'0 4'9 0'3 1'5
12'8
0'7 0'5 6·0 0'7
3'6
3'7 Not available Not available Not available
0-9 I'S
4'8 Not available Not available Not available
1'6 3'0
15'2
Not available Not available 7'5 0'3
-> 6'1 6·Z Not available Not available
5'6 9'9 Z'o
Not available 4'7 4'1 9'6 8'1
Not available Not svailable
0'7
1'9 2'1 1'8 1'7 2" , 0'8 2'5 2'2 3'8
4'4 3'1 1'0
Not available 3'5 4'1 8'1 8'4
Not available Not available
1'0
2'0 2'5 0'1 2'6 2'5 1'3 2'2 2'8 4'5
4"1 Not available
6'4 Not available Not available Not available
3'1 5'6
19'2
,~ot available 0·6 6'8
Not available
5'5 3'4 1'4
Not available 4'8 7'1 6'5
12'6 Not available Not available
1'1
1'8 2'2 0'9 2'2 2'9 0'9 1'9 4'0 5'0
Not available Not available Not available Not available
2'7 Not available Not available Not avallabl.

TABLE 4°8 245
per Capita during three decades
Assuming that this newly asquired population increased at the same rate as the general population of the State of Bombay as at present constituted during the past decade the additional population would have increased to 10,264,169 and the population of the old districtsoftheformer Province of Bombay in 1951 would have been 25,691,981: In regard to acreage figures, the figures available for the former Province of Bombay in the" Season and Crop Report for 1948-49" might be accepted. On the basis of these figures, the cultivated area per capita in cents for the former Province of Bombay for 1951 would be as under :-
Unirrigated Single Crop Uniy:rigated Double Crop Irrigated Single Crop 0. Irrigated Double Crop
The corresponding figures for Bombay State shown in the table are as under :Unirrigated Single Crop Unirrigated Double Crop I rrigated Single Crop .. Irrigated Double Crop
Hhoo 3°3 5°0 0°8
109°3 2°9 4°9 0°-7
If the figures and methods are reliable Bombay would appear to have gained by the merger of the former Indian States in respect of unirrigated areas, and lost in respect of irrigated areas.
Irrigated Single Crop Cultivation per Capita (ISC) (in cents)o .
1951
10
8°3 1/
6°0 3/8
.0/000 )5°7 16°2 9°0 9°6 6°' 2°8
13 0 S
6°4 8°0 3"6 7°0 1°2 OoS 0°, 0°' 6°2
1941
11
4°5 0°4 2"7
Not available Not available Not available
4°3 4°1
Not available , 0°7 , 0°9
/ Not available )1
7"4 20S 2°3
Not available 6°0
13°8 S07 7°1
Not available Not available
11°1
5"4 5°0 3"4 7"4 1°4 0°7 0°' 0°9 6°1
1931
12
4°9
3°7 Not available Not available Not available
7°0 5°2 1°1
Not available 0°3 1°0
Not availabl'i.
70S 2°7 1°9
Not available S04
11°4 fOol 7°4
Not available Not available
13 0S
S08 5°4
/2°8 8°6 . 1°8 0°5 0°' 2°0 6°2
1921
13
5"4 Not available
4°4 Not available Not available Not available
Sol 6°3 1°1
Not available 0°3 1°3
Not available
80S 4°2 20S
Not available 8°5
14"6 8°5 8°5
Not available Not available
13°9
S03 50 S 1·9 70 S 2°3 OoS 0°2 3°4 S·2
Irrigated Double Crop Cultivation per Capita (IDC) (in cents).
1951
14
0°7
0°2 Not available
0°3 0°8 0°1
0°7
1°7 1°0 0°8
2°2 1°7 1°7 2°9 1°6 0°1 3°1
0°3 0°7 0°2
1941
IS
0°9
Not available Not available Not available
0°2 0°2
Not available
Not available
1°9 0°4 0°2
Not available 1°9 2°1 3°3 2°3
Not available Not available
3°0
1931
16
0°7
Not available Not available Not available
0°' 0°1
Not available
Not available
I·S 0°4 0°1
Not available 1°8 1°8 2°2 1°9
Not available Not available
20S
0°3 OoS 0°3 0°1
0°1
0°1
1921
17
0°8
Not available Not available Not available
0°4 0°4
Not available
Not available
1°9 0°5 0°3
Not available 2"3 2°2 20S ZoO
Not available Not available
3"5
0°3 0°7 0°2
0°1
State, Natural Division and District.
BOMBAY STATE Greater Bombay
Bomhay Gujarat Division Banaskantha Sabarkantha Mehsana Ahmedabad Kaira Panch Mahala
Baroda Broach Surat Am.reIi
Bombay Deccan Northern Division
West Khandeah East Khandeah Dangs Nasik Ahmednagar Poona Satara North Satara South Kolliapur Sholapur
Bombay Deccan Southern Division Belgaum Bijapur Dharwar
Bomhay Konk.an Iiivision Thana Kolaba Ratnagiri Kanara
1°1 1°0 1°0 3 ° 7 Not available 0°7 SAURASHTRA STATE
S06 Notavaila6le Not available Not available 0·4 Not available Not available Not available KUTCH STATE

246
SUBSIDIARY TABLE 4'9
Land Area per Capita (1951) and trend of Cultivation per Capita during thfee decades This table shows (i) the total land area per capita (ii) the area cultivated and cultivable per capita and
(iii) the area of cultivation per capita for 1951, 1941, 1931 and 1921. 2, The figures are given in cents, i,e, in hundredths of an acre, Thus 100 cents equal one acre,
3. For working out the figures of land area per capita (1951) given in columns (2) and (3) for Bombay State and its component districts, the acreage figures available in the" Season and 'Crop ReRort for 1949-50 " for Bombay State were used. The acreage figures were divided by the 1951 population figures and then multiplied by 100 for conversion into cents.
The figures shown for 1921. 1931 and 1941 for Bombay State relate to the former Province of Bombay and its component districts, without adjustment for boundary changes that t09k place from 1948 onwards,
4. The area of cultivation per capita is the total of (i) the unirrigated single crop cultivation per capita (ii) the unirrigated double crop cultivation per capita, (iii) the irrrigated single crop cultivation per capita and (iv) the irrigated double crop culti vation per capita.
Therefore the figures given in columns 4, 5, 6 and 7 of this table represent the totals of the figures given in the columns specified below of Subsidiary Table 4' 8
Column 4 of Subsidiary Table 4'9 Column 5 " Column 6 .. Column 7
"
Column - 2 - 3 - 4 - 5
ColuiTln Column + 6 -+ 10 + 7 + II + 8 + 12 + 9 + 13
Column + 14 + 15 + 16 + 17
of Subsidiary Table 4' 8
" " "
Land Area per Capita (1951). Area of Cultivation per Capita (in cents),
T ota! Land Area Area cultivated State, Natural Division and per Capita and cultivable 1951 1941 1931 1921
District, (in cents), per Capita (in cents),
2 3 4 5 6 7
BOMBAY STATE 188 140 117'8 136'8 154'4 166'0
Greater Bombay 8'2 5'6 2'8 11'5 21'3 Not available
Bomhay Gujarat Division 183 131'3 114'3 107'4 134'1 141'0 Banaskantha Not available Not availabl~ 159'8 Not available Not available Not available
Sabarkantha 215 161 132'1 Not available .> N 01 available Not available
Mehsana 193 145 121'5 Not available Not available Not available
Ahmedabad 130 104 87'S 116'4 158'7 136'6
Kaira 102 84 80'S 91'1 110'3 107'3
Panch Mahala 193 147 116'7 Not available 123'3 225'3
Baroda 190 159 142'8 Not available Not available Not available
Broach 248 180 152'1 129'5 186'6 196'9
Surat 139 100 93'0 87'0 109'2 110'1
Amreli 306 227 169'9 Not available Not available Not available
Bombay Deccan Northern Division ' .. 231'2 171'2 150'7 183'6 202'3 225'9 West Khandesh 304 163 153'5 171'8 194'2 209'1 East Khandesh 195 144 131'4 147'5 165'0 183'2 Dangs 894 70'4 53'5 Not available Not available Not available Nasik 268 185 160'4 203'7 20S'7 235'6 Ahmednagar 293 236 216'4 249'0 273'3 349'9 Poona 193 145 125'0 153'6 171'4 180'8 SataraNorth 221 171 147'9 159'5 172'7 187'1 Satara South 212 193 166'1 Not available Not available Not available Kolhapur 139 89 69'4 Not available Not available Not available Shoiapur 243 219 190'9 216'8 265'0 282' 5

SUBSIDIARY TABLE 4' 9-cQnid.
Land Area per Capita (1951) and trend of Cultivation per Capita during three decades
State. Natural Division and District,
Bombay Deccan Southern Division
Belgaum
Bijapur
Dharwar
Bombay Konb_an Division
Thana
Kolaba
Rahlaiiri
Kanara
SAURASHTRA STATE
KUTCH STATE
;,-'
Land Area per Capita (1951),
Total Land Area Area cultivated per C3p;ta and cultivable per {in cents}, Capita (in cents),
2 3
238 203'0
198 156
311 282
216 184
Z09 102'6
161 78
186 liZ
180 IZ9
486 69
Not available Not available
Not available Not available
Area of Cultivation per Capita (in cents).
1951 1941 1931 1921
4 5 6 7
180'3 206'6 230'9 243'1
130'9 152'5 171'4 183'7
253'1 296'6 337'8 357'0
1"69'9 187'1 203'3 210'7
47'6 59,2 61'4 68'4
48'6 67'5 70'9 78'5
53'5 59'6 62'3 69'1
43') 55'5 55'9 63'4
48'5 50'9 56'7 61'Z
23'1 22'3 28'2 30'1
101'3 Not available Not available Not available
247

248 SUBSIDIARY
Non-Agricultural Classes per 1,000 persons of General Population; number in each Employers, Employees and Independr)lt Workers per 10,000
Non-Number per 10,000 pen;ons of all
Agricultural
State, Natu;.u Division and Di~tIict. Classes per Total.
I ,000 persons V-Production Vl-Commerco. of General Self- Non- other than Population. supporting earmng Earning cultivation.
persons. dependants. dependants.
I 2 3 4 5 6 1
BOMBA~ SAURASHTRA AND KUTCH 403 3,033 6,192 775 3,539 1,979
BOMBAY STATE 385 3,141 6,137 722 3,571 1,975
Greater Bombay ... 995 4,451 -5,333 216 3,520 2,447
Bombay Gujaraf Division 378 2,830 6,362 808 3,681 2,004
Banaskantha 289 2,829 6,048 1,123 3,207 2,221 Sabarkantha 261 2.610 6.146 1.244 3.426 2.112 Mehsana 390 2,623 6,378 999 3,598 2,056 Ahmedabad 705 3.110 6,336 554 4,697 2,042 Kaira 2B9 2,682 6579 739 3,175 2,091 Panch Mahals 162 2,7B2 6,292 926 2,834 2,353
. Baroda 370 2,995 6,269 736 2,623 2,030 Broach 288 2,737 6,235 1,028 2,547 1.842 Sural. 388 2,676 6,455 869 3,811 1,725 Amreli 467 2,549 6,630 821 3,586 1,822
Bombay Deccan Northern Division 309 2,793 6,377 830 3,516 1,721
West Khandesh 227 2.713 6,426 861 3.213 1.960 East Khandesh , 295 2,630 6,528 842 3,511 1,849 Dang! 96 4,005 4,680 1,315 3,922 802 NaGik 327 2,720 6,324 956 3,508 1.699 Ahmednagar 270 2,529 6,246 1,225 3,516 1,649 Poona 477 3,203 6,228 569 2,874 1,595 Satara North 228 2.601 6,366 1,033 3,894 1,601 Salara South 211 2.626 6,473 90r 3,353 1,733 Kolhapur 244 2,728 6,568 704 3,632 1,800 Sholapur 374 2,691 6,495 808 4,544 1,807
Bombay Deccan Southern Division 268 2,836 6,168 996 3,863 2,152
BelgalllD 245 2,765 6,322 913 3,757 1,98B Bijallur 248 2,808 5,890 1,302 4,144 2,092 Dharwar 309 2,917 6,232 851 3,755 2,338
Bomhag Kol1f?,an Division 353 2,752 6,348 900 3,278 1,538
Thana 456 3,056 6.149 795 3.205 1.815 Kolaba 260 3,019 5,947 1,034 3,152 1,447 Ratnagiri 305 2,200 6,817 983 3,331 1,172 K8.!lara 372 2,825 6,283 892. 3,m 1,648
SAURASHTRA STATE 53t 2,384 6,536 1,080 3,368 2,012
Haiar 534 2.344 6,554 1,102 3,742 1,877 Madhya Saurashtra 571 2,337 6,667 996 3,213 2,126 Zalawad 543 2,448 6,218 1,334 3,729 1,691 Gahilwad 534 2,295 6,530 1,175 3,295 2,049 Sorath 490 2,528 6,549 923 3,205 2,094
KUTCH STATE 580 2,850 6,180 .. 970 3,305 1,950

TABLE 5'1 249
Class and Sub-Class of 10,000 persons of all Non-Agricultural Classes ; and number of self-supporting perSO:lS of all Non-Agricultural Classes
Non-A,,"J'icultural Classes. Number per 10,000 self.supporting persons of all Non-Agricultural Classes.
_,;
VII-Transport. VllI-Other Employers. Employees. Independent Others. State, Natural Division and District. services and Workers.
miscellaneous sources.
8 9 10 II 12 13
563 3,919 465 5,025 4,221 289 BOMBAY, SAURASHTRA AND KUTCH
579 3,875 477 5,354 3,905 264 BOMBAY STATE
844 3,189 402 7,562 1,882 154 Greater Bombay
449 3,866 436 4,451 4,759 354 Bombay Gujarat Division
575 3,997 254 2,056 7,055 635 Banaskantha 276 4,186 247 2,469 6.932 352 Sabarkantha 390 3,956 428 2,376 6,749 447 Mehsana 362 2,899 482 6,232 3,008 278 Ahmedabad 350 4,384 391 3.377 5,840 392 Kaira 583 4,230 317 4,413 4,876 394 Panch Mahals 543 4,804 392 4,979 4,189 440 Baroda 351 5,260 375 3,868 5,528 229 Broach 628 3,836 588 4,637 4,509 266 Surat 543 4,049 323 )3,316 5,934 427 Amreli
498 4,265 621 4,778 4,308 293 Bomhay Deccan Northern Division
272 4,555: 957 3,506 5,344 193 West Khandesh 780 3,860 603 4,283 4,837 277 East Khandesh 57 5,219 598 6,460 2,876 66 Dangs
670 4,123 698 4,553 4,484 265 Nasik 313 4,522 708 4,263 4,782 247 Ahmednagar 569 4,962 569 6,199 2,917 315 Poona 271 4,234 367 3,525 5,756 352 Satara North 468 4,446 639 3,547 5,402 412 Satara South 307 4,261 520 3,824 5,355 301 Kolhaput 470 3,179 623 4,991 4,097 289 Sholaput
386 3,599 344 3,187 6,153 316 Bombay Deccan Southern Division
345 3,910 489 3,250 5,954 307 Belgaum 255 3,509 258 2,604 6,799 339 Bijapur 514 3,393 283 3,535 5,874 308 Dharwar
801 4,383 560 4,723 4,502 215 Bombay Konkan Division
757 4,223 684 5,796 3,358 162 Thana 874 4.527 604 4,292 4,911 193 Kolaba 910 4,587 518 3,869 5,358 255 Ratnagiri 574 4,225 112 2,913 6,608 367 Kanara
485 4,135 ·401 2,841 6,321 437 SAURASHfRA STATE
641 3,740 246 2,841 6,392 521 Halar 458 4,203 444 2,920 6,148 488 Madhya Saurashtra 311 4,269 419 2,602 6,601 378 Zalawad 485 4,171 464 2,938 6,235 363 Gohilwad 515 4,186 371 2,779 6,414 436 Sorath
427 is,31S 259 2,013 7,080 648 KUTa-I STATE

250 SUBSIDIARY
Non-Agricultural Classes per 1,000 persons of Rural Population ; number in each Class and Employers, Employees and Independemt Workers per 10,000
Non- ) Number per 10,000 persons of all
Agricul tural
State, Natural Division and District. Classes per Total.
1,000 persons V-Production VI-Commerce. of Rur.l Self- Non- other than
Population. supporting earning Earning cultivation. persons. dependants. dependants.
I 2 3 4 5 6 7
BOMBA~ SAURASHTRA AND KUTCH 201 2,688 5,917 1,395 3,973 1,336
BOMBAY STATE 178 2,738. 5,931 1,331 3,891 1,346
Greater Bombay •..
Bombay Gu]arat Division 209 2,707 6;016 1,277 3,649 1,459
Banaskantha 235 2,795 5,858 1,347 3,589 2,045 Sabarkantha 215 2,564 6,032 1,404 3,855 1,843 Mehsana 290 2,533 6,184 1,283 4,087 1,545 Ahmedabad 326 2.638 6,039 1,323 3,880 1,430 Kaira 146 2.816 6,014 1,170 3.860 1,486 Panch Mahala 71 3,031 5,190 1,779 3,706 1,585 Baroda 187 3.055 5,619 1,326 2.562 1,487 Broach 157 2,717 5,688 1,595 2,401 1.141 Surat 237 2.668 6,307 1,025 3,639 993 AmreIi 315 2,575 6,278 1,147 4,246 1,447
Bombay Deccan Northern Division 145 2,687 5,883 1,430 4,160 1.281
West Kbandesh J13 2,687 5,847 1,466 3,752 1,529 East Khandesh 126 2,761 5,742 1,497 4,157 1,348 Dang! 96 4,005 4,680 1.315 3,922 802 Nasik 149 2,605 5,838 1,557 3,711 1,455 Ahmednagar 175 2,357 5,957 1,686 4,376 1,171 Poona 193 3,100 5,687 1,213 3,533 1,170 Satara North 152 2,568 5,968 1,464 • 4,801 1,172 Satara South 113 2,600 6,147 1.253 4,185 1,124 Kolhapur 118 2,722 6,053 1,225 4,683 1,422 Sholapur 147 2,678 5,935 1,387 4,472 1,278
Bombay Deccan Southern Division 125 3,033 5,547 1,420 4,538 1,603
Belgaum 131 2,947 5,697 1,356 4,816 1,318 Bijapur 115 3,027 5,385 1,588 4,456 1,576 Dharwar 128 3,144 5,506 1,350 4,266 1,980
BombaJl Konkan Division 237 2,732 6,022 1,246 3,656 1,094
Thana 226 3,359 5,187 1,454 3,988 1,060 Kolaba 196 3,074 5,644 1,282 3,306 1,262 Ratnagiri 257 2,135 6.698 1,167 3,458 1,000 Kanara 266 3,146 5,812 1,042 • 4,232 1,267
SAURASHTRA STATE 356 2,432 5,827 1,741 4,370 1,228
Halar 360 2,260 6,001 1,739 5,145 1,175 Madhya Saurashtra 370 2,433 5,834 1,733 4,467 1,106 Zalawad 394 2,535 5,404 2,061 4,547 1,036 Gohilwad 368 2,284 5,933 1,783 3,627 1,425 Sorath 306 2,668 5,847 1,485 4,557 1,283
KUTCH STATE 498 2,816 6,011 1,173 3,855 1,609

TABLE S'l-A
Sub-Class of 10,000 persons of all Non-Agricultural Classes in rural areas; and number of self-supporting perlfons of all Non-Agricultural Classes in rural areas
Non-Agricultural Classes in Number per 10,000 self-supporting persons of all Non-Agricultural
I rural areas. Classes in rural areas.
,... .... ~J .--;
vu-Transport. VllI-Other services and
Employers. Employees .• Independent Others. State, Natural Divisfon and Qistrict. Workers.
miscellaneous sources.
8 9 10 II 12 13 1
251
441 4,250 265 2,928 6,494 313 BOMBAY, SAURASHTRA AND KUTCH
492 4,271 292 3,260 6,184 264 BOMBAY STATE
Greater Bombay
480 4.412 172 2.865 6.683 280 Bombay GujaTaf Divisian
531 3.835 70 1,308 8,012 610 Banaskantha 217 4,085 150 2,106 7,376 368 Sabarkantha 430 3.938 192 1,655 7,844 309 Mehsana 324 4,366 85 2,477 7,240 198 Ahmedabad 227 4,427 162 2,542 7,045 251 Kaira 314 4,395 143 4,430 5,058 369 Panch Mahals 627 5,324 214 4,305 5,319 162 Baroda 220 6,238 130 3,586 6,179 105 Broach 915 4,453 267 4,318 5,238 177 Surat 272 4.035 181 1,802 7.534 48~ AmreIi
....
376 4,183 443 3.627 5,679 251 Bombay Deccan Northern Division
180 4,539 688 2,970 6,160 182 West Khandesh 754 3.741 486 3,859 5,388 267 East Khandesh 57 5.219 598 6,460 2,876 66 Dangs '
662 4.172 626 3.377 5,836 161 Nasik 253 4.200 705 4.093 4,950 252 Ahmednagar 301 4,996 214 5.121 4,487 178 Poona 182 3,845 250 2.798 6.625 327 Satara North 544 4,147 635 2,648 6,473 244 Satara South 129 3.766 143 2.557 7.046 254 Koihapur 479 3,771 415 3.1\6 6,040 429 Sholapur
179 3.680 120 2.091 7,413 376 Bombay Duclm Southern·Dif)ision
209 3,657 155 2,501 6,994 350 Belgaum 110 3.858 77 1,773 7,758 392 Bijapur 204 3,550 117 1,891 7,601 391 Dharwar
842 4,408 402 4,133 5,274 191 Bombay Konkan Dif)ision
754 4,198 503 5,410 4.000 87 Thana 895 4537 474 4.103 5.271 152 Kolaba 935 4,607 403 3,657 5,689 251 Ratnagiri 600 3,901 64 2,492 7,115 329 Kanara
244 4,158 169 1,656 7,702 473 SAURASHTRA STATE
322 3,358 70 1,589 7.723 618 Halar 295 4.132 147 1.707 7,649 497 Madhya Saurashtra 99 4.318 284 1.455 7,977 284 Zalawad
272 4.676 218 1.587 7,777 418 Gohilwad 191 3,969 122 1,843 7,493 542 Soratb
303 4,233 119 1,3!7 7,861 633 KUTCH STATE

252 SUBSIDIARY
Non-Agricultural Classes per 1,000 persons of Urban Population; number in each Class and Employers, Employees and Independent Workers per 10,000
f)
-
I Nwnber per 10,000 perllOnlI of all
I Non- , Agricultural Classes per Total.
State, Natural Di';;~ion and District. 1,000 periOns V-Production VI-Commerce. , of Urban SeU- Non- other than Population. supporting . earmng Earning cultivation.
persons. dependants. dependants.
I 2 3 4 5 6 7
BOMBAY, SAURASHTRA AND KUTCH 851 3,213 6,336 452 3,313 2,314
BOMBAY STATE 846 3,329 6,233 438 3,422 2,268
Greater Bombay ••• 995 4.451 1,333 216 3,520 2,447
Bombay Gujarat Divilion 872 2,915 6,602 '\.
483 3,702 2,383
Banaskantha 939 2,931 6,628 441 2,039 2,758 Sabarkantha 865 2,758 6,511 731 2,046 2,978 Mehsana 747 2,746 6,645 609 2922 2,761 Ahmedabad 967 3,220 6,405 375 4,887 2.184 Kaira 651 2,607 6,900 493 2,785 2,435
..Panch Mahala 841 2,628 6,973- 399 2,295 2,828 Baroda 925 2,%0 6,665 375 2,661 2,362 Broach 870 2,754 6,677 569 2,665 2,409 Surat 949 2,683 6,592 725 3,971 2,402 Amreli 875 2,524 6,968 50B 2,952 2.183
'" Bombay Deccan Northern Divmon 763 2,849 6.637 514 3,176 1,954
West Khandesh ... 783 2,730 6,832 438 2.835 2,262 East Khandesh , .. 660 2,576 6,849 575 3,247 2,054 Dang.
838 2,779 6,572 649 3,405 Nasik 1,823 Ahmednagar 803 2,736 6,596 668 2,474 2,228 Poona 856 3,233 6,392 375 2,675 1.723 Satara North 713 2,645 6,903 452 2,674 2,177 Satara SQuth ... 455 2.641 6,675 684 2,838 2,110 Kolhapur ::: It,
626 2,732 6,874 394 3,006 2,025 Sholapur 873 2,704 6,703 593 4,570 2,004
Bombay Deccan Southern Diouion 668 2.732 6,495 773 3,507 2,441
Belgaum 604 2,642 6,746 612 3,039 2,443 Bijapur 692 2,687 6,170 1,143 3,970 2.379 Dharwar 707 2,826 6.521 653 3,551 2,481
Bombay Kon!t,an Divilion 836 2,775 6.731 494 2.834 2.061
Thana 892 2,911 6,610 479 2,830 2.176 Kolaba 797 2.904 6,581 515 2,830 1,832 Ratnagiri 776 2,412 7,206 382 2,917 1,732 Kanara 710 2,442 6,845 713 2,741 2,103
SAURASHTRA STATE 885 2,345 7,098 557 2,575 2,633
Halar 890 2,414 7,010 576 2,587 2,455 Madhya Saurashtra 883 2,275 7,210 515 2,394 2,792 Zalawad 882 2,358 7,052 590 2,891 2,362 Gohilwad 905 2,306 7,073 621 2,993 2,617 Sorath 867 2,426 7,057 517 2.229 2,680
KUTCH STATE 906 2,922 6,551 537 2,098 2,698

TABLE S'1-B
Sub-Class of 10,00'1 persons of all Non-Agricultural Classes in urban areas; and number of self-supporting persons of all Non-Agricultural Classes in urban areas .,.-
Non-Agricultural Clasaes in urban Number per 10,000 self-supporting persons of all Non-Agricultural areas. Classes in urban areas. ,
VII-Transport. VIII-Other Employers. Employees. Independent Others. State, Natural Division and District. services and Workers.
miscellaneous Bources.
8 9 10 11 12 13 1
253
626 3,747 55! 5,938 3,231 279 BOMBAY, SAURASHTRA AND KUTCH
619 3,691 548 6,158 3,030 264 BOMBAY STATE
844 3,189 402 7,562 1,882 154 Greater Bombay
428 3,487 606 5,475 3,517 402 Bombay Gujarat Division
711 4,492 790 4,230 4,272 708 Banaskantha 466 4,510 534 3,555 5,608 303 Sabarkantha 336 3,981 728 3,292 5,357 623 Mehsana 372 2,557 558 6,950 2,199 293 Ahmedabad 420 4,360 m 3,891 5,09B 479 Kaira 749 4,128 440 4,402 4,747 411 Panch Mahals 491 4,486 505 5,403 3,477 615 Baroda 458 4,468 570 4,092 5,010 328 Broach 362 3,265 883 4,930 3,840 347 Surat 803 4,062 463 4,798 4,367 372 Amreli
561 4,309 709 5,~51 3,626 314 Bombay Deacan Northern Division
337 4,566 1,141 3,876 4,783 200 West Khandesh 790 3,909 655 4,468 4,595 282 East Kha~e.h
Dangs 673 4,099 733 5,116 3,837 314 Nasik 386 4,912 712 4,441 4,606 241 Ahmednagar 650 4,952 673 6,511 2,462 354 Poona 392 4,757 520 4,474 4,621 385 Satara North 422 4,630 640 4,094 4,751 515 Satara South 41l 4,556 745 4,576 4,350 329 Kolhapur 467 2,959 700, 5,681 3,382 237 Sholapur , 495 3,557 474 , 3,828 5,416 282 Bombay Deccan Southern Division
437 4,081 741 3,816 5,168 275 Belgaum 336 3,315 371 3,12~ 6,198 306 Bijapur 637 3,331 355 4,261l 5,109 272 Dhatwar
752 4,353 743 5,406 3,608 243 Bamhay Kanb_an Divuian
• 758 4,236 783 6,010 3,003 204 Thana 831 4,507 889 4,711 4,117 283 Kolaba 830 4,521 852 4,481 4,402 265 Ratnagiri S44 '4,612 186 3,561 5,828 425 Kanara
&7& 4,116 592 3,813 5,188 407 SAURASHTRA STATE
904 4,054 381 3,807 5,366 446 Halar S64 4,250 651 3,767 5,101 481 Madhya Saurashtra 528 4,219 568 3,864 5,086 482 Zalawad 678 3,712 684 4,154 4,848 314 Gohilwad 749 4,342 570 3,523 5,556 351 Sorath
Sgg 4,5011 555 3,335 5,430 1180 KtNCH STATE

SUBSIDIARY 254
Livelihood Class V (production other than cultivation) ; number per 10,000 pe,rsons of Livelihood who are employers, employees and independent workers; Secondary
Number per 10,000 of Livelihood I Number per 10,000 self-supporting Number per 10,000 Class V, persons of Liveli hood Class V.
Cultivation of owned \ Cultivation of unowned
-.1 land. land.
State, Natural Division and Self. Non. Earning Emp· Emp· Indepen.
District. support· earning depen. layers. loyees. dent Self. Earning Self. Earning
ing depen. dants. Workers. sUl?port· depen. su~port. depend.
persons. dants. mg dants. mg ants.
persons. persons.
2 3 4 5 '6 7 8 9 10 II
BOMBAY, SAURASHTRA AND KUTCH ... 3,073 5,917 1,010 .~ 5,177 4,501 86 65 27 22
BOMBAY STATE ... 3,184. 5,894. 922 332 ,5,623 4,045 95 71 30 25
Greater Bombay 4,762 4,972 266 210 8,740 1,050 47 2 6
Bombay Gujarat Division 2,875 6,199 926 213 5,323 4,464 61 54 17 12
Banaskantha ... 2,755 5,652 1,593 57 808 9,135 92 87 67 76
Sabarkantha ... 2,445 5,870 1,685 97 1,034 8,869 262 275 15 6
Mehsana ... 2,459 6,243 1,298 142 2,089 7,769 56 68 10 II
Ahmedabad ... 3,269 6,197 534 161 8,037 1,802 11 5 8 3
Kaira 2,745 6,289 966 207 3,605 6,188 76 61 29 2S
Panch MahaIs ::: 2,903 5,890 1,207 193 4,095 5,712 111 270 32 45
Baroda 3,037 6,201 762 238 5,166 4,596 62 30 13 2
Broach 2,694 6,253 1,0'>3 253 3,305 6,442 53 24 18 6
Surat 2,593 6,376 1,031 468 4,832 4,700 102 60 21 12
Amreli 2,603 6,226 1,171 150 3,592 6,258 49 28 7 6
Bombay Deccan Northern Division 2,674 6,217 1,109 556 4,017 5,427 150 128 18 14
West Khandesh 2,733 6.256 1.011 1,283 2,470 6,247 61 28 8 II
East Khandesh 2.529 6,387 1,084 489 3,302 6,209 139 43 18 7
DanltS 3,251 4.585 2,164 1,000 4,328 4,672 1,132 667 17
Nasik 2,510 6,190 1,300 602 3,359 6,039 62 64 5 3
Ahmednagar ::: 2.533 5,763 1,704 679 3,613 5,708 146 234 12 38
Poona ... 3,059 6,173 768 481 5.501 4,018 108 108 13 8
Satara North ... 2,374 6,219 1,407 250 2,273 7,477 303 287 22 15
Satara South ... 2.544 6,245 1,211 652 1,788 7,560 382 269 36 9
Kolhapur 2.589 6,407 1,004 499 2,271 7,230 334 311 64 52
Sholapur 2,706 6,329 965 461 5,674 3,865 78 31 14 7
Bombay Decc an Southem Division 2,811 5,717 1,412 268 1,946 7,786 140 58 33 36
Belgaum 2,690 6,051 1.259 443 1.572 7,985 204 95 59 52
Biiapur 2,793 5,281 1,926 153 1.367 8,480 137 56 24 42
Dharwar 2,929 5,928 1,143 215 2,677 7,108 87 27 17 17
Bombay Konkan Division 2,796 5,996 1,208 604 3,896 5,500 103 118 137 123
Thana 3.328 5.563 1.109 780 5,534 3,686 99 46 66 23
Kolaba 3,019 5,650 1,331 682 3,085 6,233 94 53 205 133
Ratnagiri 1,996 6,766 1,238 475 2,338 7,187 138 277 182 262
Kanara 2,862 5,824 1,314 78 1,412 8,510 39 15 178 101
SAURASHTRA STATE 2,382 6,075 1,543 262 1,907 7,831 28 29 5 5
Halar 2,334 5,955 1,711 144 1,588 8,268 33 54 5 22
Madhya Saurashtra 2,399 6,083 1,518 363 1.782 7,855 13 49 2 1
Zalawad 2,395 5,628 1,977 192 1,846 7,962 64 12 17 6
Gohilwad 2,301 6,294 1,405 345 2,711 6,944 2B 9 5 4
Sorath 2,479 6,189 1.332 180 1,459 8,361 20 20 4 1
KUTCH STATE 2,726 5,900 1,374 137 1,039 8,824. 83 28 63 28

TABLE 5'2 255
Class V in each Sub.Class; number per 10,000 self. supporting persons of Livelihood Class V Means of Livelihood lof 10,000 persons of Livelihood Class V
of Livelihood Class V whose Secondary Means of Livelihood is
Employment as Rent on Production other
1
Commerce. Transport. 1 Other services cuitivating agricultural than and miscellaneous )
labourer. land. cultivation. sources.
Self. Earning) Self. Earning) Self. Earning Self. Earning' State, Natural Division and
Self. Earning Earning Self. District. supporting depen. w,""";'" d,,.~ 1 ... ,,,,,,m, depen. supporting d_
I
,",,,,,,;,,, d",,"- ,"","m", d,,~-persons. danls. persons. dants. persons. dants. persons. dants. persons. dants. persons. danls.
12 13 14 15 16 17 18 19 20 21 22 23 I
39 128 53 12 48 601 19 64 3 5 44 113 BOMBAY, SAURASHTRA AND KUTCH
40 129 61 12 47 531 18 56 3 5 38 93 BOMBAY STATE
3 40 16 24 168 9 25 7 14 44 Greater Bombay
31 122 52 10 49 524 17 58 3 5 42 141 Bomhay Gujarat Dicision
21 74 90 II 36 1,115 36 51 6 I 57 178 Banaskantha . 25 158 125 10 32 1,007 18 60 7 2 37 167 Sabarkantha 36 189 124 40 39 682 22 91 I 4 57 213 Mehsana II 36 25 5 61 349 13 52 I 3 32 81 Ahmedabad 72 224 73 13 56 493 18 44 3 2 45 104 Kaira 26 92 48 5 47 616 17 33 I 2 49 144 Panch Mahals 33 123 56 2 45 414 23 59 2 2 67 130 Baroda 60 260 61 6 67 488 18 42 II 2 52 225 Broach 37 163 15 I 33 544 10 54 6 14 27 .183 Surat 72 180 24 4 54 599 32 109 4 3 68 242 Amreli
50 216 86 14 51 619 21 29 2 3 47 86 Bom6C1!f Deccan Northern Divuion
48 327 13 I 38 580 IS 24 3 7 24 33 West Kbanolesh 72 468 37 2 45 468 21 26 I 4 24 66 East Khandesh
101 471 73 919 II II 50 96 Dangs 33 181 75 13 41 940 19 29 2 4 28 66 Nasik 45 236 97 38 51 972 18 26 I 2 49 158 Ahmednagar 19 73 8S 6 30 437 14 22 2 3 56 111 Poona 72 238 163 31 64 723 26 17 3 2 80 94 Satara North 99 239 87 33 81 556 24 24 I 3 87 78 Salara South 48 136 98 II 80 385 40 42 2 3 42 64 Kolhapur 59 208 105 II 64 590 25 41 I 3 45 74 Sholapur
74 216 96 16 70 1,003 29 34 2 4 41 45 Bomhay Deccan Southern Divilion
81 255 115 14 80 751 29 35 2 3 57 54 Belgaum 59 203 88 29 69 1,539 30 24 I I 32 32 Bijapur 80 193 85 P 62 803 28 40 2 6 34 49 Dharwar
81 90 33 6 54 574 16 193 8 5 45 99 Bombay Konk,an Divuion
150 8S 30 2 35 796 " 65 4 6 33 86 Thana 36 80 59 18 53 539 17 391 7 8 48 129 Kolaba 20 103 15 7 58 289 20 193 9 3 46 104 Ratnagiri 63 84 59 8 0106 611 23 395 20 5 74 95 Kanara
35 115 7 8 48 1,053 23 117 2 5 74 211 SAURASHTRA STATE
34 159 I 40 1,156 17 145 2 5 42 170 Halar 18 58 6 11 57 1,007 29 151 2 3 82 238 Madhya Saurashtra 68 240 18 33. 39 1,281 23 140 I 13 104 252 Zalawad 28 73 7 I 34 1,082 22 55 2 3 56 178 Gohilwad 43 122 6 1 63 854 25 110 I 3 90 221 Sorath
28 146 20 4 60 695 28 87 9 3 114 383 KUTCH STATE

256
SUBSIDIARY TABLE 5' 2--A
Livelihood Class V (Production other than cultivation) ; number per 10,000 persons of Livelihood Class V in each Sub"Class ; number per 10.000 self"supporting persons of Livelihood
Class V who are employers, employees and independent workers
State and Natural Division.
BOMBAY, SAURASHTRA AND
BOMBAY STATE
G rca/cr Bombay
Bomhay GujaTat Division
Bombay Deccan Northern Division
Bombay Deccan Southern Division
Bomhay Konk.an Dioision
SAURASHTRA STATE
KUTCH STATE
(Rural Population by Natural Divisions only)
KUTCH
Number per 10,000 of Livelihood Class V.
Self-supporting Non-earning persons. dependants.
2 3
2,564 5,745
2,611 5,804
2,581 5,923
2,533 5,767
2,875 5,458
2,643 5,840
2,345 5,500
2,695 5,792
Earning dependants.
4
,1,691
1,585
1.496
1,700
1,667
1,517
2,155
1,513
Number per 10,000 sell-supporting persons of Livelihood Class V.
Employers. Independent
Employees. Workers.
5 6 7
245 1,927 7,828
288 2,270 7,442
81 2;209 7,710
458 2;367 7,175
140 917 8,943
512 3,122 6,366
87 664 9,249
89 764 9,147

257
SUBSIDIARY TABLE 5' 2-B I
Livelihood Class V (Production other than cultivation); number per 10,000 persons of Livelihood Class V in each Sub-qass; number per 10,000 self"supporting persons of Livelihood
Class V who are employers, employees and independent workers
(Urban Population by Natural Divisions only)
Number per 10,000 of Livelihood Class V. Number per 10.000 self.supporting persons of Livelihood Class V.
Stale and Natural Division. Self-supporting Non-earning
persons. dependants.
2 3
BOMBA~ SAURASHTRA AND KUTCH 3,391 6,025
BOMBAY STATE 3,489 5,942
Greater Bombay 4,762 4,972
Bombay Gujarat Division 3,076 6,388
Bombay Deccan Northern Division 2,771 6,529
Bombay Deccan Southern Division 2,767 5,994
Bombay Kon~an Division 3,028 6,235
SAURASHTRA STATE 2,431 6,847
KUTCH STATE 2,850 6.337
MO·A Bk H 91-28
Earning dependants.
4
584
569
266
536
700
1,239
737
722
813
Employers.
5
359
350
210
289
619
359
726
489
316
Employees.
6
6,111
6,955
8,740
7,113
5,059
2,674
4,922
3,518
2,087
Independent Workers.
7
2,930
2,695
1,050
2,598
4,322
6,967
4,352
5,993
7,597

258 SUBSIDIARY
Livelihood Class' VI (Commerce) ; number per 10,000 persons of Livelihood Class VI in each employers, employees and independeJlt workers; Secondary
State, Natural Division and Distric.,
f
BOMBAY. SAURASHTRA AND KUTCH
BOMBAY STATE '"
Greater Bombay
Bombay Gujarat Dioi.ion
Banaskantha ... Sabarkantha ... Mehsana Ahmedabad ... Kaira Panch Mahals Baroda Broach Surat Amreli
Bomhay Deccan Northern Division
West Khandesh East Khandesh Dangs Nasik Ahmednagar ... Poona Satara Nortb ... Satara South ... Kolhapur Sholapur
Bombay Deccan Southern Division
Belganm Bijapur Dharwar
Bomhay Konk.an Division
Thana Kolaba Ratnagiri Kanara
SAURASHTRA STATE
Halar Madhya Saurashtra Zalawad Gohilwad Sorath
KUTCH STATE
Number per 10,000 of Livelihood Class VI.
I
I I SeH. Non-ear~inl! Earning
supporting dependants dependants
\ ~": 3 4
2,735 6,786 479
2,856 6,677 467
3,785 6,042 173
2,450 7,026 524
2.498 6,917 585 2,302 6,972 726 2,398 6,921 681 2,651 6,917 432 2,226 7,305 469 2,221 7,310 469 2,562 6,942 496 2,429 7,035 536 2,373 7,061 566 2,170 7,378 452
2,572 6,848 580
2,701 6,748 551 2,470 6,831 699 4,384 4,767 849 2,429 6,852 719 2,349 6,862 789 2,772 6,838 390 2,498 6,874 628 2,572 6,842 586 2,677 6,832 491 2,514 6,920 566
2,623 6,665 712
2,482 6,855 663 2,637 6,490 873 2,719 6,634 647
2,696 6,.788 516
2,935 6,651 414 2,858 6,435 707 2,239 7,146 615 2,450 7,024 526
2,081 7,356 563
2,062 7,399 539 1.908 7,565 527 2.151 7,251 598 2,044 7,221 735 2,316 7,264 420
2,114 7,469 m
Number per 10,000 self-supporting persons of Livelihood Class VI.
Employers. Employees. Independent Workers.
5 6 7
1,398 2,963 5,639
1,408 3,125 5,467
1 ,111 5)29 3,763
1,612 2,052 6,336
1,069 1,051 7,880 88B 1,503 7,609
1,616 1,420 6,964 1,764 2,858 5,378 1,488 1,383 7,129 1,153 1,139 7,708 1,449 2,035 6,516 1,418 1,561 7,021 2,207 2,564 5,229 1,341 1,389 7,270
1,841 2,000 6,159
1,990 1,492 6,518 1,815 1,795 6,390 2,188 2,562 5,250 2,106 1,850 6,044 2,100 1,245 6,655 1,971 2,379 5,650 1,112 1,872 7,016 1,472 2,029 6,499 1,403 2,051 6,546 1,907 2,385 5,70B
827 1,894 7,279
1.223 1.846 6,931 757 2,034 7,209 603 1.840 7,557
1,444 2,851 5,705
1,552 3,419 5,029 1,723 2,026 6,251 1,601 2,528 5,871
301 1,768 7,931
1,352 1,817 6,831
914 1,635 7,451 1,418 1,688 6,894 1,407 1,639 6,954 1,555 1,753 6,692 1,286 2,174 6,540
1,163 1,455 7,382
Number per
Cultivation of owned Cultivation of unowned land. land.
Self- Earning Self. Earning support- depen- support- depen-
ing dants. mg dan!s. persons. persons.
8 9 10 11
64 26 15 9
71 29 16 10
41 2 4
41 30 10 5
36 27 46 22 80 88 9
.Io....~. 4
62 71 6- 4 12 4 4 2 51 33 14 8, 85 64 17 16 29 20 9 2 48 11 12 6 49 27 6 r 47 8 8 3
112 44 15 7
103 8 18 .. 145 29 16 .. 384 55 55 66 26 9 5 80 78 9 14 59 37 8 5_ ,j ,
182 87 8 3 277 78 24 7 155 84 37 17 liZ 24 19 6
134 34 32 23
157 39 38 20 153 45 32 45 lOS 24 27 II
78 52 58 47
41 14 15 5 96 24 111 62
159 166 103 122 SI 13 81 51
22 • 10 4 2
25 14 I 12 16 4 1 14 7 4 4 29 8 7 3 28 4 3
86 41 24 15

TABLE 5'3 259
Sub.Class ; number per-l0,000 self. supporting persons of Livelihood Class VI who are Means of Livelihood of 10,000 persons of Livelihood Class VI
" 10.00001 Livelihood Class VI whose Secondary Means of Livelihood is .
Employment as I Rent on agricul-
I Production other I Commerce.
I Transport. I Other services and
cultivating labourer. turalland. than cultivation. miscellaneous source!. State, Natural Division and
Self- Earning Self- Earning Self- Earning I Self- Earning Self- Earning Self- Earning District. support- depen- support- depen- su~port- depen- support- depen- su pport- depen- support- de pen- " ing dants. mg danls. mg dants. ing dants. ing dants. mg dants. persons. persons.
I
persons. persons. persons. persons.
12 13 14 15 16 17 18 19 20 21 22 23 I
13 U 99 10 21 55 49 268 3 5 48 62 BOM,BAY, SAURASHTRA AND KUrCR
15 48 112 11 2% 57 48 247 3 5 SO 60 BOMBAY STATE
2 56 3 8 28 29 90 5 29 43 Greater Bombay
10 3S 99 13 19 S9 52 307 4 4 S4 71 Bombay Gujarat Division
II 11 37 2 17 44 108 395 6 2 52 82 Banaskantha 13 41 104 20 29 64 96 420 16 4 4S 85 Sabarkantha 13 42 182 '29 19 50 61 404 11 7 44 74 Mehsana 3 12 42 6 14 54 36 295 3 5 50 54 Ahmedabad
24 68 181 20 20 46 59 230 2 4 37 60 Kaira 8 25 136 12 20 21 55 275 2 3 51 53 Panch Mahals 7 47 126 9 17 51 50 277 1 6 84 84 Baroda
29 84 142 18 29 51 47 277 1 56 89 Broach 4
., 31 49 10 19 117 41 281 1 4 60 94 Surat 2S 31 82 23 21 39 26 274 3 1 68 73 Amreli
23 M 157 14 34 72 62 295 4 4 71 56 Bombay Deccan Northern Division
20 119 48 3 31 41 24 342 5 I 38 33 West Khandesh 50 232 63 I 33 78 52 289 2 4 37 62 East Khandesh 55 27 82 794 27 Dangs 21 93 121 14 38 98 60 407 6 8 65 68 Nasik 15 56 161 38 35 58 77 458 5 6 80 81 Ahmednagar 13 36 143 8 23 47 47 205 4 3 93 49 Poona 27 69 291 21 48 56 64 339 4 1 B4 52 Satara North 26 66 205 34 39 85 98 268 2 2 71 46 Satara South 20 60 253 15 44 58 108 207 4 4 40 46 Kolhapur 20 83 208 17 39 119 65 254 2 3 95 60 Sholapur
311 129 180 14 37 111 64 346 2 7 43 48 Bombay Deccan Sauthern Division
33 114 229 IB 34 90 69 313 3 4 49 65 Belgaum 41 161 156 16 52 144 68 413 1 2 43 47 Bijapur 40 120 160 10 31 105 57 329 2 11 38 37 Dharwar
19 35 117 13 23 39 37 239 6 4 51 87 Bombay Konk,an Division
9 15 65 6 12 29 30 249 6 3 36 93 Thana 58 111 233 8 25 44 44 323 5 5 94 130 Kolaba 9 32 91 21 35 41 41 173 8 4 41 56 Ratnagiri
34 36 248 32 38 72 49 241 4 5 80 76 Kanara ,
6 16 16 1 19 46 56 408 2 6 37 74 SAURASHTRA STATE
6 22 8 18 49 29 375 1 II 24 68 Ralar 6 8 9 16 65 34 354 1 6 32 77 Madhya Saurashtra 2 15 47 6 8 39 55 441 1 10 32 76 Zalawad B 20 19 3 22 40 52 570 4 5 34 86 GDhilwad 7 17 15 24 32 105 305 2 2 54 60 Sorath
'I 39 110 15 15 27 41 185 5 2 46 93 KUTCH STATE
IdO·A Bk H 91-28a

260
SUBSIDIARY TABLE 5 '3-A
Livelihood Class VI (Commerce); number per 10,000 persons of Livelihood Class VI in each Sub-Class ; number per 10,000 self .. supporting persons of Livelihood Class VI who are
employers, employees and independent workers
(Rural Population by Natural Divisions only)
State and Natural Division.
BOMBAY, SAURASHTRA AND KUTCH
BOMBAY STATE
G real er Bombay
Bomhay Gujarat Division
Bomhay Deccan Northern Division ...
Bomhay Decam Southern Division ...
Bombay Konkan Division
SAURASHTRA STATE
KUTCH STATE
Number per 10,000 of Livelihood Class VI.
Self-supporting persons.
2
2,533
2,620
2,5~8
2,591
3,006
2,694
2,270
1,978
Non-earning dependants.
3
6,554
6,457
6,685
6,335
5,846
6,499
6,747
7,497
Earning dependants.
4
913
9~
807
1,074
1,148
807
983
525
Number per 10,000 self -supporting persons of Livelihood Class VI.
, Employers.
5
878
919
851
1,249
195
I,m
709
638
Employees.
6
1,125
1,201
1,067
1,017
647
2,285
747
907
Independmt Workers.
7
7,997
7,880
8,082
7,734
9,158
6,602
8,544
8,455

SUBSIDIARY TABLE 5' 3-B
Livelihood Class VI (Commerce) ; number per 10,000 persons of Livelihood Class VI in each Sub-Class; number per 10,000 self"supporting persons of Livelihood Class VI who are
employers, employees and independent workers
State and Natural Division.
(Urban Population by Natural Divisions only)
Number per I 0,000 of Livelihood Class VI. Number per 10,000 self-supporting persons 01 Livelihood Class VI.
261
Self-supporting Non-earning Earning Employers. persons. dependants. dependants.
Employees. Independent Workers.
2 3 4 5 6
BOMBAY, SAURASHTRA AND KUTCH ... 2,796 6,855 349 1,540 3,464 4,996
BOMBAY STATE 2,921 6,738 341 1,530 3,603 4,867
C. reat er B omh ay 3,785 6,042 173 1,111 5,126 3,763
Bombay Gujarat Divi$ion 2,425 7,171 404 1,948 2,485 5,567
Bombay Deccan Northern Division 2,565 7,025 41D 2,047 2,344 5,609
Bombay Deccan Southern Division 2,490 6,948 562 1,091 2,415 6,494
Bombay Konkan Division 2,696 6,%9 335 1,650 3,205 5,145
SAURASHfRA STATE 2,011 7,580 409 1,620 2,263 6,117
KUTCH STATE 2,1.93 7,432 275 1,754 2,075 6,171

..-
262 SUBSIDIARY
Livelihood Class VII (Transport); number per 10,000 persons of ~ivelihood Class vn in are employers, employees and independent workers; Secondary
Number per ID,OOO of Livelihood
I Number per 10,000 self-supporting Number per 10,000 of Livelihood Class VII. persons of Livelihood Class VlI.
Cultivation of owned Cultivation of unowned ... land. land. State, Natural Division and Self - Non-earnini famine Employers. Employees. Independent
District. supporting depen- depen- Workers. persons. dants. danls. Self- Earning Sell- Earning
supporting depen- supporting depen-persons. dants. person •. dants.
1 2 3 4 5 6 7 8 9 10 11 J
BOMBAY, SAURASHTRA AND KUTCH 3,004 6,532 464 21.5 7,749 2,036 57 32 23 16
BOMBAY STATE ... 3,077 6,465 458 214 7,830 1,956 63 36 25 18
Greater Bombay' 4,279 5,504 217 139 8,301 1,560 38 4 5
Bombay Gujarat Division 2,674 6,668 658 132 6,681 3.187 41 26 12 8
Banaskantha ... 2,587 6,434 979 53 4,751 5,196 44 33 24 6 Sabarkantha 2,776 6,136 1,088 205 4,050 5,745 61 57 22 2 Mehsana 2,514 6,310 1,176 96 3,875 6,029 13 16 3 5 Ahmedabad ... 3,213 6,299 488 61 6,146 3,793 5 1 3 1 Kaira 2,657 6,765 578 81 7,753 2,166 79 20 12 9 Panch Mahala ... 2,925 6,603 472 66 9,101 833 153 170 32 31 Baroda 2,627 6,953 420 98 8,548 1,354 17 4 5 I Broach 3,075 6,541 384 406 7,533 2,061 28 8 13 3 Sural 2,195 7,076 729 282 7,282 2,436 68 34 20 19 Amreli 2,438 7,225 337 87 7,269 2,644 7 9 II
Bombay Deccan Northern Division 2,644 6,878 478 366 8,181 1,453 91 56 12 9
West Khandesh 2,902 6,408 690 816 6,370 2,814 31 6 24 East Khandesh 2,751 6,673 576 130 9,205 665 75 30 9 I Dangs 2,692 7,308 4,286 5,714
(065 Nasik 2,513 7,011 476 373 8,562 101 65 4 11 Ahmednagar ... 2,308 6,854 838 638 7,194 2,168 79 76 3 Poona 2,820 6,831 349 495 8,027 1,478 63 42 14 10 Satara North ... 2,336 7,035 629 341 7,171 2,488 186 205 8 9 Satara South '" 2,491 7,156 353 264 7,863 1,873 180 82 14 8 Kolhapur 2,541 7,092 367 463 6,728 2,809 120 65 49 22 Sholapur 2,568 6,993 439 157 8,493 1,350 104 57 15 8
Bombay Deccan Southern Division 2,688 6,887 425 141 7,425 2,434 58 44 21 24
Belgaum 2,656 6,873 471 242 7,951 1,807 82 58 36 31 Bijapur 2,826 6,738 436 132 6,791 3,077 80 15 36 9 Dharwar 2,657 6,948 395 86 7,357 2,557 37 45 B 25
Bombay Konkan Division 2,263 7,153 584 387 7,804 1,809 102 80 103 78
Thana 2,953 6,494 553 263 8,788 949 102 46 72 46 Kolaba 2,055 7,256 689 690 6,839 2,471 98 43 197 112 Ratnagiri 1,439 8,014 547 592 7,204 2,204 u 120 ISO 92 103 Kanara 2,928 6,378 694 148 5,632 4,220 33 10 123 53
SAURASHTRA STATE 2,449 7,040 511 235 7,136 2,629 15 3 2
Halar 2,427 7,056 517 184 7,429 2,387 15 1 3 Madhya Saurashtra 2,351 7,191 458 184 7,760 2,056 6 7 Zalawad 2,538 6,929 533 212 7,435 2,353 13 6 4 4 Gobilwad 2,409 6,938 653 297 6,854 2,849 28 1 2 Sorath 2,584 7,005 411 268 6,485 3,247 13 2 I
KUTCH STATE ... 3,082 6,453 465 175 6,802 3,023 46 4 44 4

TABLE 5'4 263
each Sub-Class; number per 10,000 self.supporting persons of Livelihood Class vn who Means of Livelihood of 10,000 perso!)s of Livelihood Class VII
Class VII whose Secondary Means of Livelihood is
Employment as Rent on agricul- I Production other cultivating turalland. than cultivation. labourer.
Self- Earning Self· Earning I Self. Earnin~ supporting depen. supporting depen. supporting depen. persons. dan!s. persons. dants. persons. dants.
12 13 14 15 16 17
9 62 53 6 23 66
10 66 59 7 N 68
34 3 6 52
8 78 32 4 40 102
25 97 56 21 16 45 4 73 37 2 61 185
12 90 42 7 22 47 3 29 15 2 77
II 106 75 6 10 58 6 26 54 12 59 4 120 34 3 6 35 7 116 50 3 4 22
10 90 13 I 138 252 7 61 21 5 14 15
14 127 106 II 13 52
17 181 27 59 ..68 17 297 25 6 39
5 101 72 14 14 62 79 290 203 25 14 48 2 22 88 7 9 49
14 123 265 47 22 66 8 34 147 13 88
14 71 186 6 29 41 15 117 179 23 7 49
17 106 124 15 13 58
21 86 209 10 13 44 14 79 159 8 8 53 15 127 61 21 15 68
20 66 52 9 ~2 71
32 53 52 4 30 53 15 169 90 6 26 42 4 30 38 17 65 79
37 89 41 7 T4) 175
4 31 9 1 12 59
I 4 6 6 97 I 16 6 10 67
14 37 29 6 96 5 77 9 12 30 6 17 10 22 40
9 41 18 1 38 47
Commerce.
Self. Earning supporting depen. persons. dants.
18 19 I
15 49
15 53
9 28
33 119
68 152 45 199
174 702 10 38 14 34 6 16 3 19
18 " 6 35 14 10
II 24
35 82 2 18
38j II 21 16 43 9 21
II 25 8 19
45 25 7 22
II 27
20 42 9 17 5 22
9 50
10 32 7 100 7 49
20 50
12 20
3 15 6 22
10 24 6 12
32 29
15 SO
I
Transport.
sources. I I a~d~is~:U~~:~us I '-S-e-If-. -Ea-rn-in-g I-~ Earning
supporting depen'jSUPPOrling depen. persons. dan!s. persons. dants.
, State, Natural Division and
District.
20 21 22 23
. ------------------16 111 32 122 BOMBAY, SAURASHTRA
AND KUTCH
13 102 28 108 BOMBAY STATE
13 50 16 78 Greater Bombay
14 135 35 186 BOmDaY Gujarat Division
8 223 80 402 Banaskautha 22 290 14 280 Sabarkantha 10 145 24 164 Mehsana 4 202 16 140 Ahmedabad
21 184 47 161 Kaira 29 67 41 103 Panch Mahals 8 72 37 166 Baroda 8 62 29 159 Broach
17 80 26 218 Surat 48 77 130 160 Amreli
10 109 32 90 Bombay Deccan Northern Division
6 286 25 48 West Khandesh 6 95 10 95 East Khandesh
Danga 8 107 34 95 Nasik
32 279 49 74 Ahmednagar 7 102 42 96 Poona 6 92 34 62 Satara North
21 62 30 60 Satara South 26 59 34 78 Kolhapur 6 59 28 104 Sho]apur
20 100 40 51 Bomhay Deccan Southern Divuion
45 140 43 60 Belgaum 16 174 16 81 Bijapur 8 51 46 36 Dharwar
14 138 30 92· Bombay Konkan Diui,ion
21 218 36 101 Thana 6 77 40 140 Kolaba 9 63 19 56 Ratnagiri
21 194 35 116 Kanara
38 179 55 218 SAURASHTRA STATE
3 263 12 135 Halar 16 95 . 19 250 Madhya Saurashtra II 150 23 215 Zalawad 17 299 3B 234 Gohilwad
119 88 155 233 Sorath
9 95 79 223 KUTCH STATE

264
SUBSIDIARY TABLE S·4 .. A
Livelihood Class VII (Transport); number per 10,000 persons of Livelihood Class VII in each Sub .. Class ; number per 10,000 s~lf .. supporting persons of Livelihood Class VII who
are employers, employees and independent workers
(Rural Population by Natural Divisions only)
State and Natural Divisior..
BOMBAY, SAURASHTRA AND KUTCH
BOMBAY STATE
Greater Bombay
Bombay Gujarat Division
Bombay Deccan Northern Division
Bombay Deccan Southern Division
Bombay Konk_an Division
SAURASHTRA STATE
KUTCH STATE
Number per 10,000 of Livelihood Class VII.
Self-supporting Non-earning persons. dependants.
2 3
2,344 6,784
2,284 6,838
2,394 6,642
2,476 6,607
2,935 6,246
1,965 7,275
2,525 6,582
3,597 5,765
Earning dependants.
4
872
878
964
917
819
760
893
638
Number per 10,000 self-supporting persons of Livelihood Class VII.
Employers. Employees.
5 6
200 7,286
211 7,274
127 6,199
117 9,003
35 . 7,997
432 7,202
148 7,676
118 6,581
Independent Worken.
7
2,514
2,515
3,674
880
1,968
2,366
2,176
3,301

SUBSIDIARY TABLE 5'4-B
Livelihood Class vn (Transport) ; number per 10,000 persons of Livelihood Class VII in each Sub"Class ; number per 10,000 self"supporting persons of Livelihood Class VII who
are employers, employees and independent workers
State and Natural Division.
(Urban Population by Natural Divisions only)
Number per 10,000 of Livelihood Class VI I. Number per 1 0,000 self.supporting persons of Livelihood Class VII.
265
Self.supporting Non.earning persons. dependants.
Earning dependants.
Employers. Employees. Independent Workers.
2 3 4 5 6 7
BOMBAY, SAURASHTRA AND KUTCH 3,246 6,439 315 219 7,871 1,910
BOMBAY STATE 1 3,371 6,327 302 215 7,970 1,815
Greater Bombay 4,279 5,504 217 139 8,301 1,560
Bombay Gujarat Division 2,892 6,688 420 135 6,992 2,873
Bombay Deccan Northern Division 2,703 6,974 323 447 7,915 1,638
Bombay Deccan Southern Division 2.641 7.009 350 164 7,304 2,532
Bombay Konk,an Division 2,656 6,992 352 343 8,390 1,267
SAURASHTRA STATE 2,427 7,170 403 260 6,976 2,764
KUTCH STATE 2,592 7,107 301 25% 7,093 2,655

266 SUBSIDIARY
Livelihood Class vm (Other services and miscellaneous sources); number per 10,000 persons Livelihood Class VIII who are employers, employees and iJJdependent workers;
N.mber per 10,000 oi Livelihood ~~u. Vlll,
Stlte. Natural Division and District.
S.lf- Non. Earninll Bupportirll' earnina dependanli,
(0 persons. d.""ndanll,
I 2 3 4
BOMBAY, SAURASHTRA AND KUTCH 3,152 6,D91 757
BOMBA Y STATE
Greater Bombay
Bom6ay GlJjaraf Divilion
Bana.kantba
Sabarkantha
Meheana
Ahmedabad
Kaila
Panch Mah.I.
Baroda
Broach
Surat
AmreIi
Bombav D~ccan Nor/!Jr.m Division
We.t Khandelb
Ea.t Khande.b
Da",.
Na.ik
Ahmednarar
Poona
Satara North
I.
Satara SoutJ
Kolhapur
Sholapur
BDmbay Deccan Southern Division
B.lpum
Bijapur
Dharwar
Bombay Konh,an DivISion
Thana
K.I.ba
Ratnariri
Kanara
SAURASHTRA STATE "
Halar
Madhya SauruLtra "
Zalawad
Gohilwad
Sorallo
KUTCH STATE
3,256
4.664
3,002
3,107
2,889
2,899
3,163
2,857
2,993
3,198
2,843
2,972
2,687
2.998
2,692
2,773
4,528
3.053
2.607
3,468
2,865
2.723
2,883
2,808
3,006
2,991
2,927
3,079
2,828
2,920
3,256
2,490
2.926
2,5Z5
2,481
2506
2,605
2,401
2.664
3,253
6.037
5,141
6.137
5,826
5,956
6.224
6,157
6.427
5,952
5,943
5,926
6,160
6,570
6,259
6,409
6,482
4,709
6.110
6,354
5.995
6,268
6,430
6,554
6,416
6,214
6,264
6.188
6,182
6,309
6,317
5,746
6,532
6,367
6,455
6,645
6,601
~,273
6,329
6.412
5,786
707
195
861
1,067
1,155
877
680
716
1.055
859
1,231
868
743
743
899
745
763
837
1,039
m 867
847
563
776
780
745
885
739
863
763
998
978
707
1.020
874
893
1,122
1,270
924
961
Number per 10,000 •• If 'supportinQ penon. of Livelihood Cia .. V Ill,
Employers,
5
215
228
241
172
55
95
165
318
135
86
142
117
149
130
272
285
276
121
347
277
262
212
358
195
256
187
239
117
185
257
300
229
286
74
146
74
154
292
116
123
80
Employe... fndependent Work ... ,
6 7
5.422 3,652
5.759 3,356
7,572 1,726
4,442 4,523
3,070 ',5,429
3.752 5;394
2,880 5,932
5,212 3,528
3,634 5,392
5,341 3,708
5,548 3452
4,551 4,913
4,892 4.336
3.297
5,950
4.934
5,170
8,195
5,739
5567
7,366
4,833
4,930
5,522
4,903
4,702
4,923
4,010
4,971
5,509
6,508
5,397
4,686
4,152
3,480
3,754
3,733
3,181
3.148
3,540
2,351
5,572
3,138
4,354
3,873
1,572
3,342
3,627
1,786
4,200
3.818
3,614
3.968
4,282
4,112
4,946
3,983
3.756
2,790
3,980
4,537
4.936
5.377
4,857
5,031
5,695
5,904
5,349
6,Z54
Others,
8
711
657
461
863
1,446
759
1,023
942
839
865
858
419
623
1,001
640
427
681
112
572
529
586
755
894
669
873
829
726
927
861
478
402
394
491
838
997
I,m
1.082
832
832
988
1,315
Cultivf.tion of owned land.
Self. Earning lupportinlZ dependants.
petSOl1.:1.
9
75
42
58
73
113
40
14
63
122
54
52
96
30
120
64 147
548
56
86
92
231
238
213
99
124 '
165
143
69
94
54
'91
157
~5
23
19
15
10
39
27
(6
10
50
55
2
50
83
224
49
5
45
187
19
24
47
72
21
32
152
47
i03
52
171
128
137
49
50
78
47
23
101
25
55
240
26
22
12
26
70
9
13
29
Number p.r 10,000
Cultivatio!1 of unowned land.
S.lf. supporlina persons.
II
22
25
)4
29
7
6
21
24
9
24
21
4
12
12
4
8
12
18
37
16
25
33
26
17
101
26
163
154
132
, 2
4
30
Earninl depen-
dant,
22
II
39
10
55
15
13
6
4
17
8
6
4
II
20
8
34
47
38
17
124
19
175
242
83
2
2
4
13
12

TABLE 5'5 267
of Livelihood Class vm in each Sub"Class ; number per 10,000 self"supporting persons of Secondary Means of livelihood of 10,000 persons of Livelihood Class vm 01 Li,.lihood Class YIII who.e Secondal1' M.an. 01 Livelihood i.
Employment as cultivating labourer.
Sell-.up-porting
t>enonl.
13
22
24
4
24
14
14
13
9
51
16
29
47
25
19
30
39
49
4
19
26
17
40
35
26
4B
48
46
53
47
20
13
27
17
50
10
8
II
16
8
12
Earning depen-clanls.
14
103
112
1
143
57
160
85
64
1%
139
163
417
165
95
138
272
321
17
114
149
44
137
92
79
206
179
146
230
176
79
44
127
98
83
58
100
31
73
58
55
64
Rent on B.vricultural land.
Self·,up-porting persons.
15
90
103
43
85
95
102
147
53
122
74
94
85
42
49
148
37
59
4
106
163
139
271
195
247
192
187
212
173
173
63
44
100
52
118
24
19
15
43
29
2J
Earning depen .. clanll.
16
10
9
9
15
20
9
15
5
4
9
3
15
5
4
16
41
9
18
17
II
22
12
8
14
14
8
10
~5
3
8
Production other than cultivation.
Self.sup-pOTting persons.
17
21
20
6
20
27
21
23
19
27
14
14
10
22
28
20
12
18
4
19
24
14
34
30
26
25
40
37
29
51
26
13
35
32
39
23
12
27
15
26
25
3«
Earning depen. clanll.
18
53
53
34
57
54
4Q
55
57
65
40
50
37
82
34
52
25
42
17
66
61
35
42
93
54
82
83
83
83
84
51
40
65
55
63
5S
58
60
70
48
44
\ Commerce.
Seli·sup. portina: persons.
19
14
13
13
12
I.
13
12
11
16
16
23
17
10
18
15
14
12
20
20
38
23
21
23
18
22
12
9
Earning depen .. dants.
20
26
24
20
30
51
24
61
29
21
15
25
17
22
27
22
I.
27
8
33
21
15
20
26
23
27
28
34
20
29
18
12
16 33
10 - 14
22 29
IS 33
11 26
11 30
7 29
18 28
21 49
15 35
Trao1.port.
Self.sup-portina' person9.
21
z
z
1
2
2
2
1
3
3
2
2
3
2
2
2
3
2
3
3
3
3
2
2 .
2
2
EarniniZ depen .. dantt.
22
2
4
6
3
6
8
4
2
7
4
Z
6
4
10
5
2
20
4
5
5
17
9
87
6
-I Other s.rvices and miscellaneous sOUTces. Stale, Nalural Division and
District. SeU-sup. porting perScn3.
23
71
68
33
77
79
54
74
79
91
74
94
85
63
60
80
45
56
67
i7
89
7B
14B
98
69
76
67
69
74
61
63
46
77
68
90
81
50
77
54
96
103
127
Earning depen .. dants.
' 24
487
421
126
556
772
684
598
509
360
607
587
690
530
559
431
556
311
565
, 1
BOMBAY. SAURASHTRA AND KUTCH
BOMBAY STATE
Greater Bombay
Bomhoy Gujaral Diuisio"
BaDaskantba
Saharkaatba
Meb,ana
Ahmedabad
Kaira
PlUlCb Mobal.
Baroda
Broach
Surat
Amreli
Bombay Deccan NOtlhem Div,o.ion
Weat Kband.,b
East Khande,b
Dangs
537 Nasik
652 Abmednarar
371 Poona
473 Satara North
474 Salara Soutb
235 Kolbapur
377 Sholapur
334 (~Bombau Deccan Souliu.m DiLwon
344
451
376
479
615
530
316
402
831
667
734
786
1.114
754
768
Bellaum
Bijapur
Dharwar
Bombau K.nk.on DirJiJiao
Tbana
Kolaba
Ralnasiri
Kanara
SAURAS1-ITRA STATE
Halar , Madhya Saura,hlra
Zalawad
Gobilwad
Soratb
KUTCH STATE

268
SUBSIDIARY TABLE S·S-A
Livelihood Class vm (Other services and miscellaneous sources) ; number per 10,000 persons of Livelihood Class vm in each Sub.Class ; number per 10,000 self. supporting persons of
Livelihood Class VllI who are employers, employees and independent ,workers
(Rural Population by Natural Divisions only)
Number per 10,000 of Livelihood Number per 10,000 self-supporting persons of Class VIII. Livelihood Class VIII.
State and Natural Division. Self-supporting Non-earning Earning Employers. Employees. Independent Others. persons. dependants. dependants. Workers.
2 3 4 5 6 7 B
BOMBAY, SAURASHTRA AND KUTCH ... 2,889 5,786 1,325 120 3,888 5,308 684
BOMBAY STATE %,943 5,778 ~,279 127 4,278 5,020 575
Greater Bombay .......
Bombay Gujarat Division 2,910 5,804 1,286 49 3,560 5,799 592
Bombay Deccan Northern Division 2,889 5,795 1,316 234 5,029 4,179 558
Bombay Deccan Southern Division 3,244 5,492 1,264 73 3,698 4,274 955
Bombay Konkan Division 2,962 5,816 1,222 157 4,909 4,535 399
SAURASHTRA STATE 2,561 5,854 1,579 101 2,499 6,316 1,078
KUTCH STATE 3,189 5,664 1,147 20 1,559 1,101 1,320
SUBSIDIARY TABLE 5· 5-B
Livelihood Class vm (Other services and miscellaneous sources) ; number per 10,000 persons of Livelihood Class VIII in each Sub.Class; number per 10,000 seU.supporting persons of
Livelihood Class VIII who are employers, employees and independent workers
(Urban Population by Natural Divisions only)
Number per 10,000 of Livelihood VIl!. Number per 10,000 self-supporting persons of Livelihood Class VJlI.
State and Natural Division. Self-supporting Non-earning Earning Employers. Employees. Independent Others. persons. dependants. dependants. Workers.
2 3 4 5 6 7 8
BOMBAY, SAURASHTRA AND KUTCH ... 3,308 6,270 422 264 6,213 2,799 724
BOMBAY STATE 3,426 6,178 398 274 8,447 2,585 694
Greater Bombay 4,664 5,141 195 241 7)572 1,726 461
Bombay Gujarai Division 3,083 6,429 488 214 5,174 3,463 1,089
. Bombay Deccan Northern Division 3,054 6,497 449 290 6,396 2,634 680 , Bombay Deccan Southern Division 2,876 6,607 517 256 5,319 3,673 752
Bomball Konkan Divuion I 2,667 6,897 436 390 6,303 2,725 582
SAURASHTRA STATE 2,491 8,935 574 178 4,281 4,604 931
KUTCH STATE 3,384 6,037 579 197 3,889 4,609 1,305

SUBSIDIARY TABLE 5'S
COMPARIS'ON OF UVELIHOOD CtASSES OF THE 1951 CENSUS WITH THE OCCUPATIONAL GROUPS OF 1931 CENSUS
This table is prepared from main Tables B~I (Livelihood Classes and Sub~Classes) and B-I1 (Secondary Means of Livelihood). Figures for the year 1931 are taken from Table X (Occupation or Means of Livelihood) of the Census of India, 1931, Volume VIll, Part II, Bombay Presidency, Statistical Tables, and Volume X of the Western India States Agency Statistical Tables.
Details of the Groups of 193 I Census which compared to different Livelihood Classes are given below :-
Livelihood Class of 1951 Census
I
II
III
IV
V
VI
VII
VIII
Corresponding Groups of 1931 Census
5
6
7
8 to 84, 88, 89, 91, 92, 93, 95, 96, 97, 98, 99,188 and 190
lIS to 126, 128 to 152 and 189
101, 102, 103, 107, 108, 109, 110, 11 I and 112
2, 3, 4, 85, 86, 87, 90, 94, 100, 104, 105, 106, 113, 114, 127, 153 to 187, 191, 192, 193,194 and 195

270
SUBSIDIARY
Comparison of the Classification of the Population
Classification 01 Population.
1951 Census. I 1931 Census. ----Li v e1ihood Crasses. Number per ten thousand 01 General Population. I Number per ten thousand of General Population.
Total classified Sdf-supporting Non-earning Earning depend- Total classified Earners. Working de-population. persons. dependants. ants. population. pendants.
2 3 4 5 6 7 ~
BOMBAY
4.074 944 2,27i 853 659 564 95
D 969 233 517 219 426 3~j 41
m 905 2~1 433 191 1.514 1.118 396
IV 198 55 127 16 64 61 3
V 1,376 438 B11 '127 565 474 91
VI 761 217 508 36 233 216 17
VII 223 69 144 10 49 47 2
vm 1,494 4116 902 106 571 504 67
Total 10,000 2,723 5,719 1,558 4,081 3,369 712
SAURASHTRA
I 3.277 739 1.645 893 -151 91 60
II B34 182 412 240 857 730 127
m 376 JIB 161 97 855 235 620
IV 176 43 120 13 69 604 5
V 1,797 4211 1.092 277 651 495 156
VI 1.074 223 790 61 296 245 51
VII 259 64 182 13 66 60 6
Vill 2.207 557 1.425 225 827 638 189
Total 10,000 2,354 5,827 1,819 3,772 2,558 1,214
KUTCH
I 2,788 778 1,412 598 232 230 2
D 957 242 502 213 464 460 4
ill 298 126 127 45 1.405 497 908
IV 160 46 106 8 70 69
V 1,916 522 1,131 263 874 660 214
VI 1,130 239 844 47 366 309 57
VD 248 76 160 12 69 63 6
vm 2,503 814 1.448 241 571 458 113
Total 10,000 2,843 5,730 ·1,427 4,051' 2,746 J,305

271
TABLE 5'6 )
by Livelihood Classes at the 1951 and 1931 Censuses
Active and Semi-active Worken.
195 I Census. 193 I Census.
Self-supporting Secondary me"ng Secondary means Prir.cipa' earners. SlIbsidiary of prin- Working depend- Livelihood Classes. . persons. of livelihc.od of of livelihood of cipal eMnen. ants.
self-supporting earning depen-persons. cl.nts.
9 10 11 12 13 14
STATE
3,395,691 215,104 2,192.470 1,417,737 47,939 239,936 I
836,624 212,706 599,567 967,504 72,411 103,888 n 1,009,482 227,187 1,677,602 2,809,714 146,657 995,164 ill
197,054 157,928 40,426 153,292 30,775 8,002 IV
1,575,997 245,517 451,516 1,191,930 103,848 229,446 V
781,544 121,235 158,849 543,422 48,089 42,289 VI
246,832 39,312 23,651 118,857 13,393 4,534 vn 1,748,677 298,929 455,361 1,265,595 108,554 168,586 vm 9,792,261 1,517,918 5,599,342 8,468,051 571,566 1,791,845 Total
STATE
305,835 7,886 236,968 26,751 842 17,782
75,228 4,386 53,024 215,189 1,828 37,437 II
49,066 8,631 223,084 69,341 2,272 182,701 ill
17,568 7,775 4,744 18,819 407 1,591 IV
177,119 12,149 90,705 145,973 2,B85 45,896 V
92,472 10,194 32,457 72,213 3,162 15,124 VI
26,226 1,427 4,283 17,564 329 1,679 vn 230,541 23,163 107,487 . 188,028 4,251 55,768 vm 974,055 75,611 752,752 753,878 15,976 357,978 Total
STATE
44,142 2,678 14,489 11,837 389 112 I
13,734 3,292 5,269 23,681 473 205 n 7,141 1,272 24,555 25,567 1,221 46,720 m
, 2,635 2,525 317 3,522 228 43 IV
29,644 3,882 9,675 33,927 1,512 10,999 V
13,564 2,105 3,243 15,894 1,192 2,936 VI
4,334 2,031 445 3,248 46 295 vn 46,210 7,001 23,013 23,560 1.149 5,807 vm
161,404 24,786 81,006 141,236 6,210 67,117 Total

272
State, Natural Division and District.
I
BOMBAY, SAURASHTRA AND KUTCH
BOMBAY STATE
Greater Bombay
Bomhay Gujarat Division Banaskantha Sabarkantha Mehsana Ahmedabad Kaira Panch Mahals Baroda Broach Surat Amreli
Bomhay Deccan Northern Division West Khandesh East Khandesh Dangs Nasik Ahmednagar Poona Satara North Satara South Kolhapur Sholapur
Bomhay Deccan Southern Division Belgawn Bijapur Dharwar
Bombay Konl?,an Division Thana Kolaba Ratnagiri Kanara
SAURASHTRA STATE Halar Madhya Saurashtra Zalawad Gohilwad Sorath
KUTCH STATE
SUBSIDIARY
Distribution of 10,000 self-supporting persons ~f ALL INDUSTRIES
Number of persons per 10,000 self-supporting persons in All Industries and Total No. of self-supporting persons
engaged in All Industries and O-Primary Indus- I-Mining & 2-Processing and 3-Processing and
Services. tries not else- Quarrying. Manulacture-F ood- Manufacture-where specified. stuffs, Textiles, Metals, Chemicals
Leather and and Products Products thereof. thereof.
2 3 4 5 6
4,829,265 434 65 2,071 446
4,238,220 368 50 2,151 m
.1,237,448 73 26 2,465 694
1,177,244 477 41 2,414 269 57,250 1,084 13 1,231 260 44,983 648 15 1,303 286
143,821 8.64 1 1,777 174 359,197 281 28 4,156 218 120,046 434 15 1,763 210 .49,868 285 463 835 756 126,715 262 31 1,442 368 54,293 433 12 1,366 107
184,902 490 39 2,232 211 36,169 857 1 1,142 855
1,035,830 244 57 1,935 502 69,217 416 35 1,698 241
111,153 272 19 1,989 381 1,810 2,575 94 66 88
123,931 205 13 2,002 282 94,085 142 110 2,392 282
288,442 171 71 1,002 1,003 67,289 387 136 1,800 435 53,201 354 50 1,686 468 79,196 349 64 1,707 300
147,506 192 31 3,779 219
345,238 314 29 2,407 384 113,561 460 18 2,053 313 93,990 232 40 3,131 182
137,687 249 32 2,203 580
442,460 1,235 143 882 413 208,156 1,007 170 1.057 636
69,943 1,606 295 517 247 111 ,989 1,130 38 927 187 52,372 1,870 59 582 234
503,369 839 184 1,543 253 68,200 1,085 254 1,595 294
132,703 921 117 1,451 211 63,363 89'0 503 1.410 360
120,488 651 122 1.728 319 118,615 165 112 1,498 115
87,676 1,298 7% 1,232 174

273
TABLE 5'7
AND SERVICES in States, Natural Divjsions and Districts (by Divisions)
Services who are engaged in Industries and Services in Division :-
f I I
State, Natural Division and District. 4-Processing 5-Construc- 6-Cornrnerce, 7-Transport, 8-Health, Edu- 9-Services
and Manufac- . tion and Storage and cation & Public not elsewhere ture-Not e1se- Utilities. Cornmunica- Adrninistra- specified.
where specified. tions. tion,
7 8 9 10 II 12 I
676 396 1,838 638 1,086 2,350 BOMBAY, SAURASHTRA AND KUTCH
675 408 1,844 650 I,m 2,269 BOMBAY STATE
567 319 2,114 932 700 2,110 Greater Bombay
676 341 1,799 478 1.011 2,494 Bom},ay Gujarat Division
747 478 2,094 599 706 2,788 Banaskantha 1,075 299 1,931 322 1,122 2,999 Sabarkantha
715 317 1,968 425 805 2,954 Mehsana 395 233 1,790 421 712 1,766 Alunedabad 960 352 1,806 395 1,158 2,907 Kaira 741 250 1,955 640 1,388 2,687 Panch Mahals 680 318 1,816 553 1,564 2,966 Baroda 647 195 1,673 442 1,787 3,338 Broach 823 656 1,572 580 1,008 2,389 Sutat 970 128 1,621 578 1,067 2,781 AmreIi
729 529 1,633 541 1,697 2,133 Bom},ay Deccan Northern Division 910 437 1,990 319 1,419 2,535 West Khandesh 811 399 1,786 907 1,401 2,035 East Khan~esh 381 492 884 155 2,000 3,265 DaDgS 823 505 1,558 693 1,754 2,165 Nasik 685 408 1,570 338 1,768 2,305 Ahmednagar 587 684 1,425 583 2,358 2,116 Poona 927 496 1,594 320 1,616 2,289 Satara North 829 531 1,771 522 1,474 2,315 Satara South
1,133 576 1,820 339 1,359 2,353 Kolhapur 473 454 1,734 509 960 1,649 Sholapur
820 617, 2.056 428 1,230 1,715 Bombay DecC01t Southern DiviJion 927 619 1,841 416 1,503 1,850 Belgaum 681 607 2,033 294 1,079 1,721 Bijapur 827 622 2,248 531 1,108 1,600 DhllJ'War
731 386 1,540 742 1,060 2,868 Bombay Konk_an Division 679 514 1,772 800 888 2,477 ThtlDa 549 329 1,397 645 996 3,419 Kolaba 819 182 1,224 690 1,333 3,470 Ratnagiri 991 388 1,484 749 1,241 2,402 Kanara
699 286 1,837 559 944 2,856 SAURASHTRA STATE 742 297 1,742 739 1,000 2,292 HaIar 768 328 1,824 535 1,108 2,737 Madhya Saurashtra 629 252 1,544 381 962 3,069 Zalawad 600 220 1,893 557 896 3,008 Gohilwad 736 317 2,006 579 767 3,045 Sotath
605 458 1,547 540 729 3,345 KUTCH STATE MO-A. Bk H 91-29

274
SUBSIDIARY
Distribution of 10,000 self"supporting persons of ALL INDUSTRIES AND SERVICES
Total No. of self-Number of penons per 10,000 self.supporting persons in All Industries and
'1 supporting persons Stale and N!tunl Division. engaged in All
Industries and O·Primary Indus-' I.Mining & 2.Processing and 3·Processing and Services. tries not else- Quarrying. Manufacture·F ood- Manufacture-
where specified. stuffs, Textiles, Metals. Chemicals Leather and and Prod uels
Products thereof. thereof.
I 2 3 4 5 6
BOMBAY, SAURASHTRA AND KurCH 1,461,301 1,051 136 1,515 266
'BOMBAY STATE 1,175,579 931 107 1,492 288
Creater Bombay .. ~ ...... ", Bombay Cujolat Dlvisirm 465,276 971 98 1,359 208
Bomhoy Dl'Ccon Northern Dioislon 345,598 517 94 1,927 418
Bombay Dtcean Southern Dluislrm 126,609 545 48 2,289 325
Bombay Konkrm Division 238,096 1.661 176 696 236
SAURASHTRA STATE 226,105 1.490 296 1,692 172
KUTCH STATE 59,617 1,760 102 1,298 181
SUBSIDIARY
Distribution of 10,000 self"supporting persons of ALL INDUSTRIES AND SERVICES
Total No. of self· Number of persons per 1 0,000 self.supporting persons in All Industries and
SllIte lnd Natural Division. supporting persons
engaged in All Industries and O.Primary Indus· I.Mining & 2-Processing and 3.Processing and
Services. tries not else. Quarrying. Manufacture.F ood· Manufacture-where specified. stuffs. Textiles. Met.ls, Chemicals
Leather and and Products
J
Products thereof. thereof.
I I
2 3 4 5 6
BOMBAY, SAURASHTRA AND KurCH 3,367,964 166 33 2,313 524
BOMBAY STATE 3,062,641 152 28 2,404 546
Greattr Bombay ... 1,237.448 73 26 2,465 694
Bomhay Gujarot Division 711,968 154 .. 3,103 308
Bombay Deccan Northern Division 690,232 107 38 1,939 544
" Bombay De:can South~m Dloision 218.629 180 19 2.474 418
Bomhay k~+arr Dldslon 204,364 739 105 1,099 620
SAURASHTRA STATE 277,264 309 93 U21 ,319
KUTCH STATE .. 28,059 315 10 1,092 157

275
TABLES'7-A
in States and Natural Divisions by Divisions (Rutal Population by Natural Divisions only)
Services who Are engaged in Industrie$ and Services in Division ;-
, I State and Natural Division.
4-Processing 5-Construc- I 6-Commerce. 7-Transport, 8-Health, Edu- 9-Services and Manufac- tion and I Storage and cation & Public not elsewhere ture-Not else- Utilities. , Communica- Administra- specified.
where specified. tions. tion.
7 8 I 9 10 II 12 1
943 459 1,300 436 1,009 2,885 BOMBAY, SAURASHTRA AND KUTCH
993 525 1,323 464 1,10';' 2,110 BOMBAY STATE
Greater Bombay
945 413 1,391 463 949 3,203 Bombay Gujarai Division
1,067 681 1,266 402 1,429 2,199 Bombay Deccan Northern Division
1,262 772 1,652 220 1,139 1.748 Bombay Deccan Southern Division
837 384 1.100 687 931 3,292 Bombay Konkan Division
713 156 1.203 283 649 3,286 SAURASHTRA STATE
597 318 1,206 449 444 3,645 KUTCH STATE
TABLE 5'7-B
in States and Natural Divisions by Divisions (Urban Population by Natural Divisions only)
Services who are engaged in Industries and Services in Division ;- r
1
6-Com~eree. State and Natural Division,
4-Processing 5-Construe- 7-Transport. B-Health, Edu- 9-Services and Manuf.c- tion and Storage and cation & Public not elsewhere ture-Not else- Utilities. Communica- Administra- specified,
where specified. tions. I tion.
7 8 9 10 11 12 I
560 369 2,071 726 1,120 2,118 BOMBAY, SAURASHTRA AND KUTCH
553 363 2,044 721 1,112 2,017 BOMBAY STATE
567 319 2.114 932 700 2.110 Greater Bombay
501 294 2.06) 488 1;052 2,031 Bombay Glfjarat Division
561 453 1.816 610 1.831 2.101 Bombay Decci:m Northern Division
564 527 2.290 549 1.282 1.697 Bombay Deccan Southern Division
606 388 2.053 806 1,209 '2.375 Bombay Konban Dil'isicn
640 391 2,355 783 1,184 2.505 SAURASHTRA STATE
623 155 2,271 735 1,335 2,107 KUTCH STATE MO-A Bk H 91-29a

276
SUBSIDIARY TABLE 5' 8
Distribution of 10,000 self .. supporting persons in States, Natural Divisions and Districts engaged in PRIMARY INDUSTRIES NOT ELSEWHERE SPECIFIED
(by Sub .. Divisions)
\ Number of persons per 10,000 self-supporting persons in Division 0 who Total No. of self-sup- are engaged in Industries in Sub-Division :-
porting persons engaged in Industries in
State, Natural Division & District. Division 0 ( and their
No. in 10,000 self- 0'1- 0'2-Rear- 0'3-Planta- 0'4-Fores- 0'5-Hunt- 0'6-supporting persons Stock ing of small· tion try & collec- ing (includ- Fishing.
engaged Raising. animals & Industries. tion of pro- ing trapping in All Industries insects. ducts not & Came
and Services). elsewhere Propaga-specified. tion).
I 2 3 4 5 6 1 B
·BOMBA Y, SAURASHTRA AND KUTCH 209,552 (434) 5,384'·, 50 396 1,499 35 2,636
BOMBAY STATE 155,931' (368) 4,335 . 66 250 1,931 47 3,371
Greater Bombay 9,088 (73) 3,009 184 19 306 6,481
Bomhay Gujarat Division 56,098 (477) 6,786 122 496 1,566 2 1,028
Banaskantba 6,207 (1,084) 8,017 116 1,814 53 Sabarkantba 2,916 (648) 8,179 912 909 Mehsana 12,420 (864) 7,941 803 1,249 1 Ahmedabad 10,093 (281) 8,532 534 850 84 Kaira 5,204 (434) 6,935 582 634 1,754 8 87 Panch Mahal. 1,423 (285) 6,683 1,005 394 1,918 Baroda 3,320 (262) 5,157 6 151 4.325 361 Broach 2.350 (433) 3,736 64 353 1,626 30 4,191 Surat 9,064 (490) 2,949 242 301 2,074 4,434 Amreli 3,101 (857) 7,752 374 332 1,542
Bomhay Deccan Northern Div,',ion 25,267 . (244) 6,140 50 175 1,904 222 1,509
West Khandesh 2,882 (416) 5,572 14 392 2,790 288 944 East Khandesh 3,026 (272) 6,140 20 132 1,110 420 2,178 Dangs 466 (2,575) 1.052 8,948 Nasik 2,539 (205) 4,080 39 130 4,321 91 1,339 Ahmednagar 1,332 (142) 5,826 120 150 1,374 173 1,757 Poona 4,936 (171) 5,470 53 113 1,890 245 2,229 Satara North 2,604 (387) 7,811 27 4 734 61 1,363 Satara South
'" 1,883 (354) 7,233 21 117 1,184 122 1,323 Kolhapur 2,764 (349) 7,887 29 4 904 1.176 Sholapur 2,835 (192) 6,744 159 554 1,326 233 984
Bomhay Deccan Southern Division 10,826 (314) 7,288 30 31 2,191 42 418
Belgaum / 5,219 (460) 7,565 27 15 2,106 287 Bijapur 2,181 (232) 7,286 27 1,724 101 862 Dharwar 3,426 (249) 6,868 35 76 2,618 61 336
Bomhay Konkan Division 54,652 (1,235) 620 4 113 2,537 22 6,704
Thana 20,965 (1,007) 743 1 76 4,066 5 5,109 Kolaba 11,232 (1,606) 459 I 30 2,245 12 7,253 Rafnagiri 12,660 (1,130) 808 6 310 183 75 8,618 Kanara 9,795 (1,870) 297 13 30 2,642 1,018
SAURASHTRA STATE 42,245 (839) 8,354 1 1,014 160 471
Halar 7,400 (1,035) 8,681 830 19 469 Madhya Saura.ht;~ 12,215 (921) 7,877 1,870 219 34 Zalawad 5,640 (890) 9,691 291 16 2 Gohilwad 7,915 ~ (657) 8,756 441 304 493 Sorath 9,075 (765) 7,547 3 955 157 1,338
KUTCH STATE 11,376 (1,298) 8,728 5 117 540 2 &08

SUBSIDIARY TABLE S· 8-A
Distribution of 10,000 self"supporting persons in States and Natural Divisions engaged in PRIMARY INDUSTRIES NOT ELSEWHERE SPECIFIED by Sub"Divisions
(Rural Population by Natural Divisions only)
277
Total No. of self-sup-Number 01 persons per 1 0,000 self-supporting persons in Division 0 who
are engaged in Industries in Sub-Division :-porting persons engaged J
in Industries in \
State and Natural Division. Division 0 (and their 0'1- 0'2-Rear- O'3-PIanta- 0'4-Fores- 0'5-Hunt- 0'6-No. in 10,000 self- Stock ing of small tion try & collec- ing (includ- Fishing . supporting persons Raising. . animals & Industries. tion of pro- ing trapping
engaged insects. ducts not and Game in All Industrie. I elsewhere Propaga-
and Services). \ specified. tion).
I 2 3 I 4 5 6 7 8
BOMBAY, SAURASHTRA AND KUTCH 153,647 (1,051) 5,972 36 359 1,429 44 2,160
BOMBAY STATE 10'9,468 (931) 4.831 51 192 1,936 61 2,929
Greater Bombay
Bombay Gujarat Division 45,163 (971) 7,370 96 371 1,145 1,017
Bombay Deccan Northern DiviJion '" 17,853 (517) 6.761 43 104 1.359 287 1,446
Bombay Deccan Southern Division 6,896 (545) 7,960 33 16 1,536 48 407
Bomhay Konk_an Division 39,556 (1.661) 516 5 57 3,170 30 6,222
SAURASHTRA STATE 33,686 \ (1,490) 8,756 1 985 112 146
KUTCH STATE 10,493 (1,760) 8,933 103 366 598
SUBSIDIARY TABLE 5'8-B Distribution of 10,000 self"supporting persons
. States and Natural Divisions m engaged in PRIMARY INDUSTRIES NOT ELSEWHERE SPECIFIED by Sub-Divisions
(Urban Population by Natural Divisions only)
Total No. of self-sup-Number of persons per 10,000 self-supporting persons in Division 0 who
are engaged in Industries in Sub-Division :-porting persons engaged
in Industries in State and Natural Division. Division 0 (and their 0'1- 0'2-Rear- 0'3-PIanta- 0'4-Forestry 0'5-Hunt- 0'6-
No. in 10.000 self- Stock ing of small tion andcolIec- ing (includ- Fishing. supporting persons Raising. animals & Industries. tion of pro- ing trapping
engaged insects. ducts not and Game in All Industries elsewhere Prop.ga-
and Services). specified. tion).
1 2 3 4 5 6 7 8
BOMBAY, SAURASHTRA AND KUTCH ... 55,905 (166) 3,767 86 499 1,689 13 3,946
BOMBAY STATE 46,463 (152) 3,165 103 387 1,919 15 4.411 \
Greater Bombay 9.088 (73) 3,009 184 19 306 6,481
Bombay Gujarat Division 10.935 (154) 4.373 227 1.011 3,309 6 1,074
Bombay Deccan Northern DiviJiolJ ... 7.414 (107) 4,644 66 348 3,214 68 1,660
Bombay Deccan Southern Division ... 3,930 (180) 6.109 23 58 3,341 31 438
Bomhay Konk_an Division 15,096 (739) 892 2 260 878 7.968
SAURASHTRA STATE 8,559 (309) 6,772 1 1.129 346 1,752
KUTCH STATE 883 (315) 6,297 68 283 2,604 23 725

278
SUBSIDIARY TABLE 5'9
Distribution of 10,000 self"supporting persons in States, Natural Divisiolts' and Districts engaged in MINING AND QUARRYING (by Sub.Divisions)
Total No. of self-sup- Number of persons per 10,000 self-supporting persons in Division I who are engaged in Industries , j)Qrting persons en- in Sub-Division :-
gaged in Industries State, Natural Division and in Division I (and
District. their No. in 10,000 .elf- I'O-Non- 1'1- 1'2- 1'3-Metal 1-4- 1'5-Stone- 1·6-Mica. 1'7-Salt, supporting persons en- metallic Coal Iron
.. Crude quarrying, saltpetre mmm!, ex-
gaged in All Indus- mining and mininll· ore ceptlron petroleum clay and and saline tries and quarryinll
. . oremininll· and natural sand pits. substances . mlmnlil·
~ervices). not other- gas. wise
classified.
I 2 3 4 5 6 7 8 9 10
BOMBAY, SAURASHTRA AND KUTCH
31,189 (65) 203 30 5 865 16 5,289 2 3,590
BOMBAY STATE 21,279 (50) 133 41 5 1,131 16 5,961 3 2,710
Greater Bombay 3,238 (26) 3 3 6,813 3 3,178
Bombay Gujarat Division 4,839 (41) 355 120 4,900 56 2,290 2,279
Bauaskantha 76 (13) 132 9,868 Sabarkantha 67 (IS) 2,836 7,164 Mehsana 19 (I) I,On 8,947 Ahmedabad 1,002 (28) 220 9,780 Kaira 178 (IS) , 730 9,270
. Panch Mahala 2.307 (463) 91 9,818 91 ...... Baroda 392 (31) 1,939 .. ·t 8,061 Broach 67 (12) 5,821 4.030 149 Surat 726 (39) 992 1.281 6,102 1,625 Amreli 5 (I) 10,000
Bombay Deccan Northern Division 5,859 (57) 89 48 It} 9,851 2 West Khandesh 243 (35) 10,000 East Khandeah 216 (19) 10,000 Dangs 17 (94) 10,000 Nasik 163 (13) 10,000. Ahmednarar 1,034 (110) 10,000 ,. Poona 2,044 (71) 54 5 29 9,912 Satara North 915 (136) 10,000 Satara South 269 (50) 483 \ ." 9,517 Kolhapur 506 (64) 534 534 6,932 Sholapur 452 (31) 22 9,956 22
Bombay Deccan Southern Division 1,018 (29) 9,971 29 Bel,aum 203 (18) 10,000 Bijapur 373 (40) 9,920 80 Dharwar 442 (32) 10,000
Bombay Konk.an Division 6,325 (143) 93 17 55 2 4,084 10 5,739 Thana 3.531 (170) 4,302 17 5,681 ., Kolaba 2,060 (295) 2,757 7.243 Ratnagiri 423 (38) 1,395 260 827 24 5,248 2,246 Kanara 311 (59) .. , 8,810 1,190
SAURASHTRA STATE 9,275 (184) 355 4 6 313 17 4,022 5,283 Halar 1,737 (254) 12 17 5,659 4,112 Madhya Saurashtra 1.550 (117) 52 39 m 5,658 3,458 Zalawad 3,186 (503) 716 3 6 16 40g B.851 Gohilwad 1,475 • (122) 542 13 224 75 4,136 5,010 Sorath 1.327 '(112) 83 8 972 6,51'\ 422
KUTCH STATE 635 (72) 299 16 16 1,307 8,362

SUBSIDIARY TABLE S'9-A Distribqtion of 10,000 self-supporting persons in States and Natural Divisions
engaged in MINING AND QUARRYING 'by Sub-Divisions (Rural Population by Natural Divisions only)
279
Total No. of self- Number of persons per 10,000 self-supporting persons in Division I who are enll811ed in upporting persons Industries in Sub-Division :-
State and Natural Division.
engaged in Indus-1 tries in Division I
(and their No. "O-Non-], 1'1- 1'2- 1'3-Metal 1'4-Crude I '5-Stone- ) 1'6- 1'7-Salt, in 10,000 self- metallic. Coal Iron ore minini petroleum quarryinl1, Mica. saltpetre
upporting persons mining and mining. mInIng. except and natural clay and and saline engaged in quarrying Iron ore ga •. land pill. substancea.
All Industries not other-..
mmmi· and Services). WIse
classified. I 2 3 4 I 5 6 7 8 9 10
I I
BOMBAY, SAURASHTRA AND 19,919 (136) 166 43 6 1,260 21 1,529 3 3,972 KUTCH
BOMBAY STATE 12,623 (107) 128 67 9 1,873 22 5,165 5 2.73)
Greater Bombay
Bombay Glljarat DiviSion 4,578 (98) 227 127 5,087 59 2,219 2.281
Bomball Deccan Northern Division 3,254 (94) 126 83 9,788 3
BombtllJ Deccan Southern Division 611 (48) 9,951 49
Bomball Konkan Division 4,180 (176) 41 26 84 2 4,093 15 5,739
SAURASHTRA STATE 6,690 (296) 233 217 23 3,629 5,897
KUTCH STATE 60S (102) 198, 16 1,205 8,581
SUBSIDIARY TABLE S'9-B Distribution of 10,000 self-supporting persoQs in States and Natural Divisions
engaged in MINING AND QUARRYING by Sub-Divisions (Urban Population by Natural Divisions only)
Total No. of self- Number of persons per 10,000 self-supporting persons in Division 1 who are el1llaged in upporting persons Industriell in Sub-Division :-engaged in Indus-
State and Natural Division.
tries in Division 1 I '4-Crude! (and their No. I 'O-Non- 1'1- 1'2- l'3-Metal I '5-Stone- 1'6- I '7-Salt,
in 10,000 self- metallic Coal Iron ore mmmi petroleum I quarryinv, Mica. saltpetre upporting persons mining and minini. mining. except and natural clay and andaaline
engaged in quarrying iron ore lias, sand pits, substances. All Industries not other- mining. and Services), wIse
classified. 2 3 4 5 6 7 8 9 10
J
BOMBAY,SAURASHTRA AND 11,270 (33) 268 6 4 166 6 6,634 2,915 KUTCH
BOMBAY STATE 8,656 (28) 141 2 49 7 7,121 2,679
Greater Bombay 3,238 (26) 3 3 6,813 3 3,178
Bombay Gujarat Division 261 (4) 2,605 1,609 3,525 2.261
Bomball Deccan Northern Division 2,605 (38) 42 4 23 9,931
Bombay Deccan Southern Division 407 (19) 10,000
Bomball Konk,an Division 2,145 (105) 196 4,065 5,739
SAURASHTRA STATE 2,585 (93) 669 16 19 561 4 5,037 3,694
KUTCH STATE 29 (10) 2.414 345 3,448 3,793

280
SUBSIDIARY TABLE 5'10
Distribution of 10,000 self-supporting persons in States, Natural Divisiolfs and Districts engaged in PROCESSING AND MANUFACTURE-FOODSTUFFS, TEXTILES,
LEATHER AND PRODUCTS THEREOF (by Sub"Divisions)
Number af persons per 10,000 self-supporting persons in Division 2 who are engaged T atal No. of self- in Industries in Sub-Division :-
supporting persons -- ---' ------------,--'-----engaged in Industries 2'0- 2'1- 2'2- 2'3- 2'4- 2'5- H- 2'7- 2'8- 2'9-in Division 2 (and Food Grains Vege- Sugar Bever- Toba- Cotton Wearing Textile Leather,
Slate, Natural Division and District, their No. in 10,000 Indus- and table Indus- ages. ceo. textiles. apparel Indus- leather self-supporting per- tries pulses. oiland tries. (except tries pro-
sons engaged in other- dairy foot- other- ducts All Industries and WIse pro- wear) wIse and
Services). unclas- ducts. and made unclas- foot-silied. up textile silied. wear.
goods .
I 2 3 ..- 5 6 7 8 9 10 II 12
BOMBAY, SAURASHTRA & KUTCH 1,000,241 (2,071) 181 226 385, 183 54 467 6,029 1,086 622 767
BOMBAY STATE 911,767 (2,151) 176 222 371 199 ~4 436 6,189 1,031 656 666
Greater Bombay 305,050 (2,465) 202 98 377 j' 57 234 7,392 848 440 351
Bombay Gujarat DiVision .. 284,154 (2,414) 65 193 247 3 40 436 6,905 979 515 617
Banaskantha 7,049 (1,231) 92 234 406 14 644 3,849 2,023 124 2,613 Sabarkantha 5,859 (1,303) 45 345 836 7 633 2,466 3,033 56 2,579 Mehsana 25,549 (1,777) 31 275 270 5 32 866 5,318 1,419 55 1,729 Ahmedabad 149,273 (4,156) 34 88 84 20 157 8,821 391 212 193 Kaira 21,170 (1,763) 112 273 616 14 50 1,271 4,906 1,384 548 826 Panch Mahals '" 4,162 ( 835) 293 836 987 82 1,098 2,095 2,994 262 1,353 Baroda 18,268 (1,442) 60 327 522 67 741 5,822 1,617 137 707 Broach 7,416 (1,366) 220 515 356 8 69 801 4,802 2,136 i37 956 Surat 41,277 (2,232) 121 259 226 9 97 338. 4,830 1,364 2,315 441 Am.reIi .. , 4,131 (1,142) 148 307 1,002 . 70 1,271 3,365 1.982 73 1,782
Bombay Deccan Northern Division 200,433 (1,935) 241 299 558 846 61 640 4,153 1,219 913 1,070
West Khandesh ... 11,754 (1,698) 449 406 1,450 27 62 839 3,718 1,774 59 1,216 East Khandesh '" 22,111 (1,989) 526 423 856 8 52 240 5,138 1,246 326 1,185 Dangs 12 ( 66) 833 1,667
li4 1,30'4 2,500 1,667 3,333
Nasik 24,807 (2,002) 318 311 610 639 3,804 1,066 844 990 Ahmednagar 22,504 (2,392) 170 239 416 3,564 26 843 1,508 981 829 1,4U POODa 28,902 (1,002) 289 413 880 1,136 116 1,396 1,352 2,086 1,100 1,232 Satara South ' .. 12,111 (1,800) 147 352 641 831 28 109 2,012 1,502 2,793 1,585 Satara North .. 8,968 (1,686) 285 245 372 18 84 541 2,661 1,717 2,370 1,707 Kolhapur 13,521 (J ,707) 215 280 306 564 61 379 3,722 1,731 1,150 1,592 Sholapur 55,743 (3,779) 73 189 192 401 30 183 7,341 539 593 459
Bombay Deccan Southern Division 83,085 (2,407) 119 368 164 116 35 510 5,700 1,159 879 950
Belgaum 23,312 (2,053) 220 286 142 380 46 356 4,104 1,449 1,690 1,327 Bijapur 29,435 (3,131) 65 212 192 24 14 194 7,432 739 451 677 Dharwar 30,338 (2,203) 95 582 154 4 47 934 5,245 1,343 672 924
BombayKonkan Division 39,045 (882) 569 693 716 25 150 812 3,053 1,590 1,577 815
Thana 21,996 (1,057) 423 540 1,005 29 136 404 3,505 1,385 2,057 516 Kolaba 3,618 (517) 392 1,504 489 17 224 1,155 1,755 2,427 544 1,493 Ratnagiri 10,383 (927) 997 385 285 24 178 1,330 3,270 1,440 1,031 1,060 Kanara 3,048 (582) 381 1,883 374 16 62 1,578 594 2,582 1,198 1,332
SAURASHTRA STATE ... 77,670 (1,543) 232 280 535 22 45 778 4,508 1,712 251 1,637
Halar . 10,876 (1,595) 330 249 349 40 724 4,489 1,663 343 1,813 ~adhya Saurashi~a 19,261 (1,451) 272 293 580 32 47 896 3,912 2,019 274 1,675 Zalawad '" 8,935 (1,410) 238 303 134 20 46 403 5,734 1,504 83 1,535 Gohilwad 20,826 (1,728) 114 226 853 35 37 694 4,892 1,409 344 1,396 Sorath 17,772 (1,498) 264 335 429 12 53 970 4,101 1,866 146 1,824
KUTCH STATE 10,804 (1,232) 257 240 432 10 60 802 3,467 1,305 396 3,031

281
SUBSIDIARY TABLE S'lO-A
Distribution of 10,000 self-supporting persons in States and Natural Divisions engaged in PROCESSING AND MANUFACTURE-FOODSTUFFS, TEXTILES, LEATHER AND PRODUCTS THEREOF by Sub-Divisions (Rural Population by Natural Divisions only)
I Number of persons per 10,000 self-supporting persons in Division 2 who are engaged
Total No, of self- ___ <--'___ in Industries in Sub-Division :-, ___ ) ____ , __ . supporting persons
eng~ged in Industries 2'0- 2'1- 2'2- 2'3- 2'4- 2'5- 2'6- 2'7- 2'8- 2'9-in Division 2 (and Food Grains Vege- Sugar Bever- Toba- Cotton Wearing Textile Leather,
State and Natural Division. their No. in 10,000 Indus- and table Indus- ages. ceo. textiles. apparei Indus- leather self-supporting per- tries pulses. oi! and tries. (except tries pro-
sons engaged in other- , dairy foot- other- ducts All Industries and wIse pro- wear) wIse and
Services). undas- ducts. & made unclas- loot-silied, up textile silied. wear.
goods.
1 2 3 4 5 6 7 8 9 10 II 12
BOMBAY, SAVRASHTRA AND KUTCH 221,387 (1,51S) 146 288 476 569 28 351 3,688 1,456 1,029 1,969
BOMBAY STATE 175,384 (1,492) 164 315 510 717 32 345 3,364 1,500 1,262 1,791
Greater Bombay
Bombay Gujarat Division 63,220 (1,359) \ 57 262 448 3 33 471 4.686 1,946 408 1,686
Bombay Deccan Northern Division 66,601 (1,927) 194 280 623 1,754 12 213 1,593 1,128 2,138 2,065
Bombay Deccan Southern Division 28,985 (2,289) 81 285 82 290, 22 158 4,818 1,369 1,127 1,768
Bombay Konk,an Division 16,578 (696) 600 703 1,039 24 125 721 2,900 1,525 1,227 1,136
SAURASHTRA STATE 38,262 (1,692) 64 186 346 4 17 331 5,180 1,338 98 2,346
KUTCH STATE 7,741 (1,298) 140 181 355 3 585 3,643 1,032 373 3,688
SUBSIDIARY TABLE S 'IO-B
Distribution of 10,000 self"supporting persons in States and Natural Divisions engaged . lD
PROCESSING AND MANUFACTURE-FOODSTUFFS, TEXTILES, LEATHER AND PRODUCTS THEREOF by Sub"Divisions (Urban Population by Natural Divisions only)
Total No, of self-Number of persons per 10,000 self-supporting persons in Division 2 who are engaged
in Industries in Sub-Division :-supporting persons ----------------------------
engaged in Industries 2'0- 2'1- 2'2- 2'3- 2'4- 2'5- 2'6- 2'7- 2.8· 2'9-in Division 2 {and Food Grains Vege- Sugar Bever- Toba- Cotton Wearing Textile Leather,
State and Natural Division. their No. in 10,000 Indus- and table Indus- ages, cco. textiles. apparel Indus- leather self-supporting per- tries pulses. oi! and tries. (except tries pro-sons engaged in other- dairy foot- other- ducts All Industries and wIse pro- wear) wIse and
Services). unclas- ducts, & made undas- foot. silied. upte><tile sified. wear.
goods
I 2 3 4 5 6 7 8 9 10 II 12
BOMBAY, SAURASHTRA AND KUTCH 778,854 (2,313) 192 208 358 74 61 500 6,694 982 506 425 BOMBAY STATE " ... 736,383 (2,404) 179 200 338 75 60 458 6,861 919 512 398
Greater Bombay ... 305,050 (2,465) 202 98 377 1 57 234 7,392 848 440 351 Bombay Cujarat Division ... 220,934 (3,103) 67 173 189 3 42 427 7,540 703 546 310 Bombay Deccan Northern Division 133,832 (1,939) 264 308 526 394 86 853 5,428 1.264 303 574 Bombay Deccan Southern Division 54,100 (2,474) 140 412 208 23 42 699 6,172 1,04~ 747 511 Bombay Konkan Division 22,467 (1,099) 547 685 478 27 168 879 3,166 1,63 1,835 578
SAURASI-ITRA STATE 39,408 (1,421) 396 370 718 41 72 1,212 3,856 2,074 400 861 KUTCH STATE 3,063 (1,092) 552 389 627 29 212 1,348 3,023 1,995 454 1,371

282
SUBSIDIARY TABLE 5'11
Distribution of 10,000 self"supporting persons in States, Natural Divisions18nd Districts engaged in PROCESSING AND MANUFACTURE-METALS, CHEMICALS
AND PRODUCTS THEREOF (by Sub"Divisions)
Total No, of self-Number of persons per 10.000 self-supporting persons in Division 3 who are engaged in
Industries in Sub-Division:-supporting perions i_-
engaged in Industries 3'O-Manu- 3'1-lron 3 '2-Non- 3'3-Trans- 3 '4-Elec- 3'5-Machi 3'6-Basic 3'7-Medi.l 3'8-in Division 3 (and facture of & Steel Ferroul port Equip- trical nery Industrial cal and I Manu-
State, Natural Division and their No. in 10,000 metal pro- (Basic Metal. ment. machinery, (other than Chemicals, Pharrna- facture of District. self-supporting per- ducts other- ManuEac- (Basic apparatus, electrical Fertiliser ceutical chemical
sons engaged in All wIse un- ture). ManuEae- appliances machinery) & Power Prepara- products I ndustries and classified. ture). & supplies. including Alcohol. lions. otherwise Services). Engineer- unclassi-
ing Work- fied. shops,
1 2 3 '4 5 6 7 8 9 10 II
BOMBAY, SAURASHTRA 215,298 (446) 4,382 496 7~ 2,052 309 1,374 315 207 790 AND KUTCH
BOMBAY STATE '" ... 201,047 (474) 4,252 508 68 2,141 324 1,403 284 220 800
Greater Bombay 85,849 (694) 2,338 824 97 2,723 655 2.000 214 281 868
Bombav Gujarat Division 31,640 (269) 4,909 623 17 1,708 169 690 638 298 948
Banaskantha 1,487 (260) 5,891 27 182 834 108 2,858 60 40 Sabarkantha 1,287 (286) 7,366 54 365 8 101 2,106 Mehsana 2,503 (174) 8,558 320 327 36 320 439 Ahmedabad 7.851 (218) 5,381 1,551 1,466 408 399 42 37 716 Kaira 2,519 (210) 6,717 564 139 282 913 182 16 1.187 Panch Mahala::: 3,769 (756) 2,722 108 7,100 32 3 3 32 Baroda 4,658 (368) 3,085 9 786 45 2,027 232 I,B93 1,923 Broach 583 (107) 8,679 52 343 34 515 377 Surat 3,B92 (211) 5,732 1,210 72 2,104 8B 144 77 46 527 . Amreli 3,091 (855) 1,453 272 158 294 5,830 1,993
Bomhav Deccan Northern Division 52,02B (502) 6,734 185 45 1,371 46 1,048 196 B4 . 291
West Khandesh 1,667 (241) 7,984 1,218 IB6 30 5B2 East Khande.sh 4,231 (381) 4,663 4,424 14 622 109 43 125 Danga 16 (88) 4,375 1,875 3,750 Nasik 3,495 (282) 4,981 100 3 3,743 " 930 17 46 169 Ahmednagar ' .. 2,653 (282) 5,BI1 26 2,017 1,606 15 388 136 Poona 28,941 (1,003) 7,924 37 41 570 52 739 321 94 222 Satara North ... 2,926 (435) 4,764 62 130 437 3 4,214 41 24 325 Satara South ... 2,492 (468) 4,282 1,990 193 369 145 2,600 20 401 Kolhapur 2,375 (300) 4,969 762 25 2,505 127 665 25 84 B38 Sholapur 3,232 (219) 5,786 384 37 2,320 22 718 9 724
Bomball Deccan Southern Division 13,253 (384) 5,278 50 120 3,735 24 334 459
Belgaum 3,557 (313) 6,801 51 368- 1,183 25 526 1,046 Bijapur 1,710 (182) 8,117 35 100 655 602 491 Dharwar 7,986 (580) 3,992 53 14 5,531 29 190 191
Bombay Konh_an DiVision 18,277 (413) 4,293 74 44 1,193 47 1,623 457 349 1,920
Thana 13,239 (636) 3,671 23 1,2BI 40 I,BI3 588 242 2,342 Kolaba 1,726 (247) 4,849 B7 661 1,773 324 1,819 487 Ratnagiri 2,OB9 (187) 5,797 163 383 929 148 1,173 5 19 1,383 Kaoara 1,223 (234) 7,670 458 1,447 16 115 294
SAURASHTRA STATE 12,729 (253) 5,899 367 209 851 103 1,009 841 29 692
Halar 1,734 (254) 4,839 40 427 II 346 3,772 •• 1 17 548 Madhya Saurashtra 2,796 (211) 7,343 86 30B 290 B9 1,026 III 747 Zalawad 2.279 (360) 3,918 557 154 31 447 4,081 9 803 Gohilwad 3,843 (319) 5,686 739 250 1,946 44 406 273 7B 57B Sorath 2,077 (175) 7,410 120 48 1,045 106 414 19 10 828
KUTCH STATE 1,522 (174) 8,843 263, 72 598 20 204

283
SUBSIDIARY TABLE S'U-A
Distribution ot 10,000 self"supporting persons in States and Natural Divisions engaged in PROCESSING AND MANUFACTURE-METALS, CHEMICALS AND PRODUCTS
THEREOF by Sub"Divisions (Rural Population by Natural Divisions only)
Number of persons per 10,000 self.supporting persons in Division 3 who are engaged in Industries in Sub.Division!-
Total No. of self· I , J
supporting persons 3·n.Manu· 3'l.Iron 3·2·Non· 3·3.Trans·13'4.Elec. 3'5·Machi· 3 '6·Basic, 3 '7.Medi· engaged in Industries Ferrous port Equip· trical I nery Industrial ; cal and
3'8-Manu-
State and Natural Division. in Division 3 (and facture of I & Steel
metal pro- (Basic Metals ment. machinery, (otherthan Chemicals, Pharma. facture of their No. in 10,000 ducts other- Manu!ac. (Basic applfatus, ! electrical Fertiliser ceutica! chemical self.supporting per- W1se ture) , Manufac- appliances mlchin,ry) and Power Preplra- products sons engaged in All unclassified. ture). & supplies, including Alcohol. tions. otherwise
Industries and Engineer. unclassi-Services). ing Work- fied.
I shops.
1 2 3 4 5 6 7 8 9 10 II
---BOMBAY, SAURASHTRA 38,825 (266) 7,375 216 49 758 53 675 185 69 620
AND KUTCH BOMBAY STATE ... 33,861 (288) 7,134 244 53 852 44 697 210 70 696
Greater Bombay ... Bombay Gujarat Division . 9,685 (208) 6,998 312 28 803 114 227 392 29 1,097 Bombay Deccan Northern 14,455 (418) 7,598 291 30 819 6 915 71 16 254
Division Bombay Deccan Southern 4,113 (325) 8,585 109 68 462 29 146 601
Division Bombay Konkan Division 5,608 (236) 5,109 107 143 1,305 30 1,348 410 332 1,216
SAURASHTRA STATE 3,882 (172) 8,951 26 31 144 134 531 10 80 93 KUTCH STATE ... 1,082 (181) 9,279 9 56 527 129
SUBSIDIARY TABLE 5'11-B
Distribution of 10,000 self"supporting persons in States and Natural Divisions engaged in PROCESSING AND MANUFACTURE-METALS, CHEMICALS AND PRODUCTS
THEREOF by Sub"Divisions (Urban Population by Natural Divisions only)
I
Total No, of self-Number of persons per 10,000 self.supporting persons in Division 3 who are engaged in
Industries in Sub. Division !-supporting persons I 1
engaged in Industries 3 ·O.Manu-1 3 'I-Iron 3'2·Non- 13·3.Trans. 3'4.Elec- 3'5.Machi'13'6-Basic 3·7.Medi- I 3'B-in Division 3 (and facture of I & Steel Ferrous port Equip· trical I nery Industrial cal and I Manu-
State and Natural Division, their No. in 10,000 metal pro- (Basic Metals ment. machinery, (other than Chemicals. Pharma. facture 0
self.supporting per- ducts Manufac· (Basic apparatus. I electrical Fertiliser ceutical chemica . sons engaged in All otherwise ture) , Manufac· appliances machinery) and Powerl Prepara- products Industries and unclassi. ture). & supplies. including Alcohol. tions, otherwis
Services) .• lied. Engineer- unclassi-ing Work· I fied.
shops.
I 1 2 3 4 5 6 7 8 9 10 II
e
BOMBAY, SAURASHTRA 176,473 (524) 3,723 558 81 2~337 365 1,528 343 238 827 AND KUTCH
BOMBAY STATE ... 167,186 (546) 3,668 561 71' 2,403 381 1,546 299 250 821
Greater Bombay 85,8!19 (694) 2,338 824 97 2,723 655 2,000 214 281 868 Bombay Gujarat Division 21,955 (308) 3,987 760 13 2,107 194 894 747 416 882 Bombay Deccan Northern 37,573 (544) 6,402 144 50 1,584 61 1,100 243 110 306.
Division Bombay Deccan Southern 9,140 (418) 3,790 23 143 5,208 22 418 396
Division Bombay Konkan Division 12,669 (620) 3,932 59 1,144 55 1,744 478 357 2,231
SAURASHTRA STATE 8,847 (319) 4,560 516 287 1,161 89 1,220 1,205 7 955 KUTCH STATE ... 440 (157) 7,773 886 114 773 68 38S

284
SUBSIDIARY
Distribution of 10,000 self"supporting persons in States, Natural Divisions ana Districts engaged in
Total No. of self-support- Number of persons per 10,000 self-supporting persons ing persons engaged in Industries in Division 4 (and their No. in 10,000 self.supporting persons 4 'O-Manufactur· 4 'I-Products 4' 2-Bricks, 4 '3-Cement-
engaged in All Industries ing Industries other. of petroleum tiles and cement State, Natural Division and District. and Services). wise unclassified. and coal. other structural pipes & other
clay products. cement products.
1 2 3 4 5 6
BOMBAY, SAURASHTRA AND KUTCH 326,480 (676) 1,964 35 478 169
BOMBAY STATE ... 285,973 (675) 1,909 32 536 178
Greater Bombay 70,132 (567) 2,041 48 307 101
Bombay Gujarat Division 79,634 (676) 1,915 47 845 378
Banaskantha 4.273 (747) 1,938 955 Sabarkantha 4,833 (1,075) 1,171 716 Mehsana 10,288 (715) 1,674 528 Ahmedabad 14,176, (395) 1,783 1,571 144 Kaira 11 ,523 (960) 1,805 222 1,480 Panch Mahals 3,693 (741) 2,104 225 Baroda 8,613 (680) 2,499 5 983 66 Broach 3,513 (647) 2,166 510 . Surat 15,214 (823) 2,318
t'.OS'S 1,168 47
AmreIi 3,508 (970) 884 171 2,774
Bombay Deccan Northern Division 75,568 (729) 1,80B 8 342 18
West Khandesh ... 6,300 \ (910) 1,714 .... ij 233 2 East Khandesh ... 9,018 (811) 1,577 305 10 Dangs 69 (381) 290 Nasik 10,204 (823) 1,488 4 242 17 Ahmednagar 6,433 (685) 1,892 9 197 8 Poona 16,941 (587) 1,653 11 518 30 Satara North 6.237 (927) 1.589 192 14 Satara South 4,411 (829) 2.079 61 188 2 Kolhapur 8.973 (1.133) 2,595 295 42 Sholapur 6,972 (473) 1,985 636 4
Bombay Deccan Southern Division 28,313 (820) 2,160 133 24
Belgaum 10,532 (927) 1,982 102 Bijapur 6.400 (681) 2.111 169 Dharwar 11,381 (827) 2,352 142 60
Bombay Konkan Division 32,326 (731) 1,626 44 1,078· 365
Thana 14,124 (679) 867 86 2,179 ' 830 Kolaba 3,843 (549) 1,785 981 3 Ratnagiri 9,167 (819) 1,868 22 29 3 Kanara 5,192 (991) 3,147 6 6
SAURASHTRA STATE. 35,200 (699) 2,312 63 76 116
Halar 5,062 (742) 3,226 10 Madhya Saurashtra 10,189 (768) 2,399 1]3 7 31 Zalawad 3,984 (629) 2,417 23 120 Gohilwad 7,230 (600) 1,576 288 8 Sorath 8,735 (736) 2,245 111 1 424
KUTCH STATE 5,307 (605) 2,621 19 30

285
TABLE 5'12 ,)
PROCESSING AND MANUF ACTURE .. NOT ELSEWHERE SPECIFIED (by Sub .. Divisions)
in Division 4 who are engaged in Industries in Sub-Division ;-
"
4'4-Non- 4' 5':"'Rubber 4:6--Wood and 4'7-Fumi- 4' S-Paper and 4' 9-Printing metallic mine- products. wood products ture and paper products. and Allied ral products. other than fixtures. Induitries. State, Natural Division and District.
furniture and fixtures.
7 8 9 10 11 12 1
1,646 91 4,331 210 90 974 BOMBAY, SAURASHTRA AND KUTCH
1,443 103 4,423 221 100 1,055 BOMBAY STATE
684 331 3,538 352 200 2,398 Greater Bombay
2,124 22 4,005 110 117 437 Bombay Gujarat Division
2,780 4,276 51 Banaskantha 3,391 60 4,575 "'89 · .... s B7 Sabarkantha 3,040 5 4.523 136 Mehsana 1.927 29 3,113 95 310 1,028 Ahmedabad 2,32B 2 3,484 507 46 126 Kaira 3,008 4,576 87 Panch Mahala 1,795 107 3,781 45 22 697 Baroda 2,044 4,668 68 544 Broach
934 5 4,725 13 256 534 Surat 2.155 2,848 8 105 Amreli
1.574 29 5.045 168 43 965 Bombay Deccan Northern Division
1.212 6,559 62 • 2 216 West Khandesh 1.262 2 6,336 194 2B 277 East Khandesh
9,710 Dangs 796 17 4.347 17 9 3,063 Nasik
2,108 3 5,378 124 281 Ahmednagar 1,237 109 4,538 237 148 1,519 Poona 3,468 2 4,334 18 56 327 Satara North 1,481 5,566 50 2 571 Satara South 2,299 4,422 29 1 317 Kolhapur 1.216 17 5,013 719 410 Sholapur
1,613 2 5,635 58 2 373 Bombay Deccan Southern Division
1,842 5,773 103 2 196 Belgaum 1,600 5,898 222 Bijapur 1,408 4 5,360 50 2 622 Dharwar
957 67 4,858 474 58 473 Bombay Konkan Division
1,000 142 4,208 29 88 571 Thana 1.033 16 5,748 26 127 2BI Kolaba
685 11 5,796 93B 13 635 Ratnagiri 1.260 4.312 1,198 6 65 Kanara
3,133 62 3,624 148 24 442 SAURASHTRA STATE
3,283 3,193 288 Balar 3,160 29 3,575 13 57 616 Madhya Saurashtra 4.199 20 3,040 2 8 171 Zalawad 2.896 250 3,682 658 13 629 Gohilwad 2,722 1 4,149 35 15 297 Sorath
2,745 :I 4,392 68 123 KUTCH STATE

286
SUBSIDIARY
Distribut:on of 10,000 self-supporting persons in States and Natural bivisions engaged in (Rural Population by Natural
State and Natural Division.
BOMBAY, SAURASHTRA AND KUTCH
BOMBAY STATE
Greater Bomhay
Bomhay Gujarat Division
Bombay Deccan Northem Division
Bombay Deccan Southern Division
Bombay Konkan Division
SAURASHTRA .STATE
KUTCH STATE
total No. of seIf-supporting persons engaged in
Industries in Division 4 (and their No. in 10,000 sell-supporting persons
engaged in All Industries and Services).
2
137,764 (943)
116,733 (9"93)
. 43,955 (945)
36,863 (1,067)
15,979 (1,262)
19,936 (837)
17,471 (773)
3,560 (597)
Number of persons per 10,000 self-supporting persons
4 ·O-Manufacturing Industries other
wise unclassified.
3
1,371
1,362
1,083
1,334
1,902
1,597
1,305
1,972
4 . I-Products 01 petroleum and coal.
4
22
15
9
69
77
4· 2-Bricks, tiles and other
structural clay products.
5
510
585
796
188
70
1,266
111
4·3-Cementcement pipes
and other cement products.
6
156
181
452
8
17
37
14
14
SUBSIDIARY
Distribution of 11),000 self"supporting persons in States and Natural Divisions engaged in . (Urban Population by Natural
I Number of persons per I 0,000 self-supporting persons Total No. of self-suppor_t-ing persons engaged In
Industries in Division 4 State and Natural Division. (and their No. in 10,000 4 . O-Manufactur- 4 . I-Products 4·2-Bricks, tiles 4· 3-Cement-
self-supporting persons ing Industries other- o! petroleum and other cement pipe. engaged in All Industries wise unclassified. and coal. structural clay and other cement
and Services). products. products.
I 2 3 I
4 5 6
BOMBAY, SAURASHTRA AND KUTCH 188,716 (560) 2,398 43 455 179
BOMBAY STATE 169,240 (553) 2,286 44 502 176
Greater Bomhay 70,132 (567) 2,041 48 307 101
Bombay Gujarat Dlvlsion 35,679 (501) 2,940 104 905 287
Bombay Deccan Northem Division 38,705 (561) 2,260 8 489 27
Bombay Deccan Southern Division 12,334 (564) 2,495 216 33
Bombay Konkan Divllion 12,390. (606) 1,674 4 776 893
SAURASHTRA STATE 17,729 (640) 3,306 48 42 217
KUTCH STATE 1,747 (623) 3,944 57 63

TABLE Q'12-A
PROCESSING AND MANUFACTURE-NOT ELSEWHERE SPECIFIED by Sub"Divisions Divisions only)
in DivisiQ[1 4 who are engaged in Industries in Sub-Division :-
4'4-Non- 4'5-Rubber 4'6-Wood and I 4'7-Furni- 4'8-Paperand 4' 9..:... Printing State and Natural Division. metallic mine- products. wood products ture anel paper products, and Allied
ra I products. other than I fixtures, Industries. furniture
7 8 and fix~tes. I
10 11 12 I
287
2,526 5 5,046 164 67 133 BOMBAY, SAURASHTRA AND KUTCH
2.~46 5 5,223 152 78 153 BOMBAY STATE
Greater Bombay
2,892 9 4,496 22 172 77 Bombay Gujarat Division
2,303 5,810 102 27 218 Bombay Deccan Northern Division
2,004 5,957 31 19 Bomba!J__ Deccan Southern Divi$ion
911 12 5,150 624 28 306 Bombay Konkan Division
4,229 5 3,950 275 6 28 SAURASHTRA STATE
3,357 4,635 17 5 Kl}TCH STATE
TABLE S'12-B
PROCESSING AND MANUFACTURE-NOT ELSEWHERE SPECIFIED by Sub"Divisions Divisions only)
in Division 4 who are engaged in Industries in Sub-Division :-
I
4'4-Non- 4'5-Rubber 4'6-Wood and 4'7-Fumi- 4'8-Paperand 4' 9-Printing State and Natural Division. metallic mine- products. wood products ture and paper products, and Allied ral products, other than fixtures. Industries,
furniture and fixtures.
7 8 9 " 10 II 12 I
1,0114 163 3,819 245 106 1,588 BOMBAY, SAURASlITRA AND KUTCH
889 170 3,872 269 115 1,677 BOMBAY STATE
684 331 3,538 ' 352 200 2,398 Greater Bombay
1,179 39 3;401 217 48 880 Bombay GujaTat Divi$ion
879 55 4,316 232 58 1,676 Bombay Deccan Northern Division
1,106 4 5,218 93 3 832 Bombay Deccan Southern Divi$ion
1,029 155 4,388 232 107 742 Bombay Konkan Division
2.053 118 3,302 23 41 850 SAURASHTRA STATE
l,SOD 6 3,898 172 360 KUTCH STATE

288
SUBSIDIARY
Distributio~ of 10,000 seH-supporting persons in States, Natural Divisions and
Total number 01 self- Number 01 persons per 10,000 sell-supporting persons in supporting persons en-
, 5 ' I-Construc- 5' 2-Consiruc-gaged in Services in 5 ' O-Construc-Division 5 (and their lion and main- tion and maintenance tion and mainle-number in 10,000 self- tbnance of works- -Buildings, nance-Roads,
State, Natural Division and District, supporting persons en- otherwise unclassi- Bridges and other gaged in All Industries fied, Transport Works,
and Services),
1 2 3 4 5
BOMBAY, SAURASHTRA AND KUTCH 191,263 (396) 277 6,095 842
BOMBAY STATE 172,868 (408) 263 6,060 855
Greater Bombay", 39,515 (319) 366 5,582 114
Bombay Gujaral Division \ 40,183 (341) 455 5,835 1,105
Banaskantha 2,736 (478) ..•... 5,431 2,902 Sabarkantha 1,346 (299) 8,373 126 Mehsana 4,556 (317) 158 6,260 2,724 Ahmedabad 8,390 (233) 900 6,673 488 Kaira 4,227 (352) 942 6,203 1,003 Panch Mahals 1,248 (250) 1,394 7;236 Baroda 4,032 (318) 714 7,014 226 Broach 1,061 (195) 9 7,352 1,687 Surat 12,123 (656) 117 4,015 1,039 Amreli 464 (128) 8,233 496
Boml,ay Deccan Northern Division 54,799 (529) 124 6,561 822
West Khandesh 3,023 (437) 8,250 122 Ea5t Khandesh 4,431 (399) 278 5,516 2,103 Dangs 89 (492) 449 6,180 2,809 Nas:k 6,263 (505) 49 5,678 1,153 Ahmednagar 3,843 (408) 23 6,152 291 Poona 19,735 (684) 200 6';19 786 Salara North 3,341 (496) 6,977 844 Salara South 2,823 (531) 32 8,282 383 Kolhapur 4,559 (576) 9 5,826 722 Sholapur 6,692 (454) 157 7,244 607
Bombay De.:can Southern Division 21,298 (617) 87 7,321 694
Belgaum 7,035 (619) 263 6,762 566 Bijapur 5,705 (607) 8,172 549 Dharwar 8,558 (622) 7,213 897
Bombay Konkan Division '" 17,073 (386) 241 4,517 2,285
Thana 10,707 (514) 261 3,993 . 2,504 Kolaba 2,300 (329) 3,530 1,739 Ratnagiri 2,036 (182) 44 7,225 1,125 Kanara 2,030 (388) 606 5,680 2,911
SAURASI-ITRA STATE 14,383 (286) 453 6,254 492
Halar 2,024 (297) 7,792 459 Madhya Saurashtra 4,358 (328) 167 6,595 996 Zalawad 1,599 (252) 25 5,922 125 Gohilwad 2,646 (220) 1,633 6,062 38 Sorath 3,756 (317) 381 5,306 402
KUTCH STATE 4,012 (458) 239 7,051 1,533

289
TABLE 5'13
Districts engaged in CONSTRUCTION AND UTILITIES (by Sub-Divisions)
Division 5 who are engaged in Services in Sub-Division :-
5'3-Construc- I, 5'4-Construc-
, I 5'5___;Works and 5'6-Works & 5' 7-Sanitary
tion and main .. tion and main- Services-Electric Services-Domes- Works and Services tenance-T ele- ten.nce opera- Power and Gas tic & Industrial - Including scaven- ; graph and T ele- tions-Irrigation supply. water supply, gers. State, Natural Division:.nd District. phone Lines, and other
agricultural works.
6 7 8 9 10
19 608 609 275 1,275 BOMBAY,ISAURASHTRA:AND'::KUTCH G
19 638 604 291 1,270 BOMBAY STATE
38 2 178 182 2,938 Greater Bombay
20 1,300 4)8 31 706 Bombay GujaTal Division
7 77 1.583 Banaskantha 22 45 1.434 Sabarkantha
46 812 Mehsana 39 923 977 Ahmedabad
40 944 336 291 241 Kaira 32 1.338 Panch Mahala 65 516 1,463 Baroda
547 339 66 Broach 52 4.141 549 87 Surat
\72 1.099 Amreli
15 659 482 501 836 Bombay Deccan Northern Division
404 199 172 853 West Khandesh 36 81 '118 185 1.083 East Khandesh
"540 562 Dangs 883 327 1.370 Nasik
3 1,119 677 913 822 Ahmednagar 25 278 537 678 977 Poona
1,119 359 183 518 Satara North 42 213 329 503 216 Satara South
2,419 581 191 252 Kolhapur 577 191 643 5S0 Sholapur
8 855 216 34 785 Bombay Deccan Southern Division
16 2,051 li'3 21 148 Belgaum 310 91 26 852 Bijapur
6 235 333 50 1.266 Dharwar
23 1,394 806 733 Bombay Konkan Division
II 1.067 1,228 936 Thana 22 4.352 31 326 KoIaba
,10 59 1,026 49 462 Ratnagiri 54 133 217 399 Kanara
1'3 352 785 102 1,5~9 SAURASHTRA STATE
10 761 64 914 Halar 106 950 167 1,019 Madhya Saurashtra
13 2,214 738 12 951 Zalawad 41 159 737 1.330 Gohilwad 16 165 660 157 2,913 Sorath
20 259 Zll2 187 509 KUTCH STATE MO-A Bk H 91-30

290
State and Natural Divi,;on.
BOMBAY, SAURASHTRA AND KUTCH
BOMBAY STATE
Greal.r Bombay
BOlJlbay Guiarat Division
Bombay Deccan Northern Division
Bombay Deccan Southern Division
Bombay Kon~n Division
SAU RASHTRA STATE
KUTCH STATE
State and Natural Division.
BOMBAY, SAURASHTRA AND KUTCH
BOMBAY STATE
Greater Bomhay
Bombay Gujaral Division
Bombay Deccan Northern Division
Bombay Deccan Southern Division
Bombay Konkan Division
SAURASHTRA STATE
KUTCH STATE
SUBSIDIARY
Distribution of 10,000 self"supporting persons in States and Natural (Rural Population by Natural
Total number of self- Number of persons per 10,000 self-supparting persons in supporting persons en-
5 . I-Construc-gaged in Services in 5 'O-Construc- 5' 2-Cons!ruc-Division S (and their tion and main- tion and maintenance- tion and mainte-number in 10,000 self- tenance of works- Buildings. nance-Roads, supporting persons en- otherwise unclassi- Bridges and other gaged in All Industries lied. Transport Works.
and Services).
2 3 4 5
67,114 (459) 226 5,530 1,645
61,685 (525) 166 5,586 1,640
19,226 (413) 279 4,437 1,660
23,540 (681) 186 6,551 1,095
9.176 (772) 7,281 910
9,143 (384) 57 3.708 3,780
3,535 (156) 1,180 4,269 1,177
1,894 (318) 391 6,056 2,672
SUBSIDIARY
Distribution of 10,000 self-supporting persons in States and Natural (Urban Population by Natural
Total number of self- Number of persons per 10,000 self-supporting persons in supporting persons en-gaged in Services In 5' O-Construc- S . I-Construc- 5' 2-Construc-Division 5 (and their tion and main- tion and maintenance- tion and main!e-number in 10,000 seli- tenance of works- Buildings. nance-Roads, supporting persons en- otherwise unclassi- Bridges and other gaged in All Industries
and Services). lied. Transport Works.
2 3 4 5
124,149 (369) 305 6,401 407
111,183 (363) 317 6,323 419
39,515 (319) 366 5,582 114
20,957 (294) 617 7,117 595.
31,259 (453) 77 6,568 617
11,522 (527) 160 7,355 512
7,930 (388) 453 5,449 561
10,848 (391) 217 6,901 269
2,118 (755) 104 7,941 515

TABLE S'l3-A
Divisions engaged in CONSTRUCTION AND UTILITIES by Sub-Divisions Divisions only)
Division 5 who are engaged in Services in Sub-Division ;-, I
S '3-Construe- S . 4-Construc- 5'S-Works and 5'6-Worksand I S'7-Sanitary tion and mJin- tion and malO" Services-Electric Services-Domes- Warks and Services
tenance-Telegraph tenance opera- Power and Cas tic and Industrial -Including seaven-and Telephone tions-Irrigation supply. water supply. gers.
Lines. and other agricultural
works.
6 7 8 9 10
291
State and Natural Division.
I
·7 1,465 367 274 486 BOMBAY, SAURASHTRA AND KUTCH
7 1,510 389 288 414 BOMBAY STATE
..... ~ Greater Bombay
4 2,713 171 50 686 Bomhay Gujarat Division
7 1,093 171 573 324 Bomhay DeccQn Northern Division
15 1,520 10 30 234 Bombay Deccan Southern Division
2 39 1,817 330 267 Bombay Konkan Division
211 1,346 133 130 1,745 SAURASHTRA STATE
10 216 90 79 486 KUTCH STATE
TABLE 5'13-B
Divisions engaged in CONSTRUCTION AND UTILITIES by Sub-Divisions Divisions only}
Division 5 who are engaged in Services in Sub-Division ;-
5 . 3-Construc- S . 4-Construc- S'}"-Works and 5 . 6--Works and 5' 7-Sanitary tion and main- tion and main- Services-Electric Services-Domes- Works and Services
temnce -Telegraph tenance opera- Power and Gas tic and Industrial -Including seaven-and Telephone tions-Irrigation supply. water supply. gers. Stat e and Natural Division.
Lines. and other agricultural
works.
6 7 8 • 9 10
25 145 739 276 1,702 BOMBAY, SAURASHTRA AND KUTCH
26 154 723 293 1,745 BOMBAY STATE
38 2 778 182 2,938 Greater Bombay
35 157 741 12 726 Bombay GujaTa! Division
20 332 716 448 1,222 Bombay Deccan Northern Division
291 390 38 1,253 Bombay Deccan Soufhern Division
5 907 1,354 1,271 Bomhay Konk,Qn Division
11 28 997 93 1,484 SAURASHTRA STATE
2B 298 302 283 529 KUTCH STATE MO·A Bk H 91-30a

292
State, Natural Divisivn fnd District,
BOMBAY, SAURASHTRA AND KUTCH
BOMBAY STATE ...
Greater Bombay
Bombay Gujaral Division
Banaskantha Sabarkantba Mehsana Ahmedabad 'Kaira Panch Mahala Baroda Broach Surat Amreli
Bombay Deccan Northern Division
West Khandesh ... East Khandesh Dangs Na!ik Ahmednag'ar Poona Satata North Satara South Kolhapur Sholapur
Bombay Deccan Southern Division
Belgaum Bijapur Dharwar
Bombay Konkan Divi.5ion
Thana Kolaba Ratna_giri Kanara
SAURASHTRA STATE
Halar Madhya Saurashtra Zalawad Gohilwad SorRth
KUTCH STATE
SUBSIDIARY
Distribution of 10,000 self-supporting persons in States, Natural
Total No, of selfsupporting persons engaged in Services in Division 6 (and their No. in 10,000 seH-supporting persons eng~ged in All lndus-
tries and Services),
2
887,580 (1,838)
781,544 (1,844),
261,581 (2,114)
211,737 (1,799)
11,987 (2,094) B,687 (1,931)
28,307 (1,968) 64.299 (1,790) 21~677 (1,806) 9,751 (1,955)
23,019 (1,816) 9,OB3 (1,673)
29,066 (1,572) 5,B61 (1,621)
169,121 (1,633)
13,776 (1,990) 19,849 (1,786)
160 (884) 19.311 (1,558) 14,775 (1,570) ; 41,103 (1,425) 10,723 ( 1,594) 9,421 (1,771)
14,417 (1,820) 25,586 (1,734)
70,974 (2,056)
20,906 (1,841) 19,108 (2,033) 30,960 (2,248)
68,131 (1,540)
36,886 (1,772) 9,768 (1,397)
13,706 (1,224) 7,771 (1,484)
92,472 (1,837)
11,879 (1,742) 24,204 (1,824) 9,7~ (1,544)
22,814 (1,893) 23,7B9 (2,006)
13,534 (1,547)
Number of persons peJ 10,000 self-supporting persons
6 'O-Retail trade otherwise unclas
sified.
3
2,746
2,618
2,880
2,713
1,783 3,486 1,019 3,245 3,208 3,946 3,292 3,062 2,107 2,\36
2,415
2,297 2,422 1,625 1,514 1,662 2,915 2,132 3,961 2,119 2,502
2,009
1,9W 1,876 2,153
2,452
2,644 1,633 3,239 1,184
4,OM
3,<456 3,426 3,445 3,832 5,571
1,005
6 . I-Retail trade in foodstuffs (in
cluding beverages and narcotics).
3,888
3,872
2,526
4,482
6,232 4,301 6,339 3511 4,673 3,194 3,856 4,801 4,510 6,101
4,453
4,461 4,455 5,313 5,111 4;564 4,226 4,700 4,040 4,584 4,217
4,M7
5,056 4,358 5,053
4,661
4,024 5,320 4,970 6,312
3,581
4,172 4,330 3,674 3,814 2,262
6,908
6'2-Retail trade in fuel (including
petro!).
5
422
433
435
344
327 236 298 301 340 178 352 339 586 293
499
351 654 312 707 378 582 392 343 406 394
406
373 512 363
567 1
-167 1,552
242 374
301
285 198 205 316 438
819

293
TABLE 5'14 0
Divisions and Districts engaged in COMMERCE (by Sub-Divisions)
in Division 6' who are engaged in Services in Sub-Division :-
6'3-Retail 6'4-Whole- 6' 5-Whole- I 6'6-Real 6'7-ln- 6'S-Money- I
trade in tex- sale trade sale trade in I Estate. surance. lending, I
tile and leather in food- commodities banking and ; State, Natural Division and [listrict. goods. stuffs. other than r other financial
foodstuffs. I
business. 1
6 7 S I 9 I 10 II
1,078 213 793 38 120 702 BOMBAY, SAURASIITRA AND KUTCH
1,084 225 816 38 124 730 BOMBAY STATE
826 IS7 2,100 93 266 717 Greater Bombay
1.344 79' 173 6 S2 807 Bombag Gv.jarat DivisiDn
976 83 599 Banaskantha 1,IS6 48 65 22 686 SabarkaDtha
870 221 316 3 6 928 Meh5ana 1,563 65 139 2 109 I,06S Ahmedabad 1,141 49 94 3 27 465 Kaira 1,771 81 334 6 490 Panch Mahals 1,174 14 162 45 80 1,025 Baroda
991 24 141 1 35 606 Broach 1,871 105 214 26 )8\ Surat
920 79 108 • 363 Amreli
1,185 410 385 19 I 40 594 Bombay Deccan Northern Division
1.217 398 403 21 3 B49 West Kbandesh 1.146 485 27S 3 42 51S East Khandesh
312 2,313 125 Dangs 1,202 358 S44 23 S2 4B9 Nasik 1,347 642 721 3 7 676 Ahmednllgar
847 231 434 30 76 659 POllna 1,218 156 675 3 42 682 Satata North 1,048 228 37 15 328 Salata South 1,368 576 164 I 27 755 Kolhapur 1,571 636 190 45 28 417 Sholapur
1,197 447 186 2 21 865 Bombay Deccan Southern Division
1,002 634 125 40 851 Belgaum 1,680 406 336 7 2 823 Bijapur 1,032 345 134 20 900 Dharwar ,
902 250 299 14 121 734 Bombay Konkan Division
1,174 161 218 II 204 1,097 Th!Ula 541 377 237 I 28 311 Kolaba 503 438 311 19 23 255 Ratnaziri 766 177 739 39 19 390 Kilnata
1,084 142 '171 39 96 502 SAURASHTRA STATE
1,105 202 192 102 24 462 Halar 1,194 74 202 29 26 521 Mlldhya Sauras,btra 1,445 459 318 4 21 429 Zalawad
969 63 240 20 19 727 Gobilwad 922 126 4 49 311 317 Serath
717 13 228 18 492 KUTCH STATE

294
-
n
State and Natural Division.
1 I BOMBAY, SAURASHTRA AND KUTCH
BOMBAY STATE
Greater Bombay
Bombay Gujarat Division
Bombay Deccan Northern Division
Bombay Deccan Southern Division ... Bombay Konkan Division
SAURASHTRA STATE
KUTCH STATE
State and Natural Division.
1 J
BOMBAY, SAURASHTRA AND KUTCH
BOMBAY STATE
Grealer Bombay
Bombay Gujarat Division
Bombay Deccan Northern Division
Bombay Deccan Southern Division
Bombay Konkan Division
SAURASHTRA STATE . ~. KUTCH STATE
SUBSIDIARY
Distribution of 10,000 seH .. supporting persons in States and (Rural Population by
Total No. of sell-supporting persons en-
Number of perso~s per 10,000 sell-supporting persons
gaged in Services I f
in Division 6 6' O-Retail trade 6' I-Retail trade 6'2-Retail trade (and their No. in 10,000 otherwise unelas- in foodstuffs (in- in fuel (including self-supporting persons sified. eluding beverages petrol). engaged in All lndus- and narcotics).
tries and Services).
2 3 \
4 5
189,946 (1,300) 2,472 5,506 422
155,561 (1,323) 2,063 5,777 433
64,704 (1,391) , 2,168 6,099 273
43,765 (1,266) 1,966 5,282 495
20,912 (1,652) 2,108 6,272 354
26,180 (1,100) 1,998 5,415 788
27,194 (1,203) 5,160 3,543 290
7,191 (1,206) 1,174 7,050 679
SUBSIDIARY
Distribution of 10,000 seH-supporting persons in States and (Urban Population by
Total No. of self- Number of persons per 10,000 self-supporting persons supporting persons
engaged in 6 . i-Retail trade Services in Division 6 6' O-Retail trade 6' I-Retail trade
(and their No. in 10,000 otherwise unclas- in focdstuffs (in" in fuel (including sell-supporting persons sified. eluding beverages petrol). engaged in Alllndus- and narcotics).
tries and Services).
2 3 • 4 5
697,634 (2,071) 2,820 3,447' 422
625,983 (2,044) 2,756 3,398 433
261,581 (2,114) 2,880 2,526 435
147,033 (2,065) 2,953 3,770 375
125,356 (1,816) 2571 4,163 500
50,062 (2,290) 2,006 4,280 427
41,951 (2,053) 2,735 4,191 429
65,278 (2,355) 3,636 3,597 306
6,373 (2,271) 814 6,747 552

TABLE S'l4-A I)
Natural Divisions engaged in COMMERCE by Sub-Divisions Natural Divisions only)
in Division 6 who are engaged in Services in Sub-Division :-,
6'3-Retail 6'4-Whole- 6'5-Whole- 6'6-Real 6'7-1n- 6'8-Money-trade in tex- sale trade sale trade in Estate. surance. lending,
tile and leather in food- commodities banking and goods. sluffs. other than other financial
foodstuffs. bu.iness.
6 7 8 9 10 11
-799 222 253 2 15 309
825 249 293 2 16 342
860 123 101 10 366
973 450 562 3 10 259
748 71 60 5 471
555 366 508 4 50 316
691 125 51 5 11 124
630 8 153 3 303
TABLE 5'I4-B
Natural Divisions engaged in COMMERCE by Sub-Divisions Natural Divisions only)
in Division 6 who are engaged in Services in Sub-Division:-
I I
6'3-Retail 6'4-Whole- 6'5-Whole- 6'6-Real 6'7-ln- 6'8-Money-trade in tex- sale trade sale trade in E.tate. surance. lending,
tile and leather in food- commodities banking and goods. stuff •. other than other financial
foodstuffs. busineu .
• 6 7 8 9 10 II
1,155 211 940 48 148 809
1,148 219 1.021 48 151 826
826 157 2,100 93 266 717
1,557 60 2~5 9 70 1001
1.259 396 324 25 51 711
1.385 604 238 3 28 1,029
1.118 J77 169 21 165 995
1.247 149 221 53 132 659
816 19 312 35 705
295
I)
State and Natural Division.
I
BOMBAY, SAURASHTRA AND KUTCH
BOMBAY STATE
Greater Bombay
Bombay Gujarat Division
Bombay Deccan Northern Division
Bombay Deccan Southern Division
Bombay Konkan Division
SAURASHTRA STATE
KUTCH STATE
State and Natural Division,
I
BOMBAY, SAURASHTRA AND KUTCH
BOMBAY STATE
Greater Bombay
Bombay Gujarat Division
Bombay DeccanNorthern Division
Bombay Deccan Southern Divisio_n
Bombav Kookan Division
SAURASHTRA STATE
KUTCH STATE

296
SUBSIDIARY c
Distribution of 10,000 self"supporting persons in States, Natural Divisions and Districts engaged in
Total No. of self·sup. 1 Number 01 persons per 10,000 slJlf'5upporting persons porting persons engaged ' I ------in Services in Division 7 I 7·0·Transport 17·I.Transport 7 ,2· Transport 7' 3· Transport
(and their No. in and communica· I by road. by water. by air.
State, Natural Di~ision and District. 10,000 self.supporting tions otherwise persons engaged in All unclassified and Industries and Services). incidental
services.
2 3 4 5 6
BOMBAY, SAURASHTRA AND KUTCH 308,125 -(638) 92 3,585 1,919 103
BOMBAY STATE ... 275,265 (650) 86 3,618 1,854 lOB
Greater Bombay 115,379 (932) 180 2.997 3,256 227
Bombay Gujarat Division 56,276 (478) 44 4,461 671 20
Banaskantha 3,429 (599) 5,585 38 Sabarkantha 1.450 (322) 8,207 7 Mehsana 6,118 (425) 46 6,180 10 Ahmedabad 15,118 (421) 91 5,535 5 73 Kaira 4,744 (395) 114 4,829 19 Panch Mahals 3,193 (640) 2,039 13 .... 4 Baroda 7,013 (553) 30 2,324 144 Broach 2,399 (442) 17 2,680 2,672 Surat 10,721 (580) 3,909 1,871 Amreli 2,091 (578) 2,128 4,711 5
Bom6ay Deccan Northern DiVision 55,997 (541) 7 3,989 80 18
West Khandesh ... 2,206 (319) 6,645 267 5 East Khandesh ... 10,082 (907) 1,353 25 1 Dangs 28 (155) 1,786 Nasik 8,581 (693) 3,712 5 Abmednagar 3,179 (338) 5,851 38 Poona 16,805 (583) 4,716 58 54 Satara North 2,153 (320) 5,759 334 Satara Soutb 2,780 (522) 3,457 93 7 Kolhapur 2,681 (339) 4 7,527 187 15 Sholapur 7,502 (509) 52 3,083 137
Bombay Deccan Southern Division 14,793 (428) 5,614 89 0'
Belgaum 4.120 (416) 5,778 187 Bijopur 2,763 (294) 7,119 119 4 Dharwar 7,310 (531) 4,940 14 I
Bombay Konkan Division 32,820 (742) 2,821' 2,780 44
Thana 16,652 (800) 2,623 745 83 Kolaba 4,513 (645) 3,616 4,323 2 Ratnagiri 7,731 (690) 2,549 5,979 5 Kanara 3,924 (749) 3,277. 3,338 3
SAURASHTRA STATE 28,122 (559) 149 3,280 2,385 60
Halar 5,038 (739) 58 3,182 . 3,827 242 ~adhya Saurashtra 7,099 (535) 544 3,843 280 7 Zala'Wad 2,416 (381) 3,618 4 Gohilwad 6,708 (557) 2.138 2,864 21 Sorath 6,861 (579) 7 3,179 3,876 38
KUTCH STATE 4,738 (540) 123 3,537 2.927 36
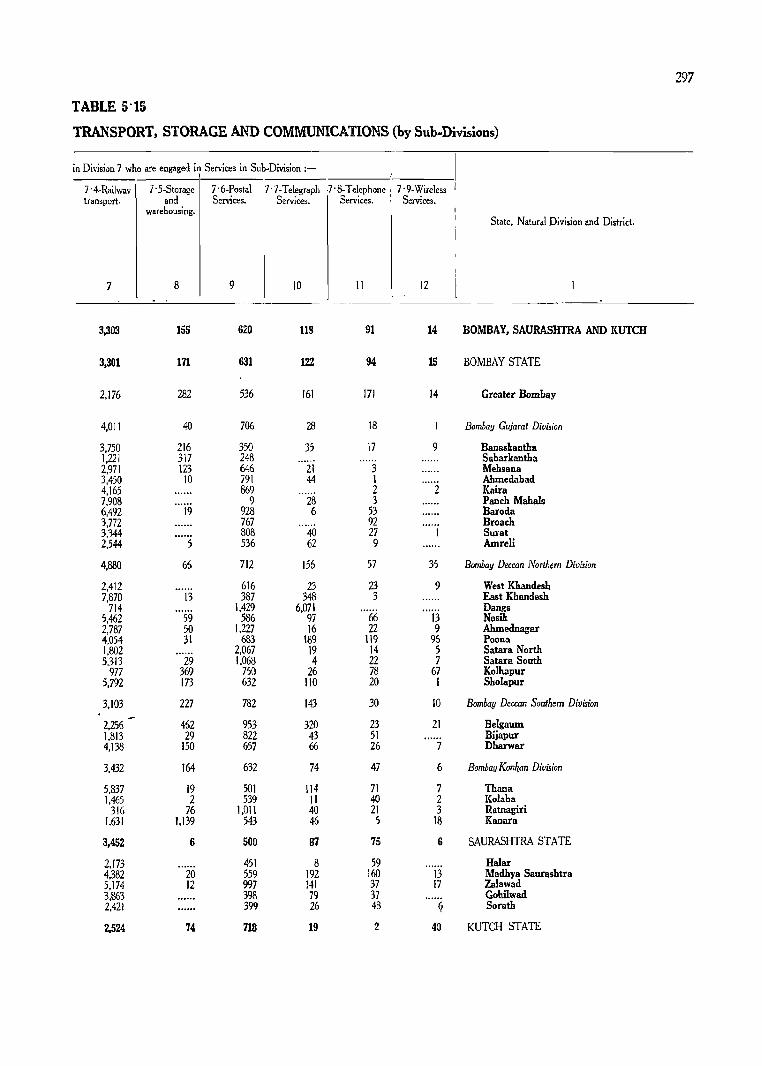
297
TABLE 5'15
TRANSPORT, STORAGE AND COMMUNICATIONS (by Sub .. Divisions)
in Division 7 who are engaged in Services in Sub-Division :-1
7 '4-Railwav 7 '5-Storage 7'6-Postal 7' 7-Telegraph .J·8-Telephone 1 7 '9-Wireless transport. and Services. Services. Services.· S~rvices.
warehousing. State, Natural Division and District.
7 8 9 10 11 12
3,303 155 620 118 91 14 BOMBAY, SAURASHTRA AND KUTCH
3,301 171 631 122 94 15 BOMBAY STATE
2,176 282 536 161 171 14 Greater Bombay
4,011 40 706 28 18 Bombay GujaTa! Division
3,750 216 350 35 17 9 Banaskantha 1,221 317 248 Sabarkantha 2,971 123 646 21 3 Mehsana 3,450 10 791 44 1 Ahmedabad 4,165 869 2 2 Kaira 7,908 9 28 3 Panch Mahals 6,492 19 928 6 53 Baroda 3,772 767 92 Broach 3,'344 808 40 27 Surat 2,544 5 536 62 9 Amreli
4,880 66 712 156 57 35 Bombay Deccan NortJ.ern Division
2,412 616 23 23 9 West Khandesh 7,870 13 387 348 3 East Khandesh
714 1.429 6,071 "'66 Dangs 5,462 59 586 97 13 Nasik 2,787 50 1,227 16 22 9 Ahmednagar 4,054 31 683 189 119 96 Poona 1,802 2,067 19 14 5 Satara North 5,313 29 1.068 4 22 7 Satara South
977 369 750 26 78 67 Kolhapur 5,792 173 632 110 20 1 Sholapur
3,103 227 782 143 30 10 Bombay Deccan Southern Division
2,256 462 953 320 23 21 Belgaum 1.813 29 822 43 51 Bijapur 4,138 150 657 66 26 7 Dharwar
3,432 164 632 74 47 6 Bombay Konkan DiVision
5,837 19 501 114 71 7 Thana 1,~5 2 539 II 40 2 Kolaba
316 76 1,011 40 21 3 Ratnagiri 1.631 1,139 543 46 5 18 Kanara
3,452 6 500 87 75 6 SAURASHTRA STATE
2.173 451 8 59 "alar 4,382 20 559 192 160 13 Madhya Saurashtra 5,174 12 997 141 37 17 Zalawad 3,863 398 79 37 Gohilwad 2,421 399 26 48 ~ Sorath
2,524 74 718 19 2 40 KUTCH STATE

298
State and Natural Di lISion.
I
SUBSIDIARY
Distribution of 10,000 self-supporting persons in States and Natural Divisions (Rural Population by Natural
Total No, of self-sup. Number of persons per 10,000 sell.supporting persons in porting persons engaged
in Services in Division 7 7'0-Transport 7'1-Transport 7'2. Transport 7'3-Transport (and their No, in & communica· by by ?y 10,000 self.supporting tions otherwise road, water. air.
persons engaged in All unclassifif'C! and Industries and Services). incidental
seTVlces.
2 3 4 I 5 6
BOMBAY, SAURASHTRA AND KUTCH 63,649 (436) 63 2,744 1,782 22
BOMBAY STATE
Greater Bombay
Bombay Gujarat Division
Bombay Deccan Northern Division
Bombay Deccan Southern Division
Bombay Konkan Division
SAURASHTRA STATE
KUTCH STATE
State and Natural Division.
1
54,570 (464) 23 2,859 1,707 23 ,
.~ ....
21,553 (463) 39' 4.137 927 37
13,880 (402) 29 1,628 203 9
2,782 (220) 3 2,926 435
16,355 (687) 2,210 4,226 19
6,405 (283) 392 1,586 2,150 25
2,674 (449) 86 3,156 2,427
SUBSIDIARY
Distribution of 10,000 self"supporting persons in States and Natural Divisions (Urban Population by Natural
Total No, of self. sup· Number of persons per 10,000 self.supporting persons in porting persons engaged in Services in Division 7 7 'd· Transport 7'1. Transport 7'2· Transport 7'3. Transport
(and their No, 10 & communica· by by by 10.000 self.supporting tions otherwise road. water. air.
persons engaged in All unclassified and Industries and Services). incidental
services.
G
I 2 3 4 5 6
I
BOMBAY, SAURASHTRA AND KUTCH 244,476 (726) 100 3,805 1,955 124
BOMBAY STATE 220,695 (721) 101 3,805 1,891 129
Greater Bombay 115,379 (932) 180 2,997 3,256 227
Bombay Gujarat Division , 34,723 (488) 46 4,662 • 511 10
Bombay Deccan Northern Division 42,117 (610) 4,767 39 21
Bombay Deccan Southern Division 12,011 (549) 6,237 8 2
Bombay Kookan Division 16,465 (806) 3,427 1,343 69
SAURASHTRA STATE 21,717 (783) 78 3,779 2,454 70
KUTCH STATE 2,064 (735) 169 4,031 3,576 82

TABLE S'lS-A
engaged in TRANSPoih. STORAGE AND COMMUNICA nONS by Sub .. Divisions Divisions only)
Division 7 who are engaged in Services in Sub-?ivision :-
7'4-Railway 7'5-Storage 7'6-Postal 7"7-Telegraph 7"8-Telephone 7'9-Wireless transport. and Services. Services. Services. Services,
warehousing. State and Natural Diviiion,
7 I
8 9 10 11 12 1 I
4,514 122 617 92 22 22 BOMBAY, SAURASHTRA AND KUTCH
4,479 142 617 106 18 26 BOMBAY STATE
Greater Bombay
4,291 56 494 16 3 Bombay Gujarat Division
6,988 81 658 298 7 99 Bombay Deccan Northern Division
4,817 694 1,049 18 47 11 Bombay Deccan Southern Division
2,539 213 670 77 44 2 Bombay K01lkan Divisio1l
5,219 556 6 66 SAURASHTRA STATE
3,553 11 767 KUTCH STATE
TABLE S'l5-B
engaged in TRANSPORT. STORAGE AND COMMUNICATIONS by Sub .. Divisions Divisions only)
Division 7 who are engaged in Services in Sub-Division :-
7"4-Railway 7'5-Storage 7'6-Postal 7'7-Telegraph 7'8-Telephone 7'9-Wireless transport· and Services. Services. Services. Services ..
warehousing. State and Natural Diviiion.
-• 7 8 9 • 10 11 12 1
I
2,988 163 621 123 109 12 BOMBAY, SAURASHTRA AND KUTCH
3,010 179 635 125 113 12 BOMBAY STATE
2,176 282 536 161 171 14 Greater Bombay
3,838 30 838 36 27 2 Bombay Gujarat Division
4,185 61 730 109 73 15 Bombay Deccan Northern Division
2,707· 119 720 111 26 10 Bombay Deccan Southern Division
4,320 115 593 72 50 11 Bombay K<J1lkan Division
2,931 8 483 111 78 8 SAURASHTRA STATE
1,192 55 654 44 5 92 KUTCH STATE
299

300
SUBSIDIARY
Distribution of 10,001) seU-supporting persons in States, Natural Divisions and Districts enffaged
Number of persons per 10,000 ielf-supportinll persons
Total No. of self- supporting persons 8' I-Medical & -
8' 2-Educational 8' 4- Police (other eng3ged in Services in Division 8 Health Services. Services and than vilI"ie
State, Natural Division & District. (and their No. m 10,000 Research. watchmen). sell-supporting persons
engaged in All Ind,'stries & Services).
1 2 3 4 5
-BOMBAY, SAURASHTRA AND
KUTCH 524,647 (1,086) 900 2,291 1,290
BOMBAY STATE 470,743 (1,111) 892 2,316 1,223
Greater Bombay 86,559 ( 700) 1.603 . 1,692 1.307
Bombay Gujarat Diviion 119,068 (1,011) 781 2,515 1,422
Banaskantho. 4,043 ( 706) 591 1,393 3,099 Sabarkantha 5,048 (1,122) 505 2,496 1,500 Mehsana 11,576 ( 805) 701 3,017 1,327 Ahmedabad 25,561 ( 712) 996 2,075 1,363 Kaira 13,902 (1,158) 903 3,696 1,132 Panch Mahals 6,924 (1,388) 631 2,419 1,712 Baroda 19,815 (1,564) 576 1,995 1,637 Broach 9,700 (1,787) 473 2,201 1,301 Surat 18,640 (1,008) 1,055 2,959 1,039 Amreli 3,859 0,067) 490 2,368 1,804
Bombay Deccan Northern Division 175,767 (1,697) 654 2,208 1,021
West Khandesh 9,822 (1,419) 559 3,200 1,187 East Khandesh 15,568 0,401) 670 3,482 1,064 Dangs 362 (2,000) 1,243 2,486 1,188 Nasik 21,m (1,754) 484 1,819 1,004 Ahmednagar 16,631 (1,768) 495 2,221 1,132 Poona 68,006 , (2,358) 581 1,345 723 Satara North 10,876 (1,616) 859 3,384 1,357 Satara South 7,&40 (1,474) 1,116 3,529 1,403 Kolhapur ... 10,763 (1,359) 806 2,668 1,504 Sholapur ... 14,160 ( 96(J) 956 2,859 1,345
Bombay Deccan Southern Division 42;458 (1,230) 804 2,964 1,304
Belgaum ... 17,063 (1,503) 724 2,528 1,290 Bijapur ... 10,141 (1,079) 712 3,275 1,547 Dharwar -... 15,254 (1,108) 953 3,244 1,158
Bombay Konkan Dioision 46,891 (1,060) 828 2,780 1.,247
Thana 18,487 ( 888) 926 2.193 1,306 Kolaba 6,970 ( 996) 715 2,834 978, Ratnagiri '" 14,933 (1,333) 761 3,496 1,152 Kanara '" 6,501 0,241) 831 2,743 1,584
SAURASHTRA STATE 47,511 ( 944) 943 2,091 1.885
Halar 6,820 (1,000) 864 1,733 1,537 Madhya Saurashtra ... 14,706 (1,108) 1,140 2.075 1,622 Zalawad 6,094 ( 962) 807 1,867 2,140 Gohilwad ... 10,791 ( 896) 899 2,11 1 1,952 Sorath 9,100 ( 767) 829 2,514 2,320
KUTCH STATE 6,393 ( 729) 1,203 1,899 1,785

301
TABLE 5'16
in HEALTH, mUCATION AND PUBLIC ADMINISTRATION (by Sub-Divisions)
in Division 8 who are engaged in Services in Sub-Division :-
8'5- Village officers B '6--Employees of Munici- 8'7-Employees of State 8'3, 8'8 & 8'9-Employees ~nd servants includ- palities & Local Bodies (but Governments (but not including of the Uniqn Government
State, Natural D~i~on and District, ingvillage not including persons persons classifiable under (but not including persons watchmen, classifiable und~r any ~ny other di\~sion classifie.ble under any
other division or or sub-division), other division or sub-sub-division), division) & Employees of
Non-Indian Govern-ments.
6 '1 8 9 I
562 1,103 2,732 1,122 BOMBAY, SAURASHTRA AND KUTCH
496 1,119 2,768 1,186 BOMBAY STATE
29 1,719 1,868 1,782 Greater Bombay
455 1,243 3,446 138 . Bomhay Gujarat Division
1,096 519 2,891 411 Banaskantha 319 331 4,489 360 Sabarkantha 448 1,303 3,137 67 Mehsana 437 2,056 3,019 :;4 Ahmedabad 600 927 2,728 14 Kaira 40 706 4,443 49 Panch Mahals
407 1,211 3,813 361 Baroda 181 324 5,520 Broach 531 1,535 2,751 130 Surat 879 803 3,480 176 AmreIi
662 833 2,804 1,818 Bombay Deccan Northern Division
1,407 1,146 2,442 59 West Khandesh 762 1,350 2,619 53 East Khandash
304 4,779 Dangs 381 427 5,806 79 Nasik 674 503 1,541 3,434 Ahmednagar 327 579 2,843 3,602 Poona
1,417 659 2,137 187 Satara North 642 954 2,087 269 Satara South
1,234 1,384 2,234 170 Kolhapur 1,073 1,937 1,233 597 Sholapur
1,045 927 2,189 767 Bombay Deccan Southern Division
973 8i2 1,855 1,758 Belga\Ul1 1,030 904 2,48B 44 Bijapur 1,137 1,006 2,363 139 Dharwar
344 942 3,099 760 Bombay Konkan Division
156 1,069 3,745 605 Thana 337 838 3,888 410 Kolaba 415 932 2,215 1,029 Ratnagiri 720 715 2,447 960 Kanara
l,t50 1,054 2,436 441 SAURASHTRA STATE
856 1,108 2,408 1,494 Halar 1,133 1,336 2,651 43 Madhya Saurashtra 1,247 612 ' 2,337 990 Zalawad 1,031 991 2,764 252 Gohilwad 1,474 927 1,787 149 Sorath
1,100 321 2,246 1,446 KUTCH STATE

302
SUBSIDIARY A
Distribution of 10,000 self"supporting persons in States and Natural Divisions engaged ill (Rural Population by Natural
Number nf persons per 10,000 self-supporting persons
Total No. 01 self- supporting persons 8' I-Medical & 8' 2-Educational 8' 4-Police (other I engaged in Services .in Division B Health Services. Services and than village watchmen).
Stale and Nat~ral Divition. (and their No. m 10,000 Research, self-supporting per.ons engaged ill All Industries -
& Services).
1 2 3 4 5
BOMBAY, SAURASHTRA AND KUTCH '
147,452 (1,009) 506 3,361 1,037
BOMBAY STATE 130,123 (1,107) 492 3,481 927
Greater Bombay .~ ... Bomhay Gu;aral Division ... 44,140 ( 949) 483 3,315 1,165
Bombay Deccan Northern Division 49.382 (1,429) 434 3,428 608
Bombay Deccan Southern Division 14,426 (1,139) 500 4,271 1,174 • Bomhay KOTlkaTl Divi.ioTl .•• 22,175 ( ~l) 631 3,416 1,004
SAURASHTRA STATE ..• 14,681 ( 649) 465 2,373 1,959
KUTCH STATE 2,648 ( 444) 1,446 2,953 1,325
SUBSIDIARY
Distribution of 10,000 self"supporting persons in States and Natural Divisions engaged in (Urban Population by Natural
Number of peTsons per 10,000 self-supporting persons
Total No. of self-supporting persons 8' I-Medical & 8' 2-Educatiolllll 8'4-Police (other engaged in Servires i!l Division 8 Health Services. Services and than village watchmen).
Slate and Natural Division. (and their No. m 10,000 Research. self-supportin!! persons engaged in Alllndu5tries
& Services).
1 2 3 4 5
BOMSAY, SAURASHTRA KUTCH
AND 371,195 (1,120) 1,054 1,872 1,389
BOMBAY STATE 340,620 (1,112) 1,044 1,871 1,336
Greater Bombay 86,559 (700) 1,603 1.692 1,307
Bombay Gujarat Divi$ion 74,928 (1,052) 957 2,044 1,572
Bombay Deccan Northern Divi$ion I 26,3B5 (1,831) 740 1,732 1,183
Bombay Deccan Southern Division 28,032 (1.282) 960 2,291 1,371
Bombay Konkan Division 24,716 (1,209) 1,005 2,209 1,465
SAURASHTRA.STATE ... 32,830 (1,184) 1,157 1,966 1,852
KUTCH STATE 3,745 (1,335) 1,031 1,154 2,109

TABLE S'16-A
HEALTH, EDUCATI6N AND PUBLIC ADMINISTRATION by Sub-Divisions Divisions only)
in Division 8 who are engaged in Services in Sub-Division :-
S'5- Village officers S'6-Employees of, Munici- 8'7-Employees of Statel 8'3, 8'8 & S'9-Employees and sm'ants includ- palities & Local Bodies (but Governments (but not includ.l "f the Union Governme nt
ing village not including persons ing persons classifiable under (but not including persons State and NaturaloDivision, watchmen. classifiable under any other division c1~ssifiable under any other
any other division or sub-division), division (lr sub-division) or sub-division), & Employees of Non-
Indian Governments, 6 7 8 9
1,632 360 2.072 1.032 BOMBAY. SAURASHTRA KUTCH
1.414 38S 2.176 1.124 BOMBAY STATE
Greater Bombay
1,022 264 3,521 230 Bombay Gujaraf Division
1,875 349 1,116 2,190 Bombay Deccan Northern Division
2,393 349 1,181 132 Bombay Deccan Southern Division
533 736 2,508 1,172 Bombay Konkan Division
3,389 198 1,222 394 SAURASHTRA STATE
2.576 8 1.635 57 KUTCH STATE
TABLE S'l6--B
HEALTH, EDUCATION AND PUBLIC ADMINISTRATION by Sub"Divisions Divisions only)
in Division 8 who are engo.ged in Services in Sub-Division :-
8'5- Village officer< 8'6-Employees of Munici- 8' 7-Employees 01 State 8'3, S'S &8'9-Employees and servants including palities & Lccal Bodies (but Governments (but not of the Union Government
village not including persons including persons classifiable (hut not including persons State and Natural Division, watchmen. classifiable under under any other division classifiable under any other
I any other division or sub-di,~sion). di,~sion or sub-divi.ion) I or sub-division). & Emplo"ees of Non-
I Indian Governments,
6 7 8 9 1 >
'" 144 1.394 2,990 1,157 BOMBAY, SAURASHTRA
KUTCH
145 1.399 2,994 1,211 BOMBAY STATE
29 1,719 1,868 1,782 Greater Bombay
120 1,820 3,403 84 Bombay GujaTat Division
188 1,021' 3,463 1,673 Bombay Deccan Northern Division
?52 1.225 2,707 1,094 Bombay Deccan Southern Division
173 1,127 3,630 391 Bombay Konkan Division
149 1,436 2.979 461 SAURASHTRA STATE
56 542 2.618 2.430 KUTCH STATE
303
AND
AND

304
SUBSIDIARY
Distribution of 10,000 self-supporting persons in States, Natural Divisions and Districts
Total No. of self-support-
I Number of persons per 1 a,OGO self-supporting persons
ing persons engaged in Services in Division 9 (end
i 9'0-Servicesother-1 9'I-Domestic ser-their No. in 10,000 self-
supporting persons engaged 9 '2-Barbers and State, Natcal Division and District. in All IndU3tries and wise unclassified. I vices (but not indud- beJuty ,hops.
Services). ing services rendered I by members of family
households to one
2 3 I m"~)
5
Bm.iBAY, SAURASHTRA AND KUfCH 1,134,gOO (2,350) 4,936 1,954 551
BOMBAY STATE ... 961,S03 (2;269) 4,553 2,169 555
Greater Bombay 261,057 (2,110) 2,366 3,328 381
Bombay GujaTal Division 293,615 (2,494) 6,274 1,380 554
Banaskantha 15,963 (2,788) 6,395 1,763 551 Sabarkantha 13,490 (2,999) 6,394 1.251 541 Mehsana 42,485 (2,954) 6,826 615 675 Ahmedabad 63,434 0,766) 5,796 1.419 530 Kaira 34,902 (2,907) 6,953 590 689 Panch Mahals 13,398 (2,687) 5,217 2,951 517 Baroda 37,585 (2,966) 6,117 1,711 456 Broach !P,121 (3,338) 6,711 1,485 418 Surat 44,179 (2.389) 5,938 1,936 484 ADlreli 10,058 (2,781) 6,937 713 699
Bombay Deccan Northern Division 220,991 (2,133) 4,425 2,107 767
West Khandesh ... 1;.544 (7,535) 5,513 1.463 891 East Khandesh ... 22,621 (2,035) 4,404 1,593 1,367 Dangs 591 (3,265) 6,497 2,098 34 Nasik 26,82:> (2,165) 4,711 2,173 762 Ahmednagar 21,691 (2,305) 4,237 2,B25 735 Poona 61.029 (2,!16) 4,010 2,557 521 Satara North 15,403 (2,289) 4,017 2,212 834 Satara South 12,314 (2,315) 4,373 1,995 665 Kolhapur 18,637 (2.353) 3,857 2,339 691 Sholapur 24,332 (1,649) 5,221 1,024 855
Bombay Deccan Southern Division 59,220 (1.715) 4,029 1,041 932
Belgaum 21.014 1,850 4,062 1,379 868 Bijapur 16,174 (1,721) 5,312 635 925 Dharwar 22,032 (1,600) 3,055 1,015 998
Bombay Konk,an Division 126,920 (2,868) 5,537 2,241 373
Thana 51,569 (2,477) 5,3e8 2,283 325 Kolaba 23,913 (3,419) 5,163 2,958 427 Rlltnagiri 38,861 (3,470) 5,974 2,13B5 389 Kanara 12,571 (2,402) 5,509 1,186 415
SAURASHTRA STATE 143,762 (2,856) 6,928 794 632
Halar 15,630 (2,292) 6,692 815 816 Madhya Saurasht~a 36,325 (2,737) 6,522 922 705 Zalawad 19,444 (3,069) 7,267 717 516 Gohilwad 36,240 (3,00B) 6,889 1,197 475 Sorath 36,123 (3,045) 7,293 293 694
KUTCH STATE 29,325 (3,345) 7,74.6 625 391

305
TABLE 5'17
engaged in SERVICES NOT ELSEWHERE SPECIFIED (by Sub-Divisions)
in Division 9 who are engaged in Services in Sub-Division :-
9' 3-Laundries 9 '4-Hotels, 9' 5-Recreat- 9'6-Legal 9'7-Arts, 9' 8--Religious, and la,;,ndry 'restaurants tion services. and business letters and Charitable and State, Natural Division & District,
services. and eating services, journalism. Welfare houses. Services.
I 6 7 8 I 9 10 II I
297 1.123 331 270 61 467 BOMBAY. SAURASHTRA AND KutCH
327 1.246 358 294 70 428 BOMBAY STATE
548 1.859 S76 580 129 233 Greater Bombay
158 773 181 93 40 547 Bombay Gujarat Division
82 362 276 65 18 488 Banaskantha 80 764 319 45 10 596 Sabarkantha 71 577 218 73 17 928 Mehsana
.281 1.464 85 95 78 252 Ahmedabad 113 592 263 III 37 652 Kaira 152 601 322 63 40 137 Panch Mahals 128 725 185 119 35 524 Baroda 153 402 88 55 28 660 Broach 182 572 ISO 124 46 568 Surat 163 487 118 86 6 791 Amreli
326 1,098 381 291 57 548 Bom6ay Deccan Nort~rn Division
227 893 285 169 21 538 West Khandesh 268 I,J08 383 212 35 630 East Khandesh 34 169 34 406 728 Dangs
211 1,041 199 187 35 681 Nasik 248 884 347 177 55 492 Ahmednagar 391 1,213 461 370 94 383 Poona 469 1,121 388 251 36 672 Satara North 409 1,165 496 281 66 550 Satara South 358 1,073 521 536 60 565 Kolhapur 337 1,193 313 313 41 703 Sholapur
572 2,063 624 281 49 409 Bombay Deccan Southern Division ,. 544 1,781 635 289 28 414 Belgaum 394 1,505 686 219 18 306 Bijapur 730 2,741 570 320 92 479 Dharwar
148 - 957 157 180 SI 356 Bombay Konkan Division
217 951 209 251 103 273 Thana 84 813 114 148 7 286 Kolaba 76 888 88 126 18 356 Ratnagiri
208 1,470 242 III 27 832 Kanata . 146 442 192 146 11 709 SAURASHTRA STATE
128 554 166 299 530 Halar 148 585 261 130 21 706 Madhya Saurashtra 57 267 187 97 10 872 Zalawad
121 311 199 74 6 728 Gohilwad 224 476 130 197 9 684 Sorath
71 449 92 92 '5 S29 KUTCH STATE MO-A Bk H 91-31

306
SUBSIDIARY
Distribution of 10,000 self-supporting persons in States and Natural Divisions {Rural Population by Natural
Total No., of self-support- Number of persons per I 0,000 self-sup~rting persOlll iog persons engaged in Services in Division 9 (and their No. in j 0.000 self. 9 'O-Services other. 9'j-Domestic ser- .9·2-&rbers ,and supporting persons engaged wise unclassified. "ices (but not includ- beauty .hopl.
State and Natural Division. in All I ndustries and illl! services rendered Services). by members of family
households to one another).
1 2 3 .. ~
BOMBAY, SAtJRASHTRA AND KUTCH 421,59P (2,885) 6,673 1,102 772
BOMBAY STATE 325,571 (P70) 8,373 1,28% 783
Greater Bomhay
Bombay Gujarat Divl!lon 149,052 (3,203) 7.302 903 665
Bombay Deccan Northern Division 76,005 (2,199) 5,427 1,224 1,245
Bomhay Deccan Southern Division 22,129 (1,748) 4,056, 652 1,458
Bomball Konkan Division 78.385 (3.292) 6,181 2.234 370
SAURASI-ITRA STATE 74,299 (3,286) 7,563 50S 817
KUTCH STATE 21,728 (3,645) 8,114 457 441
SUBSIDIARY
Distribution of 10,000 self .. supporting persons in States and Natural Division. (Urban Population by Natural
Total No. of self-support- Number of persons per 10,000 self-supporting persons ing persons engaged in
Services in Division 9 (and their No. in 10,000 self- 9 . O-Services other. 9'I-Domestic ser· 9'2-Barbers and
supporting persons engaged wise unclassified. yices (bu~ not includ- beauty shops. State and Natural Division, in All Industries and 109 sen'lces rendered
Servicea). by members 01 f.mily howeholds to one
another}.
1 2 3 • ~ ,
BOMBAY, SAURASHTRA AND KUTCH 713,292 (2,118) 3,909 2,458 436
BOMBAY STATE 636,232 (2,077) 3,621 2,622 438
Greater Bom6ay 261,057 (2,110) 2.366 3,328 381
Bomball GuJarat Divtlon 144,563 (2,031) 5,215 1,871 438
Bombay Deccan Northern Division 144,986 (2,101) 3,899 2,570 516
Bomball Deccan Southern Division 37,091 (1,697) 4,012 1,272 619
Bombay Konkan Division 1 ••• 48,535 (2,375) 4,497 2,252 378
SAURASI-ITRA STATE 69,463 (2,505) 6,247 1,102 434
KUTCH STATE 7;97 (2,707) 6,693 1,107 229

TABLE 5 '17-A (1
engaged in SERVICES NOT ELSEWHERE SPECIFIED by Sub-Divisions Divisions only)
in Division 9 who are engaged in Services in Sub-Division:-
9' 3-Laundries andla~ndry
aervltel.
6
127
159
40
363
738
83
22
11
9'4-Hotels, 9'5-Recreatrestaurants tion s~rvices. and eating
houses. !
7 8
449 2ZS
535 243
265 196
630 312
1,704 834
627 99
116 190
296 68
TABLE S'17-B
9'6-Legal I 9'7-Arts, and business I letters and
Icmees, I journalism.
9 10
47 .10
54 12
9 10
110 14
53 15
85 12
26 4
2D
9' 8-Religious. Charitable and
Welfare Services.
11
595
5S9
610
735
490
309
756
586
State and Natural Division.
1
BOMBAY, SAURASHTRA AND KUTCH
BOMBAY STATE
Greater Bomhay
Bomhay Gujarat Division
Bombay Deccan Northern Division
Bombay Deccan Southern Division
Bombay Konkan Division
SAURASHTRA STATE
KUTCH STATE
engaged in SERVICES NOT ELSEWHERE SPECIFIED by Sub-Divisions Divisions only)
in Division 9 who are engaged in Services in Sub-Division :-
9 '3-Laundries 9' 4-Hotels, 1 9'S-Reerea- 9'6-Leg.1 9'7-Arl!, 9' 8-Religious, and la~ndry restaurants tion services. and business letters and Charitable and
services. and eating services. journalism. Welfare State and Natural Division. houses. Services.
6 7 8 • 9 10 I, 11
398 1,522 393 402 91 391 BOMBAY, SAURASHTRA AND KUTCH
413 1,609 418 417 100 362 BOMBAY STATE
548 1,859 576 580 129 233 Greater Bombay
280 1,295 167 180 72 482 Bombay Gujarat Division
339 1,343 417 387 79 450 Bombay Deccan Northern Division •
473 2,277 500 418 69 360 Bombay Deccan Southern Division
253 1,489 252 332 114 433 Bombay Konkan Division
279 791 194 276 18 659 SAURASHTRA STATE
• 245 886 161 296 16 367 KUTCH STATE MO·A Bli: H 91-31a
307

30R
SUBSIDIARY •
Persons per 1,000 houses and houses per 100 square
General Population-Persons per 1,000 houses. Rural Population-Persons per 1,000 houses.
State, Natural Division and District.
~ 1951 1941 1931 1921 1951 1941 1931 1921
2 3 4 5 6 7 8 9
BOMBAY, SAURASHTRA AND KUTCH 5,610 4,681 4,913 4,783 5,534 4,564 4,805 4,626
BOMBAY STATE 5,661 4,683 4,944 4,834 5,567 4,526 4,809 4,630
Greater Bombay ... 5,832 32,269. 35,268 33,020
Bombay Gu;arat Division ..• 5,322 4,494 4,421 4,264 5,269 4,640 4,612 4,364
Banaskantha 5,217 4,490 4;1126 4,443 5,242 4,497 4,586 4,342 Sabarkantha 5,117 4,494 4,531 3,934 5,142 4,512 4,567 3,891 Mehsana 4,764 4,403 3,884 4,180 4,868 4,485 4,387 4,392 Ahmedabad 5,057 4,083 3,978 3,906 5,044 4,253 4,333 4,037 Kaira 5,022 3,986 4,046 3,865 6,271 3,993 4,028 3,652 Panch Mahals 5,394 4,991 5,139 4,766 5,482 5,330 5,693 5,054 Baroda 5,833 4,716 4,542 4,325 5,296 4,924 4,783 4,501 Broach 5,934 4,739 4,368 4,467 5,767 4,983 4,422 4,508 Surat 5,878 4,859 4,748 4,674 5,597 4,927 3,950 5,019 Amreli 5,964 5,113 4,722 4,508 5,938 5,244 4,831 4,470
B071bay Deccan Northern Division 5,867 4,478 4,961 4,873 5,779 4,479 4,957 4,883
Wesl Khandesh 6,256 5,032 5,582 5,458 6,102 5,053 5,641 4,823 East Khandesh 5,351 4,467 5,031 5,223 5,174 4,470 5,099 5,278 Dangs 5,033 4,730 5,101 4,946 5,033 4,730 5,101 4,946 Nasik 6,342 4,480 5,103 5,207 -5,966 4,500 5,083 4,949 Ahmednagar 5,894 4,255 4,902 4,587 5,668 4,253 4,909 4,616 Poona 5,438 4,358 4,709 4,721 5,476 4,245 4,772 4,731 Salara North 5,785 4,173 4,491 4,291 5,658 4,179 4,513 4,351 Satara South 6,305 4,536 4,672 _ 4,439 6,051 4,666 4,611 4,439 Kolhapur 6,515 4,876 5,268 5,063 6,429 4,855 5,174 5,134 Sholapur 5,653 4.414 5,125 4,989 5,887 4,450 .5,009 4,801
Bombay Deccan Southern Division 6,073 4,335 4,840 4,682 5,825 4,280 4,798 4,574
Belgaum 6,359 4,570 5,090 4,681 6,023 4,534 5,074 4,612 Bijapur 5,772 4,130 4,636 4,609 5,625 4,118 4,631 4,500 Dharwar 6,054 4,279 4,772 4,744 5,799 4,137 4,645 4,602
Bombay KonkanDivision ... 5,534 4,577 4,927 4,817 5,558 4,645 4,904 4,724
Thana 5,529 4,459 4,873 5,179 5,528 4,696 5,024 5,005 Kolaba 5,413 4,504 4,765 4,519 ." 5,395 4,533 4,701 4,394 Ratnagiri 5,570 4,794 5,091 4,772 • 5,525 4,777 5,027 4745 Kanara 5,647 4,310 4,787 4,706 5,619 4.245 4,565 4,656
SAURASHTRA STATE 5,376 4,769 4,797 4,501 5,470 5,019 4,903 4,611
Halar 5,459 5,652 Madhya Saurasht~' 5,446 5,561 Zalawad 5,223 5,170 Gohilwad 5,333 5,384 Sorath 5,378 5,540
KUTCH STATE 4,440 4,059 4,188 4,119 4,403 4,123 4,212 4,534
Note. -Extensive territorial changes took place durin g the past decade and the distribution of the figures of houses and population at past censuses to accord with present boundaries was difficult to effect. The figures In
some cases had to be estimated. In the basic figures for Bombay, Saurashtra and Kutch according to the censuses of 1921, 1931 and 1941
utilised in preparing this table no adjustments were made for enclave villages transfe\red from Bombay State to Hyderabad State and vice versa.
At the 1951 Census, every dwelling with a separate main entrance was treated as a house, At past censuses

TABLE 6'1
miles and comparisoJ with past censuses
Urban Population-Persons per 1,000 houses.
19S1
10
5,784
5,882
5,832
5,482
4,930 4,BI5 4,428 5,065 5,046 4,B24 8,414 6,818 7,217 6,033
6,125
7,133 5,776
7.742 7,577 5,387 6,737 7,041 6,825 5,198
6,898
7,707 6,322 6,700
5,437
5,190 5,570 6,057 5,38
5,199
5,105 5,276 5,348 5,221 5,074
4,595
1941
II
1931
12
5,095 5,347
5,217 5,518
32,269 35,268
4,061 3,767
4,399 5,099 3,914 4,045 4,143 3,632 3,940 3,480 3,958 4,115 3,221 2,930 4,124 3,797 3,888 4,102 4,615 4,115 4,740 4,341
4,475 4,980
4,91 I 5,218 4,459 4;827
4.375 5,214 4,274 4,835 4,702 4,532 4,118 4,299 3,992 4,997 4,975 5,842 4,329 5,482
4,601 5,033
4,842 '- 5,203 4,189 4,667 4,746 5,150
4,163 5,lI 1
3,840 4,296 4,189 5,6" 5,119 6,235 4,662 6,340
4,239 4,516
3.794 4.075
1921
13
5,455
5,767
33,020
3,892
6,159 4,688 3,400 3,732 4,993 3,202 3,748 4,281 3,594 4,639
4,825
4,952 5,047
4,949 4,386 4,694 3,798 4,440 4,666 5,629
5,279
5,300 5,325 5,246
5,809
6,433 6,493 5,206 4,992'
4,191
• 2,812
1951
14
4,845
5,699
438,619
6,462
3,266 4,698 7,164 9,446
12,631 6,083 6,898 4,087 6,912 3,255
4,668
3,398 6,063 1,428 3,736 3,626 5,952 5,037 4,619 6,837 4,686
4,439
4,916 3,665 4,905
5,394
7,048 6,186 6,122 2,309
3,588
2,705 4,120 2,146 4,092 4,898
764
Houses per roo square miles,
1941
IS
5,041
5,598
153,903
6,413
2,956 4,481 6,510 9,204 13,190 5,500 7,365 4,646 7,120 3,550
4,981
3,369 6,464 1,293 4,161 4,039 5,607 6,011 5,228 7.499 4,931
5,299
5,844 4.299 5,942
5,748
7,025 6,585 6,760 2,577
3,539
U58
1931
16
4,149
4,587
109,767
5,424
2,491 3,794 5,982 6.908
10,921 4,642 6,422 4,218 6,017 3,189
3,941
2,570 5,213
993 3,275 3,033 4,494 4,933 4.418 6,065 3696
4,245
4,604 3,410 4,884
4,899
5,524 I 5.846
6,003 2,198
2,915
1,451
1921
17
3,767
4,153
118,707
5,012
2,402 3,682 5,466 6,274
10,509 4,206 5,796 3,642 5,578 2,937
3,397
2,185 4,480
742 2,680 2,400 3,883
• 4,537 3,919 5,519 3,230
3,996
4,406 3,143 4,606
4,509
4,661 5,523 5,684 2,150
2,676
1.390
309
State, Natural Division and District.
BOMBAY, SAURASHTRA AND KUTCH
BOMBAY STATE
Greater Bombav
Bombay GujaTat Division
Banaskantha Sabarkantha Mehsana Ahmedabad Kaira Panch Mahals Baroda Broach Surat Amreli
Bombay Deccan Northern Division
West Khandesh East Khandesh Dangs Nasik Ahmednagar Poona Satara North Satara South Koihapur Sholapur
Bombay Deccan Southern Division
Belgaum Bijapur Dharwar
Bombay Kan~an Divisio"
Thana Kolaba Ratnagiri Kanara
SAURASHTRA STATE
Halar Madhya Saurashtra Zalawad Gohilwad Sorath
KUTCH STATE
however the practice was followed in Bombay City of numbering only main buildings separately assessed to municipal taxation, and not the dwelling houses comprised therein. There is thus a great disparity between the 1951 figure of houses in Greater Bombay and the 1921. 1931 and 1941 figures.
In the case of Kutch, the number of houses per 100 square miles is shown as 764 in 1951. In 1941 it was 1,458. The disparity between the 1951 figure and the figures for earlier censuses i3 due to the fact that the 1951 figure was worked out for the entire area of Kutch including the Rannof Kutch, while for 1941 and earlier censuses the figures were worked out for the area of Kutch exclusive of the Rann area.

310
SUBSIDIARY ., Number of households per 1,000 houses and distribution
RURAL.
Small
State, Natural ::>ivision and District. Households Household Population.
3 members or less. per 1,000 Houses. Person,. Males. Females. Number. Persona.
I 2 3 4 5 6 7
BOMBAY, SAURASlITRA AND KUTCH 1,094 5,009 2,525 2,484 309 699
BOMBAY STATE 1,093 5,020 2,528 2,492 308 700
Greater Bombay ...
Bombay Gujarat Division 1,054 4,936 .2,520 2,416 313 709
Banaskantha 1,032 5,083 2,599 2,484 290 707 Sabarkantha 1.045 4,773 2,437 2.336 313 695 Mehsana 1,009 4,816 2,4\7 2,399 310 701 Ahmedabad 1,077 4,583 2,357 2,226 355 789 Kaira 1,067 4,671 2,444 2,227 354 78D Panch Mahals 1,029 5,311 2,727 2,584 259 606 Baroda 1,040 5,021 2,609 2,412 324 753 Broach 1,109 4,954 2,548 2,406 297 622 Surat 1,083 5,108 2,530 2,578 310 714 Amreli 1,102 5,353 2,755 2,598 240 543
Bombay Deccan Northern Division 1,110 5,111 2,577 2,534 291 670
West Khandesh 1,059 5,602 2,824 2,778 252 588 East Khandesh 1,079 4,79\ 2,410 2,381 295 754 Dangs 1,041 5,089 2,675 2,414 292 773 Nasik 1,134 5,\41 2,606 2,535 287 636 Ahmednagar 1,078 5,298 2,687 2,611 265 682 Poona 1,061 5,082 2,558 2,524 280 680 Satara North 1.125 4,715 2,298 2,417 350 7\6 Satara South 1,134 5.329 2.715 2,614 283 613 Kolhapur 1,220 5,091 2,570 2,521 290 621 Sholapur 1,141 5,135 2,626 2,509 305 688
Bombay Deccan Southern Division 1,125 5,117 2,609 2,508 313 684
Belgaum 1,151 5,212 2,673 2,539 304 668 Bijapur 1,102 5,070 2,567 2,503 318 ~~} Dharwar 1,119 5,050 2,575 2,475 320
Bombay Konkan Division 1,119 4,914 2,357 2,557 330 765
Thana 1,099 5,052 2,602 2,450 248 710 Kolaba 1,129 4,821 2,357 2,464 370 839 Ratnagiri 1,123 4,898 2,193 2,705 346 752 Kanara 1,134 4,852 2,449 2,403 375 799
SAURASHTRA STATE 1,020 5,077 2,610 2,467 296 639
Halar 1,019 5,541 2,789 2,752 239 555 Madhya Saurashtra 1,018 5,218 2,653 2,565 290 641 Zalawad 1,013 4,521 2,338 2,183 364 716 Gohilwad 1,031 5,050 2,620 2,430 293 632 Sorath 1,013 5,026 2,613 2,413 298 650
KUTCH STATE 1,011 4,099 1,966 2,133 443 935

311
TABLE 6'2
by size of 1,000 Sample"Households of Rural and Urban Population
RURAL.
Medium Large Very Large
4-6 members. ) 7-9 members. 1 0 members or more. , State, Natural DiTision and District. ~
Number. Persons. Number. Persons. Number, Persons.
8 9 10 II 12 13 I
446 ,2,183 18~ 1.~1~ 61 713 BOMBAY. SAURASHTRA AND IWTCH
447 2,185 183 1.408 62 727 BOMBAY STATE
Greater Bombay
460 2,300 183 1.419 44 508 Bombav Gujaral Divi~ion
481 2,432 193 1.545 36 399 Banaskantha 470 2.310 180 1.349 37 419 Sabarkantha 475 2,361 184 1,417 31 337 Mehsana 449 2,196 164 1,243 32 355 Abmedabad 454 2,285 163 1,267 29 339 Kaira 467 2.337 211 1.647 63 721 Panch Mahal. 447 2,265 177 1,375 52 628 Baroda 456 2,226 190 1,447 57 659 Broach 451 2,273 184 1,458 55 663 Surat , 465 2,305 219 1.645 76 860 AmreJi
448 2,144 188 1.437 73 860 Bombav Deccan Northern Divj~ion
453 2,270 201 \,624 94 1,120 West Khandesh 504 2,251 159 1,238 42 548 East Khandesh 497 2,485 156 1.224 55 607 Danga 440 2,\65 186 1.421 87 919 Nauik 443 2,028 194 1.510 98 1.078 Ahmedlllllar 453 2,\52 188 1,369 79 881 . Poona 417 1,987 18S 1,355 48 657 Satara North 431 2,145 203 1,565 83 1,006 Satara South 442 2,168 197 1,507 71 795 Kolhapur 440 2,160 187 1.448 68 839 Sholapur
42, 2,091 190 1,458 72 884 Bombay Deccan Southern Division
419 2,071 201 1,543 76 930 Belgaum 430 2,134 185 1,415 67 820 Bijapur 426 2,072 182 1,398 72 893 Dharwar
364 2.105 167 1.271 67 773 Bombav Konkan Division
478 2.099 191 1,367 83 B76 Thana 435 ' 2.269 142 1.143 53 570 Kolaba 420 2.064 169 1.291 65 791 Ratnagiri _ 397 1.939 160 1.230 68 BB4 Kanara
442 2.191 204 1,570 58 677 SAURASHTRA STATE
447 2.296 235 1,839 79 851 Kalar 434 2.153 2\3 1.642 63 782 Madhya Saura.btra 439 2.183 164 1.247 33 .375 Zalawad 442 2.162 203 1,533 62 723 Gohilwad 447 2.201 203 1,574 52 601 Sorath
417 2,019 119 909 21 236 KUTCH STATE

312
SUBSIDIARY
Number of households per 1,000 houses and distribution
URBAN.
Small Household Population.
State, Natural pivision and District. Households 3 members or less. per 1,000 Houses. Persons. Males. Females. Number. Personl.
14 15 16 17 18 19
BOMBAY, SAURASHTRA AND KUTCH 1,179 4,707 2,546 2,161 383 815
BOMBAY STATE 1,199 4;711 2,571 2,140 384 821
Greater Bombay ... 1.168 4.727 2.931 1.796 401 816
Bom6ay Gujaral Division ... 1,189 4,472 2,368 2,104 416 890
Banaskantha 1,075 4,210 2,242 1.96B 45B 969 Sabarkantha 1,104 4,202 2,232 1,970 471 897 Mehsana 1,01B 4,304 2,159 2,145 424 886 Ahmedabad 1,125 4,348 2,398 1,950 436 929 Kaira 1,107 4,470 2,346 2,124 401 B38 Panch Mahala 1,05B 4,389 2,305 2,OB4 425 B94 Baroda 1,801 4,504 2,401 2,103 391 799 Broach 1,43B 4,537 2,339 2,19B 4Q9 87B Surat 1,391 4,989 2,547 2,442 394 947 Amreli 1,272 4,841 2,447 2,394 350 744
Bombay Deccan Northern Division 1,224 4,797 2,473 2,324 354 i84
West Khandesh 1,369 4;966 2,566 2,400 267 744 East Khandesh 1,181 4,886 2,516 2,370 323 763 Dangs
4,947 Nasik 1,512 2,542 2,405 335 857 ,Ahmednagar 1,427 4,926 2,500 2,426 341 794 Poona 1,081 4,429 2,312 2,117 404 824 Satara North 1,345 4,695 2,420 2,275 391 734 Satara South 1.343 5,161 2,653 2,50B 325 691
'Kolhapur 1,340 5,170 2,635 2,535 343 769 Sholapur 1,113 4.746 2.442 2.304 363 774
Bombay Deccan Southern Division 1.310 5,157 2,640 2,517 334 729
Belgaum 1,477 5,182 2,664 2,5IB 334 741 Bijapur 1,205 ·5,087 2,579 2,50B 333 737 Dhanvar 1,26/) 5.184 2,661 2,523 334 7t4
Bombay Konkan Division 1,127 4,620 2,404 2,216' 393 851
Thana 1,114 4.452 2.408 2,044 415 906 Kolaba 1,015 4,909 2,54B 2,361 323 708 Ratnagiri 1,250 4,799 2,299 2,500 371 763 Kanara I,J46 4,955 2,405 2,550 368 816
SAURASHTRA STATE 1.052 4,706 2.375 2,33f 3SS 753
Halar 1,046 4,796 2,398 2,398 323 647 Madhya Saurashtra 1,040 4,663 2,349 2,314 383 841 Zalawad 1,104 4,490 2,251 2,239 380 791 Gohilwad J,062 4,743 2,443 2,300 358 768 Sorath 1,036 4,765 2,380 2,335 339 683
KUTCH STATE 1,001 4,287 2,062 2.225 440 952

313
TABLE 6'2
by size of 1,000 Sampl..1 Households of Rural and Urban Population
URBAN.
Medium Large Very Large
4-6 members. 7.9 members. 10 members or more. State, Natural Division and District.
Number. Persons. Number. Persons. Number. Persons.
20 21 22 23 24 25 1 I
399 1,942 159 1,238 59 712 BOMBAY, SAURASHTRA AND KUTCH
396 1,923 159 1,233 61 734 BOMBAY STATE
363 1,749 161 1,254 75 908 Greater Bombay
399 1,969 142 1,095 43 518 Bombay Gujarat Division
399 2,000 105 811 38 430 Banaskantha 368 1,857 143 1,147 18 301 Sabarkantha 401 1,977 147 . 1,136 28 305 Mehsana 396 1,958 127 979 41 4B2 Ahmedabad 412 2,046 152 1,178 35 40B Kaira 387 1,892 144 1,115 44 4BB Panch Mahals 428 2,114 133 1,029 48 562 Baroda 392 1.952 159 1,229 40 478 Broach 375 1,790 160 1,240 71 1,012 Surat 414 2,083 189 1,444 47 570 Amreli
422 2,002 162 1,279 62 732 Bombay Deccan Northern Division
487 2,141 177 1,310 69 771 West Khandesh 464 2,194 167 1,314 46 615 East Khandesh
420 1,985 170 1,289 75 816 Dangs Nasik
432 1,988 159 1,375 68 769 Ahmednagar 404 1,870 139 1,114 53 621 Poona 374 1,852 169 1,339 66 770 Satara North 403 1,983 194 1,512 78 969 Satara South 403 2,086 187 1,509 67 806 Kolliapur 417 2,011 155 1,191 65 770 Sholapur
394 1,958 191 1,485 81 985 Bombay Deccan Southern Division
390 1,931 191 1.483 85 1,027 Belgaum 407 2,021 188 1,461 72 868 Bijapur 388 1,940 19i 1,503 85 1,027 Dharwar
402 1,982 152 1,162 53 625 Bambay Konkan Division
402 1,984 141 1,069 42 493 Thana 429 2,054 183 1,394 65 753 Kolaba 393 1,920 165 1,259 71 857 Ratnagiri 395 1,991 169 1,296 68 852 Kanara
425 2,091 169 1,297 48 565 SAURASHTRA STATE
4411 2,259 178 1,334 51 556 Halar 415 2,050 156 1,200 46 572 Madhya Saurashtra 432 2,129 159 1,246 29 324 Zalawad 414 2,035 178 1,373 50 567 Gohilwad 430 2,080 176 1,331 55 671 Sorath
413 2,013 129 1,073 18 249 KUTCH STATE

314
SUBSIDIARY TABLE 6'3
Family Composition of 1,000 Households of the General PopulatiOn
Sample Households Heada of house- Sons of Daughters Other male Otherlemale Population.· holds and their wives. heads of of heads of relations to relations to
State, Natural Division and District. house- house- heads of heads of Persons. Males. Females. holds. hold •. household •. households.
t"1 2 3 4 5 6 7 8 9 10
-
BOMBAY, SAURASHTRA AND KUTCH .,. 4,908 2,532 2,376 887 810 1,097 848 493 700
BOMBAY STATE 4,911 2,542 2,315 886 808 1,087 835 510 713
Greater Bombay ... 4,727 2,931 1,796 945 633 776 626 748 462
Bombay Gujarat Division ... 4,804 2,477 2,327 911 818 1,136 894 418 612
Banaskantha 5,000 2,565 2,435 945 849 1,245 981 370 597 Sabllrkantha 4,724 2,419 Z,30S 872 799 1,137 964 357 540 Mehsana 4,690 2,353 2,337 878 825 1,132 949 328 560 Ahmedabad 4,440 2,382 2,058 922 783 996 774 458 SOD Kaira 4,611 2,415 2,196 916 806 1,152 851 342 539 Panch Mahals 5,177 2,666 2.511 953 851 1,246 939 466 721 Baroda 4,873 2,550 2.323 943 816 1,141 841 454 666 Broach 4,866 2.504 2.362 896 804 1,152 899 434 655 Surat 5,082 . 2.534 254B BBS B4S 1,132 944 S02 752 Amreli 5,195 2,660 2,535 885 815 1,266 985 498 735
Bombal/ Deccan Northern Div~iQn ... 5,021 2,547 2,474 880 840 1,134 830 511 785
West Khandesh ... 5,475 2,773 2,702 935 885 1,257 967 S58 840 East Khandesh 4,822 2,44S 2,377 904 841 1,102 820 430 697 Dangs 5,089 2,675 2,414 989 896 1,196 985 429 528 Nasik 5,091 2,589 2,502 906 871 1,141 817 530 791 Ahmednagar 5,235 2,655 2,580 903 867 1,192 817 546 887 Poona 4,781 2,44S 2,336 861 809 1,037 774 S19 738 Satara North 4,712 2,316 2,396 788 808 10S1 777 474 808 Satara South 5,278 2,696 2,5S2 B64 834 1,225 866 539 82B Kolhapur 5,110 2,586 2524 868 822 1,162 881 523 794 Sholaput 5,003 2,564 2,439 892 838 1,138 822 510 758
Bombal/ Deccan Soufhern Division 5,127 2,617 2510 87G 792 1,\30 863 576 825
Belgaum 5,205 2,671 2,534 881 810 1,200 881 548 805 Bijapur 5,074 2,570 2,504 862 797 1,097 846 566 843 Dharwar 5,092 2,602 2,490 865 767 1.083 858 617 832
Bombal/ KQnk,an Division 4,B53 2,367 2,486 817 82B 1,001 80B 517 832
Thana 4,81B 2,526 2,292 920 826 1,035 7S7 529 674 Kolaha 4,830 2,377 2,4S3 856 8S9 1,072 839 447 750 Ratnagiri 4,889 2,202 2,687 703 826 943 814 SI7 1,014 Kanara 4,878 2,43B 2,440 829 792 971 793 610 833
SAURASHTRA STATE 4,941 2,524 2,417 909 823 1,224 971 379 612
Halar 5,268 2,645 2,623 921 849 1,320 1,065 404 708 Madhya Saurashtra 4,897 2,526 2,461 912 837 1,229 1,020 3B1 599 Zalawad 4,511 2.310 2,201 879 798 1,104 899 315 497 Gohilwad 4,944 2559 2,385 919 827 \,247 952 374 599 Sorath 4,930 2,528 2,402 903 802 1,202 9S1 400 644
KUTCH STATE 4,135 1,985 2,150 807 835 895 787 277 522

315'-
SUBSIDIARY TABLE 6'4
Females per r,OOO males (General, Rural and Urban Population) ; and comparison with previous censuses
I. General Population. Rural Population. Urban Population.
State, Natural Division and District.
1951 1941 1931 1921 1951 1941 1931 1921 1951 1941~ 1931 1921
2 3 4 5 6 7 8 9 10 II 12 13
BOMBAY, SAURASHTRA AND KUTCH ... 938 941 941 941 987 977 973 977 838 833 835 821
BOMBAY STATE 932 935 936 935 988 977 973 978 818 811 813 796
Greater Bombay '" 596 599 571 541 596 599 571 541
Bombay Gujarat Division ... 937 924 930 929 957 946 938 939 879 854 899 890
Banaskantha ,,, 950 946 930 915 952 948 936 924 924 914 869 818 Sabarkantha 973 967 964 994 977 972 962 989 920 900 986 1,076 Mehsana ,,, 993 972 973 955 994 978 967 946 988 949 1.002 999 Ahmedabad 849 824 889 863 942 922 904 912 789 745 868 799 Kaira 912 896 875 872 914 892 870 866 907 909 893 895 Panch Mahals 935 938 931 951 938 938 936 950 916 939 892 961 Baroda 914 893 902 903 925 918 921 917 878 833 828 . 852 Broach 944 932 920 943 947 937 930 951 932 909 868 904 Surat 991 979 984 990 1,005 994 996 1,003 940 923 927 937 Amreli 971 952 955 941 965 956 952 940 984 940 969 946
Bombay Deccan Northern Division 968 966 J62 966 986 979 976 979 917 912 B99 909
West Khandesh 972 969 970 976 97B 972 976 976 943 949 930 974 East Khandesh 971 970 968 971 984 982 982 9Bl 944 938 927 939 Dangs 877 848 848 888 877 848 848 888 Nasik 956 953 963 960 974 964 970 974 907 895 926 896 Ahmednagar 971 969 971 978 980 973 979 990 921 934 908 902 Poona 939 948 952 911 994 991 993 997 870 840 841 849 Satara North ... 1,051 1,035 1,006 1,030 1,066 1,044 \,0\5 1.039 965 959 923 949 Satara South 968 954 950 942 975 954 956 943 951 953 922 935 Kolbapur 969 970 952 945 982 984 966 952 927 906 875 904 Sholapur 945 942 934 943 951 947 944 950 932 930 908 923
Bombay Deccan Southern Division 964 953 959 961 968 955 966 966 954 941 925 939
Belgaum 957 947 952 957 962 952 962 961 943 912 887 923 Bijapur 979 963 973 %6 979 964 977 967 979 958 953 959 Dharwar 958 950 953 962 964 951 962 970 946 946 930 937
Bombay Konk_an Division ... ... 1,047 1.049 1.031 1.057 1.083 1.062 1.041 1,065 912 927 927 975 ~ • Thana 907 939 935 937 951 956 952 945 829 821 794 852 Kolaba ... 1,040 1,036 1,009 1,028 1,052 1,045 1,021 1,035 945 941 891 948 Ratnagm ... 1:224 1,158 1,129 1,187 1,239 1,167 1,136 1,195 1,094 1,018 1,028 1,066 Kanara 967 965 952 968 942 959 940 955 1,054 995 1.013 1,040
SAURASHTRA STATE 975 966 966 966 963 961 959 955 999 978 988 1,001
Halar <989 991 994 935 986 986 985 972 995 1,005 1,024 1,043 Madhya Saurashtra 986 977 974 984 971 971 964 969 1,011 993 1,003 1,031 Zalawad 959 959 965 959 939 950 956 958 1,006 984 994 962 Gohilwad 959 947 948 944 954 948 949 938 969 944 947 960 Sorath 981 962 960 962 966 955 949 945 1,013 980 992 1,014
KUTCH STATE ... 1,079 1,095 1,066 1,059 1,085 1,094 1,064 1,047 1,057 1,0.98 1,076 1,122
Note.-In Bombay, Saurashtra and Kutch and also in Bombay State, the number of females per 1,000 males showed a slight increase in both the urban and rural areas considel ed separately between 1941 and 1951 while in the General Population there has been a decrease in the proportion of females. This result, though peculiar, is real.

316
SUBSIDIARY
Females per 1,000 males in
All Agricultural Classes. ) I-Cultivators of land wholly or mainly I I-Cultivators ofland
--I owned and their dependants. unowned and
State, Natural Divisi?n and District. Self- Non- Earning Self- Non- Earning Self-Total. supporting earning depen- Total. supporting earning depen- Total. supporting
persons. depen- dants. persons. depen- dants. persons. dants. dants.
2 3 4 5 6 7 8 9 10 II
BOMBAY, SAURASHTRA AND KUTCH 992 154 1,329 2,752 989 115 1,332 2,732 978 109
BOMBAY STATE 995 161 1,335 2,749 991 120 1,339 2,719 982 114
Greater Bombay ·831 21B 1,500 624 803 117 1,406 855 855 306
Bombay Gujarat Division 960 114 1,287 2,823 955 74 1.277 2,841 931 52
Banaskantba 948 123 1,129 3,752 952 150 1,128 3,676 936 34 Sabarkantha 965 70 1,064 3,327 967 43 1,033 3,354 945 51 Mehsana 986 106 1.263 4,222 967 37 1.226 4,312 94B 60 Ahmedabad 946 118 1,394 2,237 929 57 1,454 2,012 911 52 Kaira 923 95 1,356 2,263 913 55 1,354 2,266 B93 56 Panch Mahals 948 105 1,066 3,125 954 113 1,060 3,157 938 44 Baroda 941 102 1,41B 2,37B 942 38 1,459 2,071 91B 50 Broach 961 110 1,363 2,01(0 961 61 1,381 2,004 939 44 Surat 1,009 167 1,413 2,579 1,004 114 1,478 2,290 972 74 AmreIi 959 127 1,407 2,671 980 35 1,448 2,350 922 28
Bombay Deccan Northern Division 997 146 1,350 2,656 999 117 1,353 2,663 933 64
West Khandesh 988 163 1,3281 2,562 992 168 1,348 2,454 928 66 East Khandesh 993 150 1,415 2,737 1,000 97 1,454 2,685 940 48 Dangs 913 21 1,278 2,810 919 19 1,284 2,822 701 67 Nasik 980 8B 1,319 2,573 977 51 1,334 2,497 942 48 Abmednagar ... 993 120 1,349 2,293 991 90 1.345 2,349 977 76 Poona 1,021 174 1,301 2,976 1,021 140 1,286 3,065 ·944 103 Satara North ... 1,080 198 1,319 3,291 1,071 160 1,305 3,357 971 106 Satara South ... 982 135 1,374 2,260 983 112 1,381 2,227 907 59 Kolhapur 985 153 1,361 3,124 989 147 1,350 3,146 938 64 Sholapur 960 141 1.386 2,368 955 95 1,407 2.296 895 43
Bombay Deccan Southern Division 982 230 1,406 2.220 972 168 1,419 2.253 924 110
BeJgaum 973 171 1,408 2,341 970 12f1 1,413 2,331 931 [1 Bijapur 993 253 1,377 2,123 978 196 1,387 2,158 913 142 Dharwar 946 278 1.431 2,177 970 189 1,463 2,262 922 145
Bombay Konkan Division 1.092 232 1,332 3,606 1.124 229 1,383 3,410 1,067 185
Thana 989 136 1,174 3,302 993 108 1.192 3,001 985 94 Kolaba 1,073 268 1,188 4,537 1,095 308 1,204 4,121 1.058 232 Ratnagiri 1,226 301 1,481 3,885 1,228 '283 1,515 3,756 1,210 261 Kanara 952 209 1,466 2,395 959 118 1.563 1,998 936 133
SAURASHTRA STATE 956 76 1,234 2,739 962 59 1,232 2,796 939 53
Halar 966 53 1,254 2,751 968 34 1,246 2.802 959 45 Madhya Saurashtra 958 83 1,238 2,584 974 74 1,234 2,595 940 60 Zalawad 943 84 1,273 2,264 931 69 1,296 '2,263 930 50 Gohilwad 945 102 1,229 2,284 944 81 1,234 2.378 921 85 Sorath 964 59 1,208 3.833 974 41 1.201 3,716 959 29
KUTCH STATE 1,042 213 1,468 3,200 1,039 190 1,445 3,376 989 119

317
TABLE 6'5 1
Agricultural Classes and Sub"Classes
wholly or mainly III-Cultivating labourers and their IV-Nan-cultivating owners of land; their dependants. dependants. agricultural rent receivers and their
dependants.
Non- Earning Self- Non- Earning Self- Non- Earning State, Natural Divisi~n and District, earning depen- Total. supporting earning depen- Total. supporting earmng depen-depen- dants. persons. depen- dants. persons. depen- dants. dants. dants. dants,
12 13 14 15 16 17 18 19 20 21 1
1,280 2,980 977 293 1,294 2,693 1,213 553 1,614 1,814 BOMBAY, SAURASHTRA AND KUTCH
1,295 3,003 982 298 1,296 2,707 1,217 582 1,587 1,9D2 BOMBAY STATE
1.308 972 749 191 1.665 302 892 287 1.639 343 Greater Bombay
1,266 2,757 955 249 1,275 2,972 (,256 707 1,616 1,575 Bombay Gujarat Division
1,086 4.015 769 161 1,229 3,070 1,279 627 1.735 1,909 Banaskantha 1,261 2,725 728 122 1.350 3,153 . 1,638 1,326 1,707 2,881 Sabarkantha 1.324 3,793 952 303 1,292 3,765 1,394 860 1,622 3,581 Mehsana 1,278 2,506 963 243 1.271 2,546 1,200 585 1,618 1.662 Ahmedabad 1,332 2,407 927 228 1,279 2,434 1,191 636 1,608 708 Kaira 1,060 3,132 800 98 1,103 2,432 1,220 531 1,669 1,643 Panch MahaIs 1,405 2,382 922 232 1,226 4,040 1,13') 504 1,631 1,3')9 Baroda 1,386 1,787 959 191 1,279 2,211 1,141 493 1,640 1,141 Broach 1,301 2,631 1.046 331 1,308 3,318 1,283 569 1,775 1,223 Surat 1,535 1,501 853 212 1,265 4,651 1,246 2,640 726 351 Amreli
1,352 2,625 977 234 1.297 2,656 1,217 583 1,529 2,390 Bomhay Deccan Northern Division
1,278 2,535 985 158 1,266 2,797 1,154 466 1,518 2,239 West Khandesh 1,388 2,450 979 252 1.310 2,897 1.129 510 1,522 1,464 East Khandesh 1,786 889 . 757 89 1,024 4,692 600 750 Dangs 1,426 3,260 980 211 1,199 2,731 1.166 429 1,478 3,143 Nasik 1,427 2,071 968 190 1,332 2,075 1,190 534 1,456 2,558 . Ahmednagar 1,331 2,716 953 315 1,361 2,271 1,290 751 1,502 2,973 Poona 1,313 2,812 1,074 435 1,363 2,601 1,347 795 1,532 2,859 Satara North 1,355 2,179 970 273 1,255 2,815 1,191 593 1,556 1,683 Satara South 1,310 3,220 987 281 1,424 2,967 1,201 477 1,695 1,184 Kolhapur 1,410 1,925 958 231 1,288 2,800 1,148 492 1,511 2,053 Sholapur
1,394 2,037 1,020 441 1,334 2,320 1,150 459 1,536 1,904 Bombay Deccan Southern Division :. ~
1,389 2,366 993 374 1,347 2,466 1,173 489 1,583 1,644 Belgaum 1,341 1,797 1,053 440 1,332 2,201 1,134 425 1,500 2,021 Bijapur 1,440 1,684 1,01} 486 1,326 2,351 1,138 454 1,516 2,050 Dharwar
1,264 3,866 1,015 420 1,265 3,479 1.265 462 1,772 1,011 Bombay Konkan Division
1,12S 3,524 984 293 1,222 3,653 1,060 310 1,601 992 Thana 1,142 4,83S 982 339 1,233 5,466 1,284 410 1,771 838 Kolaba 1.414 4,156 1,262 789 1,353 3,433 1,424 627 1,904 1,638 Ratnagiri 1,419 2,701 919 ~29 1,315 2,280 1,192 413 1,719 531 Kanara
1,115 2,832 862 166 1,229 2,430 1,150 286 1,831 1,106 SAUR~SHTRA STATE
1,063 3,437 818 189 1,309 1,742 1,161 300 2,(Xl4 681 Halar 1,143 2,774 724 135 1,218 2,195 1.181 326 1,803 1,053 Madhya Saurashtra 1,147 2,388 934 162 1,248 2,066 1,169 314 1,811 1,244 Zalawad 1,094 2,134 943 185 1,196 2,274 1,068 210 1,7\9 1,169 Gohilwad 1,099 4,509 824 164 1,259 3,988 1,260 350 1,979 1,608 Sorath
1.411 2,755 1,058 496 1,507 3,504 1,460 586 2,161 2,423 KUTCH STATE

318
SUBSIDIARY
Females per 1,000 males in
Non-Agricultural Classes. V -Production other than cultivation.
I VI-Com
-State. Natural !)Wision and Diatrict. Self-sup- Non-earn- Earning Self-SJlP- Non-earn- Earning Self-
Total. porting ing depen- d~pend- Total. porting ing depen- depen- Total. supporting persons. dant,. dants. persons. danls. danls. persons.
I Z 3 4 5 6 7 8 9 10 II
BOMBAY, SAURASIITRA AND KUTCH
863 123 1,628 1,4911 834 82 1,6<15 1,69D 873 77
BOMBAY STATE ... .... I 839 119 1,618 1,507 814 83 1.645 1,689 846 79
Greater Bombay 595 85 1.634 488 547 63 1.747 525 653 50
Bombay Gujaral Division 900 129 1,614 1.507 856 73 1.645 1.551 915 69
Banaskantha ... 954 157 1.600 2,148 925 104 1,4M 2,759 945 77 Sabarkantha 995 150 1,606 2,244 988 85 1.545 2,584 963 60 Mehsana 1,003 163 15M 2.7\6 9% BI \559 3.03B 1.007 105 Ahmedabad ... 811 102 1,644 819 760 59 1.713 723 859 70 Kaira 886 123 1548 1,237 853 74 1,590 1,331 909 52 Panch Mahals ... 869 96 1,570 1,543 825 85 I,4B3 I,B04 921 29 Baroda 86[1 120 1,633 1,464 839 66 1,733 I,3B5 883 63 Broach 903 140 1,54B 1,527 873 93 1,584 1,307 899 71 Surat 959 155 1,63B 1,'i46 927 86 1,660 1,551 931 69 Amreli 9M 140 1,70B 1,306 952 92 1,741 1,507 990 55
Bombay Deccan Northern Divi$ion 905 121 1,61B 1,572 915 87 1.632 1,775 924 97
West Khandesh 919 124 1.618 1.513 904 113 1,616 1,497 923 107 East Khandesh 920 % 1,65B 1558 923 61 1,634 1,771 926 64 Dangs 595 31 1,433 1.843 746 27 1,272 2,979 547 19 Nasik 909 lOB 1,515 1,712 941 78 1592 1,979 937 99 Ahmednagar ... 914 113 1,532 1,526 920 77 1,611 1,6T9 930 75 Poona 856 133 1,6B2 1,395 890 99 1,798 1,552 893 108 Satara North ... 960 142 1,549 2.161 959 85 1,495 2,314 954 110 Satara South ... 916 133 1,537 I,5BO 905 83 1,489 2,099 901 103 Kolhapur 920 114 1,650 1,517 920 65 1,646 1,798 953 106 ShoIapur 922 129 1,609 1,484 907 101 1,608 1,685 937 105
Bombay Deccan Southern Divi~ion 916 154 1,598 1,564 925 141 1,561 1,971 944 143
Belgaum 910 143 I,m 1,547 922 125 1,541 1,914 951 131 Bijapur 93B 174 1.534 1,926 946 161 1,425 2,46B 954 158 Dharwar 906 150 1,667 1,272 912 139 1,684. 1,538 931 143
Bombay Konk,an Division 971 162 1,620 2,177 947 119 1.602 2,647 920 113
Thana 81B 102 1550 1519 788 87 1,'i49 2,178 789 55 Kolaba 951 179 1,568 3,159 932 143 1521 3,524 962 166 Ratnagiri 1,220 265 1,68B 3.302 1,20B 167 1,662 3,460 1.144 208 Kanara 994 192 1,749 1,484 945 132 1.690 1,925 1,050 192
SAURASHTRA STATE 993 132 1,662 1,357 950 ~ 68 1,627 1;639 1,010 61
Halar 1,010 120 1,716 1,354 965 64 1,617 1,759 1,014 51 Madhya Saurashtra 1.00B 125 1,711 1,245 957 62 1,688 1584 1,046 47 Zalawad 972 147 1,5B9 1,491 929 93 1,468 1,774 998 61 Gohilwad 971 135 1,566 1,320 933 74 !,57, 1,397 976 67 Sorath 999 13S 1.727 1,471 965 58 1,724 1.822 1,006 75
KUTCH STATE ... 1,107 274 1,809 2,139 1,OOS 109 1,816 2,160 1,195 105

319
TABLE 6'6
Non"Agricultural Classes and Sub"Classes
merte. VII-Transport. I VIII-Other semces and miscellaneous sources.
Non-earn- Earning Self-sup- Non-earn- Earning Self-sup- Non-earn- Earning State, Natural Diyision and District, mg dependants. Total. porting mg dependant •. Total. porting mg dependants.
dependants. persons. dependants. persons. dependan!!.
12 13 14 15 16 17 18 19 20 21
1,694 703 822 30 1,786 1,043 891 201 1,556 1,700 BOMBAY, SAURASHTRA AND KUrCH
1,668 750 809 29 1,786 1,104 862 190 1,543 1,734 BOMBAY STATE
1,603 346 5B7 16 1,844 345 606 155 1,496 593 Grellter Bombay
1,687 653 887 54 1,668 1,492 936 224 1,537 1,934 Bombay Gujarat Division
1,783 739 948 53 1,677 2,587 984 256 1,571 2,562 Baaaskantha 1,716 1.039 880 20 1,712 2,248 1.027 25j 1587 2504 Sabarkaatha 1,706 1,674 879 16 1,456 3,238 1,031 283 1554 2,845 Mehsana 1,660 349 757 64 1,650 654 871 212 1512 1,379 Ahmedabad 1,589 557 829 15 1,660 876 905 200 1,489 1,512 Kaira 1,694 405 820 16 1.113 1,578 878 146 1530 1,917 Panch Mahal. 1,670 641 888 24 1,752 1,057 876 184 1547 1,896 Baroda 1,662 509 786 16 1,755 916 927 196 1,472 1,968 Broach 1,720 567 1,068 14 1,676 1,702 987 263 1569 2,080 Surat 1,768 489 - 955 13 1,910 489 1,015 242 1,626 1,484 Amreli
1,685 911 890 23 1,777 1,076 890 167 .1,561 1,672 Bombay Deccan Northern Division
1,730 912 845 18 1,878 1,012 932 147 1,557 1,791 West Khandesh 1,719 951 887 46 1.735 1,496 923 127 1,635 1.670 East Khandesh 1,677 1,214 625 1,111 504 36 1,'i35 828 Dangs 1,648 980 909 13 1,756 1,221 872 147 1,567 1.805 NasR: 1,682 810 889 29 1,796 398 905 160 1,411 1,837 Ahmednagar 1,660 857 869 17 1.833 1,089 825 170 1.608 1,464 Poona 1,659 1,234 997 17 1,814 1,974 961 209 1,538 2,321 Satara North 1,633 7B6 923 27 1,747 I,IGB 929 195 1,512 1,455 Satara South 1,609 848 873 19 1,681 842 911 165 1,586 1,510 Kolhapur 1,671 904 892 17 1,751 1,009 940 203 1,553 1,519 Shoiapur
1,630 961 874 20 1,816 666 895 190 1562 1,404 Bombay Deccan Southern Division
\664 851 864 37 1,713 746 884 174 1,540 1,525 Belgaum 1,650 1,241 858 19 1,894 5jO 925 212 1,555 1,460 Bijapur 1,711 846 866 11 1,852 662 866 189 1,591 1,251 Dharwar
1,699 895 1,051 41 1,884 1,653 994 238 1,556 2,181 Bombay Konkan Division
1,646 410 840 29 1,832 1,04B 850 152 1,465 1,479 Thaaa 1,691 1,772 1,105 30 1,812 2,899 934 230 1,505 3,365 Kolaba 1,761 1,770 1.390 85 1.894 2,404 1,217 372 ,1.626 3.705 Rataagiri 1,792 726 84G 24 1,829 1,167 1,039 276 1,767 1,282 Kanara
1,798 463 915 37 1,756 674 1,030 230i 1,611 1,498 SAURASI-ITRA 5T ATE
1,821 419 907 I 2B I,B05 413 1,075 232 1,735 1,318 Halar 1,810 417 946 12 1,863 504 1,037 229 1,655 1,317 Madhya Saurashtra 1,753 737 909 21 1,795 965 1,006 240 1,603 1,358 Zalawad 1,723 489 884 55 1,575 990 1,011 232 1,478 1,700 Gohilwad 1,875 381 925 59 1}93 657 1,032 241 1,643 1.654 Sorath
2,040 1,241 873 17 2,030 1,606 1,181 525 1,665 2,415 KUTCH STATE

320
SUBSIDIARY
Marital Status of 1,000 of each Sex of General
Males.
I ,
Unmarried. Married. Widowed. State, Natural Division and District.
1951 1941 1931 1921 1951 1941 1931 1921 1951 1941 1931 1921
1 2 3 4 5 6 7 8 9 10 11 12 13 (
BOMBAY, SAURASHTRA AND KUTCH 526 464 467 432 480 462 40 56 71
BOMBAY STATE ... 525 493 462 464 434 453 483 467 40 54 55 69
Greater Bombay 472 438 370 497 532 598 29 30 32 ,
Bombay Gujaral Division 521 436 461 433 .,,~ 500 460 44 64 79
Banaskantha 521 472 477 439 469 437 38 S9 86 Sabarkantha 530 442 493 429 507 448 40 51 59 Mehsana 532 448 472 418 484 441 50 68 87 Ahmedabad
, 496 464 423 448 460 482 515 474 42 54 62 78 .. , Kaira 499 445 387 426 446 484 536 482 53 71 77 92 Panch Mahals ... . .. 519 490 533 442 467 416 35 43 51 Baroda 520 428 422 430 500 493 45 72 85 Broach 533 ... 416 448 419 520 475 43 E4 77 Surat 539 507 434 457 415 439 503 466 41 54 63 77 Amreli 566 527 530 391 415 393 41 58 77
Bombay Deccan Northern Division 527 459 459 434 492 472 • 3B 49 69
West Khandesh 511 493 47~ 483 460 469 493 470 28 38 32 47 East Khandesh 491 451 399 414 468 500 560 533 39 49 41 53 Dangs 521 485 451 476 25 39 Nasik 497 471 447 462 468 484 511 477 33 45 42 61 Ahmednagar ... 499 456 442 449 463 493 510 484 37 51 43 67 Poona S36 494 467 467 423 448 485 469 40 58 48 64 Satara North ... ... 625 525 489 490 336 413 44R 425 38 62 63 85 Satata South ... 543 493 459 416 446 456 40 61 85 Kolhapur 552 493 459 407 452 462 40
5·S 55 79
Sholapur 511 487 459 458 441 458 480 462 47 61 80
Bombay Deccan Southern Division 535 509 467 479 419 426 468 434 43 65 65 87
Belgaum 531 503 451 463 424 436 489 455 41 61 60 82 Bijapur 510 490 446 457 445 441 490 450 43 69 64 93 Dharwar 562 531 500 5lI 390 403 430., 401 46 66 70 88,
Bombay Konka.n Division 557 537 518 521 402 413 44f) 426 39 50 42 53
Thana 516 494 494 503 451 462 468 447 31 44 3e 50 Kolaba m 522 485 490 424 436 471 454 43 42 44 56 Ratnagiri 603 574 544 536 353 376 415 413 43 50 41 51 Kanara 58! 547 540 556 372 376 407 384 45 77 53 60
SAURASHTRA STATE 540 470 484 418 469 439 39 61 77
Halar 542 421 35 Madhya Saurashtra . 527 435 37 Zalawad 532 421 45 Gohilwad 546 411 42 Sorath 552 406 39
KUTCH STATE 537 493 509 409 441 409 53 66 82
Note:-In the newly created districts of Banaskantha. Sabarkantha, Mehsana. Baroda, Amreli, Dangs, Satara South. Kolhapur and the States of Saurashtra and Kutch, figures given for the past censuses are estimated as the actual figures for areas which now constitute these districts and States are not available.

321
TABLE S'7,1
Population and comparison with previous censuses
Females.
Unmarried. Marri~d. Widowed. State, Natural Division and District, .-----
1951 1941 1931 1921 19~1 1941 1931 1921 1951 1941 1931 1921 "
I 14 15 16 171 18 19 20 21 22 23 24 25 I
409 330 326 460 509 487 129 161 187 BOMBAY, SAURASHTRA A.1'iD KUTCH
406 369 324 319 462 481 513 490 130 150 163 191 BOMBAY STJ. TE
439 397 297 451 485 558 108 118 14') Greater Bo~bay
4,0 315 319 457 543 490 111 142 191 Bombay r;ujarat DiL'isioro
421 365 372 464 506 470 114 129 153 Banaskantha 418 3fl13 351 465 542 475 116 150 174 Sabarkantha 414 313 331 454 526 488 131 161 181 Mehsana 473 362 '302 Wj 423 506 551 501 103 132 147 180 Ahmedabad 381 323 248 269 487 533 600 547 130 144 1')2 184 Kaira 446 405 461 469 503 434 83 92 105 Panch Mahills 417 296 288 476 554 540 105 150 172 Bnroda 440 319 330 457 546 507 100 135 163 Broach 449 398 334 345 444 4JO 541 514 101 112 125 141 Surat 450 405 406 413 456 435 135 139 15q Amreli
1 384 316 302 479 520 SOl 135 164 197 Bombay Deccan Northern Divisbn
431 389 366 37B 419 492 520 480 108 119 114 142 West Khandesh 347 322 272 280 5\4 535 587 557 136 143 141 163 East Khandesh 465 442 479 495 50 63 Dangs 31\2 346 325 326 49(- 517 534 508 120 137 141 166 Nasi!!: 369 322 30? 297 506 'i28 541 512 124 150 157 191 Ahmednagar 394 363 328 304 465 475 S02 496 140 162 170 200 Poona 354 362 300 279 484 450 488 470 162 188 212 251 Satara North 383 330 303 46B 475 473 148 195 224 Satata South 414 335 280 443 485 497 141 180 221 Koihapur 387 358 317 299 473 479 5!0 493 139 163 173 2()8 S~olapur
392 361 329 320 449 459 4Bl 457 156 180 190 223 Bombay Deccan Southern Division
393 356 313 301 4'i5 473 506 480 14B 171 181 219 Belgaum 3613 339 30S 301 470 479 504 478 160 182 191 221 Bijapur 412 385 3~3 351 424, 429 438 421 162 IS6 199 2213 Dharwar
406 374 352 341 447 459 471 457 145 167 177 202 Bomba" Konk.an Division
414 378 377 389 482 494 494 461 102 128 129 150 Thana 390 366 334 327 472 479 506 484 137 155 160 189 Kolaba 402 376 343 318 426 448 460 460 171 176 197 222 Ratnagiri 423 373 361 346 39(1 393 409 401 184, 234 230 253 Kanara
435 358 369 447 495 473 J15 147 158 SAURASHTRA STATE
436 444 118 Halar 431 456 110 Madhya Saurashtra 420 462 115 Zalawad 431 449 119 Gohilwad 452 429 115 Sor"th
397 349 365 438 459 435 164 192 200 KUTCH STATE
1oI0-A Bk H 91-32

322
SUBSIDIARY TABLE 6'S
Age distribution of 1,000 married persens of each Sex (and comparision with 1941 Census)
I\'lales. Females.
Slate, Nat, .• ral Divisicn and Di,trict. 0-14. 15-34. 35-54. 55 and over. 0-14. 15-34. 35-54. 55 and oyer.
1------------------.---.--------------
19~1 1941 1951 1941 lfJ51 1941 1951 1941 1951 1941 1951 1941 1951 1941 1951 1941
2 3 4 5 6 7 B 9 10 II 12 13 14 15 16 17
BOY-BAY, SAUR4.SHTRA AND KUTCH... 14 .. , 472 435 to!) 60 ij3D .. , 273 37
BO!\mAY STATE
Greater Bl)m!:ay .. ,
Eombay Clljara! Divisio., ".
Ranaskantha Saharbntha Mehsana Ahmedabad Knita Panch MclInls Barod.t Broach Surat Amr~li
Bombay [Jerean NOT them Division
West Khandesh E£.st Khndesb Danga Na.ik AhIIlednagar Poona Satara North Satura Scuth Kolhapur Sholapur
Boda.ll Deccan Soutkern Division
B~lgaunl Bijarur DhaJ"War
Thalia Kolaba ~atnagiri Kanara
SAUR6.SHTRI\ STATE
HaJar Madhya Sanrashtra Zalawad Gohilwad Sonth
KUTCH STATE
12 24 469 499 410 377 109 100 60 97 630 640 274 235 36 28
... 2 8 531 563 .107 382 60 47 13 32 7!3 145 249 205 25 18
." 19
37 ... 40 ... 14 ... 16 ... 38 ... 30
B ... 5 ... 3
4
491 ... 392
... 511 524 458
29 537 56 de')
525 lB 476
470 11 446
474
358 ... 363
410 586 376 515 3:'2
363 50g 411
41<) 477 433
410
98
94 J3
118 31fi 71 69 332 105 97
82 358 105 116
106 ~03 118 109
112
40 631 ... 286
76 608 70 656 30 622 40 84 684 85 11 \ 60) 39 r36 20 S3 1i35 17 6)9 7 32 699 5 661
... 2i9
... 243 300
674 247 217 600 271 248
274 636 303 768
303 t06 331 3!3
'" 273
... J1 ... 456 ... 4!0 123 87 ... 617 ... 265
... 15
... 14
... 11
... 14
... 14 ... 9 ... 9 ... 7
2 ... 11
27 514 46 492
4% 30 487 27 A55 19 472 12 364 ... 398
409 20 450
547 376 336 95 lJO 77 !O3 623 530 338 322 106 IC2 106 150 60?
421 72 78 666 495 390 372 109 103 1)9 127 618 482 408 375 123 116 125 148 S86 481 401 394 118 106 67 96 633 426 456 421 171 141 67 130 629
4~2 153 95 599 451 138 28 646
471 412 393 127 116 lOS 128 616
649 267 216 611 259 207
271 6?8 2~3 223 6()1) 260 223 651 270 225 636 268 213
'" 273 292
635 249 214
43
37 31 48 29 41 51 42 41 53 61
31
33 33 35 30 29 30 36 33 34 27
25 41
43
49
32 32
22 29 28 21
13 23 448 484 426 401 113 92 97 126 630 644 248 211 25 19
16 18
... 4
29 453 491 412 386 119 29 450 483 423 396 109 13 440 477 444 121 112
94 109 /41 6[18 625 252 215 92 123 143 603 633 248 203 89 58 91 677 677 245 212
31 21 20
19 16 20
... 2 11 410 439 444 427 144 123 21 65 629 643 3D6 265 44 27
2 2 2
... I
... 33
36 50
... 37
... 25
... 16
... 41
9 477 486 ~30 418 91 87 17 418 472 443 407 137 104 13 323 382 454 429 221 176 4 411 421 465 475 123 100
503
501 506
... 516
." 505
... 492
365
362 ... 348
359 371
.. , 382
398
99
lOi 96 BR 99
110
117
17 49 633 669 306 259 36 94 641 641 237 245 17 62 601 617 328 286 !6 (f 704 678 254 240
53
57 66 64 54 30
58
633
621 614 641 646 642
." 597
269
270 274 256
.". 259
... 280
... 292
44 36 54 26
45
52 46 39 41 48
53
23 20 35 16

323
SUBSIDIARY TABLE 6'9
Infants per 10,000 persons
Infants per 10,000 persons of
State, Natural Division and District. General Population. Rural Urban Agricultural IN~_A~i~'''''] Population. Population. CI~sses. Classes.
1951 1941
Persons. Males. Females. Persons. Males. Females. Males. Females. Males. Females'j Males. Females. -I 0 3 4 Sf 6 7 8 9 10 11 I 12 13 .:.
BOMBAY, SAURASHTRA AND KUTCH ... 325 164 161 167 162 157 159 168 161 158 161
BOMBAY STATE 325 164 161 252 167 163 157 157 167 161 160 161
Greater Bp.Lubay .. 236 117 119 174 117 119 112 !24 !17 119
P.o'llbay Gujarat Di<'ision '" 347 175 172 ]72 169 182 179 174 171 176 173
Banaskantha 298 153 145 153 142 153 182 148 142 165 152 Sabarkantha 339 168 171 167 173 172 151 169 176 163 159 Mchsana 293 111 !42 152 139 149 151 151 139 151 146 Ahmpd .. had 379 190 189 291 !P.4 188 194 191 183 190 103 189 {(aira ... 383 186 197 290 183 206 192 173 180 2('5 200 176 Pan~h Mahals 415 206 209 206 201 205 272 209 196 190 273 Baroda 346 171 If9 172 158 194 ZOO 175 103 182 179 Brnach 343 176 167 180 170 160 !53 180 169 166 161 Surat 313 163 150 234 163 151 164 146 167 149 157 152 Amieli 321 15.1 167 150 167 165 168 139 169 !6R 162
Bombay Deccan Northern Di~ision m 168 166 167 163 ' 170 174 165 16() 174 18G
West Khandesh 378 191 137 307 !96 190 163 171 197 187 168 183 East Khandesh .. 340 175 165 309 172 162 182 173 168 164 193 169 D:1n'l's '2,97 1137 210 187 210 194 219 11' ,,) 115 Nasik 36~ 186 182 250 185 174 1')0 204 183 16R 193 211 Abmedna"ar 309 155 154 239 156 154 151 152 155 154 156 IS3 Poona 326 159 167 248 159 167 159 166 155 '64 163 ~70 Satara North 324 164 160 160 161 194 152 156 151 192 189 Satara South 301 157 144 156 146 159 133 158 145 152 139 Kolhapur 318 161 157 160 !54 165 163 157 149 m !83 Sh"ldpur 339 166 173 279 163 156 172 209 159 153 177 206
Bombay Deccall Southern Division 319 162 157 167 161 14B 146 163 160 159 151
Belgaum 332 169 163 236 171 165 165 157 167 162 176 165 Bijafour 293 146 147 246 153 IS3 121 128 147 151 ]114 135 Dbarwar 329 168 161 249 177 166 150 149 173 165 156 149
BombGY Konkan DivisioQ '" 31;7 158 149 157 143 171 155 153 142 153 161
Thana 336 175 161 207 169 119 191) 166 170 153 183 171 Kolaba 290 IS4 136 223 154 138 158 132 159 137 138 138 Ratnagiri 2B6 144 142 208 145 141 140 142 146 135 1'39 157 Kanard 330 !66 164 229 172 169 1~1 146 172 159 157 172
SAURA..'3HTRA STATE 328 162 166 167 161 153 177 182 ' 168 145 165
Hnlar 355 196 15'1 270 167 lil8 140 252 184 147 136 Madhya Saurashtra 336 164 172 170 175 153 167 176 m 154 168 Zalawad 344 166 17'1 166 143 165 248 174 176 160 180 Gohilwa<l 314 143 171 140 150 149 22\) lSQ 146 128 194 S"rath 311 153 153 161 162 152 136 175 169 140 138
KUTCH STATE 333 167 156 165 157 180 148 175 150 162 160

324
SUBSIDIARY TABLE 6 '10
Young Children (aged 1-4) per 10,000 persons
Young children per 10,000 persons of
-General Population.
State, Natural Division and District. Rural Urban Agricultural Non-Agricultural .. Population. Population. Classes. Classes . 1951 1941
Persons. Males. Females. Persons. Males. Females, Males. Females. Males. Females. Males. Females.
1 2 3 4 , 5 6 7 8 9 10 II 12 13
BOMBAY, SAURASHTRA AND KUTCH ... 1,055 537 518 556 537 496 476 557 537 507 489
BOMBAY STATE ... 1,052 536 516 1,117 556 , 536 492 471 556 535 503 486
Greater Bombay ... 780 393 387 730 392 387 410 392 392 387
Bombay Gujarat Division 1,044 532 512 542 526 502 468 545 529 510 482
Banaskantha ... 1,096 536 560 542 568 454 456 551 582 501 506 Sabarkantha ... 1,061 540 521 542 528 512 421 541 541 538 464 Mehaana 994 503 491 517 504 454 444 514 497 486 481 Ahmedabad. 973 499 474 1,054 489 477 506 473 504 481 497 472 Kaira 1,010 525 485 1,093 529 498 515 455 526 496 525 461 Panch Mahals 1,144 595 549 604 556 525 503 608 563 525 475 Baroda 1,024 531 493 540 502 504 466 546 500 506 481 Broach ... 1,003 505 498 504 504 509 474 505 518 504 451 Surat 1,114 554 560 1.051 556 577 509 496 564 581 537 527 Amreli ... 1,041 549 492 571 510 491 446 594 508 491 468
Bombay Deccan Northern Division 1.104 565 539 573 544 543 525 570 539 552 539
West Khandesh 1,105 554 551 1,295 567 563 489 491 562 561 527 516 East Khandesh 1,011 516 495 1,156 510 491 529 504 508 478 534 537 Danga ... ... 1,358 660 698 660 698
546 659 729 667 391
Nasik ." 1.123 561 562 1.160 560 568 565 559 571 565 544 Ahmednagar ." 1.052 533 519 1,154 540 526 493 480 532 520 535 516 Poonll ... 1,086 541 545 1.129 551 I 559 527 525 550 564 530 523 Satara North 1.231 717 514 739 506 579 560 752 499 598 566 Satara South 1,117 566 551 564 568 572 508 565 553 572 542 Kolhapur 1,059 541 518 538 514 5.49 532 534 511 561 541 Sholapur 1,163 581 582 1.122 ' 584 595 575 554 584 589 576 570
Bombay Deccan Southern Division 1,118 567 551 576 563 544 516 571 557 558 534
Belgaum 1.161 590 571 1,159 599 579 561 "547 595 574 574 565 Bijapur 1,059 534 525 1.127 541 541 511 473 532 537 542 491 Dharwar 1,123 573 550 1,090 582 566 552 516 580 557 556 536
Bombay Konkan Division ... 1,033 524 509 527 513 510 488 526 510 522 506
Thana 1,023 522 501 1,120 532 507 501 489 539 509 499 491 Kolaba ... 1,045 526 519 1,211 526 527 528 453 519 517 549 526 Ratnagiri '" 1,016 515 501 1,131 515 504 514 468 510 502 527 497 Kanara ... 1,090 557 533 929 567 531 526 539 563 523 547 550
SAURASHTRA STATE ... ],081 546 535 555 547 . 526 511 568 565 526 508
Halar ... 1,067 524 543 524 582 524 463 534 593 515 499 hladbya Saurashtra 1,123 584 539 596 536 565 546 611 564 563 521 Zalawad 1,021 516 505 519 517 509 479 526 520 507 493 Gohilwad ... ).077 547 530 564 542 507 502 578 560 519 503 Sorath ... ... 1,078 532 546 544 558 506 519 560 560 502 512
KUTCH STATE ... 1,059 545 514 549 527 525 462 579 547 518 489

325
SUBSIDIARY TABLE 6.'11
(Boys and Girls (aged 5-14) per 10,000 persons
Bays and Girls per 10,000 persons of
,
State. N,tural Division and District. General Population. Rural Urban Agricultural N·)n-Agricultural Population. Population. Classes. Classes.
1951 1941
Persons. Males. Females. Persons. Males. Females. I Males. Females. Males. Females. Males. Females.
1 2 3 4 5 6 7 8 9 10 11 12 13
BOMBAY, SAURASHTRA AND KUTCH ... 2573 1,329 1,244 1,387 1,299 1,199 1,117 1,391 1,301 1,236 1,155
flOMBAY STATE ... 2,551 1,317 1,234 2,488 1,380 1,296 1,174 1,094 1,387 1,301 1,203 1,125
Greater Bombay ... .. , 1,771 924 847 1,711 925 847 957 1,032 924 845
lombay Gujarat Division 2,619 1,365 1,254 1,408 1,303 1,239 1,110 1,416 1,307 1,281 1,166
Banaskantha ... 2.B72 1,4B7 I,3B5 1512 1,404 1.163 1,145 1,542 1,431 1,34B 1,269 Sabarkantha ... 2,888 1.519 1,369 1.534 1,382 1,311 1,207 1,554 1.40 1,417 1,275 Mehsana. ... 2,702 1,413 1,289 1,440 1,319 1,314 1,182 1,432 1.:320 1.381 1,241 Ahmedabad ... 2,380 1,255 1.125 2.197 1,416 1,30B 1.140 993 1,428 1.300 1,\80 1,049 Kaira '" 2,580 1.385 1,195 2,299 1,407 1.219 1,328 1,135 1 ,418 1.216 1,304 1,142 Panch Mahals '" 2.695 1,363 1,332 1,367 1,349 1,335 1,20B 1,367 1,363 1,345 1,170 Baroda. ... 2,511 1,314 1,197 1,344 1,224 1,222 1,112 1,353 1,230 1,246 1,138 Broach ... 2,725 1,418 1,307 1,429 1,328 1,366 1,215 1,444 1,342 1,352 1,221 Surat ... 2,56B 1,309 1,259 2,546 1,333 1,282 1,219 1,174 1,343 1,283 1,254 1,220 Amreli ... 2,720 1,416 1,304 1,414 1,300 1,423 1,313 1,425 1,282 1,387 1,311
{3ombay Deccan N orthem Division ... 2,638 1.361 1.277 1.394 1,302 1.268 1.209 1,401 1.306 1.270 1,212
West Khandesh ... ... 2,795 1,443 1,352 2,629 1,450 1,372 1,412 1,249 1,461 1,383 1,380 1,240 East Khandesh ... ... 2,615 1,364 1,251 2,570 1,369 1,266 1,353 1,219 1,373 1,265 1,341 1,216 Dangs ... 2,700 1,504 1,196 1504 1,196 1517 1,211 1,379 1,057 Nasik ... 2,602 1,331 1,271 2,tfl.7 1,357 1,280 1.255 1,243 \,362 1.286 1,266 1,239 Ahmednagar ... 2,734 1,364 1,370 2,503 1,385 1,395 1.245 1,235 1,391 1,412 1,290 1,257 Poona ... 2.510 1,300 1.210 2,415 1,393 1,288 1,174 1,104 1,431 1,303 1,151 1,104 Satara North ... 2,658 1.449 1,209 1,462 1,194 1,359 1,306 1,469 1,179 1.379 1,315 Satara South '" 2,707 1,383 1.324 1,400 1,355 1,341 1,249 1,393 1,348 1,347 1,237 Kolhapur ... 2,635 1,374 1,261 1,396 1,267 1,300 1,239 1,394 1,274 1,314 1,218 Sholapur ... 2.595 1,304 1,291 2,526 1,343 1,307 1,219 1,255 1,341 1.311 1,243 1.256
'Bombay Deccan Southern Division ... ... 2,599 1,306 1.293 1,306 1,301 1,307 1.272 1,314 1,305 1,283 1,261 . Belgaum ... 2,608 1,310 1,298 2,665 1,308 1,310 1,316 1,259 1,318 1,311 1,285 1,258 Bijapur ... 2,629 1,325 1,304 2,594 1,329 1,307 1,312 1,291 1,339 1,319 1,283 1,257 Dharwar '" 2,563 1,284 1,279 2,609 1,279 1.282 1,297 1.772 1,286 1,285 1,282 1,266
Bomooy Konkan Division '" 2,567 1,328 1,239 1,351 1,259 1,217 1,148 1,360 1,265 1,263 1,190
Thana ... 2,390 1,250 1,140 2,436 1,307 1,186 1,114 1.032 1,341 1,197 1,120 1,060 Kolaba '" 2.652 1,388 1,264 2.661 1,397 1,266 1,314 1.235 1,416 1,293 1,310 1,179 Ra.tnagiri ... 2,718 1,393 1.325 2,819 1,393 1,327 1,396 1,302 1,383 1,329 1,416 1,317 Kanara ..... 2,408 1,220 1.188 2,407 1,204 1,158 1,268 1,283 1,215 1,148 1,226 1,257
SAURASHTRA STATE ... 2,759 1,436 1,323 1,453 1,338 1,399 1,293 1,446 1,322 1,426 1,324
Halar '" 2,670 1,356 1,314 1,353 1,304 1,364 1,335 1,315 1,296 1,393 '1,330 Madhya Saurashtra ... 2,692 1,400 1,292 1,409 1,299 1,387 1,279 1,431 1,275 1,377 1,304 Zalawad '" 2,786 1,445 1,341 1,481 1,372 1,363 1,266 1,473 1,341 1.422 1,339 Gohilwad '" 2,845 1,519 1,326 1,539 1,354 1,473 1,262 1,525 1,324 1,514 1,327 Sorath ... 2.779 1,428 1,351 1,450 1,360 1,379 1,331 1.450 1,316 1.403 1,388
KUTCH STATE ... 2,589 1,330 1,259 .1,347 1,255 1,260 1,276 1,361 1,246 1,306 1,270

326
SUBSIDL4.RY TABLE 6'12
Young Men and Women (aged 15-34) per 10,000 persons
Young men and women per 10,000 persons of
General Population. I Rural Urban Agricultural Non-State, Natural Division and District.
I Population. Population. Classes. Agricultural
1951 1941 Classes.
Persons. Males. Females. Persons'! Males. Females. I Males. Females. Males. Females. Males. Females.
2 3 4 5 I 6 7 l 8 9 10 11 12 13
BOMBAY, SAURASHTRA AND KUTCH ... 3,410 1,759 l,Ii51 1,584 1,643 2,155 1,668 1,563 1,638 2,057 1,670
BOMBAY STATE ... 3,413 1,766 1,647 3;34.2 1,570 1,642 2,210 1,657 1,547 1,635 2,123 1,665
,
Greater Bombay '" ... 4,646 3,094 1,552 4,678 ..... 3,094 1,552 2,051 1,585 3,101 1,552
Bombay GalaTa! Division ... 3,413 1,749 1,664 1,668 1,640 1,990 1,734 1,650 1,633 1,915 1,716
, Banaskantha ... 3,289 1,744 1,545 1,730 1,526 1,922 1,799 1,740 1,508 1,752 1,639 Sabarkantha ... 3,424 1,727 1,697 1,709 1,695 1,965 1,722 1,712 1,679 1,773 1,748 Mehsana ... 3,272 1,594 1,678 1,574 1,663 1,665 1,730 1,579 1,65~ 1,618 1,719 Ahmedabad ... 3,862 2,099 1,763 3,909 1,758 1,702 2,344 1,807 1,709 1,720 2,268 1,782 Kaira ... 3,301 1,696 1,605 3,334 1,677 1,591 1,744 1,641 1,639 1,583 1,837 1,660 Panch Mahals ... 3,419 1,797 1,622 1,796 1,613 1,801 1,684 1,775 1,610 1,912 1,685 Baroda .. ~ 3,439 1,772 1,667 1,698 1,657 2,002 1,698 1,656 1,661 1,974 1,679 Broach ... 3,328 1,690. 1,638 1,677 1.636 1,752 1,646 1,668 1,632 1,746 1,652 Surat ... 3,286 1,599 1,687 3,228 1,526 1,675 1,870 1,734 1,492 1,670 1,769 ' 1,715 AmreIi ... 3,369 1,713 1,656 1,693 1,628 1,765 1,732 1,703 1,649 1,701 1,642
Bombay Deccan Northern Division ... 3,250 1,615 1,635 1,522 1,623 1,874 1,669 1,500 1,618 1,878 1,674
West Khandesh ... ... 3,328 1,643 1,685 3,383 1,601 1,678 . 1,848 1,723 1,581 1,686 1,860 1,682 East Khandesh ... 3,335 1,677 1,658 3,297 1,641 1,680 1,754 1,610 1,629 1,643 1,794 1,693 Dangs 3,341 1,718 1.623 1,718 1,623 1,572 1,662 3,150 1,241 Nasik ... 3,314 1,681 1,633 3,174 1,59') 1,639 1,931 1,616 1581 1,639 1,893 1,620 Ahmednagar ... 3,182 1,596 1,586 3,108 1536 1,569 1,939 1,681 1,513 1,664 1,825 1,645 Poona ... 3,452 1,802 1,6')0 3,299 1,556 1,586 2,135 1,737 1,481 1,569 2,168 1,743 Satara North ... 3,030 1,266 1,764 1,225 1,792 1,526 1,588 1,194 1,809 1,511 1,610 Satara South ... 3,038 1,503 1,535 1,4')3 1,509 1,628 1,598 1,431 1,513 1,777 1,618 Kolhapur ... 3,197 1,584 1,613 1,508 1,604 1,842 1,648 1,505 1,604 1,831 1,643 Sholapur ... 3,203 1,618 1,585 3,218 1,551 1,531 1,764 1,706 1,')48 1529 1,734 1,681
Bombay Deccan Southern Division ... 3,274 1,664 1,610 1,628 1,593 1,767 1,658 1,608 1,598 1,819 1.643
Belgaum ... 3,243 1,648 1,595 3,157 1,609 1 ,580 ~ 1,769 1,644 1,585 1,579 1,841 1,645 Bijapur ... 3,236 1,632 1,604 3,163 1,606 1,584 1,718 1,671 1,586 1583 1,769 1,667 Dharwar ... 3,342 1,711 1,631 3,280 1,672 1,618 1,797 1,661 1,656 1,635 1,835 1,624
Bombay Konkan Division ... 3,244 1,514 1,730 1,413 1.736 1,983 1,699 1,371 1.734 1,796 1,722
Thana ... 3,5B2 1,891 1,691 3,413 1,703 1,668 2,')3] 1,745 1,604 1,682 2,296 1,704 Kolaba ... 3,182 1,432 1,750 3,OBI 1,397 l_,765 1,729 1,621 1,330 1,780 1,724 1,660 Ratnagiri ... 2,937 1,174 1,763 2,801 1.137 1,775 1,535 1,650 1,125 1,755 1,285 1,782 Kanara ... 3,440 1,749 1,691 3,379 1,808 1,700 1,563 1,663 1,758 1,693 1,736 1,688
SAURASHTRA STATE ... 3,415 1,733 1,682 1,728 1,650 1744 1,748 1,747 1,668 1,721 1,695
Halar ... 3,480 1,800 1,680 1,799 1,651 1,801 1.743 1,820 1,664 ),781 1,695 Madhya Saurashtra ... 3,446 1,732 1,714 1,749 1,669 1,704 1,787 1,786 1,680 1,689 1,741 Zalawad ... 3,457 1,757 1.700 1,753 1,694 1,768 1,716 1,776 1,741 1,742 1,666 Gohilwad ... 3,348 1,711 1,637 1,675 1,605 1,792 1,711 1,701 1,646 1,720 1,630 Sorath ... 3,393 , 1,707 1,636 1,709 1,656 1,704 1,752 1,713 1,657 1,700 1,717
KUTCH STATE ... 3,196 1,516 1,680 1,487 1,656 1,638 1,782 1,487 1,606 1.538 1,736

327
SUBSIDIARY TABLE 6 '13
'Middle Aged Persons (aged 35-54) per 10,000 persons
Middle aged persons per 10,000 persons of
State, N General Population.
I Rural I Urban
I Agricultural Non-
atural Division and District. Population. \
Population. Classes. Agricultural 1951 1941 Classes.
Persons. Males. Females. Persons. Males. Females. Males. Females'l Males. Females. Males. Females.
I 2 3 4 5 6 7 8 9 10 II 12 13
BOMBAY, SAURASHTRA AND KUTCH ... 1,925 1,028 897 984 929 1,126 826 978 941 1,103 833
BOMBAY STATE ... 1,947 1,046 901 2,034 997 938 1,157 817 987 952 1,142 818
Greater Bombay ... 2,106 1,443 663 2,303 1,443 663 1,280 982 1,444 661
Bombay GujaTai Division 1,892 1,012 880 984 890 1,096 852 975 893 1,074 859
Banaskantha 1,785 914 871 903 866 1,062 926 BBI 846 996 932 Sabarkantha ... 1,720 906 814 896 809 1,042 874 902 775 919 923 Mehsana ... 1,948 984 964 969 942 1,039 1,045 976 951 998 985 Ahmedabad ... 1,848 1,085 763 1,922 957 857 1,177 694 960 857 1,139 722 Kaira 1.940 1,036 904 2,082 1,029 890 1,053 938 1,014 908 1,090 892 Panch Mahals 1,759 952 807 940 802 1,047 845 930 807 1,071 809 Baroda 1,985 1,072 913 1,066 925 1,091 876 1,034 943 1,138 859 Broach 1.927 1,045 882 1,029 876 1,115 907 994 884 1,171 876 Surat 1,983 1,027 956 2,157 1,020 963 1,054 930 1,019 972 1,041 930 Amreli 1,790 93b 860 929 856 933 868 921 858 928 851
Bom ay Deccan Northern Division '" 1,925 1,011 914 999 933 1,043 862 987 955 1,066 822
West Khandesh 1,787 952 835 1,744 943 834 996 840 929 842 1,034 813 East Xhandesh ... 1,971 1,026 945 1,883 1,016 958 1,047 918 1,013 995 1,057 825 Dangs ... 1,822 1,088 734 1,088 734 1,089 753 1,080 552 Nasik 1,908 1,027 881 2,042 1,031 904 1,015 815 1,020 914 1,040 811 Ahmednagar ... 1.978 1,056 922 2,120 1,056 924 1,055 911 1,040 948 1,098 851 Poona ... 1,906 995 911 2,118 960 967 1,042 836 939 997 1,059 814 Satara North ... 1,877 874 1,003 853 1,015 1,009 929 825 1,048 1,042 . 850 Satara South 1.968 1.041 927 1,041 929 1.042 923 1,025 956 1,101 818 Kolhapur 1,9B3 1,049 934 1,051 964 1,039 B34 1,049 968 1,047 830 Sholapur 1,943 1,05B 885 2,050 1,043 910 1,090 831 1.031 928 1,103 814
Bombay Deccan Southern Divisio~ 1,962 1,043 919 1.050 923 1,021 905 1,027 944 1,086 848
BelgaJJID ... 1,9~ 1,011 892 2,023 1,017 899 991 870 1,002 917 1,039 813 Bijapur ... 2,0 1,086 971 2,108 1,096 973 1,055 963 1,075 998 1,122 888 Dharwar ... 1,940 1,039 901 2,076 1,045 903 1,024 897 1,011 923 1,101 B51
Bombay Konkan Division ... 2,031 986 1,045 969 1,074 1,061 910 969 1,092 1,018 953
Thana ... 2,066 1,122 944 2,200 1,109 1.023 1,152 758 1,071 1,067 1,194 771 Kolaba ... 2,052 1,042 1,010 2,105 1,035 1,015 1,097 966 1,024 1,024 1,094 968 Ratnagiri ... 2,000 823 1,177 2,Q42 817 1,183 876 1,123 836 1,190 793 1,149 Kanara .. 1,996 1,053 943 2,344 1,082 890 759 1,114 1,083 935 1,001 957
SAURASHTRA STATE 1,729 882 847 879 829 887 884 866 BOO 895 889
Halar 1,711 865 B46 848 823 900 893 855 796 B74 890 Madhya Saurasht;~' 1,726 861 865 859 859 866 874 830 816 886 ' 902 Zalawad 1,738 894 B44 911 811 854 919 913 781 877 897 Gohilwad 1,734 901 833 901 825 902 851 877 800 922 862 Sorath 1,732 887 845 878 816 906 908 881 802 894 891
KUTCH STATE 1,969 941 1,028 948 1,031 911 1,014 1.004 997· 893 1,052

328
SUBSIDIARY TABLE 6·14 Elderly Persons (aged 55 and over) per 10,000 persons
~
Elderl y persons per 10,000 persons of
-General Population, Rural UrbalJ Agricultural Non-State, Natural Division and District. Population. Population. Classes. Agricultural
1951 1941 Classes. -Persons. Males. Females. Persons. Males. Females. Males. Females. Males. Females. Males. Females.
I 2 3 4 5 6 7 8 9 10 11 12 13
BOMBAY, SAURASHTRA AND KUTCH ... 712 349 363 367 385 309 312 378 387 305 3~6
BOMBAY STATE 712 352 36Q 767 ·370 ·385 311 303 382 390 303 311
Greater Bombay ... 461 260 201 404 260 201 603 472 258 199
Bombay Gujarat Dlvision 685 336 349 341 357 323 325 352 355 311 332
Bariaskantba 660 311 349 307 347 365 373 299 329 340 399 Sabarkantha 56B 256 312 255 310 276 347 256 294 256 365 Mehsana 791 382 409 382 399 381 446 398 391 356 437 Ahmedabad 558 275 283 622 325 339 239 242 332 336 250 259 Kaira 786 405 381 902 390 381 446 380 419 396 370 343 Panch Mahals 56B 272 296 268 29B 296 279 270 302 278 262 Baroda 695 357 338 369 345 321 314 383 356 312 306 Broach 674 347 327 342 325 364 339 341 323 362 338 Sural 736 358 378 784 361 383 3# 360 376 384 329 369 Amreli 759 335 424 346 436 304 392 346 406 318 439
Bombay Deccan Notthem Dlvislon 749 375 374 392 388 329 334 401 398 317 31~
West Khandesh 607 287 320 640 291 315 273 345 293 318 268 324 East Khandesh 728 343 385 785 342 393 345 366 355 409 315 326 Dangs 382 219 163 219 163 227 168 138 115 Nasik 685 344 341 747 353 354 318 302 360 357 312 306 Ahmednagar 745 392 353 870 401 358 339 319 404 367 360 314 Poona 720 355 365 791 403 411 291 304 422 424 278 297 Salara North 880 431 449 433 460 416 382 440 478 398 350 Satara South 869 442 427 452 427 415 427 470 443 334 363 Kolliapur 808 401 407 420 424 338 346 428 427 315 342 Shoiapur 757 408 349 806 447 370 322 303 450 377 338 302
Bomhay Deccan Southern Division 728 350 378 353 379 340 376 ,362 391 315 343
BeIgaum 753 361 392 760 369 394 336 385 382 408 296 343 Bijapur 726 347 379 759 339 373 373 384 347 386 343 359 Dharwar 703 341 362 696 349 361 321 364 354 375 311 333
Bombay Konk.an Division ... 818 387 431 402 451 319 339 425 448 314 397
Thana 603 289 314 623 300 337 261 261 324 343 238 273 Kolaba 779 387 392 710 386 394 394 373 398 403 354 360 Ratnagiri 1,043 479 564 999 489 574 381 473 523 566 379 559 Kanara 736 356 380 707 348 371 380 408 374 377 325 384
SAURASHTRA STATE 688 321 367 329 364 304 374 322 346 320 386
Halar 717 322 395 335 394 294 395 331 360 314 426 Madhya Saurashl~~ 677 312 365 318 361 301 371 311 343 313 382 Zalawad 654 305 349 303 325 308 405 280 299 326 391 Gohilwad 682 332 350 347 358 299 332 341 343 325 356 Sorath 707 326 381 329 377 317 390 332 368 319 396
KUTCH STATE 864 361 503 378 500 288 516 409 439 325 551

329
SUBSIDlt\RY TABLE 7'1 Progress of Literacy
No., of Literate males per 1,000 males No. of Literate females per 1,000 females
Aged Aged Aged Aged Aged 5 Aged 5 Aged 15 Aged Aged Aged Aged Aged 5 Aged 5 Aged 15 5-9 5-9 5-14 5-14 and and and 5-9 5-9 5-14 5-14 and. and and
State, Natural Division on on on on up- up- up- on on on on up- up- up-and District. wards wards wards wards wards wards
on on on on on on
1-3-51 1-3-41 1-3-51 1-3-41 1-3-51 1-3-41 1-3-51 1-3-51 1-3-41 1-3-51 1-3-41 1-3-51 1-3.41 1-3-51
2 3 4 5 6 7 8 9 10 11 IZ J3 14 15
BOMBAY STATE ..• Total 183 179 340 268 403 331 429 111 85 185 120 146 97 130 . Rural 140 281 311 325 66 120 80 63
Urban 304 498 589 618 236 360 311 291 Greater Bombay Total 406 405 555 509 593 479 601 352 326 479 411 431 329 415
Bombay Gujarat (Urban)
162 142 327 244 400 347 433 Total 100 78 197 129 166 117 152 Division Rural 129 276 324 346 68 149 114 99
Urban 279 499 616 65B 214 366 326 311 Banaskanilia ..• Tot.l 44 94 134 155 10 19 22 24
Rural 34 75 I" 103 117 4 8 10 10 Urban 220 407 542 589 119 203 183 175
• Sabarkantha ... Total 101 259 272 278 37 70 58 52 Rural 92 246 247 247 30 59 45 38 Urban 240 463 580 627 144 242 227 221
Mehsana '" Total 111 292 391 438 61 201 174 162 Rural 99 260 340 380 48 172 141 128 Urban 164
190 416 571 637 117
Iii? 316 288 278
Ahmedabad '" Total 228 407 281 501 376 535 158 265 154 220 142 202 Rural 146 304 347 368 75 150 105 85 Ur~n 300 500 601 631 235 374 313 292
Kaira ..• Total 221 189 450 282 472 345 482 142 103 254 140 192 liD 166 Rural 197 412 413 414 111 212 136 104 Ur~n 292 553 620 647 229 372 333 318
PaDch Mahala '" Total 114 228 231 232 42 79 67 61 Rural % 196 180 172 26 47 33 26 Urban 266 480 605 658 190 348 321 310
Baroda ... Total 128 283 430 490 79 207 198 194 Rural 100 249 368 419 59 166 14B 140 Urban 232 401 617 694 154 349 359 363
Broach •.• Total 241 411 466 491 152 235 158 123 Rural 213 372 422 446 Jl8 205 J33 100 Urban 386 592 656 683 336 378 270 224
Surat ... Total 203 224 363 339 454 427 495 150 127 273 181 223 155 202 Rural 170 311 386 421 120 228 173 149 Urban 348 575 694 738 283 455 413 397
Amreli ... Total 144 350 465 519 86 247 225 215 Rural 118 308 412 462 76 228 196 182 Urban 216 462 605 673 116 297 300 301
BombtlY Deccan Nor- Total 180 196 • 331 279 310 303 387 94 79 149 100 102 68 82 them Division Rur.l 147 282 294 300 61 97 53 33
Urban 284 4B2 572 607 19B 307 247 222 West Khandesb ... Total 170 192 321 26B 359 284 377 74 74 137 85 87 51 64
Rural 136 265 302 321 53 101 55 32 Urban 362 606 620 626 197 331 250 216
East Khandesh ... Total 267 236 467 339 507 375 525 159 81 246 103 137 60 91 Rural 237 434 460 471 126 198 97 55 Urban 334 539 607 636 230 353 226 173
Danga ... Total 75 126 106 97 9 IB 17 17
Nasik (Rural)
.. , Total 202 156 356 233 381 270 392 109 69 161 86 104 61 78 Rural 16B 298 291 288 64 94 48 29 Urban 314 541 632 667 254 365 274 233
Ahmednagar ... Total 195 173 323 236 326 250 327 97 64 126 83 84 54 64 Rural 171 286 270 263 73 8B 53 36 Urban 357 ·561 630 656 254 373 264 218
POODa '" Total 234 205 405 291 454 3~2 475 153 liB 227 154 180 liB 161 Rural 152 306 301 299 67 110 59 36 Urban 371 566 647 67j 294 413 355 333
Salara North '" Total 240 416 409 405 115 178 97 67 Rural 220 390 369 357 90 139 65 37 Urban 379 591 643 667 270 403 317 279
HO'A Bk H 91-33 .

330
SUBSIDIARY TABLE 7·1
Progress of Literacy
No. of Literate males per 1,000 males No. of Literate females per 1,000 females
Aged Aged Aged Aged Aged 5 Aged 5 Aged 15 Aged Aged Aged Aged Aged 5 Aged 5 Aged 15 5-9 5·9 5·14 5·14 and and and 5-9 5-9 5·14 5-14 and and and
State, Natural Division and on on on on up' up- up· on on on on up· up· up-District. wards wards wards wards wards wards·
on on on on on on
1 •. 3.51 1·3.41 1.3·51 1.3.41. 1·3·51 1.3·41 1·3·51 1.3.51 1.3.41 1·3·51 1.3.41 1.3·51 1.3--41 1·3.51
2 3 4 5 6 7 8 9 10 11 12 13 14 15
Satara South Total 123 279 333 358 52 95 71 59 Rural 112 253 280 292 44 74 47 34 Urban 153 347 464 515 73 153 131 121
Kolhapur ... Total 47 151 244 286 20 53 50 49 . Rural 37 123 182 210 12 23 18 16
Urban 86 251 447 526' 49 154 163 167 Sholapu_r ... Total 98 192 216 272 273 288 297 41 67 79 91 67 63 62
Rural 66 166 205 223 21 42 30 24 Urban 176 33B 421 453 86 165 151 144
Bombay DecceR South- Total 195 163 351 243 399 311 420 105 55 155 66 110 47 89 em Division Rural 170 311 341 354 73 lOB 70 53
Urban 265 I 463 559 599 201 290 220 190 ... Belgaum ... Total 178 142 324 206 347 267 357 119 43 162 64 113 49 91
Rural 146 275 280 282 79 113 77 61 Urban 276 474 552 585 251 321 226 184
Bijapur '" Total 169 128 312' 205 360 265 381 68 36 109 55 73 39 58 Rural 151 277 310 324 50 75 47 34 Urban 231 430 524 563 132 224 161 134
Dharwar ... Total 238 218 416 315 491 390 522 123 83 190 105 139 82 117 Rural 219 389 446 469 87 137 86 64 Urban 279 475 587 633 202 309 255 231
Bombay Konk_an Division Total 147 153 296 231 351 284 376 88 66 165 96 120 73 103 Rural 124 261· 295 311 64 123 80 64 Urban 270 475 589 630 221 382 326 304
Thana ... Total 182 162 324 232 387 266 410 113 70 208 98 165 77 148 Rural 135 259 286 297 67 135 88 69 Urban 311 503 601 631 252 404 366 352
Kolaba ... Total 150 140 287 197 332 252 354 75 50 137 73 105 60 92 Rural 135 262 294 309 55 100 76 67 Urban 299 506 634 686 267 453 364 327
Ratnagiri ... Total 110 139 269 222 315 275 341 63 57 131 84 85 62 68 Rural 103 254 288 307 55 113 69 52 Urban 180 414 559 632 145 302 256 237
Kanara ... Total 177 212 335 317 386 396 405 133 120 232 178 163 125 137 Rural 158 297 341 357 114 184 126 \04 Urban 238 451 538 576 193 370 272 233
SAlJRASHTRA Total 102 234 312 350 56 121 122 123 STATE Rural 62 158 207 232 18 52 54 54
Urban 191 3% 529 593 137 267 260 256 Halar Total 87 221 292 325 46 116 119 119
Rural 55 135 178 198 17 48 42 39 Urban 157 400 531 591 lOB 256 272 279
Madhya Saura. Total 123 275 357 397 71 158 160 161 shtra Rural 77 183 234 259 19 7'1 82 86
Urban 200 426 560 624 J;6 295 281 276 Zalawad •.• Total 95 217 295 334 60 131 129 128
Rural 56 142 195 222 It} 45 53 56 Urban 193 405 537 598 168 347 302 283
Gohilwad ... Total 104 221 308 353 55 110 111 111 Rural 59 154 215 247 20 48 48 49 Urban 214 381 521 590 147 261 253 250
Sorath _ .. Total 91 220 288 322 41 94 93 93 Rural 58 158 197 216 15 43 39 30 Urban 174 365 494 555 104 209 210 21 I
KUTCH STATE Total 122 222 278 305 S4 119 120 121 Rural 83 180 224 246 40 93 95 96 Urban 293 407 507 551 113 225 224 224

SUBSIDIARY TABLE 7' 2
LITERACY STANDARD OF LIVELmOOD CLASSES
Nllmber per 1,000 Males and 1,000 Females of each Livelihood Class by Literacy and Educational Standard
LIVELIHOOD CLASSES.
Agricultural Classes. Non-Agricultural Classes.
Educational Standard. I
Cultivators of land
~hollyor mainly owned
and their dependants.
II Cultivators
of land wholly or mainly
unowned and their
dependants.
III Cultivating I.bourers and their dependants.
IV Non-cultivating owners
of land; agricultural
rent receivers and their
dependants.
Persons (including dependants) who derive their principal means of livelihood from :-
V Production other than
cultivation.
VI VII VIII Commerce. Transport. Other
services and miscellaneous
sources.
Mnles. Females. Males. Females. Males. Females. Males. Females. Males. Females. Males. Females. Males. Females. Males. Females.
2
Literate
Middle School
... 274
8
Matriculate or S.L.C. Higher Secondary
Intermediate in Arts or Science
Degrees or Dip/cmas
Graduate in Arts or Science
Post-Graduate In Arts or Science
Teaching
Engineering
Agriculture
VeteRnary
Commerce
Legal
Medical
Others
Literate
Middle School
... 142
5
Matriculate or S.L.C. Higher Secondary
Intermediate in Arts or Science
3 4
70 188
5
39 81
2
5 6
37 158
3
18 64
7 8
28 456
54
17
4
3
2
9 10 II 12
BOMBAY STATE ...
226 392 152 496
12 ,31 8 77
2 10 2 36
6
2 5
2
SAURASHTRA STATE
15 273
37
6
124 252
5 20
2
83 455
3 120
17
2
13 14
316 359
24 63
7 51
7
6
2
2
273 229
23 88
3 24
3
15 16
206 355
25 52
7 38
6
8
8
2
3
3
108 261
22 64
3 19
4
17
208
23
10
2
2
3
128
22
6

SUBSIDIARY TABLE 7' 2 LITERACY STANDARD OF LIVELIHOOD CLASSES
Number per 1,000 Males and 1,000 Females of each Livelihood Class by Literacy and Educational Standard LIVELIHOOD CLASSES.
Agricultural Classes. Non-Agricultural Classes.
I II III IV Persons (including dependants) who derive their principal Culti vators " Cultivators Cultivating Non-cultivat- means of livelihood from :-of land of land labourers 109 owners
Edudtional Standard. wholly or wholly or and their of land; V VI VII VIlI
mainly owned mainly dependants. agricultural Production Commerce. Transport. Other and their unowned and rent receivers other than services and
dependants. their and their cultivation. miscellaneous dependants. dependants. sources.
Males.Females. Males.Females. Males.Females. Males.Females Males.Females. Males.Females. Males.Females. Males.Females.
1 2 3 4 5 6 7 8 '.9 10 II 12 13 14 15 16 17
DtSTeQ OT Dip70mas L _
Graduate in Arts or Science 3 3
Posl-Graduate 10 Arts or Science
T~ching 3
Engineering
Agriculture
Veterinary
Commerce
Legal
Medical 2
Olhers
KUTCH STATE
Literate '" 182 54 128 35 101 28 396 196 137 45 564 294 180 59 261 124
Middle School 3 B 4 38 B 9 3 21 5
Matriculate or S.L.C. Higher 4 14 3 9 Secondary
Intermediate In Arb ot ... 2 Science
Dezrees OT Diplomal
Gradus te in Arta or Science 2
Post.Graduate 10 Am at Scienc~
Teaching ~ ... Engineering 3
Agriculture
Veterinary
Commerce I Legal 1
Medical
Otheta

333
SUBSIDIARY TABLE 7'3
EDUCATIONAL SERVICES AND RESEARCH
Managers. Clerks Professors, Lec-Number per lakh of population.
Professors, Lec-and Servants of turers & Teachers turers, Teachers Professors, Lee- Professors, Lee-
Educational & Re- ether than those & Research Work- Total. turers, Teachers turers, Teacher. & search Institu- employed in ers employed in other than thtse Research Workers
State, Natural Division and District. tions including Universities, Universities, employed in employed in Libraries & Colleges & Colleges & Oniversities. Universities.
Museums etc. Research Research Colleges & Colleyes & Institutioll~. Institutions. Research Research .
Institutions. Institutions.
Males. Females. Males. Females. Males. Females. Males. Females.1 Males. Females. Males. Females.
2 3 4 5 6 7 8 9 10 " 12 13
BOMBAY, SAURASHTRA AND KUTCH 9,063 1,919 85,280 18,044 4,994 886 99,337 20,849 210 44 12 2
BOMBAY STATE ... 8,186 1,640 77,340 16,181 4,857 831 90,383 18,652 215 45 14 2
Greater Bombay .. _ 2,550 517 5,843 3,373 1,923 444 10,316 4,334 206 119 68 16
Bombay GujaTa! Division 1,387 168 22,755 4,677 861 104 25,003 4,949 200 41 8
Banaskantha 177 495 51 512 51 66 7 SabBrkBntha 8 11 1,033 208 1,041 219 151 30 Mehsana 32 15 3,014 357 66 9 3,112 381 205 24 4 1 Ahmedabad 53 49 3,660 1,264 250 29 3,963 1,342 217 75 15 2 KRira 424 54 3,940 638 82 4,446 692 244 40 5 Panch Mahala 44 1,413 218 1,457 218 123 19 Barod& 278 2,636 729 255 56 3,169 785 221 61 21 5 Broach 6 4 1,824 301 1,830 305 258 43 Surat 122 34 4,408 733 208 10 4,738 777 241 40 11 Amreli 403 1 332 178 735 179 105 56
Bombay Deccan NOTthern Division ._. 2,771 571 28,623 4,944 1.633 274 33,027 5,789 231 40 13 2
West Khandesh 43 14 2,748 338 2,791 352 240 29 East Khandesh 223 24 4,614 510 49 4,886 534 314 35 3 Dangs 28 58 4 86 4 123 B Nasik 193 55 3.110 552 43 I 3,346 608 217 39 3 Ahmednagar 90 55 2,842 361 304 41 3,236 457 201 26 22 3 Poona 1,109 206 5,111 1,570 968 183 7,188 1,959 262 80 50 9 Salara North 90 46 3,057 466 19 3 3,166 515 260 40 2 Satara South 90 10 2,190 454 23 2,303 464 219 45 2 Kolhapur 216 12 2,222 247 166 9 2,604 268 181 20 14 1 Sholapur 689 149 2,671 442 61 37 3,42! 628 177 29 4 2
Bomb'lY Deccan Southern Division 860 123 9,765 1,561 267 7 10.892 1,691 208 33 6
Belgaum 165 41 3,440 555 110 3 3,715 599 199 32 6 Bijapul" 282 17 2,692 299 28 3 3.002 319 193 21 2 Dharwar 413 65 3,633 707 129 1 4,175 773 231 45 B
Bombay Konk,an Division._. 618 261 10,354 1,626 173 2 11,145 1,889 222 35 4
Thana 204 22 3,208 581 40 3,452 603 211 38 3 Kolaba 67 10 1,591 307 1,658 317 175 34 Ratnagiri 294 83 4,196 597 51 4,541 680 245 35 3 Kaoara 53 146 1,359 141 82 2 1,494 289 262 27 16
SAURASHTRA STATE 855 234 7,053 1,614 126 55 8,034 1,903 170 39 3 1 • HaIar 204 18 740 163 48 9 992 190 129 28 B 2
Madhya Saurasht;~· 283 108 2,147 445 36 32 2,466 585 205 43 3 3 Zalawad 67 48 793 205 25 885 253 160 41 5 Gohilwad 170 29 1,712 367 1.882 396 168 36 Sorath 131 31 1,661 434 17 14 1,809 479 166 43 2
KUTCH STATE 22 45 887 249 11 920 294 156 44 2 YO_A. Bk H 91-34
BOMBAY: PRINTED AT THE GOVERNMENT CENTRAL PRESS_