Indian Institute of Technology Bombay
49
Indian Institute of Technology Bombay
-
Upload
khangminh22 -
Category
Documents
-
view
3 -
download
0
Transcript of Indian Institute of Technology Bombay

Indian Institute of Technology Bombay

DEPARTMENT
OF
ENERGY SCIENCE AND ENGINEERING
IIT BOMBAY
To develop sustainable
energy systems and
solutions for the future

RESEARCH
Conventional Energy
Energy efficiency,
Process Integration,
DSM, Benchmarking,
Underground Coal
Gasification, Waste to
Energy, Microgrids, Fuel
Cells
Renewable Energy
Solar PV, Solar Thermal,
Biomass, Novel
Batteries – Li , NaS,
Hydrogen Storage
Energy Systems
Analysis
Modelling and Simulation
Energy Planning and
Policy, Water and Energy
Lifecycle Analysis
0
2000
4000
6000
8000
10000
12000
14000
16000
1 2 3 4 5 6 7 8 9 10 11 12 13 14 15 16
Furnace number
SE
C (
kJ
/kg
)
Target SEC Actual SEC

The Future of India’s Electricity Sector: Moving away from Coal?
Rangan Banerjee
Department of Energy Science and Engg
IIT Bombay
Public Lecture Melbourne Energy Institute and Australia India Institute, June 6, 2017

5
India and Australia (Selected Indicators for 2014)
Population 1295 million 23.6 million
GDP (PPP) 6902 Billion 2010 US$ 1044 Billion 2010 US$
Primary Energy 34.53 EJ 5.24 EJ
Energy/person 26.6 GJ/person/year 221 GJ/person/year
Electricity/person 800 kWh/capita/year 10000 kWh/capita/year
CO2 emissions
CO2/Per population
CO2/GDP
2020 Million tonnes 374 Million tonnes
1.56 tonnes /capita/year 15.81 tonnes /capita/year
0.29 kg /2010US$ 0.36 kg /2010US$
Source: IEA, Key World Energy Statistics 2016
http://www.iea.org/statistics/statisticssearch/report/?country=INDIA&product=indicators&year=2016

6

Issues/Questions
Why focus on electricity? Human Development Index (HDI) – Electricity linkage
Trends in Electricity installed capacity, generation
Changes in the supply mix- last 40 years
Recent policy changes
7

13
AustraliaSwitzerland
2013 India
United States
0.000
0.100
0.200
0.300
0.400
0.500
0.600
0.700
0.800
0.900
1.000
0 5000 10000 15000
Hum
an D
evelo
pm
en
t In
dex (
HD
I)
Annual Electricity consumption/ capita (kWh)
HDI and Electricity consumption (2013)
World
2035 India
1980 India
Netherlands
Russia
Pakistan
0.80-0.93
0.71 - 0.8
Very High HDI
High HDI
Medium HDI
Low HDI
0.57 - 0.70
0.41 - 0.55

0
50000
100000
150000
200000
250000
300000
350000
400000
1977 1982 1987 1992 1997 2002 2007 2012
Inst
alle
d C
apac
ity(
MW
)
Year
India Electricity Installed Capacity Growth

India Electricity Generation Trend
0
200000
400000
600000
800000
1000000
1200000
1400000
1600000
1977 1982 1987 1992 1997 2002 2007 2012
Gen
erat
ion
(GW
h)
Year

Growth in Coal
11
0
100
200
300
400
500
600
700
18
60
18
65
18
70
18
75
18
80
18
85
18
90
18
95
19
00
19
05
19
10
19
15
19
20
19
25
19
30
19
35
19
40
19
45
19
50
19
55
19
60
19
65
19
70
19
75
19
80
19
85
19
90
19
95
20
00
20
05
20
10
20
15
An
nu
al
Pro
du
cti
on
(m
illio
n t
on
nes)
Year
Production
Source: Coal Statistics 2015-16, GOI, Ministry of Coal, Kolkatta

Age Profile of Thermal Plants
0 5000 10000 15000 20000 25000
1
4
7
10
13
16
19
22
25
28
31
34
37
40
43
46
49
52
55
Capacity (MW)
Capacity (MW)
0 5 10 15 20 25 30 35 40
1
4
7
10
13
16
19
22
25
28
31
34
37
40
43
46
49
52
55
No. of units
No. of units
Plants exceeding
operational life
Plants exceeding
mid life
29.6% (179) plants have exceeded operational plant life
14.5% (23783 MW) capacity has exceeded operational plant life
55.7% (336) plants have exceeded mid plant life
36.4% (59908 MW) capacity has exceeded mid plant life

Power Generation – Supply mix
Thermal NuclearRenewables and Hydro
10

Power Generation – Supply mix
Thermal NuclearRenewables and Hydro
11

2016-17 shares - Installed Capacity and Generation
326848 MW All India installed capacity
Source: GOI, Ministry of Power, New Delhi, India GOI, Ministry of Power, Central Electricity Authority, New Delhi, India
Coal, 192163, 59%
Nuclear, 6780, 2%
Natural Gas, 25329, 8%
Hydro (Res.), 41267
Diesel, 838, 0%
Renewables, 57260, 17%
Thermal994.2302
80%
Nuclear37.9159
3%
Hydro122.3776
10%
Renewable 81.8687
7%
Bhutan (import)5.6173
0%
1242 BU All India generation

Renewable share?
16
What will be the future supply mix for the Electricity sector ?
How much can renewables and nuclear supply?
Can we quickly move away from coal?

Imports of Coal
17Source: Ministry of Coal, GOI
0.0
50.0
100.0
150.0
200.0
250.0
300.0
1990 1992 1994 1996 1998 2000 2002 2004 2006 2008 2010 2012 2014 2016
Imp
ort
(M
illio
n t
on
nes
)
Year
Non-Coking Coal Coking Coal Total

0
2
4
6
8
10
12
14
2001 2002 2003 2004 2005 2006 2007 2008 2009 2010 2011 2012 2013
Renewable Installed Capacity
Renewable Generation
Nuclear generation Nuclear Installed Capacity
Renewable Share in Power
20
19
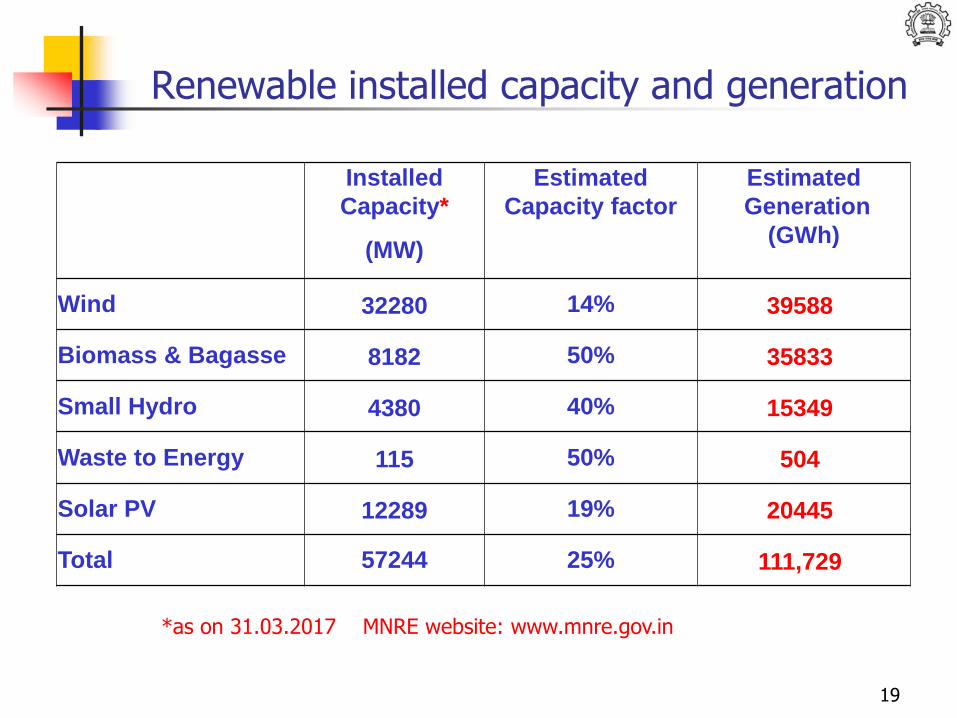
Renewable installed capacity and generation
*as on 31.03.2017 MNRE website: www.mnre.gov.in
Installed
Capacity*
Estimated
Capacity factor
Estimated
Generation
(GWh) (MW)
Wind 32280 14% 39588
Biomass & Bagasse 8182 50% 35833
Small Hydro 4380 40% 15349
Waste to Energy 115 50% 504
Solar PV 12289 19% 20445
Total 57244 25% 111,729

Renewable Generation 2015-16
20Source: Prayas Oct 2016 India’s journey towards 175 GW

India’s INDC
#1 Reduce Emissions Intensity of GDP by 33-35% of 2005 level in 2030
#2 Create 40% cumulative non fossil power by installed capacity by 2030 (using finance from Green Climate Fund)
#3 Create an additional carbon sink of 2.5 to 3 billion tonnes of CO2 equivalent through additional tree cover and forest
21
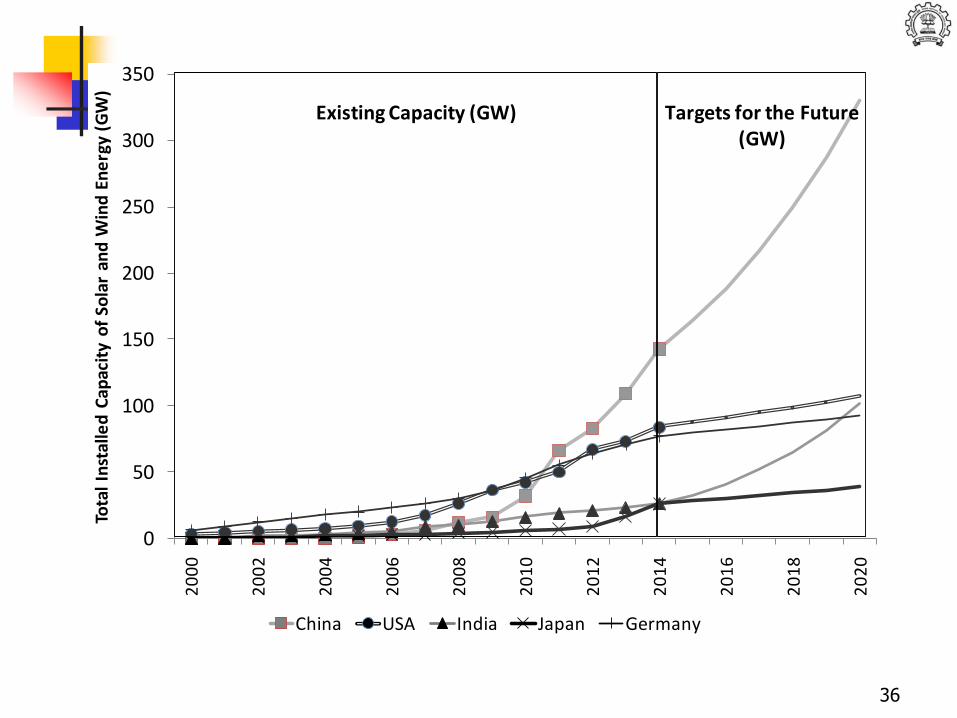
0
50
100
150
200
250
300
350
20
00
20
02
20
04
20
06
20
08
20
10
20
12
20
14
20
16
20
18
20
20
Tota
l In
stal
led
Cap
acit
y o
f So
lar
and
Win
d E
ne
rgy
(GW
)
China USA India Japan Germany
Existing Capacity (GW) Targets for the Future (GW)
36

Variation in Solar Price Bids
23
0
1
2
3
4
5
6
7
8
9
10
11
12
Ta
riff
Bid
Rs/k
Wh
Aus 6 c/kWh
Aus 10 c/kWh
Aus 20 c/kWh

World’s largest solar power plant
24
648 MW 46540 Million~ Rs 72 Million/ MW (Aus 930 Million $ or 14.4 Million$/MW)Area 10 km2 Kamothi, Tamil NaduRobotics for automatic panel cleaningPlant built in 8 months
http://www.indiatimes.com/news/india/india-is-now-home-to-the-world-s-largest-solar-power-plant-it-s-big-enough-to-power-150-000-homes-266449.html

25
Comparison of Supply technologies
GenerationTechnology
SIZERANGE(GW)
COST RsMillion /MW
Rs/kWh
CAPACITY FACTOR
AREA(m2/GWh)
CO2
Equivalent(gC02/kWh)
WATERl/MWh
COAL 0.1-4 50-60 3.5 0.8-0.9 200-400 820 1000
CCGT 0.1-1.5 40-50 3 0.5 -0.8 100 490 500
SOLAR PV 0.001-0.75
50-70 3-5.5 0.25 385 48 100
SOLARTHERMAL
0.01-0.5 100-150 12 0.25-0.29 300 48 3500
HYDRO 2.4-0.1 50-60 2.5-3.0
0.38-0.5 1374 24 17000
NUCLEAR 9.9-0.44 65-80 6-7 0.8-0.9 120 12 1000
WIND 1-0.1 60 4.5 -5.0
0.25 125 11 0
http://www.indiaenvironmentportal.org.in/files/file/solar%20energy%20in%20India.pdf

Power Generation – Supply mix
Thermal NuclearRenewables and Hydro
11

Supply Scenarios for 2035 Electricity- High Renewables
Supply Scenario Green
(Coal Low, Nuclear High,
Renewables Moderately
High )
Projections for 2035 Coal
Natural
Gas Diesel Nuclear Hydro Renewables Total
% Electricity Supply Share 40% 12% 2% 13% 11% 22% 100%
Electricity Supply/ year (in
billion kWh) 1530 459 76 497 421 841 3824
Average Load Factor 70% 70% 16% 70% 38% 26%
Installed Capacity (in GW) 249 75 55 81 126 369 956
27

Daily Load Profile- India
28
0
20
40
60
80
100
120
140
0 4 8 12 16 20 24
GW
Time of day (hours)
Jan-16

Coal Power plants PLF
29

Future Coal Requirement (2035)
30
0
200
400
600
800
1000
1200
1990 1995 2000 2005 2010 2015 2020 2025 2030 2035
Co
al f
or
Po
we
r Se
cto
r (M
illio
n t
on
ne
s)
Year
Domestic
Imports
Total
Projections
forecast
?

Non Fossil Electricity
• 175 GW Target Achievable
• Low Capacity factors- High daily and seasonal variability
• Financing issues – Initial capital –Reduction in GDP, Equity impacts
• Need for R&D and indigenization
26

California: Duck Curve
32https://www.caiso.com/Documents/FlexibleResourcesHelpRenewables_FastFacts.pdf

Estimated Future Load Curve (2035)
33
0
50
100
150
200
250
300
350
400
450
500
0 4 8 12 16 20 24
GW
Time of day (hours)
Jan- 2035

Thrust on Energy R&D
• Consortium Approaches
• Grand Challenges – Innovation
• Incubation and Innovation
• Clean Coal, Storage, Cost Effective Renewables Energy Efficiency, New processes etc..
27
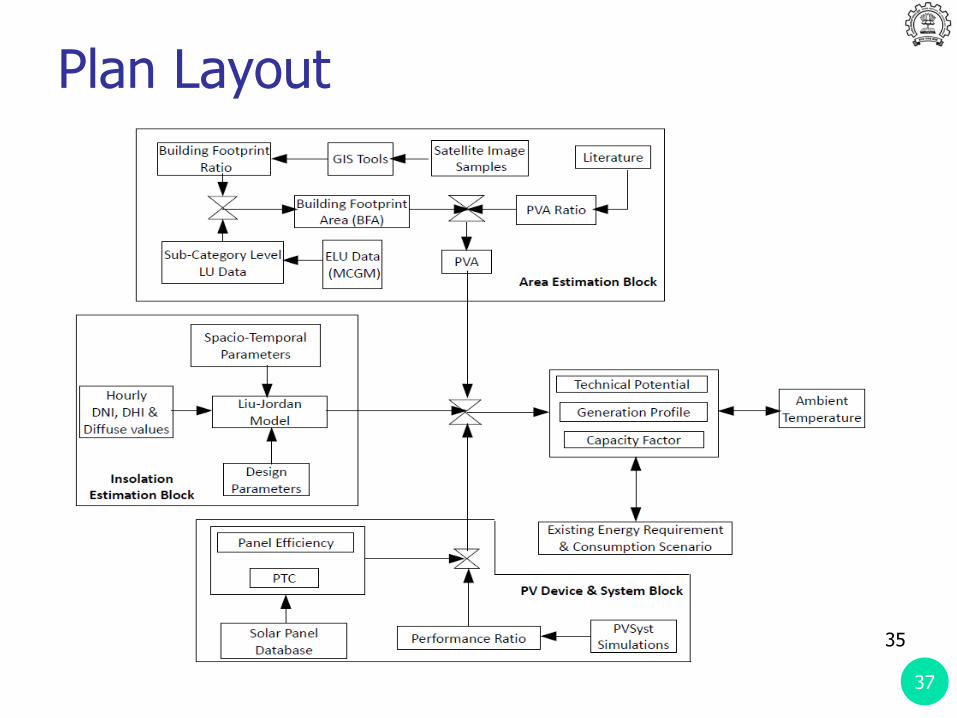
Plan Layout
35
37

38
A portion of the ELU map of Ward A of MCGM
Corresponding Satellite Imagery for the area from Google Earth
Analyzed in QGIS 1.8.0To determine-Building Footprint Ratios- Usable PV AreasFor Sample Buildings
Source: R. Singh and Banerjee, 2015

37
0
0.5
1
1.5
2
2.5
0:0
1-
1:0
0
1:0
1-
2:0
0
2:0
1-
3:0
0
3:0
1-
4:0
0
4:0
1-
5:0
0
5:0
1-
6:0
0
6:0
1-
7:0
0
7:0
1-
8:0
0
8:0
1-
9:0
0
9:0
1-1
0:0
0
10
:01
-11:0
0
11
:01
-12:0
0
12
:01
-13:0
0
13
:01
-14:0
0
14
:01
-15:0
0
15
:01
-16:0
0
16
:01
-17:0
0
17
:01
-18:0
0
18
:01
-19:0
0
19
:01
-20:0
0
20
:01
-21:0
0
21
:01
-22:0
0
22
:01
-23:0
0
23
:01
-24:0
0
MU
s
Jan, 2014 Typical Load Profile vs
PV Generation
1-Axis
Tracking @
Highest eff.
1-Axix
Tracking @
Median eff.
19 deg. Fixed
Tilt @
Highest eff.
0.115
0.125
0.135
0.145
0.155
0.165
0.175
0.185
Jan Feb Mar Apr May Jun Jul Aug Sep Oct Nov Dec
Capacity Factor for
Mumbai
1-Axis Tracking
Fixed Tilt @ 19
deg.
Annual Average
with 1-Axis
Tracking
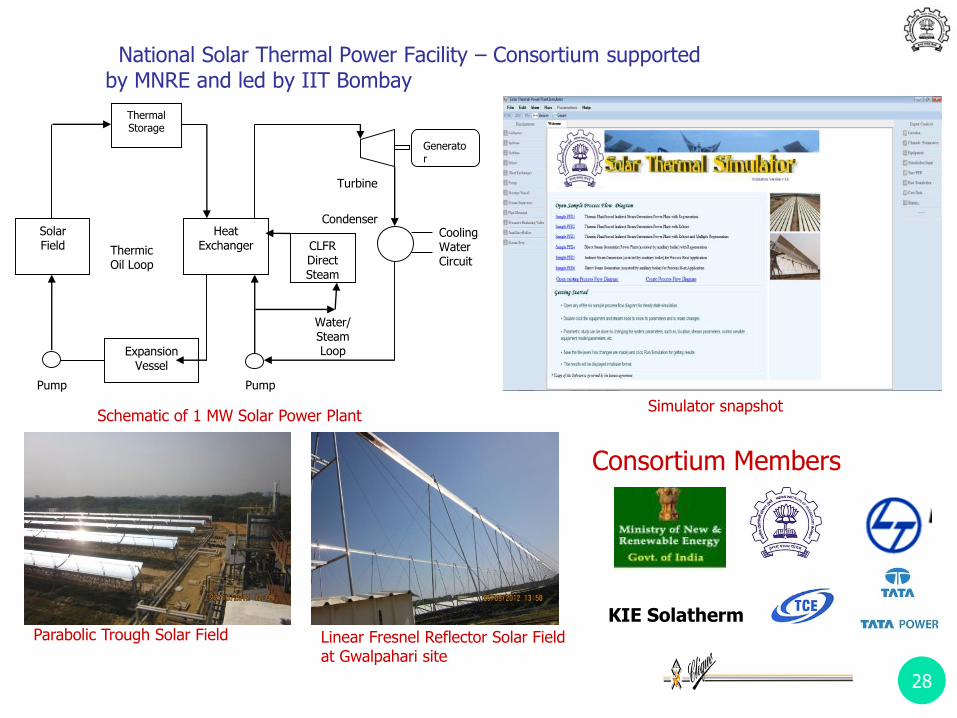
National Solar Thermal Power Facility – Consortium supported by MNRE and led by IIT Bombay
Thermal Storage
Solar Field
Expansion Vessel
Heat Exchanger
Generator
Condenser
Turbine
PumpPump
Cooling Water Circuit
Water/ Steam Loop
ThermicOil Loop
CLFR Direct Steam
Schematic of 1 MW Solar Power PlantSimulator snapshot
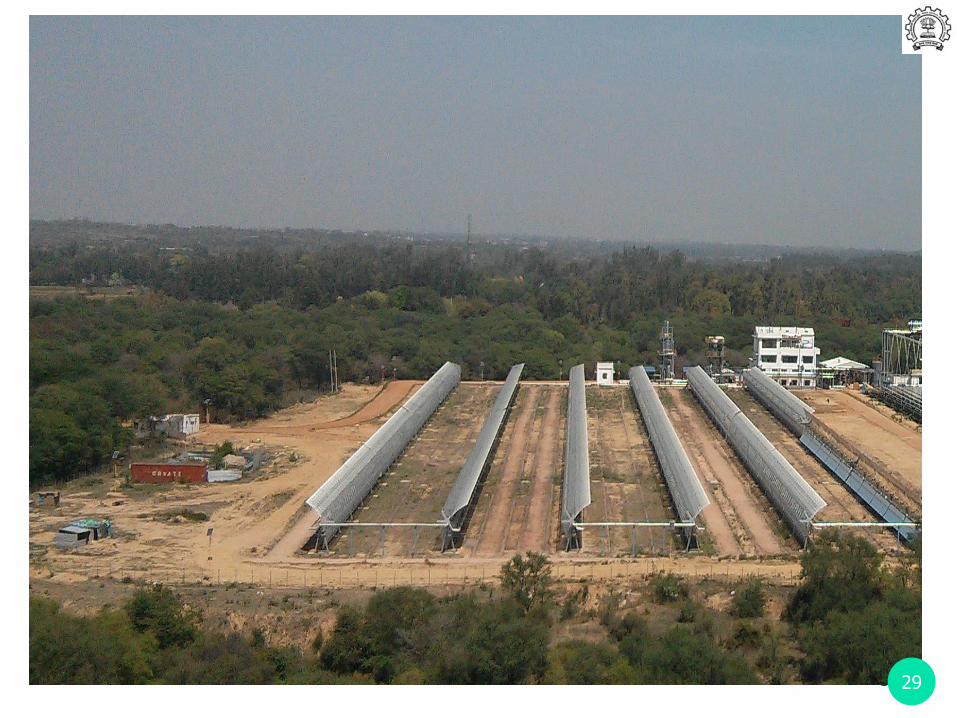
Parabolic Trough Solar Field Linear Fresnel Reflector Solar Field at Gwalpahari site
Consortium Members
KIE Solatherm
28
3929

40 30

Prototype for 24 x 7 Solar Thermal Power
Development of indigenous heliostat
Development of improved LFR with steam storage using PCM
Development of molten salt loop and stratified storage
31
Temperature
°C
1 290 Flow
2 550 Flow
3 550 No Flow
4 290 No Flow
Heat transfer fluid is molten salt
flow
condition
Heat Exchanger
Stratifiedmolten salt
Storage
Solar tower
1
2
3
4
Molten saltPump for tower
Molten saltPump for H.X
Water
Superheatedsteam
DESE- IIT Bombay
Partners: Clique Consultants, Mumbai
KGDS Renewable Energy, Coimbatore
Sponsored by NETRA –NTPC Ltd

TEAM SHUNYASOLAR DECATHLON EUROPE 2014
32

House in Versailles – 26th June, 2014
33
Team Shunya
70 students 13 disciplines 12 faculty

House assembly process
34

Team Shunya’s Solar House “H Naught”
35

Summary / Conclusions
Transition to higher renewable share
Variability / Improved forecasting
Need for Balancing / DSM/ Demand Response and Storage
Roof top/ Zero Energy Buildings
Challenge of Affordability –Paying for the transition
Impact on Development and Equity
Coal will reduce – but still be significant-40% (lower may be difficult) 46
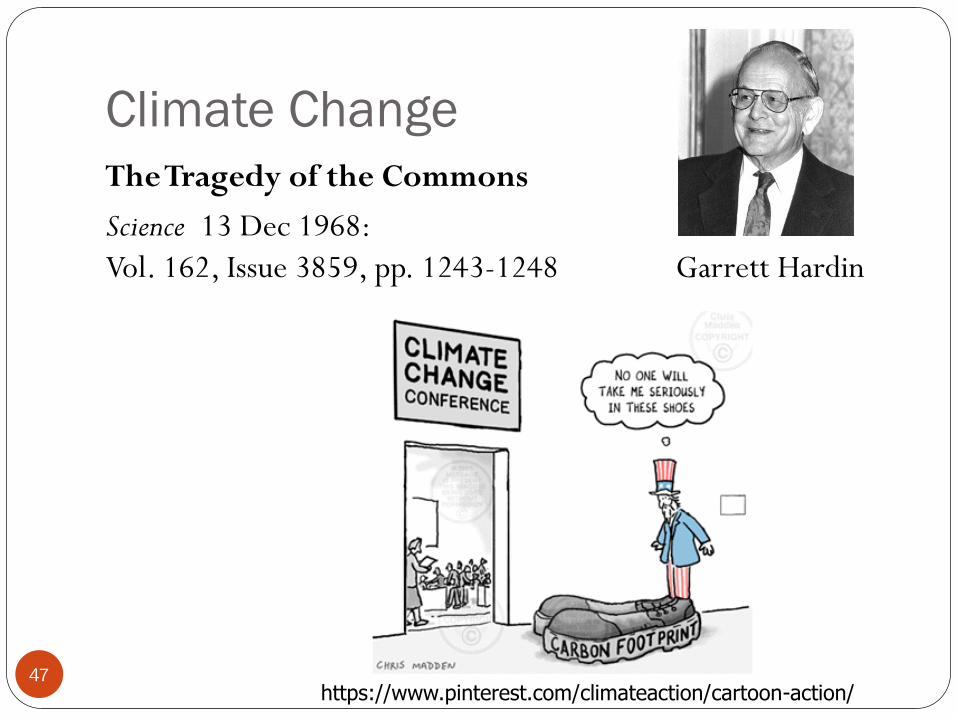
Climate Change
47
The Tragedy of the Commons
Science 13 Dec 1968:
Vol. 162, Issue 3859, pp. 1243-1248 Garrett Hardin
https://www.pinterest.com/climateaction/cartoon-action/

Acknowledgment
Balkrishna Surve
Tejal Kanitkar
Thank [email protected]@gmail.com
26
Rhythm Singh
Vikrant Singh D
Pankaj KumarJani Das
Indraneel Naik

IEA, Key World Energy Statistics 2016.
Ministry of Power, Government of India, http://powermin.nic.in/en/content/power-sector-glance-all-india
CEA, MOP, GOI: Government of India Central Electricity Authority , Monthly Reports, http://www.cea.nic.in
R. Singh and Banerjee, 2015: Singh, R., and Banerjee, R., Estimation of rooftop solar
photovoltaic potential of a city, Solar Energy, Vol. 115, 589-602, May 2015.
Provisional Coal Statistics 2015-16, Government of India, Ministry of Coal, Kolkatta.
Tejal Kanitkar, Rangan Banerjee, T. Jayaraman, Impact of economic structure on mitigation targets for developing countries, Energy for Sustainable Development, Volume 26, June 2015, Pages 56-61, ISSN 0973-0826, http://dx.doi.org/10.1016/j.esd.2015.03.003.
Ministry of Coal, Government of India, http://coal.nic.in/content/production-supplies
References
49