Annual Report.p65 -!! Indian Institute of Pulses Research ...
Upload
khangminh22Category
view
4download
0


iPB i
ANNUAL REPORT 2017-2018INDIAN INSTITUTE OF GEOMAGNETISM
INDIAN INSTITUTE OF GEOMAGNETISM


iiiPB iii
ANNUAL REPORT 2017-2018INDIAN INSTITUTE OF GEOMAGNETISM
CONTENTS
Governing Council of the Institute ...................................................................................................................................... iv
Functional Committees (Research Advisory Committee and Finance Committee) ............................................................ v
From the Director’s Desk .................................................................................................................................................... vii
Geomagnetic Data Based Research .................................................................................................................................. 1
Upper Atmospheric Research............................................................................................................................................. 3
Solid Earth Research.......................................................................................................................................................... 31
Polar Science Research ..................................................................................................................................................... 40
Field Surveys ...................................................................................................................................................................... 42
Publications ........................................................................................................................................................................ 43
Impact Factor...................................................................................................................................................................... 49
Invited Talks and Lectures .................................................................................................................................................. 50
Participation in Conferences/ Meetings/ Seminars ............................................................................................................. 50
Students Corner ................................................................................................................................................................. 53
Deputations/Visits Abroad .................................................................................................................................................. 54
Distinguished Visitors ......................................................................................................................................................... 55
Honours and Awards .......................................................................................................................................................... 56
Training Imparted ............................................................................................................................................................... 57
Particiapation in Specialized Workshops/Training Courses ............................................................................................... 58
Offi cial Language (Hindi) .................................................................................................................................................... 59
Science Outreach Activities ................................................................................................................................................ 60
Computer Facilities ............................................................................................................................................................. 66
Library and Documentation ................................................................................................................................................ 67
Special Events .................................................................................................................................................................... 67
IIG Staff Welfare and Recreation Club ............................................................................................................................... 69
Corporate Social Responsibilities ....................................................................................................................................... 71
In Service of the Nation ...................................................................................................................................................... 72
Organizational Chart of the Institute ................................................................................................................................... 74

viv v
ANNUAL REPORT 2017-2018INDIAN INSTITUTE OF GEOMAGNETISM
GOVERNING COUNCIL OF THE INSTITUTE01 Prof. A. Sen
Emeritus Professor & INSA Sr. ScientistInstitute for Plasma ResearchNear Indira Bridge, Bhat, Gandhinagar – 382 428.
Chairman
02 Secretary or his NomineeDepartment of Science and TechnologyTechnology Bhavan, New Mehrauli Road, New Delhi – 110 016.
Member
03 The Joint Secretary and Financial AdviserDepartment of Science and TechnologyTechnology Bhavan, New Mehrauli Road, New Delhi – 110 016.
Member
04 Dr. R. SridharanNASI Sr. ScientistPhysical Research LaboratoryNavarangpura, Ahmedabad – 380 009.
Member
05 Prof. Sankar Kumar NathProfessor [HAG]Department of Geology & GeophysicsIndian Institute of Technology KharagpurMidnapore (West), Kharagpur – 721302.
Member
06 Dr. Anil BhardwajDirectorPhysical Research Laboratory, Ahmedabad – 380009.
Member
07 Prof. Sibaji RahaDirector, Bose Institute93/1, Acharya Prafulla Chandra RoadKolkata – 700 009.
Member
08 Dr. T. RadhakrishnaEmeritus Scientist, National Centre for Earth Science StudiesPost Box No.7250, Akkulam,Thiruvananthapuram – 695 011.
Member
09 Dr. Virendra M.TiwariDirectorCSIR-National Geophysical Research Institute,Uppal Road, Hyderabad – 500 007.
Member
10 Dr. D.S. RameshDirectorIndian Institute of Geomagnetism
Member
11 Prof. S. Gurubaran (up to June 2017)Administrative CoordinatorIndian Institute of Geomagnetism
Non-Member Secretary
12 Mrs. Kamala Paidipati (from July 2017)RegistrarIndian Institute of Geomagnetism
Non-Member Secretary

viv v
ANNUAL REPORT 2017-2018INDIAN INSTITUTE OF GEOMAGNETISM
FUNCTIONAL COMMITTEESRESEARCH ADVISORY COMMITTEE OF THE INSTITUTE
01 Dr. R. SridharanNASI Sr. ScientistPhysical Research LaboratoryNavarangpuraAhmedabad – 380 009.
Chairman
02 Dr. P. Rajendra PrasadSir Arthur Cotton Geospatial Chair ProfessorDept. of Geophysics, Andhra UniversityVisakhapatnam – 530 003.
Member
03 Prof. A. JayaramanEx - DirectorNational Atmospheric Research Laboratory,Dept of Space, Govt of India,Gadanki – 517 112
Member
04 Dr. K. Rajeev(AACCR)Space Physics LaboratoryVikram Sarabhai Space CentreThiruvananthapuram – 695 022.
Member
05 Dr. M. RadhakrishnaProfessorDept. of Earth SciencesIIT, Bombay
Member
06 Prof. K. VijaykumarProfessorSchool of Earth SciencesSRTM UniversityNanded – 431 606
Member
07 Dr. D.S. RameshDirectorIndian Institute of Geomagnetism
Member
08 Dr. Satyavir SinghProfessor - F, (Convenor-RAC)Indian Institute of Geomagnetism
Non-Member Secretary

viivi vii
ANNUAL REPORT 2017-2018INDIAN INSTITUTE OF GEOMAGNETISM
FINANCE COMMITTEE OF THE INSTITUTE
01 Prof. A. SenEmeritus Professor & INSA Sr. ScientistInstitute for Plasma ResearchNear Indira Bridge, BhatGandhinagar – 382 428.
Chairman
02 The Joint Secretary and Financial AdviserDepartment of Science and TechnologyTechnology Bhavan, New Mehrauli RoadNew Delhi – 110 016.
Member
03 Dr. D.S. RameshDirectorIndian Institute of Geomagnetism
Member
04 Prof. S. Gurubaran (up to June 2017)Administrative CoordinatorIndian Institute of Geomagnetism
Member
05 Mrs. Kamala Paidipati (from July 2017)RegistrarIndian Institute of Geomagnetism
Member
06 Mr. Suresh Kumar KoyyaguraAccounts OfficerIndian Institute of Geomagnetism
Non-Member Secretary

viivi vii
ANNUAL REPORT 2017-2018INDIAN INSTITUTE OF GEOMAGNETISM
From the Director’s Desk…..As a critical nation-building organisation, IIG continues to make forays through scientifi c and technological advancements in deciphering the processes involved in interior earth and near space environment. The vision of IIG is to enable India become a global knowledge centre in Geomagnetism and allied fi elds. The Institute’s mandate is also to maintain and modernize the magnetic observatories under its magnetometer network, establish new observatories and publish high quality data as Indian Magnetic Data volumes. The magnetic records from these observatories serve as useful tools for the study of electrical current systems fl owing in the near space environment, the understanding of which has a bearing on monitoring and assessing the health of satellite navigation systems. It is heartening to note that a total of 700 users are registered with the World Data Center (WDC) website. Around 2500 data fi les have been accessed and downloaded from the WDC website by the end scientifi c users worldwide.A close connection must exist between research outcomes and how science is conducted. This drive and commitment to excellent science is central to the way IIG is structured. During the year, through its fl agship science programs, we have responded promptly so as to produce outstanding science in Geomagnetism and allied fi elds. Forecasting of the solar cycle characteristics is vital in understanding the space weather. Addressing this issue, two different models have been developed to predict peak of solar cycle (SC), and length of solar cycle. Employing Shannon Entropy estimates, the inherent randomness in the SC is found to vary with the phase as it progresses. The prediction has revealed a superior correlation coeffi cient of 0.94, suggesting that the upcoming SC 25 would be significantly weaker. The connection between geomagnetic pulsations and cosmic noise absorption (CNA) at Maitri, Antarctica has been obtained using transfer entropy technique. The enhancement in the cosmic noise absorption (CNA) is observed during the early recovery phase (15 - 18 UT) of the largest storm of the current solar cycle, i.e. 17th March, 2015. During this time the CNA pattern also revealed oscillation in the Pc5 (2 - 7 mHz) range and is in simultaneity with geomagnetic pulsations in the same frequency range. Absence of Electro-Magnetic Ion-Cyclotron (EMIC) waves suggests the possible role of VLF waves in precipitation. The reason for the intense CNA production is found to be the precipitation caused mainly by hiss-driven sub-relativistic electrons. Transfer Entropy method has confi rmed the modulation of CNA by geomagnetic pulsations.Under the program “Integrated studies on the earth’s upper atmosphere using ground and space-based instrumentation and numerical modeling tools” researchers at IIG are devoted to study the atmospheric tides. The role of storm-time electrodynamics in suppressing the equatorial plasma bubble (EPB) development was investigated using multi-instruments over India during a moderate geomagnetic storm that occurred on 02 October 2013 where Dst minimum reached ~ -80 nT. This storm produced unique signatures in the equatorial ionosphere such that EEJ strength showed signatures of an abrupt increase of its strength to 150 nT and occurrence of episodes of CEJ events. Observations further showed the presence of strong F3 layers at multiple times at multiple stations due to under-shielding electric fi eld. An interesting observation is thae simultaneous presence of F3 layers and suppression of EPBs in the dusk sector during the recovery phase. However, strong EPBs observed before and after the day of the geomagnetic storm, suppression of the EPBs on the storm day during ‘spread F season’ is fascinating. It can be surmised from these results that the altitude/latitude variation of Disturbance Dynamo Electric Fields (DDEFs)/disturbance winds may be responsible for simultaneous detection of F3 layers, occurrence of low latitude Es layers and suppression of EPBs during the storm day along the sunset terminator.Observations of zonal winds from the TIMED Doppler Interferometer (TIDI) instrument on board the Thermosphere Ionosphere Mesosphere Energetics and Dynamics (TIMED) satellite have been used to establish the resultant local time-longitude map of CEJ occurrence rate having a strong infl uence of the diurnal eastward propagating wave number 3 (DE3) non-migrating tide during July-September months. This is also accounted for the reduction of CEJ occurrence at certain longitudes which have implications for understanding the seasonal and longitudinal variations of CEJ. A method was developed to forecast the time of occurrence or non-occurrence, strength and probable location of L-band scintillations using GAGAN data, which will enable the service providers and users to take appropriate action to mitigate the effects and optimize the services. The potential of the simple technique to predict the 2 D maps of maximum probable scintillation index for the whole night has been demonstrated which with more refi nements could evolve

ixviii ix
ANNUAL REPORT 2017-2018INDIAN INSTITUTE OF GEOMAGNETISM
into a viable forecast or forewarning system.A study of two types of wavelike features namely, quasi-periodic waves and single band of enhanced intensity (SBEI), at thermospheric altitudes was carried out from the Indian dip equatorial station Tirunelveli, with the help of OI 630 nm all sky nightglow images during the period January 2013-January 2015. The estimated phase speed and wavelength of the quasi-periodic waves were in the range of 70-160 m/s and 130-575 km, respectively, whereas the phase speed and full width at half maxima (FWHM) of the SBEI features were in the range of 150-250 m/s and 230-470 km, respectively. The quasi-periodic waves observed here are interpreted as probable signatures of either primary or secondary GWs at thermospheric altitudes. The exact generation mechanism of the SBEI features is yet to be ascertained.Coseismic travelling ionospheric disturbances (CTIDs) and their propagation characteristics during Mw 7.8 Gorkha earthquake in Nepal on 25 April 2015 were investigated using a suite of ground based GPS receivers and broad band seismometers along with the space borne Radio Occultation observations over the Indian subcontinent region. Direct evidence for acoustic gravity wave signatures at F2-layer peak heights (300- 450 km) were found, for the fi rst time, in the vertical GPS-RO profi les. It is however inferred that the velocities of fast mode CTIDs are signifi cantly smaller than the surface Rayleigh wave velocity (~3.7 km/s), indicating that they are not the true imprint of Rayleigh wave, instead, can probably be attributed to the superimposed wave front formed by the mixture of acoustic waves excited by main shock and propagating Rayleigh wave. Using COSMIC Radio Occultation observations during the low solar activity period reveals that the annual ionospheric anomaly is primarily dominant at southern hemisphere at all local times; with signifi cant enhancements at EIA crest latitudes during noon to afternoon hours and at high latitudes during night times. These results provide new insights to the responsible mechanisms behind the ionospheric annual anomaly and its local time, latitude and longitudinal variation. A novel Artifi cial Neural Network (ANN) based two-dimensional Ionospheric Model (ANNIM) has been developed to predict the ionospheric NmF2 and hmF2 using long term COSMIC Radio Occultation data. The ANNIM has also captured the global scale ionospheric phenomena such as Ionospheric Annual Anomaly, Weddell Sea Anomaly and Mid-latitude Summer Nighttime Anomaly. Compared to IRI-2016 model, the ANNIM is found to better represent the fi ne longitudinal structures and the mid-latitude summer night time enhancements in both the hemispheres.Under the Space Weather Response of Magnetosphere-Ionosphere-Thermosphere System to Solar Driven Transient and Recurrent Forces science program, IIG scientists have deciphered the intricacies associated with the St. Patrick’s Day storm of 17 March 2015. This has a long-lasting main phase with the Dst reaching a minimum of ~223 nT. Two strong prompt penetration electric fi eld (PPEF) phases took place during the main phase; fi rst with the southward turning of IMF Bz around ~1200 UT and the second with the onset of a substorm around ~1725 UT leading to strong equatorial zonal electric fi eld enhancements. The strong eastward penetration electric fi eld caused rapid uplift of equatorial F layer over Brazilian sector and additional stratifi cation of layer into F2 and F3 layers. The enhanced zonal electric fi led due to PPEF led to the strong super fountain effect under which the anomaly crest departed poleward to ~40°S latitude. A new computer based automatic storm detection method is developed to identify the geomagnetic storms in Dst index by applying four selection criteria that minimize non-storm-like fl uctuations. This method is applied to identify the storms in Kyoto Dst and USGS Dst in 50 years (1958-2007). Based on TEC observations by India’s GPS Aided Geo Augmentation Network (GAGAN), the dayside low latitude ionospheric variations over the Indian region during the moderate main phase step-I of the 17 March 2015 geomagnetic storm is reported. Also, the effi cacy of GPS inferred TEC maps by International GNSS service (IGS) is assessed in capturing large scale diurnal features of equatorial ionization anomaly (EIA) over the Indian region during this period. The anomalies between the GAGAN TEC and IGS TEC maps are examined in terms of the possible limitations of the IGS TEC maps in capturing storm time EIA variability over the Indian region.Theoretical and numerical simulation studies of space plasma processes are being nurtured by the scientists of IIG. One-dimensional Particle-in-Cell simulation of the head-on collision of multiple counter-propagating ion acoustic coherent phase space structures in the space plasma is performed and a new mechanism of electron acceleration via interaction of multiple coherent waves has been proposed. Such local electron acceleration may be relevant to the energetic electrons observed in the planetary magnetospheric plasmas. These simulations are performed to examine the proxies for the breaking of coherent ion acoustic wave structures in space plasma, which shows that both electron trapping velocity and ponderomotive potential maximize at the time of wave breaking. An automated algorithm is developed to detect the presence of Electro Magnetic Ion Cyclotron (EMIC) waves in the Earth’s magnetosphere. The algorithm documents the basic information about each wave activity, like the wave frequency, local cyclotron frequency, start and end time of the wave event, magnetic latitude (MLAT), magnetic local time (MLT) and L shell of occurrence, wave band (proton, helium or oxygen), and the geomagnetic indices like AE and SYMH during the event. The role of substorm ion injections in triggering EMIC waves have been studied in detail for the fi rst time. An EMIC wave event occurred on 09 August 2015 was found to be triggered due to the arrival of substorm injected hot anisotropic ions.During 2017-2018, the research activities were focused towards the investigation of supermagnetic storms, sources of plasmaspheric hiss emissions and electrostatic solitary waves in the Lunar wake. An important fi nding on the supermagnetic storm research is that it is not possible to make a precise prediction of when and how often an extreme supermagnetic storm with similar and higher intensity than that of Carrington event could occur. It is estimated that O atoms and O+ ions uplifted by prompt penetrating electric fi eld during supermagnetic storms can produce about 40-times-greater satellite drag per unit mass than normal. Another important outcome of the study was explanation for the electrostatic solitary waves observed in the Lunar wake in terms of theoretical model based on slow & fast ion-acoustic and electron-acoustic solitons.Rare Observation of Daytime Whistlers at Very Low Latitude were studied and results reveal for the fi rst time, a rare observations of whistlers during sunlit hours from a very low-latitude station Allahabad (Geomag. Lat: 16.79˚N, L = 1.08) in India on 04 February 2011. The factors that facilitated the whistlers prior to the sunset were investigated in terms of source lightning characteristics, geomagnetic and background ionospheric medium conditionsThe recent simulation studies at Indian Institute of Geomagnetism (IIG); performed based on the tsunami-atmospheric-ionospheric coupling that considers tsunamigenic acoustic-gravity waves to excite the signatures in ionospheric total electron content (TEC) during Sumatra 2004 tsunami; reveal that the associated ionospheric signatures of tsunami waves were recorded (sensed) ~90 minutes prior to the actual arrival of tsunami at the Indian east coast. These simulated TEC disturbances have been confi rmed using observations from the Indian satellite-based augmentation system (SBAS) - GPS Aided GEO Augmented Navigation (GAGAN) GPS receivers. Therefore, we can offer an alternative theoretical tool to monitor the offshore signatures ‘ahead of tsunami’ in the ionosphere. Thus, could potentially be an important early warning tool for the tsunami over regions where observations are either sparse or not available. These fi ndings with a bearing on mitigation of hazards in coastal regions, are likely to impact tsunami forecast

ixviii ix
ANNUAL REPORT 2017-2018INDIAN INSTITUTE OF GEOMAGNETISM
related research in a signifi cant manner. Advancement in terms of identifying the earthquake source characteristics using its ionospheric manifestations is performed for the Gorkha Nepal earthquake of April 2015. Ionospheric response to the Gorkha Nepal earthquake is studied in terms of Global Positioning System-Total Electron Content (GPS-TEC) variations from the viewpoints of source directivity, ruptures propagation and associated surface deformations, over and near the fault plane. It is found that the variability of near fi eld co-seismic ionospheric perturbations (CIP) over and near the fault plane is the manifestations of the crustal movements as observed through GPS measurements and corroborated by Interferometric Synthetic Aperture Radar (InSAR) data sets and geomagnetic fi eld-wave coupling at ionospheric heights. A conceptual 3-D schematic model of the favored mechanism for the origin of Co-seismic Ionospheric Perturbations disposition delineated from the distinct thrust zones Campbell Coseismic Thrust Zone and Kaikoura Coseismic Thrust Zone during 2016 Kaikoura, Mw 7.8 New Zealand Earthquake has been proposed. A real-time Stationary Magnetotelluric (SMT) experiment has been initiated to understand the active seismotectonic environment in the NE Indian region through a network of novel broadband magnetotelluric (~10 KHz -10 mHz, covering ~VLF, ULF, ELF range). Campaign mode GPS studies carried out in the Kumaun-Garhwal region of central Himalaya relates the strain rate to the interseismic seismicity of the regions and the total strain rate estimated from the velocity derived principal strain components. To facilitate the slip-rate along the Main Himalayan Thrust (MHT), interseismic surface deformation velocity has been modeled by considering the uniform slip dislocations on MHT from Main Central Thrust fault in an elastic, isotropic and homogeneous half-space medium.Environmental magnetic measurements were undertaken along Tirna River basin of western Maharashtra, for studying the sediment grain size distribution trend, magnetic mineralogy and magnetic grain size. These results suggest a better understanding of the factors controlling the sediment distribution and transport sediments. Detailed mineral magnetic studies work carried out on the Mumbai forts and Aurangabad cave archaeological artifacts refl ect presence of ferrimagnetic components in form of single/pseudo-single domain state and are found to be suitable for palaeointensity measurements. These results will pave way to understand the variation of the geomagnetic fi eld over periods of centuries to millennia during the Holocene. Detailed magnetotelluric (MT) and long period magnetotelluric (LMT) soundings carried out in the northern part of Saurashtra suggests large-scale heterogeneities in the crust as evidenced from the presence of different resistive and conductive blocks. High conductivity anomalies observed in thin sheet model representing the electrical conductivity distribution in Saurashtra region could be related to the presence of metamorphosed graphite schist in shale dominated Mesozoic sequence or thin fi lms of carbon resulting from the thermal infl uence of Deccan activity on Carbonate-rich formations.Mineral magnetic investigations comprising of magnetic susceptibility, forward and back fi eld IRMs along with quartz grain microtexture studies have been carried out on twenty sediment samples of a 1 m deep trench to decipher the past environmental changes in and around Ny-Alesund, Svalbard, Arctic Region. These studies four identifi ed alternate stages of colder and warmer phases.Hydraulic parameters like formation factor, porosity, hydraulic conductivity and transmissivity in coastal aquifers have been computed using geoelectrical data in combination with resistivity of pore water of existing wells. The empirical relation of formation factor (F) was established from pore-water resistivity and aquifer resistivity for fresh and saline aquifers. The result shows some parts of the study area indicate relatively high value of hydraulic conductivity, porosity and transmissivity. The transmissivity values observed here are in good correspondence with those obtained from pumping test data. Assessment of trace element concentrations in semi-arid region, southwest Maharashtra revealed signifi cant contamination of the soil quality over Mann Ganga River basin. Toxic trace elements such as Cu, Zn, V, Fe and Mn has moderate to high concentration in the soils as estimated from index of geoaccumulation, enrichment factor and contamination factor. The potentially toxic metal pollutants can aggravate the groundwater aquifers due to leaching, which can have deleterious effect on the environment in general, and crops and human beings in particular. From analysis and interpretation of aeromagnetic and Bouguer gravity data over the seismically active Koyna region, the interface between the traps and the underlying Archean granitic-gneissic crust and an interface within the granitic-gneissic crust has been delineated. This perhaps represent the top of intermediate metamorphic amphibolitic crust or a reworked granitic-gneissic crust as the Indian plate moved over the reunion plume. The ground magnetic anomaly map of the Deccan Volcanic Province (DVP) including additional points to the tune of approximately seven hundred to the existing data base has been updated.The anomalously large cosmic noise absorption (CNA) observed at Maitri, Antarctica (L = 5; CGM−62�S, 55�E) during the recovery phase of 17 March 2015 St. Patrick’s Day storm was an enigma, which was settled invoking the wave-particle interaction. The CNA enhancement during recovery was as large as that during the main phase of the storm, which was surprising. Absence of electromagnetic ion cyclotron (EMIC) waves suggested the possible role of VLF waves in precipitation. The investigation showed that the precipitation due to hiss-driven sub-relativistic electrons was the main cause for such an intense CNA. Research carried out by IIG scientists culminated in 96 publications with a cumulative impact factor of 189.832 besides 49 papers presented in national and international conferences. Under the capacity building program, a total of 37 summer interns/dissertation students were trained by IIG during the current year.Under the Science Outreach program, the institute has been participating in several state and national level scientifi c expositions during the year. During the year, three research scholars were awarded Ph.D. degree and several recognitions through an impressive array of awards and honours were also bestowed on staff and students throughout the year.We would like to extend our deep and sincere appreciation to the Governing Council of IIG and the Research Advisory Committee for their continuous support and guidance in our endeavour to perform cutting-edge research. All the staff members of IIG stood up admirably to several academic, administrative and technical challenges during the year and have contributed signifi cantly towards the success of the new initiatives reported here.
D.S. RameshDirector
August 27, 2018


1PB 1
ANNUAL REPORT 2017-2018INDIAN INSTITUTE OF GEOMAGNETISM
Geomagnetic Observetories, Data Analysis & ResearchChief Coordinator : S.V. Singh
Coordinator : G.K. SeemalaNetwork of Geomagnetic observatories & data analysis
Coordinator G. VichareGeomagnetic fi eld variations due to internal and external origin
Coordinator B. Veenadhari IIG World Data Center
Members : A.T. Deshmukh, S.K. Bhardwaj, S. Mukherjee, M.M. Jadhav, P.K. Birthare, R. Rawat, A.S. Kulkarni, R. Nimje, M. Doiphode, P. Patro, and All observatory staff
In the study of Equatorial and Counter electrojet current systems, the technique of Principal Component Analysis (PCA) is applied to analyze the hourly mean values of geomagnetic field components D, H and Z along Indo-Russian chain of stations during International Equatorial Electrojet Year (IEEY) from January 1992 to June 1993. This technique (PCA) is used to separate the Normal Electrojet (NEJ) and Counter Electrojet (CEJ) variations and the first two Principal Components (PCs) are able to describe the characteristics of NEJ and CEJ related field variations. It is found that PC-1 for H, D and Z varies as a function of time with latitude and depicts the well-known Sq variations whereas PC-2(H) do not show any variations at all latitudes during NEJ days.
On CEJ days, the PC-2(H) shows large negative excursion at equatorial stations (KAN to BAN). The NEJ and CEJ related current systems are determined by combining the hourly inequalities in D and H. First Principal Component (PC-1) brings out a well-defined anticlockwise loop for NEJ day with focus near dip latitude (~ 35º N) and clockwise for CEJ day with well-defined focus near dip latitude (~ 20º N) around local noon time.The CEJ related current system is marked by intense westward current flow in equatorial belt is shown to close its path by forming a clockwise loop extending from dip equator to mid-latitude. Their comparison with numerically simulated current system, due to various tidal modes, emphasized the significance of anti-symmetric semidiurnal tidal modes in generation of CEJ events.
GEOMAGNETIC DATA BASED RESEARCH
Under this program, important knowledge is gained in the field of quiet time ionospheric current systems. The study of day-to-day, latitudinal, longitudinal and seasonal variations of Sq and EEJ is performed. A sudden change in the slope of the magnetic secular variation is known as a secular impulse, or geomagnetic jerk, that arises from sources inside the Earth. Recently, these jerks have been suggested as geomagnetic rapid secular fluctuations that have periods ranging from several months to a few years. These events are observed in magnetic data as sudden V-shaped changes in the slope of the secular variation. In future, it is intended to utilize monthly and annual mean data of Indian and worldwide geomagnetic observatories to determine the geomagnetic jerks.
The Indian Institute of Geomagnetism hosts the World Data Centre for Geomagnetism, Mumbai as part of the World Data System (WDS) established by the International Council of Scientific Unions (ICSU). The data and services at the WDC for geomagnetism, Mumbai are available for scientific use without restrictions. The total number of registered users with the WDC website (http://wdciig.res.in) is now 700. This year around 45 new users registered. From all over the globe, around 2500 data files have been accessed/downloaded from the WDC website by the end scientific users. Successfully handled and fulfilled the entire data request (received by email) as per IIG Data policy guidelines. Minimize the downtime and provide stable functionally by in-house website hosting. As a WDS Member representative from IIG, attending the Webinar regularly hosted by WDS system on various topics related to data stewardship and management and following the WDS norms as per the International standards.
Information Theoretic Approaches to Model Geomagnetic ProcessesChief Coordinator : G.Vichare
Members : D.S. Ramesh, S. Gurubaran, Ashwini K. Sinha, S. Sripathi, B. Kakad, A. Kakad, M.S. Bagiya, A. Bhaskar
Information theory-based stochastic methods that revolve around the concept of entropy have been used in many diverse fields including neuroscience, climate changes, magnetospheric dynamics etc. Likewise in the Geomagnetism and allied fields, there exist ambiguities

32 3
ANNUAL REPORT 2017-2018INDIAN INSTITUTE OF GEOMAGNETISM
regarding the inter-connectivity and prominent drivers between coupled systems. Program for Information Theoretic Approaches to Model Geomagnetic Processes (ITAG) applies entropy based technique to the available data sets in the interdisciplinary fields.
Development of prediction model for solar cycle characteristics
Forecasting of the solar cycle characteristics is an important aspect of space weather studies. As Sun is the source of energy for planet Earth, the variability in the solar energy emitted in the form of radiation and highly energetic particles affects the life, and near-Earth environment including space-based communication systems and technology. Therefore, the prediction of an upcoming solar cycle has always been a topic of great interest to space scientists and technologists. Two different models have been developed to predict peak of solar cycle, and (ii) length of solar cycle. The first model forecast the peak sunspot activity of the upcoming solar cycle (SC) utilizing Shannon Entropy estimates related to the declining phase of the preceding SC. Shannon Entropy is the measure of inherent randomness in the SC and is found to vary with the phase of a SC as it progresses. In this model each SC with length Tcy is divided into five equal parts of duration Tcy/5. Each part is considered as one phase and they are sequentially termed as P1, P2, P3, P4, and P5. Shannon Entropy estimates for each of these five phases are obtained for nth SC starting from n = 10 −23. It is found that the Shannon Entropy during the ending phase (P5) of the nth SC can be efficiently utilized to predict the
peak smoothed sunspot number (SSN) of the (n+1)th SC. The prediction equation derived in this study has a good correlation coefficient of 0.94. The predicted and observed peak SSN is shown in Figure 1(a). A noticeable decrease in entropy from 4.66 to 3.89 is encountered during P5 of SCs 22 to 23 as shown in Figure 1(b). The entropy value for P5 of the present SC 24 is not available as it has not yet ceased. However, if it is assumed that the fall in entropy continues for SC 24 at the same rate as that for SC 23, then the peak SSN of 63±11.3 for SC 25 could be predicted. It is suggested that the upcoming SC 25 would be significantly weaker (Figure 1).
The transfer entropy technique has been applied to understand the link between geomagnetic pulsations and cosmic noise absorption (CNA) at Maitri. The enhancement in the cosmic noise absorption (CNA) is observed at Maitri, Antarctica during the early recovery phase (15 - 18 UT) of the largest storm of the current solar cycle, i.e. 17th March, 2015. During this time the CNA pattern also exhibits oscillation in the Pc5 (2 - 7 mHz) range and is in simultaneity with geomagnetic pulsations in the same frequency range. Absence of Electro-Magnetic Ion-Cyclotron (EMIC) waves is marked suggesting the possible role of VLF waves in precipitation. The reason for the intense CNA production is found to be the precipitation caused mainly by hiss-driven sub-relativistic electrons. In order to establish the cause and effect relationship between the geomagnetic and CNA oscillations at Maitri, Transfer Entropy method has been used, which confirmed the modulation of CNA by geomagnetic pulsations (Figure 2).
(a) Observed and predicted SSN for SCs 11-24. The value of SSN marked by dotted circle shows the predicted SSN for SC 25. (b) The entropy values in the P5 phase of SCs 10-24.
Figure 1 Transfer entropy method has confi rmed the modulation of CNA due to geomagnetic pulsations during 17th March, 2015 storm.
Figure 2

32 3
ANNUAL REPORT 2017-2018INDIAN INSTITUTE OF GEOMAGNETISM
UPPER ATMOSPHERIC RESEARCH
INTEGRATED STUDIES ON THE EARTH’S UPPER ATMOSPHERE USING GROUND AND SPACE BASED INSTRUMENTATION AND NUMERICAL MODELING TOOLSChief Coordinator : S. Gurubaran
Coordinator : S. SripathiCoordinator : S. Tulasiram
Members : C.P. Anil Kumar, G. Vichare, B. Kakad, N. Parihar, R. Ghodpage, M.S. Bagiya, P. Mahavarkar, M. Lal, B. Veenadhari, K. Vijaykumar, P.T. Patil, P. Tiwari, L.M. Joshi, R. Singh, V. Yadav, P. Gurram, S. Sreekumar, K.K. Ajith
Optical observations of stormtime response of the EPBs over Kolhapur
The optical observations of ionospheric and mesospheric OI 630.0 nm, OI 557.7 nm and OH emission have been performed from Kolhapur (16.8oN, 74.2o E) using a CCD based all sky camera system. The characteristics of night airglow variations observed during the period of a strong geomagnetic storm have been studied. The storm commenced on March 17, 2015 at ~ 04:30 UT. This storm saw a minimum Dst of ~ -200 nT, realized on March 17 at 2300 UT and, so, by this measure, this storm was the largest amongst the unusually subdued solar cycle. The images on the night of March 16 and 17 show the development of strong Plasma bubble or EPBs and bright intensity regions in OI 630.0 nm emission. Generally EPBs moves from west to east direction but on strong magnetically disturbed night it moved in reverse direction. The EPBs drift velocity was less by ~100 m/sec than the velocity measured on magnetically quiet night 16 March 2015. The bright intensity regions are also observed in OI 557 nm airglow, but no intensity enhancement was seen in OH emission during this magnetic disturbance. It has been observed that the OI 630.0 nm intensity variation matches well with the GPS VTEC variation for PRN-2. The effect of reversal in EPBs drift velocity due to strong magnetic storm is well observed in GPS data.
The nightglow observations of OI 630.0 nm emission carried out from low latitude station Kolhapur using All Sky Imager (ASI) with 140º field of view (FOV) forthe month of April 2011 are used. The images were processed to study
the field aligned irregularities often called as equatorial plasma bubbles (EPBs). The present study focuses on the occurrence of scintillation during the traversal of EPBs over ionospheric pierce point (IPP). Here the depletion level (depth) of the EPB structures and its effect on VHF signals is dealt with. The VHF scintillation data was compared with airglow intensities at Ionospheric pierce point (IPP) from the same location and found that the largely depleted EPBs make stronger scintillation. From previous literature, it is believed that the small scale structures are present near the steeper walls of EPBs which often degrades the communication; the analysis presented in this study confirms this belief.
The role of storm-time electrodynamics in suppressing the equatorial plasma bubble (EPB) development was investigated using multi-instruments over India during a moderate geomagnetic storm that occurred on 02 October 2013 where Dst minimum reached ~ -80 nT. This storm produced unique signatures in the equatorial ionosphere such that EEJ strength showed signatures of an abrupt increase of its strength to 150 nT and occurrence of episodes of CEJ events. During the main phase of the storm, the interplanetary magnetic field (IMF) Bz is well correlated with the variations in the EEJ/CEJ suggesting the role of under-shielding/over-shielding electric fields of magnetospheric origin. Further, observations showed the presence of strong F3 layers at multiple times at multiple stations due to under-shielding electric field. Interestingly, simultaneous presence of F3 layers and suppression of EPBs in the dusk sector was observed during the recovery phase. While strong EPBs were observed before and after the day of the geomagnetic storm, suppression of the EPBs on the storm day during ‘spread F season’ is intriguing. Further analysis using low latitude station, Hyderabad, during the time of Pre-Reversal Enhancement (PRE) suggests that intense Esb layers were observed on the storm day but were absent/weak on quiet days. Based on these results, it is suggested that the altitude/latitude variation of Disturbance Dynamo Electric Fields (DDEFs)/disturbance winds may be responsible for simultaneous detection of F3 layers, occurrence of low latitude Es layers and suppression of EPBs during the storm day along the sunset terminator (Figures 3, 4).
The ionogram signatures of LSWS (satellite traces) and low latitude Esb layers were investigated as a basis for causing variabilities of ESF irregularities in addition to post sunset vertical drift using ground based ionosondes located at Tirunelveli (8.71oN, 77.75oE, Geomag. Lat 0.21oN) and

54 5
ANNUAL REPORT 2017-2018INDIAN INSTITUTE OF GEOMAGNETISM
(a) The monthly mean solar fl ux for the years 2007–2015. The daily temporal and seasonal variations of (b) S4 index and (c) ROTI index as obtained from GPS receiver at Tirunelveli during the years 2007–2015 and (d) monthly % occurrence of spread F at Tirunelveli using CADI ionosonde at Tirunelveli during 2008–2015.
Figure 3
The monthly percentage of spread F occurrence over (a) Tirunelveli (TIR), (b) Hyderabad (HYD), and (c) Allahabad (ALD), respectively, during the year 2015.
Figure 4

54 5
ANNUAL REPORT 2017-2018INDIAN INSTITUTE OF GEOMAGNETISM
Hyderabad (17.38oN, 78.48oE, Geomag. Lat 8.74oN) for the year 2015. Results show, statistically, that the presence/absence of STs is higher/lower than the absence/presence of Esb prior to occurrence/non-occurrence of ESF during all the seasons. This implies the importance of ST/LSWS in the ESF occurrence. Results of weak correlation of low latitude Esb layers with ESF possibly indicate its coupling to higher apex altitude than base of the F-layer. Significant equinoctial asymmetry is also observed in both the ESF and ST occurrences wherein vernal is dominant than autumn equinox. Band-pass filtered h’F oscillations of 1–1.5 h reveal significant wave amplification during the PRE on ESF than non-ESF days and also during vernal than autumn equinox. Further investigations suggest that the height oscillations of early ESF and delayed ESF are amplified according to their onset time of ESF. The study suggests that post-sunset height rise of F-layer together with the presence of LSWS provide suitable conditions for
(a) March-April ESF days: Left panel: Band pass fi ltered h’F (Dh’F) values for 5, 6 and 7MHz frequencies. Right panel: Mean of the vertical drifts obtained from 5, 6 and 7 MHz for different ESF days (shown in multiple coloured curves and the mean drift for all the days (dark blue dashed line). The PRE is seen at ~19:00 LT and the average value of peak vertical drift at this time is ~ 40 m/s. The maximum amplitude of oscillations around post sunset sunset hours is ~12 km. (b) Same as (a), but for September-October ESF days.
Figure 5
the ESF development. Further, the presence of downward phase propagation on ESF days than other days indicate the presence of upward propagating Gravity Waves in the initiation of these wave structures (Figures 5, 6).
Evidence for DE3 non-migrating tide in the global longitude-local time occurrence pattern of equatorial counter electrojet
The long-term Challenging Minisatellite Payload (CHAMP) magnetometer data are analyzed to derive the equatorial counter electrojet (CEJ) signatures globally over a range of local times. The resultant local time-longitude map of CEJ occurrence rate shows a strong influence of the diurnal eastward propagating wavenumber 3 (DE3) non-migrating tide during July-September months. DE3 is also shown to account for the reduction of CEJ occurrence at certainlongitudes. These aspects of DE3 tide-CEJ relationship have implications for understanding the

76 7
ANNUAL REPORT 2017-2018INDIAN INSTITUTE OF GEOMAGNETISM
seasonal and longitudinal variations of CEJ. Observations of zonal winds from the TIMED Doppler Interferometer (TIDI) instrument on board the Thermosphere Ionosphere Mesosphere Energetics and Dynamics (TIMED) satellite are used to establish these findings (Figure 7).
Role of Es layer in the F-layer electrodynamics during disturbed times
The role of storm time electrodynamics in suppressing the equatorial plasma irregularities/plasma bubbles to a minor geomagnetic storm was investigated on 02 October 2013 using Tirunelveli and Hyderabad ionosonde observations. To examine the temporal variations of F layer height at the time of pre-reversal enhancement on quiet days and on storm day, we present the ionogram height analysis of the F layer at 4 MHz and its corresponding vertical drifts at Tirunelveli in Figure 8 (a,b) wherein the variations in the virtual height of the F layer and the corresponding vertical drift derived using rate of change of layer height are shown. Red, blue and black lines represent 02 October, 01 October and 03 October respectively. Accordingly, it can be attributed that the height variations of the F layer is due to the electrodynamic drift in the evening hours. The durations of the spread F are shown in blue circles and black hexagons for 01 October 2013 and 03 October 2013 respectively. The figure suggests that there is no spread F on 02 October 2013 but spread F is present on other two quiet days.To
(a) March-April season: x-axis shows day of the year (DOY),Multiple panels on y-axis (from the bottom panel onwards) represent: 1) F 10.7 solar fl ux (10-22Wm-2 Hz-1), 2) h’F max (km), 3) number of ionograms in which ST is present, 4) Esb presence/absence, Top frequency of Es layer (ftEs (MHz)), 6) Blanketing frequency of Esb layer (fbEs (MHz)). (b) Same as Fig. (a), but for September-October season.
Figure 6
The global longitude-local time occurrence pattern of afternoon counter electrojet obtained from CHAMP observations. The dashed line represents the dip equator as of year 2005. The vertical tilted solid lines are the DE3 zero-wind lines as derived from TIDI observations for an altitude of 105 km. The horizontal line represents the location of the geographic equator.
Figure 7
understand the causes for the spread F disappearance on storm time, we examined the low latitude Es layers at Hyderabad. Figure 9 shows the temporal variations of top frequency (ftEs) of low latitude Es layers over Hyderabad during few quiet days as well as storm day during 00:00-15:00 UT to understand the differences between quiet and storm time Es layer. In the figure, red colour indicates storm day Es layer frequency while blue colour indicates quiet day Es layer frequency. These quiet days are obtained during 25 September 2013 to 01 October 2013 which is before the commencement of the storm days. The ftEs observations reveal that while Es layers during both storm day and quiet days are steadily varied upto 08:30 UT (14:00 IST), however, ftEsvalues increased to as high as 12.5 MHz at 11:45 UT (17:15 IST) on storm day which continued until 13:00 UT (18:30 IST) and then slowly decreased to reach quiet day values at 13:30 UT. The observations suggest that while Es layers are very strong around evening hours on 02 October 2013 (storm day), they are found to be very

76 7
ANNUAL REPORT 2017-2018INDIAN INSTITUTE OF GEOMAGNETISM
weak on quiet days. This suggest that because of abnormal enhancement of Es layers during this storm possibly due to
disturbance winds and disturbance electric fields, equatorial plasma bubbles got suppressed.
(a) Temporal variation of virtual height (h’F (km))scaled at 4 MHz and (b) corresponding vertical drifts in the post-sunset sector on 01-03 October 2013 over Tirunelveli. Here, blue, red and black colours correspond to 01-03 October 2013 respectively. The spread F durations for 01 and 03 October 2013 are shown as blue circles and black hexagons.
Figure 8
Temporal variation of top frequency (ftEs) of low latitude Es layers over Hyderabad during few quiet days (blue) and on 02 October 2013 (red colour) during 00:00-15:00 UT.
Figure 9

98 9
ANNUAL REPORT 2017-2018INDIAN INSTITUTE OF GEOMAGNETISM
A method to forecast L-band scintillations using GAGAN data
With the increase in the use of satellite-based navigation services, the forecasting of L band scintillation hasturned out to be of paramount importance as it affects their accuracy and availability. Forecasting the time of occurrence or non-occurrence, strength and probable location of scintillation enables the service providers and users to take appropriate action to mitigate the effects and optimize the services. We use the recently developed method to retrieve TEC from the ionospheric correction data transmitted by the Indian satellite-based augmentation system (SBAS)–GAGAN. By making use of the established linear relation between the dusk time TEC and the maximum probable scintillation intensity (S4max), scintillation forecast maps have been generated as early as 1930 LT. The superposition of actual S4 measurements, obtained from the GAGAN network of receivers, on the forecasted S4max map shows that the actual measurements are less than the predicted S4max except on very few occasions. The potential of the simple technique to predict the 2 D maps of maximum probable scintillation index for the whole night has been demonstrated which with more refinements could evolve into a viable forecast or forewarning system.
Optical observations of gravity wave signatures in the thermosphere
A study of wavelike features at thermospheric altitudes was carried out from the Indian dip equatorial station Tirunelveli (8.7o N, 77.8o E), with the help of OI 630 nm all sky nightglow images obtained during the period January 2013-January 2015. In total there were 55 nights of useful observations during this period. Two types of wavelike features were observed in this study, namely, quasi-periodic waves and single band of enhanced intensity (SBEI). Eleven cases of quasi-periodic waves were observed on nine nights, whereas three cases of SBEI features were noticed on three nights. The estimated phase speed and wavelength of the quasi-periodic waves observed in this study were in the range of 70-160 m/s and 130-575 km, respectively, whereas the phase speed and full width at half maxima (FWHM) of the SBEI features were in the range of 150-250 m/s and 230-470 km, respectively. The quasi-periodic waves observed in this work are interpreted as plausible signatures of either primary or secondary GWs at thermospheric altitudes. The exact generation mechanism of the SBEI features is not yet known. Study of such quasi-periodic waves needs to be carried out with a larger data base and numerical simulation to understand their generation mechanism in the dip equatorial ionosphere and their probable role in the seeding process of the equatorial spread-F (ESF) (Figure 10).
Dynamics of equatorial plasma bubbles during midnight as gleaned through observations and modeling
The vertical rise velocity (Vr) and maximum altitude (Hm) of Equatorial Plasma Bubbles (EPBs) were estimated using the two dimensional backscatter maps of 47 MHz Equatorial Atmosphere Radar (EAR) at Kototabang. The vertical rise velocities of the midnight EPBs are significantly smaller (~26 – 128 m/s) compared to post-sunset EPBs (~45 – 265 m/s) (Figure 11). The controlled simulations of three dimensional High Resolution Bubble (HIRB) model indicates that the smaller vertical rise velocities (Vr) and lower maximum altitudes (Hm) of midnight EPBs are mainly due to weak polarization electric fields developed within the bubble under weaker background electric fields and reduced background ion density levels.
Characteristics of coseismic travelling ionospheric disturbances generated during the Nepal earthquake
Coseismic travelling ionospheric disturbances (CTIDs) and their propagation characteristics during Mw 7.8 Gorkha earthquake in Nepal on 25 April 2015 have been investigated using a suite of ground based GPS receivers and broad band seismometers along with the space borne Radio Occultation observations over the Indian subcontinent region. Direct evidence for acoustic gravity wave signatures at F2-layer peak heights (300- 450 km) were found, for the first time, in
Phase speed (in m/s) and propagation direction of the quasi-periodic waves (blue arrows) and SBEI features (red arrows). The direction is measured from the north direction in clockwise manner.
Figure 10

98 9
ANNUAL REPORT 2017-2018INDIAN INSTITUTE OF GEOMAGNETISM
the vertical GPS-RO profiles (Figure 12). The CTIDs in the southward direction are found to further split in to fast (~2.4-1.7 km/s) and slow (~680-520 m/s) propagating modes at epicentral distances greater than ~800 km. However, the velocities of fast mode CTIDs are significantly smaller than the surface Rayleigh wave velocity (~3.7 km/s), indicating that they are not the true imprint of Rayleigh wave, instead, can probably be attributed to the superimposed wave front formed by the mixture of acoustic waves excited by main shock and propagating Rayleigh wave.
Ionospheric annual anomaly: Local time, latitudinal and longitudinal dependences
The ionospheric annual anomaly or non-seasonal anomaly of the ionosphere is characterized by globally increased ionization in December solstice than in June solstice (Figure 13). A systematic study using COSMIC Radio Occultation observations during the low solar
activity period reveals that the annual anomaly is primarily dominant at southern hemisphere at all local times; with significant enhancements at EIA crest latitudes during noon to afternoon hours and at high latitudes during night times (Figure 13). The annual anomaly in northern
Local time variation of the (a) vertical rise velocity (Vr) and (b) maximum attainable altitude (Hm) of post-sunset (black circles) and midnight (red circles) EPBs observed from the Equatorial Atmosphere Radar.
Figure 11
The Co-seismic Travelling Ionospheric Disturbances (CTIDs) observed around the F2-layer peak altitudes from the COSMIC Radio Occultation (RO) profi le (red profi le). The thin green profi le also measured by COSMIC RO around the same location and UT from the same set of COSMIC – GPS satellite pair on previous day is shown for the comparison. The right panel shows thede-trended electron density perturbations from COSMIC RO profi les
Figure 12
Ionospheric Annual Anomaly observed from COSMIC RO observations during the low solar activity year 2009. The NmF2 during the December (bottom panel) is signifi cantly higher than in June (top panel) solstices at almost all latitudes and local times.
Figure 13

1110 11
ANNUAL REPORT 2017-2018INDIAN INSTITUTE OF GEOMAGNETISM
hemisphere occurs with relatively smaller magnitudes and confined only to morning to early afternoon hours (08-14 LT). This study brings out the important roles of effective neutral winds due to the geomagnetic field configuration; and the offset between geomagnetic equator and subsolar point for the enhanced plasma density in the southern hemisphere during December that majorly contributes to the ionospheric annual anomaly. These results provide new insights to the responsible mechanisms behind the ionospheric annual anomaly and its local time, latitude and longitudinal variation.
Use of Artificial Neural Network in the prediction of ionospheric parameters
For the first time, a new Artificial Neural Network (ANN) based two-dimensional Ionospheric Model (ANNIM) has been developed to predict the ionospheric NmF2 and hmF2 using long term COSMIC Radio Occultation data (Figure 14). The ANNIM can successfully predict the spatial and temporal variations of ionospheric F2-layer peak parameters (NmF2 and hmF2) (Figure 15) under any given solar activity (F10.7) and geomagnetic activity (Kp index) conditions. Further, the ANNIM has also captured the
global scale ionospheric phenomena such as Ionospheric Annual Anomaly, Weddell Sea Anomaly and Mid-latitude Summer Nighttime Anomaly. Compared to IRI-2016 model, the ANNIM is found to better represent the fine longitudinal structures and the mid-latitude summer night time enhancements in both the hemispheres.
Monitoring of secondary cosmic ray (SCR) fluxes from Tirunelveli
Thallium activated NaI scintillation detectors are installed at EGRL, Tirunelveli. NaI(Tl) detectors of different sizes are kept inside the elevated, temperature controlled cabin. For gamma-ray spectroscopy, it is important to test the performance of the NaI(Tl) scintillation detectors and to calibrate the gamma-ray spectrum in terms of energy. The various characteristics of the detectors such as resolution, efficiency, gain drift due to temperature variations, background radiation at the site, shielding of the background radiation, calibration etc were studied. This has enabled to finalize various parameters to be set in the experiment. The temperature controlled cabin ensures almost no instrumental drift in the channel due to temperature variations of the detector and PMT. The testing work demonstrates the
Architecture of a newly developed Artifi cial Neural Network based two-dimensional Ionospheric Model (ANNIM) in IIG using long term COSMIC Radio Occultation observations. (a) Primary Inputs to the neural network (b) Calculation of additional inputs using IGRF-12 and HWM-14 (c) Architecture of feed-forward neural network with error back-propagation
Figure 14

1110 11
ANNUAL REPORT 2017-2018INDIAN INSTITUTE OF GEOMAGNETISM
importance of isothermal environment while studying SCR flux using NaI(Tl) detectors, especially for the experiments conducted during daytime such as solar eclipses etc. The energy calibration has shown excellent stability till now. The engaged lead shielding reduces the background radiation effectively (order of two). The plywood used for covering the temperature controlled cabin is found to reduce the SCR flux slightly (< 13%) (Figure 16).
Effects of disturbance dynamo on F-region zonal irregularity drifts
The theoretical studies show that as time difference (i.e. ΔT), between local sunset and start of magnetic activity decreases, the DD effects seen at low latitude F-region zonal irregularity drift around midnight becomes stronger. For a given magnetic storm the DD effect on F-region zonal irregularity drifts is found to be only marginally stronger at dip equator in comparison to off equatorial stations. Figure shows that the disturbance dynamo effects on zonal plasma
drifts are relatively higher at stations closer to equator (i.e. Gadanki), and seen at slightly later time for given magnetic storm (Figure 17).
The local time, latitudinal and longitudinal variations of NmF2 and hmF2 predicted by the new Artifi cial Neural Network based two-dimensional Ionospheric Model (ANNIM).
Figure 15
Secondary cosmic ray experiment at EGRL, TirunelveliFigure 16

1312 13
ANNUAL REPORT 2017-2018INDIAN INSTITUTE OF GEOMAGNETISM
Left panels shows S4; middle panels indicate quiet (black) and disturbed (red) time zonal irregularity drifts V0, along with corresponding monthly quiet time average (blue); right panels quiet (black) and disturbed (red) time CI(x0, tm), as a function of IST 6–7 April 2011 at observation stations (a) Gadanki, LC and (b) Kolhapur, LA.
Figure 17
SPACE WEATHER RESPONSE OF MAGNETOSPHERE-IONOSPHERE-THERMOSPHERE SYSTEM TO SOLAR DRIVEN TRANSIENT AND RECURRENT FORCESChief Coordinator : M.S. Bagiya
Coordinator : S. Tulasiram
Members : B. Veenadhari, Ashwini K. Sinha, G.Vichare, S. Sripathi, R. Singh, N. Parihar, G.K. Seemala, C.D. Reddy, D.S. Ramesh
The response of equatorial and low-latitude ionosphere to 22/23 June 2015 geomagnetic storm are investigated using a chain of ground-based ionosondes located at Tirunelveli (8.73°N,77.70°E; geomagnetic latitude:
0.32°N), Hyderabad (17.36°N, 78.47°E; geomagnetic latitude: 8.76°N), and Allahabad (25.45°N, 81.85°E; geomagnetic latitude: 16.5°N) along with a chain of GPS receivers. Uniqueness of this storm is that in contrast to the equatorial plasma bubbles that were detected in the European sector, suppression of plasma bubbles is seen in the Indian sector (Figure 18). The observations suggest that westward penetration electric field during local midnight caused abrupt decrease of virtual height (h’F (km)) to ~200 km and suppressed plasma bubbles due to undershielding. Later, the layer increased to 500 km simultaneously due to overshielding effect. On 23 June, negative storm in the Northern Hemisphere was observed while positive storm in the Southern Hemisphere was seen. In addition, absence of equatorial Es layers at Tirunelveli and presence of F3 layer at Tirunelveli/Hyderabad seem to be associated with equatorial electrojet (EEJ)/counter electrojet (CEJ) variations. However, on 24 June, strong

1312 13
ANNUAL REPORT 2017-2018INDIAN INSTITUTE OF GEOMAGNETISM
Temporal variation of ionospheric F region parameters (a) h’F in km (red), and fi ve IQDs mean value (blue) of h’F at ALD, (b) h’F in km (red), and fi ve IQDs mean value (blue) of h’F at HYD, (c) h’F in km (red) and fi ve IQDs mean value (blue) of h’F at TIR, (d) IMF Bz, (e) EEJ strength (blue), and fi ve IQDs mean value (black) of EEJ, bold black lines are indicate spread-F and green color lines indicate the F3 layers (fi g-(b-c)) over Indian region, during 22-24 June 2015.
Figure 18
negative storm effects at Allahabad/Hyderabad were observed, while positive storm effect at Tirunelveli was revealed. Simultaneous enhancement of h’F (km) at all three ionosonde stations at 20:30 UT on 23 June during recovery phase suggest eastward disturbance dynamo
(DD) electric field that caused pre-sunrise spread F at Hyderabad/Allahabad but void of spread F at Tirunelveli suggesting its mid latitude origin. Periodogram analysis of foF2 and h’F (km) in the present analysis suggest the presence of shorter periods (~< 2 h) associated with

1514 15
ANNUAL REPORT 2017-2018INDIAN INSTITUTE OF GEOMAGNETISM
prompt penetration (PP) electric fields while larger periods (>2 h) associated with DD electric field/winds (Figure 19).
The St. Patrick’s Day storm of 17 March 2015 has a long-lasting main phase with the Dst reaching a minimum of ~223 nT. During the main phase, two strong prompt penetration electric field (PPEF) phases took place; first with the southward turning of IMF Bz around ~1200 UT and the second with the onset of a substorm around ~1725 UT leading to strong equatorial zonal electric field enhancements. The strong eastward penetration electric field caused the rapid uplift of equatorial F layer over Brazilian sector and additional stratification of layer into F2 and F3 layers. The enhanced zonal electric filed due to PPEF led to the strong super fountain effect under which the
anomaly crest departed poleward to ~40°S latitude (Figure 20). Further, the strong westward and equatorward wind surge over Brazil lead to strong hemispheric asymmetry of EIA during both the PPEF phases.
A new computer based automatic storm detection method is developed to identify the geomagnetic storms in Dst index by applying four selection criteria that minimize non-storm-like fluctuations. This method is applied to identify the storms in Kyoto Dst and USGS Dst in 50 years (1958-2007). The identified storms (DstMin ≤ −50 nT) are used to investigate their seasonal variations. It is found that the overall seasonal variations of the storm parameters such as occurrence, average intensity (average DstMin) and average strength (average ⟨DstMP⟩) in both versions of Dst
(a) virtual height (h’Es (km)) of Es-layer (black), frequency of Eslayer (foEs (MHz)) and blue color lines indicate the disappearance of Es-layer duration, (b) variation of IMF (Bz), (c) EEJ strength variations, and (d) Isoheight variation over Tirunelveli, during the 23 June 2015
Figure 19

1514 15
ANNUAL REPORT 2017-2018INDIAN INSTITUTE OF GEOMAGNETISM
exhibit clear semiannual variations with equinoctial maxima and solstice minima (Figure 21). The semiannual variation observed in the geomagnetic activity is interpreted in terms of the (1) equinoctial mechanism based on the varying angle between the Earth–Sun line and Earth’s dipole axis and (2) Russell–Mcpherron effect based on the varying angle between the GSM Z-axis and GSE Y-axis; and the yearly range of the dipole tilt angle μ (23.2°) involved in the equinoctial mechanism is found larger than the title angle θ (16.3°) involved in the RM effect.
Based on TEC observations by India’s GPS Aided Geo Augmentation Network (GAGAN), the dayside low latitude
ionospheric variations over the Indian region during the moderate main phase step-I of the 17 March 2015 geomagnetic storm is reported. In addition, the efficacy of GPS inferred TEC maps by International GNSS service (IGS) is assessed in capturing large scale diurnal features of equatorial ionization anomaly (EIA) over the Indian region during this period. Following the prompt penetration electric field (PPE) at ~6:05 UT, equatorial electrojet (EEJ) enhances by ~55 nT over 75±3ºE longitudes where main phase step-I is coincided with local noon. Initial moderate EIA gradually strengthens with the storm commencement. Although GAGAN TEC exhibits more intense EIA evolution
Latitudinal variations of storm time TEC (red circles) over Brazilian sector showing equatorial super fountain effect. The simultaneous quiet time TEC variations on 16 March 2015 are presented as blue circles.
Figure 20

1716 17
ANNUAL REPORT 2017-2018INDIAN INSTITUTE OF GEOMAGNETISM
(a) Low latitude ionospheric variability during 1015 to 11 UT and (b) 1115 to 12 UT on 17 March 2015 across Indian longitudes. The well evolved EIA weakens in IGS TEC maps after ~45 minutes (i.e. ~10:15 UT) of the occurrence of the over shielding effect. In contrary, GAGAN TEC shows the corresponding feature after 10:45 UT. Following the PPE at ~11:15 UT, GAGAN TEC showed resurgence of EIA but IGS TEC maps could not reproduce this feature.
Figure 22
compared to IGS TEC maps, latitudinal extent of EIA are comparable in both. The enhanced EEJ reverses by ~9:18 UT under the effect of overshielding electric field; the later is accompanied by northward turning of interplanetary magnetic field (IMF) Bz. The weakening of well evolved EIA reflects in IGS TEC maps after ~45 minutes of the overshielding occurrence. In contrary, GAGAN TEC shows the corresponding feature after ~1:15 hrs. Resurgence of EIA, following the PPE ~11:15 UT, shows up in GAGAN TEC but IGS TEC maps fails in capturing this feature. The
observed low latitude TEC variations and EIA modulations are explained in terms of the varying storm time disturbance electric fields. The anomalies between the GAGAN TEC and IGS TEC maps are discussed in terms of the possible limitations of the IGS TEC maps in capturing storm time EIA variability over the Indian region (Figure 22a,b).
The low latitude electrodynamics during geomagnetically disturbed period is significantly different as compared to that during the quiet period, which eventually affects the
Semi-annual variation in the Geomagnetic activity and its dependency on dipole title angle (µ) and Russell-McPherron effect (θ).Figure 21

1716 17
ANNUAL REPORT 2017-2018INDIAN INSTITUTE OF GEOMAGNETISM
ionospheric plasma drifts by varying the ambient electric fields from that of its quiet time pattern. During nighttime, the low latitude plasma drifts vertically downward and zonally eastward under the effects of the ambient westward and downward electric fields, respectively. The present case study brings out a rarely observed feature of the nighttime equatorial plasma drifts, where the downward vertical drift (Figure 23) coincided with the westward zonal drift (Figure 24) during the geomagnetic storm of 17 March 2015. The storm time prevailing electric fields and the storm induced local electrodynamical changes are found to be responsible for this peculiar drift behavior.
Theoretical and numerical simulation studies of space plasma processesChief Coordinator : R.V. Reddy
Coordinators : S.S. Ghosh, A.P. Kakad, B. Kakad
Members : S.V. Singh, B. Remya, Ashwini K. Sinha, M. Lal, Rahul Rawat, A. Lotekar, S.V. Steffy, T. Sreeraj, A. Harikrishnan
One-dimensional Particle-in-Cell simulation of the head-on collision of multiple counter-propagating ion acoustic coherent phase space structures in the space plasma is performed. The thermal electrons trapped in the potentials of the IASWs are accelerated to higher velocities, resulting in the increase of kinetic energy of the electrons during their collisions. In this way, a new mechanism of electron acceleration via interaction of multiple coherent waves is proposed. Such local electron acceleration may be relevant to the energetic electrons observed in the planetary magnetospheric plasmas (Figure 25).
One-dimensional Particle-in-Cell simulation is performed to examine the proxies for the breaking of coherent ion acoustic wave structures in space plasma. The study shows
(a) Vertical plasma drift variations as observed by CADI from Tirunelveli on 17 March 2015 (green circles) during 16 to 21 UT. The black scattered plot shows the seven quiet days mean during March 2015 along with the error bounds. The positive (negative) values represent upward (downward) drift. (b) Prompt penetration induced zonal electric fi eld, which is considered as 10% of the IEFy (solid line) along with the simulated quiet day ambient zonal fi eld (dotted line). Since the study pertains to nighttime, negative (–ve) sign is introduced for IEFy. The enhanced downward drift at ~17:50 UT is attributed to the enhanced PPE fi eld of ~-1.2 mV/m. (c) Variations in IMF By (dotted line) and AL index (solid line) during the period of interest.
Figure 23 (a) Zonal plasma drift variations (blue circles) along with the mean of seven quiet days zonal drift (black scattered) as observed by spatially separated GNSS scintillation receiver technique during 16:00 to 21:00 UT. (b) The zonal drift as derived from CADI on the storm day (blue circles) and seven quiet days mean (black scattered). The positive (negative) values represent eastward (westward) drift. The drifts from both the observations show westward drift during ~16:30–18:00 UT that coincided with the downward plasma drift. The quiet days mean in both fi gures are shown with the error bars. From GNSS receiver technique, the drift measurements are not available after 18:00 UT. CADI measurements exhibited eastward drift for a short period of time after ~18:00 UT.
Figure 24

1918 19
ANNUAL REPORT 2017-2018INDIAN INSTITUTE OF GEOMAGNETISM
that both electron trapping velocity and ponderomotive potential maximize at the time of wave breaking. These
peculiar features can be used as proxies to identify the wave breaking in space plasmas (Figure 26).
Time evolution of change in distribution function (V) as compared to its initial distribution for (a) electrons and (b) ions. The dark red color zone in panel-a shows the wave interaction region, where the trapped electrons accelerated to the higher velocities.
Figure 25
Time variation of (a) maximum electric fi eld amplitude (Em) of the leading ion acoustic solitary wave pulse, (b) sum of trapping velocity, and phase velocity of the leading pulse; given by (Vtrap+Vs)for the simulation Runs(1 and 2)with two different electron temperatures. The dashed vertical lines at time step ωpitF1 and ωpitF2 show formation of two counter-propagating ion acoustic wave pulses in the simulations. The dashed lines at ωpitB1 and ωpitB2 show the time steps at which the initiation of the wave breaking takes place in the simulation runs. The horizontal lines show the thermal velocity of electrons for Run-1 (red) and Run-2(blue).
Figure 26

1918 19
ANNUAL REPORT 2017-2018INDIAN INSTITUTE OF GEOMAGNETISM
Space plasmas provide abundant evidence of a highly energetic particle population that result in a long-tailed superthermal distribution. Fluid simulations are performed to examine the effects of superthermal populations on the breaking of the ion-acoustic waves in superthermal space plasma. It is found that the wave breaking occurs early in superthermal plasma than the thermal plasma. This simulation confirmed that the balance ponderomotive force on both sides of the wave pulses is the necessary condition for the formation of coherent wave structures in the superthermal space plasmas (Figure 27).
Study of EMIC wave distribution and generation in the magnetosphere using satellite observations
An automated algorithm is developed to detect the presence of Electro Magnetic Ion Cyclotron (EMIC) waves in the Earth’s magnetosphere. The algorithm documents the basic information about each wave activity, like the wave frequency, local cyclotron frequency, start and end time of the wave event, magnetic latitude (MLAT), magnetic local time (MLT) and L shell of occurrence, wave band (proton, helium or oxygen), and the geomagnetic indices like AE and
SYMH during the event. Three years (01 January 2013 - 31 December 2015) of magnetic field data from the recently launched Van Allen Probes (previously known as Radiation Belts Storm Probes- RBSP) is used to understand the occurrence pattern and global distribution of EMIC waves and their relation to different geomagnetic activity levels. From the results, it is found that there is a peak occurrence rate in the dusk sector due to the westward drift of the ions. Another peak is in the dayside due to the magnetospheric compressions and in the pre-midnight sector, again due to westward drifting ions. Almost negligible wave activity is seen in the dawn sector. All peak occurrences are in higher L-shells (L>4) (Figure 28).
The role of substorm ion injections in triggering EMIC waves have been studied in detail for the first time. An EMIC wave event occurred on 09 August 2015 was found to be triggered due to the arrival of substorm injected hot anisotropic ions. The left-hand panels in Figure 29 shows the pitch angle distribution of protons from the HOPE instrument onboard RBSP-A. Various energy levels are marked for each panel. Observations show three clear injections, the first two being
Snapshots of the electrostatic potential at various time steps of the evolution of stable ion acoustic solitary wave structures in a fl uid simulation. The magnitude and direction of the spatially varying ponderomotive force acting at different locations on the shape of evolving potential pulse are shown with the arrows. The perfect balance between the ponderomotive force on the left and right side of the wave pulses generate a chain of stable pulses (in panel-f) in the simulation.
Figure 27

2120 21
ANNUAL REPORT 2017-2018INDIAN INSTITUTE OF GEOMAGNETISM
slightly dispersive and the third one highly dispersive. The red vertical lines mark the start time of the EMIC wave activity. The dynamic spectrum for the EMIC waves is shown in the right-hand panel (a). The local magnetic field shows a decrease as the injection arrives. Panels (b), (c), (d), and
(e) shows the local plasma parameters like temperature anisotropy, cold and hot plasma density and density ratios of ions. Ion injections during substorms are found to play an important role in dusk side EMIC waves when there is no high solar wind pressure or a geomagnetic storm (Figure 29).
The distribution and occurrence rate of EMIC waves in different L-MLT sectors. Dusk-side peak occurrence rate due to westward drift of ions is clearly seen in the fi gure.
Figure 28
Left-hand panels: The pitch angle distributions (PADs) of 15.9-51.8 keV protons as observed by HOPE instrument onboard RBSP-A. The energy decreases from top to bottom. The red vertical lines indicate the start time of each patch of the EMIC wave activity as seen in right-hand panel (a) Right-hand panels: (a) Dynamic spectra of wave magnetic fi eld (b) Temperature anisotropy T+/T|| for protons (blue), helium (red) and oxygen (green) (c) Cold plasma density calculated from the spacecraft potential obtained from EFW instrument on RBSP-A (d) Total hot ion density (e) Hot ion densities of proton (blue), helium (red) and oxygen (green) and (f) Ratio of density of helium (red) and oxygen (green) to protons. The red vertical lines indicate the start time of each patch of the EMIC wave activity.
Figure 29

2120 21
ANNUAL REPORT 2017-2018INDIAN INSTITUTE OF GEOMAGNETISM
Occurrence of electrostatic solitary waves in the lunar wake
An alternative generation mechanism for the electrostatic waves observed in the lunar wake during the first flyby of the ARTEMIS mission in terms of slow and fast ion-acoustic and electron-acoustic solitons is proposed. The lunar wake plasma is modelled by fluid multi-component magnetized plasma comprising of hot protons, doubly charged helium ions electron beam and suprathermal electrons following kappa distribution. The electric fields associated with the slow and fast ion-acoustic and electron-acoustic solitons are in the range of ~(0.003-17) mV/m. This is in excellent agreement with observed electrostatic wave electric fields. The fast Fourier transform (FFT) of soliton electric fields generate broadband spectra having peak frequencies (corresponding to peak in the power spectra) in the range of ~(3-1800) Hz. This corresponds to wave frequencies being in the range of ~(0.001 -0.56)fpe, where fpe is the electron plasma frequency. This matches well with the observed frequency range of (0.01-0.4) fpe. Further, the widths and velocities of these solitons are in the range ~ (100-8000)m and ~ (30-1300) km/s, respectively. Both, soliton widths and velocities, match well with the estimated wavelengths (a few hundred meters to a couple of thousand meters) and estimated phase velocities (of the order of 1000 km/s of the electrostatic waves in the lunar wake.
Existence domain of electrostatic solitary waves in the lunar wake
Electrostatic solitary waves (ESWs) and double layers are explored in a four-component plasma consisting of hot protons, hot heavier doubly charged helium ions, electron beam and suprathermal electrons having κ-distribution. Three modes: slow and fast ion-acoustic modes and electron-acoustic mode exist. The occurrence of ESWs and their existence domain as a function of various plasma parameters such as the number densities of ions and electron beam, the spectral index, κ; the electron beam velocity, the temperatures of ions and electron beam are analyzed. It is observed that both the slow and fast ion-acoustic modes support both positive and negative potential solitons as well as their coexistence. Further, they support a ``forbidden gap” in which region the soliton ceases to propagate. In addition, slow ion-acoustic solitons supports the existence of both positive and negative potential double layers. The electron-acoustic mode is only found to support negative potential solitons for parameters relevant to the lunar wake plasma. Fast Fourier transform (FFT) of a soliton electric field produces a broadband frequency spectrum. It is suggested that all three soliton types taken together can provide a good explanation for the observed electrostatic waves in the lunar wake.
Role of plasma processes in magnetic storms: Relevance for space weather research
During 2017-2018, the research activities were focused towards the investigation of supermagnetic storms, sources of plasmaspheric hiss emissions and electrostatic solitary waves in the Lunar wake. An important result on the supermagnetic storm research is that it is not possible to make a precise prediction of when and how often an extreme supermagnetic storm with similar and higher intensity than that of Carrington event could occur. It is estimated that O atoms and O+ ions uplifted by prompt penetrating electric field during supermagnetic storms can produce about 40-times-greater satellite drag per unit mass than normal. Another important outcome of the study was explanation for the electrostatic solitary waves observed in the Lunar wake in terms of theoretic model based on slow & fast ion-acoustic and electron-acoustic solitons.
New and ongoing projects
As EMIC waves play a major role in the Earth’s magnetosphere, especially the radiation belt dynamics, it is very important to understand their triggering mechanisms and also how, where and when these waves are triggered. The relation of EMIC wave occurrence with solar wind pressure pulses and geomagnetic storms is well understood. However, the role of substorms in triggering EMIC waves has never been looked in detail. A statistical study of substorm injection triggered EMIC waves is under process. It is seen that one-third of the observed EMIC waves during year 2015 were due to substorm injections when there were no pressure pulses or geomagnetic storms to trigger the wave activity. The magnetic field data and ion data are looked in detail to understand local conditions of wave generation. The geostationary satellites like LANL and GOES are planned to use to understand the particle drift trajectories and behavior during the studied events. The ground magnetometer data is being used to support the evidence for substorm injections.
One of the most obvious features of the plasma in the Earth’s or any other planetary magnetospheres is the existence of the rich variety of waves in it. The wave modes depend upon the plasma properties, which makes their study in space plasma very important. The nonlinear propagation of these waves in plasma has a fundamental limitation given by the wave breaking threshold. The study of the breaking of large amplitude plasma waves in plasma is a subject of both fundamental as well as practical interest as it is one of the important mechanisms for heating and acceleration of the plasma. In many practical situations like, in particle accelerator experiments, wave breaking limits the maximum achievable accelerating electric field. In this situation, a

2322 23
ANNUAL REPORT 2017-2018INDIAN INSTITUTE OF GEOMAGNETISM
Gigantic Jets records on 02 August 2013 (GJ1, GJ2) and 07 September 2014 (GJ3, GJ4) at a site (25.4oN, 81.9oE) near Allahabad, India. The grayscale is inverted, bright appearing dark. The altitude is estimated with an error of +/-1.2 km derived from an error estimate of GJ position of +/- 5 km.
Figure 30
pertinent issue is the maximum magnitude of the wave electric field that can be attained without wave breaking. The wave breaking analysis goes back to classical papers by Dawson, Davidson, and Schram, which shows stable wave propagation below the wave breaking amplitude. For larger amplitude, it was shown that the elements of the plasma electron fluid that started out in different positions overtake each other while moving back and forth during the passage of the wave. For non-relativistic plasmas, this overtaking happens when the peak fluid velocity equals the phase velocity of the plasma wave. Detecting a breaking of any wave in space plasmas is technologically difficult, because of the requirement of multiple spacecraft to track the evolution of the wave breaking process. Consequently, performing computer simulation is the best way to tackle such a problem in space plasmas. The fluid and particle-in-cell simulation of the breaking of waves in plasma shall provide the proxies to identify the wave breaking in plasma. The micro- and macro-scale picture from the computer simulations may help in identifying such processes in space plasma.
Remote sensing of far and near Earth environment and changing Humanosphere - Climate change from Earth environment studiesChief Coordinator : R. Singh
Coordinator : N. Parihar
Members : M. Lal, K. Vijaykumar, S. Sripathi, B. Veenadhari, S. Tulasiram, P. Tiwari, A.K. Maurya, S.A. Gokani, K. Venkatesham, A. Dube
The CFES research program addresses on the studies of the behaviour of Atmosphere-Ionosphere-Magnetosphere system (AIMs) due the sources and forcing from below (thunderstorms, lightning, cyclones, gravity waves, tides, earthqaukes, etc.) and above of geomagnetic-solar-interplanetary origin using active and passive remote sensing techniques. Investigations were carried out with ground based experimental observations of VLF waves, Lightning/TLE Imaging, Airglow Imaging, Ionosonde, Scintillation and GPS experiments. Suitable required supporting data from space based measurements were also utilized. Salient features of some of the important findings are as below:
First observations of Gigantic Jets from Monsoon Thunderstorms over India
The Gigantic Jets are the most spectacular of the family of discharges above thunderstorms, which includes the Red Sprites of the mesosphere and the Blue Jets from clouds into
the stratosphere. Gigantic Jets were first reported in 2002 over the Caribbean Ocean in light-sensitive video taken from the Arecibo observatory site on Puerto Rico and have since been observed mostly from a satellite at large distances, with only a few tens of events from the ground at higher resolution. Gigantic Jets are not well understood because of the sparsity of observations and the complexities of their nature. They span more than four orders of magnitude of the neutral atmospheric density in which they propagate, from a number density of ~1023 m-3 at cloud tops to ~1019 m-3 at 85 km altitude. Studies suggest that they are leaders at the lower altitudes within the stratosphere and streamers at the higher altitudes within the mesosphere.
The four Gigantic Jets observed from the site Allahabad at 25.4ºN, 81.9ºE are shown in Figure 30. The two in the left side columns (GJ1 and GJ2) were recorded on 02 August 2013 at 18:23:12.02 UT and 18:36:48.94 UT, respectively, at a distance ~430 km southwest of Allahabad. GJ1 appeared only in one image, apparently fully developed and extinguished within the 40 ms exposure time. GJ2 appeared fully developed in the second frame with the lower portion in the first frame. The bottom part of GJ2 is partly obscured up to ~20 km altitude by haze and the middle portion of GJ1 and GJ2 were obscured by clouds between the jets and the recording system. The two jets (GJ3 and GJ4) in the right side columns were captured on 07 September 2014 at 14:03:20.31 UT and 14:53:44.76 UT, respectively, at a distance of ~350 km south of Allahabad. These events lasted
2322 23
ANNUAL REPORT 2017-2018INDIAN INSTITUTE OF GEOMAGNETISM
Storm and lightning activity for GJ1, GJ2 on August 2, 2013 (left panels) and for GJ3, GJ4 on September 7, 2014 (right panels). The cloud top altitude estimated from the Meteosat satellite with the location of the jets and cloud-to-ground (CG) lightning during a 5-min period around each jet. Positive CGs are marked with “+” and negative CGs with “-“. (b): The peak current of CG lightning for one hour and in a 1ox1o region around the time and location of the jets is shown. (c) Evolution of cloud top temperature derived from MATSAT-1 satellite for the area shown as boxes in panels (a).
Figure 31
two frames each, both fully developed during the first frame with the lower portion, the “stem”, lasting a second frame. Also for these jets, the bottom parts are obscured in a haze. Two storms each produced two jets with characteristics not documented so far. Jets propagated ~37 km up remarkably in ~5 ms with velocity of ~7.4 × 10⁶ ms−1 and disappeared within ~40–80 ms, which is faster compared to jets reported earlier. The electromagnetic signatures show that they are of negative polarity, transporting net negative charge of ~17–23 C to the lower ionosphere. One jet had an unusual form observed for the first time, which emerged from the leading edge of a slowly drifting complex convective cloud close to the highest regions at ~17 km altitude. A horizontal displacement of ~10 km developed at ~50 km altitude before connecting to the lower ionosphere (Figure 30).
Meteorological activity in the vicinity of the thunderstorm system and observation site is presented in Figure 31. Top panels shows lightning activity detected by the global lightning detection (GLD) 360 networks in a 10 minute period around the occurrence time of jet events. They are superimposed on cloud altitude maps derived from cloud images from the Meteosat satellite taken around the time of the events at 18:30 UT (2013) and 14:30 UT (2014). The peak current of cloud-to-ground (CG) as detected by GLD360 network during one hour and in a 1ox1o region around the time and location of the jets is shown in the middle panel. The lower bottom panel, shows the cloud top temperature area evolution within the boxes during 16-20 UT and 12-16 UT for the GJ events of August 02, 2013 and September 07, 2014 respectively. For this purpose, MTSAT-1 cloud top temperature is used which is derived from the IR1 (10.3–11.3 μm) band observations (Figure 31).
Modeling of these Gigantic jets suggests that Gigantic Jets may bend when initiated at the edge of clouds with misaligned vertical charge distribution. In Figure 32, the evolution of the field structure above such cloud is shown in which the bottom and top charge layers are vertically misaligned and propagated a leader initiated from the main negative layer. The model of the cloud charge structure is built from four regions of electrically charged layers with spatial dimension and charge content matching a cloud producing giant jets. The charge layers are cylindrical with 20 km radius, the main central charge layers are 4 km height and the top and bottom screening layers are 1 km height. From the top to the bottom, the charge layer centers are positioned at 16.5, 13, 8 and 4.5 km altitude and they contain a charge of -3, 82, 5, -120 and 25 C, respectively. In all layers, the charge is distributed horizontally as a Gaussian distribution of size 5 km and is distributed vertically uniformly. To misalign the charges vertically, the two top layers are horizontally
shifted by 10 km from the bottom ones. The ground and ionosphere potential is at 0 V and 400 kV, respectively, and the atmospheric conductivity profile is assumed stationary and obtained from. Gigantic Jets, therefore, are not only interesting in their own right, but also offer an opportunity to study the electric discharges in the natural laboratory of the tenuous upper atmosphere, with implications for lightning dynamics and technological applications (Figure 32).
Rare Observation of Daytime Whistlers at Very Low Latitude (L = 1.08)
The source region and propagation mechanism of low latitude whistlers (Geomag. lat. <30˚) have puzzled scientific community for last many decades. In view of recent reports, there is consensus on the source region of low latitude whistlers in the vicinity of the conjugate point. But the plausible conditions of ionospheric medium through which they travel are still uncertain. In addition to that, the

2524 25
ANNUAL REPORT 2017-2018INDIAN INSTITUTE OF GEOMAGNETISM
whistlers in daytime are never observed at geomagnetic latitudes less than 20˚. The present results advocate for the first time, a rare observations of whistlers during sunlit hours from a very low-latitude station Allahabad (Geomag. Lat: 16.79˚N, L = 1.08) in India on 04 February 2011. More than 90 whistlers are recorded during 1200- 1300 UT during which the whole propagation path from lightning source region to whistler observation site is under sunlit. The favorable factors that facilitated the whistlers prior to the sunset were investigated in terms of source lightning characteristics, geomagnetic and background ionospheric medium conditions (Figure 33).
It is established that the low latitude whistlers originate from lightning discharges in low latitude conjugate region and can propagate along the magnetic lines embedded in the ionosphere. The whistler activity on 04 February 2011 is discussed in terms of conjugate lightning activity and ionospheric conditions on that day. The source lightning discharges are observed to occur in the vicinity of the
conjugate point with a radial extent of ~540 km (Figure 34). The whistler activity period was found to be geomagnetically
The evolution of the fi eld structure above a vertically misaligned charge structure and a leader initiated from the main negative layer. The electric fi eld (E) lines are shown in black, the jet is following the one in red. From the upper-left to the bottom right, the panels represent the fi eld when the jet has respectively started, reached 20, 30 and 60 km altitude.
Figure 32
The lightning activity in the conjugate region of Allahabad for a) 04 February 2011. Blue spheres represent the total lightning activity and magenta circles represent the lightning discharges that are correlated with the whistler causative sferics. b) 03 February 2011 c) 10 February 2011 and d) 18 February 2011. The red circle represents conjugate area with radius of 1000 km around the conjugate point.
Figure 34
Example of whistler spectrogram observed on 04 February 2011 after 1200 UT. The whistlers are indicated by W1-5 along with their causative sferics S1-5.
Figure 33

2524 25
ANNUAL REPORT 2017-2018INDIAN INSTITUTE OF GEOMAGNETISM
quiet. However, a significant suppression in ionospheric total electron content (TEC) compared to its quiet day average is found. EIA was significantly suppressed on 04 February and no F-region ionospheric irregularity was present. After analyzing the VTEC, the propagation of observed day time whistler waves may be attributed to lower electron density values on the event day. The reduction in the electron density indicates that the attenuation of whistler waves may be very low and hence whistler waves could be observed even during sunlit hours. This shows that background ionospheric conditions may play a key role in low latitude whistler propagation. This study reveals that whistlers can occur under sunlit hours at latitudes as low as L=1.08 when the source lightning and ionospheric medium characteristics are optimally favorable (Figure 35).
An investigation of the ionospheric F - region near the EIA crest in India using OI 777.4 and 630.0 nm nightglow observations
Simultaneous observations of OI 777.4 nm and OI 630.0 nm nightglow emissions over Allahabad (25.5º N, 81.9º E), during September - December 2009 have been utilized to study the behaviour of the F region of ionosphere using airglow derived parameters. Using an empirical approach put forward by Makela et al. (2001), firstly, a novel technique is proposed to calibrate two intensities using COSMIC/FORMOSAT-3 electron density profiles. Next, electron density maximum (Nm) of the F - layer and its height (hmF2) have been derived from the intensity information. Nightglow derived Nm and hmF2 were in reasonable agreement with few measurements reported earlier. Nocturnal variation of Nm showed the signatures of the retreat of equatorial ionization anomaly (EIA) and mid-night temperature maximum (MTM) phenomenon.
Signatures of gravity waves having period in the range of 0.7 – 3.0 h were also seen in Nm and hmF2 variations. Sample Nm and hmF2 maps have also been generated to show the usefulness of this technique in studying the ionospheric processes.
Unusual behaviour of equatorial plasma bubbles (EPBs) observed in OI 630 nm imaging over Ranchi (23º N), India
Observed EPBs lacked usual eastward drift, showed no signs of usual secondary instabilities on their eastern walls, had large north-south horizontal extension of more than 1500 km, and the apex height of associated geomagnetic flux tube was 1800 – 2000 km.
Unusual behaviour of Sporadic E layer during the total solar eclipse of 22 July 2009 was investigated using ionosonde measurements at Allahabad.
Deformation of the Indian Plate Margins and its Manifestation in the Atmosphere and Ionosphere (DIPM-LAIM)Chief Coordinator : P.S. Sunil
Coordinator : N. Sharma, DIPM-LAIM (Seismology)
Coordinator : M.S. Bagiya (Ionospheric Seismology)
Coordinator : B.V. Lakshmi (Palaeoseismology)
Members : Ajay K. Singh, K. Vijay Kumar, K.(Solid Earth) Deenadayalan, M. Ravikumar, S.
Kumar, S. Pandey, N.K. Hazarika, G. Surve, S.K. Pradhan,
P.B. Gawali, S. Amirthraj, M. Ponraj, C.D. Reddy, D.S. Ramesh
Members (Upper : S. Gurubaran, R.V. Reddy,Atmosphere & Ashwini K. Sinha, B. Veenadhari,Magnetosphere) R. Singh, S. Sripathi, G.K.
Seemala, K. Jeeva, V.J. Jacob, N. Meterbridge, A. Kulkarni
Research Scholars : A. S. Sunil, Ajish P Saji, Dhanya Thomas, Srinivas Nayak
Palaeoseismology and Palaeomagnetics
• Variations in palaeomagnetic directions, particle size and geochemical properties were studied for identification of liquefaction features at Beltola along Krishnai River, Assam.
IGS TEC for February 2011. Solid colored curves represent the TEC for the days having signifi cant lightning activity in the conjugate region of Allahabad (03, 04, 10 and 18 February 2011). The dotted brown curve represents the monthly average excluding fi ve most disturbed days.
Figure 35

2726 27
ANNUAL REPORT 2017-2018INDIAN INSTITUTE OF GEOMAGNETISM
• Magnetic properties of liquefaction features along Krishnai River, Nayapara, Assam were studied.
• Integrated magnetic, particle size and geochemical parameters were measured for the Sanghat sediments along Tipkai River, Assam to decipher the environmental conditions.
• Variations in anisotropy of magnetic susceptibility and magnetic properties were studied for characterizing earthquake induced liquefaction features at Dauki along Dauki river.
• The anisotropy of magnetic susceptibility, particle size and geochemical properties of sediments from the Raipur sediments along Gangadhar River, Assam, has been studied.
Palaeoseismic investigations were carried out in and around Dauki River to explore the possibility of identifying and dating past seismic events through documentation of liquefaction features and radiocarbon (14C) dating. Trenching along the Dauki River, south of Shillong valley resulted in the identification of deformation features as evidences of large to great earthquakes (Figure 36a). The age constraints in terms of respective lower and upper bound age brackets for individual features suggest two time intervals of their formations i.e. (i) between 130±30 to 920±30 yr BP and (ii) between 4285±35 to 9140±35 yr BP. These new ages of liquefaction features correspond to the occurrence timings of causative seismic events which are in addition to the known historical earthquakes and thus enhance the understanding of palaeoseismic history of this region. Palaeo-seismic studies using seismogenic liquefaction features have also been carried out in NE India, largely covered with the flood plain deposits of Tipakai (Dhubri), Krishnai (Goalpara) and Kolang (Nagaon) rivers (Figure 36b,c). In order to explore whether palaeomagnetic studies can aid in obtaining a time constraint on palaeoliquefaction, samples were collected for remanent magnetic studies on sand dykes and the host strata (undeformed). In stereo-plots (Figure 37a-f), the characteristic remanent magnetizations (ChRM) from the host strata (D=247.4, I=73.3) and from the liquefaction (D=256, I=75.1) itself represent the geomagnetic field direction at the time of deposition and at the time of the earthquake event respectively (Figure 37 a,b). The ChRM data possess a strong clustering around the mean value; a value that fits well with the geomagnetic field values for this place at this time in the past (i.e. the values recorded in the host strata). This implies that the ChRM-carrying fine particles in the liquefaction feature were able to move, rotate and re-align with respect to the geomagnetic field direction. Anisotropy of Magnetic Susceptibility (AMS) in the undeformed beds exhibit depositional fabric and the
liquefaction features have different and distinctive AMS fabrics (Figure 37 c-d). The degree of anisotropy which provides information about the degree of deformation is high for liquefaction whilst for the undeformed it is low (Figure 37 e-f). The new application of AMS provides a petrofabric tool to identify dikes as seismites, which, with good age constraints, may provide an important addition to paleoseismic records.
Lithospheric Seismology
The northeast region of India come under one of the most active seismic zone, Zone V, which means NE region of India is highly vulnerable to seismic hazard in both socio-economic manner. Thus it is indispensable obligation to mitigate the seismic hazard by carrying out Seismic hazard Analysis (both probabilistic and deterministic) for this region. The hazard analysis will require micro-zonation of the region, study of site characterization which ultimately leads to the key models popularly known as Ground Motion Prediction Equations (GMPEs). The generation of GMPE is the only key to prepare Iso-pga maps, calculation of Seismic hazard and risk analysis to mitigate the hazardous effects of earthquakes in the region.
Earthquake induced liquefaction features (sand dykes) observed along (a) Dauki river (b) along Krishnai river and (c) along Kolang river.
Figure 36
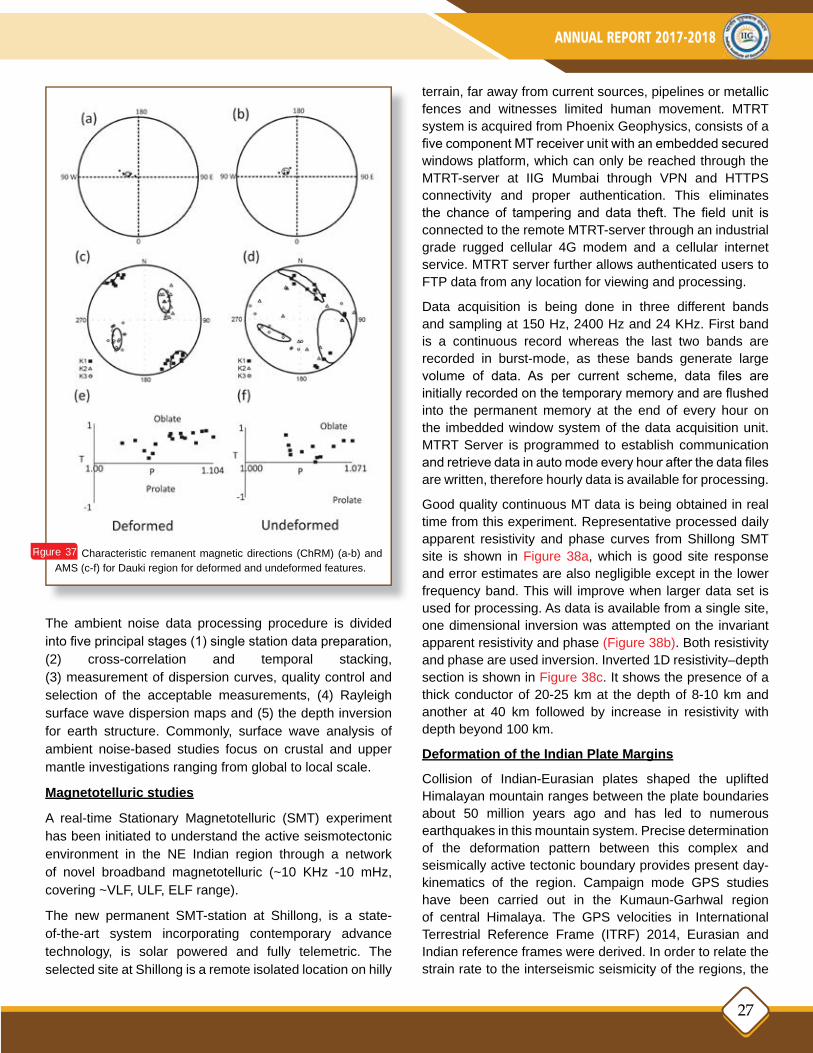
2726 27
ANNUAL REPORT 2017-2018INDIAN INSTITUTE OF GEOMAGNETISM
The ambient noise data processing procedure is divided into five principal stages (1) single station data preparation, (2) cross-correlation and temporal stacking, (3) measurement of dispersion curves, quality control and selection of the acceptable measurements, (4) Rayleigh surface wave dispersion maps and (5) the depth inversion for earth structure. Commonly, surface wave analysis of ambient noise-based studies focus on crustal and upper mantle investigations ranging from global to local scale.
Magnetotelluric studies
A real-time Stationary Magnetotelluric (SMT) experiment has been initiated to understand the active seismotectonic environment in the NE Indian region through a network of novel broadband magnetotelluric (~10 KHz -10 mHz, covering ~VLF, ULF, ELF range).
The new permanent SMT-station at Shillong, is a state-of-the-art system incorporating contemporary advance technology, is solar powered and fully telemetric. The selected site at Shillong is a remote isolated location on hilly
terrain, far away from current sources, pipelines or metallic fences and witnesses limited human movement. MTRT system is acquired from Phoenix Geophysics, consists of a five component MT receiver unit with an embedded secured windows platform, which can only be reached through the MTRT-server at IIG Mumbai through VPN and HTTPS connectivity and proper authentication. This eliminates the chance of tampering and data theft. The field unit is connected to the remote MTRT-server through an industrial grade rugged cellular 4G modem and a cellular internet service. MTRT server further allows authenticated users to FTP data from any location for viewing and processing.
Data acquisition is being done in three different bands and sampling at 150 Hz, 2400 Hz and 24 KHz. First band is a continuous record whereas the last two bands are recorded in burst-mode, as these bands generate large volume of data. As per current scheme, data files are initially recorded on the temporary memory and are flushed into the permanent memory at the end of every hour on the imbedded window system of the data acquisition unit. MTRT Server is programmed to establish communication and retrieve data in auto mode every hour after the data files are written, therefore hourly data is available for processing.
Good quality continuous MT data is being obtained in real time from this experiment. Representative processed daily apparent resistivity and phase curves from Shillong SMT site is shown in Figure 38a, which is good site response and error estimates are also negligible except in the lower frequency band. This will improve when larger data set is used for processing. As data is available from a single site, one dimensional inversion was attempted on the invariant apparent resistivity and phase (Figure 38b). Both resistivity and phase are used inversion. Inverted 1D resistivity–depth section is shown in Figure 38c. It shows the presence of a thick conductor of 20-25 km at the depth of 8-10 km and another at 40 km followed by increase in resistivity with depth beyond 100 km.
Deformation of the Indian Plate Margins
Collision of Indian-Eurasian plates shaped the uplifted Himalayan mountain ranges between the plate boundaries about 50 million years ago and has led to numerous earthquakes in this mountain system. Precise determination of the deformation pattern between this complex and seismically active tectonic boundary provides present day-kinematics of the region. Campaign mode GPS studies have been carried out in the Kumaun-Garhwal region of central Himalaya. The GPS velocities in International Terrestrial Reference Frame (ITRF) 2014, Eurasian and Indian reference frames were derived. In order to relate the strain rate to the interseismic seismicity of the regions, the
Characteristic remanent magnetic directions (ChRM) (a-b) and AMS (c-f) for Dauki region for deformed and undeformed features.
Figure 37

2928 29
ANNUAL REPORT 2017-2018INDIAN INSTITUTE OF GEOMAGNETISM
total strain rate has been estimated from the velocity derived principal strain components. To facilitate the slip-rate along the Main Himalayan Thrust (MHT), interseismic surface deformation velocity has been modeled by considering the uniform slip dislocations on MHT from Main Central Thrust fault in an elastic, isotropic and homogeneous half-space medium.
Ionospheric seismology
SAMI2 model simulations are carried out to examine the response of the ionospheric density to Raleigh wave induced atmospheric perturbations. The vertical displacement of the Earth’s surface during a seismic event (e.g., Nepal Earthquake) generates periodic vertical compression and rarefaction in the atmosphere. The vertical oscillation velocity of the air parcel at the surface of the Earth is of the order of a few millimetres per second. However, due to the amplification at higher altitudes, the vertical wind velocity becomes quiet significant. In order to calculate the wind field over various distances from the epicenter, the Rayleigh wave amplitude at Earth’s surface is assumed to reduce as r-1/2 (where r is the displacement on the surface of the Earth with respect to the epicenter). The travel-time diagram (keogram) for the vertical wind velocity at ionospheric height i.e., 200 km is shown in Figure 39. Since the propagation of the seismic Rayleigh wave has been assumed to be uniform in all directions, the magnitude of the vertical particle velocity perturbation is also varying uniformly in both north and south directions. Figure 40 a,b shows the travel-time diagram (keogram) at 150 and 175 km respectively for the ionospheric density perturbation (in %) due to the infrasound forcing in the SAMI2 simulation. It can be seen
(a) shows daily apparent resistivity and observed phase curves obtained from the SMT monitoring site at Shillong, fxy,fxy(red squares) and ryx, fyx(blue squares). Good response is obtained for the 10 kHz to 1 mHz frequency range (b) Apparent resistivity and phase of the MT sounding data (invariant mode). Measured (cross) and modelled (solid line) are illustrated. (c) 1D resistivity depth section obtained for at Shillong SMT station, showing presence of conductor at 8km depth and another at 42 km depth.
Figure 38
Displacement-time diagram (keogram) of the infrasound propagation at 200 km height for Nepal EQ. The north and south arm of the keogram for the vertical particle velocity is identical for the Rayleigh wave propagation.
Figure 39

2928 29
ANNUAL REPORT 2017-2018INDIAN INSTITUTE OF GEOMAGNETISM
that the ionospheric perturbation amplitude is significantly asymmetric in the north and south directions at all height levels. The perturbations are large in the northern side of the epicenter than that of southern side. The amplitude of the perturbation is also quite large below 200 km height in comparison to that above it. Based on these results, it is suggested that seismic propagation on the Earth’s surface does not map linearly in terms of the ionospheric response. Accordingly, it is suggested that an inherent asymmetry of the ionosphere exists due to the variation in the inclination of the Earth’s magnetic field with epicenter location.
Coseismic traveling ionospheric disturbances (CTIDs) and their propagation characteristics during Mw 7.8 Gorkha earthquake in Nepal on 25 April 2015 have been investigated using a suite of ground-based GPS receivers and broadband seismometers along with the space-borne radio occultation observations over the Indian subcontinent region.
The challenging problem of identifying the earthquake source characteristics using its ionospheric manifestations is attempted for the recent Nepal earthquake of 12 May 2015. It is found that the manifestation of near field co-seismic ionospheric perturbations surrounding the epicenter is highly controlled by the geomagnetic field-acoustic wave coupling and moving satellite geometry (Figure 41). The thrust orientations as the sources of CIP rather than
Ionospheric TEC response to the seismic infrasound in the SAMI2 model using displacement-time diagram (keogram) of the ionospheric perturbations at (a) 150 km and (b) 175km. Even though the infrasound propagation is symmetric in North-South directions (as shown in the previous fi gure), ionospheric TEC response in SAMI2 model is asymmetric. This asymmetry is mainly attributed to asymmetric orientation of geomagnetic inclination.
Figure 40
Near-fi eld co-seismic ionospheric perturbations (CIP) evolution as observed by PRN 19, 09, 23, and 27 during 12 May 2015 earthquake. (a) IPP locations at the time of the detection of CIP in PRN 19, 09, 23, and 27. The InSAR crustal deformation is reproduced to get the clear insight on the directionality of tectonic forcing distribution at ground and that of the CIP amplitude distribution at IPP height of ~330 km. (b) CIP evolution in TEC with time in PRN 19. (c) Same as (b) but for PRN 09, 23, and 27. It could be noticed that, though maximum of rupture induced energy propagated in southeast direction the CIP preferentially grown in southwest of the seismic source.
Figure 41

3130 31
ANNUAL REPORT 2017-2018INDIAN INSTITUTE OF GEOMAGNETISM
considering only the epicentre or maximum uplift area are proposed during the Mw 7.8 Kaikoura earthquake of 13 November 2016 (Refer Cover page). A successful attempt, using the simulation approach for the coupled tsunami atmosphere-ionosphere system, to explore the
(a) Sumatra tsunami amplitude map with travel time shown by contours in 30 min time interval. Red star indicates the 26 December 2004 earthquake epicenter and white grids indicate rupture model. The IPP trajectories projected at 350 km altitude for PRN 19 are also shown for eight receivers with their locations marked by triangles. The circles in trajectories represent the IPP location at 45 min, at maximum amplitudes in ΔTECobs, from the beginning time of tsunami. The inset shows the Sumatra earthquake’s focal mechanism solution in beach ball, aftershock in green circles from U.S. Geological Survey (USGS), GPS observed coseismic horizontal and vertical land deformation in red and blue velocity vectors, respectively, and cumulative radiated energy in contours during this megathrust earthquake event. For more details on this and references of the rupture model, vertical and horizontal deformation velocity vectors and cumulative radiated energy please refer Bagiya et al., 2017b. (b) TEC variations as observed by PRN 19 along the IPP trajectories from 8 GAGAN GPS stations and (c) Detrended ΔTECobsfor the same IPP trajectories. The time axis is zeroed with respect to the tsunami origin time (00:58 UT) and represents the average time in each running average window. The evolution of TEC disturbances could be observed at all stations within ~30min from tsunami onset time and ~90 minutes before the actual tsunami wave arrival at Indian east coast. Long-period envelop of ~60min could be clearly elucidated in ΔTECobs. The similar signatures are absent in previous day ΔTECobs (25 December 2004). For more details on this please refer Bagiya et al., 2017b. This work appeared at cover page of JGR-SP July 2017 issue.
Figure 42
precursory tsunami signals in the ionosphere have been made by studying the ionospheric disturbances associated with Sumatra 2004 tsunami which were observed about 90 minute prior to the actual tsunami arrival in TEC data from receivers located near the Indian east coast (Figure 42).

3130 31
ANNUAL REPORT 2017-2018INDIAN INSTITUTE OF GEOMAGNETISM
New and Ongoing initiatives in NE India
India stands highly vulnerable to seismic hazards owing to the burgeoning population and extensive developmental investments. In the past, the India has experienced several devastating earthquakes namely 1897 Shillong, 1905 Kangra,1950 Assam and 1934 Bihar–Nepal earthquakes, 1993 Latur, 1997 Jabalpur, 1999 Chamoli, 2001 Bhuj and 2005 Kashmir. At the regional level, hazard zonation of the country has been provided by BIS (2002) and the Global Seismic Hazard Assessment Program (GSHAP, 1999). The four zones demarcated by BIS, namely, zone II, III, IV and V have been respectively assigned hazard factor of MSK intensity of VI (or less), VII, VIII and IX (or above) with the corresponding zone factors designated as 0.10 g, 0.16 g, 0.24 g, and 0.36 g respectively. It is worth mentioning that Northeast India is categorized as Zone V which means high seismic risk. Thus the multipametric studies carried out under DIPM-LAIM project are aimed at mitigating the seismic hazard by identifying precursory signature in different geophysical parameters like radon gas, Ionospheric perturbations, AEFM, GPS, etc.
The geodynamics of the North-East India is quite complex. Tectonically, it is wedged between two convergent regimes: the Indo-Eurasia in the north and Indo-Burma to the east. The major geological units can be demarcated as Brahmaputra valley which divides the Himalaya with Shillong Plateau and Mikir Hills. Earlier studies, though few are very scarce and does not always present the complete structure of North-East (NE) India as a whole. The Moho depth derived from receiver function in Shillong Plateau and Mikir hills region is relatively low compare to surrounding Bhramaputra valley. This could be an interesting starting point for different seismological studies to determine a 3-dimensional velocity model for the NE India. The station installation work has already been carried out under this program.
The scientific program on Lithosphere-Atmosphere-Ionosphere-Magnetosphere coupling is aimed at multi-parameter investigations to understand the physics as well
All-sky images of OI 5577 nm emission obtained during the night of 10 March 2018 revealing the presence of quasi-periodic wave features propagating from the top left towards bottom right.
Figure 43
as the nature and extent of the coupling between the various domains. With a multi-wavelength all-sky airglow imager, it was proposed to monitor perturbations of dynamical origin appearing in airglow intensities at heights in the range of 85-97 km. An all-sky airglow imager was procured during the FY 2016-2017 and the instrument was deployed at M.O. Silchar in temporary campaign mode in November 2017. Due to foggy weather conditions and rains in the North-East, only few nights of useful observations were possible during December 2017 and March 2018. On 10 and 18 March 2018, the green line emission of atomic oxygen emanating from 97 km revealed intense wave activity (Figure 43). Analysis of the corresponding images is currently underway to compute the wave parameters. For future campaigns, it is needed to take into consideration the condensation issues at the site, the foggy conditions and frequent weather disturbances affecting the airglow observations.
SOLID EARTH RESEARCH
INTEGRATED APPROACH TO SOLID EARTH STUDIES- DATA & MODELLINGChief Coordinator : N. Basavaiah
ENVIRONMENTAL MAGNETISM STUDIES
Coordinator : B.V. Lakshmi
Members : N. Basavaiah, K. Deenadayalan, K.V.V. Satyanarayana, P.B. Gawali
Sediment grain size distribution trends in fluvial sediments in Tirna basin, Maharashtra
In coastal environments, estuaries are geologically and hydrodynamically complex and form a transition between

3332 33
ANNUAL REPORT 2017-2018INDIAN INSTITUTE OF GEOMAGNETISM
have 65.8%-82.37% silt, 12.85%-21.59% clay and sand of 1.06-6.49%. Ter sediment grain size varies from 75%-84.97 silt content, clay 9.6% and 24.86 and very fine sand 0.13-6.76%. Therefore, in the upstream of Tirna river (Dutta, Palsap and Ter regions) sediment grain size is mainly silt, followed by clay and very fine sand.
Makani section sediments have grain size of silt ranges from 78.15%-84.53%, clay from 8.26% to 15.15% and sand from 0.22% to 10.71%. In Sastur, silt conent varies between 77.39% and 86.38%, clay 9.83-12.5 and sand 2.02-7.92%. In Killari section, the sediment grain size varies from silt to very fine sand with clay content of 6.47% to 12.12%, silt of 78.6% to 84.2% and very fine sand ranges from 4.0 % to 13.79%. The Sawari samples have clay content of 10.71%-16.64, silt content veries between 57.78 and 82.56% and sand content of 3.98-18.22%. In Tirna downstream sections (Makni, Sastur, Killari and Sawari), the grain size are dominantly silt followed by clay and very fine sand. The clay percent is more in upstream sections whereas very find sand is more in downstream sections. The present study attempts to analyze grain size distributions of the fluvial sediments from Tirna River with an aim to provide a better understanding of the factors controlling the sediment distribution and transport.
Magnetic mineralogy and magnetic grain size properties of Tirna river sediments
Magnetic mineralogy
Thermomagnetic investigation (k-T curves) and acquisition and backfield demagnetization of isothermal remanent magnetization (IRM) experiments were performed to characterize the magnetic mineralogy. F300 is a ratio between IRM300 mT and SIRM, indicating the relative proportions of ferromagnetic minerals (e.g. magnetite) and imperfect anti-ferromagnetic minerals (e.g. hematite and goethite). It decreases with increased contribution from imperfect anti-ferromagnetic minerals. A mean value of 92% for F300 means that IRM obtained by the samples is nearly saturated in a field of 300 mT. This reveals that the magnetic properties of the samples are dominated by ferromagnetic minerals (Figure 45a). Meanwhile, the contribution of imperfect anti-ferromagnetic minerals cannot be neglected. The lower Bcr values of 30-60 mT also suggest the dominance of low coercivity minerals (Figure 45b). Few variations of F300 and Bcr values among the sites reflect the relatively similar composition of magnetic minerals in the study area.
Figure 45c-f shows plots of thermomagnetic curves of typical bulk samples which was taken from Tirna River sections. All the four samples show similar Curie temperatures (Tc) of
riverine and open ocean environments. The fluvial systems are the major suppliers of sediments to the estuaries. They contain a complex mixture of eroded sediments from different source rocks, agricultural and farming inputs and anthropogenic materials. Various depositional environments possess different grain size distributions due to differential rate of erosion, deposition and transport processes in the basins in which the sediments have accumulated. The transport and depositional processes are in turn strongly dependent on the grain properties, including grain size and density and the prevailing local hydrodynamic conditions. Hence determination of the grain size distribution of sediments could be used to investigate the depositional environment.
Sediments from different sections along the Tirna River vary considerably in their grain sizes ranging between 4 and 500 μm. The Dutta samples have clay (<4 μm) content of 10%-12%,silt content varies between 59.5% and 86.6%, of which the percentage of very fine silt (4-8 μm) is averaged 13.3%, fine silt (8-16 μm) 23.2%, medium silt (16-32 μm) 25.9% and coarse silt (32-63 μm) 17.9%. This clearly shows that fine and medium silts are the predominant size of silt. The sand (>63 μm) fraction ranges from 1.2% to 6.9%. The representative grain size curves of all the section samples are plotted in Figure 44. Sediments from Palsap section
Particle size distribution of sediments from Tirna basin (a) Upstream (b) Downstream
Figure 44

3332 33
ANNUAL REPORT 2017-2018INDIAN INSTITUTE OF GEOMAGNETISM
~580°C, indicating that magnetite is the major ferrimagnetic mineral. The heating and cooling processes show irreversible feature. After cooling to room temperature, magnetization of samples 2-3 times higher than that before heating, indicating the formation of ferromagnetic mineral during heating process.
Grain-size of magnetic minerals
Values of frequency dependent susceptibility (χfd%) vary from 5% to 12%, suggesting the presence of superparamagnetic (SP) particles. Since %ARM is sensitive to stable single domain (SSD, 0.04-0.06 μm) ferrimagnetic minerals, ratio XARM/X can be used to indicate the grain
(a) Representative Isothermal remanent magnetization (IRM) acquisition curves (b) backfi eld demagnetization and (c-f) Heating and cooling parts of representative thermomagnetic curves
Figure 45

3534 35
ANNUAL REPORT 2017-2018INDIAN INSTITUTE OF GEOMAGNETISM
size of magnetic minerals, with higher values reflecting fine grained SSD particles and lower values multi-domain (MD) or SP particles. Ratio XARMISIRM is also indicative of grain size, but is unaffected by SP particles and therefore lower values correspond to coarse MD particles. The samples are characterized by XARMIX< 10 and XARMISIRM < 50x10-5 mA-1, indicating that the magnetic minerals are mainly of pseudo-single domain (PSD, 0.1-10μm)-MD in size.
Based on magnetic hysteresis measurements, ratio of remanent saturation magnetization (Mrs) to saturation magnetization (Ms) and ratio of remanence coercive force (Bcr) to coercive force (Bc) are calculated. On the plot of MrslMs versus BcrlBc (i.e. Day plot), the samples are located in the PSD range (Figure 46).
Archaeomagnetic studies in DVP
The geomagnetic field is quite changeable and is on a path of continuous change that has far reaching implications on the lifer form. The instrumented records of magnetic field changes go back in time to few centuries. This time can be breached with the help of archaeological artifacts that has been fired (potteries, bricks, kilns).
Such fired materials are seen to acquire the dominant magnetic field direction prevalent during the heating up episode revealing information on the then direction and intensity of the geomagnetic field. Archaeomagnetism is an effective way to understand the variation of the geomagnetic field over periods of centuries to millennia during the Holocene.
Mineral magnetic studies carried out on the Maharashtra state archaeological artifacts (Nalasopara, Kanheri, Ter and Junnar) reflect the ferrimagnetic components in single/pseudo-single domain state and are predominantly found in all artifacts. Mumbai Buddhist sites Kanheri and Nalasopara Caves were found to belong to 1st century BC and 3rd century BC respectively. Palaeointensity values for Nalasopara (Kanheri) Banc= 38.3 ± 4.9µT (Banc= 33.1±4.3µT) are obtained. The Ter site has given mean archaeointensity value of Banc= 40.79 ± 3.6 µT (14th century AD) and mean Banc value of 37.01 ± 2.1 µT (3rd century BC) was obtained for Junnar. New intensity values are inserted in the Indian secular variation curve (Figure 47).
Detailed mineral magnetic studies work carried out on the Mumbai forts and Aurangabad cave archaeological artifacts reflect presence of ferrimagnetic components in form of single/pseudo-single domain state and are found to be suitable for palaeointensity measurements.
Environmental magnetic studies of beach and fluvial deposits of Sindhudurg district and Assam to understand their deposition dynamics
The present study underlines the utility of magnetic parameters in studying sediment accumulation and erosion (movement) along the beaches and also the fluvial sediments. This technique allows one to collect rapidly and reliably the initial data on sediment movement. The upper
Day-plot of representative samples (Hcr/Hc: remanent coercive force versus coercive force; saturation remanent magnetization versus saturated magnetization; SD: single domain; PSD: pseudo-single-domain; MD: Multi domain
Figure 46
Magnetic susceptibility variations in beach sediments for three seasons
Figure 47

3534 35
ANNUAL REPORT 2017-2018INDIAN INSTITUTE OF GEOMAGNETISM
Palaeointensity results from Nalasopara (NS), Junnar (JN), Kanheri (KH), Lonar (LN) and Ter (TR) superimposed palaeosecular variation (PSV) model curves for India.
Figure 48
3-4 cm surface sediment samples were collected from the beaches at every 10 m interval from reference point, i.e., 0m (nearer to sea), 10m, 20m … (away from sea towards the land) seasonally during premonsoon (May), monsoon (July) and postmonsoon (November), at 20 selected stations along beaches of the study area.
The three beaches studied are characterized by distinctly different magnetic signatures in terms of their concentration and magnetic grain sizes. At Vengurla beach, concentration of magnetic minerals is moderate to very low premonsoon; high to low during monsoon; and low to very low postmonsoon. In terms of magnetic grain size, presence of fine SD grains is moderate to high premonsoon; moderate to low during monsoon; and low postmonsoon at stations 1, 4, 7, and 8. Magnetite and titanomagnetite are present in samples collected at station 3, whereas hematite was found at station 4. Aravali beach (stations 8-14) has a very low concentration of magnetic minerals. Titanomagnetite and magnetite are present at station 13. At Redi beach (stations 15-20) the concentration levels of magnetic minerals are seen to increase from station 16 onward. The overall concentration of magnetic minerals at Redi beach is high premonsoon,
and increases during monsoon season, although at certain locations it is seen to rise still further postmonsoon. High susceptibility values (Figure 48), especially at Vengurla and Redi beaches, seem to be controlled by ferrimagnetic minerals like magnetite and titanomagnetite. There is also a distinct possibility of presence of antiferromagnetic minerals like hematite at stations where χLF is found to be low. The concentration of magnetic minerals is greater at the northern (stations 1 and 2) and southern (stations 16 to 19) ends of Vengurla and Redi beaches, respectively. The presence of magnetite and titanomagnetite can be attributed to Deccan traps and relict sands.
The NE region of India is complex with many geotectonic and sedimentary processes working in tandem. The fluvial deposits at Sanghat, along Tipkai River, Assam-Meghalaya plateau, contain in them many signatures of environmental and climatic vicissitudes. The susceptibility at Sanghat core is seen to decrease from bottom to top. The maximum susceptibility (MS) is observed at 60 cm depth. SIRM is seen to follow the MS pattern. ARM indicates the magnetic grains are fine and mostly hematite. S-ratio and hard and soft IRM, along with the coercivity reveals the magnetic carrier is both magnetite and hematite. The area is witness to repeated flooding, seismic activity and landslides.

3736 37
ANNUAL REPORT 2017-2018INDIAN INSTITUTE OF GEOMAGNETISM
The enhanced MS found at a particular depth (60 cm) could be a result of abrupt fluvial influx due to flooding on account of exaggerated monsoon or landslide triggered by some seismic activity.
This technique, being fast and cost effective, can complement the ‘traditional’ methods used to study sedimentological variations in varied environments, such as beach or fluvial.
ELECTROMAGNETIC INDUCTION STUDIESCoordinator : A.K. Singh
Members : C.K. Rao, P.B.V. Subba Rao, A. Kumar, D. Nagarjuna, P.V. Vijaya Kumar, S. Ghoshal
Magnetovariational studies were carried out along four different EW profiles in Saurashtra region in different phases, during January 2007–March 2012. Transient geomagnetic field variations (X, Y horizontal field and Z vertical field components) recorded along these profiles are analyzed to infer the electrical conductivity distribution of the region. The vertical field transfer functions which depict the characteristics of electrical conductivity distribution are presented in the form of induction arrows. From the spatial distribution of these arrows, it is inferred that the sediments filling the offshore basins have more conductivity than those basins in Saurashtra region. Z /H pseudo sections along the four profiles in conjunction with tectonics and other geophysical methods permit to infer that the conductivity anomaly in the eastern part of the profiles is associated with the crustal/lithosphere thinning. The possible cause for these anomalies may be explained in terms of partial melts associated with mafic intrusions, related to Deccan and pre-Deccan volcanism. High resistive block related to underplating mantle material has been reflected in 1D models of long period magnetotelluric data and its thickness reduces from west to east (Figure 49).
PALAEOMAGNETIC& PETROLOGIC STUDIESCoordinator : S.K. Patil
Members : Anup K. Sinha, R. Nishad, K. Vijayakumar, V. Purushotham Rao, S.K. Pradhan
Low field AMS investigations on the Dalma Volcanics, Singhbhum Craton
Dalma volcanics occur in an arcuate belt of 200 km long and 37 km wide along the spine of the North Singhbhum Orogen. The volcanics are folded into a large syncline with an axial
(F2) surface trending EW. Northern limb of the syncline is overturned to the south and is bound by a thrust called the Dalma thrust. The syncline is refolded on its eastern and western ends. The eastern end is marked by largescale F3 folds on NE-SW axis. Reclined F1 folds are seen at both ends of the belt. Low field AMS measurements have been carried out on 165 specimens belonging to 16 sites covering the entire Dalma Group of rocks. For these measurements KLY-2 Kappabridge has been used and the generated data was analysed with the ANISOFT software to convert the raw information into data which can be interpreted in the form of graphs and stereoplots. Based on the AMS studies we noticed the changing trend of the magnetic foliation planes. The minerals are aligned in a foliation plane which is of almost E-W orientation in the extreme west and in a clockwise motion slowly changes to N-S towards the central area of the E-W trending Dalma Volcanics. In the eastern part we see the similar trend where the alignment of the magnetic foliation plane reverts back to the E-W direction from the N-S direction in a similar fashion. The locations with vertical magnetic foliation plane can be possible spots from where the intrusion happened and the lava spread outwards.
(I) Geological map of Saurashtra and the surrounding regions (after Merh, 1995, Geology of Gujarat, GSI Publication, Bangalore) shows that the entire region is covered by Deccan volcanism and various fl uxgate magnetometer and long period Magnetotelluric stations installed in different phases. (II) Z/H Pseudo sections along three profi les brings out anomalous conductivity zone at shallow depth in eastern part of the region and is related to the crustal/lithosphere thinning along the track of Reunion hotspot. The possible cause for these anomalies may be explained in terms of partial melts associated with mafi c intrusions, related to Deccan and pre-Deccan volcanism.
Figure 49

3736 37
ANNUAL REPORT 2017-2018INDIAN INSTITUTE OF GEOMAGNETISM
Petrological studies on dolerite dykes of Singhbhum Craton
The petrological studies of all 179 thin sections reveal that dolerite with variable degrees of alterations is overwhelmingly the dominant member of the dyke system within the Singhbhum granite rock. The main mafic mineral is clinopyroxenes with a distinct ophitic texture and replacement by chlorite and actinolitic is noticed in almost in all thin sections. The grain boundary is more altered compared to the centre of the grain. The plagioclase laths and pyroxenes shows ophitic to sub-ophitic texture in many cases with distributed anhedral or subhedral grains of opaque minerals mostly shows the two phase of crystallization. Clouding of plagioclase feldspars has been observed in all the thin sections indicating a post formation regional thermal event. In this study, the minor amounts of Ca-rich and Ca-poor clinopyroxene render this order difficult to confirm.
Magnetic susceptibility and quartz grain microtexture studies on the sediments of climatic history of Ny-Alesund, Svalbard, Arctic Region
Mineral magnetic investigations comprising of magnetic susceptibility, forward and back field IRMs along with quartz grain microtexture studies have been carried out on twenty sediment samples of a 1 m deep trench to decipher the past environmental changes in and around Ny-Alesund, Svalbard, Arctic Region. The quartz grain microtexture reveals predominant glacial activities in the top 40 cm of the section, while the middle 40–55 cm part represents some aeolian activities along with glacial signatures. The bottommost part, in addition to glacial markers, exhibits some aqueous evidences as well. The lithology shows medium-grained sand in the upper part and coarse-grained sand with occasional shell pieces in the lower part. Angular gravels (2 mm–12 mm) are present throughout with increasing size from top to bottom. On the basis of above observations and 14C AMS dates, it can be summarized that after the Last Glacial Maximum (LGM), the pre-Holocene period shows rapid glacial retreat, followed by a warmer period during the early Holocene. Mid- and late Holocene is marked by a predominantly glacial environment characterized by melt water streams originating from the glaciers and flowing into the fjord. Through magnetic susceptibility studies four alternate stages of colder and warmer phases have been established. Though some similarities among the different climatic phases are discernible between the quartz grain microtexture and magnetic susceptibility studies, they are not completely compatible, which is probably due to their different responses to the climatic variations.
ELECTRICAL RESISTIVITY & GROUNDWATER QUALITY STUDIESCoordinator : G. Gupta
Members : M. Laxminarayana, G. Shailaja, N. Suneetha
Estimation of aquifer parameters from coastal Sindhudurg district, Maharashtra
Estimation of hydraulic parameters in coastal aquifers is an important task in groundwater resource assessment and development. Normally, these parameters are computed from pumping test studies of bore wells. However carrying out pumping tests at many sites may be both expensive and extensive. Therefore an attempt is made to estimate these parameters using geoelectrical data in combination with resistivity of pore water of existing wells. In the present study, hydraulic parameters like formation factor, porosity, hydraulic conductivity and transmissivity have been computed using ordinary kriging technique from coastal region of north Sindhudurg district, Maharashtra, India.
In the present study, 29 Schlumberger VES were analysed along with 29 water samples, collected from the respective dug wells and boreholes in order to determine the pore-water resistivity. The hydraulic conductivity values were estimated using Kozeny–Carman–Bear (KCB) equation, while the porosity (ϕ) and other petro physical parameter required in KCB equation was calculated using Archie’s empirical law. The calculated apparent resistivity data were inverted and the secondary geophysical parameters were evaluated.
The empirical relation of formation factor (F) was established from pore-water resistivity and aquifer resistivity for fresh and saline aquifers. The result shows some parts of the study area reveal relatively high value of hydraulic conductivity, porosity and transmissivity. Further, a negative correlation is seen between hydraulic conductivity and bulk resistivity. The hydraulic conductivity is found to vary between 0.014 and 293 m/day, and the transmissivity varied between 0.14 and 11,722 m2/day in the study area.
The transmissivity values observed here are in good correspondence with those obtained from pumping test data of Central Ground Water Board. These zones also have relatively high aquifer thickness and therefore characterize high potential within the water-bearing formation. A linear, positive relationship between transverse resistance and transmissivity is observed, which suggests that increase in transverse resistance values indicate high transmissivity of aquifers. These relations will be extremely vital in characterization of the aquifer system, especially from crystalline hard rock area (Figure 50).

3938 39
ANNUAL REPORT 2017-2018INDIAN INSTITUTE OF GEOMAGNETISM
Spatial variability map of hydraulic Conductivity, Transmissivity, Porosity in north Sindhudurg district, Maharashtra.Figure 50
Assessment of trace element concentrations in semi-arid region, southwest Maharashtra
The Mann River basin and the surrounding areas have been experiencing severe drought due to paucity of rainfall over several decades. The populace here relies chiefly on agriculture and consequently excessive and erratic use of fertilizers and pesticides are being used to enhance the crop production. This has resulted in soil contamination which persists in the subsurface stratum for several years. Therefore it is of utmost importance to evaluate the suitability of soil for agricultural practices, protection of aquifers and human health. Soil samples from 80 different locations in the surveyed region were collected and evaluated for eight trace element concentrations utilizing several risk assessment indices, correlation coefficients and principal component analysis (PCA). The results reveal significant contamination of the soil quality over Mann Ganga River basin. Several toxic trace elements like Cu, Zn, V, Fe and Mn has moderate to high concentration in the soils of the
study expanse as revealed from index of geoaccumulation, enrichment factor and contamination factor.
Relatively elevated values of Cu are observed almost throughout the study area which is due to the composition of quartz tholeiitic in basalts thereby increasing its abundance in the soil. The high concentration of vanadium is due to both geogenic and anthropogenic sources. PCA results suggest that the trace elements in PC1 accounts for 36.243% of total variation with a strong positive loading in Cu and Mn, and is moderately correlated with Zn and Fe, displaying high loadings. PC2 showed a variance of 24.323%, with strong loading in V, while a moderate loading is revealed in Fe. The results of PCA recognized two factors controlling the inconsistency in trace elements of the soil of drought-prone Mann River basin. The variation in Fe, Mn, Co and Zn is related in the same factor and is controlled by lithogenic origin. The inconsistency of Cu, V, Ni and Cr is however dominated by both geogenic and anthropogenic sources (Figure 51).

3938 39
ANNUAL REPORT 2017-2018INDIAN INSTITUTE OF GEOMAGNETISM
continental margin with excessive melt generation in the north as Indian plate separated from Seychelles micro-continent. The large amounts of melt generated in the northern part of WCMI appear to be the consequence of the interaction of the Reunion hotspot with thinned lithosphere around 65Ma forming one of the largest igneous provinces of the world, Deccan Volcanic Province (DVP). Most of the region above 16°N is covered by Deccan lava flows as a result most of the Archean and Mesozoic structures are covered by the lava flows. Since the entire area is blanketed by lava flows, the nature of the underlying pre-volcanic geology and tectonics remains speculative. As a first step to understand the evolution of WCMI, gravity and magnetic studies have been undertaken on the onshore DVP to look for structure below the lava flows there by throw light on the structure, density inhomogenities and evolution of the Deccan Volcanic Province of Maharashtra.
Some salient results are given in the following.
a) Updated the ground magnetic anomaly map of the Deccan Volcanic Province (DVP) including additional points to the tune of approximately seven hundred to the existing data base. Updated map is bounded by 16 to 20°N latitude and 73 to 78°N longitude.
b) To study the surface and subsurface density inhomogeneity beneath the DVP and build tectonic models based on gravity and magnetic data, gravity, magnetic and DGPS data were acquired along two approximately 200 km long EW profiles. Gravity and DGPS data were collected at a station spacing of 1km while magnetic data is collected at half a kilometer interval. In addition, more than forty secondary base stations have been established in Guhagar-Ratnagiri and Jath-Khanapur corridor which are tied to the absolute base at Koyna.
c) From analysis and interpretation of aeromagnetic and Bouguer gravity data over the seismically active Koyna region, the interface between the traps and the underlying Archean granitic-gneissic crust and an interface within the granitic-gneissic crust has been delineated that may possibly represent the top of intermediate metamorphic amphibolitic crust (?) or a reworked granitic-gneissic crust (?) as the Indian plate moved over the reunion plume.
d) From the structural mapping of Kutch Rift basin using aeromagnetic data, fourteen lineaments have been delineated, some of which does not have any surface expression. Comparison with earthquake data suggests that some of these lineaments might have reactivated many times in the past which can also account for the continued seismic activity in this region.
Spatial distribution maps of different trace elements.Figure 51
The current research evidently signifies that the soils from Mann River basin is contaminated with certain toxic trace metals. The potentially toxic metal pollutants can aggravate the groundwater aquifers due to leaching, which can have deleterious effect on the environment in general, and crops and human beings in particular. Subsequently, a dire need is felt to rectify and reduce at least the environmental pollution and pollutants arising out of human activity in the study region.
GEOPOTENTIAL STUDIESCoordinator : S.P. Anand
Members : M. Ravikumar, B.N. Shinde, Awdesh K. Prasad, K. Priyesh, P. Radhika
Geophysical Mapping of the Deccan Volcanic Province of Maharashtra
The formation of the Western Continental Margin of India (WCMI) occurred in two steps, producing a non-volcanic margin with normal melt generation in the south during the breakup of Madagascar from western India and a volcanic
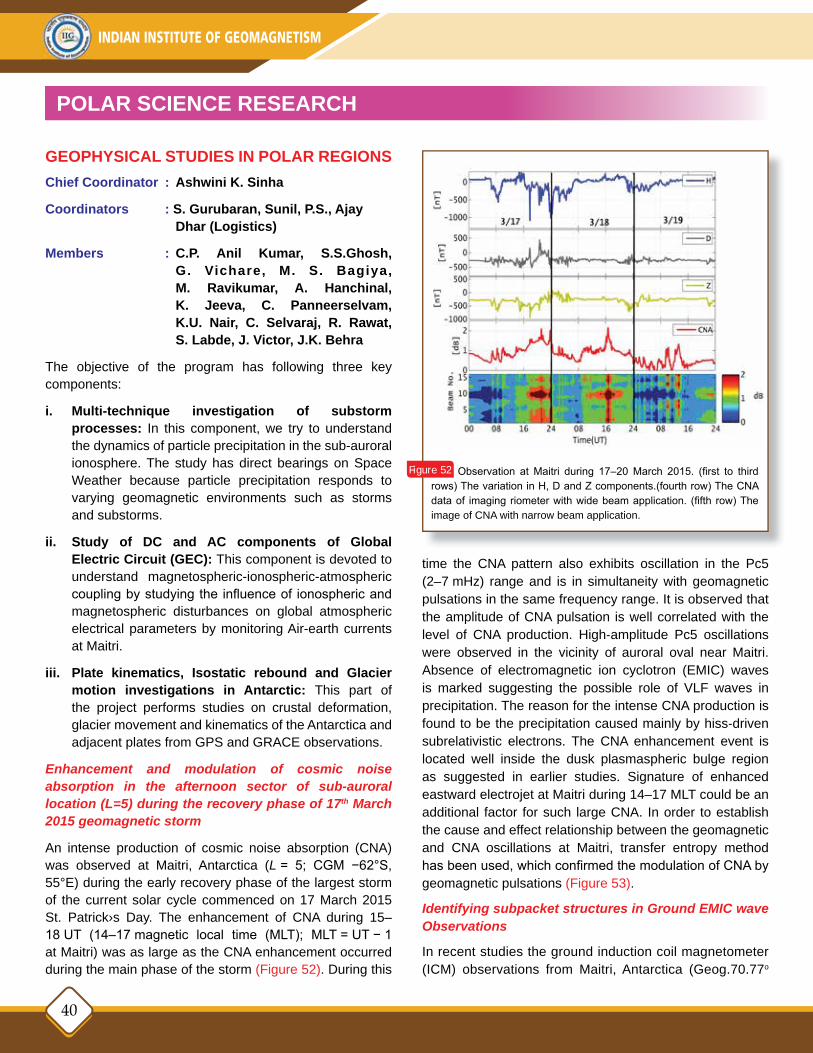
4140 41
ANNUAL REPORT 2017-2018INDIAN INSTITUTE OF GEOMAGNETISM
GEOPHYSICAL STUDIES IN POLAR REGIONSChief Coordinator : Ashwini K. Sinha
Coordinators : S. Gurubaran, Sunil, P.S., Ajay Dhar (Logistics)
Members : C.P. Anil Kumar, S.S.Ghosh, G. Vichare, M. S. Bagiya, M. Ravikumar, A. Hanchinal, K. Jeeva, C. Panneerselvam, K.U. Nair, C. Selvaraj, R. Rawat, S. Labde, J. Victor, J.K. Behra
The objective of the program has following three key components:
i. Multi-technique investigation of substorm processes: In this component, we try to understand the dynamics of particle precipitation in the sub-auroral ionosphere. The study has direct bearings on Space Weather because particle precipitation responds to varying geomagnetic environments such as storms and substorms.
ii. Study of DC and AC components of Global Electric Circuit (GEC): This component is devoted to understand magnetospheric-ionospheric-atmospheric coupling by studying the influence of ionospheric and magnetospheric disturbances on global atmospheric electrical parameters by monitoring Air-earth currents at Maitri.
iii. Plate kinematics, Isostatic rebound and Glacier motion investigations in Antarctic: This part of the project performs studies on crustal deformation, glacier movement and kinematics of the Antarctica and adjacent plates from GPS and GRACE observations.
Enhancement and modulation of cosmic noise absorption in the afternoon sector of sub-auroral location (L=5) during the recovery phase of 17th March 2015 geomagnetic storm
An intense production of cosmic noise absorption (CNA) was observed at Maitri, Antarctica (L = 5; CGM −62°S, 55°E) during the early recovery phase of the largest storm of the current solar cycle commenced on 17 March 2015 St. Patrick›s Day. The enhancement of CNA during 15–18 UT (14–17 magnetic local time (MLT); MLT = UT − 1 at Maitri) was as large as the CNA enhancement occurred during the main phase of the storm (Figure 52). During this
time the CNA pattern also exhibits oscillation in the Pc5 (2–7 mHz) range and is in simultaneity with geomagnetic pulsations in the same frequency range. It is observed that the amplitude of CNA pulsation is well correlated with the level of CNA production. High-amplitude Pc5 oscillations were observed in the vicinity of auroral oval near Maitri. Absence of electromagnetic ion cyclotron (EMIC) waves is marked suggesting the possible role of VLF waves in precipitation. The reason for the intense CNA production is found to be the precipitation caused mainly by hiss-driven subrelativistic electrons. The CNA enhancement event is located well inside the dusk plasmaspheric bulge region as suggested in earlier studies. Signature of enhanced eastward electrojet at Maitri during 14–17 MLT could be an additional factor for such large CNA. In order to establish the cause and effect relationship between the geomagnetic and CNA oscillations at Maitri, transfer entropy method has been used, which confirmed the modulation of CNA by geomagnetic pulsations (Figure 53).
Identifying subpacket structures in Ground EMIC wave Observations
In recent studies the ground induction coil magnetometer (ICM) observations from Maitri, Antarctica (Geog.70.77o
POLAR SCIENCE RESEARCH
Observation at Maitri during 17–20 March 2015. (first to third rows) The variation in H, D and Z components.(fourth row) The CNA data of imaging riometer with wide beam application. (fifth row) The image of CNA with narrow beam application.
Figure 52
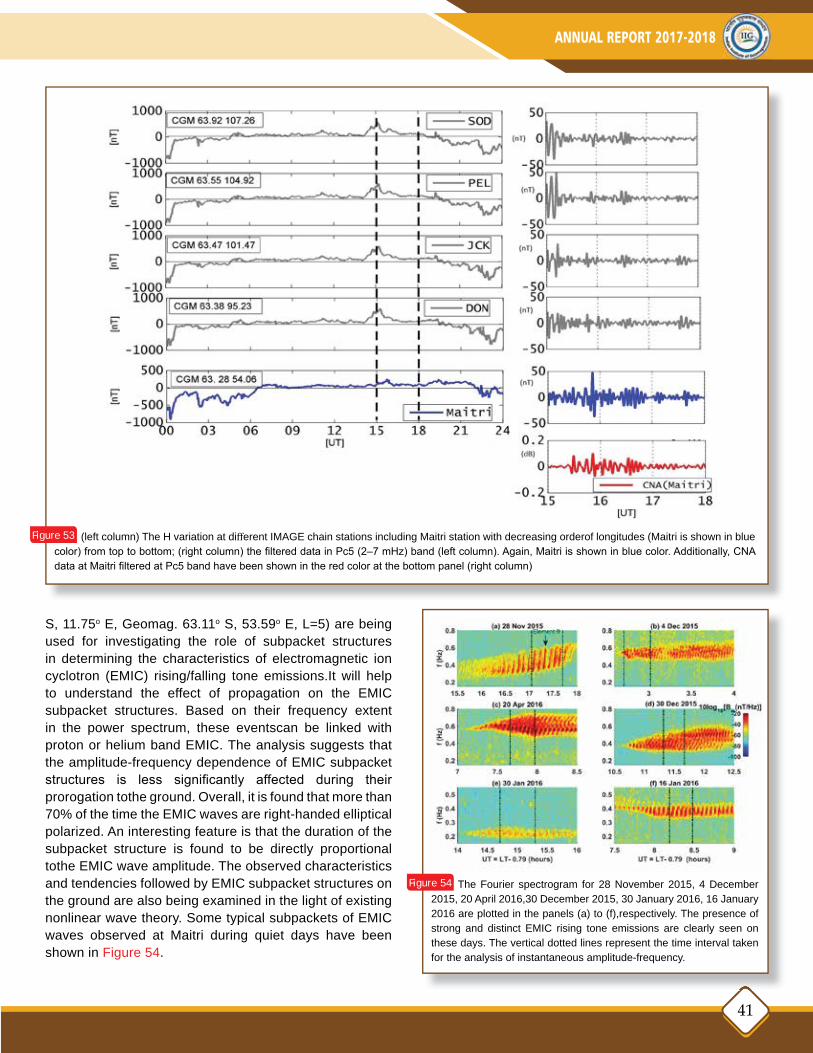
4140 41
ANNUAL REPORT 2017-2018INDIAN INSTITUTE OF GEOMAGNETISM
The Fourier spectrogram for 28 November 2015, 4 December 2015, 20 April 2016,30 December 2015, 30 January 2016, 16 January 2016 are plotted in the panels (a) to (f),respectively. The presence of strong and distinct EMIC rising tone emissions are clearly seen on these days. The vertical dotted lines represent the time interval taken for the analysis of instantaneous amplitude-frequency.
Figure 54
(left column) The H variation at different IMAGE chain stations including Maitri station with decreasing orderof longitudes (Maitri is shown in blue color) from top to bottom; (right column) the filtered data in Pc5 (2–7 mHz) band (left column). Again, Maitri is shown in blue color. Additionally, CNA data at Maitri filtered at Pc5 band have been shown in the red color at the bottom panel (right column)
Figure 53
S, 11.75o E, Geomag. 63.11o S, 53.59o E, L=5) are being used for investigating the role of subpacket structures in determining the characteristics of electromagnetic ion cyclotron (EMIC) rising/falling tone emissions.It will help to understand the effect of propagation on the EMIC subpacket structures. Based on their frequency extent in the power spectrum, these eventscan be linked with proton or helium band EMIC. The analysis suggests that the amplitude-frequency dependence of EMIC subpacket structures is less significantly affected during their prorogation tothe ground. Overall, it is found that more than 70% of the time the EMIC waves are right-handed elliptical polarized. An interesting feature is that the duration of the subpacket structure is found to be directly proportional tothe EMIC wave amplitude. The observed characteristics and tendencies followed by EMIC subpacket structures on the ground are also being examined in the light of existing nonlinear wave theory. Some typical subpackets of EMIC waves observed at Maitri during quiet days have been shown in Figure 54.

4342 43
ANNUAL REPORT 2017-2018INDIAN INSTITUTE OF GEOMAGNETISM
1. Night airglow observation was carried out at Panhala Hill station, Kolhapur. As a special campaign with the exiting All-Sky-Imager (ASI) instrument at Kolhapur, it was used at Panhala for the observations of the mesosphere and lower thermosphere during 11-22 December, 2017, 11-22 January, 2018 and 12-23 February, 2018. The imager system consists of an all-sky imager with fish-eye (180˚FOV) telecentric lens system, a computer controlled optical filter wheel, and a CCD camera head fitted with a 1024×1024 pixel resolution. An optical filter is a device that allows transmission of certain bandwidths of light coming from different altitudes through it and rejecting the rest. Images of wave structure to be obtained with integration times of typically 25 s for the near-infrared OH emission (720–930 nm passband) and 120 s for the OI (630 nm & 558 nm) line emission. OI 630nm filter is used to study plasma depletion where as OI 558nm and OH band filters are used to observe gravity waves phenomenon between (87 to 97 ± 5) km altitudes. (Figure 55)
2. In order to prepare a crustal magnetic anomaly map of the Deccan Volcanic Province of Maharashtra, ground
magnetic data was acquired in the region bounded by 19°-20°N and 76° - 77°E covering areas of Parbhani, Jalna, Lonar etc. during December 2017-January 2018.
3. Archaeological artifacts were collected from Aurangabad historical sites & sediments from Sangamner, Maharashtra from May 18-28, 2017.
4. Acquired 66 water samples from Malwan-Aachra-Kankavli-Kharepatan-Vijaydurg in Sindhudurg district, Maharashtra in order to assess the groundwater quality during post-monsoon. This survey was conducted in November, 2017.
5. Fifteen additional vertical electrical sounding data were acquired in Malwan-Aachra-Kankavli-Kharepatan-Vijaydurg in Sindhudurg district, Maharashtra in order to identify the extent of saline water ingress and to delineate zones of potential freshwater aquifers. This survey was conducted in November, 2017.
6. Long period magnetotelluric survey was carried out along 4 different profiles in Andaman Islands during April-May 2017 to decipher the underlying crustal configuration (Figure 56).
FIELD SURVEYS
Images showing the occurrence of equatorial plasma bubble (EPB) and their movement from the west to the east direction on 22-23 March 2017 at Panhala. Movement of structures can be appearing in images (highlighted with white arrows).
Figure 55

4342 43
ANNUAL REPORT 2017-2018INDIAN INSTITUTE OF GEOMAGNETISM
7. Servicing of Broadband seismic station and to retrieve the seismic data from the survey sites located at Bongaigaon, Namsai, Diphu, Nakachari, Silchar, Shillong, Aizawl and Agartala every 3 months during 2017-18.
8. Survey was conducted for identification of proper sites for magnetotelluric monitoring stations for the proposed Stationary Magnetotelluric network and also for the campaign mode BBMT (broad band magnetotelluric experiments in the region covering Shillong plateau, Mikir hills and of Brahmaputra Basin.
Also following places were surveyed for SMT network sites at Diphu, Namsai, Agartala and Aizawl. The period of survey was in June, September and November 2017.
9. Surveys were undertaken for the installation of All Sky Imager in NE Indian sector covering the areas of Silchar and Namsai during the periods 5-12 November 2017, 10-21 December 2017 and 10-19 March 2018.
10. Reoccupation and data acquisition of 16 GPS stations in geodetic campaign mode was acquired in NE India in order to study the present day crustal deformation pattern of NE Indian region. This survey was carried out during January 23-February 28, 2018.
11. Regular maintenance of Global Navigation Satellite System (GNSS) Receivers and installation of Atmospheric Electric Field Mill (AEFM) was carried out in NE India (Silchar, Kokrajhar, Namsai, Diphu and Shillong) during November 4-17, 2017, February 1-13, 2018 and February 13- March 18, 2018.
Installation of LMT unit at Ramnagar-I, Diglipur, North Andaman Islands.
Figure 56
PUBLICATIONS
PAPERS PUBLISHED DURING THE YEAR 2017-20181. Aggarwal, M. and D.K. Sharma
Seasonal characteristics of COSMIC measurements over Indian sub-continent during different phases of solar activity. Adv. Space Res., 59, 2279–2294, doi: 10.1016/j.asr.2017.02.018, 2017.
2. Aggarwal, M., A. Bardhan and D.K. Sharma
Equinoctial asymmetry in ionosphere over Indian region during 2006–2013 using COSMIC measurements, Adv. Space Res., 60, 999–1014, doi: 10.1016/j.asr.2017.05.020, 2017.
3. Anil Kumar, C.P., N. Balan, C. Panneerselvam, N.J. Victor, C. Selvaraj, K.U. Nair, P. Elango, K. Jeeva, J.C. Akhila and S. Gurubaran
Investigation of the influence of Galactic cosmic rays on clouds and climate in Antarctica, Proc. Indian National Academy of Science, DOI: 10.16943/ptinsa/2017/49028, 2017.
4. Bagiya, M.S., A.S. Sunil, D. Chakrabarty and S. Sunda
Salient features of the dayside low latitude ionospheric response to the main phase step-I of the 17 March 2015 geomagnetic storm. Adv.Space Res., doi:10.1016/j.asr.2017.06.010, 2017.
5. Bagiya, M.S., G. Vichare, Ashwini K. Sinha and S. Sripathi
On the nocturnal downward and westward equatorial ionospheric plasma drifts during the 17 March 2015 geomagnetic storm. J. Geophys. Res. (Space Physics), https://doi.org/10.1002/2017JA024703, 2018.
6. Bagiya, M.S., A.S. Sunil, P.S. Sunil, K. M. Sreejith, L. Rolland and D.S. Ramesh
Efficiency of co-seismic ionospheric perturbations in identifying crustal deformation pattern: case study based on Mw 7.3 May Nepal 2015 earthquake. J. Geophys. Res. (Space Physics), doi:10.1002/2017JA024050, 2017.

4544 45
ANNUAL REPORT 2017-2018INDIAN INSTITUTE OF GEOMAGNETISM
7. Bagiya, M.S., E. A. Kherani, P.S. Sunil, A.S. Sunil, S. Sunda, and D.S. Ramesh
Origin of the ahead of tsunami traveling ionospheric disturbances during Sumatra tsunami and offshore forecasting. J. Geophys. Res. (Space Physics), doi:10.1002/2017JA023971, 2017.
8. Bagiya, M.S., P.S. Sunil, A.S. Sunil and D.S. Ramesh
Coseismic contortion and coupled nocturnal ionospheric perturbations during 2016 Kaikoura, Mw 7.8 New Zealand earthquake. J. Geophys. Res. (Space Physics), 123, https://doi.org/10.1002/2017JA024584, 2018.
9. Balan, N., S. Tulasi Ram, Y. Kamide, I.S. Batista, K. Shiokawa, P.K. Rajesh, N.J. Victor and J. Souja
Automatic selection of Dst storms and their seasonal variations in two versions of Dst in 50 years. Earth Planets Space, 69(59), doi:10.1186/s40623-017-0642-2, 2017.
10. Basavaiah, N., K.V.V. Satyanarayana, K. Deenadayalan and J.N. Prasad
Does Deccan Volcanic Sequence contain more reversals than the three-Chron N-R-N flow magnetostratigraphy?- A paleomagnetic evidence from the dyke-swarm near Mumbai. Geophys. J. Int., doi: 10.1093/gji/ggy041, 2018.
11. Behera, J.K., Ashwini K. Sinha, G. Vichare, A. Bhaskar, Farideh Honary, R. Rawat and R. Singh
Enhancement and modulation of cosmic noise absorption in the afternoon sector at subauroral location (L= 5) during the recovery phase of 17 March 2015 geomagnetic storm. J. Geophys. Res. (Space Physics), 122 (9), 9528-9544, 2017.
12. Bhardwaj, S.K. and P.B.V. Subba Rao
Afternoon Counter-Electrojet current system along 75º East meridian during IEEY. Earth Planets Space, 69(91), DOI 10.1186/s40623-017-0675-6, 2017.
13. Bohra, A., B. Singh Kotlia and N. Basavaiah
Palaeoclimatic reconstruction by using the varvite sediments of Bharatpur, Upper Lahaul Valley, NW Himalaya, India. Quat. International, 443, Part-B, 39-48, doi: 10.1016/j.quaint.2017.04.028, 2017.
14. Carter, B.A., S. Tulasi Ram, E. Yizengaw, R. Pradipta, J. Retterer, R. Norman, J. Currie, K. Groves, R. Caton, M. Terkildsen, T. Yokoyama and K. Zhang
Unseasonal development of post-sunset F-region irregularities over Southeast Asia on 28 July 2014: 1. Forcing from above? Progress Earth Planetary Science, 5:10, doi: 10.1186/s40645-018-0164-y, 2018.
15. Chandra, S.
Digital Preservation Services for Institutional Repositories (IR) in India. Knowledge Librarian, Spl. Issue, 306-311, 2018.
16. Deshmukh, K.K., S.P. Aher, P.B. Gawali and P.P. Deshmukh
Groundwater quality in Deccan upland region of Chandanapuri Valley, Sangamner, Maharashtra, India, Sustainable Water Resource Management, doi: 10.1007/s40899-017-0154-z, 2017.
17. Devi, R., S. Saini, A. Dhar and A.K. Gwal
Saw tooth variation of horizontal component with solar wind conditions at high-latitude. Imperial J. Interdisciplinary Research, 3(3), 3923, 792-802, 2017.
18. Devi, R., S. Saini, A. Dhar and A.K. Gwal
Variability of the horizontal geomagnetic field at high-latitude during sunspot maximum. Imperial J. Interdisciplinary Research, 3(3), 3924, 803-816, 2017.
19. Gawali, P.B., S.P. Aher, B.V. Lakshmi, R.D. Gaikwad, K. Deenadayalan, P.T. Hanamgond, J.L.V. Mahesh Babu and S.A. Arote
Identification of Landslide Susceptible villages (LSVs) around the Kalsubai region of Maharashtra, India using remote sensing and Geographical Information System. J. Geol.Soc. India, 90, 301-311, 2017.
20. Gawali, P.B.
New continent on the block: Zealandia no, it’s Mauritia. Science Reporter, 54 (6), 42-44, 2017.
21. Gawali, P.B.
Breaking Antarctica Icebergs: What Does It Mean For India? Science Reporter, 54(9), 30-32, 2017.
22. Gokani, S.A., R. Singh, S. Tulasi Ram, K. Venkatesham, B. Veenadhari, Sandeep Kumar and R. Selvakumaran
Rare observation of daytime whistlers at very low latitude (L = 1.08). Adv. Space Res., doi:10.1016/j.asr.2017.07.035, 2017.
23. Joshi, L.M., S. Sripathi, M. Ravi Kumar and E. A, Kherani
Simulating the dependence of seismo-ionospheric coupling on the magnetic field inclination. Ann. Geophys., 36, 1–11, 2018, doi:10.5194/angeo-36-1-2018.
24. Kakad, Amar, B. Kakad, and Y. Omura
Formation and interaction of multiple coherent phase space structures in plasma. Phys. Plasmas, 24, 060704, 2017.

4544 45
ANNUAL REPORT 2017-2018INDIAN INSTITUTE OF GEOMAGNETISM
25. Kakad, B., A.P. Kakad and D.S. Ramesh
Shannon Entropy-based prediction of Solar Cycle 25. Solar Physics, 292(7), 95, 2017.
26. Kakad, B., A.P. Kakad and D.S. Ramesh
What would be length of upcoming solar cycles? Solar Physics, 292(12), 181, 2017.
27. Kakad, B., G. Surve, P. Tiwari, V. Yadav and A. Bhattacharyya
Extent of disturbance dynamo effects over low latitude F-region: A study by network of VHF spaced receivers. J. Geophys Res. (Space Physics), 122, 5670-5686, 2017.
28. Kakad, B., A.P. Kakad and Y. Omura
Particle trapping and ponderomotive processes during breaking of ion acoustic waves in plasmas. Phys. Plasmas, 24, 102122, 2017.
29. Kar, R., A. Mazumder, K. Mishra, S.K. Patil, R. Ravindra, P. Pam, P. Govil, R. Bajpai and K. Singh
Climatic history of Ny-Alesund region, Svalbard, over the last 19,000 yr: insights from quartz grain microtexture and magnetic susceptibility. Polar Science, doi.org/10.1016/j.polar.2018.04.004, 2018.
30. Kanu, M.O., N. Basavaiah, O.C. Meludu, A.S. Oniku
Investigating the potential of using environmental magnetism techniques as pollution proxy in urban road deposited sediment. Int. J. Environ. Sci. Tech., doi: 10.1007/s13762-017-1356-5, 2017.
31. Kattamanchi, S., R.K. Tiwari and D.S. Ramesh
Non-stationary ETAS to model earthquake occurrences affected by episodic aseismic transients. Earth Planets Space, 69:157, doi: 10.1186/s40623-017-0741-0, 2017.
32. Kumar, R., A.R. Bansal, Anand, S.P., V.K. Rao and U.K. Singh
Mapping of magnetic basement in Central India from aeromagnetic data for scaling geology. Geophys. Prospect., doi:10.1111/1365-2478.1254, 2017
33. Lakhina, G.S. and B.T. Tsurutani
Satellite drag effects due to uplifted oxygen neutrals during super magnetic storms. Nonlin. Processes Geophys., 24, 745–750, doi:10.5194/npg-24-745-2017, 2017.
34. Laxminarayana, M., R.R. Mathur and S.P. Anand
Geophysical attributes to evaluate subsurface structural features using ground magnetic data in parts of Karimnagar district, Telangana. J. Ind. Geophys. Union, 21(6), 457-464, 2017.
35. Lotekar, A., A.P. Kakad and B. Kakad
Generation of ion acoustic solitary waves through wave breaking in superthermal plasmas. Phys. Plasmas, 24, 102127, 2017.
36. Mahavarkar, P., S. Singh, S. Labde, V. Dongre and A. Patil
The low cost Proton Precession Magnetometer developed at the Indian Institute of Geomagnetism. J. Instrumentation, 12, doi: 10.1088/1748-0221/12/05/T05002, 2017.
37. Maiti, S., A. Das, R. Shah and G. Gupta
Application of automatic relevance determination model for groundwater quality index prediction by combining hydrogeochemical and geo-electrical data. Model. Earth Syst. Environ., DOI 10.1007/s40808-017-0369-x, 2017.
38. Mishra, P.K., S. Prasad, N. Marwan, A. Anoop, R. Krishnan, B. Gaye, N. Basavaiah, M. Stebich, P. Menzel and N. Riedel
Contrasting pattern of hydrological changes during the past two millennia from central and northern India: Regional climate difference or anthropogenic impact? Global Planetary Change, 161, 97–107, doi: 10.1016/j.gloplacha.2017.12.005, 2018.
39. Nagarjuna, D., C.K. Rao and Amit Kumar
Geoelectric structure of Northern Cambay rift basin from magnetotelluric data. Earth Planets Space, 69:140, DOI 10.1186/s40623-017-0725-0, 2017.
40. Narayanan, V. L., S. Gurubaran, M. B. Berlin Shiny, K. Emperumal and P. T. Patil
Some new insights of the characteristics of equatorial plasma bubbles obtained from Indian region. J. Atmos. Sol.-Terres. Phys., 156, 80-86, 2017.
41. Niyogi, A., J.K. Patil, S.K. Patil, D. Panda and M. Chakarvorty
Magnetic measurements and geochemical character-ization of the road-deposited sediments (RDS), Allahabad city, India: impact of climatic perturbations on sediment composition and provenance tracing. J. Soils Sediments, doi.org/10.1007/s1136, 2018.
42. Okoh, D., S. Onwuneme, G.K. Seemala, S. Jin, B. Rabiu, B. Nava and J. Uwamahoro
Assessment of the NeQuick-2 and IRI-Plas 2017 models using global and long-term GNSS measurements. J. Atmos. Solar-Terres. Phys., 170, doi: 10.1016/j.jastp.2018.02.006, 2018.

4746 47
ANNUAL REPORT 2017-2018INDIAN INSTITUTE OF GEOMAGNETISM
43. Pivarunas, A., J.G. Meert, M.K. Pandit and Anup K. Sinha
Paleomagnetism and geochronology of mafic dykes from the Southern Granulite Terrane, India: Expanding the Dharwar craton southward. Tectonophysics, DOI.10.1016/j.tecto.2018.01.024, 2018.
44. Priyesh, K., S.P. Anand, C. Haritha and P. Rama Rao
Moho depth variatios over the Maldive Ridge and adjoining Arabian and Central Indian basins, Western Indian Ocean, from three dimensional inversion of Gravity anomalies. J. Asian Earth Sci., 156, 316-330, 2018.
45. Radhakrishna, T., G.S. Soumya and K.V.V Satyanarayana
Palaeomagnetism of the Cretaceous Lamproites from Gondwana basin of the Damodar Valley in India and migration of the Kerguelen plume in the Southeast Indian Ocean. J. Geodynamics, 109, doi: 10.1016/j.jog.2017.05.001, 2017.
46. Radhika, P.R., S.P. Anand and M. Rajaram
Structural Mapping of Kutch Rift basin from Aeromagnetic data, J. Geophysics, XXXVIII(3), 187-197, 2017.
47. Raghav, A., Z. Shaikh, A. Bhaskar, G. Datar and G. Vichare
Forbush Decrease: A new perspective with classification. Solar Physics, 292(8), 99, 2017.
48. Ranhotra, P.S., J.Sharma, Amalava Bhattacharyya, N. Basavaiah and Koushik Dutta
Late Pleistocene - Holocene vegetation and climate from the palaeolake sediments, Rukti valley, Kinnaur, Himachal Himalaya. Quart. International, doi: 10.1016/j.quaint.2017.08.025, 2017.
49. Reddy, C.D. and M.N. Shrivastava
An appraisal of the plate tectonic forces: Role of Gravitational Potential Energy (GPE) in the deformation of Indo-Eurasia collision zone. J. Ind. Geophys. Union, 21, 474-481, 2017.
50. Remya, B., R.V. Reddy, B.T. Tsurutani and G.S. Lakhina
Comment on “Effects of electron temperature anisotropy on proton mirror instability evolution” by Ahmadi et al. (2016). J. Geophys. Res. (Space Physics), 122, 745–747, doi:10.1002/2016JA023148, 2017.
51. Rubia, R., S.V. Singh and G.S. Lakhina
Occurrence of electrostatic solitary waves in the lunar wake. J. Geophys. Res. (Space Physics), 122, doi:10.1002/2017JA023972, 2017.
52. Rubia, R., S.V. Singh and G. S. Lakhina
Existence domain of electrostatic solitary waves in the Lunar wake. Phys. Plasmas, 25, 032302, doi:10.1063/1.5017638, 2018.
53. Ruiz-Barajas, S., N. Sharma, V. Convertito, A. Zollo and B. Benito
Temporal evolution of a seismic sequence induced by a gas injection in the Eastern coast of Spain. Scientific Reports – Nature (SREP), doi:10.1038 /s41598-017-02773-2, 2017.
54. Ryberg, T., W.H. Geissler, W. Jokat and S. Pandey
Uppermost mantle and crustal structure at Tristan da Cunha derived from ambient seismic noise. Earth Planet. Sci. Letts., 471, 117-124, 2017.
55. Sai Gowtam, V. and S. Tulasi Ram
Ionospheric annual anomaly – new insights to the physical mechanisms. J. Geophys. Res. (Space Physics), 122, doi: 10.1002/2017JA024170, 2017.
56. Sai Gowtam, V. and S. Tulasi Ram
An Artificial Neural Network based Ionospheric Model to predict NmF2 and hmF2 using long-term data set of FORMOSAT-3/COSMIC radio occultation observations: Preliminary results. J. Geophys. Res. (Space Physics), 122, https://doi.org/10.1002/2017JA024795, 2017.
57. Sangode, S.J., R. Sharma, R. Mahajan, N. Basavaiah, P. Srivastava, S.S. Gudadhe, D.C. Meshram, M. Venkateshwarulu
Anisotropy of Magnetic Susceptibility and Rock Magnetic Applications in the Deccan Volcanic Province based on some Case Studies. J. Geol. Soc. India, 89(6), 617-642, 2017.
58. Sathishkumar, S., S. Sridharan, P.V. Muhammed Kutty and S. Gurubaran
Long term variabilities and tendencies of mesospheric lunar semidiurnal tide over Tirunelveli (8.7°N, 77.8°E). J. Atmos. Solar-Terres. Phys., 163, 46-53, doi: 10.1016/j.jastp.2017.05.015, 2017.
59. Sau, S., V.L. Narayanan, S. Gurubaran, R.N. Ghodpage and P.T. Patil
First Oobservation of Inter-Hemispheric Asymmetry in the Equatorial Plasma Bubbles (EPBs) during the St. Patrick’s Day Geomagnetic Storm of 2015. J. Geophys. Res. (Space Physics), DOI 10.1002/2017JA024213, 2017.

4746 47
ANNUAL REPORT 2017-2018INDIAN INSTITUTE OF GEOMAGNETISM
60. Shailaja, G. and G. Gupta
Risk assessment of trace elements distribution in soils of basaltic aquifers, southern Maharashtra, India. Int. Res. J. Earth Sci., 5(8), 22-31, 2017.
61. Shailaja, G., G. Gupta, S.T. Padmane and S.N. Patil
Morphometric analysis of trap covered Suki River Basin, Maharashtra for water resource management using geo-spatial tools. Asian Jour. Appl. Sci. Tech., 1(9), 347-360, 2017.
62. Shailaja, G., G. Gupta and P. Rama Rao
Spatial mapping of aquifer parameters from surficial electrical methods over basaltic aquifers of Maharashtra. J. Ind. Geophys. Union, 22(1), 40-48, 2018.
63. Sharma, A.K. G. Chavan, O.B. Gurav, H.P. Gaikwad, R.N. Ghodpage and D.P. Nade
Dynamics of ionospheric irregularities in increasing phase of 24th solar cycle at Kolhapur [16.4oN, 74.2oE]. Adv. Space Res., https://doi.org/10.1016/j.asr.2017.08.002, 2017.
64. Sharma, A.K., O.B. Gurav, G.A. Chavan, H.P. Gaikwad, R.N. Ghodpage and P.T. Patil
Variation in occurrence of equatorial plasma bubbles (EPBs) using All Sky Imager from low latitude station Kolhapur (16.8 N, 74.2 E,10.6 dip. Lat.). Adv. Space Res., 60, 2452-2463, https://doi.org/10.1016/j.asr.2017.09.014, 2017.
65. Sharma, A.K., G.A. Chavan, H.P. Gaikwad, O.B. Gurav, D.P. Nade, S.S. Nikte, R.N. Ghodpage and P.T. Patil
Study of ionospheric irregularities from Kolhapur (16.4°N, 74.2°E). J. Atmos. Sol.-Terres. Phys., 121,196–205, DOI: 10.1016/j.jastp.2017.12.019, 2017.
66. Sharma, A.K., O.B. Gurav, H.P. Gaikwad, G.A. Chavan, D.P. Nade, S.S. Nikte, R.N. Ghodpage and P.T. Patil
Study of equatorial plasma bubbles using all sky imager and scintillation technique from Kolhapur station: a case study. Astrophys. Space Sci., 363:83, https://doi.org/10.1007/s10509-018-3303-4, 2018.
67. Sharma, D.K., M. Aggarwal and A. Bardhan
Variability of ionospheric parameters during solar minimum and maximum activity and assessment of IRI model. Adv. Space Res., 60, 435–443, doi: 10.1016/j.asr.2016.11.027, 2017.
68. Siingh, D., T. Dharmaraj, P.R. Kumar, R. Singh, S. Kumar, G.R. Chinthalu, M.N. Patil and R.P. Singh
Variability of lightning, convective rain and solar activity study over South/Southeast Asia during ENSO episode
for the period of 1998-2010. J. Ind. Geophys. Union, 21(5), 401-414, 2017.
69. Singh, R., A.K. Maurya, O. Chanrion, T. Neubert, S.A. Cummer, J. Mlynarczyk, S. Kumar, M.B. Cohen and D. Siingh
First observations of Gigantic Jets from Monsoon Thunderstorms over India. Scientific Reports - Nature Publications, doi:10.1038/s41598-017-16696-5, 2017.
70. Singh, D., S. Gurubaran and M. He
Evidence for the influence of DE3 tide on the occurrence of equatorial counterelectrojet, Geophysical Research Letters, 45, 2145-2150, 2018.
71. Singh, Ram and S. Sripathi
Ionospheric response to 22–23 June 2015 storm as investigated using ground-based ionosondes and GPS receivers over India. J. Geophys. Res. (Space Physics), 122, 11645–11664, doi:10.1002/2017JA024460, 2017.
72. Sinha, Ashwini K., A. Dhar, Anand K. Singh, J.K. Behera and S. Gurubaran
India’s contribution to Geomagnetism and allied studies in Antarctica – A review. Proc. Indian Natn. Sci. Acad., 83(2), 299-326, DOI: 10.16943/ptinsa/2017/48955.
73. Sreekumar, S. and S. Sripathi
On the role of ionogram signatures of LSWS (satellite traces) and low latitude Esb layers in causing the variabilities of ESF irregularities over Indian sector. Adv. Space Res., doi:10.1016/j.asr.2018.04.011, 62, 94–110, 2018.
74. Sreekumar, S. and S. Sripathi
A seasonal study on the role of h’F/meridional winds in influencing the development of ESF irregularities over Indian sector. Adv. Space Res., 60(3), 652-666, doi: 10.1016/j.asr.2017.04.009, 2017.
75. Srinivasu, V.K.D., P.S. Brahmanandam, G. Uma, D.S.V.V.D. Prasad, P.V.S. Rama Rao and S. Mukherjee
Long-term morphological and power spectral studies of VHF amplitude. Terres. Atmos. Oceanic Sci., 28(3), 385-394, doi: 10.3319/TAO.2016.11.08.01, 2017.
76. Srinivasu, V.K.D., N. Dashora, D.S.V.V.D. Prasad, K. Niranjan and G.K. Seemala
On the occurrence and strength of multi-frequency multi-GNSS Ionospheric Scintillations in Indian sector during declining phase of solar cycle 24. Adv. Space Res., doi: 10.1016/j.asr.2017.08.036, 2017.

4948 49
ANNUAL REPORT 2017-2018INDIAN INSTITUTE OF GEOMAGNETISM
77. Sripathi, S., S. Banola, K. Emperumal, B. Suneel Kumar and Sandro M. Radicella
The role of storm time electrodynamics in suppressing the equatorial plasma bubble development in the recovery phase of a geomagnetic storm. J. Geophys. Res. (Space Physics), 123, doi:10.1002/2017JA024956, 2018.
78. Steffy, S.V. and S.S. Ghosh
Existence domain of the compressive ion acoustic super solitary wave in a two electron temperature warm multi-ion plasma. Phys. Plasmas, 24, 102111, doi: 10.1063/1.4993511, 2017.
79. Steffy, S.V. and S.S. Ghosh
Compressive ion acoustic double layer and its transitional properties for a two electron temperature warm, multi-ion plasma. Phys. Plasmas, 25, 012307, doi: 10.1063/1.5006972, 2018.
80. Sunda, S., S.Yadav, R. Sridharan, M.S. Bagiya, P.V. Khekale, P. Singh and S.V. Satish
SBAS-derived TEC maps: a new tool to forecast the spatial maps of maximum probable scintillation index over India. GPS Solut., 21(4), 1469-1478, 2017.
81. Suneetha, N., G. Gupta and M. Laxminarayana
Evaluation of geoelectric parameters to delineate the subsurface fractures for groundwater exploration around coastal Maharashtra. Jour. Coastal Sci., 4(2), 9-16, 2017.
82. Suneetha, N. and G. Gupta
Spatial variation of aquifer parameters from coastal aquifers of Sindhudurg district, Maharashtra, using pore water resistivity and bulk resistivity. Hydrospatial Analysis, 1(1), 28-40, 2018.
83. Suneetha, N., G. Gupta, P. Das, S. Maiti, G. Shailaja, A. Das and M. Laxminarayana
Evaluation of groundwater quality in coastal aquifer system of Sindhudurg district, Maharashtra. Ind. J. Geosci., 71(3), 481-500.
84. Surkov, V.V., V.A. Pilipenko and Ashwini K. Sinha
Possible mechanisms of co-seismic electromagnetic effect. Acta Geod. Geophys., 53(1), 157-170, 2018.
85. Tsurutani, B.T., G.S. Lakhina, E. Echer , R. Hajra, C. Nayak, A.J. Mannucci and X. Meng
Comment on “Modeling Extreme “Carrington-Type” Space Weather Events Using Three-Dimensional Global MHD Simulations” by C. M. Ngwira, A. Pulkkinen, M. M. Kuznetsova, and A. Glocer”. J. Geophys. Res. (Space Physics), 123, doi: 10.1002/2017JA024779, 2018.
86. Tulasi Ram, S., K.K. Ajith, T. Yokoyama, M. Yamamoto and K. Niranjan
Vertical rise velocity of equatorial plasma bubbles estimated from Equatorial Atmosphere Radar (EAR) observations and HIRB model simulations. J. Geophys. Res. (Space Physics), 122, doi:10.1002/2017JA024260, 2017.
87. Tulasi Ram, S., P.S. Sunil, M. Ravi Kumar, S.-Y. Su, L. C. Tsai and C. H. Liu
Coseismic travelling ionospheric disturbances during the Mw 7.8 Gorkha, Nepal, Earthquake on 25 April 2015 from ground and space borne observations. J. Geophys. Res. (Space Physics), 122, 10669-10685,doi:10.1002/2017JA023860, 2017.
88. Venkatesh, K., S. Tulasi Ram, P.R. Fagundes, G.K. Seemala and I.S. Batista
Electrodynamic disturbances in the Brazilian equatorial and low-latitude ionosphere on St. Patrick’s Day storm of 17 March 2015. J. Geophys. Res. (Space Physics), 122, doi:10.1002/2017JA024009, 2017.
89. Vichare, G., A. Bhaskar, G. Datar, A. Raghav, K.U. Nair, C. Selvaraj, M. Ananthi, Ashwini K. Sinha, M. Paranjape, T. Gawade, C.P. Anil Kumar, C. Pannerselvam, S. Sathish Kumar and S. Gurubaran
Equatorial secondary cosmic ray observatory to study space weather and terrestrial events. Adv. Space Res., 61(10), 2555-2568, 2018.
90. Victor, J.N., A.V. Frank-Kamenetsky, S. Manu and C. Panneerselvam
Variation of atmospheric electric field measured at Vostok, Antarctica, during St. Patrick’s Day storms on 24th solar cycle. J. Geophys. Res. (Space Physics), 122, doi: 10.1002/2017JA024022, 2017.
91. Vijaya Kumar, P.V., P.B.V. Subba Rao, C.K. Rao, A.K. Singh and P. Rama Rao
Frequency characteristics of geomagnetic induction anomalies in Saurashtra region. J. Earth Syst. Sci., 126:101, 2017: DOI 10.1007/s12040-017-0872-5.
92. Yadav, V., B. Kakad, A. Bhattacharyya and T.K. Pant
Quiet and disturbed time characteristics of blanketing Es during solar cycle 23. J. Geophys. Res. (Space Physics), 122(11), 11591-11606.
93. Yadav, T.K. Pant, R.K. Choudhary, C. Vineeth, S. Sunda, K.K. Kumar, P.R. Shreedevi and S. Mukherjee
Impact of Sudden Stratospheric Warming of 2009 on the Equatorial and Low-Latitude Ionosphere of the

4948 49
ANNUAL REPORT 2017-2018INDIAN INSTITUTE OF GEOMAGNETISM
Indian Longitudes: A Case Study. J. Geophys. Res. (Space Physics), 122, doi: 10.1002/2017JA024392
94. Yadav, V.K., N. Srivastava, S.S. Ghosh, P.T. Srikar and K. Subhalakshmi.
Science objectives of the magnetic field experiment onboard Aditya-L1 spacecraft. Adv. Space Res., 61(2), 749-758, doi: 10.1016/j.asr.2017.11.008, 2018.
95. Yagova, N.V., V.V. Yagov, Ashwini K. Sinha, M. Hayakawa, E.N. Fedorov and G. Vichare
Flow instabilities in two-phase or supercritical crust fluids and its possible relevance to seismoelectromagnetic disturbances. Nat. Hazards, doi: 10.1007/s11069-018-3203-5, 2018.
96. Zubair, S., A. Raghav and A. Bhaskar
The presence of turbulent and ordered local structure within the ICME shock-sheath and its contribution to Forbush Ddecrease. The Astrophys. J., 844:121, doi: 10.3847/1538-4357/aa729f, 2017.
CHAPTERS IN BOOKS/BOOKS EDITED1. Meert, J.G., M.K. Pandit, A. Pivarunas, K. Katusin and
Anup K. Sinha
India and Antarctica in the Precambrian: a brief analysis. Geol. Soc. London, Special Publications, 457, https://doi.org/10.1144/SP457.13, In: Crustal Evolution of India and Antarctica: The Supercontinent Connection (Eds. N. C. Pant and Somnath Dasgupta), 2017.
2. Lakhina, G.S. and S.V. Singh
Solitary waves in plasmas described by Kappa distributions. In: Kappa distributions: Theory and applications in Plasmas. Ed. George Livadiotis, Elsevier, Amsterdam, Netherlands, pp. 399–418, doi:10.1016/B978-0-12-804638-8.00009-7, 2017.
3. Lakhina, G.S. and B.T. Tsurutani
Supergeomagnetic Storms: Past, Present and Future, In: Extreme Events in Geospace: Origins, Predictability and Consequences. Ed. Natalia Buzulukova, Elsevier, Amsterdam, Netherlands, Chapter 7, 2017.
IMPACT FACTOR OF PUBLICATIONS DURING 2017-2018Journal Name Impact
FactorNo. of Papers
Acta Geod. Geophys. 0.738 01Advances Space Research 1.401 12Ann. Geophys. 1.61 01Asian Jour. Appl. Sci. Tech. --- 01Astrophys. Space Sci. 1.622 01Earth Planets Space 2.243 04Earth Planet. Sci. Lett. 4.581 01Geophys. J. Int. 2.528 01Geophys. Prospect. 1.846 01Geophys. Res. Lett. 4.253 01Global Planetary Change 3.982 01GPS Solut. 4.061 01Hydrospatial Analysis --- 01Imperial J. Interdisciplinary Research
3.75 02
Ind. J. Geosciences 0.16 01Int. J. Environ. Sci. Tech. 1.915 01Int. Res. J. Earth Sci. --- 01J. Atmos. Solar-Terr. Phys. 1.326 04J. Asian Earth Sci. 2.335 01J. Coastal Sci. --- 01J. Earth Syst. Sci. 0.955 01J. Geodynamics 2.142 01
Journal Name Impact Factor
No. of Papers
J. Geophysics --- 01J. Geophys. Res. (Space Physics) 3.42 20J. Geol. Soc. India 0.479 02J. Ind. Geophys. Union --- 04J. Instrumentation 1.258 01J. Soils Sediments 2.522 01Knowledge Librarian 0.331 01Model. Earth Syst. Environ. --- 01Nat. Hazards 1.901 01Nonlin. Processes Geophys. 1.129 01Phys. Plasmas 2.115 06Polar Sci. 1.031 01Proc. Indian Natn. Sci. Acad. --- 02Progress Earth Planetary Science 2.481 01Quart. International 2.163 02Science Reporter --- 02Science Reports- Nature (SREP) 4.259 02Solar Phys. 2.682 03Sustainable Water Resource Management
--- 01
Tectonophys. 2.693 01Terres. Atmos. Oceanic Sci. 0.543 01The Astrophys. J. 5.551 01

5150 51
ANNUAL REPORT 2017-2018INDIAN INSTITUTE OF GEOMAGNETISM
Dr. Geeta Vichare
Delivered a talk on the topic “Overview of Low latitude Current Systems” at Institute for Space-Earth Environmental Research (ISEE), Nagoya University, Japan on October 27, 2017.
Invited to deliver a lecture on “Investigations of near earth Space using magnetometer measurements” at ISRO Structured Training Programme (STP Theme: Space Science), Physical Research Laboratory, Ahmedabad, on March 8, 2018.
Shri Rupesh N. Ghodpage delivered a lecture on “Study of Upper atmosphere using Airglow technique”, to M.Sc. (Space Science) students of Shivaji University, Kolhapur during November, 2017.
Dr. Amar Kakad delivered a talk on “Computational plasma physics-a tool for modelling space plasma processes” for IMPRESS workshop, February 23, 2018, IIG Navi Mumbai.
Dr. S.P. Anand
Invited by Geological Survey of India for delivering lectures as a part of the Orientation course for newly recruited
Geophysicists & Assistant Geophysicists at GSI Training Institute, Hyderabad for two days during May 2017. Topic of lecture “Exploration Geomagnetism and Paleomagnetism”.
Invited by Geological Survey of India for delivering lectures on Airborne Geophysics to officers of GSI associated with Mineral Exploration/Geophysical Mapping / Airborne Surveys at RSAS GSI, Bangalore for a day and half during December 2017. Topic of lecture “Role of magnetic and aeromagnetic data in Geological Mapping and Resource Evaluation”.
Shri K. Jeeva was invited as Mentor to the DST-INSPIRE programme organized by V.O. College, Tuticorin on November 3, 2017 and gave a talk on “Importance of the Fundamental Science”.
Prof. S. Gurubaran delivered a lecture on “Geomagnetism: The Earth’s shield against solar and cosmic ray events” at Department of Physics, Assam University, Silchar on March 14, 2018.
Dr. M.S. Bagiya delivered a talk titled “Seismic forcing and its imprints at the ionosphere” at Department of Physics, Saurashtra University, Rajkot on March 12, 2018.
INVITED TALKS AND LECTURES
PARTICIPATIONS IN CONFERENCES/MEETINGS/SEMINARS
NATIONAL5th Bharatiya Vigyan Sammelan, (BVS-2017), Pune, May 11-14, 2017
Erram, V.C., G. Gupta and M. Laxminarayana
Electrical resistivity imaging technique to study saltwater-freshwater transition in parts of west coast of Maharashtra.
Ghodpage, R.N., P. T. Patil, V.C. Erram, S. Gurubaran and A.K. Sharma
Study of equatorial plasma bubbles over low latitude station Kolhapur.
National Conference on Polar Sciences (NCPS-2017), Goa, May 16-17, 2017
Jeeva, K., A.K. Tiwari, S. Sathish Kumar, V.K. Soni, Ashwini K. Sinha and S. Gurubaran
Relationship between Atmospheric electricity parameters, Nitrogen Oxides (NOx) and surface weather parameters:
A mechanism to explain the solar terrestrial weather relationship.
Rawat, R. and Ashwini K. Sinha
Universal and Local Time variations deduced from simultaneous Schumann resonance records at three widely separated observatories.
Hanchinal, A., Ashwini K. Sinha and A. Dhar
Study of Geomagnetic variations at Indian Antarctic stations Maitri and Bharati during March 17, 2015 event.
Kakad, A.P., B. Kakad, A. Upadhyay, Y. Omura and Ashwini K. Sinha
First observation of electromagnetic ion cyclotron (EMIC) waves from the Indian Antarctic station, Maitri.
Vichare, G., Ashwini K. Sinha, J.K. Behera, A. Bhaskar, Farideh Honary and R. Singh

5150 51
ANNUAL REPORT 2017-2018INDIAN INSTITUTE OF GEOMAGNETISM
Occurrence of huge particle precipitation at Maitri (L=5) caused by incoherent hiss waves during 2015 ST. Pattrick’s day storm.
M.R. Gupta Memorial National Seminar, Jadavpur University, Kolkata, August 4, 2017
Kakad, A.P., B. Kakad and A. Lotekar
Ponderomotive processes during breaking and evolution of coherent wave structures in plasmas. [INVITED]
Singh, S.V., R. Rubia and G.S. Lakhina
Evolution of electrostatic solitary waves in the Lunar wake. [INVITED]
Consultation Meeting on Aerogeophysical Mapping Program, Ministry of Mines, New Delhi, August 10, 2017
Anand, S.P.
Activities of Indian Institute of Geomagnetism in the field of Aero-geophysical and related surveys.
Brain Storming Session related to International Geological Congress, IGC 2020, NCAOR Goa, August 18-19, 2017
Anand, S.P. and G. Gupta
Earth’s Magnetic Field: Application to Geoscience.
Third National Symposium on Particles, Detectors and Instrumentation (NSPDI 2017), TIFR, Mumbai, October 4-7, 2017
Datar, G., G. Vichare, A. Bhaskar, A. Raghav, K.U. Nair, C. Selvaraj, M. Ananthi, Ashwini K. Sinha, M. Paranjape and T. Gawade
NaI(Tl) scintillation detectors for Secondary Cosmic Ray studies near equator.
32nd National Symposium on Plasma Science & Technology-2017, Gandhinagar, Gujarat, November 7-10, 2017
Hari, A., A.P. Kakad and B. Kakad
BGK Electron hole theory for superthermal plasmas.
Lotekar, A., A.P. Kakad and B. Kakad
First-ever model simulation of ion acoustic supersolitons in plasma.
Lotekar, A., A.P. Kakad and B. Kakad
Model simulation of the wave breaking phenomenon in superthermal plasma.
54th IGU Annual Convention on Recent Advances in Geophysics with Special Reference to Earthquake Seismology, CSIR-NGRI, Hyderabad, December 3-7, 2017
Tahama, K., G. Gupta and S.K.G. Krishnamacharulu
Geoelectrical studies to understand the groundwater regime in parts of coastal area of Sindhudurg district, Maharashtra.
Mohammed Salah Ahmed, P.B. Gawali, B.V. Lakshmi and S.K.G. Krishnamacharyulu
Environmental Magnetic studies of Beach and fluvial deposits of parts of Maharashtra and Assam to understand the sediment deposition dynamics.
Vijaya Kumar, P.V., P.B.V. Subba Rao, A.K. Singh and P. Rama Rao
Geomagnetic depth sounding in Saurashtra Region.
Multidisciplinary Approaches of Remote Sensing & GIS, Pune University, Pune, January 5-6, 2018
Aher, S., A. Iype and P.B. Gawali
Was Cheyyar River avulsion due to neotectonic or climatic activity? What were its implications on the existence of Marakkanam port along eastern coast of Tamilnadu, India?
Third Science Film Festival of India, Goa, January 16-19, 2018
Anand, S.P.
The Earth’s Magnetic Field: An Overview.
1st National Conference on Plasma Simulations, Department of Physics, Indian Institute of Science, Bangalore, January 18-19, 2018
Kakad, A.P., B. Kakad and A. Lotekar
Particle-In-Cell Simulation of the Breaking and Interaction of Multiple Coherent Wave Structures in Space Plasmas. [INVITED]
Lotekar, A., A.P. Kakad and B. Kakad
A new 1D fluid code for the modeling of plasma wave processes in superthermal plasmas.
Emerging Trends in Geophysical Research for Make in India (ETGRM-2018), Department of Applied Geophysics, IIT-ISM, Dhanbad, March 9-11, 2018
Ghoshal, S., P.B.V. Subba Rao and A.K. Singh
Geomagnetic Depth sounding across Baratang mud volcano, Andaman Island region.

5352 53
ANNUAL REPORT 2017-2018INDIAN INSTITUTE OF GEOMAGNETISM
Suneetha, N. and G. Gupta
Appraisal of physico-chemical parameters in northern part of Sindhudurg district, Maharashtra, for domestic and irrigation purposes.
35th & 36th Association of Hydrologists of India Annual convention and National Seminar on “Hydrology” with a colloquium on ‘Nature based solutions to Water Challenges’, Andhra University, Visakhapatnam, March 22-24, 2018
Tahama, K., G. Gupta and S.K.G. Krishnamacharulu
Estimation of secondary geophysical indicators to demarcate sea water intrusion in parts of Konkan coast, Maharashtra.
INTERNATIONALEGU-2017 General Meeting, Viena, Austria, April 23-28, 2017
Tamas Bozoki, Gabriella Sátori, Péter Steinbach, Mariusz Neszka, Janusz Mlynarczyk, Colin Price, Ashwini K.Sinha, R. Rawat, József Bór, Veronika Barta, Anirban Guha and Earle Williams
Signature of St. Patrick Geomagnetic Storm on Schumann Resonances.
Lakshmi B.V., P.B.Gawali, K. Deenadayalan and D.S. Ramesh
Rock magnetic and anisotropy of magnetic susceptibility (AMS) of earthquake affected soft sediments: Examples from Shillong and Latur (Deccan Trap), India.
15th International Workshop on MST Radar, NIPR, Tokyo, Japan, May 27-31, 2017
Yokoyama, T., S. Tulasi Ram, K.K. Ajith and M. Yamamoto
Plasma Bubble Rise Velocity Estimated from EAR Observation and High-Resolution Bubble Model.
Asia Research Node - International Symposium on Sustainable Humanosphere, Kyoto University, Uji, Kyoto, Japan, 19-21 July, 2017
Tulasiram, S.
Origin, growth and dynamics of Equatorial Plasma Bubbles (EPBs) observed from EAR. [INVITED]
UN/US Workshop on the International Space Weather Initiative: the decade after the International Heliophysical Year 2007, Boston, Massachusetts, USA, July 31 to August 4, 2017
Veenadhari, B.
Study of Space weather events of Solar cycle 23 and 24 and their Geoeffectiveness.
14th Annual Meeting of the Asia Oceania Geosciences Society, Singapore, August 6-11, 2017
Sunil, P.S., K.M. Sreejith, Ajish P. Saji and D.S. Ramesh
Interseismic crustal deformation in central Nepal Himalaya prior to 25 April Gorkha, Mw 7.8 earthquake. [INVITED]
Bagiya, M.S., A.S. Sunil, P.S. Sunil, K.M. Sreejith, L. Rolland and D.S. Ramesh
Efficacy of co-seismic ionospheric perturbations in indentifying crustal deformation pattern: case study based on Mw 7.3 May Nepal 2015 earthquake.
URSI GASS, Montreal, Canada, August, 19-26, 2017
Rubia, R., S.V. Singh and G.S. Lakhina
A mechanism for evolution of electrostatic solitary waves in the lunar wake.
IAPSO-IAMAS-IAGA Joint Assembly, Cape Town, South Africa, August 27- September 1, 2017
Yadav, V., P. Gurram, B. Kakad and A. Bhattacharyya
Study of dynamics of low-mid latitude E-region irregularities during magnetically quiet and disturbed days.
Gurubaran, S., P.T. Patil and S. Sathishkumar
Radar Observations of Atmospheric Gravity Waves in the MLT region from the low latitude station, Kolhapur (16.8oN), India.
S. Gurubaran, D. Singh and S. Sathishkumar
On the relationship between the mesospheric tidal winds and counter electrojet in the Indian Sector.
International Space Science School-2017, GSSI, L’Aquila Italy, September 18-22, 2017
Hari, A., A.P. Kakad and B. Kakad
BGK electron hole theory for superthermal space plasmas.
1st Asia-Pacific Conference on Plasma Physics, Chengdu, China, September 18-23, 2017
Kakad, A.P., B. Kakad and Y. Omura
Generation of electrostatic solitary wave structures through wave breaking process and their dynamics in plasmas. [INVITED]

5352 53
ANNUAL REPORT 2017-2018INDIAN INSTITUTE OF GEOMAGNETISM
World Data System Asia-Oceania Conference, Kyoto University, Kyoto, Japan, September 27-29, 2017
Veenadhari, B., S. Mukherjee, R. Nimje and Sandeep Kumar
Importance of Geomagnetic data and the role of WDC-Mumbai in Solar Terrestrial Research. [INVITED]
142nd SGEPSS Fall Meeting, Kyoto University, Kyoto, Japan, October 15-19, 2017
Kakad, B., A.P. Kakad and Y. Omura
Particle trapping and ponderomotive processes during breakingof ion acoustic waves in plasmas.
Van Allen Probe SWG Meeting, JHU-APL, Maryland, USA, October 25-27, 2017
Remya, B., D.G. Sibeck, A.J. Halford and K. Murphy
Substorm ion injections triggered EMIC waves.
International Conference on Traditional Sciences in Asia (ICTSA 2017), Kyoto University, Kyoto, Japan, October 25-28, 2017
Veenadhari, B., Sandeep Kumar, S. Mukherjee and R. Nimje
Extreme Space weather events as seen in the historical geomagnetic records of Colaba, India. [INVITED]
International Workshop on radio science and radio application technology, Kanazawa, Japan, October 29-30, 2017
Kakad, B., A.P. Kakad and Yoshiharu Omura
Role of ponderomotive processes in the breaking of ion acoustic waves in plasmas.
Yadav, V., B. Kakad, A. Bhattacharyya and T.K. Pant
Quiet and disturbed time characteristics of blanketing Es (Esb) during solar cycle 23.
AGU Fall Meeting, New Orleans, USA, December 11-15, 2017
Remya, B., D.G. Sibeck, K. Murphy, B.T. Tsurutani, A.J. Halford, K.H. Lee and L.C. Lee
Observations of ion injections triggered EMIC waves in the magnetosphere.
Currie, J.L., B.A. Carter, R. Pradipta, K. Groves, R. Caton, S. Tulasi Ram and T. Yokoyama
An analysis of unseasonal equatorial plasma bubbles in July 2014.
AGU Chapman conference on Particle Dynamics in Earth’s Radiation Belts, Portugal, March 4-9 2018
Gokani, S.A., M. Kosch, M. Clilverd, C. Rodger, R. Singh, D. Danskin and S. Marple
What fraction of the outer radiation belt electron flux was lost to the atmosphere during the dropout event on the St Patrick’s Day storm of 2015?
Space weather meeting held at Kyushu University, Japan, March 14-15, 2018
Vichare, G., N. Thomas, K. Shiokawa, Ashwini K. Sinha and A. Bhaskar
Ring current studies using swarm measurements.
Thomas, N., K. Shiokawa and G. Vichare
Conjugate observations of the low-latitude Pi2 pulsations from longitudinally distributed ground network and Swarm satellites.
STUDENTS CORNER
Mr. Selvakumaran has been awarded with Ph.D. degree from Andhra University, July 2017, under the guidance of Dr. B. Veenadhari.
Mr. Virendra Yadav has been awarded with Ph.D. degree from Andhra University, October 2017 under the guidance
of Dr. Bharati Kakad on “Multi-technique study of the dynamics of equatorial E-region”.
Mr. Ajith, K.K. has been awarded with Ph.D. degree in January 2018 under the guidance of Dr. Tulasiram.


5554 55
ANNUAL REPORT 2017-2018INDIAN INSTITUTE OF GEOMAGNETISM
Shri Sabuj Ghosh of Saha Institute of Nuclear Physics, Kolkata visited IIG on April 4, 2017 and delivered a lecture entitled “On the paths of transitions among different kinds of nonlinear oscillations in glow discharge plasma.
Shri Pankaj Kumar Shaw of Saha Institute of Nuclear Physics, Kolkata delivered a talk at IIG on the topic “Investigation on nonlinear dynamics of self-excited plasma oscillation” on April 5, 2017.
Dr. Kshitija Deshpande, Embry-Riddle Aeronautical University, Daytona Beach, Florida visited IIG and delivered a lecture on “GPS Remote Sensing and Its Role in Space Weather Applications” on 4th August 2017.
Shri A.N. Kutty, Consultant (H.R.), Cotton Corporation of India, Belapur visited IIG on November 2, 2017 and delivered a lecture on “The Role of Vigilance Commission and the Departmental Proceedings in government offices and public sector undertakings”.
Prof. V. Siva Kumar, Professor and Programme Director of NASSP, University of KwaZulu Natal, Westville Campus, Durban, South Africa visited IIG during 4-5 January, 2018. He delivered a lecture on “The study on the interaction between middle atmosphere and lower thermosphere using SuperDARN HF Radar and Satellite data” 5 January, 2018.
Prof. Vikas Sonwalkar from University of Alaska Fairbanks, USA visited IIG on January 12, 2018 and delivered a talk on the topic “Remote sensing of electron density and ion composition using lightning-generated nonducted whistler observations on magnetospheric satellites”.
Dr. E.A. Kherani from National Institute of Space Research (INPE), Brasil deliverd a seminar talk entitled “Seismogenic response of pre-conditioned ionosphere during a moderate earthquake and possible forecasting scenario” on January 30, 2018.
Mr. Ochieng Adero, A. (Dr. C.V. Raman Fellow; DST) from Technical University of Kenya, Nairobi, delivered a lecture on “Statistical analysis of Field-Aligned Currents observed by Champ Satellite during Geomanetic Storms” on March 5, 2018.
Shri Amit Doshi, MathWorks gave a lecture on “Tackling Big Data with MATLAB” on March 23, 2018 at IIG.
During the IMPRESS 2018 (February 19-23, 2018) and the one-day workshop (February 21, 2018), following distinguished scientists delivered lectures/talks:
Prof. B. Buti, Director, Centre for Science and Society, Founder & President, Buti Foundation, New Delhi, gave a keynote address on “Chaos and Fractals” during the workshop.
Prof. Abhijit Sen, Institute for Plasma Research, Gandhinagar, gave a talk on “Precursor Solitonic Excitations in Space and Laboratory Plasmas” during the workshop.
Prof. S.K. Nath, IIT Kharaghpur, gave a talk on “Extreme Events as Nonlinear processes being perceived from initiation to impact on Man and Environment with major focus on Earthquakes, Tsunamis and Landslides” during the workshop.
Prof. A. Bhardwaj, Physical Research Laboratory, Ahmedabad, gave a talk on “Indian Planetary Missions”, during the workshop.
Dr. V.M. Tiwari, CSIR-NGRI Hyderabad gave a talk on “Satellite based observations of hydrological extremes”, during the workshop.
Prof. Frank Verheest, University of Ghent, Belgium gave a talk on “Elements of electrostatic soliton theory in plasmas”, during the workshop and lecture on “Introduction to Waves in Space Plasmas”, during the IMPRESS 2018.
Prof. B.T. Tsurutani, JPL Pasadena, USA, gave a talk on “Some exceptional advancements/ achievements in magnetospheric and interplanetary plasma physics from IIG”, during the workshop and a lecture on “Solar and Interplanetary Phenomena that cause the Aurora Borealis”, during the IMPRESS 2018.
Dr. K. Vijay Kumar, SRTM University Nanded, gave a lecture on “Differentiation of the Planet Earth: In Space and Time”, during the IMPRESS 2018.
Dr. S.K.G. Krishnamacharyulu, SRTM University Nanded, gave a lecture on “Exploration Geophysics and Planet Earth”, during the IMPRESS 2018.
Dr.Tarun K. Pant, SPL Trivandrum, gave a lecture on “Sun-Earth System-Emerging key issues”, during the IMPRESS 2018.
DISTINGUISHED VISITORS

5756 57
ANNUAL REPORT 2017-2018INDIAN INSTITUTE OF GEOMAGNETISM
Prof. Geeta Vichare was invited as an examiner for the M.Sc. Project of the M.Sc. Part II students at the Department of Physics, University of Mumbai.
Dr. S. Tulasiram
Finalist, NASI-SCOPUS Young Scientist Award, National Academy of Sciences India and Elsevier, 2017.
Associate Fellow, Andhra Pradesh Academy of Sciences, 2017.
Navin Parihar
2018 ISEE International Joint Research Program, (Institute for Space-Earth Environmental Research (ISEE), Nagoya University, Japan.
Prof. Satyavir Singh was the Convener of, “Inspiring the Minds of Post-graduates for Research in Earth and Space Sciences (IMPRESS – 2018)”, Indian Institute of Geomagnetism, New Panvel, Navi Mumbai, India (February 19-23, 2018).
Miss Khan Tahama, SRTM University, Nanded, is the recipient of AHI- Dr. S.C. Puranik Young Scientist Award for best paper presentation entitled “Estimation of secondary geophysical indicators to demarcate sea water intrusion in parts of Konkan coast, Maharashtra”, by Khan Tahama, Gautam Gupta and S.K.G. Krishnamacharulu, at the 35th & 36th Association of Hydrologists of India Annual Convention and National Seminar on ‘Hydrology’, at Andhra University, Vishakhapatnam during March 22-24, 2018.
Prof. Gautam Gupta is selected as a regognized research guide in Department of Geophysics, Andhra University, Visakhapatnam, to guide the research scholars admitted into Ph.D. program under extramural category.
Prof. Gautam Gupta was appointed as Post graduate examination paper setter for School of Environmental & Earth Sciences, North Maharashtra University, Jalgaon, on the course “GS-202: PHYSICS AND CHEMISTRY OF THE EARTH” during 2017-18 examination.
Prof. Gautam Gupta & Dr. S.P. Anand was nominated to attend the Brain Storming Session related to International Geological Congress, IGC 2020, held at NCAOR Goa during August 2017.
Dr. S.P. Anand
Nominated to participate in the consultation meeting convened by Secretary, Ministry of Mines to appraise the activities of exploration surveys currently carried out and understand the capabilities & possibilities of sharing of resources/data acquired by various organizations during August 2017.
Nominated to represent IIG for the Science Film Festival of India (SCI-FFI) held in Goa from 16 to 19 January 2018 jointly organized by Department of Science & Technology, Govt of Goa, Vidnyan Parishad, National Institute of Oceanography, Entertainment Society of Goa etc.
Mohammed Salah Ahmed, SRTM University, Nanded, Summer Intern at IIG 2017, received the 1st prize at the 54th Annual Convention of IGU at CSIR-NGRI, Hyderabad, for best poster presentation for the paper entitled “Environmental Magnetic studies of Beach and fluvial Deposits of parts of Maharashtra and Assam to understand the sediment deposition dynamics” by Mohammed Salah Ahmed, P.B. Gawali, B.V. Lakshmi and S.K.G. Krishnamacharyulu.
Cover Page of Journal of Geophysical Research (Space Physics): The paper “Coseismic contortion and coupled nocturnal ionospheric perturbations during 2016 Kaikoura Mw 7.8 New Zealand earthquake” by Bagiya, M.S. et al., (2018) made the cover page of February 2018 issue of American journal, “Journal of Geophysical Research (Space Physics)”.
Cover Page of Journal ofGeophysical Research (Space Physics): The paper “Origin of the ahead of tsunami traveling ionospheric disturbances during Sumatra tsunami and offshore forecasting” by Bagiya, M.S. et al., (2017) made the cover page of July 2017 issue of American journal, “Journal of Geophysical Research (Space Physics)”.
American Geophysical Union (AGU) Journal Highlights: The paper “Origin of the ahead of tsunami traveling ionospheric disturbances during Sumatra tsunami and offshore forecasting” by Bagiya, M.S. et al., (2017) was selected by the AGU as Journal highlights.
IGU best paper award for year 2017 was conferred on the paper titled “An appraisal of the plate tectonic forces: Role of Gravitational Potential Energy (GPE) in the deformation of Indo-Eurasia collision zone” by Reddy, C.D. and M.N. Shrivastava.
HONOURS AND AWARDS

5756 57
ANNUAL REPORT 2017-2018INDIAN INSTITUTE OF GEOMAGNETISM
TRAINING IMPARTED
Gautam Gupta guided the following students:
Miss Khan Tahama, SRTM University, Nanded has carried out a project work entitled “Geoelectrical studies for delineating seawater ingress in a coastal area of Sindhudurg district, Maharashtra” as Summer Trainee during May-June, 2017.
A project work entitled “Delineating groundwater potential zones in dykes of northern Maharashtra via electrical resistivity technique” was done by Mr. Debajit Sarkar, IISER, Kolkata during his tenure as Summer Trainee (May-July, 2017).
Ms. Divya Borse, North Maharashtra University, Jalgaon accomplished her M.Sc. dissertation entitled “Evaluation of secondary geophysical indices via electrical resistivity sounding technique in parts of Dhule district, Maharashtra” during the period December 2017-January 2018.
B.V. Lakshmi guided the following students:
Ms. Patil Jayshri Ravindra, M.Sc. Environmental Sciences, North Maharashtra University, Jalgaon, Maharashtra, completed her project on “Environmental Magnetic properties of Girna River Sediments, Maharashtra, India” during her internship from December 4, 2017 to January 10, 2018.
Mr. Mukalla Sankara Narayana, M.Sc. Geophysics Dr. B.R. Ambedkar University, Srikakulam, completed his project on “Magnetic, particle size and geochemical methods along Tirna River, Latur, Maharashtra, India” from December 2017 to January 2018.
Mr. Arund Dadi from Department of Geology, K.J.Somaiya College of Science and Commerce, Mumbai completed his project on “Magnetic Properties of Sediments along the Krishnai River, Nayapara, Shillong” from May to June 2017.
Ms. Jadhav Pooja Sunil from Gopal Krishna Gokhale College, Shivaji University, Kolhapur completed her project on “Magnetic Properties of earthquake induced soft sediment deformation features, Dauki river, Shillong” from November 2017 to January 2018.
Mr. K.R.Rajgopal from KUFOS, Kochin completed his project on “Integrated magnetic, particle size and geochemical paramters for the Sanghat sediments along Tipkai river, Assam to decipher the environmental conditions” from May to June 2017.
Ms. Sreelakshmi, pursuing M.Sc. Applied Geophysics from Manonmaniam Sundaranar University, Tirunelveli, completed project on “Paleomagnetism, geochemistry and particle size properties of liquefaction sediments, Beltola, Assam, India” from December 2017 to March 2018.
S.K. Patil
Imparted training on Low field AMS studies on the Dhalma volcanic, Singhbhum Craton, to Mr. Roshan Shukla of Geology Department, Lucknow University. The student has worked for one month during March-April, 2018, perusing for his M.Sc. dissertation.
S. Sripathi
Mr. V. Murali from Andhra University, AP did his M. Sc. (Space Physics) project work on “A statistical study on the generation/suppression of Equatorial Spread F (ESF) irregularities based on the onset time of the geomagnetic storm” during June/July 2017.
Ms. K. Prasanna from RBVRR Women’s College (Osmania University), Hyderabad did M. Sc (Mathematics) project work on “GPS receiver Biases estimation using variance minimization method: case studies during January 2004” during 30-11-2017 to 13-01-2018.
Ms. M. Kalpana from RBVRR Women’s College (Osmania University), Hyderabad did M. Sc. (Mathematics) project work “GPS receiver Biases estimation using variance minimization method: case studies during March 2004” during 30-11-2017 to 13-01-2018.
Mr. Abhijeet Tripathy from IIT Bombay did his M. Sc. (Geophysics) project on “Ionospheric TEC perturbations due to possible Tsunami waves following the 26 December, 2004 Earthquake” during 11 December 2017 to 2 January 2018.
Geeta Vichare guided the Pre-Ph.D. project of Ms. Sree Lakshmi entitled “Atmospheric tides”.
Rajesh Singh guided the Summer project dissertation of:
Mr. Sidha Sankalpa Moharana, BS-MS 2nd year student from IISER Kolkata.
Mr. Narish Kumar Patra, M.Sc. Physics 2nd year student from Department of Physics, Annamalai University.
Navin Parihar guided the M.Sc. Dissertation of Ms. Shabeena Shaik of Department of Physics, Andhra Univeristy, Vishakhapatnam.

5958 59
ANNUAL REPORT 2017-2018INDIAN INSTITUTE OF GEOMAGNETISM
M.Sc. Dissertation of Mr. Ajin Tom Joseph of School of Pure and Applied Physics, Mahatma Gandhi University, Kottayam, Kerala.
S. Tulasi Ram guided the dissertation of Mr. Arka Mitra, Presidency University, Kolkata on the project “A Study of extensive radio occulration data from 2007-2015 to understand and model short and long-term variability in ionoshperic response to solar forcing”.
Bharati Kakad guided the dissertation of the following:
Lissa Duvvu, Andhra University, M.Sc. dissertation on “Study of the solar cycle variations and characteristics”, July 2017.
Shubham Singh and Shraddha Chaubey, R.J. College, Mumbai University, M.Sc. dissertation “Understanding Earth’s Ionosphere”, August 2017.
Tejaswini Gawade, University of Mumbai, Summer trainee, on “Understanding Earth’s magnetic field”, May-July 2017
Guided pre-Ph.D. project entitled, “Plasma waves in earth’s magnetosphere” by Ms Aditi Upadhyay.
S.P. Anand guided the following students:
Anagha, T.J., Department of Geotechnology, MS University Tirunelveli, on “Crustal Magnetic Anomalies over Wagad Uplift, Kutch Rift Basin”, January-March 2018.
Haritha, C., Department of Marine Geology and Geophysics, Cochin University of Science & Technology, Cochin, on the topic “Moho topography estimation over the Maldive Ridge and adjoining areas from inversion of high resolution satellite derived free air gravity data”, December 2016-June 2017.
Amar P. Kakad guided the dissertation of the following:
Guided pre-Ph.D. project entitled, “Linear dispersion characteristics of electrostatic waves in ordinary and dusty plasmas” by Mr. Z. Shaikh.
M.Sc. dissertation entitled “Solving differential equation using numerical methods” by Mr. Ajith Kumar Bahawath Singh and Mr. Shankar Suresh Pawar, Master Students, Department of physics, RamniranjanJhunjhunwala College.
Summer Trainee work entitled, “Kinetic dispersion analysis of the electrostatic waves in plasma” by Mr. Mandar Paranjape, Mumbai University.
C.K. Rao guided the project of Abinav Jaiswal, 2nd year M.Sc., IIT Kharagpur on the topic “Understanding magnetotelluric method: A case study in Rewa”, during 29th May 2018 to 8th July 2017.
K. Deenadayalan guided the dissertation of Mr. Akhil U.M, Department of Marine Geology and Geophysics, Cochin University of Science and Technology, during January 22 – February 28, 2018.
P.B. Gawali guided the dissertation of the following:
Ms. Sowmya from KUFOS, Cochin completed project on “Magentic, particle size and geochemical properties of Raipur sediments along Gangadhar River, Assam” from May to June 2017.
Mr. Mohammed Salah Ahmed, SRTM University, Nanded, completed his project on “Environmental magnetic studies of beach and fluvial deposits of Sindhudurg District and Assam to understand their deposition dynamics” from May to July 2017.
Ms. Ashwini B. Kale from Gopal Krishna Gokhale College, Shivaji University, Kolhapur and Himanshi D. Sali from School of Environmental & Earth Sciences North Maharashtra University, Jalgaon, completed project on “Environmental magnetic studies of three beaches of Sindhudurg District to understand their deposition dynamics” from November 2017 to January 2018.
P.S. Sunil guided the dissertation work entitled “Seismicity data analysis and imaging of stress accumulation zones along/across the interplate regions of New Zealand” by Mr. Shyam Sunny, School of Environmental Sciences, Mahatma Gandhi University, Kottayam, Kerala from 1st to February to 10th May 2017, in partial fulfillment of the requirements for the award in Master of Science in Environmental and Disaster Management.
Nitin Sharma imparted training to two students of Bodoland University, Kokrajhar during the year.
PARTICIPATION IN SPECIALIZED WORKSHOPS/TRAINING COURSES
Navin Parihar
Advanced School on Tropical-Extratropical Interactions on Intra-Seasonal Time Scales, 16 - 27 October 2017, International Centre for Theoretical Physics, Trieste, Italy.
Advanced School on Programmable System-on-Chip for Scientific Instrumentation, 20 November - 1 December 2017, International Centre for Theoretical Physics, Trieste, Italy.

5958 59
ANNUAL REPORT 2017-2018INDIAN INSTITUTE OF GEOMAGNETISM
Virendra Yadav & Ramsingh
International Reference Ionosphere (IRI) workshop 2017, National Central University (NCU), Taiwan, 4-19 November 2017.
Ramsingh
ISR School and workshop, Arecibo Observatory, Puerto Rico (U.S.A), 23-29 July 2017.
Mr. Biswajit Ojha attended GIAN course on “computational methods and parallel processing in science and technology”, organized by Mathematics Dept. NIT Warangal from December 20-30, 2017. Course was based on the tools to solve the numerical equations (both ODEs and PDEs).
OFFICIAL LANGUAGE (HINDI)
Rajbhasha Adhikari : Ashwini K. SinhaAsst. Director (Offi cial Language) : J. KamraSr. Hindi Translator : Manju J. SinghLower Division Clerk : K. Shelatkar
In compliance with the provisions of the Official Languages Act, Rules made there under, Annual Programme and other directives issued from time to time by the Department of Official Language, the Institute regularly undertakes some importantand special activities to enhance the progressive use of official language Hindi among its members.
The Institute organized ‘Hindi Mah’ during September-October, 2017. TheHindi competitionsorganized during this period included Computer Typing, Translation, General Knowledge, Crossword, Essay Writing and Word Construction from the prefix and suffix, which were well attended by the members. A prize distribution function was held on November 16, 2017, in which Chief Guest Shri Narendra Kulkarni, Commissioner of Central Excise, Customs & Service Tax (Now GST) gave away the prizes to the winners and addressed the gathering. He told that is was a pleasant surprise for him to see that IIG’s most of the work is done in Hindi.He further added that the difficulties to work in Hindi are similar to all and if any new language is sometimes useful and one can become familiar with the culture of that particular language. He said that there is no orders issued or no incentive scheme exists for working in English, then also people are working in English. Whereas there are numerous govt. orders and a number of incentive schemes for doing work in Hindi.He concluded with the best wishes to the Institute for achieving more name & fame in the field of official language implementation. Prof. D.S. Ramesh, Director urged the staff members not to limit their Rajbhasha work & activities to competitions and incentive schemes only, buttry to work voluntarily throughout the year and make optimum use of facilities provided for doing day-to-day work in Official Language Hindi. He also gave away prizes to some of the winners.
Chief Guest Shri Narendra Kulkarni, addressing the staff members during the concluding session of Hindi Mah celebrations.
Release of the Hindi House Magazine “SPANDAN” by the Chief Guest along with Director IIG.
Participants at a competition held during Hindi Mah celebrations

6160 61
ANNUAL REPORT 2017-2018INDIAN INSTITUTE OF GEOMAGNETISM
Shri Narendra Kulkarni giving away prizes to the winners of various competitions during Hindi Mah celebrations.
The Institute celebrated the World Hindi Day on January 10, 2018 and organized Hindi writing and extempore speech competitions. The winners were given cash awards by the Chief Guest Dr. Manjula Desai from Hindustani Prachar Sabha, Mumbai. She said that our Hindi language has a variety of qualities and its script is very-very scientific and that is why, it is on the path of becoming a major global language. She further added that we should consolidate our Hindi language domestically, then it will automatically become a globally spoken language and for this, we should stick to our diversified culture and traditions, then only our languages shall remain protected. On the occasion, Director Prof. D.S. Ramesh said that Hindi can become the major global language only with the help of NRIs, who are very fond of their culture & language.
Dr. D.S. Ramesh, Director, welcoming Chief Guest Dr. Manjula Desai during celebration of World Hindi Day.
The Institute organized a Hindi translation competition on January 30, 2018 under the aegis of TOLIC, in which 35 officers/staff participated from the member organizations. On this occasion, IIG documentary was also screened for the participants. The programme was highly appreciated by the TOLIC authorities and the participants. The winners of the competition shall be awarded with cash prizes in the half yearly meeting of the TOLIC to be held on June 20, 2018.
Hindi House Magazine “SPANDAN” was published on six monthly basis, which includes scientific & technical articles as well. The magazine is sent to various scientific & educational institutes of the country.
Staff members attending a Hindi workshop at IIG Panvel.
During the year, four Hindi Workshops were organized on different topics, in which a total of 93 members participated.
Under the annual incentive scheme, during the Annual Day Celebrations 15staff members of the Institute were awarded with cash prize for doing their official work in Hindi.
The Asstt. Director (Official Language) and Sr. Hindi Translator continued as member of the editorial board of Hindi Magazine ‘Samanvaya’ being jointly brought out by the member organizations of TOLIC, Navi Mumbai.
The Director, Rajbhasha Adhikari, Asstt. Director (Official Language) and Sr. Hindi Translator of the Institute attended various meetings/seminars held under the aegis of TOLIC, Navi Mumbai and other organizations.Some of the staff participated in the Hindi competitions organized by the member organizations of TOLIC, Navi Mumbai.
SCIENCE OUTREACH ACTIVITIES
Science and technology is taking immense strides and leaps in varied fields. These are, many a times, out of reach of the comprehension of non-specialists of the field and the common people. The impact science and technology has on
the lives of each and every life form of the universe is beyond any doubt. However, the essence of this knowledge stream is difficult to intellectually digest; hence special efforts are needed to make it comprehensible to the population that

6160 61
ANNUAL REPORT 2017-2018INDIAN INSTITUTE OF GEOMAGNETISM
is not directly involved in generating this wisdom. Science outreach activities at the Institute are designed precisely to widen the horizons of understanding about how the universe functions. The increased ‘knowhow’ of abstract concepts can aid the general population and opinion makers, as also the policy deciders, to make informed and judicious decisions benefitting and catalyzing overall wellbeing of our universe.
To achieve the above stated objectives, the following activities were carried out in the academic year 2017-18:
i. Students from over 60 Schools/Colleges visited the Institute at Panvel and Colaba campus, alongwith all other magnetic observatories and regional centers, and they were acquainted with the Science of Geomagnetism and allied fields.
ii. 80 lectures were delivered by IIG Scientists on various topics for the benefit of students
iii. IIG participated in Indian Science Congress – 2018 (held at Imphal, Manipur), IISF – 2017 (Chennai), and Destination Goa – 2017 (Goa).
iv. 3-Day open house was held during Science Day Celebrations from February 26-28, 2018 at IIG main campus, and at all other magnetic observatories and regional centers. Competitions related to the theme “Reaching the unreached through science and technology” was also held at all the IIG campuses.
The following schools/colleges visited the Institute to get acquainted with the science of geomagnetism and allied fields:
IIG, NAVI MUMBAI
Date of visit
Name of college/school
No of students
No of teachers
21-06-2017 New Horizon Scholars school, Airoli
25 3
21-08-2017 Padmabhushan Vasantdada Patil College of Engineering, Sion
120 5
08-09-2017 Changu Kana Thakur College, New Panvel 51 3
22-09-2017 Padmabhushan Vasantdada Patil Pratishthan’s College of Engineering, Sion
55 3
27-09-2017 Saraswati Institute of Technology, Kharghar 52 3
Date of visit
Name of college/school
No of students
No of teachers
05-10-2017 Padabhushan Vasantdada Patil Pratishthan’s College of Engineering, Sion
200 5
27-10-2017 B.R.Harne College of Engineering & Technology, Ambernath
150 4
28-11-2017 MNR International School, Palaspe
100 14
13-12-2017 Acharya Marathe College, Chembur
50 5
18-01-2018 Student’ Experience in Inter-state Living (SEIL)
30 5
18-01-2018 KLE Society’s Science and Commerce College, Kalamboli
20 2
19-01-2018 Swaminarayan Gurukul International School, Navi Mumbai
50 2
23-01-2018 Acharya Marathe College, Chembur
50 2
26-02-2018 K.V.Pendharkar College of Arts, Science and Commerce, Dombivli
30 5
26-02-2018 Saurashtra University, Rajkot
33 3
28-02-2018 Arts, Science and Commerce College, Vidyanagari, Baramati, Pune
50 5
14-03-2018 Ismail Yusuf College of Arts, Science and Commerce, Jogeshwari
30 2
The visitors were acquainted with the basics of geomagnetism, GPS and other related activities carried out at IIG. Posters, models, lab visits and talks were arranged to enlighten them on the advances made at IIG in the field of geomagnetism and allied areas. All the activities were aimed also at instilling scientific temper and arousing curiosity in the young minds. The teachers were happy to update their knowledge.

6362 63
ANNUAL REPORT 2017-2018INDIAN INSTITUTE OF GEOMAGNETISM
Talks on basics of geomagnetism to advances in geomagnetic, seismic studies were given by scientists like Sunil P.S., Ajay Dhar, Praveen Gawali, Ashwini Sinha, Gopi Seemala, Mala Bagiya, Vijay Kumar, Rahul Rawat, Ankush Bhaskar and many others.
Praveen Gawali published more than 50 popular science articles in Marathi and few in Science Reporter.
On many occasions Director, IIG, Prof. D. S. Ramesh, and other senior scientists took special interest and time to interact with the students and teachers.
ALIBAG M.O.
Date of visit
Name of college/school
No of students
No of teachers
25-04-2017 Bapusaheb D.D.Vispute College ofEducation, New Panvel
70 5
13-10-2017 Rajiv Gandhi College of Arts, Commerce & Science, Vashi
40 5
29-11-2017 Sunshine English Medium School, Satara
130 5
29-01-2018 Dayanand Science College, Latur 85 4
07-02-2018 Shri Bapusaheb D.D Vispute College, New Panvel
90 6
08-02-2018 PES Modern College, Pune
43 7
14-02-2018 Zeal Polytechnic, Narhe, Pune
51 6
29-01-2018 Dayanand Science College, Latur
85 4
13-03-2018 Botanical Survey of India, Pune
12 2
A brief introduction on history of geomagnetism in India, role of Colaba-Alibag magnetic observatories in institutionalizing geomagnetism in India, the utility of network of magnetic observatories all over India was briefly explained. The students and teachers were also exposed to classical and modern instruments through visits to museum and the absolute/variometer rooms.The care taken by the pioneers in constructing non-magnetic observatories was also explained. 175 years of Geomagnetism documentary was screened during their visit.
Alibag staff members have been active participants in Antarctic expeditions. The visitors were enlightened on the extreme climate of the region and the inclement weather through which all the experiments are carried out on this icy continent.
Mr. Sudarshan Patro published a few articles and photographs (especially aurorae) of different natural phenomena occurring on the harsh icy continent.
ANDAMAN (PORT BLAIR) M.O.
Date of visit
Name of college/school
No of students
No of teachers
FEB 2018 Govt. Senior Secondary School, Wimberly Gunj
51 6
The visiting students were briefed about the activities of theInstitute through a series of posters. Students were also taken around the observatory and various magnetometers and other scientific instruments deployed in the observatory were shown. Students and the accompanying teachers took keen interest in learning about the institute and the experiments being conducted in the observatory.
As part of Science Outreach Activity, an “Interactive Session with Scientists” was arranged at Multiparametric Geophysical Observatory, Shoal Bay No-8, South Andaman on February 12, 2018. A total of 51 students (28 Boys and 23 Girls) and Teachers participated in the event and interacted with the visiting Scientists.
Students being briefed about the research activities and experimental setup at MPGO

6362 63
ANNUAL REPORT 2017-2018INDIAN INSTITUTE OF GEOMAGNETISM
JAIPUR M.O.
Date of visit
Name of college/school
No of students
No of teachers
NOV 2017 Biyani Girls College 40 2
FEB 2018 Different Schools/Colleges
80 5
An exhibition of posters, instruments and talks were arranged. The importance of studying Earth’s geomagnetic field was explained and why such studies are necessary. The visitors were shown old classical instruments like IZMIRAN IV, QHM and BMZ. 175 years of Geomagnetism documentary was screened.
KOLHAPUR MF RADAR FACILITY
Date of visit
Name of college/school
No of students
No of teachers
20-02-2018 Dr. Bombale Uttam L., Shivaji University, Kolhapur
13 2
PONDICHERRY M.O.
Date of visit
Name of college/school
No of students
No of teachers
20.02.2018 KendriyaVidyalaya 2, Pondicherry
150 5
28.02.2018 University Earth Science Dept.
46 2
A lecture was delivered by Dr. Anil Iype on the history of geomagnetic observations and research in India and basics of Geomagnetism. Mr. Sheikbareeth gave a lecture on basics of Electricity and Magnetism. The basics of geomagnetism were explained with the help of posters. The working principle of every observatory instrument, along with their importance and applications in geomagnetism, was also explained to the students.
RAJKOT M.O.
Date of visit
Name of college/school
No of students
No of teachers
20.02.2018 Dept. of Physics, Saurashtra University, Rajkot
70 5
28.02.2018 Different colleges 33 6
Posters and magnetometers were explained and demonstrated.
SILCHAR M.O.
Date of visit
Name of college/school
No of students
No of teachers
20.02.2018 Different Schools/col-leges
50 2
Posters and IZMIRAN instruments were displayed and explained. Documentary on 175 years of geomagnetism was screened.
KSKGRL, ALLAHABAD
Date of visit
Name of college/school
No of students
No of teachers
09-11-2017 University of Horticultural Science, Bagalkot
30 3
28.02.2018 Different schools/colleges
100 5
Three day Science week celebration with the theme “Reaching the unreached through science and technology” were carried out at KSKGRL during 26th -28th February 2018. In order to create awareness about the scientific research carried at the RC, power point presentation featuring space weather, sun and earth connection, Geomagnetism: its measurement and instrumentation experiments, Airglow studies using ULF/VLF waves, Lighting/TLE studies, Ionosonde-Scintillation, GPS base tectonic research, Paleomagnetic and Petrological studies and also IIG’s participation in Antarctica Expedition was delivered on each day by S.K. Patil, Rajesh Singh, C.K. Rao and many others. Over 20 posters were displayed and explained to visitors. Over 300 schools and college students were welcomed during this celebration. 50 especially abled children also participated. To generate curiosity among the young students, elocution and open science quiz were organized. Prizes and gifts were distributed to the winners.
SGRC, SHILLONG
Date of visit
Name of college/school
No of students
No of teachers
21.10.2017 Department of Environmental Studies, NEHU, Shillong
45 2
25.11.2017 Department of Chemistry, Shillong College, Shillong
25 2

6564 65
ANNUAL REPORT 2017-2018INDIAN INSTITUTE OF GEOMAGNETISM
Date of visit
Name of college/school
No of students
No of teachers
02.12.2017 Directorate of Mineral Resources, Shillong
---- 15 (Del-
egates)
07.12.2017 Directorate of Physics, St. Mary’s College
40 5
20.02.2018 Army Public School, San Shnong Higher Secondary School, St. Gabriel Higher Secondary School, and San Mer Secondary School.
60 5
The visitors were explained the basics of geomagnetism and seismology through posters and presentations. They were also explained the working and principle of different instruments operating in the campus. Discussion and questionnaire sessions were also arranged. The following scientists, Nitin Sharma, Nawa Hazarika, Shantanu Pandey, Sujit Pradhan and M.B. Nongklaw delivered talks on basics of seismology, geomagnetism and observatory instrumentation.
NATIONAL SCIENCE DAY 2018In order to bring scientific awareness among the students and public, the National Science Day- 2018 celebrations started with various competitions held for students and teachers. The focal theme for this National Science Day was “Reaching the unreached through Science and Technology”.
The following programs were arranged for the students and teachers during this Science Day celebrations:
The “Essay Writing” competition was held on January 30, 2018 for the students. 180 Students from 16 Schools and 3 Junior Colleges participated in this competition. The participants were divided into three different categories as junior, senior and college students. A separate competition was held for vernacular language (Marathi Medium) Schools/Junior College and had more than 80 participants. The topic for the Essay was “Transforming India through Science and Technology”.
The “Elocution” competition for the students was held on February 6-8, 2018 for English Medium and vernacular language schools and junior colleges. 250 Students from 15 schools and 3 Junior Colleges participated in the Elocution competition. The participants were divided into three different categories as junior, senior and college students.
The topic of Elocution this year was “Social media: boon or bane” for junior students and “Climate change and sustainability” for senior and college students.
The “Sit & Draw” competition for the students attracts large participation and was held on February 2, 2018 on the topic “Idea for Bharat Nirman”. Nearly 250 Students from 20 different schools participated in this competition, which was again divided into three categories as sub-junior, junior and senior standards.
School students participating in the sit and draw competition during the Science Week celebrations.
The “Power Point Presentation” competition for teachers was held on February 12, 2018 on for English medium teachers, and on February 15, 2018 for Marathi medium teachers on the topic “Reaching the unreached through Science and Technology”. 25 Teachers from 10 Schools and two Junior colleges made Power Point presentation on the above mentioned topic.
The main exhibition of colorful posters depicting the “Science of Geomagnetism and Allied Fields” was held from February 26-28, 2018. A few posters depicting the theme of the National Science Day were specially prepared and displayed. Various instruments used for geomagnetic studies and allied surveys were displayed for the benefit of students. More than 1500 students and a large number of people from all walks of life visited the exhibition. Transport arrangements were made for schools expressing inability to bring the students to the Institute. Various audio-visuals on science related topics were highlighted and a number of popular talks were delivered during this period. Hands on experiments on “What can you do with a Magnet” and various science Models were also displayed. Science Quiz was held daily during the exhibition and spot prizes given to students. The main attraction for students and common public was the Solar Telescope. The students and public could have a view of the solar corona, sun spots, solar flares and prominences with the help of this solar telescope.

6564 65
ANNUAL REPORT 2017-2018INDIAN INSTITUTE OF GEOMAGNETISM
Science projects on display during the Science Week celebrations.
School students being explained the concepts of geomagnetism through posters.
School attending a popular science lecture during the Science Week celebrations.
The response from students and schools was phenomenal wherein almost four thousand participants competed for top spots. The footfall for exhibition of lay people was also encouraging. The Science Week celebrations culminated with popular science talk on “Walk the talk with Cancer cells” by the Chief Guest of the function, Dr. Nishigandha Naik, Director, Haffkine Institute, Mumbai. Prof. M. Radhakrishna, IIT, Mumbai, our Guest of Honor also spoke on the occasion. Awards and Certificates to winners of the competitions were distributed at the hands of Chief Guest, Guest of Honor and Director, IIG, Dr. D. S. Ramesh during the valedictory function.
The Chief Guest and the Guest of Honour getting acquainted to the working principle of instruments during the Science Week celebrations
2018. Also seen is Director IIG.
Dr. D.S. Ramesh, Director, felicitating Chief Guest Dr. Nishigandha Naik during culmination of Science Week celebrations.
The Science Day was also celebrated at the regional Centre’s “Equatorial Geophysical Research Laboratory (EGRL), Tirunelveli” and “Dr. KS Krishnan Geomagnetic Research Laboratory (KSKGRL), Allahabad” and all other magnetic observatories.
105th INDIAN SCIENCE CONGRESSThe Institute participated in the 105th Indian Science Congress held at Imphal, Manipur, from March 16-20, 2018 with a group consisting of four faculty members. IIG participated in the Science Expo as a part of Department of Science and Technology (DST) pavilion. The focal theme of the Indian Science Congress – 2018 was “Reaching the unreached through Science and Technology”.
The “Pride of India” science pavilion was inaugurated by the Hon’ble Minister for Science and Technology and Earth Sciences, Dr. Harsh Vardhan in the presence of Secretary, Department of Science and Technology and other dignitaries. The Institute put up an exhibition of colorful posters depicting the “Science of Geomagnetism

6766 67
ANNUAL REPORT 2017-2018INDIAN INSTITUTE OF GEOMAGNETISM
and Allied Fields”. A few posters on the theme of the Science Congress were specially made and displayed for the public. In addition, few equipment used for collecting magnetic field data and various science models were also put on display. The scientific models of IIG’s research activities such as Earth’s Magnetosphere, Plasmasphere, Seismometer, etc were exhibited along with illustrating posters to create scientific awareness in common public including school/college students. The IIG participants at stall in DST pavilion and at solar telescope were constantly engaged in demonstrating the scientific models and their working principles in a lucid manner so as to reach out to a large audience and create awareness in the common public. IIG also distributed science comic books and other literature to visitors. The participation and demonstration of IIG’s exhibits received huge applause and wide coverage in the national/local print and electronic media. The main attraction for students and common public was the Solar Telescope put up by the Institute. The students and public
at large could view the solar corona, sun spots, solar flares and prominences.
INDIA INTERNATIONAL SCIENCE FESTIVAL - 2017 HELD AT CHENNAI, TAMIL NADUMinistry of Science and Technology and the Ministry of Earth Sciences jointly held India International Science Festival (IISF) at Chennai from October 13-17, 2017. The Institute participated in IISF by putting up an exhibition of posters depicting the science of geomagnetism and allied fields and the impact it has on society. Solar telescope and different models were also put on display. The stall was visited by the Hon’ble Minister for Science and Technology and Earth Sciences, Dr. Harsh Vardhan, who lauded our displays and appreciated the work carried out by the Institute.
Praveen Gawali was invited as an expert at the Round Table meet on Mass Communication.
Chief Coordinator : R.V. Reddy
Coordinator : Mahendra Doiphode
Member : Nanda S. Shah
During the year, computer center has carried out various activities to provide uninterrupted internet and networking services to end users and some of them listed below.
• IIG HPC center: Using newly established HPC centre scientists in the simulation group has published about 5 scientific papers.
• Provided Internet, networking, email and website services to IIG staff members with minimum downtime.
• MATLAB software training sessions conducted for new research scholars and staff members on “tackling big data with matlab”.
• Installed DELL server at SGRC, Shillong to meet the high end computational needs of the scientific staff at SGRC. Also switch-over form current unstable low bandwidth broadband internet link to 10 MBPS NIC internet leased line connectivity is in final stage of commissioning at this center.
• Scientific community at IIG is using central storage facility provided by computer centre to store their
COMPUTER FACILITIES
important data sets on newly installed NSA setup. It is also planned to upgrade NSA storage capacity to meet increasing storage space requirements by scientific staff members under IIG data policy committee’s recommendations.
• The development of new IIG website is under final stage of development which will be hosted on NIC web hosting cloud to avoid downtime. It is also planned to avail NIC email services for more security.
• Successfully installed new latest s/w based active network components and also carried out passive network cabling works at H.Q. New Panvel campus as part of major network renovation plan. Also installed high end more secure firewall units to protect from various cyber threats.
• Carried out configuration of newly procured Video Conference (VC) setup at various locations of IIG.
• Participated in three video conference sessions as asked by DST with the newly procured VC setup.
• Computer centre provided all the technical support to administrative sections and scientific and computer s/w installation support for all the staff members.

6766 67
ANNUAL REPORT 2017-2018INDIAN INSTITUTE OF GEOMAGNETISM
SPECIAL EVENTS
LIBRARY AND DOCUMENTATION
Chief Coordinator : Ashwini K. Sinha
Coordinator : Smita Chandra
Members : Neetesh Dubey, A. Selvarajeshwari, B.I. Panchal
Library
The library was committed to meeting the needs of staff and students by providing timely user service, supporting research, learning and teaching, and ensuring that our facilities and services are accessible to everyone. The services were extended to outside users from universities and other organizations.
The library works closely with staff, scientists, students and researchers to ensure that our print and online collections align with learning, teaching and research activities of the institute. During the year, the library added books, e-books, reprints and conference papers on areas of research within the institute. Hindi books were also acquired. The library subscribes to online copies of all international journals. Hard copies of only the journals from Indian publishers were subscribed to. The library had an excellent usage statistics of the online library resources. It also procured documents on inter-library loan for its users and also provided documents to other libraries under this service. New students from across the country visited and used the library for their various project and/or internship work.
The library got new compactors for efficient storage of library material. All the bound volumes at Alibag were transferred to the headquarters and rearranged in the compactors. All the volumes given treatment for conservation were also stored in climate controlled environment in these compactors.
Metadata was regularly updated to the Institutional Repository (IR) and the contents of the IR being harvested by the National Digital Library (NDL) at IIT Kharagpur. Access to online resources to scientists and IIG centers and observatories was extended via the newly upgraded software RemoteXs. The library also implemented the QR code technology such that now the library OPAC is available to the library users from their mobile devices. The digitization of project reports is still going on at the library at our center at Tirunelveli. The library website further enhanced our services by provided access to all our resources, via the library website (http://library.iigm.res.in). Through the NKRC (library consortium of DST-CSIR laboratories), users have full text access to more than 20 publisher resources. Access to online copies of journals was given to all our observatories and centers via the RemoteXs.
Documentation
Documentation continued all the support services to the scientists and students. During the year, various work related to scanning and digitizing the Ph.D. thesis by our institute was accomplished. Other routine services like, rendering help in preparation of posters & brochures, editing of photographs, designing/ layout of institute publications and photography of magnetograms was also undertaken. Photography of the special events organized by the Institute during the event was also undertaken by this section. Another important task of this section is to ensure the proper functioning of CCTV cameras installed in the campus. This is very important as far as security issues are concerned and thus considerable amount of time goes into checking the intricacies of the same.
IMPRESS-2018 and Workshop on “Nonlinear Processes and Extreme Events in Earth and Space” on 21st February, 2018
Indian Institute of Geomagnetism organizes Inspiring the Minds of Post-graduates for Research in Earth and Space Sciences (IMPRESS) programme at one of its several research centres every year since its inception in the year 2014. The goal of IMPRESS is to attract, motivate and train young talent to undertake research in geomagnetism and allied fields. This year IMPRESS-2018 was organized at Panvel HQ from February 19-23, 2018. The students were exposed to the basics of solid earth geophysics,
lithosphere, exploration geophysics, plate tectonics and understanding of earthquakes. They were also made aware of Electrical Resistivity Technique, Magnetotelluric imaging and Archaeomagnetic and environmental magnetic studies of Lonar Impact Crater. Space weather which is current topic of research and has a bearing on the various technological systems was well received by the students. It was also emphasized that the coupling of Sun-Earth system is vital in understanding auroras and other phenomena such as equatorial plasma irregularities etc. The lab sessions gave firsthand experience on some of the instruments being used in our observatory set up. The three lab sessions gave

6968 69
ANNUAL REPORT 2017-2018INDIAN INSTITUTE OF GEOMAGNETISM
a good understanding of GPS, GNSS/TEC, Ionosonde, EM Induction Experiments, Resistivity Methods, Gravity Magnetics and Environmental Magnetism.
Prof. B.T. Tsurutani delivering a scientifi c lecture during IMPRESS 2018
Participants of the IMPRESS 2018 Training Program attending lectures at IIG
As customary, this year also Institute hosted one day workshop on “Nonlinear Processes and Extreme Events in Earth and Space” on February 21, 2018 at Panvel campus. During the workshop, distinguished researchers from Earth System Science presented their works on topics relevant to the theme of the workshop which immensely benefited and enthused the young students attending IMPRESS. Prof. B. Buti gave a keynote address and she along with Prof Abhijit Sen chaired the sessions. Incidentally, the one day workshop coincided with the 75th Birth Anniversary year of Prof. G. S. Lakhina who made immense and enduring contributions to the area of Magnetosphere Dynamics & Space Weather. On this joyous occasion Prof. G. S. Lakhina was befittingly honoured and felicitated.
Lighting the traditional lamp by dignitaries during the one-day workshop on “Nonlinear Processes and Extreme Events in Earth and
Space” on February 21, 2018 at Panvel campus.
Prof. G.S. Lakhina addressing the gathering during the one-day workshop on “Nonlinear Processes and Extreme Events in
Earth and Space”.
Prof. G.S. Lakhina being felicitated during the one-day workshop on “Nonlinear Processes and Extreme Events in Earth and Space”.

6968 69
ANNUAL REPORT 2017-2018INDIAN INSTITUTE OF GEOMAGNETISM
IIG Staff Welfare and Recreation Club organized IIG’s 45th
Annual Day celebration on April 1. During the morning session Director IIG presented a brief report of the Institute’s activities and achievements. Prof. S.K. Tandon, Adjunct Professor, Department of Earth and Environmental Sciences, IISER Bhopal, was the Chief Guest during the function. He delivered the Foundation Day lecture on “Journey into Space: Exploration of the surface environments of Mars and the search for life”. Staff members who completed 25 years of dedicated service were presented a memento and a certificate of appreciation by the Chief Guest. Employees contributing a major portion of their official work in Hindi were also felicitated by the Chief Guest.
Dr. D.S. Ramesh, Director, welcoming Prof. S.K. Tandon, Chief Guest during the IIG Foundation Day.
Chief Guest Prof. S.K. Tandon delivering the Foundation Day lecture.
Chief Guest Prof. S.K. Tandon presenting the long service award to staff members
Cultural function performed by Research Scholars, Staff, and their family members were the highlight of the afternoon session. Celebrations for the day concluded with the Director handing over prizes to the winners of sporting
IIG STAFF WELFARE AND RECREATION CLUB

7170 71
ANNUAL REPORT 2017-2018INDIAN INSTITUTE OF GEOMAGNETISM
events organized during the months from January to March 2017. The Club accomplished in making the Annual Day 2017 a successful event.
Cultural performance by staff members during IIG Foundation Day.
President of IIG Staff Welfare & Recreation Club, giving away prizes for the various competitions held during IIG Foundation Day celebrations.
During the year, a talk was arranged on November 30, 2017, titled “You are a Blue Diamond” by Dr. (Mrs.) Roopali Deshpande Walujkar. She talked at length about the gratitude and achievements of happiness.
As every year, the club organized Dussehra Pooja and Rangoli competition was organized for the members.
Annual General Body Meeting of the Club was held on December 15, 2017, which transacted all the business of the agenda in a genial manner.
Every year the Club encourages and honors the children of the staff members who pass with good marks in the 10th and 12th Class board examination. This year six children were honored on behalf of the Club.
The Club Library bought magazines and newspapers for the benefit of the staff during the year.
The Club, on behalf of the Institute, bid farewell on superannuation to Shri B.D. Kadam on May 31, 2017, and Dr. Arun Hanchinal on December 31, 2017.
The club continued to provide recreational facilities to staff members during the allotted time. The co-operation and support extended by staff is gratefully acknowledged.
STAFF WELFARE MEASURES
Various staff welfare measure, such as, visit of a Resident Doctor twice a week, transport facilities from the nearest railway station, Benevolent Fund Scheme, Canteen facility etc. were provided to the staff members. Hindi and Marathi magazines and books were made available for the staff.
The Internal Complaint Committee (ICC) is in force at IIG. This committee meets every quarter to discuss issues related to the safety and security of the female employees.
The Vililance Awareness pledge was observed from October 30, 2017. Director IIG administered the oath to all staff members. The theme this year was “My Vision- Corruption Free India”.
Institute observed a ortnight of “Cleanliness drive” of its campus, residential complexes, laboratories, office and other installation facilities from September 15 to September 29, 2017. To commensurate this occasion a Pledge taking ceremony was organized in the Institute on September 20, 2017. Director, IIG administered the oath to all the staff members of the institute.
The Annual General Meeting of the IIG Employees Benevolent Fund Scheme was held on December 15, 2017 at IIG HQ, Panvel.

7170 71
ANNUAL REPORT 2017-2018INDIAN INSTITUTE OF GEOMAGNETISM
CITIZEN CHARTER
Information / suggestion on the functioning of the Institute can be obtained / given by the public. The following nodal officers have been nominated for this purpose:
Central Public Information Officer (CPIO):
Prof. R. V. Reddy, (Professor G)Indian Institute of GeomagnetismPlot No. 5, Sector-18New Panvel (W), Navi Mumbai-410218MaharashtraTel.:022- 27484019Fax: 022-27480762E-mail:[email protected]
Appellate Authority:
Prof. S. Gurubaran, (Professor G)Indian Institute of GeomagnetismPlot No. 5, Sector-18New Panvel (W), Navi Mumbai-410218MaharashtraTel.:022-27484227Fax: 022-27480762E-mail:[email protected]
RESERVATION POLICY
The Institute has been implementing the reservation policy of the Govt. of India from time to time.
STAFF PROFILE
Academic ● 41 * 41
Technical ● 84 * 71
Administration ● 41 * 34
Maintenance ● 11 * 09● Sanctioned staff strength* Staff strength as on March 31, 2018
ACTION TAKEN NOTE ON AUDITORS REPORT
No serious adverse comments have been received. However, replies to some of the observations made are appended with the Audit Report of the Institute for the year 2017–2018.
MOBILIZATION OF RESOURCES
The Institute has been constantly making endeavors to mobilize resources by extending its scientific and technical expertise to organizations like ISRO, DRDO, AAI etc and by selling magnetic data to outside organizations. During the year 2017–2018, the Institute received funds for carrying out the objectives of various sponsored projects. The gains from sponsored projects in terms of academic activity are immense.
The Instrumentation section has got a provisional Indian patent The Instrumentation section has got a provisional Indian patent no. 201621021949 dated June 27, 2016 in the name of Indian Institute of Geomagnetism entitled: “A low cost proton precession magnetometer”, S. M. Labde, A. G. Patil, P. K. Mahavarkar, S. K. Narkhede, V. J. Jacob, V. Y. Dhapre, S.Singh, V. C. Dongre
CORPORATE SOCIAL RESPONSIBILITIES


7372 73
ANNUAL REPORT 2017-2018INDIAN INSTITUTE OF GEOMAGNETISM
geomagnetism and allied areas, new initiatives have been taken by IIG, such as ‘Inspiring Minds of Post-graduates for Research in Earth and Space Sciences’ (IMPRESS) and Dr. Nanabhoy Moos Post-Doctoral Fellowship to research scientists.
Under the Science Outreach program, the Institute promotes several scientifi c exhibitions for students and its faculty and students participate in several state and national level scientifi c expositions every year.
In summary, signifi cant progress has been made towards the scientifi c objective of understanding the geophysical processes, including the Sun-Earth interactions. However, at the same time, the studies carried out have opened up many new scientifi c questions and challenges that need to be addressed, especially, in the areas of space weather and geo-seismic phenomena, which can have potential implications for the modern society and technological systems.

PB74 PB
ANNUAL REPORT 2017-2018INDIAN INSTITUTE OF GEOMAGNETISM
Copyright © 2022 FDOKUMEN