Conservation of Human Microsatellites across 450 Million Years of Evolution
13
Conservation of Human Microsatellites across 450 Million Years of Evolution Emmanuel Buschiazzo* ,1,2 and Neil J. Gemmell 1,3 1 School of Biological Sciences, University of Canterbury, Christchurch, New Zealand 2 Present address: Department of Forest Science, University of British Columbia, 2424 Main Mall, Vancouver, BC, Canada V6T1Z4 3 Present address: Centre for Reproduction and Genomics, Department of Anatomy and Structural Biology, University of Otago, PO Box 913, Dunedin 9054, New Zealand *Corresponding author: E-mail: [email protected]. Accepted: 2 February 2010 Associate editor: Kateryna Makova Abstract The sequencing and comparison of vertebrate genomes have enabled the identification of widely conserved genomic elements. Chief among these are genes and cis-regulatory regions, which are often under selective constraints that promote their retention in related organisms. The conservation of elements that either lack function or whose functions are yet to be ascribed has been relatively little investigated. In particular, microsatellites, a class of highly polymorphic repetitive sequences considered by most to be neutrally evolving junk DNA that is too labile to be maintained in distant species, have not been comprehensively studied in a comparative genomic framework. Here, we used the UCSC alignment of the human genome against those of 11 mammalian and five nonmammalian vertebrates to identify and examine the extent of conservation of human microsatellites in vertebrate genomes. Out of 696,016 microsatellites found in human sequences, 85.39% were conserved in at least one other species, whereas 28.65% and 5.98% were found in at least one and three nonprimate species, respectively. An exponential decline of microsatellite conservation with increasing evolutionary time, a comparable distribution of conserved versus nonconserved microsatellites in the human genome, and a positive correlation between microsatellite conservation and overall sequence conservation, all suggest that most microsatellites are only maintained in genomes by chance, although exceptionally conserved human microsatellites were also found in distant mammals and other vertebrates. Our findings provide the first comprehensive survey of microsatellite conservation across deep evolutionary timescales, in this case 450 Myr of vertebrate evolution, and provide new tools for the identification of functional conserved microsatellites, the development of cross-species microsatellite markers and the study of microsatellite evolution above the species level. Key words: comparative genomics, multiple alignment, tandem repeats, vertebrates, mammals. Introduction Microsatellites are arrays of short, tandemly repeated, DNA motifs (1–6 bp) found throughout the genomes of both pro- karyotes and eukaryotes (Buschiazzo and Gemmell 2006). Their distribution and density in genomes appear to be non- random but can vary greatly even between closely related species (To ´ th et al. 2000; Warren et al. 2008). Polymorphism at microsatellite loci occurs through additions and deletions of motifs in the repeat array, but the detailed dynamics of microsatellite mutation are still not fully understood (Bu- schiazzo and Gemmell 2006). Microsatellites have gained notoriety in medical genetics with evidence of association with colorectal, endometrial, and various other cancers (Woerner et al. 2006), and the implication of unstable re- peats in ;30 human hereditary disorders (Mirkin 2007). Other microsatellites, in contrast, are thought to play an ad- vantageous role in evolution (Kashi and King 2006; Vinces et al. 2009). However, microsatellites have attracted the widest interest as polymorphic, neutral genetic markers for population genetics, gene mapping, forensics, or pater- nal investigation (Schlo ¨ tterer 2004). Being traditionally regarded as neutrally evolving, non- functional and highly polymorphic sequences, microsatel- lites are not expected to be retained in different species, particularly when evolutionary distance increases. This view is supported by the relative difficulty to transfer micro- satellite markers between distant species, which severely limits cross-species applications in molecular ecology ª The Author(s) 2010. Published by Oxford University Press on behalf of the Society for Molecular Biology and Evolution. This is an Open Access article distributed under the terms of the Creative Commons Attribution Non-Commercial License (http://creativecommons.org/licenses/by-nc/2.5), which permits unrestricted non-commercial use, distribution, and reproduction in any medium, provided the original work is properly cited. Genome Biol. Evol. 2:153–165. doi:10.1093/gbe/evq007 Advance Access publication February 8, 2010 153 GBE by guest on April 4, 2016 http://gbe.oxfordjournals.org/ Downloaded from
-
Upload
independent -
Category
Documents
-
view
1 -
download
0
Transcript of Conservation of Human Microsatellites across 450 Million Years of Evolution

Conservation of Human Microsatellites across 450 MillionYears of Evolution
Emmanuel Buschiazzo*,1,2 and Neil J. Gemmell1,3
1School of Biological Sciences, University of Canterbury, Christchurch, New Zealand2Present address: Department of Forest Science, University of British Columbia, 2424 Main Mall, Vancouver, BC, Canada V6T1Z43Present address: Centre for Reproduction and Genomics, Department of Anatomy and Structural Biology, University of Otago, PO Box 913,
Dunedin 9054, New Zealand
*Corresponding author: E-mail: [email protected].
Accepted: 2 February 2010 Associate editor: Kateryna Makova
Abstract
The sequencing and comparison of vertebrate genomes have enabled the identification of widely conserved genomic
elements. Chief among these are genes and cis-regulatory regions, which are often under selective constraints that promote
their retention in related organisms. The conservation of elements that either lack function or whose functions are yet to beascribed has been relatively little investigated. In particular, microsatellites, a class of highly polymorphic repetitive sequences
considered by most to be neutrally evolving junk DNA that is too labile to be maintained in distant species, have not been
comprehensively studied in a comparative genomic framework. Here, we used the UCSC alignment of the human genome
against those of 11 mammalian and five nonmammalian vertebrates to identify and examine the extent of conservation of
human microsatellites in vertebrate genomes. Out of 696,016 microsatellites found in human sequences, 85.39% were
conserved in at least one other species, whereas 28.65% and 5.98%were found in at least one and three nonprimate species,
respectively. An exponential decline of microsatellite conservation with increasing evolutionary time, a comparable distribution
of conserved versus nonconserved microsatellites in the human genome, and a positive correlation between microsatelliteconservation and overall sequence conservation, all suggest that most microsatellites are only maintained in genomes
by chance, although exceptionally conserved humanmicrosatellites were also found in distantmammals and other vertebrates.
Our findings provide the first comprehensive survey of microsatellite conservation across deep evolutionary timescales, in
this case 450 Myr of vertebrate evolution, and provide new tools for the identification of functional conserved microsatellites,
the development of cross-species microsatellite markers and the study of microsatellite evolution above the species level.
Key words: comparative genomics, multiple alignment, tandem repeats, vertebrates, mammals.
Introduction
Microsatellites are arrays of short, tandemly repeated, DNA
motifs (1–6 bp) found throughout the genomes of both pro-
karyotes and eukaryotes (Buschiazzo and Gemmell 2006).
Their distribution and density in genomes appear to be non-
random but can vary greatly even between closely related
species (Toth et al. 2000; Warren et al. 2008). Polymorphism
at microsatellite loci occurs through additions and deletionsof motifs in the repeat array, but the detailed dynamics of
microsatellite mutation are still not fully understood (Bu-
schiazzo and Gemmell 2006). Microsatellites have gained
notoriety in medical genetics with evidence of association
with colorectal, endometrial, and various other cancers
(Woerner et al. 2006), and the implication of unstable re-
peats in ;30 human hereditary disorders (Mirkin 2007).
Other microsatellites, in contrast, are thought to play an ad-
vantageous role in evolution (Kashi and King 2006; Vinces
et al. 2009). However, microsatellites have attracted the
widest interest as polymorphic, neutral genetic markers
for population genetics, gene mapping, forensics, or pater-
nal investigation (Schlotterer 2004).
Being traditionally regarded as neutrally evolving, non-
functional and highly polymorphic sequences, microsatel-
lites are not expected to be retained in different species,
particularly when evolutionary distance increases. This
view is supported by the relative difficulty to transfer micro-
satellite markers between distant species, which severely
limits cross-species applications in molecular ecology
ª The Author(s) 2010. Published by Oxford University Press on behalf of the Society for Molecular Biology and Evolution.
This is an Open Access article distributed under the terms of the Creative Commons Attribution Non-Commercial License (http://creativecommons.org/licenses/by-nc/2.5),
which permits unrestricted non-commercial use, distribution, and reproduction in any medium, provided the original work is properly cited.
Genome Biol. Evol. 2:153–165. doi:10.1093/gbe/evq007 Advance Access publication February 8, 2010 153
GBE by guest on A
pril 4, 2016http://gbe.oxfordjournals.org/
Dow
nloaded from
(Barbara et al. 2007). However, not only have these assump-tions never been thoroughly tested, they run counter to the-
oretical expectations (Tachida and Iizuka 1992; Stephan and
Kim 1998) and direct observation of microsatellite conserva-
tion in closely related species (Schlotterer et al. 1991; Blanquer-
Maumont andCrouauroy 1995; Primmer et al. 1996; Gemmell
et al. 1997; Crawford et al. 1998; Slate et al. 1998; Guillemaud
et al. 2000; Gonzalez-Martınez et al. 2004), as well as spe-
cies that diverged 100þMYA (FitzSimmons et al. 1995; Ricoet al. 1996; Ezenwa et al. 1998; Moore et al. 1998). Unfor-
tunately, these reports have thus far been limited to one or
few loci, whereas genomewide searches for homologous
human microsatellites have to date been limited to compar-
isons with chimpanzee (Kayser et al. 2006; Vowles and
Amos 2006; Kelkar et al. 2008) or other close primate rel-
atives (Raveendran et al. 2006). In response to the lack of
both comprehensiveness and evolutionary scope in prioranalyses of microsatellite conservation, it is timely to develop
a reliable method to identify, at the genome scale, human
microsatellites conserved in mammals and beyond.
Recently, genome sequence projects have dramatically in-
creased in number and evolutionary breadth, providing the
opportunity to advance our understanding of the organiza-
tion, evolution, and functional landscape of eukaryotic ge-
nomes, as was emphasized by the recent findings of theENCODE Project Consortium (Gerstein et al. 2007; King
et al. 2007; The ENCODE Project Consortium 2007; Thurman
et al. 2007). In particular, comparative methods have been
developed to predict evolutionarily conserved and/or func-
tional sequences (Margulies and Birney 2008) not only
amongmammalian genomes (Waterston et al. 2002; Cooper
et al. 2005; Lindblad-Toh et al. 2005; Mikkelsen et al. 2007)
but also among more distant vertebrates, including avian,amphibian, and fish species (Siepel et al. 2005; Venkatesh
et al. 2006; Loots and Ovcharenko 2007). The comparative
method of choice to identify human conserved elements re-
lies on the statistical prediction of constrained segments in
pairwise and multiple sequence alignments (Cooper et al.
2005; Siepel et al. 2005; Prabhakar et al. 2006); but is this
method applicable to any type of DNA sequence? Unfortu-
nately, using current algorithms, microsatellite sequencesdo not align well and, at first sight, might resemble sequen-
ces with no common ancestry; the above statistical ap-
proach, which assumes a ‘‘perfect’’ alignment (Margulies
and Birney 2008), is thus inappropriate for microsatellites.
An alternative approach, applied in recent studies of hu-
man–chimpanzee comparisons (Kayser et al. 2006; Vowles
and Amos 2006; Kelkar et al. 2008), is to identify all micro-
satellites in each genome and find homologies by compar-ing positions in a pairwise whole-genome alignment.
Although efficient, this task may become impractical when
many genomes are compared and probably disproportion-
ate when dealing with highly divergent species that are
not expected to share many microsatellite sequences
(e.g., human and chicken). We instead sought to narrowour investigation down to a subset of genomic sequences
already aligned to each other and thus likely to contain
the subset of conserved microsatellites. The publicly avail-
able alignment of the human genome against 16 vertebrate
genomes, namely, 17-way alignment (17-WA), provided
a timely framework to investigate the extent and patterns
of conservation of human microsatellites.
Our proposed approach has already been briefly intro-duced in the recent analysis of the platypus genome using
an alignment of six vertebrate genomes (Warren et al.
2008), but here we present the detailed methodology
and analysis of human microsatellite conservation across
vertebrate genomes representing 450Myr of evolution. This
work offers clues to explain the wide conservation of micro-
satellites, assesses the reliability of our findings, and provides
the first opportunity to discuss the implications and applica-tions of conserved microsatellites in evolutionary genomics
and genetics. Indeed, in addition to providing new lines to
explain genome organization and evolution and the func-
tion of microsatellites within genomes, our efforts will im-
prove the prospects of transferring microsatellite markers
between related species to promote comparative genemap-
ping (Sun and Kirkpatrick 1996), cutting the development
costs of de novo microsatellites (Barbara et al. 2007), andthe opportunity to study microsatellite evolution above
the species level (Zhu et al. 2000; Kelkar et al. 2008).
Materials and Methods
Vertebrate Sequences
The 17-WA available on the University of California in Santa
Cruz (UCSC) Genome Browser for each human chromo-
some was downloaded by anonymous FTP from ftp://
hgdownload.cse.ucsc.edu/goldenPath/hg18/multiz17way/.
Multiple alignment format blocks were extracted and
converted to FASTA format using a stand-alone version of
Galaxy (Giardine et al. 2005). Due to the large size of the
alignments for chromosomes 1–4, the files were split in half;this had no consequence except that an additional step to
merge results for each respective chromosome was re-
quired. Sequence gaps were removed using the degapseq
module from the EMBOSS 5.0 package (Rice et al. 2000).
Microsatellite Search and Classification
Our approach aimed at 1) using a fast, flexible, reproducible,
and user-friendly program and 2) finding perfect and imper-
fect microsatellites, with a repeating motif of size 1–6 bpand no shorter than 12 bp for mono-, di-, tri- and tetranu-
cleotide repeats and three perfect repeats for penta- and
hexanucleotide repeats. Perfect and imperfect microsatel-
lites (motif length: 1–6 bp) were searched in ungapped se-
quences using SciRoKo 3.1 (Kofler et al. 2007) with fixed
Buschiazzo and Gemmell GBE
154 Genome Biol. Evol. 2:153–165. doi:10.1093/gbe/evq007 Advance Access publication February 8, 2010
by guest on April 4, 2016
http://gbe.oxfordjournals.org/D
ownloaded from

penalty parameters (score: 12, mismatch penalty: 4, simplesequence repeat [SSR] seed minimum length: 3, SSR seed
minimum repeats: 3, maximum mismatches at once: 3).
Genomic intervals of microsatellites in each vertebrate
genomewere recorded with block number, standardized re-
peat motif (Kofler et al. 2007), array length, and number of
imperfections. Microsatellites in the alignment of the Y
chromosome were not included in analyses because only
human, chimp, and mouse Y chromosomes are includedin the 17-WA (but see supplementary table S3, Supplemen-
taryMaterial online). Humanmicrosatellites lying in segmen-
tal duplications .1 kb and .90% identity (Bailey et al.
2001) and nonhuman overlapping intervals (5 bp minimum
cutoff), indicating those sites that aligned to human dupli-
cated segments, were removed. Indeed, every alignment
block in the 17-WA represents one, and only one, human
interval, but the same nonhuman interval can be assignedto one or more human intervals. Intervals overlapping with
repeats other than simple repeats or low-complexity se-
quence (Smit et al. unpublished data) were also discarded.
Segmental duplication and repeat data were retrieved from
the UCSC Table Browser (Karolchik et al. 2003).
We classifiedmicrosatellites as simple, compound, linked,
and mixed loci. If the sequence 25 bp upstream and down-
stream of a microsatellite interval did not contain anothermicrosatellite, the microsatellite was classified as ‘‘simple.’’
Microsatellite segments were merged and classified as
‘‘compound’’ if they were 5 bp or less apart from each other
or were overlapping by 5 bp or less, ‘‘linked’’ if they were
separated by 5–25 bp, or ‘‘mixed’’ if they contained both
linked and compound portions. This classification is neces-
sary because complex structures ought to be considered as
individual microsatellites rather than several independentloci: 1) complex microsatellites tend to evolve differently
(Buschiazzo and Gemmell 2006; Kofler et al. 2008), 2)
a considerable fraction of microsatellites (3–25%) are part
of a compound structure in vertebrate genomes (Kofler
et al. 2008), and 3) to ensure that two neighboring micro-
satellites were separated by at least 25 bp of ‘‘unique’’ se-
quence, a sufficient length to design a potential primer for
future comparative polymerase chain reaction (PCR)-basedanalysis. This series of operations produced, in human,
a data set of 696,016 microsatellites covering 19.5 Mb
of the human genome (0.70% of human sequences in
the 17-WA).
Microsatellite Conservation
Positions of nonhuman microsatellites were converted to
the hg18 human assembly using the liftOver utility and chain
files (Kent et al. 2003) available at the UCSC Genome
Browser (Karolchik et al. 2003). Converted intervals overlap-
ping with human repeats other than simple or low-complex-
ity repeats were discarded. The fraction of human
microsatellites overlapping with any of the converted micro-satellite positions indicated conserved sites. We found
594,340 human microsatellites conserved in at least one
species, that is, 85.0% of the initial data set.
G 1 C composition
We classified microsatellites conserved in at least one non-
primate species according to the Gþ C composition of their
standardized motif as given in SciRoKo’s output (Kofler et al.
2007). G þ C-rich motifs were characterized by a G þ Ccontent .50%, whereas A þ T-rich motifs and AT 5 GC
motifs were characterized by a G þ C content ,50%
and equal to 50%, respectively. For practicality, repeat seg-
ments forming compound, linked, andmixed microsatellites
were treated as individual microsatellites for this analysis.
Genomic Location
A tentative canonical list of 17,260 nonoverlapping human
nuclear genes was produced from the UCSC Genome
Browser and used to locate humanmicrosatellites conservedin coding exons, 3#-untranslated regions (UTRs), 5#-UTRs,introns, or intergenic regions (IGRs). Conserved microsatel-
lites spanning more than one element were positioned in
the element with the longest overlap. When an equal over-
lap existed, we positioned the microsatellite following the
preferential order given above.
Statistical Analyses
Genomic features were based on annotations of human au-
tosomes obtained from the UCSC Genome Browser and
were calculated in 1 Mb windows using Galaxy. Densities
of microsatellites were based on sequence length excluding
segmental duplications and repeats, unless stated other-wise. Windows with low-sequence coverage and high con-
tent of repeats and segmental duplications were excluded
(i.e., windowswith.70%of their length annotated as gaps
and segmental duplications and windows with .90% of
their length annotated as gaps, segmental duplications,
and repeats). Again, these repeats do not include low com-
plexity or simple repeats. This treatment excluded 233 win-
dows out of 2,857. We considered smaller window sizes(500 kb and 250 kb) but selected 1 Mb windows as only
a negligible number of these contained no microsatellite
conserved in at least three nonprimate species (23 out of
2,624 windows). Spearman’s rank-order correlation tests
were performed using the R package (www.r-project.org).
Method Assessment
To assess the validity of the identified conserved microsatel-
lites, we compared their positions with regions previously
found to be suspiciously aligned in the 17-WA of human
chromosome 1 using a statistical assessment (Prakash and
Conservation of Human Microsatellites GBE
Genome Biol. Evol. 2:153–165. doi:10.1093/gbe/evq007 Advance Access publication February 8, 2010 155
by guest on April 4, 2016
http://gbe.oxfordjournals.org/D
ownloaded from

Tompa 2007). Any conserved microsatellite overlappingwith regions identified as suspiciously aligned may be con-
sidered suspicious too.
Results
Alignability to the Human Genome
The UCSC team produced the 17-WA blocks using the hu-
man genome as reference (supplementary table S1, Supple-mentary Material online); the end result is therefore not an
all-against-all genome alignment. For this reason, our results
ought to be presented from the human perspective too. Be-
sides, the organization of the human genome and its align-
ability to other genomes ought to be made explicit to fully
comprehend our results.
The alignable and unique fraction of the human genome,
that is, the fraction studied here, represented only;37% ofits total length and was fairly heterogeneous between chro-
mosomes (supplementary table S2, Supplementary Material
online). Chromosomes 18 and 13were highly represented in
the 17-WA (42.26% and 41.72%, respectively), whereas X,
19, 22, and 16 had the lowest representations (28.42%,
30.14%, 33.43%, and 34.17%, respectively). The origin
of this disparity is essentially interchromosomal differences
in 1) the amount of gaps in the sequence, mostly a result ofhigh heterochromatin content, 2) content of segmental du-
plications and repeats, 3) other genomic features that may
affect microsatellite distribution, for example, gene density,
and 4) sequence alignability with other genomes (supple-
mentary fig. S1, Supplementary Material online).
As expected, there was a negative relationship between
the size of sequence aligned to the human genome (align-
ability) and both the phylogenetic distance from human toeach comparison species and times of divergence from the
common ancestor (supplementary table S1, Supplementary
Material online), and this relationship was found to be best
explained by an exponential decline (R2 5 0.9581 and R2 50.9625, respectively). We nevertheless found large differen-
ces in alignability between species more closely related to
one another than to human. than to human. For example,
the relatively low amount of human sequence aligned to themouse genome (;37%) compared with the dog and cow
genome (;57% and 51%, respectively) reflects the well-
known higher rate of sequence evolution and large dele-
tions occurring in the rodent lineage, probably a reflection
of short generation time (Waterston et al. 2002; Lindblad-
Toh et al. 2005).
Microsatellite Survey
Mining microsatellites in genomic sequences is not a trivial
task; the chosen approach and resulting data set largely de-
pend on the underlying objectives of the research (Merkel
and Gemmell 2008). Our methodology was developed to
look for all orthologous microsatellites for which PCRprimers could be potentially designed in supposedly unique
genomic sequences for downstream cross-species applica-
tions, for example, comparative mapping, population ge-
netics of nonmodel species, and study of interspecies
microsatellite evolution.
Our initial set of human microsatellites (HMs) comprised
a total of 696,016 microsatellites (supplementary tables S2
and S3, Supplementary Material online), including 11.35%with complex structures (compound, linked, or mixedmicro-
satellites). Based on total ungapped length of chromo-
somes, HM density appeared particularly homogeneous
among human autosomes (249.3 ± 10.6 HM/Mb) but the
X chromosome exhibited a lower density (207.1 HM/Mb).
Conversely, when densities were based on the length of un-
gapped sequences free of segmental duplications and re-
peats to account for the previously mentioned differentialrepresentation of each chromosome in the unique fraction
of the alignment, the overall picture was comparably het-
erogeneous (495.7 ± 37.2 HM/Mb): chromosomes 19,
16, 20, X, and 22 showed a relative increase in HM density
(639.18; 550.47; 512.55; 535.14; and 508.92 HM/Mb, re-
spectively), whereas chromosomes 13 and 18 showed
a slight decrease (470.54 and 474.41 HM/Mb, respec-
tively). This second measure of density compared favorablywith chromosomal differences found in a genomewide
scan of human microsatellites (Subramanian et al. 2003)
and confirmed that the HM data set, which we refer to
as our background distribution, represented well the over-
all distribution of microsatellites in the human genome.
We compared microsatellite abundance in every ge-
nome relative to that of HMs (fig. 1A and supplementary
table S2, Supplementary Material online) and found pro-portions ranging from 87.88% in chimpanzee to 15.52%
in opossum for mammals and to 1.24% in fugu for verte-
brates. These results are positively correlated with the
amount of sequence aligned in each species (Spearman’s
rank correlation, q 5 0.89, P , 0.0001) and are thus also
dependent on phylogenetic distance from human.
By measuring the ratio of the percentage of microsatel-
lite abundance to the percentage of human sequence thataligns to each genome, we also obtained an indication of
whether sequences from each species were enriched or im-
poverished for microsatellites compared with human se-
quences (fig. 1B). Rather than following a phylogenetic
trend, this ratio demonstrated species-specific enrichment.
Microsatellites were especially enriched in mouse, ele-
phant, and dog, whereas sequences from armadillo, frog,
and fugu were particularly depleted in microsatellites incomparison with the human genome. These differences
may be caused by species-specific microsatellite birth
and death events (Buschiazzo and Gemmell 2006) and/
or by the species-specific nature of alignable sequences.
Our enrichment results are concordant with independent
Buschiazzo and Gemmell GBE
156 Genome Biol. Evol. 2:153–165. doi:10.1093/gbe/evq007 Advance Access publication February 8, 2010
by guest on April 4, 2016
http://gbe.oxfordjournals.org/D
ownloaded from

analyses of whole-genomemicrosatellite coverage in mouse,
dog, opossum, and chicken (Waterston et al. 2002; Warren
et al. 2008), thus we would favor the former hypothesis.
Phylogenetic Extent of Conserved HumanMicrosatellites in Vertebrate Genomes
We define our conserved microsatellites as single-copy, or-thologous arrays of short tandem repeats, regardless of the
specific nature of their primary sequence, that are found in
genomic regions that similar to the human genome in one or
several species that they could be aligned with the BlastZ/
MULTIZ algorithms (Schwartz et al. 2003; Blanchette
et al. 2004) used to construct the UCSC 17-WA (supplemen-
tary fig. S2, Supplementary Material online).
Of 696,016 microsatellites identified in human aligned
sequences, 594,340 (85.39%) were found to be conserved
in at least one comparison species, whereas 199,403
(28.65%) and 41,608 (5.98%) were conserved in atleast one and three nonprimate species, respectively (sup-
plementary table S3, Supplementary Material online). The
fraction of conserved human microsatellites decreased from
FIG. 1.—Species-specific microsatellite enrichment. (A) Alignability to the human genome and conservation of human microsatellites in vertebrate
species. (B) Scatter plot showing the ratio (rp) of percentage of microsatellite conservation to percentage of alignment relative to human. Dotted lines
represent a 5% significance threshold. Species are arranged from left to right by increasing distance (substitution rate) from human (Miller et al. 2007).
Conservation of Human Microsatellites GBE
Genome Biol. Evol. 2:153–165. doi:10.1093/gbe/evq007 Advance Access publication February 8, 2010 157
by guest on April 4, 2016
http://gbe.oxfordjournals.org/D
ownloaded from
87.74% (521,476) in chimpanzee to 1.71% (10,140) in
opossum for mammals and to 0.16% (961) in fugu for ver-
tebrates (supplementary table S2, Supplementary Material
online). These results demonstrate a much higher extent
of microsatellite conservation than previously found in
mammals (Moore et al. 1998) but still illustrate an overall
dramatic decline of human microsatellite conservation
across vertebrates. In fact, we found that microsatellite con-
servation decayed exponentially with increasing phyloge-
netic distance from human (fig. 2A). It can be argued
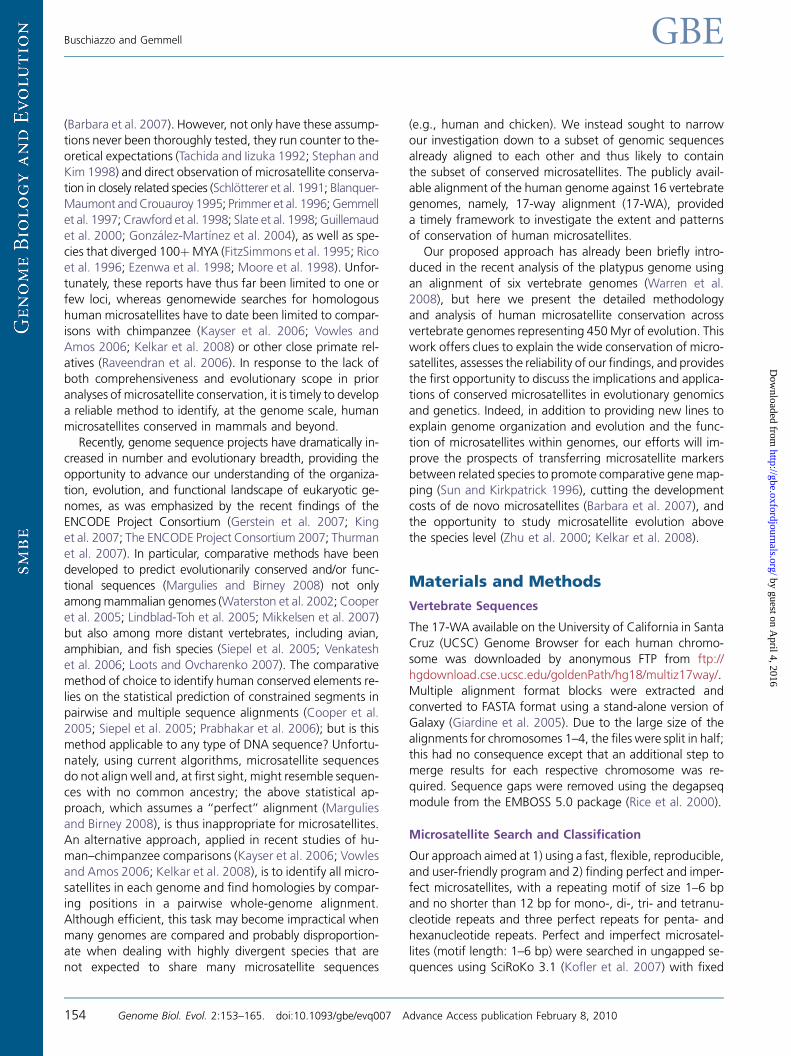
FIG. 2.—Phylogenetic extent of conservation of human microsatellites. (A) Decay of conservation in different genomic locations as a function of
phylogenetic distance from human (Miller et al. 2007). Microsatellite conservation is measured as the fraction of human microsatellites identified in the
alignedportion of thehumangenome that is found conserved in at least oneother species. Scatter plots for totalmicrosatellites andmicrosatellites in introns
and intergenic regions (IGR) overlay. (B) Conservation profiles of humanmicrosatellites in vertebrate genomes. Each profile is a proportional distribution of
the range of conservation of human microsatellites conserved in at least each of the species, from exclusive (1 species, leftmost bar) to wide (12 species,
rightmost bar). Each bar thus represents a percentage of humanmicrosatellites that fall in each range category, for each species, and bars of identical range
add up to 100%.Nomicrosatellitewas found in 13 species and only one in all 14 species. Species are arranged from left to right by increasing branch length
from human (Miller et al. 2007). Primates were excluded to allow the observation of differences among species distantly related to human.
Buschiazzo and Gemmell GBE
158 Genome Biol. Evol. 2:153–165. doi:10.1093/gbe/evq007 Advance Access publication February 8, 2010
by guest on April 4, 2016
http://gbe.oxfordjournals.org/D
ownloaded from
that measuring the fraction of conserved humanmicrosatel-
lites using absolute numbers of microsatellites may be bi-
ased by the amount of aligned sequences, which were
shown above to decline exponentially over time. Substitut-
ing microsatellite densities for raw numbers of microsatel-
lites may well resolve this potential issue. However, if
microsatellite conservation strictly follows alignability, andbased on the analysis of the 28-WA (Miller et al. 2007),
we would expect a much slower rate of exponential decay
of microsatellite conservation in coding sequences than that
pictured in figure 2A. Therefore, we believe that our use of
absolute numbers, while inducing a potential bias, likely has
little impact on the interpretation of the data.
To explore patterns of microsatellite conservation further,
we examined the proportion of human microsatellites con-served within species subsets (fig. 2B). A profile skewed to
the left indicates a species that shares microsatellites rela-
tively exclusively with human, whereas a profile skewed
to the right indicates a species that mostly shares microsa-
tellites that are broadly conserved. Under a neutral model of
evolution, these scenarios would be typical of species that
are respectively closer (e.g., dog) and more distant (e.g., ze-
brafish) to human. Figure 2B shows that this expectation isin relatively good agreement with our observations, with in-
termediate stages between the two extremes. In fact, only
species with a mere 2X coverage did not perfectly fit with
this general pattern, for example, armadillo, the closest spe-
cies to human if 4-fold degenerate site substitutions are
used to measure phylogenetic distance, revealed a flat con-
servation profile instead of the expected skew to the left.
We believe, however, that profiles from 2X covered ge-
nomes are not complete and that any premature interpre-
tation should therefore be avoided.
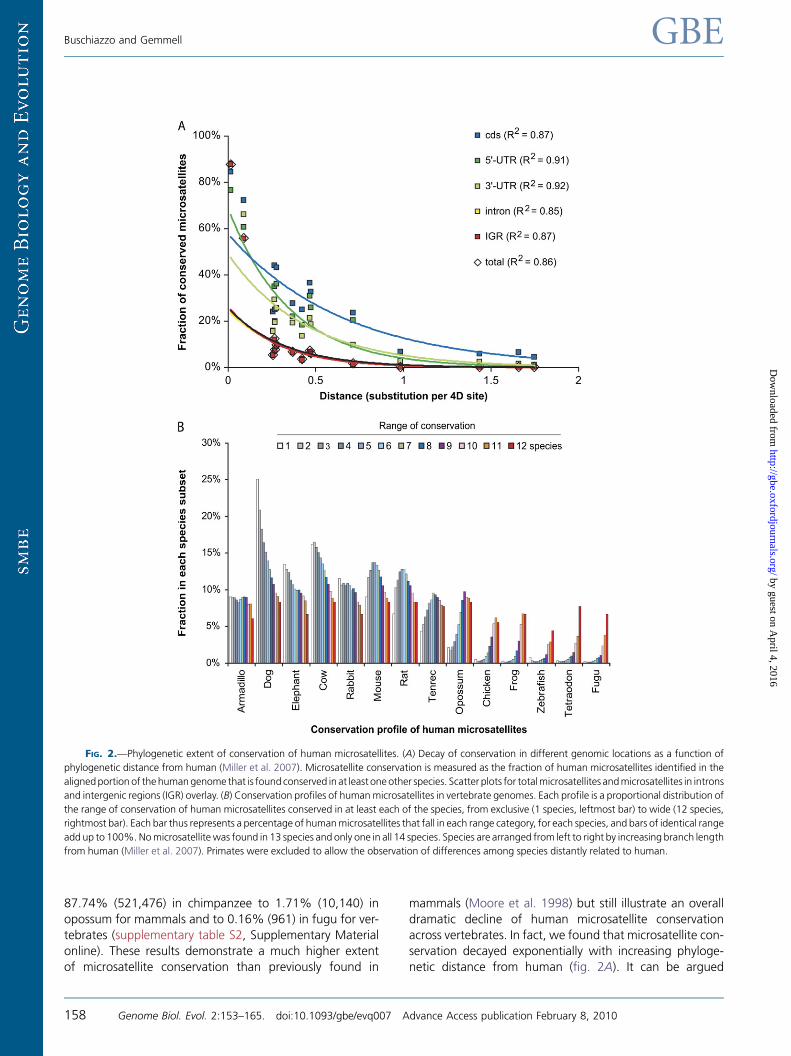
Interchromosomal Distribution of Human ConservedMicrosatellites
Wesoughtto investigatewhethertherewasanypatterninthedistribution and extent of microsatellite conservation at the
chromosome level by counting microsatellites conserved in
increasing number of species. As expected, therewas a rapid
decline of conserved microsatellites with increasing species
number, regardless of the chromosome examined (fig. 3).
We found it pertinent to compare HMs abundance with
numbers of microsatellites conserved in 1) at least one of all
16 species (human conserved microsatellites [HCMs]), 2) atleast one of the nonprimate species (NPMs), and 3) at least
three of the nonprimate species (NP3Ms). At the genome
scale, the three inclusive subsets represented 85.39%,
28.65%, and 5.98% of the initial data set, respectively (sup-
plementary table S2 and supplementary fig. S3, Supplemen-
tary Material online).
At the chromosome level, proportions of HCMs com-
pared with HMs were strikingly homogeneous (84.28–86.61%) with the exception of chromosomes 19, X, and
22 (77.10%, 78.86%, and 82.13%). Accordingly, the align-
ability of human chromosomes 19 and X was the lowest
among eutherian genomes, especially primate genomes
that contain most microsatellites in the HCM data set
(66.45%) and thus influence greatly the overall HCM distri-
bution (supplementary fig. S4, Supplementary Material on-
line). When primate-specific microsatellites (PSMs) were
FIG. 3.—Distribution of human microsatellites conserved in nonprimates species. The number of species is color coded as indicated in the legend.
Conservation of Human Microsatellites GBE
Genome Biol. Evol. 2:153–165. doi:10.1093/gbe/evq007 Advance Access publication February 8, 2010 159
by guest on April 4, 2016
http://gbe.oxfordjournals.org/D
ownloaded from

excluded, proportions of NPMs were more heterogeneous
among human chromosomes (25.44–30.68%), althoughchromosome 19 still showed a distinctively low proportion
(22.07%). When NP3Ms only were considered, interchro-
mosomal differences in the extent of human microsatellites
were manifest (4.13–8.09%) and did not follow previous
observations, for example, chromosome 19 had a compara-
tively average proportion of microsatellites conserved in at
least three nonprimate species (5.71%). Yet again, these re-
sults might be caused by the uneven alignability of humanchromosomes to other genomes: chromosome 19was com-
paratively highly represented in species distant to human,
that is, in opossum but especially in nonmammalian verte-
brates (supplementary fig. S4, Supplementary Material on-
line), a likely explanation for the relatively higher proportion
of NP3M conservation. Chromosomes 1, 11, 15, 16, 17, and
22 also showed high representation in distant species and
high proportion of NP3M, whereas chromosomes 4 and 13showed the contrary dispositions.
Overall, our results of interchromosomal distribution of
conserved microsatellites showed that the distribution of
conserved microsatellites broadly corresponded to the over-
all distribution of aligned, hence conserved, genomic se-
quences and suggested that a finer scale analysis of
microsatellite distribution in relation to other genomic ele-
ments, such as genes, would help understand why micro-satellites in different chromosomes were differentially
maintained in genomes. Indeed, it is striking that gene den-
sity is highest in highly aligned chromosomes, whereas chro-
mosomes 4 and 13 share the lowest densities with
chromosome 18. In addition, the former group contained
proportionally more NPMs in exons than the latter group
(supplementary fig. S5, Supplementary Material online).
Megabase Distribution of Human MicrosatelliteConservation
We sought to inspect what could drive the distribution of
conserved microsatellites at a finer scale than the chromo-
somes level, which may help understanding the causes of
microsatellite conservation in genomes.We first compared density of human microsatellites
(HMs) in 1 Mb windows of autosomes with densities of hu-
man microsatellites conserved in at least one other species
(HCMs), in primates only (PSMs), in nonprimate species
(NPMs), and in at least three nonprimate species (NP3Ms).
We found a general positive correlation between HM den-
sity and densities of all sets of conserved microsatellites
(table 1 and supplementary fig. S6, Supplementary Materialonline), although the statistical significance was weaker
for NPMs and especially NP3Ms, which suggests that a num-
ber of megabase segments contain a higher than usual
proportion of widely conserved microsatellites.
We further carried out these comparisons relative to se-
quence composition (G þ C content), genomic elements
(gene density and repeat coverage), and four measures of
evolutionary change; two derived from the human genome(recombination rate and single nucleotide polymorphism
[SNP] density) and two derived from genomic comparisons
(coverage in conserved, ‘‘indel-purified,’’ intervals, viz. cIND
and density of conserved transcription factor binding sites,
viz. tfbsCons). Preliminary correlation analyses between
these factors confirmed results from previous analyses of
the human genome (e.g., Fullerton et al. 2001; Lander
et al. 2001): G þ C content covaried positively with genedensity, short interspersed repeat element (SINE) density,
and recombination rate but was inversely correlated with
long interspersed repeat element (LINE) and long terminal
repeat (LTR) density (supplementary table S4, Supplemen-
tary Material online). Table 1 shows correlations between
these genomic features and our microsatellite data sets.
As a whole, microsatellite densities were negatively corre-
lated with gene density, LINE, LTR, and recombinationand weakly associated with SINE coverage. The strongest
relationships (q . 0.40) appeared between microsatellites,
including the background HM data set and measures of se-
quence conservation (cIND and tfbsCons, supplementary
fig. S6, Supplementary Material online). A relatively strong
Table 1
Covariation between Human Microsatellites and Other Genomic Features
HM G þ C Gene SINE LINE LTR Rrecomb SNP cIND tfbs
HM — n.s. �0.22*** 0.11*** �0.37*** �0.26*** �0.33*** �0.05** 0.41*** 0.40***
HCM 0.98*** �0.07*** �0.25*** 0.14*** �0.32*** �0.24*** �0.31*** �0.09*** 0.45*** 0.42***
PSM 0.90*** �0.11*** �0.27** 0.17*** �0.28*** �0.12*** �0.26*** n.s. 0.16*** 0.15***
NPM 0.84*** n.s. �0.19*** 0.08*** �0.27*** �0.29*** �0.28*** �0.16*** 0.67*** 0.61***
NP3M 0.63*** 0.17*** 0.04* 0.15*** �0.35*** �0.41*** 0.25*** �0.23*** 0.74*** 0.75***
A þ T-rich — �0.33*** �0.38*** 0.24*** �0.04* �0.14*** �0.13*** �0.21*** 0.61*** 0.48***
G þ C-rich — 0.65*** 0.45*** 0.51*** �0.62*** �0.54*** 0.35*** �0.08*** 0.41*** 0.57***
AT 5 GC — n.s. �0.24*** 0.17*** �0.20*** �0.17*** �0.32*** �0.07*** 0.54*** 0.46***
NOTE. —Left to right: Density of microsatellites in aligned sequences (HM) and conserved in at least one species (HCM), primates only (PSM), and at least 1 (NPM) and 3 (NP3M)
nonprimate species; NPMs are also differentiated as A þ T-rich (motif G þ C content,50%), G þ C-rich (.50%), and AT5 GC (550%) (see Materials and Methods); G þ C content;
gene density; SINE, LINE and LTR coverage; average recombination rate; SNP density; indel-purified sequence coverage (cIND), and density of tfbsCons. Source: UCSC Genome
Browser. Spearman’s rank correlation factor q, P value significance: 0 , *** , 0.001 , ** , 0.01 , * , 0.05 , not significant (n.s.).
Buschiazzo and Gemmell GBE
160 Genome Biol. Evol. 2:153–165. doi:10.1093/gbe/evq007 Advance Access publication February 8, 2010
by guest on April 4, 2016
http://gbe.oxfordjournals.org/D
ownloaded from

relationship with the background distribution seems unex-pected but can be explained by our biased alignment ap-
proach, that is, microsatellites were scanned in sequences
known to possess some level of conservation; however,
the much larger significance found with NPMs and NP3Ms
(especially compared with PSMs) shows that widely con-
served microsatellites were mostly found in the vicinity of
other conserved sequences. This view is further supported
by the negative relationship found between SNP densityand both overall conservation and the most widely con-
served set of microsatellites (NP3Ms).
To explore whether the extent of microsatellite conserva-
tion was affected by Gþ C composition, we grouped NPMs
into G þ C-rich, A þ T-rich, and AT 5 GC microsatellites,
depending on whether G þ C content of the repeat motif
was superior, inferior, or equal to 50%, respectively. G þ C-
rich NPMs were found to cluster in G þ C-rich regions andwere therefore typically, though weakly, associated with
genes, SINEs, and high recombination rate and inversely cor-
related to LINE and LTR density (table 1). A þ T-rich NPMs
generally showed a contrary disposition and AT5 GC NPMs
generally showed an intermediate disposition, although
they had a weaker association to SINEs and recombination
rate than Aþ T-rich NPMs. Of the three data sets, Aþ T-rich
NPMs had the strongest negative relationship with SNP den-sity. At least for NPMs, it thus seemed that the G þ C com-
position of conserved microsatellites correlated with that of
the surrounding sequences. Due to low numbers and for
statistical purposes, we did not partition NP3Ms relative
to their G þ C composition, but an overall small association
with G þ C-rich regions (table 1) and an analysis of micro-
satellite composition in the different data sets (supplemen-
tary fig. S7, Supplementary Material online) showed that Aþ T-rich microsatellites were depleted in NP3Ms compared
with other data sets.
Genic Environment Influences MicrosatelliteConservation
When we looked at the distribution of human microsatel-
lites in coding exons, UTRs, introns, and IGRs that are con-served in each of the comparison species, the vast majority
of conserved microsatellites lied in nonexonic regions (sup-
plementary fig. S8, Supplementary Material online). The
proportions of microsatellites found in each genomic region
were fairly constant for microsatellites conserved in euther-
ians, with ;55–60% lying in IGRs of the human genome,
;35% in introns, and;5–10% in exons (UTRs and protein-
coding sequence) but varied considerably for microsatellitesconserved in more distant species. The decrease in conser-
vation was slower in exonic than nonexonic regions when
phylogenetic distance increased (fig. 2A), a pattern similar
to that of evolutionary conserved regions (ECRs, Loots
and Ovcharenko 2007). However, whereas Loots and
Ovcharenko (2007) observed that.75%of ECRs shared be-tween human and nonmammalian vertebrates were in cod-
ing regions, we found that at most 35% of conserved
microsatellites were in exonic regions (human–fugu compar-
ison). Although this figure might be underestimated due to
spurious alignments with distant vertebrates (see below), it
was anticipated in light of a well-known distribution bias of
microsatellites toward nonexonic regions of vertebrate
genomes (Toth et al. 2000).Overall, though, conservation of microsatellites in coding
exons declinedmore slowly than conservation of microsatel-
lites in UTRs, which in turn declined more slowly than loci in
introns and IGRs, as illustrated in figure 2A.
The Reliability of Large-Scale Alignment andMicrosatellite Data Mining
Our results are only as accurate and reliable as the sequence
assemblies, the genomic alignments, and the microsatellite
search algorithm.
First, concordantwithourexperienceandpreliminary tests
(Merkel and Gemmell 2008), SciRoKo (Kofler et al. 2007)
has recently been recognized as a highly performing tool to
mine for perfect and imperfect microsatellites in genomic
sequences (Sharma et al. 2007). Although tolerating theidentification of rather short arrays, which could help docu-
ment the concept of microsatellite life cycle (Buschiazzo and
Gemmell 2006), our search parameters were purposely
conservative regarding purity: imperfect microsatellites that
maintained a clear repeat pattern were included, but low
complexity DNA and overdegenerated repeat sequences
were ignoredwith no need for additional filtering of spurious
sequences.Second, coverage and accuracy, that is, extent of se-
quence gaps and errors, of the genomic assemblies available
at the time and used to produce the UCSC 17-WA are vari-
able (supplementary table S1, Supplementary Material on-
line). In particular, the alignment contains four mammalian
genome assemblies with a 2X depth coverage, namely rab-
bit, armadillo, elephant, and tenrec, which may significantly
increase the amount of false negatives in our results. Ac-cording to the Lander and Waterman (1988) formula,
a 2X assembly should include 87.5% of the bases in the ge-
nome and a 5X assembly 99.4% (Miller et al. 2007). Al-
though high coverage of every genome would clearly be
preferable, increasing the available branch length with
low-coverage assemblies still considerably improves the ac-
curacy of multiple genome alignments (Margulies et al.
2006; Wong et al. 2008) and of the identification of shortconserved elements (Eddy 2005) and therefore improves our
analysis.
The UCSC 17-way and chain alignments are the third and
arguably the most critical (Wong et al. 2008) source of po-
tential inaccuracies and missing data in our results. This is
Conservation of Human Microsatellites GBE
Genome Biol. Evol. 2:153–165. doi:10.1093/gbe/evq007 Advance Access publication February 8, 2010 161
by guest on April 4, 2016
http://gbe.oxfordjournals.org/D
ownloaded from

caused by 1) erroneous or missing genomic sequences (seeabove), 2) the methodological difficulties to produce a true
alignment for sequences generated from highly diverged
species (Kumar and Filipski 2007), and 3) the phylogenetic
tree used to construct the 17-WA that differ slightly from
the most recent understanding of evolutionary relationships
between the compared species (Miller et al. 2007). Also, un-
like the recently updated 28-way and 44-way alignments,
the generation of the 17-WA did not include filtering of pair-wise alignments based on synteny (for high-quality mamma-
lian sequences) and reciprocal best alignments (for 2X
mammalian genomes). Because these advances were pub-
lished only in the latest phase of this work, we rather sought
to assess the accuracy of our results post hoc. The accuracy
of the 17-WA has recently been estimated through statisti-
cal inference of sequences suspiciously aligned to human
chromosome 1 (Prakash and Tompa 2007). The authors es-timated that BlastZ/MULTIZ algorithms performed well, with
9.7% (21 Mb) of chromosome 1 identified as suspiciously
assigned. Using their data, we worked out the proportion
of HCMs identified in these suspiciously aligned sequences
(supplementary fig. S9, Supplementary Material online). Re-
sults ranged from 0% (chimpanzee) to 52% (tetraodon). As
expected, we observed a positive trend between the pro-
portion of microsatellites found to be ‘‘suspiciously con-served’’ in each species and sequence divergence, hence
phylogenetic distance from human. There were less than
5% of human microsatellites in suspiciously aligned euthe-
rian sequences, just over 10% in opossum and over 18% in
nonmammalian sequences.
We chose to leave in our final data set all microsatellites
found in suspicious alignments because only suspicious
alignments to human chromosome 1 have been identifiedto date.
Discussion
Microsatellites comprise ;3–5% of mammalian genomes
(Warren et al. 2008), but little is known about their biolog-
ical significance in comparison with other genomic ele-
ments, and there is still an incomplete understanding ofmicrosatellite mutational dynamics. Despite these shortfalls
and a limited success in cross-species transfer (Barbara et al.
2007), microsatellites have beenwidely employed as genetic
markers for almost two decades. There is therefore an ob-
vious need for comprehensive surveys of microsatellite con-
servation to help explore their evolution, transferability
between species, possible functionality, and eventually un-
derstand their place in genomes, which will aid our generalunderstanding of how genomes are organized.
Here, we present the first comprehensive analysis of hu-
man microsatellite conservation in vertebrate genomes.
Drawing on the UCSC alignment of the human genome
against the genomes of 11 mammals and five nonmamma-
lian vertebrate species, we were able to find all human mi-crosatellites that were conserved above the species, genus,
group, or even family level. Our findings therefore signifi-
cantly extend the scope of previous reports of microsatellite
conservation and the sporadic identification of microsatel-
lites conserved above the genus level in mammals (e.g.,
Schlotterer et al. 1991; Moore et al. 1998) and other verte-
brate species (e.g., FitzSimmons et al. 1995; Rico et al.
1996).We found that of 696,016 microsatellites identified in
aligned human sequences, 85.39% were conserved in at
least one other species, 28.65% in at least one nonprimate
species, and 5.98% in at least three nonprimate species. On
the whole, this decline of conservation appeared exponen-
tial as a function of evolutionary distance and did not nec-
essarily always depend on time of divergence alone.
Although the exponential decline of microsatellite conserva-tion is consistent with random sequence loss (Miller et al.
2007) and thus supports the general view that most micro-
satellites evolve neutrally and would therefore be main-
tained only by chance, interpretation of such general
trends is not trivial. Not only have we introduced a bias
by using a human-centered alignment but the ability to
tease out the dynamics of birth and death of microsatellites
along the different lineages, which ultimately dictate micro-satellite conservation between taxa, is missing. Should these
limitations be overcome in the future with the development
of a solid statistical framework, it will be possible to under-
stand at a global scale the evolutionary trends of microsa-
tellite retention in genomes rather than be limited to the
study of individual loci.
We also found that the genomic distribution of conserved
microsatellites, either at the chromosome or megabaselevel, was fairly homogeneous regardless of the extent of
conservation, further supporting the neutral expectation
that most microsatellites are maintained by chance. How-
ever, highly conserved microsatellites (NP3Ms) had a slightly
different distribution (table 1), with megabase portions of
the human genome containing substantially more of these
microsatellites than average, providing clues that at least
some microsatellites are not randomly maintained. Thatthe decline of G þ C-rich and exonic microsatellites was
found to occur more slowly than that of the abundant
and mutation-prone A þ T-rich and nonexonic microsatel-
lites is yet another line of evidence to support a nonneutral
retention of some microsatellites in vertebrate genomes.
Certainly future research should endeavor to find those mi-
crosatellites that do not follow the neutral expectation.
Overall, we believe that our method is a robust and rapidapproach for identifying human microsatellites conserved in
mammals, especially in eutherians, but will suffer from badly
aligned sequences when applied tomore distant vertebrates
(supplementary fig. S9, Supplementary Material online). We
recommend that these results be viewed as a preliminary
Buschiazzo and Gemmell GBE
162 Genome Biol. Evol. 2:153–165. doi:10.1093/gbe/evq007 Advance Access publication February 8, 2010
by guest on April 4, 2016
http://gbe.oxfordjournals.org/D
ownloaded from

attempt to characterize microsatellites conserved in non-mammalian vertebrates and, only with particular care, be
used for interpretations stemming from comparisons of in-
complete 2X covered genomes.
These findings raise questions as to why microsatellites
might be conserved in distant species, and why microsatel-
lites in different genomic locations are maintained to differ-
ent extents. First, some regions of mammalian genomes are
more ‘‘flexible,’’ enduring many substitutions and insertionsover time, whereas other regions are more ‘‘rigid’’ and ac-
cumulate fewer mutations (Chiaromonte et al. 2001).
Therefore, microsatellites located in constrained regions
might be passively, but highly, maintained. This is concor-
dant with our finding that highly conserved microsatellites
showed both a much stronger association with other con-
served genomic elements and a stronger negative relation-
ship with SNP density than PSMs.In addition, some microsatellite sequences may well be
actively maintained. Coding microsatellites may be subject
to purifying selection as they might be important for protein
structure and protein–protein interactions (Hancock and
Simon 2005) or to indirect selection as a source of adaptive
evolution (Wren et al. 2000; Fondon and Garner 2004; Riley
and Krieger 2009a). In 3#-UTRs, some microsatellites have
been shown to be selected for their folding potential ratherthan their primary sequence (Riley et al. 2007). Although it is
not clear what the function of most nonexonic microsatel-
lites is, there is clear evidence that at least some are acting as
regulators of gene expression (Kashi and King 2006; Vinces
et al. 2009), suggesting that noncodingmicrosatellites could
also be indirectly selected for mutability. Indeed, the genetic
variation provided by microsatellites may be advantageous
and may vary (and evolve) independently from otherwiselow average nucleotide substitution rates (Kashi and King
2006). Conserved microsatellites therefore provide exciting
possibilities to help single out those loci that may be actively
selected for functionality, but there might be a need for fur-
ther data and theoretical developments (i.e., statistical tests)
to reliably distinguish between mere retention (neutral) and
active conservation (selection).
Conserved microsatellites are a boon for the explorationof the mutation dynamics of microsatellites above the spe-
cies level, an approach that has been rarely used to date (Zhu
et al. 2000; Kelkar et al. 2008). In particular, further inves-
tigation is needed to tease out structural changes among
orthologous microsatellites, for example, how compound
structures arise in genomes (Kofler et al. 2008), whether
there are motif changes (Riley et al. 2007; Riley and Krieger
2009b), and whether there are interspecies and intraspeciesvariations in length and/or mutability (Laidlaw et al. 2007;
Kelkar et al. 2008). Moreover, as a consequence of the com-
plexity and heterogeneity of microsatellite mutational dy-
namics, there is to date no theoretical development to
estimate the life expectancy, thus the turnover, of microsa-
tellites above the species level (Stephan and Kim 1998). Wehave demonstrated elsewhere that there is a strong phylo-
genetic signal in microsatellite loci conserved in vertebrate
genomes (Buschiazzo and Gemmell 2009), therefore our
data set could be fundamental for such developments
and the characterization of microsatellite birth and death
rates. Finally, polymorphic conserved microsatellites prove
particularly useful to develop and implement transferable
PCR primers (Vanpe et al. 2009). Indeed, one disadvantageof microsatellites as genetic markers is that cross-species
studies needs substantial preparation (Barbara et al.
2007); provided that priming sites are also conserved be-
tween species of interest, conserved microsatellites over-
come this limitation and are therefore an invaluable
resource for cross-species applications in population genet-
ics, comparative molecular ecology, and gene mapping.
Supplementary Material
Supplementary figures S1–S9 and supplementary tables S1–
S4 are available at Genome Biology and Evolution online
(http://www.oxfordjournals.org/our_journals/gbe/).
Acknowledgments
Help from V. Mencl was crucial to optimize our computa-
tional work at the University of Canterbury Supercomputing
facility. A. Bagshaw, D. King, R. Kofler, K. Makova, R. Sainu-
diin, J. Tylianakis, and I. Vargas-Jentzsch provided sugges-tions to improve the analyses and/or the manuscript.
Genomic intervals of suspicious alignments were kindly pro-
vided by H. Prakash andM. Tompa. This workwas supported
by a Royal Society of New Zealand Marsden grant (UOC 202
to N.J.G.).
Literature CitedBailey JA, et al. 2001. Segmental duplications: organization and impact
within the current human genome project assembly. Genome Res.
11:1005–1017.
Barbara T, et al. 2007. Cross-species transfer of nuclear microsatellite
markers: potential and limitations. Mol Ecol. 16:3759–3767.
Blanchette M, et al. 2004. Aligning multiple genomic sequences with
the threaded blockset aligner. Genome Res. 14:708–715.
Blanquer-Maumont A, Crouauroy B. 1995. Polymorphism, monomor-
phism, and sequences in conserved microsatellites in primate
species. J Mol Evol. 41:492–497.
Buschiazzo E, Gemmell NJ. 2006. The rise, fall and renaissance of
microsatellites in eukaryotic genomes. Bioessays. 28:1040–1050.
Buschiazzo E, Gemmell NJ. 2009. Evolutionary and phylogenetic
significance of platypus microsatellites conserved in mammalian
and other vertebrate genomes. Aust J Zool. 57:175–184.
Chiaromonte F, et al. 2001. Association between divergence and
interspersed repeats in mammalian noncoding genomic DNA. Proc
Natl Acad Sci U S A. 98:14503–14508.
Cooper GM, et al. 2005. Distribution and intensity of constraint in
mammalian genomic sequence. Genome Res. 15:901–913.
Conservation of Human Microsatellites GBE
Genome Biol. Evol. 2:153–165. doi:10.1093/gbe/evq007 Advance Access publication February 8, 2010 163
by guest on April 4, 2016
http://gbe.oxfordjournals.org/D
ownloaded from

Crawford AM, et al. 1998. Microsatellite evolution: testing the
ascertainment bias hypothesis. J Mol Evol. 46:256–260.
Eddy SR. 2005. A model of the statistical power of comparative genome
sequence analysis. PLoS Biol. 3:e10.
Ezenwa VO, et al. 1998. Ancient conservation of trinucleotide micro-
satellite loci in polistine wasps. Mol Phylogenet Evol. 10:168–177.
FitzSimmons NN, Moritz C, Moore SS. 1995. Conservation and
dynamics of microsatellite loci over 300 million years of marine
turtle evolution. Mol Biol Evol. 12:432–440.
Fondon JW III, Garner HR. 2004. Molecular origins of rapid and
continuous morphological evolution. Proc Natl Acad Sci U S A. 101:
18058–18063.
Fullerton SM, Bernardo Carvalho A, Clark AG. 2001. Local rates of
recombination are positively correlated with GC content in the
human genome. Mol Biol Evol. 18:1139–1142.
Gemmell NJ, Allen PJ, Goodman SJ, Reed JZ. 1997. Interspecific
microsatellite markers for the study of pinniped populations. Mol
Ecol. 6:661–666.
Gerstein MB, et al. 2007. What is a gene, post-ENCODE? History and
updated definition. Genome Res. 17:669–681.
Giardine B, et al. 2005. Galaxy: a platform for interactive large-scale
genome analysis. Genome Res. 15:1451–1455.
Gonzalez-Martınez SC, et al. 2004. Cross-amplification and sequence
variation of microsatellite loci in Eurasian hard pines. Theor Appl
Genet. 109:103–111.
Guillemaud T, Almada F, Serrao Santos R, Cancela ML. 2000.
Interspecific utility of microsatellites in fish: a case study of (CT)nand (GT)n markers in the shanny Lipophrys pholis (Pisces: Blenniidae)
and their use in other Blennioidei. Mar Biotechnol (NY). 2:248–253.
Hancock JM, Simon M. 2005. Simple sequence repeats in proteins and
their significance for network evolution. Gene. 345:113–118.
Karolchik D, et al. 2003. The UCSC genome browser database. Nucleic
Acids Res. 31:51–54.
Kashi Y, King DG. 2006. Simple sequence repeats as advantageous
mutators in evolution. Trends Genet. 22:253–259.
Kayser M, Vowles EJ, Kappei D, Amos W. 2006. Microsatellite length
differences between humans and chimpanzees at autosomal loci are
not found at equivalent haploid Y chromosomal loci. Genetics.
173:2179–2186.
Kelkar YD, Tyekucheva S, Chiaromonte F, Makova KD. 2008. The
genome-wide determinants of human and chimpanzee micro-
satellite evolution. Genome Res. 18:30–38.
Kent WJ, et al. 2003. Evolution’s cauldron: duplication, deletion, and
rearrangement in the mouse and human genomes. Proc Natl Acad
Sci U S A. 100:11484–11489.
King DC, et al. 2007. Finding cis-regulatory elements using comparative
genomics: some lessons from ENCODE data. Genome Res. 17:
775–786.
Kofler R, Schlotterer C, Lelley T. 2007. SciRoKo: a new tool for whole
genome microsatellite search and investigation. Bioinformatics.
23:1683–1685.
Kofler R, Schlotterer C, Luschutzky E, Lelley T. 2008. Survey of
microsatellite clustering in eight fully sequenced species sheds light
on the origin of compound microsatellites. BMC Genomics. 9:612.
Kumar S, Filipski A. 2007. Multiple sequence alignment: in pursuit of
homologous DNA positions. Genome Res. 17:127–135.
Laidlaw J, et al. 2007. Elevated basal slippage mutation rates among the
Canidae. J Hered. 98:452–460.
Lander ES, et al. 2001. Initial sequencing and analysis of the human
genome. Nature. 409:860–921.
Lander ES, Waterman MS. 1988. Genomic mapping by fingerprinting
random clones: a mathematical analysis. Genomics. 2:231–239.
Lindblad-Toh K, et al. 2005. Genome sequence, comparative analysis
and haplotype structure of the domestic dog. Nature. 438:803–819.
Loots G, Ovcharenko I. 2007. ECRbase: database of evolutionary
conserved regions, promoters, and transcription factor binding sites
in vertebrate genomes. Bioinformatics. 23:122–124.
Margulies EH, Birney E. 2008. Approaches to comparative sequence
analysis: towards a functional view of vertebrate genomes. Nat Rev
Genet. 9:303–313.
Margulies EH, Chen CW, Green ED. 2006. Differences between pair-
wise and multi-sequence alignment methods affect vertebrate
genome comparisons. Trends Genet. 22:187–193.
Merkel A, Gemmell N. 2008. Detecting short tandem repeats from
genome data: opening the software black box. Brief Bioinform. 9:
355–366.
Mikkelsen TS, et al. 2007. Genome of the marsupial Monodelphis
domestica reveals innovation in non-coding sequences. Nature.
447:167–177.
Miller W, et al. 2007. 28-way vertebrate alignment and conservation
track in the UCSC Genome Browser. Genome Res. 17:1797–1808.
Mirkin SM. 2007. Expandable DNA repeats and human disease. Nature.
447:932–940.
Moore SS, Hale P, Byrne K. 1998. NCAM: a polymorphic microsatellite
locus conserved across eutherian mammal species. Anim Genet. 29:
33–36.
Prabhakar S, et al. 2006. Close sequence comparisons are sufficient to
identify human cis-regulatory elements. Genome Res. 16:855–863.
Prakash A, Tompa M. 2007. Measuring the accuracy of genome-size
multiple alignments. Genome Biol. 8:R124.
Primmer CR, Moller AP, Ellegren H. 1996. A wide-range survey of cross-
species microsatellite amplification in birds. Mol Ecol. 5:365–378.
Raveendran M, et al. 2006. Designing new microsatellite markers for
linkage and population genetic analyses in rhesus macaques and
other nonhuman primates. Genomics. 88:706–710.
Rice P, Longden I, Bleasby A. 2000. EMBOSS: the European Molecular
Biology Open Software Suite. Trends Genet. 16:276–277.
Rico C, Rico I, Hewitt G. 1996. 470 million years of conservation of
microsatellite loci among fish species. Proc R Soc Lond B Biol Sci.
263:549–557.
Riley DE, Jeon JS, Krieger JN. 2007. Simple repeat evolution includes
dramatic primary sequence changes that conserve folding potential.
Biochem Biophys Res Commun. 355:619–625.
Riley DE, Krieger JN. 2009a. Embryonic nervous system genes pre-
dominate in searches for dinucleotide simple sequence repeats
flanked by conserved sequences. Gene. 429:74–79.
Riley DE, Krieger JN. 2009b. UTR dinucleotide simple sequence repeat
evolution exhibits recurring patterns including regulatory sequence
motif replacements. Gene. 429:80–86.
Schlotterer C. 2004. The evolution of molecular markers—just a matter
of fashion? Nat Rev Genet. 5:63–69.
Schlotterer C, Amos B, Tautz D. 1991. Conservation of polymorphic
simple sequence loci in cetacean species. Nature. 354:63–65.
Schwartz S, et al. 2003. Human-mouse alignments with BLASTZ.
Genome Res. 13:103–107.
Sharma PC, Grover A, Kahl G. 2007. Mining microsatellites in eukaryotic
genomes. Trends Biotechnol. 25:490–498.
Siepel A, et al. 2005. Evolutionarily conserved elements in vertebrate,
insect, worm, and yeast genomes. Genome Res. 15:1034–1050.
Buschiazzo and Gemmell GBE
164 Genome Biol. Evol. 2:153–165. doi:10.1093/gbe/evq007 Advance Access publication February 8, 2010
by guest on April 4, 2016
http://gbe.oxfordjournals.org/D
ownloaded from

Slate J, et al. 1998. Bovine microsatellite loci are highly conserved in red
deer (Cervus elaphus), sika deer (Cervus nippon) and Soay sheep
(Ovis aries). Anim Genet. 29:307–315.
Smit A, Hubley R, Green P. Repeat-Masker Open-3.0. Available from:
http://www.repeatmasker.org (Data accessed from the UCSC Ge-
nome Browser Table in December 2007).
Stephan W, Kim Y. 1998. Persistence of microsatellite arrays in finite
populations. Mol Biol Evol. 15:1332–1336.
Subramanian S, Mishra RK, Singh L. 2003. Genome-wide analysis of
microsatellite repeats in humans: their abundance and density in
specific genomic regions. Genome Biol. 4:R13.
Sun HS, Kirkpatrick BW. 1996. Exploiting dinucleotide microsatellites
conserved among mammalian species. Mamm Genome.
7:128–132.
Tachida H, Iizuka M. 1992. Persistence of repeated sequences that
evolve by replication slippage. Genetics. 131:471–478.
The ENCODE Project Consortium. 2007. Identification and analysis of
functional elements in 1% of the human genome by the ENCODE
pilot project. Nature. 447:799–816.
Thurman RE, Day N, Noble WS, Stamatoyannopoulos JA. 2007.
Identification of higher-order functional domains in the human
ENCODE regions. Genome Res. 17:917–927.
Toth G, Gaspari Z, Jurka J. 2000. Microsatellites in different eukaryotic
genomes: survey and analysis. Genome Res. 10:967–981.
Vanpe C, et al. 2009. Development of microsatellite markers for the
short-beaked echidna using three different approaches. Aust J Zool.
57:219–224.
Venkatesh B, et al. 2006. Ancient noncoding elements conserved in the
human genome. Science. 314:1892.
Vinces MD, et al. 2009. Unstable tandem repeats in promoters confer
transcriptional evolvability. Science. 324:1213–1216.
Vowles EJ, Amos W. 2006. Quantifying ascertainment bias and species-
specific length differences in human and chimpanzee microsatellites
using genome sequences. Mol Biol Evol. 23:598–607.
Warren WC, et al. 2008. Genome analysis of the platypus reveals unique
signatures of evolution. Nature. 453:175–183.
Waterston RH, et al. 2002. Initial sequencing and comparative analysis
of the mouse genome. Nature. 420:520–562.
Woerner SM, Kloor M, von Knebel Doeberitz M, Gebert JF. 2006.
Microsatellite instability in the development of DNA mismatch repair
deficient tumors. Cancer Biomark. 2:69–86.
Wong KM, Suchard MA, Huelsenbeck JP. 2008. Alignment uncertainty
and genomic analysis. Science. 319:473–476.
Wren JD, et al. 2000. Repeat polymorphisms within gene regions:
phenotypic and evolutionary implications. Am J Hum Genet.
67:345–356.
Zhu Y, Queller DC, Strassmann JE. 2000. A phylogenetic perspective on
sequence evolution in microsatellite loci. J Mol Evol. 50:324–338.
Conservation of Human Microsatellites GBE
Genome Biol. Evol. 2:153–165. doi:10.1093/gbe/evq007 Advance Access publication February 8, 2010 165
by guest on April 4, 2016
http://gbe.oxfordjournals.org/D
ownloaded from