How To Compare One Million Images?
40
1/40 How to Compare One Million Images? Dr. Lev Manovich, Professor, Visual Arts Department, University of California, San Diego (UCSD). Director, Software Studies Initiative (softwarestudies.com ) at California Institute for Telecommunication and Information (Calit2). Dr. Jeremy Douglass, Post‐doctoral Researcher, Software Studies Initiative. Tara Zepel, Ph.D. candidate, Art History, Theory, & Criticism, UCSD. Exploring one million manga pages on the 287 megapixel HIPerSpace (The Highly Interactive Parallelized Display Space) at Calit2, San Diego. HIPerSpace offers 35,840 x 8,000 pixels resolution (287 megapixels) on 31.8 feet wide and 7.5 feet tall display wall made from 70 30‐inch monitors.
Transcript of How To Compare One Million Images?

1/40
HowtoCompareOneMillionImages?Dr.LevManovich,Professor,VisualArtsDepartment,UniversityofCalifornia,SanDiego(UCSD).Director,SoftwareStudiesInitiative(softwarestudies.com)atCaliforniaInstituteforTelecommunicationandInformation(Calit2).Dr.JeremyDouglass,Post‐doctoralResearcher,SoftwareStudiesInitiative.TaraZepel,Ph.D.candidate,ArtHistory,Theory,&Criticism,UCSD.
Exploringonemillionmangapagesonthe287megapixelHIPerSpace(TheHighlyInteractiveParallelizedDisplaySpace)atCalit2,SanDiego.HIPerSpaceoffers35,840x8,000pixelsresolution(287megapixels)on31.8feetwideand7.5feettalldisplaywallmadefrom7030‐inchmonitors.
2/40
INTRODUCTIONThedescriptionofjointNEH/NSFDiggingintoDatacompetition(2009)organizedbyOfficeofDigitalHumanitiesattheNationalEndowmentofHumanities(theU.S.federalagencywhichfundshumanitiesresearch)openedwiththesequestions:“Howdoesthenotionofscaleaffecthumanitiesandsocialscienceresearch?Nowthatscholarshaveaccesstohugerepositoriesofdigitizeddata—farmorethantheycouldreadinalifetime—whatdoesthatmeanforresearch?”Ayear,later,anarticleinNewYorkTime(November16,2010)stated:“Thenextbigideainlanguage,historyandthearts?Data.”Whiledigitizedarchivesofhistoricaldocumentscertainlyrepresentajumpinscaleincomparisontotraditionallysmallcorporausedbyhumanists,researchersandcriticsinterestedincontemporaryculturehaveevenalargerchallenge.WiththenotableexceptionofGoogleBooks,thesizeofdigitalhistoricalarchivespalesincomparisontothequantityofdigitalmediacreatedbycontemporaryculturalproducersandusers–designs,motiongraphics,websites,blogs,YouTubevideos,Flickrphotos,Facebookpostings,Twittermessages,andotherkindsofprofessionalandparticipatorymedia.Thisquantitativechangeisasatleastasimportantastheotherfundamentaleffectsofthepolitical,technologicalandsocialprocessesthatstartaftertheendoftheColdWar(forinstance,freelong‐distancemultimediacommunication).InanearlierarticleIdescribedthisinthefollowingway:Theexponentialgrowthofanumberofbothnon‐professionalandprofessionalmediaproducersoverthelastdecadehascreatedafundamentallynewculturalsituationandachallengetoournormalwaysoftrackingandstudyingculture.Hundredsofmillionsofpeopleareroutinelycreatingandsharingculturalcontent‐blogs,photos,videos,onlinecommentsanddiscussions,etc.Atthesametime,therapidgrowthofprofessionaleducationalandculturalinstitutionsinmanynewlyglobalizedcountriesalongwiththeinstantavailabilityofculturalnewsoverthewebandubiquityofmediaanddesignsoftwarehasalsodramaticallyincreasedthenumberofcultureprofessionalswhoparticipateinglobalculturalproductionanddiscussions.Before,culturaltheoristsandhistorianscouldgeneratetheoriesandhistoriesbasedonsmalldatasets(forinstance,"ItalianRenaissance,""classicalHollywoodcinema,"“post‐modernism,”etc.)Buthowcanwetrack"globaldigitalcultures",withtheirbillionsofculturalobjects,andhundredsofmillionsofcontributors?Beforeyoucouldwriteaboutculturebyfollowingwhatwasgoingoninasmallnumberofworldcapitalsandschools.Buthowcanwefollowthedevelopmentsintensofthousandsofcitiesandeducationalinstitutions?(Manovich,CulturalAnalytics,2009).Whiletheavailabilityoflargedigitizedcollectionsofhumanitiesdatacertainlycreatesthecaseforhumaniststousecomputationaltools,theriseofsocialmediaandglobalizationofprofessionalcultureleaveusnootherchoice.Buthowcanweexplorepatternsandrelationsbetweensetsofphotographs,designs,orvideo,whichmaynumberinhundredsofthousands,millions,orbillions?(Bysummer2010,Facebookcontained48billionphotos;deviantArt.com,theleadingsitefornon‐professionalart,housed100millionsubmissions;coroflot.com,asiteusedbyprofessionaldesignershad200,00portfolios.)In2007wehavesetupanewlabcalledSoftwareStudiesInitiative(http://www.softwarestudies.com)atUniversityofCalifornia,SanDiego(UCSD)andCaliforniaInstituteforTelecommunicationandInformation(Calit2)toaddressthesechallenges.Wedevelopedanumberofmethodsandtechniquesfortheanalysisandvisualizationoflargesetsofimages,video,andinteractivevisualmedia.Thisarticledescribesourkeymethodthatconsistsfromtwoparts:1)automaticdigitalimageanalysisthatgeneratesnumericaldescriptionsofvariousvisualcharacteristicsoftheimages;2)visualizationsthatshowthecompleteimagesetorganizedbythesedimensions.

3/40
Wehavealreadysuccessfullyappliedthismethodforresearchingmanytypesofvisualmedia:comics,webcomics,videogames,virtualworlds,video,films,cartoons,motiongraphics,printmagazines,paintings,andphotographs.Examplesinclude167,000imagesfromArtNowFlickrgroup,100hoursofKingdomHeartsvideogameplay,and20,000pagesofScienceandPopularSciencemagazines(1872‐1922).(Formoredetailsandotherprojects,seeDigitalHumanitiessectionofourlabbloghttp://www.softwarestudies.com;youcanalsofindourvisualizationsonYouTubeandFlickrathttp://www.flickr.com/photos/culturevis/collections/).Totesthowthismethodwouldworkwithlargerdatasets,intheFall2009wedownloadedthecompleterunsof883differentmangaseriesfromthemostpopularwebsitefor“scanlations”OneManga.com.(“Scanlation”referstotomangapublicationswhicharedigitizedandtranslatedbyfans.)Weobtainedallpagesavailablefortheseseriesalongwiththeuser‐assignedtagsindicatingthegenresandintendedaudiencesforthem(SeeDouglass,Huber,Manovich,UnderstandingScanlation).Theresultingdatasetcontains1,074,790mangapages.EachpageisintheformofaJPEGimage;averageimageresolutionis850x1150pixels.Weusedourcustomdigitalimageprocessingsoftwaretomeasureanumberofvisualfeaturesofeverypage(shading,presenceoffinedetails,textureproperties)usingsupercomputersattheNationalEnergyResearchScientificComputingCenter(NERSC).(A“feature”isthecommontermindigitalimageprocessing;itreferstoanumericaldescriptionofsomeimagepropertysuchasaveragegrayscalevalue,orthenumberoflines.Forthereadersfamiliarwithcomputationaltextanalysis:imagefeaturesarestructurallysimilartotextfeatures;theyofferacompactdescriptionofthedata.)Inthisarticleweusethechallengeofworkingwiththissetofonemillionmangapagestomotivatetheneedforacomputationalapproachfortheexplorationofcollectionsofsuchsize,andtoexplainourparticularmethodthatcombinesdigitalimageanalysisandanovelvisualizationtechnique.Anyreflectiononculturebeginswithaninformalcomparisonbetweenmultipleobjectsinordertounderstandtheirsimilaritiesanddifferences.Forinstance,ifwewantouranalysistoproperlyreflecttherangeofgraphicaltechniquesusedtodaybymangaartistsacrossthousandsofmangabooks,millionsofpagesinthesebooks,andtensofmillionsofindividualpanels,weneedtobeabletoexaminedetailsofindividualimagesandtofindpatternsofdifferenceandsimilarityacrosslargenumbersofimages.Todothis,weneedamechanismthatwouldallowustopreciselycomparesetsofimagesofanysize–fromafewdozenstomillions.Wediscusshowourmethod,whichcombinesautomaticdigitalimageanalysisandmediavisualization,addressestheserequirements.HOWTOCOMPAREONEMILLIONIMAGES?Today,atypicalpublicationinhumanitiesisbasedonthedetailedexaminationofasmallnumberofartifacts(which,dependingonthefieldcanbeliterarytexts,TVprograms,films,videogames,etc.Ofcourse,thisdoesnotmeanthattheauthoronlyconsideredtheseartifactsinisolation.Usuallythedetailedanalysisoftheseartifactsisperformedagainstthelargerhorizon‐theknowledgeofthewiderculturalfield(s)whichisacquiredbothdirectly(forinstance,watchingfilms)orindirectly(forinstance,readingpublicationinfilmstudies).Buthowreliableorcompleteisthisbackgroundknowledge?Forinstance,tocontinuewiththeexampleofcinema,IMDb(www.imdb.com)containsinformationforoverahalfamillionfilmsproducedsincethebeginningsofcinema;howmanyofthemwereseenbyacademicfilmscholarsandfilmcritics?(Thesamedatabaselists1,137,074TVepisodesasofsummer,2001;seeIMDbDatabaseStatistics).Thefactthatusingtinysampleshasbeenadefaultmethodofhumanitiesuntilnowdoesnotmeanthatweshouldkeepusingitbydefault.IfGooglecananalyzebillionsofwebpagesandoveratrillionlinksseveraltimeseachday,weshouldbeabletodobetterthansimplyconsiderahandful

4/40
ofartifactsandgeneralizefromthem–evenifwedon’thavethesameresources.ThekeyreasonforthehugeinfrastructuremaintainedbyGoogleistheneedtoindexthewebinrealtime;inthecaseofculturalanalysis,wedon’thavethesamerequirements,soweshouldbeabletoanalyzelargeculturaldatasetswithmuchsmallercomputerresources.Indeed,todaycomputerscientistswhostudyonlinesocialmediatypicallycaptureandanalyzedozensorhundredsofmillionsofseparateobjects‐photos,twitterupdates,blogposts,etc.‐withverysmallresources.(SeeCha,Kwak,Rodriguez,Ahn,Moon,ITube,YouTube,EverybodyTubes;Crandall,Backstrom,Huttenlocher,Kleinberg,Mappingtheworld'sphotos;Kwak,Lee,Park,Moon.WhatisTwitter?).Havingatourdisposalverylargeculturaldatasetswhichcanbeanalyzedautomaticallywithcomputersandexploredusinginteractiveinterfacesandvisualizationopensupexistingnewpossibilities.Thesepossibilitiescanpotentiallytransformourunderstandingofculturesinmanyimportantways.Insteadofbeingfuzzyandblurred,ourhorizon(knowledgeofaculturalfieldaswhole)canbecomerazorsharpandatthesametimeacquireanewdepth(beingabletosortandclustermillionsofartifactsalongmultipledimensions).Thiswouldenrichourunderstandingofanysingleartifactbecausewewouldseeitinrelationtopreciselydelineatedlargerpatterns.Itwouldalsoallowustomakemoreconfidentstatementsaboutthefieldatlarge.Perhapsmostimportantly,itwillerasethedistinctionbetweentheprecisionof“closereading”andimprecisionofa“zoomedout”view“–betweenadetailedunderstandingofafewworksandveryapproximateideasaboutthefieldasawholewhichwenormallyformbymentallyinterpolatingbetweenasmallnumberoffactsandartifactswestudied.Itwillalsoerasetheseparationbetween“closereading”(detailedanalysisofsmallpartsoftexts)andFrancoMoretti’s“distantreading”(asitiscommonlyunderstood‐whichisnotthesameashowMorettidefinesit–seehisConjecturesonWorldLiterature,2000):analysisoflargescalepatternsinthedevelopmentofentiregenres,literaryproductionofwholecountries,andthelikeusingawholenovelasanatomofanalysis(forinstance,countinganumberofnovelsindifferentgenrespublishedoverahistoricalperiod.)Ratherthanchoosingonescaleofanalysis,wewouldbeabletoeasilytraversebetweenallthematwill,observingpatternsatanyscale.Anyautomaticcomputationalanalysisoflargesamplesofhumancultureswillhavemanylimitationsofitsown,andthereforeitwillnotreplacehumanintuitionandexperience.However,whileweshouldkeepinmindthesevariouslimitations,theopportunitiesthatitoffersarestillimmense.Forexample,havingaccesstoamillionmangapagesshouldallowus,inprinciple,toprettyreliablymapthefullspectrumofgraphicalpossibilitiesusedbycontemporarycommercialJapanesemangaartists.Suchamappingwouldalsoallowustounderstandwhichmangaseriesaremosttypicalandwhicharemostuniquestylistically;tofindallserieswheregraphicallanguagesignificantlychangesovertime(todayalltopserieshavebeenrunningforanumberofyears);toinvestigateifshorterseriesandlongerserieshavedifferentpatterns;toseparatetheartistswhosignificantlyvarytheirgraphicallanguagesfromseriestoseriesfromtheartistswhodonot;etc.Wealsowouldbeabletotakeanyhypothesisorobservationwemaymakewhileinformallylookingthroughasmallsamplesofimages–forinstance,wemayobservethatthemangaaimedatdifferentgendersandagegroupshasdistinctgraphicallanguages–andseeifitholdsacrossourwholeset.Buthowcanweaccomplishthisinpractice?Howcanwepossiblycompareonemillionmangapages?WHATEYESCAN’TSEE1.Letusstartbyselectingonlytwopagesfromourmangaimagesetsetandexaminingthemdirectlywithoutanysoftwaretools.WewilltakethesepagesfromOnePieceandVampireKnightseries.Thefirstisoneofthebestsellingandtopratedshounen(teenageboys)manga;thesecondisamongthetopshoujo(teenagegirls)manga.

5/40
Leftimage:samplepagefromVampireKnight.Rightimage:samplepagefromOnePiece.AccordingtotheOneManga.comJune2010listoftop50seriestitlesaccessedbysiteusers,OnePiecewasno.2,whileVampireKnightwasno.13.Accordingtowww.icv2.com,duringQ32010,OnePiecewasno.2inJapan,andVampireKnightwasno.4.ThedifferenceinVampireKnightrankingislikelytoreflectdifferentproportionsofmale/femalemangareadersinsideandoutsideofJapan.
Wecancertainlynotemanykindsofstylisticdistinctionsbycomparingthesetwopages.Forinstance,wemayobservethatapagefromVampireKinightcontainsdramaticdiagonalanglescreatedbybothpaneldivisionsandlinesinsidethepanels,thefullpaletteofgreytonesfromwhitetogreytoblack;thelargeblacklettersrepresentingsoundsandcontributingadditionalvisualenergy.Incontrast,thepagefromOnePiecehasverylittleshading;thelineshavecurves;thepanelsareneatrectangles.However,howdoweknowifthesestylisticdistinctionsholdforallofthe10562OnePiecepagesand1423VampireKnightpageswhichwehaveavailable?Similarly,ifwewanttotalkaboutagraphicalstyleofanartistwhomayhaveproducedtensofthousandsofpagesacrossdozensoftitles,wouldselectingandexaminingafewdozenpagesbesufficient?Andwhatifwewanttocompareallshounenandshoujomangainourdataset?Howmanypagesshouldwepulloutfromeachofthesecategoriestoreachauthoritativeconclusionsaboutthepossibledifferenceintheirgraphicallanguages?
Hereisanotherexample.Let’ssaywewanttocompareOnePiecewithanotherhighlypopularshounen(teenageboys)manga:Naruto.Herearethetwosamplepagesfromthetwoseries.

6/40
Leftimage:samplepagefromNaruto.Rightimage:samplepagefromOnePiece.
Wecannoticecertaindifferencesingraphicalstylebetweenthesepages–buthowtypicalarethesedifferencesforallof10562OnePiecepagesand8037Narutopageswehaveavailable?Incontrasttothefirstexamplewherethestylesvarieddramatically,herethedifferencesaremoresubtle–whichmakesitevenmoreproblematictogeneralizewhatweseeinthesetwopagestothecompleteseries.
7/40
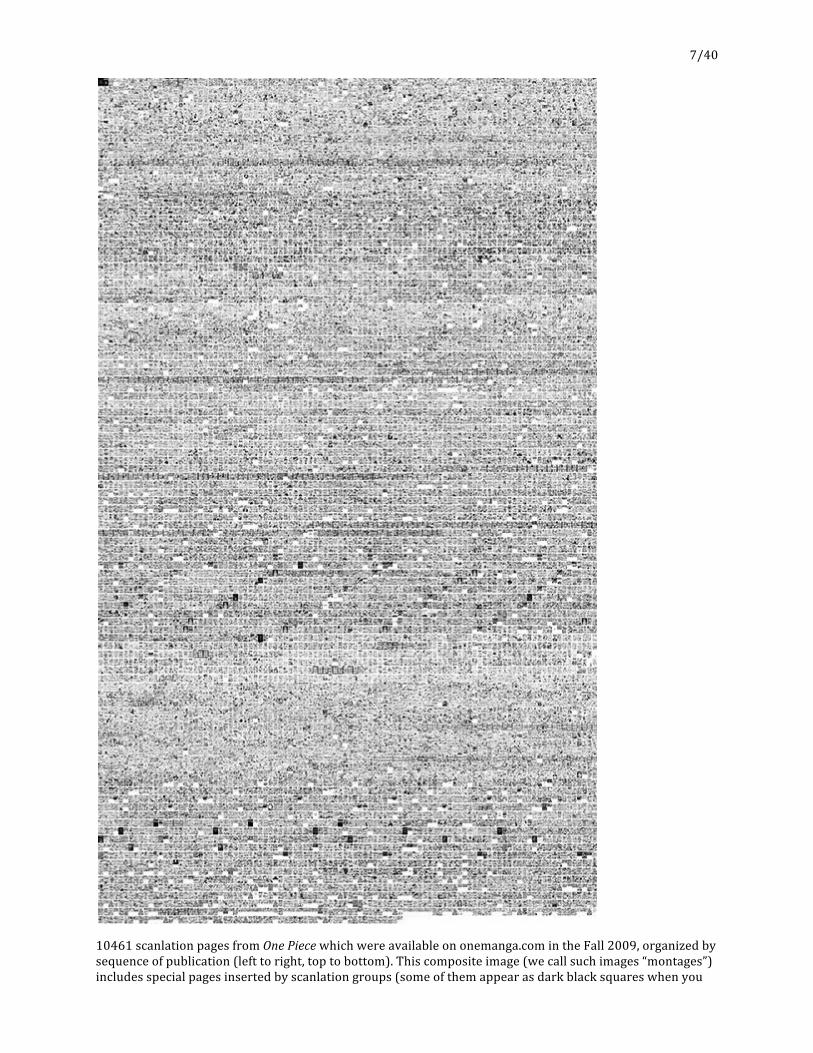
10461scanlationpagesfromOnePiecewhichwereavailableononemanga.comintheFall2009,organizedbysequenceofpublication(lefttoright,toptobottom).Thiscompositeimage(wecallsuchimages“montages”)includesspecialpagesinsertedbyscanlationgroups(someofthemappearasdarkblacksquareswhenyou

8/40
lookatasmallversionofthevisualization).Note:Tofitallpagesinarectangulargrid,someofthepageswerecropped.
Ifweonlyexamineasmallnumberofimagesfromamuchlargerimagesetatrandom,wecan’tbecertainthatourobservationswillholdacrossthecompleteset.Forexample,inthecaseofouronemillionpagescollection(whichitselfisonlyasampleofallmangabeingpublishedcommercially),100pagesis%0.0001ofallavailablepages.Wedon’thaveanyreasontobelievethatwhateverwemayobserveinthese100pagesistypicalofourmangasetawhole.
Thus,thefirstproblemwithusingournativeperceptiontocompareimagesinordertonoticedifferencesandsimilaritiesisthatthisapproachdoesnotscale.Ifweonlyexamineasmallselectionofmangapages,thisdoesnotqualifyustomakegeneralstatementsaboutthegraphicalstyleof“best‐sellingmanga,”“shounenmanga,”orevenofasinglelongrunningseriessuchasHajimenoIppo(15978pagesinourdataset.)Examiningonlyasmallsampleofalargerimagesetalsoprecludesusfromunderstandingdetailedpatternsofchangeandevolution.Toillustratethis,wepulledoutthreepagesfromabest‐sellingOnePiecemangaseriesdrawn.Thepagescomefromchapters5,200,and400.Theseriesstartedin1997;approximately600chapterswerepublishedbytheendof2010,withnewchaptersappearingweekly.Thus,thetimepassedbetweenchapter5andchapter400isapproximatelyeightyears;duringtheseperiods,theartistscreatedover7000pages.(Ourdatasourcedidnothaveexactinformationonpublicationdatesofeverychapter,andthat’swhywehavetoestimatetheminthisway).Aswecanimmediatelyseebycomparingthesethreepages,thegraphicallanguageofOnePieceapparentlychangedsignificantlyduringtheseeightyears‐buthowdiditchange?Wasitagradualtransition,aseriesofabruptchanges,orsomeothertemporalpattern?Unlesswehaveamechanismtocompareamuchlargernumberofpages,wecan’tanswerthisquestion.
SamplepagesfromOnePiecemangaseriesdrawnfromthe5th,200th,and400thchapters.
Inthisexample,itwillbebeneficialtopulloutalargersetofsamplepagesusingsomesystematicprocedure.Forexample,wecanselectevery100thpagetogetabetterideaofhowseries’visuallanguageischangingovertime.Thisapproachcanalsobeappliedforcomparingdifferentmangaseries.Forinstance,wecouldtakeevery200thpageofNarutoandevery200thpageofOnePiece.(Narutoisthemostpopularmangaseriesaroundtheworldtoday.)Sinceourdatasetcontainsapproximately10,000pagesforeachoftheseseries,wewouldendupwith50pagesforeach.Wecouldthenexaminethese100pagesinordertodescribethedifferencesbetweenthestylesofthe

9/40
twoseries.Or,ifourseriesarenotverylong,wecanuseadifferentprocedure.Wecanselectonepagefromeachchapterofaseriesandthenusesuchsetsofpagestocompareseriestoeachother.
However,suchanapproachwillfailifthestylewithineachchaptervaries.Thepageswemayselectusingoursamplingproceduremaynotproperlyreflectallthesevariations.Thisisafundamentalproblemwiththeideaofselectinganumberof“representativepages”andonlyworkingwiththissmallerset.
Forinstance,considerallpagesfromoneofAbara’schapters(seeillustrationbelow).Whichpageineachchapterbestrepresentsitsstyle?Regardlessofwhichpageweselecttostandinforthewholechapter,itwillnotadequatelyconveythestylisticvariationsacrossallthepages.Somepagesconsistmostlyfromblackandwhiteareas,withlittletexture;otherpageshavelotsofshadingandusemostlygrey;stillotherscombinepanelsinbothstyles.
Ofcourse,ifweareusingacomputertobrowseourimageset,wearenolongerlimitedtopullingoutasmallsampleofimagesforcloseexamination.Modernoperatingsystems(OS)suchasWindows,MacOS,iOS,andAndroid,imageorganizersoftwaresuchasGoogle’sPicasaandApple’iPhoto,andwebphotosharingservicessuchasPhotobucketandFlickrallprovidetheoptionstobrowsethroughlotsofimages.Soifwe,forexample,addall10,461OnePiecepagestoiPhoto,wecanpan,zoominginandoutatwill,quicklymovingbetweenindividualimagesandthewholeset.
Thisshouldhelpustonoticeadditonalvisualdifferencesandaffinitiesacrosslargesetsofimagesbeoyndwhosepickedupbyacloseanalysisofasmallsample.Unfortunately,thedisplaymodesofferedbyexistingconsumersoftwareandwebservicesareratherinflexible.Typically,theonlymodesavailableareaslideshowandanimagegrid.Moreover,usuallytheimagescanbesortedbyonlyafewparameterssuchasuploadeddates,ornames,andtheusercan’teasilychangetheorderinwhichimagesaredisplayed.Inordertodisplayimagesinadifferentorder,youhavetofirsttoassignnewkeyword(s)toeveryimage.Thispreventsspontaneousdiscoveryofinterestingpatternsinanimageset.Insteadofreorganizingimagesalongdifferentdimensionsandquicklytryingdifferentpossibilities,auserwouldhavetoknowfirsttheexactorderinwhichtodisplayimages.
Ofcourse,ifourimagesethassomeveryobviouspatterns–letssay,itconsistsfromimagesinthreedistinctstylesonly–theselimitedbrowsingmodesandfixedorderwouldbestillsufficient,andwewilleasilynoticethesepatterns.Butsuchcasesareexceptionsratherthanthenorm.(WhilePicassoworkedinanumberofdramaticallydifferentstyles,heisnottypical.)
Analternativetoexaminingasetofimagesinformally‐regardlessofwhetherwearelookingformallyatafew,orusesoftwaretobrowsethroughmany–istosystematicallydescribeeachusinganumberofterms,andthenanalyzethedistributionsoftheseterms.Inhumanities,thisprocessiscalled“annotation.”Aresearcherdefinesadictionaryofdescriptivetermsandthentagsallimages(orfilmshots,transitionsbetweencomicframes,oranyothervisualobjects).Aparalleltopopularpracticeofuserstaggingmediaobjectsinsocialmediasites(thinkoftagsinFlickr),oraddingkeywordstoone’sblogpostisobvious–howeverwhileusersarefreetoaddanykeywordstheywant,inacademicstudiesresearcherstypicallyemploy“closedvocabularies”whereasetoftermsisdefinedbeforehand.Onceallimagesareannotated,wecanlookatalltheimagesthathaveparticulartags;wecanplotandcomparethetagfrequenciesandotherstatisticaldescriptions.Forinstance,ifweannotatemangapagesusingasetoftagsdescribingvisualstyle,wecanthencomparehowofteneachstylisticfeaturewasusedforshounenvs.shoujopages.
BarrySaltpioneeredtheuseofthismethodtostudyvisualmedia.Heannotatedallshotsinfirst30minutesofafewhundredsof20thcenturyfeaturefilmsusinganumberofcharacteristics:shotscale,cameramovement,andangleofshot.Baltusedasmallnumberofcategoriesforeachcharacteristic.Forexample,possiblecameramovementtypeswerepan,tilt,panwithtilt,track,etc.(BarrySalt’sDatabase).Healsorecordedshotduration(Salt,TheStatisticalStyleAnalysis;FilmStyleandTechnology.)Saltthenuseddescriptivestatisticsmeasuresandgraphstoanalyzethisdata.InhisveryinfluentialbookUnderstandingComics(1993)ScottMcLoudemployedasimilar

10/40
methodcomparethevisuallanguageofJapanesemangaandcomicsfromtheWest.Heannotatedtypesoftransitionsbetweenframesinanumberofmangaandcomicbooks,andthenusedhistogramstovisuallyexplorethedata.Communicationandmediastudiesfieldhaveasimilarmethodcalled“contentanalysis.”Ifhumanistsusuallyareconcernedwithworksofaparticularauthor(s),communicationresearcherstypicallyemployedcontentanalysistoanalyzerepresentationsinmassmedia,and,morerecently,user‐generatedcontent.Therefore,theymorecarefullydeterminetheirsamples;theyalsoemploymultiplepeopleto“code”(thetermusedincontentanalysistorefertoannotation)mediamaterial,andthencalculatethedegreeofagreementbetweentheresultsofdifferentcoders.Hereiscoupleofrecentapplicationsofthismethod.Herring,Scheidt,Kouper,andWrightanalyzedthecontentof457randomlyselectedblogscollected at roughly six-month intervals during 2004-2004 “to assess the extent to which the characteristics of blogs themselves remained stable or changed during this active period.” Williams,Martins,Consalvo,andIvory analyzed characters in 150 video games; the total of 8572 characters were coded to “answer questions about their representations of gender, race and age in comparison to the US population.”
Thismethodismorepowerfulthaninformalexaminationofmedia,butitsuffersfromthesameproblem–itdoesnotscaletomassivedatasets.McLoud,forinstance,onlyannotatedasmallnumberofcomicbooksandmangatitles.Wouldheobtainthesameresultswithamuchlargerset–suchasourcollectionofonemillionmangapages?Andevenifhisresultswouldbeconfirmed,whataboutallpossibleexceptions?Tofindthem,weneedtotageverypage.
Letussaywehaveatrainedviewerwhocanexamineamangapageandselecttherelevanttags.Ifthisviewerspends1minuteforeachpageandworks8hoursperday,itwouldtakealmost6yearstoannotateonemillionpages.
(Recently,itbecamepossibletousecrowdsourcinginordertospeedupthisprocess.Sincewecannotexpecteverypersontohavethesamejudgmentsaboutvisualformortousetagsinthesameway,researchersusestatisticaltechniquestocalculateconsistencybetweenthejudgmentsofallparticipatingworkers,andtodisregardlowqualityresults.However,thisapproachhasafundamentallimitation–likeanyotherattempttodescribeimagesusingnaturallanguages,itismuchbetteratcapturingimagescontentthanform.Wediscussthisinmoredetailbelow.)Summary:Whenweexamineonlyasmallsubsetoflargeimageset,oursamplemaynotberepresentativeofthewholeset;itmaynotproperlyreflectallvariationsinaset;andwemaynotbeabletostudygradualchangesovertime.
2.Sowhatifweassumethatourdatasetcontainsnotamillionimages,butonlyahundred?Notthattheproblemofscalegoesaway,isitsufficienttouseoureyesonly?No.Thesecondproblemwithusingoureyesisthatwearenotverygoodatregisteringsubtledifferencesbetweenimages.Ifyouareconfrontedwithasmallnumberofimagesthathavesubstantialdifferences,yourbraincaneasilyorganizetheseimagesaccordingtotheirvisualdifferences.(HereIamnotconcernedwithdifferencesincontent,whichareeasytosee,butwiththedifferencesinvisuallanguage).Thismeansbeingabletoseparatethemintogroups,rankthemaccordingtooneormorekindsofvisualcharacteristics,noticetheoutliers(imageswhichstandoutfromtherest),andcompleteothertasks.Forinstance,wehavenoproblemdistinguishingbetweenpaintingsbyPietMondrianandTheovanDoesburgcreatedafter1925.Mondrianusedexclusivelyhorizontalandverticallineorientations,whilevanDoesburgalsoonlyuseddiagonals.ThesepropertiesclearlymarkMondrian’sandvanDoesburg’spaintings.

11/40
Left:PietMondrian.CompositionIIinred,blueandyellow.1930.Right:TheovanDoesburg.SimultaneousCounterComposition.1929.
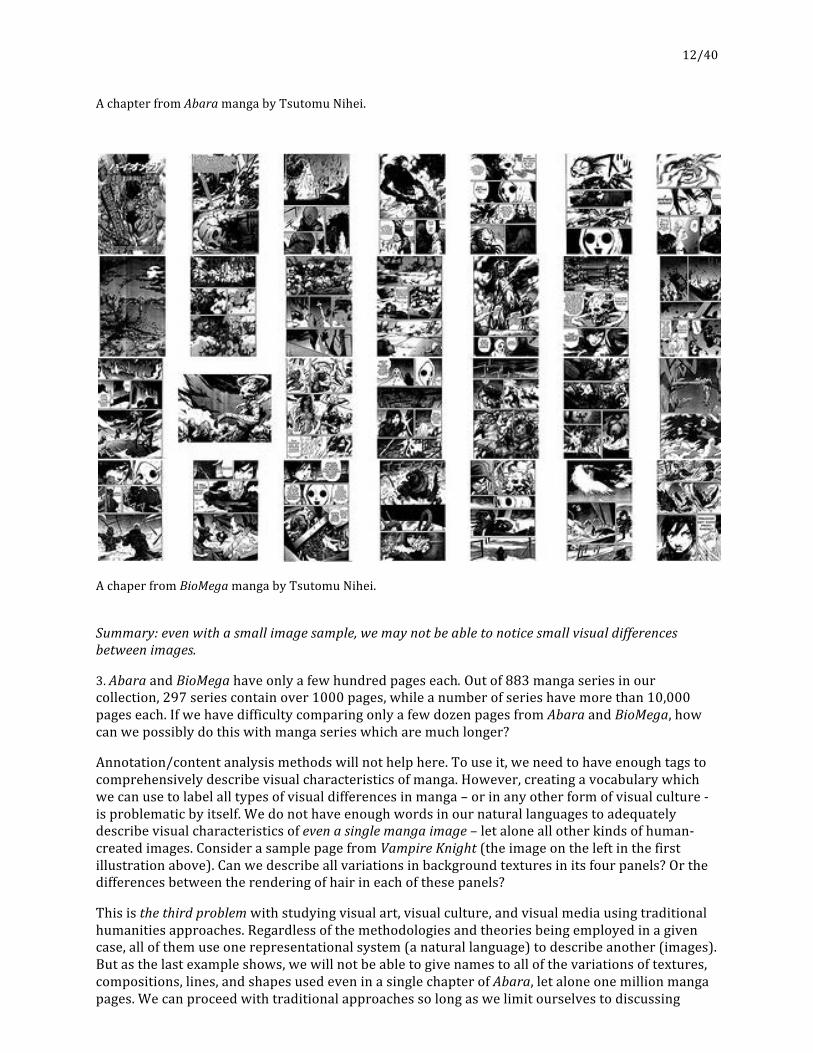
Butwithlargenumberofimages,whichhavesmallerdifferences,wecannolongerperformthesetasks.Thefollowingexampleillustratesthisproblem.ThefirstcompositeimagecontainsallpagesfromasinglechapterofAbarabyTsutomuNihei.ThesecondcompositeimagecontainsallpagesfromasinglechapterofBioMegabythesameartist.DoAbaraandBioMegasharethesamestyle,ordotheyhavesubtlebutimportantdifferences(besidethesizeofthepanels)?Forexample,doesonetitlehasmorestylisticvarietythantheother?Whichpageineachtitleisthemostunusualstylistically?Evenwiththissmallnumberofmangapages,thesequestionsarealreadyimpossibletoanswer.
12/40
AchapterfromAbaramangabyTsutomuNihei.
AchaperfromBioMegamangabyTsutomuNihei.
Summary:evenwithasmallimagesample,wemaynotbeabletonoticesmallvisualdifferencesbetweenimages.
3.AbaraandBioMegahaveonlyafewhundredpageseach.Outof883mangaseriesinourcollection,297seriescontainover1000pages,whileanumberofserieshavemorethan10,000pageseach.IfwehavedifficultycomparingonlyafewdozenpagesfromAbaraandBioMega,howcanwepossiblydothiswithmangaserieswhicharemuchlonger?
Annotation/contentanalysismethodswillnothelphere.Touseit,weneedtohaveenoughtagstocomprehensivelydescribevisualcharacteristicsofmanga.However,creatingavocabularywhichwecanusetolabelalltypesofvisualdifferencesinmanga–orinanyotherformofvisualculture‐isproblematicbyitself.Wedonothaveenoughwordsinournaturallanguagestoadequatelydescribevisualcharacteristicsofevenasinglemangaimage–letaloneallotherkindsofhuman‐createdimages.ConsiderasamplepagefromVampireKnight(theimageontheleftinthefirstillustrationabove).Canwedescribeallvariationsinbackgroundtexturesinitsfourpanels?Orthedifferencesbetweentherenderingofhairineachofthesepanels?
Thisisthethirdproblemwithstudyingvisualart,visualculture,andvisualmediausingtraditionalhumanitiesapproaches.Regardlessofthemethodologiesandtheoriesbeingemployedinagivencase,allofthemuseonerepresentationalsystem(anaturallanguage)todescribeanother(images).Butasthelastexampleshows,wewillnotbeabletogivenamestoallofthevariationsoftextures,compositions,lines,andshapesusedeveninasinglechapterofAbara,letaloneonemillionmangapages.Wecanproceedwithtraditionalapproachessolongaswelimitourselvestodiscussing

13/40
mangaiconographyandotherdistinctvisualelementswhichhavestandardizedshapesandmeanings:waterdropssignifyingstress,throbbingveinssignifyinganger,andsoforth.Butifweactuallywanttostartdiscussingarangeofgraphicalandcompositionalpossibilitiesusedacrossinmanga,weneedanewkindofinstrument.Thisfundamentallimitationappliestoallothervisualformsdevelopedbyhumanbeings,betheypaintings,drawings,photographs,graphicdesigns,webpages,visualinterfaces,animations,etc.Summary:naturallanguagesdonotallowustoproperlydescribeallvisualcharacteristicsofimages,ornamealltheirpossiblevariations.
METHOD:DIGITALIMAGEPROCESSING+VISUALIZATION
Toaddressthesechallenges,wedevelopedasetofmethodsandtechniques,whichtogetherwecallCulturalAnalytics.Thekeyideaofculturalanalyticsistheusevisualizationtoexplorelargesetsofimagesandvideo.Thesevisualizationscanuseexistingmetadata(forexample,publicationdatesorauthornames)andalsonewmetadataaddedbyresearchersviaannotationorcoding.However,aswealreadydiscussed,addingtagsorotherannotationsmanuallyhasseriouslimitations:ournaturalvisualsystemcan’tnoticesubtlevisualdifferencesbetweenalargenumberofimages,andournaturallanguagesdonothavetermstodescribeallvisualcharacteristicsofimages,ornametheirpossiblevariations.
Toovercometheselimitations,ourcoremethodusesdigitalimageprocessingandanewtypeofvisualization.Thissectiondescribesthismethod,andthenextsectionsapplyittoprogressivelylargernumbersofimagesdrawnfromouronemillionmangadataset.(Forthedescriptionofourothervisualizationmethods,seeManovich,MediaVisualization).
Themethodinvolvestwosteps:
1.Weusedigitalimageprocessingtoautomaticallymeasureanumberofvisualcharacteristics(i.e.,features)ofourimages.Inthisprocess,visualqualitiesaremappedintonumbers.(Incomputerscience,thisstepisoftenreferredtoas“featureextraction.”)Forexample,inthecaseofgreytonesmeasuredon0‐255scale,blackisrepresentedas0,whiteas255,and%50greyas127.5.Theexamplesofdimensionsthatcanbemeasuredincludecontrast,presenceoftextureandfinedetails,numberoflinesandtheircurvature,numberandtypeofedges,sizeandpositionsofshapes,andsoon.Inthecaseofcolorimages,wecanalsomeasurethecolorsofallpixels(hue,saturation,brightness),determinemostfrequentlyusecolors,andcalculatevariousimagestatisticsforR,G,Bcolorcomponents(R,G,B)separately.
Typically,suchmeasurementsproducemanynumbersforeachvisualdimensionofanimage.Forinstance,everypixelwillhaveitsgrayscalevalue.Ifwemeasureorientationsofalllinesinanimage,wewillendwithaseparatenumberforeveryline.Inordertobeabletocomparemultipleimageswitheachotheralongparticulardimensions,itisconvenienttousetheaveragesofthemeasurementsoneachdimension.
Forexample,ifweareinterestedingreyscalevalues,wesumvaluesofallpixelsanddividethembythenumberofpixels.Inthecaseoflineorientations,wesimilarlyaddanglesofalllinesanddividethembythenumberoflines.
Besidesthissimpleaveragescalledmean,wecanalsouseothertypesofdescriptivestatisticstosummarizeimagecharacteristics.Theyincludedifferentrepresentationsofcentraltendencyinadata(median,mode,etc.)andofdatadispersion(variance,standarddeviation,etc.)
Herearetheexamplesofsuchstatisticscalculatedforthesamplemangapageswhichalreadyappearedintheprevioussection.

14/40
Left:apagefromVampireKnight.Mean:164.68.Standarddeviation:102.25.Middle:apagefromOnePiece.Mean:214.58.Standarddeviation:75.65.Right:apagefromNaruto.Mean:199.96.Standarddeviation:90.92.Bothmeanandstandarddeviationarecalculatedusinggreyscalevaluesofallpixelsinapage.VampireKnightpage(left)hasthelowestaveragegrayscalevaluebecauseofitsshadedareas,thickblackcontoursandtype,andtheblackareaatthebottom.OnePiecepage(middle)hasthehighestaveragegrayscalevaluebecauseitusesblackquitesparingly.Thestandarddeviationvaluesarereversed:VampireKnightpagehasthehighest,whileOnePiecepagehasthelowest.VampireKnightpagehaslotsofblack,gray,andwhite,andthispushesupitsstandarddeviationmeasurement.OnePiecehaslotsofwhiteandjustalittlebitofblack,andthismakesitsstandarddeviationlow.
2.Wecreate2Dvisualizationsthatpositiontheimagesaccordingtotheirfeaturevalues.Forexample,wemayusehorizontaldimension(X‐axis)torepresentgrayscalemean,andverticaldimension(Y‐axis)torepresentgrayscalestandarddeviation.Theseimagefeaturescalculatedbysoftwareinstep1becameimagecoordinatesina2Dspace.Inthisway,thedifferencesbetweenimagesalongaparticularvisualdimensionaretranslatedintotheirpositionsinspace–somethingthathumanvisualsystemcanreadverywell.
Toillustratethis,wevisualizethethreemangapagesfromthepreviousexampleusingtheirmeanandstandarddeviationfeatures.

15/40
AplotofsamplepagesfromVampireKnight,OnePiece,andNaruto.MeanandstandarddeviationofapageareusedasitsXandYcoordinates.
(Bothmeanandstandarddeviationarecalculatedusinggreyscalevaluesofallpixelsinapage.)Thisplotusesonlytwoverybasicfeatures.Thereforewecan’texpectittocaptureeveryvisualdifferencebetweenthesethreeimages.Still,evenwithonlytwofeatures,thespatialpositionsandthedistancesbetweentheimagesin2Dspacereflectwelloursenseofoverallvisualdifferencesbetweentheimages:OnePieceandNarutopagesarecloseby;VampireNightpageisfurtheraway.MeasuringvisualfeaturesandthenmappingthesefeaturesintoXandY‐axisallowsustoseparatetheoverallperceiveddifferenceintoseparatedimensions.Inthisplot,weuseaverageandthespreadofgrayscalevalues(i.e.,meanandstandarddeviation),butwecanalsousemanyotherdimensionscanbealsoused.Thisprocessisnotunlikehowhumanvisualperceptionfunctions.Humanvisualsystemanalyzesvisualinputseparatelyintermsofdifferentcharacteristics:contrast,texture,shape,color,andmotion.Mostpsychologistsandneuroscientistsbelievethatthebraincombinesthisinformationtoarriveatperceptualwholes.Varioustheorieshavebeenproposedtoexplainthedetailsofthisprocessandto.AninfluentialtheoryofattentiondevelopedbyAnneTreismanandGarryGeladesuggeststhatdifferentfeaturesanalyzedattheearlystagesofperceptionare“bindedtogether”intoconsciouslyexperiencedwholes.AnothertheorybyL.Wardproposedtheneuralmechanismresponsibleforthebindingoffeatureswhichcodeshape,motion,color,depthandotherperceptualaspects.SomeofthefeatureswemeasuresuchasGaborfiltersarethoughttobetheexactequivalentsofthefeaturesanalyzedbythebrain;otherscanbeunderstoodasbeingequivalenttothecombinationofmultiplefeaturescomputedbythebrain.

16/40
Aswediscussedearlier,whenabrainisconfrontedwithanumberofverysimilarimages,oraverylargenumberofimages,itnolongercancomputethesedifferencesreliably.Whenwemeasurefeaturesinimagesetsandvisualizingimagesaccordingtothefeaturevalues,weessentiallyaugmentshumanperception;thatis,wescaleupitscapacitytojudgevisualdifferences.Combinationofdigitalimageanalysisandvisualizationmakespossibletobypasstheproblemwhichhauntedvisualsemioticsinparticular,andalllinguisticdescriptionsofthevisualingeneral:theinabilityoflanguagetoadequatelyrepresentallvariationswhichimagescancontain.Forinstance,evenifweusehundredsofwordsforcolors,imagescanshowmillionsofcolorvariations.Andcolorisnottheworstcase;forotherdimensionssuchastextureorlinecharacter,thetermsprovidebynaturallanguagesaremuchmorelimited.
Inotherwords,oursensesareabletoregisteramuchlargersetofvaluesonanyanalogdimension‐loudness,pitch,grayscale,color,motion,orientation,size,etc.–thanourlanguageshavewordsfor.Thismakessensebecauselanguagehasdevelopedmuchlaterevolutionarytosupplementthesenses.Languagedividesthecontinuousworldintolargerdiscretecategoriesthatmakespossibleabstractreasoning,metaphors,andotheruniquecapacities.Itisnotdesignedtoexactlymapthewealthofoursensoryexperienceintoanotherrepresentationalsystem.
Soifwecan’trelyonanaturallanguagetocapturewhatoursensescanregister–andwecan’trelyonthesensesbecause,aswediscussedintheprevioussection,theyarenotabletoregisterverysubtledifferencesbetweenimages,orotherculturalartifacts–howcanwetalkaboutvisualcultureandvisualmedia?
Ourapproachistousevisualizationasanewdescriptivesystem.Inotherwords,wedescribeimageswithimages.Indoingthis,wearetakingadvantageoftheabilityofimagestoregistersubtledifferencesonanyvisualdimension.
Notethatourmethoddoesnotimplythatwearegettingridofdiscretecategories.Rather,insteadofbeinglimitedtoafewprovidedbylanguage,wecannowdefineasmanyasweneed.
Forexample,letssaythatwewanttodescribegrayscalelevelsinanimage.Weusesoftwaretoreadpixelvaluesfromanimagefile,andcalculateanaveragevalue.ThisaverageisthenusedtopositiontheimageinthevisualizationalongXorY‐axis.Common8‐bitand24‐bitimageformatssuchasJPEGandPNGuse256discretevaluestorepresentgrayscalelevels.Thisgivesus256separatecategoriesforgrayscalevalues.Thesecategoriesdonothavedistinctnames.Buttheywork‐theyallowustocomparemultipleimagesintermsoftheirgrayscalevalues.
Wearenotlimitedto256categories–ifwewant,wecanuse1000,10,000,oranyothernumber.Howdoesthiswork?Whenwecalculatetheaveragevalueofallintegergrayscalepixelvalues,wegetarealnumber.Forinstance,ifourimagecontainsfourpixelswithgrayscalevalues103,106,121,and112,theaverageofthesevaluesis102+107+127+113)/4=109.75.Ifweroundthesevaluesusingonedecimalplace,wewillhave256x10=2,560distinctcategories.Ifwekeeptwodecimalplaces,wewillhave25,600distantcategories.Inreality,wedon’tneedtogothathigh,sincehumanperceptioncan’tevenseethedifferencebetweentwograylevelswhicharenexttoeachother(forinstance,127and128)on0‐256scale.
Whileweutilizeavarietyofvisualizationtechniques,thekeytechniqueusedbyourmethodisascatterplot,i.e.a2DvisualrepresentationthatusesCartesiancoordinatestodisplaytwosetsofnumericalvaluesdescribingdata.Inourcase,eachelementofadatasetisanimage,andthetwovaluesthatdetermineitspositioninaplotaretwomeasuredvisualqualities(features),suchasaveragegrayscaleandstandarddeviation.

17/40
EquallyoftenweuselinegraphswheretheX‐axisrepresentsthedatestheimageswerecreated(ortheirpositionsinanarrativesequencesuchasacomicbook),andY‐axisrepresentssomemeasuredvalue(suchasaveragesaturation).
Alongwithregularscatterplotsandlinegraphs,wealsouseanewvisualizationtechniquewhichwecallimageplot.Anormalscatterplotandalinegraphdisplaythedataaspointsandlines.Animageplotsuperimposesimagesoverdatapointsinagraph.
Thefollowingvisualizationsof127PietMondrian’spaintingsillustratethedifferencebetweenascatterplotandanimageplot.
127paintingsbyPietMondrian(createdbetween1905and1917)visualizedasascatterplot(left)andasimageplot(right).X‐axis=brightnessmedian.Y‐axis=saturationmedian.(Technicaldetails:Wealsousemoreadvancedvisualizationtechniquessuchasscatterplotmatrixandparallelcoordinates,andmultivariatedataanalysistechniquessuchasPCA,clusteranalysis,andsoon.However,sincetheconceptsofamulti‐dimensionalfeaturespaceanddimensionreductionaremoreabstract,inthischapterallourexamplesare2Dvisualizationswhereeachaxiscorrespondstoasinglefeaturesuchasmeangrayscalevalue,ormetadatawhichwascollectedalongwiththedata‐suchasapositionofapagewithinthesequenceofallpagesinamangatitle.Ingeneral,weprefertousesinglefeaturesforXandY‐axisiftheirgraphrevealsinterestingpatternsandiftheirmeaningiseasytoexplain;incontrast,itisoftendifficulttointerpetthedimensionsinagraphwhichusesPCAorothermultivariatemethods.)
Whilethetechniquewecall“imageplots”hasalreadybeendescribedinanumberofarticlesinComputerScience(seePeters,MultiMatch),ithasnotbeenmadeavailableinanygraphingorvisualizationapplication.Ourlabdevelopedsoftwaretocreateimageplots;weusethissoftwareinallourprojects,andalsodistributeitasopensource(SoftwareStudiesInitiative,ImagePlot).ThesoftwarerunsonregularWindows,MacandLunixdesktopsandlaptops.Workingwithourlan,GravityLabatCaliforniaInstituteforTelecommunicationandInformation(Calit2),wealsodevelopedaninteractiveapplicationthatcangenerateimageplotswhichcancontainthousandsofindividualimagesinrealtime.TheapplicationrunsonscalabletileddisplayssuchasHiperSpace(TheHighlyInteractiveParallelizedDisplaySpace)whichoffers35,840x8,000pixelsresolution(287megapixels)on31.8feetwideand7.5feettalldisplaywallmadefrom7030‐inchmonitors(Yamaoka,Manovich,Douglass,Kuester,CulturalAnalyticsinLarge‐ScaleVisualization

18/40
Environments).Inthisarticle,allimageplotsaredonewithImagePlotsoftware;scatterplotsandlinegraphsaredonewithImagePlotandMondrian(freedatavisualizationsoftware).
Inthenextsectionsofthisarticle,wewillshowhowourmethodcanbeusedtocompareimagesetsrangingfromafewhundredtoonemillionimages.
COMPARINGABARAANDNOISE(474PAGES)Havingintroducedourmethod–visualizingimagesasascatterplotaccordingtoquantitativedescriptionsoftheirvisualproperties(features)measuredwithdigitalimageprocessingtechniques–letsnowapplythismethodtoourmangadataset.Tomakeourvisualizationexampleseasiertofollow,wewillusethesametwovisualfeaturesinmostoftheexampesbelow.Thefirstfeatureisastandarddeviationofgreyscalevaluesofallpixelsinanimage.Standarddeviationisacommonlyusedmeasureofvariability.Itshowshowmuchthedataisdispersedaroundtheaverage.Ifanimagehasabigrangeofgreyscalevalues,itwillhavelargestandarddeviation.Ifanimageemploysonlyafewgreyscalevalues,itsstandarddeviationwillbesmall.
Thesecondfeatureisentropy.Ininformationtheory,theconceptofentropywasdevelopedbyClaudeE.Shannoninhisfamous1948paper"AMathematicalTheoryofCommunication”.Entropydescribesthedegreeofuncertaintyinthedata–i.e.,howdifficultorhoweasyitistopredicttheunknowndatavaluesgiventhevalueswealreadyknow.Ifamimageconsistsfromafewmonochromeareas,itsentropywillbelow.Incontrast,ifanimagehaslotsoftextureanddetails,anditscolors(orgreyscalevaluesinthecaseofablackandwhiteimages)varysignificantlyfromplacetoplace,itsentropywillbehigh.
Inthefollowingexamples,wewillmapstandarddeviationvaluestoX‐axis,andentropyvaluestoY‐axis.WewillstartbycreatingimageplotsofAbaraandNoisepages.Thefirsttitlehas291pages;thesecondhas183pages.(Thiscountincludesallpages,whichwereavailableforthesetitlesononemanga.com,includingtitleandcreditpages.)

19/40
Abarapages.Artist:TsutomuNihei.X‐axis=standarddeviationofgreyscalevaluesofallpixelsinapage.Y‐axis=entropycalculatedovergreyscalevaluesofallpixelsinapage.

20/40
NOISEpages.Artist:TsutomuNihei.X‐axis=standarddeviationofgreyscalevaluesofallpixelsinapage.Y‐axis=entropycalculatedovergreyscalevaluesofallpixelsinapage.Ascanbeseen,standarddeviation(X‐axis)andentropy(Y‐axis)measurementsindeedcorrespondtoperceptuallymeaningfulvisualcharacteristicsofmangapages.Thepageswithlowentropyvaluesaresituatedinthebottompartofaplot.Theyconsistfromasmallnumberofflatareas,withminimumdetailandnotexture.Thepageswithhighentropyvaluessituatedinthetoppartofaplotaretheopposite:theyhavelotsofdetailandtexture.Onahorizontaldimension,thepagesthatonlyemployafewgreyscalevaluesareontheleft;thepagesthathavetherangeofvaluesinthemiddle,andthepagesthatonlyhavewhiteandblackareontheright.Tobeabletocomparetherangeofstandarddeviationandentropyvaluesinbothtitles,wecanplotthedatausingstandardscatterplots,andputthetwoplotssidebyside(Abaraisontheleft,NOISEisontheright).

21/40
Abarapages(left)andNOISEpages(right).Artist:TsutomuNihei.X‐axis=standarddeviationofgreyscalevaluesofallpixelsinapage.Y‐axis=entropycalculatedovergreyscalevaluesofallpixelsinapage.
Thesevisualizationsofthetwotitlesside‐by‐sidemakeansweringthequestionsweaskedearliereasy.Doesonetitlehasmorestylisticvarietythantheother?Yes,Abara’sstylevariesmuchmorethanNOISEstyle:thepointsontheleftplotaremoredispersedthanthepointsontherightplot.Whichpageineachtitleisthemostunusualstylistically?Eachplotrevealsanumberofoutliers–i.e.pointsthatstandoutfromtherest.(Ofcourse,weshouldkeepinmindthatthetwomeasurementsweareusingintheseplots–i.e.standarddeviationandentropy‐onlycapturesomedimensionsofavisualstyle.Ifweuseotherfeatures,differentpagesmaystandoutasoutliers.)
VISUALIZINGTEMPORALCHANGESINABARAANDNOISE
Mangaisasequentialart.Tounderstandifandhowvisualstyleinatitlevariesoverthesequenceofitschaptersandindividualpages,wecangenerateimageplotswhereX‐axisrepresentsapage’spositioninasequence,andY‐axisusessomevisualfeature.Ifwedothisfortwotitles,wecanthencomparehowtheyvaryintimeinrelationtothisfeature.
Whenwemakeimageplotsusingthisapproach,theycanbecomeverylong.Forexample,letssaywewanttographasequenceof10,000imagesandmakeeachimage100pixelswide.Suchvisualizationwillbe10,000x100=1,000,000pixelswide.Toaddressthisproblem,ourvisualizationsoffeaturefilmsrepresenteachshotbyasingleframe.YoucanfindexamplesofsuchplotswemadeforwholefilmsonourFlickrgallery.Forshortermangaseries,wewillusebothimageplotswhichshowallpages,andlinegraphsthatrepresenteachpagebyapoint.Theformerareeasiertoread;thelatteraresometimesmoreeffectiveinrevealingpatterns.Forlongertitles,wewilluselinegraphs,sinceimageplotswouldverylong.(Alinegraphdoesnothavetouselinestoconnectthedata.ThedifferencebetweenalinegraphandascatterplotisthattheformerassumesthatdatavaluesmappedontoX‐axisareseparatedbythesameinterval,i.e.1,2,3,…Ascatterplotdoesnotmakethisassumption).

22/40
First,wecompareAbara(318pages)andNoise(140pages)usingasimplestvisualfeature:ameanofgrayscalevaluesofallpixelsinapage(Y‐axis).Themeanvalueindicatesarelativeproportionofwhite,blackandgreyareasinapage.Wenumberedallpagesstaringfromthecoverpageandendingwiththelastpageoftheseries.(Wehaveremovedextrapagesinsertedbyfanswhoscannedandtranslatedtheseseries;wealsoremoved“bonus”chapters.)Thepagesarepositionedlefttorightusingthislinearsequence(Y‐axis).
InJapanamangaseriesfirstpublishedinmagazineswhichmaycomeoutweekly,bi‐weekly,ormonthly,andcontainnewchaptersforanumberofseries.Later,anumberofalreadypublishedchaptersofsuccesfulseriesisprintedinaseparatevolume(tankōbon).Theseriestranslatedintootherlanguagesarepublishedinsimilarformat(anumberofchapterscollectedinasinglebook)Globalfanswhoreadscanlatedmangaonthewebcanalsogothoughasequenceofchaptersallatone.AvisualizationwhicharrangesallpagesinashortseriessuchasAbaraorNOISEassumesthisreadingmode.
Abara(318consequitivepagesin11chapters).X‐aixs=pagepostionintheseries.Y‐axis=grayscalemean.
NOISE(140consequitivepagesin6chapters).X‐aixs=pagepostionintheseries.Y‐axis=grayscalemean.ThetwovisualizationsusethesamescaleforX‐aixs,andthisiswhyfirstgraph(Abara,318pages)

FQ"#$%
%
.,%3B.A+%0,%1)7=%0,%3I+%,+A)7C%>?;E/R&%!#$%50=+,?@%EI+%5).73,%A)((+,5)7C.7=%3)%.7C.9.C/01%50=+,%0(+%
A)77+A3+C%W:%1.7+,%.7%)(C+(%3)%60`+%3I+%5033+(7,%+0,.+(%3)%,++@%%%
;)650(.7=%3I+%3B)%,+(.+,%A(+03+C%W:%3I+%,06+%0(.,3%,.C+%W:%,.C+%,I)B,%,.6.10(.3.+,%07C%C.**+(+7A+,%
.7%3I+.(%=(05I.A01%C+9+1)56+73@%FA+,+j,%=(05I%=(0C/011:%=)+,%/5%016),3%.7%0%1.7+0(%*0,I.)7%/73.1%3I+%
10,3%*+B%50=+,@%?;E/R%=(05I%01,)%,1.=I31:%=)+,%/5%3.11%3I+%6.CC1+%)*%AI053+(%R&%07C%3I+7%=)+,%C)B7@%
J)B+9+(&%.3,%09+(0=+%=(0:,A01+%1+9+1,%7+9+(%(0.,+%0,%6/AI%0,%3I),+%)*%FA+,+@%%
%
E)%I+15%/,%/7C+(,307C%3I+%=(05I.A01%5033+(7,%.7%+0AI%AI053+(&%=(05I.A%C+,.=7+(%X7=%k.07%'+7=%
>g/13.6)C01%2701:,.,%m0W&%<.7=05)(+%T03.)701%87.9+(,.3:?%9.,/01.P+C%3I+%,+Y/+7A+%)*%?;E/R%50=+,%
0,%0%W0(%AI0(3@%L0AI%AI053+(%.,%60(`+C%.7%.3,%)B7%A)1)(h%3I+%AI053+(,%0(+%01,)%,+50(03+C%W:%
I)(.P)7301%.73+(901,@%EI+%=(05I%01,)%)6.3,%A)9+(,%3I+%AI053+(,%A)9+(,%3)%*)A/,%)7%3I+%5033+(7,%.7%3I+%
(+=/10(%70((03.9+%50=+,@
?;E/R@%pG0.M,%r%50=+%5),3.)7%.7%3I+%,+(.+,@%_G0M.,%r%=(0:,A01+%6+07@%L0AI%AI053+(%.,%,I)B7%.7%0%,+50(03+%A)1)(@%
;I053+(,%0(+%,+50(03+%W:%BI.3+%=05,h%3I+%3.31+%50=+,%0(+%)6.33+C@%%
%
EI+%7+M3%3B)%9.,/01.P03.)7,%A)650(+%2A+(+%07C%?;E/R%,3:1.,3.A%C+9+1)56+73%)7%1)B%C+30.1"3+M3/(+%
e%I.=I%C+30.1"3+M3/(+%C.6+7,.)7%0,%(+5(+,+73+C%W:%+73()5:%*+03/(+@%>J+(+%3I+%51)3%)*%TXD<L%.,%,A01+C%
3)%3I+%,06+%B.C3I%0,%3I+%51)3%)*%2W0(0%3)%60`+%5033+(7,%6)(+%9.,.W1+@?%
%
FA+,+%50=+,@%%
pG0M.,%r%50=+%,+Y/+73.01%5),.3.)7%.7%3I+%3.31+%>1+*3%3)%(.=I3?@%
_G0M.,%r%+73()5:%A01A/103+C%)9+(%=(+:,A01+%901/+,%)*%011%5.M+1,%.7%0%50=+@%
%
%

F#"#$%
%
%
?;E/R%50=+,@%%
pG0M.,%r%50=+%,+Y/+73.01%5),.3.)7%.7%3I+%3.31+%>1+*3%3)%(.=I3?@%
_G0M.,%r%+73()5:%A01A/103+C%)9+(%=(+:,A01+%901/+,%)*%011%5.M+1,%.7%0%50=+@%
%
D7%W)3I%3.31+,&%+73()5:%901/+,%AI07=+%)9+(%3.6+@%EI+%5033+(7%)*%3I+,+%AI07=+,%.7%?;E/R%A07%W+%
C+,A(.W+C%0,%0%1.7+0(%,1.=I3%,I.*3%C)B7B0(C@%EI+%5033+(7%.7%FA+,+%.,%6)(+%A)651+M@%D3%A07%W+%
AI0(0A3+(.P+C%0,%0%I)(.P)7301%1.7+&%*)11)B+C%W:%0%A/(9+%BI.AI%*.(,3%=)+,%C)B7%07C%3I+7%=)+,%/5@%
EI+%3B)%3+65)(01%5033+(7,%01,)%I09+%07%.73+(+,3.7=%,3(/A3/(01%,.6.10(.3:@%D7%+0AI%=(05I&%3I+%(07=+%
W+3B++7%3I+%3)5%07C%W)33)6%5).73,%>.@+@@%3I+%C.**+(+7A+%W+3B++7%3I+.(%901/+,%)7%_G0M.,?%=(0C/011:%
.7A(+0,+,@%EI.,%6+07,%3I03%,3:1.,3.A011:%3I+%50=+,%0(+%03%*.(,3%0(+%5(+33:%,.6.10(&%W/3%W+A)6+%6)(+%
90(.+C%)9+(%3.6+@%>2=0.7&%`++5%.7%6.7C%3I03%B+%0(+%C+,A(.W.7=%)71:%)7+%,3:1.,3.A%C.6+7,.)7@?%
E)%.11/,3(03+%.73+(+,3.7=%3+65)(01%5033+(7,%3I03%A07%W+%(+9+01+C%/,.7=%,/AI%1.7+%=(05I,%)*%*+03/(+%
901/+,&%B+%B.11%=)%)/3,.C+%)*%)/(%)7+%6.11.)7%607=0%50=+,%*)(%3I+%7+M3%+M0651+@%b+%B.11%1))`%03%3I+%
B+WA)6.A%V,*+S+$%*4.D!X/(%C030%,+3%A)7,.,3,%*()6%Q#F%A)7,+A/3.9+%50=+,%5/W1.,I+C%)9+(%!R%6)73I,%
>F$$NGF$$V?%.7%,.MG50=+%AI053+(,%055+0(.7=%B++`1:@%m.`+%.7%5(+9.)/,%=(05I,&%B+%/,+%_G0M.,%3)%
(+5(+,+73%0%,.7=1+%9.,/01%*+03/(+&%07C%(+,+(9+%p%0M.,%*)(%50=+,%5/W1.A03.)7%)(C+(@%%
D7%3I+%*)11)B.7=%9.,/01.P03.)7&%_%5),.3.)7%)*%+0AI%50=+%.,%C+3+(6.7+C%W:%3I+%6+07%>09+(0=+?%)*%3I+%
=(+:,A01+%901/+,%)*%011%5.M+1,%.7%3I+%50=+@%
%%
%
Q#F%A)7,+A/3.9+%50=+,%)*%3I+%B+W%A)6.A%V,*+S+$%*4.%>F$$NGF$$V?@%%
pG0M.,%r%50=+%5/W1.A03.)7%)(C+(@%%
_G0M.,%r%6+07%)*%=(+:,A01+%901/+,%)*%011%5.M+1,%.7%0%50=+@%c(+:,A01+%901/+%r%>H%901/+%q%c%901/+%q%d%901/+?%"%Q@%

25/40
Aclose‐upofvisualizationsofthewebcomicFreakangels.
Despitetheweeklyintervalsthatseparatethe6‐pageepisodesofFreakangels,visualizationshowsthatvisualvaluesofthepagesareremarkablyconsistent.Forthelargerpartofthepublicationperiod,thechangesinaveragegrayscalevaluesfollowasmoothcurve(thesameappliestohueandsaturationifweplotthem).Whiletheoverallchangefromlighttodarkimagescorrespondstothedevelopmentofthestoryfromdaytonight,thefactthatthegrayscalevaluesshiftsverygraduallyandsystematicallyovermanymonthsisagenuinediscovery.Visualizationrevealsthisunexpectedpatternandallowsustoseetheexactshapeofthecurve.
COMPARINGVAMPIREKNIGHTANDONEPIECESAMPLES(2,744PAGES)
AbaraandNoisetitlesarequiteshort:291pagesand183pages,respectively.HowdoesourmethodscaleforlongermangaseriessuchasVampireKnight(57chapters;1423pages)andOnePiece(563chapters;9745pages)?VampireKnightpublicationstartedinJanuary2005;OnePiecestartedmuchinAugust4,1997.Thisexplainsthedifferencesinthenumbersofchaptersandtotalpagesinourdownload.Tomakeacomparisonmoremeaningful,wewillonlyuseonlyapartofOnePiecedataset:481‐563chaptersthatcontain1321pages.Asintheearlierexample,wewillvisualizethesetwosetsofpagesaccordingtostandarddeviation(X‐axis)andentropy(Y‐axis).Wegraphthedatausingscatterplots;eachpageisrepresentedbyapoint.

26/40
1423VampireKnightpages(left)and1321OnePiecepages(right).X‐axis=standarddeviation.Y‐axis=entropy.Ineachgraph,X‐axisandY‐axisstartandendvaluesaresetasfollows:Std:min=0.000000,max=126.602400(largestpossiblevaluewhichcanbeobserved).Entropy:min=‐0.000000,max=7.962000(largestpossiblevaluewhichcanbeobserved).Wecannoticethatthecenterofthepointsintheleftgraphishigherthanthecenterofthepointsintherightgraph.RecallthatY‐axiscorrespondstolowtexture/detail–hightexture/detaildimension.Thisconfirmswhatwecanseeinthetwosamplepages:VampireKnightpagehasmoreshadinganddetailthanOnePiecepage.However,sinceeachsetofpointsalsoextendssignificantlyalongY‐axis,itisclearthatwewereluckyinourchoice.Wecouldhaveeasilyselecteddifferentpagesthatwouldleadustoanoppositeideaaboutthegraphicdifferencebetweenthetwosets.
Toconfirmourobservationabouttheverticaldifferencebetweenthecentersofthetwosetsofpoints,wecalculatetheactualaveragesofthedatavaluesprojectedontoY‐axis(entropy).
VampireKnight:meanofentropymeasurementsof1423pages:5.1.OnePiece:meanofentropymeasurementsof1321pages:5.6. (Theaveragesareroundedtoonedigit). Toputthisdifferenceinperspective,itisusefultoknowthemaximumpossiblevalueofentropymeasurementofasingleimageis7.962.Thismeansthatthisvaluerepresents%6.4ofthetotalpossiblerange.

27/40
1423VampireKnightpages.X‐axis=standarddeviation.Y‐axis=entropy.

28/40
1430OnePiecepages.X‐axis=standarddeviation.Y‐axis=entropy.
COMPARINGNARUTOANDONEPIECE(17,782PAGES)
WhenweputsidebysidetwosamplepagesfromNarutoandOnePiecemangaseries,wenoticedthatthedifferencesintheirgraphicalstylesweremoresubtlethanbetweenthesamplepagesfromVampireKnightandOnePiece.Canwebetterunderstandthesemoresubtledifferencesusingourmethod?
ItisalsointerestingtocompareNaruto(1999‐)andOnePiece(1997)becausetheyamongmostpopularmangaseriesamongglobalreaders.Thesetitlesareratedno.1andno.3amongOneManga.comglobalreaders(OneManga).WhenwedownloadedthepagesfromOneManga.comintheFall2009,thefirstserieswaspublishedcontinuouslyfor10years,andthesecondwaspublishedfor12years.Accordingly,ourdownloadcontained8037Narutopagesand9745One

29/40
Piecepages.Thefollowingplotscomparethesetwosetsofpages.
Left:8037Narutopages.Right:9745OnePiecepages.Eachpageisrepresentedbyapoint.X‐axis=standarddeviationofgreyscalevaluesofallpixelsinapage.Y‐axis=entropycalculatedovergreyscalevaluesofallpixelsinapage.

30/40
8037Narutopages.X‐axis=standarddeviation.Y‐axis=entropy.

31/40
9745OnePiecepages.X‐axis=standarddeviation.Y‐axis=entropy.
Projectinglargenumberofpagesfromthetwoseriesintothesamecoordinatespacehelpsustobetterunderstandthesimilaritiesandthedifferencesbetweentheirgraphicalstyles.Thevisualizationsshowthatalongthetwovisualdimensionsusedg,thedistinctionsbetweenthelanguagesofthetwoseriesarequantitativeratherthanqualitative.Thatis,the“pointcloud”ofNarutopagessignificantlyoverlapswiththe“pointcloud”ofOnePiecepagesbothalongandverticalaxis.Atthesame,thedifferencesbetweenthemarelargerthanacasualexaminationofonlytwopagesimplies.Thevisualizationsrevealthatbothseriescoveralargerangeofgraphicalpossibilities:fromsimpleblackandwhitepageswithminimaldetailandtexture(lowerpartofeachvisualization)tothehighlydetailedandtextured(toppart).ButthecenterofOnePiecepointcloudisslightlyhigherthanthecenterofNarutopointcloud.ThismeansthatOnePiecehasmorepagesthathavemoretexturesanddetailsthatOnePiecepages.

32/40
Visualizationsalsorevealthesignificantdifferencesinthegraphicalvariabilitybetweenthetwoseries.Naruto’s“pointcloud”ismuchmoredispersethanOnePiece“pointcloud”bothonhorizontalandverticaldimensions.ThisindicatesthatNaruto’svisuallanguageismorediversethanthevisuallanguageofOnePiece.(WealreadysawasimilardifferencewhenwecomparedAbaraandNOISE–butnowweareseeingthisinamuchlargerdataset.)
WecanalsoexaminethestylisticdevelopmentoftheselongseriesoverthetimeofpublicationinthesamewayusedformuchshorterAbaraandNoise.Thefollowinggraphplots9745OnePiecepageslefttorightintheorderofpublication;theverticalpositionisdeterminedbypagegrayscalemean.Belowthegrapharethethreesamplepagesfromwhichwealreadyreferedtoearlier.
9745OnePiecepages(562chapters).X‐axis=pagepositioninpublicationorder(lefttoright).Y‐axis=meanofgreyscalevaluesofallpixelsinapage.
SamplepagesfromOnePiecemangaseriesdrawnfromthe5th,200th,and400thchapters.
Sincewenowdealingwiththousandsofpagesin562weeklychapterspublishedover12years,wecandiscusstemporalpatternsatnumberofscales.Onthescaleofyears,OnePiecemeanvalues

33/40
graduallydriftoverthewholetimeperiod.Withinthisoverallalmostlinearpattern,weseeperiodicraisesandfallsthatreversedirectionanywherebetween7and13months.Thus,wegettheanswertothequestionweaskedearlierwhenwecomparedthreesamplepagesdrawnfromthe5th,200th,and400thchapters–howdoesthevisuallanguageofOnePiecechangesovertime?Thevisualizationalsorevealsthepatternsmaynotbevisibleifweonlyuseasmallnumberofpages.Thethreepageswelookatearliermissedtheperiodicdropsingrayscalevalueswecanseewhenweplotallpages.Thedipscorrespondtotheflashbackpartsofthenarrativewhichplacethepanelsoverblackbackground,ascanbeseenintheclose‐upoftheearliermontageofallOnePiecepages.
Aclose‐upofthecompletesetofOnePiecepagesarrangedinagridinpublicationorder(lefttoright,toptobottom).
VISUALIZINGCOMPLETEMANGAIMAGESET(1,074,790PAGES).
Wecannowfinallyprovideananswertothequestioninthechapter’stitle:howtoseeonemillionimages?Usingthesamemeasurementsandaxesassignments(X‐axis=standarddeviation,Y‐axis–entropy)aswedidintheplotsofindividualtitlesandseries,wevisualizeourcompletesetofonemillionpages.(Ofcoursewecanalsoorganizethisimagesetinmanyotherwaysusingmanyothermeasurements–thisisjustonepossiblemapping.)

34/40

35/40

36/40
Onemillionmangapagesorganizedaccordingtoselectedvisualcharacteristics.X‐axis=standarddeviationofgreyscalevaluesofallpixelsinapage.Y‐axis=entropycalculatedovergreyscalevaluesofallpixelsinapage.Topimage:completevisualization.Middleimageclose‐upofthetoppart.Bottomimage:close‐upofthebottomleftcorner..Notes:1)Someofthepages‐suchasallcovers‐areincolor.Inordertobeabletofitallimageintoasinglelargeimage(theoriginalis44,000x44,000pixels‐scaledto10,000x10,000forpostingtoFlickr),werenderedeverythingingraycale.2)Becausepagesarerenderedontopofeachother,youdon'tactuallyseeonemillionofdistinctpages–rather,thevisualizationshowsadistributionofallpageswithtypicalexamplesappearingonthetop.
OnemillionpagescoverthespaceofgraphicalpossibilitiesmorebroadlyandwithmoredensitythanNarutoorOnePiecealone.Inbetweenthefourgraphicalextremescorrespondingtotheleft,right,top,andbottomedgesofthepages“cloud,”wefindeverypossibleintermediategraphicvariation.Thissuggeststhatmanga’sgraphiclanguageshouldbeunderstoodasacontinuousvariable.
This,inturn,suggeststhattheveryconceptofstyleasitisnormallyusedmaybecomeproblematicthenweconsiderverylargeculturaldatasets.Theconceptassumesthatwecanpartitionasetofworksintoasmallnumberofdiscretecategories.However,ifwefindaverylargesetofvariationswithverysmalldifferencesbetweenthem(suchasinthiscaseofonemillionmangapages),itisnolongerpossibletousethisconcept.Instead,itisbettertousevisualizationandmathematicaldescriptionstocharacterizethespaceofpossibleandrealizedvariations.
Tobetterunderstandthedistributionofourdatasetwithinthespaceofallgraphicalpossibilities,wecanrenderthedatafromthelastvisualizationusingpoints.Suchascatterplotisnotaseasytoreadasanimageplot,howeveritisbetterinshowingtheshapeofpagesdistribution.TheplotshowsthatthedistributionfollowsBell‐curvelikepattern:singledenseclusterswithgradualfallofftothesides.Thepartsoftheplotwhichremainsblackrepresentthegraphicalpossibilitiesnotrealizedinourmangasample:imageswhicharealmostcompletelywhite(lowerrightcorner),andimageswhichhavelargeareasofblackandsmallareasofwhite(leftthirdoftheplot).

37/40
Onemillionmangapagesrenderedaspoints.X‐axis=standarddeviationofgreyscalevaluesofallpixelsinapage.Y‐axis=entropycalculatedovergreyscalevaluesofallpixelsinapage.Thefactthatdigitalimageprocessingandvisualizationofonemillionmangapagesdatasetmakeusquestiontheverybasicconceptofhumanitiesandculturalcriticismisatleastasimportantasanyparticulardiscoverieswecanmakeaboutthisdataset.Itillustrateshowcomputationalanalysisofmassiveculturaldatasetshasapotentialtotransformourtheoreticalandmethodologicalparadigmsforstudyingculture.

38/40
DEFAMILIARISATIONWITHCOMPUTERS
AlexanderRodchenko.PineTreesinPushkinPark.1927.(Gelatinsilverprint.)
Ourmethodologyreliesonstandardtechniquesofdigitalimageanalysiswhichstartedtobedevelopedalreadyinthesecondpartofthe1950sandarenoweverywhere–indigitalcameras,imageeditingsoftwaresuchasPhotoshop,automatedfactories,medicalimagingandallsciencefieldswhichuseimagesassourcesofdata(fromastronomytobiology).However,whenweadoptthesetechniquesastoolsfortheculturalresearch,weshouldbeclearabouthowtheyanalyzeimagesandwhatdoesitmeaningeneraltoseethroughcomputer“eyes.”Sincethischapterisfocusedonmotivatingandexplainingourmethodingeneralterms,wewouldonlymakeoneobservation.Whenwelookatimagesnormally,weexperiencealltheirvisualdimensionsatonce.Whenweseparatethesedimensionsusingdigitalimageanalysisandvisualization,webreakthisgestaltexperience.Beingabletoexamineasetofimagesalongasingularvisualdimensionisapowerfulmechanismofdefamiliarization(“otstranenie”)–adeviceforseeingwhatwecouldhavenotnoticedpreviously.Ifavant‐gardephotographers,designersandfilmmakersofthe1920suchasRodchenko,Moholy‐Nagi,Eistenstein,andVertovweredefamiliarizingthestandardperceptionofvisiblerealityusingdiagonalframingandunusualpointsofview,nowwecanusesoftwaretodefamaliarizeourperceptionsofvisualandmediacultures.

39/40
ACKNOWLEDGMENTS
SoftwareStudiesInitiativeresearchreportedinthisarticlewasmadepossiblebythegeneroussupportprovidedbyCaliforniaInstituteforTelecommunicationandInformation(Calit2),CenterforResearchinComputingandtheArtsatUCSD(CRCA),andChancellorOfficeofUniversityofCalifornia,SanDiego(UCSD).ThedevelopmentofthecustomdigitalimageanalysissoftwareandtheprocessingofmangaimagesetonsupercomputersattheNationalEnergyResearchScientificComputingCenter(NERSC)wasfundedby2009HENHumanitiesHighPerformanceComputingAward“VisualizingPatternsinDatabasesofCulturalImagesandVideo.”ThedevelopmentofImagePlotsoftwarewasfundedbyNEH2010‐2011DigitalStartuplevelIIgrant“InteractiveVisualizationofImageCollectionsforHumanitiesResearch.” CREDITS
ThevisualizationsanddataanalysisandvisualizationtoolsdevelopedbySoftwareStudiesInitiativearetheresultofsystematiccollaborationsbetweenthekeylabmembers:LevManovich,JeremyDouglass,WilliamHuber,andTaraZepel.HyperSpacesoftwareforinteractivemediavisualizationwasdevelopedbySoYamaoka(Gravitylab,Calit2).BatchimageprocessingtoolsweredevelopedbySunsernCheamanunkul(PhDstudent,ComputerScienceandEngineeringDepartment,UCSD).
REFERENCES
Barry,Salt.“TheStatisticalStyleAnalysisofMotionPictures.”1974.FilmQuarterly,28,1:13‐22.Barry,Salt.FilmStyleandTechnology:HistoryandAnalysis.London:Starword,1992.Cha,Meeyoung,HaewoonKwak,PabloRodriguez,Yong‐YeolAhn,andSueMoon.“ITube,YouTube,EverybodyTubes:AnalyzingtheWorld’sLargestUserGeneratedContentVideoSystem.”2007ACMInternetMeasurementConference.Web.17July,2011.<http://an.kaist.ac.kr/traces/papers/imc131‐cha.pdf>.
Cinemetrics.lv.BarrySalt’sDatabase.Web.August11,2011.<http://www.cinemetrics.lv/satltdb.php‐cm>
Crandall,DavidJ.,LarsBackstrom,DanielHuttenlocher,JonKleinberg.Mappingtheworld'sphotos.18thinternationalconferenceonWorldwideweb,2009.Web.July17,2011.<http://www.cs.cornell.edu/~dph/papers/photomap‐www09.pdf>.
Douglass,Jeremy,WilliamHuber,LevManovich."Understandingscanlation:howtoreadonemillionfan‐translatedmangapages."ImageandNarrative,12,1(2011),190–228.Brussels.Web.<http://lab.softwarestudies.com/2010/11/one‐million‐manga‐pages.html>.Gaborfilter.“GaborFilter.”Wikipedia.Web.August11,2011.<http://en.wikipedia.org/wiki/Gabor_filter>.Herring,Susan,LoisAnnScheidt,InnaKouper,andElijahWright.ALongitudinalContentAnalysisofWeblogs:2003‐2004.Blogging,CitizenshipandtheFutureofMedia.London:Routledge,2006.
IMDb.IMDbDatabaseStatistics.Web.July17,2011.<http://www.imdb.com/stats>.

40/40
Kwak,Haewoon,ChanghyunLee,HosungPark,andSueMoon.“WhatisTwitter,aSocialNetworkoraNewsMedia?”The19thinternationalconferenceonWorldWideWeb,2010.July17,2011.Web.<an.kaist.ac.kr/~haewoon/papers/2010‐www‐twitter.pdf>.SoftwareStudiesInitiative.2011.ImagePlot.Opensourcesoftwareforvisualizationoflargeimageandvideocollections.Web.<http://lab.softwarestudies.com/p/imageplot.html>McLoud,Scott.UnderstandingComics:TheInvisibleArt.KitchenSinkPress,1993.
Manovich,Lev.“CulturalAnalytics:VisualingCulturalPatternsintheEraof‘MoreMedia’”.Domus,Spring2009.Web.<http://lab.softwarestudies.com/2009/06/publications.html#CA_Publications>.
Manovich,Lev.2010."MediaVisualization:VisualTechniquesforExploringLargeMediaCollections."MediaStudiesFutures,ed.KellyGates.Blackwell,forthcoming2012.July17,2011.Web.< http://manovich.net/DOCS/media_visualization.2011.pdf>.
Moretti,Franco.ConjecturesonWorldLiterature.NewLeftReview1(2000),55–67.July17,2011.Web.<http://www.newleftreview.org/A2094>.OneManga.onemanga.comtop50mangalist.August,12,2011.<http://www.onemanga.com/directory/top/>.Peters,Carol,ed.MultiMatch:Technology‐enhancedLearningandAccesstoCulturalHeritage.D1.1.3–StateoftheArtreportsection.2006.July17,2011.Web.<http://www.multimatch.eu/docs/publicdels/D1.1.2.pdf>Treisman,AnneandGarryGelade(1980)."Afeature‐integrationtheoryofattention."CognitivePsychology,Vol.12,No.1,pp.97‐136.Ward,L.M.(December2003)."Synchronousneuraloscillationsandcognitiveprocesses".TrendsCogn.Sci.7(12):553–9.Williams,D.,N.Martins,M.ConsalvoandJ.Ivory.2009.“TheVirtualCensus:RepresentationsofGender,RaceandAgeinVideoGames.”NewMedia&Society.11,p.815‐834.Yamaoka,S.,L.Manovich,J.Douglass,F.Kuester.2011.“CulturalAnalyticsinLarge‐ScaleVisualizationEnvironments.”SubmittedtoComputerGraphicsForum.